table of contents - Asian Development Bank
541
-
Upload
khangminh22 -
Category
Documents
-
view
2 -
download
0
Transcript of table of contents - Asian Development Bank


Quetta WSE . Final ReDort . Volume 1 Table of Contents I Pave 1
TABLE OF CONTENTS
Page
1 . INTRODUCTION ......................................................................................... 1/1
1.1 General ............................................................................................... 1/1 Technical Assistance Programme ....................................................... 1/1 1.2 1.2.1 Objectives ................................................................................. 1/1 1.2.2 TA Implementation ................................................................... 1/1
1.3 Need for a Project ............................................................................... 1/2 1.4 The Bank's Sectoral Strategy .............................................................. 114 1.5 Scope of the Project ............................................................................ 1/5
2 . PLANNING BACKGROUND ...................................................................... 2/1
2.1 Project Area ........................................................................................ 2/1 2.2 Population ........................................................................................... 2/2
2.2.1 Census 1998 ............................................................................ 2/2 2.2.2 Validity of Quetta 1998 Census Data ....................................... 2/3 2.2.3 Design Population and Growth Rates ...................................... 2/4
2.3 Socio-Economic Situation ................................................................... 2/9 2.3.1 General .................................................................................... 2/9 2.3.2 Urban Poverty ........................................................................ 2/10 2.3.3 Gender Disparities ........................................................ ; ......... 2/11 2.3.4 Administration ......................................................................... 2/12 2.3.5 Economy ................................................................................ 2/13 2.2.6 Employment ........................................................................... 2/14 2.2.7 Environment and Water Resources ........................................ 2/15 2.2.8 Socio-Economic Planning Criteria .......................................... 2/16
2.4 Planning Horizon ............................................................................... 2/17
3 . SECTOR PROGRAM . WATER RESOURCE DEVELOPMENT ................ 3/1
3.1 Present Situation ................................................................................. 3/1 3.1.1 Current Sources ....................................................................... 3/2
3.2 Development of Water Resources ...................................................... 3/7 3.2.1 Primary Sources ....................................................................... 3/7 3.2.2 3.2.3 Secondary Sources and Water Conservation ......................... 3/16
3.1.2 Need for a Project .................................................................... 3/6
Water Conservation Measures ............................................... 3/14
3.2.4 Current and Projected Water Balance .................................... 3/18
H:\ConDanBeWAKIST~3WOSFind RepomFR V d l\VOLJ-ConImts.doc

Ouetta WSE . Final Report . Volume 1 Contents / Page 2
Page
3.3 Project Measures of Phase 1 (ADB-Project) ..................................... 3/23 3.1.1 Project Component Groundwater Resources ......................... 3/23 3.3.2 Project Component Surface Water Resources ....................... 3/26 3.3. Project Component Secondary Sources and Water
Conservation .......................................................................... 3/27 3.4 Cost Estimate of Phase 1 (ADB-Project) .......................................... 3/32
4 . SECTOR PROGRAM WATER SUPPLY .................................................... 4/1
4.1 Present Situation ................................................................................. 4/1 4.1 . 1 General Overview ..................................................................... 4/1 4.1.2 Water Production and Treatment ............................................. 4/1 4.1.3 Operation and Distribution ........................................................ 4/2 4.1.4 Problem Analysis ...................................................................... 4/3 4.1.5 Need for a Project .................................................................... 4/5 Planning Parameters and Assumptions .............................................. 4/6 4.2.1 Level of Service (LoS) of the Public Water System .................. 4/7 4.2.2 Water Production Requirements .............................................. 4/9 4.2.3 Technical Design Parameter .................................................... 4/9
4.3 Project Definition ............................................................................... 4/11 4.3.1 Definition of the Main System Components ........................... 4/11 4.3.2 Definition of the Secondary Network and Metering
Programme ............................................................................. 4/14 4.3.3 Water Loss Reduction System ............................................... 4/17 Project Measures of Phase 1 (ADB-Project) ..................................... 4/20 4.4.1 Introduction ............................................................................. 4/20 4.4.2 Project Components of Phase 1 (ADB-Project) ...................... 4/20
4.5 Cost Estimate of Phase 1 (ADB-Project) .......................................... 4/23
SECTOR PROGRAM WASTEWATER ....................................................... 5/1
4.2
4.4
0 5 .
5.1 Present Situation ................................................................................. 5/1 5.1.1 General Overview ..................................................................... 5/1 5.1.2 Condition of the Existing Network ............................................. 5/2 5.1.3 Administration ........................................................................... 5/3 5.1.4 Need for the Project ................................................................. 514
5.1.4.2 Environmental Aspects .............................................. 5/5
5.2. Planning Parameters ................................................................ 5/6 5.3 Investigated Alternatives ..................................................................... 518
5.1.4.1 Hygiene and Health Conditions ................................. 515
5.1.4.3 Saving of Scarce Water Resources ........................... 5/6 5.1.4.4 Status of Planning and Implementation ..................... 5/6
H:X;onDat\BeWAKISTAt+Z33209Winal ReporlWR V d l\VOLLContenis.doc

Quetta WSE . Anal Reuort . Volume 1 Contents I €'age 3
Page
5.4 Proposed Sewerage System ............................................................. 5/17 5.4.1 Service Areas ......................................................................... 5/17 5.4.2 On-site Facilities ..................................................................... 5/19 5.4.3 Design of the Sewer Network ................................................. 5/20 5.4.4 Required System Extension ................................................... 5/21
5.5 Proposed Treatment System ............................................................ 5/23 5.5.1 Process and Design Parameters ............................................ 5/23 5.5.2 Primary Treatment .................................................................. 5/25 5.5.3 Secondary Treatment ............................................................. 5/26 5.5.4 Sludge Treatment ................................................................... 5/28
Proposed Treatment Plant ...................................................... 5/28 Re-use of Treated Wastewater and Sludge ...................................... 5/30
Re-use of Sludge in Agriculture .............................................. 5/31 Project Measures of Phase 1 (ADB-Project) ..................................... 5/31 Cost Estimate of Phase 1 (ADB-Project) .......................................... 5/32
5.5.5
5.6.1 Irrigation ................................................................................. 5/30 5.6.2
5.6
5.7 5.8
6 . SECTOR PROGRAM . DRAINAGE ........................................................... 6/1
6.1 Present Situation ................................................................................. 6/1 6.1 . 1 General Overview ..................................................................... 6/1
6.1.3 Problem Analysis ...................................................................... 6/2 6.1.4 Need for the Project ................................................................. 6/4
6.2 6.3 Project Definition ................................................................................. 6/6
6.3.1 Prioritization of Sub-projects ..................................................... 6/6 6.3.2 6.3.3 Expansion of the Urban Drainage System ............................. 6/10 6.3.4
6.1.2 Existing Facilities ...................................................................... 6/1
Planning Parameters and Assumptions .............................................. 6/5
Drainage Maintenance and Rehabilitation ................................ 6/7
Drainage and Flood Control in Peripheral Areas .................... 6/14 6.3.5 Implementation Requirements ................................................ 6/16 Project Measures of Phase 1 (ADB-Project) ..................................... 6/17 Cost Estimate of Phase 1 (ADB-Project) .......................................... 6/18
6.4 6.5
7 . SECTOR PROGRAM . SOLID WASTE DISPOSAL .................................. 7/1
7.1 Present Situation ................................................................................. 7/1 7.1.1 General .................................................................................... 711
Collection and Transport .......................................................... 7/2 7.1.3 Final Disposal ........................................................................... 7/2
Need for the Project ................................................................. 7/6
7.1.2
7.1.4 Management and Operation ..................................................... 7/3 7.1.5 Problem Analysis ...................................................................... 7/3 7.1.6
H:\ConDat\Ber\PAKISTAM233209\Find RepomFR Vol l\VOLl-Contents.doc

Ouetta WSE . Rnal Reuort. Volume 1 Contents I Pape 4
Page
7.2 Planning Parameters and Assumptions .............................................. 7/6 7.3 Project Definition ................................................................................. 7/6
7.3.1 General Implementation Arrangement ..................................... 7/6 7.3.2 Sustainability of Proposed Sanitary Landfill .............................. 7/7 7.3.3 Design of Facilities ................................................................... 7/7 7.3.4 Environmental Impact ............................................................... 7/8
7.4 Project Measures of Phase 1 (ADB-Project) ....................................... 7/8 7.4.1 Initial Establishment of Sanitary Landfill - SW/P/411 ............... 7/8 7.4.2 Supply of Machinery and Equipment - SW/P/412 .................... 7/9
7.5 Cost Estimate of Phase 1 (ADB-Project) .......................................... 7/10
8 . INSTITUTIONAL DEVELOPMENT AND CAPACITY BUILDING ............... 8/1
8.1 Introduction ......................................................................................... 8/1 8.1.1 Existing Institutional Set-Up in Project Area ............................. 8/1 8.1.2 Overview of the Main Water-Related Departments .................. 8/1
8.1.4 Proposed Institutional Set-Up at Upper Level (Establishment of a Single Water Regulatory Authority) ................................... 8/5 8.1.4.1 Balochistan Water Board (BWB) ............................... 8/5 8.1.4.2 Balochistan Water Resources Management Agency
8.2 Institutional Development on Regulatory Level ................................... 8/7 8.2.1 Institutional Arrangements for Water Resources Management 8/7 8.2.2 Institutional Arrangements to Promote Water Conservation
through Building Codes .......................................................... 8/13 8.2.3 8.2.3 Institutional Arrangements for Solid Waste Management
(SWM) .................................................................................... 8/15 8.3 Capacity Building on Operational Level ............................................ 8/16
8.3.1 8.3.2 Reform of BWASA .................................................................. 8/19
8.3.2.1 Customer Data Base, Billing, Revenue Accounting . 8/21 8.3.2.2 Financial Accounting ................................................ 8/22 8.3.2.3 Development of Double Entry Accounting System
for BWASA .............................................................. 8/23 8.3.2.4 Tariff Structure ......................................................... 8/25 8.3.2.5 Customer Management ........................................... 8/26 8.3.2.6 Management Information System ............................ 8/27 8.3.2.7 Staff Training and Capacity Building ........................ 8/30
Proposed Technical Assistance for Institutional Reforms ................. 8/34
8.1.3 Approach .................................................................................. 8/3
(BW RMA) .................................................................. 8/6
Institutional Arrangements for Sewerage Management .......... 8/14
Existing Situation of BWASA & QMC ..................................... 8/16
8.4
0 H:\ConDat\BeWAKISTA33ZO~nal RsportFR Vd l\VOCl-Contents.doc

Contents I Paee 5 Ouetta WSE . Final Reoort . Volume 1
Page
9 . COMMUNITY DEVELOPMENT AND SOCIAL ISSUES ............................. 9/1
9.1
9.2 9.3
9.4
9.5 9.6 9.7 9.8 9.9
Background ......................................................................................... 9/1 9.1.1 Income ..................................................................................... 9/1 9.1.2 Poverty ..................................................................................... 9/1 9.1.3 Gender ...................................................................................... 9/2 9.1.4 Ethnicity .................................................................................... 9/3 Poverty ................................................................................................ 9/4 Poverty Alleviation .............................................................................. 9/6 9.3.1 Introduction ............................................................................... 9/6 9.3.2 Project Measures ..................................................................... 9/6 9.3.3 Monitoring Criteria and Indicators ............................................. 9/8
9.4.1 Introduction ............................................................................... 9/8 9.4.2 Gender Impact .......................................................................... 8/9
NGO/CBO Involvement ..................................................................... 9/10 Water Use and Ability to Pay ............................................................ 9/16 Public Awareness and Water Conservation ...................................... 9/18 Hygiene Education ............................................................................ 9/20
Gender Disparities .............................................................................. 9/9
Benefit Monitoring and Evaluation ...................................................... 9/9
9.1 0 Resettlement Requirements ............................................................. 9/21 9.1 1 Indigenous People Development Plan Guidelines ............................ 9/23
10 . ENVIRONMENTAL ASSESSMENTS ....................................................... 10/1
10.1 Introduction ....................................................................................... 10/1 10.2 Legal Requirements .......................................................................... 10/2 10.3 IEE Water Supply .............................................................................. 10/3
10.3.1 Options Investigated ............................................................... 10/3 10.3.2 Summary of Findings ............................................................. 10/3 10.3.3 Conclusions and Recommendations ...................................... 10/7
10.4 EIA Waste Water Disposal ................................................................ 10/9 10.4.1 Options Investigated ............................................................... 10/9 10.4.2 Summary of Findings ........................................................... 10/11 10.4.3 Conclusions and Recommendations .................................... 10/13
10.5 EIA - Solid Waste Disposal ............................................................. 1011 4 10.5.1 Options Investigated ............................................................. 10/14 10.5.2 Summary of Findings ........................................................... 10/15 10.5.3 Conclusions and Recommendations .................................... 10/1 8
10.6 Complementary Program ................................................................ 10/20
H:\ConDat\BaflAKISTAJW33209Wnal ReporWR Vol l\VOLl-Contents.doc

Ouetta WSE . Final Reuort . Volume 1 Contents / Page 6
Page
11 . PROGRAM FOR BANK FINANCING ....................................................... 11/1
11.1 Recommended Phase 1 Investment Program (ADB-Project) ........... 1111 1 1.1.1 Water Resource Development ............................................... 11/1 11.1.2 Water Supply .......................................................................... 11/2 1 1 . 13 Wastewater Disposal .............................................................. 11/2 11.1.4 Urban Drainage ...................................................................... 11/3 1 1.1.5 Solid Waste Disposal ............................................................. 11/3 11.1.6 Technical Assistance .............................................................. 11/3 1 1.1.70verview of Project Components ............................................ 11/4
11.2 Summary of Capital Cost Estimates ................................................. 11/6 11.3 Financing of the Recommended Phase 1 Program .......................... 11/7
12 . LONG-TERM DEVELOPMENT PLAN ...................................................... 12/1
12.1 General ............................................................................................. 12/1 12.2 Additional Long-Term Programme .................................................... 12/2
12.2.1 Water Resource Development ............................................... 12/2 12.2.2 Water Supply .......................................................................... 12/2
12.2.4 Drainage and Flood Control ................................................... 12/3 12.3 Supplementary Components ............................................................. 12/6
12.2.3 Wastewater Disposal .............................................................. 12/3
13.4 Summary of Capital Cost Estimates ................................................. 12/7
13 . ECONOMIC AND FINANCIAL APPRAISAL ............................................ 13/1
13.1 Approach .......................................................................................... 13/1
13/2 13.2 Water Supply .................................................................................... 13/2
13.2.2 Economic Considerations ....................................................... 1314 13.2.3 Tariff Recommendations ........................................................ 13/6 13.2.4 Financial Projections .............................................................. 13/9
13.3 Wastewater ..................................................................................... 13/18 13.3.1 Financial Average Incremental Cost ..................................... 13/18
13.3.4 Financial Projections ............................................................ 13/22
13.2.1 Average Incremental Cost Analysis 0 ........................................
13.3.2 Economic Considerations ..................................................... 13/19 13.3.3 Tariff Recommendations ...................................................... 13/20

Ouetta WSE . final ReDort . Volume 1 Contents / Pape 7
Page
14 .
15 .
IMPLEMENTATION PROJECT ................................................................ 14/1
14.1 Integration of Project Components .................................................... 14/1 14.2 Project Implementation ..................................................................... 14/1 14.3 Execution and Coordination .............................................................. 14/2
CONCLUSIONS AND RECOMMENDATIONS ......................................... 15/1
15.1
15.2
15.3
Project Justification ........................................................................... 15/1 15.1.1 General .................................................................................. 15/1 15.1.2 Technical Justification ............................................................ 15/2 15.1.3 Economic and Financial Justification ...................................... 15/2 15.1.4 Environmental Impact ............................................................. 15/3 15.1.5 Social Dimensions .................................................................. 15/3 Issues and Risks ............................................................................... 15/4 15.2.1 Implementation ....................................................................... 15/4 15.2.2 Social and Institutional Aspects .............................................. 15/5 Recommended Action ....................................................................... 15/6
H\ConDat\BeWAKISTAM233209\Final ReportWl V d l\VOCl -Contents.doc

Contents I PaPe 8 Ouetta WSE . Final Reuort . Volume 1
LIST OF TABLES
Page
Table 1.1
Table 2.1
Table 2.2
Table 2.3
Table 3.1
Table 3.2
Table 3.3
Table 3.4
Table 3.5
Table 3.6 a Table 3.7
Table 3.8
Table 3.9
Table 4.1
Table 4.2
Table 4.3
Table 4.4
Table 4.5
Overview of Project Components ............................................... 118
Population Growth Rates (Percent) ............................................ 2/4
Population Projection .................................................................. 2/5
Average useful Lifetime of System Components ...................... 2/17
Number of Wells Tapping the Alluvial Aquifer in the Quetta Valley .......................................................................................... 3/2
Average Groundwater Abstraction From the Alluvial Aquifer by BWASA Wells (Average Values From Determination by FAO.UN. 1997 and BWASA. 1998) ............................................ 3/3
Abstraction Rates. Periods and Net Abstraction of Ground- water from the Alluvial Aquifer in the Quetta Valley by Private Wells ........................................................................................... 314
Measured Abstraction by Private Wells ...................................... 3/5
Typical Data on Dams Investigated .......................................... 3/13
Matrix for Water Conservation Measures ................................. 3/15
Resource Development and Anticipated Effects ...................... 3/17
Water Demand and Production (mio m3/yr) .............................. 3/21
Cost Estimate for Resource Development ................................ 3/33
Existing Water Distribution System ............................................. 4/3
Population Served in the Service Area ....................................... 4/7
Water Consumption and BWASA - Production Requirements ... 4/9
Physical Water Losses in the System ....................................... 4/10
Proposed Water Meter installation in the Service Area ............ 4/17

Quetta WSE . final ReDort . Volume 1 Contents / Paee 9
Table 4.6
Table 4.7
Table 4.8
Table 5.1
Table 5.2
Table 5.3
Table 5.4
Table 5.5
Table 5.6
Table 5.7
Table 5.8
Table 5.9
Table 5.10
Table 5.1 1
Table 6.1
Table 6.2
Table 6.3
Table 6.4
Table 7.1
Table 8.1
Table 8.2
Table 8.3
Page
Proposed Rehabilitation Measures (WS/P/115) ....................... 4/21
Proposed Expansion Measures (WS/P/116) ............................ 4/22
Project Costs of Phase 1 (ADB-Project) ................................... 4/23
Existing Sewer Lines .................................................................. 5/2
Results of Site Inspections ......................................................... 5/3
Comparative Parameters . WW Options .................................. 5/10
Extent of Sewerage Areas ........................................................ 5/19
Required New Sewers and House Connections ....................... 5/21
Effluent Standards .................................................................... 5/23
Quality Requirements for Irrigation ........................................... 5/23
Parameters for Treatment Plant Dimensioning ......................... 5/24
Expected Effluent Quality ......................................................... 5/25
Wastewater Effluent and Irrigation Requirements .................... 5/30
Total Operation Cost ................................................................ 5/32
Existing Drains and Natural Streams .......................................... 6/2
Drainage Maintenance Machinery and Equipment ..................... 6/9
Drainage Development Plan . Phase 2 .................................... 6/12
Summary of Implementation Cost ............................................ 6/18
Summary of Implementation Cost ............................................ 7/10
Cost Estimate . Technical Assistance ...................................... 8/22
Investment Schedule . Technical Assistance .......................... 8/23
Investment Schedule ................................................................ 8/40
H:U)onDat\Ber\PAKISTANQ33ZO~nal ReDOrtFR Vd 1\VOL1~Contents.doc

Ouetta WSE . Hnal Reuort . Volume 1 Contents I Page 10
Page
Table 9.1 : Poverty Indicators Based on a Calorie-Intake Approach (2.250 Calories per Person per Day) .......................................... 915
Table 9.2 : Poverty indicators Based on Basic Needs Approach (Based on Distribution of Expenditure) ....................................... 915
Table 9.3 : Poverty Indicators Based on Basic Needs Approach (Based on Distribution of Income) .............................................. 9/5
Table 9.4 : Development of Low-Cost Water Supply .................................... 9/7
Table 11.1 : Overview of Project Components . Phase 1 (ADB-Project) ..... 11/5
Table 11.2 : Summary of Phase 1 Investments ............................................ 1117
Table 11.3 : Financing Plan for Recommended Phase 1 Project ................. 11/7
Table 12.1 : Overview of Additional Project Components ........................... 12/5
Table 12.2 : Summary of Proposed Phase 1 Water Infrastructure Investments ............................................................................... 12/9
Table 12.3 : Financing Schedule for Recommended Phase 1 Water Supply Investments ...................................................... 12/10
Table 12.4 : Summary of Proposed Phase 1 Waste Water Investments ...................................................... 12/15
Table 12.5 : Summary of Financing Plan for Phase 1 Wastewater Infrastructure Development ................................ 12/16
Table 13.1 : Projected Income Statement ................................................. 13/11
Table 13.2 : Summary of Proposed Phase 1 Water Infrastructure Investments ............................................................................ 13/12
Table 13.3 : Summary of Financing Plan for Phase 1 Water Infrastructure Development ........................................... 13/13
Table 13.4 : Projected Sources and Application of Funds Statements ....... 13/15
Table 13.5 : Summary of Pro-Forma Balance Sheet .................................. 13/17
Table 13.6 : Projected Income Statement .................................................. 13/23
H\ConDat\BeWAKISTNW33209WnaI RepomFR Vd l\VOLl-COnten*i.dffi

Ouetta WSE . Final Report. Volume 1 Contents I Paee 1 l.
Table 13.7 :
Table 13.8 :
Table 13.9 :
Table 13.10 :
Table 13.1 1 :
Table 13.12 :
Table 13.13 :
Summary of Proposed Phase 1 Wastewater Investments ...... 13/24
Summary of Financing Plan for Phase 1 Wastewater Infra- structure Development ........................................................... 13/25
Projected Sources and Application of funds Statements ........ 13/26
Summary of Pro-Forma Balance Sheets ................................ 13/28
Projected Income Statement . BWASA Consolidated Water
Projected Sources and Application of Fund Statement - BWASA Consolidated Water Supply and Wastewater
Supply and Wastewater Operations ....................................... 13/29
Operations .............................................................................. 13/30
Supply and Wastewater Operations ....................................... 13/31 Projected Balance Sheets - BWASA Consolidated Water
LIST OF FIGURES
Page
Figure 2.1 : Trends of Urban Development ................................................... 2/7
Figure 2.2 ; Population Projection .................................................................. 8 8
Figure 2.3 : Rainfall Frequency/lntensity/Duration 2/15 0
....................................... Figure 3.1 : Location of Water Resources ................................................... 3/10
Figure 3.2 : Water Balance in the Quetta Valley .......................................... 3/19
Figure 3.3 : Water Demand and Source Development ................................ 3/22
Figure 4.1 : Layout of Existing Distribution System ....................................... 4/4
Figure 4.2 : Service Areas and Resource Zones ......................................... 4/13
Figure 4.3 : Implementation of Main Distribution System ............................ 4/16
Figure 4.4 : Proposed structure of Distribution System ............................... 4/18
a H\ConDaWeWAKISTA33ZO%Final RepomFR Vol l\VOL-l-ContenDi.doc

Contents / Page 12 Ouetta WSE . Final Report. Volume 1
Figure 5.1 :
Figure 5.1.1 :
Figure 5.1.2 :
Figure 5.1.3 :
Figure 5.1.4 :
Figure 5.2 :
Figure 5.3 :
Figure 5.4 :
Figure 5.5 :
Figure 6.1 :
Figure 7.1 :
Figure 8.1 :
Figure 8.2 :
Figure 8.3 :
Figure 9.1 :
Figure 14.1 :
Existing Sewer System ............................................................... 5/4
Wastewater Disposal Option 1 ................................................. 5/13
Wastewater Disposal Option 2 ................................................. 5/14
Wastewater Disposal Option 3 ................................................. 5/15
Wastewater Disposal Option 4 ................................................. 5/16
Development of Sewered Service Areas .................................. 5/18
Existing and Proposed Sewerage System ................................ 5/22
Proposed Treatment System .................................................... 5/24
Proposed Wastewater Treatment Plant .................................... 5/28
Drainage Development Plan ..................................................... 6/13
Solid Waste Service Area and Disposal Site .............................. 7/5
Management ............................................................................ 8/11
Management ............................................................................ 8/12
Proposed Layout of Functional Departments ........................... 8/20
Organizational Structure - BWASA Community Develop- ment Unit .................................................................................. 9/15
Project Implementation Schedule ............................................. 14/3
Administrative Work Concept for Water Resources
Institutional Framework for Water Resources

Quetta WSE - Final Reoort. Volume 1 Contents / Page I3
ANNEXES
ANNEX 1 : COST ESTIMATES AND INVESTMENT SCHEDULES
ANNEX 2 : CONSULTANT’S ACTIVITIES
ANNEX 3 : EXISTING SITUATION
ANNEX 4 : PROPOSED PROJECT MEASURES
ANNEX 5
ANNEX 6 : TERMS OF REFERENCE FOR CONSULTING SERVICES
: SCOPE OF WORK FOR AN EIA ON WATER SUPPLY (DAMS)
7

Ouetta WSE - Final Report. Volume 1 Abbreviations I PaPe 1
ADB BEPA BlDA BWASA BWR CBO cusec d DGPS EC ft G IS GOB GPS GSP ha IPD kf km km2 I I/c,d I/s LGD m m/s m2 m3 m3/hr m3/yr mmgd
mg/l mio
ABBREVIATIONS
Asian Development Bank Balochistan Environment Protection Agency Balochistan Irrigation and Drainage Agency Balochistan Water and Sanitation Authority Bureau of Water Resources Community Based Organization Cubic feet per second
Day Differential Global Positioning System Conductivity Feet Geographical Information System Government of Balochistan Global Positioning System Geological Survey of Pakistan Hectare Irrigation and Power Department Permeability value [ d s ] Kilometer Square kilometer Liter Liter per person and day Liter per second Local Government Department Meter Meters per second Square meter Cubic meter Cubic meter per hour Cubic meter per year Million gallons per day (imperial) Milligram per liter Million
H\CcnDat\BeAPAKISTAN\233209\Final ReporlFR Vol l\VOLl_Contents.da:

Ouetta WSE - final ReDort. Volume 1 Abbreviations I Paee 2
ABBREVIATIONS (Cont’d)
MES NGO
PBME P&D PC PD PHED PMU QDA QMC SOP T WAPDA yr (or: a) yslcm
OC
: Military Engineering Services : Non Governmental Organization : Degree Celsius : Project Benefit Monitoring & Evaluation : Planning and Development Department, GOB : Project Coordinator : Project Director : Public Health Engineering Department : Project Management Unit : Quetta Development Authority : Quetta Municipal Corporation : Survey of Pakistan : transmissibility value [m2/s] : Water and Power Development Authority : Year : micro Siemens per centimeter (conductivity)
H:\ConDat\BeWAKISTAM233209\nnal RepomFR Voll\VOCl-Contents.doc

1. INTRODUCTION

Quetta WSE - Final Report. Volume 1 Chauter 1 / Paee 1
I . I
1.1 General
Quetta is the capital city of Balochistan, the largest province of the Is,anic Republic of Paki- stan. It is located at an altitude of 1,680 m between the strategically important Bolan and Khojak passes on the route to Afghanistan. The town and suburbs have grown tremendously in the last 20 years, and hold now an estimated population of 1.2 million.
In the prevailing arid climate, Quetta’s water supply is largely dependent upon groundwater from an alluvial aquifer of some 100 m depth underlying the Quetta valley. Over-pumping from more than 2,000 wells for water supply and irrigation at a rate that exceeds the natural recharge, lead to a situation that the aquifer could be exhausted within less than 10 years if exploitation continues at current trends. Considerable water losses and shortcomings in re- source management aggravate the situation. Furthermore, inadequate wastewater and solid waste disposal, stonnwater drainage and flood control seriously affect the existing water re- sources as well as the urban environment.
a
Responding to these conditions, the Government of Balochistan has decided to carry out the current project preparation in the scope of the “Quetta Water Supply and Environmental Im- provement Project”, with Technical Assistance from the Asian Development Bank (ADB) under TA No.2928-PAK.
1.2 Technical Assistance Program
1.2.1 Objectives
This TA comprises consulting services for technical studies, institutional and human re- sources development programs, social and environmental impact assessment, and associated economic and financial analyses. Its primary objective is to prepare a project relevant to the management of water resources by conservation and development in the Quetta basin for possible Bankfinancing. In support of that, the TA will also assess various policy options and institutional arrangements to encourage effective water allocation by consumption-oriented pricing. It will, furthermore, investigate and recommend the economically most viable and sustainable water supply scheme for Quetta, along with improved drainage, wastewater dis- posal and treatment, sanitation and hygiene education to ensure social and environmental ac- ceptability.
1.2.2 TA Implementation
The Contract for Consultant’s Services, Contract No COCS/99-068, dated 16 February 1999, was concluded between the Asian Development Bank and GKW Consult of Germany in as- sociation with Louis Berger Intl. Inc., USA and Engineering Associates (Pvt) Ltd. and Fin- con, of Palustan. Contractually, the Consultant reports to the Bank. a H:\ConDat\BehPAKISTAN\233209\Fin~ Report\FR Val l\vall-chl .doc

Executing Agency for the Project is the Balochistan P&D; it has appointed a Project Coordi- nator (PC) whose tasks include the coordination of TA activities among the line agencies concerned. BWASA is the Implementing Agency, and the establishment of a Project Man: agement Unit (PMU) within its headquarters, headed by the appointed Project Director (PD), had been envisaged in the original set-up of the Project. Practically, BWASA realised internal Project coordination, and participated in Project operations through seconded counterpart personnel.
On the basis of the established arrangements, a Project Steering Committee (PSC) was formed to advise on TA progress and resolve policy issues. Members axe representatives of P&D (chairman), BWASA (secretary), Irngation Dept., PHED, BEPA, LGD, QDA, BCCI and QMC, as well as of the NGO involved in the Project. Participatory meetings were held following submission of inception, interim and draft final reports - and according to actual requirements. Under the coordination of BWASA, the Consultants carried out their assign- ments in cooperation with counterpart staff, and rendered on-the-job training.
Finalization of the TA program package within a compressed time frame has taken extraordi- nary efforts for a number of reasons: Frequent administrative changes - including i.a. five managing directors of the Implementing Agency within the project period and eventually a complete re-shuffling of practically all agencies involved, late constitution of steering com- mittee, very limited counterpart contributions, and late or altogether lacking comments on fundamental issues - were constraints on progress and coordination of the work, that had to be overcome. Technically, the requirement of interdependent solutions and a severe shortfall in basic data material stood against limited time and resources in a less than favorable work- ing environment. Budget targets for a first-phase program were revised by the Bank around and after copy deadline of the consultant’s reporting.
1.3 Need for a Project
Quetta has the greatest population concentration in Balochistan; and, in addition to its ad- ministrative functions, it is also the Province’s major trading and service center. It is linked by national highways, rail and air to the rest of Pakistan, Afghanistan, and Iran.
Natural increase, migration from rural areas, and an influx of Afghan refugees have fueled rapid urban growth and expansion in recent decades. During peak years in this period, the population of Quetta grew at more than 6 percent annually; and, by all accounts the city has mushroomed and exerted ever-increasing demands on the limited resource base of the Quetta Valley.
Between one third and one half of this new urban population resides in densely populated slums (kachi abadis) that surround the municipality. Water supply distribution and extension of services have not kept pace with urban growth, especially in these areas. Overall, per cap- ita water supply availability remains less than one third of the World Health Organization’s recommended minimum; and this deficit is most pronounced among the least-served and poor.
H:\ConDat\BehPAKISTA33209Final Reporl\FR Vol l\voll -chl .doc

Paralleling the region’s rapid urban development has been a dramatic expansion of commer- a
cia1 agriculture, primarily irrigated orchard production, made possible by tubewell irrigation. Large operations now cover much of the land outside the city and play one of the largest p i - vate roles in the local economy.
Ever-increasing rates of pumping-estimated at about 85 million cubic meters (m3) per year-are dramatically exceeding the rate of natural recharge of about 5 1 million m3 per year, from an annual rainfall of only around 200 millimeters. These overdrafts from more than 2,000 wells for water supply and irrigation have resulted in a steadily dropping water table, a decline that has accelerated with growing population and expanded co*mercial agriculture.
The existing water distribution system suffers from a number of problems: More than forty percent of water production is unaccounted for, and revenue collection ratio of total billings is around 50 percent. Metering does not exist, and the flat tariff of PRs 75.- per month per connection (and not per unit of water usage) hinders water conservation incentives. Tariff revenues cover only 40 percent of operating costs with GOB providing the shortfall as a grant. Sanitation conditions are not any better. Households and industry rely on septic tanks and open drainage canals, plus some 57 km of sewers (but only 1,100 connections) for con- veyance of wastewater. There is no sewage treatment plant for the effluent, which currently flows to soak pits and dry riverbeds.
Various institutions of the Government, GOB, and municipal agencies have some control over development, operation, or use of water supply, sanitation, and drainage in Balochistan. Most important among them are BWASA, PHED, the Local Government Department (LGD), the Irrigation Department, the Cantonment Board, Quetta Municipal Corporation (QMC), Quetta Development Authority (QDA), a Water Board, and the Balochistan Environmental Protection Agency (BEPA). Coordination among these agencies is poor and Balochistan lacks coherent and comprehensive policies governing water resources development or con- servation.
The Balochistan Water and Sanitation Authority (BWASA) was formed by an act of the Ba- lochistan Provincial Assembly in 1989 and given the mandate for water supply and sanitation in Quetta City and other urban areas in the province. Outside Quetta City and urban areas, water supply responsibilities are vested in the Public Health Engineering Department (PHED). At present BWASA operations cover only a portion of Quetta City, since it has not been able to extend its mandate to suburban Quetta because of lack of financial and human resources.
a
A Water Board was established in 1995 within the Planning and Development Department (P&D) of the provincial government of Balochistan (GOB) with five members, including the provincial, divisional and municipal authorities, and BWASA. It, however, has had limited influence on control of groun-dwater resources, including use of up to one half of total annual withdrawal for irrigated agriculture. If water and electricity pricing for agriculture were suitably increased to reflect costs, and this resulted in farmers switching to trickle irrigation, up to 60 percent of irrigation water could be saved-representing a 30 percent reduction in groundwater withdrawal.
H:\ConDat\BerWAKISTANQ33209iFinal ReporAFR Vol l\voll -chl .doc

Quetta WSE - Final Reuort. Volume 1 Chaoter 1 I Page 4
Following recent changes on central government level in October 1999, major administrative re-shuffling took place at the agencies involved in Quetta water supply: at present, BWASA is under PHED, which belongs to the h g a t i o n Department. Re-structuring was still ongoing by the copy deadline of the present report. Generally, Balochistan’s institutional framework for the water sector is structurally deficient in three main areas:
a
e
*
agencies responsible for regulating water resources and setting environmental quality standards for sewerage are not enforcing regulations; responsibility for most sector activities is shared by three or more agencies; and government agencies lack strong tradition and experience in involving beneficiaries in decision-making processes.
These deficiencies are manifest in the management of groundwater resources, provision of potable water supply, and management of wastewater, stormwater drainage, and solid waste.
0 Despite manifold problems, Quetta’s water supply and sanitation systems have received only limited external assistance. The Government of the Netherlands has assisted the water supply sector, and since the mid-1980s, the Kuwait Fund provided funding for water distribution and tube wells. The Government of Japan is considering support for wastewater treatment and solid waste facilities, as well as delay action dams and groundwater recharge; and the Gov- ernment of Germany has plans for fire-fighting equipment.
Quetta will have to accommodate - and supply - some 2 million inhabitants by the year 2020. The overall water demand would then exceed 350,000 m3/d, assuming no substantial further growth in the water consumption of agriculture. With this steadily increasing popula- tion and water demand coupled with dropping groundwater levels, Quetta requires interven- tion to improve its water supply situation. Economic growth and expansion are already lim- ited, and current practices of discharging untreated domestic and industrial sewage need to be stopped by providing treatment facilities.
1.4 The Bank’s Sectoral Strategy
The Bank recently has been involved in several projects in the sector. These include the Sec- ond Urban Development Project in the Northwest Frontier Province (Loan 1004-PAK SF) approved in 1989, and the Rawalpindi Urban Water Supply and Sanitation Project in Punjab Province (Loan 1260-PAK(SF), approved in 1993. Implementation of both projects was de- layed over institutional and financing issues and compliance with loan covenants. Experience gained in these projects has been incorporated in TA design of the Quetta project.
An ensuing Project would complement the Bank’s operational strategy for Pakistan which focuses on human resource development, including education, health, population, welfare, and water supply and sanitation; and on environmental concerns. Bank operations provide attention to issues concerning women as beneficiaries in social sector and other projects, and promote a strong participatory approach in all feasible areas of Bank projects.
H:\ConDat\Ber\PAKISTAM233209\Final Report\FR Vol l\vo11 -chl .doc

Ouetta WSE - Final Reuort. Volume 1 Chapter 1 I Page 5
The Bank’s Pakistan program supports economic growth as a complementary strategic ob- jective to generate employment for a rapidly growing labor force and the financial resources required for investment in human and physical capital by both public and private sectors. Critical bottlenecks in physical infrastructure, in the agriculture, transport, and energy sectors are also being addressed and the potential of the private sector is being harnessed whenever possible. Resource mobilization reform, financial market development, governance and pub- lic sector reforms, and an improved policy environment for private sector industry and ex- port-led growth are also key elements of the strategy.
Key policy implications of Bank operations in Pakistan include resource mobilization, devo- lution, and decentralization. These issues are intertwined and cut across all aspects of the Bank’s Palustan program.
Following international sanctions after the nuclear tests and Palustan’s arrears on loan service payments to the Bank, no loans were approved in 1998. However, eight TA grants amounting to $3.9 million were approved.
The Bank undertook a country portfolio review in 1998 to assist the Government in identify- ing and resolving project implementation constraints. Timely implementation of Bank proj- ects has been hampered by a number of project management, financial, and procurement con- straints, some related to effects of sanctions. Generic factors that affect project implementa- tion across the portfolio include long delays in preparation and approval of projects, recruit- ment of consultants, pre-qualification of contractors, and award of contracts. Pakistan’s eco- nomic difficulties also impose high fiscal constraints and severely limit availability of coun- terpart funds for timely intervention of projects.
1.5 Scope of the Project
In accordance with the Bank’s sectoral strategy and the requirements of the Terms of Refer- ence to this project preparatory technical assistance, the ensuing Project enhances:
0
0
8 sanitation and drainage improvement;
0
0
Q
0 water conservation and water source augmentation; improved water supply services, including a metering program;
financial sustainability; institutional integration for water supply provision and groundwater management; building management capacity of BWASA; and community participation and strengthened integration of sanitation with health care through hygiene education.
In this context, the Project is to solve the current backlog of essential infrastructure services in the City of Quetta and surrounding villages, and at the same- time set up medium and long- term programs for their feasible and sustainable development.
H:\ConDat\BeWAKlSTAN\233209Final ReportFR Vol l\voll -chl .doc

Ouetta WSE - Final ReDort. Volume 1 ChaDter 1 /Page 6
Particularly addressing the needs of low-income groups, the Project lays emphasis on reduc- 0
tion of health hazards: improvement of living conditions, and promotion of urban efficiency. It will also support expansion of the urban economy, which is of increasing importance in view of constraints imposed by limited water resources on the sustainability of irrigated agri- culture. Towards such purposes, services will be improved and expanded in the relevant sec- tors, as well as towards sound technical and financial management, operation and mainte- nance of infrastructure facilities, and other institutional capacities of the agencies involved.
Achievement of the Project's primary objectives by conservation and development, including those technical, institutional and social measures necessary to secure and improve the water supply and sanitation of Quetta City and surroundings, requires both a comprehensive ap- proach and a high degree of coordination among constituent activities and interventions. Be- cause many proposed actions are mutually dependent, project success needs integrated and carefully sequenced implementation of project components.
This is considered - together with the anticipated development of water demand, funding re- quirements and local implementation capacities - in the proposed programming, namely: ''
Project for Bank Financing
In the short-range, the immediate objective of the ensuing Project proposed for Bank financ- ing is to arrest and stabilize the decline of service levels and urban environmental quality through a Phase 1 program to restore failing infrastructure required to sustain the city for the next 5 to 10 years. This scenario, with a planning horizon of 2005, includes implementation of those components that provide necessary and logical first steps toward longer-term solu- tions. Depletion of the alluvial aquifer will continue, but the collective impact of proposed measures will slow the process and provide time for the preparation of more sustainable so- lutions and implementation of urgent institutional improvements.
Long-term Strategy .
The envisioned overall Project includes major sectoral implementation packages and a sup- plementary package of supporting components, as well as the anticipated institutional, finan- cial, environmental, and participation component packages. Requirement and realistic possi- bilities to combine these interrelated components in order to prepare a project package for sustainable water supply and environmental protection have been addressed in the Interim Report. Results were further processed during the second Phase of the consultant's assign- ment, and are laid out in the present Final Report.
0
Following the Programming Workshop on 17. and 18. November 1999, principal decisions on the further course of the implementation program were made. An overview of the selected project options and supporting components is given in the following Table 1.1. Subprojects proposed for ADB funding in the first implementation Phase are further detailed in Chapter 11. Comprehensive descriptions of all components are compiled in the relevant Sector Re- ports submitted under separate cover.
H:\ConDat\BehPAKISTA33209~1n~ ReportWR V d I\voll -chl .doc

The proposed measures are designed to enhance the protection of earlier investment and ex- tend fundamental social services to the direct benefit of about 355,000 present and additional 420,000 consumers in its Phase 1 till 2005, and a total of 1,795,000 inhabitants overall by the end of the planning period in 2020.
a
The cost of Phase 1 including engineering, contingencies and value added tax is estimated at about US$ 109.31 million. Thereof, the Bank proposes financing of approx. 70% through loan. Overall program cost till 2020 is estimated at US$ 344.28 million in constant mid 1999 terms.
The Project is given high priority by the Government, and is in conformity with the Bank’s country assistance planning and operational policy for the sector, particularly in terms of a necessary integration of various sub-sectoral initiatives for better coordination and mutual reinforcement. For Quetta, the administrative and commercial center of Balochistan, substan- tial improvements especially in the water supply sector are essential.
H:\CanDaW-aWMISTA332Winal ReporWR V d l\vollchl.dw

Quetta WSE - Final Report. Volume 1 Chapter 1 I Paee 8
0
TABLE 1.1 : OVERVIEW OF PROJECT COMPONENTS -
B. PHASE I IMPLEMENTATION
I WATER RESOURCE DEVELOPMENT
WS/C/lOl B Consulting for Well Rehabilitation 01/01 - 12/03 WS/C/102A 07/01 - 12/02 WS/P/l 1 1 04/01 - 12/03 WS/P/113A Well Construction L2 and L3 07/01 - 12/02
Consulting for Well Construction L2 and L3 Well Rehabilitation in the Quetta Valley
Subtotal
WATER SUPPLY
WS/C/105 Consulting for System Rehabilitation 01/01 - 12/05 WS/C/lO6 Consulting for Water Supply Expansion I 01/01 - 12/05 WS/P/115 Water Supply Rehabilitation Project 01/02 - 12/05 WS/P/116 Water Supply Expansion Project I 01/02 - 12/05
Subtotal
WASTEWATER DISPOSAL
WW/C/201 Consulting for Wastewater Project I 01/01 - 12/05 WW/P/211 Wastewater Disposal Project I 01/02 - 12/05
Subtotal
URBAN DRAINAGE
DF/P/312 Supply of Drainage Maintenance Equipment 01/02 - 06/02 Subtotal
SOLID WASTE DISPOSAL
SW/P/411 Initial Construction of Sanitary Landfill 01/02 - 12/03 SW/P/412 Supply and Installation of Equipment 01/02 - 06/03
Subtotal TOTAL B
Description Code I
444,259 1,612,458 5,923,450.
21,499,438
I A. WATER RESOURCE INVESTIGATION
INSICIlOl A
NSICI103A Hydrology and Soil-mechanical Tests
NSIPI l l2 ExDloration Well Drillina
Consulting Services for Exploration of New Groundwater Resources
for Kuchnai Dam Scheme (1 st campaign)
TOTAL A I
Duration
37/00 - 12/01
1 O/OO - 03/01
1 o/oo - 12/01
Base Cost 7 659,800
192,200
2,962,122
308,500 549,300
1,589,352 1,005,062
29,479,605 1 1,496,144 19,948,190
61 4,200 61 4,200
1,161,850 856,000
2,017,850
H:\ConDat\BetlPAKlSTAN\233209Fin~A ReporWR VoI l\voll-chl .doc

Quetta WSE - Final ReDort. Volume 1 Chaoter 1 /Page 9
Code
0 Table 1.1 : (cont'd)
Description
lD/C/501
iD/C/502 lD/C/503
lD/C/504 'D/C/505 SP/C/i'Ol SP/C/702
SP/C/704
I Advisory Services for Financial & Commercial Management in BWASA Advisory Services for Project Implementation Advisory Services forpublic Works Technical Management & Operation Provincial Institutional Reforms Benefit Monitoring and Evaluation Social Action Plan Public Awareness & Community-oriented Conservation Program Hygiene Education
TOTAL C
Duration ~ ~
01/01 - 12/03
01/01 - 12/01 01/02 - 12/03
01/02 - 12/03 01/02 - 12/03 01/01 - 12/03 01/01 - 12/05
01/01 - 12/05
780,000
276,000 786,000
320,000 106,000 446,000 348,117
780,000
3,842,117
H:\ConDat\BeWAKISTAN\233209Fin~ ReportFR Vol l\voll-chl .dm

Table 1.1 : (cont'd)
Code Description
WS/C/1028
WS/C/l03B
WSIPI1138 WS/P/114
Consulting for Well Construction L1, Z1, 22
Hydrology and Soil-mechanical Tests for Kuchnai Scheme (2nd campaign) Well Construction L1 Well Construction Z1 and 22
t I
GRAND TOTAL
a
Duration
Subtota
01/06 - 12/12 intermittent
01/12 - 12/12
01/06 - 12/06 01/07 - 12/07 01/12 - 12/12
WS/C/lO7 WS/C/lO8 WS/P/117 WS/P/ll8
01/06 - 12/10 01/11 - 12/17 01/07 - 12/10 01/12 - 12/17
01/06 - 12/10 01/13 - 12/17 01/07 - 12/10 01114 - 12/17
Consulting for Water Supply Expansion I I Consulting for Water Supply Expansion 111 Water Supply Expansion Project II Water Supply Expansion Project I l l
Subtota
06/01 - 12/03 01/06 - 12/10 01/12 - 12/16 01/07 - 12/10 01/13 - 12/16
WW/C/202 WW/C/203 WW/P/212 WW/P/213
Base Cost' US$
Consulting for Wastewater Project I1 Consulting for Wastewater Project I l l Wastewater Disposal Project I1 Wastewater Disposal Project Ill
Subtota
1,073,72(
101,70(
502,53' 1,818,551 1,214,03; 4,710,54~
2,192,31: 4,628,72'
29,230,83( 61,716,28( 97,768,14:
1,797,28; 1,622,38:
23,963,831 21,631,77( 49,015,27d
2,535,00( 885,45(
2,238,75( 11,806,00( 29,850,00( 47,315,20(
DF/P/311 DF/C/303 DF/C/304 DF/P/313 DF/P/314
198,809,161
Initial Maintenance & Rehabilitation Program Consulting for Drainage Project II Consulting for Drainage Project Ill Drainage & Flood Control Project I I Drainage & Flood Control Project Ill
Subtota TOTAL C
262,621,60I
.
. . .
H : \ C o n D a t \ B e r \ P A K I S T ~ 3 3 Z O ~ n ~ ReporWR V d l\voll-chl .doc

a 2. PLANNING BACKGROUND

Quetta WSE -.Final Report, Volume 1 Chaoter 2 / Pave 1
2.1 Project Area
The Project Area comprises of the project’s Service Area and the extended area around Quetta, in which relevant water sources are located or investigated.
The Service Area is confined by the mountain ranges east and west of the Quetta valley, by the Mian Ghundi hill and Rakhshan Housing Scheme near the southern boundary of Quetta Subdistrict, by the rough east-west borderline of arable land about 1-2 km north of the railway bridge over Khwaja Lora, and by the proposed treatment plant location near the village I o l i Barmah in the north-west.
The present land use in this area is as following: 0 Developed area 220 km2 incl. ola 66 km2 municipal and ola 33 km2 Cantt. Area Cultivated land 61 km2 Open space 61 km2 Total potential service area 342 km2
The Service Area and anticipated trends of urban development are illustrated in Figure 2.1 below.
Main features of the geographical setting’ are summarised as follows:
Location: Quetta city is located at about 30’-10’ north and 67’-01’ east, some 600 km north of Karachi and 700 km south-west of Lahore at a general elevation of 1,680 m above sea level.
Topography: The cup-shaped Quetta valley is surrounded by five mountain ranges that rise up to 3,350 m. The valley bottom slopes at a fairly uniform gradient of 1.25% from 1,740 m in the south to about 1,600 m a.s.1. in the north-west. It is well drained by the two main watercourses, (Sariab) Lora Nadi river and Habib Nallah, which joins it some 4 km north-west of the city center, and a number of smaller streams.
a
Geology: The mountainous periphery of the Quetta basin is made up by the jurassic- eocene limestone ridges of the Murdar, Chiltan and Takatu ranges, together with the terti- ary Urak conglomerates and the Urak Sra Khula Shales. The valley section comprises the piedmont marginal gravel zones and, in the central parts, recent fine deposits of loam, clay and gravels, overlaying thick deposits of pliocene clays.
detailed descriptions are given in the Interim Report
H:\ConDaI\Ber\PAKISTAN\233209Final ReportFR Vol I\voll -ch2.doc

Quetta WSE - Final ReDon. Volume 1 ChaDter 2 / Page 2
Soils: Major parts of the valley bottom are covered by sandy to silty loam, mixed with pebbles and boulders towards the foothills. Around the city area, upper impermeable lay- ers of fine alluvial and wind-driven dust deposits are found. In deeper strata there are beds of shingle, spreading in fans from the bottom of the mountain streams as they reach flatter sections.
Climate: Quetta has an arid mountain climate with temperatures falling below zero in winter and rising above 4OoC in summer. Most of the precipitation (average 228 m d y r ) occurs in winter and spring as rain storm or snow. Average humidity is around 33%. Like many towns in Balochistan, Quetta and its suburbs lie in the outwash fans of non- perennial mountain streams that, sporadically, turn into torrents due to intensive local rain- storms and can cause major flooding.
The Extended Project Area - thoroughly described in the Interim Report - includes the potential dam sites between MangiKhappar Rift in the east to Kuchnai near Quetta and to Burj Aziz Khan in the west and their watersheds, as well as the locations of eventual fur- ther hydrological and hydrogeological programs. Figure 3.1 below gives an overall view of the extended project area. For obvious economic reasons, locations are given decreasing priority with their distance from the service area.
2.2 Population
2.2.1 Census 1998
To make an estimate on the demand for potable water in the Project area, latest population. figures for Quetta city (municipal wards), including cantonment and rural area (killies) lo- cated on the outslurts of the capital city were obtained. The GOP conducted the last popu- lation census in March 1998 all over the country, including Balochistan, and the provi- sional figures were published in July 1998. Accordingly, the total population of Quetta Tehsil (subdistrict) was enumerated as 742,969 persons, which was distributed as follows:
a Census Unit Persons Percent
(a) Quetta Municipal Corporation 48 8,223 65.71 (b) Quetta Cantonment 72,084 9.70 (c) Urban (a+b) 5 60,3 07 75.41 (d) Rural 182.662 24.59
Quetta Tehsil (c+d) 742,969 100.00
These figures indicate that nearly 2/3'd (65.71%) of the total population reside in QMC area while about 10% live in the Cantonment. Thus a little over 75% of the total popula- tion was classified as urban while the proportion of the rural population came close to 25%.
The city area is heavily congested and any major expansion, which may become necessary in future would be either on land occupied by new housing colonies or in rural areas on the outskirts of the city.
H:\ConDat\BeWAKISTAM233209\Final ReportVR Vol l\voll -chZ.doc

Ouetta WSE - Final Reoort. Volume 1 Chapter 2 / Page 3
2.2.2 Validity of Quetta 1998 Census Data2
As these figures were seriously questioned, plausibility checks were carried out on the ba- sis of the city map / recent satellite images and actual population densities. The above population of Quetta municipal area (66 km2) would - if correct - lead to a very low den- sity of 73 pers./ ha. This is not considered realistic and thus strongly indicates that census figures are incomplete. Population densities for the year 1981 are given in the Quetta Ur- ban Plan (1987) to range between 124 and 321 pers./ha in the municipal area.
It may be pointed out that the 1998 census work in some areas of Balochistan - including parts of Quetta city and suburbs - could not be carried out properly due to political distur- bances at the time. As a consequence, the population in the disturbed parts of Quetta was estimated on the basis of trends observed in the enumerated areas. These provisional esti- mates were deemed to be replaced by actual population figures as soon as the census work would be re-conducted in the leftover areas3. However, this latter exercise was never com- pleted. According to independent research agencies, scholars, as well as Government offi- cials in local bodies such as QMC election commission staff who were assigned the re- sponsibility of updating of voters lists, were of the view that, if proper count was held - especially in congested wards of the city, slum areas and lullies (villages) adjacent to ur- ban boundaries - the number of Quetta population would not be less than 1.2 million.
0
In order to verify the plausibility of this population figure and the distribution of residents, the consultant delineated within the overall Service Area 22 typical housing areas, con- sisting of 72 sub-areas, on the basis of satellite images, maps as far as available, and water supply wards. Representative population density samples were assessed in the scope of the social field surveys and superimposed on the respective sub-areas'. Results were system- atically processed (comp. DFR, Vol.2.1.B, Annex B5) and they generally confirmed the estimated present population. Seasonal and overall fluctuations are likely, but are in the present. context of minor influence, since the majority of the groups concerned (refugees, semi-nomads, seasonal workers, troops) are at the low end of specific water consumption.
' Being aware of general shortcomings in available demographic figures, the Central Government planned in March 2000 the establishment of a countrywide comprehensive population data base.
Popiilation and Housing Census of Pakistan 1998, Census Bulletin-5 Provisional Results of Balochistan, Population Census Organization, Statistics Division, GOP, July 1998, page-1 (Foreword).
In the Interim Report an aerial survey and mapping program was proposed, which would improve the re- sults of this method - and yield proper maps for the area.
H:\ConDat\BehPAKISTAN\233209Final ReportFR VoI l\voll-ch2.doc

Ouetta WSE - Final Reoort. Volume 1 Chaoter 2 / Page 4
* Census Quetta Quetta Urban Quetta Quetta Balochistan Pakistan Years M.C. Cantt. MC+Cantt. Tehsil District
(u+r) 1951 -61 3.60 -0.35 2.43 5.25 -3.320 1.49 3.21 1961 -72 5.12 -2.58 3.64 5.38 5.363 5.46 3.07 1972-81 6.61 8.05 6.80 4.63 4.699 6.64 2.87 1 981 -98 4.14 3.39 4.04 4.12 4.130 4.91 2.61 1951 -98 4.72 2.03 N.A N.A 2.89 3.73 2.92 A
2.2.3 Design Population and Growth Rates
a) Base Year Population
Based on the above findings, and in consultation with the Government officials, research agencies, and senior social and political workers/leaders residing in the city, the base year population has been taken as 1.2 million in the year 2000 as a “design population”, in- cluding seasonal workers, guests and Cantonment residents. This planning assumption was confirmed by the Minister for BWASA and BDA, Government of Balochistan.
b) Growth Rates
Population growth rates for QMC, Cantonment, Quetta Tehsil and other places in Balo- chistan during the last five censuses are given in Table 2.1 as follows:
Table 2.1 : POPULATION GROWTH RATES (Percent)
It is reflected by the above data that the overall annual average growth rate in QMC over the last five censuses (1951-98), which covered a period of 47 years, has been 4.72% while in Quetta Cantonment it was 2.03%. The bifurcation details of data into rural and urban for Quetta Tehsil in 1951 census are not available. The growth rate for Quetta dis- trict is 2.9 percent while for Balochistan province it is 3.7 percent, and the national figure is 2.9 percent. The average figure for QMC, Cantonment and District Quetta comes to 3.21 percent. Again, these figures, especially the later ones, have to be looked at with critical reservation. However, in the absence of precise 1998 data, plausible estimates were made for the task in hand as following:
In view of the marked variation in growth rates, it has been decided to adjust the project population of Quetta Project to the overall rate of Palustan at 3 percent up until 2010 and thereafter at 2.5 percent till the end of the planning period in 2020. A longer-term declin- ing trend in growth of population appears tenable in view of the following reasons:
- The influx of Afghan Refugees may reasonably be assumed to be over. There is an increasing number of cases of emigration form Pakistan (both from NWFP and Balochistan provinces) to native homes in Afghanistan; the general scarcity of drinlung water as well as over-crowding and environmental pollution in Quetta has acquired significant proportions. These conditions may ad- versely react on decisions of prospective investors as well as tourists to settle andor visit Quetta even on short-term basis;
-
H:\ConDat\BehPAK1STAN\23320Winal Report\FR Vol l\voll -ch2.doc

Ouetta WSE -.Final Report. Volume I Chapter 2 / Paee 5
201 0-1 1 201 1-12 2012-13
- reduction in job opportunities due to slackening of economic activity as well as semi-stagnation of construction and services sector; saturation of construction work has long been reached in the central city area where horizontal expansion is not possible for want of space and social amenities. The vertical growth of the city is strategically not feasible owing to the fact that Quetta valley, which is geologically identified as “fault zone”, is directly influ- enced by seismic activity. Expansion, and therefore population growth, occurs at the outskirts of the city; and there have been massive efforts on the part of the provincial government to pro- mote education in the province, including Quetta. Therefore an increase in social and educational awareness induces social responsibility in the general public. Such environment is conducive to the promotion of family planning and eventually re- sults in a managed and balanced family size.
-
-
1,612,700 3.0 1,653,017 2.5 1,694,343 2.5
Again, the sensitivity of this assumption is reduced in respect of project planning due to a lower water consumption through yard connections and community taps of a large part of the population.
~~
c) Design Population
2014-15 201 5-1 6 2016-17 201 7-1 8
Using the growth rates of 3% up till 2010 and 2.5% thereafter up till 2020, and the base year population of 1.2 million, the projections for the Quetta Water Supply and Environ- mental Improvement Project are as given in Table 2.2 below, and are further illustrated in Figure 2.2. Table 2.3 and the appertaining Figure 2.3 show the most likely present and future distribution of inhabitants in the Service Area.
1,780,119 2.5 1,824,622 2.5 1,870,237 2.5 1,916,993 2.5
Table 2.2 : POPULATION PROJECTION
2018-19 1,964,918 2.5
H:\ConDat\BeWAKISTAM233209\Final Repon\FR Vol l\voll -chZ.doc

Ouetta WSE - Final Reuort. Volume 1 Chapter 2 I Paee 6
d) Spatial Distribution of Population
In the Quetta area - as in comparable other fast growing cities - a trend can be observed, that, in economic textbooks is described as Thuen's Circles (Thiin'sche Kreise): Low- technology, land consuming production moves from expensive central areas to the periph- ery, where land is much cheaper and production (e.g. agriculture) remains economic. Ar- eas close to the growth center increase in price and are occupied by more profitable (re- ferred to area) high-tech businesses, or are used for residences and - where proper urban development planning is carried out - for recreation. This process of organic urban growth takes place fairly uncontrolled in Quetta. For the agro-business concerned, it is a matter of economic advantage, rather than a question of governmental action planning.
In view of technical (and eventually financial) constraints of groundwater abstraction for irrigation at present locations, and incentive provision of nutrient-rich recycled wastewater at prospective new agricultural land that is still close to the market place, it is reasonably assumed that a part of the present agricultural activities will continue to follow this natural trend, once industrial quantities of treated wastewater are made available for irrigation. The assumption is strongly supported by recent offers of land owners to sell their private wells to BWASA.
0
It is therefore anticipated that, in the second half of the planning period and after the con- struction of the wastewater treatment plant, as part of the ADB Project - Phase 1, a part of the affected irrigation wells can be re-utilized for water supply. This is expected to add up to 15 mio m3/yr in 2010 (19 mio m3/yr in 2015 and 21 mio. m3/yr by 2020) to the quanti- ties available for human consumption - without harming the overall agricultural require- ments.
H:\ConDat\BeWAKISTANQ33209\Final RepoRWR Vol 1 \vo11 -chP.doc


Figure 2.2 POPULATION PROJECTION QUETTA SERVICE AREA
2.00 1
201 0 201 5 YEAR+

a t e 21 e
2.3 Socio-economic Situation
The following overview of key socio-economic aspects is given as a summary of relevant issues related to the proposed program. For the detailed assessment and evaluation of the socio-economic context, reference is made to the extensive descriptions in the respective interim and sector reporting.
2.3.1 General
With nearly one-sixth of the entire provincial population, greater Quetta has become the largest urban concentration in Balochistan. Its population has about quadruplet within the last 20 years. Given current trends, its prominence and share of the provincial population will continue to increase. Both Pakistan and Balochistan are becoming more urban.
In part because it hosts the provincial capital, Quetta exerts a dominant influence on re- 0
gioial development and almost all spheres of life. It is the hub of commerce, education, communication, and health care; the seat of Divisional- and District governments; and the political, economic, military, and cultural center of the province. With half the province’s population within an 80 km radius, Quetta is effectively the primate city of Balochistan, and no other urban center in the province comes close to supplying the functions it pro- vides.
Socioeconomic and environmental change in rural areas has ‘pushed’ migrants to Quetta, while the city’s attractions of employment, education, marriage, and urban amenities have also ‘pulled’ rural residents. Arising on the social seam between boundaries of ancestral Pashtoon (50%), Baloch (35%), and Brahui tribal territories, Quetta has become a complex multi-cultural amalgam of indigenous groups and later arrivals. The ethnic mix of the city also includes a sizeable Hazara (10%) community, substantial post-Partition settler com- munities of Mohajirs and Punjabis, the more recent refugees from Afghan troubles, Sind- his, and several other ethnic minorities. Old and new neighborhoods and settlement pat- terns display a high degree of ethnic segregation and sensitivity, and, in many respects, Quetta is less a consolidated urban community than a collection of ethnic enclaves. Group identities are distinct, each with their own cultural traditions and social organizations, practices, and values.
0
In addition to ethnic diversity, the city reflects extremes in income and standards of living. While lifestyles differ importantly among Quetta’s ethnic groups, these differences are often less pronounced than those between the more modern and affluent urban core areas and housing estates and the remnant rural villages and swelling migrant settlements that surround them.
Urban expansion in recent decades has occurred largely outside the boundaries and be- yond the reach of the designed municipality. This process has absorbed rural villages and stretched further into the elongated Quetta Valley in the form of leapfrogging new settle- ments associated with housing schemes. In addition to these more or less planned and relatively self-contained extensions, unplanned settlement has occurred on a massive scale, filling in the valley interstices and spreading up its lower slopes in kachi abadis - 0 H:\ConDai\Be~~ISTAM233209\Final RepomFR Vol l\voll ch2.doc

generally mud-constructed low income communities and slums. This growth pressed aging municipal infrastructure beyond its limits and severe suppl y/demand gaps in urban serv- ices have been widening.
The city’s lack of urban consolidation is multidimensional. In addition to ethnic and in- come segregation, urban services lack both reach and integration. Abetted by discontinui- ties in local and provincial governments and distracted administrations; the unregulated urban growth process has continued. As a result, contemporary Quetta is a mixed con- glomerate of diverse urban forms and residential enclaves, including the original military cantonment, the civil lines and municipal core of British Quetta, satellite housing areas and sub-communities, rural villages, and extensive slums. Between one third and one half of the urban population resides in the densely populated kachi abadis, and great and growing disparities in income, opportunities, and outlook strain a fragile social fabric.
2.3.2 Urban Poverty
Poverty is a pervasive feature of the Service Area, and Quetta’s problems may be ap- proaching those of Palustan’s larger urban areas, which house the most degrading poverty in the Sub-Continent. Nationally, about three-quarters of all new households established in urban areas between 1985 and 1990 were in slums, and Quetta’s katchi abadis share their acute lack of social services, particularly sanitation and sewerage.
The extent and depth of poverty in Quetta has been measured through several methods. These include calorie-based, basic needs, and income poverty measures, and several indi- ces. A Human Poverty Index synthesises life expectancy, literacy, and a composite of variables including access to safe water and health services, and child malnutrition; and a more recent Poverty of Opportunity Index captures a composite of, health, education, and income deprivation, which also includes access to safe drinking water.
Poverty levels reported for Balochistan are slightly lower than the national figures but many are based on population to service ratios. Quetta’s relatively higher social indicators, for example, are based on the census population, 742,969 in 1998, and drop severely against the estimated actual Service Area population of 1.2 million. About one quarter to one third of Pakistan’s population falls below the poverty line in the more narrow caloric, basic needs, and income level definitions of poverty. However, when poverty is consid- ered in the broader sense, in terms of denial of opportunity in education, health, material well-being, job security, political and social freedoms, and other dimensions, Pakistan’s poverty profiles rise to almost half the population (between 44-47 percent). About 35 per- cent of the urban population are estimated to fall below poverty levels and 48 percent of the rural population.
0
Quetta’s poor are characterized by low levels of human resource development associated with food deficiency, lack of minimum income to satisfy basic needs, and deprivations of education, health, and other services. Disaggregated by gender, male poverty in Pakistan is estimated as 37.4 percent and female poverty as 51.9 percent. Balochistan has the lowest adult literacy .in Pakistan, and female illiteracy in Quetta, in some estimates is close to 85
’ percent. Balochistan also has the nation’s highest infant mortality rates (IMR) for both ur- ban and rural areas. ‘Most lethal diseases in Balochistan and much morbidity are water-
~
H:\ConDat\BehPAKISTAN\233Z~in~ ReportWl Vol l\voll -ch2.dcc

Quetta WSE -.Final Report. Volume 1 Chapter 2 / Page I I
borne or related. Apart from low birth weight, the main causes of infant death are related 0
to contaminated water and poor sanitation. Fifty percent of Balochistan’s IMR, for exam- ple, is associated with diarrhea.
Recent national research indicates no discernible trend in reduction of income poverty in Palustan, and, in some measures, it is believed to have increased since 1987-88. Figures do indicate a reduction when broader measures are considered, but female poverty is de- creasing at much slower rates than male, especially in education, reflecting increasing fe- male-male disparities; and. rural poverty in Palustan has decreased faster than urban.
2.3.3 Gender Disparities
All three of Quetta’s major ethnic groups share the institution of purdah, although their practices vary. Purdah is promoted by a set of cultural values associated with women’s proper behavior, shame, and honor that supports a system segregating women from all men other than their closest relatives. It divides social life into two strictly segregated spheres, one of the outdoor, public life of men, and the other, the indoor, secluded life of women. The conservative Pashtoon, typically practice strict seclusion of women, and most Pashtoon women between the ages of 14-45 seldom or never leave their family com- pounds. Hazara seclusion of women is less strict than Pashtoon, and women shop freely and are less heavily veiled. Among the less orthodox Baloch, Most women are free to shop in neighborhood markets, visit nearby houses, and exert influence in domestic matters.
0
Urban expansion in recent decades has occurred largely outside the boundaries and be- yond the reach of the designed municipality. This process has absorbed rural villages and stretched further into the elongated Quetta Valley in the form of leapfrogging new settle- ments associated with housing schemes. In addition to these more or less planned and relatively self-cpntained extensions, unplanned settlement has occurred on a massive scale, filling in the valley interstices and spreading up its lower slopes in kachi abadis - generally mud-constructed low income communities and slums.
Accommodating the growth Quetta experienced would have challenged any urban area, and the city has had mixed success in keeping pace with its expansion. Quetta’s selection as Balochistan’s capital unfortunately coincided with a breakdown in the provin- cial/federal relationship, subsequent dissolution of the provincial government, and a period of armed conflict. These were difficult times in the province, accompanied by high unem- ployment and worsening poverty, during which Quetta’s growth pressed the aging mu- nicipal infrastructure to its limits. Service capacities were thoroughly exceeded with the refugee influx that began in the late 1970’s and became a flood that included almost 400,000 displaced Afghanis in 12 large camps and as many more unregistered ones, many of them in Quetta. Despite several extensions of the municipal limits, expanding admin- istered area threefold from an original 2.5 sq. miles, the city was unable to keep up, and supply/demand gaps in urban services have essentially widened ever since.
a
In addition to ethnic and income segregation, urban services lack both reach and integra- tion. Abetted ‘by discontinuities in local and provincial governments and distracted ad-
’ ministrations; the unregulated urban growth process has continued. As a result, contempo- rary Quetta is a mixed conglomerate of diverse urban forms and residential enclaves, in-
.
a H:\ConDal\BehPAKlSTAN\233209~1n~ RepoltFR VoI l\voll-ch2.dcc

cluding the original military cantonment, the civil lines and municipal core of British Quetta, satellite housing areas and sub-communities, rural villages, and extensive slums. Between one third and one half of the urban population resides in the densely populated kachi abadis, and great and growing disparities in income, opportunities, and outlook strain a fragile social fabric.
2.3.4 Administration
Another dimension of dis-consolidation and the many ‘Quettas’ depicted are the Service Area’s multiple and often disjunct jurisdictions. Local government and administration in the Quetta Valley is a patchwork of units that rarely act in concert, including the Quetta Municipal Corporation (QMC), a Cantonment Board, the Pakistan Army, the Quetta De- velopment Authority (QDA), and several Union Councils represented on a District Coun- cil. QMC, the largest of these units, administers barely one-sixth of the Service Area and less than half of the built-up areas that comprise greater Quetta.
The provision of water supply, urban services, and sewerage, sanitation, drainage, and solid waste disposal is yet another, and even less coherent, layer of governments, agencies, local bodies, communities, and the private sector.
Quetta’s water supply alone involves nearly twenty government agencies and an even larger number of semi- and unofficial undertakings. The two largest agencies, BWASA and PHED, together distribute barely a third of the domestic drinking water actually con- sumed in the Service Area. The remainder is provided by a hodgepodge of other agencies and private schemes operating more than 100 tube wells, 800 dug wells, and an unknown number of small distribution systems. A significant amount of this water is marketed by private sector tanker services. Project surveys indicate that thirteen of these private tube wells, alone, may sell as much .as 5 percent of domestic water consumed.
Sewerage and sanitation services are provided by several public agencies and private schemes, including the Cantonment Board, QMC, QDA, BWASA, and a number of gov- ernment housing colonies and private housing schemes. These services reach, at most, less than 15 percent of Service Area households, and the remainder of the population is left to its own devices and an array of on-lot facilities, including pit and pour-flush latrines, and open drains. Stormwater drainage is largely a colonial legacy restricted to portions of the QMC area and the GOB-constructed Kasi Nallah. The Cantonment Board and QMC pro- vide solid waste services only within their boundaries; and the nearly one-third of the greater Quetta built-up areas outside them, including many of the kacha abadis, service themselves.
0
In short, most households and communities in Service Area meet their own needs for wa- ter, sanitation, and waste disposal - often not very well, or not as well as they would like- without assistance or services from government. In several neighborhoods and katchi aba- dis, communities have mobilized with NGO and CBO support to develop or upgrade their own service systems. Somewhat surprising in these circumstances, is that water supply complaints, dissatisfaction, and demands for improved services appear to be greater in the
’ areas that receive public services than outside them. In any event, within the tangle of
.
H:\ConDat\BeWAKISTA33209Final RewmFR Vol l\voll -ch2.dcc

Ouetta WSE - Final ReDort. Volume I Chauter 2 I Page 13
public, private, and, community-based services provided in the Service Area, extensive service gaps and deficits exist, both within publicly served areas and outside them.
a
2.3.5 Economy
Almost as disparate as its ethnic, social, spatial, and service divisions, are Quetta’s many economies. In spite of its prevalent poverty, several major economic streams of national and international dimension meet in the provincial capital. Quetta is a gateway in substan- tial formal and informal trade and commercial transactions across Balochistan’s porous borders with Afghanistan and Iran. In contrast to its underdeveloped social infrastructure and decayed and collapsing urban services, Quetta’s economic infrastructure has strength- ened, supporting seemingly robust private sector activity.
Quetta has enjoyed the subsidies of an extensive public economy supported by federal and provincial government spending and large military facilities. Cold War-era strategic con- siderations also drew significant foreign assistance to the region until the dissolution of the Soviet Union, and the refugee situation generated sizeable infusions of spending by inter- national relief agencies.
0
At the same time, locally important productive agricultural, livestock, and mining sectors make steady contributions. Notably accompanying the region’s rapid urban development has been a dramatic expansion of commercial agriculture, primarily irrigated orchard pro- duction made possible by electrification and tube well irrigation. Large operations now cover much o€ the land outside the city and play one of the largest private roles in the local economy.
The fortuitous convergence of these multiple financial flows and the development they promoted was a both a magnet for the migration that has overwhelmed the Valley and the means of staving off many of its consequences.
Changing geopolitical circumstances and macro-economic factors, however, have in- creasingly undercut much of Quetta’s largely induced economic vitality, threatening the establishment of self-sustaining and sustainable growth required to both satisfy service deficits and meet escalating demands of its residents.
Macroeconomic constriction and diminished public sector capacity have become major factors in the current situation.
Balochistan as a province does not pay for itself and government operations are essentially funded through transfers from the federal budget. To the extent that Quetta’s economy is associated with this financial stream, it can expect reduced in-flow of government spend- ing and diminished federal capacity to support urban development. Quetta is not immune to international economic trends and the severe tightening of the national economy that has recently occurred.
H:\ConDal\BehPAKISTA33ZO~inal ReportFR Vol l\voll -chZ.da:

Prior to the May 1998 nuclear testing which resulted in international sanctions imposed by major donors, the macro-economic environment was relatively encouraging. Through the boost of good crop output and a revival of manufacturing, real GDP had increased by more than 5 percent in the prior year, overcoming the negative growth that preceded it.
Overall economic performance was also stronger than in recent years, investment had in- creased, savings had picked up, and the trade gap had narrowed. The agriculture sector - providing 25 % of GDP and 47 percent of employment - had increased by almost 6 per- cent after a disappointing 0.1 percent the year before.
This situation has changed significantly over the last year5. Palustan’s domestic economy has deteriorated rapidly since the nuclear tests and subsequent worsening of the interna- tional situation which has adversely affected foreign investment. Despite the recent IMF financial package, the underlying socioeconomic difficulties confronting the nation are unlikely to be resolved quickly.
2.3.6 Employment
Principal occupation classes reported in government data include landowners, cultivators, flock-owners, traders, laborers, artisans, and government employees. District profile data suggests that the urban labor force represents nearly 22 percent of the total population (male 37%; female 2.1%). The major occupation group is “production and related work- ers, transport, equipment operation and laborers”, making up nearly a third of the total la- bor force.
The major economic activities reported are service-oriented, absorbing more than 28% percent of the worlung population, including civilian government services; followed by “Wholesale and retail trade and restaurants and hotels” accounting for nearly one-fourth of the working population.
Child labor is common among the poor and in the informal sector. According to the La- bour Survey 1993-94, the total number of children working as laborers in Quetta was 1,693. Children are mainly involved as either paid or unpaid workers in garages, tailoring, electric workshops, and shoe making. This number does not cover children working as house servants, or those collecting garbage, many of whom are Afghan refugees. Many children are also involved in loading and unloading fruit and vegetables.
’ eventual effects of the last change of Government in mid October excluded.
H:\ConDat\Ber\PAKISTAM233a09\Final ReportVR Vol l\voll -ch2.dcc

Ouetta WSE - Final ReDort. Volume I Chaoter 2 I Paee 15
2.3.7 Environment and Water Resources
Concurrent with these economic contractions, Quetta has also begun to fully experience an ecological recession associated with diminished environmental services, retreating re- sources, and a depletion of natural capital signaled most clearly by its receding water ta- ble. Severe environmental deterioration has followed the city’s growth. As Greater Quetta exerts ever-increasing demands on the limited resource base of the Quetta Valley the ca- pacity of its environmental systems to support the city are furthered diminished.
As commercial farms chase a falling water table and urban development arrests its re- charge, much of Quetta’s local economy, including the capacity to support its vital trade and commercial sector, lives on borrowed time and faces tremendous challenges in a situation when both its own and the national economy are likely to further weaken rather than recover.
The necessity of a deliberate and determined transition to a sustainable development tra- jectory will require decisive public leadership, collaborative collective action, and social partnership hitherto unrealized among Quetta’s diverse communities.
a
With both its wells and its fiscal resources drying-up, Quetta looks increasingly to both international donors and to its own communities for solutions to its water crisis and urban environmental problems.
Socio-economic surveys6 included qualitative appraisals of BWASA-provided service and facilities, environmental health, affordability and acceptability of potential tariff increases, and flooding problems and experience, viz.:
- Almost 65% of responding households identified water supply-related prob- lems as the highest priority for solution under a potential ensuing Project. Households overwhelmingly indicated shortage of water as the most urgent is- sue, followed by irregular and inconvenient night-time water provision and poor water quality. More than 30% of responding households identified solid waste-related prob- lems as the highest priority for solution under an ensuing Project. Lack of proper arrangements for disposal of solid wastes was the most urgent issue identified, followed by current practices of throwing/dumping waste in open spaces and plots including playgrounds, and non-provision of dustbins by mu- nicipal or other authorities. About 4% of responding households identified drainage and sewerage-related problems as the highest priority for solution under an ensuing Project. Poor drainage and the unhygienic condition of open drains was the most urgent issue identified, followed by malfunctioning of the sewerage system and associated widespread pollution. Almost 80% of surveyed households indicated they had made efforts to solve identified problems by bringing them to the attention of appropriate authorities. Those served by QCB, MES, and PHED reported that these organizations were
-
-
-
’ 6Carried out in the scope of the TA in 60 of 220 identified localities, with informationfrom 170 households. Due to security reasons low-income areas are under-represented. Full descriptions are provided in the in- terim and final sector reporting. 0 H:\ConDat\Ber\PAKISTAM233209\Final RepomFR Vol l\voll -ch2.doc

approached when necessary. Households served by BWASA indicated that they had approached their area QMC Councilor, local newspapers, and Provin- cial Ministers for attention to their problems. A majority of households re- ported that, besides verbal assurances and promises, government had provided no solutions to the problems identified. More than 20% of households expressed extreme frustration with absent, in- adequate, or contaminated BWASA-supplied water, but indicated their efforts to solve these problems-including recourse to BWASA valve-men and suc- tion pumps-had been to no avail. Stakeholders also expressed great concern with the unsanitary situation of the city associated with the inadequacy, inappropriateness, or absence of drains and sewers. They drew attention to the widely prevalent discharge of human refuse and house waste directly into open drains, typically clogged and broken drains, choked sewer lines overflowing into streets, the lack of dustlgarbage bins, and the absence or inattention of QMC sanitation personnel. A common theme of stakeholder comment was the need for an integrated, co- ordinated, and multi-sectoral approach. At one level, this involved the ex- pressed recognition that urban environmental problems were multi-dimensional and included interrelated water, sanitation, drainage and solid waste elements that should not be addressed in isolation. Many stakeholders supported a com- prehensive program that would include attention not only to water supply, but also to broader urban environmental conditions, and to the needs of poorly served katcha abadis.
-
-
-
Forging a collective response to water resource development and urban water problems entails the participation of many sectors and stakeholders at several levels and new and more open modes of decision-making and operation including cooperation with NGOs and community-based organizations. This process has begun and promising initiatives are evi- dent at several levels, from preparation of the Balochistan Conservation Strategy to com- . munity-based activities in many parts of the city. The recent re-installation of local gov- ernments also provides new avenues and opportunities for addressing common problems.
2.3.8 Socio-economic Planning Criteria
-As a major factor in the human and social development, planning for Quetta water supply and environmental improvement considers key socio-economic parameters and social di- mensions of the Service and Project Areas, and employs the following associated socio- economic planning criteria:
- - - Gender Factors -
- Attention to Vulnerable Groups - Human Resources Development - -
Continuing Increase of Urban Population and Development Aspirations Ethnic Diversity and Multi-cultural Considerations
Diver gent S oci o-economic Characteristics and Conditions of Beneficiaries ' - Poverty
Divergent Jurisdictions and Local Governments Divergent Current Service Modes and Providers
H : \ C o n D a l \ B e r \ P A K I S T ~ ~ Z O ~ n ~ ReportFR VoI l\voll -chZ.doc

Ouena WSE - Final Reoort. Volume 1 Chaoter 2 I F’aae 17
Pipelines Tubewells Pumps, machines and other WE equipment Civil structures Ground reservoirs Water towers
Gaps Between Government and Communities Macro-economic Constriction and Diminished Public Sector Capacities Public/private Partnerships Donor Partnerships Multi-level Public Involvement Limited Experience with Participatory Development Benefit Monitoring and Evaluation Household Size Ability to Pay
20-40 years, depending on material 10-1 5 years 10-1 5 years 40 years 40 years 20-30 years
These factors, further detailed in the Vol. 4 Social Studies, find full attention in the con- sultants’ approach towards socially sustainable solutions and, consequently, in the design of the proposed program.
2.4 Planning Horizon a
In view of the required sustainability of water resource development, social infrastructure and environmental improvement, and considering the average useful lifetime of system components shown in Table 2.4, a long-term planning period of 20 years has been ap- proved. The Planning Horizon is thus Year 2020. Intermediate stages of 5 years duration allow the detailed implementation program to be adjusted to actual development if neces- sary.
Table 2.3 : Average useful lifetime of system components

3. SECTOR PROGRAM : WATER RESOURCE DEVELOPMENT

Ouetta WSE - Final Report, Volume 1 Chapter 3 / Paee I
3. SECTOR PROGRAM -RESOURCE DEVELOPMENT
The following chapters summarize the results of investigations on the current use of water sources, and delineate the proposed program for their improved utilization, as well as the development of new water resources for the Quetta Service Area. For detailed descriptions of investigations and findings, reference is made to Volume 2.1, Part A of the present re- port, and to Volumes 2.1 and 2.2 of the Interim Report.
3.1 Present Situation
With a view to the comprehensive appraisal of the existing conditions, all available data bases and documents were reviewed and supplemented by field investigations. A ground- water model was established, calibrated and used to support the hydrogeological assess- ments and conclusions. Consultant's activities included the following: 0 e The well inventory was conducted according to the availability of counterpart person-
nel for BWASA and PHED wells. With the training provided and the equipment pro- cured (GPS, dipmeter) the inventory is supposed to be continued by the counterparts.
e The works performed included the assessment of all available data and the execution of field visits for the evaluation of artificial recharge techniques and possibilities in the Quetta valley (delay action dams and spreading structures).
Beyond the scope of the TOR, pumping tests have been conducted for BWASA wells in order to assess well hydraulics and performances.
e The mathematical model' of the Quetta valley was installed and calibrated, as de- manded with the TOR in the first phase of the project until the submission of the In- terim Report. The model was subsequently upgraded from steady state to transient function. This procedure was provided beyond the scope of the TOR in order to sup- plement the interpretation of existing data with regard to the evaluation of existing and new groundwater resources. The current results for the Quetta valley alluvial aquifer and an assessment of the impact of eventual groundwater production from the Chiltan limestone aquifer and from the Urak group in the Zarghoon range are summarized in the following and are detailed described in Volume 2.1 of the Final Report, Chapter A. 4.2.2.
e A GIS has been developed and updated with the collected data concerning surface and groundwater resources; the data have been processed and visualized for the respective evaluations.
0 Comprehensive on-the-job training for counterpart staff in well inventory work, GIS and hydraulic groundwater modeling has been conducted in the frame of the water re- sources investigations.
forfiill descriptions refer to the Sector Report, Vol. 2.1, and the Training Manual, Vol. 7.2, of this Final I
Report.
H:\ConDat\BehPAKISTA33209~inal Rewtt\FR Vol l\voI 1 ch3.doc

Quetta WSE - Enal Reuort. Volume 1 Chauter 3/Paee 2
0 Based on the comprehensive evaluation of datdstudies, field investigations, processing of data with the developed GIS and the groundwater modeling, necessary works for the management and exploitation of sustainable water resources are defined. Detailed designs for the rehabilitation of existing wells, exploration of new groundwater sources (limestone aquifedzarghoon range), preliminary designs for new well fields and necessary investigation programs for the utilization of the Kuchnai dam scheme, each with costs estimates are provided. The concept for a staged development of the water resources is delineated.
With that background, the present situation of the currently utilized water resources is summarized in the following chapter.
3.1.1 Current Sources
Generalities
About 86% of Quetta's present water supply is based on the exploitation of the alluvial groundwater resources of the Quetta Valley, mainly by tube wells. The remaining quanti- ties are abstracted from existing wells in the limestone aquifer (9%) and from Spin Karez impounding reservoir (5%). Total average abstraction from the alluvium for domestic use is around 40 mo.m3/yr, for agricultural use approximately 35 Mio. m3/yr groundwater are abstracted with daily pumping rates falling far below the respective average figure in the later months of the year during dry season. Surface water from Spin Karez and Urak Headworks' is still supplied to the Cantonment (average 2.3 mi0 m3/yr) via the existing fil- tratiodchlorination plant, but has to be supplemented by the available groundwater from MES wells:
The groundwater resources are tapped by a total of approximately 500 tubewells and some 1,266 dugwells, about 238 tubewells and 816 dugwells are used for domestic / industrial water supply (see Table 3.1). This includes functional wells of BWASA (87), PHED (62) and MES (ll), as the main agencies for public water supply. A considerable number of tubewells and practically all dugwells are thus operated privately. The traditional kurezes ceased to be used for drinlung water supply. a Table 3.1 : NUMBER OF WELLS TAPPING THE ALLUVIAL AQUIFER IN THE
QUETTA VALLEY
H:\ConDat\Be~PAKISTAM233209\Final ReportFR V d l \voll -ch3.doc

Public wells
Well Av. Ab- Av. Abstrac- Av. Annual Number Location straction tion Period Abslraction of Wells
Rate per Well m3/h hid d/yr rn3/yr
City area 29.2 19.2 365 204,634 58 Northern Well 73.9 14.2 365 383,024 9
With the available well inventory it could be shown that the vast majority of production wells of BWASA and PHED do not allow the measurement of water level andor the yield. According to the evaluation of the existing pumping tests and conduction of pump- ing tests, inadequate ratings of the well performance and insufficient development of the wells are apparent. Therefore, for the productive wells of BWASAPHED an extensive rehabilitation program is deemed necessary.
Annual Ab- straction
m3/yr 11,868,749 3,447,213
It is apparent that the determination of dynamiclstatic groundwater level, detailed abstrac- tion rates or pumping hours could not be facilitated during the present project, but can only be executed after a first rehabilitation phase of wells (installation piezometedwater meter) is implemented. Following the first rehabilitation phase of the wells, pumping tests have to be executed for the rating of the sustainable yields of the wells. With these data available, pumps corresponding to the rated optimum performance of the wells and elec- tro-mechanical equipment (with electrodes) can be designed in detail and installed in a second phase of rehabilitation measures. 0
Field Western Well Field Southern Well
The BWASA share of the yearly estimated groundwater abstraction from the alluvial aqui- fer can be assessed based on the available average abstraction determination from FAO- UN (1997) and BWASA from 1998 (Interim Report, V01.2.2, Annex 5.12). The calcu- lated abstraction per well field and overall abstraction of BWASA wells from the alluvial aquifer is summarized in Table 3.2.
Table 3.2 : AVERAGE GROUNDWATER ABSTRACTION FROM THE ALLU- VIAL AQUIFER BY BWASA WELLS (AVERAGE VALUES FROM DETERMINATION BY FAO-UN, 1997 AND BWASA, 1998)
34.4 18.0 365 226,008 4 904,032
28.8 21.4 365 224,957 11 2,474,525 Field
SUM 18,69431 9
Approximately 18,7 Mio m3/yr can be estimated as the abstraction rate from the alluvial aquifer from the 82 BWASA wells, if the well fields are operated according to the design capacities. Flow measurement carried out in the framework of the project indicates ap- proximately a production of only 52 % of the rated abstraction figures for the Northern, Western and Southern Well Field. From the overall estimated abstraction of approximately 75 Mio. m3/yr groundwater from the alluvial aquifer in the Quetta valley, approximately 25.0 % are estimated to be currently abstracted by BWASA wells.
H:\ConDat\Ber\PAKISTAM233209\Final RepomFR Vol l\voll -ch3.doc

Ouetta WSE - Final Report, Volume 1 Chaoter 3 / Paee 4
Tubewell, do- mestic Tubewell, irri-
It is estimated by BWASA (1996) that the PHED wells account for a water production of 13,600 m3/d (approximately 4.96 Mio. m3/yr, or 6.6 % of the estimated groundwater ab- straction of the alluvial aquifer). For cantonment wells, an average abstraction of 20 m3/h, an average pumping time of 18 hours per day can be estimated for 365 days per year, re- sulting in an abstraction of approximately 1,76 Mio m3/yr (2,3 % of the estimated groundwater abstraction of the alluvial aquifer).
a
Av. Ab- Av. Abstrac- Av. Annual Number Annual Ab- straction tion Period Abstraction of Wells straction
Rate per Well m3/h h/d d/yr m3/yr m3/yr
30.60 9 240 134,028.0 78 5,155,488.0
30.60 12 240 88,128.0 262 23,089,536.0
Therefore, the public sector (BWASA, PHED and MEYcantonment) combined are utiliz- ing approximately 35 % of the estimated yearly groundwater net abstraction from the allu- vial aquifer.
Pumped dug- well, domestic Pumped dug-
The five BWASA wells tapping the limestone aquifer are not regarded in the discussed abstraction of groundwater. The five wells are estimated to abstract 4.34 Mio. m3/yr from the limestone aquifer.
18.00 9 240 70,080.0 225 8,748,000.0
18.00 12 240 46,080.0 225 11,664,000.0
Private wells
well, irrigation Manually oper- ated dugwell
As for the public wells, an estimation of the groundwater abstraction of the private wells tapping the alluvial aquifer has been executed.
0.05 12 365 21 9.0 81 6 178,704.0
Estimations of abstraction rates and abstraction periods for the different types of private wells according to the main use of the wells (domestic water supply or irrigation) are pro- vided (see also Interim Report Vol. 2.1, chapter 5.1.6). Based on a detailed assessment of existing data (GWC, 1991 for tubewells, HALCROW, 1995, 1996 for dugwells, WAPDA, 1992, 1996 and BWR, 1995, 1999 for dugwells and tubewells), the rates and periods of the estimated groundwater abstraction by private wells from the alluvial aquifer are compiled in Table 3.3.
Table 3.3 : ABSTRACTION RATES, PERIODS AND NET ABSTRACTION OF GROUNDWATER FROM THE ALLUVIAL AQUIFER IN THE QUETTA VALLEY BY PRIVATE WELLS
The average abstraction rates used for private domestic tubewells is 30.6 m3/h for 9 h/d (BWR, 1999). In order to proof the assumption of an abstraction of approximately 30 m3/h 0 H:\ConDat\BeAPAKISTAM233209\Enal ReportFR Vol l\voll -ch3.doc

Quetta WSE -.Final Reoort. Volume 1 Chapter 3 / Page 5
P 2 P 3 P 4
for 9 h/d (270 m3/d), the actual abstraction from 12 private tubewells have been measured. Based on water tanker fillings, the abstraction was monitored (Table 3.4). For the 12 pri- vate tubewells, a total of 4260 m3 was abstracted on the day of observation. This amounts to an average abstraction of 355 m3/d per well. Hence, the utilized average abstraction rate of 30.6 m3/h for 9 h/d in Table 3.3 is in the same order of magnitude.
0
Amanullah water supply 1 .ooo, Haii Mlan Khan W.S. 200, Kaleem Water Supply 600,
-P 5 Haii Wali Mohammed W.S. 300,C P 6 Hafeez Water Supply P 7 Haii Wali Khan W.S. 600,C P 8 Safina cold store 100,q P 9IJahangeer Water Supply I P 121National Water Supply 200,c
Source: Report No. 6-WASA 2/labNal 1/11/4622 28.1.1 999
The assumed average pumping rates of dugwells with centrifugal pumps of 18 m3/h are realistic, since these pump types provide generally a yield of 15-20 m3/h. For the manually operated wells a yield of 0.05 m3/h (50 l/h), is assumed as realistic by HALCROW (1997). Accordingly, the abstraction figures provided with Table 3.3 can be regarded as the at present most representative estimation of the groundwater abstraction from the alluvial aquifer in the Quetta valley by the different private wells. The daily pumping hours and pumping days per year are reduced in comparison to the estimation provided with the In- terim Report (Vol 2.1, chapter 5.1.6, Table 5.5). This has been implemented, since spot- checks during investigations in the second phase of the project showed that the pumping frequency is less than assumed prior.
Summarizing, the groundwater abstraction from the alluvial aquifer by public wells (BWASA, PHED, MES) is 25,13 Mio. m3/yr, the groundwater abstraction by private wells is 48,8 Mio. m3/yr. From the overall net groundwater abstraction from the alluvial aquifer, only 35 % are utilized for the public water supply and 65 % for private use. From the pri- vately abstracted groundwater from the alluvial aquifer of 48,8 Mo. m3/yr, 34,8 Mio. m3/yr groundwater (71 %) is utilized for irrigation, 14 Wo. m3/yr (29 %) for domestic water supply.
H : \ C o n D a t \ B e r \ P A K I S T ~ ~ 2 0 9 ~ n ~ ReportFR Vol l\voll-ch3.dcc

Quetta WSE -.Final Reoort. Volume 1 Chapter 3/Paee 6
Since the inventory of private wells could not be commenced by the counterpart staff due to their non-availability, the presented first assessment of the conditions of private tubew- ells is based on spot-checks. Some private wells have been visited during the field works on public wells. As for the public wells, it was observed that the vast majority of private tubewells do not allow the measurement of water level and/or the yield. The figure of the groundwater abstraction by private wells is an estimate, without considering stand-by times of wells due to electricity failures and is based on assumptions, which can not be fully proven at present. A certain number of the wells included in the calculation may not be in production anymore, whereas others (especially implemented by private drilling companies) may not be registered.
A final assessment of the groundwater abstraction from the alluvial aquifer by private wells will be possible only after the abstraction is actually recorded on a representative number of wells with water meters over at least one hydrological year. The estimation of the groundwater abstraction will be more reliable as the amount of recorded wells will in- crease.
The continuation of the well inventory for the private wells is deemed mandatory for a detailed evaluation and for the establishment of input parameter for the hydraulic model- ling and is therefore included in the proposed project component WS/C/101.
3.1.2 Need for a Project
At the climatic and hydraulic boundary conditions, prevailing in the project area, a severe depletion of the groundwater resources in the alluvial aquifer is outlined with the investi- gations performed.
The existing abstraction facilities of BWASA and PHED in the alluvial aquifer show tech- nical short-comings. With the needed extensive rehabilitation program, further additional drawdown in the wells can be avoided and an adequate exploitation corresponding to the hydrogeological boundary conditions of the well site and the well hydraulics under eco- nomic pumping costs will be achieved.
In addition to an improved management of the existing groundwater resources (rehabilita- tion, water conservation) the development of additional water resources are required in order to secure the water supply for Quetta.
In order to cover the future water demand with a sustainable water production, the fol- lowing described strategy was worked out within this project, based on the investigations performed.
Detailed calculations show that the total expected water demand in the service area of ap- proximately 134 mi0 m3 in 2020 will be covered only to about 65 mio m3/yr by a sustain- able supply from the alluvial aquifer (which equals the natural rechargelinflow including the return flows from domestic water supply and irrigation), and some 7 mi0 m3/yr from the ‘present other sources Limestone aquifer and Spin Karez Dam. Even with effective water conservation, re-use of up to 24.8 mio m3/yr treated wastewater for irrigation and all return flows, a still remaining deficit of approximately 40 mi0 m3/yr has to be covered un- til 2020 from additional water resources.
H:\ConDat\Ber\PAKlSTANQ33209\Final ReportWR VoI l\voll -chd.doc

Quetta WSE -,Final Report. Volume 1 Chapter 3IPaee 7
3.2 Development of water resources
3.2.1 Primary Sources
A thorough analysis of existing sources and the potential to optimize their further utiliza- tion - through conservation, loss reduction, recycling and artificial recharge - revealed, that these are necessary measures towards achievement of an improved water balance. How- ever, even with these measures taking full effect as secondary sources, there will still re- main a massive requirement to develop additional water resources in order to cope with the increasing demand. With a view to swift and economical augmentation of presently available quantities, the following development of primary sources is proposed:
a) Rehabilitation of Existing Wells
Under the Ref. WS/P/ l l l , the rehabilitation to original design capacity of up to 100 wells in the alluvial aquifer of the Quetta Valley (mainly BWASA, but also PHED, and other wells eventually taken over) is envisaged. Detailed descriptions of the scope of work and the associated engineering services under Ref. WS/C/101 are given, together with the relevant cost estimates, in Chapter 3.2 above. Works are co-ordinated with the proposed system rehabilitation, and are to be completed before December 2003.
0
It can reasonably be expected, that these measures restore the previous output and increase the production by at least 8.8 mi0 m3/yr, but, equally important, bring back full capacity use of pumping, transmission, storage and distribution facilities constructed just about 10 years ago.
b) Development of Limestone Well Fields
Based on the interpretation of available datdstudies (e.g. JICA, 1988, WAPDA, 1992) and field visits of existing BWASA wells, maximum yields in the order of 100 m3/h at low drawdowns (in the order of 5 m) have been recorded at existing production wells tapping the limestone aquifer. With a security reduction of 20%, an average yield of 80 m3/h per future well at a reasonable drawdown is considered a sound prediction for future produc- tion wells.
a The desk studies and field investigations, confirmed by respective runs of the groundwater model, showed that the most promising areas for groundwater development of the lime- stone aquifer are located in the northeast and southeast of Quetta, in areas with fault zones. The appropriate areas for proposed abstraction centers have been delineated as well fields Ll, L2 and L3, as indicated in Figure 3.1. Using a total of 30 successful production wells and an average yield of 80 m3/h at 16 hrs daily pumping as planning parameters, the com- bined average yield from these three well fields will reach about 14 mi0 m3/ yr.
Due to the extensive thickness of the limestone aquifer and the presumably large subsur- face catchment area, a long-term sustainable yield of wells is expected.
The impact of the future exploitation of the limestone aquifer on the alluvial aquifer was assessed. Based on:
H:\ConDat\Ber\PAKISTANW32Wtnal RepomFR V d l\voll -ch3.doc

0 the examination of available data, 0 the delineation of high yields of wells tapping the limestone at low drawdowns, 0 transient model runs with the groundwater model (these runs have been additionally
executed, beyond the TOR, which stipulate only a calibration of the model), it was concluded that a 30 year exploitation period of the limestone aquifer will not sub- stantially effect the alluvial aquifer. Instead, a relief of the situation in the alluvial aquifer can be expected, if groundwater production is shifted to the limestone aquifer.
However, since relatively limited data are available, a comprehensive exploration program including geophysics and tests wells is included in the proposed program in order to con- firm the suitability of long-term abstractions and to define the final design of production wells. The exploration program and the proposed well field implementation project are detailed below. The number of 30 test wells is justified, since some test wells have to be used as observation wells while pumping individual test wells. Only with this method. Storativity values, important input parameters for the modelling, can be delineated. Espe- cially in fractured/karst aquifer systems as encountered in the project area, the heterogene- ous groundwater bearing zones can be localized with sufficient accuracy only with direct observations from test wells.
0
Following detailed geophysical exploration and test drilling (Ref. WS/C/lOl and WS/P/112 resp.), the three well fields are proposed to be developed, north-east, east and south of the city center, close to the respective supply zones. Under Ref. WS/P/113, the following program is envisioned:
0 Well Field L1 10 wells; 4.67 mi0 m3/yr till 2008 0 Well Field L2 12 wells; 5.61 mio rn3/yr till 2004 0 Well Field L3 8 wells: 3.74 mio m3/yr till 2004
Total : 14.02 mio m3/yr
Four existing BWASA wells near L2, earlier test drilling in the south, and the consultants hydrogeological field investigations and modeling results indicate a very high potential yield from this aquifer in the selected areas. The locations allow fast well construction and relative easy connection to existing percolation facilities. a c) Development of Zarghoon Range Well Fields
Further locations with high potential have been identified in the Zarghoon Range, a wide syncline with approximately 23 x 28 km extension in the east of Quetta. The presence of fault lines and open joints as potential groundwater bearing structures underlined by abun- dant springs in the central Zarghoon Range, indicate the high potential of the proposed in- vestigation area Z l (Shra Khula valley, 5 km north of Urak village) for substantial groundwater abstraction. The area is accessible with a drilling rig.
In order to achieve a sufficient well yield, it is recommended to take advantage of the huge thickness of the formation and to drill wells of sufficient depth. Hydraulic heads of about 2020 m above sea level are encountered at Urak and at Bilal Kach. Both locations are situ- ated at about 4 km downstream of the proposed investigation area. The investigation area in the Shra Khula Valley has a topographic elevation of about 2120m. The depth to the groundwater table can therefore be expected to be less than 100m. A rough estimate of the 0 H:\ConDat\Be~iPAKISTANV33209\Final ReportVR Vol I\vollch3.doc

Chapter 3 I Paee 9 Ouetta WSE - Final Report. Volume 1
recharge inside the surface catchment area of the Shra Khula is in the order of 2 Mi0 m3/year. However, the Zarghoon consists of a huge block of the Urak Formation with a large vertical extension. Therefore, from the hydrogeological point of view, it must be seen in its totality and it can be expected that the long-term sustainable yield will exceed the figure of recharge in the catchment area of the Shra Khula valley substantially.
As concluded from analyses of Islam Kach and Sakhobai Spring samples collected during field visits, the water quality in the area does not impose problems.
Additional hydrogeological interpretation of available data and field reconnaissance indi- cated a promising exploration areas some 4 to 6 km due east (22) in the upper Shra Khula valley, and a further prospecting area (22 alt.) was delineated to the south-east of this re- gion as eventual alternative or complementation. 21 and 22 allow gravity feeding to all parts of the Quetta service area, and the static head of more than 300 m suggests a combi- nation of break pressure facilities with power generation.
As provisional planning parameters, a total of 70 production wells in two well fields are anticipated to supply 16 Mio m3/yr at average 16 hrs daily pumping and yields around 40 m3/h per well. The production from well field Z1 is estimated with 9 mi0 m3/year from 40 wells, the production from well field 2 2 could presumably deliver 7 mio m3/year from 30 wells. The influence of groundwater production in the Zarghoon Range was assessed with the groundwater model. No influence to the hydraulic system in the Quetta valley has to be expected within the next 10 years, and in the further future the influence - if any - will be marginal.
The necessary detailed exploration and test drilling programs for the potential Zarghoon Range well fields are included in the source development component of the project pack- age proposed for Bank financing. The indicated number of 60 test wells is considered as the minimum necessary. It has to be emphasised that the Zarghun range is an unknown exploration target. Observation wells while pumping test wells are mandatory in order to delineate the cone of depression and storativity values. In the fractured aquifer systems of the conglomerates and sandstones of the Zarghu rage, the heterogeneous groundwater bearing zones can be localised with the needed accuracy only with direct observations from sufficient test wells. Considering the large areal extent of the exploration area, the number of 60 test wells is justified. A reduction of the exploration program may deliver limited observations and may results in a inappropriate assessment of the groundwater potential of the area.
e
H:\ConDat\BeWAKISTA33209Ftnal ReportFR Vol l\voll c h 3 . d ~


Quetta WSE - Final Report. Volume 1 Chapter 3IPaee 11
The further hydrogeologicalkydrological investigations are proposed to support detailed geophysical investigations and test drilling in two pre-selected exploration areas (Ref. WS/C/101 and WS/P/ll2). Subject to their results, a staged development program for two major well fields is envisaged under Ref. WS/P/114, namely:
0 Well Field 2 1 40 wells; 9.00 mio m3/yr till 2009 0 Well Field 2 2 30 wells; 7.00 mio m3/yr till 2014
Total : 16.00 mio m3/yr
The most promising exploration areas lie in the upper Shra Khula valley some 5 km north of Urak village (Zl), and from there further 4 to 6 km due east (22) on a motorable track. A further prospecting area (22 alt.) was delineated to the south-east of this region as eventual alternative or complementation. 21 and 2 2 allow gravity feeding to all parts of the Quetta service area, and the static head of more than 300 m suggests a combination of break pressure facilities with power generation.
d) Kuchnai Dam Scheme
An impounding reservoir on Urak (Chashmo Tanga) river, in conjunction with existing facilities, was found to present a sustainable least-cost option for the supplementation of Quetta water resources. From technical, economic and environmental points of view, this solution has clear advantages over the other options with surface waters as resources that were analyzed in the scope of the ongoing project.
The dam site is situated at the most appropriate location just downstream of the confluence of Loe Dara and Kuchnai Dara streams, about 2 km upstream of the existing Urak Head- works from where since 1896 the Cantonment receives water. The chosen location allows maximizing of storage capacity against height and width of the dam. Sedimentation is seen as a potential problem.at this site; the existing (but not operated) Wali Tangi dam on Loe Dara and a new structure on Kuchnai Dara are proposed as silt check dams to reduce the sediment load reaching the reservoir. The useful life span could further be increased by a change of the spillway and outlet design to reduce the trap efficiency of suspended sedi-
0 ments.
The proposed Kuchnai Dam Scheme envisages the rehabilitation and incorporation of the existing facilities of Spin Karez and Hanna dams and Urak Headworks, as well as the re- habilitation and extension of the Cantonment Water Works. Arrangements allow gravity feeding to all parts of the Quetta service area, and the static head of more than 400 m sug- gests a combination of break pressure facilities with power generation.
The yield from the reservoir of the proposed Kuchnai Dam is estimated at min.7.73 mi0 m3/yr according to NDC (1988). In a combined system WaliTangi / Kuchnai / Spin Karez (min. 2.7 mio m3/yr) / Hanna (ca. 1.8 mi0 rn3/yr abstraction is considered not to affect the present leisure activities), a total yield of up to 10 mio m3/yr can reasonably be expected.
H:\ConDat\Ber\PAI(ISTAN\233ZO~n~ ReportFR V d l\voll zh3.doc

Main features of the proposed Kuchnai dam are:
Catchment area 57.8 km2 max. surface 24.0 ha max. capacity 3.74 mi0 m3 dam earthhock fill body with clay core (d.s. 1:3; U.S. 1:2.5)
o/a height 60 m; crest length 315 m crest level 2,334 m; river bottom 2,274 m a.s.1.
Estimated yield of Scheme Kuchnai 7.73 mio m3/yr Spin Karez 2.27 mio m3/yr
Implementation 2012 - 2017
For the existing and proposed dam sites, specific hydrological or meteorological records are not available, and therefore a two-stage investigation program (Ref. WS/C/lO3) is in- cluded in the project. However, based on the available hydrological desk study by NDC, on Kuchnai Dam, original design data and actual observations, it is estimated that the combined yield of the scheme comes up to 10 mi0 rn3/yr.
0
The proposed scheme has the following advantages over the investigated alternatives:
0
optimum use of existing facilities and rights of way; gravity flow in the entire system up to house connections in the city; break- pressure faciIities may be combined with power generation; no resettlement required since affected areas are not inhibited; and downstream flood-prone areas in the Urak Valley are protected.
Provisional costs are included in the.estimate for Water Supply Expansion Project I11 - WS/P/118, further detailed below.
e) Further Options
A considerable number of potential dam sites - both, for groundwater recharge and for direct abstraction - were checked in the course of the present study. The more promising projects were discussed in the Interim Report, viz:
Burj AzizDam MangiDam KuchnaiDam
For these dams, studies on pre-feasibility level (Mangi; Kuchnai) and a comprehensive feasibility study (Burj Aziz) respectively, are available. Based on their review and own site investigations, the nearest, cheapest and least problematic option (i.e. Kuchnai Dam in conjunction with the existing Wali Tangi, Spin Karez and eventually Hanna Dams, and an expanded Cantonment Treatment Plant) was given highest priority.
A summary of key data describing the dams investigated in more detail is given in Table 3.5 overleaf. 0 H\ConDal\Ber\PAKISTAM2332OS\Final RsportFR V d l\vO11 c h 3 . d ~

:ore
PARAMETER I KUCHNN I SPINKAREZ I I
core H A 4 rn / L=367 m ds 1:2; us 1:2 crest 1430 m max 1417/ 1420 rn
H 4 5 m; L=305 rn ds 1;2; us 13.5 crest 1623 m rnax 1615 m
&- earth / rock lill; clay
H=6O m; L=315 m; ds 1:3 us 1:2.5 crest 2334rn I7657ft
earth fill
dimensions
25.9 krn'l10 mi' steep conglomerate rock 1.01 mio m' 1.02 815 AF 0.65 rnio mJ 550 AF 0.07 km' / 18 acre 0.13 rnio mJ /a
levels I rnax I min. 1404 (dead sto)
Zarghoon con- Pishin Lora Basin Khost River Basin glomerate
tot. 138 I 199 mio m' live 110 / 84 mio rn3 n. a. n. a.
24 km' at El. 1420 9 / 22 mio rn' /a
spring-fed stream 7610 Ian' 1220 km'
tot. 43.2 rnio m" live 15.4 m ~ o rn3
3.5 km'1862 acre 2.47 rnio m' /a
catchment area
catchmt. character
design capacity
present capactty
ma. surface
des. evaporation
....... 57.8 lol
ky rnin. 3.74 rnio m' tot. 7.09 mi0 3030 AF 5745 AF n. a 5.86 rnio m; (1992)
5.00 mi0 rn (2000) 0.24 h' 0.82 kmL I203 acre 043miorn'/a 1.47 mio rn"/ a
a 1.79mla 3
seepage I ' I 1 5.5 mio m4 I a 1 summer 0.13 m" /s
1.77m/a
(ev. higher - pending detailed hydrological 1 design yield I
I I I 14.9 mio m3 /a) ?
base flow 0.085 m3 1s
Burl Azlz WS: system capacity: 46 mio mala=
abstr. 38 rnio m" l a spills 124 (at 1417)
6.17 mio m" l a summer 0.28 m3 /s
(2.68 mio rn3 /a)
design abstraction: 4.96/0.66 mio m3/a
BURJAZIZ I MANGl I Remarks WALlTANGl I URAKH.WKS I I I I 1
68 (at 1420) winter 0.14 rn3/s 126000 m3/d= average 0.21 m3 /s 28 rngd (Burj Aziz)
n.a. n. a.
I 1 I
I961 I 1896 1 1998 Feas. Study I 1968 Feas. Study 1 ,arth I rockfill; clay I rock fill; shale core I I weir (r.c. structure) 1 earth/ rockfill; clay I
present yield
Program) (2.48 mio rn" /a) n. a av. 0.072 rn' Is =
av. 2.27 rnio rn3 l a =
min. 38 mm / a 732 rn' / a. km'
summer/wlnter 2 2 m m l a 5 mrn la incl. upstrqam w e 355 rn' / a. krn' 329 rn" I a. h'
eff ectlve run-off siltation
(1.37 mgd) 88 rnm / a (do%) red. by catch dams
30 - 44 d a (Usec 341 rn"/ a, km '
REMARKS hydrology rqd. + design optimization; downstream riparian rights
filled only twice
i ida I j approx ds i e / I I I international water I 1
Feveral overflow
. . . . . ....... . . . . . ~ __ . . . - . .... ~ . - ---
cap. Rs 9.36 billion OD. Rs 0.601:
frequent overflow cost 1997

1 Cha ter 3 / h e 14
3.2.2 Water Conservation Measures 0
The conservation of water becomes essential as the water resources are scarce and demand grows faster than the supply in the project area. The important issue is to conserve most effectively in view of the local society’s individual targets, such as equity, efficiency and political/ institutional and social acceptability. The effective implementation of water con- servation methods requires the acceptance of the programme by all parties involved, the institutions (legal level), the water management and supply organisation (supply level) and water user (consumer level). The key players in the Quetta context are in terms of supply and consume:
Supply level: BWASA, PHED, Pakistan Railways, MES and Army. Consumer level: Private, commercial, institutional and industrial consumers.
The BWASA, PHED, the MES and Army (Cantonment area) are the key producer and suppliers. The domestic and irrigation users are playing a key role in the water circle. Other producers and users do not play a significant role in the water circle. Conservation may involve technical and non-technical methods, which are presented in the following matrix. Proposed conservation methods depend on the role of the player within the water household of the Quetta valley. However, the key issue is that the political stakeholder have to establish an environment, which encourages the conservation of water on all lev- els. Technical measures may be applied at producer and user level, e.g. water producers may improve the system and introduce better o+m schedules. Users might adopt water- efficient technologies that enable them to maintain their requirements with less water con- sumption. Farmers may introduce more efficient irrigation methods, or might have to change crops and harvesting methods. The domestic users (private, institutional or com- mercial) may improve their sanitation systems to allow for re-use of waste water for toilet flushing or the re-use of rainfall water for irrigation purposes. Industrial users may adopt their production technologies towards water conservation (thermo-electric power produc- ers switching from wet to dry cooling, re-use of rainwater and “clean” waste water for sanitation purposes). Details on such improvements are applicable for each consumer group and presented in the following matrix. Non-technical measures, such as price incen- tives, mandated through regulations or forced because of shortages may encourage con- servation at user level. However, the economical effects may be dramatic as e.g. the pres- ent irrigation methods and crops might have to be changed. This situation might result in political confrontation and discussions with all stakeholders are essential to establish an understanding and willingness to balance the demand of all parties concerned. In the fol- lowing matrix the cause of water losses for each operator of the system is listed. A listing of possible conservation methods and action proposed is presented. The matrix indicates the present water losses as well as the realistic target value to be achieved through imple- mentation of the respective conservation measures. For each conservation method an im- plementation schedule is presented and reference is given to the corresponding sections in this document for easy reference. The project emphasises that the means of water loss re- duction would yield substantial savings, especially by technical rehabilitation measures of the transmission and distribution system. Also the re-use of treated wastewater will have a high impact on the water balance and reduce the water losses of pure drinking water for agricultural purposes.
a
a
H:\ConDat\BehPAKISTAM233209\Final RepoMR Vd l\vollch3.doc


3.2.3 Secondary sources and water conservation
Secondary sources are increasing the quantities actually available for consumption, either directly (through reduction of physical losses and wastage, as well as by proper manage- ment and operation), or indirectly (through re-use of treated wastewater, utilization of former private and irrigation wells for public water supply, conservation and lowering of specific consumption, and enhancement of groundwater recharge). There is large interde- pendence between the proposed measures and their effects. Prominent components of sec- ondary source development are described in required detail in the relevant sections of the present Final Report. They are summarised as follows:
a) Physical Loss Reduction In the scope of the project, conveyance loss reduction to a realistic level of 20% of pro- duction is envisaged. In relation to present conditions, this holds an additional potential rising from 2.7 mio m3/yr by 2005 to about 9.6 mi0 m3/yr till 2020, of produced potable water made available to the customers. 0 A comprehensive water loss reduction program is included in the proposed package for Bank financing. It is described under Ref. WS/P/ll5 in Section 4 that follows.
b) Non-structural Loss Reduction Relevant activities addressed in the scope of this Project Preparation Technical Assistance include:
fundamental institutional improvements on both, institutional and operational levels; substantial reduction of unauthorized connections (and provision of functioning legal alternatives); water conservation in the domestic/industrial sector as well as in the irrigated agriculture, enhanced by metering and consumption-oriented pricing, relevant legislation/regulations/ building codes and their enforcement, and public edu- cational campaigns;
Quantification of effects will remain problematic as long as baseline data on actual con- sumption are missing, and large parts of the service area are not supplied at all on a regular basis. International experience puts the overall effect of extensive conservation programs in the order of 10% of original consumption. This was considered in the applied design parameters for specific water demand, anticipating the positive effects of proposed institu- tional and human resources development, legal improvements, conservation campaigns and consumption-oriented billing. Logical pre-condition for any non-structural loss reduc- tion is, of course, a reliably functioning supply.
In the present planning considerations, the potential reduction of wastage and losses in the agricultural sector was not considered in quantitative terms, as it requires, for realization, changes in national policy. It was rather assumed that the irrigation quantities remain con- stant during the planning period (albeit partly replaced by treated wastewater), and that eventual savings would be utilized by the farmers for an increase of irrigated areas.
H\ConDat\Be~PAKISTAN\233209~tn~ ReportFR Vol l\vollth3.doc

Ouetta WSE - Final ReDon. Volume 1 ChaDter 3/Page 17
~
MEASURE
Rehabilitation of Wells and Wellfield Installa- tions Rehabilitation / Loss Reduction of Distribu- tion System Limestone Wells L1 Limestone Wells L2 Limestone Wells L3 Zarghoon Wells Z1 Zarghoon Wells 22 Kuchnai Dam Scheme
Re-utilization of Wells
c) Wastewater Recycling Treated wastewater in the order of 12.1 mi0 m3/yr by 2010, increasing to 24.8 mi0 m3/yr until 2020, are expected to be available for irrigation. These quantities do not need to be abstracted from the aquifer. The above quantities underline the importance of the proposed wastewater scheme - which, for proper functioning, needs an effective water supply, though.
SCOPE
100 exist. wells
81 km replacements; rehab. of network; pump stations; reservoirs; chlorination 10 new wells 12 new wells 8 new wells
up to 40 new wells up to 30 new wells new reservoir and fore dam in conjunction with existing part of re-allocated irrigation and other private wells
d) Re-utilization of Wells I t is anticipated that, due to gradual shifts of agricultural activities from central locations to the periphery in the second half of the planning period, a part of the affected irrigation wells can be re-utilized, and other private wells will be given up, once public water supply becomes better in terms of quality and reliability, and adequate quantities of treated wastewater are provided. This is expected to add up to 21.0 mi0 m3/yr to the quantities available for human consumption by 2020 - without harming the overall agricultural re- quirements.
8.8 rnio m"/yr
The anticipated effects of the proposed resource development and supporting measures on the coverage of water demand are summarized in Table 3.7 below.
restoration of design capacity till 2005
Table 3.7 : RESOURCE DEVELOPMENT AND ANTICIPATED EFFECTS
5.61 rnio m"/yr 3.74 mi0 m"/yr
to results of explora- tion drilling
9.00 rnio m"/yr 7.00 mio m%r 7.73 mio m'/yr
2.00 to 21 .OO mio m3/yr
Potential 10% of previous cons. Potential >lo%: Irrigation >>15% of previous cons. Potential 10% 6.78
12.12 24.8 mio m3/yr 99.03 mio m"/yr
bulk meters and subsequent I individual meters Metering Program
ditto
(addition); hydrology rqd. from 201 0 to 2020; agriculture shifts to periphery consumption reduced to specific design data ditto: reduction of irri- gation not considered in overall balance ditto 2005 201 0 2020 potential compare detailed as-
Conservation Program public campaigns
Domestic Demand (2020) Original Production (2000) Net Increase (till 2020)
Potential Production (2020)
Progressive Tariffs
REMARKS ADDITIONAL QUANTITY
institutional item Re-use of Wastewater wastewater scheme incl.
treatment plant
H\ConDat\Ber\PAKISTAW2332~1nal RepomFR V d l\voll-ch3.doc

Ouetta WSE - Final Reuort. Volume 1 Chapter 3/Page 18
3.2.4 Current and Projected water balance
a) Current Situation (2000)
According to the investigations performed within this project, the total water abstraction can reliably be estimated as 81.6 mi0 m3/year (35 rnio m3/year for agricultural and 46.6 mi0 m3/year for domestic use). Thereof 75 rnio m3/year are produced from the alluvial and 4.34 mio mVyear from the limestone aquifer. The domestic return flow originating from leaking supply and drainage facilities is assumed as 8.4 rnio m3/year, agricultural return flow is assumed as 7 mio m3/year. These figures, describing the current groundwater ab- straction and return flow, were used in a 30 years transient model run. The porosity and specific storativity values in the model were calibrated in order to reproduce the actual drawdown situation. The model results show an annual deficit of 8.6 mi0 m3/year, causing decline of the groundwater table of about 1 m/year in the region of the Quetta city and in the northern part of the valley. In the southern part of the valley, pronounced drawdown is restricted to the southern well field. Due to the reversal of the groundwater gradient in most parts within the model boundary to the Kuchlagh basin, the subsurface outflow is reduced to about 2 mi0 m3/year.
0
b) Future Water Balance (2020)
The proposed long-term scenano envisions the developmenl of additional resources from the Quetta valley limestone well fields (total incl. existing wells: 18.4 mi0 m3/year); from Zarghoon range (16.0 mi0 m3/year); and from the Kuchnai Dam scheme (7.73 mio m3/year). It is, furthermore, anticipated that these additional quantities will allow a reduc- tion of overall withdrawal from the alluvial aquifer to some 64.9 mio m3/year, with do- mestic return flow slightly increased to approximately 12 mi0 m3/year at lower losses, but altogether higher quantities supplied. The return flow from irrigation will remain at 2 rnio m3/year. Overall. the future abstraction from the alluvial aquifer will equal the natural re- charge and the return flows. The development also foresees that about 213 of agricultural production in central locations will move to the periphery, and irrigation wells - along with some other private facilities -will be incorporated in the public water supply scheme. For irrigation at the northwestern periphery, where land is available downstream of the proposed treatment plant, up to 24.8 mio m3/year of treated wastewater will gradually be available till 2020. About 20% return flow from these quantities is not considered in the groundwater balance inside the service area, and the effective secondary recharge there is thus reduced to about 2 mio mVyear from the still remaining irrigation.
0
The resource development is planned in stages, starting with the works on the limestone aquifer, followed by the investigations for an exploitation of the Zarghoon range and the works for the surface water resources. The proposed phasing of implementation foresees that a balanced regime in the Quetta valley alluvial aquifer can be reached before 2010 when connection of the first Zarghoon well field (Zl) is effected. For about 5 to 10 years, a slight surplus is envisaged, to further enhance the aquifer’s recovery. Thereafter, the overall scenario is targeted at a sustainable neutral balance. It has to be stressed that the scheme needs & components to be implemented, operated and managed to be effective. Economically comparable alternatives are not available. Both, the current and anticipated future water balance are illustrated in Figure 3.2 below.
H : \ C o n D a t \ B e ~ ~ I S T ~ ~ Z O ~ n ~ ReportFR Vci l\voll c h 3 . d ~

CURRENT WATER BALANCE (2000) Quantites in Mio rn3/year
Surface Water (Spin Karez)
Probkt Area -1 --------- r----
I
1 Domestic Use I
Return Return 8.4 FIOW 35.0 7.0 Flow
B Alluvial Aquifer 1 = -8,6
FUTURE WATER BALANCE (2020) Quantites in Mio m3/year
zarg;;;; Ringe!o*o z1 + z 2
r-t--- I I-- I I 18. 33.9
Surface Water (Spin Karez,
Kuchnai Dam, Hannah Lake)
Recharge and Subsurface Net Inflow 51 .O
Outside Projekt - Area - ------ Avaliable for
Irrigation Outside
I I I I ServiceArea I I
I
/ Y e 2 4 . 8 ITreated Wastewater A ------- \+ rp
Pro2kt Area -- <&@ 4 ---------
Recharge and Subsurface Net Inflow Alluvial Aquifer I= +/- 0
Figure 3.2
Current and Future Water Balance

Ouetta WSE - Final ReDort. Volume 1 ChaDter 3lPage 20
A viable concept for water source development, in order to meet the described future wa- ter balance (Fig. 3.2.) in the Quetta Valley, has to fulfill the following objectives:
satisfaction of the present and anticipated future demand for potable water; continued supply of adequate quantities for irrigation; and stabilization of the groundwater balance.
These targets can be achieved if proposed measures are implemented - comprehensively and on schedule. The necessary steps to be taken comprise of:
administrative improvements with regard to systematic monitoring, routine evaluation/modeling, management and control of water resources; rehabilitation of existing sources to original design capacity; water conservation through non-structural measures (incl. introduction / en- forcement of relevant building codes) to limit domestic consumption to accept- able levels, and to reduce the subsidized wastage in agricultural irrigation; comprehensive leak detection and repair, together with overall system reha- bilitation and operational/administrative improvement; exploration and development of additional primary groundwater sources in Quetta valley Limestone aquifer and Zarghoon Range Conglomerate aquifer; thorough investigation and optimized development of primary surface water sources, viz. KuchnaiNali Tangi/Spin Karez/ Hanna dam scheme; re-use of wastewater for imgation upon completion of relevant sewage collec- tion and treatment scheme, and functional water supply; integration of existing private irrigatioddomestic wells into the public water supply scheme upon provision of alternative of treated wastewater for irriga- tion, functioning public water supply, urbanization of areas presently used for irrigated agriculture and allocation of alternative land at the city’s periphery at fair conditions; effective source protection through radical improvement of sewerage, solid waste disposal and urban stonnwater drainage, and establishment of adequate protection zones for well fields, impounding reservoirs and their catchment ar- eas; combination of flood retaining reservoirs and drainage channels with artificial groundwater recharge measures; social backing of measures through straightforward improvement of services, socially acceptable pricing, public campaigns, and NGO/CBO involvement, as well as immigration control through development in the hinterland; economic backing of measures through controlled investment, metered supply and consumption-oriented pricing; legal and institutional backing of measures through streamlining of administra- tion, technical/financial management and control.
Within that framework, the proposed technical measures for a sustainable source devel- opment to cover domestic and industrial water demand in the next 20 years are summa- rized below. An overview of the projected water demand, production and resulting water balance in the alluvial aquifer is compiled in Table 3.8. The anticipated timeframe and extent of source development is plotted against the domestic and agricultural demand in the attached Figure 3.3.
H\ConDat\BeWAKISTAM233209\Final RewmFR V d l\voll c h 3 . d ~

Ouetta WSE - Final ReDort. Volume 1 ChaDter 3 / Paee 21
Table 3.8 : Water Demand and Production (mio m3/yr)
WATER PRODUCTION . .
WATER DEMAND
Public Supply house connection yard connection public tap industry
Cantonment Private Consumers
Subtota
Subtota Losses (% of production)
BWASA Northern Well Field Western Well Field Southern Well Field City Wells (alluvium) City Wells (limestone)
PHED Can ton m ent
wells surface water (Spin Karez)
Private Production New Limestone Well Fields
Prospection Area L1 Prospection Area L2 Prospection Area L3
Zarghoon Range Well Fields Prospection Area Z1 Prospection Area 22
Surface Water Schemes Kuchnai Dam Scheme (add.)
Re-utilization of irrlpriv. wells Subtota
Irrigation Total Demand (mi0 m3M
Irrigation Wells (inside project area)
Re-use of treated wastewater Total Production (mi0 m3/yr:
WATER BALANCE IN THE ALLUVIAL k
Vet Recharge 3ackflow
domestic (60% of losses) irrigation inside service area (2%)
Subtotal (influx) lbstraction from Alluvial A4uifer
2005
18,74 4,56 0,95 5,66 4,03
Total available (mi0 m3&/yr: Balance
2010 2015 2020
29,66 41,99 56,70 5,66 6,39 7,30 1,17 1,31 1,46 5,88 6,21 7,30 4,03 4,03 4,03
9,15 43,09
25
7,49 5,351 2,43 53,89 65,281 79,22
20 20 I 20
Balance
57,45 35,OO 92,45
2000
67,36 81,60 99,03 35,OO 35,OO 35,OO
102,36 116,60 134,03
18,3; 0,7t O,O( O,O( 4,O:
1 1,8C 34,9E
30 49,9E 35,OC 84,9C
4,05
2,77 12,36 4,34 4,96
1,76 2,27 6,50
4,67 5,61 3,74
9,00 7,OO
7,73
1,39 3,4E 0,9c 2,47
11,87 4,34 4,7a
1,66 2,27
14,86
0,oo 0,oo 0,oo
0,oo 0,oo
0,oo 0,oo
46,60 35,OO 81,60 0.00
87,69 6,78
81,60 -3,38
IlFER
51,OO
a,39 7,OO
66,39 74,99 -8,60
91,28 107,84 109,35 12,12 15,47 24,80
94,47 2,Ol
51,OO
103,40 123,31 134,15 1,04 6,71 0,13
51,OO 51,OO 51,OO
4,05 1,39 2,77
12,36 4,34 4,96
1,76 2,27
1 1,44
0,oo 5,61 3,74
0,oo 0,oo
0,oo
4,05 1,39 2,77
12,36 4,34 4,96
1,76
9,36
4,67 5,61 3,74
9,00 0 ,oo
0,oo
2,27.
4,05 1,39 2,77
12,36 4,34 4,96
1,76 2,27 6,69
4,67 5,61 3,74
9,00 7,OO
7,73
33,OO 23,OO
10,60 11,90 :"/ 3,901 2,041 65,93 63,79 65,50 64,94 71,73 61,65 63,48 64,99 -5.80 2.1 4 2.02 -0.05 ,- , I
H:\ConDat\Ber\PAKISTAN\233209\FinaJ RepomFR Vol l\voll ch3.doc


Ouetta WSE - Final Reuort, Volume 1 Chauter 3 I Paee 23
3.3 Project Measures of Phase 1 (ADB-Project)
3.3.1 Project component Groundwater resources
The detailed designs for the rehabilitation of existing wells tapping the alluvial aquifer, exploration of new groundwater sources (limestone aquifedzarghoon range) and prelimi- nary designs for new well fields, each with costs estimates are provided.
With these described measures, the sustainable development and management of currently and future utilized groundwater resources can be achieved.
Consulting Services for Exploration and Rehabilitation - WS/C/101 A, B In the following, the scope of consulting services for the development of a groundwater management system the and supervision of the rehabilitation of existing BWASAPHED wells in the alluvial aquifer in the Quetta valley as well as the exploration of the ground- water resources in the limestone aquifer (Quetta Valley) and the conglomerate aquifer (Zarghoon Range) is listed.
Exploration Program for the Limestone Aquifer WS/C/lOl A tendenng, supervision and interpretation of long-term pumping test on the ex- isting BWASAPHED wells. tendering, supervision and interpretation of a geophysical exploration cam- paign (electromagnetic survey with the GENIE tool) in order to detect the structure of the limestone aquifer and delineate fauWfracture zones. final design, tendering, supervision and interpretation of test well drilling (incl. pumping tests, sampling and analyses of physico-chemical parameter and iso- tope composition, of groundwater) in identified target areas, according to the geophysical survey. Evaluation of recording and interpretation of the ground- water level in surrounding production wells during pumping tests in test wells (if present in both the limestone and the alluvial aquifer). assessment of the groundwater potential of the limestone aquifer in the north- em Quetta valley. The results from the investigations should be incorporated in the existing groundwater model. Especially the interaction of the alluvial aqui- fer and the limestone aquifer and an enhanced abstraction from the limestone aquifer are to be investigated in detail. Recommendation of the final design for the implementation of production wells and well fields in the limestone aquifer.
r, Exploration Program for the Zarghoon Range WS/C/lOl A
execution and evaluation of a hydrogeological mapping and remote sensing program, for the delineation of zones for further work (geophysicdtest well drilling).
0 tendering, supervision and interpretation of a geophysical exploration cam- paign (electromagnetic survey with the GENIE tool) in order to detect the structure of the conglomerate/sandstone aquifer and delineate joint / fault / fracture zones.
H : \ C o n D a t \ B e ~ P A K I S T ~ 3 3 2 O ~ n ~ ReporWR V d l\voll-ch3.doc

Ouetta WSE - Final Revort. Volume I Chavter 3 I Paee 24
0 final design, tendering, supervision and interpretation of test well drilling (incl. pumping tests, sampling and analyses of physico-chemical parameter of groundwater) in identified target areas, according to the geophysical survey and measurements of the yield from springs. assessment of the groundwater potential of the Zarghun range, east of Quetta valley. The results from the investigations should be incorporated in the exist- ing groundwater model. Recommendation of the final design for the imple- mentation of production wells and well fields in the conglomerate/sandstone aquifer.
0
Further Services 0 Guidance of counterpart staff, which will continue the well inventory, com-
menced in the frame of the present project, for all wells in the Quetta valley and provide input for the drilling supervision. Supervision of the GIS works and groundwater modeling, which will be pri- marily executed by counterpart staff.
0
a Rehabilitation Measures WS/C/lOl B
0
0
0
0
0
final design, tendering and supervision for the installation of water meters, piezometers and rising pipes with threads in wells. supervision of performance of step-drawdown pumpin2 tests. rating of the permissible yield/drawdown based on the evaluation of the pumping test data in a Q/s-diagram. determination of the suitability of the well for water supply at the permissible yielddraw down. determination of the pump-setting, determination of the appropriate pump specification; final design, tendering and supervision for the installation of new pumps. final design, tendering and supervision for the installation of electrodes in the well to secure a automatic shut-down of the well.
0
Schedule Execution of exploration program between July 2000 and December 2001 (18 months); Rehabilitation work planning and supervision from January 2001 to December 2003
a
Supervision of Well Construction and Pumping Tests - WS/C/102 A
The consulting service for the supervision of the implementation of production wells for the exploitation of groundwater resources in the limestone aquifer (Quetta valley) would comprise:
Implementation of Production Wells in the Limestone Aquifer tendering and supervision of drilling for 20 production wells (12 wells in L2 and 8 wells in L3, incl. pumping tests, sampling and analyses of physico- chemical parameter and isotope composition of groundwater) in identified well fields, according to the exploration program. During pumping tests in test wells
H\ConDat\BetVMlSTAN\233209U=in~d RepoAFR V d l\voll c h 3 . d ~

recording and interpretation of the groundwater level in surrounding production wells (if present in both the limestone and the alluvial aquifer). Evaluation of the pumping tests and determination of permissible (long-term sustainable) abstractioddrawdown for each production well. Finalization of pump setting in each production well. Final assessment of the impact of the groundwater abstraction on all involved aquifer systems. The results from the investigations should be incorporated in the existing groundwater model.
Further Services Guidance of counterpart staff, who will provide input for GIS works, ground- water modeling and drilling supervision.
Schedule Execution of services between July 2001 and December 2002 (see attached Schedule)
Rehabilitation of Wells - WS/P/111 * In the frame of the rehabilitation program for existing BWASAPHED wells, the supply and installation of piezometers, water meters and rising pipes for submersible pumps will be provided in a first step. Thereafter, pumping test will be executed in the wells. In a final step, new submersible pumps will be supplied and installed in the wells.
Rehabilitation measures 0
0
6
supply and installation of water meters (100 units), piezometers (900 m) and rising pipes with threads (6300 m) in existing wells. performance of step-drawdown pumping tests (3600 h) in existing wells with recovery observations (1200 h). supply and installation of submersible well pumps (55 units). supply and installation of electrodes in the well to' secure a automatic shut- down of the well (100 units).
Schedule Execution of works between April 2001 and December 2003 (32 months)
Exploration Well Drilling Program - WS/P/112
The scope of the works for the exploration and test well drilling in the limestone aquifer (Quetta Valley) and the conglomerate aquifer (Zarghoon Range) is defined in the follow- ing: Exploration Program for the Limestone Aquifer
0 execution of a geophysical exploration campaign (electromagnetic survey with the GENIE tool) in order to detect the structure of the limestone aquifer and delineate fauldfracture zones (160 line km). drilling of 30 test wells (combined rotary and hammer drilling) to an average depth of 250 m (incl. development, pumping tests, samplinglanalyses of physico-chemical parameter and isotope composition of groundwater and to- pographical surveys) in identified target areas, according to the geophysical survey. Execution of long-term pumping test on the existing BWASA wells (LO80 h) with recovery observations (120 h). During pumping tests in test wells
0
H:\ConDat\BeWAKISTA332OQ!Final RepodFR V d l\vollch3.doc

Quetta WSE - Final ReDort, Volume 1 ChaDter 3IPaee 26
and existing wells, the recording of the groundwater level in surrounding pro- duction wells (if present in both the limestone and the alluvial aquifer) is fore- seen.
-
Exploration Program for the Zarghoon Range 0 execution of a geophysical exploration campaign (electromagnetic survey with
the GENIE tool) in order to detect the structure of the conglomerate/sandstone aquifer and delineate joint/fault/fracture zones (240 line km). drilling of 60 test wells (combined rotary and hammer drilling) to an average depth of 250 m (incl. development, pumping tests, sampling and analyses of physico-chemical parameter of groundwater and topographical surveys) in identified target areas, according to the geophysical survey. Supply and installation of V-notch measurement weirs on springs for.the im- plementation of yield measurements (15 units).
0
0
Schedule Execution of works between October 2000 and December 2001 (15 months)
Construction of New Production Wells - WS/P/113 A
The preliminary defined scope of the works for the implementation of production wells for the exploitation of groundwater resources in the limestone aquifer (Quetta Valley) is listed in the following:
Implementation of Production Wells in the Limestone Aquifer (WS/P/113) drilling of 20 production wells for well fields L2 and L3 (combined rotary and, hammer drilling) to an average depth of 300 m (incl. development, pumping tests, sampling/anal yses of physico-chemical parameter and isotope composi- tion of groundwater and topographical surveys) in identified ,well. fields, ac- cording to the exploration program. supply and installation of submersible pumps, rising pipes and wellhead con- structions (20 units)
Schedule Execution of services between July 2001 and December 2002 (see attached Implementa- tion Schedule)
3.3.2 Project Component Surface Water Resources
In addition to the implementation of the works for the exploitation of groundwater re- sources, the incorporation of a surface water scheme at Kuchnai is envisaged for the cov- erage of the water demand for Quetta.
H : \ C o n D a t \ B e ~ ~ I S T ~ ~ 2 O ~ n ~ RepomFR Vol l\voll ch3.doc

Ouetta WSE - Final ReDort. Volume 1 Chapter 3 I Page 27
Hydrometric Program and Soil-mechanical Tests for Kuchnai Dam Scheme - WSlCl103 A
For the proposed dam and catchment no specific hydrological, or meteorological data are yet available. The final determination of the yield of the dam and the conceptual design of a combined system will be possible only after evaluation of results from a multi-annual measuring and monitoring campaign which will also be beneficial to other components of the proposed Quetta Water Supply Expansion Project. In order to conduct the planning and implementation of a hydrological monitoring program and execution of soil-. mechanical tests in preparation of Kuchnai Dam Water Supply Scheme, Quetta.
However, rough assessments of flows, sedimentation and underground conditions have been made in the scope of a Feasibility Study for Flood Protection of Hanna-Urak Valley by NDC, 1988. The interpretation of these results allows tentative assessment of properties and costs of the proposed scheme. Relevant provisions for physical implementation have been made under Contract Package WS/P/l18.
For the necessary detailed investigations, the following program is proposed for inclusion into the package of possible Bank financing:
First Campaip WS/C/IO3 A review of related data and information on the proposed system components; re- connaissance of catchment area and delimitation of a recording network and appertaining equipment requirements; planning, tendering and supervision of the procurement and implementation of hydrometrical and meteorological recording stations, as well as the execution of test boreholes incl. performance/interpretation of soil-mechanical investiga- tions ; establishment of monitoring routines and staff training; conceptual design of dam and scheme, incl. preliminary determination of po- tential performance, and reporting on the proposed solution.
0
0
0
Monitoring Program 0 regular collection, systematic processing and filing of recorded data, perform-
ance of measurements and maintenance of recording stations by counterpart personnel.
Schedule Execution of services from October 2000 to March 2001
3.3.3 Project component secondary sources and water conservation
The apparent deficit in the water balance for the Quetta water supply and the coverage of the future water demand call for the consideration of all primary and secondary water re- sources.
H:\ConDanBer\PAKISTAN\233209\Fin~ RepomFR VoI l\voll ch3.doc

Ouetta WSE - Final ReDort. Volume 1 ChaDter 3/Paee 28
The evaluated water conservation measures (loss reduction and recycling) and the suit- e
ability of artificial recharge for a supplementation of the utilization of the primary sources are discussed in the following.
a) Loss Reduction and Recycling
The complex task of balancing the water demand with the available resources in the pre- vailing arid conditions includes the efficient mobilization of secondary water resources through :
0 the reduction of (at present substantial) conveyance losses in the distribution system;
0 re-use of treated wastewater for irrigation; 0 avoidance of water wastage in both the domestic/industrial and agricultural
sectors; and 0 non-structural loss reduction, from consumption habits on household level to
irrigation practices to effective resource management. 0 Specific measures are described in required detail in the relevant sections of the present Final Report. Their anticipated effects are summarized as follows:
Leak Repair Program
Present rates of unaccounted-for water in the order of 40 to 50% of production (thereof about 2/3 actual leakages - especially in the old parts of the system) are expected to be reduced to a realistic level of 20% through the proposed systematic rehabilitation program. In quantitative terms this would effect a reduction of losses from potentially (but also eco- nomically un-acceptable) more than 30 Mio. m3/yr to some 20 Mio. m3/yr by 2020.
Wastewater Recycling
The rather conservative assessment of treated wastewater actually available for irrigation* leads to quantities of 12 Mio. m3/yr by 2010, increasing to 24.8 Mio. m3/yr until 2020. These quantities do not need to.be abstracted from the aquifer. 0 It is anticipated that, due to gradual shifts of agricultural activities from central locations to the periphery in the second half of the planning period, a part of the affected irri ation wells can be re-utilized for water supply. This is expected to add up to 21 Mio. m /yr to the quantities available for human consumption by 2020 - without harming the agricul- tural requirements.
P
Water Wastage and Non-structural Loss Reduction
Relevant experiences with intensive conservation programs in the domestic sector quantify the effects in excess of 10% of previous consumption. However, in the present case re- spective considerations will remain hypothetical as long as baseline data are unavailable due to the absence of water meters, and the supply is erratic to non-functional in large
a ’ total efluent from the treatment plant: 18.32 Mio. m3/yr (2010); 28.90 Mio. m3/yr (2020)
H:\ConDat\Ber\PAKISTW33209Wnal RepottFR Vd l\vollch3.doc

parts of the service area. This would also apply to the practical effect of any new metering without substantial improvements on the delivery.
a
Nevertheless, the present improvement concept for Quetta Water Supply fully considers the anticipated (i) well functioning of supply, and (ii) effect of proposed conservation campaigns and consumption-oriented billing, in the applied moderate parameters of spe- cific water demand.
High potential of wastage reduction lies in the agricultural sector. Although it would not appear to be realistic to assume radical changes in irrigation techniques and habits (where several previous projects had practically no effect), fundamental improvements in the eco- nomical water use may derive from quantity-based pricing of power consumption for pump operation. “Switching off pumps when there is no need for pumping, reduction of channel losses, and irrigating only as much as necessary” may swiftly become popular, once relevant national or provincial tariff regulations would replace the prevailing flat rate system.
In the present planning considerations, this potential was not considered in quantitative terms, as it requires, for realization, changes in national policy. It was rather assumed that the irrigation quantities remain constant during the planning period (albeit partly replaced by treated wastewater), and that eventual savin9s would be utilized by the farmers for an increase of imgated areas.
b) Artificial Groundwater Recharge
The eventual suitability of artificial recharge with delay action dams and/or spreading structures (wells/ponds) has been intensively studied3.
The general situation in the Quetta valley is characterized by low rainfall (average effec- tive rainfall 250-300 mm/yr, Interim Report, 1999, Vol. 2.1) and high evaporation (1645 mm/yr to 1665 mm/yr, Interim Report, 1999, Vol. 2.1). In regions with this clima- tological situation, artificial recharge is in general not considered a viabIe water conversa- tion measure (Central Groundwater Board, 1994), unless trans-basin water transfer is available. Water transfer for a recharge of the aquifer system in the Quetta valley is not considered feasible. Nevertheless, the artificial recharge option was evaluated based on field visits and available data. Existing delay action dams and the pilot plants for artificial recharge at Ziargai and Wuch Mangi were scrutinized and assessed.
a .
In general, the artificial recharge techniques may be applied with the objective to restore declining groundwater level. The source of the water is normally surface water from res- ervoirs, conveyed to the recharge facilities. The recharge facilities (spreading structures) consist of recharge ponds or ditches/furrows especially prepared with a filter bed or of in- filtration wells, depending on the quality of the water from the source, the hydrogeological boundary conditions and the amount of water to be recharged.
A special technique applied in the project area is the recharge with delay action dams (DAD). DAD’S simply consist of a reservoir with a dam on intermittent streams. The re-
comp. Vol. 2.1; and studies by others, e.g. UNDP, 1999; IUCN,1999; Halcrow 1996; Jica, 1996 3
H:\ConDanBeflPAKISTA332OMna RepoAFR Vol l\voll-ch3.doc

Quetta WSE - Final ReDort. Volume 1 Chapter 3 / Paee 30
charge is assumed to result from infiltration over the natural reservoir bed without imple- mentation of a prepared filter bed.
In the following, the results from the first phase of the investigations, introduced with the interim report and new considered aspects are summarized.
Delay Action Dams
Conclusive studies of the quantification of the actual benefit from the DAD on the groundwater level (groundwater monitoring of piezometer downstream of DAD) are not available (BWR, 1999).
It is however known that the reservoirs of the DAD in the Quetta area suffer substantially from siltation of the impoundment, deposited from the feeding Nalas. HALCROW (1995, 1996), NGI & SCI (1997) and UNDP (1999) stress in the assessment of DAD that the ef- fectiveness of the recharge by the dams is declining rapidly over time, due to this siltation of the reservoir.
The assessment of the existing data show that the practiced artificial recharge from DAD may result in some local improvements, but it is questionable whether these facilities have an impact in terms of quantities necessary to significantly improve the supply situation and groundwater balance in the alluvial aquifer. Further systematic investigations, including the lonpteim monitoring (approximately 2-3 years) of piezometers downstream of exist- ing DAD, as proposed by BWR (1999), are recommended to quantify actual effects of DAD in the relevant locations.
Artificial recharge with special infiltration facilities
Considering the presumed limited effectiveness of DAD on the recharge of the aquifer system in the Quetta area, alternative recharge techniques have been studied.
Two experimental pilot projects at Ziargai and Wuch Mangai have been set up in the Kuchlagh basin at the Zhob valley road, approximately 20 km North of Quetta (BMIADP, 1990, 1991). A mathematical model was applied to quantify the processes of the artificial groundwater recharge. Based on the mathematical modeling (BMIADP, 1990, 1991), it was determined that the artificial recharge schemes have an insignificant impact upon fal- ling groundwater levels, and were likely to contribute only a minimal addition recharge of the groundwater resource.
NDC (1994) investigated in the frame of a feasibility study the possibilities of imple- menting artificial recharge schemes in the Quetta valley with infiltration wells. It was de- termined by a computer simulation, that from the recharge facilities with 170 injection wells, 4000 acrefeedyr (4.9 Mio. m3/yr) recharge could be expected. NDC (1994) con- clude, that the amount of recharge is small, considering the major investments of 170 wells. The costs of the schemes have been estimated with 289.0 Mio. Rs.
NGI & SCI (1997) have submitted a further feasibility study proposing artificial recharge by utilizing surface water from DAD and infiltration over spreading structures. For the Quetta area, it was planned by NGI & SCI (1997) to construct or rehabilitate DAD on the rivers of Brewery, Ghutai Shela, Walidad, Dara and Kach. The total available surface wa- ter for recharge for the five DAD sites has been estimated, based on catchment areas and
H:\ConDat\Ber\PAKISTAN\233209\Finrll ReportFR V d l\vollch3.doc

Quetta WSE - Final ReDort. Volume 1 Chapter 3/Page 31
precipitation, with approximately 2.2 Mio. m3/yr. Hence, the dimensioned recharge ponds with an infiltration capacity of 8.4-1 1 Mio. m3/yr are over-rated.
a
Conclusions and recommendations on artificial recharge
The potential suitability of artificial recharge with delay action dams and/or spreading structures (wells/ponds) has been assessed.
Summarizing, the DAD as recharge facilities are considered as ineffective measures for artificial recharge in the project area; the contribution of the recharge from DAD must be assumed as minor and declining with time. However, these assessments still have to be confirmed by investigations with a scope clearly outside of the frame of the present proj- ect.
The evaluation of artificial recharge structures by the assessment of existing studies (BMIADP, 1990, 1991; NDC, 1994; NGI &SCI, 1997) and appraisal of the sites during field visits under consideration of the hydrological/hydrogeological boundary conditions could not positively proof the suitability of the investigated artificial recharge techniques.
Overall, a comprehensive groundwater enrichment program in the entire Quetta Valley, that effectively improves the rate of groundwater recharge by (optimistically assumed) ten percentage points, would increase the total available water on average by about 3 Mlo. m3/y1 (1.e. 10% of the direct recharge into the alluvial aquifer). This quantity, equivalent to approximately 2% of the water demand in 2020, seems small in comparison.
The impoundment for the relatively small amount of 3 Mio. m3/yr raw water, which is in the range of the estimated maximum raw water availability of 2.6-5.1 Mio. m3/y in the Quetta valley, would require substantial investments.
Design and hydraulic regime of each of the very site-specific artificial recharge options have to be determined on a case-to-case basis, and eventual quantification of specific ef- fects is dependent upon that input. For the detailed design of the raw water impoundment structure, the treatment process and the infiltration facility, a specific and comprehensive investigation program is necessary, in a scale beyond the frame of the present project.
The artificial recharge can only serve as a supplementary measure for groundwater con- servation, at relatively high expenses. The following listed measures are deemed more vi- able for a relief of the groundwater abstraction from the alluvial aquifer. The main atten- tion will have to be directed on:
0
+. 0
the re-use of wastewater for irrigation and reduction of conveyance losses
the improved management of the existing abstraction facilities of the alluvial aquifer and exploration of new groundwater resources
the direct utilization of surface water for the water supply scheme 0
Nevertheless, Flood Delay Action Dams will become necessary with the further develop- ment of the Quetta valley, and the attachment of recharge-enhancing spreading channels and appropriate design of the downstream stormwater drains are proposed4. One further option which is cheap and is practiced since centuries, is the use of low gropes (from boulders or gabions) across a watercourse, that reduce velocity but increase depth and re-
comp. further description in Chapter 6 below.
H \ C o n D a I \ B e r \ P A K I S T ~ ~ 2 0 9 ~ i n ~ RewmFR V d l\voll-chXdoc

Ouetta WSE - Final Report. Volume 1 Chauter 3 I Pace 32
charge slightly - and thus improve percolation while keeping the self-cleaning transport capacity. A forestation or reforestation of the mountainland in order to enhance the natural retention for superficial run-off and to reduce the sediment load of the run-off should ac- company any water conservation technique.
a
3.4 Cost Estimate of Phase 1 (ADB Project)
Consulting Services
Generally, the package proposed for Bank financing covers the first phase of the presented long-term scenario that is necessary for a sustainable development of water resources in the prevailing adverse conditions. However, fundamental technical, financial and admin- istrative decisions on the development in the next 20 years require supporting information that is not available at present. Therefore, the proposed detailed exploration and investiga- tion program is designed to supply those data that are necessary for sound overall planning and protection of immediate as well as future investment.
0
In accordance with the detailed descriptions set forth in Chapters 3.2 and 3.3 above, the program includes the following components:
WS/C/lOlA,B Consulting Services for Rehabilitation of Existing Wells and Exploration of New Groundwater Resources (full program)
WS/C/102A Consulting Services for Supervision of Well Construction and Pump Tests for: Limestone Well Fields L2, L3 Consulting Services For Hydrometric Program and Soil-mechanical Tests for: Kuchnai Dam Scheme - First Campaign
WS/C/103A
Physical Implementation
The following first phase program is proposed for Bank financing: a WS/P/l 1 1 WS/P/112 Exploration Well Drilling in
Rehabilitation of Existing Wells in the Quetta Valley Alluvial Aquifer
Quetta Valley Limestone Aquifer, fields L l , L2, L3 Zarghoon Range Conglomerate Aquifers, fields Z1,22, and - depending on their yields - 22 alt. Construction of Production Wells in Quetta Valley Limestone Aquifer, fields L2, L3
WS/P/113A
A summary of estimated cost (in mid 1999 US$) for the package proposed for Bank fi- nancing is given in Table 3.9 below. Detailed estimates for the overall water resource de- velopment program are compiled in Volume 2.1, Section A.
H:\ConDat\BehPAKISTAM2332O~n~ ReporWR V d l \vd l ch3.doc

Table 3.9 : COST ESTIMATE FOR RESOURCE DEVELOPMENT 0
WS/C/lOlA
WS/C/103A
WS/P/112
Code 1 Description
Consulting Services for Exploration of New Groundwater Resources Hydrogoe1:py and Soil-Mechanical Tests for Kuchnai Dam Scheme (1 Campaign) Exploration Well Drilling
W S/C/l 0 1 B WS/C/102A NS/P/l 1 1 NSIPI113A
Consulting for Well Rehabilitation Consulting for Well Construction L2 and L3 Well Rehabilitation in the Quetta Valley Well Construction L2 and L3
Note: EDCS and Construction cost of Kuchnai Dam included in Water Supply Program
cost US$
659,800.00
192,200.00 2,110,122.00 2,962,122.00
308,500.00 549,300.00
1,589,352.00 1,005,062.00 3,452,214.00
H:\ConDat\Ber\PAKISTAM233209\Final RepoMFR V d l\vollth3.doc

4. SECTOR PROGRAM : WATER SUPPLY

4. SECTOR PROGRAM WATER SUPPLY
4.1 Present Situation
4.1.1 General Overview
Public water supply in Quetta is carried out by BWASA (73%), PHED (15%) and mili- tary (12%). With the most recent joining of BWASA and PHED, practically all civil piped drinking water supply is administered by this body. In the following text it is shortly referred to as 'BWASA' only.
BWASA has divided the distribution and primary production for Quetta into two divi- sions, which are then further divided into eight sub divisions. The primary collection of water by BWASA to the eight sub divisions can be seen to come from four sources. The northern, western and southern well fields with multiple tube well sources being col- lected to one point before delivery and bulk distribution to the city sub divisions. The fourth source is based on tube wells located in each of the sub divisions. During the proj- ect period, South City and Southern Well Field sub divisions have been combined on an administrative level.
a
BWASA has been entrusted with the task of operation and maintenance of water supply and sewerage systems, Including the management / implementation of construction work, and the collection of water charges. The Government is providing funds for operation and maintenance till BWASA is able to implement the project work for improvement of wa- ter supply and sewerage work and is capable of generating adequate revenues for opera- tion, maintenance and depreciation of facilities. Presently, BWASA employs the follow- ing staff
administrative staff operational staff
108 79 1
0 miscellaneous new appointments 3 12 0 Total 1,211
4.1.2 Water Production and Treatment
Production from Northern Well Field being the only regular bulk supplies distributed to some of the other sub divisions. They are Mali Bagh, Ayub Stadium and South City. Ini- tial investigation shows that none of the well fields (northern, southern and western well fields) supplies water as envisaged in the design (NESPAK 1988). Construction work was partially completed in 1991. The design considered the requirement of the city lim- its, but no design for the expansion of Quetta. The non-performance of the design is due to a combination of the following reasons - a drop in the yield from the well fields, illegal and legal connections on transmission lines reducing pressure and flows. Urban growth around some tube wells, that formerly fed only well field collector mains now also serve the new population. The well fields were then to serve four pressure zones within Quetta numbered as zones I, IIA, IIB and III. These four pressure zones are also not operating as designed.
H:\ConDat\BeWAKISTAN\233209Final ReportFR V d l\voll ch4.doc

Chauter 4IPaee 2 Ouetta WSE - Final Reuort, Volume I
City tube wells usually pump to a small local network or an over head reservoir that then supplies the surrounding vicinity. The yield is often insufficient to serve the entire area, which warrants the use of ‘valve men’ to regulate distribution by streets or sectors by opening and closing appropriate gate valves. The bulk supply from the northern, western and southern well fields is distributed to the BWASA sub divisions as described in detail in the Sector Study on Water Supply, Volume 2, Section B.
Apart from the two Cantonment filtration plants with some sort of rapid filters and - by now - makeshift chlorination, water treatmenvdisinfection is not practiced at present. A few previously installed clorinators are out of function, with the exception of BWASA tube well (64) at Mali Bagh, which was reported as chlorinated before delivery and con- firmed on a site visit. Chlorination facilities were included in the design (NESPAK 1988) and constructed but have reportedly not been used. This was confirmed by site visits. In view of up to 20% of wells being heavily contaminated, and further 60% showing - at increasing trend - objectionably high coli counts, the situation is alarming. Things are worsened by indiscriminate mixing with clean water, and by intrusion of polluted groundwater into distribution pipes running under low pressure.
0
4.1.3 Operation and Distribution
In the history of Quetta’s water supply, distribution pipes have often been extended with- out regard to availability of water and system design, which has resulted in reduction of water pressures in the distribution mains. This reduction of supply and service pressures affects the whole city and BWASA has to resort to intermittent supply in individual areas through operation of valves on the branches and main lines. In order to get more water, consumers have installed suction pumps which are further reducing water pressure in the distribut.ion mains and depriving the neighbours of their share. of water. The following Table 4.1 gives an overview of the length of the existing distribution networks.
The supply of drinlung water operates for an hour or less for most of the population within the service area. However, some areas do receive better supplies e.g. the govern- ment housing around the Secretariat and the Governors Residence along Zarghoon Road. This is due to connections on to the main lines, which are not closed as often as branch lines, in order to regulate supply schedules.
a
During the allotted hours of service, pressure is often too low to provide an adequate flow. Householders that are able to afford the cost purchase a pump to increase the flow to their property. The survey carried out by the Sociologist team showed 47% of house- holds use pumps in this way, from their survey. For the whole city, the figure would be lower as the survey was skewed away from poorer parts of Quetta. The complicated sys- tem of delivering water to households is a reflection of the insufficient water resources available to the current population of Quetta. An increasing population is further strain- ing the system with illegal connections particularly noticeable on the southern well field transmission line.
H:\ConDat \BehPAKlSTA332~1n~ RepotiWR Vol l\vollsh4.doc

Ouetta WSE - Final Report, Volume 1 Chaoter 4 / Page 3
50 75 80 100 125 150 175 200 225 250 300 350 400 450 500
I ame 4.1 txisting water uistritwtion system
27,21' 6,34;
36,858 91 24,565 1,442
35,148 48t
9,775
6,813 8,422 686
11,592 1,348 8,676
600 2,612 1 Subtotal
Total 146,495 35,581 I 93,825 I 52,874 42;
1 1 329,197
H\ConDat\BehPAKISTA332OWinal ReportFR Vol l\voll th4.doc
50 62 75 100 125 150
Subtotal Total
3,55€ 195
1 1,99€ 6,95C 85 503
23,287 23,287
75 100 150 200
Subtotal Total
GRAND TOTAL
7,100 8,500 7,000 5,650 28,250
28,250
380,734


0 4.1.4 Problem Analysis
The major problems to be solved are the lack of quantity to maintain a network under pressure, the high leakage rates within the distribution system, poor leakage repair tech- niques, ingress of pollutants due to negative pressure and the need for better operation and maintenance procedures in the water system. In some locations PHED and BWASA wells are less than 100 m from each other, which results in inefficient operation and wa- ter production from both.
(a) Physical Condition of the System
0
0
0
0
About 40 -50 % of distribution pipes, fittings, valves, fire hydrants are assumed to be older than 40 years which results in high leakage rates due to corrosion, damage, age; piped system has not been replaced, rehabilitated or extended due to lack of funds for years; many valves are buried and not maintained, due to corrosion many network utilities are not working and leaking; parts of the water distribution system of Quetta are in obsolete conditions, especially in areas such as Mali Bagh and Pashtoonabad. Major rehabilitation work should be carried out in these areas in order to reduce leakage.
(b) Operation and Maintenance
' 0
0
The number of experienced and well trained employees is limited; Emergency maintenance is applied rather than preventive measures on the basis of monitoring and controlling the system due to lack of monitoring devices; Due to lack of tools and spares repair works was carried out rather unprofessionally, e.g. old rubber inner tubes,, wooden wedges etc. are used for leak repair works; Workshops are poorly equipped resulting in ineffective maintenance programs. The present crew is not able to implement a full time preventive maintenance program. The only work carried out is repairing of faults. This is insufficient and results in massive losses of water pumped; Non existence of a metering section to work hand in hand with the billing section. A well developed metering section is vital and helps in achieving high levels of revenue collection.
a 0
4.1.5 Need for a Project
The examination of Quetta's water supply has been outlined in Volume 2.1, Section B 1. As a result of those investigations the following recommendations are delineated below, grouped into technical recommendations (primary production and water supply distribution network) and institutional and social recommendations. (The consequences of technical rec- ommendations do not include all project institutional recommendations.)
H : \ C o n D a t \ B e ~ ~ I S T ~ 3 ~ O ~ n ~ RepoltFR Vol l\vollcM.dcc

(a) Technical Recommendations
0
Re-establish the tube well production to previous production levels in the northern, western and southern well fields. Rehabilitate tube wells as outlined in the following section. Make good the installation of generators that have not been operating since they were purchased. New pumps for pumping stations in the Northern and Western Well Field, pump motors and rehabilitate pressure tank compressor. Pressure tank to be rehabilitated. (In particular, prevent reverse flows turning pumps and motors.) Overhaul and check all meters, gate valves, air valves and washout valves. Ensure valve boxes are secure. Regulate supplies to Killi Chashma Achozai and Killi Bareich in the northern well field, to the urban developments at the western well field and along the southern well field transmission by standard designs (i.e. over head service reservoirs, meters etc). Replace cast iron pipes, galvanized iron pipes and asbestos cement pipes with ductile iron pipe or bitumen coated galvanized pipe or similar. Tube wells that presently pump direct to the delivery system, to pump to centralized over head reservoirs. Chlorination units for all water production before delivery to distribution system. Existing system to be divided up into districts by valves and district meters to be placed in the system to aid managers to operate the network and allow early recognition of problems. Bulk water deliveries to be metered.
(b) Technical Aspects that Affect Institutional and Social Aspects
Ensure communities (i.e. Killis) that receive supplies are charged.. Limit agricultural pumping in vicinity of northern well field tube wells. Once PHED and BWASA come under a single authority, decommission tube wells that are too close to one another (in particular Southern Well Field). Apply recognized standard house connections and leak repair techniques. Ensure training of personnel or establish current proficiency is suitable. Additional tools purchased to establish better practices. House metering to take place once a reliable 24 hour distribution system has been established with reliable pressure.
4.2 Planning Parameters and Assumptions
Since 1972 until 1981, the population of Quetta increased significantly. This trend has been assumed to continue over the planning period, due to the general attraction of Quetta, being the administrative centre of Baluchistan. In Section 2.2.3 of this report the population development and the spatial distribution is addressed and presented. On the basis of the population data the water demand and production requirements have been developed.
H:\ConDat\Be~PAKISTAM233209\Final RepoMFR Vci l\voll c h 4 . d ~

4.2.1 Level of Service (LoS) of the Public Water System
Public Water System House Connection Yard Connection Public Tap
Sub-Total
Sub-Total
Sub-Total Grand Total
Others
Cantonment
The following section presents the assumptions and design criteria applied for the devel- opment of the project measures.
Total Population 2000 2005 201 0 201 5 2020
355,000 395,000 625,000 885,000 1 ,I 95,000 250,000 31 0,000 350,000 400,000 130,000 160,000 180,000 200,000
355,000 775,000 1,095,000 1,415,000 1,795,000
760,000 490,000 390,000 280,000 120,000
85,000 85,000 85,000 85 , 000 85,000 1,200,000 1,350,000 1,570,000 1,780,000 2,000,000
(a) Supply and Metering Policy
At present about 30% of the population, resident in the service area, is connected to the public water system. It is the intention of the project to incorporate all individually sup- plied residents into the centralised water system. It has been assumed that when a safe and reliable supply of potable water is available through the water network is available, households which are now depending on private sources will find it more desirable to connect to the public water system. This approach of a more centralised water system, will allow for water management and control of the domestic water use in the Quetta valley and ultimately result in a more efficient water management system, if operated ac- cording to the specification presented in this TA.
a Considering the “connection” approach, it has been assumed that over the next decades the civil population served and connected to the public water system will increase from 57% served (in 2005) to 70% (in 2010), to 80% (in 2015) and ultimately 90% (in 2020). It goes without saying that this approach requires substantial investments to accommo- date approximately 1.8 mio inhabitants in the year 2020 with pipe borne potable water. In future all house and yard connections would be equipped with individual water meter. The installation of water meter will allow for metered billing, oppose to the present flat rate billing tariff, which will result in a positive effect on efficient water consumption of domestic, institutional and commercial water users.
Table 4.2 : Population Served in the Service Area
In the absence of population figures, metered production or consumption, and statistics on consumer groups under present conditions with overall erratic water supply - let alone the past 10 years of uncontrolled urban excrescence, quantitative assessment of planning parameters was based on average demand in (72) sub-areas under consideration of popu- 0 H:\ConDat\BeAPAKISTM33209Find RepoMR Vol l\vollzh4.doc

lation densities, and present and anticipated development. This lead to the following con- clusions:
At present about 30% of the population resident in the Service Area are connected to the public water system, and around 7% are served by MES in the Cantonment. The remain- ing two thirds of Quetta's inhabitants ("Others" in the above Table 4.3), including indus- try, businesses, institutions, hospitals, hotels and private residences - from large housing complexes and extensive villas to slum and semi-permanent shelters - are predominantly served from private drilled or dug wells, and from water vendors. As one very clear finding of the consultant's social surveys (see Vol. 4A), a majority of this group, and certainly the less affluent part of it, would welcome a change to less expensive public water supply if quantitative and qualitative reliability is established.
(b) Specific Water Consumption
According the socio-economic household survey, the water consumption of domestic water consumers range from a low of 50 gpd to 4,000 gpd per households. The average household water consumption has been calculated on the basis of the survey results to approx. 350 gpd. However, more than half of the households interviewed reported a daily consumption of 150 gpd or even less. Considering an average household size of 7.6 per- sons, as indicated in the socio-economic analysis, an average specific water consumption of 19.7 gpcd or 90 l/c/d results.
The "Quetta Sewerage and Drainage Report, BKH, Nespak" estimates the consumption of house connections in the range of 75 to 200 l/c/d, depending on the type of house in- stallation and approx. 10-15 l/c/d for stand-post supply.
The consumption figures represents average water consume of domestic consumer. It is well known that some low-density areas might have higher specific consumption (Lytton Road and Governmental area), due to the high percentage of multiple tap house installa- tions, as in the central Quetta area, Gowalmandi, Nichari and Quaidabad area, with lower per capita consumption, due to single tap installations. It has been assumed that due to the proposed metering policy the present water consumption habits will be reduced to the required needs and wastage will be reduced to the economic level affordable for the con- sumers. Therefore the specific average water consumption of the domestic consumers has been estimated as follows:
0
house connection: 130 l/c/d (28.5 gpcd) 0 yard connection: 50 l/c/d (1 1 gpcd)
public tap: 20 l/c/d (4.4 gpcd)
In the framework of this study, the specific water consumption has been assumed con- stant over the planning period.
H:\ConDatBeAPAKISTANQ3320~inal ReDortVR V d l\voll ch4.doc

Quetta WSE - Final Report. Volume 1 Chapter 4 1 PaEe 9
Description
4.2.2 Water Production Requirements a
Quantity per Year
Considering the specific water demand figures as presented above as well as the popula- tion served according to the Level of Service, the following water production require- ments results.
201 5 [mio m3/a]
41.99 6.39 1.31 6.21
55.90
20.00 13.97 69.87
Table 4.3 : Water Consumption and BWASA - Production Requirements
2020 [mio m3/a]
56.70 7.30 1.46 7.30
72.76
20.00 18.19 90.95
[mio m3/a] Public Water System
I I 2005 I 2010 [mio m3/al
House Connectibn Yard Connection Public Tap Industrial Consumer
Su b-Total System Losses
% of production mio m3/a
Production Require- ments
10.74 29.66 4.56 5.66 0.95 1.17
29.91 42.36
25.00 20.00 9.97 10.59
39.88 52.95
5.66 5.88
I I
4.2.3 Technical Design Parameter
The purpose of this section to determine economically feasible supply standards and technologies to be applied in the study area. In the view of the technically systems im- plemented in the past, which then became partly or totally none-operational after some time because of insufficient technically trained operating personnel and/or operating set- ups underline the necessity to develop, design and apply technologies which are adapted to the local situation under sound economic conditions. 0
(a) Water Losses - Unaccounted For Water
Allowance must be made for water losses in the design of the water supply components, because no distribution system is absolutely tight. The term “unaccounted for” includes water which is not metered and accounted for, as well as physical leakage in the water supply network and along the transmission lines between the water sources and the reser- voirs. Water losses can be given either as a percentage of the average daily water con- sumption or of production. In this study the latter ratio has been selected. Water losses are assumed to be constant and not subject to seasonal variations.
H:\ConDat\BehPAKISTAN\233209\Final ReporKFR Vol l\voll ch4.doc

Quetta WSE - Final ReDort, Volume 1 ChaDter 4 / Page 10
201 5 2020
The percentage of system leakage was estimated in a range of 40% at present. It is as- sumed, that the amount of physical water losses water will decrease in future as a result of an improved supply scheme. The project target towards the following improvements, due to rehabilitation measures and improved operation and maintenance procedures:
a
5% 15% 5% 15%
Table 4.4 : Physical Water Losses in the System
Losses Losses
20% 201 0 5% 15%
(b) System Pressure
In order to provide an adequate service to consumers, water must be supplied at adequate pressure. It is generally accepted that to supply water to a roof tank on a two store build- ing a minimum pressure of 20 meters is required in the secondary mains. Each additional floor would require an additional pressure of approximately 3 meters. In areas mainly serving public taps and areas of mostly single floor houses a minimum pressure of 10 m is required at peak hour demand.
It is proposed that, if necessary, all building of more than two stories should be provided with ground tanks and pumps, which are provided at the customers expense. Therefore the minimum pressure proposed for design is 15 meters in the network. In order to pro- vide this minimum pressure it is necessary to have higher pressure in upstream parts of the system and in areas of low elevation. Taking into consideration the relatively high water losses of the existing distribution systems the maximum pressure for gravity fed networks therefore should be limited to less than 50 m. In the frame of this study,.a con- ceptual network model of the primary supply system will be established on this basis. In the hydraulic calculation of the primary system a minimum pressure of 15 meters is se- cured to allow for direct feeding into overhead reservoirs.
a
(c) System Storage
The main reason for constructing a ground or elevated storage reservoir is to provide for fluctuations in consumer demand during the day (e.g. the hourly peak flow). Furthermore the storage provides for a fairly constant residual pressure and flow to the consumers. Also it provides a reserve capacity for fire fighting and allows time for repairs and essen- tial maintenance without interrupting flow to the consumers. It has been assumed that the supply of water to the consumers shall be provided from overhead reservoirs, fed by the primary system. As the water sources are allocated on higher ground than the service ar- eas, the feeding into overhead reservoirs can be established without additional pumping. The following criteria have been applied to define storage capacities.
H : M n D a ~ \ B e r \ P A K f S T ~ ~ Z O ~ i n a l ReporWR Vol l\voll -chAdoc

, ground reservoirs at well sites: elevated reservoirs: 0.20 of average peak day demand
0.30 day storage of production capacity
4.3 Project Definition
Water system facilities have been designed for future population and demand scenarios, namely 2010 and 2020. On the basis of the hydraulic network designs, the project com- ponents have been defined. These engineering designs comprise the development of the following three main components:
Water Production and Treatment Facilities, consisting of ground water production wells, raw water pumping station and water treatment facilities. The development of the sources and water works for each proposed project stage is described in Volume 2.1, Section A - Water Resources, report. The engineering designs have been based on rele- vant information, such as production capacities, location of well fields, location of the proposed dam and the implementation phases, provided in the above mentioned section.
a Water Transmission and Primary Network, required to enable the new source-works to operate at full capacity and to convey the treated water from the well fields and water works to a point within the water service area, where it will enter the distribution system. The network consists generally of pipes with diameters larger than 200 mm. The associ- ated water supply network configuration related to each alternative considers the existing network and is dimensioned based on the results of a functional hydraulic analysis of the primary water distribution network (0 above ND 200 mm). The Network Model applied in this planning works is described in Volume 2, Annex B6. This annex also contains the input and output data with explanations.
Distribution Network, consisting of pipelines ND 80 to ND 200 mm (secondary net- work), including house connections and public taps respectively (tertiary network). The lengths and diameters of the proposed distribution network have been derived on a statis- tical basis, by detailed sample analysis of the existing water supply systems. m 4.3.1 Definition of the Main System Components
As outlined in the Sector Study on Water Supply, it is proposed that the water supply system will be sub-divided into manageable resource zones. Three main areas of supply, the Northern Area, the Central Area and the Southern Area have been identified. This general concept of subdividing the total service area into individual resource zones con- sidered various objectives, related to resources optimization, water quality, logistics, op- eration and maintenance aspects. In addition, the proposed concept will allow for con- stant flow direction in the primary system, a pre-condition for water metering. The layout of the proposed resource zoning of the service area is presented in the following Figure 4.2.
H:\ConDat\BehPAKISTA33209Wind RRwWFR Vol l\vollth4.doc

Quetta WSE - Final Report. Volume 1 Chapter 4 / Page 12
(a) Northern Resource Zone a
The Northern Resource Zone will be supplied from the “Northern Well Field”. The sup- ply from the well fields into the primary system shall be based on gravity supply, due to the topographic constrains in the area. The well field is feed into ground storage reservoir located within the well field area. From the service reservoirs, potable water will be dis- charged into the Northern Resource Zone. The primary pipe network consists of two main branches. The pipe alignment will follow the three main feeder roads in the area. In addition to the well field operation, the present PHED wells will continue to be in opera- tion to satisfy the water demand requirements of the population. Through the primary system potable water will be transferred into individual distribution zones. As each dis- tribution feeding point will be metered, a water balance from the primary mains into dis- tribution can be established on a monthly or weekly basis. In order to determine the re- quirements for the primary system a network layout has been developed and hydraulic calculations executed. According to the network simulations, the total pipeline require- ments (ND 150mm to ND 500mm) is about 21.8 km. The proposed ground reservoir will be allocated next to the existing reservoir site. Existing PHED wells will be utilised as additional sources to satisfy the water demand in future. The PHED wells shall supply into the proposed elevated reservoirs to avoid interaction between the PHED borehole system and the remaining supply system. The total storage provision would amount to 2,250 m3, which represents about 20% of the day demand in the supply area.
(b) Central Resource Zone
As the central area has the highest population and density, the requirements concerning primary mains, secondary pipes, connections and storage facilities is demanding. There- fore additional facilities are required to ensure the operation of the water scheme. The supply of the Central Resource Zone will be based on the existing BWASA City and limestone wells, as well as the proposed Limestone Well Field - L1 and the Zarghoon Range Well Field - Z1. In the year 2010 the water demand will be met by ground water sources. The well fields will feed into ground storage reservoirs located within the well field areas. From the service reservoirs, allocated on high ground, potable water will be discharged into the Resource Zone. The pipe alignment will follow the main roads in the area. In addition to the proposed well fields, the operation of the present BWASA City Wells will continue in order to satisfy the water demand requirements of the population. In case the yield of the proposed new limestone well fields are beyond expectations, the City Wells will be abandoned and supply would depend on sources outside the three well fields only. Additional primary mains and storage facilities will be required according to the water resource development. According to this approach the main water source of the areas will shift from the well fields in the north, west and south to the area to the east, where most of the water production facilities will be allocated in the near future (e.g. Limestone Well Field Ll , Zarghoon Range, Kuchnai Dam). Therefore additional primary mains and reservoirs are to be constructed to accommodate the change in “mode of sup- ply” in terms of technical facilities as well in terms of operation and maintenance proce- dures. In order to determine the requirements for the primary system a network layout has been developed and hydraulic calculations executed. The total length of pipelines amount to 13.9 km up to the year 2005 and additional 8.2 km from 2005 to 2010. The storage provision in the distribution network would amount to 3,900 m3 in the year 2005 and an additional 4,600 m3 in the yesir 2010.
a
H:\ConDat\BeWAKISTAN\233209lFinal RewrWR Vol l\voll -ch4.dw


(c) Southern Resource Zone
In future the Southern Resource Zone will be supplied from four different sources, the existing Southern and Western Well Field, as well as the proposed Limestone Well Field - L2 and L3. The supply from the well fields into the primary system will be based on gravity supply. The well fields will feed into ground storage reservoir located within the well field area. From the service reservoirs, allocated on high ground, potable water will be discharged into the Southern Resource Zone. The primary pipe network consists of three main branches.
The pipe alignment will follow the three main feeder roads in the area. In addition to the three well fields the operation of the present PHED wells will continue in order to satisfy the water demand requirements of the population. In case the proposed limestone well fields are producing more potable water than expected, the operation of the PHED wells could be abandoned and supply would depend on the three well fields only. In order to determine the requirements for the primary system a network layout has been developed and hydraulic calculations executed. According to the network simulations, the total pipelines requirements is about 44,65 km (24.2km until 2005 and 20.45km until 2010).
0
To allow for water transfer between different supply areas, pipeline connections are pro- posed for the purpose of conveying potable water from the different sources to the vari- ous supply areas. During daily operation, gate valves at connecting points of transmission mains will be closed to separate the water system into individual resource zones. In emergency cases valves can be opened to allow for interconnected operation. During the implementation stages of the water system until the year 2010, the intermediate network structures must allow for flexible operation. Interconnections between transmission mains will be necessary to allow for water transfer through the system from different sources into the distribution zones. The proposed length and diameter of the primary mains are presented in Figure 4.3 on the following page.
4.3.2 Definition of the Secondary Network and Metering Programme
As the proposed well fields are located on high ground, the transfer of potable water from the well fields to the system storage facilities will reticulate by gravity. In order to limit the pressure levels in the secondary supply systems, elevated reservoirs, distributed within the service area, will be constructed and utilized as feeding points into the secon- dary system.
0
The elevated reservoirs will also act as pressure break facilities to limit the distribution system pressure to acceptable limits of approximately 20-40m. This approach will facili- tate pressure control and ultimately reduce leakage through pressure reduction. In addi- tion, the elevated reservoirs are seen as a point of identification from the local commu- nity point of view. The identification of an elevated reservoir to a community will assist in the process of community participation, rather than underground pipelines supplying to the consumer outlets. The number of elevated reservoir has been assessed on the basis of population distribution in the service area for the planning horizon 2010 and 2020. The detailed number and probable location is presented in Annex B5.
0 H:\ConDat\Ber\PAKISTANP33209Final RepohFR V d l\voll-ch4.doc

Apart from district metering in defined districts of the water supply system the individual metering within the distribution system is proposed to be implemented in future. This ap- proach is seen as the most effective way to encourage water users to use water more effi- ciently, which results in the reduction of wastage of potable water. Today, individual water connections are charged on ferrule size. The introduction of an individual metering system is seen as an appropriate method under the assumption of sufficient water avail- able to fill up the distribution network, as water metering is difficult to establish under intermittent water supply conditions. However, until sufficient water is available in Quetta, some areas will still depend on intermittent water supply.
It shall be noted that a reliable rotating supply system would already be an achievement and appreciated by the residents and communities. Therefore, the metering system shall be introduced along with the improvements of the system in terms of availability of suffi- cient and good quality water. The socio-economic survey suggests that consumers are willing to pay for reliable and good quality water supply. As soon as water supply is se- cured, a metering system might become successful as it is seen as a fair billing method, already applied for gas and electricity supplied to individual connections in Quetta. The system layout allows for a staged development of the metering system. In the urbanized town center, known as QMC area, the water metering might start earlier than in the peri- urban areas. Water metering shall start in areas where rehabilitation works will result in improved service levels. Residential, industrial, commercial and institutional consumers shall be metered and charged accordingly. With the progress of the rehabilitation works the metered areas will expand.
0
In the pen-urban areas a metering system, based on bulk metering to defined communi- ties, could be applied until the individual metering system is socially accepted. Until then the communities will be charged on a monthly, half-year or annual basis according to water supplied into the community. The network system will be designed to allow for defined shares of water to each community, connected to the system.
This approach will ensure that the scarce water source is protected from wastage by lim- iting the quantity supplied and will allow for a fair water distribution to all communities. As water consumption in metered by bulk meters, the community shall be in charge of the operation of the supply point. This could be established by operating the gate valve of the service elevated reservoir or by opening and closing the pressure pipe supplying the community distribution system. After the project has achieved improved level of serv- ices, the consumers in the system can be charged on a meter basis. In order to allow for metering the following number of water meters are proposed to be installed in the sys- tem.
H:\ConDat\Ber\PAKISTANP33209Final ReportFR V d l\voll -cM.doc


Table 4.5 : Proposed Water Meter Installation in the Service Area a
Public Water System House Connection Yard Connection Public Tap Industrial Consumer
I Year 2000 2005 201 0 201 5 2020
45,000 49,375 78,125 1 10,625 149,375 0 25,000 31,000 35,000 40,OOC 0 2,031 2,500 2,813 3,125 0 0 0 0 C
192,500 Sub-Total 45,000 76,406 111,625 148,438 Cantonment 10,625 10,625 10,625 10,625 10,625
c Grand Total 55,625 87,031 122,250 159,063 203,125
4.3.3 Water Loss Reduction Programme
The technical assessment of the Quetta water supply system clearly indicates that the’ system suffers from a number of problems, which can be grouped under the following general headings:
0
0
0
0
0
insufficient monitoring facilities without which the effect of any action cannot be understood or evaluated, high levels of leakage due to the aged water supply facilities, failing assets, contributing to leakage, very complex operational conditions prohibiting any optimization of opera- tion, failure to provide sufficient potable water, resulting in an intermittent supply.
These are all engineering related symptoms of a system in decline. To reverse this trend capital investment in the assets of the water supply system, a p m from re-establishing the production capacities, are urgently required in the following areas within the primary and distribution system. In order to ensure that the capital investment is utilized to produce definite reductions in water losses, operating costs and improvements in the “Levels of Service” delivered to the water consumers, the project suggests the adoption, of a Reha- bilitation Strategy, which comprise the following aspects:
a
a) Re-structuring of the supply system 0
0
0
0
0
0
rehabilitation of the existing primary mains from the well fields into the City centre and the establishment of defined resource zones, rehabilitation and reinforcement of the secondary pipe network necessary to establish a zoning structure, division of distribution system into districts, by identifying location of zone valves (see Figure 4.4), identification of district meter / valve positions and procurement, calibration and installation of district meters, the refurbishment / extension and building of facilities, establishing a metering hierarchy comprising metering of production facili- ties, metering of outflow from reservoirs into supply districts.
H:\ConDat\BeWAKISTAN\233209lFind RepottWR Vol l\voll-ch4.dcc


b) Replacing the pipe network which is beyond its useful lifetime - WS/P/115 0 replacing secondary pipe work of galvanized (GI), cast iron (CI) and asbestos
cement (AC) pipes in areas where repair records clearly indicate the obsolete condition of the pipelines.
c) Introduction of leak control, detection and repair procedures - ID/C/503 0
0
Training of inspectors. 0
0
0
Introduce meter installation, repair and maintenance procedures. Assistance/advice on set-up and development of leakage reduction pro- gramme.
Preparation of district databases comprising all metered consumers within the district, identification of large consumers. Initial Inspection of each district on establishment and determination of dis- trict norms. Introduction of regular monitoring procedures (weekly and monthly district meter re adin gs) .
The expected benefits from the re-structuring of the distribution system are:
better understanding of the normal and emergency operation of the distribu- tion system resulting in improved “Level of Services” to the consumers, availability of operational data on the distribution of flow in the system, demand management through the ability to limit flows into defined zones by flow and pressure control, definition of zones can be used as a basis for the introduction of cost centres including other functions such as meter reading, billing, connection services, reduction in undetected leaks through systematic leak control and monitoring, installation of water meters (100% metering) and comprehensive survey of connections will allow to reduce under-registration of water consumers, the introduction of a meter hierarchy in the BWASA will provide the oppor- tunity for greater accuracy in the control of flows, the establishment of zones will allow for more efficient use of energy and re- duce electricity costs, improvements in the systems will result in constancy of supply and reduce the administrative and operational efforts to complaints.
,
As far as possible some expected benefits, although having significant and far reaching implications in operational and management spheres, cannot be assessed in monetary terms because of their inter-relationship with other functions of the BWASA and the de- gree of uncertainty about their effect.
To be consistent with the assumptions on investment costs and project implementation, the benefits of the rehabilitation measures are assumed to start by the year 2002 and to accrue during the whole period of implementation.
H:\ConDat\BeWAKlSTANW33209lFinal ReporWR V d l\voll ch4.doc

4.4 Project Measures of Phase 1 (ADB- Project)
4.4.1 lntroducltion
The implementation of the rehabilitation and expansion programme of the Quetta Water Supply up to the year 2020 represents a construction project of great magnitude and in- volves large investments of capital funds. Although there is a pressing need for the im- plementation works of this study throughout the inhabited areas, the need is greater in some areas and less in others. For this reason and the limited availability of funding it is prudent to construct the works in phases, which are listed below up to the year 2020. The project has been split into two phases, consisting of individual project packages:
Phase 1 (ADB Project)
0
rehabilitation of existing assets - WS/P/l15, expansion of the water supply system to connect the new limestone well fields L2 and L3 to the public water system and extension of the distribution system to connect the public presently not connected to the existing water system as well as the additional population growth according to the requirements up to the year 2005 - WS/P/116.
0
Phase 2 (not part of proposed ADB funding)
0 expansion of the water supply system to the water demand requirements up to the year 2010 - WS/P/117,
Phase 3 (not part of proposed ADB funding)
0 expansion of the ws system to the water demand requirements up to the year 2020 - WS/P/118.
In the following sections the project components are listed in more detail. The project components of the ADB-Project - Phase 1 (WS/P/llS and WS/P/116) are presented in more detail in the following section. The project components of the “Additional Project - Phase 2” is presented in Section 11.
a
4.4.2 Project Components of Phase 1 (ADB-Project)
(a) Rehabilitation Measures - WS/P/115
The rehabilitation measures for the upgrading and re-structuring of the Quetta water sup- ply system shall be implemented until 2005. The rehabilitation of wells and replacement of submersible pumps is part of the rehabilitation programme as part of the water re- sources development, presented in Section 3. The rehabilitation project under this topic will comprise the measures on source development and transmission, treatment, storage, distribution, workshop, tools and material.
H:\ConDat\Ber\PAKISTANQ33209WnaI RepomFR Vol l\voll c h 4 . d ~

Quetta WSE - Final ReDort. Volume 1 Chaoter 4IPage 21
Proposed Project Measures
Water Supply 1 Source Development and Transmission
Rehabilitation of ground reservoirs at Southern well field Construction of reservoir extensions Installation of water meter (well fields ND 300 mm) Installation of water meter (well fields ND 150 mm) Supply and Installation of HTH Chlorinator
Installation of bulk meter chambers Installation of gate chambers Rehabilitation of Primary network (assuming 20% re- placement) Rehabilitation of Pumping station
Rehabilitation of ground reservoirs Rehabilitation of elevated reservoirs Rehabilitation of ground reservoirs and elevated reser- voirs of minor capacity Installation of bulk meter on reservoirs Supply and Installation of HTH Chlorinator
Replacement of distribution pipes 80-1 OOmm
Replacement of distribution pipes 150-250mm
Installation of gate valves 80-200mm Installation of gate valves 250-500mm
Installation of water meter (bulk meter) Installation of water meter (house connection)
Supply of pipes and material
3 Treatment and Transmission
3 Storage
$ Distribution
Supply and installation of gate valves
5 Workshop, Tools and Material Supply of tools
Table 4.6 : Proposed Rehabilitation Measures (WS/P/115)
Unit
Nos. Nos. Nos. Nos. Nos.
Nos. Nos. Nos.
Nos.
Nos. Nos. Nos.
Nos. Nos.
Length [ml Length [ml Nos. Nos. LS Nos. Nos.
LS Nos.
(b) Expansion Measures - WS/P/116
Quantity
I . , .
15( I \
I t 8:
1
5 %
- I L
14
1L 1 4
61 ,OOC
20,40C
72 4E
1 18
45,OOC
1 1
The expansion works proposed under this section shall be implemented until 2005. These works mainly comprise works to connect the additional two new well fields to the exist- ing water system. The expansion project will comprise of the following tasks:
,
H:\ConDat\Be~PAKISTA332O~inal ReportFR Vol l\voll sch4.d~

Quantity
20
7,600
20,000 16,000
2
35,000 2
20 20,000
2
17,450 9,100
17 8
25 25
2,031 1,016 1 ;016
21 4,500 97,000
146,875
20,313 29,375
2,031 54
4 2
14
18,000 10,000
Proposed Project Measures Unit
H:\ConDat!BeWAKISTAM233P09\Final RepotlFR V d l\voll -cM.doc
Water Supply 1 Source Development and Transmission
Construction of well head and housing in the well fields L2 Nos. and L3 Construction of terminal storage in the well fields L2 and Vtot
Construction of gravel roads in the well fields L2 and L3 M Construction of pipelines within the well fields L2 and L3 M Installation of water meter in the well fields L2 and L3 (ND Nos. 300 mm)
M Electricity substations in the well field Nos. PMT - Transformer Nos.
M Supply and Installation of Chlorination equipment at the Nos. terminal reservoir
Construction of primary mains ND 200-350mm Nos. Construction of primary mains ND 400-600mm Nos.
Construction of elevated reservoirs 50-300m3 Nos. Construction of elevated reservoirs 400-1 100m3 Nos. Installation of bulk meter on reservoirs Nos. Supply and Installation of HTH Chlorinator Nos.
Construction of public taps Nos. Construction of soakaways for public taps Nos. Construction of drainage pipes of the public tap Nos.
M M M
L3 ~ 3 1
Transmission line for power supply
Power supply to the individual submersible pumps
2 Treatment and Transmission
3 Storage
4 Distribution
Construction of distribution pipelines ND 80-1 OOmm Construction of distribution pipelines ND 150-200mm
Supply and Installation of public taps (1 - pipe) M
Supply and Installation of individual house and yard con- nections (0.5- pipe)
Installation of water meters for individual house and yard Nos. connections Installation of water meters tap connections Nos. Installation of gate valves for zone metering Nos.
Pressure monitoring and control equipment Nos. Leak detection equipment Nos.
Vehicles for Operation and maintenance Nos.
Well fields L2 and L3 M2 Elevated reservoirs M2
5 Workshop, Tools and Material
Vehicles
Land Acquisition

4.5 Cost Estimate of Phase 1 (ADB-Project) 0
w S/P/115 Rehabilitation
337,400 330,000
1,888,550 2,517,500 850,000
0 0
5,923,450
The cost estimates for the ADB-Project - Phase 1 comprising the rehabilitation (WS/P/llS) and expansion programme I (WS/P/116) of the water system will be neces- sary to re-establish a functioning water supply system as well as to extend the existing system to the required needs until 2005. The head works of technical facilities, such as primary mains, ground reservoirs and elevated reservoirs are considered with capacities required for the planning horizon 2010 or 2020.
WS/P/116 Expansion
4,714,338 4,189,750 8,842,513 1,829,138 1,391,700 420,000 1 12,000
21,499,438
The following table comprises the summary of the project packages proposed for imple- mentation. The total cost for the test drilling, construction and installation of submersible pumps in the proposed well fields, as well as the rehabilitation and replacement costs of existing wells are considered in the project packages WS/P/lll, WS/P/112 and WS/P/113. The cost estimates are based on unit prices developed for this project. All project costs have been converted to US$, on the basis of constant prices. An average US $ rate of 1 US$ = 54.- Pak Rupees has been applied. 0 Physical contingencies were estimated to be 15% of the net investment costs. Engineering costs for final design, tender preparation and construction supervision are estimated on the basis of 7.5% of the net investment costs. The total project costs are estimated considering 14% VAT.
Table 4.8 : Project Costs of Phase 1 (ADB Project)
Description
nvestment Costs Civil works Primary network Secondary network Water meter E&M Equipment Vehicles Land acquisition
Jet Investment Costs (NIC)
H:\ConDat\Ber\PAKISTAN233209FinaI RepoMFR Vol l\voll -ch4.dcc ,

5. SECTOR PROGRAM : WASTEWATER

5. SECTOR PROGRAM - WASTEWATER
5.1 Present Situation
5.1.1 General Overview
The present rudimentary sewerage system of Quetta consists of QSSP Network, Old City and Railway Compound sewers and the Cantonment System. All the collection networks are separate systems conducting in principle sewage only. Until the early SOies, a conventional wastewater treatment plant was operated at Samungli Road, and a part of the effluents was used for irrigation.
The remaining quarters are without piped sewerage system, and only to a small part served by on-lot facilities. Most of the roads and streets in the inner city are provided with drains on both sides that receive wastewater from the residential houses, public buildings and commerciallindustrial compounds, as well as the occasional storm water.
’ The collected wastewater from these drains, as well as from the sewers is discharged into the natural creeks or “nallahs”, including Durrani nallah, Habib nallah, Kansi nallah and Sarab Lora, the main water course in the Quetta valley, and ultimately Pishin b r a river.
The increase in population, and development with improved standards of living, resulted in higher quantities of wastewater beyond the capacity of the existing drainage system, whose capacity is further curtailed by lack of maintenance accumulation of garbage, resulting in unsanitary conditions and health hazards for the population, and groundwater pollution.
New housing schemes, including Samungli, Chaman, GOR and Chiltan housing schemes were provided with piped sewer systems. Their effluents are also discharged into the storm water nalluhs without treatment. Quetta Satellite Town was provided with a sewer system, but - due to inappropriate design - the system had never been functioning and the raw sewage is being carried through open drains into the nearby storm water nullah.
a Planning of a Quetta Sewerage and Sanitation Project (QSSP) was finalized in March 1985 under the Quetta Development Authority, and implementation under BWASA has been constructed since to about 30% of Phase 1 (of 4). The scope was reduced in 1994 on the grounds of inadequate water supply and extremely slow progress of construction. The system, originally planned for a population of 400,000, thus was curtailed to cater for a population of 150,000. It consists at present of transport main, reduced 4.1 km, some 52 km of collectors, and about 1,100 house connections, as well as 5,122 pour-flush latrines in various parts of the city. The components treatment plant and irrigation scheme were dropped. The system discharges untreated sewage into Sariab b r a nadi along Samungli Road. Construction was discontinued in May 1999.
A summary of existing sewer lines, consisting of QSSP Network, Old City and Railway Compound Network and the Cantonment System, is compiled in Table 5.1.
H:\ConDat\Ber\PAKIST~33209~1n~ ReportWR Vol l\voll -ch5.doc

Ouetta WSE - Final Reuort. Volume 1 Chauter 5/Page 2
Dl AM ETER LENGTH (mm) (m)
a
REMARKS
Table 5.1 : EXISTING SEWER LINES
300 400 500
3,030 2,730 4,180
QSSP Network 225 I 32,600 I
JUU
450 Subtotal
WIU U I I I f t
3,180 discharge directly into 3,790 Habib Nallah
700 I 1,580 900 I 4.080
100 200 300 400
Subtotal TOTAL
lengths from available drawings 1 :10,000; untreated effluents discharge into Sariab Lora
7,050 7,900 , 9,050 7,550
31,550 aa,i 40
All presently functioning sewerage systems have their outlets close to the abandoned sewage treatment plant In detail these are:
0 ND 900 from the QSSP Network, 0 ND 300 from the Old City and the Railway Compound Network and 0 ND 400 from the Cantonment System.
The related wastewater flows were estimated at 120 I/s in total.
5.1.2 Condition of the Existing Network
Inspections at selected manholes have been carried out to determine the state of cleanliness, amount of flow and general condition of manholes and pipes, at the QMC, Cantonment and Satellite Town Networks. With a view to rehabilitation requirements, the findings are summarized as follows:
H:\ConDat\BeWAKISTAM233209Final ReportFR Vol l\voll -ch5.doc

~ ~ ~
Chanter 5 I Page 3 Ouetta WSE - Final Reuort. Volume 1
COMPONENT QUANTITY DEFECTIVE
Table 5.2 : RESULTS OF SITE INSPECTIONS
REHABILITATION
QMC Network Covers 2,OO units 0 % 0 Chambers (shaft) 2,000 units 0 % 0
52,800 m 80 % 42,000 M Sewer cleaninQ Cantonment Network Covers 1,200 units 30 % 350 Chambers (shaft) 1,200 units 40 % 500
Satellite Town Network , Sewer cleaning 31,600 m 70 % 22,000
System beyond repair!
5.1.3 Administration
BWASA employs the following staff and equipment for operation and maintenance of the QMC/QSSP sewerage system:
0 1 Executive Engineer 0 2 Sub Divisional Officers 0 4 Sub Engineers 0 1 driver for tractor 0 2 workers operating sludge / sewage pump 0 3 workers for manual cleaning of sewers by rodding
0 1 No. sludge suction machine with 5 m3 tank mounted on truck 0 1 No. de-watering / non clogging sewage pump, diesel driven 0 small assortment of hand tools
The staff previously responsible for construction management will be responsible for operation and maintenance on full time basis. However, as there is only a small number of house connections, the opinion prevails, that no major maintenance, repair or operation work is required. Occasional blockages are attended by the above staff. Training and equipment are inadequate for a more systematic operation. .
Overall conditions at the Cantonment network are gradually better, but also in need of improvement.
H:\ConDal\BehPAKISTAN\233209Sinal ReportSR Vol l\vollth5.Uoc


Ouetta WSE - Final Report, Volume 1 ChaDter 5 I Page 5
5.1.4 Need for the Project
5.1.4.1 Hygiene and Health Conditions
The health standards are extremely poor in Balochistan. With infant mortality around 160 - 200 per 1,000 live births, fertility and maternal mortality of 5 - 7 per 1,000, Quetta, with about 20% of the province’s population, lies far below the national average.
Most lethal diseases are water-borne, water related, livestock or pet borne. Apart from low birth weights the main causes of sickness are related to waterborne diseases, and unsanitary conditions. Infant mortality is associated with diarrhea in almost half of the cases. Sources of water borne diseases in the project area are contaminated drinking water, and wastewater. Most of the tubewell water supplied in Quetta shows bacteriological contamination.
Diseases related to wastewater are of higher significance due to open sewer lines crossing the city of Quetta. Wastewater is also used for vegetable imgation - which is probably a main source of roundworm and tapeworm infections - or is discharged untreated into the Habib Nallah in the north or the Sariab b r a in the west. During rainstorms the open drains over- flow, leaving deep puddles of contaminated water in the streets, creating health hazards espe- cially for children. Washing dishes and other utensils in such open drainage canals is com- mon. In the suburban areas of Quetta, small rainwater reservoirs, karez- and well ditches, as well as (sewerage) canals are often used for washing, bathing and livestock watering.
e
Proposed measures of extension of the existing sewerage system would improve considerably the hygienic conditions within the town of Quetta. Presently, about 9,700 m3 of wastewater per day out of 95,000 m3/d freshwater consumption are collected by the existing sewerage system. After implementation of proposed measures of Phase 1 that quantity would increase to 32,000 m3 in 2005 out of 117,000 m3/d freshwater consumption, and to 57,000 m3 in 2010 out of 147,000 m3/d freshwater.
5.1.4.2 Environmental Aspects a At present, the receiving surface water bodies (Sariab b r a , Hanna River, Habib Nala) are heavily polluted by untreated wastewater. The collection of sewage together with an adequate treatment will reduce the load of these surface waters considerably. Taking into account pro- posed treatment measures, the BODS-load discharged into the surface waters would be re- duced in 2010 from about 21,000 to 500 kg/d, and thus significantly improve their water quality.
Wastewater, untreated or onIy partly treated by septic tanks and soak-away pits, seriously endangers groundwater in particular within the densely populated areas with high specific water consumption. Construction of sewerage systems in proposed areas will thus be required to reduce/prevent pollution of groundwater.
H:\ConDat\BehPAKISTAM233209~inal ReportFR Vol l\vollth5.doc

5.1.4.3 Saving of Scarce Water Resources 0
Quantities of treated wastewater will develop as follows:
YEAR 2010 2020 Effluent in m3/d 54,400 85,800 Effluent in mio. m3/a 19.9 31.3
About 40 % of the clear water supplied to the Quetta service area would thus be available for imgation. With imgation with, treated wastewater fully applied, abstraction from the limited resources of the Quetta aquifer could be reduced up to these annual quantities. Crop yields significantly increase by application of treated wastewater and sludge.
5.1.4.4 Status of Planning and Implementation
Implementation activities in the sector up to now were largely based on the proposals made under the Quetta Sewerage and Drainage Project in 1984 with relevant growth assumptions till 2010. - albeit to a greatly reduced scope as detailed above. Planning for that project was carried out under consideration of the Quetta Urban Plan of the same date, and an earlier feasibility study and planning in the scope of the Quetta Water Supply Project. More recent master plans, studies, reports or relevant sector documents were not available until now.
0
Notwithstanding such shortcomings and delays, it appears imperative that existing assets are fully utilized - and earlier investments thus protected - by integration into a functioning comprehensive wastewater disposal system.
5.2 P.lanning Parameters and Assumptions
With a view to water conservation and potential replenishmentlrelief of the alluvial aquifer, principal decisions on the shape of Quetta's future wastewater scheme have to consider actual development in the service area, natural gradient flow, and actual conditions regarding available land and vicinity of imgated areas, as well as the economy of scale for the relevant components. Additionally, the introductiodfurther use of on-site solutions has to be taken into account in areas with reduced water supply or unfavorable construction conditions.
0
The following basic aspects and criteria are considered in the definition and planning of the Quetta wastewater disposal system:
1. Improvement of environmental, hygienic and health conditions within the town of Quetta.
2. Sewerage systems for all areas of high consumption of potable water. 3. Planning of sewerage systems of present and future service areas has to take into
account topography to facilitate gravity flow. 4. Existing facilities and alignments of sewers have to be respected and integrated in
future planning. 5. Design of primary sewers has to be carried out for final capacity (target year
2020).
H:\ConDat\BeWAKISTANQ33209Final ReportFR Vol l\vo11 e h 5 . d ~

Ouetta WSE - Final Report. Volume I ChaDter 5IPaee 7
6. Site of treatment plant has to respect future urban development of Quetta as well as minimization of all environmental negative impacts.
7. Treatment process and technology have to consider local conditions concerning required standards of effluents, economic aspects, availability of land for the plant and simple operation and maintenance of planned facilities.
8. Treated effluents from the treatment plant should preferably be used for agricultural irrigation, taking into account the scarce water resources in the Quetta region, and the necessary relieve of the alluvial aquifer from present over-exploi tati on.
In practical terms, only those quantities are of interest that can be collected in a piped sewer system and conveyed to the proposed wastewater treatment plant. This includes: (a) domestic sewage from public water supply through house connection; (b) part of domestic sewage from private well supply; (c) industrial wastewater; and (d) infiltration.
Main planning parameters are thus: 0 Return flow Connection Rates
Private well contribution Infiltration Daily peak factor Pollution load as BOD5
COD ss
Irrigation efficiency Sludge production
70% of fresh water (130 l/c,d) supplied
and railway facilities and new BWASA connections) 25% (2005) 38% (2010) 44% (2015) 47% (2020) 2% of sewage from public supply 3 l/m,d 1.30
8% of population (present; incl. Cantonment, old city
30 g/PE,d (present) 33 g/PE,d (2005) 35 g/PE,d (from 2010)
1.80 x BOD5 1.40 x BODS
65% (35% excess esp. in winter) 45 l/c,yr
Detailed design criteria for the sewer system and the proposed treatment plant (with me- chanical treatment followed by anaerobic/facultative/maturation pond system) are set forth in Volume 2.2 of this Final Report.
For non-sewered areas, on-site facilities are proposed. In Volume 2.2 technical details and cost estimates for flush toilets with septic tanks and on-site disposal, and for pour-flush toilets with pit latrine or dual soak-away pits are presented.
As further elaborated in Chapter 2 above, it is anticipated that a part of agricultural activi- ties will gradually move from expensive land in central locations to the periphery, where low-technology production is more economic, and full use of the treated wastewater is made.
H:\ConDat\BehPAKISTAM233209\Final ReportFR Vol l\voll -chB.doc

Ouetta WSE - Final Report. Volume 1 Chaoter 5 I Page 8
5.3 Investigated Alternatives 0
Four potential arrangements and different treatment options have been described in the Interim Report, taking into account the relevant technical, environmental and economic aspects, as well as development and topographical conditions that define shape and extent of respective sub-systems.
The following potential treatment plant sites had been shortlisted after field checking and study of realistic possibilities':
a) .
The site is located at the land purchased by BWASA for that purpose(about 80 ha), after the original site proposed in 1984 by BKH was abandoned. It is located approximately 15 km from the city center at Kili Barmah off Baleli village. This site would allow to collect all wastewater effluents of the Quetta service area. Reuse of treated effluents for irrigation of vast arable land in the immediate surrounding would be possible.
Kili Barmah Plant (north-west of the airport)
11)
b) The area along Sariab Lora nudi at a width of approx 1 km is predominantly occupied by irrigated cultivation (most common: grapes). Towards Sariab Road in the east and the nalluh along Sabzal Road, dense development with mainly traditional housing makes up another 1 km, with ramifications into the farmland, growing towards the smaller settlements directly by the river. In, and adjacent to, the agricultural green land, ample space for a treatment plant could be found.
Kambarani Plant (south-west of the town center, close to the Sariab Lora river)
c) This site is at the abandoned old treatment plant. Before it stopped to be operated at least 15 years ago, this full-scale wastewater treatment plant (incl. trickling filters; sludge treatment) processed the effluents of Cantonment; Railway Area and the older parts of Quetta till about Sirki. Facilities appear to be beyond repair. Parallel to the old collector main, the new transmission pipe passes the plot along Samungli Road. The site is also considered for housing development.
Cantonment Plant (west of Cantonment)
'
d) A substantial empty plot of land was identified east of the main railway at the level of the Government Degree College, Sariab Road. The place is now used to dry dung and as borrow pit for soil. Towards the north (Irrigation Colony; outlet of major karez; followed by Garib Abad and Satellite Town) and the south (encroaching traditional settlements) the land is developed. In south-eastern direction the land rises towards the foothills of Murdar Range holding irrigated farmland, brick kilns and scattered traditional settlements. This location could accommodate a small treatment plant for effluents from Satellite Town and New Baluch Colony, as well as all flow from the south that accrues on the eastern side of the railway line.
Government Degree Plant (south of the town center, close to the railway track)
the option of a multitude of small treatment plants was dropped during the pre-selection process, due to reasons ofi economy of scale; lacking space for treatment plants; lacking irrigated areas in locations where gravity flow of sewage would be possible; required high-end technology solutions in view of high land prices; non-availability of relevant operational stag objections of local residents; environmental conse- quences if plants are not operated optimally; administrative constraints.
H : \ C o n D a t \ B e r \ P A K I S T ~ 3 3 Z O ~ n ~ ReportFR Vol l\voll -ch5.doc

In addition, for each treatment plant considered, comparative parameters have been worked out for:
Low-tech solution (pond system) with the main components: inlet pumping station screening facilities grit and grease trap
' parallel anaerobic ponds parallel facultative ponds serial maturation ponds
0 appertaining drains and channels administration I operation buildings
0 streets, lights, and ancillary facilities
and a
High-tech solution (activated sludge system), including: inlet pumping station screening facilities grit and grease trap primary settling tank activated sludge tank secondary settling tank
0 appertaining drains and channels administration I operation buildings streets, lights, and ancillary facilities
Alternative wastewater collection and treatment strategies were studied, whereby four technical options were formulated. These options take into consideration one or more treatment plants at the above mentioned sites. Potential treatment plants and alternative concepts are extensively described and further analyzed in the Sector Report, Volume 2.2, and in the Interim Report. Comparative parameters for the four shortlisted options are compiled in the following Table 5.3, and schematic system plans are attached below in Figures 5.1.1 through 5.1.4.
a
As further detailed in the Sector Report, the thorough evaluation of all relevant aspects and parameters - including environmental effects, least cost analyses, operational considera- tions, appraisal of future development in presently still irrigated central areas - and exten- sive discussions with competent Government personnel, the variant with a single plant near Kili Barmah and treatment by pond system was jointly selected for further processing and adoption in the proposed comprehensive program.
H:\ConDat\Ber\PAKlSTANW33209Final ReportFR VoI l\voll-ch5.doc

Ouetta WSE - Final Report. Volume 1 Chapter 5 / Paee 10
operation & maintenance I US $/a eff. available for irrigation environmental ranking
mio m3/a
I
Table 5.3 : COMPARATIVE PARAMETERS - WW OPTIONS
I 693,970.- 9.4 (9 months) 9.4 (9 months)
Third I
I I I
I I I average incremental cost I uS$/m3treated I 0.132 (selected arrangement)
H:\ConDat\BeAPAKISTA33209Winal RemrWR Vol l\vollch5.doc

Ouetta WSE - Final ReDort. Volume 1 Chapter 5 / Page 1 I.
Unit Component (final stage)
Table 5.3 : COMPARATIVE PARAMETERS - WW OPTIONS (ctd.)
Low-tech Option Hi-tech Option
transmission main I
operation & maintenance I US $la implementation cost us $
eff. available for irrigation environmental ranking
mio m3/a
I
n.a. n.a. 2,573,200.- 6,503,190.-
84,758.- 441,998.- 4.6 (9 months) 4.6 (9 months)
Second I
Govt. Degree Plant treatment plant effluent quality
land requirement transmission main implementation cost
H:\ConDat\BeWAKISTAM233209\RnaJ RepottFR VoI l\voll -ch5.doc
capacity (m3/d) 16,700 16,700 BODs (mg) 80 (Apr.- Oct.) 80
coli/lOO ml ~2,000 (Apr.- a t . ) c2,ooo m' 230,000 9,226
n.a. n.a. u s $ 2,573,200.- 6,503,190.-

Ouetta WSE - Final Reuort, Volume 1 Chauter 5 / Paee 12
Transmission main Implementation cost Operation 8, maintenance eff. Available for irrigation
Table 5.3 : COMPARATIVE PARAMETERS - WW OPTIONS (ctd.)
n.a. n.a. us $ 4,752,800.- 9,931,814.-
US $la 120,716.- 680,950.- mio m"/a 9.1 (9 months) 9.1 (9 months)
Environmental ranking First I I I
Environmental ranking
Average incremental cost US$/^^ treated
Second
0.064 (selected arrangement) I I
H:\ConDat\Ber\PAKISTAN\2332OWinal ReportFR V d l\voll -chRdoc


Quetta WSE - Final Reuort, Volume 1 Chaoter 5 /Pase 17
5.4 Proposed Sewerage System
5.4.1 Service Areas
Growing population, increased affluence and industrialization will increase environmental pollution. The objective of the proposed sewerage scheme thus is to minimize the negative environmental effects and to find the best beneficial uses of land and water resources, including final disposal of wastewater.
Urban sanitation and sewerage systems are developed in stages and the various compo- nents of these systems will each contain a number of technology options that are inde- pendent of each other. Consequently, the entire service area will consist of both sewerage systems and on-site sanitation facilities, namely:
0 0
0
mainly excreta disposal: pour-flush toilet including infiltration pit and vault system; wastewater disposal: piped sewerage and/or septic tank including soakage pit.
For new development areas the first step of decision is to determine whether an on-site or an off-site system is the most appropriate. In areas with higher population density (> 100 - 150 people/ha) a piped sewerage system will usually be the most appropriate.
Pour-flush latrines with or without on-site infiltration in the city center of Quetta are nor- mally to be considered as temporary or transitional solutions. Increasing urbanization, higher population densities and limited space for septic tanks or soak-away pits and infil- tration systems, plus the fact that all infiltration systems will clog up, will sooner or later demand a piped system (off-site collection system).
The disposal of effluent from the existing individual septic tanks is primarily disposed of in roadside open drains andor by on-site ground infiltration. Resulting ground water pol- lution and environmental hazards from the city drains suggest gradual connection to a piped system where feasible.
Figure 5.2 shows the proposed development of the sewered areas in Quetta, and the ex- tents of relevant areas are compiled in Table 5.4. Three stages are distinguished:
0 existing sewerage systems (networks of Cantonment, Railway Compound and QMC) to be upgraded and extended in Phase 1 (till 2005)
0 proposed sewerage areas to be additionally served in Phase 2 (till 2010) and 0 proposed sewerage areas to be added in Phase 3 (after 2010).
H:\ConDat\Ber\PAKISTAM233209\Final ReporWR V d l\vollth5.dcc


Table 5.4 : EXTENT OF SEWERAGE AREAS -
Areas as shown in Total Area Sewered Area Non-sewered Figure 5.1 Area ')
(ha) (ha) (ha) Existing (1 999) 1,360 1,360 n.a.') Phase 1 (till 2005) 1,025 1,025 0 Phase 2 (2005/10) 6,675 2,575 4,100 Phase 3 (201 0/20) 2,900 1,900 900
Phase 1 areas comprise basically the Cantonment, the town center and some densely de- veloped adjacent zones in the southeast of the city incl. Satellite Town, as well as a strip along the sewage transmission main between the town and the treatment plant northwest of Quetta. Phase 2 sees a connection of presently built-up areas and zones of anticipated development and densification in the northern and southern suburbs, and the area around Brewery Road. Phase 3 areas are situated in the south of the town, where an extension of Quetta along the three main roads is taking place.
For Phase 2 and Phase 3 areas marked in Figure 5.2 it has to be mentioned that only for a
be served by on-lot facilities. portion g C thn Lllbsb P cubus nrnn piped sewerage networks will be provided. Non-sewered areas will
5.4.2 On-site Facilities
On-site systems can be individually owned and operated, or shared by a few neighbors, or they may be communal facilities that are owned and/or managed and operated by a community organization. For cost estimating purposes in-house toilet bowls or squatter plates and service connection have been included in the overall program.
The following on-site technology options have been considered:
1. Flush or pour-flush toilet with septic tank and on-site disposal 2. Hush or pour-flush toilet with pit latrine
0s 1 os2 OS3 3. Flush or pour-flush toilet with dual soak-away pits
Technical details and schematic plans of these facilities are presented in Volume 2.2.
H:\ConDaKBeWAKISTA332OWnd ReDodFR Vol l\voll ch5.doc

5.4.3 Design of the Sewer Network
Comprehensive planning parameters for the sewerage scheme including treatment facili- ties are detailed in the Sector Report. The specific design criteria for the collector system are summarized as follows:
a) Design Parameters
Hydraulic calculation with Darcy-Weisbach equation, using: operational roughness coefficient 1.5 mm
minimum flow velocity 0.5 d s maximum velocity
minimum gradient 0.2 %
5.0 m/s (not to be exceeded)
Sewers and manholes: private house connections secondary sewers space between manholes depth of sewers crossing services
2.5 m/s (design velocity at max. dis- charge with 80 % of pipe filled)
min. ND 150 - 200 mm min. ND 250 mm max. 50 m min. 1.00 m cover min. 0.30 m vert. distance
Materials for sewers: ND 150 to ND 200 (house connections) over ND 200 jointing
PVC concrete (from local factory) bell-and-spigot joints with rubber rings
Pumping stations: In the present scheme not applicable.
e b) Modeling of the Primary Sewerage System
In Volume 2.2 of this Final Report, all relevant details are given on the hydraulic modeling and dimensioning of the existing and proposed collection network. The system is dimensioned for the sewage production of the target year 2020. Sub-areas (“connected area”) of sewage production and discharge from upstream were attached to each nodehewer. Infiltration water into the sewers is added to the sewage flow. The collection network is dimensioned for maximum hourly flows, and basic discharges were therefore increased by daily and hourly peak factors. For the maximum discharge flow depth and velocity were determined.
General slope of the Quetta’s drainage area is along the river Sariab Lora in northern to northwestern direction. Lateral slopes are oriented to this river, which flows in the western part of the Quetta valley. Therefore, the sewers in the town center are oriented predominantly to the west, while the transmission main will be along this river in northern direction. It will deviate to a western direction north of the Airport of Quetta.
H:\ConDat\BeWAKISTANW33209Final RepomFA V d l\voll -ch5.da:

Figure 5.3 shows the existing and proposed primary sewerage system as modeled in the scope of the present project. It indicates nodes and main sewers of the calculated collection network.
The secondary sewerage system (DN 250) was not hydraulically calculated: Respecting a minimum diameter of DN 250 and a minimum slope of 0.2 % will guarantee a discharge of wastewater up to 26 Us. This capacity allows the collection of sewage of 7,000 to 10,000 inhabitants. Therefore, the modeling of sewer pipes of a diameter less than DN 300 is not required and only the primary network (sewer pipes of 2 DN 300) is calculated.
5.4.4 Required System Extension
Dimensions and lengths of primary sewers are according to hydraulic dimensioning. Secondary sewers are determined on a hectare basis i.e. 150 m of sewers (ND 250) per hectare for the relevant service areas (see Annex 6.1 in Volume 2.1). Details of required sewer lengths for future sewerage extension are compiled in Table 5.4.
a
Considering 8 inhabitants per house connection, total numbers of new house connections of 29,000 for Phase 1, and some 32,700 for Phase 2 were calculated. Main construction work (collectors; treatment plant extension) for Phase 3 is scheduled to be completed by 2017. Until then, additional 32,000 house connections will be installed. Together with a still growing number of water supply service connections, further 10,900 wastewater house connections are thereafter scheduled to be implemented under different contractual coverage until the target year 2020.
Table 5.5 : REQUIRED NEW SEWERS AND HOUSE CONNECTIONS
Secondary network (DN 250): Total
Primary network: Total
DN 300 DN 400 DN 500 DN 600 DN 800 DN 900 DN 1200
Total length House connections
Unit
km
km
km km km km km km km km
units
Phase 1 0 154.00
24.85
7.16 5.79 0.00 0.00 0.00 0.00 11.90 -1 80 29,000
Phase 2 0 332.00
32.35
16.00 4.95 1.70 6.00 0.65 2.95 0.00 -360 32,700
Phase 3 (km)
21 4.00
16.45
3.15 4.45 7.78 1.07 0.00 0.00 0.00 -230 32,000
H:\ConDaKBer\PAKISTA33ZOWinal RepottWR Vd l\vollth5.dcc


Ouetta WSE - Final Reoort. Volume 1 Chaoter 5 / Paee 23
Characteristics of Dis- charge
5.5 Proposed Treatment System
Monthly Average Concentra- Monthly Average Concentra- Pakistan National Environ- tion tion ’) mental Quality Standards r,
(US-EPA) (US-EPA) mgn
5.5.1 Process and Design Parameters
BOD5 Suspended solids PH
Relevant US Environmental Protection Agency Standards for levels for treated effluents, and the respective Palustan National Environmental Quality Standards for Municipal and Liquid Industrial Effluents as shown in Table 5.6, and recommended effluent quality requirements (Arthur, 1983) listed in Table 5.7 have been adopted. Due to the limited industrial activities in Quetta there is no particular risk for a dscharge of toxic substances in quantities that could endanger natural aquatic systems or exclude even the reuse of treated wastewater for agri- cultural irrigation. However, proper pre-treatment by factories in question has to be foreseen, if such industries settle in Quetta in the future.
mg/l mgn 30 a)nb) 30 D, 80 30 a’*D’ 30 D, 1 50
6 - 9 ” 6-10
a Table 5.6 : EFFLUENT STANDARDS
arithmetic mean treatment plants with stabiliation ponds and flows c 7,600 d / d are exempt continuous only enforced if caused by industrial wastewater or in-plant treatment dilution ratio to receiving water 1 : 8 dilution ratio to receiving water 1 : 10
b) 4 d)
Table 5.7 : QUALITY REQUIREMENTS FOR IRRIGATION
a
According to Pakistan National Environmental Standards National Pakistani Regulations for the use of treated wastewater for agricuttural imgation are not available. Recommended standards are according to Arthur. 1983: A B C D
1) 2)
Irrigation of trees, cotton and other non-edible crops Imgation of citrus fruit trees, fodder crops and nuts Irrigation of deciduous fruit trees, sugar cane, vegetables and sport fields Unrestricted crop imgation including parks and lawns
H \ C o n D a t \ B e h P A K l S T ~ 3 ~ 0 ~ 1 n ~ ReportVR Vol l\vollch5.doc

Ouetta WSE - Final ReDort. Volume 1 ChaDter 5 lPaee 24
RAW SCREEN GRIT
Taking into account the above requirements, a full primary and secondary treatment process is proposed. The following figure shows a schematic diagram of the planned wastewater treatment system.
@
MATURATON PONDS 1 r 1r
PERIODIC DESLUDGUNG
Figure 5.4 PROPOSED TREATMENT SYSTEM
S W i i CHAMBER -
DRYING BEDS TREATED WASTEWATER
SLUDGE TO AGRICULTURAL IRRIGATION r"l OR RECEIVING WATER
TO AGRICULTURE OR SANITARY LANDFILL
For this system, the basic design parameters are summarized in the following Table 5.8. For the detailed assessment of all values, reference is made to the Sector Report, Volume 2.2.
Table 5.8 : PARAMETERS FOR TREATMENT PLANT DIMENSIONING
I Component
201 0 Discharge (average daily)
BODS-load Total population Connection rate Total connected population (incl. equiv)
2020 Discharge (average daily)
BODS-load Total population Connection rate Total connected population (includ. equiv)
( m a . hourly)
( m a . hourly)
Q Qmax
Ca C
Q Qmax
Ca C
Unit
m3/d m3/h
C %
c+ eq
kg/d
m3ld m31h kdd
% c+ eq
C
Quantity I 58,640 4,950 20,771
1.570,OOO 38
593,462
92,470 7,740 32,806
2,000,000 47
937,308
H:\ConDet\Be~~ISTAM233209~n~ RepomFR Vol l\voll-ch5.doc

In the proposed treatment plant, degrees of purification may be expected as following:
Degree of Treatment
Mechanical treatment facilities only Mechanical treatment facilities Anaerobic pond system Mechanical treatment facilities
Facultative pond system Mechanical treatment facilities
Anaerobic pond systems
Table 5.9 : EXPECTED EFFLUENT QUALITY
Expected Effluent Concentrations BOD5 Fecal Colifons Mg/l nb/l 00ml
200 - 250 1 o7 100 - 150 106 - 10’
30-60 50,000 - 100,000
10 Anaerobic pond systems Facultative pond system Maturation pond system
500 - 2,000
5.5.2 Primary Treatment
~
Number of screening channels Total required width
With primary treatment, non-dissolved matters are removed from sewage. Rough solids of bigger size are removed by screens, and grit chambers are provided to settle granular inor- ganic solids that pass through the screens.
Unit Phase 1 Phase 2” Phase 3 ’) 3 4 6
m . 2.9 5.2 8.0
a) Screens Main features are:
circular-bar screens
flow velocity in each channel cleaning mechanical collection of screened matter operation security
dia. 10 mm @ 20 mm crs. 2 % m a . 1.0 m/s
in containers provision of min. two channels (by-pass)
slope of the channel bottom
Proposed dimension of each screening facility:
Proposed width of each channel I m l 1.4 I 1.4 1 1.4 Depth I m l 1.5 1.5 1.5 1 ) including existing units of previous Phase
b) Grit Chambers Besides other cleaning effects, grit chambers (a) protect the downstream facilities of the treatment plant against abrasion (e.g. pipes, pumps, measuring device); and (b) avoid the re- duction of usable volumes in the succeeding basins by sand accumulation.
H:\ConDat\BerU‘AKISTAM23320mFinal RepomFR V d l\vOll chAdoc

Proposed is a design velocity of 0.30 m/s, leading to the elimination of sand grains > 0.2 mm, without sedimentation of organic matter. For hydraulic reasons the number of grit chambers is adapted to the number of screening channels.
a
, Length I m l 25 I 25 I 25 Total surface area I mL I 190 I 250 375 .
Chosen dimensions of de-gntting facilities are:
I I Unit I Phase1 I Phase2’’ I Phase 3 ’I I I Number of chambers 1 - 1 3 I 4 I 6 I
I Total volume I my I 470 I 625 I 940 I 1) Including existing units of previous Phase
c) Flow Measuring Between the primary treatment units and the distribution chamber to the anaerobic ponds a Venturi-channel is proposed to measure the discharge of wastewater.
0 5.5.3 Secondary Treatment
Biological (secondary) treatment processes depend strongly on the temperature of the wastewater. Considering seasonal variations in water consumption, the minimum treatment temperature was determined on the basis of the average minimum air temperature (14 “C) during the decisive months. The corresponding average minimum temperature of wastewater was taken at 20 OC.
a) Anaerobic Ponds The use of anaerobic ponds as pre-treatment units for facultative ponds reduces land requirements in a pond treatment system.
Basic parameters for dimensioning of the anaerobic ponds are as follows:
number of parallel basins: 4 - 10 Units Volumetric load (C”): 80 kg BODs/m3/d depth of basins 0: 3.5 M retention time (tR): 4 D surface load (Cs): >1,000 kg/ha/d
a
The dimensions of each basin are:
Number of basins Total surface
Total volume 3.5 3.5 3.5
1) Including existing units of previous Phase
H:\ConDat\BeWAKISTANQ33209FinaI RepomFR Vol l\vollch5.doc

Ouetta WSE - Hnal Reuort. Volume 1 Chauter 5 I Paee 27
Number of basins Surface load
b) Facultative Ponds These ponds are shallow, less than 1.6 meters deep, being aerobic near the water surface where bacteria oxidize waste and prolific algae growth should occur, and anaerobic at the pond bottom where solids settle and are digested. Stratification that could cause algae growth and odors, is overcome by installing circulating pumps for which the power input should be less than 1 kWha of pond surface.
0
Unit Phase 1 Phase 2’’ Phase 3’’ 4 8 13
kg/ha/d 200L’ 1 80 180
Basic parameters are:
Total surface Depth Tntnl vnlume
Number of parallel basins: 4 - 13 Units Depth of basins (H): 1.60 M Retention time (tR): ’ 15-30 D Surface load (C,): 180 - 200 kg/ha/d
ha 24.0 47.8 75.6 m 1.6 1.6 1.6 m‘ 38p.000 765.000 1.209.000
This leads to the following dimensions of each basin:
1) 2)
Including existing units of previous Phase with a view to subsequent OonstNction a 10% higher load is accepted in the initial Phase
c) Maturation Ponds Maturation ponds are completely aerobic and serve in particular to reduce the fecal coliform concentration of pre-treated wastewater. In case of reuse of treated wastewater for agricul- tural irrigation, treatment by maturation ponds i s required.
The following parameters have been adopted:
Number of basins in series: 2 - 10 Units Depth of basins (H): 1.5 M Retention time (tR):
Surface load (C,): < 140 kg/ha/d
0 5 - 7 d (for the first basin)
3 d (for the basins in series)
Results of dimensioning are summarized follows:
1) Including existing units of previous Phase
H\ConDat\Ber\PAKISTAN\2332O~inal ReporlUR Vol l\vollch5.doc

Ouetta WSE - Final Report. Volume 1 Chapter 5 I Paee 28
Number of beds Total surface Width Length Depth
a 5.5.4 Sludge Treatment
Unit Phase 1 Phase 2” Phase 3” 200 350 560
ha 2.5 4.5 7.0 m 5 5 5 m 25 25 25 m 0.3 0.3 0.3
a) Desludging of Ponds The specific annual production of sludge in the anaerobic and facultative ponds is calculated at 0.045 m3/c/yr. Anaerobic ponds are emptied once a year, while facultative ponds are emp- tied once in five years depending on the actual sludge production.
Desludging is effected either (i) after emptying the pond of water (by-passing the pond, ho- mogenization of the sludge and pumping of sludge - the recommended method in the present case); or (ii) by submersible pumps without emptying the pond of water (suction of sludge from a pontoon, displacement of the pontoon by cables connected to the dikes of the ponds).
b) Sludge Drying Beds De-sludging of ponds is carried out continuously for alternate ponds. Drying time is about half a year and drylng beds can be refilled every 6 months.
The following dimensions are required:
1) Including existing units (of previous Phase)
5.5.5 Proposed Treatment Plant
Figure 5.5 shows the planned arrangement of proposed treatment facilities at E l i Barmah. The gravity transmission main from Quetta will be laid along the existing asphalt road which runs along the northern end of the land already purchased BWASA, and will be brought from there to the lifting station at the back of the site. General flow direction within the plant will then be from south to north.
Downstream of the screw pump lifting station, mechanical treatment facilities are placed (screens and grit chambers). Space for anaerobic ponds is sufficient to place ponds for Phase 1 and additional ponds proposed for Phase 2 (target year 2010). Facultative and maturation ponds follow the anaerobic ones.
North of the proposed plant area for Phases 1 and 2, across the asphalt road, sufficient space is available for extension of facultative and maturation ponds required for Phase 3.
Agricultural land for irrigation lies north and downstream of the proposed treatment plant.
H:\ConDanBeWAKISTAN\233209\Final AepomFR V d l\vdlchS.doc

From Quetta Raw water
. Pond(l.lha€adl) I j P h a s e l A -
Phase2 F !=aaMwsM(6l’ra€adl)
FtSe3 M h%dI~mP~#3(1.5h€adl)
c 105m ++ 105m + 105m * i05m +
Figure 5.5 PROPOSED WASTEWATER TREATMENT PLANT
1
F
1
I To receiving water or to irrigation
Treated water Wngasphaltroad
area *
Quetta Water Supply and Enwronmntal lrnptmwnent Pmject LEGEND

Ouetta WSE - Final Report. Volume 1 Chapter S/Paee 30
5.6 Re-use of Treated Wastewater and Sludge
5.6.6 Irrigation
Irrigation with effluents from the proposed treatment plant is envisioned under assumption of the following typical crop pattern:
0 80 % of the cultivated area planted with orchards consisting of apples (with alfalfa as forage crop) and grapes in equal surface 20 % of the cultivated area with
- vegetables as dry season crop and - wheat as winter crop
Agricultural land is available to use all treated wastewater during periods of highest demand of irrigation water. Optimum cultivation plans have yet to be developed, that also take advantage of surplus quantities in the winter months - which were not considered in the conservative balance set forth below as follows:
The water demand for irrigation has been determined on a monthly basis. An irrigation eff- ciency of 65 % was assumed which includes all losses in the conveyor and dlstribution chan- nels as well as losses due to field application. 12 hours were presumed as irrigation per day. A balance of water production and required imgation water is shown in Table 5.10. Annual quantities of treated effluent will be about 19.9 mio. m3 in 2010 and 31.3 mio. m3 in 2020. A minimum of about 65 % of the effluent of the proposed treatment plant will be used for irri- gation, while the remaining 35 % are discharged as excess water. Particularly during winter time effluent of the plant could be used more effectively, and the overall irrigation efficiency may rise up to 80% in the later stages of the planning period.
. Table 5.10 : WASTEWATER EFFLUENT AND IRRIGATION REQUIREMENTS
H:\ConDat\BerWAKlSTANQ33209F1nal RepoMR Vol l\vollchl.doc

Quetta WSE - Anal Renort. Volume I Chapter 5 / Pape 31
5.6.2 Reuse of Sludge in Agriculture 0
\
The deficit of nutrients in irrigated agnculture can be compensated by using de-watered and dried sludge from the sewage treatment plant. In addition, the sludge serves as a soil conditioner. For this the following criteria can be adopted:
Sludge production: 45 l/c/yr Dosage of sludge on fields (about 1.7 t/ha/a): Dosage of P205 (4 % of 1.7 t):
3.0 m3/ha/yr 68 kg/ha/yr
Benefits include the saving of expenditure for the use of chemical fertilizers of the same content of P205. A dosage of 136 kg/ha/a fertilizer corresponds roughly with 68 kg/ha/a of p205.
In order to reduce the hygienic risk coming from the helminth eggs to a supportable ex- tent, the sludge should be exposed to sunlight and dried for about 6 months in the sludge drying beds. Raised heavy metal concentrations in sewage sludges have to be anticipated, but due to the absence of extensive industrial activities in Quetta, the risk of such an ac- cumulation reaching dangerous contents is low (comp. relevant European standards com- piled in the Sector Report).
5.7. Project Measures of Phase 1 (ADB-Project)
The package proposed for Bank financing covers Phase 1 of the presented comprehensive scenario that is required for a sustainable development of water resources and sanitary conditions in the Quetta service area for the planning period. Associated detailed planning and implementation activities are expected to be continued in the subsequent Phases 2 & 3 under dlfferent funding arrangements. However, basic strategies and outlines of the final scheme have to be considered already at the start of the program, as major components are designed for ultimate capacity requirements during their useful lifetime.
In accordance with the descriptions set forth above, the program will include the following components:
a
WW/C/201 Consulting Services for Engineering Design and Construction Supervision of Quetta Sewerage Project I Implementation: January 2001 - December 2005
Quetta Sewerage Project I - Rehabilitation of existing wastewater disposal facilities and construction of new sewers, house connections and treatment plant, Phase I Implementation: January 2002 - December 2005
Base cost: US$ 1,496,144.- WW/P/211
Base cost US$ 19,948,190.-
Components and quantities are further listed in the cost estimates set forth in the following Chapter 5.9. The relevant Project Implementation Schedule is shown as Figure 13.1.
H:\ConDat\BeWAKISTAM2332OWnal RepomFR V d l\voll ch5.da:

Ouetta WSE - Final Reuort. Volume 1 Chauter S / h e e 32
Component
5.8 Cost Estimate of Phase 1 (ADB-Project) 0
Operation Cost 2006/10 US$/yr
Standardzed unit prices have been determined for all important components of the project, and were used in the detailed cost estimates for investment and O&M cost included in the relevant Sector Reports. The attached Tables 5.11 to 5.14 provide summary cost estimates broken down into the major cost items to facilitate future evaluation of the proposed scheme.
Staff cost Administration cost Maintenance cost
a) Implementation Estimated gross implementation costs for the wastewater components come to:
61,400 18,420 143,176
Phase 1 US$ 28,113,483.-
~
Energy cost I 19,900 Total 248,971
Details of these total investment costs for Phase 1 (present project) of measures to be implemented in 2001/05, are compiled in the Table 5.12.. Costs for physical contingencies (15%) and for value added tax (14%) are included in the above overall cost of each Phase. 0 b) Operation and Maintenance Total operation costs for sewerage system and treatment plant are presented in Table 11. Details of the cost estimation are given in the Sector Report.
Table 5.1 1 : TOTAL OPERATION COST
I Cost for consumables I ' 6,075 I
H:\ConDanBeWAKISTANV332OWinal RepomFR V d l \ ~ l l < h S . d o c

Ouetta WSE - Final ReDOrt. Volume 1 Chapter 5 I Paae 33
Engineering costs
Physical contingencies
TABLE 5.1 2: Total Investment Costs - Phase 1 (ADB-Project) a
1
1
Quetta Water Supply and Environmental Improvement Project Connected population: 343.800; Wastewater collection: 31,905 m3/d,/ 11.65 m3M
SEWERAGE NETWORK
Rehabilitation and cleaning of existing sewers
Primary system (incl. transmission main)
Secondary system
Transmission main
House connections
Pumping stations
Stormwater overflows
SUETOTAL CIVIL WORKS
Pumping stations
Cars, machines
SUETOTAL EQUIPMENT NETWORK
WASTEWATER TREATMENT PLANT
CMl works
Equipment E&M
Land acquisnion
SUB-TOTAL WASTEWATER TREATMENT PLAN
SUB TOTAL (Sewerage and treatment plant)
lump sum
m
m
m
U
U
U
lump sum
lump sum
lump sum
lump sum
ha
1
24.850
154.1 00
0
29.000
0
0
0
1
OTHER WORKS
PART Civil Works,
PART Equipment EBM
SUB TOTAL (GROSS INVESTMENT COST) WITHOUT VATPRICE CONTING.
VAT (for gross Investment cost without land cost)
SUB TOTAL (GROSS INVESTMENT COST) WITH VATNITHOUT PRICE CONTING.
14%
142.000
3.604.990
6.472.200
0
3.045.000
0
0
13.264.1 90
0
410.000
410.000
6.061.000
213.000
0
6.274.000
19.948.1 90
19.325.1 90
623.000
19.M8.190
1.496.1 14
3.216.646
24.660.950
3.452.533
28.113.403
PHASE 1 (till 2005)
0,7%
18,1%
32.4%
o.oo/.
15,3%
0.0%
0.0%
66.5%
0.0%
2,1%
2,1%
30.4%
1.1%
0,070
31,5%
96.9%
3,1%
7,5%
16.1%
123,6%
17,3%
140,9%
H:\ConDat\Ber\PAKISTAN\2332O~nal RepotlFR V d l\voll c h 5 . d ~ ~

Ouetta WSE - Final Reuort. Volume 1 Chauter 5 f Paee 34
TABLE 5.1 3: Total Investment Cost (Phase 2)
Quetta Water Supply and Environmental Improvement Project Connected population: 267,000; Wastewater collection: 24.785 m'/d I9.05 m3//yr (in addition to Phase 1)
PHASE 2 (1111 2010)
(Basis US199 PERCENTAQE OF TOTAL
NET PRICES Component AMOUNT
U S
SEWERAGE NETWORK
Rehabiliation and cleaning of existing sewers
Primary system
Secondary system
Transmission main
House connections
Pumping stations
Stormwater overflows
SUETOTAL CIVIL WORKS
Pumping stations
Cars, machines
lump sum
m
m
m
U
U
U
0
32.250
331.900
0
32.700
0
0
0.0%
10,6%
58.2%
O,O%
14,3%
O,O%
0.0%
83,1%
0
2.534.700
13.939.800
0
3.433.500
0
0
19.908.Ooo
lump sum
lump sum
0
1
0
90.000
90.000
0.0%
0.4%
0,4% SUBTOTAL EQUIPMENT NETWORK
WASTEWATER TREATMENT PLANT
Civil works
Equipment E&M
Land acquisition
lump sum
lump sum
ha
1
1
14.7
3.263.705
114.129
588.000
3.965.834
23.963.834
13.6%
0,5%
2.5%
16.5%
100,0%
SUBTOTAL WASTEWATER TREATMENT PLAN'
SUB TOTAL (Sewerage and treatment plant)
OTHER WORKS
PART Chrll works
PART Equipment E&M
SUB TOTAL (NET INVESTMENT COST)
23.171.705
204.129
96,7%
09%
23.963.834
1.797.288
3.864.168
7,5%
16,1%
Engineering costs lump sum 1
Physical contingencies lump sum 1
SUB TOTAL (GROSS INVESTMENT COST) WITHOUT VATPRICE CONTING. 29.625.290 123,6%
VAT 14% 4.147.541
33.772.830
17,3%
140,970 SUB TOTAL (GROSS INVESTMENT COST) WITH VATMITHOUT PRICE COMING.
H\ConDat\Ber\PAKISTANQ33209Wnd ReporWR Vol l\voll c h 5 . d ~

Ouetta WSE - Final Reuort. Volume 1 Chauter 5 I Paere 35
TABLE 5.14: Total Investment Cost (Phase 3)
Quetta Water Supply and Environmental Improvement Project Connected population: 353,900; Wastewater wilection: 33,285 m3/d 112.15 m'lyr (till 2020; in addnion to Phases 182)
PHASE 3 (after 2010)
Component UNIT QUANTITY
SEWERAGE NETWORK
Rehabilitation and cleaning of existing sewers
Primary system
Secondary system
Transmission main
House connections (till 2017)
Pumping stations
Stormwater overflows
SUBTOTAL CIVIL WORKS
Pumping stations
Cars, machines
SUETOTAL EQUIPMENT NETWORK
WASTEWATER TREATMENT PLANT
CMl works
Equipment E&M
Land acquisition
lump sum
m
0
16.450
214.000
0
32.000
0
0
0
1.1 68.275
8.988.000
0
3.360.000
0
0
13.516.275
0
370.000
370.000
5.383.1 90
174.305
2.188.000
7.745.495
21.631.770
O,O%
5,4%
41.5%
O,O%
15.5%
0.0%
O,O%
62,5%
lump sum
lump sum
0
0
O,O%
1.7%
1,7%
lump sum
lump sum
ha
1
1
542
24,9%
0,8%
10,1%
35.8%
lW,O% SUB TOTAL (Sewerage and treatment plant)
OTHER WORKS
PART Civil Works
PART Equipment E&M
87,4%
2,5%
18.899.465
544.305
100,0% 21.631.770
1.622.383
3.488.123
SUB TOTAL (NET INVESTMENT COST)
Engineering costs 1
Physical contingencies 1
7.5%
16,1%
SUB TOTAL (GROSS INVESTMENT COST) WITHOUT VATPRICE COWING. 26.742.276 123,6%
VAT 14%
PUB TOTAL (GROSS INVESTMENT COST) WITH VATNYITHOVT PRICE CON.
3.743.919
30.486.1 94
17,3%
140,9%
H\ConDat\Ber\PAKISTAM233209\Final RepomFR Vol l\vollch5.da:

a
6. SECTOR PROGRAM : DR Al N AG E

6. SECTOR PROGRAM - DRAINAGE
6.1 Present Situation
6.1.1 General Overview
For the development of water resources in the Quetta valley, an integrated approach is necessary of not only developing primary water sources but also implementing measures to protect them. The proposed stormwater drainage component of the project will enhance the quality and quantity of groundwater recharge, the improvement of hygiene and quality of life, and the reduction of flood damages. The improvement program for the urban stormwater drainage in Quetta also puts an emphasis on the protection of investments made in the past, and thus prepares the ground for improved operation and maintenance of future installations.
Primary service area is the administrative area of Quetta Municipality, with the highest population densities and property values. Conditions in the Cantonment do not call for immediate action, due to spacious development, the regulation of the main recipient Dur- rani nallah, and own maintenance arrangements by the army. In the suburbs, where practi- cally no proper stormwater drainage or flood control exists, major planning and construc- tion work is required in conjunction with the progressing urban development.
This project proposal, therefore, gives priority to a first phase maintenance and rehabilita- tion program that supports Quetta Municipal Council’s own efforts to improve operation of the present urban stormwater drainage system and make, where necessary, local struc- tural improvements. In addition, an outline long-term drainage development plan is pro- vided for the entire service area, keeping in view also the interrelations with flood control and potential groundwater recharge.
The present chapter gives a comprehensive view of the proposed implementation program. Detailed descriptions are presented in the relevant Sector Report, Volume 2.2 of this Final Report.
a
6.1.2 Existing Facilities
Storm water from the built-up areas of the city is transmitted to the major natural nallahs - with the main recipients Habib, Durrani and Kasi Nallah - and finally into Sariab Lora nadi, through a network of road side drains, following largely the prevailing gradients of the terrain.
Lengths of existing drains of different classification, and natural streams that constitute a part of the drainage system, have been given as shown in Table 6.1. Thereof, detailed as- sessments for city drains of total 57,758 m are available. Many of these drains were con- structed primarily for domestic wastewater disposal. Further independent systems are found in the Cantonment area and in a number of housing estates and smaller complexes.
0 \\MA-NWOl\VOLl\PROJEKTE\ConDat\Ber\PAKlSTAN~33209\Fi~al Repon\FR Vol I\voll-ch6.doc

~~~ ~~
Ouetta WSE - Final Report, Volume I Chapter 6 / Paae 2
LENGTH (km\ CLASSIFICATION
Table 6.1 : EXISTING DRAINS AND NATURAL STREAMS
REMARKS
Subtotal Natural Streams Durrani Nallah Habib Nallah Kasi Nallah other minor streams Sariab Lora
I Drains I ----1
323
11 13 7 2
17 Kechi Beg to Airport
Major Drains Minor Drains and Road-side Gutters
1
Subtotal I 50 1 TOTAL I 373 I
Main catchment areas of this network of drains streams are:
Habib Nallah 13.8 km2 Kasi Nallah 5.6 km2 Lora Nadi (directly) 14.2 km2
With the additional paved areas of the rapidly expanding city, increased and accelerated run-off significantly raises the peak flows. In the poorer parts of the city at the foothills of Murdar Range, e.g. beyond Shaldara and Pashtoonabad, flash floods from the mountain slopes add to the problem.
Existing facilities are operated and maintained by Quetta Municipal Corporation through its Sanitation Section. Its staff of 1,066, however, is predominantly engaged in solid waste disposal and street cleaning. Systematic clearing of drains - especially buried sections - is rarely carried out, and corrective maintenance is not a part of the routine. 0
6.1.3 Problem Analysis
Notwithstanding the arid climate in Quetta, flooding and malfunctioning drains containing wastewater, are serious problems. Several past proposals for improvement were not fol- lowed by action. Planning is generally handicapped by uncontrolled development, and by incomplete topographical maps, meteorological records and hydrological data.
Drains, and especially the underground sections, are frequently clogged by accumulation of silt, garbage and construction materials, and their limited capacities are further con- stricted due to shortcomings in solid waste collection and separate wastewater disposal, but especially due to a serious lack of maintenance. A considerable part of the mainte- nance problem arises from the lack of suitable equipment and required vehicles to carry out the work properly and efficiently.
\\MA-NWOl\VOLl\PROJEKTRConDat\Ber\PAKISTANV33209\Find Report\FR Vol l\voll-ch6.doc

A part of the polluted effluents percolates into the ground and thus constitutes an increas- ing threat to the groundwater quality. During heavy rains in the mountains the situation becomes even worse: Run-off from the Murdar Range continues partly as sheet flow over the streets of the eastern suburbs and further increases the polluting and damaging effects.
Based on these findings, problems and required remedial action are summarized as fol- lows:
e Existing city drains are in serious need of systematic maintenance, extended rehabilitation and local structural improvement. Restoration of original capacities will significantly improve the harmless con- duction of stormwater run-off from the urban area, and thus will restrain the hygienic hazards and increasing groundwater pollution imposed by the present condition of facilities. In line with the requirement of swift improvement at reasonable cost, an initial rehabilitation program is to be carried out by contractors, to be continued later by QMC as a regular routine of their Sanitation Section. For this purpose, ap- propriate equipment is required. Conditions in the Cantonment area do not impose major drainage problems, and the military’s own arrangements are considered satisfactory. Existing and developing urbanization outside of the present municipal bounda- ries are threatened primarily by flash floods from the mountainous catchment areas, but also by the lack of local drainage facilities. In order to handle rele- vant existing and anticipated problems, combined flood control and drainage measures are necessary. Drainage facilities in the densely urbanized areas serve the swift disposal of stormwater run-off and thus reduce percolation of effluents into the ground and pollution of the underlying aquifer. However, envisaged new drainage and es- pecially flood control facilities in the outer, less polluted areas have to be planned in a way that promotes such percolation and makes optimum use of the potential for groundwater recharge. With a view to the proper functioning of: drains and the necessary improvement of effluent quality, both the problems of solid waste management and separated disposal of wastewater have to be solved simultaneously to any successful drainage project in Quetta.
0
0
0
*
0
It is therefore necessary to give top priority to drainage maintenance and rehabilitation in the Quetta municipal area as Phase 1 of a systematic and comprehensive improvement of stormwater drainage and flood control in the service area. For subsequent implementation of Phases 2 and 3, program and preliminary design are outlined below.
\\MA-NWOl\VOLl\PROJEKTE\ConDat\Be~PAKISTAN\233209\Final ReportFR Vol l\vo11 -ch6.doc

Quetta WSE - Final Reoort. Volume 1 Chaoter G/Paee 4
6.1.4 Need for the Project 0
The generally dry climate in the Quetta area may be deceiving: during flash floods in 1982, fifty seven people were lulled and thousands of homes destroyed. Although the situation has improved after some flood control works were implemented, similar events still cause serious damage. However, besides these major - but rare - freshets, the more common problems derive from wastewater, stagnant in the blocked drains and frequently overflowing, and the resulting health and hygiene hazards and groundwater pollution.
According to population estimates in the sub-areas concerned', a total of 664,000 inhabi- tants are potentially affected by shortcomings in the existing urban drainage. The recom- mended Phase 1 program of re-establishing capacities through systematic rehabilitation and maintenance is thus a necessary and affordable improvement in the most densely populated parts of the city. Negative environmental impacts and health hazards will be re- duced due to shortened retention of polluted effluents in the drains, less percolation of wastewater into the local aquifer, and higher dilution and self-cleaning in the further re- cipients.
In order to enhance the above impacts and benefits, the ensuing project needs to support QMC's capacities to carry out corrective and routine maintenance by provision of special equipment as well as institutional and operational advisory services. It is, furthermore, recommended that an initial rehabilitation program is carried out through contractors in order to save time and to avoid building up internal capacities that would be required only for a limited period.
In logical continuation of this proposed immediate program, Phase 2 of the Drainage De- velopment Plan envisages the required expansion and upgrading of the urban drainage system to final capacity in the urbanized areas. This includes new drains, but covers in the first place the continued conversion of open sewers for wastewater into proper stormwater drains - once the sewerage system becomes fully operational. This second phase is re- quired to fully achieve reliable drainage and the desired environmental improvements in the city.
In developing areas around Quetta, man-made drainage and flood control is practically non-existent at present. Area run-off and flash floods from the mountain nallahs follow their natural routes and thus provide important groundwater recharge where the rapidly spreading settlements do not yet impose restrictions. Anticipating further development, Phase 3 of the proposed program includes therefore a necessary combination of urban drainage and flood delay action dams against damages from erratic mountain torrents, with an enhancement of groundwater recharge. Implementation is envisaged at a later stage in consideration of priorities and available capacities. However, proposed measures are rather independent of Phase 1 & 2 activities and could be started sooner, where actual ur- banization requires so.
Area ID Nos. I, 2, 3, 4, 7, 8, 9, 10; cornp. Vol. 2.1/B, Annex BS 0 I
\ \ M A - N W O ~ \ V O L ~ \ P R O J E K T E \ C ~ ~ D ~ ~ \ B ~ ~ P A K I S T A N \ ~ ~ ~ ~ O S \ F I ~ ~ ~ Report\FR Vol l\voll -ch6.doc

Ouetta WSE - Final Reoort. Volume 1 Chaoter 6 / Paoe 5
6.2 Planning Parameters and Assumptions 0
Precipitation: Rains in the Quetta area are erratic and over small areas. There are no automatic recorders installed. Highest recorded intensity at Quetta Station is 2.17 mm over 24 hours. However, precipitation increases with altitude, and intensities - especially at the slopes of the sur- rounding mountains - are considerably higher. For the 12 km2 catchment area of Kasi Nallah, an intensity of 44 md24hrs was given during an extreme event in 1982.
For pre-dimensioning of urban drains, the available records have been evaluated, and characteristic rainfall frequency/intensity/duration curves are used in the calculations de- tailed in the Sector Report. Typical values for the valley bottom are:
Station Duration Return Period (years) H rs 2 5 10 25 50 . 100
Kuchlack 24 1.29 1.79 2.12 2.58 2.94 3.30 (58 years records)
a
Quetta 24 1.38 1.73 .97 2.31 2.59 2.85
(79 years rec- 6 0.99 1.25 1.42 1.66 1.86 2.05 ords)
1 0.62 0.78 0.89 1.04 1.17 1.28
Run-off: The following typical run-off coefficients were applied:
Type of Area Range of Run-off Coefficients ( C )
Business Downtown Neighborhood
Single family Multi-units, detached Multi-units, attached
Residential
Residential (suburban) Apartment Buildings Industrial
Light Heavy
Parks, cemeteries Playgrounds Yards Unimproved
0.70 to 0.95 0.50 to 0.70
0.30 to 0.50 0.40 to 0.60 0.60 to 0.75 0.25 to 0.40 0.50 to 0.70
0.50 to 0.80 0.60 to 0.90 0.10 to 0.25 0.20 to 0.35 0.20 to 0.35 0.10 to 0.30
Flow Modeling: Flows have been computed applying block distribution of rains and the Modified Rational Method as run-off model. Discharge capacities of drains are calculated using Manning’s Formula with the recommended roughness coefficients, and characteristic flow velocities are given for optimized open drains with 1 : 1 side slopes. 0 \\MA-NW Ol\VOLl\PROJEKTC\ConDat\BaWAKISTAN\233209~inal Raport\FR Vol l\vo11 -ch€i.doc

Typical Design of Drains: For drain design, the following recurrence intervals of storm events were chosen:
0
Major, primary drains 1 in 5 years Secondary collector drains - 1 in 2 years Minor drains 1 in 1 year
General design parameters are summarized as follows:
Lined Channels Unlined Channels Storm Design Low Flow Storm Design Low Flow Parameter
Velocity max. 3.00 m/s n.a. max. 1 S O m/s n.a. Depth (to stability) min. 0.30 m max. 2.50 m .min. 0.50 m Side slopes (to stability) (to stability) max. 1 :1.5 max. 1:1.5 Freeboard bottom width 4 m min. 0.30 m bottom width >1 m min. 0.30 m min. 0.50 m
min. 0.1 5 m
Manning roughness 0.01 3 - 0.030 0.025 - 0.045
Typical cross sections are shown in the Annex to this Volume.
Further details on the planning parameters and criteria for the preliminary design of stormwater drainage facilities are set forth in the relevant Sector Report in Volume 2.2 of this Final Report.
6.3 Project Definition
6.3.1 Prioritization of Sub-projects
The priority program for the Drainage Sector has been developed to meet local require- ments, reflect operational capabilities, and complement existing facilities in a scope and form compatible with the financial and administrative resources of the local government. Subsequently, medium and long-term programs are envisaged, that focus on expansion and improvement of the existing scheme in order to complete area coverage and add to the capacities of strategic recipient drains. Proposed works serve both, the swift and harmless discharging of stormwater run-off from congested urban areas, and an economical utiliza- tion of the potential for groundwater recharge in locations at the periphery.
a
The following implementation program is proposed:
0
Phase 1 - Drainage Maintenance and Rehabilitation Phase 2 - Expansion of the Urban Drainage System Phase 3 - Drainage and Flood Control Scheme for Peripheral Areas
\\MA-NWOl\VOLl \PROJEKTEConDat\BeAPAKISTANV33209\Fin~ Report\FR VoI 1 \vo11 -ch6.doc

This phasing takes into consideration that the drainage development plan cannot be im- plemented at once and will not be successful unless the proposed water supply, sewerage and solid waste disposal components of the project take effect. However, the required comprehensive approach in the water supply and sanitary sectors also implies that imme- diate measures have to be taken to make full use of existing assets, and to establish the op- erational routines necessary to protect future investment.
a
Therefore, the project preparation for possible Bank financing puts an emphasis on the first phase maintenance and rehabilitation requirements of Quetta's stormwater drainage system.
6.3.2 Drainage Maintenance and Rehabilitation
This sector component is proposed to be included in the Phase 1 overall implementation program. It comprises of two project packages - one for initial cleaning and system reha- bilitation by contractors, and the other one for the supply of machinery and equipment un- der ADB loan to support QMC's Sanitary Section in establishing and maintaining effec- tive maintenance routines.
a
a) Drainage System Rehabilitation - DF/PMll Main objectives of this component are the restoration and improvement of discharge ca- pacities of the existing drainage system, incl.:
0
0
thorough initial cleaning, de-silting and removal of debris; comprehensive rehabilitation to full and consistent flow capacity of existing drains and open sewers according to original design; systematic removal of bottlenecks and missing links; reconstruction of damaged drain sections; rehabilitatiodconstruction of curb inlets, culverts and other related structures, as well as relocation of existing facilities and road reinstatement; and establishment of workshop and storage facilities
0
0
*
0
The project is to be carried out under contract with QMC, with a view to future continua- tion of routine services by their Sanitation Section. Initial engineering and contract man- agement support is rendered through PMU advisory services in the scope of the overall Project.
Detailed work items are locally defined by the contract managedengineer, following each drainage subsystem from the point of discharge in upstream direction, and subsequently recorded in the relevant design and contractual documents.
\\MA-NWOl \VOLl\PROJEKTE\ConDat\Ber\PAKISTAN'233ZOS\Final Report\FR Vol 1 boll -ch6.doc

Ouetta WSE - Final Reuort, Volume 1 Chaoter 6 / Paoe 8
The scope of work includes: 0
0 cleaning of 150 km micro drains; 100 km small drains up to 0.50 m depth; and 75 km larger open drains and buried conduits; repair and systematic reinstatement of function incl. construction of curb inlets, of 50 km micro drains; 30 km small drains; and 10 km larger open drains, cul- verts and buried conduits; clearing and repair of 40 km main channels and natural drains; relocation of electrical, telecommunication, gas, water supply and sewerage fa- cilities; and construction of workshop and storage facilities for the QMC drainage mainte- nance activities.
0
0
0
0
b) Supply of Machinery and Equipment - DF/P/312 The contract covers the provision of general and special equipment to support and improve worlung methods and progress in routine and corrective drainage maintenance by QMC Sanitary Section. A list of required equipment is compiled in Table 6.2 below.
\\MA-NWO1\VOL1\PROJEKTE\ConDat\Ber\PAKISTAN\233209\Final Report\FR Vol l\voll -ch6.doc

Table 6.2 : DRAINAGE MAINTENANCE MACHINERY AND EQUIPMENT - ITEM No.
1
2 3 4 5
-
8
9
12
13
-
~~
DESCRIPTION
Front wheel loader and back hoe
Skid steer loader Dump truck - diesel engine Double-cabin pick up truck JElTING TRUCK: High-pressure cleaning vehicle with adjustable 5m3 water and sludge tanks, including multi-piston high pressure pump (80-120 bar), hose on reel min.100m with direct and reverse jet headkleaning torpedo; sludge suction pump and discharge appliances; incl. all attachment for effective operation; Set of spare parts for min. 2000 hours' maintenance Set of sewer rods of oil tempered steel, min. 6mm/l.50m, single sections with snap-lock couplings; complete set incl. 20 Numbers. 1.50m sections, auger head, general purpose head, root retriever, and tee handle; Spares incl. 10 Numbers. 1.50 m sections, 1 No. auger head, 1 No. general purpose head, 1 No. root cutter, 1 No. tee turning handle
Rotary cleaning machine for pipe drains up to ND 600mm; petrol driven; with attachments and spare parts for 1500 hours of operation Set of "non clog" dewatering pump and petrol generator 2.5 kw; incl. set of spare parts HAND TOOLS AND EQUIPMENT - Mat axe (Pulaski Tool)
- Double kit, crown pattern axe - Heavy duty lopper pack - Single edge bush hook - Carton of 4 - Long handle square nose shovel
- Long handle round nose shovel,
- 1/2 inch (12 mm) x 600 ft bullrope coil (appr. 183 m) - Mechanic's metric tools in tool box - Loosening chain 20 m - Wheelbarrow, appr. 100 I - Set of moveable dumping frame
Pack of 6, complete with leather sheaths
Pack of 6
Pack of 6
2.50 x 1.50 x 0.30 m high of wooden planks 25 mm; with steel end connectors combined with stands for road barriers
SAFETY EQUIPMENT Set of road security equipment incl. min. - 6 Numbers. road barriers with stands - 12 Numbers warning cones - 2 Numbers traffic signs
I' no entry" no stands - 2 Numbers. traffic signs
"direction" on stand Set of protective clothing incl. - Steel capped rubber boots - Helmet - Warning waist coat heavy duty gloves
QTY
1
1 2 1
1
1 set
1 set
1 set
1
1 1 1 4
4
1 1 2
24 6
6 sets
S
REMARKS
e.g. CAT 926 Schaeff HT12
e.g. Sperry L-455 approx. 150 HP e.q. Toyota e.g. Eichhoff, FRG
e.g. Mc Mater-Carr, USA
e.g. Eichhoff, FRG
\ \ M A - N W O 1 \ V O L 1 \ P R O J E K T E \ C o n D a t \ B e h P A K I S Report\FR Vol l\voll -ch6.doc

Ouetta WSE - Final Report. Volume 1 Chapter 6 / Page 10
6.3.3 Expansion of the Urban Drainage System 0
Phase 2 of the proposed drainage program envisages a major upgrading and expansion of facilities and the systematic improvement of overall capacity and functioning of Quetta’s stormwater drainage scheme. Its feasibility implementation is strongly dependent upon the actual completion and function of measures carried out under the Phase 1 drainage, solid waste and sewerage/water supply program components. In the arid climate, full drainage is only employed during short periods every year, once an environmentally and hygienically sound sewerage system is in place.
Considering, furthermore, the aspects of financial tolerance as well as the local capacities to physically implement the major works simultaneously to water supply and wastewater disposal, Phase 2 drainage is not included in the proposed regular program for immediate realization under the proposed Bank financing program. The concept and preliminary de- sign presented hereunder are therefore regarded as an option for eventual execution under different or later funding arrangement.
a) Main Drains Stormwater drainage in the central parts of Quetta faces the problem of congested urbani- zation, leaving little space for the construction of drains. This calls for small cross-sections hence sub-catchment areas, and accordingly, a greater number of collector drains. Main drains are therefore located in the bigger roads, with alignments that lead to the recipients on the shortest possible route, while following the natural gradient of the terrain. Follow- ing in general previous layouts determined by existing streets and development, the four QMC service zones are divided into 16 sub-catchment systems. Their locations are shown in Figure 6.1 below. Main features are as following:
Central Zone: Subcatchment System Drainage Area 580 ha Recipient Habib Nallah
Nos. 2 , 3 and 4
Drain No. 2 and its tributaries serve the largest area. Its end discharge of approx. 18 m3/s calls for large cross sections along Zarghoon and White Roads. The smaller areas further north, Zarghoon Rd. to Share Iqbal, are served by drain No. 3 (4.3 m3/s) and No. 4 (5.9 m3/s) respectively. In view of the locations, closed conduits are required. Existing facilities are to be replaced.
Eastern Zone: S ubcatchmen t S ys tern Drainage Area Recipient
Nos. 5,6,7,8 and 9 approx. 3 10 ha Habib Nallah
Dense development with narrow streets in Shaldara, Quaidabad, Tel Gom and Marriabad allows only small subsystems. Drain design has to allow for run-off from the Murdar f i l l slopes. Predominantly covered drains are required.
\\MA-NWOl\VOL1\PROJEKTnConDat\BenPAKISTAN~33209\~n~ Repon\FR Vol l\voll -ch6.doc

Southern Zone. S ubc atc hmen t S ys tem Drainage Area Recipient
No. 1 with tributary drains approx. 600 ha Kasi Nallah
The service area includes Pashtunabad, Baluch Colony and Satellite Town till Baluch Bund and Kasi Nallahin the south. The best part of run-off from Pashtunabad is caught by the main drain of System No.1 in Islam Rd. in order to relieve drain No. 2 in Quarry Rd. where space is restricted System No. 1 discharges (26.6 m3/s design flow)into Kasi Nallah east of Jungle Bagh.. Kasi Nallah, regulated from the retention basin at Eastern Bypass till Sariab Rd., needs clearing/dredging from there to its confluence with Sariab Lora. Lower sections of main drain No. 1, west of Sariab Rd. are constructed as open channel; the big- ger branches upstream have to be predominantly buried drains due to dense development along the route.
Western Zone: a Subcatchment Systems Drainage Area approx. 850 ha Recipients Sariab Lora (10,11,12,13); Habib Nallah
Nos. 10, 11, 12, 13, 14, 15 and 16
(14,15,16)
The service area is roughly delineated by Habib Nallah and Hudda village in the north, Sarib Lora in the west, Kasi Nallah and Kdi Shaikhan in the south, and the railway and Sariab Rd. in the east. Development densities in the suburbs are lower than in the center, and due to the vicinity of recipients, subcatchment areas are small. Thus, a majority of drains can be constructed as open channels.
b) Secondary Drains Additional street-side micro drains are to be provided for collection of stormwater from the service areas - subject to the actual realization of the proposed Phase 1 program. They discharge via secondary drains into the main channels described above. Standard cross- sections of brick-lined channels have been adopted, with average clear dimensions width = 0.30 m, depth = 0.50 m. Total lengths of secondary drains and street-side gutters in the QMC service area are calculated at an average 420 &ha - including existing facilities.
0
Key parameters for the envisioned Phase 2 program are compiled in the following Table 6.3.
\\MA-NWOI \VOLl\PROJEKTE\ConDat\BerlPAKISTAN\233209\Find Report\FR Vol l\voll -ch6.dcc

Ouetta WSE - Final ReDort. Volume 1 Chapter 6 / Paoe 12
SERVICE MAIN DRAINS AREA tot. Length max. Flow Gradient BASE COST DRAIN m m'tsec Yo US$
Table 6.3 : DRAINAGE DEVELOPMENT PLAN - PHASE 2
REMARKS
I I
CENTRAL ZONE (580 ha) predom. covered
3 4
2,460 4.38 0.25 0.1 97 2,900 5.94 0.25 0.232
ISecondary I I Ciictnm I I I I
Secondary System
Subtotal I
252,000 1.890 2.839
WESTERN ZONE (850 ha) 1 I
predom. oDen
\\MA-NWO1\VOLl\PROJEKTE\ConDat\Ber\PAKlSTAN~33209\Fin~ ReporWR VoI l\voll-ch6.doc
Secondary System
Subtotal
TOTAL
357,000 2.678 4.21 4
11.806


6.3.4 Drainage and Flood Control in Peripheral Areas
Major urban development will continue along the three axes Eastern and Western By-pass and Sariab Roads in the south, and between ChamardAirport Road and Cantonment in the north. West of the city, further urban expansion is anticipated in the area of Brewery Rd. and at the Air Force compounds along Samungli Road. With the increase of built-up land, surface run-off will rise - at the expense of local groundwater recharge.
Comprehensive drainage and flood control, therefore, has to serve three functions:
0
0
conduct storm run-off from inhabited areas; prevent damages from mountain torrents; and enhance groundwater recharge from these rare discharges, in order to make up for reduced natural percolation due to the growing proportion of sealed sur- faces.
These aspects have to be considered in the detailed design of the required bunds, basins and drains. Consequently, the relevant outline program for Phase 3 of the Project envis- ages the following components:
a) Northern Development Area South-west of Chaman Road it is proposed to upgrade the existing nallah from Askari Park to the confluence with Sariab Lora. As a main drainage channel (No. 23)2, it will serve the entire area between Sarab Lordeaster Samungli Rd. and the Chaman railway line, including Kdi Ismail, Kili Almo and the settlements all along till Airport Road.
The urbanizing zones along and north-east of Chaman Road - from %lies Nawan, Kotwal and Muhamad Umar to the Kili Chashma road junction - will be served by two main drains (Nos. 24 & 25), that finally discharge into Hanna River. Eventual re-activation of the disused drain section from Kili Mili to Tarin Shahr is envisaged.
b) Western Area A main drain (No. 22), discharging into Sariab Lora, is required along Brewery Road to serve the developed areas up to Bolan Medical College and further till the sanatorium.
a
For Ghair Abad in the north and &rani south of Brewery Rd., as well as for the smaller developments along Western B y-pass, direct discharge from secondary drains into the nearby Sariab Lora is economical.
It is assumed that the military maintain their own drainage arrangements (into Nahar Nala and Sariab Lora respectively) for the Air Force complexes at Samungli.
A matter of most serious concern is the potential flooding from Karakhasa Nallah. With a catchment area of 26.1 km2, this stream (No. 26), entering the Quetta valley at Murree Brewery, may bring devastating discharge if hit by a storm travelling in NNE direction. Particular attention has to be paid to that possibility during the final engineering design.
Numbers refer to the drains as illustrated in Figure 6.1
\ \MA-NWOl\VOL1\PROJEKTRConDal\Be~PAKISTA~33209\~n~ Report\FR Vol l\voll -ch6.doc

c) Southern Development Area The areas between Sariab Lora and the Murdar foothills south of Kasi Nallah have experi- enced rapid development and are expected to urbanize further, with a concentration along the central axis Sariab Road, where also older establishments (e.g. Imgation Colony; WAPDA; Polytechnic Institute) and settlements (Kambarani; Kechi Beg; Sariab; etc.) are found. Systematic drainage is absent, and the situation is worsened - especially for the new developments along the Eastern By-pass - by rare but quite severe flooding from the Murdar nallahs.
The following main drainage systems have been projected for this area:
0 No. 18 Takhtani Canal to receive effluents from approx. 820 ha drainage area3 plus mountain run-off from some 9.81 km2 catchment of Takhtani Nallah and (the diverted) Shal Dara stream;
Kngi Canal, with 615 ha drainage area and 13.53 km2 external catchment of Hingi Nallah;
Rungi Canal, with 450 ha drainage area and 6.15 km2 external catchment of Rungi and Khakhuri Nallahs; and
Duni Canal, with approx. 410 ha drainage area and about 3.75 km2 external catchment of Duni Nallah.
0 No. 19
0 No. 20
0 No. 21
Proper function of these main drains needs the combined effects of flood-controlling delay action dams on each of the tributary nallahs; suitable self-cleaning contour channels to percolate slowly released discharges from the retention basin; and an appropriate secon- dary system. The channel itself is designed to accommodate base flow and surplus over- topping floods from the dam, and the stormwater run-off from the actual drainage area. Low design velocities in the unlined channel, eventually checked by gabion ground sills, enhance groundwater recharge, but provide also a safety margin for floods that are higher and run faster than anticipated.
Implementation of the proposed site-specific systems has to be preceded by an in-depth study of precipitation and probable flood discharges from Murdar nallahs, regulation of the further development in the planning area, and final engineering design with great em- phasis on the hydraulic performance of all components including assessment of the local percolation parameters.
@
Overall, Phase 3 involves the construction of approx. 51 km of primary drains and canals; 5.3 km of major rehabilitation work in the Chaman Nallah; 7 flood retaining dams and ap- pertaining spreading channels; and eventually up to 900 km of secondary and micro drains. Costs depend largely on the final design of facilities; orders of magnitude are:
main drains 5.100 mio. US$ dams and structures 15.000 mio. US$ spreading channels 3.000 mio. US$ secondary system 6.750 mio. US$
TOTAL 29.850 mio. US$
counting areas along and west of Eastern By-pass, excluding direct catchment of Sariab b r a .
\\MA-NWO1\VOL1\PROJEKTE\ConDat\BeAPAKISTAM233209\Final Report\FR Vol l\voll -chG.dm

Ouetta WSE - Final Reuort, Volume 1 Chapter 6/Paoe 16
6.3.5 Implementation Requirements
Phase 1 of the Project is proposed to be carried out under Quetta Municipal Council (QMC) as the Implementing Agency. Work has to be coordinated by the Project Manage- ment Unit (PMU), which will also provide advisory services on technical and contractual issues.
The scheduling of implementation is based on the assumption that until December 2000
QMC has, from own resources, seconded suitably qualified staff to plan, tender and supervise the rehabilitation work and procurement of equipment, and to continue with the maintenance of the drainage system on a regular routine ba- sis; PMU and relevant advisory services are available; and loan and relevant local funding are ready for disbursement.
The envisioned timing of implementation is illustrated Figure 13.1 below.
Implementation of the Phase 2 program is not seen as a top priority, once systematic reha- bilitation of existing assets is well under way. However, should this option be taken up at a later stage, a construction period of min. 5 years has to be envisaged. Implementation is tentatively programmed from 2005 till 2010 in the detailed schedule of the Sector Report.
Likewise, the proposed Phase 3 program - with the eventual exception of the proposed schemes along Caman Road and western Brewery Road - does not have the high priority for immediate implementation. Concrete development plans for the areas concerned are yet to be made, the proposed alignments of main canals follow existing waterways, and the present natural condition of these watercourses and their inundation zones promotes percolatiordgroundwater recharge to a certain extent. If decisions are made to go ahead with the Phase 3 activities, then it is recommended to begin with the Brewery and Charnan Rd. drains and simultaneously start with the flood controlhecharge component, viz. reten- tion dams and spreading channels. The tentative timing of engineering and eventual con- struction is illustrated in the detailed implementation schedule shown in the Sector Report.
H:\ConDal\BeAPAKISTANQ33209Final Report\FR Vol l \vo l l -ch6.dw

Ouetta WSE - Final Reoon. Volume 1 Chaoter 6 I Paoe 17
6.4 Project Measures of Phase 1 (ADB Project)
The package proposed for Bank financing is embedded in Phase 1 of the presented com- prehensive scenario that is required for a sustainable development of drainage and flood control in the Quetta service area. Associated detailed planning and implementation ac- tivities are expected to be extended in the subsequent Phases 2 & 3 under different funding arrangements. However, improved arrangements for administration, operation and mainte- nance have to be made during Phase 1, so that future investments will be protected.
In accordance with the descriptions set forth above, the program will include the compo- nent:
DF/P/3 12 Supply of Machinery and Equipment for the Quetta Drainage Maintenance and Rehabilitation Program Implementation: January 2002 - June 2005
0 Base cost US$ 614,200.-
The initial cleaning and rehabilitation by contractor has been dropped as not eligible for Bank financing, and therefore must be carried out under another funding arrangement.
All components and quantities of the overall long-term program are listed in the summary cost estimates set forth in the following Chapter 613. The Project Implementation Sched- ule is shown in Figure 13.1.
H:\ConDat\BeAPAKISTA33209\Final Repon\FR VoI l\voll -ch&doc

6.5 Cost Estimate of Phase 1 (ADB Project)
CODE DESCRIPTION
roposed for implementation)
Machinery and Equipment
Net Investment Cost
Detailed cost estimates are compiled in the Sector Report, Volume 2.2 of this Final Re- port. A summary of implementation costs for the program is given in the following Table 6.4.
COST US$
61 4,200
61 4,200
Table 6.4 : SUMMARY OF IMPLEMENTATION COST
\\MA-NWO1 \ V O L ~ \ P R O J E K T E \ C ~ ~ D ~ ~ \ B ~ ~ P A K I S T A N \ ~ ~ ~ Z O ~ F I ~ ~ ~ Report\FR Vol l\voll -ch6.dm

7. SECTOR PROGRAM : SOLID WASTE DISPOSAL

Ouetta WSE - Final Reoort. Volume 1 ChaDter 7 lPaoe 1
7. SECTOR PROGRAM - SOLID WASTE DISPOSAL
Solid waste disposal is not particularly mentioned in the Terms of Reference for this Proj- ect Preparation Technical Assistance. However, the consultants found it necessary to in- clude this component in both, the institutional and technical considerations, as proper solid waste collection and disposal is of importance to the functioning of stormwater drainage and wastewater disposal systems, and the protection of groundwater quality. In Quetta, there is a need for improvement.
The situation has been studied earlier', but only a few of the proposals made in the rele- vant reporting were implemented, and less are actually operated.
This Chapter and the more detailed Sector Report update previous findings, and delineate a project for eventual Bank financing, which is conducive to the overall goal of the project - sustainable water supply and environmental improvement in the Quetta valley. 0
7.1 Present Situation
7.1.1 General
The present solid waste disposal system of Quetta City is operated and maintained by the Quetta Municipal Corporation (QMC). The activities include collection and transport of city solid waste to a central dump site located off the Eastern By-pass, about 10 km from the city center at the foot of Murdar J3lls.
There is no arrangement for systematic collection and disposal of solid waste in the area outside the municipal and cantonment boundaries. People dump refuse wherever conven- ient and occasionally bum it on site. Regular house-to-house collection is neither practiced in these areas nor in the city. 0 Overall solid waste disposal of Quetta City is unsatisfactory and is a major cause of poor environmental conditions and constitutes a threatening hazard to the population and the groundwater.
The study on solid waste management carried out for the QMC area in 1996, suggests the project components and activities listed hereunder. Basic planning parameters and as- sumptions of the study are further discussed in Chapter 2 above.
- Provision of steel containers for collection of solid waste in the city area; - provision of compactors for congested city areas; - replacement of some masonry garbage bins not suitably located or constructed,
and repair of others; provision of container trucks for transport of solid waste to central dump site; -
Solid Waste System for Quetta Municipal Corporation, Environment Systems & Engineering (Pvt.) I
Ltd., I996
\\MA-NWO1\VOLl\PROJEKTRConDa~\BenPAKISTAN~33209~in~ Report\FR Vol l \voll -ch7.doc

Ouetta WSE - Final Reoort. Volume 1 ChaDter 7 / Page 2
- construction of proper sanitary land fill at the central dump site with necessary operating and monitoring arrangements;
- improvement of workshop facilities for repair and maintenance of vehicles and equipment; and
- improvement of system management.
Subsequently, a number of containers, trucks and tools had been procured to supplement and partly replace old equipment. However, about 40% of the new gear are yet to be put into operation; compactors are not available; and the sanitary landfill has not been con- struc ted.
Management and operation of waste collection, transport and disposal are not adequate and the entire system needs thorough review and re-organization.
Figure 7.1 below gives an overall view of the present QMC service area and waste dis- posal site. a . 7.1.2 Collection and Transport
Private citizens and commercial/residential establishments are required to collect their own domestic and/or industrial solid waste and bring it to the nearest garbage bin or steel container provided by QMC for this purpose in different parts of the city. Available facili- ties are as under:
0
0
Approx. 100 Nos. masonry garbage bins of different capacities varying from about 1.00 m3 to 2.50 m3, constructed by QMC in the service area; approx. 125 steel containers of capacity about 3.00 m3 have been deployed by QMC in different parts of the city - out of a total of 208 presently available.
QMC maintains a fleet of 20 dumper trucks for transport of garbage from garbage bins to the central dump site. Four helpers are provided with each vehicle for loading the garbage. One dumper truck serves about 6 to 10 garbage bins per day depending upon the distance of bins from the central dump site. For areas with high waste production, QMC has two mechanical loaders.
0
For transport of garbage containers, QMC is presently operating 22 arm roll container trucks - out of total of 37 trucks provided - to collect the full containers from different parts of the city, and unload them at the central dumping site. Several trips are made daily by each vehicle, depending on distances.
7.1.3 Final Disposal
QMC have acquired a plot of 27.7 ha about 1.5 km up from the new Tameer e Nau school (under construction), some 5 km from the Kasi Nallah flood retention basin along Eastern By-pass. However, the proposed sanitary landfill has not been constructed, and open dumping is practiced in a large area around the site, creating the usual problems: odour, air pollution, flies, vermin, groundwater pollution and general environmental degradation.
\ \ M A - N W O 1 \ V O L l \ P R O J E K T ~ C o n D a t \ B e A P A K l S T A Report\FR Val l\voll -ch7.doc

Ouetta WSE - Final Report, Volume 1 Chauter 7 I Pace 3
Human scavengers - most of them children - pick out recyclable matter. Some organic 0
matter is collected for compost. Vultures compete for the offals. Many of the individual heaps from each truckload of garbage contain hospital waste.
7.1.4 Management and Operation
The whole system of city sanitation comprising of collection, transport and disposal of solid waste, street sweeping and cleaning of road side drains is maintained by QMC through its Health and Sanitation Section. The following numbers of staff are engaged:
0 Sanitation Officer 1 No. 0 Chief Sanitary Inspector 2 Nos. 0 Sanitary Inspectors 21 Nos. 0 Sanitary Supervisors 34 Nos. 0 Sweepers / Laborers 964 Nos. 0 Drivers for dumpers and 44 Nos. 0 container trucks
Major equipment for waste collection and transport includes:
0 Masonry refuse bins 100 Nos. (most need rehabilitation) 0 Steel containers (3 m3> 208 Nos. (125 deployed)
Annroll container trucks 37 Nos. ( 22 deployed) 0 Dumper trucks (7 m3) 20 Nos. (operating)
It is understood that QMC is presently unable to deploy the full number of available steel containers and m o l l container trucks due to financial constraints.
7.1.5 Problem Analysis
'biverage waste production has been assessed in the a/m study at 0.65 kg/c,d. At the densi- ties at origin, ranging from 130 kg/m3 (domestic) to 250 kg/m3 (institutions), and given quantitative distribution, this corresponds with a specific volume of about 2.75 l/c,d - a value determined also in comparable other cities. With a present population around 525,000 in the QMC area, the average daily waste production thus comes to 2,270 m3/d. There is no significant compaction of the waste at the collecting points.
a
Against that production figure stand the actually utilized collection and transport capaci- ties of:
Collection Points 100 garbage bins of av. 1.75 m3/d 125 steel containers of 3.00 m3/d
Total
175 m3/d 375 m3/d 550 m3/d
'~\MA-NWO1\VOL1\PROJEKT~ConDat\Be~AKISTAM233209\Final Reporl\FR Vol l\voll-ch7.doC

Quetta WSE - Final Reoon, Volume 1 ChaDter 7 / Paoe 4
Transport
-
20 dumpers of 7 m3 x 2 tripsld 125 containers of 3 m3
280 m3/d 375 m3/d
Total 655 m3/d
This indicates that - at best - around 30% of the potentially produced waste is presently collected and transported to the central dump site. Even with deductions for low-income areas, a surplus in the order of 1,000 m3/d finds its way into drains or other unsuitable lo- cations within the city, or is burnt on the spot.
Available manpower and equipment of QMC would be adequate to significantly improve the situation - with optimized management2. Additions and expansion of service area can thus be recommended only for a later stage when existing assets are fully utilized and effi- cient operational routines are firmly established.
In the context of water supply, a major threat is seen in the practice of wild rubbish dumping, concentrating at an important groundwater recharge area. Therefore, establish- inent of sanitary landfill as proposed is given first priority in the solid waste component of the present project.
0
a ’ compare Vol.S, in which a possible out-sourcing of activities is addressed.
\\MA-NWOl\VOLl\PROJEKTRConDat\BenPAKISTAN~33209\Fin~ Repor!\FR Vol l\voll-ch7.doc


Quetta WSE - Final Report, Volume 1 Chapter I I Page 6
7.1.6 Need for the Project 0
A major problem is seen in the indiscriminate dumping of unsorted refuse in an ill-defined location south of the city, in a groundwater recharge zone. The present report and ensuing project proposal therefore put an emphasis on the construction and continued operation of a sanitary landfill waste disposal site in that location, as a feasible first step improvement to bring Quetta’s solid waste disposal to an acceptable standard.
7.2 Planning Parameters and Assumptions
Potential average waste production has been assessed in the available study3 at 0.65 kg/c,d. At the densities at origin, ranging from 130 kg/m3 (domestic) to 250 kg/m3 (insti- tutions), and given quantitative distribution, this corresponds with a specific volume of about 2.75 l/c,d - a value determined also in comparable other cities. With a present population around 825,000 in the QMC area, the average daily waste production thus comes to 2,270 m3/d. At a compaction to approx. 1,000 kg/m3 at the proposed final dis- posal in a proper sanitary landfill, and a target collection rate of 70%, the daily quantity will come to about 240 m3/d.
7.3 Project Definition
7.3.1 General Implementation Arrangement
The analysis of present staffing and available collection and transport equipment revealed unused reserves with QMC, that have to be fully utilized and effectively managed through internal improvement. Consequently, the main target of the present project proposal for Bank financing is the implementation of final disposal facilities that meet the required minimum standards of environmental acceptability and groundwater protection. It is there- fore proposed to include the upgrading of the existing open dump site into a fully func- a tioning sanitary landfill.
At this site the ground is gravely and consists mainly of coarse-grained stones and dust. The groundwater table is reported to be some 90 m below ground level. From geological and hydrogeological points of view, (i) the proposed site does not have steep slopes and no rock and scree slides are expected; (ii) mud flows in the landfill area, underlain by Ghazij formation and Bostan clays, are not expected; (iii) erosion problems may occur due to rapid runoff and flush floods from the barren mountain flanks during the rare rain events, and a protecting bund is required; and (iv) due to the absence of groundwater in the imme- diate area of the disposal site the chance of land subsidence is not likely.
The envisaged implementation program provides for a staged proceeding, viz.:
Solid Waste System for Quetta Municipal Corporation, 1996
\\MA-NWO1\VOLl\PROJEKTRConDal\Ber\PAKISTANV332O3~inal Repon\FR VoI l\voll-ch7.doc

Stagel: Initial establishment of all basic facilities and transfer of present depos- its from wild dumps in the vicinity to the sanitary landfill site - by con-
- tractor.
Stage 2: Addition of cells according site development plan and actual require- ment in the course of regular plant operation routines - by QMC' per- sonnel. For that dual purpose, heavy equipment is to be provided.
This approach facilitates swift improvement of the present unacceptable conditions, gives QMC' adequate time to organize solid waste disposal management, and allows optimum use of expensive equipment.
7.3.2 Sustainability of Proposed Sanitary Landfill
The readily available land of 27.7 ha is envisaged for construction of disposal cells of 8 m capacity over a net area of 250,000 m2, resulting in a useful volume of 2,000,000 m3.
In a realistic scenario for the development of specific waste production, area coverage and collection rates, the following typical parameters have been worked out for the planning period:
Average waste production 2,300 Increase of collection rate from present 30
to an average of 70 Compaction of solid waste from origin 150
to final storage 1,000 Daily quantity at disposal site 240
88,000 Useful lifetime of plant (overall) 23
- 3 20
Annual quantity at disposal site
Deduct for present dumps to be transferred Planned storage volume good for up to
m3/d % % kg/m3
m'/d m3/yr years years years
kg/m3
The above tentative parameters present a low-progress scenario, and it is recommended to reserve additional land for eventual future development. However, the figures underline the overall feasibility of the proposed solution.
7.3.3 Design of Facilities
The preliminary design of the main components of the proposed sanitary landfill (Option 2 of the a/m Study) is detailed in the relevant Sector Report. It provides for:
Embankments and site protection; 0 stormwater drainage; 0 leachate collection and treatment;
orfollow-up organization I
\\MA-NWOl\VOLl\PROJEKTnConDat\Ba~PAKISTAN~33209~nal Report\FR Vol l\voll-ch7.dOc

sludge collection and treatment; groundwater pollution prevention; permeability protection; gas collection and removal; approach and internal roads; formation and management of cells; method of waste covering; site protection and fencing; weighing facilities; and operational buildings.
Preliminary layout and design of facilities are illustrated in the Annex.
7.3.4 Environmental Impact
The environmental impact assessment carried out in the scope of the present project (see Volume 3, Section D) classifies the proposed measures in Category “C” according to ADB guidelines. If the plant is implemented and operated to the proposed standards, only minor adverse effects are to be expected.
However, it is put to note, that present conditions are hazardous to environment and groundwater, and thus the removal of existing adverse effects is immediately required.
7.4 Project Measures of Phase 1 (ADB Project)
Based on the staged proceeding addressed above, and on the urgent need for improvement, this sector component is proposed to be included in the Phase 1 overall implementation program under ADB loan. It comprises of two project packages - one for the engineering services and civil works (Stage l), to be contracted out, and the other one for the supply of machinery and equipment to support QMC’s Sanitation Section in establishing and main- taining effective operational routines.
a
7.4.1 Initial Establishment of Sanitary Landfill - SW/P/411
The proposed construction of a sanitary landfill site serves the objective of establishment of an environmentally acceptable central disposal facility for Quetta Municipality’s solid waste, and transfer of existing rubbish dumps to the controlled sanitary landfill.
The scope of work includes:
Construction and site development of 27.7 ha sanitary landfill, including access and internal roads; leachate control and treatment; initial gas collection system; offices, workshop and weigh bridge; and fencing, lighting and fire protection. Clearing of approx. 15 ha from open refuse dumps and transfer of materials to the adjacent new sanitary landfill.
\\MA-NWOl\VOLl\PROJEKTE\ConDat\BertPAKlSTAM2332OSFinal Report\FR Vol I\voll -ch7.doc

Ouetta WSE - Final Reuort. Volume 1 Chauter 7 I Page 9
The project is to be carried out by a contracting firm under QMC, with a view to future continuation of routine services by the QMC Sanitation Section. Engineering design and contract supervision is rendered by a specialized consulting firm and coordinated by the PMU in the scope of the overall Project.
Schedule of Work: - July 2001 - December 2003 (consulting services) - January 2002 - December 2003 (civil works)
7.4.2 Supply of Machinery and Equipment - SW/P/412
The envisaged supply of machinery and equipment for the Quetta solid waste disposal site includes the provision of heavy equipment, special machinery and tools to support opera- tion and expansion of the sanitary landfill by QMC Sanitary Section. Tendering is effected through QMCPMU.
Description:
Schedule of Supply:
- 1 No. complete weigh bridge with control and monitoring
- 1 No. excavator - 1 No. wheel loader - 1 No. compactor/dozer - - 1 set hand tools
facility
2 Nos. water sprinkler trucks
- January 2002 - December 2002 (equipment inc. tendering) - January 2003 - June 2003 (supply and installation of weigh bridge)
\\MA-NWOI \VOL1!PROJEKTE\ConDal\BeAPAKlSTAN\2332OQ\Final Report\FR Vol 1 \voll -ch7.dm

Quetta WSE - Final Reuort. Volume 1 Chapter 7IPaoe 10
Construction of Sanitary Landfill Solid Waste Disposal Site including Engineering Design and Construction Supervision
Civil Works
7.5 Cost Estimate of Phase 1 (ADB Project)
For the Phase 1 program proposed for implementation, a detailed cost breakdown is given in the Sector Report. An overall view of estimated costs for the proposed project is com- piled in Table 7.1 below.
1,161,850
1.161.850
Table 7.1 : SUMMARY OF IMPLEMENTATION COST
~~
Supply and Installation of Machinery and Equipment including Consulting Services
Supply
GRAND TOTAL
t- SW/P/411
856,000
856,000
2,017,850
SW/P/412 r COST US$
DESCRIPTION
\\MA-NWOl\VOLl\PROJEKTRConDa1\8er\PAKISTAN\233209\Fin~ Report\FR Vol l\voll -ch7.doc

8. INSTITUTIONAL DEVELOPMENT AND CAPACITY B U I LDI N G

mtta WSE - Final Reuort. Volume I Chapter 8/Paee 1
8. INSTITUTIONAL r DEVELOPMENT AND CAPACITY BUILDING
8.1 Introduction
8.11.1 Existing institutional setup in project area
The actual institutional arrangements, characterized by a multitude of institutions interfering in the sectors concerned, and with overlapping responsibilities and insufficient co-ordination - reflected by the absence of coherent water resource and environmental management policies and by the inadequate performance of the operating agencies - appear insufficient to effec- tively control and operate the water supply and sanitation infrastructure. Institutional strengthening, streamlining of responsibilities and capacity-building - on political as well as on operational level - are an important precondition to achieve rational water resource and environmental management, sustainable development and technically and financially viable operations of the water supply and sanitation infrastructure with a view to obtaining adequate ecc~noinic benefits from limited resources and the capital investment tied into the sectors.
8.1.2 Over view of the Main Water Related Departments
1. Balochistan Development Authority (BDA) was established to prepare & execute the de- velopment programmes to uplift the under-developed areas & mineral based industries. BDA installs tube-wells for various water-related departments.
2. BWASA was.established on 20th September 1985 to take over responsibility for execution of water supply & sewerage projects from the Quetta Development Authority. BWASA is responsible for providing safe drinking water & sanitation facilities to urban population of Quetta.
0
3. Quetta Municipal Corporation (QMC) was established in 1896 by upgrading Quetta Mu- nicipal Committee that was created in 1896. It is responsible to clean the open drains, ref- use disposal & health & sanitation.
4. Quetta Development Authority (QDA) was established in 1976 to prepare master plan, road & land development, town planing & water supply.
5. Public Health Engineering Department (PHED), having support from the World Bank, develops water supply schemes in rural areas and small towns. For domestic purposes, the PHED undertakes tubewell drilling and installation works in urban area and maintaining distribution network. In the rural areas, most water supply schemes are undertaken in col- laboration with the Local Government and Rural Development Department (LG&RDD). Presently PHED has launched 1407 water supply schemes in Balochistan, out of which 81
H:\ConDat\BeWAKISTAN\233209Find ReportWR V d l\voll -chB.dcc

a e t t a WSE - Final Reoort. Volume 1 Chauter 8IPage 2
schemes are in the Quetta District.
6. In 1994, Bureau of Water Resources (BWR) was established in the IPD with the Nether- lands Technical Assistance. The Bureau was entrusted with compiling the data and infor- mation in the Province in the water sector and to monitor the network of hydro- meteorological stations in the Province. Though a lot is yet to be done and accomplished by the Bureau, it is heartening to note that, since its establishment, the Bureau has done some good work in the collection, compilation and computerization of data. It is however handicapped due to non-availability of adequate number of trained professional staff in hydrological data collection and analysis techniques. Recently, the Bureau has been ad- ministratively placed under the P&D Department of GOB. The Bureau has also started publishing hydrological data of various rivers and streams in the Province.
7. On the Research and Development side, the PCRWR, a Federal Government organization has established, in 1988, a Water Resources Research Center (WRRC) in the Province. This Center has so far concentrated its activities on Karez improvement, data compilation and assessment, and high-efficiency imgation systems. The center organized few semi- nars and training courses on important topics related to the Province's water resources problems. This Center has the capacity to be developed into an excellent R & D institution in the Province, but is handicapped due to lack of qualified and trained staff and financial resources.
8. Quetta Cantonment Board (QCB) is a semi-autonomous body & it provides civic facilities to the Cantt residents. Major responsibilities of the boards are sanitation, removal of rub- bish, water supply, and road construction. It is presently managing 895 water supply con- nections.
9. The role of Donor Agencies in Water Development is tremendous. Balochistan has been the recipient of technical and financial assistance of a number of international donor agen- cies and governments for developing the water resources of the Province. These agencies include; the Asian Development Bank (ADB): the World Bank (WB): the Netherlands Government; the Kuwait Emirate; agencies of the UN; and the German Bank, KfW. Most of the efforts have been directed towards financing small irrigation schemes, command water management. Flood protection and income generation schemes for Afghan Refu- gees in water, forestry and rangeland resources also received financing from the donors. The effectiveness and impact of the various programmes, executed with donor assistance, on the provincial economy cannot be assessed because of lack of monitoring and evalua- tion mechanism.
a
H:\ConDat\BerU'AKISTAN\233209\Final ReportFR V d l\voll -chE.dcc

a e t t a WSE - Final ReDort. Volume 1 Chapter 8 / Page 3
8.1.3 Approach
With special regard to institutional issues, the existing situation in the water supply and sani- tation sectors in the project area is characterised by:
Limited water resources in the Quetta Valley Basin to satisfy the increasing water demand of the various user groups. Imperfect institutional framework to efficiently manage the limited water re- sources and the water supply and sanitation operations. Insufficient existing water supply and sanitation infrastructure. Absence of cost effective and economic use of existing water supply and waste water assets. Inadequate technical and financial operations of water supply and sanitation serv- ices and limited slulls and experience to adequately manage and operate future extension of the infrastructure. Lack of financial resources (as well development as operating budgets) due to in- sufficient budget allocation, inadequate financial management and performance and inadequate tanff policies. lncomplete enforcement of existing rules and regulations. Lack of continuity of professional management and accountability. Poor governance.
To ensure safe, adequate and most economic water supply and sanitation services to the in- creasing population in the project area, along with sound and efficient management of the limited water resources in the Quetta basin, supported by a competent and cost effective in- stitutional and legal framework and by professional water supply and sanitation operations, the main objectives of the present Institutional Development and Capacity Building part of the project can be summarised as follows:
To improve and secure long term sound, technically and financially sustainable, cost effective water supply and sanitation services to satisfy the needs for these services, to improve health and living conditions of the population and to strengthen the economic development potential in the project area through
t
Better management and rational use of the existing limited water resources (to avoid the needs for premature development of expensive surface water resources, e.g. dams). Encouragement of stringent water conservation by the various user groups. Improvement of institutional and legal conditions for sound sector development and infrastructure operations. Improvement of management of operations and performance to optimise use the of assets and the water supply and sanitation services. Strengthening of the financial basis of sector operations by improvement of finan- cial management and budgeting.
e
H:\Con[)at\BeAPAKISTANQ33209\Final ReportFR VoI l\voll -chE.doC

Chauter 8 I Page 4 a e t t a WSE - Final Reuort. Volume 1
Improvement of commercial and financial systems and operations on operational level towards more professional performance. Adequate water and sewerage tariff policies, harmonising the financial needs, the social requirements and the water demand management objectives.
However, it is evident, that the actual institutional arrangements, as well on upper regulatory as on operational level are insufficient to effectively implement, control and operate such strategies. Accordingly, the present Chapter on Institutional Development and Capacity Building is presented in 2 Parts, whereof
Part 1 deals with INSTITUTIONAL DEVELOPMENT ON REGULATORY LEVEL
Guided by the basic principles that (1) the institutional reforms to be recommended under the TOR should not create new, additional institutions, but gather existing institutional assets and manpower and (2) that the institutional resources management and responsibilities be sepa- rated from the service delivery function, this part mainly deals with:
Institutional Arrangements For Water Resources Management, Institutional Arrangements To Promote Water Conservation Through Building Codes, Institutional Arrangements For Solid Waste Management, Sanitation And Drain- age Infrastructure,
and
Part 2 deals with CAPACITY BUILDING ON OPERATIONAL LEVEL
With the main objective to develop BWASA towards a more autonomous, professionally per- forming and, in the long run, self-sustaining entity, this part addresses:
Reforms of BWASA, Commercialkustomer management, Accounting, Management Information System, Manpower development,
0 Implementation of Recommendations.
0
Note, that most of the elaboration’s of institutional issues have been completed before the po- litical changes in October 1999 and the change of governments on national and provincial level, with subsequent substantial reshuffling of administration/institutional framework and postings, and thus may require adjustment to the new situation, which is not provided for in the available project budget. The elaboration also suffered from the change of key decision makers and of BWASA’s MDs, and from the lack of continuity within the administration concerned.
H:\ConDat\BerPAKISTANN\233209iFinal ReporWR Vol l\voll -chB.UoC

Ouetta WSE - Final Reuort, Volume 1 Chapter 8 / Page 5
0
8.1.4 Proposed Institutional Set-up at upper level (Establishment of a Single Water Reg u 1 at or y Authority )
It has been recommended that by merging BWASA & PHED, like BIDA, an authority may be created as Public Health Engineering Authority (PHEA) in order to effectively manage the water resources at rural & urban levels.
It is proposed that the Balochistan Water Resources Management Agency (BWRMA) be es- tablished to coordinate the planning, evaluation and monitoring of plans for the integrated de- velopment of the land water and the underground resources. On the apex Balochistan Water Board (BWB) should be established to prepare, implement, and monitor the plans.
The Balochistan Water Resources Management Agency (BWRMA) would provide overall coordination between all the water-related departments. The Balochistan Water Resources Management Agency (BWRMA) may be established by strengthening the already existing Bureau of Water Resources (BWR). The proposed option is not to establish a new govern- ment body but to shift and re-assign functions and responsibilities from the existing agencies, streamlining the existing authonties and reducing duplications and overlapping mandates.
0
8.1.4.1 Balochistan Water Board (BWB)
Balochistan Water Board, as highest authority at Provincial level, will be fully autonomous (within the frame of the pertinent legislation) and solely liable for the water resources man- agement at Provincial level. It will be accountable only to the responsible upper legislative Government bodies. All competing function should be merged into the Balochistan Water Board to avoid duplication of responsibilities.
The main responsibilities and function of the Balochistan Water Board, would be more on policy and regulatory level, meeting at least quarterly on a regular basis and whenever re- quired, consisting of representatives of,
.
. Upper Government legislative bodies concerned with water resources management and development and All important stakeholders (or groups of stakeholders) and users of the limited ground- water resources in the Quetta Basin.
It may include:
Establish (in accordance with the applicable legislation) general policies for water re- sources management, development and conservation. Establish technical and financial rules and regulation for the most economic use of water resources.
. H:\ConDat\Ber\PAKlSTAW33209Final ReportFR Vol l\vo11 -chB.doc

Ouetta WSE - Final Reoort. Volume I ChaDter 8 I Pane 6
9
.
. Establish technical norms and design criteria for installations to exploit the water re- sources (such as e.g. the minimum distance between tube wells). Liaison with upper level government bodies, with provincial water authorities and other parties concerned with the district water resources management and water use. Assume the supervising and controlling authority for above matter.
The mandate of the Balochistan Water Board may be as under:
1. The Board will act as a supervisory and controlling authority of the Balochistan Water Resources Management Agency.
' 2. Forming rules and regulations for use of ground water resources and administering the water rights of various departments.
3. To work as appellate authority against the decision of the Balochistan Water Resources Management Agency charged with the administration of water rights.
0
4. The Board will also be authorized to formulate policies and regulations for the proper use of ground water in the province. It wi l l also lay down distance between wells/ springs and tube wells.
5. The Board shall have the authority to call for the record of any case relating to the water rights or other pending cases with Balochistan Water Resource Management Agency.
8.1.4.2 Balochistan Water Resources Management Agency (BWRMA)
The BWRMA will be the executing agency for implementing and executing the policies and rules of the Provincial Water Board. This agency will report to the Balochistan Water Board (BWB), which will be established by reconstituting the existing Provincial Water Board. The BWB at the upper level will be vested with the responsibility to formulate various policies and rules relating to water resources management, conservation, and development of new re- sources, while the Agency at the execution level will be vested with functions for implemen- tation of such policies and rules, issuance of water licenses, monitoring resources, etc. Under this scheme, only the Water Board at the upper level has the power to allocate water rights to user in both the public and private sectors. No existing water users / agencies will be allowed to develop water resources for themselves without the permission of the BWB.
a
The Balochistan Water Resource Management Agency may be an upgraded merger of the existing Bureau of Water Resources, and the District Water Committee and absorbing also all other institutions or parts thereof. The following units of the Irrigation and Power/ PHED and other departments are working for drilling and groundwater development activities in the province of Balochistan:
H:\ConDat\Ber\PAKISTAN\2332OS\Final Repon\FR Vol l\voll-ch8.doc

Ouetta WSE - Final Report. Volume 1 Chauter 8 I Paee 7
Electrical & Mechanical Division Electrical & Mechanical Division PHED Hydro geology, Water Division BWASA Hydro geology Directorate BDA
I&P Department
BWRMA may have district offices to manage water resources at district level. Presently there is no such organized department and the people in the district are extracting and using water without any proper control over the aquifer. The existing district water committee failed to control the over use of water resources in the district. In future the establishment of BWRMA at district level will help to control and monitor the water resources. Till the establishment of BWRMA at district level, the existing district water committees may be strengthened to man- age the water resources in the district.
0 8.2 Institutional Development
8.2.1 Institutional Arrangements for
on Regulatory Level
Water Resources Management
This part of the report emphasises particularly on the institutional development and capacity building in the project area i.e. Quetta valley basin. Regarding institutional aspects of the study the main emphasis was to find out responsibilities, functions and linkages among all institutions concerned with water resources management and development, management and operation of water supply, drainage and sewerage infrastructure on political and operational level in Quetta basin. Another objective was to review the legal framework and regulations governing water resources management and conservation and the development, management and operation of water supply, drainage and sewerage infrastructure. The study also attempted to identify the needs for reforms and institutional integration, and to develop recommenda- tions for improvements, streamlining of responsibilities and capacity building programs.
The qualitative information obtained through in-depth interviews helped to understand the institutional framework and management of the concerned departments. In addition to the secondary data, the researcher also prepared the inventories of the most relevant departments with information on the legal status, mandate, major achievements, existing institutional framework and strength and weaknesses of the department was also prepared. The purpose was to analyse the water related departments / sectors in order to recommend a single regula- tory authority for water resources management in Quetta valley basin. The existing legislation pertained to water sectors was also examined. In this respect the following Federal and Pro- vincial legal frameworks / Government Acts dealing with water activities were analysed.
@
Balochistan Development Authority Act, 1974 Balochistan Ground Water Rights Administration Ordinance 1978 Quetta Development Authority Ordinance 1978
0
0
H:\ConDat\BeAPAKISTA33209~nal RepomFR Vol l\voll -chS.doc

Ouetta WSE - Final ReDort. Volume 1 Chaoter 8/Paee 8
0
0
0
Balochistan Local Government Ordinance 1980 Public Health Engineering Department Act 1987 Balochistan Water and Sanitation Authority Act 1989 Pakistan Environmental Protection Act 1997 Balochistan Irrigation and Drainage Authority Act 1998
Quantitative and Qualitative Analysis of the above mentioned legislation was done and its re- sults have been incorporated in the interim report.
The study indicated that there are various government institutions responsible for providing services including portable water supply, water resources management and development, management and operation of water supply, drainage and sewerage infrastructure in Quetta valley basin. It includes Federal Government, Provincial Government and Local Government agencies, each having its own (but often overlapping and duplicating) mandates, each respon- sible to it’s own hierarchy, with an evident lack of concentration of responsibilities and coor- dination of action. Management appears fragmented and inefficient in terms of planning, im- plementation, operation and maintenance, with federal, provincial and local government agencies having unclear and overlapping roles and responsibilities. On operational level of the water and sanitation infrastructure and services, a certain lack of technical and financial man- agement capacities and of sound operating shlls and experience are evident as well.
II)
There is an absence of coherent water resource management policies. There is also inadequate and imperfect institutional framework to efficiently manage the limited water resources and the water supply and sanitation operations. Absence of cost effective and economic use of existing water supply and wastewater assets is another major impediment in the performance of the operating agencies. Insufficient technical and financial operations of water supply and sanitation services and limited skills and experience to adequately manage and operate future extension of the infrastructure is another barrier. Lack of library and laboratory facilities and excess to computerised infrastructure hinders the performance of the agencies.
Institutional strengthening, streamlining of responsibilities and capacity building - on politi- cal as well as on operational level - are an important precondition to achieve rational water resource and environmental management, sustainable development and technically and finan- cially viable operations of the water supply and sanitation infrastructure. For more efficient and cost-effective water supply and sanitation services on a high standard, a single institu- tional regulatory arrangement is required. To further strengthen the commercial and financial management and operation capacities towards more professional procedures and performance the development of the water resources in Quetta valley basin will be necessary. The function of water resources management and allocation be separated from service delivery function for institutional reforms at upper level.
a
H:\ConDat\BeAPAKISTAN\233209~nal ReportFR Vol l\voll -chE.doc

ChaDter 8/Paee 9 Ouetta WSE - Final ReDort. Volume I
Recommendations
To avoid conflict of interest, the institutional functions for water resources management and allocation of water rights should be separated from the service delivery function. For exam- ple; if the Irrigation Department (as has been discussed) would be vested with the authority and responsibility to manage water resources and to allocate water rights to other users of the limited ground water resources, e.g. to BWASA for domestic supply services, this may result ih conflicting decisions of competing users of the limited ground water resources in the Quetta basin. Therefore, it is recommended that all competing users of the same resource are represented in one institutional body, the Balochistan Water Board, responsible for the re- sources management and allocation of water rights and to represent the interests of their re- spective institutions and customers. For this purpose, the establishment of a single water regulatory agency, Balochistan Water Resources Management Agency (BWRMA) is recom- mended. This agency will be established by Strengthening the already existing Bureau of Water Resources. The capacity of BWR in this regard has been assessed and restructuring of staff has been recommended.
0
Balochistan Water Board (BWB) may be established at upper level by reconstituting the existing provincial water board to formulate policies and rules for water resources manage- ment, conservation and development of new resources. Balochistan Water Resources Man- agement Agency (BWRMA) may be established by legally upgrading and strengthening Bu- reau of Water Resources to work as an executing agency of the BWB. At later stage, when required, BWRMA may be established at district level to manage and control the water re- sources. The existing District Water Committee may be reconstituted to allocate more power for the implementation of policies and rules of the BWB at district level.
The basic concept provides for the representatives of the important stakeholders, as well on the level of the users of the common water resources as of the upper administrative bodies to form a WATER BOARD, independent from individual users of the resources, responsible es-
0 pecially for:
0
0
Monitoring and research, 0
e
Political and strategic planning of water resources management, Technical and financial rules for the economic use of the limited resources,
Development of new water resources, Liaison with other federal and provincial water authorities.
An important feature of the recommended Institution for water resources management is the right to levy charges for water licenses and rights and to charge water abstraction fees. These charges will constitute the operating budget of the institution and provide the opportunity to accumulate funds for counterpart financing of water resources development projects.
Under the Water Board, a WATER RESOURCES AGENCY is anticipated to act as the Board's executing agency, organised in three functional departments:
H:\ConDat\BerV'AKISTA33209\Final Reporl\FR Vol l\voll -chE.doc

a e t t a WSE - Final ReDort. Volume 1 Chapter 8/Paee 10
0 WATER RESOURCES, with the main tasks of monitoring, research, strategic planning, project development and technical specifications.
0 WATER RIGHTS AND LICENCES, with the main tasks of technical approvals, con- tracts, legal affairs, water conservation and controlling.
0 ADMINISTRATION AND FINANCE, with the main tasks of personnel, revenues, fi- nance, general affairs.
Discussions with the Project Steering Committee during and after the workshop for presenting above concept for institutional reforms, suggest that the proposed institutional restructuring for controlling water resources in the Quetta Valley Basin is basically acceptable to the authorities concerned and may fit, subject to approval by higher authorities, into the existing institutional structure.
The Administrative Work Concept and the proposed Institutional Framework for Water Re- source Management are illustrated in Figures 8.1 and 8.2 below.
'
H:\ConDatWeAPAKISTAN\233209Final ReDOrtWR VoI l\vo11 -chS.doc

a Quetta WSE - Final Report, Volume I Chapter 8 / Page 1 I
Figure 8.1 : ADMlNlSTRATIVE WORK CONCEPT FOR WATER RESOURCES MANAGEMENT
ARMY BWASA PHED IRRIGATION AGRICULTURE
' G O V E R N M E N T
PRIV. USERS OTHERS
I I
I v
B A L O C H I S T A N W A T E R B O A R D 1
I EXECUTIVE AGENCY OF THE DISTRICT WATER BOARD I I Q U E T T A W A T E R R E S O U R C E S A G E N C Y I
I I 1
(1) Ground water resources Includes also those developed in future for the water supply in the Quetta Valley (2) Ground water resources may be extended to future surface water resources developed for the water supply in the Quetta Valley

e 0 Ouetta WSE - Final Reoort. Volunie 1 CliaDter 8 / Paoe 12
Figure 8.2 : INSTITUTIONAL FRAMEWORK FOR WATER RESOURCES MANAGEMENT
B A L O C H I S T A N W A T E R B O A R D
EXTERNAL AUDIT 8 CONTROLLING
~~
IQUETTA W A T E R R E S O U R C E S A G E N C Y ~
D IR E C T O R I G E N E R A L
H I N T E R N A L A U D I T &
C O N T R O L L I N G I P
I A D M IN I S T R A T I O N W A T E R W A T E R
R E S O U R C E S R I G H T S & & F I N A N C E
L I C E N C E S
I I
I
S T R A T E G I C P L A N N I N G
P R O J . D E V E L O P M E N T
S P E C l F l C A T l O N S I
T E C H . A P P R O V A L S
C O N T R A C T S
L E G A L A F F A t R S
W A T E R C O N S E R V A T I O N
1 1 1
C O N T R O L L l N G 1
P E R S O N N E L
R E V E N U E S
F I N A N C E
G E N E R A L
H:\C~Oat\Bar\PAKLSTAN\23320mFinal RepotIWR V d l\vollch8.doc
~

Ooetta WSE - Final Reoort, Volume I Chapter 8/Paee 13
8.2.2 Institutional Arrangements to Promote Water Conservation through Building Codes
At present Quetta Municipal Corporation (QMC), Cantonment Board Quetta (CBQ) and Quetta Development Authority (QDA) are dealing with implementation and control of build- ing codes in Quetta city. These agencies are responsible for the construction and control of buildings in their respective areas, without any co-ordination at any level. Each of the agen- cies is following a different building code, with their own personal for execution. The agen- cies involved have their own, independent from each other, building construction and control sections. The major features of these agencies are inventoried to provide information on legal status, financial aspects and organisational structure. The information about building con- struction and control sections include details about personnel, equipment, general perform-
@ ance and so on.
A comparative analysis of the building codes and their respective executing agencies helped to identify main problems. The major problems identified include, lack of co-ordination, in- sufficient enforcement and weak control of building codes. The weak enforcement and im- plementation of the building codes are causing haphazard urban development in the city. The widely spread encroachments in the city confirm the non-enforcement of building codes. None of the building codes has incorporated water conservation measures in their architec- tural designs.
The existing situation calls for an immediate institutional rearrangement for the effective im- plementation of building codes as well as to make relevant modifications in contents of building codes to promote water conservation by incorporating them into architectural de- signs. After analysing the building codes, it is recommended that there should be one unani- mously arrived at building code for the entire city and the prevailing contingencies like short- age of water, pollution and environmental situation of the city should be paid special atten- tion. 0 Recommendations:
There is a felt need to stream line the activities of the executing agencies, i.e., QMC, CBQ and QDA. To improve the enforcement of building codes and to create and strengthen inter linkage and co-ordination among agencies responsible for urban development, an Urban De- velopment Board is recommended. The recommended board will also control, co-ordinate and liaison the activities of executing agencies. The institutional framework, functions and com- position of the Board are discussed in detail.
The recommendations to develop a water sensitive building code, incorporating water conser- vation strategies in all architectural designs, have been made an integral part of the paper.
H\ConDat\Be~PAKISTANU33209~inai Report\FR Vol l\voll -chB.doC

Ouetta WSE - Final Reuort. Volume 1 Chapter 8IPage 14
8.2.3 Institutional Arrangements for Sewerage Management
About 0.8 million people in Quetta city are without proper sewerage and drainage facilities due to insufficient and inadequate arrangements of sewerage. A large number of population, particularly the residents of suburbs are using rudimentary and unhygienic methods of sewer- age and drainage. For the population of 1.2 million, only 50 km of sewer pipeline is con- structed, whereas, only 1300 households are using the facility. This network is concentrated only in Centre of the city. Rest of the population is discharging their wastewater and sewage either into open drains or into nearby natural nallahs.
The Balochistan Water and Sewerage Authority (BWASA) is responsible for the construction, operation and maintenance of sewerage network in municipal area of the city. To accomplish with the responsibility, Quetta Sewerage and Sanitation Project (QSSP) of BWASA is making efforts to provide facility of sewerage to the citizens of Quetta city. The QSSP is not only constructing the network, but through its social mobilisation teams, it is facilitating and en- couraging the people to get connected with the sewerage network. The hygiene education is also imparted by the QSSP at community level. Moreover, a sewerage regulation has been devised to regulate the sewerage actjvities, but is being hardly enforced.
@
The main problems of sewerage, both at operational and functional levels, include: lack of awareness, insufficient sewerage network, relatively high costs of connection, unplanned de- velopments in the city, illegal connections, absence of sewerage tariff, lack of resources, in- adequate equipment and limited involvement of CBOs/NGOs.
Recommendations:
Considering the insufficient network of sewerage, it is extremely important to expand the sewerage network to all areas of the city. A regular interplay between the solid waste and sewerage suggests that these activities should be the responsibility of one single authority, i.e., BWASA. To overcome the problem of connection costs, a micro credit program should be introduced to increase the number of beneficiaries of the sewerage network. The existing network of open drains should be improved by widening the size and covering them properly. The involvement of private sector can help to overcome the sewerage problems particularly in areas where sewerage system do not exist.
e
The sewerage problem needs to be addressed at two levels; at collection and disposal level. The collection mechanism should be expanded and maximum number of houses should be connected to it. The disposal system do not have permanent arrangements in the form of treatment plant which can help to use treated water for irrigation purposes and, consequently, to save a lot of fresh water presently used for this purpose.
H:\ConDat\Ber\PAKISTAN\233209iFinal Report\FR Vol l\voll -chS.doc

Ouetta WSE - Final Reoort. Volume 1 ChaDter 8 / Page 15
8.2.4 Institutional Arrangements for Solid Waste Management (SWM)
The solid waste management has, overtime, became one of the biggest problems of Quetta city. The population explosion, on one hand, and the insufficient means to provide necessary civic amenities, on the other have intensified the complexity of solid waste management. The existing arrangements for the collection and disposal of solid waste are not only insufficient and inadequate but also underused against their original potential. Only about 35% of the daily produced solid waste is removed. The remaining solid waste is causing a polluted and unhealthy atmosphere in the city.
The Health and Sanitation Department of the Quetta Municipal Corporation is responsible for the solid waste management in municipal area of the city. To carry out the responsibilities of solid waste collection and disposal from various areas of the city, a team of more than one thousand workers, working at different levels, is doing the job. A number of different types of vehicles is under use to assist the work. For the regulation of activities and responsibilities of all the stakeholders involved, a Prevention or Abatement of Nuisances Bye-laws also exists.
In spite of all these arrangements, the situation of solid waste management in the city is de- pressing. The heaps of garbage in almost every housing and commercial areas, dirty streets, filthy roads, dusty and smoky atmosphere of the city tell a failure story about solid waste management and sanitation.
The major issues identified with reference to solid waste management include the following; insufficient resources, inadequate/insufficient infrastructure for the collection of solid waste, under utilisation of manpower and machinery, poor enforcement of sanitation regulations, and, last but not the least, absence of recycling. The open and untreated dumping along with burning of solid waste at a large scale are causing deterioration in the quality of underground water and an increase in air pollution.
Recommendations:
It is recommended that one authority should handle sewerage and SWM. Out souring of some parts of the system can help to increase the quality of work. The primary collection, transpor- tation and awareness raising, e.g., can be handed over to private sector. The newly adopted concept of micro enterprises for SWM should also be duly considered and recognised. It is assumed that delegation of some responsibilities to the private sector can help to improve the situation. There is an urgent need to improve the existing arrangements for solid waste collec- tion, disposal and treatment. Not only more manpower, equipment and machinery is required, but dumping and recycling aspects should also be treated on priority.
H:\ConDat\Ber\PAKISTAN\233209Final Report\FR Vol l\voll -chE.doc

Ouetta WSE - Final Reuort, Volume I Chauter 8/Pape 16 a
8.3 Capacity Building on Operational Level
8.3.1 Existing Situation of BWASA & QMC
A. BWASA
The existing BWASA is inefficient and less cost-effective. The main reasons for this include overstaffing, ineffective financial system. Presently, the number of BWASA employees is 1211. BWASA has about 44,640 water connections. The ration of staff per thousand connec- tions is about 27. If this ratio is compared with LWASA (YlOOO), Indonesia’s ratio (4/1000), KWSB (8/1000), RWASA (1 1/1000), Malaysia (l/lOOO), Maldives (8/1000), the staff ratio of BWASA looks to be fairly on higher side. There is an immediate need to bring the number of staff/l000 connections in BWASA to a lower figure. The other factors like de-motivation, lack of training, complicated procedures and functions, low revenue collection efficiency, ar- rears recovery, non-fulfillment of audit requirement further aggreviate the situation.
The following deficiencies have been found in the billing / collection system of BWASA:
a Illegal connections, a Outstanding arrears, 0
a Disconnection policy, a , Improper categorization of consumers,
0
Low efficiency in revenue collection,
. a Limitation of computerized billing system, Limitations of existing accounting system.
The following recommendations have been made to improve the operational efficiency of BWASA:
Adoption of Double entry accounting system, Setting up a Customer Service Center, Audit of accounts by Chartered auditors, Updating of consumers’ data base, Revision of tariff structure, Identification of illegal connections, Integrated MIS, Fee charging from private tube wells
H:\ConDal\BeAPAKISTAM233209\Final Repoti\FR Vol l\voll -chB.doc

Ourtta WSE - Final Reuort, Volume 1 Chauter 8 /Page 17
I . Administration 2. Finance
B. Quetta Municipal Corporation
73 249
It came into existence as Municipal Committee in 1896. The status of old Municipal Com- mittee was upgraded to that of Municipal Corporation in the year 198 1. The area of Municipal Corporation is 32 Sq. &lo Meters. Like other sister cities of the country, Quetta Municipal Corporation is required to perform compulsory as well as optional functions within the Mu- nicipal limits as laid down in the Balochistan Local Government Ordinance. 1980. QMC is an elected local government body having an elected Mayor and Councilors with their term of office as 4 years. The municipal limits have been extended recently to include areas south of Satellite Town and those lying between Sariab Road and Sariab Lora in the west with Icllli Kambarani in the south-west and the Sabzal RoadSamungali Road Junction in the north- west.
3. Health 4. Education 5. Public Safetv
@ i. Institutional Strength
1212 45 72
The existing institutional strength is as under: -
6. Social Welfare
1 Department 1 ~ o . o f ~ t a f f
06
Works 8. EnPineerinP 175 9. Mosques Total
15 1867
ii. Financial Resources
The QMC is responsible for the facilitation and provision of basic civic services within its area of jurisdiction as defined in the said Ordinance. To meet the required expenses, QMC generates its own resources through levying and collecting various taxedfees and develops its own development plans within the municipal limits. In addition to its own resources, the QMC gets financial assistance from provincial and federal governments for the execution of various development projects. Very recently, the Federal Government has abolished the main source of QMC’s income, i.e., the recovery of Octroi. Nevertheless, the Federal Government has committed to pay the amount on this account.
H:\ConDat\BeAPAKISTANN\233209\Final ReportFR Vol l\voll -chB.doc

Ouetta WSE - Final Report. Volume 1 ChaDter 8 I Page 18
The budget estimates for the year 1997/98 at a glance is given below:
(In Million) 1. Total Income 225.338 2. Total Expenditure:- 249.654
a) Non Development 19 1.654 b) Development 57.800
iii. Legal Framework
The Balochistan Local Government Ordinance 1980 which provides the legal framework for QMC has been discussed identifying the important sections for consideration. The Ordinance does not give QMC enough freedom, flexibility and powers to function as a responsible local government institution, and there is a tight control of provincial government and bureaucracy on its important policy and operational matters.
QMC has to get prior sanction of the government for enforcing various controls and bye-laws including its budget, permission to raise loans or propose taxes. The continuing rapid urbani- zation is imposing server strain on QMC which must be assured financial supports to meet the assigned goals. QMC has been provided as the successor to QDA whenever government de- cides to dissolve QDA. This enabling provision recognizes the permanence of QMC as an elected institution as against QDA.
iv. Approval Committee for Maps
For the approval of new constructions, the QMC has established an Approval Committee comprising of Commissioner Quetta, Deputy Commissioner Quetta, Director LG&RDD, Mayor QMC, Municipal Commissioner and Municipal Engineer. The committee holds its meetings, as and when-required.
v. Building Construction and Control Section
The building codes of QMC were notified in 1937. The Engineering Department is responsi- ble for, along with others, the matters dealing with construction, including building code as well. The Municipal Engineer permits and controls the construction of private buildings within the limits of Quetta Municipality. For this purpose, a Buildings Construction and Con- trol Section works under the supervision of Municipal Engineer to implement the Building codes.
The total strength of Building Construction and Control Section is as follows:
Municipal Engineer (l), Chief Architect (l), Building Inspector (3), Draftsman (2), Clerk (2) and Tracer (1).
H:\ConDat\Ber\PAKISTAN\233209Final ReponFR Vol l\voll -chE.doc

Quetta WSE - Final Reuort. Volume 1 Chaoter 8 I Page 19
0
A total number of ten (10) people is supervising and inspecting the construction related mat- ters in municipal limits. The Municipal Engineer is provided with a vehicle whereas the Building Inspectors are using Motorcycles to carry out their duties. The staff is not provided with regular training and/or refresher courses.
8.3.2 Reforms of BWASA
In view of the requirements for more efficient and cost effective water supply and sanitation services on a high standard, further to the anticipated reforms of the institutional and regula- tive arrangements, subst an tial strengthening of commerci a1 and fi nanci a1 management and operation capacities towards more professional procedures and performance, and of the reve- nue potential, will be necessary to sustain technically and financially viable development and operations of the utilities.
To better achieve these objectives, i.e. professional and commercial oriented infrastructure services (considering however, as top priority, the social and economic requirements of such services), to supply cost effective, least cost water supply and sanjtation to the population in the project area, and especially also in view of the expected substantial increase of water sup- ply and sanitation operations, it appears necessary to make BWASA, on the basis of the BWASA Act of 1989, a fully autonomous and self-sustaining enterprise, which however will require substantial capacity building, one of the priority issues of the present project.
For this purpose, restructuring of the organisation of BWASA into four functional main de- partments (instead of the actually existing 2 departments) may be advisable, which includes:
0 the BOARD OF SUPERVISORS (similar to a commercial enterprise), where the top deci- sion makers of the important stakeholders are represented, for establishing technical and financial sector policies, objectives and strategic infrastructure planning, for deciding on important technical and financial issues exceeding the day to day operations (without di- rectly interfering into day to day operations), and for auditing & controlling infrastructure operations,
0
a professional MANAGING DIRECTOR, on a normal professional employment basis, fully accountable to the Board of Supervisors, according to normal professional principles, to implement the policies and decisions of the Board and to manage the infrastructure op- erations, and
FOUR main functional DEPARTMENTS: Water Supply operations and development, Sewerage & Sanitation operations and development, Finance and Administration & Gen- eral Affairs.
H:\ConDal\Ber\PAKISTAN\233209\Find Report\FR VoI l\voll -chE.doc

Quetta WSE - Final ReDon. Volume 1 Chapter 8IPaee 20
I N T E R N A L A U D I T
O U A L I T Y 1
Figure 8.3 : PROPOSED LAYOUT OF FUNCTIONAL DEPARTMENTS
M A G I S T R A T E
L E G A L A F F A I R S -I a
G O V E R N M E N T
-I W A T E R S E W E R A G E S U P P L Y &
S A N I T A T I O N
F I N A N C E A D M I N l S T R A T I0 N h
G E N E R A L A F F A I R S
C O N T R O L u T R E A T M E N T
LABORATORIUM
C O L L E CTO R S
* P L A N T
-
C O N N E C T I O N S - -
P L A N N I N G a
T E N D E R I N G
C 0 N S T R U C T 10 N
-
- S U P E R V I S I O N
S T O R E
W E L L S H ( O a M ) LABORATORIES
S T O R A Q E
W O R K S H O P W O R K S H O P
I', J
P L A N N I N G
S U P € R V l S I O N
S T O R E C I
B U 0 G E T lNG B U D G E T C O N T R O L
I R E V E N U E S METER READINQ H BILLING. COLLECTION
A R R E A R C O N T R O L S E N F O R C E M E N T
I 1 - P R O C U R E M E N T S I
P A Y R O L L rn
I I P E R S O N N E L I U
M A N A Q E M E N T I N F O R M A T I O N
S Y S T E M J R E L A T I O N S
S E R V I C E S
W A T E R C O N S E R V A T I O N
C O M M U N I T Y D E V E L O P M E N T
H E A L T H H Y Q I E N E
C O M P U T E R C E N T R E
H:\ConOat\Be~SAKISTAM233209\Final RepotlFR Vd l\voll ch8.da:

Ouetta WSE - Final Reoort, Volume 1 Chauter 8/Pa,e 21
We mentioned already elsewhere in this report, that the elaboration of the present institutional report coincided with the political changes of October 1999, subsequent administrative and institutional reforms and the exchange of upper level decision makers, hampering decisions and smooth progress of the works. It is therefor recommended that, as soon as approval and decisions on the reform concept for BWASA presented in this report have been taken by the competent authorities, details for such reorganisation are worked out and implemented as pri- ority task of the recommended long term TA.
The proposed Layout of Functional Departments is illustrated in Figure 8.3 above.
8.3.2.1 Customer Data Base, Billing, Revenue Accounting
Complete and updated customer data base for complete billing of all water consumption (and sanitation services) is the most important asset for revenue generation, which again is the vital precondition for financially sustainable and thus technically sound water supply operations.
0
Actually, w/ith BWASA, our inquiries during the present studies suggest that the existing customer data base is Incomplete and urgently needs updating to provide a sound basis for improved hilling operations and strengthening of the earning capacity of BWASA. It appears that, on top of the registered water connections of approximately 45.000 an additional 50% to 100% illegal, unregistered and/or unbilled water connections are tapping water from the BWASA system, causing considerable financial losses to BWASA.
It is therefor urgently recommended to perform a comprehensive (house to house) survey of all potential water users in the supply area (which should be combined with the anticipated rehabilitation of water connections and the recommended general meter installation), espe- cially also focussing on the detection of illegal and unregistered connections, to re-establish a complete and up-to-dated customer data base (not only to improve the revenue basis, but also to better control unaccounted for water and for supporting water resources management). It is further recommended to implement regular data base update procedures, to streamline billing operations and controls, revenue collection and accounting, arrears controls and enforcement of due payments through well defined and stringent enforcement procedures and disconnec- tion policies.
The detailed design, based on the comprehensive concept presented in the present Final Re- port for the QUETTA WATER SUPPLY AND ENVIRONMENTAL IMPROVEMENT PROJECT and the implementation of such systems should be a priority task of the recom- mended long term Technical Assistance.
H:\ConDat\BeAPAKISTAtW33209Winal Reoon\FR VoI l\voll -chE.doc

Ouetta WSE - Final ReDort, Volume 1 Chauter 8 /Pape 22
8.3.2.2 Financial Management
Sound financial management plays a very important and dynamic role in the development and sustainability of an organization. Heightened corporate competition, technological changes, volatility in inflation and interest rates, worldwide economic uncertainty and ethical concerns over certain financial dealings are some of major external factors. An organization must have the flexibility to adapt to this changing external environment for its survival.
An organization’s ability to adapt to change, raise funds, invest in assets and manage them wisely effects the success of an organization and ultimately the overall strength of the econ- omy as well. If the funds are misallocated, the growth of the economy will be slowed. In an era of unfilled needs, this misallocation of funds may work to the detriment of the society. It is also vital to ensuring that individuals obtain satisfaction of their highest level of personal wants.
The Government of Balochistan approved the following recurring grants for BWASA during 1995-96 to 1999-2000. In the table given below, percentage of increase/decrease in grant over the last five years has been indicated. The Government of Balochistan has approved 76.697 millions rupees grant for the year 1999-2000. If we compare i t with allocation for the year 1998-99 (Rs.42.609 million), there is an increase of 80%.
The major heads of actual expenditure for the year 1995-96 to 1998-99 are shown in the table given below. During 1995-96 and 1996-97, the expenditure on sewerage was recorded sepa- rately. Therefore, the figures for sewerage expenditure have been shown separately.
0
H:\ConDal\BehPAKlSTAN\233209Final Repoll\FR Vol l\voll -chB.doc

Ouetta WSE - Final Reoort. Volume 1 Chapter 8 / Page 23
As we can see in the expenditure summary the total expenditure amounts to Rs.76.697 million for the year 1999-2000. If we divide this amount in 12 months, the monthly expenditure comes up to Rs.6.391 million. BWASA gets 76.697 million as grant from the Government of Balochistan. This money is kept in Personal Ledger Account (PLA) as directed by the Govt. The treasury doesn’t give interest on the money granted by the government. If we divide this figure by number of months in a year then we get the amount of Rs.6.391 million. For 6 months this amount will be Rs.38.346 million.
The total amount that BWASA will receive from its water tariff in six months will be Rs.lO.OO million. This amount is currently being deposited in ABL and MCB. This is an op- erational account because consumers keep on depositing their bills till the last date and even after the due date with additional surcharge for late depositing. BWASA also keeps on with- drawing the amount to meet up the monthly expenditure. Because of this very reason little amount remains in the account due to which very little profit is accrued on it and because the minimum requirement of amount is not fulfilled then the interest rate also drops. Thus this existing fund management system results in low profit.
’
8.3.2.3 Development of Double Entry Accounting System for BWASA
The basic purpose of accounting is to provide decision-makers and policy makers with infor- mation useful in making economic decisions. Accounting is the means by which the results of financial activities of an organisation can be measured and described. It is just as important to the successful operations of a government organisation as it is for a private or commercial concern.
The financial systems and management play a vital role in the development of an organisa- tion. The financial accounting provides the information relating to financial resources, obliga- tions and activities of an organisation. The Management Accounting comprehend the devel- opment and interpretation of accounting information intended specifically to facilitate the management in running the organisation smoothly. This information is used in setting the or- ganisation’s overall goals, evaluating the performance of different departments and individu- als and in making various types of managerial decisions. Most progressive organisations have an accounting system for preparing financial statements, reports, bills to consumers and other types of information. An accounting system consists of the personnel, procedures, devices and records used by an organisation in developing accounting information and communicating this information to decision makers. In every accounting system, the economic activities of the organisation are recorded in the accounting records.
A double entry accounting system has been designed and developed for BWASA, which is universally accepted as a complete accounting system in both private and public sector. The need for a double entry accounting system, four fundamental concepts, six basic principles have been high lighted. A complete set of formats has been suggested and the usage has been described. The accounting procedure for the proposed double entry system has also been
H:\ConDat\BehPAKISTANG!33209\Final Report\FR VoI l\vo11 -chB.doC

Ouetta WSE - Final Reuort. Volume 1 Chauter 8 / Paee 24
taken care of. An easy access to the different kinds of information and financial data is an- other advantage under the double entry accounting system whose importance can never be disregarded. New formats have been suggested for usage in the double entry accounting sys- tem. The proposed formats will provide a wide range and variety of financial information to the Management of BWASA.
Accounting aims at providing the best and accurate information for effective planning, man- agement and control. By adopting the double entry accounting system, BWASA would have easy access to the required information, which will readily be available. The information and data available under the proposed accounting system will be used in setting goals, comparison of classified income and expenditure, financial analysis and evaluating the performance of organisation. Different financial statements and reports have been proposed which would pro- vide useful information to the management for financial planning and evaluation of the per-
@ formance.
The training plays a vital role to adopt any new system in an organisation. It not only helps in introducing a system but also provides the basic tools and techniques to implement the system in an effective manner. The training manual for double entry accounting system has been de- veloped for BWASA staff taking into consideration the needs of BWASA accounting staff. The aim of the training is to impart knowledge and provide practice to accounting staff that will help them to familiarise with the proposed double entry accounting system. The training will provide an opportunity to practically go through the whole process of the entries in the books of accounts and understand it. The process of entries starting from the receipt/ payment voucher to cash book, ledgers, trial balance, income & expenditure statement and balance sheet will be practically illustrated to the trainees. The training will be useful for BWASA staff to,adopt and implement the double entry accounting system. We believe BWASA ac- counting staff has the ability and desire to run the double entry accounting system. The double entry accounting system will help BWASA to become a progressive and advanced organisa- tion having the abilities to face the challenges of the next millennium.
Recommendations: a
0 Adoption of a universally accepted accounting system:
The BWASA accounts are maintained at single entry accounting system, which has certain limitations and deficiencies. It has been genuinely felt that BWASA does not follow the gen- erally accepted accounting system. The double entry accounting system is universally ac- cepted accounting system. It is recommended that double entry accounting system may be adopted by BWASA. By adopting it, BWASA would be in a position to develop the plan and achieve the organisational aims and objectives. BWASA would be in a better position to maintain its accounts in a systematic manner and thus become a progressive and forward looking organisation. The double entry accounting system will provide a wide range and vari- ety of information to BWASA policy/ decision-makers.
H:\ConDat\BerlPAKISTANG'33209\Final ReportVR VoI l\voll -chE.doC

Quetta WSE - Final Report. Volume 1 ChaDler 8/Paee 25
Designing of double entry accounting system:
The double entry accounting system was proposed for designing in the second phase of the project. The double entry accounting system has been developed and designed for BWASA, which will be presented in the coming chapters.
Computerisation of accounting system:
It is recommended that accounting system of BWASA may be computerised for proper flow of financial information. The accurate and reliable data would become available for taking certain rational decisions through computerised accounting system. Either an accounting package may be considered and examine for suitability to WASA's accounting system or a customised accounting software could be developed.
TA for implementation of double entry accounting system:
It is recommended that 2 years TA may be approved for implementation of double entry ac- counting system at BWASA. The followjng steps are suggested for implementation of double entry accounting system:
- - -
Preparation of accounting manual for accounting staff, Preparation training manual for accounting staff, Conversion of last 3 years accounts of BWASA from single entry into double entry accounting system, Staff training through classroom lectures and on jobs training. -
8.3.2.4 Tariff Structure
Balochistan Water & Sanitation Authority (BWASA) Quetta took over the water supply from Quetta Municipal Corporation (QMC) on December 1, 1994. Water has a significant impor- tance for human life. Without it, human survival is impossible. The water reservoirs are de- pleting at an alarming rate due to over-pumping through wells. The water supply situation be- comes worse due to heavy water losses and low efficiency in revenue collection. The Balo- chistan WASA is responsible for providing potable water to the residents of Quetta City. The improvement in water supply system may not be possible unless BWASA has sufficient fi- nancial resources.
The BWASA has to discharge its' responsibilities and meet the challenges of inadequate fi- nancing, fast population growth, and deteriorating conditions of tube wells. The presently generated revenue is insufficient to operate and maintain the system effectively. The existing services can be improved if drastic changes are made in the tariff structure. It is imperative to revise the existing tariff structure for water charges.
H:\ConDat\Ber\PAKISTAN\233209\Final RepotWR VoI l\voll -chB.doC

Ouetta WSE - Final Reuort, Volume 1 Chauter 8 / Paee 26 a Recommendations The tariff rates were revised in December 1994 last time. This revision resulted reduction in the tariff structure. Before December 1994, the domestic consumers were charged @ Rs. loo/- per month. The rates revised in December 1994 consisted of different categories on the basis of water connection pipe size. Since about 92% consumers were placed that category which paid Rs.751- per month. This revision of December 1994 was actually a reduction in the tariff structure. The following recommendations are proposed in order to enhance the revenue col- lection of BWASA, which are further discussed in chapter 13. of the present Report and in Volume 6, chapter 1.4.
Introduction of water metering system
It is recommended that meter may be installed with each water connection to control usage of water. It will help in reducing the water wastage. Furthermore, with the introduction of meter system, those consumers who will use less water, will pay less charge.
Introduction of long term tariff structure
It would be appropriate to introduce long-term tariff structure to cover the operational cost in the near future and enhance the tariff to cover operational cost and depreciation/ replacement cost of the infrastructure after a certain period. The long-term tariff will ensure the gradual withdrawal of government subsidy.
Fee charging from private tube wells
There is a provision in the Act of BWASA that Authority shall monitor and control water re- sources in the area, both surface and underground, and issue licenses for abstraction of water from such resources in the area in accordance with regulations made by the Authority. A fee may be fixed and charged from private tube well owners. No objection certificate may be is- sued only after the prescribed fee is deposited with BWASA. 0
8.3.2.5 Customer Management
Bringing water supply to the level where it could meet the standard both quality and quantity wise is vitally important for the residents of Quetta. Like most of the developing countries, parallel to several other factors, the main hurdle in attaining this gigantic task is scanty fi- nance. Several donor agencies are helping the developing countries by financing certain proj- ects that could ensure basic needs of life. These funds help the projects to be initiated and then become a self reliant and self-sufficient authority.
H:\ConDat\Ber\PAKISTAM233209\Final ReDorAFR VoI l\voll -chS.doc

Quetta WSE - Final Report, Volume 1 Chauter 8 / Page 27
The main goals of Balochistan Water & Sanitation Authority are to provide adequate water supply and sewerage facilities for the Quetta City residents. As in the most of organizations, it is expected that BWASA will be faced with day to day problems. These problems ask for immediate response to these and come up with prompt, complete and workable remedies to keep the work carry on. Only those organizations survive that cope with its problems success- fully, others can't progress in the long run. Even a minor problem, if ignored today can result in a vandalism tomorrow. It is thus necessary to design a comprehensive policy for the current functions that could streamline all the workings and help in preventing any red tap-ism. Only then could be BWASA regarded as an effective and efficient organization leading towards attainment of its goals.
During the study of existing system of customer management, problems identified including lengthy procedure of connections, inappropriate coordination among BWASA Departments, non-existence of customer management policy and incomplete addresses of consumers. It has been recommended that BWASA should immediately setup a customer service Center, stream line the connection procedures, formulate the customer management policy, to conduct survey for illegal connections and strengthening the computer section for computer supported cus- toiner management and commercial operations.
a
8.3.2.6 Management Information System (MIS)
The Institutional Development on regulatory level deals with formation of single authority responsible for water production and distribution and the institutional development on opera- tional level deals with performing different functions for examples, Maintenance of accounts, Financial Management, Billing, Revenue Collection, Customer Service and Management In- formation System (MIS). MIS not only directly enhances the organisational capabilities for decision making, it provides service and help in improving the other areas on operational level, computerised billing would be more efficient as compared to the manual billing. MIS is an activity on the operational level for the capacity building of the organisation to perform better.
'
(I,
Over all objective of the assignment is to provide an integrated, comprehensive and efficient MIS for providing accurate and timely information and data about operations to help improve the operational capabilities of BWASA.
To perform this task, Management Information System (MIS) plays very important role. MIS aspect of Institutional Development will help in studying information flow in the existing system and then analyse it and pinpointing the problem areas. Once the problem areas have been defined then a Computer-based Information Management System is designed to over- come the shortcomings of the existing system by enhancing the capacity of the system to sup- port the Project.
- H:\ConDat\BetlPAKISTAM233209\Final Report\FR Vol l\voll -chE.doc

Ouetta WSE - Final Reuort, Volume 1 Chaoter 8 / Page 28
a) The Problem Areas
The current manual system has the following limitations: -
The information is prepared manually after it has been asked for, therefore it takes time in compilation which, at times, looses its value because of being late. Manual compilation of information tends to have mistakes and may not contain correct information. The information, even if available, cannot be presented in useful formats like graphs, bars and diagrams which facilitates comparisons. The manual information is at times incomplete and does not provide the complete picture of the situation. The partial view, at times, is misleading. Normally the manual information lacks consistency. At times the Figures used from different sources do not tally with each other. Comparison and analysis of the information is not possible in the manually pre- pared information. Manual information processing is as good as not having an Jnformation System for instant Decision-Making. This situation becomes more serious in the absence of the most vital information on Financial and Operational situation in the organisa- tion.
b) The Characteristics of Effective Information
Accuracy, Timeliness, Completeness, Conciseness.
0 c) Recommended Management Information System
Option I - Stand-alone MIS: This option takes care of only MIS without computerisation of any department. According to this option there will be one Computer Centre and all the in- formation generated by the different departments of BWASA will be inscribed on Data input forms and sent to the Computer Centre at the end of the day for keying-in. The information so compiled will be available to the Managing Director. The layout of this option is placed as Annex.
Option I1 - Partial System Approach: Whereas the integrated system approach consists of a separate module for each department. This partial system approach is the computerisation of only one module, namely the “water supply module”. The particular requirements of an MIS for BWASA would be formulated to deal with the specific aspects of operating and main- taining of a water supply system, including:
0 Maintenance schedules and activities, Data on existing assets and their condition,
H:\ConDat\BeAPAKISTAN\233209FinaI RepoltFR Vol l\voIl-chE.dcc

Chapter 8 / Pace 29 Ouetta WSE - Final Reoort. Volume 1
Depreciation , Water Quality and, Quantities of water produced and supplied.
The layout of partial system approach is placed as Annex.
Option 111 - Integrated System Approach: All the departments of BWASA should be com- puterised where each department will be doing their Transaction Processing using computer installed in each department. MIS, in this case become the by-product of the transaction proc- essing system (TPS). No extra efforts are required to create MIS. All the heads of the depart- ments will have access to their own information. One head of the department will not have an access to another department’s information whereas the Managing Director will have access to all the information of his departments.
This option would require the computerisation of the following modules: -
0
0 Accounts and payroll module, Jnventory/Asset Management module,
Personnel Management module.
Revenue (Billing and Collection) module, Engineering - Water supply module,
Recommended Option: Option 111 is an integrated system approach. All the departments will be computerised and MIS will just be the by-product of their routine Transaction Processing System. The information to the management will be all the times updated with the latest status and all the departments will enjoy the benefit of the latest and the most modem management tool of computerisation. This approach will take BWASA proudly in to the next millennium and that too in the most befitting manner.
d) System Implementation a System Implementation is the fulfillment or carrying out of the design specification to put a new information system into operation. The implementation involves system construction and syslem delivery phases. The following main steps are involved in the system implementation:
System Study, System Design, Programming, System Test, Conversion, Hardware Selection, Software Selection, Site Preparation, Personnel Selection,
H:\ConDat\BeWAKISTANP33209Final ReportWR Vol l\voll -ch8.doc

Quetta WSE - Final Report. Volume 1 Chapter 8/Paee 30
System Support, 0 Implementation Schedule.
8.3.2.7 Staff Training and Capacity Building
The capacity building at any organisation is a very technical and specialised task. It provides base and contributes for behaviour modification and image building of an organisation. The objective of capacity building is achieved through analysing the situation and then formula- tion of training strategy and program for enhancing skills and carrier development of profes- sionals working with the organisation.
Training is a planned and systematic effort to modify or develop knowledge, skills and atti- tude through learning experience, to achieve effective performance in an activity or range of activities. Its purpose, in the work situation, is to enable an individual to acquire abilities in such an order that they can perform adequately in a given task or job. HRD experts recom- mended following steps for developing a training strategy and program.
0
The objective of capacity building is achieved through analyzing the situation land then for- mulation of training strategy and program for enhancing skills and carrier development of professionals working with the organization.
Training is a planned and systematic effort to modify or develop knowledge, skills and atti- tude through learning experience, to achieve effective performance in an activity or range of activities. Its purpose, in the work situation, is to enable an individual to acquire abilities in such an order that they can perform adequately in a given task or job. HRD experts recom- mended following steps for developing a training strategy and program.
a) Situation Analysis
The situation analysis provides information regarding existing working patron and problems of the organization. The existing gaps in management, documentation, efficiency of work and roles and responsibilities, could be identified. This part leads the HRD expert to do detailed training needs assessment. The outcome of this step is to identify the major training problems existing in the organization. It also provides an analysis of professional capacity of the em- ployees working in the organization.
b) Training Needs Assessment (TNA)
The, important step in capacity building is to determine whether a need for training actually exists. An organization should commit its resources to a training activity only if the training can be expected to achieve some organizational goal. An elaborate assessment on major training problems identified at step 1 is carried out. The training need assessment identifies any discrepancy between what is desired and what exists. Comparisons between the expected level of performance specified (from the job analysis) and the current level of performance
H:\ConDat\BerWAKlSTAN\233209Final ReportFR Vol l \voll -chE.dcc

Quetta WSE - Final ReDort. Volume 1 Chauter 8 /Pave 31
exhibited (evident in the person analysis) may indicate performance discrepancies.
The training needs assessment also helpful for identifying the gaps in Knowledge, Attitude and Practices (KAP) of workers of an organization. The TNA provides basis for developing HRD strategy and activities to enhance the skills of workers.
c) Assessed Training Needs for Capacity Building at BWASA
The training needs assessment study identified a large number of areas where training is found to be necessary. The consultant advises that these courses be designed and implemented through in-house resource persons. They must be interested and have basic communication skills (empathy, listening, etc.) in order to pretend to qualify for such additional function. The consultant foresees that SDO and associated level of the staff would be best to undergo a Training of Trainers. Such training could be organised in house by hiring some good consult- ant. This training must be very good because it would provide base to other in house training courses.
Besides the technical courses, the TNA has also identified a major need in the field of man- agement. Indeed all levels of management staff having some responsibility should be aware of basics of management. In terms of efficiency, it appears that the planning-monitoring & evaluation capabilities are weak at all levels. We see the need to develop such skills, but with different emphasis according to the level of responsibility. For senior managers, emphasis should be on long-term planning, corporate management planning, identification of and man- agement by objectives, policies, etc. and delegation of responsibilities, control (monitoring- evaluation) through MIS data, etc. For junior staff having specific responsibilities the empha- sis should be on proper planning of teamwork, quality control, supervising role, Benchmark surveys, etc. The detailed training needs assessed are as under:
- S.N 0 _- 1.
Training Needs
0
0 Organizational culture building
0 Customer orientation
0
0
Communication skills
0
Orientation to policies and operational procedures of BWASA
Corporate image building of the organization
Team building, Leadership &Decision making
Delegation of responsibilities & Supervising skills
Project management & monitoring and evaluation
Development sustainable linkages with other departments
Concept to involve community as partner of the program
Category of Staff
Directors
Deputy Directors
S.Es
XENs
H:\ConDat\Ber\PAKISTAW33209\Rnal Report\FR VoI l\voll -chB.doc

Quetta WSE - Final ReDort. Volume 1 Chaoter 8/Pape 32
- 2.
3 .
Record keeping and reporting
MIS
Water management and quality control (refresh technicalities)
Sewerage and sanitation (refresh technicalities)
Finance and accounting (refresh technicalities)
Orientation to policies and operational procedures of BWASA
Corporate image building of the organization
Organizational culture building
Customer orientation
Team building, Supervising skills & Situation analysis
Involving community as partner to the program
Making feasibilities
Supervising schemes & Documentation of projects
Water treatment and quality control
Sewerage and water supply management technicalities
Delegation of responsibilities
Record keeping and reporting
Training of trainers
Handling complaints and customers satisfaction
Community mobilization and social organization
Handling community meetings
Basic philosophy of BWASA
An orientation to corporate culture in the organization
Handling complaints and satisfaction of consumers
Attending mohalla committee meetings
Basic communication skills &Team work
Maintaining record of activities and complaints
Reporting to the officers
Basic principles in electricity and electric motors
Basic repairs in electricity and electric motors
Basics of tube wells and minor repairs
Identification of faults in tube wells and machines
Periodic maintenance of tube wells and machines
SDOs
Research Officers
Sub-Engineers
Supervisors
Social Organized
Community Moti- vators
All operational staff
Electricians/ Tube well
Operators/ Electri- cal Supervisors
H:\ConDai\BeAPAKISTAM233209\Final Repolt\FR Vol l\voll -chB.doC

Ouetta WSE - Final Reuort. Volume 1 Chanter 8 / Page 33
Supervising skills
Principle of gravity flow
0
0 Reading maps
0
Basics sewer system
Hydraulics and related equipment
0 Periodic cleaning of lines
0
Basic techniques for laying pipes
Basics of valves and their maintenance
Health hazards and security measures
Recommendations
Supervisors
Pipe Fitters/
Plumbers
Valve men
Sewer men
A corporate culture and professional shlls could be developed amongst the staff of BWASA through implementing a capacity building program. The following is recommended for a good capacity building program at BWASA.
Strategy Formulation in HKD
It is recommended, on the basis of results derived from training needs assessment a strategy of HRD should be developed for next five years. It will provide a path to BWASA for adopt- ing corporate culture as well as it will provide guidelines for carrier development of staff working with BWASA.
Development of Training Material
0 It is recommended to develop training materials to implement training program with help of an experienced HRD organisation. There is a great need to pay special attention on material development, which provides base for training program.
0 Human Resource Development Unit at BWASA
BWASA is a large organisation having more than 1200 employees working with it. We are recommending a permanent HRD unit at BWASA. This unit should be responsible for organ- ising in-house training programs, documentation of training programs and carrier planning of BWASA staff.
0
It is recommended to get services of a good HRD organisation to develop Standard Operating Procedures (SOP) for HRD section at BWASA.
Development of Standard Operating Procedures for HRD Unit
H:\ConDat\BehPAKISTAW33209Final ReporhFR Vol l\voll -chB.doc

k e t t a WSE - Final Report. Volume 1 Chauter 8IPane 34
Training of Trainers
It is also recommended that a training of trainers should be organised. These trainers should be responsible for organising in-house training courses for workforce at BWASA.
Development of Job Description of BWASA Staff
BWASA staff did not provide any job descriptions. Majority of them is not clear about their responsibilities and functions. We are recommending very strongly to develop job description for each category of staff. The job descriptions should clarify their responsibilities, sphere of authority, chain of command and their function to achieve the goal of BWASA.
8.4 Proposed Technical Assistance for Institutional Reforms and Capacity Building
Jt is evident that the implementation of the recommended reforms and improvements will re- quire more time and input of expertise than is available under the present project. It is there- fore recommended to supp01-1 the efforts of the financial water supply and sanitation manage- ment to implement the recommended reforms and improvements in financial and accounting systems and performance through a long term Technical Assistance program and to assign one expatriate expert, experienced in overall financial water supply and sanitation manage- ment and operations, working closely together with the responsible water and sanitation man- agement, to the Quetta BWASA, and three Pakistani financial and commercial experts.
Proposed Technical Assistance
The recommended reforms and improvements in financial and accounting systems and per- formance through a long term Technical Assistance program is proposed both at the Provin- cial (Regulatory reform project and at the operational level reforms of BWASA in particular and to some extent at PHED and QMC). Following technical assistance components are pro- posed.
@
Institutional Development
1. Provincial Institutional Reforms
Institutional Inventory refinement, Legal framework analysis, Reorganizing and merger of provincial water sector institutions, Water resources management policy framework and institutions. The regulatory framework and the organization of a joint water board have to be worked out and a proper system of decision making has to be setup. Unified Building Codes development and implementation and institutional setup has to be developed. Sup- port has to be provided to the provincial government in establishing these institutions,
H:\ConDat\BeWAKISTAN\233209\Final ReportGR Vol l\voll -ch8.d%

Ouetta WSE - Final Reuort. Volume 1 Chauter 8 / Page 35
strengthening the existing structures, institutional restructuring and reorganization, merger of function roles & responsibilities and later institutions themselves. The staffing plans and organizational structures have to be developed for the new / restructured institutions. The systems and procedures and financial management system to run the affairs of these institutions also have to be established. The reclassification and reorganization of the ex- isting staff and determination of an excess/ surplus staff also will be carried out with a comprehensive Surplus staff and Privatization policy.
2. Institutional Analysis of BWASA and Capacity Building of BWASA
(a) Financial Management System
BWASA has to develop a better system of managing its finances and bookkeeping practices. A computerized double entry accounting system and payroll system will have to be developed. Internal Audit & Value for Money Audit system will have to be developed. With proper account maintenance, the annual audit has to be carried out by independent auditors. Fiscal Policies & Procedures and Implementation of Funds Management Policy will also have to be carried out.
0 ’
The focus of carrying out this exercise is to understand the strengths and weaknesses of the organization. The problems, concerns and issues will be highlighted. After thor- oughly assessing the strengths and weaknesses of the organizations, their financial procedures, fund-flow arrangements and carrying out training needs assessments, Consultants will recommend a number of options to streamline their financial man- agemen t .
’ (b) Financial Analysis
The financial requirements of BWASA and the project have to be determined. The op- erational cost, the valuation and then the depreciation in the value of assets has to be calculated. In order for this organization to become a sustainable entity it has to iden- tify its financial requirements and have to find ways to fulfill those requirements.
The consultants will have to propose mechanism through which BWASA achieves fi- nancial sustainability in its target time of next five years. A self-reliance Model has to be developed and its implementation have to be carried out. The financial analysis should determine the subsidy requirements of BWASA in the next five years. The objectives of consultancy services are to assist BWASA to develop strategies for strengthening financial and management systems to assist BWASA in implementing these strategies; and to help BWASA improve cost recovery formulate strategies for the improvement of financial operations and assist BWASA in the execution of these strategies.
a
H:\ConDat\Ber\PAKISTAN\233203Final Report\FR Vol l\voll -chE.dcc

Ouetta WSE - Final Report. Volume 1 Chauter 8 I Page 36
Cost recovery, tariff and, affordability issues will be addressed. Based on this review, the financial analyst will recommend appropriate mechanisms to comply with the loan covenants, and action plans for the financial strengthening of the BWASA. Assistance is provided to BWASA in the implementation of the following:
a. Financial and Operational Plan, b. Funds Management Policy, C. Privatization Policy, d. Arrears Policy.
(c) BWASA Restructuring & re-organization
Corporate Entity framework and its implementation, Strategic & Administrative As- pects (Organizational structure, Mission, Vision, Goals, Objectives, Staffing Require- ments, Personnel Policy, Jnternal Procedures Rules & Regulations, Job Descriptions, Performance Evaluation System, Legal Framework). Mission of PHED, Organiza- tional Structure, Rules/regulations & functioning of Governing Body, Charter of du- ties/Job description of each post, Financial powers of specified posts, Recruitment Rules, Efficiency & discipline Rules, Promotion Rules, Move-over Rules, Release & Retirement rules, Pension Rules, Leave Rules, Financial Rules. Administrative Working Procedures, including Channel of CommandlAuthority, Processing of mail/cases, Processing of financial matters, Processing of reports and returns, Proc- essing of legal matters, Processing of ACRs, Security & safety matters, Handing of classified matters, Administrative & financial coordination, Mechanical Transport op- eration, Budgeting, Purchases & Procurement.
Tendering, Contracts / MOUs, Execution, Inspections & Quality Control, Reports & Returns, Completion / Finalization, Contractors, Consultants, Administrative Authori- ties of Quetta, Table of authorized office equipment, machinery and furniture etc, Specimen of standard forms to be used.
The Managerial, organisational and operational issues identified will be looked into. The Geographic zoning, operating and support functions top management reorganisa- tion and needs, management procedures, and performance appraisal system will all be implemented soon.
4. Revenue Collection System
(a) §urvey and the Inventory of Consumers BWASA needs to adopt a progressive tariff structure and identify consumers who fall in different categories and increase its consumer base. BWASA also needs to identify illegal connections in Quetta. BWASA has to develop a complete consumer database. Jn order to develop this database, a detailed house to house survey of it service area needs to be carried out.
H:\ConDai\Ber\PAKISTANW33209\Final Repor?\FR VoI l\vo11 -chE.doc

Chapter 8/Paee 37 Ouetta WSE - Final Reuort. Volume 1
(b) Computerized Revenue Collection System
The consultancy will also study BWASA’s billing system, assist BWASA in the in- troduction of a computerized billing system, assist BWASA in selecting hardware and software and provide training of BWASA staff in the use of the system. Study the ex- isting billing system in depth and identify its limitation. Review the feasibility of con- version to a computerized billing system and determine the outputs for accounting purposes. Run the computerized billing system on trial basis identifying and correcting any flaws and Provide on the job training for concerned BWASA staff.
(c) Short Term Billing Support After the introduction of the Computerized Revenue Collection System it will be ex- tremely important to ensure that the integrity of the database is not compromised as it will serve as the tax base for the organization. Besides that the BWASA staff will be trained and will be provided short-term support in the transition stage of switching to the new system.
In order lo manage the software and to update the record a programmer will be hired. This programmer wi l l setup the billing system and will supervise the billing opera- tions. The broader responsibilities of the consultants will include preparation of bills, corrections & updating of records, translating banks scrolls and improving the billing system, inspecting & verifying complaints, initiating a dialogue with community and providing them assistance to understand various billing categories of bills and ration- ale of tariff structure, training BWASA staff in billing operations and billing software.
A detailed procedural manual is to be developed elaborating the entire systems and procedures of BWASA Revenue collection, Connection, Disconnection, Reconnec- tion, financial operation, Computerization, Complaint monitoring and rectification.
5. Management Information System and GIS BWASA suffers from a lack of information flow system. Some of the staff members are overwhelmed with data while others lack the basic information needed for effective decision making. The internal communication is weak and lacks a systematic flow. A proper decision support system based in information flow will be developed to help the decision makers of all the levels of management’s have smooth access to the essential information to make there de- cisions. Several modules of various functions of BWASA will be developed in this regard.
(a) Assets Management System (Geographic Information system)
BWASA does not have a comprehensive assets management system. We strongly rec- ommend that a proper assets management system be developed incorporating all the details of the assets including tube-wells with allied civil works, properties, equip-
@ H:\ConDat\BeWAKISTAW33209\nnal Report\FR Vol l\voll-ch8.doC

Ouetta WSE - Final ReDort. Volume I Chauter 8 / Paee 38
ment, vehicles, office equipment, filtration plant, water works, sewerage lines, pipe- lines etc. A GIS system may be developed with all this information.
Consultants will develop a computerized database (software) to accurately access the value of the assets (Detailed inventories, stocks and stores, design drawings, distribu- tion system, Water works assets, Tube wells, elevated water tanks, water distribution system, sewerage network, machinery and equipment, disposal station). The database will effectively consolidate social, technical and financial data from various sources and will enable rational decision making and planning processes. Provide technical details of tube wells, surface reservoirs, and machinery, Population projection Sup- plement Personnel Management to track down the exact job description and deploy- ment of the employees of BWASA.
6.
The Consultant will carry out the following tasks presented under the following tasks. The Consultant will provide approx. 12 person-month of an international key expert, experienced in the project management of large scale water and sanitation projects.
Advisory Service for Project Jniplementation
Advise the EAs on the technical aspects, engineering design, construction and super- vision and Bank procurement procedures and guidelines for the Procurement of goods. Help the EAs coordinate Project implementation activities, maintain records and min- utes of all construction related activities, and certify and recommend payment of claims by the contractors and suppliers. Coordinate the activities-of all local and international consultants. Advice and provide assistance towards community development (e.g. multimedia campaigns, target group communication, water conservation education and PR & documen tation center development). Advise on environmental issues and resettlement of families displaced by construc- tion activities. Inspect completed works and make recommendations to the EAs on the issuance of the certification of completion. Prepare reports for the EAs and for the Bank, including progress reports, project completion report, and project benefit monitoring reports; and facilitate the Bank’s loan review missions.
H:\ConDat\Be~PAKISTA33209\Final ReportFR VoI l\voll -che.doc

ChaDter 8 I Page 39 Quetta WSE - Final Report. Volume 1
7. Advisory Service for Public Works, Technical Management and Operation
The Consultant will carry out the following tasks presented under the following tasks. The Consultant will provide approx. 12 person-month of international key experts for a Public Works Management Expert and approx. 12 MM for a Civil/Sanitary Engineer.
(vii)
(viii)
Review the appropriateness of the engineering design prepared and proposed modifi- cations if necessary. Review the project implementation plan and organizational arrangements for project implementation. Review tendedcontract documents and assist during pre-construction period. Day-to-day monitoring of project progress, preparation of progress reports to PMU and ADB. Preparation of training programs and review of training manuals provided by the Consultants. Organize workshops and seminars for BWSAS staff. Assist in commissioning and peiformance evaluation of completed facilities and in setting up regular maintenance programs, and if required, maintenance contracts with suppliers. Supervise the training programs of the civil works and equipment suppliers; provide additional technical and management training to the PMU and project implementa- tion units in the project area. Prepare a leakage detection and control training program; provide training on re- source mobilization including, cadastral mapping, property registration and valuation, and revenue collection; and conduct training for the staff of the water treatment and waste water treatment plant . The consultant will help, in association with the Project Implementation Advisor and local NGO/CBO, with the Community Development Program Sanitation and Health Awareness Program.
H:\ConDat\BeWAKISTA33209\Final ReporWR Vol l\voll-ch8.doc
I

I
Qietta WSE - Final Reuort, Volume 1 Chavter 8 I Paee 40
TABLE 8.3 : INVESTMENT SCHEDULE
'ECHNICAL ASSISTANCE (TA) FOR INSTITUTIONAL REFORMS AND C
(constant 10' US$ of mid 1999)
D/C/501 TA FOR CAPACITY BUILDING OF COMMERCIAL AND FIN AND OPERATIONS IN BWASA (2001 .2003)
Financial/Commercial Advisor (Expatriate) Financial/Commercial Advisor (Local) Accounting Adviior (Local) Computer Specialist (Local)
SUBTOTAL
D/G/502 TA FOR PROJECT IMPLEMENTATION (2001)
Contract ManagementCiv Eng Expert (Expatriate)
SUBTOTAL
'ACITY BU
MM
ICIAL MAN,
24 24 24 12
12
I NG local
TOTAL foreign cost cost
:MENT % $ $
0.552 0 096 0 096 0.036
0.780
0 276
0 276
0 552
71% 0552
0 276
100% 0276
1lCl503 TA FOR PUBLIC SERVICES TECHNICAL MANAGEMENT AND OPERATIONS (2002 - 2003)
Public Works Management Expert Expalriale) CivillSaniiay Engineer (Expatriate)
SUBTOT,
)/C/504 PROVINCIAL INSTITUTIONAL REFORMS (2001 .2002)
Institutional Development Specialist (Local) MIS Specialist (Local) Financial Management Consultant(Loca1) HRD Specialist (Local) Junior Consultants (Local)
SUBTOTI 3TAL BASE COST
physical contingencii price contingencies [avg 7% p
Value Added Tax (14' RAND TOTAL TECHNICAL ASSISTANCE JSTITUTIONAL REFORMS AND CAPACITY BUILDING
12 24
24 8 18 6
48
0 276 U 276 0 510 0 510
0.786 100% 0.786
0.096 0.032 0.072 0.024 0.096
0 320
0 091 0 091 0 031
0 221
0 09t 0 03: 0 07; 0 021 0 09f
0 32( 2.162 75% 1.614 0.W
0.324 75% 0.242 0.082 0.592 60% 0.355 023; 0.431 72% 0.310 0.12'
3.509 72% 2521 0.98t
2001 2002 2003
0.138 0.024 0.024 0.009
0.195
0.024 0.032 0.029 0.024 0.024
0 276 0 048 0 048 0 018
0 390
0 276
0 276
0 138 0 255
0 393
0 048
0 043
0 048
0133 0139 0328 1.198 0.62
0.1: 0.0; 0.0; O.O(
0.15
0 1: 0.21
0 3:
0.02
0.02
0 04
0.049 0.180 0.0s 0,055 0.310 0.22 0.060 0.236 0.12
0.492 1.924 1.05
H:\ConDai\BeriPAKISTAN\233209~inal ReporWR Vol l\voll-ch8.doc

a
9. COMMUNITY DEVELOPMENT AND SOCIAL ISSUES

Ouetta WSE - Anal Report. Volume 1 Chapter 9 I Page 1
9. COMMUNITY DEVELOPMENT AND SOCIAL ISSUES
9.1 Background
Water resources management plays a crucial role in Quetta’s development and survival as a capital city. Large influx of migrants and refugees explosively increased population and water demand in the last 20 years. Coupled with rapidly dropping groundwater levels, the city and surrounding villages need massive and rapid intervention to rectify and improve its water supply situation. In view of extremely limited overall water resources in the area, an integrated approach is necessary, to mobilize all potential primary and secondary sources, while remaining within limits of economic tolerance. Community acceptance and cooperation are most important factors in the required loss reduction, conservation and recycling components of the proposed integrated water management, that may, if conse- quently applied, make up more than one fifth of the overall quantity. Therefore, great em- phasis was put on the social dimensions associated with the planning, implementation and sustainable operation of the envisioned ensuing project. These are as under:
a
9.1.1 Income
Household-level socio-economic surveys carried out in conjunction with project prepara- tion examined family expenditures on house rent and upkeep, food, clothing, education, medical treatment, electricity, gas, fuel, transportation, recreation, and other needs.
Estimated monthly expendltures in surveyed households ranged from Rs. 1,500 to Rs. 45,000. Average monthly household expenditures were Rs. 10,411. Almost 70% of sur- veyed households had estimated monthly expenditures less than Rs. 10,000, placing them in low and medium income groups. Nearly one-third of all surveyed households had aver- age monthly expenditures of less than Rs. 5,000.
Less than 25% of surveyed households owned property or assets beyond the occupied house and lot. About 10% of all households owned agricultural or orchard lands. These were generally small holdings, although several households reported agricultural lands or orchard of several hundred acres. Several households owned additional houses or shops.
*
9.1.2 Poverty
Poverty is a pervasive feature of the Service Area, and Quetta’s problems may be ap- proaching those of Pakistan’s larger urban areas, which house the most degrading poverty in the Sub-Continent. Nationally, about three-quarters of all new households established in urban areas between 1985 and 1990 were in slums, and Quetta’s katchi abadis share their acute lack of social services, particularly sanitation and sewerage.
H:\ConDat\BerU‘AKISTAN\233209\Final ReportFR Vol l\voll -chg.doc

Ouetta WSE - Final ReDort. Volume 1 Chaoter 9 I Parre 2
The extent and depth of poverty in Quetta has been measured through several methods. a
These include calorie-based, basic needs, and income poverty measures, and several indi- ces. A Human Poverty Index synthesizes life expectancy, literacy, and a composite of variables including access to safe water and health services, and child malnutrition; and a more recent Poverty of Opportunity Index captures a composite of health, education, and income deprivation, which also includes access to safe drinking water.
Recent national research indicates no discernible trend in reduction of income poverty in Pakistan, and, in some measures, it is believed to have increased since 1987-88, particu- larly in the last several years. Figures do indicate a reduction when broader measures are considered, but female poverty is decreasing at much slower rates than male, especially in education, reflecting increasing female-male disparities; and. rural poverty in Pakistan has decreased faster than urban.
9.1.3 Gender
Gender imbalances in access to health and education services and low levels of human re- sources development among women in the beneficiary population can’t be ignored. Socio- cultural factors, including the institution of purdah and seclusion of women, which reduce women’s mobility and participation in society have also been considered.
Although Quetta is the most developed district in Balochistan in terms of education for women, availability of health services, and women’s employment opportunities, the over- all situation is not encouraging. Opportunities remain limited and the cultural and social pressures restricting women are widely prevalent.
Women’s roles within the family are significant, but much more limited at the community level. Within the major ethnic groups of the beneficiary population, women’s roles are very limited. Women are compelled to live within traditional social and cultural values, including purdah, and their social standing is largely determined by the number of male children and the social and economic status of the husband. Women’s status and social and economic interactions are low. Women’s property and inheritance rights are generally not recognized.
a The status and role of women, however, is slowly changing in Quetta’s urban society. The number of women worlung in the social sector, NGO’s, and banking has increased, and attitudes toward female education are becoming more favorable. The Balochistan govern- ment has institutionalized gender development and donor agency policies have drawn at- tention to gender equity. Many women are involved social welfare activities, politics, and advocacy to mainstream women’s development.
Women’s employment is principally in the education and health sectors. Few women work in government where conditions are discouraging due to the lack of promotions and a male-dominated environment. Education among young females is spreading rapidly and an increased number, even from very traditional households, are entering outside employ- ment.
H : \ C o n D a l \ B e ~ P A K I S T ~ 3 3 Z O ~ n ~ ReportFR Vd l\voll -ch9.doc

Ouetta WSE - Final ReDOrt, Volume 1 Chapter 9 / Paee 3
Despite these improvements, women’s social circumstances in most of the beneficiary @
population require special consideration in project design and implementation. The physi- cal segregation of women associated with purdah has architectural expression with service delivery and water use implications.
Women’s roles in household decision-making and expenditures may be constrained and their lack of mobility and widespread illiteracy will demand time-intensive participatory modes and utilization of informal networks in which the influence and relatively greater mobility of older women and widows is great.
9.1.4 Ethnicity
Wgration and historical factors have produced a city of unusual ethnic heterogeneity. The kaleidoscopic cultural diversity of Balochistan, Pakistan and the wider region converges and sometimes collides in the social crucible of the Quetta Valley. Arising on the cultural seam between boundaries of ancestral Pashtoon, Baloch, and Brahui tribal territories, each characterized by relative internal ethnic homogeneity, Quetta has become a complex multi-cultural amalgam of these indigenous groups and later arrivals.
While almost half are Pashtoon, and much of the balance Baloch and Brahui, the ethnic mix of the city also includes a sizeable Hazara community, substantial post-Partition set- tler communities of Mohajirs and Punjabis, the more recent refugees from Afghan trou- bles, Sindhis, and several other ethnic minorities.
Several cyclical migratory patterns also contribute to this mix. Every year nomads from Afghanistan, along with their livestock, move through Quetta’s mountain passes into rural areas of the district, occupying camps where grazing is available. With the beginning of winter, these groups move to warmer areas like Sibi and Jacobabad, returning to .their homes the following summer using the same route. Another stream of seasonal migration also takes place from warmer areas of the country to Quetta during the summer. Since its inception, Quetta has provided a respite from the scorching lowlands as a ‘hill station’. a - Close to fifty percent of Quetta’s inhabitants are Pashtoon. They belong to numerous sub- tribes that together, extending across several neighboring states, comprise the world’s largest single tribal organization. Each of the many Pashtoon subtribes in Quetta has its own representatives and tribal leaders. Some Pashtoon neighborhoods, like Shaldra, are among the oldest in the city, predating British occupation. Most Pashtoons and Pashtoon settlements in Quetta, like Pushtoonabad, are more recent. These include most of the Af- ghan refugees, the majority of whom are Pashtu-speaking and share the same cultural val- ues as Quetta’s Pashtoons. Barely 40 percent of Pashtoon heads of households have been resident in Quetta since birth; the majority are migrants who arrived in the 1980’s.
Pasthoon tribal leadership is generally less influential, and in Quetta, distinctly so relative to the high status and power of Balochi tribal chiefs. Pashtoons tend toward muslim ortho- doxy and their religious leaders (mullahs) both enjoy great respect and exert substantial influence in all spheres of community life. Among Quetta’s ethnic groups, the Pashtoon, particularly the latest migrants, are the most conservative; favoring religious educational centers for their children.
H:X;onDat%WAKISTA33ZWina! RewnFR V d l\voll Ch9.doc

Ouetta WSE - Final Reuort. Volume 1 Chapter 9 I Paee 4
Quetta’s population is about 35 percent Baloch. They descend from formerly independent Balochi Kingdoms ruled by a feudal aristocracy of Sardars and Nawabs that once gov- erned much of present Balochistan. The Baloch tribe consists of numerous sub-tribes that vary in name, identity, and language. Balochi and Brahvi are the dominant language groups in Quetta, but Dewari and Saraki speakers are also present. More than 80 percent of Baloch heads of households have been resident in Quetta since birth.
Since the formation of Pakistan, Sardars, the Balochi tribal chiefs, have maintained and consolidated their influence over the Baloch population, and Quetta Balochis, for the most part, strictly uphold the traditional hierarchical system and maintain allegiance to Sardar patrons. Each sub-tribe has its own tribal representatives, including a hierarchy of Wal- dera, Malik, and Tokaree sub-chiefs, and below them a strata of elders, mullahs, and other respected community leaders. Baloch are generally not orthodox muslims, and their mul- lahs are less influential than those in the Pashtoon communities.
About ten percent of Quetta’s population is Hazara. This substantial minority largely de- scends from Hazara migration to Quetta from northern Afghanistan in the late nineteenth century. These settlers established themselves in Marieabad, which has remained their center since, and more than 90 percent of Hazara heads of households have been resident in Quetta since birth. Hazaras are differentiated by sub-tribes, but not so strictly as the other groups. There is a more ‘pan-Hazara” identity, and a higher degree of unity as a community than is found among the more fractional Pashtoon and Balochis.
0
Hazara are Persian speakers and Shiite Muslims, in contrast to the generally Sunni Pash- toon and Balochis. They are very religious, obedient to their religious leaders, and gener- ally less fundamentalist than the other groups.
An extensive social study of requirements and anticipated effects has been made, including socio-economic surveys, proposals to involve the beneficiaries, CBO’s and NGO’s in the decision-making on system design and implementation procedures, and assessment of the social impact of the project. For the eventual preparation of resettlement plans - not required for those project components that are proposed in the implementation program - an outline action plan has been prepared. Relevant outputs of the study are compiled in Volume 4 of this Final Report, reflecting the comprehensive attention directed at the social dimensions of the ensuing project, and establishing the agenda for activities to be carried out during im- plementation. Findings and recommendations are summarised as follows:
a
9.2 Poverty
The poverty line is the measure, which separates the poor from the non-poor. The poor are defined as those whose income, or consumption, falls below that standard. The poverty calculations based on different approaches estimate the poverty in Balochistan to be rang- ing between 14.8 to 29.2 percent. The below tables are based on the results of three ap- proaches used for measuring poverty. The figures provide a comparison for Pakistan and the province of Balochistan.
H:\ConDaI\Ber\PAKISTAN\233ZO~inal ReporWR V d l\wll -ch9.dcc

Table 9.1 : Poverty Indicators based on a Calorie-intake approach (2.250 @
MEASURES (Yo) HEAD COUNT
Pakistan Balochistan
Years
1986-87 1987-88 1990-91 1992-93 1993-94
26.9 26.4 23.3. 20.3 20.8 27.5 24.0 16.4 19.3 19.6
Source: Mahbub-ul-Haq Centre for Human Development 1999.
~~ ~
MEASURES (%)
HEAD COUNT
Pakistan Balochistan
Table 9.2: Poverty Indicators based on Basic Needs Approach (Based on Distribution of Expenditure)
~~~~
Year
1986-87 1987-88 1990-91 1992-93 1993-94
29.1 29.2 16.1 26.8 28.7 31.1 28.8 21.2 26.4 24.4
MEASURES (Yo)
HEAD COUNT
Pakistan Balochistan
Table 9.3: Poverty Indicators based on Basic Needs Approach (Based on Distribution of Income)
Year
1986-87 1987-88 1990-91 1992-93 1993-94
28.6 29.2 29.4 35.9 35.7 26.9 23.1 23.5 30.1 29.2
The calorie-based approach indicates that poverty has declined somewhat and is a bit lower than the national average. The basic needs approach, based on distribution of ex- penditure, also portrays a similar trend. If the terms of distribution of income are taken into account, the trend is quite different. It indicates that the situation has aggravated. One indicator cannot be used for income or consumption, because it provides a partial picture. In addition to non-economic measures of living standards like life expectancy and mortal- ity, access to clean drinking water, education, health facilities, public transport, sewerage, electricity, the factors of security and opportunity are also of a great importance while de- fining the poverty line. Although literacy rate has improved over the past two decades, it still stands near 26 percent. There are major disparities between the urban and rural popu- lation, and between men and women and literacy rate among rural women.
H\ConDat\Be~PAKISTAN\233ZO~n~ ReporWR Vol l\voll ch9.dcc

Quetta WSE - Final ReDort. Volume 1 Chapter 9 I Page 6
Twenty five percent of the population has been educated to the primary level, and 7 per- cent stepped forward beyond matriculation. The access to education beyond primary level in rural areas is limited particularly for girls. The access to safe drinking water and pri- mary health care is not available to nearly half the population. This situation is similar for Balochistan. The poverty in Pakistan in 1995 was estimated to be 44 percent. The Gov- ernment of Balochistan uses the figure of 22 percent for the number of households living below the poverty line for formulating poverty alleviation strategies.
0
9.3 Poverty Alleviation
9.3.1 Introduction
Poverty is a pervasive feature of the Service Area, and Quetta’s problems may be ap- proaching those of Pakistan’s larger urban areas. Quetta’s kutchi ubudis share their acute lack of social services, particularly safe drinking water, sanitation and sewerage. 0 Poverty levels reported for Balochistan are slightly lower than the national figures but many are based on population to service ratios. Quetta’s relatively higher social indicators, for example, are based on the census population, 742,969 in 1998, and drop severely against the estimated Service area population of 1.2 million. About one quarter to one third of Pakistan’s population falls below the poverty line in the narrower caloric, basic needs, and income level definitions of poverty. However, when poverty is considered in the broader sense, in terms of denial of opportunity in education, health, material well- being, job security, political and social freedoms, and other dimensions, Pakistan’s poverty profiles rise to almost half the population (between 44-47 percent). About 35 percent of the urban population are estimated to fall below poverty levels and 48 percent of the rural population.
Quetta’s poor are characterized by low levels of human resource development associated with food deficiency, lack of minimum income to satisfy basic needs, and deprivations of education, health, and other services. Disaggregated by gender, male poverty is estimated as 37.4 percent and female poverty as 51.9 percent. Balochistan has the lowest adult liter- acy in Pakistan, and female illiteracy in Quetta, in some estimates is close to 85 percent. Balochistan also has the nation’s highest infant mortality rates (IMR) for both urban and rural areas. Most lethal diseases in Balochistan and much morbidity are water-borne or related.
a
9.3.2 Project Measures
The ensuing Project is designed to provide major extension and improvement of public water supply to currently poorly served areas and populations. It includes substantial ex- pansion of both public taps and yard connections to service groups without house connec- tions or resources to acquire them. The project is also anticipated to include tariff provi- sions targeted to poor and low-income groups that will assure lifeline access and supply safety nets to buffer rate increases (compare chapter 13 of the present Main Report and chapter 1.4 of volume 6). a H\ConDat\BeWAKISTA33209Ftnal ReporWR Voll\voll ch9.doc

In particular consideration of the most pressing need for safe and reliable supply of drink- a
PUBLIC TAPS
ing water, the proposed rehabilitation and expansion program includes appropriate pro- portions of publickommunity taps and yard connections. These facilities can be swiftly connected at low technical effort and cost, and they facilitate overall resource development and main water distribution on feasible levels. Assuming gradual reduction of the rate of poor and low income groups in the Service Area, the anticipated development of relevant facilities and consumers is as shown in Table 9.4.
I
Table 9.4: DEVELOPMENT OF LOW-COST WATER SUPPLY
~~
Nos. Constructed Population served
YARD CONNECTIONS Nos. Constructed Population served
Year I 2000 I 2005 I 201 0
1500 2,000 2,500 100,000 130,000 160,000
20,000 25,000 31,000 200,000 250,000 31 0,000
Total Population I 1,200,OO I 1,350,OO I 1,570,OO
Low Income Popula- tion Served by the 300,000 380,000 470,000 Project
2015 I 2020 1,78:,00 I2,00:,00
3,000 3,400 180,000 200,000
530,000 I 600,000
The participation component also features provisions that will expand and strengthen rep- resentation and participation of the poor and other disadvantaged groups among stakeholders and in anticipated community advisory and consumer boards and committees. Hygiene education activities and reliance on NGOICBO partnerships are supported, to maximize social development processes within the project.
The project is also anticipated to provide substantial human resource development through training and other capacity building measures, and it will promote women's participation and gender sensitive implementation-both of which will contribute to social development objectives. It provides for enhanced integration of health and sanitation services and coor- dination with Government social action and poverty alleviation programs, and will pro- mote liaison and foster cooperative links and synergies with other ongoing development initiatives and projects, such as the Katchi Abadis Improvement Programs underway in some areas.
'
There is a considerable potential for project-related employment once physical imple- mentation gets under way.
Enhanced benefit monitoring will contribute to the minimization of benefit diversion. Planned public awareness campaigns and the extensive public involvement and benefici- ary participation incorporated in project implementation, including public representation on advisory and consumer boards and committees, will promote transparency and ac- countability which will provide another check.
H:\ConDat\BeWAKISTAM233209\Final RepomFR V d l\vollchS.doc

The program also includes provisions for a mid-term evaluation of project impacts, in- 0
cluding poverty reduction and benefits distribution, which will be carried out by an inde- pendent organization external to the project. Enhanced monitoring and this evaluation will provide the basis for adjustments during project implementation.
Project implementers should consider the significant opportunities that are present for sub- stantially increasing and expanding project benefits and enlarging the project’s contribu- tion to overall urban and human resources development.
9.3.3 Monitoring criteria and indicators
Monitoring criteria and indicators should identify whether project impacts are reaching intended beneficiaries with desired impacts. These indicators should be monitored with information collected from household surveys and GOB data. The following types of data should be collected and monitored regularly:
Per capita income - total, urban and rural; Income distribution; Ratio of total income captured by the richest 20 percent to the poorest 20 percent; Poverty line, and percentage of population below it; Education achievement profile; Employment profile; Population with access to health facilities; Access to safe drinking water Access to sewerage & sanitation Development of infrastructure Pollution free environment Women and gender development Infant mortality Population growth rate; and Rural - urban disparities.
The information specified above should be collected regularly and reviewed frequently during the first two years of project implementation supported during a first phase by a technical assistance team, with particular focus on the important beneficiary sub popula- tions. The need for any adjustment in project components, and implementation arrange- ments to better respond to beneficiary needs, should be identified in mid-term review.
9.4 Gender Disparities
9.4.1 Introduction
All three of Quetta’s major ethnic groups share the institution of purdah, although their practices vary. Purdah is promoted by a set of cultural values associated with women’s proper behavior, shame, and honor that supports a system segregating women from all
H:\ConDat\BeWAKISTAM233209~nal ReporIFR V d l\voll -chS.dcC

Quetta WSE - Final Report. Volume I Chapter 9 / Paee 9
men other than their closest relatives. It divides social life into two strictly segregated spheres, one of the outdoor, public life of men, and the other, the indoor, secluded life of women. The conservative Pashtoon, typically practice strict seclusion of women, and most Pashtoon women between the ages of 14-45 seldom or never leave their family com- pounds. Hazara seclusion of women is less strict than Pashtoon, and women shop freely and are less heavily veiled. Among the less orthodox Baloch, most women are free to shop in neighborhood markets, visit nearby houses, and exert influence in domestic matters.
In addition to ethnic diversity, the city reflects extremes in income and standards of living. While lifestyles differ importantly among Quetta’s ethnic groups, these differences are often less pronounced than those between the more modem and affluent urban core areas and housing estates and the remnant rural villages and swelling migrant settlements that surround them.
9.4.2 Gender Impact
The human resources development and poverty reduction benefits outlined above will have their greatest impact on women who suffer higher levels of poverty and endure lower levels of human resources development such as education and health than men.
Women are major potential beneficiaries of an ensuing Project. Levels of human resources development in the beneficiary population are lowest for women. Proposed water supply and other environmental improvements, including hygiene education, will complement vital woman and child health programs and women’s education. Accompanied by appro- priate social preparation efforts, the ensuing Project has potential for improving the status of women.
Proposed water supply and sanitation improvements will directly reduce women’s burdens associated with obtaining water and managing household water uses and empower women by enhancing domestic control over water use.
The ensuing Project will also contribute to greater gender equity through targeted meas- ures to involve women and women’s organizations in project design and implementation employing gender-sensitive approaches to participation and social mobilization. These in- clude deployment and capacity-building of women social mobilizers and community out- reach workers.
0
9.5 Benefit Monitoring and Evaluation
Project planning and implementation have recognized that the complex social context of the Project, high risk of diversion of project benefits, and relative novelty of potential project implementation modes will require unusual levels of coordination and adjustment. The ensuing Project anticipates that pro-active benefit monitoring and evaluation features will be necessary during implementation to provide feedback and guide adaptive response to changing circumstances in the Service Area.
H\ConDat\BenPAKISTAM233209\Final RewrWR Vol l\vollchS.dcc

Ouetta WSE - Final Reuort. Volume 1 Chauter 9/Paee 10
Appropriate measures and mechanisms for social monitoring of project implementation 0
are necessary. Social assessment suggests a strategy and approach to monitoring that should guide efforts.
Due to the limited experience of implementing agencies and a mixed record in similar projects, an effective monitoring and evaluation system, supported by Technical Assis- tance during a first phase, will be of great importance during project implementation to track social benefits provided and indicate where adjustments and corrective measures may be necessary. A high risk of diversion of project benefits is present; and the ensuing Project will rely on partnerships with NGOs, CBOs, and beneficiaries that, if unproduc- tive, may serious delay project implementation and success. Frequent evaluation by an in- dependent agency or organization will also be necessary.
Performance indicators for participation, beneficiary contributions, and benefits derived that should be incorporated in overall project monitoring. This includes monitoring of benefit achievements during project implementation, and evaluation of impacts of benefits during implementation and after project completion.
Monitoring the impact of project interventions on poverty reduction and the other social dimensions significant in the project will require a relatively long-term commitment as project benefits may gestate slowly.
Benefit monitoring and evaluation exercise may be carried out in three steps. Initially at the start of the project. This will be to develop a baseline socio-economic database and monitoring indicators to assess the impact of the project on the community in general with the special focus on Gender issues, poverty reduction, indigenous people and human de- velopment issues. Based on these database and quantified monitoring indicators the monitoring and implementation exercise will be carried out in the middle of the project and at the end and the comparisons will be drawn to identify early the needs for correction measures, if necessary.
9.6 NGO/CBO Involvement
Beneficiary participation and involvement are important factors towards the feasibility and success of the project, and participatory development processes were mainstreamed in project preparation activities. The Interim Report documents the extensive array of stakeholder and beneficiary involvement carried out during Phase 1. It includes a detailed report on the Stakeholders’ Consultative Workshop that summarizes expressed stakeholder concerns and other public comment, and also reports the results of the household-level so- cio-economic survey and the many community-level consultations that were held.
Project preparation included, furthermore, the development of community participation arrangements with local CBOs and NGOs. The ensuing Project will rely on community organizations as partners in the implementation of many components and depend on communities to accept and sustain project measures. CBO participation and capacities to partner key aspects of project implementation will be facilitated and strengthened by proj-
H:\ConDat\BehPA)(ISTAM233209\Final ReporIWR Vol l\voll ch9.doc

ect-assisting NGOs, who will also play important roles in expanding public awareness of 0
- .
project concerns and promoting community-oriented conservation.
The following procedures for NGO/CBO involvement and measures to enhance BWASA capacity to engage and manage NGO/CBO partners have been adopted:
a) Formation of CBOs
The number of CBOs to be formed depends on the localities to be served by the project. The QMC core service area has 58 wards consisting of 229 localities. Allowing for ad- joining suburbs, the number of localities increases to ca. 250, with an average number of about 295 households or approx. 2,241 people per locality. With at least one CBO for each locality, the total number required comes to 250 CBOs for the project area.
Staggering the formation of 250 CBOs over a period of five years, the annual number comes to 50 CBOs including the association, activation and reorganization of the CBOs that already exist - depending on the number of localities or households to be served by the project.
The steps in formation of CBOs are:
Form 50 CBOs, including the existing CBOs, every year, reaching 250 by the fifth year, viz. - - Conduct orientation on relevant aspects of the project for all CBOs, in- cluding existing CBOs formed during the year. Strengthen and consolidate the CBOs formed in the preceding year/years, through training, capacity building etc. Organize and conduct campaigns, in accordance with requirements of proj- ect activities launched, in the localities for - Awareness raisinghuilding - - Dissemination of useful information, - - Hygiene education, Register the CBOs formed, if ready and required, under the relevant Act.
Associate the existing active CBOs in the work area. Activate and revive passive CBOs, in the work area.
Motivation, education and mobilization of communities
Improving water supplier - consumers relationship,
These CBOs should perform the following:
0
0
Carryout
Motivate, educate and mobilize beneficiaries/ communities for collective effort. Enroll all beneficiaries (households) as members. Inculcate self/ mutual help and realize self-reliance. Implement / carry out planned activities:
- Awareness raising campaign, - Dissemination of useful information
H:\ConDat\BeAPAKISTAM233209Wnal ReportWR Vol l\voll -ch9.dw

0 9 Cha ter 9/ e 12
- Hygiene education - Water conservation Up grade/ build capacity - Participate in training programs - Acquire know how and skills - Train activists as sub professional cadres Supervise / oversee and help in water supply, sanitation, solid waste dis- posal and environmental improvements. Collect and resolve water, sanitation, solid waste disposal, and pollution is- sues of respective localities. Plan and implement, on self help and mutual help basis, improvement and extension of on-going activities. Support and assist BWASA in collection of water tariff, installation of wa- ter meter, repair and improvement efforts. Work for improvement of relationship between BWASA/water supplier and consumers.
b) Associating NGOs
Quetta has many NGOs, out of which over 50 are performing activities in line with the project components. Those being associated with project implementation should be formed into a council of NGOs for the Quetta Water Supply and Environmental Improve- ment Project, and should work closely with the Community Development Unit (CDU) of BWASA, which works as secretariat for the council. With the chief CDU as ex-officio member secretary and MD BWASA as patron, the council’s chairman is from among the NGOs in turn for a period of three months. The council should meet at least once a month in order to:
Discuss the BWASA Plan of Action for provision / extension/ improve- ment of its services and facilities. Deliberate on issues in implementation and their resolution. Review progress of work entrusted to member NGOs. Suggest measures for strengthening the NGOs/CBOs sector and benefici- aries participation.
The Quetta metropolis has about half a dozen big ethnic groups like with Pashtoon, Hazara, Baloch and Brahvi as well as settlers from other parts of Balochistan, Pakistan and elsewhere. Each locality should be entrusted to the NGO with relevant expertise for working with the resident ethnic group.
The NGOs should perform the following:
Associate/activate/ strengthen existing CBOs. 0
Plan and conduct. Motivate, educate and mobilize communities to organize their own CBOs.
- Awareness Raising Building Campaigns 1. Information dissemination
H : \ C o n O a t \ B e ~ ~ I S T A N \ 2 3 3 Z O ~ n ~ ReDorWR Vol l\voll-ch9.doc

: Cha ter 9 / h e 1
0
0
a
0
a
.. 11. Water conservation 111. Hygiene education iv. Water tariff collection V. Water meter installation
...
- - Conferences, Seminars and workshops for CBOs, communities at
Assist, guide and lead CBOs in preparation and implementation of action plans for Water Supply, Sanitation, Solid Waste Disposal and Environment Improvement Monitor and evaluate CBOs work. Collaborate with BWASA and related government departments (PHED, Ir- rigation) and other agencies including donors, and NGOs. Participate inkontribute to efforts of BWASA and other agencies at local, provincial and national levels. Formulate rules/regulations for CBOs required from time to time in pursu- ance of their activities/objectives. Act as umbrella organization of the formed CBOs and help them register, if ready and required, under the relevant Act. Encourage CBOs to generate and utilize productively their own resources. Undertake projects/work on contract from government and private sector agencies, and donors independently or as partners. Generate funds and resources through regular activities, periodic cam- paigns, and special efforts by itself for the CBOs.
Training for CBOs and their office bears and local cadres.
Quetta and locality levels.
c) BWASA Community Development Unit (CDU)
BWASA has two female Monitoring Officers, four Social Organizers (2 female and 2 males), one each Public Relation Officer and Hygiene Educator (both females) with re- lated support staff (drivers etc). Their reorganization into a Community organization Unit, adequately strengthened, is proposed for realizing the avowed objective of beneficiaries involvement envisaged under the project. Figure 9.1 shows the suggested organization of the CDU.
The CDU should have the following personnel:
1. Consultant / Advisor CM/ICE & T- 2. Chief CDU - 3. Deputy Director SOM 18
18 5. Monitoring Officer 17 6. Social Organizers
a. Male 17 b. Female 17
7. Hygiene Educator 17
4. Deputy Director IEC & Training
Ns
4 4 2
H:\ConDat\Ber\PAKISTAN\233209\Final ReportWR Vol 1 \voll-chRdcc

8. Public Relation Officer 17 . 2 (Media)
The CDU will be supported by members of the community advisory forum and media ad- visory forum.
The CDU will perform the following major tasks:
s
0
0
0
Provide described guidance and direction. Facilitate implementation of activities. Streamline the roles of NGOs and CBOs Monitor work of NGOs and CBOs Evaluate performance of NGOs and CBOs Assess impact of the project activities Arrange training of its personnel in Community Participation and Devel- opment inside Pakistan (at ARD and NIPA Quetta, NCRD Islamabad, PARD Peshawar, NRSP and other NGOs etc) and abroad. Organize public hearings, seminars, conferences and workshops at Quetta level and at community levels. Preparation of action plans for associating NGOs and CBOs, and for setting up of CBOs in the project area in accordance with implementation of ac- tivities. Formation and provision of secretariat services to council of NGOs associ- ated in the project. Prepare documents and execute negotiations of work contracts with NGOs and CBOs. AnnounceM oat BWASA plan of activities for implementation inviting NGOs role. for community mobilization and participation of beneficiaries.
d) BWASA - NGO Partnership
0 Terms and Conditions: These are defined for concrete tasks, depending on the activity, time and area of work, and partnerships with other projects. Roles and Responsibilities: Almost all the NGOs and CBOs consulted ex- pressed their willingness to share responsibilities in implementation of the project. Main issues, further detailed in the Sector Report, are: - Community / beneficiary participation - Water supply and conservation - Sanitation - drainage and sewerage - Solid waste disposal - Environment - Hygiene education
H:\ConDai\Be~AKISTAM233209\Final RepottFR Vd l\wll-ch9.doc

9 Cha ter I e 1
Social Organizers Monitoring Officers Hygiene Educator Media Relation Oficer Male = 4 Female = 4 Female = 2 Female = 2 MaldFemale = 2 BPS-17 BPS-17 BPS-17 BPS-17 -
a
- C O M M U N I T I E S
Figure 9.1 ORGANIZATIONAL STRUCTURE BWASA COMMUNITY DEVELOPMENT UNIT
I ManagingDirector
Local Subhfessional /Activists Male / Female For different Community Level Activities in each CBO
I

Ouetta WSE - Final Reuort, Volume 1 Chauter 9 / Paee 16
9.7 Water Use and Ability to Pay
Project surveys indicate the current situation among urban water users in the Service Area. Surveyed households received water supply from 7 sources. More than three-quarters of households were supplied by BWASA. The non-BWASA remainder were served, in de- scending order, by tube wells (12%), (the Cantonment Board (6%), PHED (4%), other wells, Military Engineering Service, and karezes. Several of these households had access to more than one source of supply, and some surveyed households had no water connec- tion and obtained supplies from neighbors or nearby businesses or tubewells.
Survey results indicate that BWASA supplies insufficient water, particularly during sum- mer monthis to most surveyed households and neighborhoods. Water is distributed une- qually across the service area and, when available, is often provided at inconvenient times. Water quality is frequently poor. Where present, sewage lines often cross water pipes that are frequently corroded or broken and lack pressure, enhancing potential contamination. 0 All families who were supplied by BWASA had house connections. Service was intermit- tent and irregular. About 80% of the BWASA-supplied households received water once a day or less. Beginning in the early hours of the morning and continuing to as late at mid- night, the service zones in the city are provided water for brief periods. Among households surveyed, those receiving water reported durations of availability from 15 minutes to 2 hours. Less than 7% of households received water for longer than one hour per day. More than 40% received water for less than half an hour daily, some for less than fifteen min- utes.
The survey of BWASA consumers indicated that overall scarcity of supply was typical throughout the service area. Some respondents reported receiving water for only 15 min- ‘Utes a day (and complained that the amounts delivered through a ?h inch pipe in that period was insuffiicient for household needs. Many expressed frustration with irregular service schedules ,and associated uncertainty and emphasized the inconvenience occasioned by unpredictable and often night-time timings and the scramble to fill all available containers before the water stopped. Consumers complained that these circumstances engendered a constant sense of ‘emergency’ disruptive of family life.
@
Many households reported that BWASA-supplied water contained rust, mud, and sludge contamination from aged and corroding pipes, poor pressure, and criss-crossed water and sewage lines. Many surveyed consumers in a satisfaction survey of BWASA customers also complained of transmission problems, including choked pipelines due to silted wells, and of poor water quality.
Given supply irregularities, nearly all surveyed households displayed elaborate arrange- ments for water storage. These included a variety of ground-level, below ground, and roof- top puce tanks and various metal and plastic containers including portable drums, hamans, mushkeezas, tire-rubber barrels, and buckets.
H\ConDanBeWAK1STAM232O~nal RepoMR Vol l\voll th9.doc

Eighty percent of surveyed households relied primarily on brick, cement, or sheet metal e
storage tanks, most of them at ground-level or on roof-tops. Reported tank and storage container capacities ranged from 50 to more than 3000 gallons. Most households reported storage capacities of less than 275 gallons.
Sixty percent of surveyed households relied on or supplemented limited B WASA-supplied water with water from their own wells, with water purchased from other suppliers, or with water acquired from other sources. Almost 30% of households reported one to two pur- chases per week from commercial water tankers. Prices varied from Rs 120.- to Rs 150.- for a 1000-1200 gallon tanker; and were Rs 180.- for a 1400 gallon load. Average monthly water expenditures for these households, in addition to the BWASA tariff, was between Rs 500.- to R:s 600.-. More than half of households purchasing tanker supplies, however, re- ported spending Rs 100.- to Rs 200.- per month.
Most responding households in a consumer satisfaction survey of BWASA customers also reported purchase of water for domestic use; and 82% of them spent more than Rs, 200 per month to supplement BWASA-received supplies.
Many households, both on the BWASA network and off, relied exclusively on tanker- supplied water. Others secured water from neighbors with dug or tubewells or from other neighborhood sources, when no public supply was available.
Surveyed lhouseholds reported daily water use mostly in terms of storage and container units. More than 20% of households used one or close to one tank daily. About half of these reported 50% to 100% higher consumption levels during the summer months.
About 10% of households reported daily water consumption in terms of hamans. More than half of these used one haman per day and the remainder reported higher consumption levels, particularly during summer.
About 17410 of surveyed households reported water consumption in terms of drums and buckets. More than half of these households used one drum daily, and most of the remain- der two drums. Household use reported in buckets ranged from 8 to 20 buckets per day. a Nearly onethird of surveyed households reported daily water use in gallons. Consumption levels ranged from a low of 50 gallons per day to 4000 gallons with an average daily household consumption of about 350 gallons. More than half of these households reported daily consumption of 150 gallons or less. Half of all households reporting water consump- tion in gallons indicated 20-100% increase in water use in summer months.
To meet needs, households - often with the collusion of BWASA personnel - are com- pelled to resort to illegal practices such as suction pumping. Many polled households in a consumer satisfaction survey of BWASA customers reported that it was often necessary to use suction pumps to access water when it was available in their neighbourhood or local- ity.
Levels of ,service provided by BWASA are low and facilities are inadequate. Water bills are not provided in a timely or regular fashion, and accumulated lumped charges pose payment difficulties for some consumers. 0 H:\ConDat\Ber\P~:ISTAM233209\Final Repo~iFR Vol 1\vol1 ch9.doc

Ouetta WSE - Final Reuort, Volume 1 Chauter 9 I Page 18
Water supply sources and services in the rural communities of the Service Area are widely observed to be inadequate. In many cases, existing systems, many of them traditional, are in decline and rural domestic water-users face diminished water quality and escalating time and resource expenditures to secure supplies.
Willingness to pay is generally present, especially as manifest in household and commu- nity demand for the project and interest in participation and involvement in project imple- mentation, although it, too, is less than universal for proposed sanitary sewerage and solid waste disposal improvements.
Social analysis also indicates that ability to pay for proposed project improvements is con- strained by poverty and low incomes in a considerable proportion of the Service Area population. This is especially the case for levels of service to be provided by sanitary sew- age and wastewater improvements and for water costs that may be associated with poten- tial water resources development.
Monthly expenditures in surveyed households ranged from Rs 1,500.- to Rs 45,000.-. Av- erage monthly household expenditures were Rs 10,411 .-. Almost 70% of surveyed house- holds had estimated monthly expenditures less than Rs 10,000.-, placing them in low and medium income groups. Nearly one-third of all surveyed households had average monthly expenditures of less than Rs. 5,000.-.
0
For more detailed discussions and recommendation on water and sanitation tariffs and ability to pay considerations please refer to Volume 6 , Chapter 1.4 and Chapter 13 of the present report.
9.8 Public Awareness and Water Conservation
In the context of water conservation, building public awareness is a major aspect of the participatory agenda of the ensuing Project; one that is fundamental to involving the public and beneficiary communities in many aspects of project implementation, including opera- tion and maintenance of investments, conservation, hygiene education, and support for policy, institutional, and tariff reforms.
a
Project preparation included a review of public awareness objectives pertinent to an ensu- ing project, including characteristics of key stakeholders. With regard to water conserva- tion, and based on the relevant findings during the relevant surveys and workshops, public awareness campaigns have been designed and partly implemented, that focus on the fol- lowing messages:
0 meter installation
0 unauthorized connections poorO&M
0 social components
leak detection and reporting improvement puncture the main pipe to get a supply of water
H:\ConDanBe~PAKISTAM233209\Final RepoMR V d l\voll -ch9.doc

0 traditional practices 0 inadequate storage facilities 0 use of suction pump 0 water contamination 0 unnoticed economic burden 0 conservation attitudes
Under the active cooperation of a Media Advisory Forum established on the project's rec- ommendation, these messages are conveyed through:
a) Multimedia Communication
0 Television Programs': The objective is to inform, educate and persuade 80% of viewers to adopt responsible behavior in conserving drinking water and help im- plementing conservation strategy measures. Radio Programs and Promotional Spots: to provide information on water conser- vation to over 60 per cent listeners and educate female listeners on importance of clean water, water born diseases and conserving drinking water by adopting water conservation measures. Regional Press: to provide update news and views on all-round development is- sues relating to water supply and conservation for potential readers of Urdu or English local newspapers.
0
b) Face-to-face Educational Communication
0 Target Group Communication: to motivate, mobilise and involve beneficiaries in the design and implementation of the project at all stages, particularly in the eventual installation of water meters, and implementing conservation strategy measures including hygiene education. Water Conservation Education: to educate school children in conservation of water and environment including hygiene education through the formal and in- formal educational systems.
0
a c) Public Relations and Documentation Center
To improve communication between all stakeholders by providing effective pub- lic relations internally and externally and establish a documentation center aiming at serving the information to all categories of users of information and improving BWASA's public relations.
During the transmission of messages /information it is necessary to install a built-in monitoring system which facilitates collecting of feedback and responses of the targeted population. Each campaign component will thus be systematically monitored to determine acceptance of the contents, quality of messages and frequency. The effect and impact in relation to overall objectives achievement will also be collated making the following mechanism operational:
a ' a 25 min. film on water conservation has been prepared and is currently broadcast on PTV Quetta channel
H:\ConDat\Ber\PAKISTAM23320mFinaJ R e D o f l R V d l\voll -chg.doc
i

Ouetta WSE - Final Report. Volume 1 Chaoter 9 / Pave 20
- Quarterly reports obtained from QTV
Readers, Listeners and viewers responses through letters Effect assessment through designing of a questionnaire Impact study at the mid- term and final phase of the project.
- Assessment report of PBC - - -
9.9 Hygiene Education
Phase 1 of project preparation included a preliminary review of the existing situation in the Project Area regarding health and hygiene-related aspects of water supply, sanitation, drainage and solid waste. This review, including household, hospital, and school surveys, provided an assessment of hygiene education needs, and included recommendations for:
0
0
0
0
water treatment to reduce Contamination; awareness-building activities among beneficiaries and implementing agency staff; capacity-building of PHED personnel for promotion of hygiene education; and design of a community-oriented training package, including monitoring and supervision of program implementation.
The hygiene education study also provided recommendations for PHED activities includ- ing:
0
enhancement of participatory approaches and beneficiary involvement; deployment of village level and community-based implementers; development of IEC, motivation, and awareness materials; and training of CBOs and village-level staff.
Interim recommendations were refined in Phase 2 of project preparation and a hygiene education component has been developed for incorporation in the ensuing project. The proposed program will be implemented in conjunction with Social Action Plan targeting of poverty-level beneficiary sub-populations and other disadvantaged beneficiary groups including women. This sub-component of the ensuing Project’s Participation Component package, detailed in the Sector Report, Volume 4, is summarized as follows:
a
a) Scope
Hygiene education in the project area includes messages on hygiene, better health, safe water and improved environment. Women will be encouraged to form their independent groups for receiving hygiene education, antenatal and postnatal care and advice for newborns. Special programs will be introduced for school children, aimed at making hygiene, health, safe water, improved water and water conservation practices a way of life. The core target group will be the poor and deprived who look forward to better health and hygiene opportunities, thus enabling them to improve their livings and environment.
H:\ConDat\Ber\PAKISTAN\233ZO~n~ RepomFR Vol l\voll chPdoc

Ouetta WSE - Final ReDOrt. Volume 1 Chaoter 9 / Pase 21
Objectives include:
0
0
0
0
0
0
Provide social, health and environmental development through improved hy- giene practices and their maintenance. Introduce and Improve hygiene measures for safe water Prevent water borne diseases and environmental diseases by providing hygiene education and provision of safe water. Provide improved sanitary practices and their maintenance Co-ordinate with poverty-focused environmental protection and conservation agencies and departments Involvement of NGOs and CBOs in hygiene education
b) Lessons
Hygiene education has to be treated as a long term initiative. At the inception stage the focus will be on awareness creation of the problem and preparing the community to join hand in the move- ment for improving social sector services. Lessons are prepared on basic issues and problems in order to equip the field staff with unified and standard lesson plans on the following issues:
m- 0 General Health 0 CleanlinessPersonal Hygiene 0 Water and Disease 0 Disposal of Waste 0 School Hygiene and Health Issues
c) Establishment of a Hygiene Education Section in BWASA
Presently BWASA has one hygiene educator. Together with social organizers from Public Health Engineering Department (PHED), the hygiene messages can be extended to the target population. Since the persons involved have, at present, a variety of other commit- ments, the establishment of a proper section in the proposed Community Development Unit of BWASA - cooperating with PHED and NGOs/CBOs on a routine basis - is rec- ommended. Equipment and logistical support are handled by BWASA. Relevant activities include:
a 0 Training of Field Staff 0 Comprehensive Baseline Survey 0
0
0 Workshops, Seminars and Publications
Compilatioflevelopment of Information, Education and Communication Material Elaboration and Implementation of Action Plans
As an output of the proposed activities, it is envisaged that measurable effects will be con- stituted on community health and poverty reduction due to improved hygiene and health information and facilities offered through the project on the basis of
0
0
Increased knowledge on hygiene and improved health care practices Use of safe water and knowledge on water born diseases
H:\ConDat\Ber\PAKISTAM233209\Final ReportVR V d l\voll -ch9.doc

Quetta WSE - Final Report. Volume 1 Chapter 9 / Page 22
Sharing through community participation
Benefits of personal hygiene and clean environment Advantages of sewerage and improved sanitation Water conservation and non-structural water loss reduction practices
a
Financial requirements for the proposed Technical Assistance components are estimated at:
1. Social Action Program (SAP)
Duration : 200 1-2003 Input 24 MM local Social Development Specialists: 96,000
Training: 75,000 Compliance plans, Consultation, Evaluation 75,000 Social surveys 75,000 Computer, equipment & Support 50,000 Transportation, Travel, Perdiem 75,000
cost US$446,000
2. Public Awareness & Community Oriented Conservation Program
Duration : 200 1-2005 Input 06 MM Community Dev. Expert
12 MM Communication & Media Expert 48 MM Community Information Officers NGO Support Water Conservation Education Mu1 timedi a campaigns Target Group Communication PR & Documentation Center
cost a 3. Hygiene Education Program
Input Duration : 200 1-2005
30 MM Public Heath Specialist 180 MM Social Organizershlygiene Educators logistical support TrainingMaterials development
cost
24,000 48,000 96,000 75,000 10,000 56,000 20,000 19,117
US$348,117
120,000 360,000 200,000 100,000
US$780,000
H:\ConDat\Ber\PAKtSTAM233209~n~ AepoNFR Vol l\voll chQ.doc

Ouetta WSE - Final Reoort. Volume 1 Chapter 9 I P a ~ e 23
4. Benefit Monitoring & Evaluation a
Duration : 2001 - 2003 Input 4MM Community development specialist 16,000
6MM M & E specialist 24,000 6MM Programmer !8,000 24MM Social organizers 48,000
cost US $106,000
Total Base Cost : Physical Contingencies (15 %) : Taxes (14 %) : Price Contingencies (17 %) :
US$978,117 US$146,717 US$157,477 US$217,993
GRAND TOTAL : 0 US$1.5000304
9.1 0 Resettlement Requirements
Project design, including proposed surface water resource development and selection of technical options for sanitation and wastewater treatment, avoids resettlement. Prelimi- nary designs suggest that water and wastewater transmission lines will be largely accom- modated in existing right of ways and not require significant land acquisition. Land for the proposed impounding reservoir, the solid waste disposal site and the wastewater treatment plant is uninhibited. The land usage pattern changes with the passage of time. Some of the land may he used for agricultural purposes and other lands may'be used as natural re- settlements. Therefore, determination of compensation rate cannot be estimated accurately at this early stage.
The land usage pattern changes with the passage of time. Some of the land may be used for agricultural purposes and other lands may be used as natural re-settlements. Therefore, determination of compensation rate cannot be estimated accurately at this early stage.
The ensuing project may require land acquisition for groundwater resources development, solid waste disposal, and drainage and flood control improvements. The Social Action Plan contains provisions for preparation of resettlement action plans when and if they are required. Resettlement impacts and requirements should be examined in the course of en- gineering design proposed for these components, and PAP census and baseline studies should be carried out in conjunction with derailed design of these components-- either by counterpart PMU staff or by the PIU once it is established, as per SAP provisions.
Project design, including proposed surface water resource development also avoids in- digenous peoples impacts. Proposed development of groundwater resources outside the Quetta sub-basin in the ensuing Project may potentially produce impacts on indigenous people. The Social Action Plan contains provisions for preparation of indigenous peoples development plans should this become necessary. Once proposed explorations are com- a H : \ C o n D a t \ B e ~ P A K I S T A ~ 2 0 ~ i n ~ RepomFR Vol l\voll ch9.doc

pleted, indigenous peoples impacts should be examined in the course of engineering de- sign proposed for these components, and PAP census and baseline studies should be car- ried out in conjunction with derailed design of these components - either by counterpart PMU staff or by the PIU once it is established, as per SAP provisions.
a
For reference, the Sector Report, Volume 4 of this Final Report, contains:
Resettlement Plan Outline 0
0
TOR for Baseline Socio-economic Surveys and Resettlement Action Plan Preparation Indigenous Peoples Development Plan Guidelines
adapted for eventual use in the scope of the further project execution.
9.1 1 Indigenous People Development Plan Guidelines
The ISA indicated that an ensuing Project may affect indigenous people and require prepa- ration of a project-wide Indigenous Peoples Development Plan (IPDP).
Project design, including proposed surface water resource development avoids indigenous peoples impacts. Proposed development of groundwater resources outside the Quetta sub- basin in the ensuing Project may potentially produce impacts on indigenous peoples. The Social Action Plan contains provisions for preparation of indigenous peoples development plans should this become necessary. Once proposed explorations are completed, indige- nous peoples impacts should be examined in the course of feasibility studies proposed for these components, and PAP census and baseline studies should be carried out in a con- junction with derailed design of these components-- either by counterpart PMU staff or by the PIU once it is established, as per S A P provisions.
The policy states that Bank-assisted development should avoid negatively affecting in- digenous peoples, and provide adequate and appropriate compensation when a negative impact is unavoidable. Under the policy, Bank development efforts should ensure that de- velopment initiatives affecting indigenous peoples are effective and sustainable. Further, such initiatives should be compatible in substance and structure with the affected peoples' culture and social and economic institutions, and commensurate with the needs, aspira- tions, and demands of affected peoples.
0
According to the policy, development initiatives should be conceived, planned, and im- plemented, to the maximum extent possible, with the informed consent of affected com- munities, and include respect for indigenous peoples' dignity, human rights, and cultural uniqueness. Moreover, they must include clear mechanisms for accurate, objective analy- sis of the circumstances of indigenous peoples and incorporate transparency and account- ability.
The IPDP must include specific measures and approaches to be taken to address issues affecting indigenous peoples. A project negatively affecting indigenous peoples must be appropriately redesigned to mitigate negative effects, or include an acceptable compensa- a H:\ConDat\BeWAKISTAN\2332O~nal RepoMR V d I\vollchO.doc

tion plan; the provision of compensation should not be a substitute for efforts to avoid or mitigate negative effects a project may have. The indigenous peoples plan forms a basis for project implementation and for monitoring and evaluation of how the project deals with indigenous peoples issues. Specific components or provisions of the plan must be in- cluded in the project design, and the plan should address questions of sustainability of the proposed project as well as questions of its implementation.
The policy provides that proper protection of indigenous people’s rights may require im- plementation of special project components outside the primary project’s objectives that include health and nutrition and other activities.
These brief guidelines for preparing an Indigenous Peoples Development Plan (IPDP) are based on detailed work of the World Bank and ADB policy, Every feature indicated may not be applicable to an ensuing Project and to the realities of Balochistan and Pakistan, but they are a guide which can be used by GOB P&D, BWASA, and/or other implementors as they develop plans which may be necessary to deal with indigenous peoples issues and concerns.
Given the vulnerability of indigenous peoples to negative effects of externally-initiated development interventions, the planning and implementation of donor-assisted water re- source development projects need to be supported by a plan that addresses the specific needs of indigenous peoples that may be affected. Both the World Bank and the ADB stipulate in their policies that Bank-funded projects should include an indigenous peoples development plan. Key features of such plans, as outlined in Bank policy guidance, are summarized below.
Key features of an IPDP’s overall design are that the plan:
a
Reflects full consideration of the options preferred by the indigenous peoples; Is informed by studies that attempt to anticipate trends likely to develop as a result of the project; Utilizes simple implementation arrangements, yet recognizes the need for specialized skills for interacting with indigenous peoples; Reflects consideration of relevant patterns of social organization, religious beliefs, and resource use; Supports sustainable indigenous production systems; Minimizes indigenous peoples dependence on the project and enhances their capac- ity for local control; Reflects the need for long lead times throughout the project; and Builds on any relevant existing programs.
Implementation of the IPDP may involve activities relating to health and nutrition, pro- ductive infrastructure, linguistic and cultural preservation, entitlement to natural resources, and education.
H:\ConDat\BeWAKISTAM233209\Final ReportFR V d l\voIl -chE).doc

Ouetta WSE - Final Report. Volume 1 Chauter 9 / Paee 26
Key elements of the content of an IPDP should be: 0
e An assessment of the legal framework and the capacity of the indigenous peoples to use the legal system to promote their rights; Baseline data that convey the key dimensions of the indigenous peoples’ way of life; Arrangements for ensuring long-term land tenure rights; A strategy for local participation throughout the project; The identification of mitigation activities (e.g. relative to education, health, credit, and legal assistance); A preliminary assessment of need and subsequent plan to strengthen the capacity of governmental, non-governmental, and indigenous people’s institutions to play an ef- fective role in both the project itself, and in the on-going development of the indige- nous peoples; An implementation schedule; Plans for monitoring and evaluation; and Cost estimates and a plan for financing the indigenous peoples development plan.
H:\ConDat\Ber\PAKISTAM233209\Final ReportFR Vol l\voll ch9.doc

Chaoter 9 I Pace 27 Ouetta WSE . Final Reoort . Volume 1
9 . COMMUNITY DEVELOPMENT AND SOCIAL ISSUES ........................................ 1 9.1 Background ................................A. .............................................................................
9.1.1 Income ............................................................................................................... 1 1
9.1.2 Poverty .................................................................................................................. 1 9.1.3 Gender 2 9.1.4 Ethnicity ............................................................................................................... 3
9.3 Poverty Alleviation .................................................................................................... 6
..................................................................................................................
9.2 Poverty ....................................................................................................................... 4
9.3.1 Introduction ....................................................................................................... 6 9.3.2 Project Measures ............................................................................................... 6
Monitoring criteria and indicators ..................................................................... 8 9.4 Gender Disparities ..................................................................................................... 8
9.4.1 Introduction ....................................................................................................... 8 9.4.2 Gender Impact ................................................................................................... 9
9.5 Benefit Monitoring and Evaluation ........................................................................... 9
9.7 Water Use and Ability to Pay .................................................................................. 16 Public Awareness and Water Conservation ............................................................ 18
9.10 Resettlement Requirements ................................................................................. 23 Indigenous People Development Plan Guidelines .............................................. 24
9.3.3
9.6 NGO/CBO Involvement 10
9.8 9-.9 Hygiene Education 20
9.1 1
e ..........................................................................................
..................................................................................................
H : \ C o n D a t \ B e r \ P A K I S T ~ ~ Z O ~ l n ~ ReportWR V d l\voll-chQdoc

10. ENVIRONMENTAL ASSESSMENTS

Quetta WSE - Final Report. Volume 1 ChaDter IO/Page 1
10. ENVIRONMENTAL ASSESSMENTS
10.1 Introduction
The present Chapter 10 provides an overview of the Environmental Studies carried out in the scope of project preparation. Findings in accordance with the relevant guidelines of the Islamic Republic of Pakistan and the Asian Development Bank are detailed in Volume 3 of the Final Report on the Quetta Water Supply and Environmental Improvement Project summarizes and. It contains the following main sections:
A. Water Supply: describes the project’s initial environmental examinations (IEE) and points of particular consideration for environmental impact assessment (EIA) for the en- visaged water supply schemes, with particular emphasis on the envisaged impounding res- ervoirs for surface water. Since the augmentation of additional surface water schemes are not part of the ADB project, an IEE has been executed for the surface water projects.
B. Waste Water: gives environmental impact assessments (EIA) on the investigated op- tions for waste water treatment plants in Quetta; and in
C. Solid Waste: an environmental impact assessment (EN) for the existing solid waste disposal site which is proposed to be upgraded and continued to be used. It was considered appropriate to include the solid waste component in the study, although it is not particu- larly requested in the Terms of Reference to this project.
The main objectives of the project are:
The assessment of policy options and institutional arrangements to encourage ef- fective drinking water production, distribution and allocation by demand driven pricing, as well as investigations and recommendations of the most economically viable, socially and environmentally acceptable and financially sustainable water supply scheme for Quetta, along with improved sanitation, hygiene education, drainage and wastewater treatment. To conduct initial studies of the environmental impact of different project com- ponents and technical options.
0 To analyze positive and negative effects of each project component (technical op- tions) on the baseline conditions.
This study is thus prepared in order to provide a comprehensive view of the project’s po- tential environmental impacts, and to give clear indications on institutional requirements, environmental monitoring programs and recommended further action for those options eventually selected for implementation.
H:\ConDat\BeWAKISTA33209\Final ReportFR Vol l\vo11 -chl O.dm

Ouetta WSE - Final Reuort. Volume 1 Chauter 10 / Paee 2
10.2 Legal Requirements 0
The national Environmental Protection Agency of Pakistan (EPA) has - on the basis of the Pakistan Environmental Protection Act 1997 - prepared “Palustan Environmental Assess- ment Procedures” to carry out environmental assessments. The respective national law on environmental impact assessments (EIA) is not yet ratified and is therefore not yet applied in all provinces of Pakistan. Likewise, relevant provincial procedures and standards are still to be implemented.
The draft policies and procedures of environmental assessments of the national EPA indi- cate the projects for which a complete environmental impact assessment is required. In this respect, the present project is concerned with:
Water Management, Dams, Irrigation and Flood Protection
0 Dams and reservoirs with a maximum storage volume of greater than 50 mil- lion m3 or a surface area greater than 8 km2. Irrigation and drainage serving more than 15,000 hectares 0
Water Supply and Treatment
0 Major urban water supply infrastructure, including major head works and treatment plants.
Waste Disposal
0 Waste disposal and/or storage of hazardous or toxic wastes (including landfill sites, incineration of hospital toxic waste)
0 Waste disposal facilities for domestic or industrial wastes, where more than 10,000 m3 of waste will be handled annually.
0 As the rehabilitation of the existing site and the extension of this site. will have only small effects (mainly odor emissions) on the environment the revised IEE becomes now the complete EL4 for the site. Nevertheless, the groundwater level must be confirmed and the permeability of the soil has to be checked once again.
A comprehensive list of major Pakistan environmental laws and regulations is compiled in the Sector Report.
H:\ConDat\BehPAKISTAM233209\FinlII ReportFR Vol l\voll-chl O.dm

10.3 IEE - WATER SUPPLY 0
10.3.1 Options Investigated
In the Interim Report, specific attention was paid to water quality and measures to stop contamination of groundwater, and to Initial Environmental Investigations (IEE) for the optional development of additional surface water resources. These investigations were then further refined and complemented during the second phase of the project with the logical emphasis on potential dam sites. In order to provide a comprehensive view of the eventual environmental impacts of the three shortlisted technical options:
Mangi Dam Kuchnai Dam Burj Aziz Khan Dam,
the initial environmental studies were continued to cover all three options, notwithstanding the fact that a pre-selection of the Kuchnai Dam Scheme for technical and economic rea- sons had taken place in the meantime. Thus, the relevant Sector Report, Volume 3 of this Final Report, presents for each of these options the IEE, that forms a basis for subsequent Environmental Impact Assessment (EM) in the scope of final engineering design. A com- plete EIA requires more time, at least 4-5 month for each of the solutions (dams). This time was not available and not foreseen by the Bank. IEE’s were therefore prepared. In ad- dition, a specific scope of work and terms of references could also not be carried out due to the lack of available time. If the EIA for solid waste disposal - which was not foreseen in the TOR of the present project - would not have been carried out enough would probably be available to define TOR and a scope of work for the EIA’s of the dams. Nevertheless, some basis recommendations for TOR’S for a complete E M study for the dams are pre- sented in subchapter 6 of the present chapter as well as in the sector report.
In this Chapter, the main findings of surface water related environmental investigations are summarized, together with recommended supporting technical monitoring and institutional
0 programs.
10.3.2 Summary of Findings
The main findings of the present study are:
0 The construction of the proposed dams will have moderate to major impacts on the natural environment. Human life will be affected as well as settlements and villages, which are in, or near the project areas.
0 Water conflicts due to the use of water in the downstreadupstream of the dams can occur when water is also used for irrigation, drinking or other purposes.
0 In case of Burj Aziz Khan Dam international conflicts can not be excluded as Pishin b r a passes the border to Afghanistan.
H:\ConDat\Ber\PAKISTAM233209Final ReDorWR Vol l\voH chl0.doc

Ouetta WSE - Final Reuort, Volume 1 Chauter 10 / Paee 4
Contamination of the reservoir can occur, as surface waters are sensible at any time to pollution. Contaminated inflows into the reservoirs are possible. This will probably have an effect on the quality of the supplied water. A constant water quality can not be guaranteed as the Pishin Lora is a rain fed river where the water quality can change in dependence on the contamination of the dry riverbed in summer.
0 In two cases residents are present in the reservoir areas and must be resettled. This can be a costly variant, as compensations must be paid and new villages must be constructed.
The envisaged projects are classified in category “A” (significant adverse environmental and social impacts) according to the Bank’s guidelines. They are generating major and moderate effects and impacts on the environment as well as social impacts concerning the residents in two of the three investigated reservoir areas. An Environmental Impact As- sessment (EIA) is required for the selected project in the scope of final engineering de- sign. The result of the present Initial Environmental Examination study (IEE) on the envis- aged dam sites lead to the following ranking in respect of their environmental and social impacts:
a
1. Kuchnai Dam (lowest impacts) 2. Mangi Dam (medium impacts) 3. Burj Aziz Khan Dam (highest impacts)
Specific problems, further addressed in the Sector Report, include:
a) Project Location
The proposed location for Mangi Dam is approximately 50 km from Quetta City. In the reservoir area, a small settlement and some orchards and other agricultural activities are found. The region is moderately grown over with bushes and grass but only scarce trees and bushes are found near the river beds with some stagnant water ponds. The possible effects on wildlife are considered minor. The reservoir area is very flat and evaporation will probably result in large water losses. Adequate solutions for resettlement must be found for up to 30 persons, but are not expected to impose major problems.
The location of Kuchnai Dam is approximately 25 km from Quetta City, in the upper reaches of the fertile Hanna valley, which also is attractive to local tourists. The impound- ment area can be seen as a “wild area”. No settlements, villages or houses are located in this area and no urbanization is planned. The entire valley is under military administration. The flooding will affect natural environment, mainly trees, bushes, grass, and the existing wildlife, including, insects, reptiles, rodents as well as birds and higher wildlife will be affected to a certain extent. Aquatic life like fish can be colonized in the reservoir, com- bined with all aquatic species that will develop naturally over time.
The location of the envisaged Burj Aziz Dam is approximately 57 km from Quetta City. The region seemed to be not very fertile for agricultural purposes; in addition, water is missing for irrigation. Nevertheless, villages and settlements are existing and small or- chards as well as small agricultural fields are there. The region is scarcely grown over with 0 H:\ConDat\Ber\PAKISTAN\233209~inal RfmorWR VoI l\vo11 -chl O.doc

small bushes and grasses, dry during summertime. Trees and bushes are mainly found near the riverbeds of Pishin Lora and its tributaries and some stagnant water ponds. The possi- bly affected wildlife is currently not known; respective investigations should be carried out. The proposed site is suitable for the construction of a dam, with an impounded area of maximum 44 km2. Evaporation will result in significant water losses. In conclusion, the region seemed ecologically not so precious. Even if a great area is flooded, the vicinity of the reservoir area is not very different from the flooded area. A loss of endangered vegeta- tion and wildlife can probably be excluded. Villages and settlements are existing in the reservoir area that must be shifted to other places. Adequate solutions for resettlements must be found for that reason.
Aquatic life like fish can be colonized in the reservoir, combined with all aquatic species that will be developed naturally over time.
Concerning the locations of the envisaged dam sites, major impacts will be created for wildlife and flora. Impacts for residents will be small for Kuchnai Dam, moderate for Mangi Dam but major for Burj Aziz Dam.
a
b) Design
In the reservoirs, excessive growth of algae can not be excluded. Nutrients (mainly phos- phates) can be drained with the river water into the reservoirs. A contamination with other chemical substances can also not be excluded as the reservoir water and the supplying riv- ers are not protected against pollution. However, this risk is assumed as small to moderate as Balochistan is not heavily industrialized. Problems of contamination will mainly derive from untreated human wastewater.
The downstream flows of affected rivers will be significantly reduced, which may generate negative environmental impacts for the wildlife and flora as the availability of water will be reduced. The groundwater flow under the riverbed may possibly decrease and the re- charge rate of the groundwater can be reduced. Investigations on these effects are recom- mended. Irrigation schemes located downstream of the dam will also be affected. This can generate water use conflicts, especially for Burj Aziz Dam, where Afghanistan interna- tional rights are a factor. Downstream of Kuchnai Dam positive flood control effects are of significant extent.
a
During construction of the dams, some effects on the environment are to be expected. However, stronger environmental impacts will derive from flooding the reservoir and the reduction of downstream flow in the rivers, and restricted water use.
Water transmission mains may affect the environment through possible erosion due to cor- rosion, rupture, and leakage of the pipes.
H:\ConDal\BeWAKISTAM233209\Final ReportWR Vol l\voll -chl O.doc

Ouetta WSE - Final Reoort. Volume 1 Chaoter 10 I Page 6
c) Construction
The main impact on the environment will be the generation of dust and noise, but these effects will be localized and temporally limited. Hazardous substances (fuel, oil, lubri- cants, chemicals etc.) used during construction machines, engines etc. must be stored properly to avoid contamination.
Safety of workers can be affected, as the construction of high dams is more dangerous than construction of normal buildings. Appropriate labor protection measures must be applied.
Eventual dust, noise and vibration emissions should be taken into consideration, but are not seen as a problem as no major settlements are near the sites in question.
d) Operation a - The main impact is related to the flooding of the valleys behind the dam. All wildlife and flora in the reservoir areas will be strongly affected. In addition, sedimentation of solids, especially during the rainy season must be taken into account. Negative effects related to sedimentation can be, instability of the dam, reduction of the reservoir's volume and ef- fects on aquatic life.
Excessively high salt concentrations in the raw water have been found in Pishin Lora river'. Treatment at the water works will produce brine with high salt concentrations and treatment sludge, which must be properly disposed. Reverse osmosis (RO) has been pro- posed for treatment of raw water from Burj Aziz Khan Dam. However, further routine and long-term monitoring is required to optimize the level of water treatment.
The reverse osmosis plant may require reassessing and resizing with special consideration also of the nature of anions and cations in the water, and the behavior of salts (TDS) in the reservoir.
Treated water from Burj Aziz Dam is foreseen to be chlorinated in the transmission over a
more than 56 km can have significant chlorine consumption and unsafe water may reach the consumers.
Positive effects of the dam projects may derive from a recharge of groundwater in the res- ervoir area, development of new flora and fauna, and fishing activities linked with genera- tion of employment and provision of protein.
Further environmental enhancement measures will be included in the proposed Environ- mental Assessment study on the selected dam site.
Max.: BWASA September 1999: 10,500 mgA dissolved and ionized salts Cfrom stagnant pond) NESPAK Dee. 89 - 94:
I
6,000 - 10,000 mgA a Jan./Feb. ~2 ,000 mgA
H:\ConDaI\Ber\PAKISTAN~33209Final ReportWR Vol l\voll shl0.doc

Ouetta WSE - Final Reuort, Volume 1 Chapter 10 1 Paee 7
10.3.3 Conclusions and Recommendations a
The main recommendations are:
0 To determine the reduction of downstream flow during filling time of the reser- voir to counteract eventual negative environmental and social impacts for the wildlife, flora and residents in the downstream area.
0 To control the groundwater flow in the riverbeds in the downstream region. 0 To monitor discharges and contents of TDS in Pishin Lora River.(and other riv-
ers in the area!) on a regular routine basis. 0 To carry out chlorination of treated water if withdrawn from Pishin Lora first in
Quetta city as the transmission main can have a significant chlorine consump- tion and unsafe water can reach the consumer in Quetta.
0 To check the transmission mains against erosion, illegal connections and leak- age.
0 To implement an environmental monitoring program to ensure water quality and to check all relevant parameters frequently.
0 For the water supply of Quetta, to check the tubewells in the suburban areas - especially in the northern and southern well fields - for pesticides.
The environmental management programme (environmental mitigation measures and a monitoring programme) is mainly presented in the sector report. A detailed environmental management programme should be carried out with the EIA if one of the dams will be se- lected as an additional technical option for water supply. It can not be provided in the pres- ent study due to the fact that only nine weeks were provided for the evaluation of all the proposed technical options of the project (drainage, water supply, waste water, solid waste disposal). The EIA to be carried out should also provide an institutional analysis of the concerned environmental management programme (Environmental Protection Agency).
The envisaged projects are classified in Category “A” (significant adverse environmental and social impacts) according to the Bank’s guidelines. An Environmental Impact As- sessment (EM) is recommended for the selected dam site. This has to address: e
- Alternatives, - Anticipated environmental impacts and mitigation measures, - Economic assessment, - Public involvement.
These items are briefly presented and discussed as follows:
a) Project Components
To provide sufficient drinking water until 2020 the present project (Quetta Water Supply and Environmental Improvement) proposed the following measures concerning water sup- ply:
H:\ConDat\BeWAKISTAN\233209Winal Rapolt\FR VoI l\vo11 chlO.doc

Ouetta WSE - Final Reuort. Volume 1 Chapter 1 0 I P a ~ e 8
1. Reduction of water losses and waste of water (structural and non-structural) inclusive rehabilitation and optimization of the existing wells and drinking water distributing sys- tem.
2. Exploitation of new groundwater resources in the limestone aquifer and enlargement of the distributing system.
3. Exploitation of additional groundwater resources in the Zarghoon Range.
4. Exploitation of surface water resources through an integrated system utilizing the pro- posed new Kuchnai Dam in conjunction with the present dams and facilities:
- Rehabilitation of Wali Tangi - SpinKarez - -
Hanna Dam and Hanna Lake, combined with the Rehabilitation and expansion of the existing water works.
Exploration of additional surface water resources in the area was recommended. Decisions on eventual construction of Mangi or Burj Aziz Dams depend on actual development in the Service Area, and can be postponed until more supporting information is on hand.
The technical options presented above show, that Mangi Dam and Burj Aziz Dam are less sound environmental solutions. The priority of these dams is further delineated in Final Report Volume 2.1 Section A, Water Resources.
b) Anticipated Environmental Impacts and Mitigation Measures
1. This section of the IEE report is one of the most important as it will evaluate item by item the expected impact of the project on each resource or value wherever any significant impact is expected. This analysis is the key presentation in the report and if not sufficiently completed, it may be necessary to delay the project. To carry out this evaluation and analy- sis at least three or four weeks are necessary to investigate the environmental and social conditions upstream of the dam and downstream, respectively. This should be carried out for any of the three technical options (3 dams), if taken up. In the present project, Kuchnai Dam is proposed with other technical measures (see above). It is recommended to investi- gate the complete “package” of this technical option (Kuchnai Dam, Wali Tangi, Spin Karez, Hanna Dam, water works) in the required EIA study. The need of time for this EA study is estimated to 4 - 5 person-months for each consultant in the EIA team. If other water supply schemes are envisaged for construction (Mangi or Burj Aziz Dam) a com- pletely new EIA report and investigations should be carried out.
2. For each significant adverse environmental impact, the EIA report will carefully explain how the project pladdesign minimizes the adverse effects. The main effects of the pre- sented additional surface water supply schemes are the flooding of the reservoir and reset- tlements of residents in the case of Mangi Dam and Kuchnai. Alternative could be to re- duce significantly the height of the dam to reduce the flood area. This would have an ad- verse effect on available storage and consequently on bulk water deliveries to Quetta. 0 H:\ConDat\BeWAKISTAN\233209Final RepoltFR Vol l\voll -chlO.doc

Ouetta WSE - Final Reuort. Volume 1 Chapter 10 / PaEe 9
3. The EL4 report will identify the extent to which the proposed project would irreversibly curtail the potential uses of the environment.
4. In the event the construction phase of the project involves special environmental im- pacts, these will be separately discussed including proposed remedial measures.
c) Economic Assessment
This section of a future EL4 report will include:
- costs and benefits of environmental impacts and - costs, benefits and cost effectiveness of mitigation measures.
0 An economist should be included in the EIA team.
d) Public Involvement
Public participation and involvement are important aspects of social review, both during initial social assessment and throughout project preparation. Achievement of project ob- jectives will rely to an extent on public participation in water conservation measures and involvement of community based organizations and beneficiaries in project implementa- tion. Project preparation includes design of public awareness and participation component to be delivered in association with community based organizations (CBOs) and non- governmental organizations (NGOs). Anticipated activities are expected to promote a res- toration of public confidence in service providers by making both, proposed improvement measures and regulation of sector activities more understandable to beneficiaries. Public involvement, beneficiary participation, and the participation of those who may be ad- versely impacted by project action in mitigation planning are mandatory under ADB's policy. A large number of stakeholders, in addition to beneficiary populations are affected by potential project actions, particularly in water resources development and management. These stakeholders have perspectives whose consideration can improve designs, promote project acceptability, and facilitate project implementation.
a
10.4 EIA - Wastewater Disposal
10.4.1 Options Investigated
In the scope of Phase 1 of the project, four options for system arrangement and appertain- ing treatment plant sites were presented, namely: 0
Technical Option 1: Technical Option 2:
Central Treatment Plant at Kili Barmah (BKH) Reconstruction of the Cantonment Treatment Plant and con- struction of Kambarani Plant, reduced BKH Plant a
H:\ConDat\BeAPAKISTNW332OQFinal ReportFR Vol l\voll -chlO.dcc

Quetta WSE - Final ReDort, Volume 1 Chaoter 10IPaee 10
Technical Option 3: Reconstruction of Cantonment Plant, construction of Kam- barani Plant (reduced), Government Degree Plant and BKH Plant (reduced) BKH Plant (Phases I and 11) and Kambarani Plant Technical Option 4:
The technical options for wastewater treatment plants were evaluated using a checklist, and classified according to the ADB guidelines. The methodology for the evaluation is presented in the sector report. The evaluation lead to the following ranlung of sitehystem options:
1. Central Plant at Kili Barmah (BKH) 2. Kambarani Plant 3. Cantonment Plant 4. Government Degree Plant
Taking into consideration the above ranking, the site at Kili Barmah and a system with a single, central treatment plant is evaluated as the best solution for Quetta’s future waste- water scheme. For the technical options that also include the construction of several treat- ment plants, the one presented in Technical Option 1 is evaluated as the most environ- mentally sound solution for future treatment of Quetta’s wastewater. The Interim Report favored technical option 4 as the best solution for Quetta’s wastewater treatment. This was done taking into account that at that time only a combination of a number of treatment plants were required by the partners to treat the wastewater as only one treatment plant was assumed not to be sufficient for the treatment of the wastewater of the entire city. So best technical and environmentally soundest solution of a combination of different treatment plants was the technical option 4. This option was no more envisaged in the ongoing proj- ect. Only one treatment plant is know proposed, the one from technical option 1 (BKH).
This solution has also economic and operational advantages over the other options investi- gated, and the surrounding areas downstream of the plant hold great potential for accom- modating additional agriculture, using treated effluents for irrigation. Consequently, Tech- nical Option 1 was chosen as the Selected Variant to be implemented in the scope of the project.
0
e In addition to the overall piped sewerage scheme, the technical planning envisages Private On-site Facilities in parts of the Service Area. These solutions are independent of the above technical options but have also been considered in respect of their environmental impact. Generally, on-site treatment of wastewater has its full justification in locations where connection to a piped system proves to be highly uneconomic. The envisaged reuse of pretreated wastewater (from private septic tanks or small community plants) for irriga- tion of gardens would have a positive effect on general attitudes, towards water conserva- tion, and is therefore highly supported. Minor negative effects on groundwater quality are outweighed by the overall environmental improvement, well constructed and maintained on-site wastewater disposal facilities will bring.
H:\ConDat\Ber\PAKISTAM233209\Final ReportFR Vol l\voll -chl O.dw

Ouetta WSE - Final Reuort. Volume 1 Chauter IOlPaee 11
10.4.2 Summary of Findings a
As no or only small impacts are expected from the realization of Technical Option 1, the Initial Environmental Examination (IEE) carried out in Phase I of the project becomes the Environmental Impact Assessment (EIA). The Selected Variant is classified in Category “C” according to ADB Guidelines.
The further description of particular problems and points of consideration refer to the Se- lected Variant. Full detailed descriptions of all options investigated are compiled in the relevant Sector Report, Volume 3 of this Final Report.
Particular problems, include:
a) Project Location
The proposed wastewater treatment plant near E l i Barmah village is located northwest of the airport, approximately 15 km away from the center. The land is flat and in the vicinity a small area is currently used for agriculture. The treated water can easily be used for irri- gation.
a
No special wildlife and flora will be affected when the plant is constructed - on the con- trary, improvements of flora are expected. Endangered species are not existing in this area, as it is mainly dry land or agricultural land. It is not yet known if the area around the planned treatment plant will be in future used for settlements. Currently a few houses and settlements are under construction some 700 - 1000 m away from the proposed site.
No interference with other utilities and no nuisance hazards to neighboring areas exist. Displacement and resettlement is not required. Historical and/or cultural monuments or areas are not affected.
Environmental problems due to the project location can in general be excluded.
a b) Design
Pakistan National Environmental Standards for municipal and liquid industrial effluents are existing, but are still in discussion in Balochistan. It is foreseen to implement the pro- vincial environmental standards at the end of 1999 (EPA, 1999). The treated effluents will not exceed them if the treatment plant is operated in an appropriate manner. As the indus- trial density is low in Quetta, the treatment plant will probably receive no or very small quantities of hazardous substances.
Nevertheless, according to experiences in other countries there is a risk of effluent quality exceeding standards due to poor operation of the plant. However, talung into consideration the water quality standards and the proposed treatment process, it is assumed that possible impacts on the environment would be minor. (This applies to all the proposed treatment plants presented in the technical options.)
H:\ConDal\BeAPAKISTAM233209\Final ReDortWR Vol l\voll -chlO.doc

c) Construction 0
For this technical option, no environmental problems are associated with construction ac- tivities. No major settlements are close to the area. The activities to be carried out are mainly normal civil engineering measures (excavation and construction). Worker’s health and safety precautions are to be respected by the contractor. Dust, possible fumes, noise and nuisance emissions are in the normal range correlated with civil engineering measures and do not affect the view of nearby residents.
Excavated material can be deposited close to the site, as there is enough space - if not used for construction of levees. There is no need for transportation over any significant dis- tances.
The problems during construction stage are assumed as not significant for the selected op- tion. a d) Operation
The only wastes that are ejected are treated wastewater and sludge. As there are only a few industries located in the city and its surroundings, it can be assumed, that the wastewater and in consequence the generated sludge will not be heavily or moderately contaminated with hazardous substances. Pathogenic germs may occur; but their lifetime in the treatment plant has to be investigated under realistic conditions (after finalization of all construction work and during routine operation conditions). The rate of survival of pathogenic germs in a normal operated treatment plant is in the range of 0 - 5 %.
The cited hazards - except limited survival of pathogenic germs - will therefore probably not occur in the proposed wastewater treatment plant. No hazardous chemicals will be used during treatment. In consequence, the associated risks can be set at “no significant effect“ for all the presented technical options. Inadequate operation may lower the treat- ment effects, but nevertheless, the chemical parameters eventually exceeding permissible limits will predominantly be non-toxic. The effects indicated in the relevant checklist are set as “small”.
0
In conclusion, the problems during operation are anticipated to be small for all the treat- ment plants presented in the technical options.
e) Environmental Enhancement Measures
Currently most of the city’s wastewater is conducted in open drains into nearby natural streams and receives no treatment. The wastewater is contaminated with different biologi- cal vectors and residents can easily get in contact with pathogenic germs in this situation. An appropriate wastewater collection and treatment system is urgently required.
H:\ConDat\BeWAKISTAM233209lFinal ReportWR VoI l\voll -chlO.doc

Quetta WSE - Final Report. Volume 1 Chaoter 10 / Page 13
Potential enhancement measures are focused on: 0
- underground sewers that will reduce the contact with pathogenic germs and flooding of streets treatment of the sludge for agncultural use (anaerobic stabilization) reuse of the treated water for agricultural purposes reduction of odor emissions by appropriate treatment of wastewater and sludge.
- - -
10.4.3 Conclusions and Recommendations
All the four presented treatment plants as well as the presented technical options for con- struction of treatment plants are classified in Category “C” (unlikely to have significant adverse environmental impacts) according to ADB’s “Environmental Assessment Re-
0 quiremen ts”.
Positive effects of the plants are:
- use of treated water for irrigation - recharge of groundwater - use of sludge as fertilizer - dilution of contaminated river water - economic advantages in case the treated water and sludge are sold.
The Selected Variant with a central treatment plant at Kili Barmah village represents the best solution with the lowest environmental impact.
As none of the technical options investigated have major impacts and only few show mod- erate impacts, the revised Initial Environmental Examination carried out in the scope of the present TA becomes the complete Environmental Impact Assessment (EIA), and addi- tional environmental studies are not required for any of the plants considered.
The institutional responsibilities, for the treatment plant must be clearly defined, including lines of decision, job description where all the main tasks and responsibilities are de- scribed in a clear and understandable manner. Those responsible on the plant as well as in the technical department, must have clear guidelines to act immediately in case of irregu- larities.
e
To secure a proper functioning of the treatment plant it is necessary to employ trained staff, and follow-up training courses, on the job training, should be attended at least every two years.
H:\ConDat\Ber\PAKISTAM233209\Final Report\FR Vol l\voll -chl O.dm

I Ouetta WSE - Final ReDort. Volume 1 Chauter lOlPaee 14
As environmental standards in the Province of Balochistan are still pending implementa- tion*, a monitoring or environmental survey has actually no legal basis. However, the op- eration of the treatment plant needs to ensure that there is no accumulation of hazardous substances in the soil with irrigation by regularly monitoring. A further consideration is the dilution of the polluted river water with adequate treated wastewater. It is therefore rec- ommended to install an environmental monitoring program. The following main parame- ters should be monitored frequently:
0
- Biological Oxygen Demand (BODS) - Chemical Oxygen Demand (COD) - Nitrate - Nitrite - Ammonia - o-Phosphate
- Conductivity - TDS
- PH
- Sedimentation.
The proposed monitoring program for the effluents of the treatment plant should be carried out at least every four months in the first 3 years of operation. If the results do not show significant differences and are not exceeding the limit values, analyses can be reduced to a frequency of twice a year. After a couple of years the determined concentrations of the above listed parameters are stable (tolerance 20 %), the sampling frequency may be re- duced to once a year.
10.5 EIA - Solid Waste Disposal
10.5.1 Options Investigated a The technical options for solid waste disposal are detailed and classified according to ADB guidelines in the Sector Report. This Chapter provides an overall view of the potential en- vironmental impacts of investigated options, and the relevant findings and recommenda- tions for improvement.
At present, solid waste disposal is operated and maintained by Quetta Municipal Corpora- tion (QMC), but executed unsatisfactory. The current system of solid waste disposal in Quetta consists of
In discussions held with the Provincial Environmental Protection Agency, the provincial standards will be enforced till the end of 1999. National environmental quality standards are presented in the Sector Report.
H:\ConDat\BeliPAKlSTAN\233209~inal ReportVR Vol l\voll c h l O.dm

Ouetta WSE - Final ReDort. Volume 1 Chauter lOlPage 15
- - - -
individual transport of waste to garbage bins and containers in the city. collection of the waste by QMC with dumper and arm-roll trucks transports to a disposal site approximately 10 km outside of town open dumping of the waste at the site.
The average solid waste generation in the overall service area is around 0.35 kg/c,d. With an estimated total population of 1.2 million inhabitants, approximately 420 dday of solid waste are currently generated. In the QMC area, specific waste production is higher (around 0.65 kg/c,d) but the collection rate comes only to about 33 %. In Cantonment the service is better with closer to full collection. In the suburbs and surrounding villages, little or no regular waste collection is carried out. A major portion of refuse is burnt on site or dumped in the nearest drain or other convenient location.
In the scope of this project the following options and stages of improvement were investi- gated:
1. Rehabilitation of the existing open dump site 2. Extension of the existing solid waste disposal site (sanitary landfill) 3. Construction of a new solid waste disposal site
0
Although not particularly requested in the consultants’ Terms of Reference, it was consid- ered appropriate to include the solid waste component in the present study and the ensuing project proposal. Relevant technical details are compiled in Chapter 7 above.
10.5.2 Summary of Findings
It can be stated that only small environmental problems are likely to occur due to the proj- ect location whilst operating or during construction under appropriate conditions. A possi- ble influence of groundwater quality must be confirmed as the groundwater level is esti- mated in a depth of appr. 90 m. However, if properly designed, constructed and operated, the envisaged sanitary landfill will cause only small adverse effects. 0 Eventual risks during normal operation of the sanitary landfill site can arise from:
- Dust emissions - - - - Settlement and decomposition - Odor generation
Toxic or inflammable gases (COY C a y H2S, etc.) Health hazards due to flies, mosquitoes, rats and other vectors of disease Contamination of soil and groundwater in case of inadequate disposal
However, the proposed site is evaluated in Category “c“ (estimated to have no or small adverse environmental impacts) according to the ADB classification.
A complete Environmental Impact Assessment (EM) is not required. The present revised IEE becomes the completed EIA, as the environmental impacts are relatively insignificant. If the site is properly maintained, a drainage system is installed for the collection of drain- a H:\ConDat\Ber\PWISTAM233209\Final ReportFR Vol l\voll t h l O.dw

age water, and the drainage water is appropriately treated, a contamination of the ground water can most likely be excluded.
0
Specific environmental aspects have been reviewed in respect of:
a) Project Location
The proposed site for solid waste disposal is already used as a dumpsite. There are no set- tlements, houses or residents close to the site. Smell, dust and other emissions affect there- fore mainly the workers on the site. The land is arid and has practically no vegetation. Fauna and flora will be not affected. The currently used site is not protected against leachate water, which can infiltrate into the soil. A contamination of the groundwater is not assumed, but needs further confirmation through survey bore holes.
The site is ecologically not of interest. The ground is gravelly and consists mainly of coarse-grained stones and dust. The groundwater table is reported to be some 90 m below ground level. From geological, hydrogeological and general points of view the following can be stated:
- The proposed site does not have steep slopes; no rock and scree slides are expected. The area underlain by Ghazij formation and Bostan clays was studied to assess possible mud flows in the landfill area and found that no such flows are expected to occur at the disposal site. Erosion problems can occur everywhere in Quetta valley as the mountains are rugged and are consisting of barren rock, devoid of soil and vegetation, causing rapid runoff and flush floods during rare rainfall events. The pos- sible sites of rapid erosion are Sariab b r a and Kuchlak Valley. One kurez passes north of the disposal area; potential liquefaction and subsidence have to be counteracted. Protection against occasional flush floods from the nearby small nalluh, and against sheet flow from the hill side is required. Due to the absence of groundwater in the immediate area of the disposal site the chance of land subsidence is very remote. Foundation failures are possible by earthquakes or landslides. The later will not occur on the disposal site. Earthquakes can of course cause foun- dation instabilities. The site is located about 1,6 km off the main road.
-
-
-
-
-
-
-
In general, it can be stated that no environmental problems will probably occur due to the project location. A possible negative influence on groundwater quality must be confirmed.
H:\ConDat\Ber\PAKISTANU33209Final ReportFR Vol l\voI 1 -chl O.doc

Ouetta WSE - Final ReDort. Volume 1 ChaDter lOlPage 17
b) Design 0
The proposed design envisages upgrading of the existing open dump to a controlled sani- tary landfill, to be established in its initial stage by a contracting firm, and subsequently extended to the full size of the 27.7 ha (procured earlier by QMC for that purpose) in the scope of regular landfill operation.
Generally, problems related to design are as follow:
- soil contamination, - groundwater contamination, - - smell and dust emissions, - photogenic calamities.
missing of a drainage system for rain and leachate water,
If the site is planned and designed following the proposal set forth in the Sector Report: the landfill site will cause only small adverse effects. These would be mainly odors, which cannot easily be avoided.
0
c) Construction
The main interference for the environment during rehabilitation of the existing dumpsite and construction of its extension or the construction of a new sanitary landfill site will be excavation measures. It is planned to excavate cells with a depth of 5 - 8 m where the waste will be filled in. These measures will not have any negative effects on the environ- ment or the ground. All other construction measures will have no effect on the environ- ment, as the measures are normal civil engineering activities. Dust emission has to be ex- pected, which, however, will not affect the environment nor the distant settlements. Exca- vated soil can be stored on site and used for levee construction and cover material of the waste layers.
Construction of buildings (guard house, maintenance facilities, equipment stores etc.) will a
also not have any adverse effects on the environment.
It is assumed that there are no moderate or major problems related to the construction stage of a new solid waste disposal site. The waste is filled into the partly excavated cells, compacted by heavy equipment and covered with soil. Significant environmental problems during construction are not to be expected.
H:\ConDat\Ber\PAKlSTAN\233209Winal RepolfWR Vol l\voll -chlO.dm

Ouetta WSE - Final Reuort. Volume 1 Chauter 10/Pape 18
d) Operation a
Problems during normal operation of the sanitary landfill site can include:
Dust emissions due to movement of vehicles and compression equipment. The proposed program envisages provision of equipment for periodical sprinkling with water to reduce this problem and, furthermore, improve compaction and enhance decomposition of organic material. Decomposition of matter waste is producing inflammable and toxic gases. The design considers installation of gas collectors and appropriate equipment for fire control will be provided. Applying a proper soil cover can control vectors breeding. The soil covers also discourage birds foraging which especially feed on uncovered solid waste. For possible soil and groundwater contamination, sealing of the cell bottom and adequate leachate collection and treatment facilities are envisaged. In spite of proper compaction, settlement and decomposition occurs at all land- fill sites. The settlement depends primarily on the type and quantity of the waste and the degree of compaction provided. Experience shows that the set- tlement occurs between 1 - 25 % after 2 years. If wet waste is dumped (e.g. nightsoil), the settlement can occur much earlier, within 2 - 4 weeks. Decompo- sition of organic matter in the waste depends on permeability of the cover ma- terial, depth of burial, volume of rainfall, moisture content of the waste, putres- cence of the waste and the presence of microorganisms. Odorous gases occur in all sanitary landfill sites, due to the decomposition of organic matter in the waste. It is not easy to avoid or to reduce them. EU direc- tives state that a distance from settlements should not be less than 200 m. Rap- idly and continuously covering of freshly dumped waste with soil and a sealing surface to prevent emission of gases, can reduce to production of odors.
0
0
0
0
0
The above listed items are evaluated to be mostly moderate or low during operation stage, provided the site is properly designed, constructed and operated. If so, adverse environ-
0 mental effects are unlikely.
These measures should be carried out in a systematic way, a management program for the site and the collection of waste should be available and installed at QMC administration. Clear definition of responsibilities as well as job descriptions for the concerned staff must be available.
10.5.3 Conclusions and Recommendations
The options/development stages investigated in the scope of the present TA are estimated to have no or only small adverse environmental impacts, According to the ADB classifica- tion, they rank in Category "C", and the present revised IEE becomes the completed EIA.
H:\ConDat\BeWAKISTAM233209\Final Report\FR Vol l\vo11 c h l O.doc

Ouetta WSE - Final Reuort. Volume 1 Chauter IOlPane 19
With a view to overall improvements in the sector, the following is put to note: 0
a) Environmental Enhancement Measures
Appropriate and efficient collection of solid waste in the city of Quetta is a prerequisite to a healthy urban environment, functioning drainage and protected groundwater quality. To ensure an environmental safe disposal of waste and to enhance hygienic conditions, the following environmental enhancement measures should be carried out:
0
0
0
Appropriate collection of the waste in the city with appropriate equipment and closed lorries. Sweeping of the streets of Quetta to enhance and ensure hygienic conditions. Covering the bottom of disposal cells to prevent infiltration of water and leachate into the ground. Reduction of odors and gas emissions by covering the waste heavily loaded
with decomposable organic matter with excavated soil and/or lime layers. Provide treatment facilities for contaminated leachate and drainage water. Provide appropriate landfill site management and trained staff for carrying op- erations on the landfill site. Train staff of QMC in environmentally sound measures to operate the solid waste sanitary landfill.
0
0
0
0
b) Institutional Measures
The responsibility for the sanitary landfill site must be clearly defined in QMC and the de- cision chain from the chief (responsible) down to the sweepers and workers must also be clearly defined and laid down in a written form. The executing staff must have a job de- scription. To secure a proper function of the landfill site it is necessary to employ only trained staff. In addition, it is necessary to train the staff frequently.
c) Public Awareness a
Awareness measures should be carried out with the goal to:
inform the residents about the collection of solid waste and the diseases related to inadequate disposal in the city center. 0 sensibilize the residents not to drop the waste wherever they are standing or
living. 0 inform the resident not to dispose the solid waste in the drainage canals.
H:\ConDat\BerlPAKISTA33209\Final Re~ort\FR Vol l\voll ch l0 .doc

Quetta WSE - Final Reoort. Volume 1 Chaoter 10/Pape 20
d) Environmental Monitoring a
To ensure an environmentally sound mode of operation of the sanitary landfill site, it is recommended to establish a permanent monitoring program. The following main parame- ters of the leachate drainage should be monitored before and after treatment:
0 Biological Oxygen Demand (BODS) 0 Chemical Oxygen Demand (COD) 0 Nitrate
Nitrite Ammonia
0 o-Phosphate
0 Conductivity. 0 Relevant heavy metals 0 Relevant pesticides
PH
10.6 Complementary Program
The available Environmental Impact Analyses for investigated wastewater and solid waste disposal facilities comply with the respective requirements of the Bank’s guidelines and with draft local regulations.
For the envisioned impounding reservoir, proposed in the scope of surface water resources development, an upgrading of the present IEE to a full-scale EL4 is recommended. Rele- vant studies are envisaged to be carried out in the scope of Final Engineering Design of the proposed facilities. However, a tentative cost estimate and outline Terms of Reference for a stand-alone environmental study are shown below for general information.
a) Tentative Cost Estimate
The necessary time required for the EM is estimated at 3 - 4 months. An EIA team con- sisting of one international expert (team leader, environmental expert) and 2 - 3 local ex- perts (biologist for flora and fauna investigations; hydrogeologist or geograph and social expert). The costs for a four months assignment are estimated at:
- International Expert16,OOO US$/month - National Experts 1,800 US$/month - per diem international - per diem national - Mobilization - Support staff (secretary, half day) - Equipment
US$ 64,000.- US$ 21,600.- US$ 13,120.- US$ 9,504.- US$ 10,000.- US$ 500.- US$ 5,000.-
Sub-Total US$ 114,724.-
H:\ConDaI\BehPAKISTAN\233209lFinal Report\FR Vol l\voll chlO.doc

Ouetta WSE - Final Reoort. Volume 1 ChaDter 10 / Page 21
- Contingencies (15 %) US$ 17,208.-
Grand total (estimated) US$ 131,932.-
by full-time employment of all four specialists during the investigations (prices in US$, October 1999). The local staff may possibly be reduced to 3 months each at the smaller dams, which would reduce the costs.
The costs for a complete EIA for Burj Aziz Khan dam site (minimum six months for in- vestigations) are estimated to approximately US$ 205,000. However, NESPAK Consult- ants carried out an Environmental Impact Assessment in the framework of Phase 1 of the present project (Project Planning Studies) for the Burj Aziz Khan Dam in April 1998. This study followed mainly the guidelines of the World Bank for EIA studies. On the opinion of the consultant the study was realized on a minor to medium level and can be used as a ba- sis for a complete EIA if the Burj Aziz Khan Dam is envisaged for realization. A revision of this study will significantly reduce the costs for the EIA study. It is calculated, that ap- prox. 4 men-month will be sufficient for revision. Additionally, the staff must probably not be engaged on full time basis. An international consultant or an experienced national con- sultant should be hired full time; 2 - 3 months will probably be enough for each of the other experts. This would reduce the costs to approximately half of the above mentioned costs.
0
b) Outline Terms of Reference
The terms of reference for the complete EIA study should focus on the main items men- tioned below (the order of presentation does not indicate any score):
wildlife in the project areas, flora in the project areas, water use conflicts in the downstream areas, water use conflicts in the upstream areas possible influences of the raw water quality, erosion problems, transmission main problems (leakage and infiltration of surface or groundwater), possible sedimentation of solids in the reservoir. raw water treatment plants and production of salts from reversed osmosis and sludge production preparing alternatives design options for Burj Aziz and Mangi Dam cost estimations for environmental losses mitigation measures for reservoir management, raw water treatment, salt and sludge disposal, water losses in the main, water quality
H:\ConDat\BeWAKISTAM233209Final RepoItFR Vol l\voll -chlO.doc

Ouetta WSE - Final Renort. Volume 1 Chaoter 10 / Paae 22
- sound resettlement options - -
amendment of income situation of the residents in the area (fish etc.) and impacts which are not yet treated in the present IEE.
Reference is made also to the detailed check lists, guidelines and legal documents attached in the Sector Report, Volume 3 of this Final Report.
H:\ConDat\BeAPAKISTANG!33209Final ReportFR Vol l\voll -ChlO.doc

7 7. PROGRAM FOR BANK FINANCING

11. PROGRAM FOR BANK FINANCING
11.1 Recommended Phase 1 Investment Program (ADB-Project)
The declared target’ of a possible Bank financing program is a least-cost solution to Quetta’s water supply problems that is also environmentally acceptable, socially and eco- nomically feasible and financially viable. Selected investments must be operated and maintained in collaboration with the local communities and achieve an acceptable level of cost recovery of O&M cost within about five years and O&M plus dept service payments or depreciation, whichever is higher, within ten years of completion of the selected option.
Based on the general goal of sustainable water supply, a program is presented for infra- structure development that, if consistently implemented, can meet the above targets. Since all measures and their effects are interdependent it is essential that the defined components of the entire project be implemented in the proposed sequence in order to match growing demand and to achieve a balanced groundwater regime.
d
Embedded in a staged development, the recommended Phase 1 implementation program for Bank financing has been delineated in coordination with Bank and Project Steering Committee. It is the result of a systematic variant selection, based on the TA findings and previous discussions with both, Implementing and Executing Agencies. However, the overall financial scope of Phase 1 was reduced by some 40%, and during the Tripartite Meeting in March 2000 the implementation of several components was subjected to final decisions prior to or during the forthcoming loan negotiations, including:
- - rehabilitation of existing wells - installation of water meters - -
scope, funding and timing of preparatory ground- and surface water exploration
construction of wastewater house connections number of wastewater treatment plants and, consequently, shape of the entire sewerage system scope of social and institutional support programs -
In that light, the Investment Program proposed by the Consultant includes the following packages:
11.1.1 Water Resource Development
0 Rehabilitation of up to 100 wells in the alluvial aquifer in the Quetta Valley to restore original design capacity, fully utilize attached existing distribution and storage facili- ties and allow systematic monitoring (WS/P/lll; US$ 1.59 mio2)
I TOR I.A.8 ’ base cost in mid 1999 constant prices, excluding contingencies and tax 8 H:\ConDat\BeWAKISTANQ33209Bnal ReporWR Vol l\vollchll.doc

9 Cha ter 1 /Pa e 2
a
a
a
a
a
a 8
Drilling and exploration program including 30 test wells in the limestone aquifer of the Murdar Range and 60 test wells in the conglomerate/sandstone aquifer of the Zarghoon Range (WS/P/112; US$2.00 mio) Construction of approx. 20 new production wells in well fields L2 and L3, with total expected yield of 9.1 mi0 m3/yr from the Murdar limestone aquifer in the Quetta valley (WS/P/113A; US$ 1.01 mio) Exploration of new groundwater resources in the limestone aquifer of the Murdar Range and in the conglomerate/sandstone aquifer of the Zarghoon Range; involving 24 PM (F), 36 PM (L), 198 PM (CP)3, and geophysical program. (WS/C/lOlA; US$0.77
Consulting services for well rehabilitation; with 4 PM (F), 54 PM (L), 144 PM (CP). (WS/C/lOlB; US$0.31 mio) Consulting services for supervision of well construction and pump testing; 20 PM (F), 20 PM (L), 112 PM (CP). (WS/C/102A; US$0.55 mio) Hydrological/geotechnical investigations; incl. 3PM (F), 6 PM (L), 24 PM (CP), geo- physical/soil-mechanical investigations, and supply and installation of hydrometrical and meteorological stations. (WS/C/103A; US$O.l9 mio)
mi0)
11.1.2 Water Supply
Quetta Water Supply Improvement Project - Rehabilitation of wells, reservoirs, disin- fection equipment, pumping stations and distribution network, incl. restructuring of the system, replacement of valves and 81 km pipeline, installation of 65 water meters at PHED wells, and 45,000 water meters at house connections (WS/P/l15; US$ 5.92 mi0) Quetta Water Supply Expansion Project I - Development and connection of Limestone well fields L2 and L3 to a production ca acity of approx. 10.0 mi0 m3/yr, construction of reservoirs of'4,600 m3 and 3,000 m capacity at the well fields, and 25 elevated service reservoirs of 50 rn3 to 1,100 m3 capacities; construction of 26.6 km primary pipelines ND 200 to ND 600 mm, and 3 11 km distribution network ND 80 to ND 200 mm, and 166 km house connections with 31,400 water meters (WS/P/116; US$ 21.50 mi0) Consulting services for engineering design and construction supervision for system rehabilitation packages. Duration 5 years at 7.5% of construction cost. (WS/C/105; US$O.44 mio) Consulting services for engineering design and construction supervision for Quetta Water Supply Expansion Project I packages. Duration 5 years at 7.5% of construction cost. (WS/C/106; US$1.61 mio)
P
1 1.1.3 Wastewater Disposal
Quetta Sewerage Project I - Rehabilitation and cleaning of existing sewers; construc- tion of 24.85 km primary sewers, 154.10 km secondary collectors, 20,000 house con- nections, and first stage of central treatment plant near Kili Barmah village. Service ar-
a person-months foreign, local and counterpart services
H:\ConDat\BeWAKISTAM233209\Final RepomFR Vd l\mll-chll .doc

Ouetta WSE - Final ReDort. Volume 1 ChaDter 11 / Page 3
eas include Cantonment and Railway Compound (loo%), QMC (extension from 1,360 ha to 3,935 ha). The Phase 1 scheme will serve 383,800 inhabitants, at an average dis- charge of 31,905 m3/d (1 1.65 mi0 m3/yr); at 65% efficiency, around 400 ha can be ir- rigated with the treated effluent.(WW/P/211; US$ 19.95 mio) Consulting services for engineering design and construction supervision for the above implementation package. Duration 5 years at 7.5% of construction cost. (WW/C/201; US$1.50 mio)
11.1.4 Urban Drainage
0
0
Supply of Machinery and Equipment for Quetta Drainage Maintenance - Provision of general and special equipment to support and improve working methods and efficiency in routine and corrective drainage maintenance by QMC Sanitation Section. @F/P/312; US$ 0.61 mio) Initial engineering and contract management support is rendered through PMU advisory services in the scope of the overall project.
11.1.5 Solid Waste Disposal
Construction of Sanitary Landfill Solid Waste Solid Waste Disposal Site - Construc- tion and development of 27.7 ha sanitary landfill site including roads, leachate control. gas collection, weigh bridge and operational facilities; and clearing of existing open dump. Work is carried out under contract for the first two lots and then continued by QMC in the scope of daily operations. The implementation contract includes engi- neering design and construction supervision by a specialized consulting firm, and ac- tivities are coordinated through PMU in the scope of the overall project. (SW/P/411; total incl. 7.5% engineering US$ 1.16 mio) Supply of Machinery and equipment for Quetta Solid Waste Disposal Site - Provision. of heavy equipment, special machinery incl. weigh bridge, and tools to support opera- tion and expansion of the sanitary landfill by QMC Sanitation Section. (SW/P/412; total incl. 2% engineering US$0.86 mio)
11.1.6 Technical Assistance
After discussion of requirements and proposed activities for supporting consulting and ad- visory services, the following technical assistance program is envisaged in the scope of eventual Bank-financing of a Phase 1 implementation package:
Advisory Services for Financial and Commercial Management in BWASA - total 84 person-months of one foreign and three local experts plus relevant counterpart and supporting personnel. (ID/C/501; US$0.78 mio) Advisory Services for Project Implementation - 12 person-months of foreign expert in contract management and civihanitary engineering to assist in the initial stage of im- plementation and establish regular contracting, monitoring and administrative routines to the Bank’s requirement. Activities are to be taken over and continued by suitably qualified PMU counterpart personnel seconded to the advisor at the beginning of his assignment.(ID/C/502; US$0.28 mio)
0
H:\ConDat\Be~PAKISTAN\233209\Final RepoMR Vol l\voHchll .doc

Quetta WSE - Final Reuort. Volume I Chauter 11 /Page 4
Advisory Services for Public Services Technical Management and Operation - total 36 person-months of foreign public works management and civil/sanitary engineering ex- perts plus counterpart and supporting personnel, stationed at PMU, to support setting- up and control of implementation and subsequent O&M routines. (ID/C/503; US$0.79 mi0) Advisory Services for Provincial Institutional Reforms - total of 24 person-months of a institutional development specialist , a local MIS expert (8 person-months), a finan- cial management consultant (1 8 person-months), a HRD specialist (6 person-months) and approx. 48 months input of junior consultants to support the team of experts (ID/C/504; US$0.32 mio). Advisory Services for Benefit Monitoring and Evaluation - total of 4 person-months of a Community development specialist, 6 person-months of a M&E expert, 6 person- months of a programmer and 24 person-months of social organizers (ID/C/505; US$
Social Action Plan - Coordinated implementation of participatory components, social assessment recommendations, hygiene and public awareness components, and mitiga- tion measures, as well as carrying out procedures for NGO/CBO involvement, social targeting of benefits and poverty reduction, and addressing resettlement, indigenous peoples, and other social impacts. Required are 15 PM (F), 36 PM (L), ca.72 PM (CP). Duration 3 years. (CP/C/701; 0.45 mio) Public Awareness and Community-oriented Conservation Program - focussing on key aspects of water conservation, metering and revenue enhancement, and stakeholder, NGOKBO and community participation. Through a Media Advisory Forum, media campaigns will be staged. Key outputs are: Media Advisory Forum; Community Con- servation Roundtable; multimedia campaigns; face to face campaigns; educational campaigns; documentation center. Duration 5 years. (CP/C/702; US$0.35 mio) Hygiene Education - providing improved information regarding sanitary and hygiene practices, potable water supply, and prevention of water borne and environmental dis- eases, as well as complementing project-supported measures to reduce water wastage and contamination, targeting poverty-level and other disadvantaged beneficiary groups including women. Strategies include awareness- and capacity building, development of education material, training packages, and deployment of community-based implementers. Duration 5 years. 60 PM public health specialist, 240 PM social organ- izers, 480 PM hygiene educators, logistical support, materials development, training (all local). (CP/C/704; US$0.78 mio)
0.11 mio).
17.1.7 Overview of Project Components
Key data of the above implementation packages are compiled in the following Table 11.1.
H:\ConDat\Ber\PAKISTAM233209\Final ReporlWR V d l\wHthll .doc

> ha ter 11/Pa e 5
Code Description
A. WATER RESOURCE INVESTIGATION I
Table 11.1 : Overview of Project Components - Phase 1 (ADB-Project)
Duration
WS/C/101 A
WS/C/103A
WS/P/112
Base Cost 7 Consulting Services for Exploration 07/00 - 12/01 659,800 of New Groundwater Resources Hydrology and Soil-mechanical Tests 1 O/OO - 03/01 192,200 for Kuchnai Dam Scheme (1 st campaign) Exploration Well Drilling 10/00 - 12/01 2,110,122
TOTAL A 2,962,122
B. PHASE I IMPLEMENTATION
I WATER RESOURCE DEVELOPMENT
WS/C/lOl B Consulting for Well Rehabilitation 01/01 - 12/03
WS/P/111 Well Rehabilitation in the Quetta Valley 04/01 - 12/03 WS/P/113A Well Construction L2 and L3 07/01 - 1 2/02
WS/C/102A Consulting for Well Construction L2 and L3 07/01 - 12/02
Subtotal
WATER SUPPLY
WS/C/105 Consulting for System Rehabilitation 01/01 - 12/05
WS/P/115 Water Supply Rehabilitation Project 01/02 - 12/05 WS/P/116 Water Supply Expansion Project I 01 /02 - 12/05
WS/C/106 Consulting for Water Supply Expansion I 01/01 - 12/05
Subtotal
WASTEWATER DISPOSAL
WW/C/201 Consulting for Wastewater Project I 01/01 - 12/05 WW/P/211 Wastewater Disposal Project I 01/02 - 12/05
Subtotal r ~ I - URBAN DRAINAGE
DF/P/312 Supply of Drainage Maintenance Equipment Subtotal
SOLID WASTE DISPOSAL
SW/P/411 SW/P/412
Initial Construction of Sanitary Landfill Supply and Installation of Equipment
Subtotal TOTAL B
01/02 - 06/02
01 /02 - 12/03 01/02 - 06/03
* I I I
308,501 549,301
1,589,35: 1,005,06: 3,452,21
444,25! 1,612,451 5,923,45(
21,499,431 29,479,60!
1,496,14~ 19,948,19( 21,444,334
61 4,20( 61 4,20(
1,16 1,85( 856,00(
2,017,85( 57,008,20:
H:\ConDaI\BeWAKISTANQ33209~naI ReportWR V d l \vo l lch l l .doc

Ouetta WSE - Rnal Report. Volume 1 ChaDter 1 1 / Paee 6
Code I Description
Table 11.1 : Overview of Project Components - Phase 1 (ADB-Project) (Continued)
Duration
ID/C/501
ID/C/502 ID/C/503
ID/C/504 ID/C/505 CP/C/7Ol CP/C/702
a
Advisory Services for Financial & Commercial Management in BWASA Advisory Services for Project Implementation Advisory Services forpublic Works Technical Management & Operation Provincial Institutional Reforms Benefit Monitoring and Evaluation Social Action Plan Public Awareness & Community-oriented Conservation Program
01/01 - 12/03 7a0,ooo
276,000 786,000
320,000 106,000 446,000 348,117
7a0,ooo 3,842,117
01/01 - 12/01 01/02 - 12/03
CP/C/704
01/02 - 12/03 01/02 - 12/03 01/01 - 12/03 01/01 - 12/05
Hygiene Education 01/01 - 12/05 TOTAL C
Base Cost
11.2 Summary of Capital Cost Estimates
The total capital cost requirements for the realization of above program sum up to US$ 109.3 1 million, including physical and price contingencies and taxes, but excluding bank charges (capitalized Interest During Construction and Commitment Charges). .
More comprehensive details on the estimations of the capital cost requirements to imple- ment above recommended phase 1 projects for improving and developing the Quetta water resources and supply infrastructure, waste water collection and treatment, solid waste management and urban drainage are fully documented in the respective sector reports of the present Final Report and more detailed summary tabulations and the proposed invest- ment schedule in appendix 11, Tables 1 to 5 of the present Volume 1.
a
H:\ConDat\BehPAKISTAM23209Winal ReportFR V d l\voll-chll.doc

Ouetta WSE - Final ReDort. Volume 1 Chauter 1 1 I Page 7
6383 1,36 4,71 18,76 18,46 10,74 9,80
6,46 45% 2,93 3.53 1,36 2,72 1,68 0,70 29,49 48% 14,21 1528 0,41 10,20 10,19 4,98 3,71 2 1 4 23% 4,84 16,60 0,85 3,66 552 554 587 2,63 22% 059 2,04 1.62 1,Ol 3,81 43% 1,64 2,17 0,73 1,60 1,04 0,22 0,22
9,57 38% 3,63 534 0,20 0,7i 2,81 2 , n i,6i i,47 22,48 28% 6,29 16,19 0.13 0.86 525 599 4,55 5,71 13,42 36% 4,78 8,651 0,24 0,88 3,76 3,81 2,37 2,38
109,31 36% 38,92 70,40 1.93 7.16 30.58 31,02 19,26 1 9 3
Table 11.2 : Summary of Phase 1 Investments 0
12,05 2,03
4SE COST (at 1999 prices) thereof
Water resources Water supply Waste Water Solid Waste 8 Drainage Technical Assistance
0.13 0,67 1.87 2,99 3,85 234 0,72 0,64 0,42 0,20 0.05
physical contingencies (approx. 15% price contingencies (avg 7% pa
Value Added Tax (14%
DRAIN. &
millim c u m t US$ WATER WASTE SOLID TECH. ALL
INTERNAL GOVERNMENT SUBSIDIES 20,33 11,n 4,23 0,51 2685 WATER WASTE ASSIST. PROJECTS
EXlERNAL FUNDING
DISBURSEMENTOF PROJECT FUNDS 47,44 27,47 423 204 81,18
INTERESTDURING CONSTRUCTlON (capitalized) 1129 590 029 0,12 15,s COMMITMENTCHARGES (capitalized) 0,97 0,72 0,06 401 1,76
TOTAL EXERNAL FUNDING 59,@ 3209 4,s 2,17 98'52 -
ITAL ALL PROJECTS
Interest during construction (capitalised, Commitment charges (capitalised
RAND TOTAL TO BE FINANCED
12,05 2,03
I
123,39 32% 38,92 84,481 2,78 8,47 32,86 34,21 23,17 21,90
11.3 Financing of the Recommended Phase 1 Program
At the time, when the financial analysis for the Quetta Water Supply and Environmental Improvement Project was completed, financing arrangements and Bank conditions for fi- nancing the proposed Phase 1 program were nor yet settled nor recommended from neither competent authority. Therefore, the present analysis adopts, for the purpose of the present studies, general conditions frequently used for comparable analysis of similar projects in comes pondi n g economic surroundings .
Details on the adopted financing arrangements are elaborated in Volume 6 of the present Final Project Report, summing up to a grand total to be financed of US$ 123.39 million, thereof US$ 33.05 million Government subsidies (or approximately 32%) and US$ 90.43 million external Bank loans, and are tabulated in Appendix 11, Tables 6 to 10 of the pres- ent Volume 1 and summarized as follows:
a
Table 11.3 : FINANCING PLAN FOR RECOMMENDED PHASE 1 PROJECl
H:\ConDat\BeWAKlSTA33209Wnal RepomFR V d l\voll-chll .doc

12. LONG-TERM DEVELOPMENT PLAN
a

ChaDter 12 I Page 1 Quetta WSE - Final Reoort. Volume 1
12. LONG-TERM DEVELOPMENT PLAN
12.1 General
In accordance with the requirements of the Terms of Reference, the purpose of the present TA is the planning of a Project for possible Bank financing, embedded in an economically viable and sustainable program for the management of water resources in the Quetta Ba- sin, and the identification of least-cost solutions for the city’s water supply, sewerage, drainage and solid waste disposal’.
In the short-range, the immediate objective of the proposed Project is, therefore, to arrest and stabilize the decline of service levels and urban environmental quality through a Phase 1 program to restore failing infrastructure required to sustain the city for the next 5 to 10 years. This scenario, with a planning horizon of 2005, includes implementation of those components that provide necessary and logical first steps toward longer-term solutions. Depletion of the alluvial aquifer will continue, but the collective impact of proposed measures will slow the process and provide time for the realization of more sustainable solutions and implementation of urgent institutional improvements.
i 0
Achievement of the Project’s primary objectives and the Bank’s sector goals in the area, viz.:
- -
sound development of water resources management; and sustained improvement of social infrastructure and environment,
by conservation and development - including those technical, institutional and social measures necessary to secure and improve the water supply and sanitation of Quetta City and surroundings - requires both a comprehensive approach and a high degree of coordi- nation among constituent actions and interventions. Because many proposed actions are mutually dependent, Project success needs integrated and carefully sequenced implemen- tation of project components.
The envisioned overall Project includes the major sectoral implementation packages and a supplementary package of supporting components, as well as the anticipated institutional, financial, environmental, and participation component packages. Requirement and realistic options to combine these interrelated components in order to prepare a project package for sustainable water supply and environmental protection have been presented in the Interim Report. Results were further processed during the second phase of the consultant’s as- signment, and are laid out in the present Final Report.
e
Subprojects proposed for ADB funding in the first implementation phase are highlighted in Chapter 11 above. The overall sector programs are presented in the relevant sections of the present report, and are summarized below. Detailed descriptions of all components are compiled in the appertaining Sector Reports submitted under separate cover.
’ the last comprehensive plan for a “Greater Quetta Water Supply Project” dates back to 1967/68, when about 10% of the present population lived in the area. a H:\ConDat\BerVAKISTAM233209\Finel RepoMR Vd l\vollchl2.doc

12.2 Additional Long-term Program 9
The further staging of proposed implementation is dictated by the pace of continuous growth of population and water consumption, and the need to mobilize all feasible primary and secondary resources in a systematic program towards full coverage of water demand, restoration of groundwater balance and re-establishment of a healthy living environment. It also considers realistic appropriation of the time requirements for necessary institutional improvements and of local implementation capacities, and places the simpler and less costly components earlier in the schedule than the more expensive options that require longer investigation and are sensitive to unexpected development.
The following additional investment packages are envisaged:
12.2.1 Water Resource Development \e - Construction of approx. 10 new production wells in Well Field L1, with a total ex- pected yield of 4.47 mi0 m3/yr from the limestone aquifer just east of the Quetta val- ley. (WS/P/113B; US$0.50 mio2) Construction of up to 40 new production wells in the proposed Well Field Z l , and later additional 30 new production wells in the envisaged Well Field 22, with anticipated total yields of 9 mi0 m3/yr and 7 mi0 m3/yr respectively from the conglomerate aqui- fers of the Zarghoon Range. (WS/P/l14; US$ 1.82 mi0 and 1.21 mio)
0 Consulting services for supervision of well construction and pump testing of L1, Z l , and 22 wells. Duration 6 years, intermittent. (WS/C/102B; US$ 1.07 mio)
0 Hydrologicallgeotechnical investigations for Kuchnai dam scheme (2nd campaign); incl. evaluation and complementation of data series and establishment of final hydrau- lic/geotechnical criteria for dam and system design. (WS/C/103B; US$ 0.10 mio)
12.2.2 Water Supply
0 Quetta Water Supply Expansion Project I1 - Development incl. provision of electricity, and connection of well fields L1 and 21 to a production capacity of approx. 13.47 mi0 m3/yr, construction of internal pipelines and reservoirs of 3,800 m3 and 7,400 m3 ca- pacity at the well fields, and 38 elevated service reservoirs of 50 m3 to 1,000 m3 ca- pacities; construction of 49.5 km primary pipelines ND 150 to ND 800 111111, and 237 km distribution network ND 80 to ND 200 mm, and 177 km house connections with 35,000 water meters. This is planned to cover an additional connection demand of 320,000 inhabitants by 2010. (WS/P/117; US$29.23 mio) Quetta Water Supply Expansion Project I11 - Development incl. provision of electric- ity, and connection of well field 22, and incorporation of Kuchnai dam scheme and re- assigned irrigation wells, to a total added production capacity of approx. 38.08 mi0 m3/yr; construction of internal pipelines and reservoir of 5,800 m3 capacity at the well field; construction of 17.1 km transmission main ND 500 mm, treatment plant for ap- prox. 21,600 m3/d, and 6,400 m3 storage capacity; erection of 59 elevated service res-
a
0
base cost in mid 1999 constant prices, excluding contingencies and tax
H:\ConDat\BehPAKISTANG!33209Wkfl~ ReporWR Vol l\voll-chlP.doc

0 - l Cha ter 12/Pa e
ervoirs of 50 m3 to 1,200 m3 capacities; construction of 18.75 km primary pipelines ND 300 to ND 800 mm, and approx. 520 km distribution network, and 407 km house connections with 80,000 water meters. From a forecast total population of 2 mi0 by 2020, the complete public supply system will serve about 1,795,000 inhabitants through 192,500 connections. (WS/P/118; US$61.72 mio) Consulting services for engineering design and construction supervision for Quetta Water Supply Expansion Project 11 packages. Duration 5 years at 7.5% of construction cost. (WS/C/107; US$2.19 mio) Consulting services for engineering design and construction supervision for Quetta Water Supply Expansion Project I11 packages. Duration 7 years at 7.5% of construc- tion cost. (WS/C/108; US$4.63 mio)
@
0
0
12.2.3 Wastewater Disposal
0 Quetta Sewerage Project 11 -Construction of 32.25 km primary sewers, 331.90 km secondary collectors, 32,700 house connections, and second stage of central treatment plant near Kili Barmah village. Service areas are extended by additional 2,575 ha around the central part and along a corridor towards the treatment plant. With Phase 2 completed, the scheme will serve some 593,500 inhabitants, at an average total dis- charge of 58,640 m3/d (21.40 mio m3/yr). At 65% efficiency, min. 670 ha can be im- gated with the treated effluent.(WW/P/212; US$26.96 mio) Quetta Sewerage Project 111 -Construction of 16.45 km primary sewers, 214.00 km secondary collectors, 32,000 house connections, and third stage of central treatment plant near Kili Barmah village. Service areas include extensions in the southern parts of the service area amounting to additional 1,900 ha. The overall scheme will serve about 937,300 inhabitants, at an average total discharge of 92,470 m3/d (33.75 mi0 m3/yr). At 65% efficiency, min. 1,040 ha can be irrigated with the treated efflu- ent.(WW/P/213; US$21.63 mio) Consulting services for engineering design and construction supervision for the im- plementation package 11. Duration 5 years at 7.5% of construction cost. (WW/C/202; US$ 1.98 mio) Consulting services for engineering design and construction supervision for the im- plementation package III. Duration 5 years at 7.5% of construction cost. (WW/C/203; US$1.62 mio)
9
0
0
0 0
12.2.4 Drainage and Flood Control
Quetta Drainage Maintenance and Rehabilitation Program - Initial restoration and im- provement of discharge capacities of existing storm water drains, including cleaning of 325 km and repair of 90 km drains and conduits; clearing and repair of 40 km main channels and natural drains; relocation of existing facilities; construction of workshop and stores for QMC drainage maintenance activities. This will affect run-off condi- tions in an area of up to 3,360 ha, with substantial hygienic improvement for up to 800,000 residents and visitors, and reduction of groundwater pollution from stagnant wastewater in the drains. (DF/P/311; US$2.54 mio) Quetta Drainage and Flood Control Project 11 - Expansion of the urban drainage sys- tem, including major upgrading of facilities and systematic improvement of overall
0 a H:\ConDanBe~PAKISTAM233209\Fmal RepomFR Vol l\vollchlEdoc

capacities. Affected is a total drainage area of ca. 2,340 ha with about 234,000 inhabi- tants. Envisaged are total 49.04 km of main drains and 982.80 km of secondary system - to be newly constructed or thoroughly rehabilitated. @F/P/313; US$ 11.81 mio) Quetta Drainage and Flood Control Project 111 - Conduction of storm run-off, preven- tion of flood damages from mountain torrents, and enhancement of groundwater re- charge in peripheral development zones. This will involve construction of approx. 51 km of primary drains and canals; 5.3 km of major channel rehabilitation; construction of 7 flood retaining dams and appertaining spreading channels; and eventually up to 900 km of secondary and micro drains. (DF/P/3 14; US$29.85 mio) Consulting services for engineering design and construction supervision for the im- plementation package 11. Duration 5 years at 7.5% of construction cost. (WW/C/303;
Consulting services for engineering design and construction supervision for the im- plementation package II. Duration 5 years at 7.5% of construction cost. (WW/C/304; US$2.24 mio)
US$0.89 mio)
12.2.5 Overview of Project Components
Key data of the above implementation packages are compiled in the following Table 12.1.
HConDat\BeWAKISTAM233209\Final ReporWR Val l\voH;chl2.doc

Ouetta WSE - Final Reoort‘. Volume 1 Chauter 12 I Page 5
I D. ADDITIONAL LONG-TERM PROGRAM
WATERRESOURCEDEVELOPMENT
WS/C/102B
WS/C/103B Hydrology and Soil-mechanical Tests
WS/P/113B Well Construction L1 WS/P/ll4
I
Consulting for Well Construction L l ,Z l , 22
for Kuchnai Scheme (2nd campaign)
Well Construction Z1 and 22
Subtota
WATER SUPPLY
Table 12.1 : OVERVIEW OF ADDITIONAL PROJECT COMPONENTS (not part of ADB-PROJECT)
I)
WW/C/202 WW/C/203 WW/P/212 WW/P/213
Code I Description
Consulting for Wastewater Project II Consulting for Wastewater Project Ill Wastewater Disposal Project II Wastewater Disposal Project Ill
Subtota
DF/P/311 DF/C/303 DF/C/304 DF/P/313 DF/P/314
W S/C/107 W S/C/108 WS/P/117 L W S/P/l 1 8
Initial Maintenance & Rehabilitation Program Consulting for Drainage Project II Consulting for Drainage Project Ill Drainage & Flood Control Project II Drainage & Flood Control Project 111
Subtota
TOTAL D
Consulting for Water Supply Expansion II Consulting for Water Supply Expansion Ill Water Supply Expansion Project II Water Supply Expansion Project Ill
Su btota
Duration
01/06 - 12/12 intermittent
01/12 - 12/12
01/06 - 12/06 01/07 - 12/07 01/12 - 12/12
01/06 - 12/10 01/11 - 12/17 01/07 - 12/10 01/12 - 12/17
01/06 - 12/10 01/13 - 12/17 01/07 - 12/10 01/14 - 12/17
06/01 - 12/03 01/06 - 12/10 01/12 - 12/16 01/07 - 12/10 01/13 - 12/16
Base Cost’ US$
1.073.72(
101.701
502.53 1.818.55t 1.21 4.03 4.71 0.541
2.192.31; 4.628.72‘
29.230.83( 61.716.28( 97.768.14:
1.797.28; 1.622.38:
23.963.83~ 21.631.77( 49.01 5.27r
2.535.00t 885.45t
2.238.75 1 1.806.00t 29.850.00( 47.31 5.20(
198.809.1 61
H\ConDanBeWAKISTAN\233209\Final ReporWR Vol l\voll c h l 2 . d ~ ~

Ouetta WSE - Final Reuort. Volume 1 Chapter 12/Page 6
12.3 Supplementary Components
The supplementary packages of supporting components are those proposed in the Interim Report, with a tentative overall budget in the order of US$ 10 mio. These sub-project would be generally conducive to systematic planning and sustainable urban development. They include:
a) Aerial Mapping of the Project Area
This component responds to the critical deficiency in basic planning data that cripples sound engineering and frustrates technical planning of Quetta’s urban development and infrastructure. It provides for aerial mapping of the Service and Project Area that will sup- port both project-proposed feasibility studies and detailed design of water supply, waste- water, and drainage improvements. L
Duration 200 1-2002 Input aerial mapping of Project Area
b) Comprehensive Urban Development Plan
This component provides for updated comprehensive urban development planning for Quetta. It directs attention to the broader aspects of urban development which are of criti- cal importance to water resource management, water supply and sanitation, and infra- structure requirements, but which are beyond the scope of the current TA.
It provides for preparation of a binding land use plan that will complement and support the ensuing Project and includes consideration of
- -
Regulation of urban development within Quetta City under a single authority; Adoption of building codes, with water conservation features incorporated into all architectural designs; Checking urbanization and development in the piedmont plain-the area where most of the groundwater recharge is assumed to take place; Creation of a green belt for water source protection; and Attention to potential industrial development in Quetta and associated impacts on wastewater and solid waste options from toxic and hazardous waste.
0 -
- -
Duration : 200 1-2003 Input comprehensive urban development plan
Binding urban land use planninglzoning
c) Agricultural Development Plan
This component provides for preparation of an agricultural development plan for the Quetta Valley and sub-basin. It directs attention to competing urban and agricultural water a H:!ConDanBehPAKISTAW2332~1nal RepoMR Vd l\vollchl2.doc

Ouetta WSE - Final Reuort. Volume 1 Chapter 12 I Pape 7
demands and to the broader aspects of agricultural development which are of critical im- portance to water resource management and water supply, but which are beyond the scope of the current TA.
It provides for preparation of binding regional land allocations to guide development with emphasis on agricultural green belts and water-saving irrigation. It addresses improved water management and reduction of overall consumption in the agricultural sector and ex- cessive use of groundwater for irrigation, including:
- Promotion of improved irrigation methods (sprinkler, drip feeding, micro sprayer, blubber method, etc.) Promotion of water-conserving crop alternatives; Restrictions on uncontrolled withdrawal of groundwater from existing tube wells for agriculture; and Replacing subsidized flat rate for electricity with charges on a consumption ba- sis (metered supply eventually subsidized rate).
- -
-
200 1-2003 Duration Input Agricultural Development Plan
Regional land allocation Water conservation measures for agriculture
d) Re-forestation Program
This component provides for a program of watershed rehabilitation, protection, and man- agement to restore and enhance groundwater recharge, reduce flooding intensity, protect surface water resource development infrastructure, and improve overall environmental quality in the Quetta Valley.
Duration 200 1-2005 Input re-forestation program
0 Watershed management
12.4 Summary of Capital Cost Estimates
The total capital cost for the long-term (up to 2020) infrastructure development are esti- mated to sum up to the cost of US$ 262.51 (without contingencies and taxes) and up to US$344.28 including physical contingencies of 15 % and taxes in the order of 14 %.
The expected development is shown in Table 12.2. overleaf.
H:\ConDat\BeWAKISTAM233209\Finill RepoMR Vol l\vollchl2.doc

TABLE 12.2
r Description cost
106US$ 2000 2001 2002 PHASE 1 WATER RESOURCE INVESTIGATION 3.01 1.36 1.65 PHASDE 1 WATER RESOURCE DEVELOPMENT 3.45 1.07 1.68
Value added taxes (14% on base cost)
Contingencies (15% on cost incl. Taxes) COST INCLUDING TAXES
PHASE 1 COST INCLUDING TAXES AND CONTINGENCIES
LONG TERM WATER RESOURCE DEVELOPMENT LONG TERM WATER SUPPLY DEVELOPMENT TOTAL BASE COST
COST INCLUDING TAXES
COST INCLUDING TAXES AND CONTINGENCIES
TOTAL BASE COST LONG TERM DEVELOPMENT
COST INCLUDING TAXES
COST4NCLUDING TAXES AND CONTINGENCIES
Value added taxes (1 4% on base cost)
Contingencies (15% on.cost incl. Taxes)
,Value added taxes (14% on base cost)
Contingencies (1 5% on cost incl. Taxes)
PHASE 1 WATER SUPPLY DEVELOPMENT I 29.48 I 0.41 10.19 BASE COST RESOURCE INVESTIGATION AND PHASE 1 IMPLEMENTATION I 35.94 I 1.36 3.14 11.87
5.03 0.19 , 0.44 1.66 40.96 1.55 3.58 13.53 6.14 0.23 0.54 2.03 47.12 1.78 4.11 15.56
4.71 97.77 102.48 14.35
11 6.82 17.52 134.34
138.12 1.36 3.14 11.87 19.38 0.19 0.44 1.66 157.76 1.55 3.58 13.53 23.67 0.23 0.54 2.03 181.45 1.78 4.11 15.56
PHASE 1 PHASE 2
TOTAL 2001 2002 21.44 0.37 3.68 25.76
\ ' PHASE 3 23.25 TOTAL BASE COST waste water 70.34 0.37 3.68
physical contingencies (15%) 10.47 0.06 0.55 , 0.06 0.59
&TOTAL DEVELOPMENT OF WASTE WATER ASSETS 92.37 0.49 4.82 Value Added Tax (1 4%) 1 1.34
SOLID WASTE INVESTMENTS DRAINAGE INVESTMENTS TOTAL BASE COST
INVESTMENT SCHEDULE FOR PROPOSED TECHNICAL ASSISTANCE IBASE COST TECHNICAL ASSISTANCE I 3.81 I 0.73 1.60
2.02 1.01 47.92 0.61 49.94 1.62
physical contingencies ValueAddedTax(14%)
TOTAL SOLID WASTE AND DRAINAGE PROJECT
SUMMARY OF LONG TERM INVESTMENTS [TOTAL BASE COST I 262.51 I 1.36 4.24 18.78
(constant lo6 US$ of mid 1999)
7.49 0.24 8.15 0.32 66.36 2.61
physical contingencies Value Added Tax (14%)
TOTAL BASE COST TECHNICAL ASSISTANCE
0.57 0.11 0.24 0.61 0.12 0.26 5.00 ' 0.96 2.10
physical contingencies Value Added Tax (14%)
39.39 0.20 0.64 2.82 42.28 0.22 0.68 3.02 344.28 1.78 5.56 24.61

\
\ 0.19 1.38 1.08 1.08 1.08 0.09 1.76 1.53 1.53 1.53 1.53 1.53 , 1.59 11.25 8.83 8.83 8.83 0.75 14.34 12.48 12.48 12.48 12.48 12.48
'.0.24 1.69 1.32 1.32 1.32 0.11 2.15 1.87 1.87 1.87 1.87 1.87
\ , 1.82 12.93 10.16 10.16 10.16 0.87 16.50 14.35 14.35 14.35 14.35 14.35.
- 0.88 4.97 , 3.71 '1..39 9.86 7.75 7.75 7.75 0.66' 12.58 . 10.95 10.95 10.95 10.95 10.95
0 7 9 1.38 1.08 1.08 1.08 0.09 I 1.76 1.53 1.53 1.53 1.53 1.53 ii:E i::; \:;: 1.59 11.25 8.83 8.83 8.83 0.75 14.34 12.48 12.48 12.48 12.48 12.48 1.86 0.85 .63 1.69 1.32 1.32 1.32 0.11 , 2.15 1.87 1.87 1.87 1.87 1.87 4.26 6.52 487 y; : : /3 12.93 10.16 10.16 10.16 0.87 16.50 14.35 14.35 14.35 14.35 14.35
QUETTA WATER SUPPLY AND ENVIRONMENTAL IMPROVEMENT PROJECT \ . ;$ of mid 1999)
903 2004 2005 2006 2007 2008 2009 2010 2011 2012 2013 2014 2015 2016 2017
I
!
0.88 4.97 3.71 1.52 0170 0.52 2.40 5.q7 4.23 1 86 0.85 0.63 4.26 6.5;~ 4.87
\ \
\ 0.95 2.12 1.64 n 0.44 7.75 7.75 7.75 7.75 0.66 10.95 10.95 10.95 10.95 10.95 10.95 , \ 1.39 9.86 7.75 7.75 7.75 0.66 12.58 10.95 10.95 10.95 10.95 10.95
mistant 106 us$ of rniJi1999) ', -_ 2003 2004 2d,05 2006 2007 2008 2009 2010 2011' 2012 2013 2014 2015 2016 2017 5.68 5.68 6.d4
\ 0.63 5.55, 6.51 6.51 6.76 I /,, i 2.69 3.63 3.63 6.53 6.77
0.63 5.35 \ 6.51 6.51 6.76 - I - 2.69 3.63 3.63 6.53 6.77 \
5.68 5.68 6.04 0.85 0.85 0.40 0.54 0.54 0.98 1.02 0.91 0.91 ::;;\ 0.10 0.86 1.05 1.09 - 0.43 0.58 0.58 1.05 1.09 7.44 7.44 7.9: 0.83 7.01 8. 3 8.53 8.87 - 3.53 4.76 4.76 8.56 8.88
0.09 0.80 /(9! 0.98 1.01
1.01 I \ I I \
I 4.30 4.30 4.30 / 4.30 4.30 4.30 4.30 4.30 4.30 4.30 4.30 1.01 ' 4.30 4.30 4.30 \4.30 4.30 4.30 I 4.30 4.30 4.30 4.30 4.30
0.65 0.65 , 0.65 0.65 0.65 0.65 0.65 - 0.65 0.65 0.65
5.64 5.64 5.64 5.64, 5.64 5.64 5.64 5.64 5.64 5.64 5.64 - 0.69 0.69 0.69 0.69 0.69 ' 0.69 0.69 0.69 0.69 0.69 -
0.15 0.21 1.73
1.04 0.22 0.22 3.16 0.03 0.03 3.17 0.04 0.04 1.36 0.29 0.29 t
I I
3.61 10.87 ' 9.97 6.32 19.52 18.55 18.55 16.88 17.94 18.88 18.88 21.77 17.72 2.79 1.63 1.49 0.95 2.93 2.78 2.78 'i::; % 2.53 2.69 2.83 2.83 3.27 2.66 3.00 1.75 1.60 1.02 3.14 2.99 2.99 3.03 2.72 2.89 3.04 3.04 3.51 2.85 1.39 14.25 13.07 8.29 25.58 24.33 24.33 24.66 22.13 23.52 24.75 24.75 28.55 23.23
\
\

13. ECONOMIC AND FINANCIAL APPRAISAL

13. ECONOMIC AND FINANCIAL APPRAISAL 0
13.1 Approach
This section of Volume 1 of the present Final Project Report summarizes from Volume 6 the economic and financial implications of the implementation of the recommended long term development strategies and of the anticipated phase 1 projects for the development of the water resources to satisfy the water demand in the project area, of the water supply system and of the waste water infrastructure in Quetta.
The primary objectives of this analysis are:
0 to assess the economic and financial viability of the proposed long term water supply and sewerage infrastructure development and the conditions to ensure the economic and financial (and thus technical) sustainability of the investments, and
to assess cost recovery and revenue enhancement issues for strengthening the earning capacity and the financial basis of BWASA for financially sound and sustainable water supply and sewerage operations.
Note, however, that weaknesses in technical, commercial and financial management and performance may not be balanced by simple tariff increase, but require substantial capacity building on management and operational level, which are comprehensively addressed in Volume 5 on Institutional Development And Capacity Building and sum- marized in Chapter 8 of the present Volume 1 of the Final Project Report.
@ 0
To achieve these objectives, the present analysis proceeds in four steps, i.e.:
0 Determination of the (financial) Average Incremental Cost, based on the proposed long term development of the water supply and sewerage infrastructure in the project area, including an analysis of the sensitivity of important system parameters on the econom- ics of the infrastructure development.
0 Discussion of economic issues, to show the economic viability of the proposed devel- opment plans, to demonstrate the needs for improved water supply and sanitation infra- structure and to emphasize the priority which improved water supply and sanitation in- vestments merit to support the living and health conditions of the population and the economic potential in the project area.
0 Discussion of cost recovery issues and recommendation of revised water and sanitation tariff policies to strengthen the revenue potential of BWASA and to achieve (in the long run) financially self sustained services, with gradual phasing out of public sector subsidies.
H:\ConDat\BeWAKISTANQ33209Uinal ReportUR Vol l\Voll_chl3.doc

Financial projections, to show the development potential of important financial pa- rameters during the decade after the implementation of the proposed phase l projects and the conditions for sustainable sound technical and financial development and op- erations.
The overall results of this analysis show that the proposed long term strategy for the im- plementation as well of improved water supply as of waste water collection and treatment infrastructure in Quetta, and the recommended phase 1 projects proposed for Bank financ- ing, are both economically and financially viable, if the responsible Authorities and BWASA succeed to implement successfully the recommended TECHNICAL ASSIS- TANCE programs to support the essential CAPACITY BUILDING for improving the overall technical, commercial and financial management and performance, and if appropri- ate sector subsidization, TARIFF AND COST RECOVERY POLICIES are adopted to strengthen the financial basis of the water supply and sanitation operations.
.
13.2 Water Supply
13.2.1 Average Incremental Cost Analysis
Based on the data and assumptions defined in Volume 2.1, Sections A (WATER RE- SOURCES) and Volume 2.1, Sections B (WATER SUPPLY) of the Final Project Report, the expected development of the important system parameters during the period considered for AIC calculation and calculated with a discount rate of 12%, the AIC for the proposed water resources and infrastructure development in the Quetta supply area come up to US$ 0.47 (PRs 25.1 1) per m3 of water sold, whereof US$0.36 (PRs 19.44) per m3 of water sold is allocated to the use of assets, US$ 0.01 (PRs 0.65) to the required replacement of assets after their useful life and US$ 0.10 (PRs 5.13) per m3 of water sold to the incremental op- erating and maintenance cost, and thus are well in line with comparable projects in similar surrounding .
With a break even tariff of US$0.465 per m3 of water sold (at a discount rate of 12%) and an average sales price (tariff) of US$ 0.362 per m3 of water sold the financial subsidy would be in the order of US$ 0.10 (or PRs 5.4) per m3 of water sold.
The Financial Internal Rate of Return, calculated with the recommended tariff develop- ment, is in the order of acceptable 8.41%.
The results of comprehensive sensitivity calculations suggest that the single most sensitive parameter influencing the economics of the proposed water supply development is the quantity of water sold. If BWASA succeeds to fully mobilize its customer potential e.g. through the provision of sufficient quantities of water and consumer oriented water supply services, through adequate tariff policies considering the ability and the willingness of the various consumers to pay for potable water, and to decrease at the same time the water losses in the water supply system to satisfy an increased demand with the available pro- duction and distribution assets, i.e. to increase water sales by say 15% (all other parameters unchanged), compared with the base case, the AIC decrease from US$ 0.47 per m3 of wa- a H:\ConDat\Ber\PAKISTAM233209\Final ReportFR Vol l\VoIl-chlB.doc

Quetta WSE - Final Report, Volume 1 Chapter I3 I Page3
ter sold US$ 0.40, with respective impacts on the tariff requirements to achieve given fi- n anci a1 objectives.
The Internal Rate of Return, with the proposed water tariffs, improves from 8.41% to 10.33%.
If, on the other hand, the water available for consumption is reduced by 15%, e.g. due to inadequate water supply services, due to increased water losses in the system andor if the water consumption decreases, e.g. due to unbalanced water tariff policies and (according to the price elasticity of demand) tangible reactions of water consumers on tariff increase, the AJC increases to US$0.54 per m3 of water sold and the FIRR decreases to 6.28%.
The reaction of consumers on water tariff increase is usually measured by the price elastic- ity of demand, which is a measure of the degree to which consumers would reduce their water consumption in response to an increase in water tariffs. For example, an elasticity of -0.5 means that water consumption must be expected to drop by 5% if the water tariff is increased by 1096, with more accentuated reactions upon more substantial price increases.
@
On the other hand experience (supported by respective statistics) shows that, after a certain period of adaptation, consumers tend to return to their original consumption habits.
Though very important for sound and demand driven water tariff policies to achieve well defined financial objectives, firm data on the price elasticity of water demand could not be made available in Quetta, and the available statistics on water consumption (which is not consequently metered in Quetta) vs water tariff development do not provide a sufficient basis for such analysis. However, pertinent investigations in comparable environment sug- gest that the basic needs of water supply reacts fairly inelastic against price increases (which however, are limited by social priority targets), unless there are alternative water sources, such as wells, rivers, etc, even if these are often of doubtful hygienic quality. Typical elasticity values for medium water consumption may be in the order of -0.2, for higher consumption (including garden watering, car washing, e.t.c.) -0.5, for industrial water use -0.35 and -0.25 for Government and institutions. In view of the sensitivity of water sales for the economics of the water supply and the importance for the design of so- cially and financially viable tariff policies, this phenomenon would merit more in depth research than is possible under the limitations of the present study.
a
The results of the sensitivity calculations also underline the importance of strict cost con- trol, as well of capital investments as of operation and maintenance expenditures, at an adequate level of operation and maintenance (especially also preventive maintenance to sustain the value of the assets and to avoid premature replacement requirements) and the necessity to undertake all efforts to optimize the use of water supply assets in particular also by reducing the high amount of unaccounted-for water and by supporting adequate water use and conservation efforts through appropriate tariff policies, to improve the water supply services to the population and non domestic users and thus to strengthen the overall earning capacity of the Quetta BWASA.
H:\ConDat\BeAPAKlSTA33209Final RepomFR Vol l\Voll-chl3.doc

Quetta WSE - Final Report, Volume 1 Chapter 13 I Page4
13.2.2 Economic Considerations
To demonstrate the economic and socio-economic efficiency of the proposed projects and the effective allocation of economic resources it is common practice to compare the Aver- age Incremental Financial Cost (AIC) andor the Financial Internal Rate of Return (FIRR), with the Average Incremental ECONOMIC Cost (AIEC), and/or the ECONOMIC Internal Rate of Return (EIRR), reflecting the true cost and benefits of the project to the economy, supplemented by identification, quantification and valuation (if practicable) of tangible in- direct cost and benefits.
Calculation of Composite Conversion Factors (world price numeraire) %of Basic Composit
Total Cost C.F. C.F. Caritat Cost
Traded Elements Foreign Cost (direct imported goods and services) 41.8% 1 .OO 0.42
Indirect Foreign Cost 13.5% 1 .OO 0.12
Von-Traded Elements Domestic goods and services 32.4% 0.85 0.28
raxes and Duties . 12.3%
Zomposite Conversion Factor 100.0% 0.83 Operation and Maintenance Cost
rraded Elements Foreign Cost (direct imported goods and services) 19.2% 1 .OO 0.19
Indirect Foreign Cost 6.2% 1 .OO 0.06
don-Traded Elements Domestic goods and services 14.7% 0.85 0.12
Skilled Labor 11.5% 1 .OO 0.12 Unskilled Labor 9.5% 0.62 0.06
Electricity 29.0% 1.15 0.33
-axes and Duties 9.8%
:omposite Conversion Factor 100.0% 0.89
Calculated at constant mid 1999 prices with above standard conversion factors, adjusted according to the prevailing macro-economic conditions in the Quetta area of Pakistan, and considering a depletion premium, a conservative assessment of indirect benefits, and a dis- count rate of 12%, which may reflect the economic opportunity cost of capital, the ECO- NOMIC AIC for the proposed projects are in the order of US$ 0.37 per m3 of water deliv- ered to the final consumers, while the respective financial AIC evaluated above come up to US$0.47 per m3 of water sold.
H:\ConDat\BeliPAKISTnM233209\Final ReportFR VoI l\Voll-chlJ.doc

Quetta WSE - Final Report, Volume 1 Chapter 13 / Page5
The average economic subsidy at a discount rate of 12% may be in the order of US$ -0.05 per m3 of water consumed.
The respective ECONOMIC INTERNAL RATE OF RETURN (ERR), calculated with the proposed water tariffs, is in the order of 14.01%, compared with the Financial Internal Rate of Return (FIRR) of 8.4196, both suggesting the economic viability of the proposed water infrastructure development.
The main objective of water supply projects is to deliver safe drinking water of high stan- dard quality to domestic and non-domestic water users, with special emphasis on basic needs (drinking, cooking, washing) for the poorer strata of the population, while the prin- ciple target of sanitation projects is to ensure safe and hygienic disposal of waste water to improve the living and health conditions of the population in the project area.
It should be fully aware, that with increasing water consumption through water supply projects, the waste water problems may be compounded, endangering, if not adequately dealt with, one of the indirect priority objectives of water supply, i.e. to improve the gen- era1 health conditions and quality of living of the population, and augmenting negative en- vironmental impacts through uncontrolled discharge of domestic and especially of indus- trial waste water. The uncontrolled discharge of untreated waste water may cause consider- able economic cost and environmental damages, but also direct financial cost, such as for example increased raw water treatment cost to provide hygienically clean drinking water to the population. Though adequate waste water infrastructure requires capital investments which often exceed those for water supply infrastructure, the economic benefits of waste water projects and the savings in other vital sectors, e.g. for water supply treatment, health care infrastructure and recurrent cost and environmental preservation, justify and require these expenditures.
e
It is evident, that beyond the primary target of water supply projects to deliver clean drinking water to the population and non-domestic users, there are a number of important economic benefits justifying capital investments into water supply projects, such as im- pacts on public health, strengthening of the economic potential in the supply area, and in- crease of property value due to reliable water supply. Adequate water supply strengthens the economic potential in the supply area, not only through improved hygienic conditions, but also by providing the production factor water on a continuous and safe basis for cost effective production, making areas with sound water supply an attractive site for industry and commerce, creating job opportunities, generating tax income for public budgets, which again improves the financial capacities for investments in public infrastructure, social net- work, poverty reduction and human resources development.
@
Investments in water supply and sanitation have been shown to be critical to improving public health. It is estimated that 80% of endemic disability in developing countries is due to diarrheal disease. A review by the World Health Organization demonstrates that im- provements in water supply and sanitation have a direct and significant payoff in reducing diarrheal morbidity: when both water quality and water quantity can be improved, diarrheal morbidity rates can be reduced by as much as 37%.
H:\ConDat\BeWAKISTA33ZOWinal ReporWR VoI l\Voll-chl3.doc

Quetta WSE - Final Report, Volume 1 Chapter 13 / Page6
13.2.3 Tariff Recommendations
Based on well defined (and laid down in a binding charter or corporate plan for the water supply utility) socio-economic, operational, development and financial objectives, an ap- propriate tariff system, considering that the water rates for the different consumer catego- ries are set according to their different social characteristics, should support:
adequate water supply to the population at cost, that even the poorer population can af- ford to cover their basic needs of potable water to improve the general health situation of the population and their standard of living.
adequate water supply to industry and commerce by providing the production factor in- put “water” in sufficient quantity at acceptable cost to support the activities of the en- terprises and thus to support the economic development in the supply area.
adequate water supply to administration, social institutions and other non-domestic wa- ter consumers to provide the required infrastructure for sound performance of these in- stitutions and services to the community.
9
the financial objectives of the water supply venture, which for the present financial sce- nario and in accordance with the macro-economic exigencies to phase out water sector subsidies, especially also in view of the macro-economic constraints and economic re- structuring efforts, and in accordance with the TOR for the present studies, are set to generate sufficient water revenues to recover operation and maintenance cost of the water supply services after 5 years and to earn depreciation of water supply assets through tariff revenues by 2010.
the operational objectives to generate sufficient recurrent liquidity for continuous and high standard water supply services to the population and non-domestic water consum- ers through sound technical operations and preventive maintenance.
the water demand management objectives to reduce excessive use of water and water wastage for optimizing the use of assets financed with limited financial resources, for better managing limited water resources and for maximizing the benefits for all, and to control the impacts on waste water production and the financial requirements for hygi- enic and environmentally compatible waste water collection and treatment.
The actual lump sum water tariff of PRs 75.- (US$ 1.39) per connection and month neither satisfies the minimum cost covering requirements for sound water supply operations, nor the other postulates of modem tariff policies explained above, especially not the require- ments for stringent control of water wastage and the urgent needs for efficient management of the limited water resources in the Quetta valley.
To better support these issues, a reform of the water and sanitation tariff policies is rec- ommended. We underline that, according to our experience, a tariff system based on bill- ing of metered water consumption is the preferred policy to support the social, the financial and the resources management objectives of modern water supply management. a H:\ConDat\BeWAKISTA33209FinaI ReportFR Vol l\Voll-chlJ.doc

Quetta WSE - Final Report, Volume 1 Chapter 13 I Page7
However, since metering is actually not generally practiced in Quetta, a complete review of the water tariff policies can only be implemented after universal metering of the water con- sumption is introduced. To do this, the project recommends and anticipates to implement water meters for all service connections. However, according to the implementation sched- ule for the proposed project, this can not be completed before 2004.
To achieve the financial cost covering objectives defined above, we recommend to
0 Maintain the actual lump sum water tariff system only until general metering of water consumption is applied (presumably by 2004/5), but to immediately (effective early 2000) adjust the actual water charges to PRs 100,- per connection and month.
9 Immediately implement a waste water surcharge of 20% on the,water tariff, anticipat- ing the extension of the waste water services recommended under the present project e and their financial requirements.
Annually adjust the lump sum water charges in current terms to achieve a PRs 170.- per connection per month level by 2004.
Prepare the technical, commercial and legal implementation of water tariffs based on metered billing, including reviewing the tariff policies for water and sanitation within a comprehensive tariff study, latest during 2003 and 2004.
0 Implement tariff policies based on metered water consumption in 2005 as outlined in the following table.
H:\ConDat\BeriPAKISTAM2332OS\Final RepoltFR V d l\Voll-chlJ.doc

Quetta WSE - Final Report, Volume 1 Chapter 13 / Page8
consumption band (m3/mO)
4 5 16 - 40 >40
avgltotal
Recommended Water Tariffs ( current prices of 2005)
house connections
TARIFF US$/m3 PRslm3 0.05 2.50 0.09 5.00 0.17 9.00 0.12 5.78
<I0 1 1 -40 >40
avghotal
0.04 2.00 0.07 4.00 0.13 7.00 0.09 4.74
Public Taps Public Administration
overall weighted average per m3 of water sold I 0.12 6.50
0.04 2.00 0.09 5.00
It is evident, that the achievement of sound water supply services to all strata of the pope- lation and of the social and hygienic objectives and that consumer reactions on water tariff increase, with possible adverse effects on the financial performance of the utility, largely depends on the ability and willingness of the population to pay for water.
Generally accepted guidelines suggest, that the monthly expenses of a household for water and sewerage in developing countries should not exceed 5 6 % of the monthly household income .
0
Social Institutions
Commercial Enterprises, big Commercial Enterprises, small
We recommend to immediately increase the actual lump sum water rates from PRs 75.- per connection and month to PRs loo.-. with further stepwise annual increases to a PRs 170.- per connection per month level up to 2004. Adding a surplus of 20% on the water bill for waste water services, and not considering normal increase in household income, the com- bined water and waste water bill would correspond in 2004 to acceptable 4.0% for a low income household and 1.4% for a medium income household.
0.04 2.00 0.09 5.00 0.17 9.00
In 2005, when we recommend to operate and bill water consumption on metered,basis (with a surplus of 20% for waste water services), the individual households have the op- portunity to better control their individual water and sanitation bills, compared with lump sum billing. A low income household of 10 persons (say with a monthly income of PRs 5,000.-) using the lifeline quantity of potable water of approximately 30 I/cd would con- sume approx. 10 m3 of water per month. With the recommended water tariff for this con- 0 H:\ConDatWer\PAKISTAN\233209Final ReportWl VoI 1\VoH-chl3.doc

Quetta WSE - Final Report, Volume 1 Chapter 13 / Page9
sumption band of PRs 2.5 per m3 of water consumed, and the recommended 25% surplus for waste water, this would correspond to PRs 35,- or less than 1% of the household in- come.
Only if considerably more water is used (by lower income households), the monthly water and sanitation bill may exceed the normal ability to pay. In this case, it may be expected that the water consumer, with a tariff system based on metered consumption, tries to re- duce the monthly water bill by reducing the water consumption, an effect, which is desir- able and an objective of the recommended tariff policy to better support the management of the limited water resources in the Quetta basin.
13.2.4 Financial Projections
Based on the data and assumptions on the expected development of water sales, the re- quired investments into the anticipated phase 1 water supply infrastructure projects and the operation and maintenance cost estimates for appropriate water supply operations laid down in the previous sub-sections, this scenario computes
il)
0 projected income statements, 0 projected sources and applic,ation of funds statements, and 0 pro-forma balance sheets up to 2015.
Revenue Potential
The projection of the revenue potential from water sales is based on the anticipated quan- tity of water consumption in the Quetta water supply area, the expected development of connections and on the recommended tariff policies, i.e. to stepwise increase the actual lump sum rate of PRs 75.- (or US$ 1.85) per connection and month to PRs 170.- (US$ 3.15) per connection and month up to 2004. Thereafter (2005), as soon as the general me- tering recommended under the project is implemented, to change to a tariff policy based on metered monthly water consumption, to support water resources management and, phasing out public subsidies, to cover operation and maintenance cost up to 2005 at current prices. The initial tariff in 2005 on metered basis would be approximately US$ 0.12 or PRs 6.5 per m3 of water consumed. Thereafter the scenario provides for annual tariff increases to make up for inflation, to cover recurrent O&M expenditures and to achieve coverage of depreciation by 2010.
0
Further to the revenues generated from the lump sum charges during a first phase and the metered water sales from 2005 onwards, the assessment of the revenue potential in the projected income statements includes “revenues from new connections”, assuming that the expected number of new connections are pre-financed by the project up to 2005, and that the cost of some US$ 105 per connection (constant 1999 prices) are recovered from the new customers through a cost covering connection charge, annually adjusted for inflation.
H:\ConDat\BeWAKISTAM233209\Final ReportFR Vol l\VoIl-chlJ.doc

Quetta WSE - Final Report, Volume 1 Chapter 13 / Page 10
Operating Expenses To establish the financial projections of operating cost in current terms, based on the macro-economic analysis included in the Interim Report for this study; the projections of the present financial scenario assume that the actual average inflation rate in the order of 11% p.a. will be reduced to 8% up to the year 2000 and will further slow down to a long- term level of 5% p.a.
In accordance with values often adopted e.g. by Asian Development Bank, YVorld Bank and other lending agencies, the average foreign inflation rate for imported goods and serv- ices is expected to remain on a constant 3.0% p.a. level throughout the projection period (compare Appendix 1 , Table 10).
Depreciation
Depreciation is calculated with the straight line method according to the expected useful c) life of assets:
distribution pipes, civil works and similar structures 0 transmission mains
mechanical and electrical equipment tube wells vehicles, consumer connections and other short living assets
40 years 50 years 15 years 15 years 5 years
Based on these assumptions, the weighted annual depreciation for the existing water sup- ply assets and the proposed phase 1 extension projects is in the order of approximately 2.9% p.a. on the re-valued gross fixed assets in operation of the Quetta water supply infra- structure.
Interest Expenses
Details on the assumptions for the projection of the interest expenses account in the in- come statements are laid down under the following heading “Project Financing”. Interest expenses, in the present scenario, are charged to operations, while interest during con- struction are capitalised and financed by the project loan.
@
Taxes
The projection of the income statements in this scenario for the integrated Quetta water supply adopts that no direct taxes will be levied on water supply operations. (For supplies and services indirect taxes of 14% (VAT) are included in the cost estimates).
Income Statements
BWASA’s Income Statements and the monitoring indicators, projected with above as- sumptions, suggest that substantial public subsidization, as well of capital investments into the water supply infrastructure as of the water supply operations, will be required to pro- vide the population of Quetta with acceptable potable water supply services. However, such subsidies from severely limited public financial resources must be expected to seri- 9 H:\ConDat\BeWPAKISTA33209FinaI Report\FR Vol l\Voll-chl3.doc

ously restrict the urgently required financial means, and thus the development opportuni- ties and requirements, in other socially and economically vital sectors such as education, health, poverty infrastructure, etc. Public water sector subsidies can only be phased out in medium and long term if adequate water tariff policies are adopted as proposed above, supported by efficient professional technical and financial management and operations.
-a
VATER SALES (1W6 m3 p.a.)
NUMBER OF CONNECTIONS (1W3 number) AVERAGE TARIFF (US$ per m3 of water sold)
NEW CONNECTIONS (1W3 number) FIXED MONTHLY CHARGE PER CONNECTION
TABLE 13.1 : Projected Income Statement
11.43 27.95 27.95 0.12 0.35
44.38 74.38 109.13 7.25 6.95
1.85
REVENUES FROM WATER SALES REVENUES FROM NEW CONNECTIONS
REVENUES FROM FIXED CONNECTION CHARGE 'OTAL REVENUE POTENTIAL )PER AT1 NG EXPENSES COME BEFORE DEPRECIATION AND INTEREST
DEPRECIATION (AVG 2.9% OF GR. FIX. ASSETS)
INTERESTEXPENSES JCOME FROM OPERATIONS
COME BEFORE TAX IET INCOME I minus = oDerational subsidies)
(MILLION CURRENT US$) I 2000 2005 2010 201 5 27.95 0.47
45.63 7.30
3.35 9.78 13.14 1.10 1.47 1.96
0.99 0.99 4.46 11.25 15.10 1.32 4.06 5.41 6.84
-0.34 0.40 5.84 8.26 0.64 2.95 4.33 5.52
-0.98 -2.55 1.51 2.74 2.83 2.40
-0.98 -2.55 -1.32 0.34 -0.98 -2.55 -1.32 0.34
IPERATING RATIO (REV/(O&MtDEPRECIATION) lETURN ON AVERAGE EQUITY (Yo) 0.7%
0.64 1.16 -4.3% -5.0% -1.6%
:ETURN ON AVG. GROSS FIXED ASSETS (Yo) I -4.0% -2.3% -0.8% 0.4% I LOCAL INFLATION 1 1 .O% 8.0% 5.0% 5.0%
FOREIGN INFLATION 3.0% 3.0% 3.0% 3.0%
Fixed Assets
Actually no conclusive asset accounting, depreciation and asset management is practiced by the Quetta BWASA A first assessment of the existing water supply assets, for the pur- pose of the present financial scenario, based on a physical estimate of the existing assets and their preliminary valuation at the replacement value, amounting to some US$ 36.28, and the net present asset value (considering the age and the useful state of the assets), amounting to some US$ 22.02 is considered for the present pro-forma balance sheet pro- jections and estimates of depreciation.
H:\ConDat\BehPAKISTA33209Final ReportFR Vol l\Voll-chl3.doc

Quetta WSE - Final Report, Volume 1 Chapter 13 / Page12
Capital investments into the proposed Phase 1 water resources and supply infrastructure in the Quetta project area sum up to US$ 60.53, including taxes, physical and price contin- gencies.
TABLE 13.2 :
a
Summary Of Proposed Phase 1 Water Infrastructure In- vestments
I Description I TOTAL million constant mid 19999 US$
WATER RE SOURCE INVEST I GAT ION
PHASE 1 IMPLEMENTATION
WATER RESOURCE DEVELOPMENT WATER SU PP LY EXTENSIONS
BASE COST
COST INCLUDING TAXES
COST INCL. TAXES AND CONT.
GRAND TOTAL
Value added taxes (1 4% on base cost)
Contingencies (1 5% on cost incl. Taxes)
Price contingencies
3.45 29.48
35.94 5.03
40.97 6.1 5
47.12 13.41 60.53
foreign cost indir. loc. cost dir. loc. cost % US$ % US$ % US$
58% 1.75. 7% 0.21 35% 1.05
34% 1.18 22% 0.78 43% 1.49 48% 14.21 15% 4.53 36% 10.74
17.14 5.52 13.29 2.40 0.77 1.86
19.54 6.29 15.15 2.93 0.94 2.27
22.47 7.23 17.42 6.40 2.06 4.96
28.87 9.29 22.37
Capital investments for the implementation of phase 1 of the proposed water supply infra- structure development in Quetta are initially posted to the work in progress account of the pro-forma balance sheets and transferred to the gross fixed asset account in the year fol- lqwing the commissioning of the respective project progress.
Gross fixed assets are revalued with the weighted average of the expected local and foreign inflation rate.
0 Depreciation of revalued gross fixed assets in this scenario is 2.9% p.a.
H:\ConDat\BeWAKISTA332OSFinal ReporlFR Vol l\Voll_chl3.doc

Quetta WSE -Final Report, Volume 1 Chapter 13 / Pagel 3
INTERNAL GOVERNMENT SUBSIDIES
EXTERNAL FUNDING
DISBURSEMENT OF PROJECT FUNDS
INTEREST DURING CONSTRUCTION (capitalized)
COMMITMENT CHARGES (capitalized)
TOTAL TO BE FINANCED BY EXT. FUND.
LONG TERM DEBT
GRAND TOTAL TO BE FINANCED
Financing of Phase 1 Water Infrastructure Development 0
18.1 6
42.38 8.09 1.20
51.66
69.82
Detailed financing arrangements for the proposed phase 1 water resources and supply in- frastructure development in the Quetta supply area were not yet settled at the time when the present study has been elaborated. Therefor the present scenario assumes standard fi- nancing arrangements normally used for similar analysis of water projects in similar sur- roundings:
0 30% of the capital requirements for the implementation of the anticipated water supply projects, or US$ 18.16 million (corresponding to PRs 980.64 million at an exchange rate of US$ 1.- = PRs 54.-), are financed by internal sources, e.g. by non-reimbursable, non-interest Government subsidies (details on available public financial resources could not made available during project preparation).
0 70% of the capital requirements, or US$ 42.38 million, are financed by external loans, at the following conditions: L
0
Interest rate: 6.0% per annum on outstanding debts. Loan period: 30 years, including 6 years of grace during the water resources inves- tigations and the construction period of the 2000 to 2005 implementation phase. Commitment charges: 1.0% per annum on committed, but undrawn loan portions, capitalized and increasing the loan amount by US$ 1.2 million. Interest During Construction: 6.0% on drawn loan portions, capitalized and in- creasing the loan amount by US$8.09 million.
0
0
TABLE 13.3 : Summary Of Financing Plan For Phase 1 Water Infra- structure Development
~~~
I ~~~ million current US$ I TOTAL
IWATER 60.54 EXTERNAL FUNDING I 42.38
2000 2001 2002 2003 2004 2005 1.91 4.72 19.08 18.63 9.05 7.15 1.34 3.30 13.36 13.04 6.34 5.01 0.57 1.42 5.72 5.59 2.72 2.15
1.34 3.30 13.36 13.04 6.34 5.01 0.08 0.28 1.08 1.86 2.24 2.54 0.41 0.38 0.24 0.11 0.05 - 1.83 3.96 14.68 15.02 8.63 7.55 1.83 5.79 20.47 35.48 44.11 51.66 2.40 5.38 20.40 20.61 11.34 9.69
Further to the foregoing assumptions on project financing, the projections of the sources and application of funds statements and the projection of the pro-foma balance sheets ai-e based on the following assumptions:
H:\ConDatU3eWAKISTA33209Winal AepoftFR Vol l\Voll-chl3.doc

Quetta WSE - Final Report, Volume 1 Chapter 13 / Page14
Other Capital Expenditures
The scenario assumes that, after the implementation phase of the proposed projects in 2006, annually some US$ 0.25 million (in current terms) will be invested in general water supply assets, distribution network, pre-financing of house connections (which, in this sce- nario, will be recovered through cost covering connection charges), etc and financed by internally generated funds.
Replacements
This scenario assumes that approximately 0.5% of the water supply assets in operation will require to be replaced annually and are accounted for in current terms (revalued with the expected local inflation rate) and expected to be financed by internally generated funds.
Cash and Banks L a
The cash and banks account is the end year cash balance calculated in the projected sources and application of funds statements.
H:\ConDat\Ber\PAKISTAN\233209~inal ReportFR Vol l\Voll-chlJ.doc

Quetta WSE - Final Report, Volume 1 Chapter 13 I Page15
SOURCES OF FUNDS NET INCOME
DEPRECIATION INTEREST
INTERNAL CASH GENERATION PROPOSED PROJECT
EXTERNAL FUNDING INTERNAL FUNDING
TOTAL FINANCE TOTAL CASH INFLOW
TABLE 13.4 : Projected Sources and Application of Funds Statements
-0.98 -1.25 -0.83 -1.54 -2.30 -2.55 -1.32 0.34
0.64 0.76 0.99 1.69 2.44 2.95 4.33 5.52 2.83 2.40
-0.34 -0.49 0.16 0.15 0.15 0.40 5.84 8.26
1.83 3.96 14.68 15.02 8.63 7.55 0.57 1.42 5.72 5.59 2.72 2.15
' 2.40 5.38 20.40 20.61 11.34 9.69 2.06 4.89 20.56 20.76 11.49 10.09 5.84 8.26
I (MILLIONCURRENTUS$) I 2000 2001 2002 2003 2004 2005 2010 2015
OTHER CAPITAL EXPENDITURES INCREASE IN OTHER ASSETS
INCREASE IN PAYABLES (-) WORKING CAPITAL NEEDS
PROPOSED PROJECT LOAN AMORTIZATION
INTEREST TOTAL DEBT SERVICE
REP LACE M E NTS TOTAL CASH OUTFLOW NET CASH INFLOW
CASH, BEGINNING CASH, ENDING
DEBT SERVICE RATIO a
0.33 0.42 0.33 0.13 0.36 0.20 0.22 0.31 0.39 0.23 -0.12 -0.06 -0.07 -0.08 -0.09 -1.1 1 -0.1 1 -0.20 0.21 0.06 0.29 0.12 0.14 -0.80 0.29 0.03
1.28 1.72 2.83 2.40 4.12 4.12 0.71 0.91
2.61 5.44 20.69 20.73 11.48 8.89 5.44 5.48 -0.55 -0.55 . -0.13 0.03 0.01 1.20 0.40 2.78
-0.55 -1.10 -1.23 -1.20 -1.18 -8.83 -1.60 -0.55 -1.10 -1.23 -1.20 -1.18 0.01 -8.42 1.18
1.42 2.01
2.40 5.38 20.40 20.61 11.34 9.69 I APPLICATION OF FUNDS
Accounts Receivable
The projection assumes that, through improved customer management, billing and collec- tion operations and performance the accounts receivable can be brought down to a 100 days level up to 2003 and maintained on this level throughout the projection period.
Inventory
The projection of the inventory account assumes that the. utility will maintain a stock of operation and maintenance materials required for 3 months of normal operations.
H:\ConDat\Be~PAKISTAM233209Final RepORFA Vol l\Voll-chlB.doc

Capital 0
The capital account is assumed to increase only as a result of retained earnings.
Equity
The equity account is assumed to increase according to the Government subsidies invested for the development of the Quetta water infrastructure.
Accounts Payable
Accounts payable are estimated at 2 months operating expenses other than personnel cost.
Current Portion of Long Term Debt
The account current portion of long-term debt includes the principal due the following year on all long-term debt.
0
Increase in Other Assets
Increase in other assets in the sources and application of funds statements includes ac- counts receivable and inventory.
H:\ConDat\Ber\PAKlSTAM233209Final RepoRWR Vol l\Voll-chl3.dM:

(MILLION CURRENT US$) 2000 2001 2002 2003 2004 2005 2010 2015 REVALUED GROSS FIXED ASSETS 22.02 26.33 34.06 58.32 84.23 101.65 149.27 190.18
LESS ACCUMULATED DEPRECIATION 0.64 1.40 2.39 4.08 6.52 9.47 28.91 54.00 NET FIXED ASSETS 21.38 24.93 31.67 54.24 77.71 92.18 120.35 136.18
WORK IN PROGRESS 2.40 5.38 20.40 20.61 11.34 9.69 SUBTOTAL FIXED ASSETS 23.79 30.30 52.08 74.85 89.05 101.88 120.35 136.18
CASH & BANKS -0.55 -1.10 -1.23 -1.20 -1.18 0.01 -8.42 1.18 ACCOUNTS RECEIVABLE 0.27 0.35 0.66 0.81 0.97 1.22 3.08 4.14
INVENTORY 0.06 0.10 0.15 0.20 0.26 0.33 0.43 0.53 SUBTOTAL CURRENT ASSETS -0.22 -0.64 -0.41 -0.18 0.05 1.56 -4.92 5.85 TOTAL ASSETS 23.56 29.66 51.66 74.67 89.10 103.44 115.44 142.02
CAPITAL -0.98 -2.23 -3.05 -4.59 -6.89 -9.44 -25.58 -26.89 EQUITY 22.60 24.01 29.74 35.33 38.04 40.19 40.19 40.19
REVALUATION SURPLUS 1.91 4.26 8.12 13.42 19.50 52.86 87.73 SUBTOTAL EQUITY 21.62 23.69 30.95 38.85 44.58 50.25 67.47 101.03
ACCOUNTS PAYABLE 0.12 0.18 0.25 0.33 0.42 0.51 0.68 0.86 CURRENT PORTION OF LONG TERM DEBT 1.02 1.36 1.88
SUBTOTAL CURRENT LIABILITIES 0.12 0.18 0.25 0.33 0.42 1.53 2.04 2.74 LONG TERM DEBT EXTERNAL FUNDING 1.83 5.79 20.47 35.48 44.1 1 51.66 45.93 38.26
TOTAL LIABILITIES 1.94 5.97 20.72 35.81 44.53 53.19 47.97 41.00 TOTAL LIABILITIES AND EQUITY 23.56 29.66 51.66 74.67 89.10 103.44 115.44 142.02
DEBT/EQUITY RATIO 0.24 0.66 0.91 0.99 1.03 0.68 0.38 CURRENT RATIO (cur. assetskur. liabilities) -3.57 -1.66 -0.56 0.12 1.02 -2.41 2.14 -
The above projections of the income statements over the next 10 years after the expected completion and entering into operation of the recommended water supply projects, the projected sources and application of funds statements and the pro-foma balance sheets, suggest an independent financial development potential of the Quetta water supply, pro- vided viable water tariffs policies as recommended earlier in this report are implemented, supported by a coherent subsidisation policy to secure sound water supply operations (with the long term objective to phase out public water sector subsidies), and provided manage- ment and operations of BWASA are improved through the recommended capacity building programs. Nevertheless, mainly due to the expected tariff policy of recovering O&M cost after 5 years and depreciation after 10 years, noticeable weaknesses of overall financial performance and the needs for public financial subsidies of the water supply in Quetta over the next decade are evident.
@
H:\ConDat\Be~\PAKISTAM233209\FinaI ReportVR Vol l\Voll-chl3.doc

Quetta WSE - Final Report, Volume 1 Chapter 13 / Page18
a 13.3 Waste Water
13.3.1 Financial Average Incremental Cost
Based on the data and assumptions defined in the pertinent technical reports (Volume 2, Section C of the present Final Project Report), the expected development of the important project parameters during the period considered for AIC calculation and calculated with a discount rate of 12%, the AIC for the proposed extension of improved waste water infra- structure in Quetta suggest that BWASA will be required to increase its water and sewer tariffs to provide improved services to its clients and to achieve sound technical and finan- cial performance. It should be noted, however, that (alone for social reasons and the exi- gencies of optimal allocation of limited financial resources) it is hardly acceptable that in- sufficiencies in technical and financial performance are compensated by simple tariff in- crease.
Following the approach of the foregoing water sector analysis, to test the sensitivity of various project parameters with regard to their impact on the economics of the proposed waste water infrastructure development, and thus the tariff requirements to achieve given financial cost recovery objectives, we compare (considering the recommendation that the waste water tariffs are directly linked to water sales) the FAJC, evaluated above with the quantity of water sold to the population in the project area as reference parameter, with the FAJC adopting as sensitivity factor of 15%.
0
The results of these sensitivity calculations suggest that, in addition to a sensible reduction of investment cost through a least cost planning approach (providing however the same service level and quality), the single most sensitive parameter influencing the required waste water tariff level to achieve given financial objectives, cost recovery targets and sector subsidization policies is the quantity of water sold to the population, if the waste. water tariffs are linked to the water consumption.
If BWASA succeeds to improve the water supply services by say 15%, combined with a corresponding improvement of the waste water services (all other parameters unchanged), compared with the base case, the FAIC of the proposed waste water infrastructure devel- opment decrease from the base case by 16% from US$0.12 (PRs 6.7) per m3 of water con- sumed to US$ 0.108 (Prs 5.8), with respective impacts on the economics of the utilities and the tariff requirements to achieve the financial cost covering objectives.
The Financial Internal Rate of Return (FIRR) in this case, calculated with the recom- mended waste water tariffs of a 25% surplus on the water bill, would improve from ac- ceptable 6.31% (base case) to 7.68%.
A considerable more sensitive impact must be expected, if the quantity of water sold is re- duced by 15% (with direct impacts on revenue generation and the economics of the waste water infrastructure). In this case (all other parameters unchanged) the AIC, compared with the base case, increase by some 20.0% to US$0.15 (PRs 7.8) per m3 of water sold and the FIRR would deteriorate to 4.93%.
e H:\ConDat\BeAPAKlSTA33209Final ReportWR Vol 1\Voll-chl3.doc

Quetta WSE - Final Report, Volume I Chapter 13 I Page1 9
It should also be noted that a reduction of waste water collection and treatment proportion- ally reduces the availability of recycled waste water for irrigation purposes, thus hampering the objectives of efficient management of the scarce ground water resources in the ,Quetta Basin through substitution of ground water for irrigation by recycled waste water. It should further be noted, that a reduction of waste water collection and treatment below the system capacities also results in noticeable reductions of indirect project benefits such as im- provement of living and health conditions of the population in the service area, and would hurt the exigencies of optimal allocation and use of assets.
0
12.3.2 Economic Considerations
To demonstrate the economic and socio-economic efficiency of the proposed waste water infrastructure development and the effective allocation of economic resources we compare, similar to the water supply sector in the previous section, the ECONOMIC waste water cost with the Average Incremental Financial Cost (AIC) and the Financial Internal Rate of Return (FRR) evaluated above.
a Calculation of Composite Conversion Factors (world price numeraire)
WASTE WATER % of Basic Compositc Total Cost C.F. C.F.
Capital Cost
Traded Elements Foreign Cost (direct imported goods and services) 19.5% 1 .OO 0.20
Indirect Foreign Cost 12.5% 1 .OO 0.13
Non-Traded Elements Domestic goods and services 55.5% 0.85 0.47
Taxes and Duties 12.5%
Composite Conversion Factor 100.0% 0.79 Operation and Maintenance Cost
Traded Elements Foreign Cost (direct imported goods and services) 9.5% 1 .OO 0.10
Indirect Foreign Cost 5.8% 1 .OO 0.06
Yon-Traded Elements Domestic goods and services 43.2% 0.85 0.37
Skilled Labor 7.5% 1 .OO 0.08 Unskilled Labor 9.5% 0.62 0.06
Electricity 12.0% 1.1 5 0.14
Taxes and Duties 12.5%
Zomposite Conversion Factor 100.0% 0.79
H:\ConDat\Ber\PAKISTAM233209\FinaI ReportFR VoI l\Voll-chl3.doc

Calculated with analog assumptions as used for the water supply analysis and a discount rate of 12%, which may reflect the economic opportunity cost of capital in Pakistan, the ECONOMIC AIC for the proposed wate water projects are in the order of US$ 0.07 (PRs 3.8) per m3 of water delivered to the final consumers, while the respective financial AIC for waste water collection and treatment come up to US$ 0.12 (PRs 6.7) per m3 of water consumed.
e
The respective ECONOMIC Internal Rate of Return (ERR), calculated with the proposed waste water tariffs as 25% surplus on the water bill, is in the order of 14.52%, compared with the Financial Internal Rate of Return (FIRR) of 6.31%, underlining the economic vi- ability of the proposed project.
Technically and environmentally sound and hygienic waste water discharge is of predomi- nant importance to avoid that through increased and uncontrolled waste water production and discharge the hygienic situation of the population is negatively effected. The uncon- trolled discharge of untreated domestic and industrial waste water into the limited drinking water resources (either directly and/or indirectly through percolation into the underground water resources) might cause considerable economic cost and irreversible environmental damages, but also direct financial cost, such as considerably increased capital cost in water production and raw water treatment cost to provide hygienically clean drinking water to the population, and extensive cost for the rehabilitation of environmental damages.
e
Though adequate sewerage infrastructure requires capital investments which often exceed those for water supply infrastructure, the economic benefits of waste water projects and the savings in other vital sectors, e.g. for water supply treatment, public and private health care infrastructure and environmental preservation, justify and require these expenditures, and often even require higher priority on sanitation projects than on water supply. Safe and hy- gienic water supply and sanitation has been shown to be highly effective in reducing the incidences of water and sewer related diseases and to be effective in controlling cholera, typhoid, giardiasis and a variety of other diseases and it is obvious, that adequate and safe water supply and sanitation, through generally improved health conditions, decreases the burden of sickness to the individual, the family and the economy, increases the economic productivity of the population and their earning capacity and decreases the cost for medical infrastructure and services to the society as a whole.
a
12.3.3 Tariff Recommendations
We recommend, in line with wide spread practices all over the world and considering the limited ability and willingness to pay for sewerage services, to link the waste water charges directly to the water consumption and to charge for waste water collection and treatment a general surplus on all water consumption in the order of 25% on all water bill. According to the cost recovery and subsidization policies defined by the competent authorities for this service, this surplus could gradually be increased to the AIC level.
In this case, the FlRR of the waste water operations would be in the acceptable order of 6.31%. a H:\ConDat\BeWAKISTAM233209\Final ReporWR Vol l\VoIl-chlJ.doc

Quetta WSE - Final Report, Volume 1 Chapter 13 / Page21
The main advantages to link waste water charges to water consumption (instead of di- rectly/separately charging for the wastewater services) include:
0 if waste water charges are levied exclusively/separately from water supply services, people will try by any means to escape this payment,
0 if, on the other hand, waste water charges are linked to all water consumption (even for those consumers, who are not yet connected to the sewer system), water consumers, usually used to pay for their water consumption, will easier accept to connect to the waste water system, if they have to pay for such charges anyway,
0 to achieve given cost covering objectives, waste water charges linked to water con- sumption are much lower than direct waste water charges, and accepting that the whole population in the project area, even those not directly served by the sewer system, are profiting directly and indirectly from the waste water operations, all water consumers (and thus waste water producers) duly contribute to the benefits of the community, a
0 a joint watedwaste water bill would further support the important objective of water resources management through cutting off of excess water use and reduction of water wastage (which not only helps to save scarce water resources, but also helps to reduce the needs for water and waste water assets and the respective capital requirements),
0 joint management of water and waste water charges results in more cost effective ad- ministration, billing and collection (however, it should be emphasized, that in any case the accounts for water supply and sanitation services should be strictly separated in distinct codprofit centers).
In view of the forthcoming waste water projects, this surcharge on water consumption for waste water services should be implemented immediately in small, acceptable increments (say 5% in 2001, 10% in 2002, 15% in 2003 and 20% in 2004 and thereafter, until further revision of tariffs, which anyway should be reviewed annually).
Ability to pay considerations are included in above respective discussion of the recom- mended water tariffs.
a
The introduction of the recommended waste water charges should be preceded by publicity campaigns to increase the awareness of the population for the needs and the individual benefits of hygienic discharge of waste water, but also, at the same time, for the require- ments to pay for such services improving the general and individual living conditions, in- cluding the savings in cost of sickness and for medical care in a healthier environment, through adequate waste water collection and treatment operations and services, which again, analogous to water supply, can only be delivered at the required high quality stan- dard, if the consumers pay for such services.
We further recommend to charge a tariff of PRs 10,- per m3 of treatedrecycled waste water delivered from the waste water treatment plant for imgation purposes, to support the fi- nancial equilibrium of the sanitation operations and to enable phasing out public sector subsidies, considering that imgation water is a production factor the cost for which are 0 H:\ConDat\Ber\PAKISTAM233209\FinaI Repoll\FR Vol l\Voll-chl3.doc

Quetta WSE - Final Report, Volume 1 Chapter 13 / Page22
normally carried on in the sales prices of the profit generating products, and not subsidized by the community through public budgets.
12.3.4 Financial Projections
Similar to the approach in the foregoing analysis of the recommended water resources and supply infrastructure development, this analysis of the recommended waste water invest- ments undertakes to establish a financial scenario for assessing the impacts of the imple- mentation of the proposed phase 1 waste water projects on the financial performance po- tential of BWASA’s sewerage operations.
Operating Expenses
The assumptions for the projection of operation and maintenance cost for the Quetta waste water collection and treatment system (in 1999 constant prices) and their expected devel- opment until 2015 are comprehensively laid down in Volume 2, C and summarised in the foregoing chapter 2.2.
0
To establish the financial projections in current terms the projections of the present finan- cial scenario assume that the actual average inflation rate in the order of I 1 % p.a. will be reduced to 8% up to the year 2000 and will further slow down to a long-term level of 5% p.a.
In accordance with values often adopted e.g. by Asian Development Bank, World Bank and other lending agencies, the average foreign inflation rate for imported goods and serv- ices is expected to remain on a constant 3.0% p.a. level throughout the projection period.
Depreciation
The weighted annual depreciation for the existing waste water assets and the proposed phase 1 extension projects is in the order of approximately 2.5% p.a. on the re-valued gross fixed assets in operation of the Quetta water supply infrastructure.
0
Interest Expenses
Details on the assumptions for the projection of the interest expenses account in the in- come statements are laid down in the following under the heading “Project Financing”. Interest expenses, in the present scenario, are charged to operations.
Taxes
The projection of the income statements in this scenario for the Quetta waste water collec- tion and treatment adopts that no direct taxes will be levied on water supply operations. (For supplies and services indirect taxes are included in the cost estimates).
H:\ConDat\BeWAKISTAN\233209Final ReponFR Vol l\Voll-chl3.doc

Quetta WSE - Final Report, Volume 1 Chapter 13 I Page23
@
Income Statements a
(MILLION CURRENT US$) 2000 2004 2005 2010 201 5 WATER SALES (10% m3 p.a.) 11.43 24.90 27.95 27.95 27.95
NUMBER OF CONNECTIONS (1V3 number) 6.17 17.80 20.71 37.09 48.49 NEW CONNECTIONS (1W3 number) 2.91 2.91 3 28 2 28
REVENUES FROM WASTE WATER SURCHARGE 0.77 2.52 5.59
TOTAL REVENUE POTENTIAL 0.02 0.17 0.77 2.52 5.59 OPERATING EXPENSES 0.74 1.55 INCOME BEFORE DEPRECIATION AND INTEREST 0.02 0.17 0.77 1.77 4.04
DEPRECIATION (2.5% OF GR. FIX. ASSETS) 0.10 0.64 0.98 1.77 2.27 INCOME FROM OPERATIONS -0.08 -0.47 -0.21 0.01 1.77
INTEREST EXPENSES 1.73 1.49 NET INCOME ( minus = operational subsidies) -0.08 -0.47 -0.21 -1.73 0.28 .OPERATING RATIO (REV/( O&M t DEPR EC I ATION) 0.21 0.26 0.78 1 .oo 1.46
RETURN ON AVG. GROSS FIXED ASSETS (?o) -1.9% -1 5% -0.4% -2.1% 0.6% LOCAL INFLATION 11 .O% 8.6% 8.0% 5.0% 5.0%
AVERAGE TARIFF (US$ per m3 of water sold) 0.03 0.09 0.20
FIXED MONTHLY CHARGE PER WATER CONNECTION 0.28 0.79
REVENUES FROM NEW CONNECTIONS
RETURN ON AVERAGE EQUITY (%) -1.9% -2.7% -1.1% -5.5% 1.5%
The Income Statements, projected with above assumptions, suggests that substantial public subsidization, as well of capital investments into the waste water infrastructure as of the waste water operations, will be required to provide the population of Quetta with accept- able waste water services. However, such subsidies from severely limited public financial resources must be expected to seriously restrict the urgently required financial means, and thus the development opportunities and requirements, in other socially and economically vital sectors such as education, health, poverty infrastructure, etc. Public waste water sub- sidies can only be phased out in medium and long term if adequate tariff policies are adopted, supported by efficient professional technical and financial management and op- erations of the waste water sector.
Fixed Assets
Actually no conclusive asset accounting, depreciation and asset management is practiced by the Quetta BWASA, neither in the water supply sector nor in the sewerage sector. A first assessment of the existing waste water assets, for the purpose of the present financial scenario, based on the known length of the existing sewer system, land and other waste water assets, and their preliminary valuation at the replacement value, amounting to a total
a H:\ConDat\BehPAKlSTA33209\Final ReportFR VoI l\VoIl-chl3.doc

Quetta WSE - Final Report, Volume 1 Chapter 13 I Page24
of some US$ 3.99 million, is considered for the present pro-forma balance sheet projec- tions.
Capital investments into the proposed Phase 1 waste water infrastructure in the Quetta project area are summing up to US$38.38 million.
TABLE 13.7 :
a
Summary Of Proposed Phase 1 Waste Water Investments
TOTAL
0.14 6.06 0.21
0.41 13.12
1.50
21.44
(constant 10' US$ of mid 1999) foreign cost indir. Loc. cost dir. loc. cost % US$ % US$ % US$
10% 0.01 10% 0.01 80% 0.11 20% 1.21 10% 0.61 70% 4.24 70% 0.15 10% 0.02 20% 0.04
90% 0.37 10% 0.04 15% 1-97 15% 1.97 70% 9.18
100% 75% 1.13 25% 0.38
23% 4.84 12% 2.61 65% 14.00
'HASE 1 WASTE WATER PROJECT
Rehabilitation Treatment plant - civil works Treatment plant - equipment Sewers Cars, Machines Land acquisition Engineering
'OTAL BASE COST
physical contingencies (1 5%) price contingencies (avg 7% pa)
Value Added Tax (1 4%)
'OTAL WASTE WATER PROJECT ource: Volume 2, Section C
3.22 9.01 4.71
0.73 0.39 2.10 2.03 1.10 5.88 1.06 0.57 3.08
38.381 23% 8.65 12% . 4.67 65% 25.05 and is owned by BWASA
Capital investments for the implementation of phase 1 of the proposed waste water infra- structure development in Quetta are initially posted to the work in progress account of the pro-forma balance sheets and transferred to the gross fixed asset account in the year fol- lowing the commissioning of the respective project progress.
a
Gross fixed assets are revalued with the weighted average of the expected local and foreign inflation rate.
Depreciation of revalued gross fixed assets in this scenario is 2.5% p.a.
H:\ConDat\BeAPAKISTAN\233209Final ReDortWR Vol l\VoIl-chlB.doc

Financing of Phase 1 Waste Water Infrastructure Development
~~
I %fiT I 2001 2002 2003 2004 2005
Detailed financing arrangements for the proposed phase 1 waste water infrastructure de- velopment in the Quetta supply area were not yet settled at the time when the present study has been elaborated. Therefor the present scenario assumes standard financing arrange- ments for similar analysis of waste water in similar surroundings:
38.38 26.86 11.51
26.86 3.79 0.71
31.37
42.88
TABLE 13.8 : Summary Of Financing Plan For Phase 1 Waste Water In- frastructure Development
1.28 5.88 9.49 10.19 11.55 0.89 4.11 6.64 7.13 8.OE 0.38 1.76 2.85 3.06 3.4E
0.89 4.11 6.64 7.13 8.0t 0.05 0.30 0.70 1.13 1.61 0.26 0.22 0.15 0.08 - 1.21 4.63 7.49 8.34 9.7C
1.21 5.84 13.33 21.67 31.37 1.59 6.40 10.34 11.39 13.16
I million current US$
a
WASTE WATER COLLECTION AND TREATMENT EXTERNAL FUNDING
INTERNAL GOVERNMENT SUBSIDIES EXTERNAL FUNDING
DISBURSEMENT OF PROJECT FUNDS INTEREST DURING CONSTRUCTION (capitalized)
COMMITMENT CHARGES (capitalized) TOTAL TO BE FINANCED BY EXT. FUND.
LONG TERM DEBT
Basic assumDtions on financina conditions: GRAND TOTAL TO BE FINANCED
Proportion financed by external sources:
grace period: 5 years after first disbursement annuity (million US$) 2.45
70% Interest during construction: 6.00% on drawn loan portion, capitalized I
Commitment charges: 1 .OO% on committed loan portion not drawn Interest: 6.00% on outstanding loan.
I loan period: 30 years, including
Further to the foregoing assumptions on project financing, the projections of the sources and application of funds statements and the projection of the pro-forma balance sheets are based on the following assumptions:
Other Capital Expenditures
The scenario assumes that, after the implementation phase of the proposed projects in 2006, annually some US$ 0.1 million (in current terms) will be invested in general waste water assets, wate water collector system, house connections (which, in this scenario, will not be recovered directly through connection charges to encourage the population to con- nect to the waste water system, but indirectly during a first phase through subsidies and later indirectly through waste water tariffs), etc and financed by internally generated funds. a H:\ConDat\BeWAKISTAM233209\Final ReportFR VoI l\Voll-chl %doc

Quetta WSE - Final Report, Volume 1 Chapter 13 / Page26
Replacements
SOURCES OF FUNDS NET INCOME
DEPRECIATION INTEREST
IINTERNAL CASH GENERATION
This scenario assumes that from 2006 onwards approximately 0.5% of the waste water as- sets in operation will require to be replaced annually and are accounted for in current terms (revalued with the expected local inflation rate) and expected to be financed by internally generated funds.
-0.08 -0.06 -0.08 -0.22 -0.47 -0.21 -1.73 0.28 0.10 0.1 1 0.16 0.34 0.64 0.98 1.77 2.27
1.73 1.49 0.02 0.04 0.08 0.12 0.17 0.77 1.77 4.04
Cash and Banks
PROPOSED PROJECT EXTERNAL FUNDING INTERNAL FUNDING
TOTAL FINANCE TOTAL CASH INFLOW
APPLICATION OF FUNDS TOTAL PROPOSED PROJECT
OTHER CAPITAL EXPENDITURES INCREASE IN OTHER ASSETS
INCREASE IN PAYABLES (-) I WORKING CAPITAL NEEDS
The cash and banks account is the end year cash balance calculated in the projected sources and application of funds statements.
1.21 4.63 7.49 8.34 9.70 0.38 1.76 2.85 3.06 3.46 1.59 6.40 10.34 11.39 13.16
0.02 1.63 6.47 10.45 11.56 13.93 1.77 4.04
1.59 6.40 10.34 11.39 13.16 0.23 0.30
0.01 0.01 0.01 0.01 0.16 0.10 0.18 -0.57 -0.05 -0.93
0.01 0.01 0.01 0.01 -0.41 0.05 -0.75
TABLE 13.9 : Projected Sources and Application of Funds Statements a ,
PROPOSED PROJECT LOAN AMORTIZATION
INTERESl TOTAL DEBT SERVICE
REPLACEMENTS TOTAL CASH OUTFLOW
I (MILLION CURRENT US$) I 2000 2001 2002 2003 2004 2005 2010 2015
NET CASH INFLOW CASH, BEGINNING
CASH, ENDING DEBT SERVICE RATIO
0.72 0.97 1.73 1.49 2.45 2.45 0.34 0.43
1.60 6.41 10.35 11.41 12.75 3.07 2.43 0.02 0.04 0.07 0.1 1 0.15 1.18 -1.30 1.60
0.02 0.06 0.13 0.23 0.39 -6.35 -9.62 0.02 0.06 0.13 0.23 0.39 1.56 -7.64 -8.02
0.72 1.65
H:\ConDat\BeWAKlSTAN\233209Final ReportFR VoI l\Voll-chl3.doc

Accounts Receivable
The projection assumes that, through improved customer management, billing and collec- tion operations and performance the accounts receivable can be brought down to a 100 days level up to 2003 and maintained on this level throughout the projection period.
Inventory
The projection of the inventory account assumes that the utility will maintain a stock of operation and maintenance materials required for 3 months of normal operations.
Capital
The capital account is assumed to increase only as a result of retained earnings. 0 Equity
The equity account is assumed to increase according to the Government subsidies invested for the development of the Quetta water infrastructure.
Accounts Payable
Accounts payable are estimated at 2 months operating expenses other than personnel cost.
Current Portion of Long, Term Debt
The account current portion of long-term debt includes the principal due the following year on all long-term debt.
Increase in Other Assets 0
Increase in other assets in the sources and application of funds statements includes ac- counts receivable and inventory.
H:\ConDat\BeWAKISTAM233209iFinal ReponiFR VoI I\Voll-chlJ.doc

Quetta WSE - Final Report, Volume 1 Chapter 13 / Page 28
3.99 4.30 6.33 13.63 25.57 39.32 70.72 90.61 0.10 0.21 0.37 0.71 1.35 2.33 10.25 20.53
~ 3.89 4.09 5.96 12.92 24.23 36.99 60.47 70.07
3.89 5.68 12.36 23.26 35.62 50.15 60.47 70.07
I
1.59 6.40 10.34 11.39 13.16
TABLE 13.10 : Summary Of Pro-Forma Balance Sheet
~
0.02 0.06 0.13 0.23 0.39 1.56 -7.64 -8.02 0.01 0.01 0.02 0.03 0.05 0.21 0.69 1.53
0.10 0.22
' fMlLLlON CURRENT US$) I 2000 2001 2002 2003 2004 2005 2010 2015 I
SUBTOTAL CURRENT ASSETS TOTAL ASSETS
REVALUED GROSS FIXED ASSETS LESS ACCUMULATED DEPREClATlOh
NET FIXED ASSETS WORK IN PROGRESS
SUBTOTAL FIXED ASSETS CASH & BANKS
ACCOUNTS RECEIVABLE INVENTORY
OTHER ASSETS 0.03 0.07 0.15 0.26 0.43 1.77 -6.86 -6.27
~
3.92 5.75 12.51 23.52 36.06 51.92 53.61 63.81 ~~
CAPITAL EQUITY
REVALUATION SURPLUS
ACCOUNTS PAYABLE CURRENT PORTION OF LONG TERM DEBT
OTHER LIABILITIES
SUBTOTAL EQUITY
SUBTOTAL CURRENT LIABILITIES 'ROPOSED PROJECT
LONG TERM DEBT EXTERNAL FUNDING rOTAL LIABILITIES rOTAL LIABILITIES AND EQUITY
-0.08 -0.14 -0.22 -0.45 -0.92 -1.13 -12.28 -15.58 3.99 4.37 6.14 8.98 12.04 15.50 15.50 15.50
0.31 0.75 1.65 3.26 5.61 21.38 37.96 3.91 4.54 6.66 10.19 14.38 19.98 24.60 37.88
0.09 0.21 0.57 0.77 1.88
0.57 0.86 2.09
1.21 5.84 13.33 21.67 31.37 28.14 23.83 1.21 5.84 13.33 21.67 31.94 29.00 25.92
3.91 5.75 12.50 23.52 36.05 51.92 53.60 63.80
The projections of the income statements over the 10 years following the implementation of the recommended waste water projects, the projected sources and application of funds statements and of the pro-forma balance sheets suggest, provided adequate cost recovery policies, viable waste water tariffs and consistent subsidization policies (which are antici- pated to phase out within the decade) are implemented to overcome obvious financial bot- tlenecks. A vital condition therefore is that the overall technical, commercial and financial management and operations of BWASA are improved to achieve a viable financial devel- opment potential of the Quetta BWASA waste water operations. However, this can only be sustained, if adequate tariff policies are adopted.
Consolidated financial statement of BWASA for their water and wastewater operations are added in the following tables 13.11 to 13.13.
H:\ConDat\Ber\PAKISTAN\233209iFinal ReDortiFR Vol l\Voll-chl3.doc

Table 13,Il QUETTA WATER SUPPLY AND ENVIRONMENTAL IMPROVEMENT PROJECT
PROJECTED INCOME STATEMENT BWASA - CONSOLIDATED WATER SUPPLY AND WASTE WATER OPERATIONS (MILLION CURRENT US$) 2000 2001 2002 2003 2004 2005 2006 2007 2008 2009 2010 2011 2012 2013 2014 ' 2015
REVENUES FROM WATER &WASTE WATER SERVICES ~ 4.72 5.76 7.39 9.03 10.66 12.30 13.58 14.87 16.15 17.44 18.73 REVENUES FROM NEW CONNECTIONS 0.11 0.84 093 1.02 1.10 1.14 1.22 1.31 1.38 1.47 1.61 1.69 1.78 1.87 1.96
REVENUES FROM FIXED CONNECTION CHARGE 1.01 1.23 1.66 2 15 2.70
TOTAL REVENUE POTENTIAL WATER &WASTE WATER 1.01 1.33 2.50 307 3.72 5.22 6.90 8.62 10.33 12.05 13.76 15.20 16.56 17.94 19.31 20.69 OPERATING EXPENSES WATER &WASTE WATER
SAIARIESANDALLOWANCES 0.63 0.69 0.76 084 0.91 0.99 1.21 1.29 1.37 1.45 1.52 1.65 1.73 1.82 1.91 2.00 REPAIRSAND MAINTENANCE 0.23 0.39 0.57 078 1.01 1.27 1.64 1.73 1.83 1.92 2.00 2.39 2.50 2.62 2.74 2.87
ELECTRICITY 0.31 0.45 0.61 078 0.98 1.21 1.33 1.43 1.53 1.62 1.71 1.80 1.91 2.02 2.14 2.27 CHEMICALS 0.01 0.01 001 0.02 0.02 0.02 0.03 0.03 0.03 0.03 0.03 0.03 0.04 0.04 0.04
CONSUMABLES 0.00 0.01 0.01 0.02 0.02 0.04 0.04 0.04 0.04 0.05 0.06 0.06 0.06 0.07 0.07 GENERALEXPENSES/CONTINGENCIES 0.16 0.23 0.30 0.37 0.46 0.55 0.66 0.71 0.75 0.80 0.84 0.94 0.99 1.04 1.09 1.15
CONSOLIDATED OPERATING COST WATER &WASTE WATER 132 178 226 280 340 406 490 523 555 585 615 687 722 759 799 840 CONSOUDATED INCOME BEFORE DEPRECQTION AND INTEREST -032 -044 024 027 031 117 200 339 479 619 762 833 934 1034 1132 1229
8,711
DEPRECIATION WATER &WASTE WATERASSETS 0.75 0.89 1.17 2 09 3.18 4.10 5.09 5.44 5.79 6.16 6.53 6.91 7.31 7.75 8.23
CONSOUDATED INCOME FROM OPERATIONS -1.07 -1.33 -093 -1.82 -2.87 -2.93 -3.10 -2.05 -1.00 0.03 1.09 1.42 2.03 2.59 3.10 3.58 INTERESTEXPENSESWATERfiWASTEWATER 4.98 4.89 4.79 4.68 4.56 4.44 4.32 4.18 4.04 3.89
CONSOLIDATED INCOME BEFORE TAX I -1.07 -1.33 -0.93 -1 82 -2.87 -2.93 -8.08 -6.94 -5.79 -4.64 -3.48 -302 -2.29 -1.59 -0.94 -0.31 I
CONSOLIDATED NET INCOME ( minus = operational subsidies) -1 07 -1 33 -093 -1 82 -2 87 -293 -808 -694 -579 -464 -348 -302 -229 -1 59 -094 -031 OPERATING RATIO (REV/(O&M+DEPREClATlON) 048 050 073 063 056 064 069 081 091 100 109 110 114 117 119 121 RETURN ON AVERAGE EQUITY (%) -4.0% 4.0% -2.2% -34% -4.5% -4.1% -11.0% -9.0% -7.1% -5.3% -3.1% -6.2% -4.4% -2.8% -1.5% -0.4% RETURN ON AVG. GROSS FIXED ASSETS (%) -3.8% -3.7% -1.7% -20% -2.3% -1.9% -4.5% -3.6% -2.8% -2.1% -1.3% -2.5% -1.8% -1.2% -0.7% -0.2%
LOCAL INFLATION 11.0% 10.4% 9.8% 9 2% 8.6% 8.0% 7.4% 6.8% 6.2% 5.6% 5.0% 5.0% 5.0% 5.0% 5.0% 5 0% FOREIGN INFLATION 3.0% 3.0% 3.0% 30% 3.0% 3.0% 3.0% 3.0% 3.0% 3.0% 3.0% 3.0% 3.0% 3.0% 3.0% 3.0%

TABLE 13,12 QUETTA WATER SUPPLY AND ENVIRONMENTAL IMPROVEMENT PROJECT
PROJECTED SOURCES AND APPLICATION OF FUND STATEMENT BWASA - CONSOLIDATED WATER SUPPLY AND WASTE WATER OPERATIONS
(MILLION CURRENT US$) ZOO0 2001 2002 2003 2004 2005 2006 2007 2008 2009 2010 2011 2012 2013 2014 2015 CONSOLIDATED SOURCES OF FUNDS
NETINCOME -1 07 -1 33 -093 -1 82 *287 -293 -808 -694 -579 -461 -348 -302 -229 -1 59 -094 -031 DEPRECIATION 075 089 117 209 318 410 509 544 579 616 653 691 731 775 823 871
INTEREST 498 489 479 468 456 444 432 418 404 389
STERNAL CASH GENERATION -0.32 -0.44 0.24 0.27 0.31 1.17 2.00 3.39 4.79 6.19 7.62 8.33 9.34 10.34 11.32 12.29
ROPOSED WATER AND WASTE WATER PROJECTS EXTERNALFUNDING 183 5 17 1931 2251 1697 1724 1NTERNALFUNDlNG 057 180 749 843 577 561
OTAL FINANCE WATER AND WASTE WATER 2.40 6.96 26.80 3094 22.74 22.85
ONSOLIDATED CASH INFLOW 2.08 6.52 27.04 31 21 23.05 24.02 2.00 3.39 4.79 6.19 7.62 8.33 9.34 10.34 11.32 12.29 CONSOLIDATEDAPPLICATION OF FUNDS
ROPOSED WATER AND WASTE WATER PROJECTS
OTHER CAPITAL EXPENDITURES INCREASE IN OTHER ASSETS
INCREASE IN PAYABLES (-) WORKING CAPITAL NEEDS
ROPOSED WATER AND WASTE WATER PROJECTS LOAN AMORTIZATION
INTEREST
OTAL CONSOLIDATED DEBT SERVICE
REPLACEMENTS OF WATER AND WASTE WATER ASSETS
2.40 6.96 26.80 3094 22.74 22.85
0.19 0.45 0.69 0.97 1.26 1.59 1.93 2.30 2.70 3.13 3.29 033 013 037 021 024 048 0% 050 050 049 049 049 040 041 041 041 -012 -006 -007 -008 -009 -168 -020 -014 -015 -015 -016 -023 -018 -019 -020 075 022 007 030 013 015 -121 035 035 035 034 034 027 022 022 021 116
1.59 1.68 1.78 1.89 2.01 2.13 2.25 2 . 3 2.53 2.68 4.98 4.89 4.79 4.68 4.56 4.44 4.32 4.18 4.04 3.89
6.57 6.57 6.57 6.57 6.57 6.57 6.57 6.57 6.57 6.V
0.20 0.99 1.18 1.25 1.33 1.42 1.50 1.58 1.67 1.77 1.42
'OTAL CASH OUTFLOW 2.62 7.03 27.10 31.08 22.89 22.03 8.36 8.79 9.14 9.51 9.91 10.27 10.67 11.15 11.67 12.44 :ONSOLIDATED NET CASH INFLOW -0.53 -0.51 -0.06 0 14 0.16 1.99 -6.36 -5.41 -4.35 -3.32 -2.29 -1.94 -1.33 -0.81 -0.35 -0.14
CASH, BEGINNING -0.53 -1.04 -1 10 -0.97 -0.80 1.19 -5.18 -10.58 -14.94 -18.25 -20.55 -22.49 -23.82 -24.63 . -24.98 CASH, ENDING -0.53 -1.04 -1.10 -0 97 -0.80 1.19 -5.18 -10.58 -14.94 -18.25 -20.55 -22.49 -23.82 -24.63 -24.98 -25.12
)EBT SERVICE RATIO 0.30 0.52 0.73 0.94 1.16 1.27 1.42 1.57 1.72 1.87

e TABLE 13,13
(MILLION CURRENT US$) 2000 2001 2002 2003 2004 2005 2006 2007 2008 2009 2010 2011 2012 2013 2014 2015 YALUED GROSS FIXED WATER &N WASTE WATER ASSETS 26.01 30.63 40.39 71.95 109.81 141.38 175.61 187.49 199.73 212.28 225.10 238.13 252.17 267.31 283.64 300.46
3 FIXED ASSETS 25.26 28.99 37.58 67.05 101.72 129 19 158.33 164.77 171.22 177.62 183.91 190.03 196.76 204.15 212.26 220.36
LESSACCUMUMTEDDEPRECIATION 0.75 1.64 2.81 4.90 8.09 12.19 17.28 22.71 28.51 34.66 41.19 48.10 55.41 63.16 71.39 80.10
WORK IN PROGRESS WATER 8 WASTE WATER 2.40 6.96 26.80 30.94 22.74 22.85
JBTOTAL CONSOLIDATED FIXED ASSETS 27.66 35.95 64.38 97.99 124.46 152.05 158.33 164.77 171.22 177.62 183.91 190.03 196.76 204.15 212.26 220.36
CASHBBANKS -0.53 -1.04 -1.10 -0.97 -0.80 1.19 -5.18 -10.58 -14.94 -18.25 -20.55 -22.49 -23.82 -24.63 -24.98 -25.12 ACCOUNTSRECEIVABLE 0.28 0.37 0.68 0.84 1.02 1.43 1 89 2.36 2.83 3.30 3.77 4.16 4.54 4.91 5.29 5.67
INVENTORY 0.06 0.10 0.15 0.20 0.26 0.33 0.42 0.45 0.47 0.50 0.52 0.62 0.65 0.68 0.71 0.74 OTHER ASSETS
JBTOTAL CONSOUDATED CURRENT ASSETS -0.20 -0.58 -0.27 0.08 0.48 2.95 -2.86 -7.77 -11.63 -14.46 -16.25 -17.70 -18.63 -19.04 -18.98 -18.71
ITAL ASSETS WATER AND WASTE WATER 27.46 35.37 64.11 98.07 124.94 155.00 155.47 157.00 159.59 163.16 167.65 172.33 178.13 185.12 193.28 201.65 7
QUEi7A WATER SUPPLY AND ENVIRONMENTAL IMPROVEMENT PROJECT
CAPITAL EQUITY
REVALUATION SURPLUS
JBTOTAL E a u i w WATER AND WASTE WATER
ACCOUNTS PAYABLE CURRENT PORTION OF LONG TERM DEBT
OTHER LIAEIIJ~ES
JBTOTAL CONSOLLIDATED CURRENT LIABILITIES
ROPOSED PROJECT WATER AND WASTE WATER LONG TERM DEBT EXTERNAL FUNDING
OTHER LONG TERM DEBT
UBTOTAL CONSOLIDATED LONG TERM DEBT
3TAL LIABILITIES
-1.07 26.59
25.52
0.12
0.12
1.83
1 .&3
1.94
-2.40 28.39 2.22
28.20
0.18
0.18
6.99
6.99
7.17
-3.34 35.87 5.01
37.55
0.25
0.25
26.31
26.31
26.56
-5.15 44.31 9.77
48.93
0.33
0.33
48.81
48.81
49.14
-8.02 50.08 16.69
58.74
0.42
0.42
65.78
65.78
66.20
-10 96 55 69 25 14
69 87
0 51 159
2 10
83 02
83 02
a5 12
-19.04 55.69 35.08
71.73
0.62 1 68
2.30
81.44
81 44
83.74
-25.97 55.69 45.09
74.81
0.66 1.78
2.44
79.75
79.75
82.19
-31.76 55.69 55.11
79.03
0.70 1.89
2.59
77.97
77.97
80.56
-36.40 55.69 65.06
84.34
0.73 2.01
2.74
76.08
76.08
78.82
-39.88 55.69 74.88
90.69
0.77 2.13
2.90
74.07
74.07
76.97
-42.90 55.69 84.48
97.26
0.87 2.25
3.12
71.95
71.95
75.07
-45.19 55.69 94.64
105.13
0.92 2.39
3.30
69.69
69.69
73.00
-46.79 55.69 105.41
1 14.32
0.96 2.53
3.49
67.30
67.30
70.80
-47.73 55.69 116.85
124.81
1.01 2.68
3.70
64.77
64.77
68.47
-48.03 55.69 128.96
136.61
107 1.88
2.95
62.09
62.09
65.04
3TAL CONSOUDATED LIABILITIES AND EQUITY 27.46 35.37 64.11 98.07 124.94 155.00 155.47 157.00 159.59 163.16 167.65 172.33 178.13 165.12 193.28 201.65 ACCOUNTING CHECK
DEBTEQUITY RATIO 0.25 0.70 1.00 1.12 1.19 1.14 1.07 0.99 0.90 0.82 0.74 0.66 0.59 0.52 0.451
I CURRENT RAno (current asseWcurrent liabiliiies) -3.21 -1.10 0.23 1.15 1.40 -1.25 -3.18 -4.49 -5.28 -5.61 -5.67 -5.64 -5.45 -5.13 -6.35 REVALUATIONFACTOR 1.00 1.08 1.07 1.07 1.07 1.06 1.06 1.06 1.05 1.05 1.05 1.04 1.04 1.04 1.04 1.04

14. IMPLEMENTATION PROJECT

Ouetta WSE - Final Reuort. Volume 1 Chauter 14 / Page 1
14. IMPLEMENTATION ARRANGEMENTS
14.1 Integration of Project Components
The proposed implementation program is focused on an overall sustainable development of Quetta’s water supply, and provides a phased investment plan for rational utilization of water resources and sanitation systems. In the prevailing conditions, sustainability can only be achieved if the combined measures create equilibrium between recharge and ab- straction in the area’s main source of potable water, the alluvial aquifer underlying the Quetta Valley. Since all measures and their effects are interdependent, it is essential that the defined project components be implemented jointly and in the proposed sequence.
Subject to detailed arrangements - internally by Government authorities, and possibly with the Bank’s financial assistance - an advance Water Resource Investigation Program is envisaged to back up subsequent final decisions on the main investment program.
Generally, the Phase 1 implementation program as proposed for Bank financing will pro- vide the fundamental institutional, social, technical and economic components that lead towards massive improvements in the coverage of water demand, environmental condi- tions and water balance. However, considering also local funding and implementation ca- pacities, this program is embedded in a long-term strategy and has to be continued in a second phase, before full demand coverage and a balanced regime in the alluvial aquifer can reasonably be expected. The overall concept, including also a third implementation phase within the 20 years period, provides the necessary planning and scheduling in a fashion that gives room for adjustment in response to actual development and findings of detailed exploration.
14.2 Project Implementation Schedule
As proposed, preparatory water resources investigations have to start in advance of the main physical work, around July 2000. Final results will not be available before comple- tion of exploration well drilling and evaluation, expected in the later half of 2001, but nev- ertheless, it is anticipated that preliminary findings from geophysical investigations and first test wells in the limestone aquifer will be in hand by end 2000.
Considering the pressing needs, general project implementation is thus expected to com- mence in January 2001 with those components that are not directly dependent upon the above investigation program. It is reasonably assumed that Loan Agreement and local funding arrangements could be concluded, Project Management and Project Implementa- tion Units are in place and other functional, and required institutional preconditions are fulfilled by that date.
H\ConDal\Ber\PAKISTNW332~nal ReportWl V d l\vollchl4.do(:

Ouetta WSE - Final ReDort. Volume 1 Chapter 14IPaee 2
Phase 1, essentially the package proposed for Bank financing, is scheduled to be com- pleted by end 2005. Realization of the further program until the target year 2020 is fol- lowing a logical sequence and, where practical, packaging in consecutive 5-year imple- mentation periods. The programming considers well supported and less expensive compo- nents in the earlier stages, and those packages that need more exploration and higher in- vestment later, in order to allow for well-founded decision-making and flexible response to unexpected development.
e
The Implementation Schedule is shown as bar chart in Figure 14.1.
14.3 Execution and Coordination
Implementation of this multi-component project will involve agencies at the Central, Pro- vincial and Municipal government levels, and cooperating NGOs and CBOs. Lead exe- cuting agency will be the Planning and Development Department, Government of Balo- chistan, with BWASA and Quetta Municipal Corporation as implementing agencies of the main components. Due to the major re-shuffling of GOB administrative structures, fol- lowing the change of central government, roles and responsibilities may change shortly. The Bank may wish to initiate policy dialogue.with GOB on this aspect of an ensuing project to establish shared understanding of the issues involved. Pending relevant further decisions, the following distribution of tasks and responsibilities for project implementa- tion is suggested:
a
At the central level, Ministry of Finance and Economic Affairs Division will deal with the loan and internal funding aspects.
At the provincial/municipal level, a Project Steering Committee chaired by the Additional Chief Secretary P & D, or alternatively the (proposed) District Water Board, will be the intermediate body to provide consultation, liaison and coordination between the various agencies concerned. The committeehoard will meet at least once every month. The formal management structure would be supplemented by informal communication on specific is- sues.
0
To ensure continuous professional project management, a Project Management Unit (PMU) will be established in the Provincial Government. Assisted initially by advisors, the PMU will be responsible for contract management; operational coordination and su- pervision; monitoring and reporting including PBME; conducting public campaigns and community development programs; and coordinating further studies, investigation and ex- ploration programs.
Day-to-day management of consultants’ and contractors’ services will be carried out by Project Implementation Units (PIU), established for each Sector, and reporting to the Proj- ect Manager PMU.
Consultants will be engaged to undertake detailed design work and to assist with con- struction supervision.
H\ConDat\BeWAKISTAM232~nal RewrWR Vol l \ vo l lCh l4 .&~


14.4 Procurement
The procurement of goods and services under Phase 1 of the project will be undertaken in accordance with the Bank’s Guidelines for Procurement. Indicative procurement packages are presented in the relevant sectional chapters and summarized in Tables 11.1 and 12.1 above. It is proposed that contracts for the supply of special vehicles and equipment, and water supply pipes and accessories be awarded through international competitive bidding (ICB) or international shopping(1S). Major civil works contracts costing US$ 1 mio or more, and vehicles, equipment, or materials costing US$ 0.5 mi0 or more would be awarded through ICB procedures. Other goods and services are procured Cdlowing local competitive bidding (LCB) procedures acceptable to the Bank.
14.5 Land Acquisition and Rights ~@
The major plots of land required in Phase 1 - for Wastewater Treatment Plant (approx. 80 ha) and Sanitary Landfill (approx. 27.7 ha) - have been acquired earlier by BWASA and QMC respectively for the assigned purposes. For water resource development, land acqui- sition will be required, subject to the results of detailed exploration. Pending final engi- neering design, the other project components such as water and wastewater conveyance systems, are predominantly aligned along public right of way, and the need for land acqui- sition and resettlement has been largely avoided for Phase 1 implementation.
In the second and third phases, major additional land acquisition will be required for fur- ther well fields, Kuchnai Dam, extension of the Cantonment Water Treatment Plant, ex- tension of Wastewater Treatment Plant at E l i Barmah, stormwater drains and flood reten- tion basins with attached percolation channels, and eventual extension or new site of solid waste disposal site. Relevant areas envisaged are uninhibited at present. :* 14.6 Maintenance of Project Facilities
Subject to final administrative arrangements, the tentative allocation of responsibilities for operation and maintenance of project facilities will be as follows:
Wells BWASA Water Supply Installations BWASA
0 Kuchnai Dam Scheme Military Engineering Services (MES) 0 Sewerage System BWASA
0 FloodControl BIDA
excl. Kuchnai Dam Scheme
0 Urban Drainage QMC
0 Solid Waste Disposal QMC
H:\ConDat\BeWAKISTA33209Final RemftWR Vol t\vollchl4.doc

14.7 Reports, Accounts, Audits
Quarterly project progress reports will be prepared uy the Project Manager PMU, and submitted to the Steering Committee and the Bank within one month after the end of each quarter in a format and detail as the Bank may reasonably request. They will provide a de- scription of progress, details of any modifications to the project schedule, problems en- countered, and an outline of the work in the following quarter. The reports will also give summary accounts of the project, including expenditure during the quarter, fiscal year tq date expenditure and total expenditure to date, as well as status of financial and institu- tional developments, benefit monitoring, and compliance with loan covenants.
Detailed project accounts, as maintained by the Project Manager PMU, will be submitted to the Steering Committee and the Bank within nine months of the close of the fiscal year in audited form. The auditor will be chosen with the approval of the Bank. The auditor’s report will include certified copies of the audited accounts, financial statements, the audi- tor’s professional opinion on the use of loan proceeds, the status of compliance with the Bank’s loan covenants, and an explanation of the procedures to prepare and compile statements of expenditure.
a
A Project Completion Report will be submitted by the Project Manager PMU to the Steering Committee and the Bank within three months of substantial completion of the project, describing the execution and initial operation of the project facilities.
The responsibility for preparing these reports, accounts and statements, and their timely submission rests with the Project Manager PMU.
14.8 Benefit Monitoring and Evaluation
To protect investments, and to ensure that project works and facilities are managed and operated efficiently at the envisaged service levels, and that target groups are realizing the anticipated benefits from the development, the project will devise a benefit monitoring and evaluation program (BME) to monitor the delivery, use and benefits of the rehabilitated, upgraded and extended facilities. The results of the program will eventually incorporated into an evaluation exercise which will be undertaken periodically after extended periods of operation of the improved infrastructure. BME inception includes establishing benchmark socio-economic and technical profiles based on initial and periodic surveys, data collec- tion, and analyses of environmental quality, public health, property values, and operational and institutional efficiency. The BME framework will be designed, developed and com- missioned by the project consultants in compliance with the Bank’s BME guidelines dur- ing the design phase, and PMU will be responsible for its maintenance in accordance with a schedule and terms of reference agreed upon by the Bank. Quarterly Reports during project implementation will include information on the BME planning and establishment of baseline and performance indicators. Annual BME Reports will submitted by the Proj- ect Manager PMU to the Steering Committee and the Bank with the first Quarterly Report for each year, continuing until one year after submission of the Project Completion Report.
a
0 H:\ConDat\Ber\PAKISTAN\233ZO~n~ ReDodFR V d l\voll c h l 4 . d ~

Quetta WSE - Final Report. Volume 1 Chaoter 14 /Page 6
14.9 Mid-term Review
It is proposed that a comprehensive midterm review be carried out when the project has reached the implementation stage at which detailed engineering for the main sub-projects is complete and major contracts have been awarded and commenced. this is envisaged to be about 12 months from loan effectivity. The purpose of the review will be to critically evaIuate actual project progress, implementation procedures, procurement methodology, BME procedures, and the performance of the design and supervision consultants. Follow- ing the review, corrective measures as appropriate will be introduced to remedy any iden- tified weaknesses.
H: \ConDat \Ber \PAKlST~3~09~n~ RepomFR Vci l\vollchl4.doc

15. CONCLUSIONS AND RECOMMENDATIONS

15CONCLUSIONS AND RECOMMENDATIONS
15.1 Project Justification
15.1.1 General
Rapid growth of population and water demand on one hand, and receding groundwater reserves combined with less than optimum resource management on the other, have cre- ated a strong demand for piped water supply in the Quetta service area. Furthermore, the existing water resources as well as the urban environment are seriously affected by inade- quate wastewater and solid waste disposal, and by shortcomings of stormwater drainage and flood control. The arid climate necessitates an integrated approach to streamline and strengthen responsible institutions, win public cooperation, and utilize feasible primary and secondary water resources in order to cover the water demand and at the same time restore equilibrium in the groundwater balance.
Adopting the necessary integrated concept, the Project is to solve the current backlog of essential infrastructure services in the City of Quetta and surrounding villages, and at the same time set up medium and long-term programs for their feasible and sustainable devel- opment.
Particularly addressing the needs of low-income groups, the Project lays emphasis on re- duction of health hazards, improvement of living conditions, and promotion of urban effi- ciency. It will also support expansion of the urban economy, which is of increasing im- portance in view of constraints imposed by limited water resources on the further growth of irrigated agriculture. Towards such purposes, services will be improved and expanded in the sectors water supply, wastewater and solid waste disposal, drainage and flood con- trol. Included are, as prominent items, conservation and recycling measures, as well as the sound technical and financial management, operation and maintenance of infrastructure facilities, and other institutional capacities of the agencies involved. m The proposed measures are designed to enhance the protection of earlier investment and extend fundamental social services to the direct benefit of about 355,000 present and ad- ditional 420,000 consumers in its Phase 1 till 2005, and a total of 1,795,000 inhabitants overall by the end of the planning period in 2020.
The Project is given high priority by the Government, and is in conformity with the Bank's country assistance planning and operational policy for the sector, particularly in terms of a necessary integration of various sub-sectoral initiatives for better coordination and mutual reinforcement. For Quetta, the administrative and commercial center of Balo- chistan, substantial improvements especially in the water supply sector are essential.
H:\ConDat\BetU'AKSTANP33209Wnal ReportWR V d l\voll-chl5.doc

15.1.2 Technical Justification
Responding to the specific requirements of the Terms of Reference, and in line with sound professional practice, the proposed technical and other supporting measures follow a pro- gram design and scheduling that:
- is suited to raise primary and secondary water production to demand levels in a feasible staged approach;
- will, if consequently implemented, lead to an equilibrium in the groundwater balance of the alluvial aquifer in the Quetta basin;
- presents a minimum-cost concept, which envisages "no alternative" and straight-forward components to be implemented at the early stages; and
- provides the required time for investigation, response to unexpected develop- ment, and relevant final decision-malung in respect of proposed complex and more expensive components.
15.1.3 Economic and Financial Analyses
The Economic Internal Rate of Return for the proposed Phase 1 development of the water resources and supply infrastructure, estimated with rather conservative assumptions, is in the order of acceptable 14.01 %, compared with the Financial Internal Rate of Return of 8.41 %. For the recommended Phase 1 waste water collection and treatment investments the ERR, calculated with the same conservative assumptions, is 14.52 %, versus the FIRR of 6.31 %.
Thus the economic and financial analysis of the proposed sub-projects shows that the rec- ommended Phase 1 investment program is economically necessary to improve the living and health conditions of the population in the project area, their economic potential and the economic potential in the region. It further suggests a sound potential for viable and sustainable technical and financial development, provided that:
0 necessary institutional reforms, as proposed, are implemented for stringent technical and financial water resources management and for cost effective in- frastructure regulations; technical, commercial and financial management and performance of opera- tions are improved through adequate Technical Assistance, manpower devel- opment and capacity building programs; appropriate financial, public sector subsidization and cost recovery policies are defined, implemented and enforced; and socially compatible, demand driven tariff policies are implemented to achieve these predefined objectives, but also to support demand management by better controlling water wastage through adequate tariff policies and the required stringent resources management.
0
0
Relevant programs to solve these issues, further detailed in Volumes 5 and 6 of this Final Report, have been accepted by the Government agencies involved. Generally, it was rec- ognized that proposed investments are based on technical least-cost options, leading to af- fordable and socially acceptable water prices. 0 H:\ConDat\Be~~ISTAM233209\Final ReportiFR Vol t\vollchlS.doc

Average incremental cost of 0.47 US$/m3 at a discount rate of 12% for water, and the tar- geted coverage of O&M expenditures within the next 5 years, and O&M plus dept service or depreciation within ten years after project completion, result in a recommended increase of flat rates from present Rs 75.- per month to Rs 170.- per month till 2005. Thereafter, structured tariffs on metered consumption basis are proposed, ranging from a lifeline rate of 2.50 Rs/ m3 to a “penalty” rate of 8.00 Rs/ m3 for excessive use. Sewerage charges are proposed to be levied in the form of a 25% surcharge on the water bill.
15.1.4 Environmental Impact
The project beneficiaries are at present faced with critical environmental risks deriving from water-borne pathogen pollution. Most lethal diseases in the region are water-borne or water-related. The highest exposure and associated health risks are associated with the lack of safe drinking water in sufficient quantity, and poor sanitary conditions, which subjects the people to significant pathogen-related environmental health risks. 0
The proposed integrated project components - technically required to establish a balanced regime of water resources - will facilitate optimum improvement of water supply, waste- water and solid waste disposal and urban stormwater drainage. Furthermore, strong health education and community development components will promote beneficiary support and participation. Thus, the overall environmental benefits of the project are significant and far reaching, with major impacts directed particularly at low-income groups, and general im- provement of socio-economic conditions.
Environmental assessments carried out in the scope of project preparation revealed no sig- nificant environmental impacts that would object the implementation and operation of the proposed project. components and further options investigated. In accordance with the Bank’s relevant guidelines, they are classified in Category “ A (dams - full scale addi- tional EL4 will be carried out in the scope of engineering design), and Category “C” (wastewater treatment plants; and sanitary land fill for solid waste disposal). a 15.1.5 Social Dimensions
The project will significantly benefit human development in Quetta and surrounding vil- lages. In addition to health benefits, the project will rise living standards, increase produc- tivity, and support economic growth. With improved water supply, sewerage, solid waste disposal and urban drainage, the incidence of water-related disease will decrease. The project also puts great weight on capacity building to improve development planning, mu- nicipal services management and revenue generation to promote adequate operation and maintenance, and project sustainability. It enhances NGO/CBO involvement in commu- nity participation and hygiene education programs to meet community expectations of de- sign and implementation, and to achieve the envisaged human development objectives.
The proposed resource development and water supply project components will decisively alleviate the acute water shortage. In particular consideration of the pressing needs and financial constraints in low-income groups, public taps are re-introduced to serve local a H:\ConDat\Ber\PAI(IST~33209~in~ ReportFR Vol l\voll t h l 5 . d ~ ~

communities. For swift and economical supply of extended households, increased num- bers of yard connections will be installed. Close cooperation with NGOs and CBOs will facilitate appropriate site selection and care of facilities in a logical extension of higher order technical and administrative arrangements in the supply system.
The envisioned sewerage, drainage and solid waste sub-projects are expected to eliminate local sewage ponding and stop the flow of contaminated wastewater in open channels, that affect the lives of residents - especially of children in less affluent neighborhoods, and in- creasingly pollute the groundwater.
Building public awareness is a major aspect of the participatory agenda of the ensuing Project; one that is fundamental to involving the public and beneficiary communities in many aspects of project implementation, including operation and maintenance of invest- ments, conservation, hygiene education, and support for policy, institutional, and tariff re- forms. This sub-component was initiated during project preparation, and relevant provi- sions have been made for a systematic continuation throughout the implementation phases. It emphasizes particularly community and grassroots-level water conservation, and in- eludes public relations; press relations; multimedia, interpersonal, and community / infor- mal communications; and establishment of a documentation center. Specific lines of ac- tion will cover hygiene education, procedures for NGO/CBO involvement, and public awareness.
@
Thus, the overall impact of the combined measures will not only enhance the vital supply of safe drinking water and the normalization of environmental conditions, but it will also significantly contribute to a balance of the most important groundwater regime in the allu- vial aquifer, systematic resource and demand management, and full involvement of bene- ficiaries in all stages of implementation and operation. Costs could be kept within afford- able limits. In that way, the presented solutions, will be sustainable and to the benefit of the population in the entire service area, particularly the women and children, and disad- vantaged groups.
15.2 Issues and Risks
15.2.1 Implementation
This project preparation report provides an overall view and the preliminary design of in- tegrated water supply and environmental measures that are necessary to cover the de- mands of a capital city of 2 million in an arid climate. Presently, resource management and facilities are inadequate to non-existent. Prevailing conditions require immediate and con- centrated remedial action.
Specific risks deriving from the Project’s urgency, the complex technical interdependen- cies, and the necessary institutional and operational revisions, have been considered in the staging of proposed measures. Consulting services are provided to assist implementation, and an adequate time frame is envisaged to allow detailed exploration of new water re- sources and flexible responses to unforeseen development. In addition to the proposed loan, technical assistance is envisaged for institutional strengthening, implementation and 0, H:\ConDat\BerWAKISTANE33209lFinal ReporWR Vol l\voll t h l 5 . d ~

Quetta WSE - Final ReDort. Volume 1 ChaDter 15 / Page 5
operational support, and public campaigns. Other risks to project execution are seen in the local funding capacity, general administration and timely decision-making, and in the lim- ited absorption capacity of local contractors for the major works involved. It is therefore recommended to install a project management unit to manage and coordinate implementa- tion.
Program components are interdependent and have to be implemented jointly and in logical sequence in order to achieve the anticipated effects. This will require relative large scopes of work in both, exploration and final engineering, and physical implementation.
Potential risks for the management and execution of the proposed program may derive
institutional readiness to decide upon, manage and subsequently operate the complex arrangement of multi-sectoral measures; national and provincial borrowing and funding capacities, and capability to complete relevant arrangements by end 2000; capacities of contractors, consultants and project administrators to handle the large-scale tasks involved; delayed appointment of consul tan ts; dropping of single program components, causing a chain reaction of effects - e.g. deleting the sewerage program would cancel the availability of treated wastewater for irrigation; agriculture continues to deplete the alluvial aquifer; groundwater from this source is not available for domestic use; the groundwa- ter balance continues its negative trend; highly sensitive exploration and production wells in limestone and Zarghoon Range are carried out by inexperienced drilling contractors; and essential investigations, including e.g. continuation of well inventory and up- dating of groundwater model; hydrological program for Kuchnai dam, are not carried out efficiently, and results are not at hand when they are needed for on- leading decision-making.
General program delays due to such potential constraints would cause lagging of imple- mentation behind a “run-away” development of demand, and consequently a continued worsening of the overall situation.
15.2.2 Social and Institutional Aspects
Potential BWASA failure to improve performance is a basic risk that could undermine at- tainment of most project objectives, especially user willingness to pay, which is condi- tioned on service improvements.
The envisioned project will also rely on partnerships with the other institutions concerned with water and sanitation, as well as with NGOs, CBOs, and beneficiaries that, if unpro- ductive, will seriously delay project implementation.
A high risk of diversion of project benefits is present. Risks that good governance prac- tices will not be observed and sustained are also of significant concern. @+ H:\ConDat\BeWAKISTAM2332OWinal ReporWR Vol l\vo11 -chl5.doc

The complexity of the project’s social context and associated requirements for public and beneficiary participation increases overheads. Similarly, the necessity of tailoring project measures to socio-spatial sub-populations reduces economies of scale. Without careful balancing, a tailored approach also risks perceived catering and preferential treatment, potentially aggravating ethnic divisions and divisiveness. Resentment by non-poor groups due to perceived favoritism of poverty-reduction and life-line tariff provisions is also a significant risk. Resistance by vested interests opposed to social equity risks emasculation of social development dimensions of the Project.
Resistance to demand management and conservation by vested interests may also under- mine the effectiveness of overall conservation efforts and the program may degenerate into platitudes and blaming victims.
Many important aspects of comprehensive water demand management are outside the project’s scope, including population planning, rural development to reduce migration push, and measures to contain and accommodate migration pull at source or through di- version to alternative urban destinations. If these aspects go unattended, project objectives will lack complementary support and their attainment will be jeopardized.
e
Jneffective conservation may promote an unbalanced approach and over-emphasis on wa- ter resource development that absorbs scarce resources in low-return ventures. These may reduce development resources available for rural Balochistan, accentuate Quettdrural dis- parities, and encourage additional in-migration.
15.3 Recommended Action
Following the review, constructive commenting of the present report by Executing Agency and Bank, and eventual adjustment of program provisions, the further critical path in project preparation will include:, a
clarification of de-facto responsibilities within GOB, and full-time appointment of suitable personnel to take over PMU tasks and liaison between local, provin- cial and central Government agencies and the Bank; final delineation of the Phase 1 implementation program; Bank’s appraisal Mission and reporting conclusion of Loan Agreement and local funding arrangements; formal establishment of PMU and PIUs; appointment of consultants; continuation of investigation programs; continuation of PR and community development programs; and start of regulative procedures on central and provincial levels towards quantity- based billing of water consumption and electricity for irrigation.
H:\ConDat\BeWAKISTAM233209\Final ReDortFR Vol l\voll -chl5doc

Quetta WSE - Final ReDOrt. Volume 1 Chauter 15 /Page 7
Particular attention has to be paid to the requirement of in-depth exploration and planning of components that are scheduled for later implementation, but need these preparatory ac- tivities for relevant final decisions on detailed scope, cost and timing.
0
H:\ConDanBeWAKISTAN\233209FinaJ ReportFR Vol l\vollchl5.doc

ANNEXES

ANNEX 1 :
COST ESTIMATES AND INVESTMENT SCHEDULES
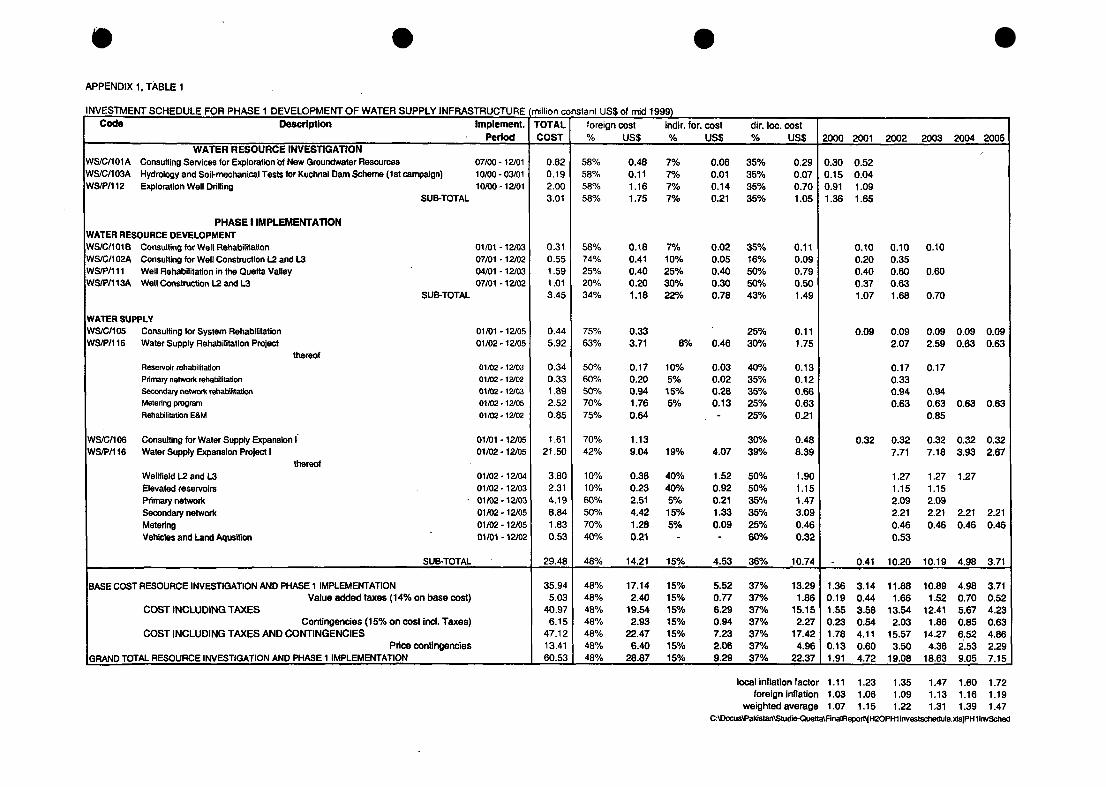
Y APPENDIX 1. TABLE 1
NVESTMENT SCHEDULE FOR PH Code
SE 1 DEVELOPMENT OF WATER SUPPl Description
INFRASTRUCTURE Implement.
' Period WATER RESOURCE INVESTIGATION
VS/C/lOlA Consulting Services for Exploration of New Groundwater Resources 07/00 - 12/01 VS/C/103A Hydrolcgy and Soil-mechanical Tests fur Kuchnai Dam Scheme (lsi campaign) 10/00 - 03/01 VsIp/112 Exploration Well Drilling 1o/w - 12/01
SUB-TOTAL
PHASE I IMPLEMENTATION WATER RESOURCE DEVELOPMENT YSlCllOlE Consulting for Well Rehabilitation 01/01 - 12/03 YS/C/102A 07/01 - 12/02 YSIP/lll Well Rehabilitation in the Quetta Valley 04/01 - 12/03 YSiP/ll3A Well Constructin L2 and L3 07/01 - 12/02
Consulting for Well Construction L2 and L3
SUBTOTAL
NATER SUPPLY NS/C/105 HWIl15
NSICH 06 NWI116
Consulting for System Rehabilitation Water Supply Rehabilitation Project
thereof Reservoir rehabilitation Primary network rehabilitation Secondary network rehabilitaWn Metering program Rehabilitation E&M
Consulting for Water supply Expansion i Water Supply Expansion Project I
Wellfield L2 and L3 Elevated reservoirs Primary network Secondary network Metering Vehkles and Land Aqusition
hmf
01/01 - 12/05 01/02 - 12/05
o i m - 12/03 0102 - 12/02 0102 - 12/03 01/02 - 12/05 01/02 - 12/02
01/01 - 12/05 01/02 - 12/05
01 102 - 12/04 01/02 - 12/03 01 102 - 12/03 01/02 - 12/05 01/02 - 12/05 01/01 - 12/02
SUB-TOTAL
ASE COST RESOURCE INVESTIGATION AND PHASE 1 IMPLEMENTATION Value added taxes (14% on base cost)
Contingencies (15% on cost ind. Taxes)
Price contingencies
COST INCLUDING TAXES
COST INCLUDING TAXES AND CONTINGENCIES
,RAND TOTAL RESOURCE INVESTIGATION AND PHASE 1 IMPLEMENTATION
iillion CI
rOTAL COST
0.82 0.19 2 .oo 3.01
- -
0.31 0.55 1.59 1.01 3.45
0.44 5.92
0.34 0.33 1.09 2.52 0.05
1.61 21.50
3.00 2.31 4.19 8.04 1.03 0.53
29.48
35.94 5.03
40.97 6.15
47.12 13.41 60.53
-
-
;tant US$ of mid 19 foreign cost sndir. for. cost dir. loc. cost % US$ % US$ % US$
50% 50% 50% 50%
50% 74% 25% 20% 34%
75% 63%
50% 60% 50% 70% 75%
70% 42%
1 0% 1 0% 60% 50% 70% 40%
0.48 0.1 1 1.16 1.75
0.18 0.41 0.40 0.20 1.18
0.33 3.71
0.17 0.20 0.94 1.76 0.64
1.13 9.04
0.30 0.23 2.51 4.42 1.28 0.21
7% 7% 7% 7%
7% 10% 25% 30% 22%
8%
10% 5% 1 5'/0 5%
19%
40% 40% 5% 15% 5%
0.06 35% 0.01 35% 0.14 35% 0.21 35%
0.02 35% 0.05 16% 0.40 50% 0.30 50% 0.78 43%
25% 0.46 30%
0.03 40% 0.02 35% 0.20 35% 0.13 25% - 25?'0
30% 4.07 39%
1.52 50% 0.92 50% 0.21 35% 1.33 35% 0.09 25% - 60%
0.29 0.07 0.70 1.05
0.1 1 0.09 0.79 0.50 1.49
0.1 1 1.75
0.13 0.12 0.66 0.63 0.21
0.48 8.39
1.90 1.15 1.47 3.09 0.46 0.32
40% 14.21 15% 4.53 36% 10.74
48% 17.14 15% 5.52 37% 13.29
40% 19.54 15% 6.29 37% 15.15 40% 2.93 15% 0.94 37% 2.27 40% 22.47 15% 7.23 37% 17.42 48% 6.40 15Yo 2.06 37% 4.96 40% 28.87 15% 9.29 37% 22.37
40% 2.40 15% o.n 37% 1.86
2000 2001 2002 2003 2004 2005
0.30 0.52 0.15 0.04 0.91 1.09 1.36 1.65
0.10 0.20 0.40 0.37 1.07
0.09
0.32
0.10 0.35 0.60 0.63 1.68
0.09 2.07
0.17 0.33 0.94 0.63
0.32 7.71
1.27 1.15 2.09 2.21 0.46 0.53
0.10
0.60
0.70
0.09 0.09 0.09 2.59 0.63 0.63
0.17
0.94 0.63 0.63 0.63 0.85
0.32 0.32 0.32 7.18 3.93 2.67
1.27 1.27 1.15 2.09 2.21 2.21 2.21 0.46 0.46 0.46
- 0.41 10.20 10.19 4.98 3.71
1.36 3.14 11.88 10.89 4.98 3.71 0.19 0.44 1.66 1.52 0.70 0.52 1.55 3.58 13.54 12.41 5.67 4.23 0.23 0.54 2.03 1.86 0.85 0.63 1.78 4.11 15.57 14.27 6,52 4.86 0.13 0.60 3.50 4.36 2.53 2.29 1.91 4.72 19.08 18.63 9.05 7.15
localinflation factor 1.11 1.23 1.35 1.47 1.60 1.72 foreign inflation 1.03 1.06 1.09 1.13 1.16 1.19
weighted average 1.07 1.15 1.22 1.31 1.39 1.47 C : \ D o c u s ~ ~ t d i ~ e ~ ~ n ~ R ~ ~ ~ P H l invastschedule.xLs]PHllnvSch&
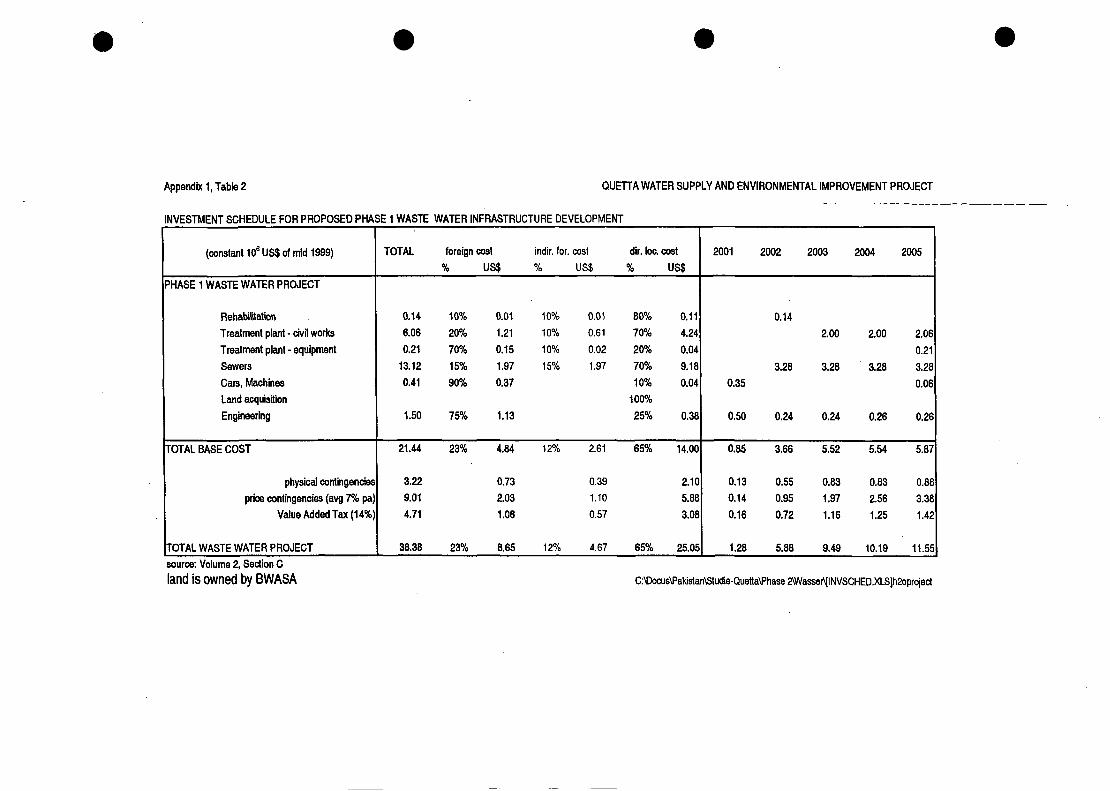
TOTAL foreign cost indir. for. cost dir. loc. cost % US$ % US$ % us$
Appendix 1, Table 2
2001 2002 2003 2004 2005
INVESTMENT SCHEDULE FOR PROPOSED PHI
(constant 10' US$ of mid 1999)
21.44 23% 4.84 12% 2.61 65% 14.00
3.22 0.73 0.39 2.10 9.01 2.03 1.10 5.88 4.71 1.06 0.57 3.08
Rehabilitatiin Treatment plant - civil works Treatment plant - equipment Sewers Cars, Machines Land acquisition Engineering
0.85 3.66 5.52 5.54 5.87
0.13 0.55 0.83 0.83 0.88 0.14 0.95 1.97 2.56 3.38 0.16 0.72 1.16 1.25 1.42
TOTAL BASE COST
physical contingencie price contingencies (avg 7% pz
Value Added Tax (14%
\TOTAL WASTE WATER PROJECT source: Volume 2, Section C land is owned by BWASA
QUETTA WATER SUPPLY AND ENVIRONMENTAL IMPROVEMENT PROJECT
0.14 10% 0.01 10% 0.01 80% 0.11 6.06 20% 1.21 10% 0.61 70% 4.24 0.21 70% 0.15 10% 0.02 20% 0.04 13.12 15% 1.97 15% 1.97 70% 9.18 0.41 90% 0.37 10% 0.04
100% 1.50 7596 1.13 25% 0.38
0.14 2.00 2.00 2.06
0.21 3.28 3.28 3.28 3.28
0.35 0.06
0.50 0.24 0.24 0.26 0.26
38.38 23% 8.65 12% 4.67 65% 25.051 1.28 5.88 9.49 10.19 11.55
C:\DocusWakistan\Studie-QuettaWhase AWassefllNVSCHED.XLS]h2oprojed

0
local TOTAL foreign cost cost
YO $ $
1.16 10% 0.12 1.05 0.86 100% 0.86 2.02 48% 0.97 1.05
0.61 100% 0.61 0.61 100% 0.61 2.63 60% 1.59 1.05
0.39 0.24 0.16 0.78 0.20 0.59 0.53 0.43 0.74
4.34 57% 2.45 2.53
a
2001 2002 2003 2004 2005
0.58 0.58 0.43 0.43 1.01 1.01
0.61 0.61 1.62 1.01
0.24 0.15 0.42 0.36 0.32 0.21
2.61 1.73
APPENDIX 3, TABLE 3 QUEl lA WATER SUPPLY AND ENVIRONMENTAL IMPROVEMENT PROJECT
UVESTMENT SCHEDULE FOR PROPOSED PHASE 1 SOLID WASTE AND DRAINAGE INFRASTRUCTURE DEVELOPMENT
(constant lo6 US$ of mid 1999)
IECOMMENDED PHASE 1 SOUD WASTE PROJECT
Construction of Sanitary Landfill Machinery and Equipment
SUBTOTAL
IECOMMENDED PHASE 1 DRAINAGE PROJECT
Machinery and Equipment SUBTOTAI
'OTAL BASE COST
physical contingencie! price contingencies (avg 7% pa
Value Added Tax (1 4%
'OTAL SOLID WASTE AND DRAINAGE PROJECT source: Volume 2, Section C

APPENDIX 1, TABLE 4
TECHNICAL ASSISTANCE (TA) FOR INSTITUTIONAL REFORMS AND
(constant 10' US$ of mid 1999)
ID/C/501 TA FOR CAPACITY BUILDING OF COMMERCIAL AND FIF AND OPERATIONS IN BWASA (2001 - 2003)
FinanciaVCommercial Advisor (Expatriate) FinanciaWComrnercial Advisor (Local) Accounting Advisor (Local) Computer Specialist (Local)
SUBTOTA
D/C/502 TA FOR PROJECT IMPLEMENTATION (2001)
Contract ManagemenVCiv Eng Expert (Expatriate)
SUBTOTA
DICi503 TA FOR PUBLIC SERVICES TECHNICAL MANAGEMENT I
Public Works Management Expert Expatriate) CiviVSanitary Engineer (Ewalriate)
SUBTOTAI
I/C/504 PROVINCIAL INSTITUTIONAL REFORMS (2001 - 2002)
Institutional Development Specialist (Local) MIS Specialist (Local) Financial Management Consultanl(Loca1) HRD Specialist (Local) Junior Consultants (Local)
SUBTOTAI OTAL BASE COST
physical contingencie! price contingencies (avg 7% pa
Value Added Tax (14% iRAND TOTAL TECHNICAL ASSISTANCE 'JSTITUTIONAL REFORMS AND CAPACITY BUILDINQ
'ACITY B
MM
ICIAL MAI
24 24 24 12
12
) OPERA1
12 24
24 8 18 6 48
I NG local
TOTAL loreign cost cost % $ $
iMENT
0.552 0.552 0.096 0.096 0.036
0.780 71% 0.552
0 276 0 276
0276 100% 0276
S (2002.2003)
0.276 0.276
0.510 0.510
0.786 100% 0.786
0.096 0.032 0.072 0.024 0.096
0 320
0.09 0.09 0.03
0.22
0.09( 0.03: 0.07: 0.02' 0.09t
2.162 75% 1.614 0.W
0.324 75% 0.242 0.08: 0.92 60% 0.355 0.237 0.431 72% 0.310 0.121
3.509 72% 2.521 0.98f
2001 2002 2003
0.138 0.024 0.024 0.009
0.195
0.024 0.032 0.029 0.024 0.024
0.276 0.048 0.048 0.018
0.390
0 276
0 276
0.138 0.255
0.393
0.048
0.043
0.048
0.1: 0.0: 0.0: 0.a
0.11
0.1: 0.2!
0.3:
0.02
0.02
0.133 0.139 0.04 0.328 1.198 0.63
0.049 0.180 0.09 0.055 0.310 0.22 0.060 0.236 0.13
0.492 1.924 1.09

Ouetta WSE - Final Reuort. Volume 1 Appendix 1 I Pave I
APPENDIX 1 -Table 5 :
1. Social Action Program (SAP)
Duration : 200 1-2003 Input 24 MM local Social Development Specialists: 96,000
Training: 75,000 Compliance plans, Consultation, Evaluation 75,000 Social surveys 75,000 Computer, equipment & Support 50,000 Transportation, Travel, Perdiem 75,000
cost US$446,000
2. Public Awareness & Community Oriented Conservation Program
Duration : 200 1-2005 Input 06 MM Community Dev. Expert
12 MM Communication & Media Expert 48 MM Community Information Officers NGO Support Water Conservation Education Mu1 ti media campaigns Target Group Communication
’ PR & Documentation Center
a
cost
24,000 48,000 96,000 75,000 10,000 56,000 20,000 19,117
US$348,117
3. Hygiene Education Program
Duration : 200 1-2005 Input 30 MM Public Heath Specialist 120,000
logistical support 200,000 TrainingMaterials development 100,000
180 MM Social OrganizerdHygiene Educators 360,000
cost . . . US$780,000
4. Benefit Monitoring & Evaluation
Duration : 2001 - 2003 @ Input 4MM Community development specialist 16,000 6MM M & E specialist 24,000 6MM Programmer ! 8,000 24MM Social organizers 48,000
cost US $106,000
Total Base Cost : Physical Contingencies (15 %) : Taxes (14 %) : Price Contingencies (17 %) :
US$978,117 US$146,717 US$157,477 US$217,993
GRAND TOTAL : US$1.5000304

FINANCING PLAN FOR RECOMMENDED PHASE 1 PROJECT - WATER SUPPLY QUE"A WATER SUPPLY AND ENVIRONMENTAL IMPROVEMENT PROJECT million current US$ TOTAL 2000 2001 2002 2003 2004 2005 2006 2007 2008 2009 2010 2011 2012 2013 2014 2015
WATER SUPPLY 60.54 1.91 4.72 19.08 18.63 9.05 7.15
EXTERNALFUNDING 42.38 1.34 3.30 13.36 13.04 6.34 5.01
INTERNALGOVERNMENTSUBSIDIES 18.16 0.57 1.42 5.72 5.59 2.72 2.15
EXTERNAL FUNDING DISBURSEMENT OF PROJECT FUNDS 42.38 1.34 3.30 13.36 13.04 6.34 5.01
INTEREST DURING CONSTRUCTION (capitalized) 8.09 0.08 0.28 1.08 1.86 2.24 2.54
COMMITMENTCHARGES (capitalized) 1.20 0.41 0.38 0.24 0.11 0.05 - TOTAL TO BE FINANCED BY MT. FUND. 51.66 1.83 3.96 14.68 15.02 8.63 7.55
LONG TERM DEBT 1.83 5.79 20.47 35.48 44.11 51.66 50.64 49.56 48.42 47.21 45.93 44.57 43.13 41.60 39.98 38.26
PRINCIPAL PAYMENTS 1.02 1.08 1.14 1.21 1.28 1.36 1.44 1.53 1.62 1.72 INTEREST PAYMENTS 3.10 3.04 2.97 2.91 2.83 2.76 2.67 2.59 2.50 2.40
GRAND TOTAL TO BE FINANCED 69.82 2.40 5.38 20.40 20.61 11.34 9.69 Basic assumptions on financinq conditions:
Proportion financed by external sources: 70% Interest: 6.00% on outstanding loan annuity (million US$) 4.12 Interest during construction: 6.00% on drawn loan portion, capitalized loan period: 30 years, including
Commitment charges: 1 .OO% on committed loan portion, capitalized grace period: 6 years after first disbursement
Appendix 1, Table 6

MTERNAL FUNDING
INTERNAL OOVERNMENTSUBSIDIES
EXTERNAL FUNDING
Appendix 1, Table 7
26.86 0.89 4.11 6.64 7 13 808 - 0.38 1.76 2.85 3 06 3 46 - 11.51
FINANCING PLAN FOR RECOMMENDED PHASE 1 PROJECT - WASTE WATER
WASTE WATER COLLECTIONAND TREATMENT I 38.38 I 1.28 5.88 9.49 10.19 11.55
Q U m A WATER SUPPLY AND ENVIRONMENTAL IMPROVEMENT PROJECT million current US$ I TOTAL I 2000 2001 2002 2003 2004 2005 2006 2007 2008 2009 2010 2011 2012 2013 2014 2015
DISBURSEMENT OF PROJECT NNDS
INTEREST DURING CONSTRUCTION (capitalized) COMMTMENT CHARGES (capitalized)
TOTAL TO BE FINANCED BY MT. NND.
PRINCIPAL PAYMENTS
26.86 3.79 0.71
31.37
INTEREST PAYMENTS
0.89 4.11 6.64 7.13 8.08 - 0.05 0.30 0.70 1.13 1.61 0.26 0.22 0.15 0.08 - 1.21 4.63 7.49 834 9 70 - 1.21 5.84 13.33 21.67 31 37 30.79 30.19 29.55 28.86 28.14 27.38 26.57 25.71 24.80 23.83
0.57 0.61 0.64 0.68 0.72 0.77 0.81 0.86 0.91 0.97 1.88 1.85 1.81 1.77 1.73 1.69 1.64 1.59 1.54 1.49
~~ .. .. - Basic assumDtions on financina conditions:
annuity (million US$) 2.45 Proportion financed by external sources: 70% Interest: 6.00% on outstanding loan Interest during construdion: 6.00% on drawn loan portion, capitalized loan period: 30 years, including
Commitment charges: 1.00% on committed loan portion, capitalized grace period: 5 years after first disbursement
201 6
22.81 1.02 1.43

Appendix 1, Table 8
FINANCING PLAN FOR RECOMMENDED PHASE 1 PROJECTS QUETTA WATER SUPPLY AND ENVIRONMENTAL IMPROVEME million cunent US$ TOTAL 2000 2001 2002 2003 2004 2005 2006 2007 2008 2009 2010 2011 2012 2013 2014
DRAINAGE AND SOUD WASTE 4.34 2.61 1.73 EXTERNALFUNDING 2.17 1.30 0.87 -
INTERNAL GOVERNMENT SUBSIDIES 2.17 1.30 0.87 - EXTERNAL FUNDINB
DISBURSEMENT OF PROJECT FUNDS 2.17 1.30 0.87 - INTEREST DURING CONSTRUCTION (capitalized) 0.14 0.05 0.09
COMMITMENT CHARGES (capitalized) 0.01 0.01 - TOTAL TO BE FINANCED BY EXT. FUND. 2.32 1.36 0.95 -
LONG TERM DEBT 1.36 2.32 2.16 2.00 1.84 1.66 1.48 1.29 1.10 0.90 0.69 0.47 0.24 0.00 PRINCIPAL PAYMENTS 0.15 0.16 0.17 0.17 0.18 0.19 0.20 0.20 0.21 0.22 0.23 0.24 INTEREST PAYMENTS 0.09 0.09 0.08 0.07 0.07 0.06 0.05 0.04 0.04 0.03 0.02 0.01
GRAND TOTAL TO BE FINANCED 4.49 - 2.67 1.82 - Basic assumptions on financing conditions:
Proportion financed by external sources: 50% Interest: 4.00% on outstanding loan annuity (million US$) Interest during construction: 4.00% on drawn loan portion, capitalized loan period: 15 years, induding
Commitment charges: 1.00% on committed loan portion, capitalized grace period: 3 years after first dBbursernent

million current US$ I TOTAL I 2000 2001 2002 2003 2004 2005 2006 2007 2008 2009 2010 2011 2012 2013 2014 2015
TECHNICAL ASSISTANCE I 6.04 I 1.11 2.55 1.71 0.34 0.34
Appendk 1, Table 9
EXTERNAL FUNDING
INTERNAL GOVERNMENT SUBSIDIES
MEFINAL FUNWNG DISBURSEMENT OFPRCUECTFUNDS
INTEREST DURING CONSTRUCTION (capitalized)
COMMITMENTCHAFIGES (capitalized)
TOTALTO BE FINANCED BY MT. FUND.
LONG TERM DEBT PRINCIPAL PAYMENTS INTEREST PAYMENTS
GRANDTOTALTOBEFINANCED
4.84 - 0.89 2.04 1.37 0.27 0.27 1.21 - 0.22 0.51 0.34 0.07 0.07
4.84 - 0.89 2.04 1.37 0.27 0.27 0.04 - 0.04 0.11 0.05 0.04 0.02 0.01 0.00 - 4.99 0.05 0.96 2.06 1.38 0.27 0.27
0.05 1.01 3.07 4.45 4.72 4.99 4.52 4.03 3.52 2.99 2.43 1.86 1.26 0.64 0.00 0.47 0.49 0.51 0.53 0.55 0.57 0.60 0.62 0.64 0.20 0.18 0.16 0.14 0.12 0.10 0.07 0.05 0.03
6.20 0.05 1.19 2.57 1.72 0.34 0.34

Appendix 1, Table1 0
108.02 76.25 33.05
76.25 12.05 2.03 90.33
FINANCING PLAN FOR RECOMMENDED PHASE 1 PROJECTS QUEllA WATER SUPPLY AND ENVIRONMENTAL IMPROVEMENT PROJECT
I million current US$ I TOTAL I 2000 2001 2002 2003 2004 2005 2006 2007 2008 2009 2010 2011 2012 2013 2014 2015 1.91 14.32 32.85 30.53 20.93 7.49 2.23 9.61 22.90 21.54 14.69 5.27 0.96 4.71 9.95 8.99 6.25 2.21
2.23 9.61 22.90 21.54 14.69 5.27 0.13 0.67 1.87 2.99 3.85 2.54 0.72 0.64 0.42 0.20 0.05 - 3.08 10.92 25.18 24.73 18.59 7.82 3.08 14.00 39.19 63.76 82.20 89.28
- 0.15 0.16 0.74
CONSOLIDATED PHASE 1 PROJECTS EXTERNAL FUNDING
INTERNAL GOVERNMENT SUBSIDIES EXTERNAL FUNDNG
DISBURSEMENT OF PROJECT FUNDS INTEREST DURING CONSTRUCTION (capitalized)
COMMITMENT CHARGES (cqilalized) TOTAL TO BE FINANCED BY MTERNAL FUND.
LONG TERM MBT PRINCIPAL PAYMENTS
87.01 2.27
84.62 82.10 79.44 2.39 2.52 2.66
76.64 73.68 70.56 2.80 2.96 3.12
67.28 63.81 3.29 3.47
61.07 2.74
INTEREST PAYMENTS~ I - - 0.09 0.09 1.96 5.22 5.10 4.97 4.83 4.68 4.53 4.37 4.20 4.02 3.83 GRANDTOTALTOBEFINANCEDI 123.38 I 4.04 15.63 35.13 33.72 24.84 10.03 -

ANNEX 2:
CONSULTANT’S ACTIVITIES

Quetta WSE - Final Rmort. Volume 1 Annex 2 f Pace 1
Annex 2 CONSULTANT’S ACTIVITIES
Objective Project preparation for eventual ADB financing of technical, institutional and social meas- ures to secure and improve the water supply and sanitation of Quetta City and surround- ings.
Location Quetta, capital of Balochistan Province, Pakistan; and surrounding villages.
Scope of Work Assessment of policy options and institutional arrangements to encourage effective water allocation by demand-driven pricing, as well as investigation and recommendation of the most economically viable, socially and environmentally acceptable and financially sus- tainable water supply scheme for Quetta, along with improved sanitation, hygiene educa- tion, drainage and waste water treatment.
Executing Agency Government of Balochistan, Planning and Development Department (P&D)
Implementing Agency Balochistan Water and Sanitation Authority (BWASA)
Funding Asian Development Bank (ADB) Grant TA No. 2928-PAK
Consulting Services Contract No.COCS/99-068, dated 16 February 1999; between ADB and GKW Consult, Germany, in association with Louis Berger Intl., USA, Engineering Associates, and Fin- con, Pakistan. Period: Input: 29.5 man-months international experts
10 months (22 March 1999 - 21 January 2000; intermittent)
50.0 man-months local experts
This Project Preparatory Technical Assistance (PPTA) is focused on the required institu- tional capacity building and elaboration of policy options, as well as the ensuing formula- tion of an investment project that matches the ability and willingness of users to pay for water and sinitation and thus ensures the Project’s sustainability.
In particular, the Consultant’s scope of work includes the following tasks:
Technical Aspects - - Review of relevant studies - - -
Development of a GIS system for environmental and urban planning
Assessment of aquifer characteristics and land use in the Quetta valley Assessment of the groundwater potential in the Quetta valley Inventory of existing wells in the Quetta valley
H : \ C ~ ~ D ~ ~ \ B ~ ~ \ P A K I S T A N \ ~ ~ ~ ~ O ~ F I ~ ~ I Repofl- Volume I\voll Apx 2 TA btatus.doc

Quetta WSE - Final Rem-qt. Voliirne 1 Annex 2 /Pane 2
- Reassessment of water demand - - - - - - -
Establishment and calibration of a groundwater model Inventory of existing water supply and sanitation facilities Design of a water loss reduction programme Identification of non-structural water-loss reduction measures Review of existing drainage and sewerage planning and actual situation Determination of preferable options in the water supply and sanitation sectors Preparation of preliminary designs and cost estimates for selected options
Institutional Development and Capacity Tasks - Institutional inventory - - - - - - On-the-job staff training - - - Recommendation of tariff policies - -
Development of institutional development and capacity-building programmes Assistance in establishing institutional reforms Mobilisation of CBO or NGO for a water conservation campaign Recommendation of institutional reforms on operational level Elaboration of options for commercial and financial performance improvement
Assistance in developing and implementation of basic accounting systems Definition of requirements for an MIS
Support in design and implementation of a hygiene education program Integration of findings and recornmendations into the relevant reporting
Social and Environmental lmpacts - Preparation of socio-economic surveys -
- - - -
-
Proposal for the involvement of CBOs and NGOs in decision-making on sys- tem design and implementation procedures Assessment of the social impact of ensuing project components Preparation of re-settlement plans if necessary Initial environmental examinations and impact assessments Identification of types and sources of water contamination and proposal of counteractions Integration of findings and recommendations into the relevant reporting
Economic and Financial Analyses - Analysis of sector policy - Least cost analysis
- - - -
' - Economic and financial analyses on project level Establishment of procedures for BME Recommendation of revenue enhancement schemes Financial sustainability analysis of selected option Integration of findings and recommendations into the relevant reporting
Details on achievements and references to the relevant sections in the consultant's report- ing are compiled in the Table below.
H:KonDat\Ber\PAKISTAN\233209Final Report - Volume I\voll Apx 2 TA rtatus.doc

Quella WSE - Final Reooli. Volume 1 Annex 2 I Pace 3
A. 2. (i)
CONSULTANT’S ACTIVITIES - REFERENCES
I I
Technical Aspects Development of a GIS for environ-
Basis: TOR / Min. of Contr. Negotiation / Inception Report Status: Final Report No. I TASK I REFERENCE I REMARKS
I I I
. _
(ii) (iii)
(iv)
(v)
mental-and urban planning Review of relevant studies Assessment of aquifer characteris- tics and land use in Quetta valley Assessment of the groundwater potential in the Quetta valley
Inventory of existing wells in the Quetta valley
V 2.1, A; incl.rqd. additional pro- grams evaluation in V 2.1, A
presented in IR further detailed descriptions presented in IR
full data sets in IR; proposed counterpart input not fully available
(vi) (vii)
reassessment of water demand Establishment and calibration of a
I program I Identification of non-structural wa- (x)
. I
(viii) groundwater model Inventory of existing water supply
I sewerage planning, and actual
(ix)
I situation (xii) I Determination of preferable options
and sanitation facilities Design of a water loss reduction
I in the water supply and sanitation
V 2.1, AB
V 2.2, CD
V 1; V2.1, B; V 2.2, CDE
I sectors (xiii) I Preparation of preliminary designs
matrix in V1
solid waste added
and cost estimates for selected op- tions
, ,
(xi)
1 V 7.1; application, developed and applied; addi- in.all reports tional training provided
ter-loss reduction measures Review of existing drainage and
reviewed I commented where applicable V 2.1. A I further detailed descrbtions
B. 3.
(i)
(ii)
Institutional Development and Capacity Building Institutional inventory V 5, A 8 due to (still ongoing) major Assistance in est. a single water regulatory authority to manage the water resources need adjustment; Assistance in establishment of in- stitutional reforms
V 5, A institutional re- shuffling, proposed concepts may
existing institutions (except QMC) operate on provincial
V 5, AB
additional training provided
data in Appendix 1 V 2.1, B
(iii) (iv)
1. (i) (ii)
I V 2.1, B
and local levels
NGO represented in steering Assist in adoption of building codes Mobilization of CBO or NGO for a water conservation campaign committee Formulation of MIS requirements Assistance in developing a basic accounting system
V 5, A V 4, C
V 5, B V 5, B
~
v 1 - V 2.1, A * V 2.1, B V 2.2, CDE
summary water resource development water supply seweragddrainagdsolid waste
I I f
No. I TASK I ACHIEVEMENT I REMARKS
H:\ConDat\Ber\PAKISTAN\233209\Final Report - Volume I\voll Apx 2 T A status.doc

(iii) Assessment of training needs V 4, BC; V 5. AB:
(iv) V 7:1 a7.2
On-the-job staff training (as per V 4, BC; MoN) V 7.1 & 7.2
(v) Support in design and implementa- tion of a hygiene education pro-
(viii) gram Integration of findings and recom- mendations into the relevant re-
all volumes
C.
5. (i)
(ii)
(iii)
Social and Environmental Im- pacts Preparation of socio-economic sur- veys Proposal for the involvement of beneficiaries, CBOs and NGOs in decision-making on system design and implementation procedures Assessment of the social impact of
V 4, A
v 4 , c
V 1
(iv)
institutional responsibilities recently changed
ensuing project components v4, A Preparation of re-settlement plans if not applicable
additional special training provided (in GIS and GW modeling); no institutional / financial counterparts prov.
(v)
(vi)
(vii)
1.
. (i) (ii) (iii)
NGO also member of steer- ing committee
necessary Initial environmental examinations and impact assessments Identification of types and sources of water contamination and pro- posal of counteractions Integration of findings and recom- mendations into the relevant re- porting
Economic and Financial Analyses Analysis of sector policy V 1; V 5, A Least cost analysis V 6; Economic and financial analyses V 6
V 3, ABCD
complete Results presented in V 3, A all volumes
summary
3ddressed in V 1; and V 4, A
. .
(iv)
R, Vol. 3.2; urther addressed in hygiene ?ducation program design
on project level Establishment of procedures for V 1
R Vol.1 for wastewater
(v)
Notes: IR = Interim Report DFR = Drafl Final Report TOR = original Terms of Reference MoN = Minutes of Contract Negotiation V.. = Volume of Final Report
benefit monitoring and evaluation
Recommendation of revenue en- V 5
H:\ConDat\BerWAKISTAN\233209\Final Report - Volume I\voll Apx 2 TA status.doc
selected option
vant reporting (vii) Integration of findings into the rele all volumes
I
. .
(vi) hancement schemes Financial sustainability analysis of V 5

ANNEX 3:
EXISTING SITUATION


ANNEX 4:
PROPOSED PROJECT MEASURES
. . * _ . .


'*\
r = '0. I .
i
LAYOUT approx. 1 : 2,500
Source: Study on Solid Waste Management System for Quetta ' Municipal Corporation Environment Systems & Engineering (Pvt.) Ltd., j996

A I I
I
I I
I 1
I
i , I
, I
I i
LOCATION PLAN

8
L .....
GRAVEL V E N T S OR GRAVEL LATERAL FOR G A S REMOVAL
M E T H O D OF GAS REMOVAL
.,:. DOTTOY CCLC. ' ; . ... . .
A. GAS REMOVAL
STEP - 1 1 1 .
' L PREVIOUSLv COMPACTED A f l D COVERED SOLID WASrE
B. CELL FORMATION AND C
.

ADINO Of SOLID WSTE DL OF SLOPE
SPREADlNO OF SOLID WASTE IN THIN LAVERS I lPP . 2 FEET)
------.-_ _-
D r A $ l t 1
3MPACTION
C. LEACHATE CONTROL
I
Quetta Water Supply and Environmental Improvement Project
A 4.4 SANITARY LANDFILL - COMPONENTS

,
INLET CHAMBER COAGULATION Q Alum Dosing
FLOC SEDll
I Contact Tank F loccu lat Sedimen
El -1 t l n W
Contact Tank F loccu lat Sedimenj
(Proposed Construction in 2

CULATION - dl ENTATI ON
FILTRATION
'I
ion - iation Tank
1 DESINFECTION 1 STORAGE
i
Chlorination 0
I 4 x Rapid Sand Filter ;=;
0
5 m Desinfection and 2 Storage Reservoir cn
E 0 m m
A 4.5: Conceptual Design of Water Treatment Plant

ANNEX 5:
SCOPE OF WORK FOR AN EIA ON WATER SUPPLY (DAMS)

Quetta WSE - Final Report, Volume 1 Appendix 5 I Page 1
ANNEX5: Scope of Work for an EIA on Water Supply (Dams)
The terms of reference on the complete EIA study should focus on the below mentioned main itenis (the order of presentation does not indicate any score):
wildlife in the project areas, flora in the project areas, water use conflicts in the downstream areas, 'water use conflicts in the upstream areas possible influences of the raw water quality, erosion problems, transmission main problems (leakage and infiltration of surface or groundwater), possible sedimentation of solids in the reservoir. raw water treatment plants and production of salts from reversed osmosis and sludge pro- duction preparing alternatives design options for Burj Aziz and Mangi Dam cost estimations for environmental losses Mitigation measures for reservoir man agemen t , raw water treatment, salt and sludge disposal, water losses in the main, water quality sound resettlement options amendment of income situation of the residents in the area (fish etc.) and impacts which are not yet treated in the present IEE.
H:\ConDat\BeWAKISTAN\233209\Final RepoAFR Vol 1 WOL-l-APP-5.doc

ANNEX 6:
TERMS OF REFERENCE FOR CONSULTING SERVICES
a

Quetta WSE - Final Report, Volume 1 Appendix 561 Page 1 --
APPENDlX6: OUTLINE TERMS OF REFERENCE FOR CONSULTING SERVICES
General
Consulting services will be procured to provide assistance to the project management unit (PMU) under the Executing Agency Balochistan Planning and development Departments. Four packages (Part A, Part B, Part C and Part D) for consulting services described herein will be awarded under the proposed ADB project. The Project Parts will comprise the con- sulting services for the implementation of project measures proposed under this project. The packages for Consulting Services are:
0
0
0
For each package the outlined Terms of Reference are presented. Three international Con- sultants will focus on the project packages for resource development (WS/C/101,102 and 103), Water Supply (WS/C/105 and 106) and Sanitation (WW/C/201), including detailed de- sign and construction supervision of the works. For the execution of technical assistance an additional international Consultant shall be awarded contract. This component will comprise the advisory services for management of the financial and commercial aspects of the BWASA (ID/C/501), the project execution (ID/C/502), the technical operation of the water and sanitation systems (ID/C/503), Provincial Institutional reforms (ID/C/504) and Benefit Monitoring & Evaluation (ID/C/505). In order to provide support to non-technical aspects, the Social Action Plan (CP/C/701), Public Awareness and Conservation Programme (CD/C/702) and Hygiene Education (CP/C/704).
Part A -Water Resources Development Part B - Rehabilitation and Extension of Water Supply Facilities Part C - Rehabilitation and Extension of Sanitation Facilities Part D - Technical Assistance to BWASA
0
Part A - Water Resource Development
Introduction
The scope of consulting services comprises the development of a groundwater management system and supervision of the rehabilitation of existing BWASNPHED wells in the alluvial aquifer in the Quetta valley as well as the exploration of the groundwater resources in the limestone aquifer (Quetta Valley) and the conglomerate aquifer (Zarghoon Range). On the basis of findings of the exploration programme the Consultant will prepare design documents for the implementation of production wells for the exploitation of groundwater resources in the limestone aquifer (Quetta valley) and the conglomerate aquifer (Zarghoon Range).
The Consultant will carry out the following tasks and provide approx. 77 person-months of international key experts and 152 person-months of domestic consultants, excluding sup- porting and counterpart staff.
A. Rehabilitation Measures
(i)
(ii) (iii)
(iv)
Fina.1 design, tendering and supervision for the installation of water meters, piezome- ters and rising pipes with threads in wells. Supervision of performance of step-drawdown pumping tests. Rating of the permissible yield/drawdown based on the evaluation of the pumping test data in a Ws-diagram. Determination of the suitability of the well for water supply at the permissible yield/drawdown.
H:\ConDat\Ber\PAKISTAN\233209\Final Report\FR Vol l\VOL-1 -APP-G.doc

- Quetta WSE - Final Report, Volume 1 Appendix 561 Page 2
(v)
(vi)
Determination of the pump-setting, determination of the appropriate pump specification; final design, tendering and supervision for the installation of new pumps. Final design, tendering and supervision for the installation of electrodes in the well to secure a automatic shut-down of the well.
B. Exploration Programme for the Limestone Aquifer and Zarghoon Range
(i)
(ii)
Tendering, supervision and interpretation of long-term pumping test on the existing BWASNPHED wells. Tendering, supervision and interpretation of a geophysical exploration campaign (elec- tromagnetic survey with the GENIE tool) in order to detect the structure of the lime- stone aquifer and delineate fault/fracture zones and in Zarghoon Range in order to de- tect the structure of the conglomerate/sandstone aquifer and delineate joinVfaulVfracture zones. Final design, tendering, supervision and interpretation of test well drilling (incl. pumping tests, sampling and analyses of physico-chemical parameter and isotope composition of groundwater) in identified target areas, according to the geophysical survey. Evalua- tion of recording and interpretation of the groundwater level in surrounding production wells during pumping tests in test wells (if present in both the limestone and the alluvial aquifer) and according to the geophysical survey and measurements of the yield from springs in Zarghoon Range area. Assessment of the groundwater potential of the limestone aquifer in the northern Quetta valley and Zarghoon Range. The results from the investigations should be in- corporated in the existing groundwater model. Especially the interaction of the alluvial aquifer and the limestone aquifer and an enhanced abstraction from the limestone aq- uifer are to be investigated in detail. Recommendation of the final design for the imple- mentation of production wells and well fields in the limestone aquifer and in the con- glomerate/sandstone aquifer or the Zarghoon Range.
(iii)
0
(iv)
C. Exploration and Development of New Well Fields
(i) Tendering and supervision of drilling for 30 production wells (incl. pumping tests, sam- pling and analyses of physico-chemical parameter and isotope composition of ground- water) in identified well fields in Limestone Aquifer, according to the exploration pro- gram. During pumping tests in test wells recording and interpretation of the groundwa- ter level in surrounding production wells (if present in both the limestone and the allu- vial aquifer). Tendering and supervision of drilling for 70 production wells (incl. pumping tests, sam- pling and analyses of physico-chemical parameter of groundwater) in identified well fields, according to the exploration program. Evaluation of the pumping tests and determination of permissible (long-term sustain- able) abstraction/drawdown for each production well. Finalization of pump setting in each production well. Final assessment of the impact of the groundwater abstraction on all involved aquifer systems. The results from the investigations should be incorporated in the existing groundwater model.
0
(ii)
(iii)
D. Hydrology and Soil Mechanical Tests for Kuchnai Dam Scheme
For the proposed dam and catchment specific hydrological and meteorological data are to be collected for the final determination of the yield of the dam and the conceptual design of a combined system. In the framework of this tasks the evaluation of results from a multi-annual measuring and monitoring campaign is proposed. The data will also be beneficial to other
H:\ConDat\Ber\PAKISTAN\233209\Final Report\FR Vol 1 \VOL-l-APP-G.doc

- Quetta WSE - Final Report, Volume 1 Appendix 561 Page 3
0 components of the proposed Quetta Water Supply Expansion Project. The following tasks are proposed for execution:
(I)
(11)
Review of related data and information on the proposed system components; recon- naissance of catchment area and delimitation of a recording network and appertaining equipment requirements. Planning, tendering and supervision of the procurement and implementation of hydro- metrical and meteorological recording stations, as well as the execution of test bore- holes incl. performance/interpretation of soil-mechanical investigations.
(111) Establishment of monitoring routines and staff training. (IV) Conceptual design of dam and scheme, incl. preliminary determination of potential
performance, and reporting on the proposed solution. (V) Regular collection, systematic processing and filing of recorded data, performance of
measurements and maintenance of recording stations by counterpart personnel. (VI) Evaluation of collected data material, and conclusive reporting on hydraulic, hydrologi-
cal and soil-mechanical parameters, to be used in the final design and tendering of the works for rehabilitationkonstruction of the relevant components of the water supply scheme.
E. Specific Tasks of the International Consultants
(i) Guidance of counterpart staff, which will continue the well inventory, commenced in the frame of the present project, for all wells in the Quetta valley and provide input for the drilling supervision. Supervision of the GIS works and groundwater modeling, which will be primarily exe- cuted by counterpart staff.
(ii)
Part B - Rehabilitation and Extension of Water Supply Facilities
Introduction
Engineering consulting services are required to assist the PMU to carry out investigations, design and contract documents, evaluate bids and supervise construction. Consultants will have experience in the rehabilitation and extension of municipal water supply systems as well as leak control, monitoring and detection.
The Consultant will have to co-ordinate the work with the Consultant awarded contract for the development of new water resources (see above), as the rehabilitation and installation of new wells will be executed under separate contract. Specially the Consultant will carry out the following tasks.
The Consultant will carry out the following tasks presented under the following tasks. The Consultant will provide approx. 80 person-month of international key experts and 160 per- son-months of domestic consultants, excluding supporting and counterpart staff.
A. Detailed Design
(i) Plan, direct and supervise detailed topographic surveys and soil/geological and geo- technical investigations along proposed water conveyors and proposed facilities (pumping stations, reservoirs and treatment facilities). Prepare design documents for rehabilitation of the existing ground reservoirs located at the well field sites and within the distribution system of BWASA, based on study find-
(ii)
e ings and site visits.
H:\ConDat\BeAPAKISTAM33209\Final Report\FR Vol 1 \VOL-1 _APP-G.doc

- Quetta WSE - Final Report, Volume 1 Appendix 561 Page 4
(vii)
(viii)
Design appropriate installations for disinfection at water production sites and improve- ment measures of roads and of boundary walls at well field sites. Prepare detailed design for the execution of rehabilitation of pumping stations located at the well field sites and within the BWSAS distribution system and the BWASA and PHED well installations. Prepare detail design and structural engineering works for the construction of additional elevated storage facilities in the distribution system. Carry out field measurement to introduce the restructuring of the existing distribution system, including rehabilitation and replacement of existing pipes and valves. In the framework of this task the replacement of distribution pipes of 81 km and installation of metering devices in the distribution system in the existing five zones is proposed. Prepare standard design and working drawings for the installation of individual water meter at existing house connections of approx. 45,000 water meter and about 166 km individual water connection pipes and installation of approx. 31,400 water meters for newly connected house, yard and public tap consumers. Prepare detail design documents for the construction of pipelines within the well fields and from the storage facilities into the distribution system of approximately 26.6 km, ranging in diameter from ND 200mm to ND 600mm. Detail design for the construction of storage facilities of 4,600 m3 and 3,000 m3 capac- ity at the well field sites and additional 25 elevated reservoirs, ranging from 50m3 to 1 , I 00m3 storage capacity, equipped with water meter on outlet pipeline. Detail design for the construction of approx. 31 1 km distribution network, ranging from ND 80mm to ND 200mm pipelines to serve additional population. Installation of additional house, yard and public tap connections in priority areas to ex- pand the supply area of the system. Prepare a detailed construction management plan including schedules for construction, bidding and financing.
6. Construction Supervision
Review and evaluate the validity of proposed subcontracts, and assist in preparing letters of invitation for bidding, pre-qualification of .civil works bidders and shortlists of suppliers, evaluating the submitted bids and bid evaluation reports, price and technical negotiations with the bidders, and related correspondence. Update or revise, if necessary, the construction management plan and the cost esti- mates based on the results of the bidding, and modify the design and construction drawings as necessary after the bidding and during construction. Supervise the mobilization of contractors and delivery of materials and equipment, re- view shop drawings, monitor contractors' topographic surveys to ensure correct align- ments and elevations of the Project facilities, and perform soiVgeological and geotech- nical tests to ensure adequate data for foundation and structures. Inspect materials and equipment and supervise, inspect, measure and control the quality of the construction of works and installation of equipment. Compare actual with scheduled progress and advise the Executing Agencies (EAs) of any developments that could delay completion. Recommend any necessary actions to be taken by the EAs to facilitate timely completion of construction. Supervise pressure tests of the major pipelines, and equipment start-up and commis- sioning; prepare Operation and Maintenance Manuals for equipment and the water treatment facilities and provide training assistance as required to operators of new fa- cilities.
e H:\ConDat\BeAPAKISTAM33209\Final Report\FR Vol 1 \VOL-l-APP-G.doc

- Quetta WSE - Final Report, Volume 1 Appendix 561 Page 5
@ C. Project Management and Administration
The consultant will submit monthly reports summarizing progress achieved, difficulties en- countered, and issues to be resolved. Copies of each monthly report (in English) will be sent to ADB, and two copies to each PMU. The consultants will also prepare progress payment and final payment certificates for each contract for approval by the PMU, and help the PMU maintain cost records for the Project.
In addition to design reports, the consultants will provide the data and help the PMU pre- pare progress reports. The consultants will also provide a project completion report before the end of the project to provide a comprehensive review of the project impacts in the project area.
Part C - Rehabilitation and Extension of Sanitation Facilities
Introduction
Engineering consulting services are required to assist the PMU to carry out investigations, design and contract documents, evaluate bids and supervise construction. Consultants will have experience in the rehabilitation and extension of municipal sanitation systems as well as low-cost sanitation, treatment plant design and construction.
0
The Consultant will have to co-ordinate the work with the Consultant awarded contract for the development of new water resources (see above), as the rehabilitation and installation of new wells will be executed under separate contract. Specially the Consultant will carry out the following tasks.
The Consultant will carry out the following tasks presented under the following tasks. The Consultant will provide approx. 55 person-month of international key experts and 120 per- son-months of domestic consultants, excluding supporting staff.
A. Detailed Design
(i) Plan, direct and supervise detailed topographic surveys and soil/ geological and geotechnical investigations along proposed sewer conveyors and pro- posed treatment plant. Prepare design documents for rehabilitation of the existing sewer system and man- holes. Carry out hydraulic calculation for the new sewer system components of approx. 25 km primary and 154 km secondary sewer pipes. Prepare standard design and working drawings for the installation of individual sewer connections of approx. 29,000 nos. Prepare a detailed construction management plan including schedules for construction, bidding and financing.
0 (ii)
(iii)
(iv)
(v)
B. Construction Supervision
(i) Review and evaluate the validity of proposed subcontracts, and assist in preparing letters of invitation for bidding, pre-qualification of civil works bidders and shortlists of suppliers, evaluating the submitted bids and bid evaluation reports, price and technical negotiations with the bidders, and related correspondence. 0
H:\ConDat\Ber\PAKISTANl233209\Final Report\FR Vol 1 \VOL-1 _APP-G.doc

- Quetta WSE - Final Report, Volume 1 Appendix 561 Page 6
(ii) Update or revise, if necessary, the construction management plan and the cost esti- mates based on the results of the bidding, and modify the design and construction drawings as necessary after the bidding and during construction. Supervise the mobilization of contractors and delivery of materials and equipment, re- view shop drawings, monitor contractors' topographic surveys to ensure correct align- ments and elevations of the Project facilities, and perform soil/geological and geotech- nical tests to ensure adequate data for foundation and structures. Inspect materials and equipment and supervise, inspect, measure and control the quality of the construction of works and installation of equipment. Compare actual with scheduled progress and advise the Executing Agencies (EAs) of any developments that could delay completion. Recommend any necessary actions to be taken by the EAs to facilitate timely completion of construction. Supervise tests of the major pipelines, and equipment start-up and commissioning; prepare Operation and Maintenance Manuals for equipment and the waste water treatment plant and provide training assistance as required to operators of new facili- ties.
(iii)
(iv)
(vi)
(i)
C. Project Management and Administration a
The consultant will submit monthly reports summarizing progress achieved, difficulties en- countered, and issues to be resolved. Copies of each monthly report (in English) will be sent to ADB, and two copies to each PMU. The consultants will also prepare progress payment and final payment certificates for each contract for approval by the PMU, and help the PMU maintain cost records for the Project. In addition to design reports, the con- sultants will provide the data and help the PMU prepare progress reports. The consultants will also provide a project completion report before the end of the project to provide a comprehensive review of the project impacts in the project area.
Part D - Technical Assistance to BWASA
Introduction
The tasks to be executed in the framework of the Consulting Services in the framework of the Technical Assistance Programme, including the Advisory Services during project implemen- tation, for technical management and operations are presented below. In the framework of the p,roject implementation assistance, guidance and assistance towards community devel- opment will be provided.
0
A. Advisory Services for Financial and Commercial Management
The implementation of the recommended reforms and improvements will require additional Consulting Services to support the efforts of the financial water supply and sanitation man- agement. The overall objective is to implement the recommended reforms and improvements in financial and accounting systems and performance through a long term Technical Assis- tance program. Under this assistance program one expatriate expert, experienced in overall financial water supply and sanitation management and operations, working closely together with the responsible water and sanitation management, to the Quetta BWASA, and three Pakistani financial and commercial experts, i.e. shall be assigned to the following tasks.
(i) The expatriate adviser with special experience in overall financial and commercial management and operations of water supply and sanitation, for approximately 24 months, to advise the financial (and eventually the administrative director, according to
e H:\ConDat\BeAPAKISTAM33209\Final Report\FR Vol 1 \VOL-l _APP-G.doc

Quetta WSE - Final Report, Volume 1 Appendix 561 Page 7
the anticipated organizational reforms) director of BWASA in all financial and commer- cial matters, including the priority objective of know how transfer in all fields of com- mercial and financial management and operations, and with special regard to estab- lishing sound financial and operational objectives, water tariff policies, budgeting and financial planning procedures. A local financial and commercial advisor, under the direction of the BWASA manage- ment and the expatriate financial and commercial advisor, specially experienced in water billing and collection operations, for approximately 24 months, to advise on, de- sign and assist the implementation of improvements in meter reading (as recom- mended for implementation), billing and cash collection operations and performance, arrears control and enforcement procedures, improvements of customer relation, to design and implement an efficient financial Management Information System, design training programs in above fields and perform on the job training. A local accounting advisor, under the direction of the BWASA management and the expatriate financial and commercial advisor, specially experienced in water supply and sanitation accounting and control systems, including asset accounting and manage- ment, for approximately 24 months, to advise on, design and supervise the implemen- tation of modern double entry accounting and financial systems and accounts analysis, transfer of existing accounts to the new system, design training programs in above fields and perform on the job training. One Pakistani computer hardware and software specialist, under the direction of the BWASA management and the expatriate financial and commercial advisor, specially experienced in water supply and sanitation billing, accounting, personnel administration and MIS software, for approximately 12 months, to enhance, in close connection with the financial and commercial advisor and the accounting advisor computer operations in these fields, design training programs in above fields and perform on the job training.
6. Advisory Service for Project Implementation
The Consultant will carry out the following works presented under the following tasks. The Consultant will provide approx. 12 person-month of an international key expert, experienced in the project management of large scale water and sanitation projects.
Advise the EAs on the technical aspects, engineering design, construction and su- pervision and Bank procurement procedures and guidelines for the Procurement of goods. Help the EAs coordinate Project implementation activities, maintain records and min- utes of all construction related activities, and certify and recommend payment of claims by the contractors and suppliers. Coordinate the activities-of all local and international consultants. Advice and provide assistance towards community development (e.g. multimedia campaigns, target group communication, water conservation education and PR & documentation center development). Advise on environmental issues and resettlement of families displaced by construc- tion activities. Inspect completed works and make recommendations to the EAs on the issuance of the certification of completion. Prepare reports for the EAs and for the Bank, including progress reports, project completion report, and project benefit monitoring reports; and facilitate the Bank's loan review missions. *
H:\ConDat\BeAPAKISTAN\233209\Final Report\FR Vol 1 \VOL-l-APP_G.doc

- Quetta WSE - Final Report, Volume 1 Appendix 561 Page 8
0 C. Advisory Service for Public Works, Technical Management and Operation
The Consultant will carry out the following works presented under the following tasks. The Consultant will provide approx. 12 person-month of international key experts for a Public Works Management Expert and approx. 24 MM for a CiviVSanitary Engineer.
(ii)
(iii) (iv)
(vii)
(viii)
Review the appropriateness of the engineering design prepared and proposed modifications if necessary. Review the project implementation plan and organizational arrangements for project implementation. Review tendedcontract documents and assist during pre-construction period. Day-to-day monitoring of project progress, preparation of progress reports to PMU and ADB. Preparation of training programs and review of training manuals provided by the Consultants. Organize workshops and seminars for BWSAS staff. Assist in commissioning and performance evaluation of completed facilities and in setting up regular maintenance programs, and if required, maintenance contracts with suppliers. Supervise the training programs of the civil works and equipment suppliers; provide additional technical and management training to the PMU and project implementa- tion units in the project area. Prepare a leakage detection and control training program; provide training on re- source mobilization including, cadastral mapping, property registration and valuation, and revenue collection; and conduct training for the staff of the water treatment and waste water treatment plant. The consultant will help, in association with the Project Implementation Advisor and local NGOKBO, with the Community Development Program Sanitation and Health Awareness Program.
D. Provincial Institutional Reforms
The Consultant will carry out the following works presented under the following tasks. The Consultant will provide approx. 24 person-months of a institutional development specialist , a local MIS expert (8 person-months), a financial management consultant (1 8 person-months), a HRD specialist (6 person-months) and approx. 48 months input of junior consultants to support the team of experts. Tasks to be executed are listed as follows: 0 (0
(ii)
(iii)
(iv)
(vii)
Institutional inventory refinement, Legal framework analysis, Reorganising and merger of provincial water sector institutions. Water resources management policy framework and institutions; the regulatory framework and the organisation of a joint water board have to be worked out and a proper system of decision making has to be set-up. Unified Building Codes and implementation and institutional set-up has to be devel- oped. Technical support has to be provided to the provincial government in establishing these institutions, strengthening the existing structures, institutional restructuring and re-organisation, merger of function roles & responsibilities and later institutions them- selves. The staffing plans and organisational structures have to be developed for the new / restructured institutions. The systems and procedures and financial management system to run the affairs of these institutions also have to be established. The reclassification and re-organisation of the existing staff and determination of an excess/ surplus staff also will be carried out with a comprehensive Surplus staff and privatisation policy.
H:\ConDat\BeAPAKISTAM33209\Final RepoflFR Vol l\VOL-l_APP-G.doc

Quetta WSE - Final Report, Volume 1 Appendix 561 Page 9
E. Benefit Monitoring and Evaluation
The ensuing Project anticipates that pro-active benefit monitoring and evaluation features will be necessary during implementation to provide feedback and guide adaptive response to changing circumstances in the Service Area. The Consultant will provide approx. 4 person- months of a Community development specialist, 6 person-months of a M&E expert, 6 per- son-months of a programmer and 24 person-months of social organisers. The tasks to be executed are listed as follows:
(i)
(ii)
(iii)
Provision of co-ordination and adjustment during the project planning and implemen- tation. Appropriate measures and mechanisms for social monitoring of project implementa- tion are necessary. Social assessment suggests a strategy and approach to monitor- ing that should guide efforts. Preparation of monitoring and evaluation system, supported by the TA during a first phase, will be of great importance during project implementation to track social bene- fits provided and indicate where adjustments and corrective measures may be neces- sary. Performance indicators for participation, beneficiary contributions, and benefits de- rived shall be incorporated in overall project monitoring. This includes monitoring of benefit achievements during project implementation, and evaluation of impacts of benefits during implementation and after project completion. Monitoring the impact of project interventions on poverty reduction and the other so- cial dimensions significant in the project will require a relatively long-term commitment as project benefits may gestate slowly. Benefit monitoring and evaluation exercise shall be carried out in three steps. Initially at the start of the project. This will be to develop a baseline socio-economic database and monitoring indicators to assess the impact of the project on the community in general with the special focus on Gender issues, poverty reduction, indigenous peo- ple and human development issues. Based on these database and quantified moni- toring indicators the monitoring and implementation exercise will be carried out in the middle of the project and at the end and the comparisons will be drawn to identify early the needs for correction measures, if necessary.
F. Social Action Plan
In the context of the co-ordinated implementation of participatory components a TA is pro- 0
posed comprising 15 PM (F), 36 PM (L), ca. 72 PM (CP) for a period of approx. 3 years. .
(i) (ii)
(iii) (iv) (v)
Social Action Plan - co-ordinated implementation of participatory components, social assessment recommendations, hygiene and public awareness components, and mitigation measures, carrying out procedures for NGOICBO involvement, social targeting of benefits and poverty reduction, addressing resettlement, indigenous peoples, and other social impacts.
G. Public Awareness and Community-oriented Conservation Plan
In the context of water conservation, building public awareness is a major asp ct of the par- ticipatory agenda of the ensuing Project; one that is fundamental to involving the public and beneficiary communities in many aspects of project implementation, including operation and maintenance of investments, conservation, hygiene education, and support for policy, institu- tional, and tariff reforms. With regard to water conservation, and based on the relevant find- ings during the relevant surveys and workshops, public awareness campaigns shall be con-
0
H:\ConDat\Ber\PAKlSTANW33209\Final RepodFR Vol WOL-1 _APP-G.doc

- Quetta WSE - Final Report, Volume 1 Appendix 561 Page 10
tinued under this TA. The Consultant will carry out the following tasks presented under the following headings. The TA comprise 6 person-month of community development expert, 12 person-months of a communication and media expert, 48 person months of a community information offices and NGO support.
(i) Multimedia Communication; the objective is to inform, educate and persuade 80% of viewers to adopt responsible behaviour in conserving drinking water and help imple- menting conservation strategy measures. Radio Programs and Promotional Spots: to provide information on water conservation to over 60 per cent listeners and educate female listeners on importance of clean water, water born diseases and conserving drinking water by adopting water conservation measures. Regional Press: to provide update news and views on all-round development issues relating to water supply and conservation for potential readers of Urdu or English local newspapers. Face-to-face Educational Communication; target Group Communication: to motivate, mobilise and involve beneficiaries in the design and implementation of the project at all stages, particularly in the eventual installation of water meters, and implementing conservation strategy measures including hygiene education. Water Conservation Education; to educate school children in conservation of water and environment including hygiene education through the formal and informal educa- tional systems. Public Relations and Documentation Center; to improve communication between all stakeholders by providing effective public relations internally and externally and es- tablish a documentation center aiming at serving the information to all categories of users of information and improving BWASA’s public relations.
(ii)
(iii)
(iv)
0
H. Hygiene Education
The Consultant will carry out the following tasks presented under the following headings. The Consultant will provide approx. 30 person-month of a public health experts and 180 person- months of social organizers and hygiene educators. The main objective of this TA is to pre- pare hygiene plans with the beneficiaries of the project. The proposed activities, under the project, shall be by following the various steps as defined below:
(ii) (iii)
Establishment of Hygiene Education Unit for both the BWASA & PHED who will work in collaboration with both the agencies. Recruitment of Hygiene Educators. Training of Hygiene Educators and Social organisers. Consultation with NGOs, CBOs, Line departments. Develop/adopt information education and communication material. Staff training on extension of IEC material. Initially a pilot program identified by BWASA and PHED in collaboration with the NGOs. Allocation of staff according to geographical sectors. Pilot program carried out and feedback. Adjustments made for implementation of a full program. Linkages with the NGOs and CBOs of the area. Extension of information to the target group. Monitoring of activities of the target group. Monitoring of Health / Social staff. Evaluation of the activities and their impact. Feed back and follow up training of the staff. Replication of the activities in other areas. Long term follow up activities in communities.
H:\ConDat\BeAPAKISTAM33209\Final Report\FR Vol l\VOL-l_APP_G.doc


Quetla WSE - Final Report, Executive Summary Currency 8 Abbreviations
CURRENCY EQUIVALENTS (as of November 1999)
Currency Unit - - Pakistan Rupee/s (PRe/PRs) PRe 1 .OO - - US$ 0.01 85 US$ 1 .oo - - PRs 54.00
Pakistan maintains a managed floating exchange rate system under which the rate for the rupee is fixed on a daily basis in terms of the US dollar. For the purpose of calculations in this Report, an exchange rate of PRs 54.00 = US $ 1.00 has been used. This was the rate prevailing at the time of report preparation.
ABBREVIATIONS
ADP EPA BWASA EIA GOB GOP ICB IPD IS IEE LG D MES MIS NGO ODA OECF O&M P&D PHED PIU PMU PSC QMC SAP
BOD COD cm31day I/c,d mg/l PH
(0 (ii)
Annual Development Plan Environmental Protection Agency Balochistan Water and Sanitation Authority Environmental Impact Assessment Government of Balochistan Government of the Islamic Republic of Pakistan International Competitive Bidding Irrigation and Power Department, GOB International Shopping Initial Environmental Examination Local Government Department Military Engineering Services Management Information System Non-Government Organisation Overseas Development Administration, UK Overseas Economic Cooperation Fund, Japan Operation and Maintenance Planning and Development Department. GOB Public Health Engineering Department Project Implementation Unit Project Management Unit Project Steering Committee Quetta Municipal Corporation Social Action Program
WEIGHTS AND MEASURES
= biochemical oxygen demand = chemical oxygen demand = cubic centimetre per day = litres per capita per day = milligrams per litre = aciditylbasicity measure of water sample
NOTES
The fiscal year (FY) of the Government ends on 30 June In this Report, 3" refers to US dollars.

Quetta WSE . Final Report. Executive Summary Table of Contents / Page i
c.
TABLE OF CONTENTS
Page
1 . THE PROPOSAL ............................................................................................................... 1
II . INTRODUCTION ................................................................................................................ 1
111 . BACKGROUND ................................................................................................................. 1
A . Sector Description ....................................................................................................... 1 1 . Water Resources ................................................................................................. 1 2 . Water Supply .................. ..................................................... 3 3 . Sanitation ............................... ................................................................. 5 4 . Drainage ......................... ............................................................. 7 5 . Solid Waste .......................................................................................................... 8 Government Policies and Plans ............................. External Assistance to the Sector ......................................................
1
8 . C . D . Lessons Learned .......................
F . Policy Dialogue .........................
THE PROJECT ................................................................................................................ 13
E . The Bank’s Sectoral Strategy .................................. ................
IV .
.
A . Rationale ................................................................................................................... 13 6 . Objectives and Scope ............................................................................................... 14
1 . Water Resources ............................................................................................... 15 2 . W aler Supply ..................................................................................................... 16 3 . Sanitation ........................................................................................................... 16 4 . Drainage ............................................................................................................ 17 5 . Solid Waste ........................................................................................................ 17 6 . Technical Assistance ......................................................................................... 17
C . Technical Justification ............................................................................................... 19 D . Cost Estimates .......................................................................................................... 20 E . Financing Plan .......................................................................................................... 21 F . Implementation Arrangements .................................................................................. 22
1 . Integration of Project Components .................................................................... 22 2 . Project Implementation Schedule ..................................................................... 22 3 . Execution and Co-ordination ............................................................................. 23 4 . Consulting Services ........................................................................................... 24 5 . Procurement ...................................................................................................... 24 6 . Land Acquisition and Rights .............................................................................. 24 7 . Maintenance of Project Facilities ...................................................................... 24 8 . Reports, Accounts, Audits ................................................................................. 25 9 . Benefit Monitoring and Evaluation .................................................................... 25 10 . Midterm Review ................................................................................................. 26

Ouetta WSE - Final Report, Executive Summary Table of Contents / Page ii
- Page
G. The Executing Agency .............................................................................................. 26 H. Environmental and Social Measures ........................................................................ 26
1. Environment ....................................................................................................... 26 2. Social Analysis ................................................................................................... 27
1. Policy Issues ............................................................................................................. 29
V. PROJECT JUSTIFICATION ............................................................................................ 29
A. Economic and Financial Analyses ............................................................................ 30 B. Environmental Impact ............................................................................................... 31 C. Social Dimensions .................................................................................................... 31
ISSUES AND RISKS ....................................................................................................... 32 c
VI.
A. Implementation .......................................................................................................... 32 B. Social and Institutional Aspects ................................................................................ 33 C. Recommended Action ............................................................................................... 34
TABLES :
TABLE 1 : COST ESTIMATES .................................................................................... 21
TABLE 2 : FINANCING PLAN ..................................................................................... 22
FIGURES :
FIGURE E-1
FIGURE E-2
FIGURE E-3
FIGURE E-4
FIGURE E-5
FIGURE E-6
FIGURE E-7
FIGURE E-8 a..
Map of Pakistan and Location of Project Area
Extent of Project Area
Location of Water Resources
Water Demand and Source Development
Implementation of Main Distribution
Existing and Proposed Sewerage System
Drainage Development Plan
Solid Waste Service Area and Disposal Site
H:\Conpat\Ber\PAKISTAM233209\FiMI RepomExecutive Summary\U(EC_SUM_Contents.doc

Quetta WSE - Final Report, Executive Summary Table of Contents / Page iii
APPENDICES :
Appendix 1
Appendix 2
Appendix 3
Appendix 4
Appendix 5
Appendix 6
Appendix 7
Appendix 8
Appendix 9
Appendix 10
Appendix 11
411
: Project Framework
:
: Detailed Project Component Description
:
:
: Project Implementation Organization
: Cost Estimate
: Implementation Schedule
: Economic and Financial Analyses
: Indicative Procurement Packages
: Indicative Financing Schedule
External Assistance for Urban Water Supply and Sanitation Management
Lessons Learned from Previous Sector Projects
Outline Terms of Reference for Consulting Services

Queita WSE . Final Report, Executive Summary Loan and Project Summary 1
_- LOAN AND PROJECT SUMMARY
Borrower
Project Description
Classification
: Islamic Republic of Pakistan
: The Project represents Phase 1 of a long-term program to cover the water demand of a target population of 2 million, and restore a balanced groundwater regime in the city’s main water source. It will provide improvement of water supply and environmental sanitation through resource development; rehabilitation and ex- tension of water supply facilities and sewerage system; construc- tion of a sewage treatment plant; rehabilitation of urban drainage; and provision of a sanitary landfill for solid waste disposal, in Quetta, Pakistan. The Project will enhance water conservation, loss reduction and recycling, provide implementation assistance and institutional support to the line agencies involved, and will promote public participation.
: Primary : Human Development Secondary : Environmental Improvement
Environmental Assessment : Category C. An initial environmental examination (IEE) was un- dertaken. and the summary IEE is a core appendix.
: Balochistan and its explosively grown capital, Quetta, have re- ceived comparable little public sector investment during the last decades. This neglect has resulted in depletion of water re- sources, and many social services including water supply and sanitation are unable to meet the rapidly increasing demand. The Project developed in the scope of the current Bank funded TA is to solve the current backlogs of essential services in the city and surrounding villages, particularly addressing the needs of low- income groups, reduction of health hazards, improvement of living conditions, and promotion of urban efficiency and economy.
The Project is given high priority by the Government, and is in conformity with the Bank’s country assistance planning and op- erational policy for the sector, particularly in terms of a necessary integration of various sub-sectoral initiatives for better coordination and mutual reinforcement.
Rationale
Objectives and Scope
Improvements will yield high economic and environmental benefits but will require investment in physical infrastructure as well as institutional and policy development. The Government of Balo- chistan (GOB) recently initiated a number of institutional and pol- icy reforms in support of the Project to improve its efficiency and operations, and quantity-based cost recovery is envisaged.
Subject of the Project is a least-cost solution to Quetta’s water supply problems that is also environmentally acceptable, socially and economically feasible and financially viable. Investments must be operated and maintained in collaboration with the local com- munities and achieve an acceptable level of cost recovery of O&M cost within about five years and O&M plus dept service payments or depreciation, whichever is higher, within ten years of comple- tion of the selected option.

Cost Estimates
Quena WSE - Final Report, Executive Summary Loan and Project Summary 2
Hereby the objectives are to (i) secure water supply in the city and surrounding villages; (ii) improve the urban environment and pub- lic health; (iii) improve public awareness of hygiene practices to reduce disease incidence; (iv) enhance re-use of treated waste- water for irrigation; (v) strengthen the community partnership, using neighbourhood committees and non-government organisa- tions; (vi) strengthen the capacity of BWASA to construct, operate, and maintain water supply and sewerage schemes; (vii) enhance revenue collection to achieve full cost recovery; (viii) facilitate QMC drainage and solid waste operations; and (ix) carry out the initial social, institutional and physical measures of a long-term program for sustainable development till year 2020.
The Project covers six sectors:
Resource Development, incl. well rehabilitation to restore system capacities, exploration of new resources, devel- opment of limestone aquifer (3 wellfields; tot. capacity 14 mio m3/yr), and Zarghoon Range conglomerate aquifer (first well field; capacity 9 mio m3/yr); Water Supply, with (a) rehabilitation and improvement project incl. restructuring of system, replacement of 81 km pipes, installation of 45,000 water meters; (b) expansion project I, incl. construction of 2 ground reservoirs and 25 elevated tanks, 26.6 km mains, 311 km distribution net- work, 166 km house connections, 31,400 water meters; and (c) consulting services for design and construction supervision; Sewerage Project I, incl. (a) rehabilitation of existing facili- ties, construction of 24.85 km primary and 154.10 km secondary sewers, 20,000 house connections, first stage wastewater treatment plant. The component will serve 383.800 people; up to 400 ha can be irrigated with treated effluent; (b) consulting services for design and construc- tion supervision; Drainage Maintenance and Rehabilitation Program, incl. (a) repair of 40 km main channels and 90 km drains, cleaning of 325 km drains, construction of operational buildings; (b) supply of special equipment; Solid Waste Sanitary Landfill, incl. (a) construction of first stage and development of 27.7 ha site; (b) supply of spe- cial equipment; Technical Assistance, incl. (a) advisory services for finan- cial and commercial management in BWASA; (b) advisory services for project implementation; (c) advisory services for public services technical management and operation; (d) support services for community development.
: The total cost is estimated at $ 123.4 million equivalent, of which $38.9 million (32 per cent) is the foreign exchange cost and $84.5 million equivalent (68 per cent) is the local currency cost.

Quetta WSE - Final Report. Executive Summary Loan and Project Summary 3
INTERNAL GOVERNMENT SUBSIDIES 18.16 EXTERNAL FUNDING
DISBURSEMENT OF PROJECT FUNDS 42.38
IMEREST DURING CONSTRUCTION (capilalired) 8.09
COMMITMENr CHARGES (caphalized) 1 PO TOTAL EXTERNAL FUNDING 51.B
GRAND TOTAL TO BE FINANCED 69.82
Financing Plan
miliicm current USS WATER SUPPLY
Loan Amount and Terms
,-
Period of Utilisation
Executing Agency
Implementation Arrangements
Procurement
- Consulting Services
Estimated Project Completion Date
Project Benefits and Benefici- aries
L.
DRAIN. a
31.37
42.53 4.49
TECH.
: The equivalent in various currencies of SDR 51.602 million ($70 million equivalent) will be provided from the Bank's Special Funds resources. The loan will have a 1 percent service charge per an- num and a maturity period of 30 years, including a grace period of ten years.
: Until 30 June 2007
: Balochistan Planning and Development Department
: For GOB, the Additional Chief Secretary of the Planning and De- velopment Department will serve as Chairman of the Project Steering Committee and will appoint its members. The established Project Management Unit and Project Implementation Units will implement the Project.
: Procurement of goods and services financed by the Bank will be in accordance with the Bank's Guidelines for Procurement. Major civil works and supplies will be tendered as international competi- tive bidding/ international shopping packages. Minor civil works will be tendered and minor equipment and materials will be pro- cured following local competitive bidding, direct purchase, or in- ternational shopping procedures.
Packages of consulting service will be required for (i) well reha- bilitation, groundwater exploration and hydrological / geo-technical investigation; (ii) construction supervision and detailed design; (ii) capacity building for BWASA; (iii) assistance in financial manage- ment, project implementation, and public services operation. En- gagement of consultants will follow the Bank's Guidelines on the Use of Consultants and other arrangements satisfactory to the Bank on the engagement of domestic consultants.
: 31 December 2006
: The proposed measures are designed to enhance the protection of earlier investment and extend fundamental social services to the direct benefit of about 355,000 present and additional 420,000 consumers in its Phase 1 till 2005, and a total of 1,795,000 in- habitants overall by the end of the planning period in 2020.
The ElRR for the Project is estimated at 14.01% (water supply) and 14.52% (sewerage) respectively.


Quena WSE - Final Repart Executive Summaw I Paae 1
1. THE PROPOSAL
1. The present Executive Summary and Recommendation on a proposed loan to the Islamic Republic of Pakistan for the Quetta Water Supply and Environmental Improvement Project has been worked out to the extend and format requested by the Bank's Mission.
II. INTRODUCTION
2. The Government has requested Bank assistance for the improvement of urban water supply and environmental sanitation in Quetta, provincial capital of Balochistan. A Bank-funded project preparatory technical assistance (TA),' carried out from March 1999 till January 2000 formulated the first phase Project for possible Bank financing presented herein, and defined a comprehensive long-term program for sustainable management of water resources in the Quetta Basin. A preparatory Mission visited Quetta upon start of the TA in March 199g2, and two follow-up Missions were carried out in September and November 1 99g3. This Executive Summary is prepared in conjunction with the Final Report of the TA.
111. BACKGROUND
A. Sector Description
1. Water Resources
3. About 86% of Quetta's present water supply is based on the exploitation of the alluvial groundwater resources of the Quetta Valley, mainly by tube wells. The remaining quantities are abstracted from existing wells in the limestone aquifer (9%) and from Spin Karez impounding reservoir (5%). Total average groundwater abstraction from the alluvium aquifer for domestic use is around 40 Mio.m3/yr, for agricultural (irrigation) use 35 Mio. m3/yr with daily pumping rates falling far below the respective average figure in the later months of the year during dry season. Surface water from Spin Karez and Urak Headworks is still supplied to the Cantonment (average 2.3 mio rn3/yr) via the existing filtratiotdchlorination plant, but has to be supplemented by the available groundwater from MES wells.
4. The groundwater resources are tapped by a total of approximately 500 tubewells and some 1,266 dugwells, about 238 tubewells and 816 dugwells are used for domestic / industrial water supply. This includes functional wells of BWASA (87), PHED (62) and MES ( l i ) , as the main agencies for public water supply. A considerable number of tubewells and practically all dugwells are thus operated privately. The traditional karezes ceased to be used for drinking water supply. The BWASA share of the yearly estimated groundwater abstraction from the alluvial aquifer can be assessed based on the available
' TA NO. 2928-PAK comprising of D. Boggs both comprising of T. Kanazawa
H:\CcnDa1\BehPAKISTA33203Wnel RepomEIsCYtive Sumnl\Exs-Sum.do:

Executive Summaw / Page 2 Quena WSE - Final Reoorl
average abstraction determination from FAO-UN (1 997) and BWASA from 1998 (see also Interim Report, V01.2.2, Annex 5.12).
5. Approximately 18,7 Mio m3/yr can be estimated as the abstraction rate from the alluvial aquifer from the 82 BWASA wells, if the well fields are operated according to the design capacities. Flow measurement carried out in the framework of the project indicates approximately a production of only 52 Yo of the rated abstraction figures for the Northern, Western and Southern Well Field. From the overall estimated abstraction of approximately 75 Mio. m3/yr groundwater from the alluvial aquifer in the Quetta valley, approximately 25.0 % are estimated to be currently abstracted by BWASA wells.
6. It is estimated by BWASA (1996) that the PHED wells account for a water production of 13,600 m3/d (approximately 4.96 Mio. m3/yr, or 6.6 Yo of the estimated groundwater abstraction of the alluvial aquifer). For cantonment wells, an average abstraction of 20 m3/h, an average pumping time of 18 hours per day can be estimated for 365 days per year, resulting in an abstraction of approximately 1,76 Mio m3/yr (2,3 % of the estimated groundwater abstraction of the alluvial aquifer). Therefore, the public sector (BWASA, PHED and MESkantonment) combined are utilising approximately 35 % of the estimated yearly groundwater net abstraction from the alluvial aquifer. The five BWASA wells tapping the limestone aquifer are not regarded in the discussed abstraction of groundwater. The five wells are estimated to abstract 4.34 Mio. m3/yr from the limestone aquifer.
7. As for the public wells, an estimation of the groundwater abstraction of the private wells tapping the alluvial aquifer has been executed. Estimations of abstraction rates and abstraction periods for the different types of private wells according to the main use of the wells (domestic water supply or irrigation) are provided. The groundwater abstraction from the alluvial aquifer by public wells (BWASA, PHED, MES) is 25,13 Mio. m3/yr, the groundwater abstraction by private wells is 48,8 Mio. m3/yr. From the overall net groundwater abstraction from the alluvial aquifer, only 35 % are utilised for the public water supply and 65 Yo for private use. From the privately abstracted groundwater from the alluvial aquifer of 48,8 Mio. m3/yr, 34,8 Mio. m3/yr groundwater (71 %) is utilised for irrigation, 14 Mio. m3/yr (29 "10) for domestic water supply.
8. The existing abstraction facilities of BWASA and PHED in the alluvial aquifer show technical short-comings. With the needed extensive rehabilitation program, further additional drawdown in the wells can be avoided and an adequate exploitation corresponding to the hydrogeological boundary conditions of the well site and the well hydraulics under economic pumping costs will be achieved.
9. Detailed calculations show that the total expected water demand in the service area of approximately 134 mio m3 in 2020 will be covered only to about 65 mio m3/yr by a sustainable supply from the alluvial aquifer (which equals the natural rechargehnflow including the return flows from domestic water supply and irrigation), and some 7 mio m3/yr from the present other sources Limestone aquifer and Spin Karez Dam. Even with effective water conservation, re-use of up to 24.8 mio m3/yr treated wastewater for irrigation and all return flows, a still remaining deficit of approximately 40 rnio m3/yr has to be covered until 2020 from additional water resources.
10. Over-pumping from more than 2,000 wells for water supply and irrigation from the alluvial aquifer at a rate that exceeds the natural recharge, lead to a situation that this aquifer could be exhausted within less than 10 years if exploitation continues at current trend.

11. The overdraft of the groundwater resource is responsible for a certain part of the drawdown of the groundwater level observed and is common referred to as "groundwater- mining". The overdraft of the groundwater from the alluvial aquifer is not uniform in the Quetta valley. Distinct abstraction centres in the northern Quetta valley, in the middle of the valley and in the Mian Ghundi areas have been delineated, according to cones of depressions of the groundwater table. However, not the entire development of the declining groundwater level can be attributed to the groundwater-mining. The wells of BWASA show that a development of the wells is insufficient, causing additional drawdown.
12. A special technique applied in the project area are delay action dams (DAD). DAD simply consist of a reservoir, implemented by a dam on mostly intermittent streams. An enhanced recharge is assumed to result from infiltration over the natural reservoir bed without implementation of a prepared filter bed. In the Quetta valley, seven DAD exist. These DAD have been constructed between 1973 and 1997 (BWR, 1999). The DAD are under the control of the IPD. A further DAD, the Kach dam is under MES control. The dam got substantial degraded since overtopped. A further DAD at Murghi Kotal, north- west of the Quetta basin towards the Kuchlagh basin, was visited during the present study. A sedimentation of approximately 8 m inside the reservoir led to the overtopping and the development of a major breach in the dam structure. These examples document a disadvantage of the DAD. The reservoirs in the area suffer substantially from siltation of the impoundment, deposited from the feeding Nalas. The siltation has been also observed on the DAD pilot schemes in the Bostan area (Chargath dam, Bostan dam).
13. Surface water resources of the Quetta valley are under control of the army via the MEWEME. According to the estimation by BWASA (1994, 1998) the surface water resources provide 8.0 cusec (approximately 7.1 Mio. m3/yr) for the water supply, regulated by MES/EME. This includes water supply from the Kach dam and the Wali Tangi dam, which are both not in operation at present. The surface waters of Chashmo Tanga Nullah, Ghundak Rud Nullah, Spin Karez lake, Hanna lake are utilised with intake structure /facilities.
2. Water Supply
14. Quetta is the capital city of Balochistan, the largest province of the Islamic Republic of Pakistan. Natural increase, migration from rural areas, and an influx of Afghan refugees have fuelled rapid urban growth and expansion in recent decades. During peak years in this period, the population of Quetta grew at more than 6 percent annually and has attained a present population of around 1.2 million, exerting ever-increasing demands on the limited resource base of the Quetta Valley.
15. Between one third and one half of this new urban population resides in densely populated slums (kachi abadis) that surround the municipality. Water supply distribution and extension of services have not kept pace with urban growth, especially in these areas. Overall, per capita water supply availability remains less than one third of the World Health Organisation's recommended minimum; and this deficit is most pronounced among the least-served and poor.
16. Paralleling the region's rapid urban development has been a dramatic expansion of commercial agriculture, primarily irrigated orchard production made possible by tubewell irrigation. Large operations now cover much of the land outside the city and play one of the largest private roles in the local economy.

Quena WSE - Final Rewrt Executive Summarv I Paae 4
17. In the prevailing arid climate, Quetta’s water supply is largely dependent upon groundwater from an alluvial aquifer of some 100 m depth underlying the Quetta valley. Over-pumping from more than 2,000 wells for water supply and irrigation at a rate that exceeds the natural recharge, lead to a situation that the aquifer could be exhausted within less than 10 years if exploitation continues at current trends. Furthermore, the existing water resources as well as the urban environment are seriously affected by inadequate wastewater and solid waste disposal, and by shortcomings of stormwater drainage and flood control. Coordinated resource management and effective control of consumption are absent. The potable water supply situation is aggravated by considerable water losses in the distribution system and by low efficiency in revenue collection.
18. The Balochistan Water and Sanitation Authority (BWASA) holds regulatory powet over the water resources but, practically, several agencies, institutions and other parties retain responsibility over the water provision in the area.
19. Public water supply in Quetta is carried out by BWASA (73%), PHED (15%) and military (12%). With the most recent joining of BWASA and PHED, practically all civil piped drinking water supply is administered by this body. However, combined, these main suppliers serve only up to 48% of the total population of 1.2 million in the Quetta Valley, but the service is erratic throughout the year and becomes even worse towards the end of the dry season. During the allotted hours of service, pressure is often too low to provide an adequate flow. Householders that are able to afford the cost use suction pumps to increase the flow to their property. An increasing number of illegal connections are further straining the system. With minor exceptions, water is not treated or disinfected.
20. A majority of the inhabitants and most of the commercial enterprises are thus supplied from a variety of public and private drilled or dug wells, or water vendors, even if connected to the public system. This uncontrolled abstraction - plus excessive use of groundwater for irrigation - causes a negative water balance in the alluvial aquifer in the order of 8.60 million m3/yr, and dropping of groundwater levels in several parts of the valley by up to 1 m per year.
21. With regard to the civil piped distribution system, the major problems to be solved are the lack of water quantity to maintain the network under pressure, the high leakage rates within the distribution system, poor leakage repair techniques, ingress of pollutants due to negative pressure, and the need for better management, operation and maintenance. Specific problems include, amongst others: (i) in some locations wells are less than 100 m apart from each other, which affects efficient water production; (ii) about 40 -50 % of distribution pipes, fittings, valves, fire hydrants are presumably older than 40 years resulting in high leakage rates due to corrosion and damage, and no systematic rehabilitation other than emergency repairs has been carried out in recent years. Especially in areas such as Mali Bagh and Pashtoonabad the system is in desolate condition; (iii) buried and corroded valves hinder adequate network operation, control and monitoring; (iv) workshops are poorly equipped and staff is insufficiently trained; (v) non existence of a metering section to work hand in hand with the billing section.
‘ Following recent changes on central government level in October 1999, major administrative re-shuffling took place at the agencies involved in Quetta water supply: at present, BWASA is under PHED, which belongs to the lrrigation Department. Re-structuring was still ongoing by the copy deadline of the present report.
H:\ConDal\Be~PAI(ISTAN\23320hFin* RewnExmcUliVB Surnmly\Exe-Surn.doc

22. The Balochistan Water and Sanitation Authority (BWASA) was formed by an act of the Balochistan Provincial Assembly in 1989 and was given the mandate for water supply and sanitation in Quetta City and other urban areas in the province. Outside Quetta City and urban areas, water supply responsibilities are vested in the Public Health Engineering Department (PHED). At present BWASA operations cover only a portion of Quetta City, since it has not been able to extend its mandate to suburban Quetta because of lack of financial and human resources.
23. A Water Board was established in 1995 within the Planning and Development Department (P&D) of the provincial government of Balochistan (GOB) with five members, including the provincial, divisional and municipal authorities, and BWASA. It, however, has had limited influence on control of groundwater resources, including use of up to one half of total annual withdrawal for irrigated agriculture. Generally, Balochistan’s institutional framework for the water sector is structurally deficient in three main areas: (i) agencies responsible for regulating water resources and setting environmental quality standards for sewerage are not enforcing regulations; (ii) responsibility for most sector activities is shared by three or more agencies; and (iii) government agencies lack strong tradition and experience in involving beneficiaries in decision-making processes. These deficiencies are manifest in the management of groundwater resources, provision of potable water supply, and management of wastewater, stormwater drainage, and solid waste.
24. Despite manifold problems, Ouetta’s water supply and sanitation systems have received only limited external assistance. The Government of the Netherlands has assisted the water supply sector, and since the mid-l980s, the Kuwait Fund provided funding for water distribution and tube wells. The Government of Japan is considering support for wastewater treatment and solid waste facilities, as well delay action dams and groundwater recharge; and the Government of Germany has plans for funding of fire- fighting equipment.
25. With steadily increasing population and water demand coupled with dropping groundwater levels, Quetta requires intervention to improve its water supply situation. Economic growth and expansion are already limited, and current practices of discharging untreated domestic and industrial sewage need to be stopped by providing treatment facilities.
26. At greatly reduced future growth rates of 3.0% in the next 10 years and 2.5% thereafter, this important city may have to accommodate - and supply - some 2 million inhabitants by the year 2020. The overall water demand would then exceed 350,000 m3/d, assuming no substantial further growth in the water consumption of agriculture.
3. Sanitation
27. Environmental sanitation in the project area, including sewerage, drainage and solid waste disposal is comparable to the water supply sector in standard and extent. Limited services are restricted to the municipal area and the Cantonment. In the suburban villages around the city, organised sanitation does practically not exist.
28. Generally, urban sanitation comes under the jurisdiction of three tiers of government institutions in Pakistan: (i) Federal agencies are principally staff departments for interprovincial policy coordination; (ii) provincial institutions are actively involved in project planning and design for cities, towns and villages; and (iii) municipal institutions handle overall urban management. In Quetta, key sector institutions include: (i) the Planning and Development Department (P&D), which establishes development priorities
H:\ConD*t\Ber\PAKISTAM233209\Flnsl RepomExsculivs Sumry\ExeSurn.doc

Quetta WSE - Final ReDort Executive Summarv I Page 6
and coordinates across line departments and among the different tiers of government; (ii) the Balochistan water and Sanitation Authority (BWASA), which has been given the mandate by provincial and local government departments to implement and operate civil sewerage; (iii) the Quetta Municipal Corporation (QMC), to manage and operate urban stormwater drainage and solid waste disposal; and (iv) the Military Engineering Services (MES), who have their own arrangements for water supply and sanitation in the Cantonment area. Besides, some initiatives are taken by the Balochistan Irrigation and Drainage Agency (BIDA) and other government institutions including the Public Health Engineering Department (PHED), Quetta Development Authority (QDA), and major public and private housing estates. Since 1993, the Balochistan Environmental Protection Agency (BEPA) has the mandate to adopt, monitor, regulate and enforce environmental quality standards - that have been drafted on the basis of the Pakistan Environmental Protection Act 1997, but are yet to be implemented in Balochistan. Wastewater effluent standards exist, but need application.
29. Planning of a Quetta Sewerage and Sanitation Project (QSSP) was finalised in March 1985 under the Quetta Development Authority, and implementation under BWASA since then has been completed to about 30% of Phase 1 (of 4). The scope was reduced in 1994 on the grounds of inadequate water supply and extremely slow progress of construction. The system, originally planned for a population of 400,000, thus was curtailed to cater for a population of 150,000. It consists at present of 4.1 km of transport main, some 52 km of collectors, and about 1,100 house connections, as well as 5,122 pour-flush latrines in various parts of the city. The components treatment plant and irrigation scheme were dropped. The system discharges untreated sewage into Sariab Lora rladi along Samungli Road. Construction was discontinued in May 1999.
30. Overall the rudimentary sewerage system of Quetta consists of QSSP Network (52.1 km), Old City and Railway Compound sewers (3.8 km), and the Cantonment System (31.5 km). A poorly designed sewer network in Satellite Town was never in full function and is now beyond repair. All the collection networks are separate systems conducting in principle sewage only. Until the early 80ies, a conventional wastewater treatment plant was operated at Samungli Road, and a part of the effluents was used for irrigation. The remaining quarters are without piped sewerage system, and only to a small part served by on-lot facilities. Most of the roads and streets in the inner city are provided with drains on both sides that receive wastewater from the residential houses, public buildings and commerciaVindustrial compounds, as well as the occasional storm water.
31. The health standards are extremely poor in Balochistan. With infant mortality around 160 - 200 per 1,000 live births, fertility and maternal mortality of 5 - 7 per 1,000, Quetta, with about 20% of the province’s population, average health lies far below the national average. Most lethal diseases are water-borne, water related, livestock or pet borne. Apart from low birth weights the main causes of sickness are related to waterborne diseases, and unsanitary conditions. Infant mortality is associated with diarrhoea in almost half of the cases. Sources of water borne diseases in the project area are contaminated drinking water, and wastewater. Most of the tubewell water supplied in Quetta shows bacteriological contamination.
32. Diseases related to wastewater are of higher significance due to open sewer lines crossing the city of Quetta. Wastewater is also used for vegetable irrigation - which is probably a main source of roundworm and tapeworm infections - or is discharged untreated into the Habib Nallah in the north or the Sariab Lora in the west. During rainstorms the open drains overflow, leaving deep puddles of contaminated water in the streets, creating health hazards especially for children. Washing dishes and other utensils in such open drainage canals is common. In the suburban areas of Quetta, small rainwater reservoirs, karez- and

well ditches, as well as (sewerage) canals are often used for washing, bathing and livestock watering.
33. Proposed measures of extension of the existing sewerage system would improve considerably the hygienic conditions within the town of Quetta. Presently, about 9,700 m3 of wastewater per day out of 95,000 m3/d freshwater consumption are collected by the existing sewerage system. After implementation of proposed measures of Phase 1 that quantity would increase to 32,000 m3 in 2005 out of 117,000 m3/d freshwater consumption, and to 57,000 m3 in 2010 out of 147,000 m3/d freshwater.
34. Wastewater collection, treatment and re-use for irrigation are decisive factors in the proposed program to reach coverage of water demand and at the same time equilibrium in the groundwater balance. Overall, it is anticipated that by 2020 about 60% (24.8 mio m3/yr) of irrigation water could be supplied from this secondary source, which, as a consequence, would provide up to 21% (21,O mio m3/yr) of total domestic consumption through re-utilisation of wells.
4. Drainage
35. Notwithstanding the arid climate in Quetta, flooding and malfunctioning drains containing wastewater, are serious problems. Several past proposals for improvement were not followed by action. Planning is generally handicapped by uncontrolled development and by incomplete topographical maps, meteorological records and hydrological data. Drains, and especially the underground sections, are frequently clogged by accumulation of silt, garbage and construction materials, and their limited capacities are further constricted due to shortcomings in solid waste collection and separate wastewater disposal, but especially due to a serious lack of maintenance.
36. Storm water from the built up areas of the city is transmitted to the major natural streams (nallahs) - with the main recipients Habib and Kasi Nallah - and finally into Sariab Lora rover (nadi), through a network of drains and road side gutters, following largely the prevailing gradients of the terrain. Typical drainage areas are 13.8 km2 (Habib Nallah), 5.6 km2(Kasi Nallah), and 14.2 km'(Lora Nadi directly). Further independent systems are found in the Cantonment area discharging mainly into Durrani Nallah, and in a number of housing estates and smaller complexes. Overall, 373 km of existing drains of different classification, and natural streams that constitute a part of the drainage system, have been identified. Detailed assessments for city drains of total 57.8 km are available.
37. Many of these drains were constructed primarily for domestic wastewater disposal. With the additional paved areas of the rapidly expanding city, increased and accelerated run-off significantly raises the peak flows. In the poorer parts of the city at the foothills of Murdar Range, e.g. beyond Shaldara and Pashtoonabad, flash floods from the mountain slopes add to the problem.
38. Existing facilities are operated and maintained by Quetta Municipal Corporation through its Sanitation Section. Its staff of 1,066, however, is predominantly engaged in solid waste disposal and street cleaning. Systematic clearing of drains - especially buried sections - is rarely carried out, and corrective maintenance is not a part of the routine. A considerable part of the maintenance problem arises from the lack of suitable equipment and required vehicles to carry out the work properly and efficiently.
39. For the development of water resources in the Quetta valley, an integrated approach is necessary of not only developing primary water sources but also implementing measures to protect them. The proposed stormwater drainage component

Ouetta WSE - Final Remrl Executive Summarv I Page 8
of the project will enhance the quality and quantity of groundwater recharge, the improvement of hygiene and quality of life, and the reduction of flood damages. The improvement program for the urban stormwater drainage in Quetta also puts an emphasis on the protection of investments made in the past, and thus prepares the ground for improved operation and maintenance of future installations.
5. Solid Waste
40. The present solid waste disposal system of Quetta City is operated and maintained by the Quetta Municipal Corporation (QMC). The activities include collection and transport of city solid waste to a central dump site located off the Eastern By-pass, about 10 km from the city centre at the foot of Murdar Hills. Overall solid waste disposal of Quetta City is unsatisfactory and is a major cause of poor environmental conditions and constitutes a threatening hazard to the population and the groundwater. There is no arrangement for systematic collection and disposal of solid waste in the area outside the municipal and Cantonment boundaries. People dump refuse wherever convenient and occasionally burn it on site. Regular house-to-house collection is neither practised in these areas nor in the city.
41. A study on solid waste management was carried out for the QMC area in 1996, suggesting institutional and operational improvements, and the construction of a sanitary landfill. Subsequently, a number of containers, trucks and tools had been procured to supplement and partly replace old equipment. However, about 4046 of the new gear are yet to be put into operation; compactors are not bvailable; and the sanitary landfill has not been constructed. Management and operation of waste collection, transport and disposal are not adequate and the entire system needs thorough review and re-organisation.
42. Average waste production has been assessed at 0.65 kg/c,d. At the densities at origin, ranging from 130 kg/m3 (domestic) to 250 kg/m3 (institutions), and given quantitative distribution, this corresponds with a specific volume of about 2.75 I/c,d - a value determined also in comparable other cities. With a present population around 825,000 in the QMC area, the average daily waste production thus comes.to 2,270 m3/d. There is no significant compaction of the waste at the collecting points. Against that production figure stand the actually utilised collection and transport capacities of 655 m3/d. This indicates that - at best - around 30% of the potentially produced waste is presently collected and transported to the central dump site. Even with deductions for low-income areas, a surplus in the order of 1,000 m3/d finds its way into drains or other unsuitable locations within the city, or is burnt on the spot.
43. In the context of water supply, a major threat is seen in the practise of wild rubbish dumping, concentrating at an important groundwater recharge area. Therefore, establishment of sanitary landfill as proposed is given first priority in the solid waste component of the present project.
B. Government Policies and Plans
44. The Government recognises that inadequate access to safe drinking water and sanitation facilities constrains economic and social development, particularly in urban areas. To help maintain sustained economic growth and increase per capita income, the Government has demonstrated a strong commitment to develop the country’s human resources by making substantial ADP budgetary provision to improve the basic social services of education, health, population welfare, water supply, and sanitation. To maximise the human resource development benefits, however, improved governance is

QueRa WSE - Final Report Executive Summarv I Page 9
required through local participation in management by institutional restructuring, deregulation, devolution of authority, government accountability, and community empowerment. The latter is often accomplished by using NGOs. The Eighth Five-year Plan (FY 1993194-1 997/98) articulated an extension of decision-making responsibility to local government and the provision of adequate financial resources to local authorities, commensurate with the respective local government's capacity and sphere of influence. It may reasonably be assumed that this policy is continued by the present Government, and even intensified for Balochistan, and particularly for Quetta, with its important military position and economic potential.
45. The Government is adopting policies to overcome many urban water and sanitation financial problems, including (i) encouraging water supply metering in new schemes; (ii) increasing the magnitude and progressiveness of user fees to recover O&M and capital costs in capital cities; (iii) providing loans to municipalities at concessional interest rates with relatively long payback periods; (iv) passing on external loans to local water and sanitation utilities on concessional terms; (v) matching service provision with affordability and users' willingness to pay: and (vi) gradually eliminating provincial subsidies to municipal governments for operations expenses. In the Ninth Five-year Plan (FY1998/99-2002/03), these policies become even more progressive, and the Bank's sector policy dialogue plays a major role in the formulation and implementation of sector strategies.
46. Under the current TA, the feasibility of private sector participation in Project operations has been studied. The following was found: (i) BWASA, the main provider of water and wastewater services is constitutionally an autonomous authority - but de-facto fully depends on Government subsidies and decisions. Its most recent integration into PHED under the Irrigation and Power Department shifts it further away from administrative independence. However, the Project envisages steps towards financial self-sufficiency, and thus provides the necessary basis for economic independence in the long-term; (ii) the multitude of parties involved in the water sector - including the military - on one hand, and the extreme limitation of resources on the other, call for an integrated resource management with the backing of legislative power, and without vested private interests; (iii) while, at a later stage, contracting of defined activities as e.g. solid waste collection may be considered, the core social services have to remain under Government control in view of the scarcity of water, the interdependencies of a number of sectors for optimum sustainable development, and the immense social and economic implications.
47. The TA Final Report recommends that an inter-departmental regulatory board be formed to coordinate and control water resource management. The Bank has endorsed this recommendation. It is further suggested that the regulatory board be authorised to (i) approve tariffs based on a formula acceptable to GOB, and the consumers(ii) regulate service provision; and (iii) evaluate performance of the Project Management Unit (PMU).
C. External Assistance to the Sector
48. Pakistan has received $1.6 billion in loans, grants, and technical assistance for water supply, sanitation, and urban development, mostly from the Bank, the World Bank, the United Kingdom's Overseas Development Administration (ODA) and the Commonwealth Development Corporation (CDC), and Japan's Overseas Economic Cooperation Fund (OECF). The Bank has historically played a major role in providing external assistance for water supply, sanitation, and urban development in Pakistan, and the Bank's operational strategy - as well as the medium-term program for Pakistan - envisions continued support to the sector. Since 1976. the Bank has provided direct financial assistance of $340

Quetta WSE - Final ReDort Executive Summarv I Paae 1Q
million for six projects in the sector. Two projects - amounting to $140 million - have targeted urban development and sewerage in Karachi. Three Bank projects, totalling $223 million, are ongoing in the sectors, including the Karachi Sewerage Project, which was due for completion by late 1997. The World Bank has an ongoing program of about $262 million for two projects in the sector, of which $125 million is for the water supply system of Karachi. ODA, CDC, and OECF are major external sources of assistance for urban development projects, including the $1 97 million assistance for the Karachi water supply system from ODA and CDC, and from OECF $1 63 million for the Islamabad water supply system and $1 06 million for the Karachi water supply system. Appendix 2 provides details on external assistance to the water supply and sanitation sector in Pakistan.
49. The Bank's strategy for Quetta urban development assistance has to be closely coordinated with World Bank, the Dutch Government, and OECF, potentially providing assistance to the water supply and sanitation sectors, to provide the synergies needed for the investments in physical infrastructure. Quetta's basic investment requirement over the next twenty years for water supply, sewerage and sewage treatment, drainage, flood control and solid waste disposal is estimated at US$ 385 million, which cannot be met by external assistance from the Bank or Government funding alone, so the Government has to attract other donors as well.
D. Lessons Learned
50. Previous urban environmental improvement projects in Pakistan share the common problems of (i) implementation delays, (ii) financial inadequacies, and (iii) insufficient institutional arrangements. Delays were due to (i) late declaration of loan effectiveness because of unfulfilled conditions, (ii) prolonged recruitment of consultants, (iii) land acquisition problems, and (iv) unexpected changes in project scope.
51. The Project has been designed to overcome these problems and allows for appropriate periods respectively, by considering lessons learned from previous projects. Phase 1, essentially the package proposed for Bank financing, is scheduled to start in January 2001 and be completed by end 2006. Realisation of the further program until the target year 2020 is following a logical sequence and, where practical, packaging in consecutive 5-year implementation periods. The programming considers well supported and less expensive components in the earlier stages, and those packages that need further exploration and higher investment later, in order to allow for well-founded decision- making and flexible response to unexpected development.
52. Financial problems due to late budgetary provision of counterpart funds or cost overruns are to be avoided. The Government has to give assurance of the availability of counterpart funds for the duration of the Project, and a covenant to specifically ensure timely provision of counterpart funds shall be included in the Loan Agreement. Cost overruns will be avoided by maintaining a straight forward physical Project design approach, using current market price estimates. Institutional arrangements have to be satisfactorily completed prior to commencement of detailed engineering design and physical implementation. Institutional reforms and a detailed policy agenda have been worked out in the scope of the TA, to ensure Project sustainability during and after
Loan Nos. lIWl-PAK(SF)/lOO2-PAK: Karachi Sewerage Project, for $85 million. approved on 14 December 1989; Loan No. 1004-PAK(SF); Second Urban Development Project, for $66 million, approved on 19 December 1989; and Loan No. 1260-PAK(SF): Urban Water Supply end Sanitation Project, for $72 million, approved on 4 November 1993.
5
H'\ConD~i\Bsr\PAI(lSTAM2332o~~n~ RepomErsculive Sumry\Exe-Sum.doc

Quetta WSE - Final ReDOrt Executive Surnmarv I Paae 11
implementation. Reforms include (i) beneficiary participation in Project preparation, design, construction, and O&M; (ii) staff training; (iii) institutional strengthening; (iv) public awareness campaigns; and (v) improved financial as well as operational management.
53. Two relevant studies on post evaluation findings have been prepared by the Bank: (i) Sector Synthesis of Post evaluation Findings in the Water Supply and Sanitation Sector (November 1994), and (ii) Country Synthesis of Post evaluation Findings in Pakistan. The sector synthesis study noted that (i) project designs did not match user demands; (ii) sector institutions were poorly equipped to deal with Bank projects; (iii) water tariff was too low; and (iv) water was not considered an economic good, but a social entitlement. In the second study, major lessons learned were that (i) more emphasis needs to be placed on institutional strengthening and on detailed project design prior to appraisal; (ii) more effective use of consultant inputs and counterpart staff is needed throughout implementation; (iii) only proven technical designs and processes should be accepted; and (iv) input and output pricing strategy should be continuously reviewed to determine how the pricing system can be adjusted to enhance the financial performance and efficiency of industry operations.
54. Bankwide, 37 water supply and sanitation projects have been post evaluated. Of these, 20 (54 percent) were "generally successful," 14 were "partially successful," and three were rated "unsuccessful." One of the three unsuccessful projects was in Pakistan.' Appendix 3 provides a detailed description of lessons learned from Bank-assisted water supply and sanitation projects in Pakistan.
E. The Bank's Sectoral Strategy
55. The Bank recently has been involved in several projects in the sector. These include the Second Urban Development Project in the Northwest Frontier Province (Loan 1004- PAK SF) approved in 1989, and the Rawalpindi Urban Water Supply and Sanitation Project in Punjab Province (Loan 126O-PAK(SF), approved in 1993. Implementation of both projects was delayed over institutional and financing issues and compliance with loan covenants. Experience gained in these projects has been incorporated in TA design of the Quetta project.
56. The Project would complement the Bank's operational strategy for Pakistan which focuses on human resource development, including education, health, population, welfare, and water supply and sanitation; and on environmental concerns. Bank operations provide attention to issues concerning women as beneficiaries in social sector and other projects, and promote a strong participatory approach in all feasible areas of Bank projects.
57. The Bank's Pakistan program supports economic growth as a complementary strategic objective to generate employment for a rapidly growing labour force and the financial resources required for investment in human and physical capital by both public and private sectors. Critical bottlenecks in physical infrastructure, in the agriculture, transport, and energy sectors are also being addressed and the potential of the private sector is being harnessed whenever possible. Resource mobilisation reform, financial market development, governance and public sector reforms, and an improved policy environment for private sector industry and export-led growth are also key elements of
Loan No. 331-PAK(SF): Faisalabad Water Supply, Sewerage and Drainage, for $39.5 million, approved 0
on 15 December 1977.

Quetta WSE - Final Report Executive Sumrnarv I P a m 12
the strategy. Key policy implications of Bank operations in Pakistan thus include resource mobilisation, devolution, and decentralisation. These issues are intertwined and cut across all aspects of the Bank's Pakistan program.
58. Following international sanctions after the nuclear tests and Pakistan's arrears on loan service payments to the Bank, no loans were approved in 1998. However, eight TA grants amounting to $3.9 million were approved.
59. The Bank undertook a country porffolio review in 1998 to assist the Government in identifying and resolving project implementation constraints. Timely implementation of Bank projects has been hampered by a number of project management, financial, and procurement constraints, some related to effects of sanctions. Generic factors that affect project implementation across the portfolio include long delays in preparation and approval of projects, recruitment of consultants, pre-qualification of contractors, and award of contracts. Pakistan's economic difficulties also impose high fiscal constraints and severely limit availability of counterpart funds for timely intervention of projects.
Policy Dialogue
60. The Bank's policy dialogue with the Government for the sector has focused on (i) improved service delivery, (ii) financial and administrative autonomy for urban service providers, (iii) cost recovery and sound financial management, (iv) support to corporatization and private sector invcjlvement in utility management, (v) institutionalising community participation, and (vi) improving consumer relations. The policy dialogue has been directed at the improvement of urban service indicators. The Bank's influence in stressing improved financial management and cost recovery is reflected in the overall set- up of the Project. It will need particular consideration in the Loan Agreement. Community participation through neighbourhood user groups has been specially referred to in the TA as an essential part of the approach to provision of new infrastructure. The establishment of a consumer relations section in BWASA to listen and respond to customer's problems is proposed.

Quena WSE - Final Report Executive Summarv I Page 13
IV. THE PROJECT
A. Rationale
61. Although Balochistan is the largest province of Pakistan, it has the smallest population, lowest per-capita income and poorest health standards. The province and its explosively grown capital, Quetta, have received comparable little public sector investment during the last decades. This neglect, together with the depletion of water resources, has resulted in many social services including water supply and sanitation being unable to meet the rapidly increasing demand. Climatic conditions are especially extreme in the arid Project area, and are a major factor in the adverse development of the last twenty years.
The critical situation of the water resources has been delineated within the frame of the investigations completed. It is estimated, based on studies of the number of wells and the average abstraction rates and periods, that the existing wells abstract approximately 85 Mio. m3/yr groundwater from the alluvial aquifer. From the limestone aquifer, it is estimated that at present 5.4 Mio. m3/yr are abstracted, only by BWASA wells.
Considering return flows, differentiated according to domestic water supply / irrigation, the net abstraction from the alluvial aquifer and the outflow from the alluvial aquifer to the Kuchlagh basin an overall output if groundwater from the alluvial is calculated. Combined with the calculation of the subsurface inflow and recharge of the alluvial aquifer the groundwater balance of the alluvial aquifer has been determined as negative. It is determined, that a yearly deficit of 14.83 Mi0 m3 can be assumed for the groundwater resource of the alluvial aquifer of the Quetta Valley.
The overdraft of the groundwater resource is responsible for a certain part of the drawdown of the groundwater level observed and is common referred to as "groundwater- mining". The comparison with the long-term precipitation pattern confirmed, that the decline of the groundwater level can not be correlated with changes in the yearly rainfall. The yearly amount of rainfall is rather slightly increasing since 1988.
The discussed mechanism and boundary conditions (groundwater level, abstraction, recharge, inflow, return flows), as well as basic hydrogeological parameter as the stratigraphy, lighology and derived hydraulic parameter (specific yield, permeability) of the aquifer systems have been introduced in the hydraulic model for the Quetta valley, executed with the MODFLOW program code.
The groundwater level and the pertinent conditions of the hydraulic field of the alluvial aquifer observed could be modelled with the described input parameter. The calibration of the steady conditions in the aquifer system has, based of available data, been accomplished with reasonable accuracy. It can be therefore assumed, that the basic results of the description and conclusions regarding the situation of the groundwater resources in the alluvial aquifer are realistic and representative.
At the climatic and hydraulic conditions, a severe depletion of water resources is outlined with the investigations.
In addition to an improved management of the existing groundwater resources (water conservation) the development of additional water resources are required in order to secure the water supply for Quetta.

62. Responding to these conditions, the Government of Balochistan decided to carry out the present “Quetta Water Supply and Environmental Improvement Project” with Technical Assistance from the Asian Development Bank (ADB) under TA No.2928-PAK, financed as a grant.
63. Following the required comprehensive approach, the Project encompasses (i) Technical Studies: (ii) Institutional Development and Capacity Building; (iii) Social and Environmental Impact Assessment: and (iv) Economic and Financial Analyses. In this context, and adopting the proposed integrated concept, the Project is to solve the current backlog of essential infrastructure services in the City of Quetta and surrounding villages, and at the same time set up medium and long-term programs for their feasible and sustainable development.
64. Particularly addressing the needs of low-income groups, the Project lays emphasis on reduction of health hazards, improvement of living conditions, and promotion of urban efficiency. It will also support expansion of the urban economy, which is of increasing importance in view of constraints imposed by limited water resources on irrigated agriculture. Towards such purposes, services will be improved and expanded in the sectors water supply, wastewater and solid waste disposal, drainage and flood control. Included are, as prominent items, conservation and recycling measures, as well as the sound technical and financial management, operation and maintenance of infrastructure facilities, and other institutional capacities of the agencies involved.
65. The proposed measures are designed to enhance the protection of earlier investment and extend fundamental social services to the direct benefit of about 355,000 present and additional 420,000 consumers in its Phase 1 till 2005, and a total of 1,795,000 inhabitants overall by the end of the planning period in 2020.
66. The Project is given high priority by the Government, and is in conformity with the Bank’s country assistance planning and operational policy for the sector, particularly in terms of a necessary integration of various sub-sectoral initiatives for better coordination and mutual reinforcement. For Quetta, the administrative and commercial centre of Balochistan, substantial improvements especially in the water supply sector are essential.
67. Specific risks deriving from the Project’s urgency, the complex technical interdependencies, and the necessary institutional and operational revisions, have been considered in the staging of proposed measures. Consulting services are provided to assist implementation, and an adequate time frame is envisaged to allow detailed exploration of new water resources and flexible responses to unforeseen development. In addition to the proposed loan, technical assistance is envisaged for institutional strengthening, implementation and operational support, and public campaigns. Other risks to project execution are seen in the local funding capacity, general administration and timely decision-making, and in the limited absorption capacity of local contractors for the major works involved. It is therefore recommended to install a project management unit to manage and coordinate implementation.
B. Objectives and Scope
68. The declared target of a possible Bank financing program is a least-cost solution to Quetta’s water supply problems that is also environmentally acceptable, socially and economically feasible and financially viable. Selected investments must be operated and maintained in collaboration with the local communities and achieve an acceptable level of

Quetta WSE - Final Rewrt Executive Surnrnarv I Pam 15
cost recovery of O&M cost within about five years and O&M plus dept service payments or depreciation, whichever is higher, within ten years of completion of the selected option.
69. Based on the technical infrastructure development proposed in the Final Project Report covering individually the various infrastructure sectors included in the project, the recommended Phase 1 investment program for Bank financing is summarised below. However, it is put to note that all measures and their effects are interdependent. It is therefore essential that the defined components of the entire project be implemented in the proposed sequence to achieve sustainability of supply and a balanced groundwater regime. Particularly, the proposed Quetta Water Supply Expansion Project II (WS/P/117; US$ 29.23 mio) contract package represents a logical and necessary extension of foregoing stages. Due to reasons of timing and overall budgeting, it could not be included in the Phase 1 program proposed for Bank financing, but its immediate implementation in a subsequent second Phase will be essential to the scheduled coverage of water demand. Likewise, the sewerage system is needed to provide treated wastewater for irrigation; basic drainage and solid waste improvements are required to protect groundwater quality; loss reduction and conservation, as well as improved management and operation must become effective on a broad basis.
70. In line with these considerations based on the TA findings, a first Phase implementation program was delineated in coordination with Bank and Government. The proposed package of sub-projects, encompasses the following components and features:
Water Resources
Rehabilitation of up to 100 wells in the alluvial aquifer in the Quetta valley to restore original design capacity, fully utilise attached existing distribution and storage facilities and allow systematic monitoring (WS/P/l 1 1 ; US$ 1.59 mio).
Drilling and exploration programme including 30 test wells in the limestone aquifer of the Murdar Range and 60 test wells in the conglomerate I sandstone aquifer to the Zarghoon Range (WS/P/112; US$2.00 mio).
Construction of approximately 20 new production wells in well fields L2 and L3, with total expected yield of 9.1 mio m3/yr from the Murdar limestone aquifer in the Quetta valley (WS/P/ll3A; US$ 1.01 mio).
Exploration of new groundwater resources in the limestone aquifer of the Murdar Range and in the conglomerate / sandstone aquifer of the Zarghoon Range; involving 24 PM (F), 36 PM (L), 198 PM (CP)', and geophysical programme (WS/C/lOl A; US$0.77 mio).
Consulting services for well rehabilitation; with 4 PM (F), 54 PM (L), 144 PM (CP); (WS/C/I 01 B; US$0.31 rnio).
Consulting services for supervision of well construction and pump testing; 20 PM (F), 20 PM (L), 112 PM (CP); (WS/C/l02A; US$0.55 mio).
person-months foreign, local and counterpart services 7
n:\C0nD~t\ser\PAI(lSTAM2332~i"~ ReponlExscuIivs Surnmry\Er%Sum.doc

Quetta WSE - Final ReDOrt Executive Summarv I Page 18
(vii)
2.
(i)
(ii)
(iii)
(iv)
3.
0)
(ii)
Hydrogeological / geotechnical investigations; incl. 3 PM (F), 6 PM (L), 24 PM (CP), geophysical / soil-mechanical investigations, and supply and installation of hydrometrical and meteorological stations (WS/C/I 03A; US$ 0.19 mio).
Water Supply
Quetta Water Supply Improvement Project - Rehabilitation of wells, reservoirs, disinfection equipment, pumping stations and distribution network, including restructuring of the system, replacement of valves and 81 km pipeline, installation of 65 water meters at PHED wells, and 45,000 water meters at house connections (WS/P/I 15/; US$ 5.95 mio).
Quetta Water Supply and Expansion Project I - Development and connection of limestone well fields L2 and L3 to a production capacity of approx. 10.0 rnio m3/yr, construction of reservoirs of 4,600 m3 and 3,000 m3 capacity at the well fields, and 25 elevated service reservoirs of 50 m3 to 1,100 m3 capacities; construction of 26.6 km primary pipelines ND 200 to ND 600 mm, and 31 1 km distribution network ND 80 to ND 200 mm, and 166 km house connections with 31,400 water meters (WS/P/116; US$ 21.50 mio).
Consulting services for engineering design and construction supervision for system rehabilitation packages. Duration 5 years at 7.5 % of construction cost (WS/C/105; US$0.44 rnio).
Consulting services for engineering design and construction supervision for Quetta Water Supply Expansion Project I packages. Duration 5 years at 7.5 % of construction cost (WS/C/I 06; US$ 1.61 mio).
Sanitation
Quetta Sewerage Project I -Rehabilitation and cleaning of existing sewers; construction of 24.85 km primary sewers, 154.10 km secondary collectors, 20,000 house connections, and first stage of central treatment plant near Kili Barmah village. Service areas include Cantonment and Railway Compound (100 %); QMC (extension from 1,360 ha to 3,935 ha). The Phase 1 scheme will service 383,800 inhabitants, at an average discharge of 31,905 m3/d (1 1.65 rnio m3/yr); at 65 Yo efficiency, around 400 ha can be irrigated with the treated effluent (WW/P/211; US$ 19.95 mio).
Consulting services for engineering design and construction supervision for the above implementation package. Duration 5 years at 7.5 YO of construction cost (WW/C/201; US$ 1.50 mio)

Ouena WSE - Final ReDolt Executive Surnrnarv I Paae 17
4. Drainage
(i) Supply of Machinery and Equipment for Quetta Drainage Maintenance - Provision of general and special equipment to support and improve working methods and efficiency in routine and corrective drainage maintenance by QMC Sanitation Section (DF/P/312; US$ 0.61 mio). Initial engineering and contract management support is rendered through PMU advisory services in the scope of the overall project.
5. Solid Waste Disposal
(i) Construction of Sanitary Landfill Solid Waste Disposal Site - Construction and development of 27.7 ha sanitary landfill site including roads, leachate control, gas collection, weigh bridge and operational facilities, and clearing of existing open dump. Work is carried out under contract for the first two lots and then continued by QMC in the scope of daily operations. The implementation contract includes engineering design and construction supervision by a specialised consulting firm, and activities are coordinated through PMU in the scope of the overall project. (SW/P/411; total incl. 7.5 % engineering US$ 1.16 mio).
Supply of Machinery and equipment for Quetta Solid Waste Disposal Site - Provision of heavy equipment, special machinery including weigh bridge, and tools to support operation and expansion of the sanitary landfill by QMC Sanitation Section (SW/P/412; total incl. 2% engineering US$ 0.88 mio).
(ii)
6. Technical Assistance
After discussion of requirements and proposed activities for supporting consulting and advisory services, the following technical assistance programme is envisaged in the scope of eventual Bank-financing of a Phase 1 implementation package:
(i) Advisory Services for Financial and Commercial Management in BWASA - total 84 person-months of one foreign and three local experts plus relevant counterpart and supporting personnel. (ID/C/501; US$0.78 mio).
(ii) Advisory Services for Project Implementation - 12 person-months of foreign experts in contract management and civikanitary engineering to assist in the initial stage of implementation and establish regular contracting, monitoring and administrative routines to the Bank's requirement. Activities are to be taken over and continued by suitably qualified PMU counterpart personnel seconded to the advisor at the beginning of his assignment.(lD/C/502; US$ 0.28 mio).
(iii) Advisory Services for Public Services Technical Management and Operation - total 36 person-months of foreign public works management and civiVsanitary engineering experts plus counterpart and supporting personnel, stationed at PMU, to support setting-up and control of implementation and subsequent O&M routines. (ID/C/503; US$0.79 mio).

Ouetta WSE - Final Rewrt Executive Summarv I Paae 18
Advisory Services for Provincial Institutional Reforms - total of 24 person- months of a institutional development specialist , a local MIS expert (8 person-months), a financial management consultant (1 8 person-months), a HRD specialist (6 person-months) and approx. 48 months input of junior consultants to support the team of experts (ID/C/504; US$0.32 mio).
Advisory Services for Benefit Monitoring and Evaluation - total of 4 person-months of a Community development specialist, 6 person-months of a M&E expert, 6 person-months of a programmer and 24 person-months of social organizers (ID/C/505; US$ 0.1 1 rnio).
Social Action Plan - Coordinated implementation of participatory components, social assessment recommendations, hygiene and public awareness components, and mitigation measures, as well as carrying out procedures for NGO/CBO involvement, social targeting of benefits and poverty reduction, and addressing resettlement, indigenous peoples, and other social impacts. Required are 15 PM ( F ) , 36 PM (L), ca. 72 PM (CP). Duration 3 years. (CP/C/701; US$0.45 mio).
Public Awareness and Community-oriented Conservation Programme - focussing on key aspects of water conservation, metering and revenue enhancement, and stakeholder, NGO/CBO and community participation. Through a Media Advisory Forum, media campaigns will be staged. Key outputs are: Media Advisory Forum; community Conservation Roundtable; multimedia campaigns; face to face campaigns; educational campaigns; documentation centre. Duration 5 years. (CP/C/702; US$ 0.35 mio).
Hygiene Education - providing improved information regarding sanitary and hygiene practices, potable water supply, and prevention of water borne and environmental diseases, as well as complementing project-supported measures to reduce water wastage and contamination, targeting poverty- level and other disadvantaged beneficiary groups including women. Strategies include awareness- and capacity building, development of education material, training packages, and deployment of community- based implementers. Duration 5 years. 30 PM public health specialist, 180 PM social organisers, logistical support, materials development, training (all local). (CPC/C/704; US$ 0.78 mio).
71. The Project is located at Quetta, capital of Balochistan Province, Pakistan; and surrounding villages. Service Area is the Quetta valley from the southern sub-district boundary to roughly the east-west borderline of arable land some 2 km north of the end of the runway of Quetta Airport. The total area of 342 km2 comprises of approx. 220 km2 developed land (including 66 km2 of municipality and 33 km2 Cantonment); 61 km2 cultivated areas; and 61 km2 barren land. The Extended Project Area includes the potential dam sites between MangilChappar Rift in the east to Kuchnai near Quetta and to Burj Aziz Khan in the west, and their watersheds, as well as the locations of eventual further hydrological and hydrogeological programs. For obvious economic reasons, locations are given decreasing priority with their distance from the Service Area.
72. The Project is designed to support institutional arrangements, to encourage effective water allocation by demand-driven pricing, and to provide the most economically viable, socially and environmentally acceptable and financially sustainable water supply scheme for Quetta, along with improved sanitation, hygiene education, drainage and waste water treatment.

Quena WSE - Final Rewrt Executive Summaw I Paae 19
73. In the absence of complete census data, the total base-year population in the Service Area has been estimated at 1.20 million in 2000. With growth rates of 3.0% till 2010 and 2.5% thereafter, the service area will accommodate 2.00 million inhabitants by the target year 2020.
74. At below-average specific demand assumptions, the domestic and industrial water demand* is expected to increase from presently 49.99 mio m3/yr to about 99.03 mio m3/yr in 2020. It has been assumed that the agricultural demand will remain constant at around 35.00 mio m3/yr, with water-saving measures taking effect in both consumer categories. New exploration and development of water resources (and better utilisation of existing ones) will be necessary to cover the increasing demand. The deep limestone aquifer and Zarghoon Range (groundwater), as well as Kuchnai dam site in conjunction with existing facilities (surface water) have bee identified as prime sources for up to 40 mio m3/yr additional raw water. With all proposed measures applied on schedule, it is anticipated that a balanced groundwater regime in the alluvial aquifer can be reached until 2010.
75. Institutional aspects are included in the proposed comprehensive Project, with a view to streamline and reinforce Government agencies, handicapped by internal shortcomings, and numerous other parties involved in the water sector (a process that is taking momentum since the first recommendations in the scope of the TA were made).
76. Quetla's youthful population structure holds built-in growth and increasing demand, which is met by constraints not only of technical nature, but also from ethnic and cultural diversity, as well as diminished human resources and public sector capacities. With few exceptions, all population groups will benefit from the Project; thus it may reasonably be assumed that the willingness to pay for water on a consumption-related basis is existent - once services are provided reliably.
77. Present conditions in water supply and sanitation are environmentally objectionable. The proposed options generally improve the situation, and major constraints to their implementation are not envisaged.
C. Technical Justification
78. Project preparation under the TA was carried out by a consortium of international and domestic consultants, assisted by BWASA counterpart personnel. In view of considerable time lagsg, earlier planning was substantially updated and complemented by field investigations. A groundwater model was used to simulate effects of exploitation. In the scope of an integrated concept the Project will systematically rehabilitate and extend water abstraction and distribution facilities; the wastewater collection and treatment system with a view to re-use of treated effluents; urban stormwater drainage; and a sanitary landfill site for the final deposition of solid waste. The Phase 1 program proposed for Bank financing is the logical first step in a comprehensive program towards sustainable coverage of the demands of a target population of 2 million, and a balanced groundwater regime in the project area.
79. Variant selection from a number of alternatives investigated is the result of least- cost analyses and considerations on technical, financial and political feasibility; local
considering. conveyance losses reduced to 20% of production till 2010, and effects of conservation. except a solid waste study of 7996, comprehensive plans date back to the mid 80ies or earlier, when
8
population in the service area was less then one third of today's.

Quetta WSE - Final Rewrl Executive Surnrnarv / Paae 2Q
implementation and O&M capacities; and effect on the groundwater balance within the overall arrangement of interacting project components. The Project puts great emphasis on water conservation, loss reduction and recycling measures with the objective of saving scarce resources. Major components are designed to enhance protection of earlier investments through rehabilitation and systematic complementation of existing water supply and drainage facilities, full integration of present sewerage installations, and improved operation through provision of special equipment and technical assistance.
80. In order to achieve these targets, and to overcome the problems and constraints discussed in Chapter Ill above, a concept with logically justified, interrelated components is presented, that puts emphasis on a feasible achievement of the following key improvements. (i) administrative re-structuring and institutional strengthening of resource management and distribution; (ii) economic viability through staged introduction of consumption-related water charges; (iii) enhancement of public acceptance and co- operation by direct campaigning, establishment of a PR Section in BWASA, and NGO/CBO involvement. This includes reduction of water wastage and illegal abstraction; (iv) comprehensive loss reduction, rehabilitation and improvement programme with a view to alleviate immediate shortcomings, restore original system capacities and enhance public trust in the serious intentions of the responsible government agencies; (v) optimum utilisation of scarce water resources by re-use of treated wastewater for irrigation. For this purpose, collector system and treatment plant are provided, effecting also relieve of stormwater drains from unsanitary effluents, and reducing groundwater abstraction for irrigation: (vi) sold waste disposal system in clrder to ckan up the city, reduce blockage of drains and thus percolation of contaminated effluents into the important aquifer underlying the city, and protect groundwater and environment through proper sanitary landfill facilities; (vii) systematically staged development of feasible and economically viable additional water resources at minimum cost; (viii) provision of a water supply system in logical phases, adapted to the specific local conditions and requirements. The necessary interaction of all components is fully considered in the composition of the first phase package, as well as in the proposed long-term programme.
D. Cost Estimates
81. The total cost of the Project proposed for Bank financing, including physical and price contingencies, duties and taxes, and interest and service charges during construction is estimated at US$ 123.4 million equivalent. The foreign exchange costs amount to US$ 38.9, which is 32 percent of the total Project cost. Local currency costs, including duties and taxes, amount to US$ 84.5, or 68 percent of the total Project cost (Table 1).

Qurna WSE - Final RrDor! Execut ive Summarv I Paae 21
SUMMARY OF PHASE 1 INVESTMENT SCHEDULE
(lo6 US$ of mid 1999)
ALL RECOMMENDED PHASE 1 PROJECTS BASE COST (at 1999 prices)
Waler resources Water supply Wasle Waler Solid Waste 8 Drainape Technical Assislance
thereof
physical mntingencies (approx. 15%)
price contingencies (avg 75b pa) Valw AddedTax (1496)
TOTAL ALL PROJECTS
TABLE 1: COST ESTIMATES (US $ million)
direcl local TOTAL foreigncosl cost 2wO 2M)i 2W2 2W3 2W4 2005
% S $
63.83 1.36 4.71 18.76 18.46 10.74 9 , M
6.46 45% 2.93 3.53 1.36 2.72 1.68 0.70 29.49 48% 14.21 15.28 0.41 10.20 10.19 4.98 3.71 21.44 23% 4.84 16.W 0.85 3,66 5.52 5.54 5.87 2.63 22% 0.59 2.04 1.62 1.01 3.81 43% 1,M 2.17 0.73 1.60 1.04 0.22 0.22
9.57 38% 3.63 5.94 0.20 0.71 2.81 2.77 1.61 1.47
22.48 28% 6.29 16.19 0.13 0.86 5.25 5.99 4.55 5.71 13.42 36% 4.78 8.65 0.24 O M 3.76 3.81 2.37 2,3E
109.31 36% 38.92 70.40 1.93 7.16 30.58 31.02 19,26 19.35
lnleiesl during construclion (capilalised) 12.05 Commiimenl charges (capilalised) 2.03
12.05 0.13 0.67 1.87 2.99 3.85 2.54 2.03 0.72 0.64 0.42 0.20 0.05
E. Financing Plan"
82. A loan of US$ 90.34 million equivalent is proposed from the Bank's Special Funds resources, covering 73% of the total Project cost. The loan will cover the entire foreign exchange cost, including the service charge on the Bank loan, and US$ 56 million equivalent of the local currency costs for civil works, equipment, consulting services, and technical assistance. The loan will have a repayment period of approx. 30 years, including a grace period of 5 years. The remainder of the Project's local currency costs will be met by (i) GOB/GOP to cover taxes and duties, contribute to the capital investment costs, for administration, and for interest during construction; and (ii) the project beneficiaries to cover capital and in-kind cost of water and sewer connections. The proposed financing plan is shown in Table 2.
At the time. when the financial analysis for the Quetta Water Supply and Environmental Improvement Project TA was completed, financing arrangements and Bank conditions for financing the proposed Phase 1 program were nor yet settled nor recommended from neither competent authorify. Therefore, the present analysis adopts general conditions frequently used for comparable analyses of similar projects in corresponding economic surroundings.

Quena WSE - Final ReDOIl Executive Summarv I Paae 22
DRAIN. B
millim curienl U S WATER WASTE SOLID TECH. ALL
SUPPLY WATER WASTE ASSIST. PROJECTS
INTERNAL GOVERNMENT SUBSIDIES 18.16 11.51 2.17 121 33.05
EXTERNAL FUNDING
DISBURSEMENT OF PROJECT FUNDS 42.38 26.86 2.17 4,84 76,25
INTEREST DURING CONSTRUCTION (capitalized) 8.09 3.79 0,14 0.00 12.02
TOTAL EXTERNAL FUNDING 51.66 31.37 2.32 4.99 90.34 COMMITMENT CHARGES (caplalized) 1 2 0 0.71 0.01 0,11 2,03
GRAND TOTAL TO BE FINANCED 69.82 42.88 4.49 6.20 123.39
TABLE 2: FINANCING PLAN (US $ million)
F. Implementation Arrangements
1. Integration of Project Components
83. The proposed implementation program is focused on an overall sustainable development of Quetta’s water supply, and provides a phased investment plan for rational utilisation of water resources and sanitation systems. In the prevailing conditions, sustainability can only be achieved if the combined measures create equilibrium between recharge and abstraction in the area’s main source of potable water, the alluvial aquifer underlying the Quetta Valley. Since all measures and their effects are interdependent, it is essential that the defined project components be implemented jointly and in the proposed sequence.
84. The Phase 1 implementation program as proposed for Bank financing will provide the fundamental institutional, social, technical and economic components that lead towards massive improvements in the coverage of water demand, environmental conditions and water balance. However, considering also local funding and implementation capacities, this program is embedded in a long-term strategy and has to be continued in a second phase, before full demand coverage and a balanced regime in the alluvial aquifer can reasonably be expected. The overall concept provides the necessary planning and scheduling in a fashion that gives room for adjustment in response to actual development and findings of detailed exploration.
2. Project Implementation Schedule
85. The consulting service for exploration of new groundwater resources is expected to commence in mid 2000. It has been agreed with the Executing Agency to start the Water Resource Investigations in 20011 to confirm the availability of water from the proposed well fields in the limestone aquifer. A exploration drilling campaign is proposed to start in October 2000.
86. Project implementation of the Phase I project is expected to commence in January 2001, assuming that Loan Agreement and local funding arrangements are concluded, Project Management and Project Implementation Units are in place and functional, and other required institutional preconditions are fulfilled by that date.

Ouetta WSE - Final ReDoIl Executive Summarv I Paae 29
87. After conformation of the limestone water source (Water Resource Investigation), the well construction programme will start in 07/2001 and is anticipated to be completed in 12/2002. After completion of the production well drilling and test pumping the technical data for design and tendering of all civil works components related to the well fields can be prepared. The technical components of the well fields will be constructed between 01/2002 and 12/2005. In 2004/05 the additional water sources (L2 and L3) are anticipated to start production and to supply additional potable water to the consumers outlet.
88. In Appendix 8, Project Implementation Schedule, the construction of the well fields are presented. A significant improvement at consumer level can not be expected before 2004/05, as apart from production wells, all other technical facilities are to be designed, constructed and operational (reservoirs, transmission mains, secondary mains, water connections etc.). The Figure 3 indicates the available water quantities at consumer level. The availability of portable water at consumer level will be approximately 1.5 to 2 years later than the construction of production wells due to technical planning and construction times.
89. Phase 1, essentially the package proposed for Bank financing, is scheduled to be completed by end 2005. Realisation of the further program until the target year 2020 is following a logical sequence and, where practical, packaging in consecutive 5-year implementation periods. The programming considers well supported and less expensive components in the earlier stages, and those packages that need more exploration and higher investment later, in order to allow for well-founded decision-making and flexible response to unexpected development.
3. Execution and Coordination
90. Implementation of this multi-component project will involve agencies at the Central, Provincial and Municipal government levels, and cooperating NGOs and CBOs. Lead executing agency will be the Planning and Development Department, Government of Balochistan, with BWASA and Quetta Municipal Corporation as implementing agencies of the main components. Due to the major re-shuffling of GOB administrative structures, following the change of central government, roles and responsibilities may change shortly. The Bank may wish to initiate policy dialogue with GOB on this aspect of an ensuing project to establish shared understanding of the issues involved. Pending relevant further decisions, the following distribution of tasks and responsibilities for project implementation is suggested:
91. At the central level, Ministry of Finance and Economic Affairs Division will deal with the loan and internal funding aspects. At the provinciaVmunicipa1 level, a Project Steering Committee chaired by the Additional Chief Secretary P & D. or alternatively the (proposed) District Water Board, will be the intermediate body to provide consultation, liaison and coordination between the various agencies concerned. The committeehoard will meet at least once every month. The formal management structure would be supplemented by informal communication on specific issues.
92. To ensure continuous professional project management, a Project Management Unit (PMU) will be established in the Provincial Government. Assisted initially by advisors, the PMU will be responsible for contract management; operational coordination and supervision; monitoring and reporting including PBME; conducting public campaigns and community development programs; and coordinating further studies, investigation and exploration programs.

93. Day-to-day management of consultants' and contractors' services will be carried out by Project Implementation Units (PIU), established for each Sector, and reporting to the Project Manager PMU.
94. Consultants will be engaged to undertake detailed design work and to assist with construction supervision.
4. Consulting Services
95. For Phase 1, Consulting services with an input of about 857 person-months will be required for exploration, investigation, detailed design, and supervision of drilling and construction work. Additionally, around 132 person-months shall be provided for advisory services by local and international consultants. Services will be tendered internationally in accordance with the Bank's Guidelines on the Use of Consultants.
5. Procurement
96. The procurement of goods and services under Phase 1 of the project will be undertaken in accordance with the Bank's Guidelines for Procurement. Indicative procurement packages are presented in Appendix 10. It is proposed that contracts for the supply of special vehicles and equipment, and water supply pipes and accessories be awarded through international Competitive bidding (ICB) or international shopping (IS). Major civil works contracts costing US$ 1 mio or more, and vehicles, equipment, or materials costing US$ 0.5 mio or more would be awarded through ICB procedures. Other goods and services are procured following local competitive bidding (LCB) procedures acceptable to the Bank.
6. Land Acquisition and Rights
97. The major plots of land required in Phase 1 - for Wastewater Treatment Plant (approx. 80 ha) and Sanitary Landfill (approx. 27.7 ha) - have been acquired earlier by BWASA and QMC respectively for the assigned purposes. For water resource development, land acquisition will be required, subject to the results of detailed exploration. Pending final engineering design, the other project components such as water and wastewater conveyance systems, are predominantly aligned along public right of way, and the need for land acquisition and resettlement has been largely avoided for Phase 1 implementation.
98. In the second and third phases, major additional land acquisition will be required for further well fields, Kuchnai Dam, extension of the Cantonment Water Treatment Plant, extension of Wastewater Treatment Plant at Kili Barmah, stormwater drains and flood retention basins with attached percolation channels, and eventual extension or new site of solid waste disposal site. Relevant areas envisaged are uninhibited at present.
7. Maintenance of Project Facilities
99. Subject to final administrative arrangements, the tentative allocation of responsibilities for operation and maintenance of project facilities will be as follows:

Quetta WSE - Final Rewrt Executive Summarv I Paoe 25
Wells Water Supply Installations excl. Kuchnai Dam Scheme Kuchnai Dam Scheme Sewerage System Urban Drainage Flood Control Solid Waste Disposal
BWASA BWASA
Military Engineering Services (MES) BWASA QMC BlDA QMC
8. Reports, Accounts, Audits
100. Quarterly project progress reports will be prepared by the Project Manager PMU, and submitted to the Steering Committee and the Bank within one month after the end of each quarter in a format and detail as the Bank may reasonably request. They will provide a description of progress, details of any modifications to the project schedule, problems encountered, and an outline of the work in the following quarter. The reports will also give summary accounts of the project, including expenditure during the quarter, fiscal year to date expenditure and total expenditure to date, as well as status of financial and institutional developments, benefit monitoring, and compliance with loan covenants.
101. Detailed project accounts, as maintained by the Project Manager PMU, will be submitted to the Steering Committee and the Bank within nine months of the close of the fiscal year in audited form. The auditor will be chosen with the approval of the Bank. The auditor’s report will include certified copies of the audited accounts, financial statements, the auditor’s professional opinion on the use of loan proceeds, the status of compliance with the Bank‘s loan covenants, and an explanation of the procedures to prepare and compile statements of expenditure.
102. A Project Completion Report will be submitted by the Project Manager PMU to the Steering Committee and the Bank within three months of substantial completion of the project, describing the execution and initial operation of the project facilities.
103. timely submission rests with the Project Manager PMU.
The responsibility for preparing these reports, accounts and statements, and their
9. Benefit Monitoring and Evaluation
104. To protect investments, and to ensure that project works and facilities are managed and operated efficiently at the envisaged service levels, and that target groups are realising the anticipated benefits from the development, the project will devise a benefit monitoring and evaluation program (BME) to monitor the delivery, use and benefits of the rehabilitated, upgraded and extended facilities. The results of the program will eventually be incorporated into an evaluation exercise which will be undertaken periodically after extended periods of operation of the improved infrastructure. BME inception includes establishing benchmark socio-economic and technical profiles based on initial and periodic surveys, data collection, and analyses of environmental quality, public health, property values, and operational and institutional efficiency. The BME framework will be designed, developed and commissioned by the project consultants in compliance with the Bank’s BME guidelines during the design phase, and PMU will be responsible for its maintenance in accordance with a schedule and terms of reference agreed upon by the Bank. Quarterly Reports during project implementation will include information on the BME planning and establishment of baseline and performance

Ouetta WSE - Final Rewrt Executive Summarv I Page 26
indicators. Annual BME Reports will submitted by the Project Manager PMU to the Steering Committee and the Bank with the first Quarterly Report for each year, continuing until one year after submission of the Project Completion Report.
10. Midterm Review
105. It is proposed that a comprehensive midterm review be carried out when the project has reached the implementation stage at which detailed engineering for the main sub-projects is complete and major contracts have been awarded and commenced. this is envisaged to be about 12 months from loan effectivity. The purpose of the review will be to critically evaluate actual project progress, implementation procedures, procurement methodology, BME procedures, and the performance of the design and supervision consultants. Following the review, corrective measures as appropriate will be introduced to remedy any identified weaknesses.
G. The Executing Agency
106. Department.
Executing Agency for the Project is the Balochistan Planning and Development
H. Environmental and Social Measures
1. Environment
107. The results of the initial environmental examination (IEE) and social impact assessment, performed during Project preparation and in accordance with Bank guidelines, were incorporated in the Project design to create large positive social and environmental impacts. Public health will improve as a result of the Project, and environmental pollution will be reduced dramatically with the construction of sewerage system and treatment plant, the rehabilitation of urban stormwater drainage and the replacement of open dumping by a proper sanitary landfill for solid waste disposal. Short- term negative environmental impacts during construction are small and will be mitigated by careful construction supervision and site-specific environmental control measures. The findings of the environmental assessment are summarised as follows:
(i) Impounding reservoirs for surface water (not included in the Phase 1 program proposed for Bank financing) - The investigated options (Kuchnai, Mangi and Burj Aziz dams) are classified in category “ A (significant adverse environmental and social impacts) according to the Bank’s guidelines. They are generating some major and moderate effects and impacts on the environment as well as social impacts concerning the residents in two of the three investigated reservoir areas. An Environmental Impact Assessment (EIA) is required for the selected Kuchnai dam project in the scope of final engineering design.
Wastewater treatment plant - As no or only small impacts are expected from the realisation of Technical Option 1, the Initial Environmental Examination (IEE) carried out in Phase I of the project becomes the Environmental Impact Assessment (EIA). The Selected Variant is classified in Category “ C according to ADB Guidelines.
(ii)
H \CmDBt\Ber\PAKISTAM2332~md RewA\Eurut#vs S u m r y E x b S v r n d D c

Quena WSE - Final Rewrt Executive Summarv I Paae 27
(iii) Sanitary landfill - It can be stated that no environmental problems are likely to occur due to the project location whilst operating or during construction. A possible negative influence on groundwater quality must be confirmed. However, if properly designed, constructed and operated, the envisaged sanitary landfill will cause only small adverse effects. The proposed site is evaluated in Category “ C (estimated to have no or small adverse environmental impacts) according to the ADB classification. A complete Environmental Impact Assessment (EIA) is not required. The present revised IEE becomes the completed EIA, as the environmental impacts are relatively insignificant.
2. Social Analysis
108. An extensive social study of requirements and anticipated effects has been made, including socio-economic surveys, proposals to involve the beneficiaries, CBO’s and NGO’s in the decision-making on system design and implementation procedures, and assessment of the social impact of the project. For the eventual preparation of resettlement plans - not required for those project components that are proposed in the implementation program - an outline action plan has been prepared. Poverty is a pervasive feature of the Service Area, and Quetta’s problems may be approaching those of Pakistan’s larger urban areas. Quetta’s katchi abadis share their acute lack of social services, particularly safe drinking water, sanitation and sewerage. Quetta’s poor are characterised by low levels of human resource development associated with food deficiency, lack of minimum income to satisfy basic needs, and deprivations of education, health, and other services. Disaggregated by gender, male poverty is estimated as 37.4 percent and female poverty as 51.9 percent. Balochistan has the lowest adult literacy in Pakistan, and female illiteracy in Quetta, in some estimates is close to 85 percent. Balochistan also has the nation’s highest infant mortality rates (IMR) for both urban and rural areas. Most lethal diseases in Balochistan and much morbidity are water-borne or related.
109. The ensuing Project is designed to provide major extension and improvement of public water supply to currently poorly served areas and populations. It includes substantial expansion of both public taps and yard connections to service groups without house connections or resources to acquire them. The project is also anticipated to include tariff provisions targeted to poor and low-income groups that will assure lifeline access and supply safety nets to buffer rate increases. In particular consideration of the most pressing need for safe and reliable supply of drinking water, the proposed rehabilitation and expansion program includes appropriate proportions of publickommunity taps (2,000 Nos.) and yard connections (25,000 Nos.) serving 380,000 people of poor and low income groups in the Service Area. These facilities can be swiftly connected at low technical effort and cost, and they facilitate overall resource development and main water distribution on feasible levels.
1 10. Project preparation included, furthermore, the development of community participation arrangements with local CBOs and NGOs. The ensuing Project will rely on community organisations as partners in the implementation of many components and depend on communities to accept and sustain project measures. CBO participation and capacities to partner key aspects of project implementation will be facilitated and strengthened by project-assisting NGOs, who will also play important roles in expanding public awareness of project concerns and promoting community-oriented conservation.

Quetta WSE - Final Rewrl Executive Surnrnarv / Page 28
111. Consumption levels in the surveyed communities showed an average of 1.6 m3 per household and day, with more than half of the households using 0.7 m3/d or less. Sixty percent of surveyed households relied on, or supplemented, the limited BWASA- supplied water with water from their own wells, with water purchased from other suppliers, or with water acquired from other sources. Almost 30% of households reported one to two purchases per week from commercial water tankers. Average monthly water expenditures for these households, in addition to the BWASA tariff, was between Rs 500.- to Rs 600.-. More than half of households purchasing tanker supplies, however, reported spending Rs 100.- to Rs 200.- per month.
112. Willingness to pay is generally present, especially as manifest in household and community demand for the project and interest in participation and involvement in project implementation, although it, too, is less than universal for proposed sanitary sewerage and solid waste disposal improvements. However, social analysis also indicates that ability to pay for proposed project improvements is constrained by povetly and low incomes in a considerable proportion of the Service Area population. This is especially the case for levels of service to be provided by sanitary sewage and wastewater improvements and for water costs that may be associated with potential water resources development. Monthly overall expenditures in surveyed households ranged from Rs 1,500.- to Rs 45,000.-. Average monthly household expenditures were Rs 10,411 .-. Almost 70% of surveyed households had estimated monthly expenditures less than Rs 10,000.-, placing them in low and medium income groups. Nearly one-third of all surveyed households had average monthly expenditures of less than Rs. 5,000.-. Using 570 of family income as an upper limit of ability to pay for water, the range starts at Rs 75.- per month (the current flat rate for house connections), and reaches an average of around Rs 500.- per month (the present expenditures of better-off families supplied by tanker).
113. Project preparation included a review of public awareness objectives pertinent to an ensuing project, including characteristics of key stakeholders. With regard to water conservation, and based on the relevant findings during the surveys and workshops, public awareness campaigns have been designed and partly implemented, that focus i.a. on: (i) meter installation; (ii) leak detection and reporting improvement; (iii) unauthorised connections; (iv) inadequate storage facilities; (v) use of suction pump; (vi) water contamination; (vii) unnoticed economic burden; (viii) conservation attitudes.
114. Based on a review of health and hygiene-related aspects of water supply, sanitation, drainage and solid waste, an assessment of hygiene education needs was made, and a hygiene education component has been developed for incorporation in the ensuing Project. The proposed program will be implemented, targeting poverty-level sub- populations and other disadvantaged beneficiary groups including women.
115. Project design, including proposed surface water resource development and selection of technical options for sanitation and wastewater treatment, avoids resettlement and indigenous peoples impacts. Preliminary designs suggest that water and wastewater transmission lines will be largely accommodated in existing right of ways and not require significant land acquisition. Land for the proposed impounding reservoir, the solid waste disposal site and the wastewater treatment plant is uninhibited.

Quena WSE - Final R e w r f Executive Summarvl Paw 29
1. Policy Issues
11 6. The declared target of the Project is a least-cost solution to Quetta's water supply problems that is also environmentally acceptable, socially and economically feasible and financially viable. Selected investments must be operated and maintained in collaboration with the local communities and achieve an acceptable level of cost recovery of O&M cost within about five years and O&M plus dept service payments or depreciation, whichever is higher, within ten years of completion of the selected option.
117. The program set out in the TA takes full consideration of these postulations and the actual financial situations of GOB agencies involved. Relevant components for cost recovery and tariffs, capacity building, beneficiary involvement have been adapted to the specific requirements in the Service Area, and are included in the Project. Respective technical assistance packages are provided to provide support.
V. PROJECT JUSTIFICATION
118. Rapid growth of population and water demand on one hand, and receding groundwater reserves combined with less than optimum resource management on the other, have created a strong demand for piped water ~ t ~ p p l y in the Quetta service area. Furthermore, the existing water resources as well as the urban environment are seriously affected by inadequate wastewater and solid waste disposal, and by shortcomings of stormwater drainage and flood control. The arid climate necessitates an integrated approach to streamline and strengthen responsible institutions, win public cooperation, and utilise feasible primary and secondary water resources in order to cover the water demand and at the same time restore equilibrium in the groundwater balance.
119. Adopting the necessary integrated concept, the Project is to solve the current backlog of essential infrastructure services in the City of Quetta and surrounding villages, and at the same time set up medium and long-term programs for their feasible and sustainable development.
120. Particularly addressing the needs of low-income groups, the Project lays emphasis on reduction of health hazards, improvement of living conditions, and promotion of urban efficiency. It will also support expansion of the urban economy, which is of increasing importance in view of constraints imposed by limited water resources on the further growth of irrigated agriculture. Towards such purposes, services will be improved and expanded in the sectors water supply, wastewater and solid waste disposal, drainage and flood control. Included are, as prominent items, conservation and recycling measures, as well as the sound technical and financial management, operation and maintenance of infrastructure facilities, and other institutional capacities of the agencies involved.
121. The proposed measures are designed to enhance the protection of earlier investment and extend fundamental social services to the direct benefit of about 355,000 present and additional 420,000 consumers in its Phase 1 till 2005, and a total of 1,795,000 inhabitants overall by the end of the planning period in 2020.

Ouetta WSE - Final Rewrt Executive Summarv / Paae 30
122, The Project is given high priority by the Government, and is in conformity with the Bank’s country assistance planning and operational policy for the sector, particularly in terms of a necessary integration of various sub-sectoral initiatives for better coordination and mutual reinforcement. For Quetta, the administrative and commercial centre of Balochistan, substantial improvements especially in the water supply sector are essential.
A. Economic and Financial Analyses
123. The Economic Internal Rate of Return for the proposed Phase 1 development of the water resources and supply infrastructure, estimated with rather conservative assumptions, is in the order of acceptable 14.01 Yo, compared with the Financial Internal Rate of Return of 8.41 Yo. For the recommended Phase 1 waste water collection and treatment investments the EIRR, calculated with the same conservative assumptions, is 14.52 YO, versus the FlRR of 6.31 %.
124. The economic and financial analysis of the proposed sub-projects shows that the recommended Phase 1 investment program is economically necessary to improve the living and health conditions of the population in the project area, their economic potential and the economic potential in the region. It further suggests a sound potential for viable and sustainable technical and financial development, provided that:
(i) necessary institutional reforms, as proposed, are implemented for stringent technical and financial water resources management and for cost effective infrastructure regulations;
(ii) technical, commercial and financial management and performance of operations are improved through adequate Technical Assistance, manpower development and capacity building programs;
(iii) appropriate financial, public sector subsidisation and cost recovery policies are defined, implemented and enforced; and
(iv) socially compatible, demand driven tariff policies are implemented to achieve these predefined objectives, but also to .support demand management by better controlling water wastage through adequate tariff policies and the required stringent resources management.
125. Relevant programs to solve these issues, presented in the TA, have been accepted by the Government agencies involved. Generally, it was recognised that proposed investments are based on technical least-cost options, leading to affordable and socially acceptable water prices.
126. Average incremental cost of 0.47 US$/m3 at a discount rate of 12% for water, and the targeted coverage of O&M expenditures within the next 5 years, and O&M plus dept service or depreciation within ten years after project completion, result in a recommended increase of flat rates from present R s 75.- per month to Rs 170.- per month till 2005. Thereafter, structured tariffs on metered consumption basis are proposed, ranging from a lifeline rate of 2.50 Rs/ m3 to a “penalty” rate of 8.00 Rs/ m3 for excessive use. Sewerage charges are proposed to be levied in the form of a 25% surcharge on the water bill.

QueHa WSE - Final ReDort Executive Surnrnarv / Paae 31
B. Environmental Impact
127. The project beneficiaries are at present faced with critical environmental risks deriving from water-borne pathogen pollution. Most lethal diseases in the region are water-borne or water-related. The highest exposure and associated health risks are associated with the lack of safe drinking water in sufficient quantity, and poor sanitary conditions, which subjects the people to significant pathogen-related environmental health risks.
128. The proposed integrated project components - technically required to establish a balanced regime of water resources - will facilitate optimum improvement of water supply, wastewater and solid waste disposal and urban stormwater drainage. Furthermore, strong health education and community development components will promote beneficiary support and participation. Thus, the overall environmental benefits of the project are significant and far reaching, with major impacts directed particularly at low- income groups, and general improvement of socio-economic conditions.
129. Environmental assessments carried out in the scope of project preparation revealed no significant environmental impacts that would object the implementation and operation of the proposed project components and further options investigated. In accordance with the Bank's relevant guidelines, they are classified in Category "A" (dams, not included in the Phase 1 program - full scale additional EIA will be carried out in the scope of engineering design), and Category "C" (wastewater treatment plants; and sanitary land fill for solid waste disposal).
C. Social Dimensions
130. The project will significantly benefit human development in Quetta and surrounding villages. In addition to health benefits, the project will rise living standards, increase productivity, and support economic growth. With improved water supply, sewerage, solid waste disposal and urban drainage, the incidence of water-related disease will decrease. The project also puts great weight on capacity building to improve development planning, municipal services management and revenue generation to promote adequate operation and maintenance, and project sustainability. It enhances NGOKBO involvement in community participation and hygiene education programs to meet community expectations of design and implementation, and to achieve the envisaged human development objectives
131. The proposed resource development and water supply project components will decisively alleviate the acute water shortage. In particular consideration of the pressing needs and financial constraints in low-income groups, public taps are re-introduced to serve local communities. For swifi and economical supply of extended households, increased numbers of yard connections will be installed. Close cooperation with NGOs and CBOs will facilitate appropriate site selection and care of facilities in a logical extension of higher order technical and administrative arrangements in the supply system.
132. The envisioned sewerage, drainage and solid waste sub-projects are expected to eliminate local sewage ponding and stop the flow of contaminated wastewater in open channels, that affect the lives of residents - especially of children in less affluent neighbourhoods, and increasingly pollute the groundwater.

Ouetta WSE - Final Rewr l Executive Sumrnarv / Paae 32
133. Building public awareness is a major aspect of the participatory agenda of the ensuing Project; one that is fundamental to involving the public and beneficiary communities in many aspects of project implementation, including operation and maintenance of investments, conservation, hygiene education, and support for policy, institutional, and tariff reforms. This sub-component was initiated during project preparation, and relevant provisions have been made for a systematic continuation throughout the implementation phases. It emphasises particularly community and grassroots-level water conservation, and includes public relations; press relations; multimedia, interpersonal, and community / informal communications; and establishment of a documentation centre. Specific lines of action will cover hygiene education, procedures for NGO/CBO involvement, and public awareness.
134. The overall impact of the combined measures will not only enhance the vital supply of safe drinking water and the normalisation of environmental conditions, but it will also significantly contribute to a balance of the most important groundwater regime in the alluvial aquifer, systematic resource and demand management, and full involvement of beneficiaries in all stages of implementation and operation. Costs could be kept within affordable limits. In that way, the presented solutions, will be sustainable and to the benefit of the population in the entire service area, particularly the women and children, and disadvantaged groups.
VI. ISSUES AND RISKS
A. Implementation
135. The project preparation report provides an overall view and the preliminary design of integrated water supply and environmental measures that are necessary to cover the demands of a capital city of 2 million in an arid climate. Presently, resource management and facilities are inadequate to non-existent. 'Existing conditions require immediate and concentrated remedial action.
136. Program components are interdependent and have to be implemented jointly and in logical sequence in order to achieve the anticipated effects. This will require relative large scopes of work in both, exploration and final engineering, and physical implementation.
137. derive from:
Potential risks for the management and execution of the proposed program may
(i) institutional readiness to decide upon, manage and subsequently operate the complex arrangement of multi-sectoral measures;
(ii) national and provincial borrowing and funding capacities, and capability to complete relevant arrangements by end 2000;
(iii) capacities of contractors, consultants and project administrators to handle the large-scale tasks involved;
(iv) delayed appointment of consultants; (v) dropping of single program components, causing a chain reaction of
effects - e.g. deleting the sewerage program would cancel the availability of treated wastewater for irrigation; agriculture continues to deplete the

Quetta WSE - Final Report Executive Summarv f Paae 33
alluvial aquifer; groundwater from this source is not available for domestic use; the groundwater balance continues its negative trend:
(vi) highly sensitive exploration and production wells in limestone and Zarghoon Range are carried out by inexperienced drilling contractors; and
(vii) essential investigations, including e.g. continuation of well inventory and updating of groundwater model; hydrological program for Kuchnai dam, are not carried out efficiently, and results are not at hand when they are needed for on-leading decision-making.
138. General program delays due to such potential constraints would cause lagging of implementation behind a “run-away” development of demand, and consequently a continued worsening of the overall situation.
6. Social and Institutional Aspects
139. Potential BWASA failure to improve performance is a basic risk that could undermine attainment of most project objectives, especially user willingness to pay, which is conditioned on service improvements.
140. The envisioned project will also rely on partnerships with the other institutions concerned with water and sanitation, as well as with NGOs, CBOs, and beneficiaries that, if unproductive, will seriously delay project implementation.
141. practices will not be observed and sustained are also of significant concern.
142. The complexity of the project’s social context and associated requirements for public and beneficiary participation increases overheads. Similarly, the necessity of tailoring project measures to socio-spatial sub-populations reduces economies of scale. Without careful balancing, a tailored approach also risks perceived catering and preferential treatment, potentially aggravating ethnic divisions and divisiveness. Resentment by non-poor groups due to perceived favouritism of poverty-reduction and life-line tariff provisions is also a significant risk. Resistance by vested interests opposed to social equity risks emasculation of social development dimensions of the Project.
143. Resistance to demand management and conservation by vested interests may also undermine the effectiveness of overall conservation efforts and the program may degenerate into platitudes and blaming victims.
144. Many important aspects of comprehensive water demand management are outside the project’s scope, including population planning, rural development to reduce migration push, and measures to contain and accommodate migration pull at source or through diversion to alternative urban destinations. If these aspects go unattended, project objectives will lack complementary support and their attainment will be jeopardised.
145. Ineffective conservation may promote an unbalanced approach and over- emphasis on water resource development that absorbs scarce resources in low-return ventures. These may reduce development resources available for rural Balochistan, accentuate Quettdrural disparities, and encourage additional in-migration.
A high risk of diversion of project benefits is present. Risks that good governance

Ouetta WSE - Final ReDort Executive Summaw I Paae 34
C. Recommended Action
146. Following the review, constructive commenting of the present report by Executing Agency and Bank, and eventual adjustment of program provisions, the further critical path in project preparation will include:
clarification of de-facto responsibilities within GOB, and full-time appointment of suitable personnel to take over PMU tasks and liaison between local, provincial and central Government agencies and the Bank; final delineation of the Phase 1 implementation program; Bank's appraisal Mission and reporting conclusion of Loan Agreement and local funding arrangements; formal establishment of PMU and Plus; appointment of consultants; continuation of investigation programs; continuation of PR and community development programs; and start of regulative procedures on central and provincial levels towards quantity-based billing of water consumption and electricity for irrigation.
147. Particular attention has to be paid to the requirement of in-depth exploration and planning of components that are scheduled for later implementation, but need these preparatory activities for relevant final decisions on detailed scope, cost and timing.


APPENDIX 1 Project Framework

Quetta WSE - Final Report, Executive Summary Appendix 1, Page 1
APPENDIX 1 : PROJECT FRAMEWORK
Design Summary
. Sector Goal mprove the quality of life in the Iroject area
’romote economic and social jevelopment in the project area
II. Project Objectives Improve urban service and envi- ronment in the project area in a sustainable manner and contrib- ute to poverty reduction
Project Targets
Sleaner environment, improved nealth, higher income
Higher investments in the project town, higher employment rate, more social development pro- grammes
Complete ADB project according to study recommendations, gen- erate adequate o&m funds
Verifiable Indicators
Central and local government population and health statistics
Government statistics, studies and reports of agencies, NGO’s ICBOs
Project progress reports, loan review missions, monitoring and evaluation indicators and projecl completion report after comple. tion of implementation
Assumptions/ Risks
Political stability Economic growth
Further improvement in legal and policy environment Further improvement of govern- ance National and provincial borrowing and funding capacities, and ca- pability to complete relevant ar- rangements by end 2000
Continued improvement in gov- ernance, observations on the improved “level of Services” of the served population, improve- ment in capacities of concerned institutions Dropping of single program com- ponents, causing a chain reac- tion of effects - e.g. deleting the sewerage program would cancel the availability of treated waste- water for irrigation; agriculture continues to deplete the alluvial aquifer; groundwater from this
H:\ConDat\BeAPAKISTAM233209\Final Report\Executive Sumrnary\Exex-SUM-App-l .doc

Quetta WSE - Final Report. Executive Summary Appendlx 1. Page 2
APPENDIX 1 : PROJECT FRAMEWORK (CONTINUED)
Design Summary
mprovement of operation and naintenance procedures within 3WASA
ksistance to introduce institu- ional reforms to decentralize
II. Components/ Outputs Nater Resource Development
mprove water supply services tc xnsumers within service area
Project Targets
mprovement of level of services
levelop institutional capacities or local urban development and nanagement
Improvement of water balance through development of neH water sources in the limestone aquifer
Rehabilitation and re-structurinc of the water supply system, pro. vision of O&M training, extensior of the piped water system,
Verifiable Indicators
Nillingness of staff to be trained md improved performance of system
Jroject progress reports, loan .eview missions and projecl ;ompletion report
Completion time, discharge from exploration wells after tesi pumping
Completion time, project prog. ress reports, loan review mis, sions and project completior report; Number of new water
Assumptions/ Risks
source is not available for do- nestic use; the groundwater bal- mce continues its negative trend
4vailability of interested staff and iinancial and intellectual incen- tives
Timely legal and institutional ac- lions by the Government towards reforms and effective enforce- ment of water rights Institutional readiness to decide upon, manage and subsequently operate the complex arrange- ment of multi-sectoral measures
Impact on upper ground water aquifer, unsuccessful drilling campaign, low water quality
Timely recruitment of Consult- ants by the Project Executing Agency;
H:\ConDal\BeAPAKISTAM33209\Final Report\Executive Summary\Exex-SUM-App-l .doc

Queth WSE - Final Report, Executive Summary Appendix 1, Page 3
-Technical Management '
- Project Implementation
APPENDIX 1 : PROJECT FRAMEWORK (CONTINUED)
Completion time, project prog- less reports, loan review mis sions and project completion
Design Summary
mprovement of wastewater management in the project area
Development of community awareness concerning health care
Project provides Technical As- sistance
Management and Institutional Structure Reform
Project Targets
incorporation of PHED and BWASA system into one water network System
Rehabilitation and extension of sewer system, construction of waste water treatment plant
Assistance in community educa- tion programs and installation of low-cost sanitation systems for the urban poor through involve- ment of NGO and CBO
Verifiable Indicators
meters installed, number of new water connections
--
Completion time, project prog- ress reports, loan review mis- sions arld project completion report: Number of connected households to the piped sewer system: Discharge of waste wa- ter from the plant
Completion time, project prog- ress reports, loan review mis- sions and project completion report; Number of low-cost sani-
, tation facilities implemented
~~ ~~
Assumptions/ Risks
Available counterpart staff and funds; Timely execution of the works by the Consultant
Timely recruitment of Consult- ants by the Project Executing Agency; Available counterpart staff and funds; Timely execution of the works by the Consultant
Timely recruitment of Consult- ants by the Project Executing Agency: Available counterpart staff and funds; Timely execution of the works by the Consultant
Consultant recruited early in ac- cordance with the appraisal schedule
Consultant recruited early in ac- cordance with the appraisal schedule
H:\ConDatBeAPAKISTAN33209\Final Report\Executive SurnrnarylExex-SUM-App-1 .doc

Appendlx 1, Page 4 OUetta WSE - Flnal Report. Executlve Summary --
Project Targets
APPENDIX 1 : PROJECT FRAMEWORK (CONTINUED)
Verifiable Indicators ~ ~
Design Summary
)n surface water sources to jus- 1 ify the yield of surface water ichemes
V. Activities iydrology and Mechanical Tests or Kuchnai Dam Scheme data justifies construction of dam
Exploration Programme mproved and verified database i n Limestone and Zarghoon 3ange well field to justify the field of new ground water schemes
Completion time, successful drilling campaign, average yield of production wells according to expectations
Assumptions/ Risks
Loan awarded; government funds awarded Capacities of contractors, con- sultants and project administra- tors to handle the large-scale tasks involved Delayed appointment of consult- ants Essential investigations, includ- ing e.g. continuation of well in- ventory and updating of ground- water model; hydrological pro- gram for Kuchnai dam, are not carried out efficiently, and results are not at hand when they are needed for on-leading decision- making Loan awarded; government funds awarded Capacities of contractors, con- sultants and project administra- tors to handle the large-scale tasks involved Delayed appointment of consult- ants
H:\ConDat\BeAPAKISTANW33209\Final Report\Executive Sumrnary\Exex-SUM-App-l .dm

Quetta WSE - Flnal Report, Executive Summary Appendix 1, Page 5
APPENDIX 1 : PROJECT FRAMEWORK (CONTINUED)
Design Summary
qehabilitation and Extension ol qesources
Nater Supply Project Compo- lent
Wastewater project
Project Targets ! Verifiable Indicators I
Improvement of production Completion time, improved yield !of existing wells and production I according to expectations
Reduction of physical losses
Improved waste water quantities and re-use of wastewater
Completion time, piped water is available. losses are reduced to 2546 in 2005, rate of coverage is increased and private consumers are connected to the system
Completion time, waste water connections are implemented, waste water is discharged ac- cording to expectations, treated effluent is utilized for irrigation
Assumptions1 Risks
Highly sensitive exploration and production wells in limestone and Zarghoon Range are carried out by inexperienced drilling con- tractors Loan awarded; government funds awarded Capacities of contractors, con- sultants and project administra- tors to handle the large-scale tasks involved Delayed appointment of consult- ants Loan awarded; government funds awarded Capacities of contractors, con- sultants and project administra- tors to handle the large-scale tasks involved Delayed appointment of consult- ants
Loan awarded; government funds awarded Capacities of contractors, con- sultants and project administra- tors to handle the large-scale tasks involved
H:\ConDat\Be~?AKISTAM233209\Final Reporl\Executive Summar$Exex-SUM_App-l .doc

Appendix 1, Page 6 -. Quetta WSE - Final Report, Executive Summary
Completion time, tools and equipment is delivered and util- ized according to maintenance
APPENDIX 1 : PROJECT FRAMEWORK (CONTINUED)
Design Summary
Urban Drainage
Solid Waste Disposal
Advisory services for manage- ment of the financial and com- mercial aspects of BWASA
Project Targets
Improved drainage situation in Quetta
Verifiable indicators
Improved solid waste collection 1 Completion time, solid waste is and disposal procedures ;collected and disposed at nem 1 disposal site
i
Improved commerci
management and I performance
Project reports and review mis sions. special reports
Assumptions/ Risks
Delayed appointment of consult- ants Loan awarded; government iunds awarded Capacities of contractors, con- sultants and project administra- tors to handle the large-scale tasks involved Delayed appointment of consult- ants Loan awarded; government funds awarded Capacities of contractors, con- sultants and project administra- tors to handle the large-scale tasks involved Delayed appointment of consult- ants Loan awarded; governmenl funds awarded Capacities of contractors, con- sultants and project administra- tors to handle the large-scale tasks involved Delayed appointment of consult- ants
H:\ConDat\Ber\PAKISTAM233209\Final ReportExecutive Surnmary\ExexSUM-App_l .doc

Quetta WSE - Final Report, Executive Summary -. Appendix I, Page 7
Design Summary
Advisory services for Project Execution and Community De-
APPENDIX 1 : PROJECT FRAMEWORK (CONTINUED)
Project Targets Verifiable Indicators Assumptions/ Risks
Improved community participa- , Projectreports and review mis- Loan tion and public awareness I sions. special reports funds awarded
awarded; government
Advisory services for Project improved operation and mainte- , Project reports and review mis- Technical Operation nance procedures I sions. special reports
veloprnent
Loan awarded; government funds awarded
Capacities of contractors, con- sultants and project administra- tors to handle the large-scale tasks involved Delayed appointment of consult- ants
H:\ConDatBeAPAKISTAM233209\Final ReporhExecutive Summary\Exex-SUM-App-I .doc

. . . . Executive Summary . . . . . . . , . . .
. .
...
: ,
. . .
: .. . . ,
.
APPENDIX 2 ,J@#@@WAsslstance for urban Water Supply and Sanl-
tation Management
. . . . . . . : . . . . . . . . I ,... . . . . . . . . . I . . . . . . . . .
... bWiMT&bH. . . . . .... ' : . i . . . ...... ,. . . . . . . . . . . . . . . . : .. . . . . . . . . . . . .
. . . i , :;.):I ' . ..I:
, . . , . .,, , . . . :;. 2 ~ : . , 2 . . ; .: , m i .
-m--

Quetta WSE - Final Report, Executive Summary Appendix 2 I Page 1
APPENDIX 2 : EXTERNAL ASSISTANCE FOR URBAN WATER SUPPLY AND SANITATION MANAGEMENT
Amount Description (S milllon) Approved 1. LOANS A. TheBank
1. Loan No. 263-PAK(SF): Hyderabad Water Supply and Sewerage
2. Loan No. 331-PAK(SF): Faisalabad Water Supply, Sewerage and Drainage
3. Loan No. 793-PAK(SF): Karachi Urban Development 4. Loan No. 1001-PAK(SF)IlOO2-PAK: Karachi Sewerage 5. Loan No. 1004-PAK(SF): Second Urban Development 6. Loan No. 1260-PAK(SF): Urban Water Supply and Sanitation
6. The World Bank 1. Lahore Water Suppiy, Sewerage, and Drainage 2. Second Lahore Water Supply, Sewerage, and Drainage 3. Lahore Urban Development' 4. Karachi Water Supply 5. Karachi Special Developmenf 6. Punjab Urban Development' 7. Second Karachi Water Supply and Sanitation 8. Rural Water Supply and Sanitation
C. Japan 1. Rehabilitation of Water Treatment Systems, Karachi - Phase I 2. Metropolitan Water Supply Project in Kharpur - Phase I 3. Metropolian Islamabad Water Supply Project - Phase I 4. Rehabilitation of Water Treatment Systems, Islamabad - Phase
II 5. Metropolitan Islamabad Water Supply Project - Phase I I 6. Rehab. of the Water Treatment Plant in Islamabad - Phase I 7. Rehab. of the Water Treatment Plant in Islamabad - Phase I I 8. Karachi Water Supply Improvement Project 9. Metropolitan Water Supply Project
D. Kuwrlt 1. QuettaGwadar Potable Water Supply
E. United Kingdom 1. Second Karachi Water Supply and Sanitation
Subtotal ( I )
II. GRANTS A. UNDPAJNICEFMRIO
1. Rural Water Supply and Sanitation (UNICEF)
B. European Economic Communlty 1. Balochistan Water Supply - Phase II
22.00
39.50
55.20 85.00 66.00 72.00
1.80 26.60 16.00 25.00 70.00 90.00
125.00 136.70
10.78 115.95 92.04 10.62
42.28 8.60 9.20
95.41 53.26
16.00
187.50' 1,472.44
34.20
9.11
&I1976
December 1977
October 1986 December 1989 December 1989 November 1993
1967 1976 1982 1983 1987 1988
1991 imi
1989 1989 1990 1990
1991 1991 1992 1995 1996
1983
1990
1 992
1987

Executive Summery : , &*,,..
. . . . . . . . . ., .. i . I . . , .:. . . : I . :. . . . . ..
. .
L
. . . . .
APPENDIX 3 DetaHd Profsclt CTornpcwnt Description
. . . :.,: . . . . , :
. .
. . . . . . . . +m,, R e n & w m - .. .
. :... . . .' i. .: . . ....,.

Ouena WSE - Final ReDort. Executive Summarv ADDendix 3 / Paae 1
APPENDIX 3 : DETAILED PROJECT COMPONENT DESCRIPTION
1. Overview
In accordance with the requirements of the Terms of Reference and the Bank's sector goals in the area, the Project preparation TA enhances
9 sound development of water resources management; and sustained improvement of social infrastructure and environment.
Its overall purpose is the planning of a Project for possible Bank financing, embedded in an economically viable and sustainable program for the management of water resources in the Quetta Basin, and the identification of least-cost solutions for the city's water sup- ply, sewerage, drainage and solid waste disposal.
Achievement of the Project's primary objectives by conservation and development, in- cluding those technical, institutional and social measures necessary to secure and im- prove the water supply and sanitation of Quetta City and surroundings, requires both a comprehensive approach and a high degree of coordination among constituent actions and interventions. Because many proposed actions are mutually dependent, Project suc- cess requires integrated and carefully sequenced implementation of project components.
In the short-range, the immediate objective of the ensuing Project proposed for Bank fi- nancing is to arrest and stabilize the decline of service levels and urban environmental quality through a Phase 1 program to restore failing infrastructure required to sustain the city for the next 5 to 10 years. This scenario, with a planning horizon of 2005, includes implementation of those components that provide necessary and logical first steps toward longer-term solutions. Depletion of the alluvial aquifer will continue, but the collective im- pact of proposed measures will slow the process and provide time for the preparation of more sustainable solutions and implementation of urgent institutional improvements.
The envisioned overall Project includes the major sectoral implementation packages and the supplementary package of supporting components, as well as the anticipated institu- tional, financial, environmental, and participation component packages. Requirement and realistic possibilities to combine these interrelated components in order to prepare a proj- ect package for sustainable water supply and environmental protection have been ad- dressed in the Interim Report. Results were further processed during the second Phase of the consultant's assignment, and are laid out in the present Final Report.
Following the comments on the Draft Final Report principal decisions on the further course of the implementation program were made. A summary of the selected project op- tions and supporting components is given in the following Table 1. Subprojects proposed for ADB funding in the first implementation phase are highlighted. The relevant compre- hensive program is further addressed in Chapter 11 below. Detailed descriptions of all components are compiled in the relevant Sector Reports submitted under separate cover.

Ouetta WSE . Final ReDort. Executive Surnmarv ADDendix 3 I Paae 2
Code
A. WATER
WS/C/I 01 A
WS/C/103A
WS/P/I 12
TABLE 1 : OVERVIEW OF PROJECT COMPONENTS
Description Duration Base Cost' US$
RESOURCE INVESTIGATION
Consulting Selvices for Evloration 07/00 - 12/01 659.800 of New Groundwater Resources Hydrologyand Soil-mechanical Tests 1 O/OO - 03/01 192.200 for Kuchnai Dam Scheme (1 st campaign) Eqloration Well Drilling 10/00- 12/01 2.110.122
TOTAL A 2.962.1 22
B. PHASE I IMPLEMENTATION
WATER RESOURCE DEVELOPMENT I
WS/C/101 B Consulting for Well Rehabilitation WS/C/IOPA Consulting for Well Construction L2 and L3 WS:P:111 Well Rehabilitation in the Quetta Valley WS/P/1 13A Well Construction L2 and L3
Subtotal
WATER SUPPLY
WS/C/I 05 WS/C/106 WS/P/I 15 WS/P/I 16
Consulting for System Rehabilitation Consulting for Water Supply Evansion I Water Supply Rehabilitation Project Water Supply Evansion Project I
Subtotal
WASTEWATER DISPOSAL
WW/CROl W I P E 1 1
Consulting for Wastewater Project I Wastewater Disposal Project I
Subtotal
URBAN DRAINAE
DF/P/312 Supply of Drainage Wintenance Equipment Subtotal
SOLID WASTE DISPOSAL
SW/P/411 SW/P/412
Initial Construction of Sanitary Landfill Supply and Installation of Equipment
Subtotal
TOTAL B
01/01 - 12/03 07/01 - 12/02 04/01 - 12/03 07/01 - 12/02
01/01 - 12/05 01/01 - 12/05 01/02 - 12/05 01/02 - 12/05
01/01 - 12/05 0 1 /02 - 12/05
01/02 - 06/02
01/02 - 12/03 01/02 - 06/03
308.500 549.300
1.589.352 1.005.062 3.452214
444.259 1.612.458 5.923.450
21.499.438 29.479.605
1.496.1 44 19.948.1 90 21.444.334
614.200 614.200
1 .I 61 .850 856.000
2.01 7.850
57.008.203

Ouetta WSE - Final Reoorl. Executive Sumrnaw ADDendix 3 I Paae 3
Table 1 : OVERVIEW OF ADDITIONAL PROJECT COMPONENTS (CONTINUED)
Base Cost' uss
1.073.720
101.700
502.531 1.81 8.556 1.214.037 4.710.544
2.192.312 4.628.721
29.230.830 61.716.280 97.768.143
1.797.287 1.622.383
23.963.834 21.631.770 49.01 5.274
2.535.000 885.450
2.238.750 11.806.000 29.850.000 47.31 5.200
198.809.1 61
Code Description
D. ADDITIONAL LONG-TERM PROGRAM I
WATER RESOURCE DEVELOPMENT
WS/C/102B
WS/C/103B Hydrology and Soil-mechanical Tests
WS/P/113B Well Construction L1 WS/P/l l4
Consulting for Well Construction L1, 21, 22
for Kuchnai Scheme (2nd campaign)
Well Construction 21 and 22
Subtot;
WATER SUPPLY
WS/C/107 WSICI108 WS/P/117 WS/P/l l8
Consulting for Water Supply Expansion II Consulting for Water Supply Expansion 111 Water Supply Expansion Project II Water Supply Expansion Project Ill
Subtot:
WASTEWATER DISPOSAL
WW/C/202 WW/C/203 WW/P/212 Wastewater Disposal Project I1 WW/P/213 Wastewater Disposal Project 111
Consulting for Wastewater Project II Consulting for Wastewater Project 1 1 1
Subtota
DRAINAGE AND FLOOD CONTROL
DF/P/311 Initial Maintenance 8 Rehabilitation Program DF/C/303 DF/C/304 DF/P/313 DF/P/314
Consulting for Drainage Project II Consulting for Drainage Project 111 Drainage 8 Flood Control Project II Drainage 8 Flood Control Project Ill
Subtota
TOTAL 0
Duration
01/05 - 12/10 intermittent
01/11 - 12/11
01 /05 - 12/05 01/05 - 12/06 01/10- 12/10
01/06 - 12/10 01/11 - 12/17 01/07 - 12/10 01/12- 12/17
31/06 - 12/10 31/13 - 12/17 31/07 - 12/10 31/14 - 12/17
36/01 - 12\03 31/06 - 12/10 31/12 - 12/16 31/07 - 12/10 31/13 - 12/16

Quetta WSE - Final ReDOrt. Executive Surnmarv ADDendix 3 I Paae 4
2. Resource Development
The detailed designs for the rehabilitation of existing wells tapping the alluvial aquifer, ex- ploration of new groundwater sources (limestone aquifer) and preliminary designs for new well fields, each with costs estimates are provided. With the specified rehabilitation measures and the accompanying execution of consulting services, further additional drawdown in the existing wells of BWASNPHED can be avoided. An adequate exploita- tion of these wells, corresponding to the hydrogeological boundary conditions of the well site and the well hydraulics under economic pumping costs, can be achieved.
The implementation of production wells, including consulting and contractor services for the exploration of the limestone aquifer is described in the following. With these described measures, the sustainable development and management of currently and future utilized groundwater resources can be achieved. Locations and the programmed coverage of water demand are illustrated in Figures 1 and 2 at the end of this section.
The project implementation is split into three phases, comprising the following project measures:
Water Resource Investigation - ADB Project
hydro-geology and soil-mechanical test for Kuchnai Dam - WS/C/103A exploration of new groundwater resources - WS/P/112
Phase I - ADB Project
rehabilitation of existing wells - WS/P/111 well field construction of well fields L2 and L3 - WS/P/ll3A
Phase II - Medium-Term Project (not part of ADB financing)
well field construction of well fields L1 and 21 - WS/P/I 138 and 11 4A
Phase Ill - Long-Term Project (not part of AD6 financing)
well field construction of well field 22 - WS/P/1146
The location of the exploration targets and the new proposed water resources is illus- trated in Figure 1.
2.1 Phase I - ADB Project
2.1.1 Water Resource Investigation
The incorporation of a surface water scheme at Kuchnai is envisaged for the coverage of the water demand for Quetta.
For the proposed dam and catchment no specific hydrological, or meteorological data are yet available. The final determination of the yield of the dam and the conceptual design of a combined system will be possible only after evaluation of results from a multi-annual measuring and monitoring campaign which will also be beneficial to other components of the proposed Quetta Water Supply Expansion Project. In order to conduct the planning

Quetia WSE - Final ReDOrt. Executive Summaw ADDendix 3 I Paae 5
and implementation of a hydrological monitoring program and execution of soil- mechanical tests in preparation of Kuchnai Dam Water Supply Scheme, Quetta.
However, rough assessments of flows, sedimentation and underground conditions have been made in the scope of a Feasibility Study for Flood Protection of Hanna-Urak Valley by NDC, 1988. The interpretation of these results allows tentative assessment of proper- ties and costs of the proposed scheme. Relevant provisions for physical implementation have been made under Contract Package WS/P/118.
For the necessary detailed investigations, a first campaign (review of related data, im- plementation of hydrometrical and meteorological recording stations, interpretation of soil- mechanical investigations, regular collection, systematic processing and filing of recorded data) and a second campaign (evaluation of collected data material, and conclusive re- porting on hydraulic, hydrological and soil-mechanical parameters, to be used in the final design and tendering of the works for rehabiIitation/construction of the relevant compo- nents of the water supply scheme) is proposed for inclusion into the package of possible Bank financing:
The services will be executed in 2 lots from January 2001 to June 2001 and from January 201 1 to December 201 0 (see attached Implementation Schedule)
Further investigations are proposed for the development of groundwater resources. The Exploration Program for the Limestone Aquifer and for the Zarghoon Range will comprise the tendering, supervision and execution of geophysical campaigns and test wells. The assessment of the groundwater potential of the limestone aquifer and the Zarghun range, will be finalized. The results from the investigations will be incorporated in the existing groundwater model. Recommendation of the final design for the implementation of pro- duction wells and well fields in the conglomeratekandstone aquifer will be provided.
The scope of the works for the exploration and test well drilling in the limestone aquifer (Quetta Valley) and the conglomerate aquifer (Zarghoon Range) is defined in the follow- ing:
Exploration Program for the Limestone Aquifer execution of a geophysical exploration campaign (electromagnetic survey with the GENIE tool) in order to detect the structure of the limestone aquifer and delineate faulVfracture zones (1 60 line km). drilling of 30 test wells (combined rotary and hammer drilling) to an average depth of 250 m (incl. development, pumping tests, sampling/analyses of physico-chemical parameter and isotope composition of groundwater and to- pographical surveys) in identified target areas, according to the geophysical survey. Execution of long-term pumping test on the existing BWASA wells (1080 h) with recovery observations (120 h). During pumping tests in test wells and existing wells, the recording of the groundwater level in surrounding production wells (if present in both the limestone and the alluvial aquifer) is foreseen.
Exploration Program for the Zarghoon Range execution of a geophysical exploration campaign (electromagnetic survey with the GENIE tool) in order to detect the structure of the conglomer- atekandstone aquifer and delineate joint'faulVfracture zones (240 line km). drilling of 60 test wells (combined rotary and hammer drilling) to an average depth of 250 m (incl. development, pumping tests, sampling and analyses of

Quetta WSE - Final ReDon. Executive Summarv ADDendix 3 / Page 6
physico-chemical parameter of groundwater and topographical surveys) in identified target areas, according to the geophysical survey. Supply and installation of V-notch measurement weirs on springs for the im- plementation of yield measurements (1 5 units)
2.1.2 Rehabilitation of Existing Wells
In the frame of the rehabilitation program for existing BWASNPHED wells, the supply and installation of piezometers, water meters and rising pipes for submersible pumps will be provided in a first step. Thereafter, pumping test will be executed in the wells. In a final step, new submersible pumps will be supplied and installed in the wells.
Rehabilitation measures supply and installation of water meters (100 units), piezometers (900 m) and rising pipes with threads (6300 m) in existing wells performance of step-drawdown pumping tests (3600 h) in existing wells with recovery observations (1 200 h) supply and installation of submersible well pumps (55 units) supply and installation of electrodes in the well to secure a automatic shut- down of the well (100 units)
2.1.3
The preliminary defined scope of the works for the implementation of production wells for the exploitation of groundwater resources in the limestone aquifer (Quetta Valley) is listed in the following:
Development of New Well Fields
Implementation of Production Wells in the Limestone Aquifer (WSIPIl 13A) drilling of 20 production wells in the well fields L2 and L3 (combined rotary and hammer drilling) to an average depth of 300 m (incl. development, pumping tests, sampling/analyses of physico-chemical parameter and isotope composition of groundwater and topographical surveys) in identified well fields, according to the exploration program. supply and installation of submersible pumps, rising pipes and wellhead con- structions (20 units)
2.2 Phase II - Medium Term Project
2.2.1 Water Resource Development
The preliminary defined scope of the works for the implementation of production wells for the exploitation of groundwater resources in the limestone aquifer (Quetta Valley) and the conglomerate aquifer (Zarghoon Range) is listed in the following:
Implementation of Production Wells in the Limestone Aquifer (WS/P/113B) drilling of 10 production wells in well field L1 (combined rotary and hammer drilling) to an average depth of 300 m (incl. development, pumping tests, sampling/analyses of physico-chemical parameter and isotope composition of groundwater and topographical surveys) in identified well fields, according to the exploration program.

Ouetta WSE - Final ReDOrI. Executive Sumrnarv ADDendix 3 / Page 7
supply and installation of submersible pumps, rising pipes and wellhead con- structions (1 0 units)
Implementation of Production Wells in the Zarghoon Range (WS/P/l14A) drilling of 40 production wells in well field Z1 (combined rotary and hammer drilling) to an average depth of 300 m (incl. development, pumping tests, sampling and analyses of physico-chemical parameter of groundwater and topographical surveys) in identified well fields, according to the exploration program. supply and installation of submersible pumps, rising pipes and wellhead con- structions (40 units)
2.3 Phase 111 - Long Term Project
2.3.1 Water Resource Development
The preliminary defined scope of the works for the implementation of production wells for the exploitation of groundwater resources in the conglomerate aquifer (Zarghoon Range) is listed in the following:
Implementation of Production Wells in the Zarghoon Range (WS/P/1148) drilling of 30 production wells in well field 22 (combined rotary and hammer drilling) to an average depth of 300 m (incl. development, pumping tests. sampling and analyses of physico-chemical parameter of groundwater and topographical surveys) in identified well fields, according to the exploration program. supply and installation of submersible pumps, rising pipes and wellhead con- structions (30 units).


3. Water Supply
The implementation of the rehabilitation and expansion programme of the Quetta Water Supply up to the year 2020 represents a construction project of great magnitude and in- volves large investments of capital funds. Although there is a pressing need for the im- plementation works of this study throughout the inhabited areas, the need is greater in some areas and less in others. For this reason and the limited availability of funding it is prudent to construct the works in several stages, which are listed below up to the year 2020. The project has been split into three stages of implementation,
Phase I - ADB Project
rehabilitation of existing assets - WS/P/115 expansion of the system to the requirement up to the year 2005 - WS/P/116
Phase II (medium term project, not part of ADB financing)
expansion of the system to the requirements up to the year 201 0 - WS/P/i 17
Phase Ill (long term project, not part of ADB financing)
expansion of the system to the requirements up to the year 2020 - WS/P/118.
In the following sections the project corriponerits are listed in more detail. Figure 3 at the end of this section provides a general view of the proposed development.
3.1 Phase I - ADB Project
3.1.1 Rehabilitation Project - WS/P/115
It is proposed that the works shall be implemented until 2005. It shall be noted that the rehabilitation of wells and replacement of submersible pumps is dealt with in the water resources section of this document. The rehabilitation project under this topic will com- prise of the following tasks:
. Rehabilitation of the existing ground reservoirs located at the well field sites and within the distribution system of BWASA, comprising the cleaning, minor repairs, installation of water level indicators. Installation of disinfection equipment at water production sites. Improvement of roads and construction or rehabilitation of boundary walls at well field sites. Rehabilitation of pumping stations located at the well field sites and within the BWSAS distribution system. Installation of water meter devices on delivery pipes from the well field to the re- ceiving reservoirs in town. Rehabilitation of the existing BWASA city wells, comprising of water meter instal- lation and rehabilitation of well houses. Installation of approximately 65 nos. water meters at PHED wells. Construction of additional elevated storage facilities in the distribution system. Construction of disinfection facilities at the production sites.
. .
.
.
.
. . .

Quetta WSE - Final ReDOrt. Executive Summarv ADDendix 3 / Paae 10
. Restructuring of the existing distribution system, including rehabilitation and re- placement of existing pipes and valves. In the framework of this task the replace- ment of distribution pipes of 81 km is proposed. Installation of metering devices in the distribution system in the existing five zones is proposed. Installation of individual water meter at existing house connections of approx. 45,000 water meter. Provision of tools and material for pipe repair and emergency works within the primary and secondary system.
.
.
.
3.1.2 Expansion Project - WS/P/116
The expansion works proposed under this section shall be implemented until 2005. These works mainly comprise works to connect the additional two new well fields to the existing water system. The expansion project will comprise of the following tasks:
. Development of the new Limestone well field 2+3 to a production capacity of ap- prox. 10.0 mio m3/yr, including the purchase of land and land development, road construction, disinfection equipment and staff housing. Provision of electrical supply to well field areas. Construction of pipelines within the well field, from the wells to the storage facility at the well field site. Construction of storage facilities of 4.600 m3 and 3.000 m3 capacity at the well field sites. Construction of DI primary mains from the new Limestone Well Fields into the de- mand areas of approximately 26.6 km, ranging in diameter from ND 200mm to ND 600mm. Construction of additional 25 elevated reservoirs, ranging from 50m3 to 1,100m3 storage capacity, equipped with water meter on outlet pipeline. Construction of approx. 311 km distribution network, ranging from ND 80mm to ND 200mm pipelines to serve additional population. Installation of additional house, yard and public tap connections in priority areas to expand the supply area of the system. The works comprise laying of about 166 km individual water connection pipes and installation of approx. 31,400 water meters for house, yard and public tap consumers.
. .
.
.
.
.
.
3.2
From 2005 to 2010 the population in the service area will grow by about 220,000 inhabi- tants. In addition to the population growth, about 100,000 inhabitants, presently served by other sources, are proposed to be connected to the public system. This results in a total connection demand of 320,000 inhabitants over five years. In order to accommodate the additional population water demand, the system needs further expansion in terms of source development, storage, transmission and distribution facilities. The project meas- ures until 2010 to provide the anticipated level of services will comprise of:
Phase I1 - Medium Term Project
. Expansion of the ground water production and treatment facilities from then (after completion of the WS/P/116 Project) 39.87 mio m3/yr to 52.87 mio m3/yr (devel- opment of the Limestone Well Field Area 1 and Zarghoon Range Area 1) and pro- vision of electrical supply to well field areas. Construction of pipelines within the well field, from the wells to the storage facility at the well field site.
.

Ouetta WSE - Final Report. Executive Summarv ADDendix 3 / Paae 11
3.3
Construction of additional 3,800 m3 and 7,400 m3 storage facilities at the new well field site. Construction of approx. 49.5 km of DI primary network, ranging in diameter from ND150mm to ND 800mm. Construction of additional 38 elevated reservoirs, ranging from 50m3 to 1,000m3 storage capacity, equipped with water meter on outlet pipeline. Construction of approx. 237 km distribution network. Construction of 177 km GI pipes for house, yard and public tap connections. Installation of approx. 35,000 nos. of house, yard and public tap water meter.
Phase 111 - Long Term Project
Until 2020 the population in the service area shall be about 2,000,000 inhabitants. The public water system shall provide services to about 1,795,000 inhabitants, connected to about 192,500 water connections. In order to accommodate the water demand require- ments of the water consumer, the system requires continuos expansion in terms of source development, storage, transmission and distribution facilities. In the following list- ing the proposed project measures of the long term project are listed:
. Further expansion of the water production and treatment facilities from 52.87 mio m3/yr to 90.95 mio m3/yr (comprising expansion of Zarghoon Range Well Field, Implementation of the Kuchnai Dam Project, incorporating irrigation wells into the distribution scheme). . Construction of pipelines within the well field, from the wells to the storage facility at the well field site. . Construction of the Kuchnai Dam and transmission main of ND 500mm with a length of 17.1 km. . Construction of a surface water treatment plant with a production capacity of ap- prox. 21,600 m3/d. . Construction of additional 5,800 m3 and 6,400 m3 storage facilities at the new well field site and terminal reservoirs for Kuchnai Dam site. . Construction of approx. 18.75 km of DI primary network, ranging in diameter from ND 300mm to ND 800mm. . Construction of additional 59 elevated reservoirs, ranging from 50m3 to 1,200m3 storage capacity, equipped with water meter on outlet pipeline, . Construction of approx. 520 km distribution network. . Construction of 407 km GI pipes for house, yard and public tap connections. . Installation of approx. 80,000 nos. of house, yard and public tap water meter.


Quena WSE - Final Renort. Executive Summaw ADoendix 3 / Paae 13
Component
Staff cost Administration cost Maintenance cost Cost for consumables
4. Wastewater Disposal
The package proposed for Bank financing covers Phase 1 of the presented comprehen- sive scenario that is required for a sustainable development of water resources and sanitary conditions in the Quetta service area for the planning period. Associated detailed planning and implementation activities are expected to be continued in the subsequent Phases 2 & 3 under different funding arrangements. However, basic strategies and out- lines of the final scheme have to be considered already at the start of the program as major components are designed for ultimate capacity requirements during their useful lifetime.
Operation Cost Operation Cost Operatlon Cost 2006/10 2011117 from 2018 USYyr usuyr us* 61,403 77.500 88.700 18,420 23.250 26.610
143,176 265.817 382.300 6,075 10.125 14,075
Implementation
Estimated gross implementation costs for the wastewater component come to:
Phase 1 Phase 2 Phase 3
US$ 28,426,171 .-
US$ 30,825,272.- us$ 341 413,463.-
In the Tables below details of these total investment costs for Phase 1 (present project) of measures to be implemented in 2001/05, Phase 2 (2005/10) and Phase 3 of measures to be implemented after 201 0 are compiled.
Energy c.ost I 19.900 I 37.055 I 76.51 1 Total 248.971 413.747 588,196
4.1 Phase I - ADB Project
In accordance with the descriptions set forth in the relevant Sector Report, the program will include the following components:
WW/C/201 Consulting Services for Engineering Design and Construction Supervision of Quetta Sewerage Project I Implementation: January 2001 - December 2005
Quetta Sewerage Project I - Rehabilitation of existing wastewater disposal facilities and construction of new sewers, house connections and treatment plant, Phase I Implementation: January 2002 - December 2005
Base cost: US$ 1,994,819.- WW/P/211
Base cost US$ 19,948,190.-

Components and quantities are further listed in the overall cost estimates attached below. Figure 4 shows the proposed layout of the scheme. The following cost summary gives an indication of the overall scope of work necessary to obtain the required environmental im- provements, as well as the quantities of treated wastewater:

Quena WSE - Final Report. Executive SurnrnarV ADDendix 3 I Paoe 15
Table 3 : TOTAL INVESTMENT COST (PHASE 1)
Quetta Wate r Supply and Envlronmental Improvement Project Connwlltd popLlalion 343.800. Wasleaaler Cnlleclioll. 91,505 m'id i 11.65 m3!y
PHASE 1 (lIIIZW5)
(Basis USS 199! PERCENTAGE
Component UNIT AMOUKI USS
OF TOTAL NET PRICES
OUANTIN
SEWERAGE N€TWORK
€ail wrk
Rehabilblior. and cleaning of siistinp sewer6
Primary syslam (incl transmisstor: main)
Secondary system
Transmission main
Home c~nns~llOnS
Pump8ng sla11ons
Stormwater ov~1rllows
SUB-TOTAL CIVIL WORKS
FnuiDmenl E$b!
Pumping stillbuns
SUB.107 AL €OUIPMENT NETWORK
WASTEWATER TREATMENT PLANT
Civil works
Equipmerit EAM
Land acquisllmn
SUB-l0TAL WASTEWAlER TREATMEN7 PLAN'
SUB TOTAL (Sewerage and treatment plant)
lrrrnp sum
m
m
m
U
U
U
1
24.850
154 100
0
29 wo
0
0
142000
3 604.990
6 472 200
0
3 045 000
0
0
13 264 190
0.7%
18.1 '1.
32.4%
0.0%
15.3%
0.0%
0.0%
66.5%
lump sum
.I::,; : .,'11
0
1
4100(10 --
lump sum
lurrip bum
ha
--
G0C.l OOO
213ooO
0
6 274 WO
19,948,190
1
1
8n.o
30.4%
1.1%
0.0%
31 ,5%
OTHER WORKS
PART Clvll Works
PART Equlpmenl ELM
19325 190
623.000
96.9%
3.1%
SUE TOTAL (NET INVESTMENT COST) 19.948.1 90 100.0%
Engineerinp cosls
Physcal conlingencms I : 1.496 114
3.216.M6
7.5%
16.1%
SUE TOTAL (GROSS INVESTMENT COST) WITHOUT VATlPRlCE CONTING 24.660.950 123.6%
17.3%
140.9%
3.452.533
28.113.483
VAT (for gross Investment cost wllhoul land coal)
SUE TOTAL [GROSS INVESTMENT COST) WITH VATIWITHOUT PRICE CONTING.
14%

Ouetta WSE - Final ReDOrt, Executive Summaw AoDendix 3 I Paae 16
4.2
Table 4 :
Phase II - Medium Term Project
TOTAL INVESTMENT COST (PHASE 2)
Quena Water Supply and Environmental Improvement Project Conneclad population: 267.000: Waslewaler CoIIecIiovI' 24.785 ma:d i 9 05 m'?p (in addam ID PI:ase 11
PHASE 2 (Ill1 2010)
Component UNIT QUANTITY AMOUHT USS
SEWERAGE NETWORK
Rehabiltlalion and cleaning 01 erislinp sewers
Primary system
Secondary splm
Transmission maYl
no115e COnneCtlOnS
Pumping sla11ons
Stormwafer ovedlows
SUB.TOTAL CIVIL WORKS
! ';."L."'"! UL4
PUr"pl"Q SlatlonS
Cars. niacliines
<lJB-TOTAL EOUIPME NT NETWORK
WASTEWATER TREATMENT PLANT
^Wd works
Equipment EBM
.and acquisaon
SUB-TOTAL WASTEWATER TREATMENT PLAN
SUB TOTAL (Sewerage and lrenlmenl plant)
0
35 250
331.9W
0
32 7Do
0
0
lump sum
m
m
m
U
U
U
0
2 534.700
13.9:19 800
0
3 4.13.5w
0
0
19 908 000
0
$0 wo
90 OW
3 263 705
714 129
588 ow
3 %S 834
23.965.834
0.0%
10.8%
58.2%
0.0%
14.3%
0.0%
0.0%
83.1%
0
1
0.041
0.4%
0.4%
lump sum
lump sum
ha
1
1
14.7
13.6%
0.5%
2.5%
16.5%
1 w.c%
ITHER WORKS
I I 23.171 705
204,129
'ART Clvll W o r k 96.7%
0.9% 'ART Equlprmnt EdiM
I I
23.963.834 1 OO,O% SUB TOTAL (NET INVESTMENT COST)
:npmeering cosls lump sum 1
'hyscal coritinuencies lump Sum 1
7.79: 288
3 864.168
7.5%
16.1%
SUB TOTAL (GROSS INVESTMENT COST) WITHOUT VATIPRICE CONTING 29.625.290 123.6%
IAT 14X
iUB TOTAL (GROSS INVESTMENT COST) WITH VATIWITHOUT PRICE CONTING.
4.147.541
33.772.830
17,3%
140,9%

Ouelta WSE - Final ReDOrt. Executive Suinrnarv ADDendix 3 / Paae 17
4.3 Phase 111 - Long Term Project
Table 5 : TOTAL INVESTMENT COST (PHASE 3)
Ouena Water Supply and Envlronmental Improvement Project Cunnecled population 353.900. Wastewater collection 33.285 m'id i 12 15 m'iyr l1>11 2020, in addaion lo Phases 1&?)
PHASE 3 (after 2010)
Component UNIT QUANTITY AMOUNl U S
OF TOTAL NET PRICES
SEWERAGE NETWORK
!h!LwXb
fishabiliiafion and claaning 01 erislirig sewers
Primary system
Secondary syslam
Trarismission main
House COllnBC1Y)nS Ill11 201 7)
Pumping atalans
Slorinwaler wal l lows
?c!E!z!E_c.'vn.wonlc_s . . -- . ..
b n o ' , ; u
Pumpinp stakns
Cars, machines
SUB-TOTAL EOUIPMENl NETWORK
*ASTEWATER TREATMENT PLANT
:Nd wurks
Fquipmwnt EBM
.and acquisillon
SUB-TOTAL W A S T W A l ER TfiEATMENl PLAN
iUB TOTAL (Sewerage and treatment plant)
lump sum
m
m
m
U
U
U
0
16450
214 000
0
32 000
0
0
0
1168.275
8 988.000
0
3 3w.000
0
0
13516,275 . ..
0.0%
5.4%
41.5%
0.0%
15.5%
0.0%
0.0%
62.5% -
0
0
0
370 000
370 000
0.0%
1 .7%
1.791.
1
1
54.7
5 383 1 9 0
174 305
2 leaooo
7.745 495
21.631.770
24.90,.
0.0%
10.1%
35.8%
1w.0x
2THER WORKS
lR.898 465
544 305
87.4%
2.5%
'ART Clvll W o r b
'ART Equlpment E I M
SUB TOTAL (NET INVESTMENT COST) 21.631.770 100,096
inginearinp cos16
'hysical conlingencms
1 622 383
3.488.1 23
7.5%
16.1%
SUB TOTAL (GROSS INVESTMENT COST) WITHOUT VATIPRICE CONTING 26.742.276 123.6%
/AT 14%
iUB TOTAL (GROSS INVESTMENT COST) WITH VATAYITHOUT PRICE CON.
3.743.919
30.486.194
17.3%
140.9%

Quetta WSE - Final ReDOrt. Executive Surnmarv Aooendix 3 I Paae 18
5. Drainage
5.1 Prioritization of Subprojects
The priority program for the Drainage Sector has been developed to meet local require- ments, reflect operational capabilities, and complement existing facilities in a scope and form compatible with the financial and administrative resources of the local government. Subsequently, medium and long-term programs are envisaged, that focus on expansion and improvement of the existing scheme in order to complete area coverage and add to the capacities of strategic recipient drains. Proposed works serve both, the swift and harmless discharging of stormwater run-off from congested urban areas, and an eco- nomical utilization of the potential for groundwater recharge in locations at the periphery.
The following implementation program is proposed:
Phase I - ADB Project
Phase 1 - Drainage Maintenance and Rehabilitation
Phase II (medium term project, not part of ADB financing)
Phase 2 - Expansion of the Urban Drainage System
Phase Ill (long term project, not part of ADB financing)
Phase 3 - Drainage and Flood Control Scheme for Peripheral Areas
This phasing takes into consideration that the drainage development plan cannot be im- plemented at once and will not be successful unless the proposed water supply, sewer- age and solid waste disposal components of the project take effect. However, the re- quired comprehensive approach in the water supply and sanitary sectors also implies that immediate measures have to be taken to make full use of existing assets, and to estab- lish the operational routines necessary to protect future investment.
Therefore, the project preparation for possible Bank financing puts an emphasis on the first phase maintenance and rehabilitation requirements of Quetta’s stormwater drainage system.
5.2 Phase I - ADB Project
5.2.1 Drainage Maintenance and Rehabilitation
This sector component is proposed to be included in the Phase 1 overall implementation program under AD6 loan. It comprises of two project packages - one for initial cleaning and system rehabilitation by contractors (financed through local funds) , and the other one for the supply of machinery and equipment to support QMC’s Sanitary Section in es- tablishing and maintaining effective maintenance routines (AD6 financed).

Ouena WSE - Final ReDOrt. Executive Summarv ADDendix 3 I Paae 19
- ITEN No.
1
2 3 4
5
- -
-
- 6
7
- a -
9
- 12
- 13
a) Supply of Machinery and Equipment - DF/P/312 The contract covers the provision of general and special equipment to support and im- prove working methods and progress in routine and corrective drainage maintenance by QMC Sanitary Section. A list of required equipment is compiled in Table 6 below.
Table 6 DRAINAGE MAINTENANCE MACHINERY AND EQUIPMENT
DESCRIPTION
Front wheel loader and back hoe
Skid steer loader Dump truck - diesel engine Double-cabin pick up truck
JETTING TRUCK: High-pressure cleaning vehicle with adjustable 5m' water and sludge tanks. including multi-piston high pressure pump (80-120 bar), hose on reel min.100m with direct and reverse jet headlcleaning torpedo; sludge suction pump and discharge ap- pliances; incl. all attachment for eflective operation: Set of spare parts for min. 2000 hours' maintenance Set of sewer rods of oil tempered steel. min. 6mmll.50m. single sections with snap-lock couplings; complete set incl. 20 Num- bers. 1.50m sections. auger head, general purpose head, root retriever. and tee handle; Spares incl. 10 Numbers. 1.50 m sections, 1 No. auger head, 1 No geiieral p:tpcse C8i.;itl. 1 NC roo1 I utter, 1 Nc t m Iurning t16ndle
Rotary cleaning machine for pipe drains up to ND 600mm; petrol driven; with attachments and spare parts for 1500 hours of op-
.
aration Set of "non clog" dewatering pump and petrol generator 2.5 kw;
iAND TOOLS AND EQUIPMENT Mat axe (Pulaski Tool) Pack of 6. complete with leather sheaths Double kit. crown panern axe Heavy duty lopper pack Single edge bush hook - Carton of 4 Long handle square nose shovel Pack of 6 Long handle round nose shovel, Pack of 6 1/2 inch (12 mrn) x 600 fi bullrope coil (appr. 183 m) Mechanic's metric tools in too1 box Loosening chain 20 m Wheelbarrow, appr. 100 I Set of moveable dumping frame 2.50 x 1.50 x 0.30 m high of wooden planks 25 mm; with steel end connectors combined with stands for road barriers
SAFETY EQUIPMENT Set of road security equipment incl. min.
6 Numbers. road barriers with stands 12 Numbers warning cones 2 Numbers traffic signs ' no entry" no stands
2 Numbers. tratfic signs '"direction' on stand
jet of protective clothing incl. steel capped rubber boots helmet warning waist coat
ieavy duty gloves
QTY
1
1 2 1
1
1 set
.- - 1 set
1 set
1
1 1 1 4
4
1 1 2
24 6
6 sets
REMARKS
e.g. CAT 926
e.g. Sperry L-455 approx. 150 HP e.g. Toyota
e.g. Eichhotf, FRG
SchaeW HT12
e.g. Mc Mater-Carr. USA
e.g. Eichhotf, FAG

Ouena WSE . Final Rewort. Ekecutive Summan, ADDendiX 3 i Paae 20
b) Drainage System Rehabilitation - DFIPI311 Main objectives of this component are the restoration and improvement of discharge ca- pacities of the existing drainage system, incl.:
thorough initial cleaning, de-silting and removal of debris; comprehensive rehabilitation to full and consistent flow capacity of existing drains and open sewers according to original design; systematic removal of bottlenecks and missing links; reconstruction of damaged drain sections; rehabilitation/construction of curb inlets, culverts and other related structures, as well as relocation of existing facilities and road reinstatement; and establishment of workshop and storage facilities
The project is to be carried out under contract with QMC, with a view to future continua- tion of routine services by their Sanitation Section. Initial engineering and contract man- agement support is rendered through PMU advisory services in the scope of the overall Project. Detailed work items are locally defined by the contract manager/engineer, fol- lowing each drainage subsystem from the point of discharge in upstream direction, and subsequently recorded in the relevant design and contractual documents. The scope of work includes:
cleaning of 150 km micro drains; 100 km small drains up to 0.50 m depth; and 75 km larger open drains and buried conduits; repair and systematic reinstatement of function incl. construction of curb inlets, of 50 km micro drains; 30 km small drains; and 10 km larger open drains, cul- verts and buried conduits; clearing and repair of 40 km main channels and natural drains; relocation of electrical, telecommunication, gas, water supply and sewerage facilities; and construction of workshop and storage facilities for the QMC drainage mainte- nance activities.
5.2
5.2.1
Phase 2 of the proposed drainage program envisages a major upgrading and expansion of facilities and the systematic improvement of overall capacity and functioning of Quetta's stormwater drainage scheme. Its feasibility implementation is strongly depend- ent upon the actual completion and function of measures carried out under the Phase 1 drainage, solid waste and sewerage/water supply program components. In the arid cli- mate, full drainage is only employed during short periods every year, once an environ- mentally and hygienically sound sewerage system is in place. Considering, furthermore, the aspects of financial tolerance as well as the local capacities to physically implement the major works simultaneously to water supply and wastewater disposal, Phase 2 drain- age is not included in the proposed regular program for immediate realization under the proposed Bank financing program. The concept and preliminary design presented hereunder are therefore regarded as an option for eventual execution under different or later funding arrangement.
Phase II - Medium Term Project
Expansion of the Urban Drainage System

Ouetta WSE . Final ReDOrt. Executive Surnrnarv Amendin 3 I Paae 21
Main Drains Stormwater drainage in the central parts of Quetta faces the problem of congested ur- banization, leaving little space for the construction of drains. This calls for small cross- sections hence sub-catchment areas, and accordingly, a greater number of collector drains. Main drains are therefore located in the bigger roads, with alignments that lead to the recipients on the shortest possible route, while following the natural gradient of the terrain. Following in general previous layouts determined by existing streets and devel- opment, the four QMC service zones are divided into 16 sub-catchment systems. Their locations are shown in Figure 4 below. Main features are as following:
Central Zone: Subcatchment System Drainage Area 580 ha Recipient Habib Nallah
Drain No. 2 and its tributaries serve the largest area. Its end discharge of approx. 18 m3/s calls for large cross sections along Zarghoon and White Roads. The smaller areas further north, Zarghoon Rd. to Share Iqbal, are served by drain No. 3 (4.3 m3/s) and No. 4 (5.9 m3/s) respectively. In view of the locations, closed conduits are required. Existing facilities are to be replaced.
Eastern Zone: Subcatchment System Drainage Area Recipient Habib Nallah
Dense development with narrow streets in Shaldara, Quaidabad, Tel Gom and Marriabad allows only small subsystems. Drain design has to allow for run-off from the Murdar Hill slopes. Predominantly covered drains are required.
Southern Zone: Subcatchment System Drainage Area approx. 600 ha Recipient Kasi Nallah
The service area includes Pashtunabad, Baluch Colony and Satellite Town till Baluch Bund and Kasi Nallahin the south. The best part of run-off from Pashtunabad is cought by the main drain of System No.1 in Islam Rd. in order to relieve drain No. 2 in Quarry Rd. where space is restricted System No. 1 discharges (26.6 m3/s design flow)into Kasi Nal- lah east of Jungle Bagh.. Kasi Nallah, regulated from the retention basin at Eastern By- pass till Sariab Rd., needs clearing/dredging from there to its confluence with Sariab Lora. Lower sections of main drain No. 1, west of Sariab Rd. are constructed as open channel; the bigger branches upstream have to be predominantly buried drains due to dense de- velopment along the route.
Western Zone: Subcatchment Systems Drainage Area approx. 850 ha Recipients
The service area is roughly delineated by Habib Nallah and Hudda village in the north, Sarib Lora in the west, Kasi Nallah and Kili Shaikhan in the south, and the railway and Sariab Rd. in the east. Development densities in the suburbs are lower than in the center,
Nos. 2,3 and 4
Nos. 5,6,7,8 and 9 approx. 31 0 ha
No. 1 with tributary drains
Nos. 10,11,12,13,14,15 and 16
Sariab Lora (10,11,12,13); Habib Nallah (14,15,16)

Quetta WSE . Final ReDOfl. Executive Summaw ADDendix 3 ! Paae 22
and due to the vicinity of recipients, subcatchment areas are small. Thus, a majority of drains can be constructed as open channels.
Secondary Drains Additional street-side micro drains are to be provided far collection of stormwater from the service areas - subject to the actual realization of the proposed Phase 1 program. They discharge via secondary drains into the main channels described above. Standard cross- sections of brick-lined channels have been adopted, with average clear dimensions width = 0.30 m, depth = 0.50 m. Total lengths of secondary drains and street-side gutters in the QMC service area are calculated at an average 420 m/ha - including existing facilities.
Table 7 DRAINAGE DEVELOPMENT PLAN - PHASE 2
DESCRIPTION
Front wheel loader and back hoe
Skid steer loader Dump truck - diesel engine Double-cabin pick up truck JETTING TRUCK: High-pressure cleaning vehicle with adjustable 5m3 water and sludge tanks, including multi-piston high pressure pump (80-120 bar), hose on reel min.100m with direct and reverse jet hcadlcleaning torpedo; sludge suction pump and discharge appliances; incl. all attachment for effective operation: Set of spare parts for rnin. 2000 hours' maintenance Set of sewer rods of oil tempered steel, min. 6mm/l.50m, single sections with snap-lock couplings; complete set incl. 20 Numbers. 1.50m sections, auger head, general purpose head, root retriever, and tee handle; Spares incl. 10 Numbers. 1.50 m sections, 1 No. auger head, 1 No. general purpose head, 1 No. root cutter, 1 No. tee turning handle
Rotary cleaning machine for pipe drains up toND 600mm; Detrol driven: with attachments and mare Darts for 1500 . . hours of opeiation Set of "non clog" dewatering pump and petrol generator 2.5 kw; incl. set of spare parts HAND TOOLS AND EOUIPMENT . Mat axe (Pulaski Tool)
. Double kit, crown pattern axe
. Heavy duty lopper pack
. Single edge bush hook - Carton of 4
. Long handle square nose shovel
. Long handle round nose shovel,
. 1/2 inch (12 mm) x 600 R bullrope coil (appr. 183 m)
. Mechanic's metric tools in tool box
. Loosening chain 20 m
.Wheelbarrow, appr. 100 I
. Set of moveable dumping frame
Pack of 6, complete with leather sheaths
Pack of 6
Pack of 6
2.50 x 1.50 x 0.30 m high of wooden planks 25 mm; with steel end connectors combined with stands for road barriers
QTY
1 set
1 set
1 set
1
1 1 1 4
4
1 1 2
24 6
REMARKS
e.g. CAT 926 Schaeff HT12
e.g. Sperry L-455 approx. 150 HP e.g. Toyota e.g. Eichhoff. FRG
e.g. Mc Mater-Carr. USA
e.g. Eichhoff, FRG

Odetta WSE - Final ReDOrt. Executive Summarv ADDendix 3 / Page 23
SAFETY EQUIPMENT Set of road security equipment incl. rnin. - 6 Numbers. road barriers with stands - 12 Numbers warning cones - 2 Numbers traffic signs
" no entry" no stands - 2 Numbers. traffic sians
- 12 6 sets
"direction" on s t a d 13 I Set of Drotective clothino incl. I S I
- steel capped rubber boots - helmet - warning waist coat heavy duty gloves
5.3
5.3.1
Major urban development will continue along the three axes Eastern and Western By- pass and Sariab Roads in the south, and between Chaman/Airport Road and Canton- ment in the north. West of the city, further urban expansion is anticipated in the area of Brewery Rd. and at the Air Force compounds along Samungli Road. With the increase of built-up land, surface run-off will rise - at the expense of local groundwater recharge. Comprehensive drainage and flood control, therefore, has to serve three functions:
Phase 111 - Long Term Project
Drainage and Flood Control in Peripheral Areas
conduct storm run-off from inhabited areas; prevent damages from mountain torrents; and enhance groundwater recharge from these rare discharges, in order to make up for reduced natural percolation due to the growing proportion of sealed surfaces .
These aspects have to be considered in the detailed design of the required bunds, basins and drains. Consequently, the relevant outline program for Phase 3 of the Project envis- ages the following components:
a) Northern Development Area South-west of Chaman Road it is proposed to upgrade the existing nallah from Askari Park to the confluence with Sariab Lora. As a main drainage channel (No. 23)', it will serve the entire area between Sarab Lordeaster Samungli Rd. and the Chaman railway line, including Kili Ismail, Kili Almo and the settlements all along till Airport Road. The ur- banizing zones along and north-east of Chaman Road - from Kifies Nawan, Kotwal and Muhamad Umar to the Kili Chashma road junction - will be served by two main drains (Nos. 24 Ei 25), that finally discharge into Hanna River. Eventual re-activation of the dis- used drain section from Kili Mili to Tarin Shahr is envisaged.
b) Western Area A main drain (No. 22), discharging into Sariab Lora, is required along Brewery Road to serve the developed areas up to Bolan Medical College and further till the sanatorium.
For Ghair Abad in the north and Kirani south of Brewery Rd., as well as for the smaller developments along Western By-pass, direct discharge from secondary drains into the nearby Sariab Lora is economical. It is assumed that the military maintain their own drainage arrangements (into Nahar Nala and Sariab Lora respectively) for the Air Force

Quetta WSE . Final Reuort, Executive Summaw AoDEndix 3 / Paae 24
complexes at Samungli. A matter of most serious concern is the potential flooding from Karakhasa Nallah. With a catchment area of 26.1 km’, this stream (No. 26), entering the Quetta valley at Murree Brewery, may bring devastating discharge if hit by a storm travel- ling in NNE direction. Particular attention has to be paid to that possibility during the final engineering design.
c) Southern Development Area The areas between Sariab Lora and the Murdar foothills south of Kasi Nallah have expe- rienced rapid development and are expected to urbanize further, with a concentration along the central axis Sariab Road, where also older establishments (e.g. Irrigation Col- ony; WAPDA; Polytechnic Institute) and settlements (Kambarani; Kechi Beg; Sariab; etc.) are found. Systematic drainage is absent, and the situation is worsened - especially for the new developments along the Eastern By-pass - by rare but quite severe flooding from the Murdar nallahs. The following main drainage systems have been projected for this area:
No. 18 Takhtani Canal to receive effluents from approx. 820 ha drainage area2 plus mountain run-off from some 9.81 km2 catchment of Takhtani Nallah and (the diverted) Shal Dara stream;
Hingi Canal, with 615 ha drainage area and 13.53 km2 external catchment of Hingi Nallah;
Rungi Canal, with 450 ha drainage area and 6.15 km2 external catchment of Rungi and Khakhuri Nallahs; and
Duni Canal, with approx. 410 ha drainage area and about 3.75 km’ external catchment of Dun1 Nallah.
No. 19
No. 20
No. 21
Proper function of these main drains needs the combined effects of flood-controlling delay action dams on each of the tributary nallahs; suitable self-cleaning contour channels to percolate slowly released discharges from the retention basin; and an appropriate secon- dary system. The channel itself is designed to accommodate base flow and surplus overtopping floods from the dam, and the stormwater run-off from the actual drainage area. Low design velocities in the unlined channel, eventually checked by gabion ground sills, enhance groundwater recharge, but provide also a safety margin for floods that are higher and run faster than anticipated. Implementation of the proposed site-specific sys- tems has to be preceded by an in-depth study of precipitation and probable flood dis- charges from Murdar nallabs, regulation of the further development in the planning area, and final engineering design with great emphasis on the hydraulic performance of all components including assessment of the local percolation parameters.
Overall, Phase 3 involves the construction of approx. 51 km of primary drains and canals; 5.3 km of major rehabilitation work in the Chaman Nallah; 7 flood retaining dams and ap- pertaining spreading channels; and eventually up to 900 km of secondary and micro drains. Costs depend largely on the final design of facilities; orders of magnitude are:
main drains 5.100 mio. US$ dams and structures 15.000 mio. US$ spreading channels 3.000 mio. US$ secondaw svstem 6.750 mio. US$
TOTAL 29.850 rnio. US$

Ouetla WSE - Final Rewrt. Executive Summarv ADDendix 3 I Pam 25
6. Solid Waste
Based on the staged proceeding addressed above, and on the urgent need for improve- ment, this sector component is proposed to be included in the Phase 1 overall imple- mentation program under AD6 loan. It comprises of two project packages - one for the engineering services and civil works (Stage I ) , to be contracted out, and the other one for the supply of machinery and equipment to support QMC’s Sanitation Section in estab- lishing and maintaining effective operational routines.
6.1
6.1.1
Phase I - ADB Project
Initial Establishment of Sanitary Landfill - SW/P/411
The proposed construction of a sanitary landfill site serves the objective of establishment of an environmentally acceptable central disposal facility for Quetta Municipality’s solid waste, and transfer of existing rubbish dumps to the controlled sanitary landfill.
The scope of work includes:
Construction and site development of 27.7 ha sanitary landfill, including ac- cess and internal roads; leachate control and treatment; initial gas collection system; offices, workshop and weigh bridge; and fencing, lighting and fire protection. Clearing of approx. 15 ha from open refuse dumps and transfer of materials to the adjacent new sanitary landfill.
The project is to be carried out by a contracting firm under QMC, with a view to future continuation of routine services by the QMC Sanitation Section. Engineering design and contract supervision is rendered by a specialized consulting firm and coordinated by the PMU in the scope of the overall Project.
Schedule of Work: - July 2001 - December 2003 (consulting services) - January 2002 - December 2003 (civil works)
6.1.2 Supply of Machinery and Equipment - SW/P/412
The envisaged supply of machinery and equipment for the Quetta solid waste disposal site includes the provision of heavy equipment, special machinery and tools to support operation and expansion of the sanitary landfill by QMC Sanitary Section. Tendering is effected through QMC/PMU
Description: 1 No. complete weigh bridge with control and monitoring facility 1 No. excavator 1 No. wheel loader 1 No. compactorldozer 2 Nos. water sprinkler trucks 1 set hand tools
Schedule of Supply: - January 2002 - December 2002 (equipment inc. tendering) - January 2003 - June 2003 (supply and installation of weigh bridge)


Ouella WSE - Final Rewrl. Executive Sumrnan Amendix 3 I Paoe 27
Base Cost' US$
780.000
276.000 786.000
320.000 106.000
446.000 348.1 17
780.000
3.842.1 17
7. Technical Assistance
ID/C/503
IDIC1504 ID/C/505
For detailed descriptions, reference is made to Appendix 5. The following Table 7 gives a summary of the required input, proposed in Phase 1.
Advisory Services for Financial 8 Commercial Management in BWASA Advisory Services for Project Implementation Advisory Services forpublic Works Technical Management 8 Operation Provincial Institutional Reforms Benefit Monitoring & Evaluation
Table 8 : OVERVIEW OF ADDITIONAL PROJECT COMPONENTS
CP/C/7Ol CP/C/702
CP/C/704
Code Description
Social Action Plan Public Awareness 8 Community-oriented Conservation Program Hygiene Education
TOTAL C
Ic. TECHNICAL ASSISTANCE
ID/C/501
ID/C/502
Duration
01/01 - 12/03
01/01 - 12/01 01/02 - 12/03
01/02 - 12/03 01/02 - 12/03
01/01 - 12/03 01/01 - 12/05
01/01 - 12/05


Appendlcea Executive Sumrnaiy
APPENDIX 4 Lessons Learnt from Previous Sector Projects

Ouetta WSE - Final Report, Executive Summary Appendix 4 / Page 1
APPENDIX 4 : LESSONS FROM PREVIOUS SECTOR PROJECTS
Problem Encountered
1. Delays in land acquisition
2. Late engagement of consultants
3. Slow progress of civil works due to late award of contracts and poor perform- ance of contractors
Counterpart funds not allocated on time 4.
5. User charge increases and rate ad- justments not implemented on time
6. Preparation and approval of the Planing Commission Proforma (PC-1) consider- ably delayed
7. Executing Agency (EA) management and PMU/PIU staff not adequately quali- fied to undertake the tasks assigned
Measures Taken for the Project
No additional land acquisition is required for the sewage treatment plant (already procured by BWASA), and sanitary landfill (procured by QMC). Land acquisition will be required for well fields in predominantly un-inhibited ar- eas.
Advance action for consultant recruitment is recommended.
Advance action by early consultant selection; adequate time allocations in program.
Government of Baluchistan has to provide written assurance to allocate counterpart funds through the Annual Development Plan sufficient for the full Project implementation period (36.85 inillion).
User fees to fully cover operation and main- tenance, and part of capital recovery costs shall be levied as soon as service is provided.
Draft PC-1 document has to be completed and submitted on time to the Government of Balochistan for endorsement. Federal Gov- ernment approval is to obtained.
Consulting services are provided under the Project to assist in developing the EA's im- plementation and operation methodology, and to provide other institutional strengthen- ing measures, including advice on drainage and solid waste components.

. . . . . . . . . . . . . .
EWuHvo-S\rmmaty . . . . . . . . I . , . . . . . . . . .
::. ,,; ' : ;: . .
. .
. . . . . . . . .
. . . . . . . . . . . . ' , . . . . . .
. . . . . . . . . . . . . .
. . . . , . . . .
. .
. . . . . . . . . . . .
. . . . . . . . . . . . . .
. , . . . .
. . . . . . . .
. . . . . . . . . .
. .
. . . . . . . . . .
. . . . . . . . . . . . . . .
. . . . .
. . , .
. . . . . . . . . . . . . ... . .
. . . . . . . . .
. . . . . , . . . . .
. . . . ' ! ' .
'. . . . . . .
. . . . . . . . . : . I
. . . . .
. I . , . . . . . . . .
:. .
. . . . . . .
. . . . . . . . . . .
. . . . . .
, . . .
. . :. . , . , . . . . . . . . . . . . . .
. . . . . . . . . . . . . . . . ,
. . . . . . . . . APPENDEX S
. . . .
. . . . . .
. . . . . .
. .
. , . . . . . . . . . , .
. . . . . . . .
. . . . . . . . . . I
. . . . . . . . . . . . . .
: : , ,
. . .

Ouetta WSE - Final Report, Executive Summary Appendix 5 / Page 1
APPENDIX 5: OUTLINE TERMS OF REFERENCE FOR CONSULTING SERVICES
General
Consulting services will be procured to provide assistance to the project management unit (PMU) under the Executing Agency Balochistan Planning and development Departments. Four packages (Part A, Part B, Part C and Part D) for consulting services described herein will be awarded under the proposed ADB project. The Project Parts will comprise the con- sulting services for the implementation of project measures proposed under this project. The packages for Consulting Services are:
0 Part A - Water Resources Development Part B - Rehabilitation and Extension of Water Supply Facilities Part C - Rehabilitation and Extension of Sanitation Facilities Part D - Technical Assistance to BWASA
For each package the outlined Terms of Reference are presented. Three international Con- sultants will focus on the project packages for resource development ~SICI101,102 and 103), Water Supply (WS/C/105 and 106) and Sanitation (WW/C/201), including detailed de- sign and construction supervision of the works. For the execution of technical assistance an additional international Consultant shall be awarded contract. This component will comprise the advisory services for management of the financial and commercial aspects of the BWASA (ID/C/501), the project execution (ID/C/502), the technical operation of the water and sanitation systems (ID/C/503), Provincial Institutional reforms (ID/C/504) and Benefit Monitoring & Evaluation (ID/C/505). In order to provide support to non-technical aspects, the Social Action Plan (CP/CDOl), Public Awareness and Conservation Programme (CD/C/702) and Hygiene Education (CP/CR04).
Part A - Water Resource Development
Introduction
The scope of consulting services comprises the development of a groundwater management system and supervision of the rehabilitation of existing BWASNPHED wells in the alluvial aquifer in the Quetta valley as well as the exploration of the groundwater resources in the limestone aquifer (Quetta Valley) and the conglomerate aquifer (Zarghoon Range). On the basis of findings of the exploration programme the Consultant will prepare design documents for the implementation of production wells for the exploitation of groundwater resources in the limestone aquifer (Quetta valley) and the conglomerate aquifer (Zarghoon Range).
The Consultant will carry out the following tasks and provide approx. 77 person-months of international key experts and 152 person-months of domestic consultants, excluding sup- porting and counterpart staff.
A. Rehabilitation Measures
(i) Final design, tendering and supervision for the installation of water meters, piezome- ters and rising pipes with threads in wells.
(ii) Supervision of performance of step-drawdown pumping tests. (iii) Rating of the permissible yielddrawdown based on the evaluation of the pumping test
data in a as-diagram. (iv) Determination of the suitability of the well for water supply at the permissible
yielddrawdown.
H:\ConDat\Ber\PAKISTAM233209\Final RepomExecutlve Summary\EXEC_SUM_APP-5.doc

Quetta WSE - Final Report. Executive Summary Appendix 5 1 Page 2
(v)
(vi)
Determination of the pump-setting, determination of the appropriate pump specification; final design, tendering and supervision for the installation of new pumps. Final design, tendering and supervision for the installation of electrodes in the well to secure a automatic shut-down of the well.
B. Exploration Programme for the Limestone Aquifer and Zarghoon Range
(i)
(ii)
Tendering, supervision and interpretation of long-term pumping test on the existing BWASNPHED wells. Tendering, supervision and interpretation of a geophysical exploration campaign (elec- tromagnetic survey with the GENIE tool) in order to detect the structure of the lime- stone aquifer and delineate faulvfracture zones and in Zarghoon Range in order to de- tect the structure of the conglomeratelsandstone aquifer and delineate jointlfaultlfracture zones. Final design, tendering, supervision and interpretation of test well drilling (incl. pumping tests, sampling and analyses of physico-chemical parameter and isotope composition of groundwater) in identified target areas, according to the geophysical survey. Evalua- tion of recording and interpretation of the groundwater level in surrounding production wells during pumping tests in test wells (if present in both the limestone and the alluvial aquifer) and according to the geophysical survey and measurements of the yield from springs in Zarghoon Range area. Assessment of the groundwater potential of the limestone aquifer in the northern Quetta valley and Zarghoon Range. The results from the investigations should be in- corporated in the existing groundwater model. Especially the interaction of the alluvial aquifer and the limestone aquifer and an enhanced abstraction from the limestone aq- uifer are to be investigated in detail. Recommendation of the final design for the imple- mentation of production wells and well fields in the limestone aquifer and in the con- glomeratdsandstone aquifer or the Zarghoon Range.
(iii)
(iv)
C. Exploration and Development of New Well Fields
(i) Tendering and supervision of drilling for 30 production wells (incl. pumping tests, sam- pling and analyses of physico-chemical parameter and isotope composition of ground- water) in identified well fields in Limestone Aquifer, according to the exploration pro- gram, During pumping tests in test wells recording and interpretation of the groundwa- ter level in surrounding production wells (if present in both the limestone and the allu- vial aquifer). Tendering and supervision of drilling for 70 production wells (incl. pumping tests, sam- pling and analyses of physico-chemical parameter of groundwater) in identified well fields, according to the exploration program. Evaluation of the pumping tests and determination of permissible (long-term sustain- able) abstractioddrawdown for each production well. Finalization of pump setting in each production well. Final assessment of the impact of the groundwater abstraction on all involved aquifer systems. The results from the investigations should be incorporated in the existing groundwater model.
(ii)
(iii)
D. Hydrology and Soil Mechanical Tests for Kuchnai Dam Scheme
For the proposed dam and catchment specific hydrological and meteorological data are to be collected for the final determination of the yield of the dam and the conceptual design of a combined system. In the framework of this tasks the evaluation of results from a multi-annual measuring and monitoring campaign is proposed. The data will also be beneficial to other
H:\GmDat\BeAPAKISTANC2332OWinal RepodExecutiwe Summary\EXEC-SUM-APP-S.da:

Quetta WSE - Final Report, Executive Summary Appendix 5 I Page 3
components of the proposed Quetta Water Supply Expansion Project. The following tasks are proposed for execution:
Review of related data and information on the proposed system components; recon- naissance of catchment area and delimitation of a recording network and appertaining equipment requirements. Planning, tendering and supervision of the procurement and implementation of hydro- metrical and meteorological recording stations, as well as the execution of test bore- holes incl. performancehnterpretation of soil-mechanical investigations. Establishment of monitoring routines and staff training. Conceptual design of dam and scheme, incl. preliminary determination of potential performance, and reporting on the proposed solution. Regular collection, systematic processing and filing of recorded data, performance of measurements and maintenance of recording stations by counterpart personnel. Evaluation of collected data material, and conclusive reporting on hydraulic, hydrologi- cal and soil-mechanical parameters, to be used in the final design and tendering of the works for rehabilitation/construction of the relevant components of the water supply scheme.
E. Specific Tasks of the International Consultants
(i) Guidance of counterpart staff, which will continue the well inventory, commenced in the frame of the present project, for all wells in the Quetta valley and provide input for the drilling supervision. Supervision of the GIS works and groundwater modeling, which will be primarily exe- cuted by counterpart staff.
(ii)
Part B - Rehabilitation and Extension of Water Supply Facilities
Introduction
Engineering consulting services are required to assist the PMU to carry out investigations, design and contract documents, evaluate bids and supervise construction. Consultants will have experience in the rehabilitation and extension of municipal water supply systems as well as leak control, monitoring and detection.
The Consultant will have to co-ordinate the work with the Consultant awarded contract for the development of new water resources (see above), as the rehabilitation and installation of new wells will be executed under separate contract. Specially the Consultant will carry out the following tasks.
The Consultant will carry out the following tasks presented under the following tasks. The Consultant will provide approx. 80 person-month of international key experts and 160 per- son-months of domestic consultants, excluding supporting and counterpart staff.
A. Detailed Design
(i) Plan, direct and supervise detailed topographic surveys and soiUgeological and geo- technical investigations along proposed water conveyors and proposed facilities (pumping stations, reservoirs and treatment facilities). Prepare design documents for rehabilitation of the existing ground reservoirs located at the well field sites and within the distribution system of BWASA, based on study find- ings and site visits.
(ii)
H:\ConDatBeAPAKISTAM332OWinal RepomExecuthre SummaryWEC-SUM-APP-5.doc

Quetta WSE - Final Report, Executive Summary Appendix 5 / Page 4
Design appropriate installations for disinfection at water production sites and improve- ment measures of roads and of boundary walls at well field sites. Prepare detailed design for the execution of rehabilitation of pumping stations located at the well field sites and within the BWSAS distribution system and the BWASA and PHED well installations. Prepare detail design and structural engineering works for the construction of additional elevated storage facilities in the distribution system. Carry out field measurement to introduce the restructuring of the existing distribution system, including rehabilitation and replacement of existing pipes and valves. In the framework of this task the replacement of distribution pipes of 81 km and installation of metering devices in the distribution system in the existing five zones is proposed. Prepare standard design and working drawings for the installation of individual water meter at existing house connections of approx. 45,000 water meter and about 166 km individual water connection pipes and installation of approx. 31,400 water meters for newly connected house, yard and public tap consumers. Prepare detail design documents for the construction of pipelines within the well fields and from the storage facilities into the distribution system of approximately 26.6 km, ranging in diameter from ND 200mm to ND 600mm. Detail design for the construction of storage facilities of 4,600 m3 and 3,000 m3 capac- ity at the well field sites and additional 25 elevated reservoirs, ranging from 50m3 to 1,100m3 storage capacity, equipped with water meter on outlet pipeline. Detail design for the construction of approx. 31 1 km distribution network, ranging from ND 80mm to ND 200mm pipelines to serve additional population. Installation of additional house, yard and public tap connections in priority areas to ex- pand the supply area of the system. Prepare a detailed construction management plan including schedules for construction, bidding and financing.
B. Construction Supervision
Review and evaluate the validity of proposed subcontracts, and assist in preparing letters of invitation for bidding, pre-qualification of civil works bidders and shortlists of suppliers, evaluating the submitted bids and bid evaluation reports, price and technical negotiations with the bidders, and related correspondence. Update or revise, if necessary, the construction management plan and the cost esti- mates based on the results of the bidding, and modify the design and construction drawings as necessary after the bidding and during construction. Supervise the mobilization of contractors and delivery of materials and equipment, re- view shop drawings, monitor contractors' topographic surveys to ensure correct align- ments and elevations of the Project facilities, and perform soiVgeological and geotech- nical tests to ensure adequate data for foundation and structures. Inspect materials and equipment and supervise, inspect, measure and control the quality of the construction of works and installation of equipment. Compare actual with scheduled progress and advise the Executing Agencies (EAs) of any developments that could delay completion. Recommend any necessary actions to be taken by the EAs to facilitate timely completion of construction. Supervise pressure tests of the major pipelines, and equipment start-up and commis- sioning; prepare Operation and Maintenance Manuals for equipment and the water treatment facilities and provide training assistance as required to operators of new fa- cilities.

Quetla WSE - Final Report, Executive Summary Appendix 5 I Page 5
C. Project Management and Administration
The consultant will submit monthly reports summarizing progress achieved, difficulties en- countered, and issues to be resolved. Copies of each monthly report (in English) will be sent to ADB, and two copies to each PMU. The consultants will also prepare progress payment and final payment certificates for each contract for approval by the PMU, and help the PMU maintain cost records for the Project.
In addition to design reports, the consultants will provide the data and help the PMU pre- pare progress reports. The consultants will also provide a project completion report before the end of the project to provide a comprehensive review of the project impacts in the project area.
Part C - Rehabilitation and Extension of Sanitation Facilities
Introduction
Engineering consulting services are required to assist the PMU to carry out investigations, design and contract documents, evaluate bids and supervise construction. Consultants will have experience in the rehabilitation and extension of municipal sanitation systems as well as low-cost sanitation, treatment plant design and construction.
The Consultant will have to co-ordinate the work with the Consultant awarded contract for the development of new water resources (see above), as the rehabilitation and installation of new wells will be executed under separate contract. Specially the Consultant will carry out the following tasks.
The Consultant will carry out the following tasks presented under the following tasks. The Consultant will provide approx. 55 person-month of international key experts and 120 per- son-months of domestic consultants, excluding supporting staff.
A. Detailed Design
(i) Plan, direct and supervise detailed topographic surveys and soil/ geological and geotechnical investigations along proposed sewer conveyors and pro- posed treatment plant. Prepare design documents for rehabilitation of the existing sewer system and man- holes. Carry out hydraulic calculation for the new sewer system components of approx. 25 km primary and 154 km secondary sewer pipes. Prepare standard design and working drawings for the installation of individual sewer connections of approx. 29,000 nos. Prepare a detailed construction management plan including schedules for construction, bidding and financing.
(ii)
(iii)
(iv)
(v)
B. Construction Supervision
(i) Review and evaluate the validity of proposed subcontracts, and assist in preparing letters of invitation for bidding, pre-qualification of civil works bidders and shortlists of suppliers, evaluating the submitted bids and bid evaluation reports, price and technical negotiations with the bidders, and related correspondence.
H:\ConDaKBehPAKISTAM233209\Final RepodhecutNe Summe~EXEC-SUMAPP-5.da:

Quetla WSE - Final Report, Executive Summary Appendix 5 I Page 6
(ii) Update or revise, if necessary, the construction management plan and the cost esti- mates based on the results of the bidding, and modify the design and construction drawings as necessary after the bidding and during construction. Supervise the mobilization of contractors and delivery of materials and equipment, re- view shop drawings, monitor contractors' topographic surveys to ensure correct align- ments and elevations of the Project facilities, and perform soiVgeological and geotech- nical tests to ensure adequate data for foundation and structures. Inspect materials and equipment and supervise, inspect, measure and control the quality of the construction of works and installation of equipment. Compare actual with scheduled progress and advise the Executing Agencies (EAs) of any developments that could delay completion. Recommend any necessary actions to be taken by the EAs to facilitate timely completion of construction. Supervise tests of the major pipelines, and equipment start-up and commissioning; prepare Operation and Maintenance Manuals for equipment and the waste water treatment plant and provide training assistance as required to operators of new facili- ties.
(iii)
(iv)
(vi)
(i)
C. Project Management and Administration
The consultant will submit monthly reports summarizing progress achieved, difficulties en- countered, and issues to be resolved. Copies of each monthly report (in English) will be sent to ADB, and two copies to each PMU. The consultants will also prepare progress payment and final payment certificates for each contract for approval by the PMU, and help the PMU maintain cost records for the Project. In addition to design reports, the con- sultants will provide the data and help the PMU prepare progress reports. The consultants will also provide a project completion report before the end of the project to provide a comprehensive review of the project impacts in the project area.
Part D - Technical Assistance to BWASA
Introduction
The tasks to be executed in the framework of the Consulting Services in the framework of the Technical Assistance Programme, including the Advisory Services during project implemen- tation, for technical management and operations are presented below. In the framework of the project implementation assistance, guidance and assistance towards community devel- opment will be provided.
A. Advisory Services for Financial and Commercial Management
The implementation of the recommended reforms and improvements will require additional Consulting Services to support the efforts of the financial water supply and sanitation man- agement. The overall objective is to implement the recommended reforms and improvements in financial and accounting systems and performance through a long term Technical Assis- tance program. Under this assistance program one expatriate expert, experienced in overall financial water supply and sanitation management and operations, working closely together with the responsible water and sanitation management, to the Quetta BWASA, and three Pakistani financial and commercial experts, i.e. shall be assigned to the following tasks.
(i) The expatriate adviser with special experience in overall financial and commercial management and operations of water supply and sanitation, for approximately 24 months, to advise the financial (and eventually the administrative director, according to
H:\ConDat\BeAPAKISTAM233209\Flnal ReportExecutive Summary\U(EC-SUM-APP-5.doc

Quetta WSE - Final Report. Executive Summary Appendix 5 I Page 7
(ii)
(iii)
(iv)
the anticipated organizational reforms) director of BWASA in all financial and commer- cial matters, including the priority objective of know how transfer in all fields of com- mercial and financial management and operations, and with special regard to estab- lishing sound financial and operational objectives, water tariff policies, budgeting and financial planning procedures. A local financial and commercial advisor, under the direction of the BWASA manage- ment and the expatriate financial and commercial advisor, specially experienced in water billing and collection operations, for approximately 24 months, to advise on, de- sign and assist the implementation of improvements in meter reading (as recom- mended for implementation), billing and cash collection operations and performance, arrears control and enforcement procedures, improvements of customer relation, to design and implement an efficient financial Management Information System, design training programs in above fields and perform on the job training. A local accounting advisor, under the direction of the BWASA management and the expatriate financial and commercial advisor, specially experienced in water supply and sanitation accounting and control systems, including asset accounting and manage- ment, for approximately 24 months, to advise on, design and supervise the implemen- tation of modern double entry accounting and financial systems and accounts analysis, transfer of existing accounts to the new system, design training programs in above fields and perform on the job training. One Pakistani computer hardware and software specialist, under the direction of the BWASA management and the expatriate financial and commercial advisor, specially experienced in water supply and sanitation billing, accounting, personnel administration and MIS software, for approximately 12 months, to enhance, in close connection with the financial and commercial advisor and the accounting advisor computer operations in these fields, design training programs in above fields and perform on the job training.
B. Advisory Service for Project Implementation
The Consultant will carry out the following works presented under the following tasks. The Consultant will provide approx. 12 person-month of an international key expert, experienced in the project management of large scale water and sanitation projects.
Advise the EAs on the technical aspects, engineering design, construction and su- pervision and Bank procurement procedures and guidelines for the Procurement of
Help the EAs coordinate Project implementation activities, maintain records and min- utes of all construction related activities, and certify and recommend payment of claims by the contractors and suppliers. Coordinate the activities-of all local and international consultants. Advice and provide assistance towards community development (e.g. multimedia campaigns, target group communication, water conservation education and PR & documentation center development). Advise on environmental issues and resettlement of families displaced by construc- tion activities. Inspect completed works and make recommendations to the EAs on the issuance of the certification of completion. Prepare reports for the EAs and for the Bank, including progress reports, project completion report, and project benefit monitoring reports; and facilitate the Bank's loan review missions.
goods.
H:\ConDaKBetlPAKISTAM33209Final ReporExecutive Summary\U(EC-SUM-APP-5.doc

Quetta WSE - Final Report, Executive Summary Appendix 5 / Page 8
C. Advisory Service for Public Works, Technical Management and Operation
The Consultant will carry out the following works presented under the following tasks. The Consultant will provide approx. 12 person-month of international key experts for a Public Works Management Expert and approx. 24 MM for a CiviVSanitary Engineer.
Review the appropriateness of the engineering design prepared and proposed modifications if necessary. Review the project implementation plan and organizational arrangements for project implementation. Review tenderkontract documents and assist during pre-construction period. Day-to-day monitoring of project progress, preparation of progress reports to PMU and ADB. Preparation of training programs and review of training manuals provided by the Consultants. Organize workshops and seminars for BWSAS staff. Assist in commissioning and performance evaluation of completed facilities and in setting up regular maintenance programs, and if required, maintenance contracts with suppliers. Supervise the training programs of the civil works and equipment suppliers; provide additional technical and management training to the PMU and project hplementa- tion units in the project area. Prepare a leakage detection and control training program; provide training on re- source mobilization including, cadastral mapping, property registration and valuation, and revenue collection; and conduct training for the staff of the water treatment and waste water treatment plant. The consultant will help, in association with the Project Implementation Advisor and local NGO/CBO, with the Community Development Program Sanitation and Health Awareness Program.
D. Provincial Institutional Reforms
The Consultant will carry out the following works presented under the following tasks. The Consultant will provide approx. 24 person-months of a institutional development specialist , a local MIS expert (8 person-months), a financial management consultant (1 8 person-months), a HRD specialist (6 person-months) and approx. 48 months input of junior consultants to support the team of experts. Tasks to be executed are listed as follows:
(i) Institutional inventory refinement, Legal framework analysis, Reorganising and merger of provincial water sector institutions.
(ii) Water resources management policy framework and institutions; the regulatory framework and the organisation of a joint water board have to be worked out and a proper system of decision making has to be set-up. Unified Building Codes and implementation and institutional set-up has to be devel-
Technical support has to be provided to the provincial government in establishing these institutions, strengthening the existing structures, institutional restructuring and re-organisation, merger of function roles & responsibilities and later institutions them- selves. The staffing plans and organisational structures have to be developed for the new / restructured institutions. The systems and procedures and financial management system to run the affairs of these institutions also have to be established. The reclassification and re-organisation of the existing staff and determination of an excess/ surplus staff also will be carried out with a comprehensive Surplus staff and privatisation policy.
(iii)
(iv) oped.
(v)
(vi)
(vii)
H:\ConDat\BeAPAKISTAM233209\Final RepomExecuttve Surnmary\EXEC-SUM-APP-5.doc

Quena WSE - Final Report. Executive Summary Appendix 5 I Page 9
E. Benefit Monitoring and Evaluation
The ensuing Project anticipates that pro-active benefit monitoring and evaluation features will be necessary during implementation to provide feedback and guide adaptive response to changing circumstances in the Service Area. The Consultant will provide approx. 4 person- months of a Community development specialist, 6 person-months of a M&E expert, 6 per- son-months of a programmer and 24 person-months of social organisers. The tasks to be executed are listed as follows:
Provision of co-ordination and adjustment during the project planning and implemen- tation. Appropriate measures and mechanisms for social monitoring of project implementa- tion are necessary. Social assessment suggests a strategy and approach to monitor- ing that should guide efforts. Preparation of monitoring and evaluation system, supported by the TA during a first phase, will be of great importance during project implementation to track social bene- fits provided and indicate where adjustments and corrective measures may be neces- sary. Performance indicators for participation, beneficiary contributions, and benefits de- rived shall be incorporated in overall project monitoring. This includes monitoring of benefit achievements during project implementation, and evaluation of impacts of benefits during implementation and after project completion. Monitoring the impact of project interventions on poverty reduction and the other so- cial dimensions significant in the project will require a relatively long-term commitment as project benefits may gestate slowly. Benefit monitoring and evaluation exercise shall be carried out in three steps. Initially at the start of the project. This will be to develop a baseline socio-economic database and monitoring indicators to assess the impact of the project on the community in general with the special focus on Gender issues, poverty reduction, indigenous peo- ple and human development issues. Based on these database and quantified moni- toring indicators the monitoring and implementation exercise will be carried out in the middle of the project and at the end and the comparisons will be drawn to identify early the needs for correction measures, if necessary.
F. Social Action Plan
In the context of the co-ordinated implementation of participatory components a TA is pro- posed comprising 15 PM (F), 36 PM (L), ca. 72 PM (CP) for a period of approx. 3 years.
(i) Social Action Plan - co-ordinated implementation of participatory components, (ii) social assessment recommendations, hygiene and public awareness components,
and mitigation measures, (iii) carrying out procedures for NGO/CBO involvement, (iv) social targeting of benefits and poverty reduction, (v) addressing resettlement, indigenous peoples, and other social impacts.
G. Public Awareness and Community-oriented Conservation Plan
In the context of water conservation, building public awareness is a major aspect of the par- ticipatory agenda of the ensuing Project; one that is fundamental to involving the public and beneficiary communities in many aspects of project implementation, including operation and maintenance of investments, conservation, hygiene education, and support for policy, institu- tional, and tariff reforms. With regard to water conservation, and based on the relevant find- ings during the relevant surveys and workshops, public awareness campaigns shall be con-
.
H:\ConDat\BehPAKISTAM233209\Final RepomExecutiie Summery\EXEC-SUM-APP-5.doc

Quelta WSE - Final Report. Executive Summary Appendix 5 I Page 10
tinued under this TA. The Consultant will carry out the following tasks presented under the following headings. The TA comprise 6 person-month of community development expert, 12 person-months of a communication and media expert, 48 person months of a community information offices and NGO support.
Multimedia Communication; the objective is to inform, educate and persuade 80% of viewers to adopt responsible behaviour in conserving drinking water and help imple- menting conservation strategy measures. Radio Programs and Promotional Spots: to provide information on water conservation to over 60 per cent listeners and educate female listeners on importance of clean water, water born diseases and conserving drinking water by adopting water conservation measures. Regional Press: to provide update news and views on all-round development issues relating to water supply and conservation for potential readers of Urdu or English local newspapers. Face-to-face Educational Communication; target Group Communication: to motivate, mobilise and involve beneficiaries in the design and implementation of the project at all stages, particularly in the eventual installation of water meters, and implementing conservation strategy measures including hygiene education. Water Conservation Education; to educate school children in conservation of water and environment including hygiene education through the formal and informal educa- tional systems. Public Relations and Documentation Center; to improve communication between all stakeholders by providing effective public relations internally and externally and es- tablish a documentation center aiming at serving the information to all categories of users of information and improving BWASA’s public relations.
H. Hygiene Education
The Consultant will carry out the following tasks presented under the following headings. The Consultant will provide approx. 30 person-month of a public health experts and 180 person- months of social organizers and hygiene educators. The main objective of this TA is to pre- pare hygiene plans with the beneficiaries of the project. The proposed activities, under the project, shall be by following the various steps as defined below:
Establishment of Hygiene Education Unit for both the BWASA & PHED who will work in collaboration with both the agencies. Recruitment of Hygiene Educators. Training of Hygiene Educators and Social organisers. Consultation with NGOs, CBOs, Line departments. Develop/adopt information education and communication material. Staff training on extension of IEC material. Initially a pilot program identified by BWASA and PHED in collaboration with the NGOs. Allocation of staff according to geographical sectors. Pilot program carried out and feedback. Adjustments made for implementation of a full program. Linkages with the NGOs and CBOs of the area. Extension of information to the target group. Monitoring of activities of the target group. Monitoring of Health / Social staff. Evaluation of the activities and their impact. Feed back and follow up training of the staff. Replication of the activities in other areas. Long term follow up activities in communities.
H:\ConDanBehPAKISTAM233209\Final RepodExecutive Summa~EXEC-SUM-APP-5.doc

Appendices Executive Summary
APPENDIX 6 Project Implementation Organization

z 3 P 9 I-
- -
GOVERNMENT OF ISLAMIC REPUBLIC OF PAKISTAN
MINISTER OF URBANDEVELOPMENT OTHER MINISTERS INCL. HOME AFFAIRS COORDINATION TEAM JUSTICE; COMMUNICATION MINISTER OF FINANCE
I
CHIEF MINISTER
&
FOREIGN AID DEPARTMENT
ADDITIONAL CHIEFSECRETARY
( PLANNING ) - .. -
A
. -
WATER BOARD P D: ARMY
QDA; QhC LGD; IPD; PHED; BWASA;
BEPA; NGO
IRRIGATION 6 POWER DEPT
PHED EXTERN AUDITOR
BWASA - I ADVISORY SERVICES PROJECT
MANAGEMENT UNIT 1
6 F I-
INTERNAL AUDIT AND CONTROLLING
I
I QUElTA MUNICIPAL
CORPORATION
I
WATER RESOURCE WATER WASTE WATER SUPPORTING DRAINAGE a SOLID WASTE DISPOSAL
3
DEVELOPMENT SUPPLY DISPOSAL

Appendices Executive Summary
APPENDIX 7 Cost Estimate
GKW CONSULT GmbH
H:\ConD~nBs~PAKISTA33208\Flrul R.pomEwcutlv# Sumr)*SBE.DOC

Quetta WSF - Final Rewrl. Executive Surnrnarv ADDendix 7 I P m 1
APPENDIX 7 : PROGRAM FOR BANK FINANCING
A.7.1 Recommended Phase 1 Investment Program (ADB-Project)
The declared target' of a possible Bank financing program is a least-cost solution to Quetta's water supply problems that is also environmentally acceptable, socially and eco- nomically feasible and financially viable. Selected investments must be operated and maintained in collaboration with the local communities and achieve an acceptable level of cost recovery of O&M cost within about five years and O&M plus dept service payments or depreciation, whichever is higher, within ten years of completion of the selected option.
Based on the general goal of sustainable water supply, a program is presented for infra- structure development that, if consistently implemented, can meet the above targets. Since all measures and their effects are interdependent it is essential that the defined components of the entire project be implemented in the proposed sequence in order to match growing demand and to achieve a balanced groundwater regime.
Embedded in a staged development, the recommended Phase 1 implementation program for Bank financing has been delineated in coordination with Bank and Project Steering Committee. It is the result of a systematic variant selection, based on the TA findings and previous discussions with both, Implementing and Executing Agencies. However, the overall financial scope of Phase 1 was reduced by some 40°/o, and during the Tripartite Meeting in March 2000 the implementation of several components was subjected to final decisions prior to or during the forthcoming loan negotiations, including:
-
- rehabilitation of existing wells, - installa?ion of water meters, - - -
scope, funding and timing of preparatory ground- and surface water explora- tion,
construction of wastewater house connections, number of wastewater treatment plants and, consequently, shape of the entire sewerage system, scope of social and institutional support programs.
In that light, the Investment Program proposed by the Consultant includes the following packages. The attached tables indicate the physical project components and quantities of each project measure.
A.7.1.1 Water Resource Development
Rehabilitation of up to 100 wells in the alluvial aquifer in the Quetta Valley to restore original design capacity, fully utilize attached existing distribution and storage facilities and allow systematic monitoring (WS/P/111; US$ 1.59 mio2). Drilling and exploration program including 30 test wells in the limestone aquifer of the Murdar Range and 60 test wells in the conglomerate/sandstone aquifer of the Zarghoon Range (WS/P/112; US$2.00 mio).
' TOR I.A.8 base cost in mid 1999 constant prices, excluding contingencies and tar

Quette WSE ~ Final Rewrt. Executive Summaw ADDendix 7 I Paw i:
Construction of approx. 20 new production wells in well fields L2 and L3, with total ex- pected yield of 9.1 mio m3/yr from the Murdar limestone aquifer in the Quena valley (WS/P/113A; US$ 1.01 mio). Exploration of new groundwater resources in the limestone aquifer of the Murdar Range and in the conglomerate/sandstone aquifer of the Zarghoon Range; involving 24 PM (F), 36 PM (L), 198 PM (CP)3, and geophysical program. (WS/C/lOIA; US$ 0.77 mio). HydrologicaVgeotechnical investigations; incl. 3PM (F), 6 PM (L), 24 PM (CP), geo- physical/soil-mechanical investigations, and supply and installation of hydrometrical and meteorological stations. (WS/C/103A; US$ 0.1 9 mio).
Table A.7.1 : Proposed Rehabilitation Measures (WS/P/ll l)
Proposed Project Measures
1 Well Equipment Watermeter Installation Piezometer (PVC pipe, 1.5” diameter) Supply and installation of rising of rising pipes
Recovery, observation and recording
Electrodes Supply and installation of
2 Pumping Tests
3 Procurement of Pumps/
Supply and installation of electrodes _.
Table A.7.2 : Proposed Resources Measures (WS/P/112)
Proposed Project Measures
1 Test 30 Wells 2 Development 3 Pumping 4 Topographical Documentation 5 Execution 6 Execution
Table A.7.3 : Proposed Exploration (WS/P/113A)
Proposed Project Measures
1 Production Well Drilling 2 Development 3 Pumping 4 Topographical Documentation 5 Procurement
- Unit
Nos Nos Nos
Nos
Nos P -
- Unit
Nos Nos Nos Nos Nos Nos
-
-
- Unit
Nos Nos Nos Nos Nos
-
Quantity
100
71 20
person-months foreign, local and counterpart services
H:U3onDa-AI(ISTAM233209\nn.I R-w S u ~ E C S U M N P - 7 . d o c

Quena WSE - Final Remn. Executive Summew ADDendix 7 I P a w 3
Jnit
MM MM MM MM
MM MM'
MM
MM MM MM MM MM MM
Table A.7.4 : Proposed Consulting Services (WS/C/101 A)
Quantity
2.50 2.50
16.00 3.00
18.00 18.00
16.00
18.00 18.00 18.00 18.00 72.00 54.00
Proposed Project Measures
Unit Quantity
MM 1 MM 1 MM 1
~
MM 3 MM 2 MM 1
MM 3
MM 6 MM 6 MM 12
Is. 1
1 Remuneration -foreign Senior Hydrogeologist Remote Sensing Expert Hydrogeologist Groundwater Modeller / Geophysicist
2 Remuneration - local Hydrogeologist I Hydrogeologist II
3 Office - support staff and running cost
4 Counterpart Personnel Hydrogeologist I Hydrogeologist I I / Geophysicist+A63 Groundwater Modeler GIS Expert Technicians
- ~. __ s&!PPofls%!L -
Table A.7.5 : Proposed Consulting Services (WS/C/103A)
Proposed Project Measures
1 Remuneration -foreign Senior Hydrologist Dam ExpedGeotechnical Engineer Water Supply/Hydraulic Expert
Hydrologist Dam Expert Water Resources Expert
2 Remuneration - local
3 Office - support staff and running cost
4 Counterpart Personnel Hydrological Technician Meteorological Technician Support Staff
Soil Mechanical Drillinflesting I

ADDendix 7 I Pa@ 4 Quetta WSE - Final Remrt. Executive Summatv
A.7.1.2 Water Supply
Quantity
1 3 3
150 3
18 83 1
5
7 4
14
14 14
61,000
20,400
73 46
1 18
45,000
Quetta Water Supply Improvement Project - Rehabilitation of wells, reservoirs, disin- fection equipment, pumping stations and distribution network, incl. restructuring of the system, replacement of valves and 81 km pipeline, installation of 65 water meters at PHED wells, and 45,000 water meters at house connections (Ws/P/ll5; US$ 5.92 mio). Quetta Water Supply Expansion Project I - Development and connection of Lirne- stone well fields L 2 and L3 to a production capacity of approx. 10.0 rnio rn3/yr, con- struction of reservoirs of 4,600 m3 and 3,000 m3 capacity at the well fields, and 25 elevated service reservoirs of 50 m3 to 1,100 m3 capacities; construction of 26.6 km primary pipelines ND 200 to ND 600 mrn, and 31 1 km distribution network ND 80 to ND 200 mm, and 166 km house connections with 31,400 water meters (WS/P/116; US$21.50 mio). Consulting services for engineering design and construction supervision for system rehabilitation packages. Duration 5 years at 7.5% of construction cost. (WSICII 05; US$0.44 mio). Consulting services for engineering design and construction supervision for Quetta Water Supply Expansion Project I packages. Duration 5 years at 7.5% of construction cost. (WSICII 06; US$ 1.61 mio).
Proposed Project Measures
Water Supply 1 Source Development and Transmission
Unit
Rehabilitation of ground reservoirs at Southern well field Construction of reservoir extensions Installation of water meter (well fields ND 300 mm) Installation of water meter (well fields ND 150 mm) Supply and Installation of HTH Chlorinator
Installation of bulk meter chambers Installation of gate chambers Rehabilitation of Primary network (assuming 20% replace- ment) Rehabilitation of Pumping station
3 Storage Rehabilitation of ground reservoirs Rehabilitation of elevated reservoirs Rehabilitation of ground reservoirs and elevated reservoirs of minor capacity Installation of bulk meter on reservoirs Supply and Installation of HTH Chlorinator
Replacement of distribution pipes 80-1 OOmm
Replacement of distribution pipes 150-250mm
Installation of aate valves 80-200mm
2 Treatment and Transmission
4 Distribution
Installation of gate valves 250-500mm
Installation of water meter (bulk meter)
Nos. LS Nos.
- Installation of water meter (house connection) Nos.
Supply and installation of gate valves
Nos. Nos. Nos. Nos. Nos.
Nos. Nos. Nos.
Nos.
NOS. Nos. Nos.
Nos. Nos.
Length
Length
Nos.
[ml
Iml

Quette WSE - Final Reoofl. Executive Summew ADDendix 7 J PEIOQ 5
Proposed Project Measures
5 Workshop, Tools and Material Supply of tools Supply of pipes and material
Unit Quantity
LS 1 Nos. 1
Table A.7.7 : Proposed Expansion Measures (WS/P/116)
Quantity
20
7,600
20,000 16,000
2
35,000 2
20 20,000
2
17,450 9,100
17 8
25 25
2,031 1,016 1,016
214,500 97,000
146,875
2031 3 29,375
2,031 54
4 2
14
18,000 10,000
Proposed Project Measures Unit
Water Supply 1 Source Development and Transmission
Construction of well head and housing in the well fields L2 and L3 Construction of terminal storage in the well fields L2 and L3
Construction of gravel roads in the well fields L2 and L3 Construction of pipelines within the well fields L2 and L3 Installation of water meter in the well fields L2 and L3 (ND 300 mm) Transmission line for power supply Electricity substations in the well field PMT - Transformer Power supply to the individual submersible pumps Supply and Installation of Chlorination equipment at the terminal reservoir
Construction of primary mains ND 200-350mm Construction of primary mains ND 400-600mm
Construction of elevated reservoirs 50-300m3 Construction of elevated reservoirs 400-1 100m3 Installation of bulk meter on reservoirs Supply and Installation of HTH Chlorinator
Construction of public taps Construction of soakaways for public taps Construction of drainage pipes of the public tap Construction of distribution pipelines ND 80-1 OOmm Construction of distribution pipelines ND 150-200mm Supply and Installation of individual house and yard connections (0.5"- pipe) Supply and Installation of public taps (1" - pipe) Installation of water meters for individual house and yard con- nections Installation of water meters tap connections Installation of gate valves for zone metering
Pressure monitoring and control equipment Leak detection equipment
2 Treatment and Transmission
3 Storage
4 Distribution
5 Workshop, Tools and Material
Vehicles
Land Acquisition Vehicles for Operation and maintenance
Well fields L2 and L3 Elevated reservoirs
Nos.
Vtot
M M Nos.
M Nos. Nos. M Nos.
~1
Nos. Nos.
Nos. Nos. Nos. Nos.
Nos. Nos. Nos. M M M
M Nos.
Nos. Nos.
Nos. Nos.
Nos.
M2 M2

6 A ndix71P 6
Unit
I.S. m m m U
U U
I.S. I.S.
I s . I.S. ha
A.7.1.3 Wastewater Disposal
Quetta Sewerage Project I - Rehabilitation and cleaning of existing sewers; construc- tion of 24.85 km primary sewers, 154.10 km secondary collectors, 20,000 house con- nections, and first stage of central treatment plant near Kili Barmah village. Service areas include Cantonment and Railway Compound (1 OO%), QMC (extension from 1,360 ha to 3,935 ha). The Phase 1 scheme will serve 383,800 inhabitants, at an av- erage discharge of 31,905 m3/d (11.65 mio m3/yr); at 65% efficiency, around 400 ha can be irrigated with the treated effluent.(WW/P/211; US$ 19.95 mio). Consulting services for engineering design and construction supervision for the above implementation package. Duration 5 years at 7.5% of construction cost. (WW/C/POl; US$ 1.50 mio).
Table A.7.8 :Wastewater Measures (WW/P/211)
Quantity
1 24,856
154,lOC C
29,OOC
c a
C 1
1 1
8C
Proposed Project Measures
Seweraae Network Civil Works Rehabilitation and cleaning of existing sewers Primary system (incl. transmission main) Secondary system Transmission main House connections Pumping stations Stormwater overflows
Equipment E&M Pumping stations Cars, machines
Wastewater Treatment Plant Civil works EauiDment E&M Lind acquisition
A.7.1.4 Urban Drainage
Supply of Machinery and Equipment for Quetta Drainage Maintenance - Provision of general and special equipment to support and improve working methods and effi- ciency in routine and corrective drainage maintenance by QMC Sanitation Section. (DFIPI312; US$ 0.61 mio) Initial engineering and contract management support is rendered through PMU advisory services in the scope of the overall project.

Quetta WSE - Final Rewn. Executive Sumrnarv Amndix 7 I Paw 7
Proposed Project Measures
Machinery and Equipment Front wheel loader with backhoe Skid steer loader Dump truck Double cabin pick up Jetting truck Rodding equipment Rotary cleaning machine Non-clog pump and mob. Generator Hand tools Safety equipment
Unit Quantity
Nos. 1 Nos. 1 Nos. 2 Nos. 2 Nos. 1 Set 1 Set 1 Set 1 Set 1 Set 1
A.7.1.5 Solid Waste Disposal
Proposed Project Measures
Construction of Sanitary Landfill Solid Waste Solid Waste Disposal Site - Construc- tion and development of 27.7 ha sanitary landfill site including roads, leachate control. gas collection, weigh bridge and operational facilities; and clearing of existing open dump. Work is carried out under contract for the first two lots and then continued by QMC in the scope of daily operations. The implementation contract includes engi- neering design and construction supervision by a specialized consulting firm, and ac- tivities are coordinated through PMU in the scope of the overall project. (SW/P/411; total incl. 7.5% engineering US$ 1.1 6 mio). Supply of Machinery and equipment for Quetta Solid Waste Disposal Site - Provision of heavy equipment, special machinery incl. weigh bridge, and tools to support opera- tion and expansion of the sanitary landfill by QMC Sanitation Section. (SW/P/412; to- tal incl. 2% engineering US$0.86 mio).
Unit
3 Gas Collection System (initial)
4 Offices and Workshops Guard room, office, store
Construction of Sanitary Landfill Solid Waste Disposal'Site 1 Earth and Road Works
Metalled approach road 8 m wide Macadam internal roads 6 m Parking area Flood protection bunds I drains Waste pit excavation Embankments Impermeable clay layer 300 mm Cell formation: on-site material
Borrowed material
Is.
m2
2 Leachate Control and Treatment Collector system: ND 300
ND 200 Treatment ponds
m m I.S.
Quantity
1,350 6,000 1 ,OOo
90,000 63.000 6,750 42.500 42,500
830 1,480
150

Quem WSE - Final Reoon. Executive Summarv ADDendix 7 I Paw 6
Proposed Project Measures Unit Quantity ~
Workshop and garage m2 275 Sanitary facilities I s .
Barbed wire fence 2.00 m high m 1,100 Main gate Nos. 2 Lighting I.S. Fire fighting equipment I s .
5 Fencing, Lighting. Fire Protection
Proposed Project Measures
Machinery and Equipment 1 Weigh bridge
Excavator Wheel loader Compactor / dozer Water sprinkler Set of hand tools
Unit Quantity
I.S. No 1 No 1 No 1 No 2 Set 1
A.7.1.6 Technical Assistance
After discussion of requirements and proposed activities for supporting consulting and advisory services, the following technical assistance program is envisaged in the scope of eventual Bank-financing of a Phase 1 implementation package:
Advisory Services for Financial and Commercial Management in BWASA - total 84 person-months of one foreign and three local experts plus relevant counterpart and supporting personnel. (ID/C/501; US$0.78 mio). Advisory Services for Project Implementation - 12 person-months of foreign expert in contract management and civikanitary engineering to assist in the initial stage of im- plementation and establish regular contracting, monitoring and administrative routines to the Bank's requirement. Activities are to be taken over and continued by suitably qualified PMU counterpart personnel seconded to the advisor at the beginning of his assignment.(lD/C/502; US$0.28 mio). Advisory Services for Public Services Technical Management and Operation - total 36 person-months of foreign public works management and civil/sanitary engineering experts plus counterpart and supporting personnel, stationed at PMU, to support set- ting-up and control of implementation and subsequent O&M routines. (ID/C/503; US$ 0.79 mio). Advisory Services for Provincial Institutional Reforms (ID/C/504; US$0.105 mio). Advisory Services for Benefit Monitoring and Evaluation - total 40 person-months of management experts plus counterpart and supporting personnel. (ID/C/505; US$ 0.1 06 mio). Social Action Plan - Coordinated implementation of participatory components, social assessment recommendations, hygiene and public awareness components, and miti- gation measures, as well as carrying out procedures for NGO/CBO involvement, so- cial targeting of benefits and poverty reduction, and addressing resettlement, indige- nous peoples, and other social impacts. Required are 15 PM (F), 36 PM (L), ca.72 PM (CP). Duration 3 years. (CP/CDOl; 0.446 mio).

Quetla WSE - Final Remrt. Executive Summarv ADDendix 7 / Pam B
Public Awareness and Community-oriented Conservation Program - focussing on key aspects of water conservation, metering and revenue enhancement, and stakeholder, NGOlCBO and community participation. Through a Media Advisory Forum, media campaigns will be staged. Key outputs are: Media Advisory Forum; Community Con- servation Roundtable; multimedia campaigns; face to face campaigns; educational campaigns; documentation center. Duration 5 years. (CP/C/702; US$0.35 mio). Hygiene Education - providing improved information regarding sanitary and hygiene practices, potable water supply, and prevention of water borne and environmental diseases, as well as complementing project-supported measures to reduce water wastage and contamination, targeting poverty-level and other disadvantaged benefi- ciary groups including women. Strategies include awareness- and capacity building, development of education material, training packages, and deployment of community- based implementers. Duration 5 years. 30 PM public health specialist, 180 PM social organizers, logistical support, materials development, training (all local). (CP/C/704; US$0.78 mio).
Table A.7.12 : Proposed Technical Assistance
Proposed Project Measures
ID/C/501 Advisory Services for Financial and Commercial Manage- ment in BWASA
IDIC1502 Advisory Services for Project Implementation ID/C/503 Advisory Services for Public Services Technical Manage-
ment and Operation ID/C/504 Provincial Institutional Reforms ID/C/505 Benefit Monitoring & Evaluation
CP/C/i'Ol Social Action Plan (SAP) CP/C/i'O2 Public Awareness & Community Oriented Conservation Pro-
gramme CP/C/704 Hygiene Education Programme ID/C/505 Benefit Monitoring & Evaluation
A.7.1.70verview of Project Components
Key data of the above implementation packages are compiled in Table A 7.13.

TABLE A7.13 : OVERVIEW OF PROJECT COMPONENTS - PHASE 1 (ADB-PROJECT)
308.500 549 300
1 5189.352 1.005.062 3.452214
444.259 1.612.458 5.923.450
21.499.430 29A79.605
1.496.144 19.948.190 21 .a334
614200 61 4200
1.1 61 .850 856.Ooo
2.017850
i7.mm
A WATER’FIESOURCE iwESncanoN
WS/C/IOlA Consulting Sehices for Eqioration 0 7 M - 1201 of New Groundwater Resources
for Kuchnai Dam Scheme (lstcampaign) W / 1 0 3 A Hylrolqyand Soil-mechanical Tests lQxx)-03x)l
W / 1 1 2 rnloration Well Drilling 101oO-1201
TOTAL A
8. PHASE I IWLEMENTATION
WATWFlBouRnEVEDPMBdT I
wS/c/lOl B Consulting for Well Rehabilihtion WSICil02A Consulting for Well Construction L2 and L3 WP;111 W / 1 1 3 A
Well Rehabilitation in the (Xletta Valley Well Construction L2 and L3
Subtotal
0101 - 1u)3 07\01 - 12/02 04/01 - 1 a03 07/01 - 12/02
I WATWSUPPLY
WYC/lO!5 Consulting for *tern Rehabilitation
WSIpI115 Water Supply Rehabilitation Project ‘ W / 1 1 6 Water Supply mansion Prqed I
SIJMacal
WASTRNATWUSPOSAL
W K m O l WP12ll Wastewater Disposal Project I
Consulting for Wastewater Project I
Subtotal
I
01101- 1 m 01101 - 12An 01102 - 12105 01102 - 12105
01101 - 12105 01102- 1u)5
DFPB12
659.8
2.110.122
29621
Supply of Drainage Mintenance Equipment 01102 - 06102 subtdal
SOUD WAslE USPOSAL
SWP/411 Initial ConslnJucbon of Sanitatybndfill SWP/412 Supply and Installation of Equipment
subt&l
TOTAL B
01102-1u)3 01102 - 06/03

Quetts WSE - Final Remrt. Executive Surnrnarv ADDendix 7 I Paw 11
Code Description Duration
C. TECHNICAL ASSISTANCE
ID/C/501 Addsoty Senices for Financial 8 Commercial 01/01 - 12103 Management in BWASA
ID/C/502 Adkisory Sem’ces for Project Implementation 01/01 - 12101 ID/C/503 Advisory Senices IorPublic Works Technical 01102 - 12/03
Management 8 Operation ID/C/504 Prodncial Institutional Reforms 01/02 - 12103 IDIC1505 Benefit hnitoring 8 Evaluation 01/02 - 12/03
CP/CROl Social Action Plan 01/01 - 12103 CP/C/702 Public Awareness 8 Communiworiented 01101 - 12105
Consenation Program CPF21704 HNiene Education 01/01 - 12/05 .
TOTAL C
Base C o d 7 780.000
276.000 786.000
320.000 1 06.000
446.000 348.1 17
780.0001
3.842.1171

A ndix?/P Quetta WSE - Final Rewrl. Executive Summarv DDe sag
63.83
6.46 45% 2.93 3.53 25.49 4~~ 14.21 v ,?e 21.44 23% 4.84 1C.83
2.63 22% 0.59 2.04 3.81 43% 1.64 2.11
A.7.2 Summary of Capital Cost Estimates
1.36 4 m 18.76 1 8 . ~ 1 10.74 9.80
1.36 2.72 1,M 0.70 0.41 10.20 1C.19 4.98 3.71 c.85 3.66 5.52 5.54 5.87
1.62 1.01 0.73 1.60 1.04 0.22 0.22
The total capital cost requirements for the realization of above program sum up to US$ 109.31 million, including physical and price contingencies and taxes, but excluding bank charges (capitalized Interest During Construction and Commitment Charges).
More comprehensive details on the estimations of the capital cost requirements to imple- ment above recommended phase 1 projects for improving and developing the Quetta water resources and supply infrastructure, waste water collection and treatment, solid waste management and urban drainage are fully documented in the respective sector re- ports of the present Final Report and more detailed summary tabulations and the pro- posed investment schedule in appendix 1 1, Tables 1 to 5 of the present Volume 1.
Table A.7.14 : Investment Schedule
physicatcontingencies (approx. 15%) priieconlimgencies(avp7%pa)
ValueAddedTax(14%)
DTAL ALL PROJECTS
Interest duw u n s t r u c l i (cspilalsed) Cunrnlrnent charges (capilslised)
RAND TOTAL TO BE FINANCED
I % f I LL RECOMMENOED PHASE 1 PROJECTS
9.57 38% 3.63 5.94 0.20 0.71 2.81 2.n 1.61 1.47 22.48 28% 629 16,19 0.13 0,M 525 599 4.55 5.71 13.42 35% 4.70 8.65 024 0.88 3.76 3.81 2,37 2.38
109.31 36% 38.92 70.40 1,93 7.16 30.58 31.02 1926 19.35
12.M 12.05 0.13 0.67 187 2.88 3,85 2 5 4 2.W 2.03 0,R 0.64 0.42 020 0.05
123.39 32% 38.92 84.48 2.78 8.47 32.88 3421 23,17 21.90
ASE COST (at 1999 prices) thWeol
Waler resources Waler supply Weslc Water Solid Waste B D:airage Technical Asssiance
A.7.3 Financing of the Recommended Phase 1 Program (Herr SEUTE)
At the time, when the financial analysis for the Quetta Water Supply and Environmental Improvement Project was completed, financing arrangements and Bank conditions for financing the proposed Phase 1 program were nor yet settled nor recommended from neither competent authority. Therefore, the present analysis adopts, for the purpose of the present studies, general conditions frequently used for comparable analysis of similar projects in corresponding economic surroundings.
Details on the adopted financing arrangements are elaborated in Volume 6 of the present Final Project Report, summing up to a grand total to be financed of US$ 123.39 million, thereof US$ 33.05 million Government subsidies (or approximately 232%) and US$ 90.34 million external Bank loans, and are tabulated in Appendix 11, Tables 5 to 10 of the pres- ent Executive Summary and summarized as follows:

Quelta WSE - Final Remrt. Executive Sumrnarv Amendix 7 I Pam
EXTERNAL FUNDING
DISBURSEMENT OF PROJECT FUNDS
INTEREST DURING CONSTRUCTION (capitalized)
COMMITMENT CHARGES (capilalized)
I
Table A.7.15 : Financing Plan
42.38 26.86 2.17 4.84 7625
8,09 3.79 0.14 0.00 12.02
120 0.71 0,Ol 0.11 2 0 3
I I I I DRAIN. I
mill i i current U S I WATER I WASTE I SOLK) I TECH. I U I I
t I SUPPLY I WATER 1 WASTE I ASSIST. I PROJECTS
INTERNAL GOVERNMENT SUBSIDIES~ 18.16I 11.51 1 2.17 I 121 I 33.M
TOTAL EXTERNAL FUNDING I 51.681 31,371 2.32 I 4,931 90.34 GRAND TOTAL TO BE FINANCED 69.82 I 42.88 I 4.49 I 6201 123.39

Appendicer Executive Summary
APPENDIX 8 Implementation Schedule

APPENDIX 8 Project Implementation Schedule
I 1
Phase 1 (ADB Project) Phase 2 Phase 3
'3'1 Xl? 2013 2CI-l 2015
Duration
-t
ixlr loratxi i i Well Drilliilg
6. PHASE I IMPLEMENTATON
t
Hyyielir Ed1lCd~li)ll
D. ADDITIONAL LONG-TERM PROGRAM
WS;PillJB Wiill Cmslriic1iilri 22
WATER SUPPLY I

Appendleer Executive Summary
APPENDIX 9 Economic and Flnancial Analyses

Qurlm WSE - final Report. Executive Summary .4ppendix 9 I Page 1
APPENDIX 9: ECONOMIC AND FINANCIAL APPRAISAL
The primary objectives of this analysis are:
to assess the economic and financial viability of the proposed long term water supply and sewerage infrastructure development and the conditions to ensure the economic and financial (and thus technical) sustainability of the investments, and
to assess cost recovery and revenue enhancement issues for strengthening the earning capacity and the financial basis of BWASA for financially sound and sustainable water supply and sewerage operations.
Note, however, that weaknesses in technical, commercial and financial management and performance may not be balanced by simple tariff increase, but require substantial capacity building on management and operational level, which are comprehensively addressed in Volume 5 on Institutional Development And Capacity Building and sum- marized in Chapter 8 of the prcsent Volume 1 of the Final Project Report.
To itchieve these ohjectiws, the prcscnt imtlysis procccds in four steps. i.e.:
Dctcr-min;ition of the ( f i nm~~ iA) Awi-age I~icrcmcnlal Cost. hawd on the proposed long term developmcnt of the water supply and sewerage infrastructure in the project area, including an analysis of the scnsitivity of important systcm parameters on the econom- ics of the infrastructure development.
Discussion of economic issues, to show the economic viability of the proposed devel- opment plans, to demonstrate the needs for improved water supply and sanitation infra- structure and to emphasize the priority which improved water supply and sanitation in- vestments merit to support the living and health conditions of the population and the economic potential in the project area.
Discussion of cost recovery issues and recommendation of revised water and sanitation tariff policies to strengthen the revenue potential of BWASA and to achieve (in the long run) financially self sustained services, with gradual phasing out of public sector subsidies.
Financial projections, to show the development potential of important financial pa- rameters during the decade after the implementation of the proposed phase l projects and the conditions for sustainable sound technical and financial development and op- erations.
The overall results of this analysis show that the proposed long term strategy for the im- plementation as well of improved water supply as of waste water collection and treatment infrastructure in Quetta, and the recommended phase 1 projects proposed for Bank financ- ing, are both economically and financially viable, if the responsible Authorities and BWASA succeed to implement successfully the recommended TECHNICAL ASSIS-

Qucrta WSE - Final Repon. Executive Summary Appendix 9 / Page 2
TANCE programs to support the essential CAPACITY BUILDING for improving the ovcrall technical, commcrcial and financial management and performance, and if appropri- ate sector subsidization, TARIFF AND COST RECOVERY POLICIES are adopted to strengthen the financial basis of the water supply and sanitation operations.
9.1 Water Supply
9.1.1 Financial Average Incremental Cost
Calculated with a discount rate of 1276, the FAIC for the proposed water resources and in- frastructure developmcnt in the Quctta supply area come up to US$ 0.47 (PRs 25.1 1) per m3 of water sold, whereof US$ 0.36 (PRs 19.44) per m3 of water sold is allocated to the use of assets, US$ 0.01 (PRs 0.65) to the required replacement of assets after their useful life and US$ 0.10 (PRs 5.13) per m3 of water sold to the incremental operating and main- tenance cost, and thus are well in line with comparable projects in similar surrounding.
With a break even tariff of US$ 0.465 pcr m3 of watcr sold (at a discount rate of 12%) and an avcrage sales price (tariff) of US$ 0.362 pcr m3 of water sold the financial subsidy \\.oiild hc i n thc nrdcr of l.’S$ 0. I0 (o r P R s 5 .4) per m’of \sitter snld.
l’hc Financ i i i l Intcrnal Katc of R c l u r n . ca1~~ulatc.d \\ i th the 1-ccomnicndcd tariff dc\clop- mcnt. is in thc order of acceptable 8.3 I % .
The results of comprehensive sensitivity calculations suggest that the single most sensitive parameter influencing the economics of the proposed water supply development is the quantity of water sold. If BWASA succeeds to fully mobilize its customer potential e.g. through the provision of sufficient quantities of water and.consumer oriented wate.r supply services, through adequate tariff policies considering the ability and the willingness of the various consumers to pay for potable water, and to dccrease at the same time the water losses in the water supply system to satisfy an increased demand with the available pro- duction and distribution assets, i.e. to increase water sales by say 15% (all other parameters unchanged), compared with the base case, the AIC decrease from US$0.47 per m3 of wa- ter sold US$ 0.40, with respective impacts on the tariff requirements to achieve given fi- nancial objectives.
The Internal Rate of Return, with the proposed w’ater tariffs, improves from 8.41% to 10.33%.
If, on the other hand, the water available for consumption is reduced by 1S%, e.g. due to inadequate water supply services, due to increased water losses in the system andor if the water consumption decreases, e.g. due to unbalanced water tariff policies and (according to the price elasticity of demand) tangible reactions of water consumers on tariff increase, the AIC increases to US$O.S4 per m3 of water sold and the FIRR decreases to 6.28%.

QuclW WSE - Final Report. Executive Summary Appendix 9 / Page 3
The results of the sensitivity calculations also underline the importance of strict cost con- trol, as well of capital investments as of operation and maintenance expenditures, at an adequate level of operation and maintenance (especially also preventive maintenance to sustain the value of the assets and to avoid premature replacement requirements) and the necessity to undertake all efforts to optimize the use of water supply assets in particular also by reducing the high amount of unaccounted-for water and by supporting adequate water use and conservation efforts through appropriate. tariff policies, to improve the water supply services to the population and non domestic users and thus to strengthen the overall earning capacity of the Quetta BWASA.
9.1.2 Economic Considerations
Calculated at constant mid 1999 prices with standard conversion factors at world price numeraire, and considering a depletion premium, a conservative assessment of indirect benefits, and a discount rate of 12%, which may reflect the economic opportunity cost of capital, the ECONOMIC AIC for the proposed projects are in the order of US$0.37 per m3 of water delivered to the final consumers, while the respective financial AIC evaluated above come up to IIS$0.47 per m3 of water sold.
The respective ECONOMIC INTERNAL RATE OF RETURN (EIRK). calculated with the proposed water tariffs, is in the order of 14.01%, compared with the Financial Internal Rate of Return (FIRR) of 8.41%, both suggesting the economic viability of the proposed water infrastructure development.
Investments in water supply and sanitation have been shown to be critical to improving public health. It is estimated that 80% of endemic disability in developing countries is due to diarrheal disease. A review by the World Health Organization demonstrates that im- provements in water supply and sanitation have a direct and significant payoff in reducing diarrheal morbidity: when both water quality and watcr quantity can be improved, diarrheal morbidity rates can be reduced by as much as 37%.
9.1.3 Tariff Recommendations
Based on well defined (and laid down in a binding charter or corporate plan for the water supply utility) socio-economic, operational, development and financial objectives, an ap- propriate tariff system, considering that the water rates for the different consumer catego- ries are set according to their different social characteristics, should support:
adequate water supply to the population at cost, that even the poorer population can af- ford to cover their basic needs of potable water to improve the general health situation of the population and their standard of living.

Quriu WSE - Rnal Report. Execulivc Summary Appendix 9 / Rgc 4
adequate water supply to industry and commerce by providing the production factor in- put “water” in sufficient quantity at acceptable cost to support the activities of the en- terprises and thus to support the economic development in the supply area.
adequate water supply to administration, social institutions and other non-domestic wa- ter consumers to provide the required infrastructure for sound performance of these in- stitutions and services to the community.
the financial objectives of the water supply venture, which for the present financial sce- nario and in accordance with the macro-economic exigencies to phase out water sector subsidies, cspecially also in view of the macro-economic constraints and economic re- structuring efforts, and in accordance with the TOR for the present studies, are set to generate sufficient water revenues to recover operation and maintenance cost of the water supply services after 5 years and to eam depreciation of water supply assets through tariff revenues by 2010.
the operational objectives to generate sufficient recurrent liquidity for continuous and high standard water supply services to the population and non-domestic water consum- ers through sound technical opcrations and preventive maintenance.
thc ;itc‘I ilcm;ind man;igcnicnt oh.jcc.ti\i,s to rcdiiix. C,xL.i.\\ivc IIW 0 1 \\ ;11er and \i.;ttcr \ \ . a s t ap for optimizing the usc of ;r~szis lin:incc.J \\ i th Iimi1cd fin;in~.i ;~l I - C S ~ ~ I I C ~ C ~ S . lor better managing limited wiitcr ircsourcm and for maximizing the hcncfits for :ill, and to control the impacts on waste water production and the finimcial requirements for hygi- enic and environmentally compatible waste water collection and treatment.
The actual lump sum water tariff of PRs 75.- (US$ 1.39) per connection and month neither satisfies the minimum cost covering requirements for sound water supply operations, nor the other postulates of modem tariff policies explained above, especially not the require- ments for stringent control of water wastage and the urgent needs for efficient management of the limited water resources in the Quetta valley.
To better support these issues, a reform of the water and sanitation tariff policies is rec- ommended. We underline that, according to our experience, a tariff system based on bill- ing of metered water consumption is the preferred policy to support the social, the financial and the resources management objectives of modem water supply management.
However, since mctering is actually not generally practiced in Quetta, a complete review of the water tariff policies can only be implemented after universal metering of the water con- sumption is introduced. To do this, the project recommends and anticipates to implement water meters for all service connections. However, according to the implementation sched- ule for the proposed project, this can not be completed before 2004.
To achieve the financial cost covering objectives defined above, we recommend to
0 Maintain the actual lump sum water tariff system only until general metering of water consumption is applied (presumably by 2004/5), but to immediately (effective early 2000) adjust the actual water charges to PRs 100,- per connection and month.
H.\CcnDaWaWPAI(ISTA332WFmd RemrMmY11~. ~mmry+€XECSJM-WP-Smu doc

Quclla WSE - Final Rcporl. Excculivc Summay Appendix 9 I Page 5
consumption t m c (rnYmo)
<15
16 ~ 40 >40
Immediately implement a waste water surcharge of 20% on the water tariff, anticipat- ing the extension of the waste water services recommended under the present project and their financial requirements.
TARIFF LlSS:mB PPsim3
0.05 2.50
0.09 5.00 0.17 9.00
Annually adjust the lump sum water charges in current terms to achieve a PRs 170.- per connection per month level by 2004.
11 -40 >40
avgnotal
Prepare the technical. commercial and legal implementation of water tariffs based on metered billing, including reviewing the tariff policies for water and sanitation within a comprehensive tariff study, latest during 2003 and 2004.
0.07 4.00 0.13 7.00 0.09 4.74
Implement tariff policies based on metered water consumption in 2005 as outlined in the following table.
Recommended Water Tariffs ( current prices of 2005)
I avgltotal I 0.12 5.70 I yard connections
I 4 0 I 0.04 2.00 I
IPublic TaDs I 0.04 2.00 I IPublic Administration I 0.09 5.00 1 Social Institutions I 0.04 2.00 Commercial Enterprises, small I 0.09 5.00
kommercial EnterDrises. bia I 0.17 9.00 I
loverall weighted average per m3 of water sold I 0.12 6.50
Generally accepted guidelines suggest, that the monthly expenses of a household for water and sewerage in developing countries should not exceed 5 6 % of the monthly household income.

We recommend to immediately increase the actual lump sum water rates from PRs 75.- per connection and month to PRs loo.-. with further stepwise annual increases to a PRs 170.- per connection per month level up to 2004. Adding a surplus of 20%: on the water bill for waste water services, and not considering normal increase in household income, the com- bined water and waste water bill would correspond in 2004 to acceptable 4.0% for a low income household and I .a%! for a medium income household.
In 2005, when we recommend to operate and bill water consumption on metered basis (with a surplus of 20% for waste water services), the individual households have the op- portunity to better control their individual water and sanitation bills, compared with lump sum billing. A low income household of 10 persons (say with a monthly income of PRs 5,000.-) using the lifeline quantity of potable water of approximately 30 l/cd would con- sume approx. 10 m3 of water per month. With the recommended water tariff for this con- sumption band of PRs 2.5 per m3 of water consumed, and the recommended 25% surplus for waste water, this would correspond to PRs 35,- or less than 1% of the household in- come.
Only if considerably more water is used (by lower income households), the monthly water and sanitation bill may exceed the normal ability to pay. In this case. i t may be expected that the \v;itcr consumer. wi th ;I tariff system based on metered consumption. tries to re- diic.1: the monrhly \\ ;itci. h i l l l y i.tdiii.ing the \ \ . i i t L * i - ~ . ~ . i i i ~ t i i i i i ~ t i ( ~ n . ;in c1I.et.t. wt1ii.h is dcsir- ablc and ;in ob.jec.ti\e 01’ thc rc~~oninicnclcd 1:irit.f policy to bcttcI tipp poi^ thc n i ; ~ n a p ~ r n ~ ~ n t of the limited watci- resources i n thc Quctta hasin.
9.1.4 Financial Projections
Revenue Potential
The projection of the revenue potential from water sales is based on the anticipated quan- tity of water consumption (without non revenue water) in the Quetta water supply area, the expected development of connections and on the recommended tariff policies, i.e. to step- wise increase the actual lump sum rate of PRs 75.- (or US$ 1.85) per connection and month to PRs 170.- (US$ 3.15) per connection and month up to 2004. Thereafter (2005), as soon as the general metering recommended under the project is implemented, to change to a tariff policy based on metered monthly water consumption, to support water resources management and, phasing out public subsidies, to cover operation and maintenance cost up to 2005 at current prices. The initial tariff in 7005 on metered basis would be approxi- mately US$ 0.12 or PRs 6.5 per m3 of water consumed. Thereafter the scenario provides for annual tariff increases to make up for inflation, to cover recurrent O&M expenditures and to achieve coverage of depreciation by 2010.
Further to the revenues generated from the lump sum charges during a first phase and the metered water sales from 2005 onwards, the assessment of the revenue potential in the projected income statements includes “revenues from new connections”, assuming that the expected number of new connections are pre-financed by the project up to 2005, and that the cost of some US$ 105 per connection (constant 1999 prices) are recovered from the new customers through a cost covering connection charge, annually adjusted for inflation.

Qucira WSE - Final Rcpon. Exrcutive Summary Appendix 9 I Page 7
Depreciation
The weighted annual depreciation for the existing water supply assets and the proposed phase I extension projects is in the order of approximately 2.9% p.a. on the re-valued gross fixed assets in operation of the Quetta water supply infrastructure.
Interest Expenses
Details on the assumptions for the projection of the interest expenses account in the in- come statements are laid down under the following heading “Project Financing”. Interest expenses, in the present scenario, are charged to operations, while interest during con- struction are capitalised and financed by the project loan.
The proje.ction of the income statements in this scenario for the integrated Quetta water siipply adopts that no direct t;ixcs wi l l he h i e d on water supply opcrations. (For stipplies ;ind sci-\,icx-s i i idi i.cct t;iscs of I-l‘.,; (\!AT) ;II-C inclt idcd in thc coxt cstim;itc?;).
Income Statcments
BWASA’s Income Statements and the monitoring indicators, projected with above as- sumptions, suggest that substantial public subsidization, as well of capital investments into the water supply infrastructure as of the water supply operations, will be required to pro- vide the population of Quetta with acceptable potable water supply services. However, such subsidies from severely limited puhlic financial resources must be expected to seri- ously restrict the urgently required financial means, and thus the development opportuni- ties and requirements, in other socially and economically vital sectors such as education. health, poverty infrastructure, etc. Public water sector subsidies can only be phased out in medium and long term if adequate water tariff policies are adopted as proposed above, supported by efficient professional technical and financial management and operations.

Quetta WSF. - Rnal Krpcnt. Esecurivc Summary Appcndin 9 I Papc 8
(MILLION CURRENT US$) WATER SALES (10% m3 p.a.)
NUMBER OF CONNECTIONS (1P3 number) AVERAGE TARIFF (US$ per 17-13 of water sold)
NEW CONNECTIONS (1P3 number) FIXED MONTHLY CHARGE PER CONNECTION
NEW CONNECTION CHARGE REVENUES FROM WATER SALES
REVENUES FROM NEW CONNECTIONS REVENUES FROM FIXED CONNECTION CHARGE
TOTAL REVENUE POTENTIAL OPERATING EXPENSES INCOME BEFORE DEPRECIATION AND INTEREST
DEPRECIATION (AVG 2.9% OF GR. FIX. ASSETS)
INTERESTEXPENSES INCOME FROM OPERATIONS
INCOME BEFORE TAX NET INCOME ( minus = operational u ts id ies) OPERATING RATIO (REVi(08MtDkPRECIA7ION) RETURN ON AVERAGE EQUITY (%)
RETURN ON AVG. GROSS FIXED ASSETS (%)
LOCAL INFLATION
2000 2005 2010 201 5 11.43 27.95 27.95 27.95
0.12 0.35 0.47 44.38 74.38 109.13 145.63
7.25 6.95 7.30 1.85
152.00 211.00 269.00 3.35 9.78 13.14 1.10 1.47 1.96
0.99 0.99 4.46 11.25 15.10 1.32 4.06 5.41 6.84
-0.34 0.40 5.84 8.26 0.64 2.95 4.33 5.52
-0.98 -2.55 1.51 2.74 2.83 2.40
-0.98 -2.55 -1.32 0.34 -0.58 -2.55 -1.32 0.34
0.50 0.64 1.16 : .;2
-4.3% -5.0% -1.6% 0.7% -4.0% -2.3% -0.8% 0.470 11 .O% 8.0% 5.0% 5.0%
Fixe.d Assets
Actually no conclusive asset accounting, depreciation and asset management is practiced by the Quetta BWASA A first assessment of the existing water supply assets, for the pur- pose of the present financial scenario, based on a physical estimate of the existing assets and their preliminary valuation at the replacement value, amounting to some US$ 36.28, and the net present asset value (considering the age and the useful state of the assets), amounting to some US$ 22.02 is considered for the present pro-forma balance sheet pro- jections and estimates of depreciation.
Capital investments into the proposcd Phase 1 water resources and supply infrastructure in the Quetta project area sum up to US$ 60.53, including taxes, physical and price contin- gencies.

Quctta WSE - Final Report. Ewcutirc Summary Appendix 9 I Page 9
TABLE A.9.2 : Summary Of Proposed Phase 1 Water Infrastructure In- vestments
Description TOTAL foreign cost indir. loc. cost dir. loc. cost million constant mid 19999 US$ COST Yo US$ % US$ % US$
WATER RESOURCE INVESTIGATION 3.01 58% 1.75 7% 0.21 35% 1.05
PHASE 1 IMPLEMENTATION
WATER RESOURCE DEVELOPMENT 3.45 34% 1.18 22% 0.78 43% 1.49 WATER SUPPLY EXTENSIONS 29.48 48% 14.21 15% 4.53 36% 10.74
BASE COST 35.94 17.14 5.52 13.29 Value added taxes (14% on base cost) 5.03 2.40 0.77 1.86
COST INCLUDING TAXES 40.97 19.54 6.29 15.15 Contingencies (1 5% on cost incl. Taxes) 6.1 5 2.93 0.94 2.27
COST INCL. TAXES AND CONT. 47.12 22.47 7.23 17.42 Price contingencies 13.41 6.40 2.06 4.96
GRAND TOTAL 60.53 28.87 9.29 22.37
Capital inwstmcnts foi thc implctiientation of phasc 1 of thc pr.opos~=d nater $.upply intra- struc"ture dewlopnient i n Quctta a]-c initially postcd to the ~ o r k i n progress account of thc pro-forma balance shccts and transfcncd to the gross f ixcd assct account in the year fol- lowing the commissioning of the respective project progress.
Gross fixed assets are revalued with the weighted average of the expected local and foreign inflation rate.
Depreciation of revalued gross fixed assets in this scenario is 2.9% p.a.
Financing of Phase 1 Water Infrastructure Development
Detailed financing arrangements for the proposed phase 1 water resources and supply in- frastructure development in the Quetta supply area were not yet settled at the time when the present study has been elaborated. Therefor the present scenario assumes standard fi- nancing arrangements normally used for similar analysis of water projects in similar sur- roundings:
30% of the capital requirements for the implementation of the anticipated water supply projects, or US$ 18.16 million (corresponding to PRs 980.64 million at an exchange rate of US$ 1.- = PRs 54.-), are finance.d by internal sources, e.g. by non-reimbursable, non-interest Government subsidies (details on available public financial resources could not made available during project preparation).
70% of the capital requirements, or US$ 42.38 million, are financed by external loans, at the following conditions:

Quctts WSE - Wnal Repon. Executive Surnrnarv Appendix 0 1 Page 10
million current US$ WATER SUPPLY
EXTERNAL FUNDING
INTERNAL GOVERNMENT SUBSIDIES
0
0
Interest rate: 6.0% per annum on outstanding depts. Loan period: 30 years, including 6 years of grace during the water rcsources inves- tigations and the construction period of the 2000 to 2005 implementation phase. Commitment charges: 1.0% per annum on committed, but undrawn loan portions, capitalized and increasing the loan amount by US$ 1.2 million. Interest During Construction: 6.0% on drawn loan portions, capitalized and in- creasing the loan amount by US$ 8.09 million.
TOTAL 60.54 42.38 18.16
TABLE A.9.3 : Summary Of Financing Plan For Phase 1 Water Infra- structure Development
EXTERNAL FUNDING
DISBURSEMENT OF PROJECT FUNDS
INTEREST DURING CONSTRUCTION (Capitalized)
COMMITMENT CkARGES (capiIal,zed)
1 U A L 1C BE FINANCEDBY E X l . FUND.
.ONG l € R M DEBT
42.38 8.09 1.70
51.66
I GRAND TOTAL TO BE FINANCEDI 69.82
ZOO0 2001 2002 2003 2004 2005 1.91 4.72 19.08 18.63 9.05 7.15 1.34 3.30 13.36 13.04 6.34 5.01 0.57 1.42 5.72 5.59 2.72 2.15
1.34 3.30 13.36 13.04 6.34 5.01 0.08 0.28 1.08 1.86 2.24 2.54 0.41 0.38 0.24 0.11 0.05 1 63 3.96 14.68 1502 E 63 7.55 1.83 5.79 20.47 35.48 44.11 51.66
2.40 5.38 20.40 20.61 11 34 9.69 I
Further to the foregoing assumptions on project financing, the projections of the sources and application of funds statements and the projection of the pro-forma balance sheets are based on the following assumptions:
Other Capital Exmnditures
The scenario assumes that, after the implementation phase of the proposed projects in 2006, annually some US$ 0.25 million (in current terms) will be invested in general water supply assets, distribution network, pre-financing of house connections (which, in this sce- nario, will be recovered through cost covering connection charges), etc and financed by internally generated funds.
Replacements
This scenario assumes that approximately 0.5% of the water supply assets in operation will require to be replaced annually and are accounted for in current terms (revalued with the expected local inflation rate) and expected to be financed by internally generated funds.

Cash and Banks
(MILLION CURRENT US$)
SOURCES OF FUNDS N€T INCOME
DEPRECIATION INTEREST
NTERNAL CASH GENERATION 'ROPOSED PROJECT
EXTERNAL FUNDING INTERNAL FUNDING
rOTAL FINANCE rOTAL CASH INFLOW
-. APPLICATION __ OF FUNDS lOTAL PROPOSED PROJECT
OTHER CAPITAL EXPENDITURES INCREASE IN OTHER ASSETS
INCREASE IN PAYABLES (-) WORKING CAPITAL NEEDS
'ROPOSED PROJECT LOAN AMORTIZATION
INTEREST 'OTAL DEBT SERVICE
The cash and banks account is the cnd year cash balance calculated in the projected sources and application of funds statements.
2000 2001 2002 2003 2004 2005 2010 2015
-0.98 -1.25 -0.83 -1.54 -2.30 -2.55 -1.32 0.34 0.64 0.76 0.99 1.69 2.44 2.95 4.33 5.52
2.83 2.40
-0.34 -0.49 0.16 0.15 0.15 0.40 5.84 8.26
1.83 3.96 14.68 15.02 8.63 7.55 0.57 1.42 5.72 5.59 2.72 2.15 2.40 5.38 20.40 20.61 11.34 9.69 2.06 4.89 20 56 20.76 11.49 10.09 5.84 8.26
2.40 5.38 20.40 20.61 11.34 9.69 0.33 0.42
0.33 0.13 0.36 0.20 0.22 0.31 0.39 0.23 -0.12 -0.06 -0.07 -0.08 -0.09 -1.11 -0.11 -0.20 0.21 0.06 0.29 0.12 0.14 -0.80 0.29 0.03
1.28 1.72 2.83 2.40 4.12 4.12
TABLE A.9.4 : Projected Sources and Application of Funds Statements
CASH, BEGINNING CASH, ENDING
DEBT SERVICE RATIO
-0.55 -1.10 -1.23 -1.20 -1.18 -8.83 -1.60 -0.55 -1.10 -1.23 -1.20 -1.18 0.01 -8.42 1.18
1.42 2.01
I REPMCEMENTS~ 0.71 0.91 TOTAL CASH OUTFLOW I 2.61 5.44 20.69 20.73 11.48 8.89 5.44 5.48 NET CASH INFLOW I -0.55 -0.55 -0.13 0.03 0.01 1.20 0.40 2.78
Accounts Receivable
The projection assumes that, through improved customer management, billing and collec- tion operations and performance the accounts receivable can be brought down to a 100 days level up to 2003 and maintained on this level throughout the projection period.

Qurtln WSE - Final Repon. Executive Summary Appendix 9 I Page I2
Inventory
The projection of the inventory account assumes that the utility will maintain a stock of operation and maintenance materials required for 3 months of normal operations.
Capital
The capital account is assumed to increase only as a result of retained earnings.
Euuity
The equity account is assumed to increase according to the Government subsidies invested for the developmcnt of the Quetta water infrastructure.
Accounts Payable
Accounts payablc are estimated at 2 months operating expcnses other than personnel cost.
Current Portion of Long Term Debt
Increase in Other Asscts
Increase in other asscts in the sources and application of funds statements includes ac- counts receivable and inventory.

Quclu WSE - Find Report. Excrutivr Summary Apprndix 9 I Page 13
- (MILLION CURRENT US$) 2000 2001 2002 2003 2004 2005 2010 2015
REVALUED GROSS FIXED ASSETS 22.02 26.33 34.06 58.32 84.23 101.65 149.27 190.18 LESS ACCUMULATED DEPRECIATION 0.64 1.40 2.39 4.08 6.52 9.47 28.91 54.00
NET FIXED ASSETS 21.38 24.93 31.67 54.24 77.71 92.18 120.35 136.18 WORK IN PROGRESS 2.40 5.38 20.40 20.61 11.34 9.69
SUBTOTAL FIXED ASSETS 23.79 30.30 52.08 74.85 89.05 101.88 120.35 136.18 CASH8BANKS -0.55 -1.10 -1.23 -1.20 -1.18 0.01 -8.42 1.18
ACCOUNTSRECEIVABLE 0.27 0.35 0.66 0.81 0.97 1.22 3.08 4.14 INVENTORY 0.06 0.10 0.15 0.20 0.26 0.33 0.43 0.53
SUBTOTAL CURRENT ASSETS -0.22 6.64 -0.41 -0.18 0.05 1.56 -4.92 5.85 TOTAL ASSETS 23.56 29.66 51.66 74.67 89.10 103.44 115.44 142.02
CAPITAL -0.98 -2.23 -3.05 -4.59 -6.89 -9.44 -25.58 -26.89 EQUITY 22.60 24.01 29.74 35.33 38.04 40.19 40.19 40.19
REVALUATION SURPLUS 1.91 4.26 8.12 13.42 19.50 52.86 87.73 SUBTOTAL EQUITY 21.62 23.69 30.95 38.85 44.58 50.25 67.47 101.03
ACCOUNTS PAYABLE 0.12 0.18 0.25 0.33 0.42 0.51 0.68 0.86 CURRENT PORTION OF LONG TERM DEBT 1.02 1.36 1.88
SUBlOlAL CURRENT LIABILIlIES 0.12 0.18 0.25 0.33 0.42 1.53 204 2.74
1 O N G l L R M DEBT EXlERNAL FLVDING 1.83 5.79 20.47 35.48 44.11 51.66 45.93 38.26 TOTAL LIABILITIES 1.54 5.97 20.72 35.61 44.53 53.19 47.97 41.00 TOTAL LIABILITIES AND EQUITY
DEBT/EQUITY RATIO CURRENT RATIO (cur. asseldcur. liabilities)
23.56 29.66 51.66 74.67 89.10 103.44 115.44 142.02 0.24 0.66 0.91 0.99 1.03 0.68 0.38
-3.57 -1.66 -0.56 0.12 1.02 -2.41 2.14
The above projections of the income statements over the next 10 years after the expected completion and entering into operation of the recommended water supply projects, the projected sources and application of funds statements and the pro-forma balance sheets, suggest an independent financial development poiential of the Quetta water supply, pro- vided viable water tariffs policies as recommended earlier in this report are implemented, supported by a coherent subsidisation policy to secure sound water supply operations (with the long term objective to phase out public water sector subsidies), and provided manage- ment and operations of BWASA are improved through the recommended capacity building programs. Nevertheless, mainly due to the expected tariff policy of recovering O&M cost after 5 years and depreciation after 10 years, noticeable weaknesses of overall financial performance and the nceds for public financial subsidies of the water supply in Quetta over the next decade are evident.

Quetla WSE - Final Repon. Executive Surnnlary Apprndix 9 I Page 14
9.2 Waste Water
9.2.1 Financial Average Incremental Cost
Calculated with a discount rate of I?%, the AIC for the proposed extension of improved waste water infrastructure in Quetta suggest that BWASA will be required to increase its water and sewer tariffs to provide improved services to its clients and to achieve sound technical and financial performance. It should be noted, however, that (alone for social rea- sons and the exigencies of optimal allocation of limited financial resources) it is hardly ac- ceptable that insufficiencies in technical and financial performance are compensated by simple tariff increase.
Following the approach of the foregoing water sector analysis, to test the sensitivity of various project parameters with regard to their impact on the economics of the proposed waste water infrastructure development, and thus the tariff requirements to achieve given financial cost recovery objectives, we compare (considering the recommendation that the waste water tariffs are directly linked to water salcs) the FAIC, evaluated above with the quantity of water sold to the population in the project area as reference parameter, with the FAIC adopting 3s sensitivity factor of IS%.
Thr rcwlls 0 1 Ihcsi' w i > i t i \ . i t ! i~alt.ul;i!ions wgpcst tha t . i i i ad i l i t i c~n to ;i scn~ihlc rrdiic.tit~n 0 1 i n vcs t mc 11 t L'( )b t I h I( )ti ;.I1 ;I 1 i' :]st cost 111 ;in 11 i 11 g :I p p ( u c : ti ( p Iu \.i d i ng h0M.c w r I tic x i me scrvice lcvel and quality), the single most scnsitive p;ii-;imcter influencing the required waste wiitcr tariff level to achicvc givcn financial objectives, cost recovery targcts and sector subsidization policies is the quantity of water sold to the population, if the waste water tariffs are linked to the water consumption.
If BWASA succeeds to improve the water supply services by say 158, combined with a corresponding improvement of the waste water services (all other parameters unchanged), compared with the base case, the FAIC of the proposed waste water infrastructure devel- opment decrease from the base case by 163; from US$0.12 (PRs 6.7) per m3 of water con- sumed to US$ 0.108 (Prs 5.8), with respective impacts on the economics of the utilities and the tariff requirements to achieve the financial cost covering objectives.
The Financial Internal Rate of Return (FIRR) in this case, calculated with the recom- mended waste water tariffs of a 25% surplus on the water bill, would improve from ac- ceptable 6.31% (base case) to 7.68%.
A considerable more sensitive impact must be expected, if the quantity of water sold is re- duced by 15% (with direct impacts on revenue gcncration and the economics of the waste water infrastructure). In this case (all other parameters unchanged) the AIC, compared with the base case, increase by some 20.0% to US$ 0.15 (PRs 7.8) per m3 of water sold and the FLRR would deteriorate to 4.93%.
It should also be noted that a reduction of waste water collection and treatment proportion- ally reduces the availability of recycled waste water for imgation purposes, thus hampering the objectives of efficient management of the scarce ground water resources in the Quetta Basin through substitution of ground water for imgation by recycled waste water. It should

Qucila WSE - Rnal Rcpon. Excculivc Summary Appendix 9 / Page I5
further be noted, that a re.duction of waste water collection and treatment below the system capacities also results in noticeable reductions of indirect project benefits such as im- provement of living and health conditions of the population in the service area, and would hurt the exigencies of optimal allocation and use of assets.
9.2.2 Economic Considerations
Calculated with analog assumptions as used for the water supply analysis and a discount rate of 12%, the ECONOMIC AIC for the proposed wate water projects are in the order of US$ 0.07 (PRs 3.8) per m3 of water delivered to the final consumers, while the respective financial AIC for waste water collection and treatment come up to US$ 0.12 (PRs 6.7) per m3 of water sold.
The respective ECONOMIC Internal Rate of Return (EIRR), calculated with the proposed waste water tariffs as 25% surplus on the water bill, is in the order of 14.52%. compared with the Financial Internal Rate of Return (FIRR) of 6.31%. underlining the economic vi- ability of the proposed project.
Technically a n d cn\~ii-c~nmentally sound and hyicnic \ws tc \viiter discharge is of predomi- n a n t iiiiporliiii~~c to :I\ oid t h a t Ihi.turph inl.rrawd ;~nd un~xinri~oltcd u ;ilrtc u ; I I L Y produc.tion ;ind disL.h;rrgt. Ihc Ii!picnic 4 t u a t i o n o f thc popt1l;ition is ncy t i \ c ly clicc.tcd. 'The uncwn- trolled discharge o f unti-catcd domestic :ind industrial waste water into thc limited drinking water resources (eithcr directly andor indircctly through percolation into the underground water resources) might cause considerable economic cost and irreversible environmental damages, but also direct financial cost, such as considerably increased capital cost in water production and raw water treatmcnt cost to provide hygienically clean drinking water to the population, and extensive cost for the rehabilitation of environmental damages.
Though adequate sewerage infrastructure requires capital investments which often exceed those for water supply infrastructure, the economic benefits of waste water projects and the savings in other vital sectors, e.g. for water supply treatment, public and private health care infrastructure and environmental preservation, justify and require these expenditures, and often even require higher priority on sanitation projects than on water supply. Safe and hy- gienic water supply and sanitation has been shown to be highly effective in reducing the incidences of water and sewer related diseases and to be effective in controlling cholera, typhoid, giardiasis and a variety of other diseases and it is obvious, that adequate and safe water supply and sanitation, through gcnerally improved health conditions, decreases the burden of sickness to the individual, the family and the economy, increases the economic productivity of the population and their earning capacity and decreases the cost for medical infrastructure and services to the society as a whole.
9.2.3 Tariff Recommendations
We recommend, in line with wide spread practices all over the world and considering the limited ability and willingness to pay for sewerage services, to link the waste water charges directly to the water consumption and to charge for waste water collection and treatment a

Qicltn WSE - Rnal Hrpui. Eircutire Summary Appendix 9 I Page 16
general surplus on all water Consumption in the order of 3% on all water bill. According to the cost recovery and subsidization policies defined by the competent authorities for this service, this surplus could gradually be increased to the AIC level.
In this case, the FIRR of the waste water operations would be in the acceptable order of 6.31%.
The main advantages to link waste water charges to water consumption (instead of di- rectly/scparately charging for the wastewater services) include:
if waste water charges are levied exclusively/separately from water supply services, people will try by any means to escape this payment,
0 if, on the other hand, waste water charges are linked to all water consumption (even for those consumers, who are not yet connected to the sewer system), water consumers, usually used to pay for their water consumption, will easier accept to connect to the waste Water system, if they have to pay for such charges anyway,
a joint watedwaste water bill would further support the important objective of water resources management through cutting off of excess water use and reduction of water wastage (which not only helps to save scarce water resources, but also helps to reduce the necds for water and waste water assets and the respective capital requirements),
joint management of water and waste water charges results in more cost effective ad- ministration, billing and collection (however, i t should be emphasized, that in any case the accounts for water supply and sanitation services should be strictly separated in distinct cost/profit centers).
In view of the forthcoming waste water projects, this surcharge on water consumption for w'aste water services should be implemented immediately in small, acceptable increments (say 9% in 2001, 10% in 7002, 15% in 2003 and 20% in 7004 and thereafter, until further revision of tariffs, which anyway should be reviewed annually).
Ability to pay considerations are included in above respective discussion of the recom- mended water tariffs.
The introduction of the recommended waste water charges should be preceded by publicity campaigns to increase the awareness of the population for the needs and the individual benefits of hygienic discharge of waste water, but also, at the same time, for the require- ments to pay for such services improving the general and individual living conditions, in- cluding the savings in cost of sickness and for medical care in a healthier environment, through adequate waste water collection and trcatment operations and services, which

Quclia WSE - Rnal Rcpun. Executive Summary Apprndix 9 / Page 17
again, analogous to water supply, can only be delivered at the required high quality stan- dard. i f the consumers pay for such services.
We further recommend to charge a tariff of PRs 10,- per m3 of treatedlrecycled waste water delivered from the waste water treatment plant for irrigation purposes, to support the fi- nancial equilibrium of the sanitation operations and to enable phasing out public sector subsidies, considering that irrigation water is a production factor the cost for which are normally camed on in the sales prices of the profit generating products, and not subsidized by the community through public budgets.
9.2.4 Financial Projections
Similar to the approach in the foregoing analysis of the recommended water resources and supply infrastructure development, this analysis of the recommended waste water invest- ments undertakes to establish a financial scenario for assessing the impacts of the imple- mentation of the proposed phase 1 waste water projects on the financial performance po- tential of BWASA's sewerage operations, using the same h:isic assumptions as used for the financial water supply projections.
The wcighted annual dcpi-cciiition fur the cxisting M astc u atcr assets and the proposed phase 1 extension projccts is in thc ordcr of iipproximately 2.5%: p.a. on the re-valued gross fixed assets in operation of the Quetta water supply infrastructure.
Income Statements
The Income Statements, projected with above assumptions, suggests that substantial public subsidization, as well of capital investments into the waste water infrastructure as of the waste water operations, will be required to provide the population of Quetta with accept- able waste water services. However, such subsidies from severely limited public financial resources must be expected to seriously restrict the urgently required financial means, and thus the development opportunities and requirements, in other socially and economically vital sectors such as education, health, poverty infrastructure, etc. Public waste water sub- sidies can only be phased out in medium and long term if adequate tariff policies are adopted, supported by efficient professional technical and financial management and op- erations of the waste water sector.

Quctla WSE - Final Repon. Exrculiue Summary Appendix 9 I Page I8
(MILLION CURRENT US$) 2000 2004 2005 201 0 2015 WATER SALES (10% m3 p.a.) 11.43 24.90 27.95 27.95 27.95
NUMBER OF CONNECTIONS (1P3 number) 6.17 17.80 20.71 37.09 48.49 NEW CONNECTIONS (1P3 number) 2.91 2.91 3.28 2.28
REVENUES FROM WASTE WATER SURCHARGE 0.77 2.52 5.59
TOTAL REVENUE POTENTIAL 0.02 0.17 0.77 2.52 5.59 OPERATING EXPENSES 0.74 1.55 INCOME BEFORE DEPRECIATION AND INTEREST 0.02 0.17 0.77 1.77 4.04
DEPRECIATION (2.5% OF GR. FIX. ASSETS) 0.10 0.64 0.98 1.77 2.27 INCOME FROM OPERATIONS -0.08 -0.47 -0.21 0.01 1.77
INTERESTEXPENSES 1.73 1.49 NET INCOME (minus = operational subsidies) -0.08 -0.47 -0.21 -1.73 0.28 OPERATING RATIO (REV/(O&M+DEPRECIATION) 0.21 0.26 0.78 1 .oo 1.46
AVERAGE TARIFF (US$ per m3 of water sold) 0.03 0.09 0.20
FIXED MONTHLY CHARGE PER WATER CONNECTION 0.28 0.79
REVENUES FROM NEW CONNECTIONS
RETURN ON AVERAGE EQUITY (?&) - 1 .9% -2.7% -1.1% -5.5% 1.5% RETURN ON AVG. GROSS FIXED ASSETS ("0) - 1 . 9 o . c -1.5?0 -0.40G .2.l% 0.6%
1 OCAL INFLAl ION 11 (I'C 8.6% 6 00,c 5. (!"D 5.0'0 -
Fixed Assets
Actually no conclusive asset accounting, depreciation and asset management is practiced by the Quetta BWASA, neither in the water supply sector nor in the sewerage sector. A first assessment of the existing waste water assets, for the purpose of the present financial scenario. based on the known length of the existing sewer system, land and other waste water assets, and their preliminary valuation at the replacement value, amounting to a total of some US$ 3.99 million, is considered for the present pro-forma balance sheet projec- tions.
Capital investments into the proposed Phase 1 waste water infrastructure in the Quetta project area are summing up to US$38.38 million.

Quctta WSE - Final Report. Executivr Summary Appendix 1 Page 19
TABLE A.9.7 : Summary Of Proposed Phase 1 Waste Water Investments
38.38
(constant 10' US$ of mid 1999)
Rehabilitation Treatment plant - civil works Treatment plant - equipment Sewers Cars, Machines Land acquisition Engineering
23'i0 8.65 12% 4.67 65% 25.05
TOTAL BASE COST
physical contingencies (1 5%) price contingencies (avg 7% pa)
Value Added Tax (140k)
]TOTAL WASTE WATER PROJECT source: Volume 2. Section C
TOTAL foreign cost indir. LOC. cost dir. loc. cost 1 Yo US$ % US$ O/O US$ 1 0.14 6.06 0.21
13.12 0.41
1.50
10% 0.01 10% 0.01 80% 0.11 20% 1.21 10% 0.61 70% 4.24 70% 0.15 10% 0.02 20% 0.04 15% 1.97 15% 1.97 70% 9.18 90% 0.37 10% 0.04
75% 1.13 25% 0.38 100%
I 21.44 23% 4.84 12% 2.61 65% 14.00 I 3.22 9.01 4.71
0.73 0.39 2.10 2.03 1.10 5.00 1.06 0.57 3.08
Capital investments for the implementation of phase I of the proposed waste water infra- structure development in Quetta are initially posted to the work in progress account of the pro-forma balance sheets and transferred to the gross fixed asset account in the year fol- lowing the commissioning of the respective project progress.
Gross fixed assets are revalued with the weighted average of the expected local and foreign inflation rate.
Financing of Phase 1 Waste Water Infrastructure Development
Detailed financing arrangements for the proposed phase 1 waste water infrastructure de- velopment in the Quetta supply area were not yet settled at the time when the present study has been elaborated. Therefor the present scenario assumes standard financing arrange- ments for similar analysis of waste water in similar surroundings:

Qur~ta WSF. - Rnal Repon. Excculive Summary Appendix 9 I P a p 20
r
million current US$ TOTAL WASTE WATER COLLECTION AND TREATMENT 38.38
EXTERNAL FUNDING 26.86 INTERNAL GOVERNMENT SUBSIDIES 11.51
EXTERNAL FUNDING DISBURSEMENT OF PROJECT FUNDS 26.86
INTEREST DURING CONSTRUCTION (capitalized) 3.79
31.37 COMMITMENT CHARGES (capitalized) 0.71
TOTAL TO BE FINANCED BY EXT. FUND. LONG TERM DEBT
GRANDTOTALTO BE FINANCED 42.88
2001 2002 2003 2004 2005 1.28 5.88 9.49 10.19 11.55 0.89 4.11 6.64 7.13 8.08 0.38 1.76 2.85 3.06 3.46
0.89 4.11 6.64 7.13 8.08 0.05 0.30 0.70 1.13 1.61 0.26 0.22 0.15 0.08 - 1.21 4.63 7.49 8.34 9.70 1.21 5.84 13.33 21.67 31.37 1.59 6.40 10.34 11.39 13.16
Further to the foregoing assumptions on project financing, the projections of the sources and application of funds statements and the proje.ction of the pro-forma balance sheets are based on the following assumptions:
Other Capital Expenditures
The scenario assumes that, after the implementation phase of the proposed projects in 2006, annually some US$ 0.1 million (in current terms) will be invested in general waste water assets, wate water collector system, house connections (which, in this scenario, will not be recovered directly through connection charges to encourage the population to con- nect to the waste water system, but indirectly during a first phase through subsidies and later indirectly through waste water tariffs), etc and financed by internally generated funds.
Replacements
This scenario assumes that from 3006 onwards approximately 0.5% of the waste water as- sets in operation will require to be replaced annually and are accounted for in current terms (revalued with the expected local inflation rate) and expected to be financed by internally generated funds

Cash and Banks
SOURCES OF FUNDS NET INCOME
DEPRECIATION INTEREST
INTERNAL CASH GENERATION PROPOSEDPROJECT
EXTERNAL FUNDING INTERNAL FUNDING
The cash and banks account is thc end year cash balance calculated in the projected sources and application of funds statements.
-0.08 -0.06 -0.08 -0.22 -0.47 -0.21 -1.73 0.28 0.10 0.1 1 0.16 0.34 0.64 0.98 1.77 2.27
1.73 1.49 0.02 0.04 0.08 0.12 0.17 0.n 1.77 4.04
1.21 4.63 7.49 8.34 9.70 0.38 1.76 2.85 3.06 3.46
TABLE A.9.9 : Projected Sources and Application of Funds Statements
TOTAL FINANCE TOTAL CASH INFLOW
APPLICATION OF FUNDS
I lMlLLlON CURRENT US$) I 2000 2001 2002 2003 2004 2005 2010 2015
1.59 6.40 10.34 11.39 13.16 0.02 1.63 6.47 10.45 11.56 13.93 1.77 4.04
107AL PROPOSED PROJE-CT OTHER CAPITAL EXPENDITURES
INCREASE IN OTHER ASSETS INCREASE IN PAYABLES (-) WORKING CAPITAL NEEDS
PROPOSEDPROJECT LOAN AMORTIZATION
INTEREST
REPLACEMENTS TOTAL DEBT SERVICE
TOTAL CASH OUTFLOW NET CASH INFLOW
CASH, BEGINNING CASH, ENDING
DEBT SERVICE RATIO
1 5 9 E.40 1054 11 39 13.16
0.23 0.30 0.01 0.01 0.01 0.01 0.16 0.10 0.18
-0.57 -0.05 -0.93 0.01 0.01 0.01 0.01 -0.41 0.05 -0.75
0.72 0.97 1.73 1.49 2.45 2.45 0.34 0.43
1 .60 6.41 10.35 11.41 12.75 3.07 2.43 0.02 0.04 0.07 0.1 1 0.15 1.18 -1.30 1.60
0.02 0.06 0.13 0.23 0.39 -6.35 -9.62 0.02 0.06 0.13 0.23 0.39 1.56 -7.64 -8.02
0.72 1.65
Accounts Receivable
The projection assumes that, through improved customer management, billing and collec- tion operations and performance the accounts receivable can be brought down to a 100 days level up to 7003 and maintained on this level throughout the projection period.

Qurlta WSE - Final Report. Executive Sumrnar_v Apprndix 6) / Page 22
Inventory
The projection of the inventory account assumes that the utility will maintain a stock of operation and maintenance materials required for 3 months of normal operations.
CaDital
The capital account is assumed to increase only as a result of retained earnings.
The equity account is assumed to increase according to the Government subsidies invested for the development of the Quetta water infrastructure.
Accounts Payable
Accounts payable are estimated at 2 months operating expenses other than personnel cost.
Current Portion of Long Term Debt
Increase in Other Assets
Increase in other assets in the sources and application of funds statements includes ac- counts receivable and inventory.

Quclw WSE - Rnal Krpon. Executive Summary Appcndix 9 I Page 23
(MILLION CURRENT US$) 2000 2001 2002 2003 2004 2005 2010 2015 REVALUED GROSS FIXED ASSETS 3.99 4.30 6.33 13.63 25.57 39.32 70.72 90.61
LESS ACCUMULATED DEPRECIATION 0.10 0.21 0.37 0.71 1.35 2.33 10.25 20.53 NET FIXED ASSETS 3.89 4.09 5.96 12.92 24.23 36.99 60.47 70.07
WORK IN PROGRESS 1.59 6.40 10.34 11.39 13.16 SUBTOTAL FIXED ASSETS 3.89 5.68 12.36 23.26 35.62 50.15 60.47 70.07
CASH& BANKS 0.02 0.06 0.13 0.23 0.39 1.56 -7.64 -8.02 ACCOUNTS RECEIVABLE 0.01 0.01 0.02 0.03 0.05 0.21 0.69 1.53
INVENTORY 0.10 0.22
SUBTOTAL CURRENT ASSETS 0.03 0.07 0.15 0.26 0.43 1.77 -6.86 -6.27 OTHERASSETS
TOTAL ASSETS 3.92 5.75 12.51 23.52 36.06 51.92 53.61 63.81 CAPITAL -0.08 -0.14 -0.22 -0.45 -0.92 -1.13 -12.28 -15.58 EQUITY 3.99 4.37 6.14 8.98 12.04 15.50 15.50 15.50
REVALUATION SURPLUS 0.31 0.75 1.65 3.26 5.61 21.38 37.96 SUBTOTAL EQUITY 3.91 4.54 6.66 10.19 14.38 19.98 24.60 37.88
ACCOUNTS PAYABLE 0.09 0.21 CCRRENT POR710N OF LONG 1ERM DEBT 0 5.7 0.77 1 88
OTHER LIABILIlIES SUBTOTAL CURRENT LIABILITIES PROPOSED PROJECT
0.57 0.86 2.09
I LONG TERM DEBT EXTERNAL FUNDING 1.21 5.84 13.33 21.67 31.37 28.14 23.83 1.21 5.84 13.33 21.67 31.94 29.00 25.92 1
[TOTAL LIABILITIES AND EQUITY I 3.91 5.75 12.50 23.52 36.05 51.92 53.60 63.801
The projections of the income statements over the 10 years following the implementation of the recommended waste water projects, the projected sources and application of funds statements and of the pro-forma balance sheets suggest, provided adequate cost recovery policies, viable waste water tariffs and consistent subsidization policies (which are antici- pated to phase out within the decade) are implemented to overcome obvious financial bot- tlenecks. A vital condition therefore. is that the overall technical, commercial and financial management and operations of BWASA are improvcd to achieve a viable financial devel- opment potential of the Quetta BWASA waste water operations. However, this can only be sustained, if ade.quate tariff policies are adopted.
Further to the forgoing separate water and waste water financial projections, consolidated statements have been prepared to demonstrate the impact of the joint operations on BWASA’s financial accounts.

T.sMeA9.11 PUETTA WATER SUPPLY AND ENVIRONMENTAL IMPROVEMENT PROJECT
PROJECTED INCOME STATEMENT BWASA - CONSOLIDATED WATER SUPPLY AND WASTE WfiTFF .-*rFWTl.?NS
(MILLION CURRENT US$) Moo 2001 2002 2003 2004 2"" 2% 2007 2008 2009 2010 2011 2012 2013 2014 2015 REVENUES FROM WATER &WASTE WATER SERVICES 4 ' 2 576 7 3 9.m 10.66 12.30 1358 1487 1615 1744 18.73
REVENUES FROM NEW CONNECTIONS 0.11 0.84 093 1.02 1.r. 1.14 1.z 1.31 1.3 1.47 161 im 1.78 1.87 REMNUES FROM FIXED CONNECTION CHARGE 1.01 1.23 1 . 6 2.15 2.70
TOTAL REVENUE POTENTIAL WATER B WASTE WATER 1.01 1.33 2.a 3.07 3.72 .'2 690 8.Y 10.33 12.05 1376 1520 1656 1794 1931 M.69 OPERATING EXPENSES WATER 8 WASTE WATER
SALARIES AND ALLOWANCES o.m 0.89 0.76 0.84 0.91 3:''. * 2 1 1.B 1.37 1.45 1 . 9 1.65 173 182 191 200 REPAIRSANDMAINTENANCE 0.23 0.3 0.57 078 131 I j' ! € A 1 73 I a 1 9 2 2.m 2.3 250 262 274 2.67
ELECTRICITY 0.31 0.45 0.61 0.78 0.98 ' 2' 133 1.43 1 % I 62 171 1 m 1.91 2.02 2 14 2.27 CHEMICALS o o i 0.01 0.01 007 .?ni Ow om o.m om o.m om 0.m 0.04 O.W O W
CONSUMABLES o.m 0.01 o 01 on2 .i *" IL G O 4 0.W 0.04 OW 005 0.06 006 006 0.07 007 GENERALEXPENSESICONTINQENCIES 016 0.23 0.3 0.37 06 >x 066 071 0.75 0.80 0.84 0.44 03 1 w 1 . 0 9 115
CONSOLIDATED OPEPATING COST WATER & WASTE WATER 1.32 1.78 226 280 34? i V , 490 5.23 5 5 5 585 6.15 667 7.22 7.59 7.59 640
200 3.33 479 6.19 7.62 8.33 9 . 3 1 0 . 3 1132 1229 CONSOUDATED INCOME BEFORE DEPRECIATION AND INTEREST -0.32 -0.44 0 24 0.27 0.31 ! 1 7
DEPREClATlONWATER&WASTEWATERASSETS 0.75 0.89 1.17 2.08 318 J ' C 508 544 5.79 616 6 % 6.91 7.31 7.75 823 8711 I CONSOUDATED INCOME FROM OPERATIONS -1.07 -1.33 -0.93 -182 -267 Z.:.' -310 -2.05 -1.00 Om 1.09 1 4 2 203 2.59 3.10 356
INTEREST EXPENSES WATER 8 WASTE WATER 4 98 4.89 4 79 4 68 4.56 4.44 4.32 4.18 4 W 3.89
CONSOUDATED INCOME BEFORE TAX .1.07 - 1 . 3 -0.93 -182 -2.87 ? 3 ? - B O B -6.94 4 7 9 4 6 4 -348 -3.02 -2.29 -0% .0,31
CONSOLIDATED NET INCOME ( minm = opsralional subsidies) .1.07 -1.33 -0.93 .1.82 -287 -73'. .AM -694 -5.79 -464 -348 .3.w -2.29 -1 59 . o . ~ -031 OPERATING RATIO (REV!(O&MtDEPREUATION) 0.4 0.50 on 0.63 0 % $51 0.69 081 091 i m 1.09 1.10 114 117 1.19 1.21 IRETURN ON AVERAGE EQUITY (%) -4.0% -40% -2.2% -3.4% -4.5% d I . I 1 0% -9 0% -7.1% -53% -3.1% 6% -4.4% 2 8 % .l 5% -0.4'b- I IRETURN ON AVG GROSS FIXED ASSETS (%) -38% -3.7% .1.7% 2 0 % -23'0 ! ',.- 4 5% -3600 -28% -2 106 -1.39.. .2.5'6 -1 8% - 1 2$ -0 P4 -0.2h
6.8% 6.2% 5.6% 50% 50% 5.0% 5.0% 50% 50% LOCC\LlNFLATlON 11.0% 10.4% 9.8% 9.2% 86% E li'r 7 44.
FORElGNlNFLATlDN3.0% 3.0% 30% 3.0% 30% 3:'. 30% 3.0% 3.0% 3.0% 3.0% 3.0% 3.0% 3.0% 304r. 3.0%

QUETTA WATER SUPPLY AND ENVIRONMENTAL IMPROVEMENT PROJECT TABLE A9.12
PROJECTED SOURCES AND APPI ICATION OF FUNDS'
CONSOUDATED SOURCES OF F U N N NETINCOME-1.07 -1.33 -0.93 -1.82 2 8 7 2 9 3 . $ 3 694 6 7 9 -464 .348 .3@ 229 .158 -094 .031
DEPREClATlON0.75 0.89 1.17 209 3.18 410 '.,X 544 5.79 6.16 6.53 6.91 731 775 823 8.71 INTEREST ,4'38 489 4.79 4.63 4.55 4.44 432 4.18 404 389
ITERNAL CASH GENERATION -032 -0.44 0.24 027 031 1 17 2'CE 339 4.79 6.19 7.62 833 9.34 1034 11.32 12.B
ROPOSED WATER AND WASTE WATER PROJECTS EXTERNALFUNDING 1.63 5.17 19.31 2251 16.97 1724 INTERNALFUNDNG 057 1.80 749 8.43 5.77 56:
3TAL FINANCE WATER AND WASTE WATER 2.40 6.96 26.80 30.94 22.74 22a5
3NSOUDATEG CASH INFLOW 208 6.52 2704 3121 2305 P4C? >,T 3 9 479 619 7.62 833 9 % 1034 11.32 1229 CONSOUDATEDAPPUCATION OF FUN&
ROPOSED WATER AND WASTE WATER PROJECTS
OTHER CAPITAL EXPENDITURES INCREASE IN OTHER ASSEIS
INCREASE IN PAYABLES (-) WORKlNG CAPITAL NEEDS
ROPOSED WATER AND WASTE WATER PROJECTS LOAN AMORTIZATION
INTEREST
3TAL CONSOLIDATED DEBT SERVICE
REPLACEMENTS OF WATER AND WASTE WATER ASSETS
240 6.96 26.80 30.94 22.74 2285
0 19
0.33 0.13 037 021 024 04p.
.O.Q -0.06 -0.07 -008 .om -1 m 0.22 0.07 030 013 015 - 1 21
069 050
-0 :4 035
1 fa 489
6 57
118
8 73
0.97 0.50
.O 15 0.35
1.78 4.79
6.57
1.25
126 049 .O 15 0.34
1.89 4.63
657
1.33
1.58
0.49 -0 16 034
2.01 455
6 57
1.42
1 93
049 -0 23 0 27
2 13 4.44
6.57
150
230 040
-0 18 0.22
2 2 5 432
657
1.58
2 70 0 41
.0.19 0.22
233 4.18
6 57
1 67
3 13
0 41 -0 20 0 21
253
4.04
6.57
1 i 7
322 0 41 0.75 1.16
2ffl 389
6.57
1 42
9 14 3TAL CASH OUTFLOW 262 7CO 27 10 31 08 2289 2237 951 991 1027 1067 1115 1167 1244 ONSOUDATED NET CASH INFLOW -053 -051 -006 014 016 1 9 -V, 541 -435 332 -229 1 9 4 .133 -081 035 .014
CASH. BEGINNING -053 -1.04 -1.10 -0.97 . O N ':3 -518 .lo.% .1494 -1825 -20.55 -2249 -2382 24.63 -2498 CASH, ENDING -0.53 -1.W -1.10 -097 .0.80 i i a ' 6 .. -1058 .I494 . la25 -2055 -2249 -2382 -2463 .2498 .25.12
EBT SERVICE RATIO C.V, 052 0.73 0.94 116 127 142 1.57 172 1.87

TABLEA.9, 13 QUEllAWAlER W P L Y AND EENIRONMEMAL IMPROVEMEM P W E C T
3OJEClEO W C E SHEETS 6WAE4-CONSOUMlEDWATERSJPPLY ANDWASTE WATEfi WFkA-lnW
(MILLION CURRENT US$) 2wo 2001 2002 2003 ZTY~~ 2 W ?W6 2007 2008 2w9 2010 2011 2012 2013 2014 2015 EVALUEDOROSSFD(EDWATERaNWffiTEWATERASSETS 26.01 50.63 4039 71.95 109.81 141% 1'56' 18749 19973 212.28 22510 n8.13
LESS ACCWLATED DEPREClAllON ElFlYEDASSElS
WORK IN PROGRESS WATER &WASTE WATER
JBTOTALCOHSOUMTED FMEO ASSETS
CAyI6B4NKS ACCWMSRECENAW
IWEMORY OTHERASsmS
JBTOTALCONSOUMTEDCUREW ASSETS
0.75 25.26
2.40
27.66
4.53 0.26 0.06
4.20
1.64 28.99 6.96
35%
-1 M 0.37 0.10
4.58
2 61 37 58 26.80-
6438
-1 10 068 0.15
4 27
4.90 8.09 '21? " 2 1 2271 2851 34.66 41.19 (8.10 6 7 s 10172 i z c = 1 5 8 3 3 16477 i 7 i . z i n . @ 183.91 190.03 50.94 2274 22 PS
4 9 7 O M 4 ' s < < $ -1058 -14.94 -1825 -20.55 -2249 084 1.02 Id .? ".Q 236 2.63 330 3.77 4.16 0.20 026 033 347 045 0.47 050 0.52 0.62
008 0.48 795 - 2 % .7?7 .11.63 -1446 -16.25 -17.70
252.17 267.31 20364 30046 55.41 63.16 71.39 8010
195.76 20415 212.26 ZK.36
19676 20415 212.26 m.36
-23.82 -24.63 -2498 -25 12 454 491 529 567 0.65 068 071 074
-1863 -19.04 -1608 .18.71
CAPITAL EOL4TV
RWAJJAllON S U W U S
JBTOTAL ECUTY WATER AN0 WASTE WATER
ACCOUNTSPAYABLE CURREW POREON OF LONG TERM E B T
O M R WBlUTlES
UBTOTAL CONSOWDATED CURRENT WBILIIES
ROPOSED PROJECT WATER AND WASTE WATER LON3 TERM DEBT M R N I \ L FLMDlN3
OTHER LON0 TEKU EBT
UBTOTAL CONSOUMTED LMlG TERM DEBT
O T A L W L I I E S
-1 07 26.59
25.52
0.12
0.12
1 .83
1.83
1.94
-2.40 28.39 2 . z
28 20
0.18
0.18
6.99
6.99
7.17
3 3 4 35.87 5.01
37 55
025
0.25
26.31
26.31
26.56
5 15 4431 9 . n
(8.93
0.33
033
(8 81
(8.81
49.14
-8 02 50.08 16.63
58.74
0.42
0 42
65 78
85.78
66 20
25 97 55 69 45 09
74 81
0 66 1 78
2 44
79 75
79 75
62 19
-31 76 %.I 55.11
n . W
0.70 1.69
2.59
n 97
n.97
80.56
~~
-36 40 55 69 6506
8434
0 73 2 01
2 74
76 08
76 08
78 82
-39.88 42.90 -45.19 4679 -4773 4 03 1 S . 6 9 74.88
90.63
0 77 2 13
2.90
74.07
74.07
76.97
55.63 8448
97.28
0.67 2.25
3 12
71 95
71 95
75.07
55.89 94.64
105.13
0.92 2.39
350
89.69
69 69
73 w
55.89 1M.41
114.32
0.96 2 53
3.49
67 30
67 33
70 80
55.69 116.85
124.61
1.01 2.58
3.70
6477
64n
66 47
55 69 128 96
136.61
1.07 1 .88
2.95
52.09
62 W
65.M
OTAL CONSOUMTED WBlUnES AND EQUITY 2746 3537 6411 9807 12494 ISr !? '1547 15700 15959 163.16 167.65 172.33 178.13 185.12 193.28 201.551 ACCOUNnNG CHECK
OEBTEQUN MTIO 0.25 0.70 1 W 112 ' '- 1 1 4 107 0.99 090 082 0.74 066 0.59 052 045 CVRREW RATlo ( c l m m armh'tuiwd laillhas) -3.21 -1.10 0.23 1.15 ' 1' 1 25 -3 18 4.49 5.26 -5 61 -5.67 -5.64 -5.45 5 13 -5 35
REVAWAllGUFLCTOR 1 W 1.08 1.07 107 107 106 1 % 106 l .M 1 M l.M 1.04 1.04 1.04 104 104

Appendices Executlve Summery
APPENDIX 10 Indicative Procurement Packages

Quena WSE - Final Rewrt. Executive Surnrnarv Amendix 10 I Page 1
APPENDIX 10 : INDICATIVE PROCUREMENT PACKAGES
The procurement of goods and services under Phase 1 of the project will be undertaken in accordance with the Bank's Guidelines for Procurement. Indicative procurement packages are presented in the relevant sectional chapters and summarized in Table 1 below. It is proposed that contracts for the supply of special vehicles and equipment, and water supply pipes and accessories be awarded through international competitive bidding (ICB) or international shopping(lS). Major civil works contracts costing US$ 1 mio or more, and vehicles, equipment, or materials costing US$ 0.5 mio or more would be awarded through ICB procedures. Other goods and services are procured following local competitive bidding (LCB) procedures acceptable to the Bank.

Quena WSE - Final Rewrt. Executive Summarv Awendix 10 I Paae 2
Code
TABLE 1 : PROCUREMENT PACKAGES
Descrlplon
1 - ~
~
A. WATER RESOURCE INVESTIGATION
WS/Cl101A Consulling Selvices for Evloration
WSlC1103A Hydrology and Sail-mechanical Tests
WS/PIl 12 Evloration Well Drilling
of New Groundwater Resources
lor Kuchnai Dam Scheme (lstcampaign)
i
WSGlO5 Consulting for System Rehabililation WSCI106 WSIPI115 Water Supply Rehabilitalion Project WS/PI116
Consulting for Water Supply Epansion I
Water Supply Evansion Project I Subtota
659.800
192.200
2.110.122 LCB
444.259 1.612.458 5.923.450
21.499.438 29.479.605
1.496.1 44
ICB single ICB single ICB mulliple ICB multiple
ICB single
6. PHASE I IMPLEMENTATION
W A m RESOURCE DEVEOPMENT I
WWICROI W I P R 1 1
WSICI101 B WS!C/l02A WSlPi l I l
Consulfing for Wastewater Project I Wastewater Disposal Project I
Subtotal
Consulting lor Well Rehabilitallon Consulting for Well Construction L2 and L3 Well Rehabililation in the Quelta Valley Well Construction L2 and L3
Subtota . .. . . .. .- . . _-
DFIPt312
SOLID WASTE
SWPI411 SWlPl412
Supply of Drainage Winlenance Equipment Subtotal
DISPOSAL
Initial Construclion of Sanitary Landfill Supply and Installation of Equipment
Subtotal
TOTAL B
ICB
Contract
single
single
rnutiple
single single
multiple multiple
.~
1.1 6 1.850 single multiple

Quena WSE - Final Remrt. Executive Summarv ADDendix 10 / Paae 3
Code
C. TECHNICAL
ID/C/501
IDIC1502 ID,C!503
IDlCl504 ID/C/505
CP/C/i'Ol CP/C/i'OP
CP/C/704
Table 1: PROCUREMENT PACKAGES (Continued)
Desrlptlon Base Cost Type Conbact uss
ASSISTANCE
Pdvisory Serices for Financial 8 Commercial 780.000 ICB single Management in BWASA Pdusory Serices for Project Implementation 276.000 ICB single Pdvisory Serices forpublic Works Technical 786.000 ICB single Management B Operation ICB single Provincial Institutional Reforms 320.000 LCB single Benefit hbnitoring 8 Emhation 106.000 LCB single
Social Pction Plan 446.000 LCB single Public Fwareness 8 Communiyorienled 348.117 LCB single Consenation Program Hygiene Education 780.000 LCB single
TOTAL C 3.842.117

Appendlces Executive Summary
APPENDIX 11 Indicative Financial Schedule
GKW CONSULT GmbH

Appendix 1 1, Table 1
WATER SUPPLY 60.54 kXIERNAL FUNDNG
IFITEfiN4L GOVERNMENT SUBSIDIES
EKIEFML FUNDNG
DlSBU~SEMtNI Of PROJECT FUNDS
INTEREST DURING CONSTRUCTION fcqltalued!
COMMITMENT CHARGES !capl(alizedi
TOTALTO BE FIMNCEDBY EX'T FUND
LONG TERM DEBT
I PRINCIPAL PAYMENTS
42.38 18.16
42.38 8.09 1.20
51 .€6
ItJTEREST PAYMENTS1
GP.4N2 TOTAL TO BE FlNANCEDl 69.82
Basic assumlions on Iinarcirq conditions:
JPPLV
XKX! 2CC: 2002 2003 2X.d ? E L X05 iDC? 2008 2009 2010 2011 2012 2013 2014 2015 OUEI 19 WATEE SUPPLY A N D E~lVIRONUEGT41 IMPROS'CMEM PRUECT
1.91 4.72 13.08 19.63 CC5 7 ' 5
1.34 3.30 13.36 13.04 6.34 5 :' 0.57 1.42 5.72 5.59 2 I2 2 '!
1.34 3.30 13.36 13.C4 5.34 5 7 ' 0.08 0.28 1.08 1.86 2 . 2 2 5:
0.41 0.38 0.24 0.11 C.05 -
1.83 3.96 14.68 15.02 f i E 3 5'. 1.83 5.79 20.47 35.48 44.': 5:5? 50.64 42.55 48.42 47.21 45.93 44.57 43.13 41.60 39.98 38.26
' .CZ i.53 1.14 1.21 1.28 1.36 1.44 1.53 1.62 1.72 3.10 236 2.97 2.91 2.83 2.76 2.67 2.59 2.50 2.40
2.40 5.38 20.40 20.61 1' 34 F 5
Proparlion linanc4d by external sources: lnleresl dunng conslruction:
7% 6.00% on drawn loan portion. capilallzed I annuity (million USS) 4.12
L 6 ysars after lirsl disbursemen1 -,.-. r Comrnlmenl charges: 1.000'. 3n commiiied 16as portion. csplalized ~ 1. .. "?nod. J

Appendix 11, Table 2
WASTE WATER COLLECTIONAND TREATMEW 1 38.36 I 1.28 58a 9.49 1 0 ' 9 ' * 5 ? , EXTERNAL FUNDING
I M E R M L GOVERNMEISI SUBSIDIES
EXTERNAL FUNDING
26 @6 0 . 8 4 1 1 6.64 7.13 >.W 11.51 038 1.76 285 3% ?.lF
DISBURSEMENT OF PROJECT FUNDS
IIJTEEST DURING CONSTRUCTION (cspfialue@ COMMITMENT CMRGES icapnallrear
TOTAL TO BE FlNRNCED BY EXT FUN0 LONGTERMDEBT
PRIIKIPPL PAYMENTS
26.86 3 T9 0 71
31 37
annuity (millim US$) 2 45 Proporlion liranced by exlernal sources 70% l n f p w f F. IMB on oulslandirg loan on drawn loan p i i o n . capilalized ' i lar oer;?.l 30 years, induding lrdsresl during cnnslmdion. 6 00%
Comrnitrnenl charges 1 OOS, I on mrnrnRted loan p i i o n . captalized ?vie oeriTd 5 years aiier lirsi disbursement I
!MEREST PAYMENTS
22 E l 1 02 143 . . ...
v: ,or . : u i 1.n 1 7 3 1.69 1 6 4 1.v 1 % 14

Appendix 1 1, Table 3
million current U S DRAINAGE AND SOLID WASTE
EkXRNAL FUNDING
If.ITERflAL GOVERNMENT SUBSIDIES
EXlERNAL FUNDING
DISHIJRSEMEIJT OF PROJECT FUNDS
INTEREST DURING CONSTRUCTION (capllaiized)
COMMITMENT CHARGES (capitalized)
TOTAL TO BE FINANCED BY E n . FUND.
LONG TERM DEBT
PRINCIPAL PAYMENTS
INTEREST PA'IMENTS
GP.AN@ TOTAL TO HE FINANCED
TOTAL
4.34 2.17
2.17
2.17
0.14 0.01
2.32
4.49
Q U E T T I WATEFl 5,117PL'J PEID ENViPONMENTAi lUPP,OViME
2000 2001 2002 2003 2004 7005 zong 2007 2008 2009 2010 2011 2012 2013 2014
2.61 1.73
1.30 0.87 . 1.30 0.87 -
1.30 0.87 - 0.05 0.09
0.01 . 1.36 0.95 - 1.36 2.32 2.16 2.W 1.84 166 1.48 1.29 1.10 0.90 0.69 0.47 0.24 0.00
0.15 0.16 0.17 0.17 0.18 0.19 0.20 0.20 0.21 0.22 0.23 0.24 0.09 n.m 0.08 0.07 0.07 0.06 0.05 0.04 0.04 0.03 0.02 0.01
2.67 1.82 .
Proporlim financed by exlernal sources: 5096 Inleraf: 4.00% on outslanding ban annuity (million US$) loan period: 15 years, induding lnleresl during mnslrudion:
Commitment chargas:
4.00% on drawn loan potimn. capilalized
1.00% on committed ban portin, capilalizod gram period: 3 years afler first disbursemen1

Appendix 11, Table 4
TECHNICAL ASSISTANCE 6.04 I 1.11 2.55 1.71 0.34 C 3
EXTERNAL FUNCINGI 4.84 I
DSBURSEMENT OF PRUECT FUNDS
MEREST DURING CONSTRUCTION (c-qkAized) COMMITMENT CHARGES (c-qdalizd)
TOTAL TO BE F I M K E D BY M. FUND. LONG TERM DEBT
PRINCIPAL PAYMENTS
INTERN4LGOVERNMENT SUBSIDIESI 1.21 EXTERNAL FUNDNG I
4.a4
0.04 0.1 1
4.96
- 0.89 2.04 1.37 0.27 C;' . 0.22 0.51 0.54 F.57 i :.-
. 0.89 2.04 1.37 s.27 c 2:
. 0.04 0.05 0.04 0.C2 0.01 0.00 -
0.05 0.96 2.06 1.38 C.27 0 ;- 0.05 1.01 3.07 4.45 4.72 4 3 9 4.52 4 . c ~ 3.52 2.99 2.43 i.as 1.25 0.54 0.00
0 4 7 2 4 3 0.51 C.53 0.55 0.57 0.6C C.62 0.64
INlEHtSl PPYMEYTSI I 0.X t.:? 0.15 0.14 0.1; 0.10 0.07 0.05 3.03 GRAND TOTAL TO BE FlNANCEDl 6.20 I 0.05 1.:9 2.57 1.72 C.34 : 3
Basic assufrQtvm on I inarwq conditions:
Proporlion tinarced by external sources: 80% w m s t : 4:X': on outstanding loan annuity (million USS) 0.67 , . .* Interest during construction: 4.00% Gn drawn loan porlion. capitalized '.:j Dnnod: 15 ysaw, irduding
CarnrnrlmP.nt charges: 1 .OC% an m~miX4 lljan portior., capitelized .yj-o $+nod: 5 years alter lint disbursnmnl Induding Technical Assistance for InsljtuSonal Reforms and Capaaty Building and lechnical Assisstance for Community Development and Social Issues

Appendix 11, Table 5
FINANCING PLAN FOR RECOMMEWED Pi lASE 1 PROJECTS
CONSOLIDATED PWSE 1 PROJECTS I 109.30 I 3.19 14.32 32.85 30.53 20.35 7 d:- .
C d f T A W A F F SLIPFLY A'ID ENVIRCNMEIIT.21 1MPRC'YEMEP.T F C L E L T
million tunenl U S I TOTAL I zoo0 2~x1 20~2 2003 ~ M L xc: 2 . m :OF :ma 2009 2013 ZG!! 2012 zois 2014 2015
76.25 12.05 2.03 90.3
I EXTERNALFUNDNGl 76.25 I 2.23 9.61 22.90 21.54 14.69 5.27 .
2.M 9.61 22.90 21.54 14.65 5 ;- 0.13 0.67 1.87 2.99 3.65 i LC . 0.72 0.64 0.42 0.20 0.C5 -
3.08 10.92 25.18 24.73 18.59 7 I: 3.08 14.00 39.19 63.76 8:.20 89.25 a7.31 54.5: 82.10 79.44 76.64 73.68 70.5~ 67.28 53.81 61.07
. 0.15 0.16 i7: 2 2 7 2.30 2.52 2.66 2.80 2.96 3.12 3.29 3.47 2.74
INTERML GOVERNMENT SUBSIDIES~ 33.05 I 0.96 4.71 9.95 8.99 6.25 ; :. EXTERNAL FUNDNG
INTEF~EST PAYMENTS~
DISBURSEMENT OF PRCJECT FUNDS
INTEREST DURlNG CONSTRUCTION ( c g h a i i d !
COMMITMENT CHARGES (capilalzd)
TOTAL TO BE FINAKED BY EXTERNAL FUND
LONG TERM DEBT
PRIKIPAL PAYMEWS
. 0.09 C.09 ' 5 6 5.22 5.12 4.97 4.83 4.66 4.53 4.37 4.20 4.02 3.83