
Table of Content - Innovation Arabia
324
ISSN 2708-9525 1
-
Upload
khangminh22 -
Category
Documents
-
view
1 -
download
0
Transcript of Table of Content - Innovation Arabia

ISSN 2708-9525
1
ISSN 2708-9525
2
Table of Content
➢ LEARNING, WELLBEING AND TRUST TRACK ...................................................... 5
INVESTIGATING THE EFFECTIVENESS OF TEACHING GRAMMAR THROUGH THE
CONTEXT OF WRITING ......................................................................................................................... 6
REHAB HELMI ALBAKRI, ....................................................................................................................................... 6
AN ASSESSMENT MANAGEMENT SYSTEM FOR MULTIPLE CHOICE QUESTIONS IN AN
INTEGRATED MEDICAL CURRICULUM ......................................................................................... 26
SAMI SHABAN AND MARGARET ELZUBEIR, ..................................................................................................... 26
BREAST SELF-EXAMINATION: THE KNOWLEDGE, ATTITUDE AND PRACTICES AMONG
FEMALE UNIVERSITY STUDENTS RESIDING IN ABUJA ........................................................... 27
FALMATA ALI MOHAMMED, ............................................................................................................................... 27
MARYAM BUHARI-SHEHU, ................................................................................................................................. 27
ALI ZALZALA, ....................................................................................................................................................... 27
PROLONGED COMPUTER USE AND ASSOCIATED HEALTH DISORDERS ........................... 51
NOOF AL HABAB, ................................................................................................................................................. 51
STIGMA AND DISCRIMINATION AGAINST PERSONS WITH COMMUNICABLE DISEASES
..................................................................................................................................................................... 60
REAL ALZIR .......................................................................................................................................................... 60
HOUSEHOLD ELECTRICITY CONSERVATION IN THE UAE .................................................... 67
NOORA ALQASSIM ................................................................................................................................................ 67
INTERNAL CORPORATE SOCIAL RESPONSIBILITY (ICSR); PERCEPTIONS OF
EMPLOYEES IN A PRIVATE HOSPITAL IN DUBAI ....................................................................... 77
DALAL DARABSEH ............................................................................................................................................... 77
DOMESTIC WASTE RECYCLING PRACTICES AMONG THE UAE POPULATION ............... 89
YAQEEN AL NAQBI .............................................................................................................................................. 89
INTERVIEWS WITH KEY INFORMANTS TO EXPLORE SCHOOL NUTRITION
PROGRAMS: A CASE-STUDY IN DUBAI ......................................................................................... 106
REEM S. ALGURG1, NOUR H. ABU MAHFOUZ2, AND FARAH OTAKI3 ......................................................... 106
IMPORTANCE OF RESEARCH IN HEALTHCARE QUALITY SYSTEM .................................. 117
ANWAR ALNUAIMI ............................................................................................................................................. 117
CHANGE MANAGEMENT – IN THE CASE OF A FICTIONAL MERGER ................................ 126
HAMDA AL-AWADHI, ........................................................................................................................................ 126

ISSN 2708-9525
3
LEAN AND SUSTAINABILITY: SIMILARITIES AND MUTUAL RELATIONSHIP ................. 138
ABDULLAH ALMATROOSHI ............................................................................................................................... 138
FROM AUTONOMY TO ACCOUNTABILITY: PERCEPTION OF PROFESSIONALISM
AMONG HEALTHCARE PROVIDERS IN THE MINISTRY OF HEALTH AND PREVENTION,
UNITED ARAB EMIRATES. ................................................................................................................ 141
AL ANOUD SALMAN, ......................................................................................................................................... 141
AWONIYI AWOFESO, .......................................................................................................................................... 141
CRITICAL SUCCESS FACTORS (CSFS) OF QUALITY MANAGEMENT SYSTEM IN
HEALTHCARE – A COMPARISON BETWEEN THE GOVERNMENT AND THE PRIVATE
HOSPITALS ............................................................................................................................................ 146
LATIFA HUSSAIN MOHAMED ALAMEERI, ....................................................................................................... 146
154 ................................. دور المهندس االماراتي في اعداد المواصفات التصميمية للمدن الذكية في دولة االمارات العربية المتحدة
154 ............................................................................................................................................... مأمون موسى عطعوط،
➢ ETHICS AND TECHNOLOGY – IOT TRACK ........................................................ 173
THE USAGE OF MACHINE LEARNING AND ARTIFICIAL INTELLIGENCE FOR
HEALTHCARE APPLICATION IN UAE ........................................................................................... 174
IOANNIS KARAMITSOS1 AND AISHWARYA AFZULPURKAR1 ....................................................................... 174
➢ SMART CITIES TRACK ............................................................................................. 189
CONCURRENT GENERATION OF POWER AND WATER FROM WASTE – A CASE FOR
POLICY REFORMS .............................................................................................................................. 190
MOHAN LAL AGARWAL, ................................................................................................................................... 190
ARAVINTHRAAJAN B.R. .................................................................................................................................... 190
SOLAR PHOTOVOLTAICS AN ALTERNATIVE ENERGY CONSERVATION MEASURE FOR
132/11 KV SUBSTATION BUILDING SERVICES ENERGY DEMANDS. .................................... 203
SHOEB KHAN, SHAIKHAH AL KINDI ............................................................................................................. 203
SUPERVISED CLASSIFIER BASED INTRUSION DETECTION SYSTEM FOR SMART HOME
IOT DEVICES. ........................................................................................................................................ 204
SYED ABBAS ALI, MUSAWAR AHMAD ........................................................................................................... 204
WATER LEAK INSPECTION IN RESIDENTIAL VILLAS ............................................................ 213
MOODHI ALI RASHEED ...................................................................................................................................... 213
➢ THE FUTURE OF WORK AND PLAY TRACK ...................................................... 220
ASSESSMENT OF ENTREPRENEURIAL INTENSITY AND INTERNAL ENVIRONMENT FOR
CORPORATE ENTREPRENEURSHIP - THE CASE OF A GOVERNMENTAL ENTITY AT AN
EMIRATE IN THE UAE........................................................................................................................ 221

ISSN 2708-9525
4
AYESHA AL HASHEMI, FATIMA ALMEHYAS, MARIAM AL ZAROONI, MUNA AL ANSAARI, NOOR AL
MASRI................................................................................................................................................................... 221
SUSTAINABLE INITIATIVE- GO GREEN ....................................................................................... 239
ASRAF ALI SYEED .............................................................................................................................................. 239
ABDUL RASHEED, ............................................................................................................................................... 239
MAHER AL EJEL, ................................................................................................................................................ 239
KRISHNA MOORTHY KANNAN .......................................................................................................................... 239
ESTABLISHMENT SMART MONITORING AND EVALUATION SYSTEM IN NEW
ORGANIZATIONS (CASE STUDY: IRAN MINISTRY OF SCIENCE, RESEARCH AND
TECHNOLOGY) .................................................................................................................................... 249
REZA MOHAMMAD KAZEMI, ............................................................................................................................. 249
MAJID POURMESGARI, ....................................................................................................................................... 249
MOHAMMAD REZA HOSSEIN ZADEH ............................................................................................................... 249
AN INVESTIGATION INTO THE EFFECTS OF CORPORATE SOCIAL RESPONSIBILITY ON
CUSTOMER SERVICE QUALITY IN THE UAE: THE MODERATING ROLE OF NATIONAL
CULTURE ............................................................................................................................................... 257
NASEEM M. RAFEE ABDULLA .......................................................................................................................... 257
BUSINESS INNOVATION STRATEGIES – THINKINOVA ........................................................... 280
MOHAMMAD MUSLEH ....................................................................................................................................... 280
EFFECTS OF DIGITAL SCREENS EXPOSURE ON CHILDREN: RESEARCH PROPOSAL . 281
MARYAM ALMAJIDI .......................................................................................................................................... 281
INTERNAL VS. EXTERNAL AUDITING; A COMPARISON BETWEEN THE RULES AND
REGULATIONS IN THE UAE. ............................................................................................................ 287
HIND AL-ALI, FATIMA AL SAIDI, FARIDA KHORRAMI, MOHAMED EL BARADIE..................................... 287
CHANGE MANAGEMENT: MERGER OF X AND Y COMPANIES ............................................. 295
AMNA MOHAMED SALEH ALJASMI ................................................................................................................. 295
4TH INDUSTRIAL REVOLUTION: HOW PEOPLE AND TECHNOLOGY ARE SHAPING THE
FUTURE OF ORGANIZATIONS ......................................................................................................... 304
MIGUEL SALVATO ROMBERT TRIGO, .............................................................................................................. 304
AN EMPIRICAL EXAMINATION OF THE IMPACT OF ACCREDITATION ON HOSPITALS’
QUALITY PERFORMANCE: THE MODERATING ROLE OF CORPORATE GOVERNANCE
................................................................................................................................................................... 317
GHADA A. AL MOHAMMED, ............................................................................................................................. 317
EBRAHIM SOLTANI, ............................................................................................................................................ 317
ADRIAN WILKINSON .......................................................................................................................................... 317
WORKERS AND THERMAL ENVIRONMENT IN THE UAE ....................................................... 320
MARYAM AL ALI ............................................................................................................................................... 320

ISSN 2708-9525
5
Learning, Wellbeing and Trust Track

ISSN 2708-9525
6
Investigating the effectiveness of teaching grammar through
the context of writing
Rehab Helmi Albakri,
Hamdan Bin Mohammed Smart University, Dubai, UAE
Abstract
This study examines the impact of teaching grammar through the context of writing on improving students'
performance in English. The rationale for doing this study is that teaching grammar to Arab students is important to
improve their interlanguage and help them identify how English language works in a meaningful context. Students
need to learn the grammatical system of English and recognize the environment in which the linguistic forms function.
To achieve the purpose of this study, a qualitative research is conducted on a group of university students studying an
English course. The literature review sheds light on the main theories related to grammar and writing which are
learner’s interlanguage, functional grammar, and the process- oriented approach to writing.
The data consists of students’ written performance collected at different stages of the course. The research instruments
include a benchmark test conducted at the beginning of the course and an exam conducted at the end of the course. In
both tests, students are asked to write a paragraph about different topics. Moreover, throughout the course, students
are doing a writing task related to the grammar topics taught such as tenses and punctuation. Also, through using the
writing process approach, students study the basics of writing grammatically correct, well-structured, and meaningful
paragraphs. Data analysis comprises comparing students’ writing in the benchmark test to their writing in the end-of-
course exam using rubric.
The results of data analysis prove the positive outcomes of the study by indicating a progress in students’ performance
in English. The findings will be used to provide recommendations on how to enhance teaching grammar through the
context of writing to adapt to learners’ needs and levels. These recommendations may inspire teachers to adopt
effective teaching techniques to overcome the difficulties Arab students face while studying grammar, particularly
third-person singular and consistency in using tenses. In addition, instructors are advised to use the process approach
while teaching writing especially writing assignments and projects to enable students to identify their mistakes and
correct them.
Keywords: process-oriented approach, English skills, Arab learners, punctuation, tenses, rubric, and context
1. Introduction
English is considered one of the most important languages that students need to learn and achieve
a good level of accuracy and fluency when using it. English becomes essential when they get to
the university since the language of instruction at most universities is English. Teaching grammar
as a part of learning English language is central to improve students’ interlanguage and help them
identify how English language works in a meaningful context. Azar (2007) explains that “one
important aspect of grammar teaching is that it helps learners discover the nature of language, i.e.,
that language consists of predictable patterns that make what we say, read, hear, and write
intelligibly” (p.2). Hinkel and Fotos (2008) refer to engage students in communicative tasks while
learning grammar. They indicate that “noticing linguistic forms and the environments in which
they occur often lead to learners’ increased abilities to identify the grammatical systems of the
second and foreign language” (p.14).

ISSN 2708-9525
7
On the other hand, writing represents one of the vital skills in the English language learning
process. Flower and Hayes (1980, p. 40) conceptualize writing as a "strategic action where writers
employ strategies to juggle with the constraints of composing". It is considered by researchers
(White & Arndt, 1991) as a means of communication because through writing people share ideas
and defend their opinions. For second language learners, writing is the most difficult English skill
since as described by Tangpermpoon (2008) learners should have "a certain amount of L2
background knowledge about the rhetorical organization, appropriate language use or specific
lexicon with which they want to communicate to their readers" (p. 1).”
The purpose of the study is to investigate the impact of teaching grammar through the context of
writing. Richards (2002) explores the usefulness of grammar learning when engaged in
communicative tasks. He highlights the fact that “although learners’ exposure to language increases
when they work with certain types of tasks, task work needs to be focused and carefully designed
in order to lead to the acquisition of grammar” cited in Hinkel and Fotos (2008, p.14).
Despite the fact that reading and vocabulary are necessary to understand what they study, learners
need to write grammatically correct assignments not only to pass the English course but also to do
tasks related to other subjects. The study aims to assess the effectiveness and suitability of teaching
grammar topics, such as tenses, subject-verb agreement, and passive voice through the context of
writing to adapt to students’ needs. To achieve the purpose of the study, a literature review of the
functional theory of grammar, learner’s interlanguage, and the writing process will be discussed.
The data consists of students’ written performance collected from a group of university students
studying an English course. The samples will be gathered at different stages of the course to
monitor the progress in students’ levels in both grammar and writing. The results of analyzing the
data will be used to provide recommendations on how to enhance teaching grammar through the
context of writing to adapt to learners’ needs and levels.
2. Literature review
The theoretical framework includes a hybrid of the functional theory of grammar, learner’s
interlanguage, and the writing process approach.
2.1 Functional Grammar
Of all the theories developed about grammar, this study focuses on functional grammar theory
since it examines the grammatical structure of language and entire communicative situation.
Functional grammar is a model developed by Halliday in the 1960s. The reason behind choosing
functional grammar theory is that it contributes to the functional paradigm of language. Hengeveld
(1997) defines functional grammar theory as explaining “the rules underlying the construction of
linguistic expressions in terms of their functionality with respect to the ways in which these
expressions are used” (p. 3). Similarly, Feng (2013) states that functional grammar theory focuses
on how language works in different social situations “it is very useful in showing how texts work
beyond the level of the sentence, how different texts are structured, and how language varies to suit
the purpose of the users” (p. 86).

ISSN 2708-9525
8
The importance of the knowledge of second language grammar comes from the fact that learners
need not only to comprehend but also to produce understandable output consistent with target
language norms (Ellis, 1997). Since target language norms are complicated and include many
features, language instructors should be selective when deciding the norms that achieve
intermediate and advanced linguistic skills and increase their interactional experience in the target
language. Hinkel and Fotos (2008) refer to the point that “many classroom teachers believe that
participating in interactions and activities that lead to increased output contributes to learner
internalization of L2 knowledge” (p. 7).
According to Halliday (1994), functional grammar is a natural grammar in which everything can
be explained by relating it to how language is used. He believes that language consists of three
components called meta-functions. These components include the ideational meaning (to
understand the environment), the interpersonal (to act on the others in it), and the textual meaning.
Thompson (1996) illuminates the three components of functional grammar as follows:
1) We use language to talk about our experience of the world, including the world in our
minds, to describe events and states and the entities involved in them.
2) We also use language to interact with other people, to establish and maintain relation
with them, to influence their behavior, to express our own viewpoint on things in the world,
and to elicit or change theirs. 3) Finally, in using language, we organize our messages in
ways which indicate how they fit in with the other messages around them and with the
wider context in which we are talking or writing (cited in Feng, 2013, p.87).
For the purpose of our study, the concepts of functional grammar will be used as the theoretical
framework that helps us evaluate the effectiveness of the grammar topics in the course and the
teaching strategies adopted in teaching these topics in improving learners’ English language skills.
2.2. Interlanguage
The Interlanguage theory focuses on a language created by learners of a second language. It
assumes that “an active and independent learning mind makes its own generalizations upon
grappling with a new language” (Frith, 1977, p.155). Selinker has introduced the term
interlanguage since 1972 as the first attempt to explain second language learning process from a
cognitive point of view. Interlanguage refers to “the interim grammars which learners build on their
way to full target language competence” (Ellis, 1994, p.30). Learner’s interlanguage is affected by
five central cognitive processes which are rules and items transferred from the first language,
transfer of training, strategies of language learning resulting from the approaches used when
teaching the material, strategies of second language communication, and overgeneralization of
semantic features and grammar rules of the target language (Grauberg, 1997, p.78).
Learning strategies represent an important part in the process of forming interlanguage since they
embrace learners’ approach to the material to be learnt and the communication strategies used while
teaching language. Selinker et al. (2000) define learning strategies as a way to “help learners

ISSN 2708-9525
9
develop a mental grammar of the L2. It is these strategies that support a definite systematicity in
the interlanguage” (Takac, 2008, pp.31-32).
The concept of interlanguage has been studied by many researchers. Urdaneta (2011) examined
the influence of Spanish structure on English writing and focused on the instances of literal
translations from Spanish to English during writing. The aim of the study was to show that grammar
classes are important to learn English writing, and that the more students are exposed to English,
the more language acquisition will be enhanced. To achieve the purpose of the study, he used
several instruments to collect data from twenty four students studying at UNICA University. The
results of data analysis indicated that the influence of first language can obstruct English writing
processes. In addition, there were four main mistakes traced in the written products which were
word order, missing of verb to be, implicit subject, and the incorrect use of the definite article "the".
Another study was conducted by Elkilic (2012) to examine the inter-lingual errors on the
composition papers of Turkish university students. The study referred to the difficulties that
Turkish students faced while writing such as proper word choice, grammatical structures, and other
aspects of language resulting from the differences between Turkish and English. To achieve the
purpose of the study, the researcher used participants from two different learning levels which were
intermediate and upper intermediate level students. The results of data analysis indicated that the
interference errors were word for word translation, misusing the prepositions, misusing
uncountable nouns, omitting the indefinite article, subject-verb agreement and number, quantifier,
and noun agreement.
Moreover, Alduais (2012) carried out a contrastive mixed-methods study between the simple
sentence structure in the form of statement of both Standard Arabic and Standard English
depending on the contrastive analysis hypothesis as developed by Lado (1957). In data collection,
500 simple sentences in both languages were selected randomly as samples from published
academic sources. The results of data analysis revealed that standard Arabic showed a free-word-
order system in simple sentence structure which contrasted to Standard English that exhibited a
fixed-word-order. Also, Arab learners faced problems with subject verb agreement in English and
may produce ungrammatical, ill-formed, and unacceptable written sentences due to the influence
of their first language.
2.3. The process-oriented approach to writing
The process-oriented approach to writing has been developed to focus on how writing takes place
as opposed to the product-oriented approach which focuses on the written task as a product. Smith
and Andrews (2011) describe the writing process as “a recursive, idiosyncratic, situation-dependent
set of activities we engage in to produce a piece of writing. These activities are embedded within
broader categories or phases, the hallmark of the writing process: pre-writing, writing, and
revising” (p.64).
The theory underlying the process-oriented approach is the cognitive theory. Selvester and
Summers (2015) elaborate that the recursive activities include planning, translating, and reviewing.
The writing process theory advocates integrating writing with other skills and adding a critical
literacy perspective. In this way, “writing becomes a critical learning tool for exploring,
questioning, reflecting, critiquing, and ultimately communicating thoughts and ideas that give
adolescents greater ownership and control of their understanding of and opinions about a topic”

ISSN 2708-9525
10
(Selvester and Summers, 2015, p.142). According to Kroll (2003), in second language writing
classrooms, the writing process approach prompts creative strategies, multiple drafts, and
formative feedback.
3. Methodology
The following sections will include the research questions designed to serve the purpose of this
study, the participants involved in the study, the research instruments used to collect data, the
procedures followed in collecting data, and the rubric used to analyze data.
3.1. Research questions
This study aims to answer the main research question:
To what extent would teaching grammar through the context of writing improve English
language skills?
Sub-questions are
1. To what extent would teaching grammar enhance learners' interlanguage?
2. To what extent would the writing process approach improve learners’ ability to produce
coherent output congruent with target language grammar?
3.2. Participants
The participants involved in this study include a group of university students studying an English
course. The students are selected randomly.
3.3. Research Instruments
To achieve the purpose of the study, qualitative research instruments are used. The instruments
consist of samples of written performance collected from the benchmark test conducted at the
beginning of the course, learners’ assignments, and paragraphs from the end-of-course exam. In all
samples, students are asked to write a paragraph about different topics. The purpose of using
written samples at different phases to collect data investigating the same issue is to confirm the
validity and reliability of the results and to give a fuller picture of the issue under discussion.
To analyze data, a rubric is used to evaluate students’ writing (see Appendix 2 for the rubric). The
rubric consists of four sections which are Content / Production, Organization and Coherence, Word
Choice, and Language (mechanics and structure). The content section evaluates students’ ability to
write a well-developed topic sentence, supporting details with strong evidence (logos, ethos, and
pathos), and a concluding sentence.
The organization and coherence section evaluates students’ use of a variety of transition words
while introducing reasons and evidence to achieve cohesion and coherence in the text. The word
choice section evaluates students’ ability to use vivid words and expressions that relate to the topic,
look natural, and accurate.
Finally, the language section focuses on tracing errors in capitalization, punctuation marks (period,
comma, exclamation mark, and question mark), spelling, grammar such as subject-verb agreement,

ISSN 2708-9525
11
pronoun antecedent, consistency in tenses, and sentences structure (complete sentences). There are
two reasons behind choosing this rubric. The first one is that it assesses most of the aspects that
students need to master in order to articulate well-organized paragraphs using different types of
sentence patterns. The second reason is that this rubric includes the topics that are taught in the
course such as punctuation and grammar. By analyzing language mechanics and structure,
students’ writing should reflect their ability to use their knowledge of Basic English grammar rules
in writing grammatically correct sentences.
3.4. Procedures of collecting data
The procedures of collecting data for this study include the following steps: in week three of the
English course, students took the Benchmark test as a diagnostic test to assess their levels. The
questions included paragraph writing, summary writing, conditional sentences, passive voice,
perfect and present tense. (See Appendix 1 for the complete questions of the Benchmark test).
Throughout the course, students were taught grammar topics which were parts of speech (verbs,
nouns, adjectives, and adverbs). tenses (present, past, perfect, and future), subject-verb agreement
(indefinite pronouns, compound subject, phrases between the subject and the verb, collective
nouns, plural nouns, there is / there are, and don’t / doesn’t), active /passive voice, parallel structure,
punctuation marks, fragment, run-on, wordy, and stringy snetences. For each of the previous
grammar topics, there was a writing task. Students were asked to write a reflection, a short story,
descriptive and expository paragraphs. Samples of students’ assignments and projects were also
collected.
The purpose of these writing tasks is to enable students to see how language works in a meaningful
context. While writing assignments and projects, the writing process was used to enhance their
writing by giving them the chance to check content and language. After writing the draft, students
revised the unity of ideas, their use of cohesive devices, language mechanics and the appropriate
punctuation marks. By the end of the course, an exam was conducted and students were asked to
write paragraphs about various topics.
4. Data analysis
The samples that will be presented and analyzed in this section are related to four students selected
randomly. The process of analyzing data includes interpreting the evaluation process conducted
using the rubric. The analysis will focus on language mechanics mainly punctuation and
capitalization, structure of sentence such as using complete sentences (no fragment or run-on
sentences), third person singular, different types of sentences (simple, compound, and complex),
and subject-verb agreement (singular subject takes singular verb and plural subject takes plural
verb).
Since the benchmark test is conducted at the beginning of the course, students depend on their
background knowledge of grammar to write their paragraphs. In addition, students have no idea
about the structure of the paragraph which consists of topic sentence, supporting detail, and a
concluding sentence. This is clear in the samples of the benchmark test which show a very short
text with punctuation and capitalization mistakes.

ISSN 2708-9525
12
Samples of Benchmark Test
Student 1
The advantages of english language are many such as it can be used as a main language in
an organization through which communication can become easy as in an organization people
are from different backgrounds and speak different languages. Secondly, it also helps in the
education system as it becomes more easy for student to communicate and make a sentence,
paragraph, summary as well as helps in higher education.
Student 2
English became one of the most important langane of the communites, It is the way we
communicate with with the person so learning English is very important to all ages .In our
life now we see that 80% of our kids can speak English because of the high knowlage The
advantage s of learning English is to communicate
Student 3:
The advantage of learning English is that its the most common language known in the middle
east, it connect people to understand each other and its a well known language around the
world. amount of data in a relatively small space. Because of this, offices need less storage
space to store equipment such as file cabinets and supply closets.
Student 4:
Learning a new language always have a great impact on the learner. And learning English is
like opening a door to the future, were English is considered to be the most spoken language
around the world. As it is the language used to communicate worldwide. The vast majority
of companies require English as a very important factor for choosing their employees , were
as an example in a company e-mails are usually in English. Most universities use English in
their curriculum to easily attract students from many different places. Furthermore , in most
countries English is taken as a second language beside the mother one. Overall, the one who
is lucky is the one who take into consideration improving English, because in our era to be
an ignorant is directly connected with being not able to use English!
The above samples of the benchmark test display the following errors in subject-verb agreement,
structure of sentence, word choice, spelling, and word choice as in the following examples:
Student 1: sentence structure and capitalization: The advantages of english language are many such
as it can be used as a main language in an organization through which communication can become
easy as in an organization people are from different backgrounds and speak different languages.
Comparative form of adjective: “as it becomes more easy for student” instead of “as it becomes
easier for student”
Student 3: word choice: “its the most common language” instead of “it is the most common..”

ISSN 2708-9525
13
Student 4: subject-verb agreement: “Learning a new language always have a great impact” instead
of “Learning a new language always has …“the one who take into consideration” instead of “the
one who takes …”.
Word choice “were English is considered” instead of “where English is considered”
Samples of end-of-course exam:
Student 1:

ISSN 2708-9525
14
Student 2:

ISSN 2708-9525
15
Student 3:

ISSN 2708-9525
16
Student 4:
After teaching students grammar topics such as tenses, types of sentences, the structure of the
paragraph, and punctuation, students’ writing started improving. As the samples from the end-of
course exam show, learners become able to write extended paragraphs with different types of
sentences. However, there are still mistakes in subject-verb agreement, punctuation, and
capitalization.

ISSN 2708-9525
17
Samples of assignments:
Student 1:
There are many different ways in which the UAE promotes and guides the Emirati women.
Firstly, excessive preference is given to teaching more and more Emirati women and
attention is given on broadening their proficiency rate. This was accomplished by executing
free learning for them in public schools, colleges and institutes. They even proposed a law
(Article 17 of the UAE’s constitution) that fixates on providing obligatory education at the
fundamental stages. They began to comprehend the buildup this brought in the economy and
in the literacy rate and subsequently proposed a new law which made it mandatory for Emirati
children to start schooling at the age of 6 and remain in school until they have completed
grade 12 or reach the age of 18 whichever comes first. One aforesaid program was initiated
by H.H Sheikh Mohammad with the desire to make the UAE amid the most innovative
nations in the world which was the UAE National innovation strategy that was initiated as it
was perceived that innovation was a keystone for social and economic accumulation, this
strategy concentrated on seven sectors one of which was education. For example, with the
help of this law UAE women have achieved outstanding progress accounting for over 70
percent of university graduates. Moreover, 77% of Emirati women enroll in higher education
after secondary school and make up 70% of all university graduates in the UAE and 56% of
UAE government university graduates in science, technology, engineering and mathematics
(STEM) are women and the literacy rate of women in the UAE is 95.8%. Secondly, the UAE
also commends the performance of Emirati women by celebrating Emirati women’s day
under the theme “women emulating Zayed“ which wishes to hail the efforts of Emirati
women who play different roles as well as celebrate international women’s day and as well
as decided to host the women’s economic empowerment global summit (WEEGS) in order
to extend their legitimate acknowledgement and indebtedness to women in all locations and
fields for their evident contributions to the renewal and development of the nation. There are
numerous ways in which the UAE aids and associates the Emirati women.
Student 2:
For a long time, the UAE was a melting pot of cultures with more than 200 nationalities,
which they now refer to as their homeland. Due to this variation of cultures in the UAE, it is
known to have a diverse society. The heritage of the UAE is reflected in the customs and
traditions handed down from generation to generation. Sports in UAE are an actively
promoted pursuit for the love of the game not only because of its health benefits but also
because of its additional roles as an entertainer and cultural connection among people. First,
Falcon is the most popular sport in the UAE. It represents courage and strength that are two
essential elements of Emirati culture and all that it represents. It had grown so strong over
the years. Due to its importance in the culture of the UAE, two specialist hospitals to take
care of these magnificent birds are available that includes; Dubai Falcon Hospital and Abu
Dhabi Falcon Hospital. Falcon is used for hunting in the desert and the growth of a noble
sport. With the sport's increasing popularity, Falcons can cost between Dhs 2,000 and Dhs
50,000. They even need their passport to travel outside the country. Second, Camels are one
of the important parts of the culture of the Emirates dating back to its roots. Camels are said
to be God's gifts to Bedouin in the past because these animals often made life in the desert
possible and provided everything including; transportation, clothing, and even food. Camels
are today a symbol of local culture; the UAE now has extensive camel racing tracks, with a
total of 15 different tracks across the country. Many of these tracks are large and fully

ISSN 2708-9525
18
equipped facilities including; Al Wathba that is located in Abu Dhabi, the Camel Racing
Club located in Dubai, Ras Al Khaimah, Sharjah, and Umm Al Quwain are also situated in
camel racing grounds. Third, The Arabian horse for its rich bloodline is recognizable all over
the world and is one of the oldest breeds of horses. Horse racing is, therefore, an essential
part of Arabian life. There are various tournaments and courses for learners. Equipment for
horseman sports can be found in all clubs where sport can take a form of leisure activity.
Being a dry land, sport in the UAE is associated with desert sand, where camels, horses,
and falcon are being the most important sports in the UAE. Not forgetting football and
beach soccer that is being practiced everywhere in the UAE.
Student 3:
Customer-supplier relationship is a business relation that businesses have with their
customers and suppliers. Customers and suppliers play an important part in the success of a
business. The purpose of a business is to provide products or services for its customers. And
the way a business succeeds is by getting customers, maintaining customers and growing
customers. It can be seen as simple as no customers, no business. So, it is important for
businesses to focus on their relationship with their customers and make sure they are satisfied
and develop loyalty with them. This will help companies to fulfil their business goals and
grow. In Japanese, quality is translated to “okyakusama”, which means customer or an
honorable guest in English. This shows how much businesses around the world value their
customers and work on meeting and exceeding their customers’ expectations. And for a
business to provide goods to their customers, they need materials and other resources to
produce them. This is why it important for a business to focus on the quality of their
relationship with the supplier. Having a good relationship with suppliers can help a business
in many ways like getting better quality materials and receiving materials at discounted
prices. This makes the quality of relationship with suppliers directly linked to the quality of
a business’ goods and services, which affects the quality that the customers receive. A
business must always develop their products and services with the customer’s needs in mind,
which is vital to keep and grow customers. And by having a strong relationship with
suppliers, businesses can easily communicate with providers when customers’ demands
change.
Student 4:
Life without the Internet is nearly impossible to imagine. It has been the world’s most
powerful tool. All our daily tasks either directly or indirectly heavily rely on the access to the
Internet. It is with the help of the internet that there has been a revolutionary change in the
development of the society. Its impact has been manifested through the advancements made
in the fields of education, medicine, business, law, health, entertainment along with the
economic, global and political changes in the economy. Education has become online with
the grace of virtual teaching platforms that brings the students and the teachers closer
regardless of their geographical location different and we are able to access the internet for
many informative contents and blogs in our daily life. Hospitals can now keep digital version
of their patient’s records and medical history. It has also helped doctors connect to their
patients and to each other and provide instant resolutions to important matters regarding the
health of the patients e.g., The Cleveland Clinic in Abu Dhabi provides its staff with wireless
microphone connection so that every nurse and doctor in the hospital are connected no matter
far they are from each other. Also, heartbeat and fitness trackers are available on smart

ISSN 2708-9525
19
phones along with help apps for addicts. Governments have launched many initiatives for the
common welfare of the society and that includes providing social services and introducing
the smart government, citizens now can report accidents online, and pay their speeding
violations and road penalty bills online e.g. Dubai has launched the Dubai Police App that
helps making all transactions 100% digitized. The internet has also played a major role in
connecting us to our family, friends, colleagues in our daily life and has provided instant
exchange of news and keeping up to their updates with the invention of smart phones and
social media platforms i.e. Instagram, Snapchat, WhatsApp etc. It has also expanded our
social circle by providing easy access to anyone’s digital profiles and seeking for jobs etc.
through LinkedIn. Entertainment is another important feature that has been enhanced with
the internet e.g. Children can watch online cartoons while parents surf on Netflix and gamers
find their new passion and music lovers download new playlists, the internet has variety of
things for different tastes of people and they can either utilize their time on the internet in a
productive manner or vice versa. Internet surfing can sometimes turn into an obsession for
some segments of the society however keeping a balance is a must requirement in order to
lead a healthy and unsophisticated life. In conclusion, it can be said that the internet casts a
large influence on the behavior of the individuals in a society and has played a vital role in
the growth of the economy.
The assignments demonstrate a better understanding of the grammar topics and the structure of
paragraph. Using the process-approach helps students plan, write, revise, and edit their work to
ensure no grammar or punctuation mistakes.
5. The results
The following section will present the results of data analysis through relating to the research
questions and the literature review addressed earlier in this study.
To what extent would teaching grammar through the context of writing improve English
language skills?
Sub-questions are
1. To what extent would teaching grammar enhance learners' interlanguage?
2. To what extent would the writing process approach improve learners’ ability to produce
coherent output congruent with target language grammar?
Research question 1:
To what extent would teaching grammar enhance learners' interlanguage?
This question will be addressed by comparing the results of analyzing the benchmark test samples
with the end-of-course assessment samples. The results of data analysis assert that teaching
particular grammar topics accommodated to students’ needs and providing them with
communicative practices of these topics enhance to a large extent learner’s interlanguage. The
analysis shows that students use different types of sentences in the end-of-course in comparison to
their sentences in the benchmark test. This demonstrates students’ mastering of the types of

ISSN 2708-9525
20
sentences and their function. Concerning subject-verb agreement concept as represented by using
the third person singular, it is clear that errors are available in the benchmark test as well as in the
end-of-course samples where learners wrote extended paragraphs. Finally, in relation to
consistency between tenses, students shifted smoothly between present and past tense while writing
their paragraphs.
The results of analyzing our data can be related to the theoretical framework discussed earlier. As
stated in the literature section, learner’s interlanguage is affected by different cognitive processes
(Grauberg, 1997), and one of them is related to the strategies of language learning and the
approaches used when teaching the material. During the course, learners were involved in
communicative activities to boost their understanding of the grammar topics and improve their
abilities to use them in a meaningful context as stated earlier by Takac (2008, pp.31-32) “grammar
learning strategies, i.e. learning strategies that help learners to develop a mental grammar of the
L2. It is these strategies that support a definite systematicity in the interlanguage”.
Also, the results of data analysis relate to the functional grammar theory discussed in the literature
review. Students’ samples show their understanding of how language works (Feng, 2013), and how
paragraphs are structured. Learners write texts not only for the English course but also for other
subjects, and in the case of other subjects they write extended texts. The results of our data analysis
can be explained by the words of Azar (2007) who states that “along with an understanding of the
nature of language, one of the principal benefits of GBT is that it helps students gain an
understanding of grammar concepts” (pp.1-2).
However, samples from both assessments show errors in punctuation and capitalization. Despite
the fact that leaners study these two topics at school and later in the English course at the university,
they still need to concentrate more on using appropriate punctuation marks in their writing. The
results in our study match to some extent the results of the study conducted by Urdaneta (2011)
which assert that grammar classes are important to learn English writing and that the more students
are exposed to English, the more language acquisition will be enhanced.
Research question 2:
To what extent would the writing process approach improve learners’ ability to produce coherent
output congruent with target language grammar?
This research question will be answered by comparing the samples of exams with the samples of
the assignments. The results of analyzing students’ written performance indicate that the process
approach increases learners’ abilities to produce well-organized and grammatically correct
paragraphs in comparison to the paragraphs written in both tests. After writing the draft, students
receive constructive feedback and are given the chance to check their language. This is related to
what Kroll (2003) has proved in his study that in second language writing classrooms, the writing
process approach prompts creative strategies, multiple drafts, and formative feedback.
The analysis of learners’ assignments demonstrates a deeper understanding of the usage of different
types of sentences, subject-verb agreement, third person singular, punctuation marks, and
capitalization. This is justified by the fact that students followed the process-oriented approach.
They brainstormed ideas, wrote their outlines, completed the draft, and then received the feedback.
The process of writing, revising, and editing enables learners to identify their errors and correct
ISSN 2708-9525
21
them. Also, this process clarifies the points of weakness that students need to overcome and find
suitable solutions. Whether students work in groups or as individuals, the feedback focuses on the
organization of ideas, sentence structure, and tenses.
The main question: To what extent would teaching grammar through the context of writing
improve English language skills?
The answer of this question relates to the three dimensions of the theoretical framework introduced
earlier which are functional grammar theory, learners’ interlanguage, and the process-oriented
approach. In the functional grammar theory, Thompson (1996) illuminates the three components
of functional grammar, and one of these components is using language where learners “organize
messages in ways which indicate how they fit in with the other messages around them and with the
wider context in which we are talking or writing (cited in Feng, 2013, p.87). The results of
analyzing samples of the assignments and end-of-course writing reflect the benefits of using
functional grammar theory as a teaching strategy while delivering the material. Moreover, the
results imply that teaching students the assigned grammar topics for this course and backing each
topic with a writing task would enhance students’ interlanguage and show students how language
works in a meaningful context.
As for the last dimension of the theoretical framework, it is obvious that integrating teaching
grammar with the writing process approach enables students to improve their written performance.
Learners revise and edit both content and language. This was evident in samples of assignments
more than tests’ samples, since the mechanics and structure mistakes were less in the assignments
than in the exam samples. This means that teaching grammar through the context of writing was
effective, but it would be more beneficial if teaching grammar was mingled with the writing process
approach.
6. Implications on learning and teaching English
As indicated in the previous section, the results of data analysis prove the positive outcomes of the
study by exhibiting a progress in students’ performance in English. The findings can be used to
provide recommendations on how to enhance teaching grammar through the context of writing to
adapt to learners’ needs and levels. These recommendations may inspire teachers to adopt effective
teaching techniques to overcome the difficulties Arab students face while studying grammar,
particularly third-person singular and consistency in using tenses.
In addition, instructors are advised to use the process approach while teaching writing especially
writing assignments and projects to enable students to identify their mistakes and correct them.
One aspect of improving learners’ English language is data analysis. Teachers could utilize
analyzing students’ writings to recognize the problems that they face in learning English, and then
work to find solutions for these problems during prepared classroom activities.
The call for authentic materials to be used in classroom for the different skills of English has proved
its effectiveness in enriching the learning material as Berwald (1987, p.1) states that they "contain
current language on all topics imaginable and provide constant reinforcement of grammatical forms
learned in the classroom. In addition to containing traditional vocabulary learned in the early stages

ISSN 2708-9525
22
of language instruction, they may contain neologism as well as extensive vocabulary for sports,
politics, cooking, music and other topical areas."
7. Conclusion
This study focuses on evaluating the effectiveness of teaching grammar through the context of
writing. The data gathered to answer the research questions consists of samples of written
performance collected at different stages of the course and includes samples of benchmark test,
end-of-course test, and assignments. The analysis of students’ written performance reveals the
positive effects of teaching grammar through the context of writing especially if mingled with the
process oriented approach. The study recommends that instructors use the process approach in
writing assignments and projects to enable students to identify their mistakes and correct them.
8. Limitations of the study
This study is limited to the data collected from a particular number of students. The study
concentrates mainly on evaluating the effectiveness of teaching grammar through the context of
writing. Particular grammar topics are assigned for this course to suit students’ needs since they
study different subjects. As a result, other grammar topics may not be useful and practical to
accommodate to students’ levels and needs.
9. Future research
It is recommended that a longitudinal further research is conducted on the effectiveness of teaching
grammar through the context of writing to enhance learners’ English language. A wider range of
written performance samples might be collected and analyzed to enable the researcher to generate
further recommendations to improve English teaching strategies and the learning process.
References Alduais, A.M.S. (2012). Simple sentence structure of Standard Arabic language and Standard
English language: a contrastive study. International Journal of Linguistics, vol. 4 (4), pp.500-
524.
Andrews, R. & Smith, A. (2011). Developing writers: teaching and learning in the digital age.
London: McGraw-Hill Education.
Arena, L.A. (ed.). (2013). Language proficiency: defining, teaching, and testing. New York:
Springer Science+Business Media, LLC.
Azar, B. (2007). Grammar-based teaching: a practitioner’s perspective. Teaching English as a
Second or Foreign Language TESL-EJ, vol. 11 (2), pp.1-12.
Berwald, J.P. (1987). Teaching foreign languages with realia and other authentic materials. Eric
QGA. https://files.eric.ed.gov/fulltext/ED289367.pdf
Ellis, R. (1994). The study of second language acquisition. Shanghai: Oxford University Press.

ISSN 2708-9525
23
Ellis, R. (1997). Second language acquisition. Issues in Applied Linguistics, vol. 8 (1), pp. 66-69.
Elkilic, G. (2012). Mother tongue traces of Turkish university students on composition papers
written in English. Procedia – Social and Behavioral Sciences, vol. 47 February, pp. 656-664.
Feng, Z. (2013). Functional grammar and its implications for English teaching and learning.
English Language Teaching, vol. 6 (10), pp.86-94.
Firth, M.B. (1978). Interlanguage theory: implications for the classroom. McGill Journal of
Education, vol. 13:2, pp.155-156.
Flower, L. & Hayes, J. (1980). 'The dynamics of composing: making plans and juggling
constraints', in L.W. Gregg and E.R. Steinberg (eds). Cognitive processes in writing. New Jersey:
Lawrence Erlbaum Associates, pp. 31-50.
Grauberg, W. (1997). The elements of foreign language teaching. Clevedon: Multilingual Matters
Ltd.
Halliday, M.A.K. (1994). An introduction to functional grammar. London: Edward Arnold.
Hengeveld, K (ed.) (1997). The theory of functional grammar part 1: the structure of the clause
2nd ed. Berlin: Mouton de Gruyter.
Hinkel, E. & Fotos, S. (eds) (2008). New perspectives on grammar teaching in second language
classrooms. New York: Taylor & Francis e-Library.
Kroll, B. (ed) (2003). Exploring the dynamics of second language writing. New York: Cambridge
University Press.
Lado, R. (1957). Linguistics across cultures: applied linguistics for language teachers.
University of Michigan Press.
Richards, J. C. (2002). 'Theories of teaching in language teaching', in J.C. Richards & W.A.
Renanyda. Methodology in language teaching. New York: Cambridge, pp. 19-25.
Selinker, I. (1972). Interlanguage. IRAL International Review of Applied Linguistics in Language
Teaching, vol. 10 (3), pp.209-231.
Selvester, P.M. & Summers, D.G. (2015). Socially responsible literacy: teaching adolescents for
purpose and power. New York: Teachers College, Columbia University.
Takac, V.P. (2008). Vocabulary learning strategies and foreign language acquisition. Ireland:
Multilingual Matters Ltd.
Tangpermpoon, T. (2008). Integrated approaches to improve students writing skills for English
major students. ABAC Journal, vol. 28 (2), pp. 1-9.
Thompson, G. (2013). Introducing functional grammar 3rd ed. New York: Routledge.

ISSN 2708-9525
24
Urdaneta, J.L.L. (2011). Spanish-English writing structure interferences in second language
learners. Gist Education and Learning Research Journal, vol. 5, pp. 158-179.
White, R. & Arndt, V. (1991). Process writing. Essex: Addison Wesley Longman Ltd.
Appendix 1: Questions of the benchmark test
1) Paragraph Writing: Write a short paragraph about the following topic:
The advantages of learning English
2) Summary: Summarize the following passage:
Computers have become a necessity for both small and large businesses today. It takes a computer
less than a second to retrieve information that takes a person several hours to obtain. It is for this
reason that banks, airlines, and fast food restaurants rely so heavily on them. In addition, computers
can store large amounts of data in a relatively small space. Because of this, offices need less storage
space equipment such as file cabinets and supply closets.
3) Conditional
Complete the following sentence with the suitable form of verb between brackets.
If you had told me about your problem, I _____________________________(help) you.
4) Passive Voice
Complete the following sentence with the correct form of verb between brackets. Use passive
voice.
The car _________________(steal) before the police had arrived.
5) Passive Voice
Complete the following sentence with the correct form of verb between brackets. Use passive
voice.
The car _________________(steal) before the police had arrived.
6) Perfect Tense
Complete the following sentence with the correct form of verb between brackets. Use perfect
tense.
Salim ________________(work) in London for 10 years.
7) Present Tense
Complete the following sentence with the suitable form of verb between brackets.
Ahmad or his brother _______ (play) tennis every day.

ISSN 2708-9525
25
Appendix 2: Rubrics for Paragraph Writing
Criteria Exemplary Meeting Approaching Insufficient Score
Con
ten
t /
Pro
du
ctio
n
Take a clear position
and supports it
consistently with well-
focused topic sentence,
well-developed specific
details and a concluding
sentence, persuasive
techniques logos, ethos,
and pathos are all
present and powerful,
each appeal is used
throughout the content
effectively
Take a clear position
and support it with
clear topic sentence,
mostly specific
details and a
concluding sentence,
persuasive
techniques logos,
ethos, and pathos are
present but are not
effectively used
Take a position
and provide with a
topic sentence,
general supporting
details, and a
conclusion that
does not restate the
topic, only one
rhetorical appeal is
used
Attempts to take
a position but not
clear, provide
minimal
supporting
details, no
concluding
sentence, and no
persuasive
techniques are
used
2
Org
an
izati
on
an
d C
oh
eren
ce The writer has a variety
of transition words or
phrases effectively
introduce reasons and
evidence within the
paragraph.
The writer has three
or more transition
words or phrases,
introduce reasons and
evidence within the
paragraph.
The writer has one
or two transition
words or phrases,
introduce reasons
and evidence
within the
paragraph.
The writer needs
transition words
or phrases.
1
Word
ch
oic
e
The author uses vivid
words and phrases. The
choice and placement
of words seems
accurate, natural, and
not forced.
The author uses vivid
words and phrases.
The choice and
placement of words
is inaccurate at times
and/or seems
overdone.
The author uses
words that
communicate
clearly, but the
writing lacks
variety.
The writer uses a
limited
vocabulary.
Jargon or clichés
may be present
and detract from
the meaning.
1
Lan
gu
age
(mec
han
ics
an
d s
tru
ctu
re)
The writer has few if
any errors in
capitalization, usage,
punctuation, spelling or
grammar. Errors do not
interfere with
readability.
The writer has some
errors in
capitalization, usage,
punctuation, spelling
or grammar. Errors
do not interfere with
readability.
The writer has
many errors in
capitalization,
usage, punctuation,
spelling or
grammar. Errors
interfere somewhat
with readability.
The writer has
significant errors
in capitalization,
usage,
punctuation,
spelling or
grammar. Errors
interfere
significantly
with readability.
1
Total 5

ISSN 2708-9525
26
An Assessment Management System for Multiple Choice
Questions in an Integrated Medical Curriculum
Sami Shaban and Margaret Elzubeir, College of Medicine and Health Sciences- United Arab Emirates University.
Abstract
Background: Assessment management systems for integrated medical curricula must contain
several key features in order to allow medical educators and assessors to develop, maintain, conduct
and evaluate assessments properly. We have developed an Assessment Management System
(AMS) to manage and maintain its question bank as well as create, conduct and evaluate its
assessments. Requirement analysis was conducted to determine key features needed to develop,
maintain, conduct and evaluate Multiple-Choice Question (MCQ) assessments in an integrated
medical curriculum.
Results: Requirements analysis revealed that user-friendly, security, and user access control are
top priority. Key features include collecting tagged questions in a question bank, standard setting
assessments, linking questions to learning outcomes, conducting assessments, collating and
disseminating results including question psychometrics, giving feedback to students and question
writers, and generating assessments using the question bank and examination blueprints. The AMS
has been developed in-house based on this requirements analysis using a web-based, database-
driven platform.
Discussion: The system has been used at the college for over 2,000 MCQ-type assessments from
2010 to 2019. The question bank is utilized by faculty to create assessments, standard set, map
questions to course outcomes, and analyze results using psychometrics. A Team-Based Learning
and Assessment module has also been added.
Conclusion: Keeping in mind that reliable information gathering and interaction with eventual
users is vital to the effective design of the system, it is possible to develop a secure and
customizable online assessment management system for medical schools that is earnestly used and
accepted, satisfies the needs of assessment management, and conforms to medical education and
assessment principles.
Take-home message: Tagging of questions, standard setting, linking of question to learning
outcomes, and generating examinations based on blueprints are some of the priorities in an
integrated medical curriculum assessment system.

ISSN 2708-9525
27
Breast Self-Examination: The Knowledge, Attitude and
Practices among Female University students residing in Abuja
Falmata Ali Mohammed,
Under the supervision of:
Maryam Buhari-Shehu,
Health and Nutrition Program Officer at Aliko Dangote Foundation
Ali Zalzala,
Associate at Hamdan Bin Mohammed Smart University
Acknowledgements
To begin with, I will like to thank Dr. Ali Zalzala for his unending support throughout this course.
I also have to thank my place of work, Aliko Dangote foundation, for providing me with unending
support throughout the course of my project.
Getting this research done needed more than just academic support and I have to thank my sisters
and friends for giving me more support than I could have ever wished for. Words cannot express
how grateful I am.
Most importantly, none of this could have happened without my loving parents, Group capt. Aliyu
Kur Mohammed rtd. And Mrs. Hassana Mohammed, who offered me encouragement, love and
unwavering support. To my family– every time I was ready to call it quits, you did not let me and
I am eternally grateful.
Executive Summary
Background: The occurrence of breast cancer is expanding and its diagnosis is unfortunately
usually done in our condition with prognosis at levels which are lower that what are considered to
be standard. Breast self-assessment (BSE) stays a significant tool in diagnosis for the early
detection of breast cancer in a community that is constrained of resources. Female university
students in Abuja, the federal capital of Nigeria, are in a position to be well educated on the benefits
of the tool if they are not already aware and they may also serve as ambassadors of the movement.
BSE is a relatively simple diagnostic method that requires no financial commitment, no need for
special tools and is also non-invasive.
Objectives: This research paper explores the knowledge, attitudes and believes surrounding BSE
among female university students residing in Abuja with respect to the number that actively
practice BSE, method used and the frequency of BSE.

ISSN 2708-9525
28
Materials and Methods: The examination is a case-study investigation of female university
students residing in Abuja and are utilizing BSE. The research can be framed as a survey research.
Respondents were chosen by means of the implementation of stratified random sampling. The data
collected were on socio-demographic profile, information, disposition and practice of BSE. The
connections between these elements were considered.
Results: All the female university students examined know about BSE, with some of them actually
putting it into practice. There is poor information on its timing, frequency and method. Only about
half of the respondents practice BSE month to month, and none of the respondents can precisely
depict the method used in carrying out BSE. The rate at which BSE is practiced is very low even
with those exposed to knowledge about it.
Conclusion: There is a widespread sense of awareness among the female university students to the
BSE, with inauspicious consciousness of its motivation, method, timing, and frequency among
them being examined. In any case, there is a great deal of excitement to urge others to do it. In this
way, female university students should be likewise additionally trained and taught about the
system. The hypothesis is disproven because female university students have the knowledge but
have negative attitudes towards it which result from fear and a lack of practice resulting from a
lack of comfort.
Introduction
Breast cancer is a noteworthy public health concern in both developing and developed countries.
Breast cancer is a threatening tumor that starts from the cells of the breast. It happens for the most
part in women, however men can likewise be affected. The occurrence of breast cancer is
expanding in the developing countries because of increment in life expectancy, increment in
urbanization and appropriation of western lifestyles. Albeit some risk decrease may be
accomplished with counteractive action, these methodologies can't dispose of most of breast
cancers that develop in low-and middle income countries where breast cancer is found in late stages
(WHO, 2011). In this way, early detection so as to improve breast cancer result and survival
remains the foundation of breast cancer control.
Breast cancer normally creates no symptoms when the tumor is little and most effectively treated,
which is the reason screening is significant for early detection. The most normal physical sign is
an easy protuberance. Now and then breast cancer spreads to underarm lymph nodes and causes a
protuberance or swelling, even before the first breast tumor is huge enough to be felt. Less basic
signs and symptoms incorporate breast pain or increased weight; persevering changes, for example,
swelling, thickening, or redness of the skin; and areola or nipple anomalies, for example,
unconstrained discharge (particularly bloody), disintegration, or withdrawal (American Cancer
Society, 2017). Any determined change in the breast ought to be assessed by a doctor at the earliest
opportunity.
University students, by the idea that they are of higher intellect than their less educated pairs assume
a novel job in being ambassadors of positive attitudes and believes especially in areas that have to
do with their wellbeing and health. This includes the early detection of breast cancer, risk factors

ISSN 2708-9525
29
and accessible screening methods and practices (Demirkiran, et al., 2007). Additionally, the
knowledge and practice of BSE will improve early detection in themselves and the society at large
(Doshi, Reddy, Kulkarni, & Karunakar, 2017).
Literature review
Knowledge of breast-self examination
Information of cancer in Africa is woefully deficient , and epidemiological information with respect
to the occurrence of cancer in sub-Saharan Africa, particularly, are inadequate (Parkin, et al., 1986).
In the past, cancers and other communicable illnesses were believed to be irrelevant public health
issues in developing countries, similar to Ghana, as a result of the extremely high prevalence of
transmittable illnesses (Wiredu & Armah, 2006). The past examinations have concentrated on
cancer morbidity information from the few built up cancer libraries in Africa, with not very many
providing details regarding cancer mortality information.
In Nigeria, a cross-sectional study was done by Bassey, Irurhe, Olowoyeye, Adeyomoye, and
Onajole in 2011 to survey level of knowledge, attitude and practice of mind with regards to breast
self-examination (BSE) among nursing students of Lagos University Teaching Hospital. This study
showed that the respondent's knowledge of breast cancer and breast self-examination was high
(97.3%; 85.6%) had knowledge on the proper procedure of carrying out a breast self-examination
effectively (Bassey, Olowoyeye, Adeyomoye, & Onajole, 2011). It was found that a larger part,
58.6%, acquired their information from TV/radio. The mentality of respondents to breast self-
examination was great, the larger part of the respondents, 98.5%, thought breast self-examination
was fundamental and 84.3% professed to have completed breast self-examination previously.
Respondents' routine with regards to breast self-examination was additionally great with 80.2% of
the respondents professing to do breast self-examination consistently.
The degree of consciousness of breast cancer and breast self-examination was high among nursing
students of the Lagos University Teaching Hospital. Results demonstrated that larger part of the
respondents, 40.7% were from the age bracket of 21-22 which were sampled from first to 6th year
medicinal students. 97.3% had known about breast cancer and breast self-examination. 54.8% of
the respondents knew about breast cancer from TV/radio. The vast majority of the respondents,
85.8% know how to perform breast self-examination effectively. Just 65.4% of the respondents felt
that breast self-examination was essential. 43.5% of the respondents said that the last time they
performed breast self-examination was less than a year prior. A dominant part of the respondents,
69.6% liked to perform breast self-examination in the morning while 47.7% of the respondents
liked to complete breast self-test before the mirror.
Breast cancer data and information
Malignant neoplasms represented 914 (2.6%) of every one of the 34,598 confirmations, and 141
(5.6%) of each of the 2,501 deaths at the Korle-Bu Teaching Hospital (KBTH) in the year 1996
and the case casualty risk from malignancies was in this way 15.4% (Biritwum, Gulaid, &
Amaning, 2000). A survey of the cancer register in the Department of Child Health, KBTH, over
a 40-month time frame uncovered that malignancies represented 1.67% all things considered, with

ISSN 2708-9525
30
lymphomas (for the most part Burkitt's lymphomas) being the most common tumor (67%),followed
by retinoblastoma (8.6%), leukemia (8.2%) and Wilm's tumor (7.8%) (Welbeck & Hesse, 1998).
The above cancer morbidity pattern in the Ghanaian pediatric populace is like the image found in
West Africa and other developing African countries , except for Namibia (Wessels & Hesseling,
1997).
Albeit some risk decrease may be accomplished with prevention, these systems can't dispose of
most of breast cancers that develop in low-and middle income countries. Accordingly, early
detection so as to improve breast cancer result and survival remains the foundation of breast cancer
control (Andersen, et al., 2008).
The WHO has listed two early detection strategies which are:
- early detection to early signs and symptoms in symptomatic populaces so as to encourage
determination and early treatment, and
- screening that is the deliberate utilization of a screening test in an apparently asymptomatic
populace. It expects to distinguish people with a variation from the norm suggestive of cancer.
Independent of the early detection strategy utilized, fundamental to the accomplishment of
populace based early detection are cautious arranging and an efficient and reasonable program that
objectives the correct populace gathering and guarantees coordination, progression and nature of
activities over the entire continuum of consideration. Focusing on an inappropriate age group, could
cause a lower number of breast cancers discovered per woman screened and along these lines
diminish its cost-viability. What's more, focusing on more youthful i.e. younger women would
prompt more assessment of favorable tumors, which causes superfluous over-burden of health care
offices because of the utilization of expansion demonstrative assets (Yip, et al., 2008).
Practice of breast-self examination
Better reporting women's knowledge and practices on breast cancer and breast self-test (BSE)
would be helpful in the plan of intercessions planned for counteracting breast cancer. An
examination led in Haramaya University, Ethiopia, had demonstrated that larger part of the
understudies (77%) had never performed BSE, despite the fact that they had great information of
BSE, and their purposes behind this were as per the following: nonattendance of signs or
symptoms (28.8%), carelessness (17%), dread of recognizing some variation from the norm
(16.4%), and absence of protection (15.4%) (AFCRN Ethiopia- Addis Ababa city cancer registry.,
2019).
As to of beginning for BSE, 41.37% of the investigation respondents began to perform BSE at 20
years old years. Of the 23% of understudies who had done BSE, 16 (55.1%) did not actually recall
how regularly they have done it, eight (27.5%) rehearsed it yearly, one responder (3.44%) has
done BSE under multiple times in most recent a year, four (13.79%) performed BSE multiple
occasions in the last 12 months (Ameer, Abdulie, & Pal, 2014).

ISSN 2708-9525
31
Attitudes of breast-self examination
It tends to be said that women's' frame of mind i.e. attitudes have been influenced by their level of
education and that of their spouses. Then again, more extensive information prompts better frame
of mind i.e. attitudes towards literacy (UNESCO) (Pilehvarzadeh, Rezie, RezaAflatoonian, Rafeti,
& Mashayekhi, 2015). UNESCO knows education plays a significant role in changing individuals'
frame of mind and procedures towards wellbeing and health principles (Frotan, 2002). Culture
and attitudes may have a job in performing wellbeing focused practices like BSE. The target
trainings should be focused on the improvement of fitting solutions for caution against health and
wellbeing dangers, focusing on the structure of women's attitudes and utilizing health focused
screening approach are usually recommended (Lamyian, Heidarnia, Ahmadi, Faghihzade, &
Aguilar, 2008).
In a study carried out in Buea, it was found that around 6 out of 10 (59%) of the respondents were
in accord that they can do a self-breast examination without anyone else's input or help. Half
(51.4%) conceded that they were not scared to find breast cancer, in the interim 26.5% were
apprehensive and scared of finding anything in the process. It was found that in a dominant party
(88%) of the respondents, BSE was significant and helpful in the early detection of breast cancer.
A dominant party (81.9%) of the respondents referred to that they were inspired by adverts and
health promotion campaigns to perform BSE. Around 8 out of 10 (77.1%) of the respondents
didn't consider BSE as a practice that is embarrassing. Different markers used to assess the frame
of mind (attitudes) of the respondents also found that 34.3% of the respondents were exceptionally
in support of BSE, 63.3% modestly in support, and just 2.4% were not in support (Nde, Assob,
Kwenti, Njunda, & Tainenbe, 2015).
Knowledge, Attitudes and Practice of performing BSE
Previous studies performed among women in Buea, which has a similar setting with Abuja, had
likewise uncovered that women didn't perform BSE routinely (Suh, Julius, Fuh, & Eta, 2012). The
principle factor that could be credited to this is the absence of information or knowledge on BSE
which was commonly seen to be unacceptable, with just 9.6% of the respondents significantly
knowledgeable of BSE as a method. Absence of information has additionally been embroiled as
the principle explanation behind the poor practice of BSE in comparable investigations performed
in other places. About 88.6% of the respondents in this examination saw BSE as a significant
strategy in the early detection of breast cancer, yet just 9% realized how to perform it, and just
13.9% knew what to look for while performing BSE (Nde, Assob, Kwenti, Njunda, & Tainenbe,
2015). Comparable perceptions have been accounted for somewhere else in previous studies. The
principle source of data on BSE as shown by the respondents in this examination was TV which
isn't unique in relation to what has been seen in contemplates performed somewhere else (Norliza,
2010). This discovering shows that the media particularly TV can be utilized to sharpen women
on the significance of BSE, just as educate women on the best way to perform BSE (Nde, Assob,
Kwenti, Njunda, & Tainenbe, 2015).
This study is significant in giving data towards BSE practice among female university students.
Better recording the BSE practice of the students would be helpful to the government
administration and non-governmental associations in the structure of interventions used for viable

ISSN 2708-9525
32
counteractive action of breast cancer, and it might likewise empower different analysts and policy-
makers to do an increasingly broad research in this specific issue being as standard/ baseline data.
This study is likewise viewed as imperative since BSE can be a basic methods through which early
detection of a breast disease could be made. So evaluating BSE practice will be useful over rare
diagnostic services.
Methodology Design
Aim of the study
The study is aimed at finding out the knowledge, attitudes and practices of breast self-
examinations among female university students residing in Abuja.
Objectives of the study
1. To determine the knowledge, attitude and practices of breast self-examinations among
female university students residing in Abuja.
2. To determine the relationship of the knowledge on Breast self-examination and the
demographic variables
Research questions
What are the knowledge, attitudes and practices of breast self-examinations among female
university students residing in Abuja?
What are the relationships of the knowledge on Breast self-examination and the demographic
variables?
Research hypothesis
Female university students do not engage in breast self-examination due to poor knowledge and
adverse attitudes towards said behavior
Variables
Independent variables: age, academic year, family history, type of academic institution.
Dependent variables: knowledge, attitudes, and practices of BSE.
Study design
The examination is a case-study investigation of female university students residing in Abuja and
are utilizing BSE. The research can be framed as a survey research.
Study setting
The study was conducted in Abuja, Nigeria.
Study period
The study was conducted from September, 2019 to December, 2019.

ISSN 2708-9525
33
Study sample
Respondents were selected with the use of a stratified random sampling is a method that envelops
dividing the population into smaller groups, i.e. strata; these groups are made based on specific
attributes or characteristics common to all members. For this situation, the strata would just
incorporate female university students that reside in Abuja. When the strata have been set up, a
sample size of 50 subjects will be made.
Inclusion criteria
Female :
- Currently enrolled in university.
- Residing in Abuja.
- Willing to participate in the study.
Tool of the study
For the collection of data, a questionnaire (self-administered) was used to survey the
sociodemographic data which comprised of the objective group. The questionnaire comprised of
twenty quantitative questions on breast cancer, and breast- self assessment. Scoring codes of the
participants was done as pursues: each question had a set of answer focuses, five (5) for strongly
agree, four (4) for agree, three (3) for uncertain, two (2) for disagree and one (1) for strongly
disagree. A reverse score is given for the negative items. Three interviews were also conducted.
Validity and reliability of the study
The questionnaire was revised and validated by work colleagues which are experts in the field of
public health and social behavior change.
Pilot study
A pilot study was conducted with five students to determine the clarity of the questions, time used,
and success of the questionnaire tool.
Questionnaire response rate
A high response rate of 100% was reached.
Data analysis
The quantitative data was entered and analyzed using excel. The demographics and other
parameters were analyzed using frequency, percentages and bar charts. The hypothesis was tested.

ISSN 2708-9525
34
Data Collection
Data collection method: Questionnaires
The questionnaires were personally administered and carried 20 questions given to 50
respondents. It carried both close and open ended questions. It also had both positively and
negatively worded questions. Scoring codes of the participants was done as pursues: each question
had a set of answer focuses, five (5) for strongly disagree, four (4) for disagree, three (3) for
uncertain, two (2) for agree and one (1) for strongly agree. A reverse score is given for the negative
items. The questionnaires were printed and were handed to the respondents in person. The
questionnaires were confidential.
Data collection method: interviews
The qualitative aspect of the research were interviews carried out with 3 experts in the field. The
first being Maryam Shehu, a social behavior change expert at the Aliko Dangote Foundation. The
second was Mr. Wale Falade, a monitoring evaluation and learning (MEAL) expert at the USAID.
And the last was Dr. Azeez Oseni, a projects specialist at Malaria consortium.
The interviews were structured in nature as pre-prepared questions were ready before the
interviews commenced.
These interviews were carried out in person i.e. physically.
Assessment of knowledge on knowledge, attitudes and practice of BSE
The 20 questions in the questionnaire were all focused on measuring the knowledge, attitudes and
practice ensued by the female university students residing in Abuja with regards to BSE.
Following suit, the 15 interview questions were also carried out in the same fashion simply to
assess the knowledge, attitudes and practices of the BSE by the chosen sample.
Analysis
Quantitative data
Table 1: assessment of the baseline characteristics of the study sample
parameters number
age below 20 28
above 20 22
academic level or year first year 19
second year 12

ISSN 2708-9525
35
third year 12
fourth year 7
other 0
family history yes 11
no 39
information of BSE yes 31
no 19
gained from study/education 13
personal experience 37
knowledge poor knowledge 7
fair knowledge 28
good knowledge
15
Table 2: quantitative parameters
Items
strongly
disagree
disagree
uncertain
agree
strongly
agree
Do you feel performing breast
self-examination is a waste of
time?
20
16
4
7
3
Breast Self-Examination makes me
feel
so funny
28 11 7 4 0
I find breast self-examination
embarrassing
18 10 11 9 2
I find performing breast self-
examination to be
Unpleasant
16
11
9
9
5
I would rather get treatment from a
traditional healer if I find an
abnormality
29
11
4
4
2
I do not feel comfortable and can't do
Breast Self-Examination once in a
month
5
12
15
17
1

ISSN 2708-9525
36
I think all women should do breast
self-examination
1 1 7 9 32
I avoid breast self-examination
because
I worry about having breast cancer
3
8
5
14
20
I am interested in doing breast self-
examination
5 3 18 18 11
Always search for information
regarding breast self- examination
from the internet, magazine, and
Newspaper
10
8
14
8
10
I perform a breast self-examination
once a month
7 5 1 20 17
I have learnt the correct
method of breast self-
examination
6
9
1
16
17
I have been taught breast self-
examination by health staff or
qualified personnel
5
11
1
14
19
If notice any breast abnormality, I
will directly go to public health care
7
5
1
9
28
Following the pattern of a Likert scale, data of the qualitative
analysis with: 1 = strongly disagree
2 = disagree
3 = uncertain
4 = agree
5 = strongly agree
For negative questions, a reverse scoring is done
parameters N Mean Std.
Deviation
Mode Median Interquartile
range
age below 20 28 17.04 1.43 17 17 2
above 20 22 23.86 3.95 23 23 2.25

ISSN 2708-9525
37
Figure 1: analysis of baseline characteristic – age
Figure 2: analysis of students’ attitudes of BSE
waste of time
25
20
15
10
5
0
strongly disagree disagree uncertain agree strongly agree
waste of time

ISSN 2708-9525
38
Figure 3: analysis of students attitudes for BSE
Figure 4: analysis of students practice of BSE
I perform BSE once a month
25
20
15
10
5
0
strongly disagree Disagree uncertain agree strongly agree
I perform BSE once a month

ISSN 2708-9525
39
Figure 5: analysis of the students practice of BSE
Figure 6: analysis of students’ practice of BSE
Learning the correct method of BSE
18
16
14
12
10
8
6
4
2
0
strongly disagree disagree uncertain agree strongly agre
Learning the correct method of BSE

ISSN 2708-9525
40
Figure 7: analysis of students’ attitude of BSE
Figure 8: analysis of students’ practice of BSE
go to traditional healer if abnormality is noticed
35
30
25
20
15
10
5
0
Strongly disagree disagree uncertain agree strongly agree
go to traditional healer if abnormality is noticed

ISSN 2708-9525
41
Qualitative data
Figure 9: qualitative coding
Elements to be coded Codes
Knowledge Abnormali
ty
Detection
Availability
Attitudes Ri
sk
Fe
ar
Encouragement
Practice Clinical exam
Frequency
Breast cancer Lum
ps
Histo
ry
Interviews
The qualitative aspect of the research were interviews carried out with 3 experts in the field. The
first being Maryam Shehu, a social behavior change expert at the Aliko Dangote Foundation. The
second was Mr. Wale Falade, a monitoring evaluation and learning (MEAL) expert at the USAID.
And the last was Dr. Azeez Oseni, a projects specialist at Malaria consortium.
The interviews were structured in nature as pre-prepared questions were ready before the
interviews commenced.
These interviews were carried out in person i.e. physically.
Note: The questions asked during the interview will be affixed to the appendix.
Knowledge
The three interviews conducted with experts in the field showed that knowledge is vital in the
success of breast self-examinations. Mr. Wale noted that with detection, the BSE is the first step
and should always be followed by a clinical exam if any abnormality is found. A clinical exam
also needs to be done based on routine checks for individuals, usually women, above the age of
45 via a mammogram. He also went ahead to say that early detection gives individuals a higher
chance of surviving breast cancer.
To find out more from the clinical aspect of things, Dr. Azeez was asked questions about the steps
needed for performing a breast self-exam and he said “carefully observing and palpating on the
breasts” and any lumps, skin changes, dimpling, color change, dimpling and anything considered
abnormal should always be looked for and should be brought to the doctors attention. He noted

ISSN 2708-9525
42
that knowledge that people have a misconception about is on men and breast cancer saying that
‘yes, it is in fact possible that men have breast cancer’.
With availability, the social and behavior change expert, Miss Maryam, said that knowledge is
readily available and a lot of campaigns are in place. She also said that unfortunately men do not
think they can have breast cancer and most people do not think performing BSE is vital practice.
Attitudes
Dr. Azeez said that men are equally at risk of breast cancer and culturally and socially, they have
not been conditioned to accept that. Miss Maryam finds that fear and ignorance are the two most
prevalent factors that are believed to hinder the performance of BSE. Tradition is also a factor that
makes people not perform the BSE, saying that tradition gives false information. Risk is a factor
that gives people a positive attitude towards BSE, when your family member has been a victim of
Breast cancer or other cancer, it is a form of encouragement towards positive attitudes for BSE.
Practices
The best time to perform a BSE is right after your menstrual period and this should be done
monthly. Clinical exams are the next step after BSE as aforementioned and should be done the
moment one notices and abnormality and should be routine for individuals above the age of 45. If
a lump or other abnormality is found, the thing to do is to visit a public health care facility
immediately.
Figure 10: summary of the interviews
Questions summary of response
1. In your expert opinion, how often do you
think one should perform a breast self-
examination?
once a month, right after the mestrual
period
2. At what point should one seek a clinical
exam?
the moment one notices an abnormality
and those above 45
3. What happens during a clinical exam? depending on age and case, a manual
exam , mammogram or ultrasound will
be performed
4. Does early detection make a difference? absolutely, it gives better chance of
survival
5. What are the factors that make a person at
higher risk of breast cancer?
family history, lifestyle and genetics
mostly
1. What are the most important steps in carefuly observation and palpating on

ISSN 2708-9525
43
performing the breast self-exam? the breasts
2. What exactly should I be looking for? any lumps, skin changes, dimpling, color
change, dimpling and anything
considered abnormal
3. What changes do I need to bring to my
doctors attention?
any lumps, skin changes, dimpling, color
change, dimpling and anything
considered abnormal
4. Do men also need to perform the breast
self-examination?
yes, men can also have breast cancer. It
is just not as common
5. What do I do if I find a lump? go to your primary healthcare facility
immediately
1. What do you think stops people from
performing breast self-examination despite
having the information?
fear and ignorance
2. What role does tradition play in performing
breast self-examination?
It gives false information
3. What role does a family history play in
performing breast self-examination?
it makes people more at risk and
encourages peforming the bse
4. Is knowledge on breast self-examination
readily available ?
yes, people just need to make use of the
knowledge properly
5. Are there any misconceptions on breast
self-examination?
yes. That only females perform it and
that it is not vital practice.
Discussions
Breast cancer is the most widely recognized cancer in women worldwide that is the reason women's
consciousness of breast cancer is significant. The need to assess the knowledge, attitudes and
practice of BSE among female university students who will be the future leaders, policy makers,
and so on is important and suggested (Ayed, et al., 2015). This study was led to decide knowledge,
attitudes and practice among female university students towards BSE.
The consequence of the present investigation uncovered that the sample had knowledge about BSE.
The investigation was proper in this age bracket as they fall inside the age group of developing
adulthood who are constantly anxious to discover data about things occurring around them
henceforth a morbid disease like breast cancer ought not be abnormal to them just as BSE which
has to do with paying special mind to changes in the breast. Comparative perception was accounted
for in Bassey et al study (2011) (Bassey, Olowoyeye, Adeyomoye, & Onajole, 2011)where 58.6%

ISSN 2708-9525
44
of the respondents' first wellspring of data was acquired from TV/radio, additionally upheld (Irurhe,
Olowoyeye, Arogundade, Bassey, & Onajole, 2009).
From the investigation, majority of the sample had a good knowledge level of BSE which helped
early detection of breast cancer. This is in agreement with other studies which demonstrated that a
large portion of the respondents knew about BSE (Yakout, Moursy, Moawad, & Salem, 2014).
Negative mentality has been accounted for in the present work in saying that what stops the practice
of breast self-exam is a fear in finding something. Our discoveries are like (Bassey, 2011) study in
which the demeanor of respondents to breast self-assessment was good. In the present
investigation, just a small portion practice BSE in every case each month and some revealed that
they never performed it . In different investigations the level of BSE execution have been seen as
39.5% among nursing understudies (Juanita et al., 2013).The previously mentioned examinations
uncovered the low frequency of students month to month performing BSE everywhere throughout
the world. It can be said that even with the knowledge and relatively acceptable practices towards
BSE, the attitude rates are low and mostly driven by fair.
Conclusions
Breast Self-Examination, BSE, is a significant examination tool for the early finding of breast
cancer because of absence of screening programs and proper facilities. University students whom
are believed to be the leaders or tomorrow and also the most accepting of positive change should
be appropriately instructed to effectively do this methodology. There is widespread knowledge
about the BSE among students, with dreary attention to its use, method, timing, and frequency
among the students examined. BSE and breast cancer training projects ought to be incorporated
into the educational program as a major aspect. The rates of practicing of the BSE is one which is
a cause for concern.
The hypothesis is disproven because female university students have the knowledge but have
negative attitudes towards it which result from fear and a lack of practice resulting from a lack of
comfort.
A recommendation is that more studies look into fear as a factor encouraging negative attitudes.

ISSN 2708-9525
45
Appendices

ISSN 2708-9525
46

ISSN 2708-9525
47
Figure 11: summary of quantitative data collection

ISSN 2708-9525
48
Figure 12: Summary of qualitative data collection
Works Cited
AFCRN Ethiopia-Addis Ababa city cancer registry. (2019, Accessed 2nd September 2019).
Membership list: AFCRN. Retrieved from AFCRN: http://afcrn.org/membership/membership-
list/100-addisababa.
Ameer, K., Abdulie, S., & Pal, S. (2014). Breast cancer awareness and practice of breast self-
examination among female medical students in haramaya University, Harar, Ethiopia. Int J
Interdiscip Multidiscip Stud., 2(2):109–119.
American Cancer Society. (2017). Breast Cancer. Facts and Figures 2017-2018.
Andersen, B., Yang, H., Farrar, W., Golden-Kreutz, D., Emery, C., Thornton, L., . . . Carson, W.
(2008). Psychologic intervention improves survival for breast cancer patients: a randomized
clinical trial. Cancer, 113(12):3450-8.
Ayed, A., Eqtait, F., Harazneh, L., Fashafsheh, I., Nazzal, S., Talahmeh, B., . . . Awawdeh, R.
(2015). Breast Self-Examination in Terms of Knowledge, Attitude, and Practice among Nursing
Students of Arab American University/ Jenin. Journal of Education and Practice, 2222-1735 .
Bassey, R. I., Olowoyeye, M., Adeyomoye, A., & Onajole, A. (2011). Knowledge, Attitude and
Practice of Breast Self-Examination among Nursing Students in Lagos University Teaching
Hospital, Nigeria. Educational Research, 2, 1232-1236.
Biritwum, R., Gulaid, J., & Amaning, A. (2000). Pattern of diseases or conditions leading to
hospitalization at the Korle-Bu Teaching Hospital, Ghana in 1996. Ghana Medical Journal, 34:
197-205.

ISSN 2708-9525
49
Demirkiran, F., Balkaya, N., Memis, S., Turk, G., Ozvurmaz, S., & Tuncyurek, P. (2007). How
do nurses and teachers perform breast self-examination: Are they reliable sources of information?
How do nurses and teachers perform breast self-examination: Are they reliable sources of
information? , 7:96.
Doshi, D., Reddy, B., Kulkarni, S., & Karunakar, P. (2017). Breast self-examination: Knowledge,
attitude, and practice among female dental students in Hyderabad City, India. Indian J Palliat
Care, 18:68-73.
Frotan, Y. (2002). Requirements of social, cultural,women of childbearing.
EmpowermentConference Women of the women. Publicationsof the Center for
Women’s Participation, Tehran, 246 -53.
Irurhe, K., Olowoyeye, A., Arogundade, A., Bassey, B., & Onajole, T. (2009). Knowledge,
Attitude And Practice Of Breast Self-Examination Among Female Medical Students In The
University Of Lagos. . The Internet Journal of Health., Volume 12 (1).
Lamyian, M., Heidarnia, A., Ahmadi, F., Faghihzade, S., & Aguilar, V. M. (2008).
Women’sprospect of breast cancer early detectionbehavior: a qualitative research.
Scientific Journalof British University of Medical Sciences, 15(3): 88-103.
Nde, F. P., Assob, J. C., Kwenti, T. E., Njunda, A. L., & Tainenbe, T. R. (2015). Knowledge,
attitude and practice of breast self-examination among female undergraduate students in the
University of Buea. . MC Res Notes, 8, 43.
Norliza, B. (2010). Knowledge and practice of breast self-examination among female
undergraduate students in University of Malaysia Sarawak. Sarawak: University Malaysia
Sarawak.
Parkin, D., Arslan, A., Bieber, A., Bouvy, O., Muir, C., Owor, R., & Whelan, S. (1986). Cancer
Occurrence in Developing Countries. International Agency for Research on Cancer (IARC)
Scientific Publication, No. 75.
Pilehvarzadeh, M., Rezie, H. H., RezaAflatoonian, M., Rafeti, F., & Mashayekhi, F. (2015).
Knowledge and Attitude of Women about Breast Self-Examination. BIOSCIENCES
BIOTECHNOLOGY RESEARCH ASIA, 12, 209-215.
Suh, M., Julius, A., Fuh, E., & Eta, V. (2012). Breast self-examination and breast cancer awareness
in women in developing countries: a survey of women in Buea, Cameroon. BMC Res Notes,
5:627–32.
Welbeck, J., & Hesse, A. (1998). Pattern of childhood malignancy in Korle-Bu Teaching Hospital,
Ghana. West Afr J Med, 17: 81-84.
Wessels, G., & Hesseling, P. (1997). Incidence and frequency rates of childhood cancer in
Namibia. South Afr Med J., 87: 885-889.
WHO. (2011). Breast cancer: prevention and control. Retrieved from Cancer:
https://www.who.int/cancer/detection/breastcancer/en/

ISSN 2708-9525
50
Wiredu, E. K., & Armah, H. B. (2006). Cancer mortality patterns in Ghana: a 10-year review of
autopsies and hospital mortality. BMC Public Health, 6: 159.
Yakout, S., Moursy, A., Moawad, S., & Salem, O. (2014). Awareness, Knowledge and Practice
of Breast self examination among groups of Female nursing students, Riyadh, Kingdom of Saudi
Arabia. . International Research Journal of Biological Sciences., Vol. 3(2), 58-63.
Yip, C., Smith, R., Anderson, B., Miller, A., Thomas, D., Ang, E., . . . McTiernan, A. (2008).
Guideline implementation for breast healthcare in low- and middle-income countries: early
detection resource allocation. Cancer, 15;113(8 Suppl):2244-56.

ISSN 2708-9525
51
Prolonged Computer Use and Associated Health Disorders
Noof Al Habab,
Environmental Risk Management
1.0 Introduction
Technology revolution has made our lives much easier, it would difficult to imagine life without
the internet, computers, PCs, tablets, TV, cellular phones and various digitalized equipment and
tools. Currently, computers are one of the main tools in each business, educational institute, office
and even at home. These technologies including computers are used in our everyday life, however,
there have been many human health risks related to these technologies. With increasing demand
for usage of these technologies the more probability of health risks would increase.
Electromagnetic Field (EMF) is involved with production of each electronic device including
computers and PCs. It is a non-ionizing radiation released from electronic devices. Usually, the
energy is not enough to ionize the atoms, therefore it excites the electrons. Humans are exposed to
this energy by using computers, PCs or even sitting in computerized workplaces which can risk
their health issues.
The radiations from electronic devices may cause several health hazards, particularly computer
users including employees and students who spend more than hours working on the computer are
directly exposed to the harmful effects of negative radiation and energy (Ellahi et al., 2011).
Occupational health problems assessment is one of the common fields of ergonomics study.
Employees and students suffer from various types of disorders in their daily life, including using
computer for long hours can increase the probability of having serval health problems. Regardless
of working hours in government sector (7 hours) or private sector (more than 8 hours) employee
and working students are facing health problems related to extent use of computer for long period
of time. Hence, it is necessary to examine the direct or indirect negative effects of using computers
on health.
2.0 Goals and objectives
2.1 Main ideas
In the past few years, extraordinary rate of development has been seen in information and
communication technology (Ellahi and Manarvi, 2010). Along with positive effects including an
increase in efficiency, accessibility of data and communication velocity (Blatter & Bongers, 2001).
Different industries, areas, and fields using computers such as, banks, business, military, education,
medical and media where it is impossible to use a product or service that does not utilize a
computer. Over the past 20 years, computers have become increasingly common in both
workplaces and private residences. The number of computer users has dramatically increased. In
2000, around 60% of workers were required to use computers as part of their job duties and with

ISSN 2708-9525
52
80% of those workers used a computer on a daily basis. Currently, all age groups are using
computers and PCs for many purposes including occupational and educational. The UAE
embracing the potential of technology to improve the lives of the country’s inhabitants, efficiency
and reduce costs.
For example, several schools are introduced to virtual classrooms and other e-learning tools in the
UAE. Where students do their homework and classwork online, interact with other students and
participate in an educational discussion such as online forums. The e-learning platform is one of
the popular platforms which considered as an education delivery and management tool for
academic institutions. It allows students to expand their knowledge and learn beyond the classroom
as well as it improves student’s engagement skill with their peers and teachers (Nasir, 2017). Along
with widespread use of computers, many researchers have confirmed that extensive use of
computers may risk human health causing several health disorders (Sartang & Habibi, 2015).
Computer-related health disorders and computer work are common in modern society and both
show an increasing trend. These disorders occur gradually over a long period of time of exposure
to the computers leading to potential adverse health effects. Prolonged computer use may be
considered as occupational or study hazard or both in some cases on workers, students, and working
students.
2.2 Main objective
The major objectives of the paper is to study the hazards at workplace related to computer users
particularly workers, students and/or working students. The study will identify the most occurrence
of health issues and it will investigate the effect of different direct and indirect factors such as, time
spend on computer, gender and age on appearance to health problems related to computer.
Moreover, other objectives of the study is to develop risk management plan that is applicable at
workplace to reduce the hazard through creating tables, flowcharts or diagrams. Finally, the report
will discuss risk communication plan to provide meaningful, relevant, understandable and accurate
information to audience or/and public through interested parties such as, government, stakeholders,
decision makers.
3.0 Literature Review
3.1 Previous studies
Many researchers have confirmed that risk factors associated with prolonged commuter use have
caused several diseases. The study by Ellahi et al., (2011), mentioned several researchers have
reviewed the effects of computer including Punnett and Bergqvist (1997) reviewed 56
epidemiological studies on the effects of computer work and they concluded that the use of
computer and keyboard is resulting in hand and wrist disorders and less gradually causing neck
and shoulder disorders. Moreover, Blatter and Bongers (2002) concluded that working on computer
for four hours daily can produce musculoskeletal disorders of neck or upper limb in women
whereas, six hours or more of computer use causes these similar symptoms in men. Furthermore,
Keir et al., (1999) conducted research on carpal tunnel pressure among 14 individuals working with
3 different mice. The researchers found that use of mouse cause of increasing carpal tunnel
pressure.

ISSN 2708-9525
53
There are other disorders are associated with computer use for a long duration. Many researchers
(e.g Sheedy, 1992; Smith and Stammerjohn, 1981; Costanza, 1994) reported other health issue
related to computer use where individuals complain about eye - related problems which is more
frequent health disorder among computer users, which is known as Computer Vision Syndrome.
According to Ellahi et al., (2011) “the symptoms is categorized by Yan, eta.,l (2008) in three: (i)
eye-related symptoms (e.g. “dry eyes, watery eyes, irritated eyes, burning eyes”), (ii) vision-related
symptoms (e.g. “eyestrain, eye fatigue, headache, blurred vision, double vision”), and (ii) posture-
related symptoms (e.g. “sore neck, shoulder pain, sore back”)”. Also, Wang et al., (1998) found
that if computer is used more than 30 hours per week and more than 10 years, mental problems
such as depression, obsession, and somatic disorders could increase (Ellahi et al., 2011).
4.0 Recommendations
4.1 Health risks reduction
Prolonged use of computer leads to severe health issue, however, agencies and educational
institutions can provide ergonomics training programs to employees or students. The simultaneous
occurrence of computer-related injuries among human beings is due to the human body is subjected
to risks continuously. For example, by sitting and working on a computer for long hours the
individual is exposed to several health disorders, electromagnetic fields. Body parts of an
individual such as, hands, wrist, neck, shoulders, back, brain and especially eyes are exposed to
risks which trigger these common health diseases, computer-related stress, computer vision
syndrome and musculoskeletal disorders (including carpal tunnel syndrome). Moreover,
ergonomics computer posture of the keyboard, mouse, hand, chair and sitting position along with
ergonomics equipment including desks, document holders footrests and headsets at the workplace
and educational institutions to prevent unsafe and uncomfortable computer work. Also, raising
awareness on ergonomics principles at workplace can avoid chances of possible risks (Ellahi et al.,
2011).
4.2 Ergonomic process at the workplace
Employees are future assets for any agency around the world. Some employees’ jobs are creating
health problems which turn enormous burden for agencies, organizations and economic sector. By
implementing the ergonomic process at workplace it will reduce the rate of employees’
absenteeism and maximizes productivity. For example, provide management support where the
management should define clear goals and objectives for the ergonomic process, discuss them with
their employees, assign responsibilities to designated members in the agency, and communicate
clearly with the workforce. Furthermore, involving workers to identify and provide information
about hazards and/or risk factors in their workplaces, communicating and sharing their concerns,
suggestions, and solutions to reduce, control or eliminate risks factors at their workplace. Also,
evaluating the risks and taking corrective actions are required to assess the effectiveness of the
ergonomic process periodically and to ensure its improvement at workplace (Occupational Safety
and Health Administration, n.d).

ISSN 2708-9525
54
The easier approach to avoid the risk of computer exposure for long periods during the work by
elimination, however, computers are impossible to be eliminated at offices. Hence, others
approached risk control measures could be implemented as it is shown in Table 2 (Better Health,
n.d). Correct posture at computer workstation and computer and desk stretches showed in Figure
10 and 11 (Work Safe NB, 2010). Risk assessment management plan divided into substitution,
engineering and administrative control all of actions may consider as a low risks for reduction of
hazard and probability due to other factor influence (Fig.9).
Fig 9. Risk assessment management plan divided into substitution, engineering and administrative
control
SubstitutionWorking with
Ergonomic design
Engineering control
High quality of computer display s showed be installed
Document holder and lighting at place
Administrative control
Frequent rest breaks
Awareness

ISSN 2708-9525
55
Table 2. Computer related injuries control measures at workplaces (Better Health, n.d).
1. Substitution 2. Engineering control 3. Administrative control
Ergonomic design:
- Chairs with backrest that
provides lumbar support
-Adjustable height and angle
to the seatback
-Foot supporter desk
-Adequate space should be
available in the office
-The forearm should be
horizontal when hands on
the keyboard
High quality of computer display
screens that do not cause glare
and reflection
Providing frequent rest
breaks for workers. Workers
could stretch up during the
breaks
Proving modern computer
display screen that reduces the
contrast and brightness of the
screen by automatic adjusting
controls.
Enforcing standardized
health and safety
recommendations at the
workplace. Workers must
follow the right guidelines for
their health and safety
Document holder should be
provided
Encourage workers to
maintain their health
If a frequent telephone is used at
workplace headset should be
required
Employee’s Awareness
Proper lighting in the Workplace Training courses to adopting
safe habits

ISSN 2708-9525
56
Fig 10. Correct posture at computer workstation (Work Safe NB, 2010).

ISSN 2708-9525
57
Fig 11. Computer and desk stretches (Work Safe NB, 2010).
6.0 Conclusion and Risk Communication
The computerized workplace is creating risks for both employees and students in their health.
Computer users suffer from several health problems due to prolonged computer use on a daily
basis. After providing recommendations it is required to go through the next stage which is risk
communication. It refers to the exchange and share of real-time information, advice, and opinions
between main groups in the society which are stakeholders, decision makers, experts and public
who are facing threats to their health. In addition, it helps the public to make informed decisions
for prevention or protection purposes.

ISSN 2708-9525
58
Communications techniques to deliver a message can be through social media communications,
mass communications and community engagement could be the path of risk communication
(WHO, n.d). In order to share health risks associated with prolonged computer use to main groups
in society, the public need to be educated and well informed. Education can be through creating
posters, leaflet, brochures on health and safety for computer operators by agencies or environment,
health and safety organizations and disrupting them at workplaces and educational institutions.
People’s perceptions, concerns, and beliefs are important in risk communication should be aware
of health risks such as musculoskeletal disorders, computer vision syndrome, computer-related
stress and other the could possible to occur.
Also, computer users should know the trends of health disorders associated to prolonged computer
use and the simultaneous probability of these computers related health disorders is high as it is
found in the study, which poses serious threats for human health. It is easier to deliver information
to computer users since they have an educational background and it is assumed communication
about health and safety will be accepted by the audience. Practices could be implemented and
shared to reduce risk such as, involving training and development programs and presenting the
concept of health and safety at workplace to the audience. Providing ergonomics courses and
engaging the audience to participate to get a certified degree such as NEBOSH International
General Certificate in Occupational Safety and Health. Computer users should be trained on
computer and desk stretches and agencies or organization should pose frequent short breaks for
relaxation of muscles and body, figure 12 illustrates steps of risk communication.
Fig 12. Steps involved in risk communication

ISSN 2708-9525
59
References List
Blatter, B. M. & Bongers, P. M. (2002). Duration of computer use and mouse use in relation to
musculoskeletal disorders of neck or upper limb. international Journal of Industrial
Ergonomics,30, pp. 295 - 306, doi: https://doi.org/10.1016/S0169-8141(02)00132-4
Better Health. (n.d). Computer related injuries. [online]. Available
from: https://www.betterhealth.vic.gov.au/health/healthyliving/computer-related-
injuries [Accessed 10 May 2019].
Ellahi, A. Khalil, M.S. & Akram, F. (2011). Computer users at risk: Health disorders associated
with prolonged computer use. Journal of Business Management and Economics, 2(4), pp.
171-182.
Ellahi, A. & Manarvi, I. (2010). Understanding attitudes Towards Computer Use in the Police
Department of Pakistan. The Electronic Journal on Information Systems in Developing
Countries, 42, pp. 1681- 4835.
Nasir, S. (2017, October 2). How schools in UAE are making use of e-learning tools in classrooms.
Khaleej times. [online]. Available from:
https://www.khaleejtimes.com/news/education/how-schools-in-uae-make-use-of-e-
learning-tools-in-classrooms [Accessed 28 April 2019].
Occupational Safety and Health Administration. (n.d). Ergonomics. [online]. Available from:
https://www.osha.gov/SLTC/ergonomics/ [Accessed 10 May 2019].
Sartang, A. G. & Habibi, E. (2015). Evaluation of Musculoskeletal Disorders among computer
Users in Isfahan. Iranian Journal of Health , Safety & Environment, 2(3), pp. 330-334.
Work Safe NB. (January 2010). Office Ergonomics Guidelines for preventing Musculoskeletal
Injuries. [online]. Available from: https://www.worksafenb.ca/docs/OFFICEEdist.pdf [Accessed
10 May 2019].

ISSN 2708-9525
60
Stigma and Discrimination against Persons with
Communicable Diseases
Real AlZir
The choice of style for nurturing and upraising kids is the core building block of a values’ system
of a community. Kids are born with a default acceptance behaviour to diversity. This is not only in
tangible aspects, but also, in emotional invisible ones. In elaboration, a child in the purest
unconditioned mind state does not discriminate an individual of a different colour neither does a
child discriminate an individual with a belief system different from itself or its parents’. This
entitles a close attention to how kids are raised and are educated throughout their childhood, and
how they continue being coached then after.
Some subconscious reactions by individuals raise up to a behavioural act(s) level. Some are as
silent as inherent rejection. Other actions are physical and elevate up to a body linguistic act. This
variation depends on both how a person is raised and the neurolinguistics programming the
individual has been through in his/her life such as the educational journey, neighbourhood,
parenting, babysitting, the counter practices to baptism from various belief systems, and other
neuro programming incidents intentionally or unintentionally performed in front of the child.
Dictionary mentions two classifications of those reactions. One occurs at an emotional or thought
level and results in negativity in the form of disgrace; Stigmatization. Another is a physical one.
This later one, involves an action and results in a distinction and mistreatment that causes loss of
individual’s rights; discrimination. Dictionary.com (1) states (Dictionary.com, 2019).
Stigma:
1. Stigma a mark of disgrace associated with a particular circumstance, quality, or person.
2. A mark of disgrace or infamy; a stain or reproach, as on one's reputation.
3. Medicine/Medical definition: a mental or physical mark that is a characteristic of a
defect or disease: the stigmata of leprosy.
Discrimination:
1. An act or instance of discriminating, or of making a distinction.
2. Treatment or consideration of, or making a distinction in favour of or against, a person
or thing based on the group, class, or category to which that person or thing belongs
rather than on individual merit: racial and religious intolerance and discrimination.
Or simply, discrimination is(2) “an unjustifiable negative behaviour toward a group or its members”
(Myers, 2005).
Literature3 has shown various responsive acts in the form of the three phenomenon together;
stigma, discrimination, and prejudice over varying periods of time and at different geographies of
the world [Parker, 2012]. No two original references referred to those three in a similar
chronological order neither in similar geographic exposure. The elements of this research, however,

ISSN 2708-9525
61
focused on stages of development of stigma and discrimination in relation to physical illness,
psychological behaviours, and social consequences. In addition, the research of choice for
reference in this essay is one that illustrates the history of stigma on one hand, and the history of
discrimination along with prejudice on the other hand. For reference only and not for focus in this
research, it is worth it defining prejudice herein for the sake of elaboration on the meaning and how
it differs from both stigma and discrimination.
In his book4, Social Psychology, David Myers refer to prejudice as “a negative prejudgement of a
group and its individual members”. (Myers, 2005) Thus, the definition of prejudice is obvious
enough not to elaborate on, as it is not the interest of this essay. Nevertheless, it is important to
highlight that a major root cause for both stigma and discrimination is prejudice.
The historical background that was found best summarizing the development of stigma and
discrimination is what was published by Richard Parker in his article “Stigma, prejudice and
discrimination in global public health”.5 (Parker, 2012). Richard–as many researchers—studied
stigma, prejudice, and discrimination history since 1963 and focused on references detailing the
structure of change throughout until nowadays. For example, in his paper, Richard stated that both
stigma and discrimination “has grown steadily over the last 50 years”. This covered several
research aspects such as: “physical disfigurement and disabilities, mental illness, homelessness,
homosexuality and gender nonconformity, juvenile delinquency, and other issues associated with
non-normal and non-normative experiences or behaviour” as reasons for the feeling of stigma and
the acts of discrimination.
Not only as aspects or case studies, this research has taken place, but also; as a disciplinary oriented
research were a positive forward drive serves a resolution to this through existing conceptual
platforms; such as the approaches with practical practices to handle stigma including:
“anthropology, psychology, sociology, education, public health, and social work”. The
transformation witnessed by good deeds by medical and anthropological researchers and
practitioners seems to have eased the management of stigma. For example, a dis-ease like mental
illness though appearing as a disease that requires medical interference, some researchers and
practitioners today has classified it as an anthropological case or a social one, if not a case resulting
from absence of enough education to interact positively with the surrounding in order to survive.
Another example to this is what Richard referred to as: “the emergence of the HIV/AIDS epidemic
in the 1980s can be considered a watershed event for stigma research and work on HIV/AIDS-
related stigma and discrimination has "boomed" over the course of the past three decades”.
In parallel to that and “during much of this time, the development of research on prejudice and
discrimination was motivated by growing social concern with racism, especially in the USA. Thus,
work in this area has largely focused on race and ethnicity and how racial and ethnic discrimination
are driven by prejudice, whereas work on stigma was more closely associated with health
conditions”. In 2012 when this research has been held, Richard stated, “what has been described
particularly in the United States as health disparities, has only emerged over the course of the past
10 to 15 years”. Therefore, turns out to be of importance to consider the root causes of upcoming
issues while interpreting a resolution as this is the first and most shortcut step to resolve the
consequences whether the impacted person(s) is stigmatized or discriminated with close attention
to correlations with various conceptual platforms; for instance: social, psychological, educational,
..etc.

ISSN 2708-9525
62
Says Richard in the brief of historical overview in his article that: “In recent years, the focus on
both stigma and prejudice has led to a growing body of work on the health consequences of
discrimination experienced as a result of these processes.” This aligns with the evolvement of
sciences and practices that adjoins medical sciences with psychological and behavioural in a trial
to help overcome the cases that trigger stigmatization and discrimination. Those sciences are NLP
(Neuro Linguistic Programming), TFT (Thought Field Therapies), TLPT (Time Line Paradigm
Techniques), hypnosis, and the many sciences that existed to meet the need of resolving the
negative impacts of stigma and discrimination by others and more importantly by oneself!
Continues Richard in his comprehensive brief that the main categories that lead to stigma in society
are: “people living with or perceived to be at risk of HIV in-fection; people suffering from mental
illness; and the homeless”. On another hand and in regards to stigma, “a large body of work has
emerged, particularly in the United States that has sought to measure the experience of
discrimination.
In countries such as the Unites States and South Africa, that have experienced a long history of
intense racial discrimination, research has been carried out with the aim of understanding the
differential experience of "acute" as opposed to "chronic" racial and non-racial discrimination, and
their impacts in relation to a range of stressors and psychological factors (such as social desirability,
self-esteem and personal mastery). Both stigma and prejudice-related discrimination has been
examined in relation to what Meyer and colleagues describe as "minority stress”. While much of
this work has examined the psychological and mental health impacts of stigma, prejudice and
discrimination, there has also been a significant increase in work on violence related to these
processes”.
Another set of efforts witnessed in regards to cases (classified as diseases) that provoke stigma or
discrimination is the occurrence of medical-psychological correlations research and publication.
An example is Christine’s book6: “The Key to self-liberation: 1000 Diseases and their
Psychological Origins” (Beerlandt, 2001). In her book, she provides a psychological reasoning for
popular diseases and proposes the hints for overcoming them for the reader to start a resolve based
upon.
The Magnitude of stigma and discrimination consequences is a function of two main items. The
first is the impact on the person. The second is on society. At personal level, both the stigmatized/
discriminated individual and the stigmatiz-er/discriminator go through difficult processing of this.
The victim who receives the negativity of those two aggressive behaviours ends up in possible
psychological illnesses, social refusal, and possibly mental challenges in absence of tactical
approaches to overcome this. This if not handled with consciousness can easily lead to the second
impact which is more dangerous; the social consequences.
A society/ community that responds to individuals’ dis-eases and diseases in an abusive attitude
whether stigma or discrimination, is a fertile one for a cascade of this behaviour over generations
and across cultures. Unfortunately, the wakeup call from those phenomena might cost a lot not
only monetary-wise, but also, comfort and security-wise if lack of community advisory exists. An
interesting analysis on how behaviour is transferred over generations is illustrated by NLP concepts

ISSN 2708-9525
63
and specifically by a workshop manual named: “Personal Breakthrough Experience Workshop”
prepared and delivered by Robert Simic7 as shown in the following figure:
This is an illustrative representation that explains how the impact of the negativity of any behaviour
whether a feeling (stigmatization) or an act (discrimination) results in negativity for both the doer
and the receiver. The external circumstances are sensed by an individual through one or more of
the senses shown in step 1 in the above figure. The process of making meaning starts then after and
follows a pre assumed options of processes. Based on perceived reality (for instance in this case,
the prejudice by a viewer) –step3—the behaviour results in the form of either a feeling or an attitude
(step 4 above). This results in stigma or discrimination (last step).
Therefore, the magnitude of unresolved cases of stigma and discrimination is of essence to be taken
care of by the community and the community-social associations. This is best practiced through
social campaigns and activities that not only targets bringing up the consciousness about the role
of individuals in regards to these cases, but also; in regards to the thinking fields/environment that
needs to be in place to eliminate those at the first place. Those can be handled by initiative at the
individuals’ level and by initiative at organizational levels.
Stigma and discrimination proved to be provoked by a set of causes that at the first place represents
the educational processes, pedagogy, and the decision of the team accountable for designing and
delivering the same. As a random sample and on average, more than 38% of the student’s time
during school days (excluding the sleeping hours) until the age of 18 is the exposure to the
educational neuro and thought system programming. This does not mean education is necessarily
the direct cause as the rest of the time the student spends is what the parents supervise, allow, or
make happen. This is also based on the assumption that parents are doing their parenting job. This
means parent’s education has also contributed to the state the students today are going through in
regards to the received neuro programing. The discussion about that is unlimited and can go beyond
the research focus. Other causes are stereotyping, generalization, lack of conversation with wise
and elders who are community builders, media, and lack of corporate social responsibility.

ISSN 2708-9525
64
Stigma is classified to various types and research mentions different classification criteria. The one
found of most relevance to the subject here is the classification based on the extent of magnitude.
The Mental Health Services Act of California7 classifies stigma in three categories: public stigma,
institutional stigma, and self-stigma. It defines each as follows:
“Public Stigma: refers to the attitudes and beliefs of the general public towards persons with mental
health challenges or their family members. Institutional Stigma: refers to an organization’s policies
or culture of negative attitudes and beliefs. Self-stigma: occurs when an individual buys into
society’s misconceptions about mental health. By internalizing negative beliefs, individuals or
groups may experience feelings of shame, anger, hopelessness, or despair that keep them from
seeking social support, employment, or treatment for their mental health conditions”.
(Disabilityrightsca.org, 2019).
Whereas discrimination types varied according to various references, I chose the one that summed
them up into two categories only including all types and this is the direct and indirect types referred
to by the National Association of Citizens Advice Bureaux8. “Direct Discrimination lists the
physical and personal characteristics which are protected by law and explains that you are not
allowed to be treated differently from other people because of those characteristics. Indirect
discrimination explains what is meant by indirect discrimination, when a practice, policy, or rule
applied to everyone puts certain groups of people at a disadvantage”. (National Association of
Citizens Advice Bureaux, 2019).
Despite the negative impact of stigmatization on individuals and society, it serves as a prevention
tool of possible activities leading to communicable diseases especially in absence of knowledge
and the self-survival mechanism or at least its existence, which helps addressing the communicable
disease within their actual size, impact, and consequences. This falls under some explanatory
thoughts by researchers who state that 9: “Stigma results in discrediting and loss of dignity and
value and tends to label people as being unfortunate, inferior depending on the way it is applied.
Discrimination arises from differences that can be consistently labelled and that set up the person
as different from the perceived norm and can be based on various factors ranging from race, gender
and sexual orientation”. “Both stigma and discrimination has huge effect on the management of
the disease as it can results in delay in diagnosis and therefore causes delay in entry into treatment
and adoption of a healthy lifestyle, causes fear in disclosure of illness to important people in the
family that will assist in the management of the disease and also causes restriction in participation
involving activities of life and depression” (Stewart, Omicsonline.org, 2019). This risk-fully leads
to an open loop of descending especially in absence of consciously or inherited innate hopeful
behaviour.
The advancement in technology today and the extent to which it has been utilized for the good of
individuals, their safety, security, and wellbeing has left almost no gaps for open-ended questions.
For instance, today disease like flu though communicable, had its luck of being resisted via flu
vaccines. Reversing the concept of stigma-based prevention has been an attitude dealt with by NLP
and TFT. An illustration of that, NLP-based sessions allows the chance of the positive perception
of activities—without which—would result in communicable and/or non-communicable diseases.

ISSN 2708-9525
65
The circle of stigmatization related to specific diseases witnessed an extended act even beyond
stigma to result in discrimination. “For more than two decades, HIV-related stigmatization,
discrimination and denial have characterized the pandemic and presented a major challenge to the
effectiveness of prevention, care and treatment programmes”, thinks some researchers10. They
elaborate: “Much of the societal and individual reaction towards people with HIV/AIDS may arise
from stigma towards those most affected, where fear and blame are assigned and from which
societal, political and behavioural responses are derived. Stigmatization and discrimination are
reported to occur in a variety of forms–from societal level responses such as coercive government
policies and laws, to apathy and denial of the HIV epidemic”. Those “may result in an individual's
self-exclusion from information, treatment and care” (Taylor & Francis Online, 2019). The same
applies on many other diseases that has a physical appearance like viral hepatitis, and leprosy.
Christiane11, explains how the positive psychological or thought field drive plays a magnificent
role in overcoming this at a personal level through what science calls it NLP. This not only applies
to HIV, but also to other communicable diseases such as viral hepatitis, or non-communicable ones
even such as cancer; for instances. She advises, for illustration, the patients of AIDS to be accepting
and conscious about self-love and the appreciation of the overall uniqueness of personality
disregard of a physically related state/ appearance. Similarly, she advises of similar approaches for
other diseases where she states a resolve for leprosy by stating: “believe in one’s own worth and in
the possibility of (from now on) “deserving” positive evolution will reward you” (Beerlandt, 2003).
This style aligns with the affirmations that help maintain self-worthiness and life worth
unconditional of a dis-ease or obstacles to wellbeing.
In conclusion, addressing a stigma or discrimination is important not only via direct pinpointing;
but also, on a long term. Short-term resolutions and treatment of such behaviours comes usually
through policies, regulations, and set of terms and conditions to adhere to. However, long term
addressing of the same is far more powerful in influence and magnificence. The reason is that long-
term change management tends to help cease of occurrences of such types of negative behaviours.
Looking at success models of individuals and nations who managed to overcome the difficulties,
one finds that where negativity is not addressed, positivity supersedes. Looking at the same model
above illustrated by NLP, one can radically address such issues via each stage of the model
referring to the change that can better lead to positive results rather than submission in full
surrendering to proposed resolutions and ideas. This transliterates what philosophers call it:
Thinking out of the box.

ISSN 2708-9525
66
References:
1. Dictionary.com. (2019). Dictionary.com Is The World’s Favorite Online Dictionary.
[online] Available at: https://www.dictionary.com/ [Accessed 4 Oct. 2019].
2. Myres, D. (2005). Social Psychology. 8th ed. New York: McGraw-Hill, p.334.
3. Parker, R. (2019). Stigma, prejudice and discrimination in global public health. [online]
SCIELO. Available at: http://www.scielo.br/scielo.php?script=sci_arttext&pid=S0102-
311X2012000100017 [Accessed 4 Oct. 2019].
4. Myres, D. (2005). Social Psychology. 8th ed. New York: McGraw-Hill, p.332.
5. Parker, R. (2019). Stigma, prejudice and discrimination in global public health. [online]
SCIELO. Available at: http://www.scielo.br/scielo.php?script=sci_arttext&pid=S0102-
311X2012000100017 [Accessed 4 Oct. 2019].
6. Beerlandt, C. (2003). The key to self-liberation. 1st ed. Ostend [Belgium]: Beerlandt
Publications.
7. Disabilityrightsca.org. (2019). The “Mental Health Services Act”. [online] Available at:
https://www.disabilityrightsca.org/system/files/file-attachments/CM0401.pdf [Accessed 4
Oct. 2019].
8. National Association of Citizens Advice Bureaux. (2019). What are the different types of
discrimination?. [online] Available at: https://www.citizensadvice.org.uk/law-and-
courts/discrimination/what-are-the-different-types-of-discrimination/ [Accessed 4 Oct.
2019].
9. Omicsonline.org. (2019). Journal of AIDS and Clinical Research- Open Access Journals.
[online] Available at: https://www.omicsonline.org/aids-clinical-research.php [Accessed 4
Oct. 2019].
10. Taylor & Francis Online. (2019). 10. Stigma, discrimination and the implications for
people living with HIV/AIDS in South Africa. [online] Available at:
https://www.tandfonline.com/doi/abs/10.1080/09581599808402920 : [Accessed 4 Oct.
2019].
11. Beerlandt, C. (2003). The key to self-liberation. 1st ed. Ostend [Belgium]: Beerlandt
Publications, p.555.

ISSN 2708-9525
67
Household electricity conservation in the UAE
Noora Alqassim
Introduction
All types of electricity generation lead to variable environmental impacts either on air, water or
land. Air pollution and the contribution of climate change are linked with electricity production
and consumption; wherefore, personal electricity usage is an integral part of the environmental
footprint (US Environmental Protection Agency, 2018). According to the UAE Government
website (2018), people of the UAE consume about 20 to 30 Kilowatt-hours of electricity daily.
Since economic growth continues in the country, it is expected that the demand for energy will
increase to 9% yearly. In 2013, the need for electricity reached 105 billion kilowatt hours (kWh),
making the UAE one of the highest countries in electricity consumption globally (UAE
Government, 2018). As for 2014, the total use of energy in the UAE per year was 113 billion kWh
and an average of 12,042 kWh per capita consumption. On the other hand, in 2014 the per capita
consumption of electricity was 5,514.17 kWh in Europe which is almost half the consumption
when compared to the UAE (World Data, n.d.).
According to a study done by management consultancy strategy (as cited in Maceda ,2015) showed
that electricity usage among UAE residents had been growing dramatically and mostly doubled in
the past ten years. In that study, it was expected that the gross domestic electricity utilization would
be around 141 terawatt-hours by the year 2020. As the number of residents in the country is
increasing and most of them (about 85%) live in urban areas; they should be more aware of their
electricity consumption and the negative effect of over-consumption (Maceda, 2015).
Efforts have been made to reduce electricity consumption in the country. The Abu Dhabi
Distribution company had set a structure for electricity payment to encourage sustainable
consumption. The rates and tariffs are dependent on multiple factors such as the amount of
electricity used, the type of property a person lives in, and whether a person is UAE national or
expatriate. When a person consumes according to the ideal rate “Green Band” then he will pay
fewer bills, for example, the electricity rate is 6.7 fils for 1 kWh for UAE nationals within the green
band, and 7.5 fils for 1 kWh when exceeding the ideal allowance for their property type. (Abu
Dhabi Distribution Co., 2018).
In 2015 the total electricity consumption in the UAE was 126,581 GWH, and the amount was
divided by the Ministry of Energy according to electricity and water authorities of the country as
mentioned in the Annual Statistical Report (2016). The consumption in Abu Dhabi reported by
ADWEA was 62,979 GWH, in Dubai by DEWA was 40,740 GWH, in Sharjah by SEWA was
10,797 GWH, and in the Northern Emirates by FEWA was 12,065 GWH (Ministry of Energy,
UAE, n.d.). In Dubai, the number of electricity consumer was 796,764 in 2017 of which 74.54%
were residential (593,890 consumers) (Dubai Electricity and Water Authority, n.d.). Besides, in

ISSN 2708-9525
68
Abu Dhabi, the percentage of electricity consumption in 2015 was 26.9% for the domestic sector
(Statistics Centre, UAE, n.d.).
Literature review/Background
Several studies have been published on the factors affecting household electricity consumption and
conservation patterns. As a study by Laicane, Blumberga, Rosa & Blumberga (2014) examined the
Determining factors of household electricity consumption and savings through a comprehensive
literature review. The study investigated different factors; for example, when examining personal
characteristics, it was found that the rise in age, the higher the education level, and the higher
number of family members led to increased consumption of electricity. Likewise, in the
socioeconomic investigation, some studies showed that high income increases electricity
consumption, others found it not a significant factor. Furthermore, the more appliances available
in a household led to higher growth in electricity usage. Also, household structure affected the
usage of electricity as it was higher in houses when compared to apartments. Finally, the study
investigated other factors like people awareness, external temperature as determinants of electricity
consumption (Laicane, Blumberga, Rosa & Blumberga, 2014).
Another study by Wang et al. (2016) explored rural energy consumption and the dominant factors
of the use. According to the study, the frequency of energy consumption is higher with activities
associated with cooking devices, water heaters, and home appliances when compared to activities
related to other devices. Moreover, Wang et al. examined the frequently used area and the number
of air-conditioners per house which had a clear relationship with energy consumption; however,
the association is not apparent with income, building area or shape (Wang et al., 2016). Also, a
study performed by Chen (2017) to examine the factors affecting electricity usage and the
consumption characteristics in the residential sector in Taiwan found that the electricity price does
not significantly change the amount of electricity consumption. In contrast, it was found that the
employment of electricity labeling system that gives information about energy efficiency during
purchasing devices can help in reducing electricity consumption among residential consumers
(Chen, 2017).
As for the UAE, a study conducted by Sbia, Shahbaz & Ozturk (2017) analyzed the electricity
consumption relationship with economic growth, financial development, and urbanization using
time series data over the 1975–2011 period. The research found that economic growth primarily
rises electricity consumption then decreases it when the economy is matured. Also, financial
development increases electricity consumption. Besides, urbanization is linked with high
electricity consumption (Sbia, Shahbaz & Ozturk, 2017). limited studies were done on the UAE
population to evaluate determinants of electricity consumption and conservation such as personal
characteristics, socioeconomic factors, knowledge and attitudes, and household structure.

ISSN 2708-9525
69
Aim/Objectives
Lack of research in the field of electricity conservation raises many questions regarding the
knowledge and practice of the society about this issue and whether they are ready to change their
patterns of electricity consumption. The study aims to know the knowledge, behaviors, and
intentions regarding electricity consumption and conservation among a sample of people residing
in the UAE. This research will provide an understanding of the beliefs of the people living in the
UAE regarding this issue and their behaviors and actions concerning electricity-saving.
Methodology
This cross-sectional study was conducted during May 2019 among a sample of people living in the
UAE aged 19-65 years old. The sample size was equal to 36 participants. Primary data were
collected using quantitative instruments through online based surveys distributed to a convenience
sample; the study was developed with a total of 14 questions. The first part collected general socio-
demographic information about participants such as their age, gender, education level, and
nationality. The second part investigated the beliefs and knowledge of participants regarding the
importance of electricity saving at home; the reasons for considering electricity saving important.
The third part was devoted to investigating respondents’ current practices of electricity-saving at
their house (e.g., The frequency of turning off lights or electrical switches when not in use, the
frequency of adjusting AC temperature to save energy, etc.). The last part examined respondents’
willingness to commence behaviors related to electricity conservation (e.g. intent to buy energy
efficient appliances, intent on depending on natural air to dry clothes instead of electric dryers,
etc.).
The question types were mainly single answer questions for socio-demographic information except
for age as it was an open-ended question for better analysis. The second section combined single
answer, and multiple answers question in investigating knowledge and beliefs. Moreover, the
multiple answer question allowed participants to add additional reasons for energy saving
importance in their opinion. The third section was designed in 5-point Likert type (e.g., 1 – Never,
2 – Rarely, 3 – Sometimes, 4 – Most of the times, and 5 – Always) in examining the frequency of
practicing energy-saving behaviors. Furthermore, the fourth section was designed in 5-point Likert
type (e.g., 1 – Strongly disagree, 2 – Disagree, 3 – Neutral, 4 – Agree, and 5 – Strongly agree) as
questions looked into the extent of agreement and willingness to commencing energy-saving
behaviors.

ISSN 2708-9525
70
Results
A total of 37 people agreed to contribute by filling the developed survey. All answers were used in
the analysis. Table 1 summarizes the characteristics of respondents, 19.4% of whom are male and
80.6% female. Most participants are bachelor’s degree holders (61.1%) with an average age of 35.
Finally, 69.4% of respondents are local Emirati while the rest are UAE residents.
Table 1: Characteristics of the survey participants
Household characteristics of respondents (n=36)
Sex Total Percent
Male 7 19.4%
Female 29 80.6%
Sex ratio (male: female) 0.24: 1
Age (years) Mean
Standard
deviation
Overall 34.5 11.4
Education Total Percent
Less than high school 1 2.8%
High school 5 13.9%
Bachelor level 22 61.1%
Masters level 6 16.7%
Doctorate level 2 5.6%
Nationality Total Percent
Local Emirati 25 69.4%
UAE resident 11 30.6%
Nationality ratio (local: resident) 1: 0.44
The following charts (Figs. 1-5) highlight selected trends seen during results analysis. First, when
asked if saving electricity at home is important, most of them (97%) answered “yes” as showing in
figure 1. Second, 26 out of 36 participants thought that energy saving is essential due to
environment protection and health reasons, indicating a good knowledge about the importance of
electricity saving. Moreover, 24 out of 36 thought it is crucial as it reduces electrical bills and living
expenses; 2 out of 36 believed it is important in improving social image among other people, and
2 out of 36 chose other reasons such as reducing waste of resources as seen in figure 2.

ISSN 2708-9525
71
Figure1: survey responses – knowledge about the importance of electricity conservation at home
Figure2: survey responses -knowledge about reasons for electricity conservation importance at
home
On the other hand, other questions explored current practices of respondents’ in saving energy. For
instance, the results of figure 3 indicate that most participants (50%) turn off lights “most of the
times” when leaving an unoccupied room at home. However, the responses varied from “never” to

ISSN 2708-9525
72
“always” when respondents were asked regarding adjusting temperature/ AC at home and when
asked about the frequency of switching off appliances not in use at home.
Figure 3: survey responses – energy conservation practices among respondents
The last part of the questionnaire was exploring the desire and intention of participants about
energy saving (as illustrated in Fig 4-5). First, when asked if they should save more energy at home,
the majority (92%) responded by “yes”; initially indicating a good desire in this scope (Figure 4).
Second, when investigating the willingness of commencing energy-saving actions (showing in
Figure 5), most of the answers were between “strongly agree” and “agree”. One participant
”strongly disagreed” on buying energy efficient light bulbs. Furthermore, two participants
“disagreed” on drying clothes traditionally to save energy rather than using electric dryer.
Figure 4: survey responses – intention to save more energy at home

ISSN 2708-9525
73
Figure 5: survey responses – the extent of agreement on commencing energy-saving behaviors
Discussion of the results
The results show different profiles of UAE households concerning energy-saving knowledge, the
adoption of energy-saving habits, and the intention to commence energy-saving behaviors. Given
the dependence on self-reported information, factors such as social desirability, wording, reply
scales, and other sorts of conscious or unconscious response bias may result in imprecise reports
of real behaviors.
The results of participants knowledge about electricity saving importance were analyzed in two
questions (Fig 1, 2). 48.1% of participant (26 out of 36) knew that energy saving is related to
environmental sustainability followed by 44.4% responses relating it to costs reduction.
Accordingly, people should be more aware of the electricity effect on the environment, and overall
health promotion as the percentage is not high. The result is inconsistent with another study done
in the UAE by Azar & Al Ansari (2017) which found that cost reduction was the main driver for
energy saving in households; 49% of responses in that study indicated that cost reduction is the
main factor for energy saving behavior followed by 37% of answers reported for environmental
factors (Azar & Al Ansari, 2017).
Moreover, when participants were asked if saving electricity is significant to them, most of them
agreed (97% of them answered yes). On the other hand, Azar & Al Ansari’s study 91% “agreed”
or “totally agreed” about the importance of electricity conservation (Azar & Al Ansari, 2017).
With regards to the adoption of energy-saving practices, participants were more likely to switch
off lights when leaving an empty room or when there is natural light in the room (as showing in
figure 3). Yet, the concern of practicing electricity conservation habits was less when participants
were asked regarding switching or adjusting the temperature of AC; 4 of the participants never
worry about temperature adjustment, and 3 of respondents rarely do. Similar results noticed for the
question regarding turning off switches of unused devices as 4 never do that, and 3 rarely do it out

ISSN 2708-9525
74
of 36 participants. No similar studies were found in the literature examining similar energy-saving
practices.
The overall intention of respondents to save more energy at home in this study was 92%, and
knowledge is an essential factor related to intention of energy saving actions. On Azar & Al Ansari
study (2017) 80.5% of respondent “agreed” or “strongly agreed” that they should save more energy
at home (Azar & Al Ansari, 2017). In this, research the percentage is higher and might be a bias
due to the small sample size. Different questions in this study explored the willingness of
participants regarding commencing energy conservation habits. When asked about the agreement
of buying energy efficient appliances or light bulbs; most of the participants agreed or strongly
agreed on that; surprisingly one of the participants strongly disagreed on buying energy efficient
bulbs; the reason for that might be unawareness of its advantages or high costs. On the contrary,
responses to drying clothes in natural air rather than electric dryers varied between disagreeing and
agreeing as (as showing in figure 5).
When participants were asked if energy saving is essential to them or they feel the necessity to save
more electricity, most of them agreed. Nevertheless, the reported willingness and electricity usage
practices did not necessarily follow.
The UAE Sustainable Development Goals (SDGs) is a set of 17 goals that purpose to deliver better
living circumstances to all. The UAE makes efforts to achieve the SDGs at home and outside. One
of the SDGs goals (goal number 12) is to have responsible consumption and production. Under
goal 12 the country launched several initiatives to encourage sustainable energy resources; from
those initiatives is prohibiting the import of inefficient incandescent light bulbs (UAE Government,
2018). In 2014, the federal Emirates Authority for Standardization and Metrology (ESMA) banned
incandescent bulb imports, stating that they weren’t within required quality standards (Masudi,
2017).
Conclusion and Recommendations
Before concluding, it is vital to highlight some limits of this research, which will help in future
research. First, the information used in the study was attained through a questionnaire, where some
of the questions on knowledge and practices might be felt sensitive by participants. As a
consequence, respondents might have been unwilling to report their actual behaviors. The survey
had privacy and did not obtain identity information such as names as an attempt to overcome this
issue.
The results of the current research cannot be instantly generalized to the larger society of the UAE.
Because the sample size was inadequate to obtain statistically significant responses and the study
couldn’t reach all segments of the UAE population. Future studies should purpose to confirm and
expand the results of the current research by applying the context to greater and more assorted data
sets.

ISSN 2708-9525
75
One of the recommendations of this study is the proper evaluation of the demographic features of
residential buildings and used home appliances to recognize current consumption patterns and plan
targeted approaches to encourage other practices among particular groups of people (e.g., females
40 years of age or older).
Another recommendation is to endorse energy saving in awareness programs and initiatives which
can lead to higher motivation, intentions, and actions in this field. Energy education can also be
started from earlier stages of life such as in schools and universities.
This study presents a context to evaluate the residential energy consumption knowledge, practices,
and intentions of people living in the UAE. The context covers current knowledge of people about
energy-saving importance; current practices taken in this direction; and the intention to the
adoption of energy-saving behaviors. The framework is demonstrated in a case study on a
convenience sample of the UAE, where information was gathered from 36 respondents. Data were
obtained from an online survey and analyzed using Microsoft Excel. Results showed that people
have good knowledge of energy conservation and most of the respondents related energy
conservation to environmental protection and wellbeing. The knowledge of participants does not
necessarily lead to desired actions or intentions in that regard.
Decision-makers such as governmental authorities, policy-makers or owners of facilities can apply
and improve the context of this research to assess better and recognize current and future drivers
of energy-savings in households. Targeted electricity conservation interventions like energy
awareness campaigns can then be adjusted for specific practices or a particular group of people.
Studies in universities or energy industry can also apply similar ideas of the current research and
advance it in different areas, eventually helping in achieving a green sustainable environment.

ISSN 2708-9525
76
References
Abu Dhabi Distribution Co. (2018). Rates And Tariffs 2018. Retrieved from
https://www.addc.ae/en-US/residential/Pages/RatesAndTariffs2018.aspx
Azar, E., & Al Ansari, H. (2017). A framework to investigate energy conservation motivation and
actions of building occupants: The case of a green campus in Abu Dhabi, UAE. Applied
Energy, 190, 563-573. doi: 10.1016/j.apenergy.2016.12.128
Chen, Y. (2017). The Factors Affecting Electricity Consumption and the Consumption
Characteristics in the Residential Sector—A Case Example of Taiwan. Sustainability, 9(8),
1484. doi: 10.3390/su9081484
Dubai Electricity and Water Authority. Annual Statistics 2017 (p. 14). Dubai: Dubai Electricity
and Water Authority. Retrieved from https://www.dewa.gov.ae/en/about-dewa/about-
us/dewa-publications/annual-statistics
Laicane, I., Blumberga, A., Rosa, M., & Blumberga, D. (2014). Determinants of household
electricity consumption savings: A Latvian case study. Agronomy Research, 12(2), 527–542.
Maceda, C. (2015). UAE electricity consumption to grow 'more rapidly'. Retrieved from
https://gulfnews.com/business/energy/uae-electricity-consumption-to-grow-more-rapidly-
1.1569200
Masudi, F. (2017). Traditional bulbs fading out in UAE. Retrieved from
https://gulfnews.com/uae/government/traditional-bulbs-fading-out-in-uae-1.1692214
Sbia, R., Shahbaz, M., & Ozturk, I. (2017). Economic growth, financial development, urbanisation
and electricity consumption nexus in UAE. Economic Research-Ekonomska Istraživanja,
30(1), 527-549. doi: 10.1080/1331677x.2017.1305792
UAE Government. (2018). Electricity. Retrieved from https://government.ae/en/information-and-
services/environment-and-energy/electricity
UAE Government. (2018). Responsible consumption and production. Retrieved from
https://www.government.ae/en/about-the-uae/leaving-no-one-
behind/12responsibleconsumptionandproduction
US Environmental Protection Agency. (2018). Energy and the Environment. Retrieved from
https://www.epa.gov/energy/learn-about-energy-and-its-impact-environment
Wang, M., Huang, S., Lin, X., Novianto, D., Fan, L., Gao, W., & Wang, Z. (2016). Research on
Energy Consumption of Traditional Natural Villages in Transition: A Case Study in Zhejiang
Province. Energy And Power Engineering, 08(01), 34-50. doi: 10.4236/epe.2016.81004
World Data. (2019). Energy consumption in the United Arab Emirates. Retrieved from
https://www.worlddata.info/asia/arab-emirates/energy-consumption.php

ISSN 2708-9525
77
Internal Corporate Social Responsibility (ICSR); Perceptions
of Employees in a Private Hospital in Dubai
Dalal Darabseh,
School of Health and Environmental Studies - HBMSU
1. Introduction
The health care industry is evolving very fast nowadays and facing many challenges in the UAE.
One example of these challenges is the involvement of health care organizations(HCO) in corporate
social responsibility activities(CSR). CSR concept is emerging as an acceptable activity in UAE
health care organizations these days. Moreover, the employee’s decisions in any health care
corporation is a reflection of their perceptions about their organization.
Hence, the purpose of this study is to investigate the perceptions of the hospital employees about
the internal CSR activities within their organization at a private hospital in Dubai. Although CSR
include large number of stakeholders such as; customers, shareholders, and employees, hospital
employees are critical stakeholders (Siniora, 2017), and their opinions about the internal CSR
activity are affected by the activity and strategy related to CSR.
CSR is multi-dimensional construct, although for the purpose of this study we are investigating the
employee’s perceptions only, we focus on the effects of CSR activity on employees, in other words
as perceived by hospital employees, if this activity perceived negatively, the entire CSR program
of the organization will be ineffective.; as a result, the hospital performance and image will be
affected negatively. This case study will answer the following questions: Do perceptions about
CSR activities affect employee’s decisions and actions? Do perceptions of employees influence
the image of organization from employee’s perspectives? This study aims to increase the awareness
of the internal CSR programs among the hospital employees within the available resources the
hospital has.
The objectives of this study are:
- To define the influence of CSR on hospital staff decisions and actions.
- To make recommendations for the hospital management to improve CSR policies and strategies
from the employees perspectives based on findings from this study.
2. Literature Review
CSR concepts have spread widely between the 1960s and 1970s (Chapin, 2016). CSR has many
essential and valuable core constructs. Examples of CSR components mentioned in the literature
include; accountability, transparency, competitiveness, responsibility, economic profits, legal

ISSN 2708-9525
78
compliance, philanthropic, and ethical dimensions (Cherian and Pech, 2017; Hung Chen and
Wongsurawat, 2011). However, in this case we focus on CSR construct related to employees. This
is critical because the employees perceptions about CSR within their work environment connected
positively with their behavior and practices at the workplace (Cherian and Pech, 2017).
The hospital management should demonstrate a sense of accountability about their policies,
decisions and actions towards their employees, because the employees are relevant stakeholders,
and they have a critical role in the hospital performance and the desired financial outcomes.
Therefore, if the employees are satisfied, dealt fairly and transparently, openly communicating
their concerns without barriers to their management, the organizations financial returns will be
positive, and the image of that organization will be reflected positively in the community because
of their employees satisfaction. The employee satisfaction is usually mirrored in the staff attitudes,
actions, decisions, and behavioral communication with the customers internally and externally.This
communication with customers is a fundamental construct for the hospital strategy and CSR
program to maintain their business and to retain their customers (Russo, 2014).
Organization responsibility toward their workers and their work environment is counted as a
company social responsibility for that business internally; however, there are some cost
implications for the organization to maintain their employees’ health and wellbeing (Andre S.,
2017).On the other hand, when the company invests in their staff wellbeing as a part of their internal
CSR program, the less cost will be incurred for their employee health; as a result, the company will
be known as a socially responsible company(Andre S., 2017). Consequently, CSR has a positive
impact on companies, which reflected in value enhancement and increased their profits (LIANG
and RENNEBOOG, 2017).
There is a limited number of studies for hospital social responsibility applications. However, the
majority of studies in hospitals concentrate on related hospital issues. For example, Hwang &
Chung (2017) found out that there is a strong connection between market awareness and hospital
social responsibility and the performance in Korea, which can support the hospital to run their
business for the long term. However, it's difficult to measure it. Moreover, the ethical aspect of
the human right perspectives and bioethics was included in the previous studies.
Hospitals recommended investing more money in the social activities since caring and giving are
core values of the hospital business even though there is limited metric evidence to evaluate the
hospital involvement of the hospital performances in the social activities. Money generation and
social events are relevant managerial aspects that have no conflict to be running simultaneously to
ensure business sustainability in the current competitive market. However, the Hospitals should be
oriented to market needs and stakeholders' demands, such as employees and patients, and act
accordingly to maintain their image and continue their success financially (Hwang & Chung,
2017).
Chapin (2016) said hospitals considered the social association with commercial goals, the social
responsibility concept in the health care industry means that the HCO committed to the society and
their stakeholders away from making profits. This will support what Hoffman (2018) mentioned
as essential functions of CSR activities to help poor people or other employees with less salary to
have affordable medical services, not limited to health insurance coverage inclusions (Chapin,
2016).

ISSN 2708-9525
79
Employees protection and wellbeing turn out to be a mandated demand globally, and ensuring staff
safety is a human right standard. If the HCO is not fulfilling the employee safety at the work setting,
they become liable legally. Hence, taking care of the hospital employees is a legal concern in
addition to social one as well, which affects the hospital image among the employees positively or
negatively (Hossain & Diah, 2015).
In healthcare field the main core values of the health care industry is to directly associate with the
community needs by providing the care and cure services for the community individuals,
organizations who implement CSR initiatives and program in their daily operations and as part of
their strategic directions can achieve a good exposure in the competitive market, in addition, to
promote the company services and image to the private and public sectors (Lubis, 2018).
Moreover, CSR programs reflect a positive response inside the organization among the employees
and grab their attention, as a result, it will affect the staff decision, action, and behavior with the
internal and external customers through the health services provided at the hospital and other
services offered inside the organization (Lubis, 2018).
CSR programs inside an organization should be transferred transparently and correctly among the
employees as part of the strategic management direction inside the organization, in order to reflect
a positive image and reputation about the organization, attract the staff and catch their attention,
improve the staff and patient loyalty and the other stakeholders as a result of the positive impact
for the CSR (Lubis, 2018).
Lythreatis, Mostafa and Wang( 2017) found when the management speaks to their employees and
consider their suggestions in their management decisions, this resulted in a positive perception
about the internal CSR among the employees, consequently make the employees feel committed
to the organization by reflecting this commitment in their positive attitudes at their work settings,
this positive attitudes of the employees will help the organization to achieve their goals with their
stakeholders or customers.
For example, the organizations who deal with their staff fairly, support their staff educational
opportunities and provide attractive salaries and benefits. This type of organization they value their
employees through their internal CSR policies will achieve the return of this investment in their
staff performance and attitudes during their work. It will reflect the positive image for that
organization internally and externally (Lythreatis, Mostafa and Wang, 2017).
(Cherian and Pech, 2017) Conducted one study in UAE and explored the CSR influence on
employees in two UAE companies. The study showed that the staff could show a behavioral change
according to the CSR activities and policies inside that organization. Additionally, they mentioned
that CSR policies at any organization are essential to reflect the positive impressions about the
organization internally and externally to all the stakeholders to retain the existing customers and
relations of that organization with others, which resulted in maintain the company performance.

ISSN 2708-9525
80
Previous studies tested the importance of CSR from different perspectives, financial, consumer
behavior, and employee behavior. CSR affects the employee manner either positively or negatively
(Cherian and Pech, 2017). CSR actions have a substantial effect on the employee's performance
and improve their engagement in their organization business, which leads to success organization
and better business. However, some employees may have the feeling that CSR activities are not
belonging to their work, and it's not useful. Hence, the engagement of the institution staff is critical
to have a successful CSR outcome (Cherian and Pech, 2017). Consequently, the committed
management should strive continuously to find opportunities for socially responsible programs that
create collaboration between stakeholders within and outside their organization (Groves and
LaRocca, 2011).
3. Research Methodology
This study is a quantitative exploratory study. The target population for this study was healthcare
professionals (physicians, nurses, and allied health, non-medical) working in a private multi-
specialty hospital with more than 100 beds in Dubai. Sample size was decided based on the total
number of employees working in the hospital in that period of time. The sample size selected
randomly includes all hospital staff, and the research team distributed 300 questionnaires, 173 staff
responded with complete data, with a response rate of 57.6%. The participation of the study was
voluntary, the participants approved to participate verbally after that the questionnaires was given
to them by the research team, if they were refused they were thanked for their time and left without
receiving a copy of the questionnaire, all of the personal details of the participants kept
unidentified. Approval from the hospital management to conduct the study was obtained before the
distribution of the survey started.
Survey Instrument: For this study, we used the questionnaire developed by Maignan and Ferrell's
(2001) scale adapted from Carroll's (1979) CSR Model (Lythreatis, Mostafa and Wang, 2017).
Since the questionnaire is borrowed knowledge, we used a focused group strategy to validate the
questionnaire questions to suit the contexts of the studied hospital; the focus group consisted of 8
members; 2 doctors, three nurses, one university faculty, and two administrative staff. As a result,
the focus group endorse these questions and validate the items selected in the questionnaire. The
eight elements were tested on the Likert scale range from 1 to 5, (1) strongly disagree, and (5)
strongly agree.
Internal CSR Items Table (1): In order to evaluate the insights of internal CSR concepts from the
employee’s perspective, 8 questions selected for this purpose using Maignan and Ferrell (2001)
measure, consist of 'compensation and promotion' and 'My company supports employees who want
to acquire additional education' 'My company has internal policies that prevent discrimination in
the employees'. The scale used for this study tested in 3 different countries by Lythreatis, Mostafa,
and Wang (2017) showed reliable results in Lebanon, Tunisia, and UAE with alpha score 0.90,
0.90, and 0.91 correspondingly. The selected measure for this study evaluates the four conceptual
components proposed earlier by Carroll (1979) include an ethical, legal, philanthropic, and
economic level of the organization (Lythreatis, Mostafa and Wang, 2017).

ISSN 2708-9525
81
Table 1: Corporate Social Responsibility of Workplace Survey Questionnaire items
No Question
Q1 My company closely monitors the employees’ productivity.
Q2 My company seeks to comply with all laws in hiring and giving employees benefits
Q3 My company has programs that encourage the diversity of its workforce (in terms of
age, gender, or race).
Q4 My company has internal policies that prevent discrimination in the employees’
compensation and promotion.
Q5 My company has a comprehensive code of conduct.
Q6 My company supports employees who want to acquire additional education.
Q7 My company encourages employees to join civic organizations that support the
community.
Q8 My company has flexible policies which enable the employees to better coordinate work
and personal life.
Ethical Consideration: This Research maintained the ethical research principles for example; the
hospital’s higher management approval was obtained to conduct this survey; participation was
voluntary after the purpose of the was study explained, anonymity and confidentiality of the
participants were maintained, after the participant approved to fill the questionnaire. Completed
questionnaires were accessible only to the research team.
4. Results
Descriptive analysis method found to be supportive in evaluating the impact of CSR on employees
(Cherian and Pech, 2017). Hence it is used for the data analysis in this study, totally 300
questionnaires were distributed to all staff who were working in the hospital in October 2019. The
number of surveys were decided based on the total number of medical and non-medical employees
working in the hospital. 173 respondents submitted completed questionnaires and the response
rates 57.3%. The responses which represent 57.3% (n=173) met the inclusion standards for
statistical analysis.
Demographic characteristics of the respondents
Demographic variables such as gender, different groups of healthcare professionals (doctors,
nurses, allied health professionals and non-medical staff), age and experience are essential in
studying the internal corporate social responsibility in a workplace as presented in Table (3).
The gender distribution of participants was almost equal for both males (50.9%) and females
(49.1%) with male respondents slightly higher than the females. However, in the nursing group
majority of nurses were females (Table 2). This sex ratio supports the Dubai Health
Authority(DHA) report (2015) and represents the nursing population in the UAE. Work experience
years, age and the job role was used as a demographic characteristic to identify if cultural values
influence the perceived social responsibility. Majority of the participants belonged to the age group
of 20-30 years (39.9%) followed by 31-40 age group (33.3%). Employees who had an experience
of 3-5 years in the workplace were the major responders (75.1%) for this study.

ISSN 2708-9525
82
The groups participated in the survey were from doctors, nurses, allied health professionals and
non-medical staff. Nurses (41%) were the highest responders followed by Non-medical (24.3%)
and doctors (22.5%).
Table 2: Study Groups & Gender Ratio
Group 1
(Nurses)
Male (%) 26.8
Female
(%)
73.2
Group 2
(Medical)
Male (%) 82.1
Female
(%)
17.9
Group 3
(Allied Health Professional)
Male (%) 90.5
Female
(%)
9.5
Group 4
(Non-Medical Staff)
Male (%) 25.4
Female(%) 33.8
Table 3: Demographic characteristics of the respondents
Variable Value Valid Percent Survey group
(N=173) %
Gender Male 50.9
Female 49.1
Group
Nurses 41.0
Doctors 22.5
Allied Health Professionals 12.1
Non-Medical Staff 24.3
Age 20-30 39.9
31-40 33.5
41-50 16.8
>50 9.8
Year
Experience <1=1 year 4.6
2-3 years 19.7
3-4 years 75.1
>4 years 0.6

ISSN 2708-9525
83
Reliability Measurement
Internal reliability for the 8 questions were calculated by coefficient alphas, and the scale reliability
are illustrated in the table below. Coefficient alpha are used to measure internal reliability for each
question and overall agreement scales. Reliability analysis determines data trustworthiness
obtained from questionnaires. The Cronbach alpha score was 0.640 for this survey with a reliability
percentage of 64%. These scales indicate that the overall result of the study has acceptable internal
consistency score as mentioned in a previous study (Hulin, Netemeyer, and Cudeck, 2001).
Internal CSR Measurement Results
Perception of healthcare professionals to the eight internal CSR measurements within their
organization is illustrated in Figure 1.and Tables 4, represents a detailed response to the 8 question
items.
Highest agreement (Table 4) was observed for Question 5 followed by Q4, Q3, Q2, Q1. Whereas
highest disagreement was observed for Q8 followed by Q6, Q7.
Table 4: Degree of Agreement & Disagreement on Questions
Highest Agreement Responses
Highest Disagreement Responses
Q5: My company has a comprehensive code
of conduct (98.8%)
Q8: My company supports employees who
want to acquire additional education (93.6%)
Q4: My company has internal policies that
prevent discrimination in the employees’
compensation and promotion (97.7%)
Q6: My company encourages employees to join
civic Organizations that support the community
(83.2%)
Q3: My company has programs that
encourage the diversity of its workforce (in
terms of age, gender, or race (96%).
Q7: My company has flexible policies which
enable the employees to better coordinate work
and personal life 61.8%)
Q2: My company seeks to comply with all
laws in hiring and giving employees
benefits (88.4%)
Q1: My company closely monitors the
employees’ productivity (87.3%)

ISSN 2708-9525
84
5. Discussion of Results and Recommendations for Policy
This study aimed to investigate the perceptions of the hospital employees about the internal CSR
activities within their organization in a private healthcare setting in UAE. This study also aims to
increase awareness among the hospital employees of the internal CSR programs within the
availability of hospital’s resources.
The results of this study shows that the CSR programme of the hospital in relation to code of
conduct, policies related to discrimination and upgrading of position, employee benefits related
laws are well perceived and accepted positively by the employees who responded to the survey.
However, there was disagreement related to career development, work life balance and supporting
civic community were the mostly disagreed by the target groups. This implies that the work culture
should be improved in related to the disagreed items mentioned above to show that the CSR of the
hospital is positively connected to the employee behavior.

ISSN 2708-9525
85
Recommendations
The primary reason for the study was to investigate the CSR concept in a UAE private healthcare
setting with healthcare professional in medical and non-medical departments. To conclude, CSR
is a vital concept to be integrated in each organization culture and daily operations for the
businesses, hence, each company management should assess their employees understanding and
perception with different background about the corporate social responsibility in private hospital
settings. This study has some limitations.
Firstly, the finding is limited to only one hospital in one region of the UAE and does not include
other health care organization thereby reducing the ability for generalization, and the
demographical features may change from area to another. Furthermore, respondents were skewed
towards private healthcare setting. Secondly, this study examined staff views in only one hospital
in the private sector. Therefore, the result cannot be generalized about all hospital staff (government
& private) perception in the study region, it is recommended to develop the existing research
findings by including both private and government hospital inside UAE and different region for
valid comparison. A similar study can be implemented in different healthcare settings with a bigger
sample size in various regions of the UAE.
Future research recommended to investigate the CSR impact on employee's conduct and attitudes
outside the organization's boundaries (Cherian and Pech, 2017).
Contribution to knowledge: This study produces necessary information about the CSR concept in
healthcare agencies related to work condition in UAE private hospital. However, the duration of
this study was challenging because it was done in one-month.
This study has a series of important implications for hospital management to identify the areas that
required for the improvement and the results could be used in devising proactive management
approaches to address various issues affecting work condition and to plan to inculcate social
responsibility in relation to motivating factors such as training and career development, schemes
to improve work life balance and joining the civic community.
Another suggestion for management decisions makers is to allocate a budget from their yearly
budget for the CSR programs, part of this budget should be allocated to improve their employee’s
conditions, such as improve their internal CSR policies by considering the educational support for
their staff and be more flexible with their working hours in order to help their employees to achieve
the life-work balance.
Therefore, the management should revise their CSR policies and mainly which is related to their
staff, and incorporate the CSR programs in their vision, mission, and strategic goals, and their daily
operational activities. And communicate this program clearly to their staff to encourage their
engagement (Cherian and Pech, 2017).

ISSN 2708-9525
86
6. References
• Andre S., A. (2017). The Conceptual Relationship between Workplace Well-Being,
Corporate Social Responsibility, and Healthcare Costs. International Management
Review,13(2),24-31.Retrievedfrom
http://eds.a.ebscohost.com/eds/pdfviewer/pdfviewer?vid=1&sid=eec8ad01-c872-4a4d-
adb6-07b8ee209aa9%40sessionmgr4006
• Chapin, C. (2016). The Politics of Corporate Social Responsibility in American Health Care
and Home Loans. Business History Review, 90(4), 647-670. doi:
10.1017/s0007680516000350
• Cherian, J. and Pech, R. (2017). The Impact of Corporate Social Responsibility on the
Workforce of Selected Business Firms in the United Arab Emirates: A Nascent Economy.
Sustainability, [online] 9(11), p.2077. Available at:
http://file:///C:/Users/don/Downloads/Publishedversionsustainability-09-02077-v2.pdf
[Accessed 15 Oct. 2019].
• Dha.gov.ae. (2015).
https://www.dha.gov.ae/DHAOpenData/Annual%20Statistical%20Books/DHADoc76868
1140-28-07-2016.pdf. [online] Available at:
https://www.dha.gov.ae/DHAOpenData/Annual%20Statistical%20Books/DHADoc76868
1140-28-07-2016.pdf [Accessed 29 Nov. 2018].
• Groves, K. and LaRocca, M. (2011). Responsible Leadership Outcomes Via Stakeholder
CSR Values: Testing a Values-Centered Model of Transformational Leadership. Journal of
Business Ethics, [online] 98(S1), pp.37-55. Available at:
http://content.ebscohost.com/ContentServer.asp?EbscoContent=dGJyMNLr40Sep7M4zd
nyOLCmr1GeprdSsqi4S7OWxWXS&ContentCustomer=dGJyMOzprkm1prVKuePfgeyx
8Yzf2emL3%2Bbn&T=P&P=AN&S=R&D=eue&K=136255693 [Accessed 12 Oct.
2019].
• Hoffman, A. (2018). Cost-Sharing Reductions, Technocrat Tinkering, and Market-Based
Health Policy. The Journal of Law, Medicine & Ethics, 46(4), 873-876. doi:
10.1177/1073110518821981
• Hossain, D., & Diah, N. (2015). Corporate Giving in the Health Sector: A Study on the
Malaysian Companies. Middle East Journal of Business, 10(4), 29-37. doi:
10.5742/mejb.2015.92717
• Hung Chen, C. and Wongsurawat, W. (2011). Core constructs of corporate social
responsibility: a path analysis. Asia-Pacific Journal of Business Administration, [online]
3(1), pp.47-61. Available at:
https://www.researchgate.net/publication/235250770_Core_constructs_of_corporate_soci
al_responsibility_A_path_analysis [Accessed 15 Oct. 2019].

ISSN 2708-9525
87
• Hwang, Y., & Chung, S. (2017). Market orientation, social responsibility, and performance
in Korea's healthcare industry. International Journal of Healthcare Management, 11(4),
325-332. doi: 10.1080/20479700.2017.1404728
• Hulin, C., Netemeyer, R., and Cudeck, R. (2001). Can a Reliability Coefficient Be Too
High? Journal of Consumer Psychology, 10(1),55-58.
• LIANG, H. and RENNEBOOG, L. (2017). On the Foundations of Corporate Social
Responsibility. The Journal of Finance, [online] 72(2), pp.853-910. Available at:
https://vle.hbmsu.ac.ae/pluginfile.php/459413/mod_resource/content/1/CSR%20foundatio
ns.pdf [Accessed 14 Oct. 2019].
• Lubis, A. (2018). Corporate social responsibility in health sector: a case study in the
government hospitals in Medan, Indonesia. Business: Theory and Practice, 19, 25-36. doi:
10.3846/btp.2018.04
• Lythreatis, S., Mostafa, A. and Wang, X. (2017). Participative Leadership and
Organizational Identification in SMEs in the MENA Region: Testing the Roles of CSR
Perceptions and Pride in Membership. Journal of Business Ethics, [online] 156(3), pp.635-
650. Available at:
http://content.ebscohost.com/ContentServer.asp?EbscoContent=dGJyMNLr40Sep7M4zd
nyOLCmr1GeprdSsqi4S7OWxWXS&ContentCustomer=dGJyMOzprkm1prVKuePfgeyx
8Yzf2emL3%2Bbn&T=P&P=AN&S=R&D=eue&K=136255693 [Accessed 12 Oct.
2019].
• Russo, F. (2014). What is the CSR’s Focus in Healthcare? Journal of Business Ethics,
[online] 134(2), pp.323-334. Available at:
http://eds.b.ebscohost.com/eds/pdfviewer/pdfviewer?vid=1&sid=23c7138c-56f8-4d6f-
8a3a-bccbd82f287d%40sessionmgr102 [Accessed 12 Sep. 2019].
• Siniora, D. (2017). Corporate Social Responsibility in the Health Care Sector. Graduate
student research symposium, [online] proceeding 2, and pp.1-34. Available at:
https://dsc.duq.edu/cgi/viewcontent.cgi?article=1001&context=gsrs [Accessed 23 Sep.
2019].

ISSN 2708-9525
88
7. Appendix:
Items used to measure internal CSR perceptions:
1. My company closely monitors the employees’ productivity.
2. My company seeks to comply with all laws in hiring and giving employees benefits
3. My company has programs that encourage the diversity of its workforce (in terms of age,
gender, or race).
4. My company has internal policies that prevent discrimination in the employees’
compensation and promotion.
5. My company has a comprehensive code of conduct.
6. My company supports employees who want to acquire additional education.
7. My company encourages employees to join civic organizations that support the community.
8. My company has flexible policies which enable the employees to better coordinate work
and personal life.

ISSN 2708-9525
89
Domestic waste recycling practices among the UAE
population
Yaqeen Al Naqbi,
HBMSU Leaner# 200105999
A. Introduction
Domestic recycling is a process that facilitates the regulation of non-biodegradable wastes in the
environment to a manageable level. Although non-biodegradable wastes consist of mostly solids,
it also includes liquid waste enclosed in containers (EPA, 2016). Recycling refers to the method of
altering waste materials into reusable new material, usually aimed at the conservation of the
environment. Wastes have created a significant environmental challenge globally, and the UAE is
among the countries significantly affected due to its rapid development in both population and
infrastructure.
The nation is, however, diverting its attention and finances to sustainable, eco-friendly waste
management through policies and coordinated strategies aimed at handling domestic waste recycles
as well as consumer attitudes towards recycling. There are numerous benefits attributed to
recycling which include conservation of resources through making use of the wasted ones,
production of recycled products saves a lot of energy and most importantly the process aids in the
protection and conservation of the environment. Recycling also reduces the amount of waste within
a household, the country and environment at large. There are numerous methods of handling waste
like incineration, landfills, and combustion; however, none of these procedures are as safe for the
environment as recycling (Rushton, 2003). Notably, landfilling has become unsustainable as the
population increases (Sil & Kumar, 2016). Likewise, combustion and incineration have direct
environmental consequences such as the release of toxic fumes into the atmosphere. Consequently,
waste pervasively strays into water bodies and affect marine life.
Fortunately, the UAE government have commenced several programs to sensitize the citizens on
waste recycling and its importance. It has also implemented policies that curb waste disposal to
ensure recycling of most waste produced in the country, which is coordinated by the local
authorities. Other agencies such as Tadweer have also joined in the effort to enhance waste
recycling in the country (Rana, 2016). The government has also improved waste collection and
separation systems, and what remains is the country leadership providing incentives that encourage
waste recycling. In my research, I investigated the user attitude and behavior regarding waste
disposal and made a comparison to Germany. The results showed that Germans are increasingly
recycling domestic waste while UAE citizens show the contrary.
ISSN 2708-9525
90
B. Literature Review
The household wastes in the UEA have reached an annual average of 730 kilos and 725 kilos per
home in Abu Dhabi and Dubai respectively, with the number expected to rise over time According
to Abiad and Meho (2018). Wastes mainly entail solid trash or refuse from different households.
Recycling involves the process of increasing the use of domestic wastes by converting them into
other materials. Waste management has remained a critical challenge in the UAE; hence the
contemporary waste recycling campaigns have focused on providing alternatives to waste
management. Waste recycling is a complex problem in the UAE because the government is yet to
commit adequate funds to the process. Despite the commitment of the government to reducing
waste dumping in landfills, the amount of funds allocated to process is insufficient (Anwar,
Sergany, and Ankit, 2017).
Therefore, gaining better insights into recycling requires a knowledge of who recycles domestic
wastes and how it is done. The UAE has a population of 9.68 million in which 80 of the population
are expatriates, whereas 20% are Emiratis (Abiad and Meho, 2018). Despite the diversity of its
population, UAE is still one of the largest producers of waster around the globe. For instance, 8,
200 tons of waste is produced every day with each household in the UAE producing a per capita
waste of 2kg to 2.3kg daily (Abiad and Meho, 2018). Some of the causes of the higher waste
generation in the UAE include demographic and socioeconomic factors, environmental awareness,
and the limited green solution options. These factors have also influenced the attitudes and
behavior of residents since the older generation in the UAE is yet to respond positively to the
domestic waste recycling.
Based on the income statistics, the goal of the paper will be to explore the attitudes and behaviors
of residents of the UAE towards domestic waste recycling. It will also examine the factors
promoting waste recycling in the UAE as well as how those factors have influenced the change in
behavior and attitudes of residents. With the limited knowledge of the behaviors and attitudes
towards waste recycling, this paper will provide vital information to assist in developing programs
for minimizing wastes. The effects of the limited knowledge on waste management are that people
will continue to use non-recyclable materials, which will increase the rate of solid generation
wastes. This will not only increase the number of solid wastes in the UAE but also it will reduce
participation in waste recycling programs or practices.
The behaviors and attitudes of consumers are demonstrating a positive trend because they believe
that they have a personal responsibility to support recycling. The public has a vital role in
addressing waste management. Similarly, they have developed positive attitudes towards waste
recycling because they believe that it promotes environmental conservation efforts around the
globe (Genena et al., 2018). Attitudes and towards domestic wastes recycling have changed
significantly because of the deteriorating ecological quality in the UAE. For example, the public is
developing a preference for recyclable or reusable materials in their homes to reduce the number
of wastes in the UAE.
They are Raising awareness of the UAE's population on the importance of reducing wastes while
increasing recycling to promote environmental sustainability or improve the quality of life (Ayoub,
Musharavat, and Gabbar, 2014). A study conducted by Ayoub, Musharavat, and Gabbar (2014)
determined that raising awareness on recycling promotes a positive change in behavior towards the

ISSN 2708-9525
91
recycling of wastes. The study conducted in Qatar indicated that attitudes towards recycling are
changing; hence the Qatar citizens are increasingly participating in recycling. The public
increasingly understands that domestic waste recycling is an approach aimed at promoting
environmental sustainability to improve the living standards of individuals by reducing the
possibility of environmental pollution (Hall et al., 2016). This has not only encouraged them to
support domestic waste recycling but also, they have actively participated in the recycling process
(Yano and Sakai, 2015). For instance, they have supported or actively engaged in the process by
using reusable materials.
Rajopapal and Bansal (2015) argue that the behaviors and attitudes towards domestic waste
management have steadily changed over the last decade. A study conducted across different states
including New York, California, Illinois, Virginia, and Florida indicated that people tend to
develop positive attitudes towards recycling when it is tied with the issues of the loss of natural
resources. 70% of the respondents indicated that they have participated in domestic recycling of
wastes because of the threat that the increasing number of dumpsites presents on natural resources.
The safety culture has influenced the adoption of domestic waste recycling practices in society
since the public deems it as an appropriate approach to waste management.
Despite the changing attitudes and behaviors towards domestic waste recycling in the UAE, various
factors influence such attitudes and behaviors. For example, demographic factors or variables such
as age have had a significant influence on the commitment of individuals to sustainability because
the younger generation has a positive attitude towards recycling as compared to others (Howari,
Qafisheh, & Nazzal, 2018). A study conducted by Bendak and Atili (2017) indicated that members
of the second-generation view recycling more positively, hence they actively participated in
recycling activities. The authors found that the second-generation groups exhibit higher recycling
participation, as well as awareness and willingness to support recycling promotions (Bendak and
Atili, 2017).
Despite their commitment to recycling, lack of past participation in the practice might present
several barriers. Demographic factors such as age, gender, and income levels have shaped the
attitudes of the residents of Ras Al Khaimah emirate, which has prompted them to support the
domestic recycling of waste campaigns (Assaf, Idwan, & Farhat, 2018). A study conducted by
Assaf, Idwan, & Farhat (2018) indicated that socio-demographic factors and environmental
awareness are the determinants of recycling attitude and behavior. 75% of the response indicated
that environmental awareness and socio-demographic factors such as age and income. Therefore,
demographic and socio-economic factors have significantly shaped the attitudes and behaviors of
individuals; hence motivating them to support/participate in domestic waste recycling (Assaf,
Idwan, & Farhat, 2018).
With the troubling statistics of total waste produced in the UAE and other countries like the U.S.
and Qatar, the current state of knowledge on waste recycling is lower than the expected level. This
demonstrates that there exist knowledge gaps among current generations including the millennials
and generation Z on the benefits of waste recycling in the society. Moreover, limited knowledge
of the existing waste recycling programs has increased the knowledge gaps in waste recycling
practices.

ISSN 2708-9525
92
C. Research Objectives
The first objectives of this study are to find out why people in UAE are not participating in
recycling domestic waste as well as they have a good general attitude of the population towards
recycling. Secondly, to investigate how age and level of education affect household recycling.
Another objective is to compare the recycling rate in the United Arab Emirates to Germany’s.
D. Methodology
This cross-sectional study conducted a sample survey with a total of 50 participants. Primary data
were collected using a simple questionnaire. The age of the participants varied from (19-65) years.
The question consisted of two sections where the first part required participants to fill out their
demographic data as shown below:
a) Age (19-20, 21-30, 31-40, 41-50, 51-65)
b) Gender
c) Marital status (married, single, divorced, other)
d) Level of education (high school or lower, diploma, bachelor, masters or higher).
In the second part was designed to gain a better understanding of the domestic waste recycling
knowledge of the participants, and hence, their attitude towards the same. The questionnaire was
formulated as shown in table 1 based on a total of 13 questions. All questionnaire contents were
based on previously developed and validated surveys except question nine which was modified to
achieve the objective. Specifically, questions in section two were based on similar items in a survey
conducted by Bendak and Attili (2017).
The questions types were predominantly single answer question for socio-demographic data. The
second questions consolidated single answer and numerous answer question in exploring the
attitude and behavior of household waste recycling.
The questionnaires were distributed conveniently to potential respondents around, United Arab
Emirates. The survey took place in April 2019 on an interview basis. All participants were briefed
about the purpose of the study before being allowed to answer questions. I altered some of the
questionnaire items so that the final document would suit the United Arab Emirates context. The
targeted sample size in this survey was 50 people. I discarded two questionnaire responses because
of invalid responses. I evaluated the data I collected from the 48 valid questionnaires that remained.
Respondents were asked if they were ready to contribute before being presented with questionnaire
forms. Descriptive statistics were used to assess the responses written by the respondents, and the
data were analyzed quantitatively.

ISSN 2708-9525
93
Table 1: Questionnaires
Question Answers
1. How convenient do you find recycling? Not at all
Somewhat inconvenient
Neutral
Convenient
Very Convenient
2. Do you consider recycling a waste of time?
Strongly agree
Agree
Neither agree nor disagree
Disagree
Strongly disagree
3. Is it my personal responsibility to help in
the recycling effort?
Strongly agree
Agree
Neither agree nor disagree
Disagree
Strongly disagree
4. Why do you recycle? (tick all applicable) Recycling saves energy
Recycling reduces landfills
Recycling preserves resources and protects the
environment
Recycling is good for the economy
Others
5. What encourages your participation in
waste recycling? (tick all if applicable)
More recycle beans
Less walking distance to dispose
Mass media education and advancement
Clear recycling guidelines
Frequent waste collection
6. Are you concerned about the environment
or global warming?
Very concerned
Somewhat concerned
Not sure
Not at all
7. On a 5-point scale, how strongly do you
agree that the governments should force
producers to use recyclable materials in
their packaging?
Strongly agree
Agree
Neither agree nor disagree
Disagree
Strongly disagree
8. Do you have access to waste recycling bin
at work and at home?
Yes
No
9. Depending on whether recycling beans are
available, would you prefer sending
somebody to do it when you cannot?
Often send my children
Often send my siblings
Prefer to go by myself
Send anybody
Do nothing
10. Do you currently participate or ever
participated in any waste recycling
program(s)?
Yes, but not currently
Yes, I do currently
Not at all

ISSN 2708-9525
94
11. How do you receive information about
recycling? (tick all applicable)
School/university lessons
Internet
Neighbors
Leaflets/posters
Radio/television
Newspaper articles
General perception/knowledge
12. Do you think there are enough recycling
bins?
Yes.
No.
Not sure/not applicable
13. How recent have you received information
about recycling?
In the last month
In the last 6 months
In the last year in the last 2 years None that you
know of
E. Results
First, how are age and level of education affects household recycling?
Demographic factors, such as age and education level, affected the attitude toward recycling.
Young people had a more positive outlook toward recycling than their older counterparts. The
attitude data was obtained from the questionnaires.
Many youthful participants (31.25%) were particularly positive of the idea of waste recycling
indicating that although they are not fond of employing the concept in their household management
of wastes, they have once contemplated introducing it. In contrast, a large proportion of the mature
and aging population appeared either oblivious or critical of the idea of recycling waste.
While in high school people who recycle are many compared to those who think it is a personal
responsibility. As we move on to higher education people who perceive it as a personal
responsibility, continue to increase, and at the master’s level, it is at par with people who recycle.
As the graph indicates, all the numbers keep rising, and that is an indication that as people continue
to acquire knowledge, they become more aware and concerned about the environment.
Table 2: Demographic factors, such as age and education level and marital status
Sex Total percent
Male 17 35.42%
Female 31 64.58%
Age (years) total percent
19-20 5 10.42%
21-30 13 27.08%
31-40 15 31.25%
41-50 10 20.83%

ISSN 2708-9525
95
4
6
6
7
2
2
3
6
3
2
3
5
3
4
5
7
0 1 2 3 4 5 6 7 8
High school or lower
diploma
bachelor
Masters or higher
Gra
ph
1:E
ffec
t o
f Ed
uca
tio
no
n W
aste
re
cycl
ing
figure 1:Effects of the educational level on attitude towards waste recycling
Perceive recycling as a personal responsibility
Concerned about the environment or global warming
Participants in waste disposal programs
People who recycle
51-65 5 10.42%
Education Total percent
high school and lower 12 25%
Diploma 12 25%
Bachelor 16 33.33%
master or higher 8 16.67%
marital status Total percent
Married 26 54.17%
Single 20 41.67%
Divorced 1 2.08%
Other 1 2.08%

ISSN 2708-9525
96
The second objectives of this study are to find out why people in UAE are not participating
in recycling domestic waste as well as they have a good general attitude of the population
towards recycling.
Based on the respondents' data, most people think waste recycling is not a time-wasting effort with
(38) strongly disagreeing. Nevertheless, a more significant number, (25) out of the 48 respondents
say it is their responsibility to help in the recycling effort. It indicates that think recycling is a good
deed, but they are not directly responsible for ensuring waste are recycled. Most of the respondents
also agree that the government should restrict packaging materials used by manufacturing
companies, where 26 of the respondents strongly agree.
10
7
8
7
3
6
4
3
2
1
9
3
3
1
2
8
5
4
2
1
0 2 4 6 8 10 12
<20
21-30
31-40
41-50
>50fi
gure
2:E
ffec
t o
f ag
e o
n W
aste
recy
clin
g
figure 2: Effects of age on attitude towards waste recycling
Perceive recycling as a personal responsibility
Concerned about the environment or global warming
Participants in waste disposal programs
People who recycle

ISSN 2708-9525
97
According to the above chart, most people agree that recycling is something that can help in
conserving the environment. They also think that the government should direct all producing
companies to use recyclable materials. Furthermore, most people agree that recycling efforts should
be personal responsibilities.
Table 3: General perception of waste recycling
Question Answers Percentage Total
How convenient do you
find recycling?
Not at all
Somewhat inconvenient
Neutral
Convenient
Very Convenient
20.83%
10.42%
2.08%
39.58%
27.08%
10
5
1
19
13
Why do you recycle?
(more than one selection
allowed)
To save energy.
To protect the environment and conserve the natural resource.
It is effective economically.
To reduce landfills.
Other
10.42%
37.5%
4.17%
45.83%
2.08%
5
18
2
22
1
What encourages your
participation in waste
recycling? (more than one
selection allowed)
More recycle beans.
Less walking distance to dispose.
Mass media education and promotion.
Clear recycling guidelines.
Frequent waste collection.
29.17%
25%
14.83%
10.42%
20.83%
14
12
7
5
10
Are you concerned about
the environment or global
warming?
Very concerned
Somewhat concerned
Not sure
Not at all
54.17%
35.42%
6.25%
4.17%
26
17
3
2
Do you have access to
waste recycling bin at
work or home
Yes
No
64.58%
35.42%
31
17
1
26
25
2
17
11
2
3
1
5
1
6
38
1
5
0% 10% 20% 30% 40% 50% 60% 70% 80% 90% 100%
Do you consider recycling a waste of time?
On a 5-point scale, how strongly do you agree that thegovernments should force producers to use recyclable
materials in their packaging?
Is it my responsibility to help in the recycling effort?
figure 3: User attitude and behavior towards waste recycling
Strongly agree Agree Neither agree nor disagree Disagree Strongly disagree

ISSN 2708-9525
98
Depending on whether
recycling beans are
available, would you
prefer sending somebody
to do it when you cannot?
Often send my children
Often send my siblings
Prefer to go by myself
Send anybody
Do nothing
14.83%
10.42%
25%
45.83%
10.42%
7
5
12
22
5
Do you currently
participate or ever
participated in any waste
recycling program(s)?
Yes, but not currently
Yes, I do presently
Not at all
22.91%
29.17%
47.92%
11
14
23
How do you access or
receive information on
waste recycling? (more
than one selection
allowed)
Through posters or leaflet
Through TV or radio
Through the internet
Common knowledge or perception
From my neighbors
Newspapers
Lessons from school or university
10.42%
29.17%
20.83%
2.08%
10.42%
16.67%
10.42%
5
14
10
1
5
8
5
Do you think there are
enough recycling bins
near your households.?
Yes.
No.
Not sure/not applicable
41.67%
56.25%
2.08%
20
27
1
From the survey, 41.67% of the participants claimed to have access to recycling bins near their
households. Notably, a relatively large number find recycling inconvenient as indicated by 10
respondents representing 20.83% who say not at all.
The trend entailed 10.42% of the participants accepting that they would ensure that they disposed
of their waste in a container even if it meant sending their siblings. It was otherwise surprising to
note that many participants’ attitude toward recycling was dependent on the availability of public
recycle bins to practice recycling. Without a state provided bin in the neighborhood for waste
separation, most households stuck to mixing wastes in a single bin or collection material and carry
on with life.
The majority of the responses (56.25%), however, indicated that most households have no access
to recycling bins (figure 4). Most users referred to recycle bins as waste bins, which further gave
a hint into people’s perceptions towards recycling.
The majority of the response does not currently participate or ever participated in any waste
recycling program at 47.92%.
Figure 4 Do you think there are enough recycling bins
42%56%
2%
DO YOU THINK THERE ARE ENOUGH RECYCLING BINS?
Yes No Not sure/not applicable

ISSN 2708-9525
99
This graph presents the percentage of general attitude and behavior towards waste recycling. It
entails what motivates people in the UAE to participate in waste recycling. Clear recycling
guidelines are the least motivators at 10%.
Equally, a large number says more recycle beans (29.17%), less walking distance to dispose of
waste (25%) and various waste collection (20.83%) encourages them to participate in waste
recycling (see figure 5).
The last objective to compare the recycling rate in the United Arab Emirates to Germany’s.
14
12
7
5
10
0 2 4 6 8 10 12 14 16
figure 5: What encourages your participation in waste recycling?
Frequent waste collection. Clear recycling guidelines
Mass media education and promotion Less walking distance to dispose
More recycle beans

ISSN 2708-9525
100
Figure 6: percentage of implemented household recycling in UAE and Germany, source Statistics
Center(2015); Federal Ministry for the Environment, Nature Conservation and Nuclear Safety. https://www.scad.gov.abudhabi/Release%20Documents/Waste%20Statistic%202015%20EN.PDF
https://www.bmu.de/fileadmin/Daten_BMU/Pools/Broschueren/abfallwirtschaft_2018_en_bf.pdf
According to the graphical representation of Germany and the UAE, the efforts of the UAE need
an improvement. Furthermore, as time goes by, the number of people engaged in household
recycling in the UAE keeps going down, while that of Germany keeps rising as the percentage of
people involved in household recycling was 99.5 in Germany and 18.27 in the UAE in 2014.
In Germany, Recycling was, in fact, more common among females than among male household
members in 2016 (Dornack, 2018). Further, 70% of the Germans confessed that they developed a
routine of recycling wastes due to the education and extensive campaigns by both the state and
environmental justice organizations to create awareness about recycling as an effective method of
waste management (Wunsch & Simon, 2018). Therefore, it appears the Germans’ recycling
behavior and attitudes are deeply embedded in their perceptions, values, and personality, factors
that have not been sufficiently cultivated in the UAE.
In Germany, about 92% of the households had easy access to a recycling bin in 2017, a fact that
played an essential role in influencing people’s attitude and behavior to promote the recycling
concept (Wunsch & Simon, 2018).
F. Discussion
The results of the study indicate that only a few people practice recycling. Notably, the composition
and volume of domestic waste vary from one country to the other (Ojeda-Benitez, de Vega, &
Ramı, 2003. The open dumping of organic material creates favorable conditions for disease-
causing organisms to thrive (Choden, 2015). The scarcity of land and the low cost of starting and
36.36%29.95% 27.19%
18.27%
98.80% 99.60% 99.50%
0.00%
20.00%
40.00%
60.00%
80.00%
100.00%
120.00%
2011 2012 2013 2014
figure 6: Houshold Recycling: Germany vs UAE
UAE Germany

ISSN 2708-9525
101
maintaining landfills make recycling seem uneconomical (Alhoumoud, 2005). Therefore, most
government and organizations would prefer to run landfills.
However, people are becoming more aware of the environmental degradation caused by the
accumulation of wastes in the environment if we were to go by the findings in this study. The
Environment Agency - Abu Dhabi (EAD) (2016) recommends the reuse of plastics. Recycling
programs can be made successful if the positive perception of the public towards it is translated
into action. The study established that households with higher education levels were more likely to
recycle wastes compared to the others. Based on the data presented in table 2 and figure 1, the
positive attitude towards recycling waste was higher for those holding bachelors and masters
compared to high school and diploma. Therefore, it is justified to conclude that the more a
household is educated, more likely they will adopt waste recycling practices.
Notably, the data on the age factor presents an interesting turn of events. Naturally, the younger
generation is expected to loosely attach cognizance to essential practices such as the responsible
disposal of waste. On the contrary, the data portrays the young as the more responsible group
compared to the old regarding waste recycling. Perhaps, the young generation is now taking over
the responsibility to take care of their environment now than ever. The data also provides a new
perspective in environmental conservation that can facilitate government programs on waste
recycling and sensitization.
On other related areas of the research, recycling programs can be made successful if the positive
perception by the public towards it is translated into action. Participants of the study generally had
a positive attitude towards the initiative, but many of them reported that they do not participate in
the programs. The inadequacy of recycling bins has given most respondents no option but to avoid
recycling. Many of those who participated in the survey are willing to join recycling programs
though. The amount of waste produced in the country was 6.6 million tons in 2016 (Fernandez,
2015). It was expected to increase by 30 percent in 2017 (Mazumder, 2016). Other estimates
indicate that domestic waste production may increase exponentially over the next few years
(Geranpayeh, 2015).
The number of companies recycling their waste has also increased all over the country. Sharjah has
become one of the leading emirates in waste recycling in the United Arab Emirates thanks to the
efforts of the Sharjah Environment Company in educating people about recycling (Khamis, 2014).
Advertisements on the internet have played a substantial role in spreading the recycling message.
Additionally, social media platforms, such as Facebook, Instagram, and Twitter, are being used to
educate people on the importance of recycling. The press also frequently features opinions about
recycling and its positive impact on the environment. Newspapers and magazines also feature
advertisements that urge people to recycle all recyclable products. The television is also a useful
source of information about recycling in the United Arab Emirates. Some TV stations air
documentaries that encourage residents to recycle domestic waste. Radio stations have also begun
sensitizing the public about recycling.
The confusion exhibited in many people’s distinction between waste bins and recycling bins
explains why UAE has only managed to recycle a little number of wastes despite being one of the
largest waste producers in the world. The condition epitomizes the existing notion that public

ISSN 2708-9525
102
awareness concerning waste recycling in the developing and transition economies is a serious
problem that undermines their efforts to minimize waste production (Bendak & Attili, 2017). The
UAE has made an effort to reach sustainability. Waste to energy is the way toward creating vitality
as power or warmth from the essential treatment of waste. Masdar, Abu Dhabi's sustainable power
source organization, had consented to a necessary association arrangement with Bee'ah to build up
the UAE's waste-to-energy (WtE) area (UAE Government,2018). This association will help add to
the UAE Government's Vision 2021 which focuses, among different objectives, occupying waste
from landfills by 75 percent by 2021. In Abu Dhabi, A 100 MW office, one of the world's biggest,
is a work in progress in Abu Dhabi by Abu Dhabi National Energy Company PJSC (Taqa), in a
joint effort with the Center of Waste Management (Tadweer) (UAE Government,2018).
In Germany, for instance, the state understands the role of public knowledge in the implementation
of various programs that intend to generate benefits to society (Dornack, 2018). Education and
awareness campaigns about such programs in the European country run concurrently in different
ways. While one runs at schools to enlighten the millennial, generation Z, and generation X, the
other is conducted at the national level through various media platforms to inform the older
generation, hence influence their attitude (Brassaw, 2017).
G. Conclusion and Recommendations
The United Arab Emirates should allow public participation in domestic waste recycling by making
facilities accessible to all people. Waste production is increasing as the manufacturing capacity of
companies and the population increases. Recycling is a solution to the problem of increased non-
biodegradable waste. Few research studies have previously explored people’s attitude towards
domestic waste recycling in the United Arab Emirates. My research aimed at investigating
household waste disposal attitude in the UAE. The study also sought to compare the local waste
recycling rates in the United Arab Emirates to those in Germany. 48 people participated in the
survey. The results indicated that the consumer’s attitude toward recycling differed from their
practices. Some of the reasons why people do not participate in recycling are the distance to
recycling bins.
The results indicated that the consumer’s attitude toward recycling varied based on age and
educations. Notably, the research showed that individuals who have achieved higher education
showed a better sensitivity to waste recycling compared to those with lower education. Also, the
young aged participants showed a better attitude towards waste recycling compared to their older
counterparts.
Educating people about the importance of recycling can help in creating a culture of sustainability.
The study shows that many people do not know how to access domestic waste recycling services.
The United Arab Emirates government needs to conduct public awareness campaigns that teach
people how to recycle their waste. It should also consider that there are people of various
nationalities living and working in the country. Therefore, it should ensure that all educational
material about domestic waste recycling is made available in multiple languages.

ISSN 2708-9525
103
Furthermore, the government should introduce mandatory domestic waste collection laws, which
will help the country reach its recycling target. The United Arab Emirates government may also
reach its recycling targets by imposing additional charges on goods packaged in recyclable
material. The fees should be refunded upon returning the recyclable items to the retailer. The
program will act as an incentive and encourage people to recycle household items. The government
should collect statistics on recycling volumes so that the progress made in the process can be
quantified. Information can be collected by recording the weight of the recyclable material at
various collection points. Recycling is the most sustainable method of domestic waste management
that has been developed so far. It is the best way of conserving the environment as the demand for
recyclable products increases. Recycling has gradually replaced landfilling and incineration to
become the favorite way of waste disposal. It should be adopted all over the world because it
encourages the conservation of non-renewable resources, such as crude oil, and helps in cleaning
the environment. Recycling could soon become the only method of waste disposal in the United
Arab Emirates and the rest of the world.
Attitudes played an essential role in negatively influencing people’s perception of recycling. The
precise factors that determine people’s attitude comprise of family, the media, education and
religion, personal experiences, and economic status among several others. A family is an essential
unit of society, which implies that it bears a massive influence on people’s attitudes. In most
families, the information and instructions flow from family leaders (parents, guardians, or senior
members of the extended family) to their descendants. The subsequent perceptions and attitudes
generated from the communication and relationship in families are often difficult to alter.
Accordingly, changing people’s attitudes in UAE’s households will need a carefully calculated
strategy that will entail offering incentives to help communities embrace recycling as an essential
environmental management practice (Brassaw, 2017).
In Germany, the state has managed to influence attitude at the family level through a variety of
approaches. Foremost, German children, learn about waste recycling in their preschool curriculum
where they are taught about refuse separation and colors of different recycling bins (Brassaw,
2017). A second approach is through offering monetary rewards (25 cents) for a plastic material
recycled. The incentive encourages families to practice recycling as the practice amounts to
approximately €156 annually that can supplement the household budget (groceries). Other
mechanisms are through transitioning electricity consumption to renewable energy produced from
biomass and by implementing the nation’s waste management policy. The UAE needs to deploy
similar methods to increase its waste recycling success.
Limitation of the study
The present investigation focuses on household waste recycling in the UAE. More research is
required on customers attitude and behavior towards reusing of different kinds of waste. Likewise,
a consequence of the present investigation depends on serving a limited number of people’s.

ISSN 2708-9525
104
H. References
Abiad, M. G., & Meho, L I. (2018). Food loss and food waste research in the Arab world: A
systematic review. Food security, 10(2), 311-322.
Alhumoud, J. M. (2005). Municipal solid waste recycling in the Gulf Co-operation Council states.
Resources, Conservation and Recycling, 45(2), 142-158
Al-Maaded, M., Madi, N. K., Kahraman, R., Hodzic, A., & Ozerkan, N. G. (2012). An overview
of solid waste management and plastic recycling in Qatar. Journal of Polymers and the
Environment, 20(1), 186-194.
Anwar, S., El Sergany, M., & Ankit, A. (2017). Health and Environment Conference. Innovation
Arabia 10, 1-364.
Assaf, H., Idwan, S., & Farhat, M. (2018). Assessing recycling attitude and behavior in Ras Al
Khaimah, UAE. Journal of Environmental Engineering and Science, 1-7.
Ayoub, Nasser, Farayi Musharavati, and Hossam A. Gabbar. "A future prospect for domestic waste
management in Qatar." International Conference on Earth, Environment and Life Sciences.
Dubai, UAE. 2014.
Bendak. S., & Attili, A. (2017). Consumer’s attitude and behavior towards domestic waste
recycling in developing countries: a case study. Journal of Advanced Recycling Waste
Management, 2 (124).
Brassaw, B. (2017). Germany: A recycling program that actually works. International Journal of
Environment and Waste Management, 21(3).
Choden, N. (2015). The problems of solid waste management: a case study of government housing
colony at Changjiji, Thimphu [DOC]. Retrieved from
202.144.157.211:8080/jspui/bitstream/1/194/1/Ngawang%20Choden.docx
Dornack, C. (2018). Waste policy for source separation in Germany, In R Maletz, Source
separation and recycling: Implementation and benefits for a circular economy, Cham:
Springer International Publishing, pp. 269-287.
Environment Agency - Abu Dhabi. (EAD). (2016). Waste classification policy [PDF]. Retrieved
from https://www.ead.ae/Publications/Waste%20Classification/WMP_EAD-EQ-PR-P-
01_Waste%20Classification%20Policy_English.pdf
Environmental Protection Agency (EPA). (2016). Criteria for the definition of solid waste and
solid and hazardous waste exclusions. Retrieved from https://www.epa.gov/hw/criteria-
definition-solid-waste-and-solid-and-hazardous-waste-exclusions.
Fernandes, S. (October 25, 2015). UAE waste to increase by over 27% by 2017. Khaleej Times.
Retrieved from https://www.khaleejtimes.com/nation/general/uae-waste-to-increase-by-
over-27-by-2017.
Forgas, J. P., Cooper, J., & Crano, D. (2010). The psychology of attitudes and attitude change. New
York: Psychology Press.
Genena, F. A., Jamal, D. A., Ahmed, W. K., Almarzooqi, L. A., Almazrouei, A. S., & Al-Naqbi,
A. H. (2018, February). Implementing green solutions to recycle UAE domestic waste:
Aircraft composite materials. In 2018 5th International Conference on Renewable Energy:
Generation and Applications (ICREGA) (pp. 30-33). IEEE.
Geranpayeh, S. (November 18, 2015). Abu Dhabi’s waste to double in the next 25 years. Gulf
News. Retrieved from http://gulfnews.com/news/uae/environment/abu-dhabi-s-waste-to-
double-in-the-next-25-years-1.1622404.

ISSN 2708-9525
105
Hall, C., Dayal, N., Majstorović, D., Mills, H., Paul-Andrews, L., Wallace, C., & Truong, V.
(2016). Accommodation consumers and providers’ attitudes, behaviours, and practices for
sustainability: A systematic review. Sustainability, 8(7), 625.
Howari, F., Qafisheh, N., & Nazzal, Y. (2018). Environmental service-learning in the United Arab
Emirates: Is it mediated by the effects of biographical and demographical
variables?. Applied Environmental Education & Communication, 1-13.
Khamis, J. (December 14, 2014). Sharjah aims to achieve zero waste to landfill. Gulf News.
Retrieved from http://gulfnews.com/news/uae/environment/sharjah-aims-to-achieve-zero-
waste-to-landfill-1.1423708
Mazumder, L. K. (2016). Restructuring the economy through sustainability initiatives in UAE-a
case study analysis. The Business & Management Review, 7(5), 191.
Ojeda-Benitez, S., de Vega, C. A., & Ramı, M. E. (2003). Characterization and quantification of
household solid wastes in a Mexican city. Resources, Conservation and Recycling, 39(3),
211-222.
Rana, S. (June 25, 2016). Battling the Bins. Emirates Business. Retrieved December 1st, 2016 from
http://emirates-business.ae/battling-the-bins/
Rushton, L. (2003). Health hazards and waste management. British medical bulletin, 68(1), 183-
197.
Selvam, A. and Wong, J. (2016). Waste Management and Sustainability: An Introduction.
Sustainable Solid Waste Management (pp. 1-6). American Society of Civil Engineers.
Shambavi, R. Ipshita, B. (2015). Waste disposal of fresh fruits and vegetables: A study of
consumers’ awareness levels in the United Arab Emirates (The UAE). Management of
Environmental Quality: An International Journal, Vol. 26 Issue: 5, pp.721-
738, https://doi.org/10.1108/MEQ-10-2013-0115
Sil, A. and Kumar, S. (2016). Waste Characteristics and Generation. Sustainable Solid Waste
Management (pp. 7-34). American Society of Civil Engineers. UAE Government. (2018).
Waste-to-energy. Retrieved from https://www.government.ae/en/information-and-
services/environment-and-energy/water-and-energy/energy-/waste-to-energy-
Waste statistics. (2015). Retrieved from
https://www.scad.gov.abudhabi/Release%20Documents/Waste%20Statistic%202015%20
EN.PDF
Federal Ministry for the Environment, Nature Conservation and Nuclear Safety ,waste
management
in Germany. (2018). Retrieved from
https://www.bmu.de/fileadmin/Daten_BMU/Pools/Broschueren/abfallwirtschaft_2018_en
_bf.pdf
Wunsch, C., & Simon, G. (2018). The Reduction of Greenhouse Gas Emissions Through the
Source-Separated Collection of Household Waste in Germany, In R Maletz, Source
separation and recycling: Implementation and benefits for a circular economy, Cham:
Springer International Publishing, pp. 269-287.
Yano, J., & Sakai, S. I. (2016). Waste prevention indicators and their implications from a life cycle
perspective: a review. Journal of Material Cycles and Waste Management, 18(1), 38-56.

ISSN 2708-9525
106
INTERVIEWS WITH KEY INFORMANTS TO EXPLORE
SCHOOL NUTRITION PROGRAMS: A CASE-STUDY IN
DUBAI
Reem S. AlGurg1, Nour H. Abu Mahfouz2, and Farah Otaki3 1Health Policy, 2Public Health, 3Institutional Excellence - Mohammed Bin Rashid
University of Medicine and Health Sciences, Dubai, UAE
Background
School Nutrition Programs (SNPs) are proven to influence school children eating behaviors, which
in turn impacts their intellectual, social, and emotional development, as well as their risk to Non-
Communicable Diseases (NCDs). Many stakeholders are involved in the development,
implementation, and evaluation of SNPs in Dubai, United Arab Emirates (UAE). This study
presents a rare attempt to develop a thorough understanding of stakeholders’ perceptions on SNPs
in Dubai, UAE.
Objective
This study aims at exploring the perceptions of the myriad of stakeholders, positioned at differing
levels of the public health and education ecosystems in the UAE, in relation to SNPs in Dubai,
UAE. Accordingly, this study will enable the development of a better understanding around the
relevant standards and guidelines set in place, and the challenges and opportunities of improvement
in planning for and implementing SNPs.
Methods
As part of this study, 29 semi-structured interviews were carried-out with a selection of Key
Informants, all of whom are directly or indirectly involved in SNPs. The generated data was
analyzed thematically using a Health Systems’ perspective.
Results
The generated data sheds light on the challenges in setting effective SNPs in Dubai. All the data
segments were categorized into the following themes: governance, resources, implementation, and
monitoring and evaluation, school-home coordination, and diversity.

ISSN 2708-9525
107
Conclusion
This study unearthed a deep understanding of the SNPs in Dubai, UAE. Our results emphasize
that all the involved stakeholders, from all the various institutions, should better collaborate and in
turn co-create on the level of the Emirate and also nationally.
Keywords: School Nutrition Programs, Health Policy, Healthy Schools, Dubai.
Introduction
School Nutrition Programs (SNPs) significantly affect school children eating behaviors, and health
and wellbeing1, which in turn impact their intellectual, social, and emotional development. It is
established in the literature that SNPs have a direct relationship with students’ school cognitive
function and academic performance.3 Several international nutrition-based organizations strongly
recommend that schools adapt strong and comprehensive nutritional program, and promote
nutrition education, as well as strengthen school-home-community partnerships, in order to
maximize the positive impact on the general health of a community.2
The effects of SNPs are not limited to the attitudes and behaviors in the school setting. They extend
to their eating habits at home.4 In fact, SNPs are proven to decrease the students’ risk for NCDs.5
SNPs not only affect the school children, but also their families by enhancing mother’s knowledge
on health, nutrition, and child care.6 However, even if these polices are put into place, their effect
on children health and BMI is highly dependent on effective implementation and long-term
sustenance.7
Hence, for any country to reap the benefits of SNPs, it is imperative to develop a better
understanding of the SNPs in place, as well as the enablers and barriers for their proper
implementation. This is of pivotal importance especially in countries where school children
overweight and obesity are epidemic.
To the best of the researchers’ knowledge, no study has been conducted to capture such information
in relation to SNPs in the UAE. Accordingly, this study aims at exploring the perception of
stakeholders, positioned at differing levels of the public health and education ecosystems, in
relation to SNPs in Dubai, UAE.
Methods Context
This study took place at Dubai, UAE. Dubai is the most populated Emirate of the UAE, with close
to three million (a third of the country’s population) inhabitants. According to the Dubai Statistics
Center, in 2017 close to 18% of the population of Dubai were 19 years in age or younger. With the
exception of children in the pre-school age, all of those are in Dubai’s schooling system which
includes 209 private schools and 71 public schools. The distribution of school children in Dubai,
in the Academic Year 2018-2019 were as follows: 280979 student in private schools and 29387
students in public ones.

ISSN 2708-9525
108
In 2017, the prevalence of obesity among UAE in-school children was 13.69% and 13.4% in 2018
as measured by the UAE Ministry of Health and Prevention (MOH). The target of the national
agenda indicator is to reduce this value by 17% (to 12 percent) by the year 2021.
Multiple organizations and authorities in the country are working to achieve this indicator
including: the Ministry of Health and Prevention (MOHAP), Department of Health- Abu Dhabi,
Dubai Health Authority (DHA), Dubai Municipality, and Ministry of Education (MOE). While
each of these entities has its own programs, activities, and strategies, they all acknowledge that the
reduction of school children obesity, and the enhancement of their health and well-being would not
be optimally realized without the proper implementation of SNP.
Anecdotal evidence reveals inconsistencies in the implementation of SNPs in Dubai schools with
no clear information on the enablers and barriers to such implementation. The UAE does not have
a national policy for school nutrition. There are several school nutrition guidelines generated by
differing federal and Emirate level governing bodies: MOE, DHA, Dubai Municipality, MOH, and
Abu Dhabi Health Department. Although all the various entities are working to achieve UAE vision
2021 indicator of reducing the prevalence of childhood obesity, there remain major discrepancies
across the guidelines that are affecting the planning, implementation, and monitoring and
evaluations of SNPs. In Dubai, public schools are following the MOE guidelines, while private
schools are following the DHA and Dubai Municipality guidelines, along with the KHDA
recommendations. Public schools end-up having, more or less, similar programs as they are
centrally managed by the MOE, while plans in private schools are quite varied, and depend on the
curriculum that the respective school offers.
School canteen suppliers must be approved by the MOE and DM. For the public schools in Dubai,
the MOE is responsible of deciding upon the food suppliers. The role of the school is only
supervision, where they only control for the food safety. Private schools, however, have the
freedom to choose their suppliers and then get the approval from Dubai Municipality. Below is a
list of the most prominent initiatives that are taking place in Dubai:
• School canteen standards and guidelines: A guidance manual to improve the nutritional
standard of food served or sold in schools
• Food labelling: Guidelines to ensure that children have access to nutritious, safe, and
wholesome food during their school time
• Happy Schools Initiatives: An award to recognize schools that have made achievements in
supporting the health and wellbeing of students
• Health Awareness Campaigns: Periodic campaigns to boost awareness about healthy eating
among students
• School Nutritional Education Activities: Raise awareness of students about the nutrient
quotient in foods.
Research Design
A qualitative approach to research was adapted. This design enabled the development of an in-
depth insight into the perspective of the participants.

ISSN 2708-9525
109
Sampling
The Principal Investigator identified key stakeholders who are well informed and experienced with
the school nutrition programs in Dubai. A snowball technique was utilized to recruit those
informants. These included leaders and directors from different institutions with clinical and/ or
management backgrounds, decision and policy makers, nutritionists, nurses and nurse managers,
and schools’ principals and vice principals.
Out of 48 key informants who were initially recruited, 29 agreed to participate. Accordingly, semi-
structured interviews were conducted with stakeholders from the following institutions, namely:
Ministry of Health and Prevention (n=5), Ministry of Education (n=3), Dubai Health Authority
(n=6), Dubai Municipality(n=1), Sharjah Education Council (n=4), Prime Minister Office (n=1),
Food Security Office (n=1), Media (n=1), private schools (n=3) and public schools (n=3).
The head of each department, or the person in charge from each institution, received an invitation
letter as an attachment to a personalized email. After two weeks of the invitation, there were two
reminders: the former one was by email. If there was no response, the second reminder was through
a phone call. All those who were interested eventually replied to the email. After that, a mutually
convenient timing with all the key informants was set for the interviews to be carried out. One day
before the interview, a reminder email, with the participant information sheet, was sent to each of
the participants.
In addition, a list of all 209 private schools in Dubai was provided by the Knowledge and Human
Development Authority (KHDA). The target was to interview (n = 3) private schools with different
curriculums. Eleven private schools were randomly selected from the extensive list. Each of the
randomly selected schools was contacted through phone calls to get the email of the school
principal and/ or the involved person in the school nutrition program. Then an invitation email
followed by a reminder in two-week time were sent out. After which each school was visited to
further solicit interest to participate in the study and if possible, arrange a timing for the interview.
Accordingly, representatives of three schools participated in the study, out of a total of eleven
schools who were invited.
Another list of all 71 public schools in Dubai was provided by the Ministry of Education (MOE)
and three schools were randomly selected (one male school, one female school, and one mixed
school). The school principals of the public schools were contacted by the (MOE) to participate in
the study then the interviews were conducted during mutually convenient timings. They accepted
the first invitation with no rejection as they received a letter in advance from the MOE requesting
their participation in the study.
Data Collection
Semi-structured interviews were conducted from January 14, 2019 through April 18, 2019. The
interviews focused on common topics, but with the freedom to pursue additional topics of interest
as they came up. The interviews were anonymous, but the positions of the interviewees were noted.
Before the interviews were conducted, a written informed consent in English, which was also
translated into Arabic language, was obtained from all the participants.

ISSN 2708-9525
110
They were informed about the scope of the study and the overall subject of the questions. The
interviewees were informed that they could leave the interview at any point or request for the
termination of the interview. Interviews started by introducing the title and the phases of the study
and by asking the informants some demographic questions including their position at the institution
and years of experience in the field. Then they were asked to reflect upon: (1) how they are
involved in school nutrition in Dubai, (2) any nutrition plans, policies, or programs in schools that
they are aware of, (3) implementation and evaluation of school nutrition programs, and (4) how
they intervene if needed. All interviews were conducted either in English or Arabic based on the
preference of the participant and were recorded with written consent of the participants. Interviews,
lasted on average 30–60 minutes, were recorded, transcribed, and (if need be) translated.
Data Analysis
First, the twenty-nine audio-recorded interviews were transcribed verbatim. Interviews in Arabic
were translated into English by an assigned Research Assistant. The research team members then
read all the interviews. A myriad of themes surfaced. In carrying out the thematic analysis, the
research team adapted a health systems perspective to analyze the data.
Results
The conceptual framework resulting from this study is composed of five key themes as per the
diagram provided below.
Governance
Among the most prominent challenges, within the Governance theme is the multiplicity of
regulating bodies, where a dietician who works in a regulatory body indicated:
“…the food suppliers are unified for public schools, and this is controlled by the Ministry
of Education. All the private schools, however, are registered under the KHDA…”
Governance
• Multiplicity of governing bodies
• Lack of adherence to Guidelines
• Diffusion of responsibilities
• Lack of a holistic national policy/ Incomprehensive food security framework
• Lack of an accountability scheme
Resources
• Poor quality food offerings
• Limited food offerings to students with chronic diseases
• High pricing of healthy food/ Unaffordable food offerings
• Limited Support Personnel (e.g., designated nutritionists within schools)
Implementation, and Monitoring &
Evaluation
•Lack of clear Monitoring and Evaluation Framework
•Inapplicability of international guidelines to the UAE context
School-Home Coordination
• Uncooperative Parents
• Inconsistency between the school and the home environments
Population Diversity
• Diverse food preferences
• “Pickiness”

ISSN 2708-9525
111
As per a stakeholder in the school health section of a governing body, schools in Dubai need to
abide to multiple guidelines of SNPs, issued by different national governing bodies. This is leading
to a lot of unnecessary confusion.
“…the problem is that there are four guidelines for the school canteens. The Ministry of
Education has its guidelines. The Dubai Health Authority has another one. There are also
guidelines developed and implemented by the Dubai Municipality. The Abu Dhabi Health
Authority also has its own guidelines…basically, in the UAE there is no unified policy
when it comes to SNPs…”
These discrepancies increase with the schools’ lack of adherence to guidelines, where the same
informant highlighted:
“…since the guidelines are not mandatory, they are not implemented by all schools. It is
up to the school’s principal and administration to decide whether, or not, to implement the
guidelines…”
In addition, another manager, who is involved in overseeing the health and wellbeing of students
in private schools, indicated that many of the private schools seem to be operating on an
independent basis:
“…we give them the tools, and we bring speakers and provide open learning opportunities,
but then whether, or not, they put these resources into use is totally up to them…”
Along the same lines, school food quality control officer, working for a regulatory body,
mentioned:
“…some private schools have their own guidelines. Nothing requires them to keep us in
the loop…”
Other challenges are linked to the apparent diffusion of responsibilities in between the various
relevant stakeholders. The abovementioned manager who is concerned with the health and
wellbeing of students in private schools said:
“…it is not part of our mandate. They have to take action if they find any violation in
schools. The Dubai Municipality needs to take action on that front since they are the entity
overseeing the supplying catering companies…”
The same stakeholder highlights that the generated misunderstandings, around roles and
responsibilities, are leading to conflicts in between the relevant stakeholders:
“…at some stage, we used to be engaged in the process of monitoring the performance of
school canteens, but unfortunately, three to four years back, the Ministry of Education
sidelined us…”
The respective informant also highlighted the absence of a concrete accountability framework:
“…our colleagues in Ministry of Education keep telling us that all is on track on their end.
Reality does not show so- not all the food offerings in schools are healthy. This is evident
in the reports provided to us by the school nurses…”
There may be an existing food security framework at a national level, but it is incomprehensive, as
highlighted by a national policy-maker:

ISSN 2708-9525
112
“…we analyzed the national framework which is more than 100 pages. The nutrition aspect
is touched upon, very slightly though…”
Moreover, another dietician who works for a governmental entity, brought-up the fact that there
are no polices, or any sort of accountability framework, for school nutrition at the national level.
There is nothing that requires the commitment of the schools in applying the standards.
“…currently I do not think that there is a policy or law, and most of the practices are mainly decided
by the school itself or the ministry of education…”
Resources
According to a school nurse, who is significantly involved in the National Obesity Prevention
Program, some parents attribute their restricted buy-in to SNPs to the dissatisfactory quality of the
food offered by the school to the students, which sheds light on internal inconsistency, at the
school-level, in relation to this matter.
“…parents continuously complain that the school claims that fostering a healthy lifestyle is
among its priorities. However, the food offerings at the various schools are nowhere close
to that…”
Moreover, some students suffer from chronic morbidities that require special diets. The schools
need to cater to their special needs which is not always possible due to limited resources and
expertise in the subject matter, as highlighted by a manager at a governmental entity, overseeing
the nursing and clinical support services:
“…some students are phenylketonuria patients, and others are intolerant to gluten and/ or
suffer from celiac disease. Those students who have special dietary needs do not know
what to do at school. They do not get food offerings that match their health needs…”
Along the same lines, a stakeholder in the school health section of a governing body emphasized:
“…sometimes healthy food is available but more expensive than the unhealthy food…”
A nutritionist working in a federal governing body indicated that high prices of healthy food are a
challenge not only at the school level but also at the Emirate level, where the companies supplying
the school canteens are profit oriented.
“...some suppliers will refuse to collaborate with the Ministry of Education, because
providing healthy food at regular prices will result in financial loss at their end…”
Moreover, according to a public school registered nurse, the administration of the SNPs is usually
assigned to the existent school nurse. This increases the school nurse workload, and when other
priorities are pressing, the SNPs responsibility ends-up falling through the cracks:
“…of course, it is not enough to have only the school nurse to handle all health-related
aspects because we have huge numbers of students. I already have a lot of important matters
to follow-up on. I do not have the space to follow-up with the students who really need
help in relation to eating attitudes and behaviors, or to conduct awareness campaigns and
in turn evaluate their impact on the respective students. I am really busy; all I end-up doing
in relation to SNPs is giving didactic lectures about healthy food options. That is it…”
ISSN 2708-9525
113
Similarly, another national policy-maker highlighted the importance of having qualified personnel
to sustainably implement guidelines:
“…even when you have the framework or the policy, you still need people to implement it…”
Implementation, and Monitoring and Evaluation
Apparently, according to a school nurse, raising awareness about healthy behaviors, including but
not limited to: nutrition and dietetics, is not mandated on students. Conducting nutrition-related
initiatives, every now and then, is insufficient.
“…the nutrition program is optional. This in of itself is a problem: why would the students
come to the nutrition-related awareness session if it is not mandatory?…”
The a key policy-maker in a federal governing body highlighted that there seems to be no clear
system for monitoring and evaluating the effectiveness of SNPs.
“…there is no evidence that proves that the schools are following the guidelines, or any sort
of explanation of how such a project has impacted the attitudes and/ or behaviors of the
students. There are also no consequences if a violation takes place…”
When it comes to setting the guidelines, it is usually based on international understandings of the
key concept. A manager at a federal governing body indicated that these benchmarks are not
necessarily applicable to the UAE:
“…the new food portion control system is based on international school nutrition
guidelines…some apply British guidelines for food canteens- they are the most applicable,
in my opinion. The Canadian and Australian guidelines are not bad, either. I personally
do not believe that the American guidelines suit this side of the world- the ideal portion
sizes are huge…”
School-Home Coordination
According to a school nurse, who is significantly involved in the National Obesity Prevention
Program, one of the most prominent challenges facing the SNPs in Dubai is the parents’ resistance
to change, and their limited cooperation with the school administration in applying what is learned
by their children about healthy nutrition.
“…while we have developed a special system for obese students, parents seem to have an
active role in students' lack of commitment to the recommended diet…”
Another senior dietician in a governing body, on the level of the emirate, highlighted that this
dissonance is further fostered with the inconsistency between the school and the home
environments. Nurturers at home, be it parents or otherwise, have great impact on the students’
attitudes and behaviors. Their lack of cooperation in regard to SNPs leads to uncalled-for confusion
among students.
“…what is the point of having the child eating healthy in school, and then going home and
eating junk food and unhealthy snacks?...”

ISSN 2708-9525
114
Population Diversity
According to manager who is concerned with the health and wellbeing of students in private
schools, there are people from more than 200 nationalities who are co-existing in Dubai.
Correspondingly, the school children in this city are quite diverse. It is very challenging to come-
up with a selection of healthy food offerings that meets the expectations and preferences of
everyone.
“…when you look at food habits, a lot goes back to the students’ cultural backgrounds…one
size will certainly not fit all- giving an Indian food menu might work for a school that is
dominated by Indians, but will certainly not work for international western schools or with
schools that has mostly Emirati students…”
In addition, according to a senior dietician in a governing body, students are ‘picky’ in their very
nature. The challenge is not only to provide healthy food, but also to provide it in a way that is
attractive enough for the students. Most school students nowadays complain about the lack of
diversity in the type and quality of food items offered.
“…most students complain about the lack of food that they prefer in the canteen…students,
even those who are aware about healthy choices, are still more attracted to unhealthy
food…”
Discussion
The study unveiled the major gaps in the federal and local frameworks that guide the planning and
implementation, and sustenance of SNPs in Dubai. From a system perspective, the lagging quality
and inconsistent outcomes of SNPs seem to be attributed to the firmness of the structure overseeing
and controlling for the SNPs, availability and sufficiency of resources, and the contextualization
of the current SNPs approach. This can be mapped onto the World Health Organization (WHO)
framework that was developed primarily to assist countries to assess the overall performance of
their health systems. The respective framework sets out three intrinsic goals: improving health,
enhancing the responsiveness of the system to the legitimate expectations of the population, and
assuring fairness in financial contribution.
On a governance level, there seems to be a lack of effective collaboration between the various
involved parties. This gap could be attributed to the lack of a unified national level plan. Such
structural fragmentation is not unique to the UAE. In fact, several studies have reported similar
hurdles in implementing SNPs in developing countries (e.g., Rowling & Jeffreys, 2000, Saito et
al., 2014, Tomokawa et al., 2018, 13). According to Shrestha et al., 2019, in response to such
challenges in Nepal, the collaboration between the involved governing bodies was strengthened
through introducing strong leadership that is concerned primarily with enhancing the health and
wellbeing of school students. In addition, a series of meetings among the various involved
stakeholders were conducted, on a national level, to discuss activities and achievements.
To address similar gaps in the oversight of SNPs in Nigeria, the Federal Government launched the
Home-Grown School Feeding and Health Program in September 2005 under the leadership of the
Federal Ministry of Education. The ultimate goal of this program was to provide nutritious meals
during the school day to all public and private primary and secondary educational institutions
across the country. This national program framework was inaugurated on a state and local levels,

ISSN 2708-9525
115
with a state steering committee led by the Ministry of Education (Taylor & Ogbogu, 2016).
Apparently, similar challenges are evident in developed countries, such as: the United States of
America, where the school food environment seems to be governed by a patchwork of federal,
state, and local laws and policies. However, the federal government maintains primary authority
over the school meal programs and has recently issued updated regulations governing the food and
nutrient requirements for meals sold or served through the National School Lunch and School
Breakfast Programs (Budd, Schwarz, Yount & Haire-Joshu, 2012). Along the same lines and , our
recommendations would be for the UAE to develop a single all-encompassing government
structure that oversees the work on the federal and local levels, and public and private sectors. This
structure needs to be characterized by strong leadership and firmly enacted policies and procedures.
This is expected to significantly enhance the collaboration and in turn co-creation on the national
and emirate levels.
Recommendations
- Capacity building of all involved stakeholders
- Enhance school home coordination
- Bulk purchasing of healthy food offering to capitalize on economies of scale
- Incentives for food suppliers
- Curriculum based program (report cards)
- Contextualization
- Adapt approach to the intricacies of the UAE- multi-cultural
- Listening to the voice of students and parents (parent council)
Limitations and future direction
- The generalizability → only Dubai Key Informants → not represent stakeholders from the
whole country.
- Bias → social desirability → the tendency of survey respondents to answer questions in a
manner that will be viewed favorably by others.
- Did not include parents or students as Key Informants.
Ethical Considerations
Ethical approval for the study was obtained from the International Review Board (IRB) at the
Mohammed Bin Rashid University of Medicine and Health Sciences (MBRU), Dubai, UAE.

ISSN 2708-9525
116
References
1. Tuuri G, Zanovec M, Silverman L, Geaghan J, Solmon M, Holston D et al. “Smart Bodies”
school wellness program increased children's knowledge of healthy nutrition practices and self-
efficacy to consume fruit and vegetables. Appetite. 2009;52(2):445-451.
2. Briggs M, Fleischhacker S, Mueller C. Position of the American Dietetic Association, School
Nutrition Association, and Society for Nutrition Education: Comprehensive School Nutrition
Services. Journal of Nutrition Education and Behavior. 2010;42(6):360-371.
3. FIGLIO D. Food for thought: the effects of school accountability plans on school nutrition.
Journal of Public Economics. 2004;.
4. Bevans K, Sanchez B, Teneralli R, Forrest C. Children's Eating Behavior: The Importance of
Nutrition Standards for Foods in Schools. Journal of School Health. 2011;81(7):424-429.
5. Economos C, Hyatt R, Goldberg J, Must A, Naumova E, Collins J et al. A Community
Intervention Reduces BMI z-score in Children: Shape Up Somerville First Year Results*.
Obesity. 2007;15(5):1325-1336.
6. Ghodsi D, Omidvar N, Rashidian A, Raghfar H, Eini-Zinab H, Ebrahimi M. Key Informants’
Perceptions on the Implementation of a National Program for Improving Nutritional Status of
Children in Iran. Food and Nutrition Bulletin. 2016;38(1):78-91.
7. Mâsse L, Naiman D, Naylor P. From policy to practice: implementation of physical activity
and food policies in schools. International Journal of Behavioral Nutrition and Physical
Activity. 2013;10(1):71.
8. 14. Liamputtong P. Qualitative research methods. South Melbourne, Vic.: Oxford University
Press; 2013.
9. Harper C, Steiner R, Brookmeyer K. Using the Social-Ecological Model to Improve Access to
Care for Adolescents and Young Adults. Journal of Adolescent Health. 2018;62(6):641-642.
10. Townsend N, Foster C. Developing and applying a socio-ecological model to the promotion of
healthy eating in the school. Public Health Nutrition. 2011;16(6):1101-1108.

ISSN 2708-9525
117
Importance of research in healthcare quality system
Anwar Alnuaimi,
HBMSU Leaner# 200102355
Abstract
This research proposal intends to explore the importance of research in healthcare quality system from different
perspectives. The goal of this research is to shed the light on different areas that wouldn’t be possible without research
in healthcare quality system, and that advances of quality system have led to significant improvements in healthcare
and management of quality. This has been informed largely by empirical and theoretical ideas found in the fields of
literature and case studies. However, a parallel and at a time, importance of research haven’t received big attention
in fields of ergonomics, and healthcare organizations focusing on quality and tools with minimum consideration of the
role research plays in modification and application of these tools.
This research will be helpful to deliver an overview on how quality tools developed over recent decades, and that
different phases have improved through research, different quality tools and mostly effective ones are based on
research and gives researcher the opportunity to implement them wisely using research techniques and qualitative
methods. Moreover, the objective of proposing this research is to unveils the fact that research attempts to improve
quality in healthcare system through activities carried out by health system or an organization to improve and enhance
the outcomes, and that many of these activities are approached through collaboration and interaction between different
parties and stakeholders, to understand healthcare quality system better and know the needs and expectation of each.
To communicate theories and find out more about importance of research, this project will interview experts in the
field of quality and healthcare system. It’s expected to find that research supports quality tools in different aspects,
and that there will be a positive impact on investing in research in healthcare quality system, and that a better
understanding of healthcare system could be approached through interaction and communication between different
stakeholders.
Introduction
Recently the concept of quality in health care has gained big attention, the concept is complex and
multidimensional, and some of the questions can’t be answered through traditional practices
,therefore research in health care quality raised to answer many of the questions and defines
concepts in this complex system (Pope, 2002).According to (Margolis et al. 2009) the goals behind
research in healthcare quality are, to recognize major effective ways to deliver, finance, manage
high quality care, improve patient safety and experience, and to reduce medical errors. There are
many contributions in health care quality and services, and research remains the most important
contribution among all, because of its ability to identify and describe gaps in healthcare (Margolis
et al. 2009). According to (Taylor et al. 2013), optimizing delivery in safety and quality of
healthcare remains an international challenge.
The proposed research intends to address the importance of research in healthcare quality system,
the concept is taken from different perspectives. Looking at different articles related to the
development of quality in healthcare through research, describing how some tools in healthcare
quality depends on research, how research attempts to improve quality in health care, and going
deep in the feature of collaboration in research and its role in providing a better understanding of

ISSN 2708-9525
118
healthcare quality. Addressing the importance of research in healthcare quality system assumed to
raise awareness of how this could impact healthcare system in general in UAE and in particular at
any health organization. This research will be conducted based on literature reviews and exploring
the founded facts through qualitative methods.
Literature review
To acknowledge the importance of research in health care quality, there was a need to explore
different resources and look closely into issues related to the topic. Many authors have discussed
and examined critical topics in the field of research related to healthcare quality. The paper is
shedding the light on four topics as follows:
1. Development of quality in healthcare through research
Over the past few decades issue of health care quality has evolved, and brought up in different
phases. Recently, the issue received great focus from researchers, and this have led to better
understanding, especially for decision makers among clinicians and managers, who requires
awareness of continuous change of the system in healthcare to ensure better quality, care, and
services for patients.
Clinical risk and patient safety become major international priority in early 2000s (Waring et al.
2016). Two parallel paths followed by research and practice in healthcare, 1st path have pictured
the understanding of quality and safety through medical science, human factors, social psychology
and safety science.2nd path have included an understanding of sociological informed work with an
explicit focus on quality and safety through sociology of illness and health, classic concerns,
knowledge and expertise, organizational culture and other social related issues (Waring et al. 2016).
Kieran, pictured quality improvement and research as complex social interventions that includes
levels of high variance in content, context and application (Walshe, 2007).
Safety and quality researches started by examining relationships between active errors and latent
factors, this have given the medical profession an opportunity to promote quality and safety as
policy and practice priority (Waring et al.2016). Research and research on healthcare became more
sophisticated which required a clear agenda and framework, Research road map has been described
in 3 phases, detection, understanding, and reducing. In detection researchers considers specific
selection of disparities or vulnerable groups, in understanding they go in depth to find more about
the root causes of disparities, finally by creating and implementing interventions to reduce and stop
disparities (Kilbourne et al. 2006).
Moreover, evaluation based on theory driven data attempts to draw the program theory depends on
the intervention followed by research evaluation to test the theory (Walshe, 2007). Evidence-based
Practice Center (EPC) program also designed to offer best evidence for decision makers in health
care quality through a wide variety of stakeholders, some of the lessons learned through such
programs in health care quality to be more effective are, the correct identification of the right target
for evidence, the definition of scope and questions of a review, including both flexibility and
consistency in methods, defining inclusion and exclusion criteria, and involving experts in the field
(Atkins, 2005).

ISSN 2708-9525
119
2. Research based tools in healthcare quality
There are a good number of quality tools that’s considered to be research based in nature, because
of the activities it includes through the steps and measurements. These tools are helpful in
prioritizing safety and quality problems and focusing on systems not individuals, through
observation of structures, process and outcomes (Atkins, 2005). The reason behind the
measurement of quality enhancement is the firm belief that good performance results in better
quality, and comparison of performances among different providers and organizations, encourage
better performance (Waring et al. 2016).
Quality improvement (QI) projects are considered research if the intervention tested includes a
deviation from initiated practices, subjects are individual patients, blinding or randomization is
conducted, moreover, part of the activity should include data collection from large data sets, change
protocols frequently (Varkey et al. 2007). Quality projects distinguishes whether efforts of
improvements have led to change in the end point in the desired direction, contributed to unplanned
results in the system, extra efforts needed to adjust a process, which leads to pursuing ideas that
work and discarding poor ideas (Varkey et al. 2007). Some of research-based tools in healthcare
quality are PDSA, Six sigma, lean, MUISQ and Delphi model.
The most commonly tool used for rapid improvement in healthcare quality is the PDSA cycle, it
involves trials and learning approaches where suggested solution or hypothesis is made for testing
the improvement, changes carried out in a small scale before big changes being applied to the
whole system (Taylor et al. 2013). PDSA could stand alone, or in some cases become the initial
tool for other QI approaches. Six sigma is a business strategy that aims to minimize or eliminate
waste, this can be achieved by improving, designing and monitoring process (Varkey et al. 2007).
Lean focuses on the identification of customer needs and works on eliminating non-value-added
activities to improve the process (Pope, 2002). Another interesting model is the model for
understanding success in quality (MUSIQ), which is used to optimize and understand contextual
factors affecting success of quality improvement projects, researchers and organizations uses this
model (Kaplan et al. 2011). In the Delphi technique, series of questionnaires and rounds are carried
out in a structured process to gather information, and this technique has been used for setting
quality indicators (Boulkedid et al. 2011). All these tools and techniques wouldn’t be carried out
without the assistance of research at some steps and activities.
3. Research attempts to improve quality in healthcare
As described earlier, there are many tools in health care quality that are based on research, or
includes research as part of some of its activities. Apart from tools and models, research in general
attempts to improve quality in healthcare through different approaches such as, quality programs,
translational research, organizational or case study research, and quality improvement research.
Quality programs are defined as managed activities carried out by a health system, or an
organization to prove and enhance the quality of healthcare. Such programs are meant to cover
interventions and are more complex than a project of a single team (Ovretveit, 2003). Two
problems faced by quality programs are, the difficulty of evaluation large scale programs that

ISSN 2708-9525
120
doesn’t start and finish the same time, and the multiple criteria of program success. Different
research designs are described such as descriptive case design, audit design, and retrospective
design. The suitable design depends much on the type of quality program participants of research
and examined questions. By paying attention to common failures (Pre-study theory, outcome
assessment, Outcome attribution, Explanation and Measurement variability) of previous
researchers, research into quality programs could be improved (Ovretveit, 2003).
Translational research attempts to improve the quality of health care by promoting action and
change in the real world. This research can enhance health care if the principles of the community-
based research were applied. Principles of participatory research are, being engaged in all phases
of research, having goals and resources ready in the community, investment in robust and long
term partnerships, and engaging research as a cyclical process (Schmittdiel, Grumbach, & Selby,
2010).
Policy makers and researchers find it very challenging to improve implementation of effective
practices in healthcare, case studies and organizational research, provides ways to understand the
organization role and microsystem to improve care and aids in the development of theories (Baker,
2011).
Whereas quality improvement research includes 2 types of studies, 1st one explores interventions
to redesign delivery of care and evaluate intervention, 2nd studies focuses on evaluation of the
efficacy of QI methods. Many benefits could be obtained from research in healthcare quality
improvements (Margolis et al. 2009).
4. Interaction leads to a better understanding of healthcare quality
Recently, collaboration in healthcare delivery has gained big interest and attention under well-
managed care, for different reasons. The most internal valid design for testing the link between
interprofessional collaborative is the field experimental/control groups (consists of random patients
to control condition or interprofessional team), this design distributes factors affecting patient
outcomes between control groups and intervention (Schmitt, 2001).
Research is considered embedded when the researcher is part of a team that use and generate
research results, it aims in creating good collaboration between researcher and end users. Through
collaboration, many challenges can be defined and addressed which could be used further for
quality improvement (Vindrola-Padros et al. 2016). This could be approached through focusing on
organizational cultures and having participation of individuals from different levels, these findings
are translated into practices in the later stage. Another similar research in concept is the community
based participatory research (CPBR), which ensures an equal partnership and offers sharing of
power, recourses and knowledge between research participants and investigators at all stages of
research and application (Schmittdiel, Grumbach, & Selby, 2010). CBPR leads to rigid findings
that are more useful and practical to community needs. Both embedded and CPBR leads to easier
incorporation into practice changes.

ISSN 2708-9525
121
Much of interactions in research methodologies are brought up by qualitative research. It provides
useful ways of answering research questions which can stand alone or as supportive for further
quantitative studies (Schmitt, 2001). Qualitative methods include organization, a systematic
collection of data, and analysis of texts derived from observation or talk (Pope, 2002). Its main
benefits reside in having close and true experience of participants and end users, this perspective
found in social sciences and humanities, and is very useful to understand complex issues in
healthcare quality (Pope, 2002).
Methodology
Research purposes differs according to the topic and nature of issues discussed. According to
Eriksson & Wiedersheim-Paul (2001), research purpose is to state what’s to be conducted and how
to use results. Moreover, Yin (2003), mentioned that research can be exploratory, explanatory or
descriptive, it also possible that one research has different purposes.
According to Saunders, Lewis & Thornhill (2000), exploratory researches are very crucial in
finding what’s really happening, to ask questions, to look for new insights and evaluate phenomena
in a new way, it’s also useful for authors trying to clarify the understanding of a particular problem.
Three ways could be used in conducting such research, through literature , interviewing experts or
people dealing with issue, and having focus group interviews. This research depends on literature
and interviews.
Among the two categories that any study can be divided to, qualitative and quantitative, this
research is based on qualitative methods. As it involves description of the opportunity to know
more about importance of research in healthcare quality system, in a way that’s very close to reality.
According to Saunders, Lewis & Thornhill (2000), qualitative research draws a clear conclusion
of a research that depends on no quantifiable data, like values, attitudes and perceptions, which
considered very important elements when talking about healthcare quality and importance of
research. Qualitative data in nature has an implication on both its collection and analysis. Purpose
behind choosing qualitative methods is to have a better understanding and rich information about
the importance of research in healthcare quality system therefore, data can’t be collected in
standardized way like quantitate data.
In qualitative research, data gathered to have deep understanding, to describe situations in a better
way from different perspectives, where research problem being investigated. Interpretation and
analysis of data carried out in a way that’s impossible to quantify, as they are based on meaning
described by words and expressions. According to Holme and Solvang (1997), there’s a close
relation between respondents and source of information in qualitative approach and it intends to
capture attitudes, values, and different perceptions matters in the investigated area. Therefore, this
approach is best to understand and achieve a full understanding and wider overview of the
importance of research in healthcare quality system. And looking at the purpose and research
questions, as well as discussion in literature, qualitative approach considered in this research to
gain a deep understanding of the strong relation between research and quality. There’s no intention
to generalize the concept of research importance in healthcare but to look closely into quality and
research, to fulfill the desire of having a clear idea and a better overview.

ISSN 2708-9525
122
As indicated earlier, this research based on literature reviews including case studies and qualitative
approach to understand more and interpret the data collected in the literature, implementation of
this strategy carried out in two stages, finding data then conducting interviews. According to Yin
(1994), one or more case studies could be investigated, and the more case studies and literature
investigate the better understanding of topic will be obtained, as it delivers the reader to more
convincing situation and solid views.
The sample for proposed research will include two participants, who deals with quality in
healthcare system and research. Each interview consists of 6 questions.1st question explores the
features of research that attracts healthcare mostly, 2nd question aims to find how research supports
application of healthcare quality tools, 3rd questions investigates the ways considered in bridging
the gap between units lack research and central department of quality in healthcare organization,
4th question digs deep to find out the impacts of investing in research in healthcare quality system,
5th question communicates the human nature of interaction and communication and its role in
understanding and enhancing the quality system to serve stakeholders at its best way, last question
looks into areas that experts in quality would like research to cover in future studies.
Starting with secondary data collection and interpreting data using primary data collection form
interviews. Facts and views could be collected in different ways such as, archival records,
documents, interviews, participant observation, physical artifacts, interviews, direct observation
and there’s no source have shown an advantage over the other (Yin, 2003). Data proposed to be
collected from two separate interviews with, director of clinical quality and health care
accreditation department, and with an expert from a health organization.
Expected Findings
According to (Baker, 2011), useful methods could be found through research for facilitating,
identifying and impending improvements. Despite the fact that both qualitative and quantitative
research are important, based on previous studies it’s expected to find that from quality point of
view, qualitative research is more important especially with topics related to investigation of a
phenomena with an impact outcome. Moreover, healthcare depends on human factors therefore
qualitative research would answer why and how questions.
Research supports quality tools in different aspects, when using any of the useful tools like root
cause analysis, failure mood effect diagram, scatter diagram etc., such feature pretends that all these
tools gives research an opportunity to link data together, highlight hot topics, and helps understand
and present data in a better way. Moreover, usage of different quality tools purposes either for
analysis or presentation are supported by research.
There’s always positive impact on investing on research in general, accordingly in healthcare
quality systems research expected to have equivalent impact if not more actually, as this feature let
the organization gain a better reputation among other similar organizations, it impacts staff working
in that organization as it improves their confidence and keep them updated. On the other hand, and
speaking about quality tools in particular, research would help reduce harm and risk associated
with poor quality practices, reduce cost by improving quality of care and improve patient
experience.

ISSN 2708-9525
123
Interaction and collaboration between different entities and individuals leads to a better
understating of healthcare system thus, improves the quality and that’s because the outcomes of
this action in health care quality system, engaging parties and stakeholders who are part of the
process would bring the issue from different perspectives and enhance the ideas discussed which
in return improve the quality of care.
Research lacks topics related to patient safety therefore, it’s expected to have recommendations on
covering more topics related and leads to patient safety such as encourage staff more to report
errors, role of leadership, and ways to measure actions taken and its effectiveness.
Conclusion
The wheel of quality in healthcare system is accelerating everyday due to many environmental and
scientific changes, and research is considered one of the most powerful tools to catch up such
changes and grasp many concepts in the field to enable health care workers to propose different
techniques in quality that matches the changes. Moreover, research opens doors to new era of many
other practices in healthcare quality that has been done or under process and this gives an overview
of the situation at larger scale. This in returns gives a great opportunity to overcome many barriers
and challenges in healthcare.
Quality tools main purpose is to consider safety of patients and quality of services provided,
therefore, it needs to consider the system complexities, where more of improvement actions and
plans are introduced. Programs of healthcare quality improvement are also very complex social
interventions, such programs can be evaluated only if their content, interconnected context,
applications and outcomes are understood (Walshe, 2007). Conducting research at different levels
in healthcare quality have made it possible for many healthcare providers and researcher to define
many areas in the field of healthcare quality.
Through research and experiences, the concept of quality of health care and improvement evolved,
it became an international priority in 2000s. Many of the tools used to measure quality in healthcare
are based on research, such as PDSA, Six sigma, lean, MUISQ and Delphi model. Research in
general, attempts to improve quality through different studies, either by exploring interventions, or
evaluating the efficacy of quality improvement methods. Among all activities in research and its
importance to health care quality, interaction and collaboration between different parties in
research, leads to a better understanding of healthcare quality.

ISSN 2708-9525
124
References
1- Atkins, D. (2005). Better Information for Better Health Care: The Evidence-based
Practice Center Program and the Agency for Healthcare Research and Quality. Annals
of Internal Medicine, 142(12_Part_2), 1035. doi: 10.7326/0003-4819-142-12_part_2-
200506211-00002
2- Baker, G. R. (2011). The contribution of case study research to knowledge of how to
improve quality of care. BMJ Quality & Safety, 20(Suppl 1), i30–i35. doi:
10.1136/bmjqs.2010.046490
3- Boulkedid, R., Abdoul, H., Loustau, M., Sibony, O., & Alberti, C. (2011). Using and
Reporting the Delphi Method for Selecting Healthcare Quality Indicators: A Systematic
Review. PLoS ONE, 6(6). doi: 10.1371/journal.pone.0020476
4- Eriksson, L. T., & Wiedersheim-Paul, F. (2011). Att utreda forska och rapportera (9.
uppl.). Malmö: Liber
5- Hammarberg, K., Kirkman, M., & de Lacey, S. (2016). Qualitative research methods:
when to use them and how to judge them. Human Reproduction, 31(3), 498-501. doi:
10.1093/humrep/dev334
6- Holme, I. M., Solvang, B. K., & Nilsson, B. (1997). Forskningsmetodik: om kvalitativa
och kvantitativa metoder. Studentlitteratur.
7- Kaplan, H. C., Provost, L. P., Froehle, C. M., & Margolis, P. A. (2011). The Model for
Understanding Success in Quality (MUSIQ): building a theory of context in healthcare
quality improvement. BMJ Quality & Safety, 21(1), 13–20. doi: 10.1136/bmjqs-2011-
000010
8- Kilbourne, A. M., Switzer, G., Hyman, K., Crowley-Matoka, M., & Fine, M. J. (2006).
Advancing Health Disparities Research Within the Health Care System: A Conceptual
Framework. American Journal of Public Health, 96(12), 2113–2121. doi:
10.2105/ajph.2005.077628
9- Margolis, P., Provost, L. P., Schoettker, P. J., & Britto, M. T. (2009). Quality
Improvement, Clinical Research, and Quality Improvement Research—Opportunities
for Integration. Pediatric Clinics of North America, 56(4), 831–841. doi:
10.1016/j.pcl.2009.05.008
10- Ovretveit, J. (2003). Improving the quality of health care: Using research to inform
quality programmes. Bmj, 326(7392), 759–761. doi: 10.1136/bmj.326.7392.759
11- Pope, C. (2002). Qualitative methods in research on healthcare quality. Quality and
Safety in Health Care, 11(2), 148–152. doi: 10.1136/qhc.11.2.148

ISSN 2708-9525
125
12- Saunders, M. L., & Lewis, P. (2000). P. and Thornhill, A.(2009), Research Methods for
Business Students. Financial Times Prentice Hall Inc., London.
13- Schmitt, M. H. (2001). Collaboration improves the quality of care: methodological
challenges and evidence from US health care research. Journal of Interprofessional
Care, 15(1), 47–66. doi: 10.1080/13561820020022873
14- Schmittdiel, J. A., Grumbach, K., & Selby, J. V. (2010). System-Based Participatory
Research in Health Care: An Approach for Sustainable Translational Research and
Quality Improvement. The Annals of Family Medicine, 8(3), 256–259. doi:
10.1370/afm.1117
15- Taylor, M., McNicholas, C., Nicolay, C., Darzi, A., Bell, D., & Reed, J. (2013).
Systematic review of the application of the plan–do–study–act method to improve
quality in healthcare. BMJ Quality & Safety, 23(4), 290-298. doi: 10.1136/bmjqs-2013-
001862
16- Varkey, P., Reller, M., & Resar, R. (2007). Basics of Quality Improvement in Health
Care. Mayo Clinic Proceedings, 82(6), 735-739. doi: 10.4065/82.6.735
17- Vindrola-Padros, C., Pape, T., Utley, M., & Fulop, N. J. (2016). The role of embedded
research in quality improvement: a narrative review. BMJ Quality & Safety, 26(1), 70–
80. doi: 10.1136/bmjqs-2015-004877
18- Walshe, K. (2007). Understanding what works—and why—in quality improvement:
the need for theory-driven evaluation. International Journal for Quality in Health
Care, 19(2), 57–59. doi: 10.1093/intqhc/mzm004
19- Waring, J., Allen, D., Braithwaite, J., & Sandall, J. (2016). Healthcare Quality and
Safety: A Review of Policy, Practice and Research. The Sociology of Healthcare Safety
and Quality, 18–35. doi: 10.1002/9781119276371.ch2
20- Yin, R. K. (1994). Case study research: Design and methods. sl: Thousand Oaks.
21- Yin, R. K. (2003). Case study research: Design and methods. sl: Thousand Oaks.
ISSN 2708-9525
126
Change Management – In the case of a fictional merger
Hamda Al-Awadhi,
HBMSU Learner# 200107122
Abstract
The case study lists the common guidelines for managing change due to a merger between company X, a traditional
and long existing company with company Y, a new established modern company. Those Guidelines can be used to any
type of change and shall be customized by the top management as they see fit for their company. To manage such
change successfully the essence of the change management always requires management to shed focus on the people
involved with a clear direction in mind. The paper discussed the three main steps and their sub categories to guide the
change based on both Lewin’s and Kotter’s change models supported by other research. They are: the pre change
implementation, During the change implementation and post implementation. The pre change implementation includes
defining and listing the reasons that forced the change like cost reduction, re-structuring and modernizing. Then comes
Defining and addressing the possible impact of change on all stakeholders like investors, customers and most
importantly employees. Finally communicating the change properly. Once the initial step has been established, the
actual implementation takes place. It includes; creating an urgency, forming the guiding forces in both organizations,
developing a vision and a strategy, communicating the vision, removing the obstacles and resistance, creating short
term wins and consolidating gain. The final step is post change implementation; the results of the change
implementation are sustained by anchoring the change in the corporate culture and making it part of their habits. The
main point of combining the two change management models is to ensure the success of the change implemented. It
does so by focusing on the human aspects that need to be addressed and taken care of in order for employees to
participate voluntarily in the change process.
The change management for the merger is approached in three main ways; Pre – Change implementation, Change
implementation, and Post- Change implementation. This method is following Lewin’s change model, unfreeze, change
and refreeze (Levasseur, 2001).
Pre-Change Implementation
When a change is about to take place in any company, it is a good idea to prepare. Since the merger
is a planned change between the two companies, below are the main steps to help prepare before
the actual change implementation process takes place.
Define reasons that forced the change and list them
People like to keep their routines and stick to what is familiar to them. They can accept the change
better when there is a valid reason or an incentive for it (Vine, 2016). Therefore, a list of all the
reasons that drove the two companies to merge rather than stay independent, should be prepared
and presented to all the stakeholders. Based on research, the main drivers for change are the
following;
ISSN 2708-9525
127
Cost Reduction
The top management must have a financial consultant finding in the cost benefit analysis as well
as the financial auditor’s report as a proof for stakeholders of the financial crisis that caused the
two companies to merge. This way stakeholders will understand that the risks of not changing the
current situation is more than the risk of changing. In a study conducted by Postema, Goppelsroeder
and Bergeijk (2006), The benefits of the merger are addressed, and was only considered valid when
the benefits outweighed the costs.
Re-Structuring is needed
Both companies might have the need to re-structure their company in order to help with optimizing
their operations and have the rightsizing for the companies. Explain to the employees how a merger
will be a solution to give them an opportunity to find their proper place in the new re- structured
company. Whereas if no restructuring took place, a lot of the benefits and jobs would have been
lost due to the financial issues. having a re-structure blue print can help employees in finding an
incentive to accept the change by finding the new place they fit in.
Modernizing
For the stakeholders in company X, they need to know that their ways were too traditional for the
current market. Modernizing their company in the new merger is going to help them get the
competitive advantage in the market. This is a valid reason for them to accept the change and try a
new way of doing things. Changing the organization is a way to renew and modernize the company
and by doing so, it gives it the potential of competitive advantage (Kawechi, 2018).
Define and address possible impacts of change on all stake holders
Before the change actually takes place, all the stakeholders impacted by the change must be
identified and the impacts has to be addressed. The details of the stakeholders and their impacts are
listed below:
Investors and shareholders
Investors are the people responsible for putting money in the company in order to gain future profit
(Dictionary.cambridge.org, n.d.). Therefore, the financial status of the company is essential to
them. The same goes for the shareholders since both companies are public and people own shares
in the company. The change of a merger will have an effect on them and they will resist the idea
of a merger. To prevent this, it is important to understand that this resistance is driven by fear and
uncertainty as research shows that the failure rate is higher than 60% (Akrofi, 2016). Their fear
needs to be addressed, use the annual financial statement of how the companies’ stocks were below
market price and a study of how the stocks of the merged company will be higher (Sachdeva, Sinha
and Sinha, 2015) and they will not be losing their invested money. Based on the Auditor’s reports,
explain how none of the companies would have survived their financial troubles without the
merger. And how their financial support and the right management will help in improving the odds
of their success in the merger.

ISSN 2708-9525
128
Suppliers
Suppliers for both companies will also be affected by the merger. Each company had different
suppliers in which they did business with. This merger will impact the normal business operations.
Therefore, it is important to take this as an opportunity to create new businesses. Do a study all the
suppliers for both companies, and find the best of them in order to continue doing business with
them. From the start be clear with the suppliers, prepare a new contact for the ones you will
continue business with to ensure a smooth start for the merger and keep the supplier happy. As for
the ones who will lose their business, make sure to adhere to the conditions of the contact between
them and the company prior to the merger to.
Customers
Two companies have different customers. The merger will have an impact on all the customers,
closure of branches, or their re- location will affect them. The merger can also affect the customer
prices, service received and (Investopedia, 2015). to address those effects and minimize their
impact, the top management shall decide early on the branches that will be kept and which ones
will be closed. This decision must be taken by accounting for the customer’s needs by conducting
surveys in order for the customers to feel that they have a voice in the matter. Customer service
departments must contact them to assure them that the change will not affect the quality and service
and if anything happened it will only be to the better. A proof has to be presented to the customers;
an example of proof will for the new company to have an ISO 10002 certification which focuses
on customer satisfaction (Bsigroup.com, n.d.).
Employees
The merger is a transformational change that impacts all the employees in the company from the
top management to the assistants. The CEO of each company is facing an anxiety knowing that
one of them will lose the position of a CEO. This can lead to unclear decisions regarding the merger
due to the power struggle. The employees are facing the biggest change impact due to the merger
which is the Layoff dilemma and losing a sense of identity and belonging. This Causes the
employees to resist the change and disturb the process. The way to address those impacts is first,
to have the board of directors for both companies to have a meeting to set the criteria and skills
needed in the new CEO.
The CEO has to be chosen prior to the change implementation to remove the anxiety and the power
struggle (Feinberg, 2019). As well as to set a role model for employees about the readiness of the
top to embrace the change. Another thing to be decided on is the name of the new company. While
it might seem like a simple thing, the name of the company represents the place of belonging to the
employees. According to a research done by Mase on the impact of name change on company
value, the company name acts as an identity to employees and has an effect on shareholder,
customers when it comes to stocks. (2009) This is why it is better to keep the old names in some
way, a familiar name to the employees help employees keep their sense of identity. When it comes
to the layoff dilemma, it is important to be honest about it, but with a planned method to minimize
the negative effects (Smeltzer and Zener, 1994).

ISSN 2708-9525
129
Do not layoff all the selected employees at once, first let go only the ones that no longer add value
to the company. Second, select a group that will stay with a decrease in hours and salary as long as
they are useful. Make sure that all of this is according to the contract and the help of a councilor to
ease the of change on them through planned sessions (Minor, 2010). This way the resistance at the
implementation phase will be reduce, which will be discussed more in the next section of the report.
(removing obstacles).
Communicate the change
In order for the pre-change implementation phase to go smoothly, the communication has to be
proper. As soon as the companies agree on the idea to merge, all the stakeholders are to be
informed. As the rumors tend to spread and reach the people easily which will only make their
acceptance of the change harder and affect their trust and loyalty (DesRochers, 2019). To deal with
this, both companies shall have a meeting to address the change impacts mentioned above before
those impacts affect the implementation process. I suggest that first the CEOs are informed, then
the investors and employees. After that make sure to share the new externally, meaning with the
suppliers and shareholders. Only when those steps are done the next phase can start.
Change Implementation process
When it comes to the change implementation, the Kotter model of change is suitable for the merger.
This model includes 8 steps to guide the implementation, in my opinion following those steps
include the critical success factors for the change implementation. Below are the Kottor change
model steps to be followed and how they can be achieved.
Creating an urgency
After the unfreeze phase takes place, and the change impacts are identified. The SWOT analysis
should be conducted to identify the threats and opportunities formally for the new merged
company. This strategic tool helps minimize the risks and gives a better chance for success
(Jurevicius, 2013). This step should be the first in the implementation to make people understand
and act on the reasons for the merger as well as to evaluate the situation.
Forming Power Guiding Coalitions
The guiding force is the most critical key for the merger to succeed. After the CEO is chosen in the
unfreeze phase, he and the top management must start Finding the right leaders from both
companies to lead the change. Having the right leadership is crucial in order to have someone to
set the change vision, define the path through the merger, communicate what is needed effectively,
remove the obstacles to change and provide consistency. The first step is to identify the style of
leadership required. Since this is a merger, both the task emphasis and the people emphasis should
be highly focused on.
ISSN 2708-9525
130
Therefore, the Democratic leadership style can be applied. This supportive leading style is
important to keep the communication open and make people on all levels feel involved (Saleem,
Batool and Khattak, 2017). It is also important to focus on the organizational leadership
characteristics as well as the personal characteristics. The first one requires that the leaders are:
future oriented, supported and have resources from the top management, and always needed for a
change process (Jick and Peiperl, 2011).
The second is the personal traits required to lead the change which can include the leaders to have;
good communication skills, motivational skills, commitment for the change, quick to respond in
situations, and empowering. Having emotional intelligence is a great trait for the leader to poses as
it helps in the psychological part of the change implementation in order to know how to address
people’s feelings properly (Yadav and Lata, 2019). The Ability to be decisive in the change process
is critical, as the clear decisions help in avoiding the confusion and rumors (MTD Training, 2018)
Not everyone poses the leadership traits or has the ability to lead the change. The competency of
the leaders must be identified by using the available official tests held by different organizations.
From my experience, I suggest using the following leadership assessment tools DSIC test with the
Belbin test, to know the leader’s personality.
DISC is used to evaluate the dominance, influence, steadiness and conscientiousness
(DiSCProfile.com, n.d.) The change responsibility is not limited to the leaders chosen, it is a shared
responsibility with the different people. Two change sponsors must be identified in each of the
companies in order to supervise the whole change process. Then the change managers are
identified, their task is to act as a role model throughout the change process based on their expertise.
Since the merger is critical, it is a good idea for the change managers to be hired from outside the
two companies to avoid bias. The change agents should be chosen from the middle management
and employees in the two companies to help implement the merger, enforce the change, and report
its progress (Jick and Peiperl, 2011). In my opinion, the change agents must be chosen based on
their previous reviews or based on a personality test held by professionals in order to choose right.
The change managers shall have the technical knowledge and the social support (Hammer, 2017).
The change champions should also be chosen based on their personalities, specifically their
enthusiasm and ability to accept change. The change champions must be placed in each department
to act on their supporting role for the other employees. The champion who helps the organization
positively should be rewarded in a way that is decided by the top management. Finally, the change
teams have to be formed. The change teams are at the core of the change implementation. The
teams are formed from each concerning department re-structured after the merger from both
companies to come up with the new common ground for the technical operation. The teams must
be functional and is formed from members with different expertise in order to succeed with their
responsibility According to Rod and Fridjhon (2016), an intelligent team is aware that refusing to
change only results in failure. In my opinion it will effective if the teams are formed voluntarily by
the employees with the supervision and approval from the top management to ensure effectiveness.

ISSN 2708-9525
131
Developing a vision and a strategy
This is the third step of kotter’s change model and falls under the responsibility of the merged
company’s leadership. In this step the leaders have to first form a change vision. This change vision
has to align with the vision of the new merged company. The vision has also to be clear, realistic
and achievable. The main purpose of the vision is to guide the change implementation by knowing
where the company is headed and desires to achieve without confusion (Doseck, 2015). The
company’s core values have to be defined with the vision in order to help create the new identity
for the company. The change strategy is the plan of how the change vision will be implemented.
There are four basic change management strategies that are used as needed depending on the level
of resistance, target population, the stakes, the time frame and dependency on its people. Since it
is two different companies merging, the change strategy has the address their differences. Company
X was a traditional one, therefore the suitable strategies will be the Normative-Re educative and
the Power Coercive. The first one will be done by creating new strong identity for them to commit
to through the new values and norms. The second one will be through having a change manager
with a strong authority figure to impose the change. As for Company Y, it was a modern company
and the strategy for it includes the Empirical Rational and the Environmental-Adaptive. The first
one is achieved by proper communication and incentive. I.e. the merged company must offer
personalized benefits of helping with the change. The later can be achieved by giving the
employees a chance to adapt to the news before the actual transfer. Since the merger is for a large
population of more than 500 people and more than 50 branches and has high stakes for it to succeed
in a limited time. It is suitable that all the four strategies are combined and used for the new
company.
Communicating the vision
This is the fourth step of the model and an essential one for the success of the change. However,
the communication is not limited only to the implementation. It is the link that holds all the phases
together and allows for their achievement. It offers all the stake holders a way to stay updated and
assured. An effective commination system has to be established by the top management. A
suggestion is that the first step for the company is to get a psychological expert who can help chose
the write words to be spoken to ease the people’s fears and un certainty as well as to keep the
message clear. The second step is done at the beginning phase, a face to face meetings shall be held
with the top management and the stakeholders in order to have an interactive way to address the
concerns without delay. The third step is to develop an internal communication system to share the
updates about the change process. The fourth step is to designate a small team to deliver people’s
ideas, needs and concerns to the top management and make sure that the communication goes both
ways properly.
A study by villa, Gonçalves and Villy Odong (2017) have shown that a two-ways communication
help make people more involved and eases their concerns. The timing of the communication and
the frequency is also critical and must be decided upon by the top management as they see fit. In
my opinion, the frequency can be weekly on Sunday morning. In order for people to have the full
week to respond to the update received.

ISSN 2708-9525
132
Removing obstacles
The fifth step of the model and also a critical success factor of the change. It is important to realize
that with a huge change like a merger, it is natural to face different obstacles when it comes to
people. The Resistance to the change defensive retreat will be their natural psychological reaction
according to the second step in the change stages (Castillo, Fernandez and Sallan, 2018). The
management has to deal with the resistant employees differently. Since the merge will contain older
traditional employees who are set in their ways, and contain modern young employees who are
more change tolerant.
The first way to remove the obstacle of resistance is to have leaders and managers who understand
the reasons behind the resistance and try to approach them by proper open communication (Villa,
Gonçalves and Villy Odong, 2017). The second way is to be patient, as most changes take time and
effort from everyone. The third is to allow the employees to express their natural emotions as they
see fit. Barner (2008) stated that “the use of metaphors can help organizational members better
interpret and make sense of organizational change” which has been proven to be effective. The
fourth is to give them a sense of control by allowing them to actively participate in the change
process. In order for the change process to go smoothly, it is critical for the leaders to prepare a
new organizational culture to accept the change. Since the two merged companies are from a
different organizational culture, it is important that a new shared culture is created in order to have
a common ground.
The new culture created must be balanced and demonstrate the importance of flexibility and
change. The steps to change the culture is first to define the company’s mission, vision and values
and their strategies. defining them gives employees a sense of identity and a reason to commit. The
second step is to communicate them well with the stakeholders in order to remove any uncertainty.
the third is to define the roles and responsibilities of the employees in the company and motivate
them (Wilox and Jenkins, 2015). The fourth is to implement the change over a planned period of
time which helps people accept the change better. The fifth is the continuous Measurement the
progress. Finally, to give time to the whole process to unfold. A councilor shall be hired to address
people’s emotions and helps in creating a new culture that accepts the change.
Creating short term wins
The sixth step in Kotter’s model. In such a big transformational change like the merger, the change
process takes a long period of time. To keep your employees from losing interest in achieving the
long change goal. You should divide the change implementation into different phases. Each
department is assigned a departmental change strategy to be achieved in a specified period of time.
From my experience, it is effective to have it on a monthly basis. This way the employees can have
a sense of achievement and a tangible evidence of their wins in implementing the change. those
departmental achievements are advertised to the others to take notice of the positive change.
(Pollack and Pollack, 2014).

ISSN 2708-9525
133
Consolidating Gains
The 8th step in Kotter’s model is to build on the change. creating the wins is not enough, all of the
implantation process shall be tracked by the leaders, change managers and change champions. In
order to learn from the success of the small wins, they shall be analyzed to guide the others. The
management should Prepare a form that records the reasons for the win as well as the reasons for
failure. The form content is then analyzed by specialists in order to alter the goals and improve
them.
Post Change Implementation
After the wins has been achieved and the change vision has been implemented through appropriate
strategies. The change culture should not stop, the final step of the Kotter’s model is applied for to
achieve change sustainability.
Anchoring change in the Corporate Culture
After the hard work of achieving the merger, the new company structure will require more changes
for improvement. With the help of the councilor hired, the organization is prepared for the culture
change. In order for the new merged company to sustain the change the following points has to be
addressed by the change leaders.
First, it should be kept in mind that the big changes should not be introduced immediately after the
merger. The changes should be divided into phases and alternate between the big changes and the
small changes. Second, the previous achievement should be highlighted and rewarded. The
management should set aside a budget for the change motivation, to offer bonuses in order to keep
the motivation for change. Third, is to offer employees a way to stay involved in the new changes
implemented, i.e. stress the communication process.
Fourth is to deliver training related to change to the employees at different levels. According to
Osman-Gani and Jacobs (2004), on the job training is the most effective way to consolidate the
change. The Final and most important point is for the company to have continuous improvement.
The leaders must establish an evaluation system applied quarterly in order to see when change is
required. My advice is to use the Kaizen strategy. It incorporates small changes in order to achieved
big improvement. The leaders should create a platform to receive change ideas and suggestions
form employees in order to improve for the better and sustain the achievements.

ISSN 2708-9525
134
List of References
• Akrofi, G. (2016). Mergers and acquisitions failure rates and perspective on why they fail.
International Journal of Innovation and Applied Studies, [online] 17(1), pp.150-158.
Available at:
https://www.researchgate.net/publication/305406845_Mergers_and_Acquisitions_failure_
rates_and_perspectives_on_why_they_fail (Accessed 11 Nov. 2019).
• Barner, R. (2008). The dark tower. Journal of Organizational Change Management,
[online] 21(1), pp.120-137. Available at:
http://0h1004dif.y.https.www.emerald.com.proxy.hbmeu-
elibrary.com/insight/content/doi/10.1108/09534810810847075/full/pdf [Accessed 15
Nov. 2019].
• Bsigroup.com. (n.d.). ISO 10002 Customer Satisfaction and Complaints Handling | BSI
Group Middle East and Africa. [online] Available at: https://www.bsigroup.com/en-
AE/ISO-10002-Customer-Satisfaction-and-Complaints-Handling/ [Accessed 11 Nov.
2019].
• Castillo, C., Fernandez, V. and Sallan, J. (2018). The six emotional stages of
organizational change. Journal of Organizational Change Management, [online] 31(3),
pp.468-493. Available at: http://0h1004dhb.y.https.www.emerald.com.proxy.hbmeu-
elibrary.com/insight/content/doi/10.1108/JOCM-05-2016-0084/full/pdf [Accessed 12
Nov. 2019].
• Doseck, k. (2015). Change Management Process: Step 3 - Form the Strategic Vision and
Initiatives. [online] Viral Solutions - Your Personal Chief Marketing Officer. Available
at: https://viralsolutions.net/change-management-process-step-3-form-the-strategic-
vision-and-initiatives/#.XaNAFXduLwhic (Accessed 11 Oct. 2019).
• DesRochers, M. (2019). How to Communicate During Merger and Acquisitions -
business.com. [online] business.com. Available at:
https://www.business.com/articles/communicating-during-mergers/ (Accessed 13 Nov.
2019).
• Dictionary.cambridge.org. (n.d.). INVESTOR | meaning in the Cambridge English
Dictionary. [online] Available at:
https://dictionary.cambridge.org/dictionary/english/investor [Accessed 3 Nov. 2019].
• DiSCProfile.com. (n.d.). DiSC Profile - How DiSC Personality Tests Work. [online]
Available at: https://www.discprofile.com/what-is-disc/how-disc-works/ [Accessed 13
Nov. 2019].

ISSN 2708-9525
135
• Feinberg, B. (2019). A Successful Merger Requires a Universal Understanding of Shared
Values. [online] Recruiter. Available at: https://www.recruiter.com/i/a-successful-merger-
requires-a-universal-understanding-of-shared-values/ [Accessed 12 Nov. 2019].
• Hammer, M. (2017). The change agent challenge. [online] McKinsey & Company.
Available at: https://www.mckinsey.com/business-functions/operations/our-insights/the-
change-agent-challenge [Accessed 12 Nov. 2019].
• Investopedia. (2015). How does a merger affect the customer?. [online] Available at:
https://www.investopedia.com/ask/answers/040815/how-does-merger-affect-customer.asp
[Accessed 11 Nov. 2019]
• Jurevicius, O. (2013). The Structure of a Good SWOT - How to do it Right. [online]
Strategic Management Insight. Available at:
https://strategicmanagementinsight.com/tools/swot-analysis-how-to-do-it.html [Accessed
13 Nov. 2019].
• Jick, T. and Peiperl, M. (2011). Managing Change. 3rd ed. Mcgraw Hill.
• KAWECKI, K. (2018) ‘Maintaining Competetive Advantage -- Organization Renewal
Perspective’, Scientific Papers of Silesian University of Technology. Organization &
Management / Zeszyty Naukowe Politechniki Slaskiej. Seria Organizacji i Zarzadzanie,
(118), pp. 279–290. Available at:
http://search.ebscohost.com/login.aspx?direct=true&db=bsu&AN=132701188&site=eds-
live (Accessed: 11 November 2019).
• Levasseur, R. (2001). People Skills:Change Management Tools--Lewin's Change Model.
Interfaces, [online] 31(4), pp.1-3. Available at:
https://pdfs.semanticscholar.org/ba1d/fc93a031276a46397bfbba738b740ba59266.pdf
• Leadership and Management Training Courses UK | MTD Training. (2018). 5 Reasons
Why Decision Making Skills Are So Important In Management. [online] Available at:
https://www.mtdtraining.com/blog/5-reasons-why-decision-making-skills-are-so-
important-in-management.htm (Accessed 12 Nov. 2019).
• Mase, B. (2009). The impact of name changes on company value. Managerial Finance,
[online] 35(4), pp.316-324. Available at:
http://0h1004cbc.y.https.www.emerald.com.proxy.hbmeu-
elibrary.com/insight/content/doi/10.1108/03074350910935812/full/pdf [Accessed 13
Nov. 2019].
• Minor, M. (2010) Coaching and Counseling : Become a Better Manager and Through
Mentoring. [Menlo Park, Calif.]: Axzo Press (A Crisp Fifty-minute Series Book).
Available at:
http://search.ebscohost.com/login.aspx?direct=true&db=nlebk&AN=383332&site=eds-
live (Accessed: 17 November 2019).

ISSN 2708-9525
136
• Osman-Gani, A. and Jacobs, R. (2004). Institutionalization of Organizational Change: A
Study of HRD Interventions in Singaporean, US, Japanese, and German Companies. In:
hthe Academy of Human Resource Development International Conference. [online]
Austin. Available at: https://eric.ed.gov/?id=ED492211 [Accessed 15 Nov. 2019].
• Postema, B., Goppelsroeder, M. and Bergeijk, P. (2006). Cost and Benefits of Merger
Control: An Applied Game Theoretic Perspective*. Kyklos, [online] 59(1), pp.85-98.
Available at: http://eds.b.ebscohost.com/eds/pdfviewer/pdfviewer?vid=1&sid=943f481a-
09e4-401e-b04a-4247f2a1dfc7%40sessionmgr103 (Accessed 5 Nov. 2019).
• Pollack, J. and Pollack, R. (2014). Using Kotter’s Eight Stage Process to Manage an
Organisational Change Program: Presentation and Practice. Systemic Practice and Action
Research, [online] 28(1), pp.51-66. Available at:
http://eds.b.ebscohost.com/eds/pdfviewer/pdfviewer?vid=1&sid=1bc3e0e4-e5d2-4115-
9162-e0fdc9eeb426%40sessionmgr102 [Accessed 13 Nov. 2019].
• Sachdeva, T., Sinha, N. and Kaushik, K. P. (2015) ‘Impact of Merger and Acquisition
Announcement on Shareholders’ Wealth’, Delhi Business Review, 16(2), pp. 19–36.
Available at:
http://search.ebscohost.com/login.aspx?direct=true&db=bsu&AN=120562852&site=eds-
live (Accessed: 6 November 2019).
• Smeltzer, L. and Zener, M. (1994). Minimizing the Negative Effect of Employee Layoffs
through Effective Announcements. Employee Counselling Today, [online] 6(4), pp.3-9.
Available at: http://0h1004cdb.y.https.www.emerald.com.proxy.hbmeu-
elibrary.com/insight/content/doi/10.1108/13665629410071207/full/pdf [Accessed 12
Nov. 2019].
• Saleem, Z., Batool, S. and Khattak, S. R. (2017) ‘Relationship between Leadership Styles
and Organizational Commitment: Moderating Role of Emotional Intelligence and
Organizational Support’, Journal of Managerial Sciences, 11(1), pp. 71–84. Available at:
http://search.ebscohost.com/login.aspx?direct=true&db=bsu&AN=125229282&site=eds-
live (Accessed: 17 November 2019).
• Vine, N. (2016) How Can We Make This Happen? : Successful Change Through
Incentives and Trust. Seaford: Trenchant Books. Available at:
http://search.ebscohost.com/login.aspx?direct=true&db=nlebk&AN=1280842&site=eds-
live (Accessed: 10 November 2019).

ISSN 2708-9525
137
• Villa, S., Gonçalves, P. and Villy Odong, T. (2017). Understanding the contribution of
effective communication strategies to program performance in humanitarian
organizations. Journal of Humanitarian Logistics and Supply Chain Management,
[online] 7(2), pp.126-151. Available at:
http://0h1004dg3.y.https.www.emerald.com.proxy.hbmeu-
elibrary.com/insight/content/doi/10.1108/JHLSCM-05-2016-0021/full/pdf [Accessed 14
Nov. 2019].
• Wilox, M. and Jenkins, M. (2015). Engaging Change: A People-Centred Approach to
Business Transformation. London: Kogan Page. Available at:
http://search.ebscohost.com/login.aspx?direct=true&db=nlebk&AN=987748&site=eds-
live (Accessed: 14 October 2019).
• Yadav, R. and Lata, P. (2019) ‘Role of Emotional Intelligence in Effective Leadership’,
International Journal on Leadership, 7(2), pp. 27–32. Available at:
http://search.ebscohost.com/login.aspx?direct=true&db=bsu&AN=137637139&site=eds-
live (Accessed: 17 November 2019).

ISSN 2708-9525
138
Lean And Sustainability: Similarities And Mutual
Relationship
Abdullah Almatrooshi
Abstract
Purpose
The research work highlights the interrelationship between lean and sustainability and their
significance in enhancing the different aspects of a business. The completion among businesses is
increasing sharply these days and hence, adoption of Lean practice is in demand. Hence, the
companies are considering an amalgamated business approach including environmental and social
impacts of the business activities. The prime focus of today’s business ventures is to contribute to
the well-being of the society with special emphasis on protecting the environment.
Design/methodology/approach
A SLR (Systematic Literature Review) is conducted in this research work explaining the
similarities and the mutual relationship shared by lean and sustainability approaches. There is
significant evidence suggesting that Lean is advantageous for Sustainable business management.
This is believed to be helpful from economic and environmental aspects (Das, 2018). The research
paper identifies gaps in implementing a combined form of lean and sustainability to enhance
business performance in relation to a methodology approach. A qualitative thematic analysis and
quantitative descriptive analysis is provided in this paper to justify the mutual relationship and
similarities between lean and sustainability (Lagrosen, 2019).
Findings
The findings suggest that lean is mainly utilized for practical guidance and by embracing the tool
and techniques of lean approach, the organizations are able to denote the broad concept of
sustainability in a tangible manner. On the contrary, it is evident that when the long-term
philosophic base of lean is not adopted, its usage remains superficial and hence, it does not serve a
long-lasting impact (Lagrosen, 20109. Sustainability only generates financial incentives for lean.
Even if an additional purpose is not generated by sustainability, the emerging financial urgency
can develop an advantageous tide for lean.
Research limitations/implications
The research work is only limited to the analysis is based on literature reviews describing the work
of different authors in a simplified manner. A thorough evaluation seems beneficial to identify both
the risk and opportunities shared by Lean strategy in bringing sustainability to the business
(Tasdemir, 2018). However, this research paper only focuses on shared work by different authors

ISSN 2708-9525
139
in terms of thematic and descriptive analysis. It is believed that if a survey is being carried out in
any business field, the implementation and the interlinking of lean and sustainability can be
effectively identified.
Practical implications
Lean and sustainability can be adopted by any business organization, which holds the motive to
generate economic benefits by applying sustainable business practices. A lean strategy is believed
to have a positive impact on the three pillars of sustainability, namely, society, economy, and
environment (Vinodh, 2016). The target of the business is to equalize these three pillars so that
they can acquire future opportunities for their business expansion.
Originality/value
The paper highlights the similarities and mutuality shared by lean and sustainability, although
certain loopholes exist in their combined approach. It is evident that when implemented together,
it can re-shape the business activities towards success. On the contrary, the lean is found to be a
base where a sustainable approach of the business organizations follows a conceptual path.
Keywords – Lean, Sustainability, Business success, Mutual relationship
References
Das, K., 2018. Integrating lean systems in the design of a sustainable supply chain
model. International Journal of Production Economics, 198, pp.177-190.
https://www.sciencedirect.com/science/article/abs/pii/S0925527318300331
Lagrosen, Y. and Lagrosen, S., 2019. Creating a culture for sustainability and quality–a lean-
inspired way of working. Total Quality Management & Business Excellence, pp.1-15.
https://www.tandfonline.com/doi/full/10.1080/14783363.2019.1575199
Leon, H.C.M. and Calvo-Amodio, J., 2017. Towards lean for sustainability: Understanding the
interrelationships between lean and sustainability from a systems thinking perspective. Journal of
cleaner production, 142, pp.4384-4402.
https://www.sciencedirect.com/science/article/pii/S0959652616319941
Ruiz-Benitez, R., López, C. and Real, J.C., 2019. Achieving sustainability through the lean and
resilient management of the supply chain. International Journal of Physical Distribution &
Logistics Management. https://www.emerald.com/insight/content/doi/10.1108/IJPDLM-10-2017-
0320/full/html
Tasdemir, C. and Gazo, R., 2018. A systematic literature review for better understanding of lean
driven sustainability. Sustainability, 10(7), p.2544. https://www.mdpi.com/2071-1050/10/7/2544

ISSN 2708-9525
140
Vanichchinchai, A., 2019. The effect of lean manufacturing on a supply chain relationship and
performance. Sustainability, 11(20), p.5751. https://www.mdpi.com/2071-1050/11/20/5751
Vinodh, S., Ramesh, K. and Arun, C.S., 2016. Application of interpretive structural modelling for
analysing the factors influencing integrated lean sustainable system. Clean Technologies and
Environmental Policy, 18(2), pp.413-428. https://link.springer.com/article/10.1007/s10098-015-
1025-7
Yadav, G., Luthra, S., Huisingh, D., Mangla, S.K., Narkhede, B.E. and Liu, Y., 2019.
Development of a lean manufacturing framework to enhance its adoption across manufacturing
organisations of developing economies.
https://www.researchgate.net/profile/Yang_Liu57/publication/336489195_Development_of_a_le
an_manufacturing_framework_to_enhance_its_adoption_within_manufacturing_companies_in_d
eveloping_economies/links/5da8b782a6fdccc99d911070/Development-of-a-lean-manufacturing-
framework-to-enhance-its-adoption-within-manufacturing-companies-in-developing-
economies.pdf

ISSN 2708-9525
141
From Autonomy to Accountability: Perception of
Professionalism among Healthcare Providers in the Ministry
of Health and Prevention, United Arab Emirates.
Part I (out of IV)
Al Anoud Salman, PhD candidate- Healthcare Management-HBMSU.
Supervisor:
Awoniyi Awofeso, School of Health and Environmental Studies
Co-supervisor: Ziad Khatib, Associate HBMSU Associates
Background
Organizational values are key elements in shaping the visions, cultures and performance of
healthcare organizations as well as healthcare providers. The value of professionalism emphasizes
accountability, competency, integrity, and providing quality service. In the healthcare sector, the
concept of multidisciplinary professionalism re-emerged as a core healthcare ethics principle since
the 1980s when health maintenance organizations were established in the United States and
business ownership of the healthcare industry expanded. Many healthcare organizations emphasize
professionalism as one of the core values that facilitate accomplishment of their missions and
visions. However, the extent to which a common understanding of ‘Professionalism’ and
“Professional Competence” exists at individual and organizational levels varies widely. Being
accountable at individual or organizational levels is not confined to financial or clinical aspects of
health care management but also extends to performance outcomes, and quality of healthcare
services as well.
Research objectives
This dissertation seeks to explore the concept of professionalism, its perceptions among healthcare
providers and managers, its impact on organizational performance appraisal processes as part of
corporate governance and clinical governance of health information systems at three hospitals in
Ministry of Health and Prevention; MoHaP in United Arab Emirates; UAE. The study explores the
context of professionalism at individual level from the following domains: accountability,
teamwork, learning and self-improvement, communication and integrity and work values and at
organizational levels from the following domains: patient engagement, governance, organization
culture, response to community need and daily operation & administrative support. In (part I)
,only the results from the first objective is discussed , which is about the development of a context-

ISSN 2708-9525
142
specific concept of professionalism, based on self-perception of five healthcare professions, on
what constitutes professional practice from the perspectives of physicians, dentists, pharmacists,
nurses and medical laboratory technicians.
Method
Using mixed method approach, (a) Healthcare Workers Professionalism Survey (HWPS) was
constructed internally, based on literature from (Snizek, 1972; American Board of Internal
Medicine(ABIM),2001; Stern, 2006; Moore, 2012; Shaw, 2015; Chioviti, 2015 and MOHAP,
2017). It consists of 25 questions based on likert scale (Strongly agree, agree, neutral, disagree and
strongly disagree). The survey was supported by (b) focus interviews, which asked participants to
list the most prominent professionalism values in their opinion. Finally, (c) a document review of
reported unprofessional behaviors within the period of (2018-2019) were conducted.
Li, et al (2017) conducted a systematic search to assess the quality of used instruments in assessing
professionalism from 1990–2015, eighty studies satisfied the inclusion criteria, and a total of 74
instruments for assessing medical professionalism were identified. Instruments analyzed varied
among the studies and included: self-administered rating, simulation, multi-source feedback, direct
observation, peer assessment, patients’ opinion, role model evaluation, professionalism
environment. The analysis revealed that methodological qualities of studies were usually weakened
by vague hypotheses, missing data, and inadequate sample sizes. Based on best-evidence synthesis,
three instruments were recommended: Hisar’s instrument for nursing students, the Nurse
Practitioners’ Roles and Competencies Scale (NPRCS), and the Perceived Faculty Competency
Inventory (PFCI).
However , in this study , the aim is not to validate an instrument to measure professionalism or to
specify one definition for professionalism in UAE healthcare system, rather than having a thorough
assessment of professionalism concept at a holistic level. Through assessing the interplay between
individual and organizational professionalism and how both can be integrated for better outcomes.
The outcomes are in a form of organizational excellence through international or local
accreditation, achieving higher standards of patient safety and satisfaction and improving staff
productivity.
Results
The majority of participants in the Healthcare Workers Professionalism Survey (HWPS) were
female (67%), from nursing professions (64.9%), (45.4%) from middle age (31-40 years). Around
half of the studied population spent (1- 12 years ) in the selected hospitals. The author found that
(HWPS) showed high level of individual perception of professionalism (average across all five
domains = 95.3 %, Cronbach alpha = 0.920 ) , who agreed on being accountable (98%) , effective
in their communication(96.5%) , abide with updating their skills and knowledge through
Continuous Professional Development CPD (95.6%), believe in teamwork (95.2%), and had
integrity and high personal values (91.02%). Their responses on Likert scale were grouped into (
agree : combining strongly agree and agree together, disagree : combining neutral to strongly
disagree together) as most of the results were positive.

ISSN 2708-9525
143
Healthcare professionals ‘responses were analyzed by comparing the perception of the majority
(Nursing profession and others) and between physicians and other professions. To look at any
significant findings in perception among the selected professions. For example in question (4)
“I am aware of my profession’s code of conducts and ethics and believes in the effective impact
of my membership in any of my profession’s related committee/group/association” there was
significant difference between nurses’ perception and others (p value 0.02, significant at < 0.05),
when (100 %) of nurses agreed compared to (96%) from other professions. In the last three years,
MOHAP nursing administration incorporated a revised version of Nursing ‘strategy, code of ethics
and Emirati model of care that are based on UAE community. Which had a positive impact on
nursing ‘ responses in HWPS. Due to high level of agreement and in order to exclude social
desirability bias, the findings were followed by focused interviews with selected healthcare
workers (n=16 ) to list the most common professional attributes in their opinion. They suggested
(n=35) attributes related directly to four MOHAP strategic values (patient priority, excellence and
leadership, community happiness and respect). Which suggests positive signs of well-incorporated
values among nurses, physicians and pharmacists.
The attributes of “respect and transparency” were with higher frequency (n=12 out of 35 ), and
when compared to Morrow et al. ( 2014)’s study , similar descriptions were found under “respect
for patients and colleagues”. While in comparison to Stern’s (2006), four principles of
professionalism (excellence, humanism, accountability, and altruism), MOHAP’s participants
listed collectively (22.82 %) similar o professional attributes that matches Stern’s principles (9.7%
suggested “accountability”, 7.6% “ excellence”, 3.2 %“altruism and ethics” and 2.2%
“humanism”). Considering the diversity of healthcare workers in the three hospitals according to
their professions and their different cultural backgrounds.
As the concept or professionalism is dynamic, diffused, culture and context-specific, participants
in other countries like Japan (Kinoshita, et,al, 2015) listed other professional attributes like:
accepting gifts, conflict of interest, confidentiality, impairment and honesty were among the
common types. Following the results from both tools (HWPS and focused interview), document
review of incidents were used to cross check the presence of unprofessional behavioral in two
hospitals, as part of monitoring system for any breach of conduct and to support findings in the
other tools. A total of n= 2426 incidents reviewed (between 2018-2019) and only 9.6% were
reporting unprofessional behavior, accredited hospital had only (2.09 % reported unprofessional
behavior compared to non-accredited hospital (17.3%).
Conclusion
There is absence of universal consensus of what constitutes professionalism; certain set of
competencies in one country are not always fitting other countries. As a healthcare manager, it’s
important to know what really matter to health professions in term of professional values and what
they are facing, to know how to close gaps between organizational strategic values and what is
expected from these workers on daily basis. Empirical studies showed that investment in
organizational professionalism resulted in (Brennan and Monson, 2014): (a) Improved patient
safety, satisfaction and health outcomes, (b) increased patient and community trust of the
organization,(c) improve organizational performance and reputation, (d) enhance individual moral,

ISSN 2708-9525
144
engagement and being part of wider purpose that foster productivity and (e )enhance learning and
thrive to continuous improvement.
Therefore, reliance on individual perception of professionalism is not strong enough to cultivate
professional culture and enhance quality and patient safety. The strategic values and presence of
corporate governance like risk management system and accreditation through corporate
governance is more impactful and powerful in achieving excellence and ensuring patient safety
and can foster professional behavior
Keywords: Professionalism, Healthcare Professions, UAE, Ministry of Health and Prevention, Healthcare
Managers, Survey, Focus Interview, Incident Reports , Governance, , Accountability, teamwork , Hospital
,Quality , Excellence and Patient Safety.
References
American Board of Internal Medicine;ABIM (2001) Project Professionalism. Journal of
Medicine. 7th ed. Philadelphia. Available at: https://medicinainternaucv.files.wordpress.com/2013/02/project-professionalism.pdf.
Brennan, M. D. and Monson, V. (2014) “Professionalism: Good for Patients and Health Care
Organizations,” Mayo Clinic Proceedings, 89(5), pp. 644–652. doi:
10.1016/j.mayocp.2014.01.011.
Chiovitti, R. (2015) “Professionhood and professionalism as an educational aid for facilitating
nursing students’ development and renewal of self and profession,” Journal of Nursing Education
and Practice, 5(11). doi: 10.5430/jnep.v5n11p51.
Kinoshita, K. et al. (2015) “Challenging cases of professionalism in Japan: improvement in
understanding of professional behaviors among Japanese residents between 2005 and 2013,” BMC
Medical Education, 15(1), p. 42. doi: 10.1186/s12909-015-0313-6.
Li, H. et al. (2017) “Assessing medical professionalism: A systematic review of instruments and
their measurement properties,” PLOS ONE. Edited by G. Virgili, 12 May. doi:
10.1371/journal.pone.0177321.
Ministry of Health and Prevention(MOHAP).UAE(2019) MOHAP Strategy. Available at:
https://www.mohap.gov.ae/en/aboutus/Pages/Strategy.aspx (Accessed: December 10, 2018).
Moore, R. (2012) Professionalism in nursing, midwifery and the allied health professions: report.
The Scottish Government. Available at: https://www.gov.scot/publications/professionalism-
nursing-midwifery-allied-health-professions-scotland-report-coordinating-council-nmahp-
contribution-healthcare-quality-strategy-nhsscotland/.

ISSN 2708-9525
145
Morrow, G. et al. (2014) “Professionalism In Healthcare Professionals,” Medical Education
Research Group,. Durham University Health Professions & Care Council. Available at:
https://www.hcpc-uk.org/globalassets/resources/reports/professionalism-in-healthcare-
professionals.pdf.
Shaw, S.-Z. (2015) Assessment of Professionalism in Dentistry. Available at:
http://etheses.whiterose.ac.uk/8449/1/SZS Thesis final amended.pdf.
Snizek, W. E. (1972) “Hall’s Professionalism Scale: An Empirical Reassessment,” American
Sociological Review, 37(1), p. 109. doi: 10.2307/2093498.
Stern, D. (2006) Measuring Medical Professionalism. Edited by D. Stern. Oxford: Oxford
University Press. Available at:
https://books.google.ae/books?hl=en&lr=&id=lIwRDAAAQBAJ&oi=fnd&pg=PA3&dq=sterns
%27+principles+of+professionalism+assessment&ots=l8GO65M6DZ&sig=Nfoc3hMsDWhz9k9
wLr5qekMNIUA&redir_esc=y#v=onepage&q&f=false.

ISSN 2708-9525
146
Critical Success Factors (CSFs) of Quality Management
System in Healthcare – A Comparison between the
Government and the Private Hospitals
Latifa Hussain Mohamed Alameeri,
Operations and Quality Executive, Master of Science in Organizational
Excellence United Arab Emirates, Dubai.
Abstract
Quality system in healthcare have critical impact on the safety and health of patient. Healthcare facilities consistently
introduce solutions and address issues which gives them a competitive advantage in their field. The aim of the
research to introduce the critical success factors of healthcare quality management system. Also, compare the
healthcare quality management system between the private and government sectors. The literature review included
seven CSFs for implementing successful healthcare quality system, and sated different authors’ analysis about the
quality management system in the private and government sector. Further, the methodology that will be used covers
both qualitative and quantitative approach to give more rational, reliable and fair findings. The sample will include
four hospitals which two are government and two are private that based in UAE. As well, four managerial level
employees working as head of quality department will be interviewed, while 100 employees from different fields will
be answering the survey questions. The research limitation be in including the patient perspective about quality, and
take into consideration to have more health facilities from different, specialty and region in the survey. Finally, the
expected finding will answer the research questions and hypothesis. Furthermore, will demonstrate the role of quality
in healthcare and the benefit of adopting quality program on patient and staff and the organization performance.
The following introduction will have the importance of quality system in healthcare and the research objectives and
hypothesis.
Introduction
Quality system in health care has many positive impacts on performance. As a result, more
healthcare providers focus on different quality tools and methods to increase their efficiency,
service quality and productivity. As the author background in clinical quality, many healthcare
quality system helps to reduce medical and medication errors and waste of resources. An
organization should assess its current state depending on some factors that are critical for
implementing a successful quality system. Quality in healthcare involves every activity or process
that contributes delivering care to the patient from entering the health facility until discharge, and
it involves both admin and clinical staff from different levels. When a health organization can
adopt the quality program, then we can assure it's consistency in meeting the patient needs and
contribute in a healthier and happier society.
The research will assess the effectiveness of the quality system in healthcare by analyzing the
factors that are essential for implementing a successful quality program. And will compare the
quality system in both the private and the public sector, to find out which sector is better or
ISSN 2708-9525
147
whether they have the same level of quality. The comparison will help health organizations to
focus and work on the critical factors that will assure their success and help them to achieve a
competitive level in their field. The Research Objectives, Questions and Hypothesis are listed
below for better understanding of the research path and outlines.
Research Objectives
1- Determine the critical success factors of Healthcare quality management system
2- Compare the Healthcare quality management system between private and government
sectors.
Research Questions
1- What are the factors that contribute in implementing a successful quality management system
in Healthcare?
2- What is the type of quality program used in the private and government sectors?
Research Hypothesis
1- If top management is involved with the quality program, then more effective outcomes
will be accomplished in relation to organizational performance and quality services.
2- If staff awareness is applied toward quality practices and Its importance, then a health
care organization will reach a high level of patient safety culture.
3- If a quality program is implemented in the Private sector, then it has higher probability of
success than the Government sector.
After reviewing the importance and the aim; the next section will present the literature review that
contribute to strengthen the research argument as follows below.
Literature review
According to J. Ovretveit and D. Gustafson (2002) the Quality program in healthcare refers to all
processes included in the system that contribute to improving the care. Holden and Hackbart
(2012), Chassin (2013), and Souza (2009) agreed on that current healthcare are focusing more on
efficiency, productivity and quality of service provided to patients in term of time and safety, and
staff satisfaction, which makes the management heading toward using quality programs and tools,
to achieve their objectives. Also, it is proven that quality system helps in having better future
planning and the best use of healthcare organization resources. Adding to that, Roger Hiltona,
Margaret Ballab and Amrik S. Sohala (2008), and J Ovretveit and D Gustafson (2002) suggest to
achieve all these benefits; the healthcare organization should first change their organizational
culture and the way they perceive quality. There are different success factors listed in different
literatures. The research will present the most common success factors which have the most effect
on the healthcare organizations from the reviewed articles.

ISSN 2708-9525
148
Leadership support
Ben-Tovim et al. (2008), Steed (2011), Radnor et al. (2012) stated that leadership support is
essential in changing the healthcare culture to implement quality tools like the lean method to
ensure commitment, involvement and understanding the reasons of adopting from the employees
stand. Leaders are the implementation facilitators and deal with any problem that arises in the
healthcare organization. Moreover, Armenakis et al. (1993), Ackroyd, (1996), Lehman et al.
(2002) and Steed (2011) agreed that leaders roles include providing the needed resources from
training, involving employees in the processes and provide sufficient time to complete the tasks.
Also, Radnor (2011) noticed that leadership present in the implementation phase would help in
continuing the required actions from all employees, which mean will have a successful sustainable
program. And that will eliminate any resistance, as Ben-Tovim et al. (2007), Fillingham (2007),
Carpenter (2011), Papadopoulos et al. (2011) found that physicians and nurses find more
difficulty in accepting new changes than others because they don't like someone inform them
how to perform their tasks where they are the experts in their field. Furthermore, Edmondson
(2004) ensures the leadership importance in motivating employees towards continuous
improvement by creating the vision and urgency for change. And have a blame free culture where
employees can safely report incidents and mistakes that can be avoided in the future.
Including quality program in the organization strategic plans
Butler et al. (1996) notified that the strategic plan of healthcare in its mission and policies that
should be consistent with their resources. Also, Kaye and Anderson (1999), Bateman (2001), Rich
and Bateman (2003), Cinite et al. (2009) insist on the objective and reason of any change in health
system; because by identifying the plan, Armenakis et al. (1993) and Dick et al. (2006) assure
that everything requires from employees will be clear, easy to follow and implemented
effectively. As a result, Rich and Bateman (2003) concluded that quality strategic plan would help
in better understanding of the healthcare organization work, goals and desired outcomes from the
new system. Also, long term plan for the changes identified in healthcare will have more
probability to be accepted within the organization.
Defining customer segment and value in the health sector
Papadopoulos and Merali (2008), Young and McClean (2009), Hayes et al. (2010), Poksinska
(2010) acknowledged that there are different customers groups in healthcare from patients, their
family, suppliers, …etc., and by defining them we can specify what service to be provided
depending on their needs, which will have more value to them. Also, Papadopoulos et al. (2011)
and Womack and Jones (2003) summarized the benefit of defining the customers and their needs
in focusing on value-added activity and remove any process that doesn't add value and waste the
organization resources. Where, Womack and Jones (2003), Young and McClean (2009) Added
that it would reduce resistance and conflicts.

ISSN 2708-9525
149
Identify the whole process (patient pathway)
Fillingham (2007), Papadopoulos et al. (2011) Radnor (2011) Defines that the whole patient
journey starts from the step he walks in the hospital whether as an inpatient, outpatient or
emergency case till discharge. And, Joosten et al. (2009), Papadopoulos et al. (2011) ensure by
defining the patient pathway, the value and non-added value activities can be identified to improve
the quality of service we delivered to our patient, because as Fillingham (2007) stated there is no
better way to evaluate the care than asking the patients himself. Therefore, in each process the
healthcare organization should ask the patient what service to include and what to remove for
better satisfaction and performance efficiency.
Training
Butler et al. (1996), Bateman (2005), Ben-Tovim et al. (2007) advice that to ensure sustainability
of the improved processes, training should be provided to make the staff use their resources and
the tools efficiently, that learned from the new quality system as it becomes in the healthcare
culture. While Morgan and Cooper (2004) have proven that using Some of the quality tools like
six sigma DMAIC process (Define, Measure, Analyze, Improve, and Control) , increase the
nurse's satisfaction level because the pressure and complexity of their jobs where reduced by
identifying their tasks in each of the DMAIC steps. Also, R. Grol, R. Baker and F. Moss (2002)
suggest that training should be for both managerial and clinical staff, to achieve the long term
goal of delivering quality care and safety that satisfy all members from employees and patients.
In addition, Radnor (2011) indicates that training helps the healthcare to reach sustainability on
the clinical, operational and departmental level.
Implementation of reward and measurement system
Sugimori et al. (1977), Cho (1995), Fillingham (2007) and Taner et al. (2007) notified that reward
system enhances health care organization performance to achieve continuous improvement
concept, as they recognize the hard work done by the staff. And that encourage the others to
improve to get rewarded either financially or morally. Graber and Kilpatrick (2008), Fillingham
(2007), and Gubb (2009) recommend having a measurement system in order to evaluate the
success of healthcare organization, where they can identify their current and target state to define
their progress. Also, Kollberg et al. (2006), Hines and Lethbridge (2008) and Radnor (2010) stated
that measures in the healthcare sector should be accurate, easy to understand and implement and
related in order to improve the current practice. Moreover, Antony and Banuelas (2002) confirm
the importance of data to have effective decisions and statistical tools to monitor and avoid errors
like process control charts.
Aligning organization capabilities with demand
Fillingham (2007), Dickson et al. (2009) and Delli Fraine et al. (2010) emphasize on the difficulty
of identifying the real needed resources in healthcare, due to every patient has different needs,
and it treated as individual case depending on their urgency. As a result, Balle and Regnier (2007)

ISSN 2708-9525
150
suggest health organization to prepare reports by analyzing the trends and work volume on a
regular basis, and based on that define the skills and resources needed approximately, to apply the
new system and satisfy patients requirements without facing any shortage burden.
Quality system in the private and government sector
Johnson Olabode Adeoti (2011) stated in his study of Kwara State Government Hospitals that
despite the available skills for applying total quality management system (TQM), the government
must provide financial support as they are the primary source for these hospitals. And involve the
employees more in the planning and implementation process, to enhance the hospital's
performance because they have more knowledge and experience about the area of improvement.
Also, Taylor (1994) notified the two crucial elements that all healthcare organization should focus
on: meeting patient needs and delivering quality services. Furthermore, Middle East News Online
(2002) and Angelopoulou et al. (1998) noticed that patient prefer private sector due to its
flexibility and fast response in delivering high-quality health services.
On the other hand, Naceur Jabnoun and Mohammed Chaker (2003) stated that patient goes to a
private hospital with a perception of good quality care and in the same time public hospital receive
pressure from the government to compete with the private sector in terms of efficiency and quality
of service provided to patients. In their study in UAE hospitals, they found that patient satisfied
more with public hospitals than private, due to the high rate of reliability of skills, competencies
and services delivered by the support of the government funding. Also, Eggleston, Lu, Li, Wang,
Yang, Zhang and Quan (2010) stated from their study that there is no difference in mortalities rate
and level of quality performance in both private and government hospitals that have the same size
and competency level. The only differences were that government hospitals have more advanced
equipment and machines, high number of employees and increased numbers of acute cases
referrals. And that lead to the conclusion that performance depends on the hospital competencies
and resources not the hospital type. Nevertheless, all hospitals should have system to monitor their
performance to reach their organizational goals and protect their patients’ rights in having a safe
and healthy environment while receiving their treatment.
Methodology Design
The research will include both secondary and primary data. The secondary data will be based on
literature and articles from different journals. While the primary data will consist of qualitative
and quantitative methods. The qualitative approach will be four interviews with the Heads of the
Quality Department from both the government and the private hospitals. The interviews will have
5 questions to cover the research objectives and answer the research questions. And, the
quantitative approach will be a survey from 12 questions that covers the research hypothesis in
terms of applicability and validity. The sample size will be 100 employees from different fields:
Nurses, physicians, pharmacists, technicians and admins.
The sample in the survey will be chosen randomly with consideration of equal and standardized
distribution of the survey questions between the hospitals to have a weight of 25% participation
from each hospital; to assure a rational, reliable and fair finding. Furthermore, to conduct the
interviews and the surveys; approval granted from 2 government and 2 private large size hospitals
that based in UAE, especially in the Emirates of Dubai.

ISSN 2708-9525
151
By using this methodology and including both approaches, we will have a stronger, valid and
wider base of findings as different employees’ level and categories will participate in the research.
As a result the research will have different perspectives and opinions which allows to compare
the results and find whether there is difference between the private and the government sector in
term of their implemented quality management system. More over buy having both the literature
review and the interviewees’ answers; this also give the research a stronger arguments and point
of view to state the research findings.
The data collection and analysis
For the interviews will be a semi structured face to face interviews with the Heads of Quality
Department. This will give the research a deep insight and analysis as we get the answers from
the experts. While the survey questions will be distributed through Monkey Survey and the results
will be interrupted and analyzed through Microsoft excel; which allows implementing the
regression analysis and finding whether there is relationship or no relationship between the
variables in the research hypothesis.
Limitation
The research primary data covers only the employees’ perspective about quality system in UAE
hospitals. Further studies needed to include the patients’ opinions and how they view quality
service and the factors that will contribute into having a successful system in healthcare from their
point. Since the patient voice is important, and when he is happy with the delivered care and his
requirements is satisfied; then we can say we have a quality service and successful system.
Also there is opportunity to wider the study by including more healthcare organizations from
different sizes, specialties and regions. This will give more advantage to compare and analyze the
differences and similarities. As well as, introducing case studies to share knowledge and best
practices and learn lessons from other healthcare organization experiences. Finally, further studies
can be applied on barriers factors and solutions for implementing a quality system in healthcare,
and how health facilities deal with these challenges.
Expected Findings
The research findings can projected from the literature review, previous studies and the author
experience. To answer the research questions, it is expected that the following factors are found
to be critical for effective healthcare quality management system. First, leadership support; by
providing the needed resources, being involved in the processes and create a blame free culture
to encourage the employees to report any incident related to safety or quality to implement action
plan and improve the current system.

ISSN 2708-9525
152
Second, including quality programs in the organization strategic plans; and be part of the
organization vision. Third, defining customer segment and value in the health sector; by this the
facility can focus on the value added activities and eliminate non-value added activities, to save
efforts, time and cost. Forth, identify the whole process (patient pathway); and define the specific
requirement for each process and have a focused process oriented system.
Fifth, training; and increase the staff performance and productivity by providing them with the
needed skills. Sixth, implementation of reward and measurement system; which create motivation
and encourage the employees to excel in their roles and implement a continuous improvement
culture. Also, the measures will define the current state of the organization and what need to be
done in the future to enhance the quality performance. Seventh, aligning organization capabilities
with demand; to able to meet the requirements and prepare for future demand.
Moreover, for the research hypothesis can be expected that there is positive a relation between
top management involvement in quality programs and organizational performance level and
quality services. And, there is a positive relation between the staff awareness in quality practices
and its importance and the level of patient safety culture in healthcare organization. Also, there
no relation between the type of healthcare organization (Private or Government) and the
probability of success in the implemented quality system.
Furthermore, there is no differences between the quality systems effectiveness in the private and
the government hospitals. In fact the factors that affect the system success is the availability of
resources and competencies, and the healthcare facility capacity and readiness to meet the needs
of their patients’ expectations. The questions answered from the interviewees expected to
elaborate the nature of quality department processes and activities. It includes incidents reporting,
KPIs, policies and procedures, statistics, audits and awareness sessions.
These roles aims to achieve the International Patient Safety Goals (IPSGs) and better allocation
and efficient use of resources. Regardless, the different type of quality systems and tools applied;
all healthcare provider aim to increase the safety and health of their patients, reduce medical errors
and provide them with quality care that meets their needs. Also, insure the safety and satisfaction
of the employees to ensure the continuity of delivering high level performance in term of
effectiveness and efficiency. To summarize that, the main benefits of successful quality system
are in having a healthy, satisfied and happy patient, employee and society.

ISSN 2708-9525
153
References
▪ Adeoti, J. O. (2011). Total Quality Management (TQM) Factors: An Empirical Study of Kwara
State Government Hospitals. Ethno-Medicine, 17-23.
▪ Chaker, N. J. (2003). Comparing the quality of private and public hospitals . Managing Service
Quality: An International Journal, 290-299.
▪ Edmondson, A. C. (2004). Learning from failure in health care: frequent opportunities,
pervasive barriers. BMJ Quality & Safety in Health Care, ii3- ii9.
▪ Filho, L. B. (2016). Lean healthcare: review, classification and analysis of literature.
Production Planning & Control, 823-836.
▪ Fillingham, D. (2007). VIEWPOINT Can lean save lives? . Leadership in Health Services,
231-241.
▪ Gustafson, J. O. (2002). Evaluation of quality improvement programmes. Quality and Safety
in Health Care, 270-275.
▪ Karen Eggleston, M. L. (2010). Comparing public and private hospitals in China: evidence
from Guangdong. BMC Health Services Research, 1-11.
▪ Noori, B. (2015). The critical success factors for successful lean implementation in hospitals.
International Journal of Productivity and Quality Management, 108-126.
▪ Penelope Angelopoulou, P. K. (1998). Private and public medicine: a comparison of quality.
International Journal of Health Care Quality Assurance, 14-20.
▪ R Grol, R. B. (2002). Quality improvement research:understanding the science of change in
health care. Quality and Safety in Health Care, 109-110.
▪ Roger Hiltona, M. B. (2008). Factors critical to the success of a Six-Sigma quality program in
an Australian hospital. Total Quality Management, 887–902.
▪ S. Al-Balushi, A. S. (2014). Readiness factors for lean implementation in healthcare settings –
a literature review. Journal of Health Organization, 135-153.

ISSN 2708-9525
154
دور المهندس االماراتي في اعداد المواصفات التصميمية للمدن الذكية
العربية المتحدة في دولة االمارات
، مأمون موسى عطعوط
مكتب ادارة المشاريع ، قطاع نقل الطاقة -هيئة كهرباء ومياه دبي
مستخلص
االخيرة خاص الثالث عقود الدولة في التي حصلت في المتسارعة للتغيرات التطور السريع في نتيجة الناتجة عن التكنولوجية التغيرات ة
االبداع واالبتكار واثرها في االسهام الكبير في نجاح وتطوير مختلف القطاعات الحيوية منها القطاع الهندسي والبيئي مجاالت عديدة مثل
ة عن االبتكار التي تؤثر على المستقبل المهني وعلى الرغم من ان التطبيقات التكنولوجية الناتج التابع للمؤسسات الحكومية والخاصة.
ية مما يساهم في تغيير طبيعة االدوار والمسؤوليات التي تقع على صناع القرار مما ينعكس سلبيا او ايجابيا لعديد من الوظائف الهندسل
ذي يشجع على بناء المجتمعات على بعض المهارات الضرورية التي يجب العمل على تطويرها بشكل يتناسب مع هذا التطور السريع ال
حول واالبتكار في قطاع تصميم المعماري والبيئي في دولة االمارات العربية المتحدة.والمدن ذكية لضمان التوازن بين التغير والت
كاالبداع المحيطة التكنولوجية بالعوامل مباشرة المرتبطة االماراتي المهندس خبرة تطوير الية على الدراسة هذه وحجم تركز واالبتكار
المكتسبة من خالل تعامله مع اصحاب الخبرات الواسعة في هذا المجال والتي تتمحور حول تركيز دورة في تحويل المدن المعلومات
جازات وبناءا على التفوقات واالن الحديثة الي مدن ذكية مع الحفاظ على التراث االماراتي والبيئي اثناء اعداد تصاميم المشاريع وتنفيذها .
تى الي احرزتها الدولة في مجال االبتكار والتكنولوجيا وذلك بفضل االفكار الجديدة والطرق والسياسات المبتكرة التي تتبناها الدولة في ش
يرا المجاالت ادى ذلك الي تحمل المهندس االماراتي عدد كبير من المسؤوليات التي يجب ان يتبناها اثناء تنفيذ مهامه مما يشكل تحديا كب
لضمان وتحقيق المستقبل المستدام للمدن الذكية
تنمية تساعد على والتي الذكية المدن تصاميم واسس العمراني بالتطوير المتعلقة التخصصية التدريبية والدورات البرامج ان حضور
م المعلومات المكتسبة في إعداد المهارات التطبيقية لدى المهندس االماراتي تساعده على استحداث منهجية موحدة تمكنه من استخدا
تصاميم المدن الذكية.
تستعرض هذه الدراسة التحديات الواقعة على دور المهندس االماراتي وايجاد الحلول المناسبة بعد تحليل المشاكل التي يتم طرحها
الذكي . ، المدن الذكية ، التعلم: التأهيل المهني ، الحداثة، التصميم المستدام الكلمات المفتاحية
المقدمة
نجحت دولة االمارات العربية المتحدة في استقطاب عدد كبير من الخبراء العاملين في مجال تطوير البنية التحتية
الوطنية الجهود الذكية تماشيا مع الحديثة المدن وبناء التركيز على تصميم كان بكامل خدماتها، وكذلك للمدن
الذكي للمدن، والذي يعتبر من االوليات االستراتيجية لقادة في التصميم المعماريالرامية الي ترسيخ ثقافة الحداثة

ISSN 2708-9525
155
. كب للحداثة والتقدم الدولة لبناء مستقبل مستدام الموا الدولة تركز على االستثمار االمثل وحيث ان توجهات
الذكية المدن لتصميم لالستعداد التوجه حيث ، العالم مستوى على السريع المهندسين التكنولوجي بايدي
ماراتيين من خالل تبادل خبراتهم والحوار المشترك مع الخبراء والعامليين والفاعلين في مجال تصميم المدن اال
ان الهدف من تصميم المدن الذكية هو ادارتها بطريقة حسنه الذكية التي تعتمد على االبتكار واالبداع وما يتبعهما .
تحسين الي تهدف جديدة بتقنية على ، والحفاظ التكنولوجيا االداء على تعتمد حديثة وسائل خالل من البيئة
واالقتصاد واالجتماع الذي يؤدي الي تحسين العديد من الخدمات المقدمة مثل الكهرباء والمياه واالتصاالت ، عن
الرقمية المعلومات تقنية على المعتمدة االتصال وشبكات الذكية التحكم وسائل مست. طريق الان مدن قبل
ائم على اساس التنمية االقتصادية ، حيث ان المدن هي محطة تالقي للثقافات واالفكار، وتصاميم البنية الحديثة ق
التحتية للمدن تساعد على نشر ثقافات المتخصصين في هذا المجال.
على فية انشاءها معتمدا تركز هذه الدراسة على دور المهندس االماراتي في التعامل مع متطلبات المدن الذكية وكي
النظريات والتطبيق ، حيث يتطلب اعداد تصاميم المدن الذكية وتحويل المدن القائمة الي ذكية تحليال وفهما لعدد
كبير من التقنيات الحديثة ، اضافة الي ذلك ربط االهداف االستراتيجية للمؤسسة بخطط العمل التنفيذية للوصول
التنفيذية و اولويات العمل المرتبطة بادوات محدده وتقنية تربط تعتمد االجراءات بة.الي االهداف والنتائج المرتق
بين الحداثة واالستدامة والتطبيق على االستراتيجية التي يتبناها فريق التصميم واالعداد من المهندسين االماراتيين
ا العمل في والقائمين على تحديد مهارات ، الحكومية الجهات تتناسبالعاملين في التي التحوالت لمستقبل في
الرئيسية التي تشهدها دولة االمارات العربية المتحدة ، واالستعداد لها خالل السنوات القادمة واضعين خبراتهم
المعايير وتركيز على تطبيقها وكيفية ، الذكية المدينة ابعاد ومكونات ومتطلبات بالتركيز على والعملية العلمية
لمدن الذكية . اء ال بها لتقييم ادالعالمية المعمو
يتحمل المهندس االماراتي مسؤولية كبيرة في اعداد استراتيجية تطبيق التقنيات الحديثة في تخطيط المدن الذكية
ان استغالل بالدولة بما يتناسب ومتطلبات كل مدينة من خالل اعداد خطط تنفيذية واوليات عمل قابلة للتنفيذ.
س االماراتي هي جزء مكتسب من خبرات متعددة لمشاريع قام بتصميمها، التي يمتلكها المهندالطاقات االبداعية
كتسابه من ا تم ما واضافة ربط يجب ولكن المدن. لتصميم والبيئي االماراتي المعماري التراث على محافظا
ذا بكل ما هو جديد في هخبرات عملية مع الوتيرة المتسارعة بتقنيات تصاميم المدن الذكية على ان يكون ملما
القطاع.
أهداف البحث
كبة استراتيجية الدولة بتحويل المدن تكشف هذه الدراسة عن مدى جاهزية المؤسسات الحكومية والخاصة لموا
القائمة الي مدن ذكية وتصميم مدن المستقبل على نحو ذكي لتحسين نوعية الحياة من خالل طاقمها الممثل
كبة للحداثة والذكاء والتغيير . ائم على اعداد بالمهندس االماراتي الق التصاميم الموا

ISSN 2708-9525
156
وكذلك كيفية تحديث الية مراجعة المعايير التصميمية بهدف تحديثها الي معايير تصميم ذكية جديدة تتناسب مع
المعايير هذه اعتماد وكيفية الدولة، في المدن التأهي طبيعة الدورات نوعية كذلك العالمي، المستوى لية على
للمهندس االماراتي حتى يصبح متمكنا من اعداد التصاميم بشكل كامل مرتبط بشكل مباشر المطلوبةوالتدريبية
بالبعد االجتماعي والثقافي لسكان المدن بالدولة .
المهنية للمهندس االماراتي ال تعتمد فقط ع الممارسة ، ان تعزيز اثناء دراسته االكاديمية المكتسبة النظريات لى
كبة التطور الوظيفي المرتبط بالعل م والتكنولوجيا والخبرة ، وتنفيذ استراتيجية المؤسسة الحكومية وانما على موا
كب سياسة الدولة في هذا المجال المرتبط بالحداثة والتصميم الذكي للمدن المعتمد على التي يعمل بها ، والتي توا
ها البحث هو كيفية تعامل المهندس االماراتي مع التطور ع الي يركز عليمن اهم المواضي . واالستدامةاالبداع واالبتكار
التقني المتمثل بظهور تقنيات المعلومات، والذي ينعكس بشكل مباشر على طريقة اداءه مؤديا الي ظهور تحول
ات الرقمية والبرامج التصميمية .في االداء الوظيفي ، معتمدا على المعرفة والتقني
مهندس االماراتي وكذلك على اداء المؤسسة التي يعمل بها ، ان كانت قد حققت االهداف ييم واداء الينعكس على تق
المطلوب بالشكل الحكومة التي حددتها الى مفهوم وتعريف . االستراتيجية الدراسة ايضا في هذه الباحث تطرق
والية ، الذكية االمارات المدن المهندس ودور ، المدن هذه تصاميم ومدى اعداد التقني التطور فهم و تبني في ي
على العمل، انعكاسه تنفيذ كيفية باإلضافةالية القائمة االستفادةالي المدن تخطيط في الحديثة التقنيات من
الكادر الفني اثناء التصميم والتنفيذ والمستقبلية ، على ان يتم توضيح مفهوم المدينة الذكية والتحديات التي تواجه
سب مع استراتيجية واهداف حكومة دولة االمارات العربية تماد المعايير الضرورية التي يمكن تطبيقها لتتنا ، والية اع
.المتحدة
التعليم والتدريب المستمر واثره على االداء
ينعكس التطور التقني السريع بشكل واضح وملموس على فكر المهندس االماراتي المسؤول عن اعداد التصاميم
، مما يشكل تاثير على اعداد التصاميم المعمارية المرتبطة بالحداثة والبيئة . وعليه يجب على المؤسسات المعمارية
اليجابية لهذا التطور في مجال تخطيط وتصميم المدن الذكية، دة من هذا التطور السريع واالستفادة من االثار ااالستفا
المهندس االماراتي يجب واقع في ضوء هذا التطوير السريع .والعمل على وضع رؤية مستقبلية قابلة للتنفيذ على ال
د الي حل ان يكون قادرا على تعريف وفهم المدن الذكية من خالل التطوير والتعليم المستمر واالبداع ، والذي يقو
كية . مشاكل كثيرة متعلقة بالبيئة واالقتصاد واالجتماع واالتصال ، والخدمات المقدمة عن طريق التطبيقات الذ
ان القدرة التنافسية في االنتاج واستقطاب رؤوس االموال لتطوير المدن وتنظيم المشاريع التي تتم من خالل اعداد
ادر الفني المؤهل لكي يكون قادرا على المشاركة الفعالة التي تتسم تصاميم المدن الذكية تعتمد على خبرة الك

ISSN 2708-9525
157
التعليم ان . واالبداع التعامل في المهندس بالشفافية على يجب التي المتوفرة التصاميم ادوات احد المستمر
لى تطبيق وتحقيق اهداف واستراتيجيات المستقبل . االماراتي ان يكون ملما بها بشكل مباشر لتساعده ع
ير يتطلب تصميم وبناء المدن والمجتمعات الذكية نوعا من التوازن الفعال بين االستدامة واالبتكار والتحول والتغي
ان .من خالل مشاركة المهندسين االماراتيين مع الخبراء والعاملين في مجال االبتكار في القطاعيين العام والخاص
بعض التحديات عند التحاقه بسوق العمل، ولو تم اعداد ودراسة مخرجات التعليم لدى المهندس االماراتي واجهت
ي السريع لكانت نتائج التطبيقات اعلى بكثير مما هي المخرجات في وقت مبكر لتتناسب مع التطور التكنولوج
على الجهات المعنية في المؤسسات الحكومية التواصل المباشر مع مؤسسات عليه حاليا في بعض المؤسسات.
الحالية التعليم التحديات ، بحيث تكون قادرة على مواجهة الجامعات االمارتية التعليم في الية مخرجات لتحديد
يفرض وتقديم التي الصحيح الطريق السير على لتمكنه من االماراتي المهندس ليتعامل معها واالبداع االبتكار ها
تفعيل اسس تصاميم المدن الذكية. حلول فعالة ل
ات التعليم العالي مسؤولية كبيره في صياغة وتصميم مستقبل التعليم المرتبط باعداد تصاميم تقع على المؤسس
ه على التطور التكنولوجي السريع ، ياتي ذلك من خالل تقديم مقترحات وافكار من المهندسين المدن الذكية المعتمد
علمية المميزه في المؤسسات التعليمية في المؤسسات الحكومية . توفير الفرص والتجارب الاالماراتيين العاملين
المهندسين االماراتيين من تحسين مهاراتهم وكفاءاتهم بشكل يتناسب مع ، وجعلهم تمكن التغيرات السريعة
إعتماد معايير التعليم والتطبيق بين قطاع العمل قادرين على تحديث معايير التصميم للمدن الذكية داخل الدولة .
امعي يؤدي الي جودة في االداء الوظيفي للمهندس االماراتي في تصميم المدن الذكية ، وتبادل ومؤسسات التعليم الج
االبداعية بشكل يضمن االبداع والتفوق في العمل . اليمكن فصل القطاع االكاديمي والمؤسسات المعلومات واالفكار
ال التعلم بينهم وبشكلالعاملة في ان تكون هناك صلة ربط ، حيث يجب الوظيفي ذكي االداء متواصل لضمان
للمهندس .
ت المقدمة لالفراد والمؤسسات في الكثير ان التوسع المستمر في ثورة الشبكات العنكبوتية اثر على نوعية الخدما
ت العربية المتحدة وخصوصا مدينة دبي، التي تعمل باسلوب طموح وابتكاري والذي من الدول ومنها دولة االمارا
جابي على االقتصاد وتصرفات المواطنيين والمقيميين ، بما فيها سهولة التنقل بين المدن . تم انعكس بشكل اي
المشار خالل من الذين ذلك " المستقبل مهندسين " الطموحين المهندسين قبل من والمستمرة الفعالة كة
كتسبوا خبرات العاملين في هذا ا المستمر والمواظبة على لمجال ونشروا هذه الثقافه بشكل واسع. ان التعلما
الذكي ليس فق االستثمار ان ادرك ، حيث االماراتي للمهندس المعلومات أصبحت شغفا كتساب تقنيات إ ط في
االتصاالت وانما في التطور االجتماعي واالقتصادي لالفراد الذي يعزز جودة الحياة واالستدامة .
دفعت الحكومة وبشكل مكثف معظم المهندسين االماراتيين العاملين في هذا المجال الي دورات تدريبية مكثفة
اطا وضع على قادريين ليصبحوا ، الذكية المدن بتصميم بجميع تتعلق والتنفيذ التصميم عملية يدير شامل ر

ISSN 2708-9525
158
. المجال هذا في المعتمدة االستراتيجية مع يتمشى ما حسب والتدريب جوانبها التعليم سياسية على وبناءا
المجال كفاءة في هذا الناس كثر ا االمارات من خالل استقطاب دولة انتهجتها التي االماراتي للمهندس المستمر
، العاملين المجال حيث اصبح المهندس قادرا على دمج لتدريب الدول تقدما في هذا كثر ا الدولة فقد اصبحت
بطرق مب الجديدة الشبكات االفكار المتوفرة في المعلومات كمية ، مستفيدا من الذكي التصميم تكرة في مجال
الحياة الجديدة المرتبطة االلكترونية ليتم ترجمتها على الواقع بتقديم تصاميم ذكية للمدن تتناسب مع متطلبات
بالذكاء االصطناعي والتكنولوجي المتوفر .
تصميم المدن الذكية الحكومات في تحفيز وتفعيل دور
ان نجاح تصميم المدن الذكية يعتمد على التشجيع المستمر لمسيرة التميز ، االبداع ، االبتكار والبحث العلمي
مجال التصميم ، في القطاعين العام والخاص لخدمة الخطط التنموية لجميع المهندسين االماراتيين العاملين في
وتعزيز ثقافة االبتكار في التصميم لدى المهندس االماراتي في إعداد المواصفات التي تنتهجها الدولة . ان نهج ترسيخ
المعرفية ، مما للمدن الذكية تعزز القدرات البحثية في مختلف المجاالت التخصصية التي تتناسب مع المتطلبات
االب في بيئة محفزة خلق تساعد على فرص الى وتحويلها التحديات على التغلب على بين يساعده واالبتكار داع
المهندسين .
يتوجب على المؤسسات الحكومية المتخصصة في قطاع التصميم الهندسي توفير منصة استراتيجية لتحفيز االبداع
الذكية ، باعتبارها اسس رئيسة لتحديد مواصفات حديثة لتصاميم المدن الذكية واالبتكار والتميز في تصميم المدن
ذل ان . عالميا جميع المعتمدة في العاملين التخرج حديثي المهندسين بين الثقافة هذه نشر على يساعد ك
المهندس االماراتي ع الواقعه على عاتقهم ان ذلك يساعد بالمسؤوليات التزامهم لى تحويل القطاعات من خالل
في هذا المجال ، التحديات الي فرص مما يؤدي الي خلق حلول فعالة من شانها تحقيق الرؤية التي رسمتها الدولة
والهادفة الي بناء مجتمعات ذكية ومستدامة معتمدا على االبداع واالبتكار. على المهندس االماراتي ان يكون متميزا
الذكي من خالل التقارب الفكري وتحفيز الطاقات االبداعية والتركيز على في المجاالت المتعلقة بالتعليم والتصميم
لذي يؤدي الي تحقيق الهدف االستراتيجي في هذا المجال المرتكز على االبداع والتحول االمكانيات البحثية بالشكل ا
لتشغيلية للمشاريع والتطوير المستمر. يساعد ذلك على فهم وادراك المهندس للسياسات االدارية والتصميمية وا
المعتمده على افضل الممارسات االبتكارية والحلول السريعة.
كاديمية في تصميم المدن الذكية المؤسسات اال مسؤولية
تتحمل الجامعات والمؤسسات التعليمية بالتعاون مع المكاتب االستشارية دورا كبيرا لتحقيق االهداف الطموحة
وتحو الذكية المدن تصميم المخرجات لمبادرة بان سابقا ذكر كما حيث ، العالم في االذكى المدينة الي دبي يل
ة لها دور محوري في دعم هذه المبادرة ، التي يجب ان تتبنى مناهج التعليم الذكي التعليمية للتخصصات الهندسي

ISSN 2708-9525
159
الضرو المهارات سقل على تساعد التي الدراسية والمقررات المناهج تطوير خالل من الدولة لمهندس في رية
المستقبل.
ز ، تتماشى مع اسس تصميم على المهندس االماراتي ان يكون معززا بمهارات خاصة تعتمد على االبداع والتمي
والتحليل التفكير قادرا على ان يكون الذكية. كذلك يجب عليه بالمعرفة بناء مدن مدعمه الي يؤدي المدن مما
ذ تصاميم العداد التصميم اليات معتمدا على لتعزيز الجامعة تخرجه من بعد عليها يعمل التي للمشاريع كية
المفاهيم الحديثة في هذا المجال .
العمل التقليدي لمهندس التصميم االماراتي
من اهم االدوار التي تقع على عاتق المهندس االماراتي العامل في مجال التصميم في المؤسسات الحكومية هي
ا فيها اعداد التصاميم االولية لمشاريع هذه المدن ، ومن ثم العمل على اعداد التصاميم تصاميم واعداد المدن بم
م اعضاء فريق عمله باعداد جداول الكميات والقياسات للمواد التي تستعمل لبناء المشروع .ثم يقوم النهائية ليقو
الي ذلك فهناك بعض المسؤوليات فريق العمل باعداد الوثائق التعاقدية وطرح المشروع على شكل مناقصه.اضافه
لخاصة بترميم المباني القديمة ، وتحديث تتعلق بتطوير البنية التحتية للمدن وكذلك تصميم وتنفيذ بعض االعمال ا
البعض منها بغرض الحفاظ على هويتها المعمارية ، اضاقة الي الحفاظ على المحيط البيئي للمدينة. هناك ادوار
ال وتطوير وضع في بعض تتعلق خالل من االنسان متطلبات مع تتناسب التي المشاريع لبناء الخاصه معايير
. ان الحداثة واالستدامة في اعداد تصاميم البناء تلقى ترحيبا واستحسانا من كل فئات المهندسين االختصاصيين
كبة للتغيرات التكنولوجية الحديثة المؤدية الي احداث المجتمع ، والتي تتناغم وتتناسب مع استراتيجية الدولة الموا
ف يكون هناك تغيير ملحوظ في تحول جوهري كبير في طريقة اعداد التصاميم وهي تصاميم المدن الذكية . سو
كبا مع التغيرات السريعة المتناسبة مع سياسة تصميم المسار الوظيفي للمهندس االماراتي ، حيث سيكون موا
ي بيئة العمل الحالية والمستقبلية. المدن الذكية التي يجب ان تكون متبعه ف
على تعتمد ان يجب االماراتي للمهندس المهنية الممارسة تعزيز للتطور ان الحديثة واالطر السبل كبة موا
التكنولوجي السريع ، مما يدعو الي اعداد برامج تخصصية لتاهيل المهندسين ، حيث يكتسبوا المهارات الضرورية
. ان العمل على لتتناسب مع طبيعة االعمال التكنولوجية السريعه بالثورات تاثرت التي الجديدة والمسؤوليات
المدن مستقبل فهناك تخطيط ، المجال هذا في العاملين االماراتيين المهندسين مسؤولية على يقع الحديثة
اولويات التي هي من الذكية المدن تتعلق في تصميم االماراتي المهندس تواجه كبيرة الحكومة واحدى تحديات
التحديات لهذه مدركا يكون ان االماراتي المهندس على للدولة. الرئيسية التخطيط االستراتيجيات تواجه التي
الحضري للمدن وتصاميمها الذكية ، فهناك العديد من التحوالت ومن اهمها تصميم المدن الذي تعتمد على عدد
دد السيارات المستخدمة فيها ، كذلك الكثافة السكانية في هذه من المحاور واهمها ، مساحات الطرق اليستيعاب ع
المناطق فيها بما المناطق وتنويع تاثير المدن فهم فهو الثاني التحول اما والسياحية. والترفيهية االقتصادية

ISSN 2708-9525
160
فراد في التصاميم الحديثة على االفراد في المجتمع وكيفية التعامل معها ، لينعكس ذلك على توفير احتياجات اال
اد التصميم اقل وقت ممكن بناء على اعداد تصاميم ذكية تساعد على سهولة الوصول من نقطة الي اخرى عند اعد
. يؤدي هذا الي تخفيف االزدحام واسعاد المستخدمين لهذه الطرق ، ويلعب عامل االبتكار دورا كبيرا في هذه المرحلة
ات جديده تحت االرض كاالنفاق المجهزة الكترونيا ، والذي يتطلب حيث يتوجب على المهندس االماراتي ابتكار مسار
على خبرة كافية بالتعامل معها . وجود بنية تحتية على المهندس ان يكون
على صناع القرار خلق اليات تجمع بين دمج المهندسين والعامليين في تطوير الطرق والبنية التحتية مع الشركات
ما التحول الثالث فهو التحول في طريقة العيش في المدن التي سوف يتم تصميمها المتخصصة في هذا المجال . ا
تصميمها بشكل ذكي ، والتي تؤثر على اسلوب الحياة الناتج عن تطبيقات الذكاء االصطناعي في العمليات او اعادة
وكيفية تصنيفها والية التصميمية . لذلك فان المهندس االماراتي يجب ان يكون قادرا على التعامل مع البيانات
رة الناتجة عن انترنت االشياء والتكنولوجيا الحصول عليها ، حيث سيكون هناك كميات كبيرة من البيانات المتوف
الحديثة والتي تساعد على اعداد التصاميم الذكية للمدن .
الحياة المدن ، حيث تغيير اسلوب الموارد في التحوالت فهو طريقة استخدام المدن يتطلب فهم اما اهم داخل
كثر كفاءة وتكون صديقة ئة . حيث سيعمل المهندس على توفير مصادر للبي طريقة االستهالك للموارد ، لتصبح ا
النتاج الطاقة من اي مشروع يقوم بتصميمه ليصبح هذا المشروع مولدا للطاقة . يؤدي هذا الي انخفاض تكلفة
زين الطاقة المنتجة من كل منزل ، وتوفير الشبكة الذكية لتوزيع الطاقة حيث الطاقة وزيادة الكفاءة االستيعابية لتخ
النظام الالمركزي لتوزيع الطاقة المعتمد على تكنولوجيا البلوك تشين ، مما يتطلب معرفة المهندس يمكن اعتماد
بطريقة اعداد التصاميم الخاصة بذلك والتي تتطلب التعامل الصحيح مع البيانات.
ت الرئيسية االخرى والتي قد تشكل تحديا رئيسيا للمهندس االماراتي عند تصميمه للمدن الذكية التحوال ان احدى
تتطلب التي الغذائية المحاصيل النتاج للزراعة مساحات توفير والية الزراعية االراضي مع تعامله كيفية هو ،
زيادة عدد السكان في المدن داخل الدولة تعلقة بنات الماستخدام مدروس للمياه والطاقة . يتطلب ذلك تحليل البيا
لري الالزمة المياه وكمية الضرورية الطاقة توفير الضرورية من خالل الزراعية المحاصيل توفير يتضمن الذي ،
يتم التي واالراضي للمساحات التحتية والبنية االعمال جودة تطوير ان . االراضي من المساحات هذه وتطوير
ن مهام المهندس االماراتي ، ليقع على عاتقه الكثير من التحديات التي يمكن تحويلها الي رئيسي مها جزء تطوير
فرص لتصميم المدن الذكية داخل الدولة.
احد المسؤوليات االخرى التي تقع على المهندس االماراتي هي فهم وتطبيق التشريعات المتعلقة بتصاميم المدن
يعتمد والذي ، الحالذكية المدن دون وكمة فيعلى نماذج تصاميم داخل اعداد الحكومي حيث ال يمكن العمل
المعتمد على الخاص القطاع كة مع بالشرا للسكن توفير حلول وخدمات دورها ستتمكن من التي في حوكمة
دن كان الماالبتكار والعصف الذهني. يجب على المهندس ان يكون ملما في اعداد وتصميم الخدمات التي تناسب س

ISSN 2708-9525
161
ل المعلومات والبيانات المتوفرة لديه، حيث يجب على المهندس االماراتي ان يكون قادرا على فهم احتياجات في ظ
كب سرعة التغير التكنولوجي المدن الحديثه ومدن المستقبل المعتمده على التصميم الذكي ، وكذلك عليه ان يوا
كثر فاعلية لمواجهة اي تحديات محتملة التي يجميم ، والتي تؤثر على االليات والسياسات الحالية للتص ب ان تكون ا
تؤثر على جودة حياة الناس والتصاميم الذكية . استخدام الحلول الذكية المتاحة المعتمدة على الذكاء االصطناعي
ستكون احد المهام الرئيسية التي تقع على مسؤولية المهندس االماراتي عند تصميمه للمدن الذكية.
ذكية لمدن المفهوم ا
ان التطور السريع الحاصل في مجاالت التصميم وتقنية المعلومات ادى الي تطور متواصل في المعلومات واالتصاالت
، مما انعكس على نوعية االنشطة والمجاالت والمهارات التي يعمل بها المهندس ، حيث اصبح تنفيذ جزء كبير من
ان التطور التقني ساعد في تخطيط وتصميم المدن الذكية التي ديثة . جيا الحالمهام يعتمد على تقنيات والتكنولو
تعتمد على التقنيات .ان المدن الذكية تضم مجموعة واسعة من الشبكات الرقمية والتطبيقات االلكترونية ، وتقدم
مجتمع راضي للراغ افتخدمات اقتصادية واجتماعية في عدة مجاالت مثل التجارة والتعليم والعمل والترفيه ، فهي ف
( 2003، يقوم الخدمات التي تتم عادة في الفراغ الفيزيائي للمدينة. ) فريحات & حيدر,
ان تصاميم المدن الذكية تعتمد على معايير واستراتيجيات مدروسة وتقنيات متعدده مرتبطة بالتطور التكنولوجي
ال وتحقيق للوصول البداية نقاط الذكية هي المدن الالسريع. االجتماعية مستدام عالم المجاالت والمعتمد على
واالفتراضية ، وهناك عناصر عديده تعتمد وتتاثر بالذكاء االصطناعي مثل تخطيط المدن وعملية النقل. ان مصادر
الطاقة ، التعليم ومخرجاته ، مشاريع االبنية بجميع انواعها ، البنية التحتية وخدماتها تعتمد على تخطيط عمراني
ح لدي المهندس االماراتي بان مفهوم تصاميم المدن الذكية المستدامة يعتمد على النمو الذكي حيث يتضتكامل .م
المرتكز على المعرفة واالبتكار والنمو المستدام المعتمد على كفاءة وخبرة الموارد والتكافل االجتماعي ، الناتج عن
حضارات. ان المهندس االماراتي يجب ان كافل الخالل ت تحقيق النمو الشامل والمستمر في جميع القطاعات من
يكون مدركا بان مكونات الشبكات الذكية للمدينة العمرانية المعتمدة على البنية التحتية لنقل المعلومات الذكية
والتكنولوجيا المتقدمة بمعلومات االتصاالت تساعد في تطوير وتخطيط المدن ، حيث الرؤية االستراتيجية للدولة
على المعتم هذه دة ولتحقيق والتطوير. البحث كز ومرا المعرفة ، االبتكار ، االستدامة مثل متعدده الخصائص
مشروعا 75االستراتيجية فقد صرح مدير عام ورئيس مجلس المديرين في هيئة الطرق والمواصالت بدبي عن انجاز
لذكية والبنية التحتية والمركبات مؤسسة ااريع الضمن برنامج المدينة الذكية والذكاء االصطناعي ، توزعت بين مش
(.2019الذكية وادارة البيانات والذكاء االصطناعي والمواصالت الذكية المستدامة .) مطر الطاير ،
تقديم والرفاهية للسكان من خالل السعادة بتحويل دبي لمدينة ذكية تحقق الهيئة الي مساهمة يؤدي ان ذلك
ة محور التنقل الذكي باعتبارة احد اعمدة المدن الذكية وضعت الهيئة راحة ا الهمي، ونظر خدمات عالمية المستوى
السكان والرفاهية العيش في دبي في قمة اولوياتها في تخطيط وتنفيذ المشاريع وتوظيف التقنيات الذكية لتقديم

ISSN 2708-9525
162
ريع الجديدة التي ن المشاح عدد م خدماتها للمتعاملين اعلن مدير هيئة الطرق والمواصالت بان الهيئة ستقوم بطر
تتضمن تنفيذ محاور جديدة للطرق والبنية التحتية لتحقيق انسيابية في الحركة المرورية الي جانب تعزيز اسطول
حافالت العامة لرفع كفاءة خدمة خطوط الحافالت بما يحقق السعادة لمستخدمين وسائل النقل الجماعي للعديد
(.2017دولة .)مطر الطاير ، ة في الالمقيم من االفراد من جميع الفئات
الخدمية الحكومية المؤسسات المتحدة اعتماد العربية من االهداف االستراتيجية لحكومة دبي في دولة االمارات
بااللتزام بمعايير التصاميم الذكية في مشاريعها من خالل المهندسين العامليين بها ، حيث ان االلتزام المؤسسي
اال احد لهو اهداف بالمدن تحقيق الخاصة المعايير بتطبيق المؤسسات الزام هذه والمعتمد علي الستراتيجيات
الذكية ، وهي نوعية الحياة الجديدة لالفراد المبنية على السعادة ، البيئة الذكية في تعاملتها ، منظومة االمن والسالمة
الذكي باحدث المواصالت ، االبتكار المستمر التنقل عمال ، في المدن ، التقنيات الذكية ، وجود حكومة ذكية تسير اال
والمعرفة المبنية على االستدامة القائمة على التواصل المستمر بين القطاعين العام والخاص. ان ذلك يؤدي الي
جعل دبي مدينة من افضل المدن للعيش في العالم من خالل تجسيد رؤية القيادة الرشيدة بحرصها على االهتمام
ذلك من خالل تصريح سعادة العضو المنتدب ، الرئيس التنفيذي لهيئة كهرباء ومياه دبي بمناسبة ن . جاءباالنسا
اعتماد الموازنه العامة لحكومة دبي بان القيادة الرشيده حرصت على االهتمام باالنسان كونه حجر االساس في مسيرة
د حكومة حرص على الضوء يسلط مما المستدامة على التنمية واالبتكار االهتمابي واالبداع الحكومي بالتميز م
دبي تحقيق خطة في تسهم حديثة تحتية بنية تطوير الي اضافة ، العلمي المكان 2021والبحث دبي تكون بان
(.2019المفضل للعيش والعمل والمقصد المضل للزائرين .) سعيد محمد الطاير
ا المدن الذكية عن غيرها من المدن ال لمعتمدةتتميز كاداة لالستثمار على الرقمية باستخدامها لالدوات تقنيات
الذكاء في حل المشاكل من خالل تركيزها على البعد االجتماعي والبيئي ، معتمدتا في ذلك على مفهوم االستدامة ،
تشجيع فه الي ويتم ذلك من خالل ادراك المهندس االماراتي على تصوره المكانيات وعناصر المدن المعرفية الهاد
لعلم والمعرفة وتوضيح تطبيقاتها على الخدمات الحكومية المقدمة ، وعليه ان يكون مدركا لنوعية هذه الخدمات ا
، و يجب ان تكون المناطق العمرانية التي يتم تصميمها بواسطة المهندسين االماراتيين مدعمة بواسطة شبكات
على االستدامة البيئية واالجتماعية . معتمده ة ذكية وتقنيات رقمية مستخدمة من قبل االفراد بطريق
ان ابعاد معايير التصاميم المدن الذكية مرتبط بشكل اساس بنظريات النمو العمراني التقليدية ، المعتمدة على
اة النقل واالقتصاد والموارد الطبيعية ، ودمج هذه المعايير مع معايير التصميم الذكي يؤدي الي اقتصاد ذكي وحي
ناتجة عن حكومة ذكية ، وهي احد االهداف المنظورة لتحقيق استراتيجية دبي في الدولة . لذلك على مطورة ذكية
المهندس االماراتي ان يكون مدركا لنتائج تطبيق هذه المعايير ومدى انعكاسها على تحقيق االهداف االستراتيجية
ها بشكل صحيح بعد ربطها بمخرجات ، وفهم تطبيقاتمن خالل التدريب المهني والعملي المستمر على هذه ال
التعليم الجامعي اثناء دراسته الجامعية. حيث يجب ربط عملية التطوير واالبداع والتدريب الذاتي للمهندس الذي
يمارسه اثناء فترة عمله بالمؤسسات باسلوب ومقومات ومخرجات التعليم الجامعي ، الذي يجب ان يشجع الطالب

ISSN 2708-9525
163
عتماد على نفسه في البحث عن الجديد وعن االبتكار واالختراع والممارسة المستمرة . ان على االلهندسة في كلية ا
التعليم والتدريب الهندسي الذي يمثل حالة ديناميكية مستمرة وليس حاله اجتماعية او اعتيادية .) راضي محسن
(.2002الزبيدي ،
ت والتي يتم تسجيلها على رقائق ذكية تخزن فيها المعلوما تقنية جمعان معايير تصاميم المدن الذكية يعتمد على
البيانات وتحليل معالجة ويمكن ، سريع بشكل البيانات لنقل بصرية الياف خطوط خالل من أو المعلومات
والمعلومات بواسطة ادوات معالجة تتواصل وبشكل مباشر مع الفراغات العمرانية ، حيث تعتمد المدن الذكية
هذه البرامج ومن اهمها نظم المعلومات الجغرافية ، وهي عبارة عن مجموعة من البرامج تنوعة من مجموعة م على
اهم ان . المدن وتحديد مساحاتها االماكن في توزيع بيانات تعتمد على انشاء قاعده بواسطتها للمهندس يمكن
ر عن هذه البيانات حيث واالستفساالبيانات وظائف نظم المعلومات الجغرافية هي التمثيل المكاني والربط بين
يمتاز نظام المعلومات الجغرافي بقدرته على ربط المعلومات وقواعد البيانات المرتبطة بالمكان مع القدرة الفائقة
(.2004على تخزين واستدعاء وتحليل البيانات .)السعيد & ناصر احمد
السكنية او الصناعية التي يريد تصميمها وبشكل ان هذا النظام يساعد المهندس على تحديد البيانات للمناطق
ذلك تحديد المواقع التي يصعب الوصول اليها ، مما يتيح سهولة التعامل مع بيانات هذه المواقع من سريع ، وك
تحتوي على ادق التفاصيل المطلوبة للتصميم خالل تطبيقات النقل الذكي ليتم انتاج مخططات وخرائط موقعية
الذكي.
تصم المان يسمى يم ما تطبيق مثل متنوعة الكترونية تطبيقات لتطوير الفرص من العديد يتيح الذكية دن
، االماراتي بالتراث التي تحتفظ االثرية و التاريخية والمناطق السكنية العمرانيه المناطق االلكترونية في بالسياحه
يل الرقمية والصورية. كذلك يمكن تطوير ستطيع المهندس تطوير مخططات ثالثية االبعاد بكامل التفاصحيث ي
افتراضية مد تدعم جوالت التي االضافات احد . بصرية الكترونية االبعاد من خالل مسارات ثالثية بتقنيات عمه
د على االلكترونيات والشبكات التقنية ، تصاميم المدن الذكية هي العمل على تصاميم المباني الذكية والتي تعتم
اللكترونية المعتمدة علي بيانات باجهزة حساسة مثل الكمبيوترات ، الكاميرات ، والحساسات احيث يتم تجهيزها
المغذية لهذه االجهزه مما تساعد على راحة مستخدمي هذه االبنية .
مليات التكيف واالضاءه والري الداخلي للحدائق سهولة تتيح الية التحكم االلي او التحكم عن بعد للمستخدمين بع
المستخدمالت ويسعد االستهالك مصاريف يقلل الذي والتحكم من شغيل العديد على السيطرة يتم حيث ين
التقنيات باستخدام ارتبط بانه مصطلح الذكية المباني تعريف تم االبنيه. هذه تزعج مستخدمين التي العوامل
لذكي على انه وسيلة تساعد الزوار م التصرف االلي المستجيب للمتغيرات وحدد مميزات المبنى االحديثة التي تدع
على بصمة الصوت ومالمح الوجه حيث يساعد على التغلب على معوقات تحديد الهويه. والقاطنيين على التعرف
(.2007)على & خالد يوسف

ISSN 2708-9525
164
كومي ، حيث يتم التركيز على استخدام الوسائل االلكترونية ما ذكر اعاله يعتبر جزءا من تطوير منظومة العمل الح
قديم الخدمات من خالل قنوات متعدده ، حيث يتم الحديثة لتساهم في تطوير منظومة معايير المدن الذكية لت
، توفير الوقت والتكلفة في هذه الخدمات . ان خدمات الحكومة االلكترونية تعتبر عنصر اساس لتنمية المدن الذكية
ت يتم التي المدن العمل في الية الية تطبيقها تحدد العديد من فان ، وهناك بيئة عمل ذكية توفير صميمها مع
ت التي تقدمها الحكومه الذكية مثل تقديم كافة الخدمات الحكومية للمواطنيين الكترونيا مثل تراخيص الخدما
ذلك تساهم في تبادل المعلومات والمراسالت بين البناء والمخططات الموقعية للمبنى عبر شبكات االنترنت وك
(.2007لحكومية بمختلف مستوياتها .)يوسف وائل محمد االدارات ا
معوقات تصاميم المدن الذكية
ان قلة وضعف المكونات االساسية لتقنية المعلومات تشكل تحديا رئيسيا امام المعايير التطبيقية لتصاميم المدن
مهندسين المستخدمين علومات الضرورية ليس بالشيء السهل ويشكل عائقا ملحوظا للالذكية ، حيث توافر الم
ملحوظ في التنمية العمرانية او التنمية مشاريع البنية التحتية للمدن من خالل لهذه المعايير ، مما يؤدي الي تاخير
تطبيق معايير التصميم الذكي.
ؤسسات التعليمية في معظم الدول ال يتناسب مع ما يتطلبه ان عدم تطابق وتوافق المخرجات التعليمية في الم
ول ، حيث يشكل هذا تحديا كبيرا للمؤسسات القائمة وق العمل ، وال يتناسب مع االهداف االستراتيجية لهذه الدس
على تحقيق استراتيجياتها باستخدام التصاميم الذكية في مشاريعها ويؤدي الي نقص في الكوادر المؤهلة لتطوير
التحدي الرئ المعلومات. وللتغلب على هذا يسي يجب تطوير خطط وبرامج تدريبية للمهندس واستثمار تقنيات
رفع الكفاءات والمهارات التي يجب ان يتمتع بها ، من خالل تعاون مشترك بين المكاتب الهندسية وبشكل مستمر ل
ن االماراتيين في الدولة . ان تعزيز دور المتخصصة في مجال التصميم والمؤسسات التنفيذية وجمعية المهندسي
من الكوادر الهندسية وتوظيفها ية في عجلة التنمية من خالل تطبيق اسلوب مدروس لالستفادةالمكاتب الهندس
(. 2004لتدريب المهندسين.)ضياء الدين توفيقي ،
وصحة المعلومات المتوفرة" على احد التحديات القائمة والملموسة في هذا المجال " المصداقية في التعامل " "
ت حيث المعلوماتية والمؤسالشبكات االشخاص اسماء من للعديد والعناويين االسماء الوهمية ضارب سات
اعتماد في والمصداقية الثقة وعدم المعلومات في تضارب الي ذلك يؤدي ، االسماء لهذه المستمرة والتغيرات
ان لملكيتها. تتطلب حفظا التي المدالتصاميم تصاميم االصطناعي في الذكاء استراتيجية تطبيق الذي تنفيذ ن
والتحديات ودراستها بشكل مفصل وايجاد الحلول والبدائل يتطلب من المهندس االماراتي تحديد دقيق للمعوقات
المدروسة لكل مشكلة . ان ذلك يساعد على تحويل المدن القائمة الي مدن ذكية حيث يساعد ذلك على اختيار
للمدين المناسبة االهداف المناسبة حسب الذكية وامكانية التطبيقات الذكي باالسلوب اعداد تصاميمها المراد ة

ISSN 2708-9525
165
التصاميم المعتمدة على ركائز ومعايير التطبيقات االلكترونية . ان ضعف البنية االساسية لتقنية المعلومات تطبيق
ة ، الن ذلك يتطلب كلف اضافية ناتجة عن اجور التدريب تشكل عقبة رئيسية امام تطبيقات تصاميم المدن الذكي
خصصة في هذا المجال ، وان عدم وجود اطار قانوني ستمر للمهندسين واجور االستعانة بالمؤسسات العالمية المت الم
هذه لتنفيذ المتميزة والكفاءات المهارات نقص يسبب تطبيقاتها وطرق البيانات مع التعامل بطريقة للتحكم
يقات.التطب
) خصصة في تقديم الخدمات االستشارية في هذا المجال ولتغلب على العديد من التحديات فان المؤسسات المت
التصميم الذكي ( يجب عليها ان تدرك بان المجاالت التخصصية في التدريب المستمر البد ان تعتمد على البحث
كبة التقدم التكنولوجي في مجاالت عديدة يعت مد عليها المهندس االماراتي اثناء ممارسة عمله ، الن المستمر وموا
لثقة في قدراته على اتخاذ القرار، معتمدا بذلك على يعزز من خبرته واداءه في العمل وتحديث معلوماته ومنحه ا ذلك
كزا على خبرات عديده ومنوعة في ادارة التنمية في المدن العمرانية واالعتبارات البيئية للمشاريع المستقبلية ، مر
نية الجتماعي للتصميم الحضري المرتكز على التطبيقات االلكترو تطبيق معايير االستدامة العالمية وتقييم البعد ا
والذكاء االصطناعي حيث تبدا هذه المرحلة من المهندس الذي يشكل عجلة العمل الهندسي ، فمن خالل االرتقاء
الفني ومهاراته المعرفية قدراته وتطوير وتكنولوجبكفاءته علمية امكانيات يتاح من ما توظيف يمكن فانه ، ية ة
(. 2002.)على محمد السواط & هاشم عبد الصالح بأقصى مرور لتطوير واقع العمل الهندسي في دول المنطقة
على المهندس االماراتي ان يكون فاهما ومدركا لمتطلبات وتطبيقات المدن الذكية والمشاكل والتحديات التي تواجه
عات المطلوبة لتحويل المدن القائمة الي مدن ذكية مع تطبيقات التصاميم الذكية ، ومبادئ االستراتيجية والتشري
ل غير تقليدي ، وال يخلى االمر من وجود معوقات وصعوبات الفهم الكامل اللية وبناء وتصميم المدن الذكية بشك
التي يجب التغلب عليها وتحويلها الي فرص وتحسينات النجاز العمل بطريقة افضل تتناسب مع توجيهات ورؤية
الحكومة ستمكن الحكومة بان الرشيده في دبي حيث صرح سمو الشيخ حمدان بن محمد بن راشد ال مكتوم
ية لالبتكار في تصميم حلول مبتكرة للتحديات والمعوقات ، فريادة المدن في المستقبل ترتكز المنصات المجتمع
سمو الشيخ ير تقليدية .)على مدى مرونة تشريعاتها على استخدام التكنولوجيا المجتمعية في تصميم حلول غ
(. 2019حمدان بن محمد بن راشد ال مكتوم ,
العمراني النمو التي شهدت تطورا سريعا في المدن كثر ا المتحدة من العربية تعتبر مدينة دبي في دولة االمارات
واستقطبت العديد وركزت في العقديين االخيرين على تطوير البنية التحتية باحدث المواصفات والمعايير العالمية ،
من خبراتهم في تنفيذ استراتيجية الدولة ، حيث أسست من الخبراء والمهندسين وكذلك المستثمرين لالستفاده
المدينة بيئة عمل مدعمة بقوانين وتشريعات لحماية كل من يعمل باالمارة في جميع القطاعات. ركزت استراتيجية
وني تناسب وطبيعة التحول السريع من النظام التقليدي الي النظام االلكتراالمارة على العمل في البنية التحتية بما ي
حيث ان تحويل مدينة دبي الي مدينة ذكية في االطار االستراتيجي الذي تبنته حكومة الدولة بعدم االعتماد على النفط
(.2001محمد & مجدي كمورد رئيسي لالقتصاد بل التركيز على العوامل االقتصادية والتجارية للمدينة .)جاسم

ISSN 2708-9525
166
من خالل االستفاده من تقنيات معلومات الشركات العالمية التي وكان المحرك الرئيسي لتنفيذ هذه االستراتيجية
تم استقطابها ، وتم تأسيس افرع كثيرة لها في مدينة دبي لالنترنت التي تم تاسيسها لهذا الغرض ، ونتج عن ذلك
المجال ك تم التركيز على استدعاء الخبرات التي تتمتع بمهارات عالية في هذازياده في المؤشر االقتصادي . كذل
المتواصل الدعم المجال من خالل هذا في العاملة والمؤسسات واالفراد الحكومية القطاعات بين الثقة وتعزيز
مجال التصميم الكمال البنية التحتية للمدينة والتغلب على كل التحديات التي تواجه المؤسسات المتخصصة في
للمهندسين االماراتيين دور كبير لالستفاده من الخبرات المعتمد على تكنولوجيا المعلومات في ذلك الوقت . كان
التخصصية التي تم استقطابها من خالل نقل المعرفة وتبادل الخبرات وخصوصا المهندسين العاملين في القطاع
الي مدينة الكترونية وخصوصا في القطاع الحكومي الذي قدم وال الحكومي حيث بدات مالمح التحول في المدينة
دم افضل الخدمات للمؤسسات والمشاريع واالفراد. زال يق
الموظفين مما يسهل عليهم سرعة الحكومية في متناول جميع الجهات بيانات متوفرة لدى أصبح هناك قاعدة
المقدمة من االفراد او المؤسسات االستثمارية. لقد ساعد هذا االنجاز على تسهيل اتخاذ القرار لتنفيذ المشاريع
ا التطبيقات االجراءات يتخذ من خالل اجراء كل في الدقة على تحتوي التي المعلومات بدقة والمتميزه لمقدمة
ت االلكترونية السريعه . كان للتعليم االلكتروني احد االهداف التي تم التركيز عليها من الحكومة حيث اثمرت وحقق
الحكومي عن والقطاع التعليمية المؤسسات بين كات والشرا اساسيات المؤتمرات بدمج تتعلق ايجابية نتائج
التعليم بقطاع التكنولوجيا الذي يعتبر احد ركائز تصميم المدن الذكية . تم نشر ثقافة التصميم الذكي بالجامعات
يث من المهندسين قادرين على استخدام جميع وتحديدا كليات الهندسه بجميع تخصصاتها بهدف اعداد جيل حد
تي تساعدهم على اعداد تصاميم ذكية. التطبيقات االلكترونية ال
ان انضمام هذا الجيل من المهندسين للعمل في القطاع الحكومي يعزز االداء على أعلى المستويات في منظومة
شكيل فرق عمل لعشرة مشاريع تطويرية لها العمل االلكتروني الحكومي بامارة دبي ، حيث قامت حكومة دبي بت
الجهات الحكومية ضمن مبادرة " في دبي نتعلم " التي ينفذها برنامج دبي للتميز الحكومي عالقة بالتصاميم الذكية في
كبة الوتيرة المتسارعة للمتغيرات العالمية وضمان الحفاظ على االنجازات لالمانة العامة للمجلس التنفيذي لموا
تروني متخصص بالمقارنات المرجعية ة في اطار المسيرة التنموية الشاملة المارة دبي ورصدها في موقع الكالمتحقق
. هدف هذه المبادرة الي نقل وتبادل المعرفة في القطاع الحكومي االلكتروني ورصد مستويات االداء والوقوف على
عم الذكي والتكنولوجيا المطبقة التي تساعد مع المشاريع المتقدمة والمتطورة في مختلف القطاعات من خالل الد
اعي بروح الفريق الواحد. تطوير نهج العمل الجم
خالل من والعالمية المحلية الممارسات افضل وتسخير المؤسس التعلم ثقافة تعزيز الي المبادرة هذه تهدف
الحكومي ف القطاع المعرفة في المعتمدة عالميا ونقل وتبادل الذكية . ويتم تطبيق مشاريع المعايير امارة دبي ي
عمل فرق قبل من المرجعية متخصص المقارنة بشكل تدريبها يتم مشاركة حكومية جهة كل من هندسية

ISSN 2708-9525
167
ال الشيخ حمدان بن محمد بن راشد كد سمو أ العالمية. الممارسات التعلم من افضل انشطة واالشراف على
ع شخصيا منظومة العمل الحكومي في دبي ونتائج مستويات مكتوم ولي عهد دبي رئيس المجلس التنفيذي سأتاب
على تقدم مشاريع وخطط التطوير والوصول الي اعلى مستوياته في مختلف القطاعات للحفاظ على االداء للوقوف
كد مواصلة العمل على اعداد عقول قيادية مبدعة وقادرة على تكامل عناصر منظومة العمل الحكومي ، كذلك ا
(.2019القياده الحكيمة.)سمو الشيخ حمدان بن محمد بن راشد ال مكتوم , ترجمة رؤيا
لقد حقق عدد كبير من المهندسين االماراتيين العاملين في القطاع الحكومي انجازات كبيرة جدا في التصاميم الذكية
ا البنية تطوير يتم حيث المجال هذا في االختصاصيين المهندسين من كبير عدد مع لشبكة بالتعاون لتحتية
ة لكثير من مجمعات البحث والتطوير االلكتروني ، بغرض االتصاالت وانشاء مدينة محمد بن راشد للتقنيات الحاضت
كز تدريبية وتعليمية. االستدامة وكذلك قرية المعرفة التس تستقطب طاقات ابداعية وتخصصية وتحتوي على مرا
دارة واستقطبت العديد من خبراء التكنولوجيا واالنترنت. ومن أهم أما مدينة دبي لالنترنت فهي معلم أساسي في اال
نجازات التي حققتها االمارة في هذا المجال هو مجال النقل الذكي ، حيث تم رفع كفاءة شبكة الطرق والجسور اال
على والمواصالت من خالل ربطها بنظام الكتروني موحد قائم ومصمم على تطبيقات ذكية عالمية ان ذلك ساعد
شارات الضوئية وإعطاء االوليات لحركة المرور تقليل االزدحام وضمان انسيابية حركة مرور السيارات والتحكم باال
باالتجاهات المتاحه من خالل الربط االلكتروني.
ي ان عملية التطوير والتعليم للمهندس االماراتي قادرة على تطوير الية حديثة للتصميم الذكي للمدن مما يساهم ف
راد المتخصصين. لقد نجحت دبي في انشاء تحقيق الهدف االستراتيجي ، حيث تتجلى االبداعات والطاقات من االف
االفراد وخصوصا بين الذكي التصميم ثقافة لنشر عالمية ابحاث مع مؤسسات مرتبطة الكترونية تعليم كز مرا
صممة. ان انشاء مشاريع داخل منطقة دبي المهندسين والمؤسسات الحكومية القائمة على تنفيذ المشاريع الم
كز تعليمية متخصصة في مجال المعلومات يهدف الي تشجيع التعليم االلكتروني الحرة للتكنولوجيا والمكون م ن مرا
اعداد في واالبتكار االبداع الي يؤدي والذي االصطناعي بالذكاء المرتبط ، التقليدي التعليم أسس على المبني
. (2007.) على عبد الرؤوف ،التصاميم الذكية
الخاتمه
ذكية مدينة الي دبي تحويل منهجية باعتماد والمتعلقة الحكومة حددتها التي االستراتيجية االهداف تحقيق ان
عالمية، من خالل اعتماد المعايير العالمية لتصاميم المدن الذكية على ايدي مهندسين اماراتيين متخصصين في
المه المجال وكذلك الحكومي ،هذا القطاع العامليين في الجهود واالتفاقيات ندسين التركيز على تفعيل يتطلب
الموقعة بين المؤسسات الحكومية ومؤسسات التعليم العالي ، الي يجب ان تركز على مخرجات التعليم في هذا
على استراتيجيات محدده المجال ، كذلك تحديث البرامج التدريبية للمهندسين في هذا المجال الذي يتطلب التركيز
لتدريب المطلوبة التي تتناسب مع طبيعة العمل في مجال تصاميم المدن الذكية. ان ورش العمل لتفعيل خطط ا

ISSN 2708-9525
168
االماراتيين المهندسين من كبير عدد تأهيل تضمن المنتظمة، التخصصيه المستمرة والمحاضرات والندوات
على اعداد تصاميم ذكية لمدن التطوير التكنولوجي السريع ، واثرها القادرين على التعامل مع التغيرات المتعلقة ب
الدولة مع الحفاظ على الهوية العمرانية االماراتية للدولة ، والتي تؤثر بشكل ايجابي على التواصل االجتماعي للسكان
االصطناع الذكاء ، االستدامة الحداثة، بين الجمع ان . مناخية تاثيرات اي من البيئة الذكي وحفظ التعلم ، ي
العمل وبشكل متواصل مع خبرات تخصصية وذلك لضمان نقل الخبرات وكسب المعرفة والتكنولوجيا يتطلب
على المستوى المحلى .
على المهندس االماراتي ان يكون قادرا على دمج المخرجات التعليمية المبنية على نظريات حديثة مع االساليب
ال للتطبيق القابلة المكثفة العلمية التدريبية البرامج المتخصصة في هذا مكتسب من المؤسسات تطرحها التي
المجال ، لضمان التمكن من تطبيق المعايير العالمية لتصميم المدن الذكية ليكون له دور فعال في عملية التنمية
كبير في رعاية المهندسيين المستدامة .تم التاكيد على اهمية دور الجمعيات الهندسية في دول المنطقة بتحملها دور
راتهم من خالل البرامج التدريبية المقترحة والتي تعمل على تقديم كل ما هو جديد في عالم الهندسة .) وتطوير قد
(. 2004بدر ملبس الزايدي ,
ومن خالل التركيز على تطبيق ما تم ذكر اعاله ، فان المهندس يصبح قادرا على ادارة وتطبيق معايير التصميم
- للمدن الذكية من خالل :
فهم وتحديد المحاورالتي تدعم تصاميم المدن الذكية المعتمدة على اساسيات تنمية المدن كالمعرفة واالقتصاد. -
التغلب على التحديات والمعوقات التي تواجه تطبيقات المعايير المتعلقة بالتصاميم مع تطوير الية معتمدة -
على
ة بالتصاميم الذكية. متعلقتوحيد التطبيقات وال المستوى الدولة لضمان
التركيز على دمج معايير االستدامة المتوافقة مع المعايير العالمية بعد التغلب على المشاكل المتعلقة بالبيئة -
والبنية التحتية، من خالل تصنيف المعلومات مع التركيز على صحتها ودقتها قبل تحويلها الي بيانات الكترونية.
متعلقة بابعاد المدن الذكية والمرتبطة بالتطوير العمراني وتطوير البنية التحتية والخدمات زيادة جوانب المعرفة ال -
والطرق واالتصاالت.
التركيز على فهم الجوانب القانونية في هذا المجال ، والمتعلقة في خصوصية استخدام البيانات والمعلومات -
اد والمؤسسات.وتداولها بين االفر
كبة - المستمرة للتطورات السريعة ومتابعة التوجهات الدولية التي ترتكز على التنمية المستدامة للمدن الموا
لتحقيق استراتيجية واضحة لمدن المنطقة.
تمادها التركيز على دقة البيانات والمعلومات اثناء اعداد التصاميم والتي هي جزء من الية التطبيق التي يتم اع -
لية التصميم لضمان نتائج ملموسة عند التنفيذ .قبل واثناء عم
التواصل المستمر للمهندس االماراتي مع المؤسسات المتخصصة في مجال تقنية المعلومات والحصول على -
شهادات االحتراف في هذا المجال .

ISSN 2708-9525
169
ماراتيين الواعدين والمؤسسات التعليمية ان تعمل على الدوائر الحكومية التي تضم عدد كبير من المهندسين اال
كب وتتوائم مع التطور التكنولوجي السريع ، وذلك جاهدة وبش كل متواصل على تطوير برامج تدريبية مدروسة تتوا
ا لزيادة مؤشر الذكية التكنولوجية والحلول الوسائل . لتوظيف الدولة المدن في وباقي لسعاده لسكان مدينة دبي
ير التصميم ، تعتبر من االوليات الهامه على خطط ومنهجيات تعتمد على البيانات الصحيحة لتطوير معايالتركيز
كثر من جنسية . ان تصميم الخدمات الجديدة والذي يعتبر جزءا 200لتحديث الخدمات المقدمة في مدينة تضم ا
التصامي المجتمع من افراد بين الثقافات تعزيز ، يضمن الذكية للمدن البيانات جزء م تعتبر فئاته حيث بجميع
في اتخاذ القرار لضمان سعادة االفراد في المدينة . لتكون معيارا اساسيا
العاملة على المهندس االماراتي ان يكون مدركا بان نتائج التصاميم الذكية تسعد المجتمعات واالفراد والمؤسسات
يم ومعايير معتمدة تعزز من تحقيق استراتيجية الدولة. ان تصم في الدولة ، حيث يجب ان يتم اعتماد تقنيات حديثة
واعداد الية فعالة لتنفيذ الخطة الذكية ، يجب ان تتالئم مع حاجيات المجتمع االماراتي ، حيث على المهندس االماراتي
ستمر من خالل يجب ان تكون فعالة وقابلة للتنفيذ ، ويتم تحديثها بشكل م ان يكون مدركا لنوعية الخدمات التي
مع شركاء لديهم الخبرة والثقافة في تصميم المدن الذكية .التاهيل والتدريب المستمر للمهندس ، والعمل
الجامعية ، واثناء عمله من اهم المخرجات الرئيسية التي يجب على المهندس االماراتي التركيز عليها اثناء دراسته
هم ثقافات المجتمعات االخرى التي تساعد على انتاج تصاميم ذكية هي كيفية التعامل مع التطبيقات الذكية وف
، مت بيانات المبنية على بها المعمول الحالية الذكية التصاميم المقدمة من الخدمات نتائج متابعة كذلك نوعة
خدمات كتسبة . اضافة الى ذلك هو البحث عن ادوات واليات تساعد في تطوير ومقارنتها مع المعايير الحديثة الم
حيحة ودقيقة . التصميم الذكية ليتم تنفيذ المشاريع المعتمدة على بيانات ص
التزام المهندس االماراتي بمعايير المدينة الذكية التي تعتمد على بنية تحتية بيئية ذكية ، وتوفير رفاهية مجتمعية
تقنيات ذكية تساعد في التنقل حياة من نوع جديد ومميز ، من خالل تواصل مستمر مع افراد اذكياء و للسكان و
ببناء اقتصاد قوي يعتمد على االبتكار والتكنولوجيا والمعرفة واالستدامة. الذكي تحت اشراف حكومة ذكية ملتزمة
ندس االماراتي ىتعتمد على تحديد استراتيجية تنفيذ الرؤية الحكومية التي يجب ان تكون واضحة المعالم لدى المه
من خالل التطبيقات بشكل واضح وتهدف الي تطبيق المعايير المعتمدة في اعداد التصاميم يمكن العمل من خاللها
االلكترونية الحديثة المتوفرة التي تجمع بين االستدامة واالبداع . ان قياس دينامية المجتمعات ومستقبل تقدمها
بينهم. )حبيب ادم & جيهان عثمان ى ما تتيحه البنائها من فرص لتنمية سماة االبداع واالبتكار فيما تقاس بمد
2018 . )

ISSN 2708-9525
170
ومع الفهم الصحيح لكيفية التعامل مع مكونات وشبكات البنية التحتية المتوفرة وعدم اهمال عامل المحافظة
السياحي الترويج اثناء للمدينة والبيئي المعماري تراث بالتكنولوجيا على تصميمه يتم الذي االماراتي للتراث
المبنية المستدا الرقمية الخضراء مساحات على التركيز وكذلك الذكية. التصاميم الذكية على المناطق في مة
لتخفيف االنبعاثات السامة داخل المدن من خالل تطوير انظمة نقل صديقة للبيئة تستعمل على طرق مصممة
بمعايير ذكية.
توصياتال
ترتكز اراتي في كيفية تطبيق المعايير العالمية التىركزت الدراسة في هذا البحث على دور ومسؤولية المهندس االم
كب مع التطورات التكنولوجية ، وقواعد الذكية ، من خالل اعتماد الية ممنهجة تتوا عليها اسس تصاميم المدن
بيانات صحيحة مرتبطة بتطوير البنية العمرانية واالقتصادية والبيئية ، وطريقة االستقاده من التقنيات الحديثة في
االمارات القائمة ومدن دولة كبيرة في تخطيط مدينة دبي االماراتي مسؤولية المهندس يتحمل . المتحده العربية
تحقيق استراتيجية حكومة دبي ، الهادفة الي جعل دبي اذكى مدينة في العالم من خالل التصاميم الذكية التي تمارسها
تطلباتها كا لمفهوم واساس المدينة الذكية ومكوناتها ومالمؤسسات الحكومية والخاصة ، حيث يجب ان يكون مدر
وطريقة اداءها ومعايير تقييمها على المستوى العالمي . ياتي ذلك من خالل االطالع المستمر وتبادل المعلومات
مع المدن االخرى التي قامت بتطبيق هذه التجربة ، ليكون قادرا على وضع الية معتمدة متخصصة في تصاميم
قنيات ذكية. الذكية ، وتحويل المدن القائمة الي مدن ذات تالمدن
يه االلتزام بالتوصيات التاليه: ولتحقيق ما تم ذكره فان المهندس االماراتي يتوجب عل
كبة المستمرة مع المتغيرات السريعة لتقنية المعلومات وشبكات االتصال المتعلقة بتصاميم المدن ، -1 الموا
ومتابعة االلتزام خالل المؤسسا من تفرضها التي العمل وورش التدريب مع خطط كة بالشرا الحكومية ت
المكاتب االستشارية وجمعية المهندسين االماراتيين.
التواصل مع المؤسسات الدولية المتخصصة في مجال التدريب المهني الذي يركز على تصميم المدن الذكية ، -2
كة طوي ردي لة االجل من اجل نشر المعرفة على المستوى الفوخاصة مع المؤسسات التي وقعت اتفاقيات شرا
والمؤسس لهذا النوع من التطبيقات.
الحديثة -3 التقنية تطبيقات واالختراع مستفيدا من االبتكار وثقافة االبداعي الفكر تنمية المستمر على العمل
تصميم المدن. لتطوير المعايير المعمول بها والوصول الي اعلى المواصفات والمقاييس العالمية ل
لقرار في مؤسسات التعليم العالي والمؤسسات الجامعية من خالل المؤسسات رفع التوصيات الهامه الي صناع ا -4
لتتواكب مع الهندسة بجميع تخصصاتها بكليات التعليمية المخرجات لتحسين ، المهندس بها التي يعمل
ة مع التصميمات الذكية للمدن ". سياسة الحكومة " التطبيقات االلكترونية الضرورية المتالئم

ISSN 2708-9525
171
كز االبحاث العلمية المتخصصة في مجال تصاميم المدن الذكية ، والتعرف المتابعة وال -5 تواصل المستمر مع مرا
على المدن التي نفذت هذا النوع من المشاريع على المستوى العالمي" تصاميم المدن الذكية " واالستفادة
لمجال .يا واالخذ بتوصيات الدروس المستفادة في هذا امن خبراتها في تطبيقات التكنولوج
المطالبة برصد ميزانيات محدده لتوريد برامج تصميم ذكية متعلقة بالمدن تزيد من تحفيز االبداع في االبتكار في -6
هذا المجال، وتطبيق هذه البرامج على مشاريع مختلفة بالدولة مع تقييم االداء الدوري لهذه البرامج والذي
احبه تقييم المهندسين بشكل منتظم.يص
المراجع
. بحث مقدم الي ندوة الحكومة االلكترونية: تحديث المدينة االلكتنرونية ، دراسة تحليلية (. 2003فريحات ، حيدر .) -1
ل الواقع والتحديات ، قسم المحاسبة ، ادارة انظمة المعلومات ، كلية االدارة والصناعة ، جامعة الملك فهد للبترو
ربية السعودية . والمعادن ، الظهران ، المملكة الع
(. المصدر ، البيان 2018(. خريطة المدينة الذكية والذكاء االصطناعي ) لطرق دبي 2019سعادة مطر الطاير .) -2
. 27/4/2019االلكتروني بتاريخ
، لبنية التحتية في االمارة . المصدر تعزز جهود حكومة دبي في تطوير ا 2018(. موازنة 2017سعادة مطر الطاير .) -3
. 2017ديسمبر 11جريدة الخليج بتاريخ
(. المصدر، النشرة االلكترونية لسعادة 2021(. اعتماد الموازنة العامة في دبي )2019سعادة سعيد محمد الطاير .) -4
.30/12/2019نشرة علوم الدار –العضو المنتدب الرئيسي التنفيذي لهيئة كهرباء ومياه دبي
التطبيقي الهندسي"، سجل ابحاث الملتقى الهندسي 2002راضي محسن الزبيدي .) -5 (. " التعليم والتدريب
.343ص - 337الخليجي السادس .ص
تجربة بلدية دبي بحث مقدم الي ندوة ادارة وتطوير –(. شبكة الطرق ونظام المرور 2004السعيد ، ناصر احمد.) -6
عهد العربي النماء المدن ، الخرطوم ، جمهورية السودان . لمرافق العامة في مدن العربية ، المالخدمات البلدية وا
علي ، خالد على يوسف .)د.ت(. العمارة الذكية ودورها في دعم منظومة االمن والسالمة بحث مقدم الي ندوة -7
جام ، المعمارية الهندسة ، قسم العربية بالدول المباني ، جمهورية مصر الكوارث وسالمة اسيوط ، اسيوط عة
ربية. الع

ISSN 2708-9525
172
(. دور البلديات االلكترونية في تنمية المدينة : تجربة مدينة االسكندرية ، مؤتمر 2007يوسف ، وائل محمد .) -8
االزهر الهندسي الدولي التاسع ، كلية الهندسة ، جامعة االزهر ، القاهرة ، جمهورية مصر العربية .
طلعات المستقبل " . الملتقى الهندسي الخليجي الثامن. مكاتب الهندسية وم (. " ال2004يقي .)ضياء الدين توف -9
. دبي ، إ.ع.م 177ص
(. " العمل الهندسي في القطاع الحكومي والحاجة لشهادة 2002على محمد السواط وهاشم عبد هللا الصالح .) -10
السعوديين ، قسم الهندسة ندوة ترخيص المهندسين الممارسة المهنية للمهندس في هذا القطاع . سجل ابحاث
.16ص - 1المدنية ، جامعة الملك فهد للبترول والمعادن بالظهران . ص
11- (. مكتوم ال راشد بن محمد بن حمدان الشيخ العالمية 2019سمو القمة مؤتمر في كلمته القاء اثناء .)
التي السبعة الرئيسية التحوالت عنوان تحت ، القادمة للحكومات السنوات خالل العالم حول المدن تشهدها
المتعلقة بالذكاء االصطناعي .# القمة_العالمية _ للحكومات.
(. واقع صناعة تكنولوجيا المعلومات في اعادة دبي . بحث عن ذروة معلوماتية 2001سم محمد ، مجدي .) جا -12
ن .: الواقع واالفاق ، مؤسسة عبد الحميد شومان ، عمان االرد
(. كلمة سموه اثناء لقاءه فرق " في دبي نتعلم ". 2019سمو الشيخ حمدان بن محمد بن راشد ال مكتوم .) -13
.2019/12/23، 14432، العدد 5لبيان االماراتية . ص صحيفة ا
دبي ، قسم (. دور التقنية في بناء المجتمعات المعرفية في العالم العربي ، حالة مدينة2007على عبد الرؤوف.) -14
العمارة ، جامعة البحرين .
. الملتقى الهندسي (. المهندس ودوره في عملية التنمية ) القرص وال2004بدر ملبس الزايدي .) -15 تحديات (
. 235ص – 230الثامن في دبي . ص
للتميز في التعليم (. " في ضوء مفهوم وتطبيقات االبداع". المجلة العالمية 2018حبيب ادم ، جيهان عثمان .) -16
.2(. ص 2018)

ISSN 2708-9525
173
Ethics and Technology – IOT Track

ISSN 2708-9525
174
The usage of Machine Learning and Artificial Intelligence for
Healthcare application in UAE
Ioannis Karamitsos1 and Aishwarya Afzulpurkar1 1Rochester Institute of Technology-Dubai campus
ABSTRACT
The increasing interest in healthcare knowledge of data has heightened the need for Artificial Intelligence (AI) and
Machine Learning (ML) algorithms and tools suitable to predict decisions in the health domains. AI, specifically the
sub-fields of the machine and deep learning, provides optimal cost-effective options to expand the universe of
knowledge and solutions in healthcare. In this context, the main aim of this paper is to present a research study,
extending AI and ML algorithms to empower healthcare practitioners and academics to understand and decide for
serious health problems. With the introduction of the AI/ML, we can accumulate, analyse, and elaborate on all the
structured and unstructured data collected and obtain valuable insights. The combination of AI and ML is a research
area that presents exciting challenges for the future of healthcare. These new challenges are related to the application
of AI/ML algorithms into the healthcare ecosystem. In this paper, we initially present a study of the applied machine
learning algorithms for healthcare. We present the most commonly used methods to answer different types of questions
in healthcare analytics. Based on the type of questions answered, there is another useful way to define ML algorithms.
There are two types of ML algorithms, supervised and unsupervised training algorithms. Methods that require input
data with known label are called a supervised training algorithm, and these that do not require prior knowledge of
what answers are expected are called unsupervised. The majority of the ML algorithms applicable to healthcare are
supervised learning algorithms. For supervised learning algorithms, we need to focus on data fidelity, especially for
the training data. This algorithm is particularly challenging in healthcare when unstructured data is critical, and data
comes from multiple sources. Also, we present best practices for successful ML algorithms providing different use
cases.
Keywords: Artificial Intelligence, Healthcare, Machine Learning
1. Introduction
The rise of Big Data, Machine learning (ML) and Deep learning (DP) [11] techniques and
technologies have led to a new generation of automation, knowledge generation and prediction
capabilities. Advances in computing capacity and power have enabled the collection, storage,
analysis and transportation of vast amounts, and types, of data in order to produce specific and
precise insights across industries worldwide. The healthcare sector, which invests heavily in
research on a system as complex as the human body, has and will continue to benefit from the
implementation and integration of ML into industry-wide systems and practices.
Reasons for generating insights from big data using machine learning could be organizational,
cognitive, technical and operational. Using approaches that go beyond rules-based deductive
reasoning, traditional systems engineering and descriptive analytics, machine learning provides
cost-effective solutions to expand the universe of knowledge and solutions in healthcare. Solutions
generally fall under the following broad categories:

ISSN 2708-9525
175
1) Automation of repetitive tasks that require labor and may not always be done with precision due
to human limitations- cognitive, physical or emotional.
2) Data reduction via learning and prediction.
3) Generation of new computational biomarkers by finding patterns that are not visible to the human
eye.
Shifting through the full range of architectural options available for use is not always easy, as
information on the Web could be too general, too technical or mathematical and not necessarily
applicable to the healthcare sector. This paper provides a conceptual description of crucial
technologies within machine learning and several applications of these concepts to healthcare use
cases, in a step-by-step manner. Best practice implementations and management techniques are
also provided to help with a smooth and robust deployment of a machine learning architecture in
the respective environments.
2. Artificial Intelligence in UAE
Artificial Intelligence (AI) [12] and Machine Learning adoption and deployment proliferated since
"The imitation game" and since Turing asked the question: "Can machines think?" The machine
learning algorithms have been improved over time, the amount and availability of data proliferated,
and the exponential growth of the computer processing power are essential enables fueling the AI
adoption and acceleration. Artificial intelligence could be a significant opportunity to improve the
UAE economy.
The UAE government is the first country in the world to create a Ministry of AI and the first
country in the Middle East to create an AI strategy [7]. The AI strategy was launched in October
2017 that feeds into the UAE Centennial 2071 plan. The strategy aims to enhance the government
performance and efficiency in nine pillars: transport, health, space, renewable energy, water,
technology, education, environment, and traffic as depicted in the following figure 1. As a result,
the costs across the government will decrease, the economy will flourish, and the UAE will be
positioned as a global leader in the AI Application.
Figure 1: UAE AI Strategy (Source: AI Strategy [17])

ISSN 2708-9525
176
There is no doubt that AI improves productivity by solving complex problems, which delivers a
pool of opportunities, but also risks and challenges. How the UAE decides to act to these threats
will impact the economy and the society for years to come.
The implications of AI on the various ways in which society works and lives are significant as it
contributes to the job market disruption. AI will automate a lot of human tasks; hence, many jobs
will disappear, many jobs will enhance, and many foresee that new - unknown yet – will be created.
As AI shifts the demand from many job types to new unknown ones, upskilling and training is a
lifelong necessity. Therefore, the upskilling pillar should be added as a vital part of the UAE AI
Strategy.
The government should adequately prepare the people for the future workplace in two steps.
Firstly, the curriculum in schools should be adjusted to include electives such as computer science,
data analysis, deep learning, neural networks, statistics and all AI-related topics. Such a change
requires thorough education and upskilling for teachers as well to be able to build a generation
ready to navigate in the AI-driven world. Secondly, organizations should mandate employees to
undertake training in data analysis. Artificial Intelligence (AI) could help to boost diversification
and growth in the next decade. The government is keen to seize the opportunity; especially that
UAE has crafted a national AI strategy, created the UAE AI Council, and appointed the world’s
first Minister of State for Artificial Intelligence, H.E. Omar Sultan Al Olama [2] who defines the
Artificial Intelligence as:
"AI will impact every single sector we want to be the hub for AI in Government globally.
We want to be providing ground for the technology. Our society is ready and willing to
be a part of the future."
The UAE’s national AI strategy is focused on expanding the role of AI in nine pillars: transport,
health, space, renewable energy, water, technology, education, environment, and Financial
Services.
3. Artificial Intelligence and Machine Learning: Definitions
Artificial Intelligence [11] is defined as a set of algorithms giving a computer, analysis and
decision-making capabilities that allow it to adapt intelligently to situations by making predictions
based on data already acquired. Machine learning [11] is a subset of AI that focuses on providing
algorithms with the ability to learn how to complete tasks without explicit instructions, allowing
them to adapt in the presence of new data as depicted in figure 2.

ISSN 2708-9525
177
Figure 2: Relationship between AI-ML-DL (Source: Authors)
Deep Learning [11] is an advanced type of machine learning adept at identifying abstract or
complex patterns in data by using a multilayered artificial neural network. It is called “deep”
because it has more layers than simple machine-learning approaches, which allows for more
complex processing.
4. Machine Learning – Data Sources
The selection of the machine learning algorithm is always dependent on the type of data that we
have and the question that is trying to answer. The question may be as broad as "Can we categorize
these data", or something specific like "Is X a side effect of Y?". A list of common questions and
the machine learning way to go about answering them is discussed in the second part of this chapter.
The first part introduces the types of data and learning algorithms that can be utilized to make sense
of them. There are two types of data structured and unstructured as described in the following
sections.
4.1 Structured Data
Structured data [12] is highly organized, tabular and can usually be fed into a machine-learning
algorithm as it is, without extensive data cleaning or pre-processing. It comes from sources such
as relational databases (i.e. SQL), spreadsheets, log files, sensors, and medical devices.
Unstructured data requires extensive parsing, and while the sources of this type of data are
abundant, not all of them can be collected or analyzed effectively.
4.2 Unstructured Data
The most common sources of unstructured data [12] are media, i.e. images, video, and audio files,
text documents that are not organized in a consistent way, ranging from scholarly journal papers
to webpages returned by a typical search query to twitter feeds, and databases meant for storing
unstructured data such as NoSQL. The high demand for extracting insights from unstructured data
has led to the development of several machine learning toolkits that provide audio, image, and
unstructured text processing capabilities. Some of the top new ML trends in healthcare involve the
processing of unstructured data: Diagnosis using Medical Imaging, Patient query processing using
natural language processing tools, Extracting Insights from crowdsourced medical data, and
Robotic surgery using video stream processing.

ISSN 2708-9525
178
5. Machine Learning Algorithms
Machine learning (ML) algorithms [4] can be supervised or unsupervised and can be used for
classification or regression purposes.
Input data is always divided into training and test data before feeding it into an ML algorithm. The
purpose of training data is to train the weights or values of the chosen algorithm, and the test dataset
is used to ensure that the algorithm works well for sensed data also. An implementation is
considered biased if it ignores significant deviations in data and too variant if it is too sensitive to
insignificant variations in data. There are several approaches to achieving a balance between the
two that depend on the algorithm used, data quality and size, as well as target questions, asked, or
insights expected. Details are left out; however, a list of references is provided at the end of the
paper.
5.1 Supervised Learning
Supervised learning is used when the data is labelled, i.e. there is a specific output value for a
specific set of input values. The algorithm learns to predict output value from the given input
values. For the supervised, we have the following learning algorithms.
5.1.1 Linear (and polynomial) Regression
The goal of the linear regression algorithm [1] is to generate a best-fit line of n-degrees through all
the data points (1st-degree polynomial fitting is called linear fitting). There is a way to do this
without machine learning using matrix multiplication – to get one calculation, entirely accurate
best-fit curve. However, as the number of data points and features increases, matrix multiplication
becomes infeasible and linear regression, which uses an algorithm called gradient descent. The user
provides data entries composed of input features, output labels, and if required, the degree of the
best fit line.
In the healthcare sector, an example of regression [14] is predicting the cost of manufacturing a
drug, some of the input data ‘attributes’ could be ‘name of drug’, ‘primary chemical compound
cost’, ‘secondary compound cost’, ‘number of labs able to produce the final drug’. The output
'attribute' would be the known cost of the drug. The user can subset the attributes to only include
features that influence the cost, for example, the 'name of drug' may be irrelevant but its
composition and the number of labs that have the instruments required to produce the final drug
may be relevant.
The algorithm starts with random weights, or parameters defining the best-fit function. The most
challenging part of regression algorithms is gradient descent, which iteratively seeks to minimize a
cost function, which is the difference between predictions and actual output. Parameters that can
be tuned to increase the efficiency or accuracy of this model include: the learning rate, called alpha
and momentum. A high value for alpha may result in fewer iterations but non-convergence to a
single best-fit line, so it is usually recommended to decrease alpha for later iterations. Momentum
is the rate at which alpha increases or decreases – if the algorithm detects that its values are
consistently moving in a single direction, it then moves in that direction faster. Optimization
techniques like Adam can sometimes be applied that use a ‘look-ahead’ mechanism to adjust

ISSN 2708-9525
179
momentum or learning direction. Similar optimization algorithms and hyperparameters (alpha and
momentum) exist for logistic regression, as described in the next section.
5.1.2 Logistic Regression
Logistic Regression [1] is used for classification purposes, and the goal here is to generate a best-fit line
dividing the data points into a fixed number of classes, specified by the output data. Binary logistic
regression generates a single line that divides the data into two classes. This function also uses gradient
descent, and the cost function is only slightly different. Multi-class classification is an iterative
implementation of binary logistic regression that produces dividers for each pair of classes and consolidates
results before presentation or visualization. Also, the user can specify the degree of curve fitting using
polynomial classification APIs, if the data seems to be more conducive to a curved divider.
5.1.3 Decision Trees
The decision tree algorithm [12] progressively creates a 'dependency tree' by splitting the data on the
variable that ‘best divides’ the data at each iteration. It determines the best dividing node by aligning the
probability distributions of each feature in the input dataset to that of the output data and selecting the input
feature with the most similar occurrence pattern. Error is calculated using standard probabilistic methods
comparing predictions to outputs. Another type of decision tree is Random forests in which runs the
algorithm on several ‘random’ subsets of the data, and their results are then consolidated to determine the
best tree. Random forests are therefore more resilient to variations in new input data. Another technique
used to improve the generalizability of decision trees is boosting.
5.1.4 Probabilistic Graph Models
These models [11] are used to express a conditional structure between probabilistic states or events. These
graphs can be learnt or constructed by experts. However, the data used to determine probability values of
nodes in the graph cannot be the same data used to construct the conditional, fixed dependencies between
the nodes. The most common category of such graphs, called Bayesian Networks, are directed acyclic
graphs, i.e. have a directional flow of states. Markov models and Neural networks are both subclasses of
Bayesian networks. Sometimes contextual knowledge about data can allow one to infer definite
relationships between the data, which allows one to use a more targeted model. Hidden Markov Models
(HMMs) that assume the existence of 'in-between' states that cause the probabilistic distribution of the
defined states and Kalman filters that assume a continuous state space are subclasses of Markov models that
are effective for specific use cases. For example, Kalman filters are used for object recognition in dynamic
environments, and HMMs are used to predict potential hidden causes for measurable effects.
5.1.5 Time Series Analysis
Time series analysis [1], as opposed to linear regression, allows one to the group and analyze data according
to various time intervals like days, weeks, seconds, months. It is usually used for forecasting and relies on
its past observations as features. Conventional techniques are Moving Average computations, and
Exponential Smoothing applied on top of moving average computations, which is used to exponentially
decrease the weight of past observations when added to present observations.
The Auto-Regressive Integrated Moving Average (ARIMA) model is a generalization of several time-series
models which computes a best-fit curve using regression, differencing and moving average computations.
Differencing refers to computing the difference between consecutive values and using layers of these as
extra “features”, and moving average refers to the average values over consecutive time intervals. The
regression then includes the moving average of values at all differenced levels to compute the next value in
the time-series. Several variations of this algorithm, like seasonal differencing, and optimizations such as

ISSN 2708-9525
180
Box-Jenkins have been used to produce desired results. Root mean squared error is also used to compare
model performance.
5.2 Unsupervised Learning Algorithms
Unsupervised learning is used in the absence of output values, to infer inherent structure from the
given input data.
5.2.1 Clustering
Clustering [12] is the iterative method that calculates relative distances between data points along
each dimension and creates groups of data points that are "close" to each other. Calculating
similarity measures can be a useful step before making predictions. The number of groups, features
or dimensions along which the clustering is done is up to the user. The K-means and K-medoids
algorithms define data means and medians, respectively as clusters centroids. Hierarchical
clustering builds a tree, grouping data points into smaller clusters with decreasing intra-cluster
distance at each level. Clustering can be hard, ensuring that every point belongs to a single cluster,
or soft – each point belongs to several clusters at varying percentages. Distribution and density-
based models also exist that extrapolate their data points to include an entire region of the mapping
space. These are useful in situations where data proximity in terms of the mapped features may not
necessarily be as relevant as the identification of a distributional relationship between features.
In the healthcare sector, for example, two data points corresponding to two different diagnoses may
be part of the same distribution along with the symptom A versus symptom B axis. While the
diagnoses may be predicted using k-means clustering, the distribution clusters, containing much
larger datasets, include the two points, may reveal parity between the value of symptom A and the
importance of it as a feature.
5.2.2 Association rules
Association rules [12] are defined by antecedent, and consequent pairs (i.e. if <antecedent>, then
<consequent>) and are also used to calculate similarity measures and the group frequently
occurring data points together. A-priori, FP-growth and Context-based rule mining, among others,
are algorithms used to do mostly the same thing, only differing in technical implementations and
micro-efficiencies. In order to select ‘interesting’ rules from all possible ones, constraints and
thresholds are encoded such as support (occurrence frequency of the antecedent), and confidence
(the validity of the rule), among others.
5.2.3 Topic Modelling
Frequently used in text mining, this technique abstracts out underlying semantic structures in a
document or any data that is based on intricate underlying patterns. Algorithms such as Latent
Dirichlet Allocation (LDA) and Latent Semantic Analysis (LSA) are used to extract frequencies of
words and distributions of topics and create clusters of topics and words. This technique is known
for categorizing unstructured textual data, such as medical journal papers and crowdsourced
information publicly available on the Web. This method captures greater context than regular
‘frequencies of words’ methods, but still less context than a Recurred Neural Networks (RNN).
However, it is computationally way faster than an RNN, so it is preferred for basic categorization,

ISSN 2708-9525
181
especially if the dataset is massive. The area of natural language processing often uses extra data
from another source to augment analysis. The Semantic Web has stored links between semantically
related words. The word2vec library contains a vectorized numerical notation for words such as
semantically related words are geometrically close to each other.
6. Artificial Neural Networks (ANNs)
Neural network [11] implementations, especially deep networks, are the most computationally
expensive to train but can be used for the widest variety of relationship inference problems. ANNs
refers to a large number of parallel processing units that are in some way connected to one another.
These units, called neurons, weigh the inputs they receive and produce different outputs (excited
or inhibited) depending on the activation function being used. The most commonly used activation
functions are Sigmoid, Tanh and ReLu [11]; the first two functions output values in proportion to
the signal received, and the later produces zero when an inhibiting signal is received. Like in
regression, these the input units of a neural network start out with random weights.
Backpropagation is the learning algorithm used to ‘backpropagate’ deviations in output, or error.
Iterations of forwarding and backward propagation finally yield a convergent solution of the
optimal weights. It may not always pay off to connect every neuron to every other neuron. Apart
from being inefficient, some connections may receive too many inhibition signals that they die off,
unpredictably severing data flow along specific pathways before convergence. This is referred to
as the vanishing gradient problem and mainly affects deep networks. To avoid this problem, the
number of intermediate layers, called hidden layers, between input and output layers, are kept to a
minimum. Some use cases may also contain an inherent structure that could be used to model a
relatively sparsely connected neural network. This would increase the likelihood of convergence
on the correct weight values.
Specialized neural networks such as convolutional NNs (CNNs) and recurrent NNs (RNNs) [10]
are used for spatial and temporal pattern recognition. CNNs are commonly used for image
segmentation in a non-continuous state-space; i.e. object detection in different angles. RNNs are
used for keeping track of context, in areas such as natural language processing. RNNs can be
modified such that their neurons contain memory cells that, instead of merely passing down a
weighted modification of its value, decide whether to update the adjacent neurons. The memory
cell also decides whether to update its own value during backpropagation or not. The interaction
of a neuron with its own memory is encoded and controlled with a second activation function.
RNNs that implement this functionality include GRUs (Gated Recurrent Unit) and LSTMs (Long-
Short-Term-Memory) [11].
6.1 Artificial Neural Networks
Instead of using backpropagation, ANNs for unsupervised learning form probabilistic relationships
between adjacent nodes (and previous values of the same nodes when using RNNs) [11]. This
method is used for classification purposes and also to pre-tune initial values of a supervised
learning neural network model, almost as a normalization phase.
Dimensionality reduction techniques [11] such as Principal Component Analysis (PCA) or
Generalized Discriminant Analysis (GDA) are used as preprocessing steps to mitigate inherent

ISSN 2708-9525
182
dependencies in the input data. While they may cause some data loss, not pre-processing the data
may cause the model to become more complicated for no reason and result in convergence or
visualization issues. This step can be used prior to the implementation of any algorithm, supervised
or unsupervised, but the dimensionality reduction techniques are inherently unsupervised – they
use algebraic techniques to reduce input data features and dimensionality.
6.2 Outliers
When its causes are known, can be safely ignored when analyzing a particular use case. However,
outliers can also be valuable pathways to acquiring new knowledge, that may affect research,
diagnosis, treatments, everything. Anomaly detection is useful not just in fraud detection but also
in discovering rare diseases (i.e. auto-immune diseases), potentially dangerous side effects, hidden
environmental causes, and may contain clues about the functioning of specific chemical structures.
Best Practices for Machine Learning Algorithms
1. Start with simple, individual models, before trying out more complex optimizations, models
or integrated architectures.
2. Try many algorithms before deciding on the best one: consider efficiencies, future use cases
and maintenance and scalability requirements.
3. Treat the data with suspicion: look out for systematic biases, errors, inconsistencies,
unexpected results and outliers.
4. Normalize, scale and adjust data according to goals and respective models in order to place
boundaries around the variance of data and minimize noise.
5. Iteratively validate the data on subsets to be able to isolate errors quickly.
6. Correlation is not causation: keep track of hidden factors and always be on the lookout for
more data that have the potential to strengthen or weaken previous patterns.
7. Keep track of model changes.
8. Monitor ongoing performance. Set up a feedback loop and alarm system – maintenance
may not always be required at convenient hours.
9. Use models and APIs that make sense and are easy to understand.
10. Do not be fooled by standard accuracy measures. Set expectations for precision and recall
values before implementing the model – the standards for these are only based on
organizational goals.
7. Healthcare Use Cases
The data analysis lifecycle defines analytics process consists of essential activities including
framing the business problem, gathering data, processing data, selection of ML algorithm, build
the model, validate the model and operationalize the model. Typical uses cases using in healthcare
are the following:
1. Disease Detection, Measurement and Research
2. Treatment/Drug Recommendation, Research
3. Automated Patient Diagnosis, Patient Support
4. Care Provider Support in Clinical and Organizational tasks
5. Insurance Fraud Detection, General Anomaly Detection

ISSN 2708-9525
183
For all the uses cases, the individual patient health care records are the baseline for the machine
learning algorithms. They used as the primary context for evaluating a patient, drug, treatment plan,
or facility and resources plan. All these data are stored in reachable servers as it is managed per
organisation.
7.1 Use Case #1: Disease Detection
This use case is disease detection [3,13] using machine learning algorithms. The main question to
be answered is: “Given certain symptoms, what is the likelihood that person X has disease A or
may suffer from disease B in the future?”
Simple predictive analytics such as probability relating groups of symptoms to diagnosis can
sometimes be the only thing needed to predict a diagnosis. Heart failure or sepsis detection are
acute conditions that can be detected using simple probabilistic models and a relatively small
amount of data [9]. However, the prediction of such conditions may require more sophisticated
models trained using more data sources. A set of symptoms may point to several different
diagnoses, at which point it becomes necessary to include features such as duration and severity of
symptoms, illness history, genetic predispositions, living/working conditions. For simple cases,
decision trees may work well to produce a hierarchy of significant factors that ultimately point to
the diagnosis. Logistic regression can be used to concretize a functional rule for segregating values
in features as per expected results. Linear regression can be used to define thresholds for identifying
abnormalities in lab results, which is a useful tool for relatively inexperienced practitioners when
dealing with different groups of patients with different conditions.
Machine learning models can get more complex for unknown diseases if a set of symptoms has not
been seen before, as it becomes difficult to predict diagnosis without generating some sort of a
model for individual symptoms within the sets also. Association rules, probabilistic graph models
and neural networks work well in such scenarios. Association rules narrow down the set of
symptom combinations to the ones that are considered likely above a certain threshold.
Probabilistic mapping of outcomes could be attached to 'sticky' sets of symptoms that often appear
together to influence the diagnosis. New features such as the severity of diagnosis could be formed
by isolating common symptoms from rare ones. The interaction of rare symptoms with common
ones and other features that are in line with the resulting diagnosis could be modelled using a neural
network, to predict current or future probable illnesses. Patient illness history could be used with
discrete-time series forecasting models to determine the time taken for one illness to cause or
convert into another. This is useful information for risk assessments, used by hospitals as well as
insurance companies.
7.2 Use Case #2: Treatment/Drug Plan for the patient
This use case is the treatment/drug plan for the patient using machine learning algorithms. The
main question to be answered is: "What treatment plan will be most suitable for a certain person
with disease A? Can we segregate patients requiring longer-term treatment and those that have a
high risk of readmission from the rest?"
Clustering methods [12] can be used to initially group patients according to similarity along several
dimensions such as age, gender, race, and genetic data. Treatment evaluation data for other similar

ISSN 2708-9525
184
patients with disease A can then be used to identify sets of consecutive or parallel treatments that
most benefited each phase of the disease.
Let us look at an example of data analytics lifecycle. Raw evaluation data may be in the form of
medical prescription lists, where subsequent prescriptions determine the effectiveness of a
prescription. Groups of patients getting similar prescriptions could first be clustered for separate
analyses. However, because clustering requires prior feature extraction, this could be an expensive
option. Instead, topic modelling methods that use words themselves as individual "features" and
sentences or paragraphs as data entries could be utilized for grouping. NLP techniques [11] could
be used to determine relationships between words (i.e. cause, treatment, expected effect) in
statements made in prescriptions. These key relationships, as well as new features such as
'effectiveness of treatment' can be constructed using simple statistical methods. Then, a deep
Bayesian or neural network could be trained that identifies correlations and patterns between these
features, so that a better treatment plan can be constructed for future patients of similar conditions.
Risk prediction is a crucial aspect of treatment plans that is dependent on individual patient data as
well. Separate models can be constructed for analysis of joint datasets, the output of which could
be fed into other models as features, building a more robust, context-rich model architecture.
7.3 Use Case #3: Rare Diseases
This use case is the treatment of rare diseases using machine learning algorithms [12]. The main
question to be answered is: “What are the causes of disease X and its effects? How does disease X
influence other parts of the human body or trigger other diseases in the system?
The machine learning models defined for the use cases above can also be applied for disease-
specific data, and even along with patient and treatment specific data. Knowledge of the workings
of a disease directly influences diagnoses and treatments; however, models built solely using
patient and treatment data may not be able to identify underlying causes and effects of diseases.
Therefore, it is essential to build 'base' models using specific data about a disease, acquired from
publicly accessible Web pages, internal databases or subscription journals. The importance of
parsing these kinds of unstructured data is once again highlighted in this use case, not just for
identifying broad correlations but also for extracting underlying context. While logistic regression
may be a better fit for time-sensitive acute disease detection, semantic analysis using NLP and deep
neural networks [11] for modelling multi-layered relationships are most useful for chronic disease
management.
7.4 Use Case #4: Using Chatbots for personal assistance
This use case is the usage of Artificial Intelligence Chatbots for personal assistance of the patients.
The main question to be answered is: “Can we automatically route patient calls or patient records
to the required doctor, can insurance procedures or readmission procedures be taken care of
automatically?
Call and support centres have been taken over by automated agents and robots in several other
industries, i.e. hospitality, entertainment, retail. Emergencies in healthcare, however, prohibit
complete automation when it comes to appointment scheduling and treatment support.
Optimizations in place today include keyword parsing using NLP that help redirect calls to the
right support professional and automated database population using values from online forms.

ISSN 2708-9525
185
Further improvements could be made by training a simple decision tree to route patient files or
calls to the relevant doctor or nurse based on availability, testing requirements, history of
appointments, among others. An automated support line could be online 24/7 that answers any
general, semantically sound queries about a disease or treatment. Readmission and other costs
could be forecasted using a combination of logistic and linear regression or time-series analysis.
Insurance fraud detection is a massive topic that several organizations have successfully
implemented. Depending on the evasiveness of fraudulent activity, relevant models could comprise
of probabilistic models, regression models as well as neural networks.
8. Healthcare Data Tools
All use cases above can be enhanced by using decipherable unstructured data from images, videos,
and audio files, described below.
8.1 Image, Video and Audio source data
Medical Imagery is enormous these days. Precision cameras are akin to having a second set of eyes
which can be used for object detection, movement detection and measurement, and be integrated
with the learning models discussed above. Video processing models can be trained to produce
radiology reports and provide independent analyses of patients based on these reports or other
physical symptoms. Micro-cameras attached to controllers that are less sensitive to slight
movements can be used to assist in surgeries; in fact, autonomous surgeries where there is a low
latency feedback loop between the camera, surgical controllers and the processors have already
been performed to high standards on pics [5]. OCR is used widely to convert images of documents
to the actual text that can be parsed. Surveillance cameras can be used to ensure workplace
procedure adherence, safety and security of medical crew and patients. Convolutional NNs, Hidden
Markov Models and Kalman filters are optimal models used for image and video processing [11].
Audio-processing models can be trained to listen to, understand and follow commands without one
needing free hands to type or click on something. Having voice controls connected to mechanical
processes are especially useful in surgeries. Voice recognition, along with semantic processing,
can be used to re-evaluate a patient in terms of severity of symptoms and required resources. Some
other applications include dictation and clinical note transcription, as well as automated
documentation and interpretation of clinical encounters. Voice technologies are most useful when
it comes to call center resource management, assisting in things like agent coaching, information
assistance, patient query processing, as well as providing recommendations and coaching. Hidden
Markov models and specialized Recurrent NNs, especially LSTMs [11] are relevant models for
audio processing. These technologies can also be integrated with wearable technology data, as
described below.
8.2 Wearable, or mobile (referring to portability and cellphone) technology data
Patients can get help without waiting for call centre or doctor’s appointment and be alerted of
symptoms before things get worse. For example, changes in blood pressure, vision changes, or
fluctuations in readings from attached devices such as pacemakers can be sent over a network to
an expert, or even analyzed on a local device, in order to provide timely feedback. Devices can be
trained on patient data to build models of device-specific data. They can be trained to provide

ISSN 2708-9525
186
information based on queries, store reports in a compressed form, report abnormalities and escalate
emergencies.
Online reviews of physicians, drugs, treatments, hospitals: Which doctor is better for X treatment?
Where is disease X expert located? Who has the least number of readmission requests (because of
solving the problem, not because of lousy experience)? This use case is most similar to search
engine optimization and benefits the most from simple models such as logistic regression, simple
Bayesian networks and other such classification and probabilistic models. This use case need not
be implemented by medical practitioners only, individual organizations that have access to medical
profiles, and crowdsources reviews will also be able to build such a system.
9. Healthcare Research Opportunities
9.1 Genomic data
Analysis of such data needs sophisticated algorithms that can answer questions like what is this
new gene supposed to do? To answer this question, one may look for relationships between this
gene and other genes. What parts of this gene are present in other genes? Clustering can be used to
identify the broad group of genes that the new gene belongs to and association rule mining can be
used to align certain features of genes as a way of dimensionality reduction, for further focused
analysis. Decision trees are helpful in creating a hierarchical context with which to evaluate further
properties of the gene. Deep learning can be used to test a wide range of gene triggers on a large
pool of genes to identify similarities and differences. Regression and time-series analysis can be
used to predict latency in gene expression or likelihood of mutation.
9.2 Drug data
Constituents and Effects: Questions like can we increase the potency of a specific ingredient of a
drug and minimize the effects of another ingredient, or how to minimize the side effects of a
particular drug? The first question requires trying out combinations of chemicals and dosages and
measuring the normalized difference in magnitude between the desired effect and an undesired
effect. The second question requires thorough testing of a drug on various bodily configurations,
and based on that data, classify subsets of configurations according to their reaction to the various
effects of the drug. Given the combinations of configurations and combinations of effects, this
demands a deep learning framework. Iterative analysis, such as this also requires a recursive
learning framework.

ISSN 2708-9525
187
10. Conclusion
This paper examined different algorithms of Machine and Deep Learning as a subset of Artificial
Intelligence with a particular emphasis in healthcare sector using some individual use cases.
Healthcare sector is recognized as one of the priorities in GCC and defined in its strategic vision
of each country. In particular, this paper explained the importance of machine learning and deep
learning as tools that can enhance human progress in this area.
Bibliography
1. Anke Meyer-Baese and Volker Schmid (2014). Statistical and Syntactic Pattern
Recognition, Pattern Recognition and Signal Analysis in Medical Imaging (2nd Edition),
Academic Press.
2. “An Overview of National AI Strategies” [online] Retrieved December 21,2020, from
https://medium.com/politics-ai/an-overview-of-national-ai-strategies-2a70ec6edfd
3. Chen, Min (2017). "Disease prediction by machine learning over big data from healthcare
communities." IEEE Access, Vol.5, pp.8869-8879.
4. Dua, Sumeet, U. Rajendra Acharya, and Prerna Dua, (2014). Machine learning in
healthcare informatics,. Vol. 56. Berlin: Springer
5. Eliza Strickland (2016). “Autonomous robot surgeon bests humans in World First”, IEEE
Spectrum.
6. Elsaadani, A., Purdy, M. and Hakutangwi, E. (2019). [online] Retrieved December 20,
2020, from https://www.accenture.com/t20180509T033303Zw/us-en/_acnmedia/PDF-
77/Accenture-Impact-AI-GDP-Middle-East.pdf
7. Government.ae. (2018). “UAE Strategy for Artificial Intelligence”. Retrieved December
20, 2020, from https://government.ae/en/about-the-uae/strategies-initiatives-and-
awards/federal-governments-strategies-and-plans/uae-strategy-for-artificial-intelligence
8. Gulf News (2019). “Mohammad Bin Rashid launches UAE Artificial Intelligence
strategy”.Retrieved December 20, 2020, from
https://gulfnews.com/uae/government/mohammad-bin-rashid-launches-uae-artificial-
intelligence-strategy-1.2106998
9. Hsu, Shu-Yu, et al. (2014). "A 48.6-to-105.2 µW machine learning assisted cardiac sensor
SoC for mobile healthcare applications", IEEE Journal of Solid-State Circuits, Vol 49 No
4, pp.801-811

ISSN 2708-9525
188
10. Haya Al-Askar, Naeem Radi, and Áine MacDermott (2016). “Recurrent Neural Networks
in Medical Data Analysis and Classifications”, In Emerging Topics in Computer Science
and Applied Computing, Applied Computing in Medicine and Health, Morgan Kaufmann.
11. Ian Goodfellow, Yoshua Bengio, and Aaron Courville (2016). Deep Learning, Cambridge,
MA, MIT Press.
12. Jiawei Han, Micheline Kamber and Jian Pei, (2012). Data Mining Concepts and
Techniques, Morgan Kaufmann Publishers, USA, ISBN:9780123814791
13. Kesavaraj, G., and Sukumaran, S., (2013). "A study on classification techniques in data
mining", 4th International Conference on Computing, Communications and Networking
Technologies (ICCCNT) (pp.1-7)
14. Manogaran, Gunasekaran, and Daphne Lopez (2017). "A survey of big data architectures
and machine learning algorithms in healthcare", International Journal of Biomedical
Engineering and Technology Vol. 25, No 2-4, pp. 182-211
15. Mehul P. Sampat, Mia K. Markey, Alan C. Bovik, (2005). Computer-Aided Detection and
Diagnosis in Mammography, In Communications, Networking and Multimedia, Handbook
of Image and Video Processing (Second Edition), Academic Press.
16. Majdalani, F., Kögler, D. and Viereckl, R. (2019). Retrieved December 22,2020, from
http://www.strategyand.pwc.com/media/file/Trucking-to-the-future.pdf
17. Ministry of Economy (2019). Retrieved November, 13, 2020, from
http://www.economy.gov.ae/EconomicalReportsEn/MOE%20Annual%20Report%202
18. “The Economics of Artificial Intelligence: An Agenda”. (2019). University of Chicago
Press. Retrieved December 20, 2020, from https://www.nber.org/chapters/c14005.pdf
19. The Ministry of Economic Affairs and Employment of Finland. (2019). “Artificial
intelligence program”. Retrieved December 21, 2020, from https://tem.fi/en/artificial-
intelligence-programme.

ISSN 2708-9525
189
Smart Cities Track

ISSN 2708-9525
190
Concurrent Generation of Power and Water from Waste – A
Case for Policy Reforms
Mohan Lal Agarwal,
Professor & Director, Center for Marketing Energy Innovations, NTPC
School of Business, Noida, India.
Aravinthraajan B.R.
PDGM in Energy Management, NTPC School of Business, Noida, India.
Abstract
India is among the top two populous countries in the world with 1.35 billion people. It generates an enormous amount of
garbage with a daily per capita generation of municipal solid waste in India ranging from about 100 grams in small towns
to 500 grams in large towns (Source: India 2025- Environment, Shaheen Singhal, Planning Commission, Government of
India), totaling close to 300 million tons of municipal solid waste annually. With the rapid transformation and fierce
consumerism, the waste generation is feared to multiply several times and will severely test an already strained waste
management system in India. Added to this, India faces water shortages in general and has experienced the biggest water
crisis in the current year of 2019. The country is thus, urgently seeking solutions on how to enhance water availability.
The policy research paper suggests an innovative technology solution to produce power from waste and integrate the
process technology to desalinate seawater and make it potable water concurrently. The research paper describes the
innovation, technology and mechanics of the integrated technology founded on detailed evaluation and feasibility study
for Chennai. The city is one of the four top metro cities of India and faces the double whammy of growing garbage and
declining potable water supply. It reports empirical data and the functioning of a full-scale implementation of WtE
technology in Jabalpur(smart City), Madya Pradesh. The twin technology solution, however, faces a full-scale suite of
managerial and policy challenges threatening to restrict the adoption and diffusion so necessary for urban and metro
smart cities in India. The research paper, therefore, concludes with a ten-point policy reform agenda.
Keywords:
• Innovating waste to energy (WtE) generation
• Sea to Potable water
• Smart City
• Policy reform agenda
The Background
Electricity has become the fundamental driving unit for any activity in the current day scenario.
While the world is hungry for power, the supply inadequacy and stability are still the most
gnawing problem. Worse, the consumable water – another important resource that drives the
whole living and ecosystem, is depreciating in its availability. The twin shortages cannot be
overlooked for long.
Paradoxically, what is available in abundance in today’s world is consumption garbage or waste.
Every country produces garbage in growing volume. Global annual waste generation is expected
to have a whopping 70% increase from 2.01 billion tonnes in 2016 to 3.4 billion tonnes by 2050.

ISSN 2708-9525
191
(Source: What a Waste 2.0, Silpa Kaza, Perinaz Bhada-Tata, Frank Van Woerdern, World Bank
Group).
Since every material has a preset calorific value, the municipal solid waste too has a
considerable degree of high carbon and organic content left in it. Clearly, the waste has huge
potential that hasn’t been harnessed for its large heat value. For instance, it is estimated that
Chennai - one of the top four metros of India and a population of over seven million people,
produces municipal waste of 5000 metric tons per day
(http://www.chennaicorporation.gov.in/departments/solid-waste-
management/index.htm#solid). The storing capacity of two major waste deposition areas
Perungudi, Kodungaiyur in Chennai have maxed out. Chennai has not much land left to store
new waste dump yards. This has raised a lot of questions and concerns on how to dispose of
the waste. It is been projected that by 2047 around 1,400 sq.km of landfill area will be needed
for dumping the municipal solid waste which is equivalent to a combined area of three of most
populous cities in India in landmass: Hyderabad, Mumbai & Chennai (Sustainable Solid Waste
Management in India 2012 , Ranjith Kharvel & Annepu).
Exhibit 1: Municipal solid waste generation of various Indian cities in 2016. (Solid Waste
Management in India, Utkarsh Patel, ICRIER, New Delhi)
Water scarcity or shortage, as mentioned before, is the second most pressing hurdle for a
developing country. As per a study conducted by Niti Aayog (formerly Planning Commission
of India), the demand will exceed supply by a factor of two by 2030. The projections show, 6%
of GDP will be lost by 2050 due to water crisis. (Composite Water Management Index, NITI
Aayog, August 2019 ). Presently, about one-third of the world population of 6.8 billion lives in
water-scarce areas. Analysts estimate that by 2025, about half of the world population will have
to live in water-scarce areas (Report, World Health Organization). Solutions such as water
transfer or dam construction are helpful but inadequate, making water shortage as critical as
climate change.

ISSN 2708-9525
192
Exhibit 2: Water stress level and utility across India (Composite Water Management Index,
Niti Aayog, August 2019).
Exhibit 3: Supply and demand projections of water in BCM (2008,2030) in India. (Composite
Water Management Index, NITI Aayog, August 2019).
Similar to municipal solid waste, seawater too is available in abundance. A possible solution,
therefore, is to explore technology that transforms what is wasteful but available in abundance
to produce into what is essential but in short supply. In our context, we need a technology that
uses waste as a fuel to produce power and replace or reduce the use of conventional fossil fuels
such as coal that anyways pollutes the environment.

ISSN 2708-9525
193
The technology group that uses waste as fuel to generate steam and produce power electricity
is known as waste to energy or WTE technologies. The technology hugely helps to empty the
wasteland and produce power. Thus, WTE technologies provide a solution to our first order
crisis- the energy inadequacy to satisfy the power demand. Recently, innovations are underway
testing possibility that the hitherto only waste to energy (WTE) technologies also work to purify
seawater and produce potable water at the same plant concurrently.
The remaining part of the research paper documents this technological breakthrough, key
elements and analyses the financial and managerial considerations while implementing the
augmented innovation.
An Augmented Innovation
The process begins with the collection of waste all over a city and transporting it to specially
created waste dumps. Once there, the waste of all types is collectively taken to an incineration
chamber where they are completely burnt. This fires up the boiler where water is used as the
fluid of the system. Exhibit 4 below maps the dynamic technological innovation that integrates
energy production from waste to a simultaneous purification of seawater into potable water.
In a conventional power plant, the heat energy so produced converts water into steam which is sent
to a turbine. After the low-pressure steam is released from the turbine in the proposed twin
technology contribution, the steam at the outlet is equally partitioned and diverted to a condenser
and a de-aerator. At the condenser, the cooling seawater is brought around 303k. Due to the heat
absorbed from the steam, the seawater outlets temperature raises to 313k. Now at the de-aerator,
the exhaust steam is de-aerated and along with the condensed water is pumped back to the boiler.
The flue gas obtained is sent to baghouse filters and electrostatic precipitators (ESP). This results
in the conversions of a very large pile of waste into ash and dust particles that get accumulated in
the baghouse filters. The waste is thus reduced to only 5% of the previous volume as a result of
this process and hazardous solid wastes are converted into non-hazardous particles.
Furthermore, this results in a cleaner flue gas too. Since the steam passes through the turbine, a fall
in the temperature and pressure occurs. The residue of the bottom ash that remains after the
combustion is processed through toxin destructive conveyor to make it non-hazardous and can now
be safely put into landfills or recycled as construction aggregate. Meanwhile, the power generated
from the turbine shaft is used up to generate electricity that is sent to power sub-stations. This is
distributed to the locations nearby through power grids.

ISSN 2708-9525
194
Exhibit 4: Map Integrating Waste to Energy and water desalination:
The seawater at elevated temperature is sent to the low-temperature desalination process (LTTD)
where the temperature difference is used to convert into the necessary purified water as a result of
repeated expansion and condensation. The Technology works on the principle of utilizing
temperature gradient between two water bodies to evaporate the warmer water at low pressure and
condense the resultant vapor with the colder water to obtain fresh water. The working of the plant
is under sub- atmospheric pressure hence a vacuum pump is used as an aid. The other major
components are flash evaporation chamber, condenser, pumps and the pipeline required for the
incoming and outgoing of the water. The major advantage LTTD provides is the ability to operate
the plant at a very low-temperature gradient as low as 8-12C . The clean water is finally pumped
and sent for storing. Furthermore, value adding process such as the minerals and additives could
be added.
Feasibility Study for Chennai
As mentioned before, Chennai produces 4.5 million metrics tons of garbage for collection and
removal. Headed by a Superintendent Engineer, the solid waste management department of
Chennai looks after the removal of solid waste. Night conservancy is being carried out in all
important roads and commercial areas of the city. Door to door collection of garbage is
prescribed in all zones. The process results in huge waste collection and accumulation at dump
yards. As per the data published by Chennai municipal corporation, almost 78% of the waste so

ISSN 2708-9525
195
collected are substances with high calorific values and thus, have the potential to be used as a
combustible fuel (Greater Chennai Corporation Report, 2019). The incineration process,
however, desires that the waste substances are segregated as per their low to high calorific value.
The higher the gross caloric value the better the efficiency of the process.
The composition mix (Exhibit 5(a) &5(b)) makes it clear that the major portion of the waste is
organic and combustible materials which make it an ideal substance to be used as fuel.
Perungudi and Kondungaiyur are the major dump yards in Chennai where the city waste is
brought and collected. Both of them are on the verge of closing to any further waste receipt as
they have reached maximum capacity. Perungudi is merely 4.3 km away from the coastal line
which makes it easier to access the seawater and ideally suited to implement the technology so
described. Kondungaiyur is also an equally feasible location.
This makes it quite apt for the requirement as both waste and seawater would accessible easily.
Exhibit 6 below summarizes the features that make them ideal locations for implementing the
integrated technology to produce power from water and convert seawater into potable water.
Exhibit 5(a): Physical composition of the waste substances. (Greater Chennai Corporation
Report, 2019)
8%
32%
7%
6%
1%0%3%
7%1%
35%
Physicsl Compositon
Food waste
Green waste
Timber(wood)
Consumable plastic
Industrial Plastic
Steel & Material
Rags & Textiles
Paper
Rubber & Leather
Inert

ISSN 2708-9525
196
Exhibit 5(b): Chemical composition of the waste substances. (Greater Chennai Corporation
Report, 2019)
Exhibit 5(c): Sources and categories of the waste generation. (Greater Chennai Corporation
Report, 2019)
68%
16%
14% 2%
Waste Generation By Category
Residential
Commercial
Halls. Schools, Institutions
Industrial
30%
43%
24%
1% 1%1%
Chemical Analysis
Moisture Content
Organic Content
Carbon content
Potassium K 2 O
Nitrogen Content
Phosphorous P2 O5

ISSN 2708-9525
197
Exhibit 6: Technology Site Features
Location Perungudi Kodungaiyur
Extent Area around 200 acres. (Restricted) Area around 269 acres.
Total number of years in use
More than 30 Years More than 35 Years
Neighborhood Within 0.5 KM (formed after dumping) Within one K.M (are in existence)
Daily Waste disposed 2400 tons to 2600 tons 2600 tons to 2800 tons
Exhibit 7: Thermal capacity each of landfill holds
Location Kodungaiyur Perungudi
Daily MSW Dumping MTPD 2400 2800
Calorific Value of MSW kcal/kg 1650 1650
Thermal Capacity MW 192 224
Exhibit 8: Investment & generation cost for each landfill
Generation Cost
Investment - Power Plant Million Rs. 3795 3960
Investment - LTTD Plant Million Rs. 179 187
Investment – Total Million Rs. 3974 4147
Generation Cost of Power Rs./kwh 3.93 3.93
Generation Cost of Water Rs./Liter 0.04 0.04
Exhibit 9: Possible revenue generation from each of landfill
Revenue
Annual Operating Hours hrs. 7800 7800
Cost of Power Sold to Grid Rs./kwh 6 6
Cost of Fresh Water Sold to Metro Water Rs./Liter 0.1 0.1
Annual Generation-Power Million Units 289 302
Annual Generation-Water Million Liters 1458 1521
Total Revenue – Power Million Rs. 1737 1812
Total Revenue – Water Million Rs. 146 152
Total Revenue - Power + Water Million Rs. 1882 1964

ISSN 2708-9525
198
Exhibit 10: Summary calculations
Chennai Requirement Generation/
Elimination
Gap Met
Water 215 MLD 15.97MLD (4 Units) 7.4 %
Waste 5200MTD 4940 MTD removed 95%
Energy 300 MU 8.219 MU Generated 2.7%
Since heterogeneous waste is available in the landfills across the dump yards based on the thermal
capacity the financial evaluations have been calculated. The methodology adopted for the
calculation is the consideration of the per-unit cost generation and the cost of the water per liter.
The data is collected from the local DM water producers and the tariffs are adopted as per the tariff
TNEB for NCEs. The generation cost is assessed as per the thermal calculations and the cost of
production with respect to the Opex and Capex involved.
The Implementation validated that the integrated technology yields a host of managerial and
organizational benefits some of them are listed below.
• Circular economy- the complete utilization of waste promotes a circular economy in the
country.
• Ease of Operation- This will increase the efficiency of the operation of this plant as waste
availability won’t be an issue for power generation.
• Development of water and energy security in the nation – If more plants of this technology,
are set up, it multiplies the twin benefits of reducing water sacristy and usage of coal.
• Increase the viability of the waste to energy power plants in India – Implementations of
these policies will promote the waste to energy business in India.
One of the successful pilot implementations of WtE plant in India is at Jabalpur which is a 600TPD
plant. The plant has a capacity of 66500 kg/hr. steam generation which can produce about 11.5
MW of power. In the Indian scenario, the major issue with regards to using waste as fuel is the low
calorific value. It is mainly due to the heterogeneous nature of the waste which is a result of waste
not being segregated at the point of collection. This ambiguous nature of the fuel input results in
the uneven production of electricity and makes the process inefficient. Furthermore, due to the
improper estimation of waste generation in the city by the municipal corporation results in the
wrong selection of the size of the plant. In the case of Jabalpur, India’s waste estimation provided
by the municipal corporation provided was 600 tons per day. But the actual waste generation in the
city turned out to be only 380-400 tons per day.
This resulted in the need for exporting waste from Bhopal which incremented the operational cost.
Despite the barriers posed, the plant is able to produce around 8.5 MW at peak load. This proves
the potential the WtE technology holds in being the ideal solution to tackle the increasing MSW
generation in Chennai. Also, with the increase in water scarcity and depletion of the water table in
Chennai, implementations of such technologies are the need of the hour. But only if the policy
ISSN 2708-9525
199
changes mention below are brought about, the viability of such investment intensive projects can
be justified.
Furthermore, the payback period for the above estimation is 2.11 years with a plant life of 25 years.
It is evident from the insights generated from the calculation that the twin technology could have
a major contribution in terms of potable water generation and the waste elimination while
generating a nominal amount of energy production. Hence the implementation of such integrated
solution would be advantageous in a smart city as this would create a circular economy in which
sustainability and self-sustenance is ensured.
Need for Policy Reforms- Ten Point Agenda
Clearly, Jabalpur’s implementation is successful with regards to WtE technology and seems to have
validated the need and accomplished mission and mandate. However further adoption and diffusion
require several policy measures. Some of which are outlined below:
1. Mandate segregated collection of city waste by municipal corporations or outsource waste
collectors: The main challenge in the waste to energy industry is the heterogeneous nature
of the waste that results in now gross calorific value (1650 kcal/kg). It reduces the overall
efficiency of the plant. In countries like Japan, Sweden, Netherlands etc. the calorific value
of waste is as high as 3500 kcal/kg which is as good as bituminous coal. A policy change
must mandate therefore all municipalities in India to collect waste in a segregated manner
through a series of incentives and punishments for noncompliance.
2. Proactively Adopt and Incentivize Private entrepreneurs: Waste to energy technology
integrated LTTD requires a high investment in which private players may not be too ready
to invest in India hence government must play a major role in promoting it. A basic duty of
the government is to provide public services that ensures the quality of life. As our Prime
Minister Narendra Modi noted recently, "We reached Mars. No PM or Minister went. It
was the people who did it, our scientists who did it. So, can't we create a Clean India?"
(https://www.mygov.in/newindia/wp-
content/uploads/2017/08/newindia330924_1505029463.pdf). With the success of Swachh
Bharat Abhiyan, it is clear that the government is indeed pursuing clean India. This
technology will promote cleanliness with an added economic factor.
3. Project better city waste generation: Federal and state governments must encourage and
train the municipal corporations for demand projections of waste generation. This major
factor decides and majorly impacts the need, feasibility, capacity utilization and operational
cost of the WtE plants.
4. Subsidize garbage transportation freight cost and reward waste utilization: This will
increase the project viability as it will help in the reduction of the operational cost of that
plant, which is a challenge to date.

ISSN 2708-9525
200
5. Mandate Advanced waste segregating and refinement separators at the various landfill sites:
Since dumpsites in India occupy a very large area and most of its components are in muddy
nature, it is important for waste clearing and segregation to prevent land pollution and
increase the net GCV of the waste. This will furthermore increase the efficiency of the WtE
plant.
6. Mandate auxiliary power for landfill waste segregation: This will eliminate the use of
diesel engines which again emits greenhouse gases. Furthermore, diesel
consumption(diesel engines operated on an average of 8 Hr/day) is a major cost operational
cost. This could be avoided.
7. Reward public systems of waste disposal: In Norway to promote the waste disposal
amongst the public, provides rewards. India could study and adapt own system to reward
such behavior. With time this methodology will motivate and promote the sense of
responsibility amongst people.
8. Use IoT to Monitor flue gas emission: This will promote regulation and pollution check for
these power plants.
9. Promote Fly ash toxin elimination and Reuse: Toxin destructive conveyors are used in
japan which is then quality checked by the government of Japan and sold to cement
industries. Indian government should play an active role in quality assessment and sale of
the treated fly ash. This will result in creating a circular economy where even end life of
the waste has value.
10. Mandate solar and afforestation in all waste yards, sea reclamation and landfill sites etc.
This will reduce the operational cost and will help in aiding process such as heating and
lighting in the premise of the plant.

ISSN 2708-9525
201
References
1. Comparison between LTTD and RO process of seawater de salination: an integrated
economic, environmental and ecological framework, R. Venkatesan*National Council of
Applied Economic Research (NCAER), New Delhi, India.
2. COMPOSITE WATER MANAGEMENT INDEX, NITI Aayog ,August 2019.
3. Converting food waste to usable energy in the urban environment through anaerobic
digestion Curry, N.; Pillay, P. Electrical Power & Energy Conference (EPEC), 2009 IEEE
4. Electronic plastic waste management in Malaysia: the potential of waste to energy
conversion Othman, N.; Sidek, L.M.; Basri, N.E.A.; Yunus, M.N.M.; Othman, N.A. Energy
and Environment, 2009.
5. How Can India's Waste Problem See a Systemic Change? , Mathangi Swaminathan,
Economic & Political Weekly Vol. 53, Issue No. 16, 21 Apr, 2018.
6. ICEE 2009. 3 rd International Conference on Year: 2009.
7. India 2025- Environment, Shaheen Singhal, Planning Commission , Government of India .
8. Investigation of feasibility of establishing waste to energy facility in Australia,
Zahedi. A. ; Dept. of Electrical. & Computer. Syst. Eng., Monash Univ., Caulfield, Vic.,
Australia.
9. Low Temperature Thermal Desalination Plants Phanikumar V S Sistla, Venkatesan G.,
Purnima Jalihal, Kathiroli S. National Institute of Ocean Technology.
10. Solid Waste Management in India 2016 , Utkarsh Patel, ICRIER, New Delhi.
11. Status and challenges of municipal solid waste management in India: A review ,Rajkumar
Joshi and Sirajuddin Ahmed, Cogent Environmental Science(2016).
12. Solid waste to energy strategy in Lebanon: Potential, technology and design
Hammoud,A.;Kassem,M.;Mourtada, A Renewable Energies for Developing Countries
(REDEC), 2014 International Conference of Year: 2014.
13. Sustainable Solid Waste Management in India 2012 , Ranjith Kharvel Annepu, Department
of Earth and Environment Engineering , Fu Foundation School of Engineering and Applied
Science , Columbia University.
14. Sustainable Solid Waste Management in India , Ranjith Kharvel Annepu, Department of
Earth and Environment Engineering , Fu Foundation School of Engineering and Applied
Science , Columbia University(2012).

ISSN 2708-9525
202
15. What a Waste 2.0, Silpa Kaza , Perinaz Bhada-Tata, Frank Van Woerdern, World Bank
Group.
16. http://www.chennaicorporation.gov.in/departments/solid-waste-
management/index.htm#solid
17. https://www.who.int/news-room/fact-sheets/detail/drinking-water
18. https://www.mygov.in/newindia/wp-
content/uploads/2017/08/newindia330924_1505029463.pdf

ISSN 2708-9525
203
Solar Photovoltaics an Alternative Energy Conservation
Measure for 132/11 kV Substation Building Services Energy
Demands.
Shoeb Khan, Shaikhah Al Kindi 1
Abstract
400/132 kV & 132/11 kV Substations, connecting Power Generation to End Users via complex network of Cables and
Overhead lines, are nodal to Electrical Gird by stepping up and down voltage level as per grid requirement (1). Harsh
environmental conditions of UAE causes substation to be indoor type and requires ancillary services such as
Ventilation, Air-conditioning and lighting to sustain and maintain indoor conditions suited to its key electrical
equipment’s. These ancillary services borrows energy from the substation low voltage network for it operations.
Multiple Passive and Active Energy Conservations Measures(ECM) are deployed to minimize energy consumption of
these ancillary services, which includes a) Enhanced building envelope with improved Heat transfer coefficient (U-
W/m2k) b) Light control using motions sensors c) Energy efficient HVAC equipment’s and LED lights. Mentioned
ECM’s reported an average 15.3% energy savings over ASHREA 90.1-2010 baseline when modelled for three EXPO
2020 substations (2). However, these measures are not solely sufficient for significant reductions and necessitate an
alternate ECM strategy to curb ancillary energy demands. Dubai Electricity and Water Authority Transmission Power
(DEWA-TP) aligns its strategic objective, “Minimize Environmental Foot Print” (3), with Dubai Clean Energy
Strategy 2050, and promotes use of renewable energy in transmission substations. Hence, use of solar energy as an
alternative ECM with the objective to minimise substation ancillary services energy demand is proposed, studied and
implemented in three 132/11 kV substations i.e Sustainability, Opportunity and Mobility which provide power to Dubai
EXPO 2020 site. Substation annual energy demands followed by solar energy resource onsite availability for given
geospatial locations are evaluated and suitable Photovoltaics (PV) system is modelled to abridge the demand and
resource within the given constraints. Proposed PV models promises net reduction in energy demand by 33%, 22%,
22%, for Sustainability, Opportunity and Mobility S/s respectively over baseline (4).
Keywords: DEWA, Solar Photovoltaic, Electrical Grid, Renewable Energy, Alternative Energy Conservation
Measure.
References 1. DEWA Transmission Power Strategic Map. 2019.
2. Energy Modelling Report for EXPO 2020 S/s. 2019.
3. Kaplan S. Electric Power Transmission: Background and Policy Issues [Internet].
Research.policyarchive.org. 2009 [cited 24 December 2019]. Available from:
http://research.policyarchive.org/18743.pdf
4. NREL SYSTEM ADVISORY MODEL PV MODELLING REPORT. 2019.
1Email address: [email protected], [email protected]

ISSN 2708-9525
204
Supervised Classifier Based Intrusion Detection System for
Smart Home IoT Devices Syed Abbas Ali, Musawar Ahmad2
Abstract
The increase in Internet of Things (IoT) devices collecting information that is sensitive in nature requires due
importance and attention as it can impact our daily lives. These devices simplify and automate everyday tasks in a
Smart Home but there are numerous security weaknesses. Existing security measures are unable to protect smart
devices and show vulnerability towards IoT infrastructure, default settings, and loose configuration to attract
intruders. This paper proposes a supervised Intrusion Detection System (IDS) to detect cyber-attacks on Smart Home
IoT networks. The study is based on a smart home test bed consisting of seven commonly used IoT devices such as:
Fridge, Garage Door, GPS Tracker, Modbus, Motion Light, Thermostat and Weather Sensors. The efficiency of the
proposed IDS is assessed by using seven attacks from four attack categories such as: Backdoor, Denial of Service
(DoS), Injection, Password, Ransomware, Scanning and Cross Site Scripting (XSS). The performance of the supervised
learning algorithms J48, PART, Naïve Bayes, and Bayes Network gives an accuracy of: 97.80%, 97.80%, 99.04%,
and 99.83% respectively. This demonstrates that the proposed IDS can identify and inevitably differentiate between
types of attacks on a Smart Home IoT network.
Index Terms:
Internet of Things (IoT), Smart Homes, Intrusion Detection System, Supervised Machine Learning Classification,
TON_IoT Dataset.
Introduction
Smart home Internet of Things (IoT) devices[1] have a growing presence in modern housing.
Knowledgeable thermostats, smart switches with energy tags, doorbells fitted with video cameras,
smart baby interactive monitors, and fluorescent lights controlled with voice commands, smart
shades of windows, and smart speakers are all increasingly available. These devices are connected
with sensors and connected to the Internet to collect and communicate data with end users.
Security is among the most important challenges faced in smart home IoT devices. The devices
that are accessible from anywhere through the Internet remain unprotected against various
intrusions. Therefore, maintaining security in the network of IoT devices is very important. Some
of the important security aspects are given below [2-7]:
Privacy of data: The data which is collected by devices in a smart home scenario and is transmitted
among the receiving and sending nodes is under threat by Man in the Middle attacks. The
confidentiality of data can be compromised.
Integrity: The data can be changed in the process of its transmission. The accuracy of the messages
should be preserved in the complete process of its transmission.
Availability: The availability of resources is vital at the critical time of transmission. The data
communication channel can be overloaded to restrain or slow down communication.
2 SZABIST University, Dubai Campus. ([email protected])

ISSN 2708-9525
205
Authenticity: The devices and data need to be accessible to authorized users only. The procedure
of verification needs to be error free to ensure that only authorized users access the devices or
information.
Non-repudiation: The process of communication must ensure that receiving or transmitting device
leave their footprints.
An intrusion detection system (IDS) is a security measure that works mainly in the network layer
of an IoT system. An IDS positioned for an IoT system should be able to analyze packets of data
and generate responses in real time, analyze data packets in different layers of the IoT network
with different protocol stacks, and adapt to different technologies in the IoT environment [2].
An IDS that is designed for IoT-based smart environments should operate under rigorous
circumstances of low processing capability, fast response, and processing of high-volume data.
Therefore, conventional IDS’s may not be suitable for IoT environments. IoT security is an issue
where an up-to-date understanding of the security vulnerabilities of IoT systems and the expansion
of consistent mitigation approaches are required.
Types of Intrusions in Smart Home IoT Devices Following are some malware intrusions in Smart Home IoT devices’.
Sink-hole Intrusion: This type of intrusion involves the corrupted node attracting unintended data
flows towards it. In order to create this intrusion, the corrupted node attracts all nearby nodes to
deliver their respective data through the corrupted node by posing pseudo low costs. The intruder
causes the attack by incorporating a pseudo node within the transmission system [2].
Worm-hole Intrusion: In a worm-hole intrusion, the corrupted node generates a virtual path
between two nodes. The malicious node behaves as a forwarder between two original nodes. The
corrupt nodes falsely pose that they are only one-hop far from the base station. This type of
intrusion is used to influence two different nodes in proximity by dispatching data messages among
them [3].
Selected Forwarding Intrusion: The corrupt node behaves like an authorized node but on a
selected basis, it sinks certain data messages [3].
Sybil Intrusion: The corrupt node consists of more than one identity. The route determining
protocol along with detection program are targeted by the corrupt node. [4].
Hello Flood Intrusion: The routing protocol transmits the hello message to share its existence to
nearby nodes. The nearby node, which receives this hello message considers that the source node
is in proximity and therefore, includes the corrupt node to its nearby nodes list [4].
DoS Intrusion: By denying availability of resources to nearby nodes, the malicious node causes
resource loss in the network. When multiple nodes cause such intrusion, it is termed as DDoS. It
often impacts the available resources, bandwidth and processing duration etc.
Backdoor: A backdoor is typically a concealed method of bypassing normal authentication or
encryption in an embedded device. Backdoors are most often used for securing remote access to a
device or obtaining access to privileged information like passwords, corrupt or delete data on hard
drives, or transfer information within networks.

ISSN 2708-9525
206
Distributed Denial of Service: A distributed denial-of-service (DDoS) attack is a malicious
attempt to disrupt normal traffic of a targeted server, service or network by overwhelming the target
or its surrounding infrastructure with a flood of Internet traffic.
Injection Attack: Injection attack allows an attacker to stream untrusted input to a program, which
gets processed by the decoder as part of a command or query which modifies the sequence of
execution of that program.
Ransomware: Ransomware is a type of malware from crypto virology that threatens to publish the
victim's data or permanently block access to it unless a ransom is paid. While some simple
ransomware may lock the system in a way that is not difficult for an expert individual to reverse,
more advanced malware uses a technique called crypto viral force, in which it encrypts the victim's
files, making them inaccessible, and demands a ransom payment to decrypt them.
Scanning Attack: A scanning attack sends client requests to a range of server port addresses on a
host, with the goal of finding an active port and exploiting a known vulnerability of that
service. Scanning, as a method for discovering exploitable communication channels, has been
around for ages.
Cross-Site Scripting (XSS) Attack: These are a type of injection attack in which malicious scripts
are injected into otherwise benign and trusted websites. XSS attacks occur when an attacker uses
a web application to send malicious code, generally in the form of a browser side script, to a
different end user.
Password Attack: an attack that takes advantage of the users using common words or phrases and
short passwords. The hacker uses the list of common words, the dictionary, and tries to guess the
passwords. The usual common passwords are a combination of words and numbers before and after
the text.
This research aims to develop an efficient, accurate and intelligent system that provides a practical
and effective solution for securing future large scale IoT networks. An Integrated Intrusion-
Detection System that works independent of smart home IoT protocols and network structure, and
requires no prior knowledge of security threats.
This study uses efficient machine learning algorithms to detect anomalies. On the basis of its
detection process, it will be able to tailor its performance and anomaly detection capabilities
according to the changing behavior of the attacks.
Types of Intrusion Detection Systems
Signature Based IDS
In signature-based approaches, IDSs detect attacks when system or network behavior matches an
attack signature stored in the IDS’s internal databases. If any system or network activity matches
with stored patterns/signatures, then an alert will be triggered.
Anomaly Based IDS

ISSN 2708-9525
207
This technique is also known as event-based detection. This technique identifies malicious
activities by analyzing the event. Firstly, it defines the normal behavior of the network. Then, if
any activity differs from normal behavior then it is marked as an intrusion. In this approach, a
malicious node can be detected by matching the current protocol specification with previously
defined protocol state. This approach detects attacks more efficiently than signature based IDS.
Data set and Classification Tools
1. TON_IoT datasets are used for this study.
2. Dataset attributes are filtered with Feature selection “Standardize”.
3. Classification Classifier PART, J48, Naïve Bayes, Bayes Network are applied.
4. WEKA 3.9.4 (Waikato Environment for Knowledge Analysis) is used for data analysis
reports
5. Different testing options are compared for improved results.
Process of Proposed Intrusion Detection System
Figure 1: Architecture of Proposed Model for Intrusion Detection System
TON_IoT Dataset
Pre Processing
Filter (Standardize)
Dataset Splitter
Train
Test
Classification
Bayes Network
(Probabilistic Model)
Performance
Evaluator Visualization

ISSN 2708-9525
208
Dataset (TON_IoT)
The TON_IoT data sets[8] were collected from a realistic and large-scale network designed at the
IoT Lab of the UNSW Canberra Cyber, the School of Engineering and Information technology
(SEIT), UNSW Canberra @ the Australian Defense Force Academy (ADFA).
Different hacking techniques, such as DoS, DDoS and ransomware, were launched against web
applications, IoT gateways and computer systems across the IIoT network. The datasets were
filtered to generate standard features and their label. The entire datasets were processed and filtered
in the format of CSV files to be used at any platform. This dataset contains over 650K instances
categorized into eight classes namely: Normal, Backdoor, Denial of Service (DoS), Injection,
Password, Ransomware, Scanning and Cross Site Scripting (XSS).
Results and Findings
Lightweight algorithms that take less time to build the model are implemented for training and then
run on test data for evaluating performance. Performance parameters in terms of correct and
incorrect classifications produced by each algorithm are shown in table 1 and time taken to build
training model is shown in figure 2.
Classifier Total
Number of
Instances
Correctly
Classified
Instances
Incorrectly
Classified
Instances
Correctly
Classified
Instances in
%age
Incorrectly
Classified
Instances in
%age
J48 650242 635967 14275 97.8047 % 2.1953 %
PART 650242 635934 14308 97.7996 % 2.2004 %
Naïve Bayes 650242 643986 6256 99.0379 % 0.9621 %
Bayes Network 650242 649120 1122 99.8274 % 0.1726 %
Table 1: Comparative Analysis of IoT_Weather Dataset Classifier Results

ISSN 2708-9525
209
Figure 2: Comparison of time taken by Classifiers to build the model
Naïve Bayes Algorithm has taken least time of 1.19 seconds to build the model whereas Bayes
Network has taken the most time 14.08 seconds to build the model. Highest accuracy of correct
classification of instances of intrusion detection is achieved by Bayes Network and this algorithm
also gives least inaccuracy in classification of instances of intrusion detection
Figure 3: Comparison of Incorrectly classified Instances of Different Classifiers
Analysis of Confusion Matrix
A confusion matrix is a summary of prediction results on a classification problem. The number of
correct and incorrect predictions are summarized with count values and broken down by each class.
The confusion matrix shows the ways in which the classification model is confused when it makes
3.14
12.94
1.19
14.08
J48 PART Naïve Bayes BayesNetwork
Time Taken to Build the Model (s)
2.20% 2.20%
0.96%
0.17%
J48 PART Naïve Bayes Bayes Network
Incorrectly Classified Instances in %age

ISSN 2708-9525
210
predictions. It gives an insight not only into the errors being made by the classifier but more
importantly the types of errors that are being made. It is this breakdown that overcomes the
limitation of using classification accuracy alone.
Figure 4: Confusion Matrix of Intrusion Detection Class Wise of J48 Classifier
Confusion matrix of J48 (Decision Tree) is unable to classify Ransomware and XSS attacks.
Algorithm is confused between Backdoor and Ransomware attacks, DDoS and injection attacks,
DDoS, Password and XSS attacks.
Figure 5: Confusion Matrix of Intrusion Detection Class Wise of PART Classifier
Confusion matrix of PART algorithm is almost identical to that for J48.

ISSN 2708-9525
211
Figure 6: Confusion Matrix of Intrusion Detection Class Wise of Naïve Bayes Classifier
Confusion matrix of Naïve Bayes algorithm is able to classify all types of attacks. However, it is
confused between Backdoor and Ransomware attacks, DDoS and Injection attacks, DDoS,
Password and XSS attacks, Backdoor and Ransomware attacks, Password and xss attacks.
Figure 7: Confusion Matrix of Intrusion Detection Class Wise of Bayes Network Classifier
Confusion matrix of Bayes Network algorithm is also able to classify all types of attacks with
slightly higher level of overall precision. There is a nominal confusion of normal instances with all
types of attacks. This algorithm has achieved a less confused matrix. Therefore, an IDS based on
Bayes Network or Naïve Bayes algorithms are potential candidates to be used in IoT devices for
smart homes.
Conclusions
Machine learning algorithms are the best tools to classify cyber attacks for intrusion detection
system correctly. There are many algorithms of different categories but looking at the working
scenario of smart home IoT devices that are having limited capabilities, a lightweight, efficient,
correct and variant algorithm “Bayes Network” has produced a high percentage of accuracy of
intrusion detection. Four lightweight algorithms (J48, PART, Naïve Bayes, and Bayes Network)
were applied on “IoT_Weather” file of “TON_IoT” dataset obtained from a collection of different
IoT devices. It is shown through this study that machine learning algorithms can play an important
role in detecting intrusions in IoT devices. Training and testing of dataset file using 10-fold cross

ISSN 2708-9525
212
validation test option worked effectively as compared to other testing and training options of
percentage split or dataset provided for training separately. The classification model of supervised
algorithm (Bayes Network) managed to produce results according to the types and nature of attacks
and was able to address the diverse nature of attacks of smart home IoT devices.
The detailed study of different algorithms and their comparative analysis has shown their
performance and working. It is required to further investigate the nature of the attacks by analyzing
the record level behavior of the data used to in the classification model to decide for the type of the
attack. The confusion matrix should be studied in further detail to set any criteria to identify its
type of attack clearly. Dataset can be expanded or divided and filtered into date wise sub-sets to
reduce data volume for training algorithms for higher speed and performance. Deep learning
algorithms can be used on small dataset files to avoid complexity and high time of processing.
Different rules can be set on the basis of type of data to further improve the dataset identification
of anomalies.
References [1] Li, Shancang, Li Da Xu, and Shanshan Zhao (2015). The internet of things: a survey.
Information Systems Frontiers 17, 243-259.
[2] J. P. Vasseur and A. Dunkels (2008). IP for smart objects. White Paper 1, IPSO Alliance.
Retrieved January 10, 2020 from http://www.dunkels.com/adam/dunkels08ipso.pdf
[3] Can, Okan, and OzgurKoraySahingoz (2015). A survey of intrusion detection systems in
wireless sensor networks. 6th International Conference Modeling, Simulation, and Applied
Optimization (ICMSAO), IEEE, DOI: 10.1109/ICMSAO.2015.7152200
[4] Sardar, AbdurRahaman, et al. Proceedings of the 3rd International Conference on Frontiers of
Intelligent Computing: Theory and Applications (FICTA), 707-712.
[5] Gendreau AA, Moorman M (2016). Survey of intrusion detection systems towards an end to
end secure internet of things. IEEE 4th International Conference on Future Internet of Things and
Cloud (FiCloud). IEEE, 84–90
[6] Ghorbani AA, Lu W, Tavallaee M (2010) Network Intrusion Detection and Prevention,
Advances in Information Security, vol. 47. Springer, 185-198.
[7] Williams, R.; McMahon, E.; Samtani, S.; Patton, M.; Chen, H. (2017) Identifying
vulnerabilities of consumer Internet of Things (IoT) devices: A scalable approach. Proceedings of
the IEEE International Conference on
Intelligence and Security Informatics (ISI), 179–181.
[8] Mustafa N., TON_IoT Datasets for Cybersecurity Applications based Artificial Intelligence,
Retrieved January 10, 2020 from https://www.unsw.adfa.edu.au/unsw-canberra-
cyber/cybersecurity/ADFA-ton-iot-Datasets/

ISSN 2708-9525
213
Water Leak Inspection in Residential Villas
Moodhi Ali Rasheed
HBMSU Learner#: 200105224
Abstract
Water leaks consume various amount of water thus contributing to water scarcity. It is very essential to control water
leaks in order to reduce the pressure on water resources. Residential water leaks are most commonly found in faucets
and showerheads, toilets, walls, ceilings and outdoor piping systems and tanks. Currently, there are many technologies
that aid in identifying water leaks such as acoustic techniques, tracer gas method and fiber optics. Material piping,
pipe age and diameter, motion of soil, pressure of water and water hammer hit can increase the probability of water
leaks. When controlling water leaks, electricity consumption will be reduced as well since less power will be consumed
to pump the water. other advantages of controlling water leaks include reduction of maintenance and operation costs,
reduction of damage to personal properties and economic benefits such as increasing the GDP. Besides, some
difficulties might arise when identifying water leaks such as the interference of the water table during the inspection.
This paper will focus on technologies used in identifying water leaks in residential villas, steps taken to indicate water
leaks and benefits of controlling water leaks. Mainly primary data will be used which will be obtained from a site visit
to a specific villa in order to perform water leak inspection.
Introduction
The demand of water is increasing rapidly due to population growth, climate change, water leaks
and other unsustainable practices. Nowadays, regulating the amount of water consumed is
becoming an issue. Recently; scientists and technicians are giving attention to water leakage
problems. According to studies conducted by EPA, water leakage in residential villas consume 1
trillion gallons of water each year which is equal to annual water consumption in 11 million villas.
It is estimated that 10 percent of villas waste up to 90 gallons of water daily because of water leaks.
On average, residential water leaks waste 10,000 gallons of water annually which is the amount of
water used to cleanse 270 laundry loads. Residential water leaks are most commonly found in
faucets and showerheads, toilets, walls, ceilings and outdoor piping systems and tanks (EPA, 2019;
Hanson, 2017). This paper will focus on causes of water leaks in piping systems, methods used in
identifying leaks and benefits of controlling water leaks.
Literature Review
Emirate of Abu Dhabi has performed a water leakage inspection pilot project for 150 residential
villas. The breakdown of water consumption for these villas is shown in figure 1 in which 882 liters
of water is consumed daily indoors excluding leakage, 673 liters of water is used daily in
landscapes and 124 liters of water is lost daily due water leakage. The study found out that 10
percent of villas that were involved in this project lost water 5.5 times more than other villas that
had water leaks. Besides, the study couldn’t identify the causes of high rates of water leaks
(Regulation & Supervision Bureau, 2014).

ISSN 2708-9525
214
The material of the pipe is an important parameter that must be taken into consideration. Recent
studies indicated that galvanized pipes caused 55% water leak accidents, polyethylene pipes caused
37% water leak accidents and asbestos pipes caused 8% of water leak accidents. However, the
usage of asbestos pipes is banned in some countries since they contaminate water and cause serious
deadly illness. Another important factor is the age of the pipes in which experiments have shown
that galvanized pipes can last up to 15 years while polyethylene pipes can last up to 16 years. After
this period, the pipes must be replaced to prevent water leakage accidents. Moreover; as the pipes
age, water losses can reach up to 50% of the total water entering the network.
The diameter of the pipe is another parameter that must be considered. As the diameter of the pipe
increases, the hydraulic pressure decreases; therefore, the chance of water leak is less. Furthermore,
a large pipe diameter means a thicker shell thus the pipe resistance against pressure and
environmental elements increases. Also, when the pressure of the water is too high, the chances of
water leak accidents are higher. In addition, the motion of the soil around the pipe might increase
pressure and cause the pipe to crack which can be caused due to earthquakes or sliding grounds.
Wrong installation of pipes by unprofessional workers might cause leaks if joints were not
completely sealed. Pipes and joints can crack as a result of water hammer hit and the hit can become
stronger if the pipe is corroded. Furthermore, weak pipes are subjected to cracks if they are clogged.
Pipes are affected by temperatures if the material used doesn’t withstand high or low temperatures;
especially plastic pipes. As the temperature increases, the resistance of the pipes decreases and
pipes might freeze when temperatures increase thus causing tension in the pipes (Saghi and Ansari,
2015).
It is very important to control water leaks to manage water resources which prevents water scarcity.
Controlling water leaks decreases the pressure on desalination plants thus reducing harmful
emissions that cause climate change. Moreover, controlling leaks means that less water will be
pumped into pipes; therefore, less fossil fuel will be burnt to generate the pumping power. In USA,
55 water service providers were able to control more 63,000 miles of pipes that had leaks and saved
66.5 billion gallons of water in a year.
40%
7%
53%
BREAKDOWN OF WATER CONSUMPTION
Lanscape Leakage Domestic
Figure 1: Breakdown of Water Consumption
Source: Regulation & Supervision Bureau, 2014

ISSN 2708-9525
215
This amount of water can supply 1.9 million Americans in a year. Moreover, managing water leaks
benefits the economy since technologies can be developed to analyze leaks, water auditing can be
performed, and leaks can be fixed and monitored. The adoption of these practices aids in saving
money in the future, conserving water resources and boosting economic growth. Investments in
this sector also creates social benefits since people will get employed.
In USA, it is estimated that jobs in this sector will increase by 40% when compared to across the
board tax cuts. Also, this sector will increase job opportunities by more than five times when
compared to temporary business tax cuts. A study revealed that investment of $10 billion in water
leak detection industry will increase USA’s GDP from $13 to $15 billion, job opportunities will
increase from 150,000 to 220,00 and 6.5 to 10 trillion gallons of water can be saved (Center for
Neighborhood Technologies, 2013)
It’s important to manage underground leaks to prevent flooring damage. Leaking pipes in walls
can moisten the surrounding area and cause mold growth thus leading to health issues.
Discoloration in walls and bad odors indicated mold growth. Exposure to mold can cause eye and
skin irritation, wheezing, nasal stuffiness and allergic reactions. This might also be costly to
occupants since furniture and other properties might get damaged (Environmental, Health & Safety
Department – University of Washington, 2017). Employees working in offices of Pacific
Northwest, USA were suffering from health problems such as respiratory illness and
neurobehavioral symptoms due to mold growth in walls caused by leaking pipes.
Employees were moved to other working environments and five samples were taken to conduct
tests. Results showed that concentrations of bacteria and fungi (Penicillium and Aspregillus
versicolor) were high. Also, contaminants can enter leaking pipes and cause risks to the public
health. Moreover, the symptoms were less relevant when the employees moved to another working
environment (Sudakin, 1998). Experiments were conducted in distribution networks of University
of Enna; Italy and it was interpreted that soil contaminants intruded pipes that had negative pressure
tests due to cracks. Pipes were pressurized to get rid of the contaminants; however, most of the
contaminants remained in the pipe and were transferred to users. The test results elaborated that
the concentration of contaminants reached 2 g/L and this means that people who used the water
were highly susceptible to health issues (Fontanazza et al., 2015).
Leaks can be analyzed by using different advanced technologies some of them are:
• Vibration and Acoustic Techniques
➢ LeakfinderRT
Which consists of acoustic sensors such as computer, hydrophone, accelerometer and
wireless signal transmission. Sensors are installed in two different locations. This
technology functions as cross-correlation which measures the similarities of
waveforms when time lag is enforced thus the leak sound is analyzed. Besides, this
technology can’t identify the size of the leak (Zangenehmadar, 2014).

ISSN 2708-9525
216
➢ Smart Ball
Is considered as a new technology which consists of multiple sensors such as
accelerometer, temperature sensor, magnetometer, power source and ultrasonic
transmitter. All these sensors are located in the core which is covered by outer shell.
The outer shell acts as insulation to prevent noises. The smart ball is inserted into
the pipes and can record data up to 12 hours. In this method, the receiving sensor
finds the location of the smart ball by interpreting the arrival time of the acoustic
signal thus identifying the location of the leak (Zangenehmadar, 2014).
➢ Listening sticks
This method is used in areas were water leakage is suspected and this stick is put over
the suspected area to listen for the leak. Adding to that, the time delay is calculated
based on the speed of the sound in the pipe. Besides, this technology can’t be used
for plastic pipes and pipe access is required (Zangenehmadar, 2014).
• Combined Ultrasonic Inspection
➢ This technique is useful in identifying cracks and metal loss simultaneously by
using innovative sensors. High frequency is applied to pipelines repeatedly.
Besides, access to the pipe is needed to conduct the test (Zangenehmadar, 2014).
• Acoustic Fiber Optics
➢ Fiber optics are placed in the pipes and are connected to a system where optical
data can be obtained. This system consists of laser in which light is directed
through the fiber. Light is reflected since acoustic waves produces stress on the
fiber and the reflected light is interpreted by the system. Besides, this technology
is costly (Zangenehmadar, 2014).
• Tracer Gas
➢ The tracer gas (H2N2) has low specific density that’s why it penetrates quickly in
all materials. If a pipeline has a crack, the tracer gas rises vertically in which it can
be detected by using gas check. This technology can detect small leaks due to the
quick reaction. Very low concentration of hydrogen (0.5 ppm) can detect small
leaks as 5x10⁻⁷ mbar l/s (Vtech, 2010).
Site Inspection to Identify Water Leaks
Water saving devices were installed in many villas and those devices include aerators, nozzles for
watering gardens, efficient showerheads and tank bags. Those devices regulate the flow of water
by increasing pressure and using less water. The devices save 15-30% of water. Besides, in some
of the villas the devices were installed but still there are water losses. As a result, a task of water
leak inspection was assigned, and the first steps performed were the following:
• Identification of high-water consumption villas in which no saving were achieved after the
installation of water saving devices

ISSN 2708-9525
217
• Site inspection to check the efficiency of the water saving devices, to ensure that the devices
were not removed and to check if the customer included swimming pools or water fountains
in his villa.
The first two steps were fulfilled and a specific villa that had efficient water saving devices was
chosen for water leak inspection. Water saving devices were installed on March 2017. Before the
installation of water saving devices, the customer had high water consumption; however, in the
same year water consumption kept increasing in most of the months. By the end of the year, the
customer decided to remove the agriculture to reduce water consumption. Adding to that, the
consumptions of 2019 are higher than the consumptions of 2018.
After that, a site visit was conducted to investigate the pipes and pressure gauge was used in testing
all pipes in order to identify pressure losses due to leaking pipes. Lines with pressure loss were
inspected with the tracer gas method to identify leaks. The following pipe sections were tested with
pressure gauge and tracer gas:
• Section 1
Pipe section from the supplied water to the main tank
➢ No pressure drop was noted
• Section 2
Pipe section from main tank to main house tank
➢ Pressure drop was noted
• Section 3
Pipe section from main tank to second house tank
➢ Pressure drop was noted
• Section 4
Pipe section from the main tank to the irrigation tap
➢ No pressure drop was noted
The pressure drops in section 2 and 3 were due to the leaks in the outlet of the main tank. The main
tank itself had a leak in the bottom. Adding to that, all buried pipelines were inspected, and no
leaks were identified. The leaking tank and its outlet pipe connection were recommended to be
replaced. Moreover, leaks will be repaired, and water consumption will be monitored to ensure that
the leak is controlled.

ISSN 2708-9525
218
Conclusion
To conclude, controlling and managing water leaks is vital to save water since enormous amount
of water is lost due to unknown leaks. Material of the pipe, pipe age, pipe diameter, water pressure,
soil motion, and water hammer hit are factors that might cause water leaks. Adding to that,
nowadays; there are advanced technologies that analyze water leaks and they include acoustic
techniques, acoustic fiber optics, combined ultrasonic inspection and tracer gas. Many benefits can
be achieved when water leaks are controlled. Those benefits include; reduced water and electricity
consumption, reduced operation and maintenance costs, reduced damages to personal properties,
reduced contamination risks, prevention of mold growth and economic and social benefits such as
boosting the GDP and increasing job opportunities. Besides, some difficulties can arise when
locating water leaks such as access to test points, interference of environmental conditions such as
moister and water table when using acoustic techniques, identification of pipe location and the
presence more than one leak in the same pipe since the technologies are programmed to locate one
leak in a single pipe.
References
1. Center for Neighborhood Technologies. (2013) The Case for fixing the Leaks –
Protecting People and Saving Water while Supporting Economic Growth in the Gate
Lakes Region. [Online] Available from:
https://www.cnt.org/sites/default/files/publications/CNT_CaseforFixingtheLeaks.pdf.
[Accessed 3rd November 2019].
2. Environmental, Health & Safety Department – University of Washington. (2017) Mold,
Mildew & Water Damage – Health Hazards. [Online] Available from:
https://www.ehs.washington.edu/system/files/resources/IAQ_Mold_Focus_Sheet.pdf.
[Accessed 3rd November 2019].
3. EPA. (2019) Fix a Water Leak. [Online] Available from:
https://www.epa.gov/watersense/fix-leak-week. [Accessed 1st November 2019].
4. Fontanazza, C., Notaro, V., Puleo, V., Nicolosi, P. and Freni, G. (2015) Contaminant
Intrusion through Leaks in Water Distribution System: Experimental Analysis. [Online]
Mendeley 119(1). p. 426-433. Available from:
https://www.mendeley.com/catalogue/contaminant-intrusion-through-leaks-water-
distribution-system-experimental-analysis/. [Accessed 4th November 2019].
5. Hanson, R. (2017) Water Leak Detection System. [Online] Available from:
http://digitalcommons.calpoly.edu/cgi/viewcontent.cgi?article=1411&context=eesp.
[Accessed 1st November 2019].

ISSN 2708-9525
219
6. Regulation & Supervision Bureau. (2014) Summary Report – The Residential End Use of
Water Project. [Online] Available from:
http://www.waterwise.gov.ae/en/media/get/20141221_REUW-Web-Report-1.pdf.
[Accessed 2nd November 2019].
7. Saghi, H. and Ansari, A. (2015) Effective Factors in Causing Leakage in Water supply
Systems and Urban Water Distribution Networks. [Online] Research Gate 3(2-2). p. 60-
63. Available from:
https://www.researchgate.net/publication/307974423_Effective_Factors_in_Causing_Lea
kage_in_Water_Supply_Systems_and_Urban_Water_Distribution_Networks. [Accessed
2nd November 2019].
8. Sudakin, D. (1998) Toxigenic Fungi in a Water-Damaged Building: An Intervention
Study. [Online] Wiley Online Library 34(2). p. 183-190. Available from:
https://onlinelibrary.wiley.com/doi/abs/10.1002/%28SICI%291097-
0274%28199808%2934%3A2%3C183%3A%3AAID-AJIM12%3E3.0.CO%3B2-R.
[Accessed 4th November 2019].
9. Vtech. (2010) Leak Detection Methods: A Comparative Study of Technologies and
Techniques. [Online] Available from: http://www.vtechonline.com/pdf/vtech-leak-
detection.pdf. [Accessed 5th November 2019].
10. Zangenehmadar, Z. (2014) Study of Leak Detection Technologies in Water Distribution
Networks. [Online] Available from:
https://www.researchgate.net/publication/261510256_Study_of_leak_detection_technolog
ies_in_water_distribution_networks. [Accessed 5th November 2019].

ISSN 2708-9525
220
The Future of Work and Play Track

ISSN 2708-9525
221
Assessment of Entrepreneurial Intensity and Internal
Environment for Corporate Entrepreneurship - The Case of a
Governmental Entity at an Emirate in the UAE
Ayesha Al Hashemi, Fatima AlMehyas, Mariam Al Zarooni, Muna Al Ansaari,
Noor Al Masri.
Hamdan Bin Mohammed Smart University Learners
Abstract
This paper assesses one of UAE’s emirate’s large governmental organization’s Entrepreneurial Intensity using the
qualitative data from (1) the literature, and (2) from one of the authors of this paper who works at THE
ORGANIZATION. Using the Entrepreneurial Intensity Grid, THE ORGANIZATION was categorized between dynamic
and periodic/discontinuous. This paper also uses CEAI tool to quantitatively Diagnosis THE ORGANIZATION’s
internal Entrepreneurial Environment. THE ORGANIZATION scored high in Management Support at 3.94/5, average
in Work Discretion at 3.13/5, low in Rewards and Reinforcements at 2.92/5, low in Time Availability at 2.87/5, and
the lowest in organizational Boundaries at 2.35/5, which overall indicated that THE ORGANIZATION is not ready for
individual entrepreneurial activity and in parallel cannot start planning and implementing their corporate
entrepreneurial strategy. Although top management at THE ORGANIZATION is endeavoring to spread
transformational spirit, mid-level managers proved to be not supportive of that. The traditional policies, procedures,
and jobs were also analyzed as a reason for THE ORGANIZATION’s current corporate entrepreneurial status.
THE ORGANIZATION has the capabilities to become revolutionary at the entrepreneurial intensity grid by resolving
the snags identified in this paper, continuous diagnosis using CEAI, and finally planning and implementing a proper
corporate entrepreneurial strategy upon refinement of the CEAI results.
1. Literature Review
Corporate entrepreneurship is a term used to describe entrepreneurial behavior inside established
midsized and large organizations (Kuratko, and Morris, 2018). Organizations who aims to achieve
competitive advantage and want to become leaders at the market they serve should pay great deal
towards corporate entrepreneurship. Where can be defined as a set of actions aiming towards
achievement of goal(s), another term that is strategy for entrepreneurship can be defined as a set of
actions aiming towards corporate entrepreneurship. Hence, to set up and apply a strategy for
entrepreneurship you need to know where you are today in that perspective and wither your
company have the necessary resources and ready mentally. Entrepreneurial Grid is a tool where a
company can measure their entrepreneurial intensity considering factors like frequency,
innovation, proactiveness, and risk level of entrepreneurial initiatives. Entrepreneurial grid can be
used by a company to measure level as an entrepreneurial organization.

ISSN 2708-9525
222
Figure 1 - Entrepreneurial Grid
From there, and after using the entrepreneurial grid, a company can set their goal on where they
want to be in the entrepreneurial grid and when, by building a strategy that will take them there.
But not all companies are capable of building and applying a strategy for entrepreneurship,
organizations should be packed with the necessary resources and mentality. To measure a
company’s capability to apply a strategy for entrepreneurship, Kuratko, Hornsby and Covin (2014)
have introduced a tool for measuring five different dimensions of that aspect, which are top
management support, work discretion and autonomy, rewards and reinforcement, time availability,
and organization’s boundaries.
To sum up, organizations should see where they are at the entrepreneurial grid, determine where
they see to be at what point in the future. Then measure their ability to implement a strategy for
entrepreneurship, refine their ability until they are ready, and finally apply a strategy for
entrepreneurship.
2. About THE ORGANIZATION
The organization is one of the most important governmental entities at one of the emirates of the
UAE, it operates with more than 3,500 employees from 33 different nationalities. The Organization
is dramatically transforming, and the structure of the company is changing as new departments are
created and others are merged. One of the Organization’s core values is passion for customers.
They strive to develop a long-term customer relationship by consistently delivering quality,
innovation, and business values that meet or exceed their customers’ expectation. With around 1.5
million customers. The Organization is working hard to delight every customer, every time.

ISSN 2708-9525
223
The Organization provides variety of services that can be divided to paid and free services. In
addition, there are some mandatory products and others are optional for customer.
The Organization is the only provider of its core service in that emirate. It also owns 100% of the
market when it comes to licensing related contractors and consultants. In commodities, the
Organization’s products are popular among the residents of the emirate and has plans for further
expansion.
3. THE ORGANIZATION’s Entrepreneurial Intensity and Climate
Assessment
3.1 EI Assessment on the Entrepreneurial Grid
To get a fair idea to assess the entrepreneurial intensity at THE ORGANIZATION we interviewed
an employee at THE ORGANIZATION’s executive office. From the perspective of entrepreneurial
frequency, we found that THE ORGANIZATION is doing fine but not enough for us to place it
above average at the chart, as it had completed two entrepreneurial projects in this year which we
thought was fair for a governmental entity especially that they have plenty more in the pipeline and
are working on different initiatives to source creative entrepreneurial ideas.
Considering some of their entrepreneurial projects, we thought that it was fair to say that THE
ORGANIZATION is above average when it comes to innovation level. We also thought that THE
ORGANIZATION is doing great in terms of proactiveness with all the idea sourcing initiatives
outlined by the interviewee and the change-oriented leadership we sensed at THE
ORGANIZATION. Risk level wise, we think that Interviewee have justified why we shall consider
the high level of risk implementing entrepreneurial projects at THE ORGANIZATION considering
the money invested and the reputation of a big government entity such as THE ORGANIZATION.
Based on the above, we plotted THE ORGANIZATION on the Entrepreneurial grid in Error!
Reference source not found..

ISSN 2708-9525
224
Figure 2 - THE ORGANIZATION on the Entrepreneurial Grid
3.2 Company Vision and Overall Corporate Strategy for Entrepreneurship and Innovation
THE ORGANIZATION’s vision is to reach international recognition. As for their mission, it is to
utilize teamwork, positive attitude and high standard of service in a fun environment to create value
and make a difference. In addition to the remarkable initiatives by THE ORGANIZATION’s top
management to nourish innovation and in parallel entrepreneurial environment discussed, THE
ORGANIZATION is purpose-led organization with focus on re-imagining new service value-
added innovations that build brand equity and bring durable lifetime customer value and advocacy.
In 2019, THE ORGANIZATION was awarded for its unique workplace and environment. Being
a continuous innovative learning organization, THE ORGANIZATION aspires to inculcate a high-
trust and high-performance culture. THE ORGANIZATION aims to ensure sustainable holistic
growth by balancing the People, Planet, and Profit triad.
3.3 Company Structure and Levels of Management
THE ORGANIZATION is more than halfway moving from structured hierarchy government
organization towards flat and flexible organization structure, focusing more on teams and small
units than the old big hierarchal departments. Top management is directing their focus towards
women and youth empowerment as well as upskilling employee’s knowledge management skills.
3.4 Entrepreneurship Climate & Culture
To measure THE ORGANIZATION’s entrepreneurship climate and culture we applied the CEAI
test developed by Kuratko, Hornsby and Covin (2014). CEAI diagnosis the organization’s
entrepreneurial environment based on five dimensions; where each dimension gets a score from 1
to 5 based on the average of the participants’ overall responses, as per Kuratko, Hornsby and Covin
(2014) the higher the score the better, where a low score on any dimension suggests the need for
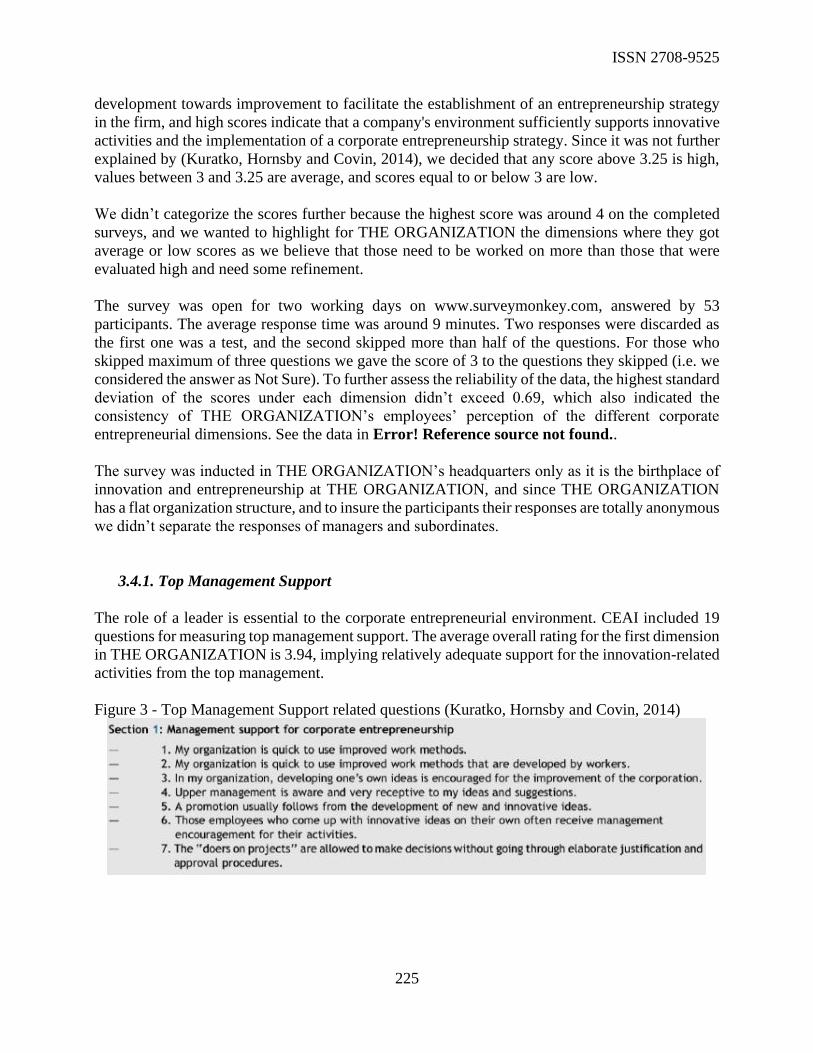
ISSN 2708-9525
225
development towards improvement to facilitate the establishment of an entrepreneurship strategy
in the firm, and high scores indicate that a company's environment sufficiently supports innovative
activities and the implementation of a corporate entrepreneurship strategy. Since it was not further
explained by (Kuratko, Hornsby and Covin, 2014), we decided that any score above 3.25 is high,
values between 3 and 3.25 are average, and scores equal to or below 3 are low.
We didn’t categorize the scores further because the highest score was around 4 on the completed
surveys, and we wanted to highlight for THE ORGANIZATION the dimensions where they got
average or low scores as we believe that those need to be worked on more than those that were
evaluated high and need some refinement.
The survey was open for two working days on www.surveymonkey.com, answered by 53
participants. The average response time was around 9 minutes. Two responses were discarded as
the first one was a test, and the second skipped more than half of the questions. For those who
skipped maximum of three questions we gave the score of 3 to the questions they skipped (i.e. we
considered the answer as Not Sure). To further assess the reliability of the data, the highest standard
deviation of the scores under each dimension didn’t exceed 0.69, which also indicated the
consistency of THE ORGANIZATION’s employees’ perception of the different corporate
entrepreneurial dimensions. See the data in Error! Reference source not found..
The survey was inducted in THE ORGANIZATION’s headquarters only as it is the birthplace of
innovation and entrepreneurship at THE ORGANIZATION, and since THE ORGANIZATION
has a flat organization structure, and to insure the participants their responses are totally anonymous
we didn’t separate the responses of managers and subordinates.
3.4.1. Top Management Support
The role of a leader is essential to the corporate entrepreneurial environment. CEAI included 19
questions for measuring top management support. The average overall rating for the first dimension
in THE ORGANIZATION is 3.94, implying relatively adequate support for the innovation-related
activities from the top management.
Figure 3 - Top Management Support related questions (Kuratko, Hornsby and Covin, 2014)

ISSN 2708-9525
226
Table 1 - THE ORGANIZATION's attributes' scores in Management Support
Dimension Dim Score Q. No. Score
Man
age
me
nt
Sup
po
rt
3.94
Q1 4.31 ↑
Q2 4.25 ↑
Q3 4.41 ↑
Q4 4.39 ↑
Q5 3.51 ↑
Q6 4.22 ↑
Q7 3.59 ↑
Q8 3.84 ↑
Q9 3.98 ↑
Q10 3.35 ↑
Q11 4.00 ↑
Q12 3.18 ↔
Q13 3.80 ↑
Q14 3.82 ↑
Q15 3.90 ↑
Q16 3.69 ↑
Q17 4.10 ↑
Q18 4.10 ↑
Q19 4.41 ↑

ISSN 2708-9525
227
As per the scores’ evaluation criteria we set, 18 questions under this dimension got high scores (i.e.
that is above 3.25), which indicated that top management is not old fashion when it comes to work
style, they welcome ideas from employees to enhance work style, they consider THE
ORGANIZATION’s employees as a source of innovative ideas that will benefit the business and
they recognize, encourage and award those who contribute to THE ORGANIZATION’s innovation
mission.
Not only this, but also, they endeavor to facilitate the journey of those contributors, and treats them
positively upon failure of execution. The top management also make sure that they hire employees
with innovation expertise. They allocate budget for innovation endeavors, and they make sure a
healthy interdepartmental communication is in place not to limit the minds of the innovators to
their fields only. In the other hand, they got an average score regarding making available variety
of options to finance individual’s innovative ideas towards the improvement of THE
ORGANIZATION.
As per the interviewee at THE ORGANIZATION – “the employees receive several recognitions
from time to time, including Special Recognition from Chairman through social media or mail
specifically boosts and uplifts the morale of an individual and in parallel enhances their longevity.”
3.4.2. Work Discretion and Autonomy
Work discretion is essential to have a flourishing innovative environment that leads to
entrepreneurial success. Some environments kill the spirit of innovation by ways that support the
manager to stand by the door, wait for the employees to punch in, introduce a log bog for the
employees to jot down the reason of the short leaves taken even after submitting them in the online
system, interfere in the decision making with regards to implementing new and positive change in
the workplace, and forbid any authority of the employees to plan and execute the work to the extent
that irritate the employees and make them feel detached from the work environment.
THE ORGANIZATION scored on Discretion a 3.13 which is average as per our scoring criteria.
The highest score was 3.6, and the lowest was 2.6. This indicates that THE ORGANIZATION is
somehow weak at empowering the employees and giving them some freedom to decide on their
tasks. THE ORGANIZATION needs to improve and strengthen work discretion in order to create
an organic environment for innovation.

ISSN 2708-9525
228
Figure 4 - Work Discretion related survey questions (Kuratko, Hornsby and Covin, 2014)
Table 2 - THE ORGANIZATION's attributes' scores in Work Discretion
THE ORGANIZATION’s employees scored their organization high in 4 out of the 10 questions
related to work discretion in the survey. A high score of 3.55 to question 21 impressively indicated
that employees at THE ORGANIZATION are treated properly if they make mistakes. Having room
for mistakes gives THE ORGANIZATION’s employees a push to learn from them rather than
being afraid of making them. Another high score of 3.41 in question 23 related to level of freedom
employees enjoy in making judgements on work situations. This score is good, and it goes in line
with insightful decision making. If employees are encouraged to practice decision making, their
judgement will be stronger, and it will reflect positively on the employee and it will ripple across
the firm (Bryan, 2019). Similarly, but not as strongly, question 20 scored 3.27, and question 26
scored 3.29 which we considered a little high as per this research evaluation criteria, but note that
they missed the average score range by very little.
Hence, to some extent in THE ORGANIZATION, the employees can make decisions and feel they
are bosses on themselves. They can also decide how the tasks they are assigned to are done to a
certain level, but they do not have the complete authority and autonomy over their tasks. It reveals
that employees are free to plan and organize their tasks, but to a certain extent they are obliged to
do the same work.
Wo
rk D
iscr
eti
on
3.13
Q20 3.27 ↑
Q21 3.55 ↑
Q22 3.04 ↔
Q23 3.41 ↑
Q24 2.88 ↓
Q25 2.73 ↓
Q26 3.29 ↑
Q27 2.96 ↓
Q28 3.06 ↔
Q29 3.06 ↔

ISSN 2708-9525
229
Yes, they can decide the how, but not the what, this was analyzed looking at the low scores of
questions 24, 25, and 27. While average scores for Q22, Q28, Q29 showed that employees feel
they are not in total control to decide for themselves. Furthermore, they feel that the organization
does not help them utilize their maximum abilities, creativity, potential to do the work.
Analyzing this dimension was a dilemma for the authors of this paper, as the score of it as per our
evaluation criteria was low, yet it had some positive aspects necessary for healthy corporate
entrepreneurial climate. This dilemma started to untangle when we analyzed the results of the
organization’s boundaries dimension in section 0 and figured the main reason of why the
employees cannot be creative even though they may feel like they are their own bosses.
3.4.3. Rewards and Reinforcement
Rewards grow a big percentage of employee’s motive and integrity to perform and innovate
(Kuratko, Hornsby and Covin, 2014). Even though there are different types of reinforcements that
managers can offer and support employees with, at the end it benefits the corporate entrepreneurial
environment. THE ORGANIZATION scored on rewards and reinforcement dimension an average
of 2.95 where the lowest score was 1.5 and the highest was 4.17. This implied that THE
ORGANIZATION is not doing the demanded critical job in the rewards scale and in employees’
reinforcement. Score 2.95 is low as per the scores’ evaluation criteria we set in this research, and
as per the survey it refers to Not Sure or less.
Hence, THE ORGANIZATION’s employees mostly couldn’t declare whether they do really get
the motivation to innovate or not. Employees rated this specific dimension with low scale as they
are not aware of how the organization arranges, builds, develops and systemizes the reinforcement
strategy and plan. This scoring results means that more effort should be occupied by management
to enhance clearer rewards strategy, thus employees arrange and perform based on that. As a result,
workers can choose where they want to position themselves in the rewards program
Figure 5 - Rewards and reinforcement related survey questions (Kuratko, Hornsby and Covin,
2014)

ISSN 2708-9525
230
Table 3 - THE ORGANIZATION's attributes' scores in Rewards and Reinforcements
Only one of the six questions related to this dimension scored a high of 3.5 as per our evaluation
criteria. This question 34’s score implied that the employee knows that his/ her work won’t be
attributed to someone else and he/ she will get the credit of their achievement. This also reveals
positive competence in THE ORGANIZATION’s internal environment.
Questions 30, 31, 32, 33 and 35 scored low between 2.7 to 3.04. This places a question mark on
how managers/ supervisors at THE ORGANIZATION translate the top management’s message we
analyzed in section 0 to their subordinates. It also reflects the standard work procedures employees
follow which will be further discussed in section 0. The reinforcement behavior of managers/
supervisors appears to be weak at THE ORGANIZATION.
Employees don’t seem to feel challenge in their work which reflects a routine day to day tasks,
they seem to have no clear idea of the rewards strategies adopted by management, there is a kind
of misunderstanding on when and what is expected from them to be rewarded. Analyzing this
dimension, we clearly observe a weak relationship and harmony between managers and employees,
and maybe managers and top management.
3.4.4. Time Availability
Innovative entrepreneurial ideas require time to be brainstormed, studied, researched, tested, and
pitched, then maybe implemented. The most dominant practice about having a job is to complete,
be evaluated, and be compensated for the responsibilities listed in the job description an employee
signs when they join a firm. Obviously, such ordinary practice won’t produce an innovative
entrepreneurial environment; as traditional job descriptions would not have areas related to
innovation and entrepreneurship and in parallel time won’t be structured accordingly.
Unfortunately, THE ORGANIZATION’s score came low in relative to this dimension, and we can
generally say that THE ORGANIZATION’s employees are mostly tight on time and the working
hours they have are merely enough to complete their day to day duties.
Re
war
ds/
R
ein
forc
em
en
ts
2.92
Q30 2.75 ↓
Q31 3.04 ↔
Q32 2.84 ↓
Q33 2.71 ↓
Q34 3.49 ↑
Q35 2.71 ↓

ISSN 2708-9525
231
Figure 6 - Time Availability related survey questions (Kuratko, Hornsby and Covin, 2014
Table 4 - THE ORGANIZATION's attributes' scores in Time Availability
None of the six questions under this dimension got a high score, which highlights a critical problem
THE ORGANIZATION should look into. It appears that the workload per employee is high and
could even be not enough to complete the day to day tasks. From a different perspective, where
questions 37 and 41 got an average score, employees seem to be not sure about the ratio between
working hours and workload, and maybe occasionally finding a slice of time to discuss problem
solutions with the team.
3.4.5. Organizational Boundaries
As we have described in section 0 the ordinary most dominant job structure would never be
supportive of corporate entrepreneurship. If employees are enjoying a high level of certainty about
their duties, then they are not in an entrepreneurial corporate. To enhance corporate
entrepreneurship, an organization should focus less on setting up unbeatable policies and
procedures and focus more on cultivating flexibility.
An entrepreneurial environment demands flexible policies that focus on the vision and the mission
of the organization rather than how work should be done and such flexible policies and procedures
organizes the desired innovation process. Although we learned in section 0 that employees at THE
ORGANIZATION feel like their own bosses, and they can decide how to do their job, they scored
THE ORGANIZATION the lowest in this dimension compared to all the other dimensions, which
reflected a set of strict rules that employees should abide to performing their day to day tasks.
Tim
e A
vaila
bili
ty
2.87
Q36 2.92 ↓
Q37 3.14 ↔
Q38 2.88 ↓
Q39 2.84 ↓
Q40 2.37 ↓
Q41 3.04 ↔

ISSN 2708-9525
232
Figure 7 - Organizational Boundaries survey related questions (Kuratko, Hornsby and Covin, 2014)
Table 5 - THE ORGANIZATION's attributes' scores in Organizational Boundries
It was evident from the scores of the seven questions under this dimension that THE
ORGANIZATION falls short in this area, especially having a traditional performance evaluation
criteria and methods, having traditional job descriptions with routine day to day tasks and high
level of certainty. Operations are managed by set rules and procedures that limits flexibility and in
parallel creativity. From a different perspective, supervisors seem to frequently discuss the
employees work performance, but unfortunately based on traditional procedures and traditional
certain evaluation criteria.
3.4.6. THE ORGANIZATION’s Overall Corporate Entrepreneurship Environment
Table 6 - All dimensions scores for THE ORGANIZATION
Org
aniz
atio
na
l
Bo
un
dar
ies
2.35
Q42 2.04 ↓
Q43 2.41 ↓
Q44 1.96 ↓
Q45 2.73 ↓
Q46 3.22 ↔
Q47 2.22 ↓
Q48 1.90 ↓
Dimension The
Organization’s Score
Management Support 3.94 ↑
Work Discretion 3.13 ↔
Rewards/ Reinforcements 2.92 ↓
Time Availability 2.87 ↓
Organizational Boundaries 2.35 ↓

ISSN 2708-9525
233
Table 7 - Summary of THE ORGANIZATION's evaluation for different attributes
THE ORGANIZATION scored high in Top Management Support, average in Work Discretion,
and low in Rewards and Reinforcements, Time Availability, and Organizational Boundaries.
The first major finding we have concluded was that employees at THE ORGANIZATION are
granted freedom when performing their duties, but to a limit that is not autonomous. They can
organize their time and tasks and finish them in a manner they deem they are suitable as discussed
in section 0. Yet tasks and duties are like a daily routine for the average worker at THE
High Average Low
1. Top Management Support
1. Financing individual innovative ideas
1. Employees can’t decide what to tasks to work on
2. Employees have room
for mistakes 2. Employees are not in
total control to decide for themselves
2. Weak reinforcement behavior of managers/ supervisors towards subordinates
3. Employees have
freedom in making judgements on work situations
3. Organization does not help employees utilize their maximum abilities, creativity, potential to do the work.
3. Employees don’t feel challenge in their work
4. Employees can make decisions and feel they are bosses on themselves
4. Employees are not sure about the ratio between working hours and workload
4. Employees have no clear idea of the rewards’ strategies adopted by management
5. Employees can manage how to complete their tasks
5. Employees occasionally find time to discuss problem solutions with the team
5. Workload per employee is high
6. Positive competence in The Organization’s internal environment
6. Supervisors frequently discuss the employees work performance
6. Traditional performance evaluation criteria and methods followed
7. Employees have
traditional job descriptions with routine day to day tasks and high level of certainty
8. Operations are managed
by set rules and procedures that limits flexibility and in parallel creativity

ISSN 2708-9525
234
ORGANIZATION, they are governed with rules, polices and operational procedures to complete
their work under a tight time as discussed in sections 0 and 0.
Secondly, the contribution from mid-level managers and supervisors towards corporate
entrepreneurial leadership was rated weak as discussed in section 0. There are huge efforts and
enthusiasm from top management towards transforming THE ORGANIZATION into an
entrepreneurial organization; this was evident from the interview and the answers analyzed from
the survey. Such entrepreneurial environment requires enablement of the individual and in parallel
individual contribution towards corporate entrepreneurship (Kuratko, Hornsby and Covin, 2014).
But this enthusiasm of the top management doesn’t move through mid-level management to
individuals.
4. Recommendations for Increasing Corporate Entrepreneurship level
Taking this test and carefully going through the results is the first step towards Increasing Corporate
Entrepreneurship level at THE ORGANIZATION. Corrective actions should be planned, tested,
implemented and controlled to enhance the contribution of individuals towards corporate
entrepreneurship. This diagnosis should be undertaken over and over until finer results are reached,
and from there become prepared for individual entrepreneurial activity and ready to plan and
implement a corporate entrepreneurial strategy.
We suggest that THE ORGANIZATION should discard the traditional policies, procedures, job
descriptions, and employee evaluation criteria and methods. Those standard tracks built by
consultancies won’t take THE ORGANIZATION beyond the standard. These traditional
boundaries should be replaced with innovative ones that encourage new way of work, different
evaluation standards, innovative guides that make the employee feel the challenge in their job, feel
the achievement, and spare time for innovation and entrepreneurial contribution.
Empowering employees results positively as it establishes rapport, creates a strong sense of
belonging and loyalty, increases productivity, and the level of motivation to achieve what is beyond
the maximum potential. Hence, we recommended to reduce excessive oversight by eliminating
punch in and outs as it leaves the employee feeling untrusted. In addition, it is more important to
give freedom for the employees to decide what they are best at with regards to the tasks they are
assigned to do, and work on them at their convenience while taking into consideration to finish the
tasks within the time constraints. It’s also important to support employees to take decisions even
though it is risky and learn from their mistakes.
Mid-level managers and their subordinates can attend special trainings in innovation, and corporate
entrepreneurship. Leadership training will be critical for mid-level managers to successfully
translate the top management corporate transformational message to their subordinates.
Furthermore, it is always good to learn from benchmarking with the most successful entities.
Richard Branson, the billionaire founder of Virgin Group believes strongly in empowering the
employees. In one of his blogs he said: “companies should give their teams freedom to make their
own decisions and express themselves” (Bryan ,2019). In addition, he introduced a new policy for
the employees to take unlimited paid leaves to capture their loyalty and support them to work

ISSN 2708-9525
235
efficiently and with desire to give the best. He also assures that employees will not abuse this policy
as they will feel more respected.
Recommended Possible Initiative Upon Readiness to Adopt A Strategy for Entrepreneurship
Monthly gathering for THE ORGANIZATION’s employees to assemble a competition designed
as a workshop, where they form different groups and each group has diverse employees from
different departments and sections to come out with an innovative complete idea in 4 hours. This
competition contributes in solving 4 dimensions’ issues. Firstly, time availability, where a special
time will be giving for critical thinking and innovating. Secondly, top management; as managers
and supervisors will be part of the group, thus no hierarchy presence. Thirdly, rewards and
reinforcements as a big valued reward is offered for the winner. Lastly, Organization’s boundaries
would be eliminated by way of no policy or management acceptation needed immediately for the
idea crafted, besides employees from different sections meet and build relationship with each other.
Thus, the idea that would be generated could deliver its voice and reaches quickly without abandon
instructions.
References
Bryan, J. (2019). Empower Employee Decision Making in Times of Change. [online] Gartner.com.
Available at: https://www.gartner.com/smarterwithgartner/empower-employee-decision-making-
in-times-of-change/ [Accessed 20 Nov. 2019].
Kuratko, D. F., Hornsby, J. S., & Covin, J. G. (2014). Diagnosing a firm's internal environment for
corporate entrepreneurship. Business Horizons, 57(1), 37-47.
Kuratko, D. F. and Morris, M. H. (2018) ‘Corporate Entrepreneurship: A Critical Challenge for
Educators and Researchers’, Entrepreneurship Education and Pedagogy, 1(1), pp. 42–60. doi:
10.1177/2515127417737291.

ISSN 2708-9525
236
Appendix 1
CEAI Data – THE ORGANIZATION’s Employees Responses
Table 8 - Unreversed Data

ISSN#:
237
Table 9 - Scores Calculation after data reversing
RespondentManagement
SupportWork Discretion
Rewards/
ReinforcementsTime Availability
Organizational
Boundaries
1 4.42 2.9 3.33 3.00 2.86
2 3.63 3.1 2.83 2.50 3.14
3 3.42 3.2 2.33 3.50 2.14
4 2.89 3.1 2.50 3.50 3.71
5 2.79 2.3 2.67 3.50 3.14
6 3.95 3.4 3.00 3.00 2.14
7 3.89 3.2 3.17 3.00 2.14
8 4.21 3.4 2.83 2.67 1.71
9 4.26 2.7 2.67 3.50 2.57
10 3.68 3.6 3.33 2.17 2.57
11 4.16 1.9 3.00 3.17 2.86
12 4.16 3.7 2.50 2.67 2.43
13 4.11 3 4.17 3.67 2.57
14 3.79 2.6 3.17 2.67 2.14
15 2.05 3 2.33 2.83 4.00
16 4.16 3.7 3.50 2.17 1.71
17 4.37 3.5 3.67 3.17 2.71
18 3.84 3.3 2.50 2.67 3.29
19 4.21 2.6 2.50 3.33 1.57
20 3.74 3.1 2.50 3.00 2.00
21 3.84 3.5 2.83 3.00 2.29
22 4.00 2.9 2.17 3.83 2.43
23 3.47 3.4 2.50 2.17 2.43
24 3.05 3 3.33 2.17 3.57
25 4.00 2.7 2.00 2.83 1.71
26 4.00 3.1 2.83 3.00 2.43
27 4.37 3.6 3.67 3.33 3.14
28 3.63 2.8 3.67 3.00 2.43
29 3.84 3 3.50 2.33 2.43
30 4.26 3.4 3.50 4.17 2.43
31 4.21 2.7 4.00 2.33 1.00
32 3.74 2.5 3.17 2.50 2.43
33 3.42 2.9 3.33 2.50 2.86
34 3.79 3.3 2.33 3.50 2.29
35 3.84 3.1 2.83 2.67 2.43
36 3.74 2.6 3.33 3.17 2.86
37 3.42 3.2 1.83 3.33 3.00
38 3.84 2.9 2.00 3.17 1.71
39 4.21 3.2 2.83 2.83 2.00
40 4.11 2.9 3.83 3.00 2.00
41 4.32 3.1 2.33 2.67 1.43
42 4.42 3.5 1.50 2.50 1.29
43 4.21 3.3 3.00 2.17 2.00
44 4.58 3.4 3.50 2.33 1.57
45 4.63 3.1 2.67 1.83 2.00
46 4.26 3.7 2.50 2.67 1.57
47 4.58 3.5 3.17 2.00 1.86
48 4.68 3.1 3.17 2.67 1.71
49 4.74 4.4 2.50 2.33 1.43
50 4.32 3.2 3.33 3.00 1.71
51 3.68 3.1 3.33 3.50 4.14
Org's Score 3.94 3.13 2.92 2.87 2.35
Standard
Deviation0.51 0.41 0.58 0.51 0.69

ISSN#:
238
Table 10 - Scores Summary
Dimension Dim Score Q. No. Score
Man
age
me
nt
Sup
po
rt
3.94
Q1 4.31
Q2 4.25
Q3 4.41
Q4 4.39
Q5 3.51
Q6 4.22
Q7 3.59
Q8 3.84
Q9 3.98
Q10 3.35
Q11 4.00
Q12 3.18
Q13 3.80
Q14 3.82
Q15 3.90
Q16 3.69
Q17 4.10
Q18 4.10
Q19 4.41
Wo
rk D
iscr
eti
on
3.13
Q20 3.27
Q21 3.55
Q22 3.04
Q23 3.41
Q24 2.88
Q25 2.73
Q26 3.29
Q27 2.96
Q28 3.06
Q29 3.06
Re
war
ds/
Re
info
rce
me
nts
2.92
Q30 2.75
Q31 3.04
Q32 2.84
Q33 2.71
Q34 3.49
Q35 2.71
Tim
e A
vaila
bili
ty
2.87
Q36 2.92
Q37 3.14
Q38 2.88
Q39 2.84
Q40 2.37
Q41 3.04
Org
aniz
atio
na
l
Bo
un
dar
ies
2.35
Q42 2.04
Q43 2.41
Q44 1.96
Q45 2.73
Q46 3.22
Q47 2.22
Q48 1.90

ISSN#:
239
Sustainable Initiative- Go Green
Asraf Ali Syeed,
Senior. Engineer, DEWA. Bachelor of Elec. Engineering. MBA, PMP.
Abdul Rasheed,
Manager, DEWA, Bachelor of Technology in Electrical, MBA.
Maher Al Ejel,
Manager, DEWA, Bachelor of Elec. Engineering, PMP.
Krishna Moorthy Kannan
Senior. Manager, DEWA Bachelor of Elec. Engineering., PMP
Abstract
This paper presents a general overview of innovative testing method of optimization of SF6 gas handling in DEWA
substation during high voltage testing of 132kilo volt cables between transformer and gas insulated switchgear.
There are 300+ DEWA substations are in operation feeding electricity to the 844,216 consumer. DEWA substation
is fully indoor substation and Gas insulated switchgear filled with SF6 gas are used in 400KV and 132KV
substation. Using the old standard practice of High voltage testing method, there are possibilities of high
possibilities of SF6 gas emission to ozone. We first study how to optimize the SF6 gas handling in DEWA substation
predict these radiated fields and examined their compliance with international standards. An innovative model
used the same technology with change in nature of work. An exposure assessment of a new innovative testing
method conducted practically at DEWA substation with the one of make of gas insulated switchgear. In a second
step, we studied the technical viability comparing with the international standard, taking into account the
stakeholder confirmation, helped study exposure level of developed idea to deployment.
Keywords: Gas insulated switchgear, cables, High voltage testing method, test adaptor device.
Introduction
DEWA substation is a standard 132-kilo volt/ 11 kilo volt substation consists of 132KV Gas
insulated switchgear of 8 number of feeder bays and 3 number of transformer. Gas insulated
switchgear are filled with SF6 (Sulphur Hexa fluoride) gas. 132KV cables are connected to
transfer power from Gas insulated switchgear (GIS) to transformer.
Scope of work
132KV cable connected between Gas insulated switchgear and transformer has to be tested after
installation at site.
Gas-insulated high-voltage switchgear (GIS) is a compact metal encapsulated switchgear
consisting of high-voltage components such as circuit-breakers and disconnectors, which can
be safely operated in confined spaces. GIS is used where space is limited, for example,
extensions, in city buildings, on roofs, on offshore platforms, industrial plants and hydro power
plants. GIS offers outstanding reliability, operational safety and environmental compatibility.

ISSN#:
240
It provides a complete range of products for all ratings and applications from 72.5 kV to 1200
kV matching current and future requirements for modern switchgears.
DEWA substation using the rated 145KV GIS and 420KV GIS for extra high voltage substation.
Figure 1: 132KV Gas insulated switchgear
A high-voltage cable (HV cable) is a cable used for electric power transmission at high voltage. A cable
includes a conductor and insulation, and is suitable for being run underground. This is in contrast to
an overhead line, which does not have insulation. High-voltage cables of differing types have a variety
of applications in instruments, ignition systems, and alternating current (AC) and direct current (DC)
power transmission. In all applications, the insulation of the cable must not deteriorate due to the high-
voltage stress, ozone produced by electric discharges in air, or tracking. The cable system must prevent
contact of the high-voltage conductor with other objects or persons, and must contain and control leakage
current. Cable joints and terminals must be designed to control the high-voltage stress to prevent
breakdown of the insulation. Often a high-voltage cable will have a metallic shield layer over the
insulation, connected to the ground and designed to equalize the dielectric stress on the insulation layer.
Any equipment’s installed at site has to be tested to check the healthiness of equipment and to
ensure free from defects due to transportation and installation.
SF6 gas: Sulphur hexafluoride (SF6) is an excellent dielectric gas for high voltage applications.
It is chemically inert, gaseous even at low temperature, non-flammable, non-toxic, non-
corrosive. Its combined chemical, thermal and electrical properties allow many advantages to
be achieved. However, SF6 gas its dangerous greenhouse gas impact to Global warming.
Test adaptor: The test adapter can permanently connect the tap on the bushing to measuring equipment,
for monitoring of the bushing during service. All bushings are capacitance-graded bushings that are
equipped with a voltage tap or test tap. The tap is connected to a conductive layer in the condenser core,
this makes it possible to measure the capacitance and dissipation factor of an installed bushing. This can
be done during service if the test adapter is installed on the tap. With the test adapter, the tap can also be
used as a power source or for the measurement of voltage. The test adapter limits the amount of power
that can be passed through the tap, despite a higher capacity of the tap, Test tap The test tap divides the
total capacitance of the bushing in two sub-capacitances: C1 (central conductor – test-tap layer) and C2
(test-tap layer – grounded flange).

ISSN#:
241
Voltage tap: The voltage tap divides the total capacitance of the bushing in two
sub-capacitances: C1 (central conductor – voltage-tap layer) and C2 (voltage-tap layer –
grounded layer).
Usage
The tap is not self-grounding, and must always be grounded or connected to an external
impedance. Because C2 usually is relatively small, the test tap must never be open-circuited
when the bushing is energized. If the tap is not grounded when the bushing is energized,
failure of the bushing will occur.
Cable High voltage test
The purpose of the test is to ensure that the cable and its terminations are fit for service and safe
to energize. The method used will be to apply a sinusoidal voltage between each cable conductor
and insulation shield (ground) in turn for a period of time.
The voltage level and application duration shall be as specified by IEC-60840 (132kV for
1hour) or as agreed with client and will stress the cable and its accessories at the same levels
encountered in normal service. The AC voltage will be generated by LC series resonance
whereby the cable under test will be the capacitor and a high voltage reactor will be the inductor.
An exciter transformer connected between the low voltage terminal of the reactor and ground
will be used to energize the resonant LC pair. The exciter transformer is energized from a
variable frequency inverter via a variable transformer. The inverter output frequency can be
varied electronically between 20Hz and 300Hz.
By knowledge of the cable capacitance and the number of reactor inductance the resonant
frequency of the test arrangement can be pre-calculated. For very short cables or apparatus
having low capacitance, e.g. busbars, a high voltage capacitor (20,000pF) will be connected in
parallel with the test object to enable resonance to be achieved at the lower end of the 20 –
300Hz frequency range.
A precision capacitive divider is used to measure the voltage being applied to the cable under
test. Test voltage, frequency, inverter output voltage & current are displayed in the computer
software.
The site will be surveyed to determine the most appropriate location to assemble the test
equipment, reactor, & capacitor divider.
The terminations remote from the testing location will be barricaded and warning signs
displayed to indicate that testing is liable to be in progress. During the application of test
voltages to the cables a watchman will be stationed near the remote terminations as an additional
safety precaution.
The free-air electrical clearance of all grounded materials from energized parts shall be a
minimum of 1.5mtr of applied test voltage (i.e. 132kV) to avoid flashover. The AC resonant
test set will be erected next to loading platform of substation and connection between the HV
test set and the cable can be made by 25 mm²copper wires and at the far end the termination
cable box end SF6 gas to be filled. The 25 mm² copper wire test lead will be contained within
100mm diameter aluminum foil ducting to reduce corona losses and minimize the generation
of external partial discharges.

ISSN#:
242
All test equipment grounds will be securely connected to the substation ground system. The
diesel generators will be prepared nearby and connected to the test set input lead. Rigid safety
barricades, warning signs and flashing warning lights will be erected around the test site. All
cable shields and link-boxes at termination end and joints will be in their in-service
configuration. Three phases of the same group will be tested together provided that the GIS
Manufacturer can install three test bushing simultaneously.
High voltage testing will commence with the measurement of cable insulation resistance,
between conductor and insulation shield, one phase at a time, by the use of a 5kV Insulation
resistance tester (Megger). The measured value of insulation resistance will be recorded at the
completion of one minute of measurement. Each conductor will be reconnected to ground upon
the completion of the insulation resistance measurement for that phase
The ground will be disconnected from all the cable before starting the HVAC test. The cable
terminals to be connected to HV terminal of the reactor via the low corona test lead.
Following a final check of safety precautions and that all equipment connections and grounds
are present & adequate the generator can be started. With the exciter transformer voltage
regulator at minimum setting the variable frequency inverter is energized and adjusted to the
calculated resonant frequency.
The frequency is adjusted to give true resonance as indicated by maximizing the cable/reactor
voltage. The voltage regulator will then be raised to increase the exciter transformer input
voltage and consequently increase the applied test voltage. The voltage will be brought to 50kV
and held for one minute, after completion of one-minute test voltage will be raised to 76kV and
held for Partial Discharge measurement until the time the Partial Discharge (PD) operator gives
clearance, after getting PD operator clearance test will be raised to 114kV for PD measurement,
upon completion of PD measurement at 114kV, test voltage will be raised to 132kV for HV
test.
The test period will commence when the specified test voltage has been achieved. In the event
that a failure of the cable or accessories occurs during the AC high voltage test the effect will
be that the Quality factor of the resonant circuit will be considerably degraded and consequently
the test voltage will immediately fall to a much reduced value. Damage at the failure location
would be minimal. The test set will be immediately shut down and the location and cause of the
failure investigated. At the end of the specified test duration the voltage regulator output will
be decreased to minimum and the inverter shut down. A ground lead shall be attached to the
terminal of the cable that has just been tested.
After Completion of 132kV for one hour, test voltage will be reduced to 114kV and then again
to 76kV for PD measurement after HV test.
After Completion of PD, Insulation resistance will be measured again at 5kV/1min and test will
be completed.
When all phases have been AC High voltage tested the insulation resistance measurement
procedure will be repeated. The tested cables will remain connected to ground until immediately
prior to being put into service.

ISSN#:
243
Previous method of testing of High voltage cables
In order to test 132KV cables, DEWA followed the standard recognized 25 years of practice of
performing the cable High voltage test (To check the healthiness of cable) between Gas
Insulated Switchgear and transformer by mounting test adaptor device on each bay
independently (total 3 times since 3 number of bays) which involves 428 KG’s of SF6 gas works
per substation.
Figure 2- Gas insulated switchgear with test adaptor mounted

ISSN#:
244
Fig- 3 Block diagram of old testing method process
Challenges faced
Many challenges were faced in implementing the new innovative method. Since the old testing
method are proven and standard worldwide practice of 25 years. On the other scenario, there
were many disadvantage like usage of more Sf6 gas since repeating the works for similar bays,
high risk like additional installation, more consumable, complicated process, non availabity of
resources and high cost issues were faced. Before conducting an experiment technical viability
was confirmed and verified with international standards.
Root cause Analysis
Fig- 4 Fish bone diagram
SF6 gas emission to ozone
Repeated work
Strict to old standard procedure
Same work in multiple location
Two different equipment and two different standard
OEM requirement & facilities

ISSN#:
245
Solution
Did a case study on present practices and developed the innovative method on testing of High
Voltage cables in 132-kilo volt DEWA substation. The main objective was to reduce the
environmental impact on DEWA substation day to day business practice (to reduce the usage
of SF6 gas with present practice). In addition to main objectives, we also focus in cost saving,
optimize risk, happy stakeholder and happy society. Action for improvement were prepared for
the pilot project. Studied in details of different option of pros and cons of new methods to reduce
the usage of SF6 gas.
Experimental studies New Innovative method of testing
Developed a new innovative method by combining all bays cable High Voltage test together by
mounting test adaptor device on common place in switchgear instead of 3 times from each bay
independently which simplify the process and reduced the usage of 85% SF6 gas works.
Detailed study conducted on new testing method with each manufacturer. New innovation has
streamlined the testing of high-voltage cable cables in the transmission stations between the
transformer and the gas-insulated switches in addition to reducing the cost and limiting the work
that includes the use of SF6 gas by 85% In the gas-insulated key room rather than installing
multiple test adapters in multiple areas, thereby simplifying test operations.
In previous method, gassing works of 486 Kg’s of SF6 gas handling works required, whereas
the new innovative testing method required only 52 Kg’s of SF6 gas works. Imagine if
whatsoever reason if minor gas leakage happens, it will bring a major effect in environmental.
For example, if 1 Kg of SF6 gas leaks that is equal to 22 tonnes of Carbon dioxide co2. In
addition to optimization of Sf6 gas handling, Various other benefits like cost and resources
saving saved.
The new innovative testing method, number of feeders bays can be selected by switching
operation with the required bays. Experimentally done for each original equipment
manufacturer and one of the test procedure shown below

ISSN#:
246
Fig-5 New innovative testing method illustrative single line diagram
Installation of HV test adaptor on common location
Test adaptor device will be installed on common point of gas insulated switchgear. Three
transformer cables between GIS and transformer will be tested together with the required
switching in the gas insulated switchgear bays. In case of any abnormalities found, this can be
separated and tested individually.
Test voltages will be applied to all the cables through gas insulated switchgear with respective
switching operation. Gassing and degassing works limited since the complete cables i.e 3
numbers of transformer cable are testing in single application.
After completion of high voltage test of cables, will be normalized by degassing the chamber
and then removing the test adaptor. If required by the user of the switchgear, the manufacturer
shall make special provisions for the testing of the cable system, such as disconnecting facilities,
earthing facilities and/or increasing gas pressure within the given design limits of the cable
connection enclosure. This applies also if parts of the switchgear directly connected to the cable
connection assembly cannot withstand the test voltage specified in IEC 60141 and IEC 60840
or IEC 62067 for the cable test at rated gas density. It also applies if in the judgment of the
switchgear manufacturer, it is not acceptable to apply the test voltage to the affected switchgear
components.
If required by the user, the switchgear manufacturer shall provide the location for a suitable test
bushing and provide the user with all necessary information for mounting such a bushing to the
cable connection enclosure. For cases where electrical clearances are inadequate, the term
bushing shall include a suitable insulated connection and test terminal. The requirement for the
test bushing shall be specified by the user in the enquiry.
NOTE It should be noted that increasing the gas pressure is not a reliable method of improving
the electrical strength at the surface of an insulator when tested with DC voltage. The AC test
voltages of extruded cables after installation according to IEC 60840 and IEC 62067 are

ISSN#:
247
normally not critical for GIS insulators if the level is below the site test voltages of GIS
according to IEC 62271-203 Subclause 10.2.101.1.4.
Outcome
Feedback and confirmation obtained from all stakeholders to implement the project (sustainable
solution) for all ongoing and future DEWA substation. Challenges like technical vulnerability,
original manufacturer confirmation on newly proposed method were overcome. Team initially
plan to implement the project for 10 numbers of selected on-going substation, which was
successfully tested and completed.
Accordingly, as per the project master plan, we implemented the new innovative method of
testing in running projects after getting concurrence from concerned stakeholders.
Achievement
1. Usage of SF6 gas works reduced by 85% (4280 Kg's of SF6 gas works reduced per 10
Substation equals to 97,584 tonnes of Co2 avoided). 2. Green Environment (21,400 cars emission avoided in Dubai city for a whole year)
3. Cost saving of USD 3.26 million per 10 numbers of Substation.
Cost saving calculation
Each item/scope of works (Degassing-test adaptor fixing-Re-gassing-specialist charges
contains Bill of Quantity (BOQ ) rate during tendering/ awarding of contract. BOQ rate is
varying from AED 500,000 to AED 800,000 as per the signed contract. considered an average
amount of AED 700,000 for one time per S/s .
Accordingly for 10 number of S/s- 10*700,000= AED 7 Million (3.26 million USD). This cost
saving will be continued for running & future projects as well. Happy stakeholders (Resources,
cost, time saved (328 man-days saved). Developer/customer- project work commissioned on
time prior to ahead of schedule. Society- Green environment- Manufacturer/contractor – Work
simplified, less consumables, man-days, cost and resource saving. Dewa- Increase productivity,
cost saving, resource saving, Happy stakeholders5. Happy society (21,400 cars emission
avoided in the Dubai city for a whole year).

ISSN#:
248
Fig 6- comparison table
Conclusion
New innovation has streamlined the testing of high-voltage cable cables in the transmission
stations between the transformer and the gas-insulated switches in addition to reducing the cost
and limiting the work that includes the use of SF6 gas by 85% In the gas-insulated key room
rather than installing multiple test adapters in multiple areas, thereby simplifying test
operations.
This project is a breakthrough and globally it is first kind of new innovative testing methodology
of high voltage cables which is contributing to environment. This project contributed to global
sustainable development goals of responsible consumption and production, climate action.
References:
1. DEWA- Method of statement
2. Gas insulated switchgear- ABB ELK04
3. IEC 60840 & IEC 62271-209
4. Siemens – Gas insulated switchgear 8DN8
0
1000
2000
3000
4000
5000
6000
SF6 gas work in kg consumbales Total activity in hrs manpower cost in %
comparison on previous and new innovative sustainable method
standard method sustainable method
ISSN#:
249
Establishment Smart Monitoring and Evaluation System in
New Organizations (Case Study: Iran Ministry of Science,
Research and Technology)
Reza Mohammad kazemi,
Associate professor, University of Tehran, Faculty of Entrepreneurship3
Majid Pourmesgari,
PhD candidate, University of Tehran, faculty of Entrepreneurship4
Mohammad Reza Hossein Zadeh,
PhD Management, Chairman and CEO, Bank Melli Iran5
Abstract
Nowadays, monitoring and evaluation is reliable toolkit to achieving qualitative and quantitative organization’s
goals. For success, modern organizations with Dynamics Structure, Strategy, System and Staff (4S) are required
to have a multi dimension view to internal and external environment of organization. The aim of this study is
identifying effective approaches in establishing a smart monitoring and evaluation system in modern organization
with flat structure. Optimization in produce, development and maintains of Buildings of higher education system
in Iran, was the most important reason that was followed by monitoring and evaluation system. The approach of
research methodology is qualitative and case study is method which scholars used as a suitable methodology. Data
collection was done by in- depth interview from 43 expert man who was expert in Information technology and civil
engineering. The information was analyzed by some policy makers, experts in organizational behavior, and
executive manager of Iran Ministry of Science, Research and Technology (MSRT) based on Delphi Method. The
results indicate there are 2 approaches to install monitoring and evaluation system in modern organization. First,
Technical approach which relates to level of technology and organizational readiness and second is about
organizational behavior subjects through persons. All in all, for successful deployment of the system, both
technical and human skills among leaders and managers are inevitable for establishment Smart Monitoring and
Evaluation System in New Organizations.
Keywords: Monitoring and evaluation, Structure, Strategy, System, Staff, Technical Approach, Behavioral
Approach
Problem Statement and Challenges
Monitoring and evaluation systems are considered one of the most important pillars of service
and production organizations in achieving organizational goals. There is growing recognition
of the critical role that National Monitoring and Evaluation Systems can play in achieving
sustainable development through enhancing effectiveness, efficiency and sustainability of
policies and programs(Tirivanhu & Jansen van Rensburg, 2018).
3 Email: [email protected] 4 Email: [email protected] 5 Email: [email protected]

ISSN#:
250
The production, development and maintenance of buildings used in higher education systems
within a dynamic and open system is a prelude to creating organizational values In this regard,
the process of monitoring and evaluating performance on construction plans is axis to
addressing the optimization process in the production, development, maintenance and repair of
associated buildings, which can be a turning point in creating value in economic, cultural,
technological, scientific and social in the higher education system. The Directorate of
Monitoring and Evaluation is responsible for providing reliable data findings for decision-
makers. They are in turn expected to access the data and information through the National
Integrated Monitoring and Evaluation System (Warinda, 2019).
Deployment of monitoring and evaluation systems on the IT platform, in addition to creating
intelligent organizational knowledge, can lead to information transparency for optimal
allocation of construction budgets. Also, the use of monitoring and evaluation systems
significantly contributes to the decision-building and decision-making of higher education
managers and policymakers in achieving predetermined quantitative and qualitative goals.
Because of the large scope of this program, a good monitoring and evaluation system is needed
to ensure its effectiveness. A web-based application is proposed to complement the existing
manual monitoring system(Budiarto et al., 2018).
Requirements to deploy these systems include receiving, processing and producing relevant,
credible, and timely information from regulatory agencies. The need to ensure that construction
project monitoring and evaluation systems generate the required project information for
effective project delivery and decision-making is imperative for project success(Tengan,
Aigbavboa, & Oke, 2018).
The advantages of using monitoring and evaluation systems in the construction
sector of higher education include:
1- Integrating and Managing Physical Space Information in the status of a valid and reliable
database
2- Cost-benefit analysis capability to develop educational, research, sport, entrepreneurship
and welfare spaces in existing and future disciplines in universities.
3- Provide up-to-date reports on ongoing and planned construction projects that underpin
mother development plans for universities .
4- Reduce human and process errors and mechanization of monitoring and evaluation process
5- Storing organizational knowledge and retaining knowledge with the retirement of expert
human resource
6- Providing up-to-date reports for decision builder, policy makers and planners in higher
education
Monitoring system definition
Monitoring is the permanent tracking and recognizing changes about a project, program and
etc. It is based on management information system( MIS) with some components: Inputs,
Storage, Control, Processing and out puts(Peersman, Rugg, & Carael, 2010). The ongoing
process of collecting and using standardized information to assess progress towards objectives,
resource usage and achievement of outcomes and impacts. It usually involves assessment
against agreed performance indicators and targets. In conjunction with evaluation information,
effective monitoring and reporting should provide decision-makers and stakeholders with the

ISSN#:
251
knowledge they need to identify whether the implementation and outcomes of a project,
programmer or policy initiative are unfolding as expected and to manage the initiative on an
ongoing basis(Dal Poz, Gupta, Quain, Soucat, & Organization, 2009). Monitoring is the routine
collection and analysis of information to track progress against set plans and check compliance
to established standards. It helps identify trends and patterns, adapt strategies and inform
decisions for project/program management(IFRC, 2011).
TABLE 1: Common types of monitoring system (IFRC, 2011)Common types of monitoring
Common types of monitoring Example Results monitoring: tracks effects and impacts. This
is where monitoring merges with evaluation to
determine if the project/program is on target towards
its intended results (outputs, outcomes, impact) and
Whether there may be any unintended impact
(positive or negative).
A psychosocial project may monitor that its
community activities achieve the outputs that
contribute to community resilience and ability to
recover from a disaster.
Process (activity) monitoring tracks the use of inputs
and resources, the progress of activities and the
delivery of outputs
A water and sanitation project may monitor that
targeted households receive septic systems
according to schedule
Compliance monitoring ensures compliance with
donor regulations and expected results, grant and
contract requirements, local governmental
regulations and laws, and ethical standards
A shelter project may monitor that shelters adhere
to agreed national and international safety
standards in construction.
Context (situation) monitoring tracks the setting in
which the project/program operates, especially as it
affects identified risks and assumptions, but also any
unexpected considerations that may arise.
A project in a conflict-prone area may monitor
potential fighting that could not only affect project
success but endanger project staff and volunteers
Beneficiary monitoring tracks beneficiary
perceptions of a project/program. It includes
beneficiary satisfaction or complaints with the
project/program, including their participation,
treatment, access to resources and their overall
experience of change.
A cash-for work program assisting community
members after a natural disaster may monitor how
they feel about the selection of program
participants; the payment of participants and the
contribution the program is making to the
community (e.g. are these equitable?).
Financial monitoring accounts for costs by input and
activity within predefined categories of expenditure.
It is often conducted in conjunction with compliance
and process monitoring
A livelihoods project implementing a series of
micro-enterprises may monitor the money awarded
and repaid, and ensure implementation is
according to the budget and time frame.
Organizational monitoring tracks the sustainability,
institutional development and capacity building in
the project/ program and with its partners. It is often
done in conjunction with the monitoring processes of
the larger, implementing organization
A National Society’s headquarters may use
organizational monitoring to track communication
and collaboration in project implementation
among its branches and chapters.
Evaluation System Definitions
Evaluation is disciplined data collection about activities characteristics and outcomes of a
project or program based on recognized indexes. Evaluation provides credible information for
improving program, identifying lessons learned and informing decision about future
resources(Peersman et al., 2010). Evaluation is Judging merit against some yardstick(Palfrey,
2005)” The systematic and objective assessment of an ongoing or completed initiative, its
design, implementation and results. The aim is to determine the relevance and fulfillment of
objectives, efficiency, effectiveness, impact and sustainability. The development of an
evaluation framework entails consideration of a range of matters, including identification of the
types of data that could inform an evaluation(Dal Poz et al., 2009). The IFRC’6s secretariat
6 International Federation of Red Cross and Red Crescent Societies

ISSN#:
252
adopts the OECD/DAC definition of evaluation as “an assessment, as systematic and objective
as possible, of an ongoing or completed project, program or policy, its design, implementation
and results. The aim is to determine the relevance and fulfillment of objectives, developmental
efficiency, effectiveness, impact and sustainability. An evaluation should provide information
that is credible and useful, enabling the incorporation of lessons learned into the decision-
making process of both recipients and donors(IFRC, 2011).monitoring
Process of monitoring and evaluation
DIAGRAM 1: Results-Based Monitoring and Evaluation System(Zall Kusek & Rist, 2004)
Research methodology
The approach of research methodology is qualitative and case study is method which scholars
used as a appropriate methodology. Data collection was done by in- depth interview from 43
expert man who was expert in Information technology and civil engineering. The information
was analyzed by some policy makers, experts in organizational behavior, and executive
manager of Iran Ministry of Science, Research and Technology (MSRT) based on Delphi
Method.
Key Concepts, Dimensions, and Active Elements
System introduction and subsystems: The monitoring and evaluation system consists of 6
subsystems
• Physical Space Subsystem
• Subsystem of Credits
• Project control Subsystem
• Reporting Subsystem
• Earthquake and disaster resilience subsystem
• Energy consumption optimization subsystem

ISSN#:
253
DIAGRAM 2: Subsystems of monitoring and evaluation system of construction plans
Solutions and Executive measures
Technical Approach
DIAGRAM 3: Process of Implementation of Evaluation Monitoring System in the Ministryof
Science, Research and Technology of Iran(Technical Approach)
Monitoring and
Evaluation System
Physical Space
Reporting
DisasterEnergy
Consumption Optimization
Credits
Preparation of recognition
document(RFP)
Identification of contractor and
project consultantTender Holding
Contractor selectionSystem
implementation and trial version
Pilot project at 11 selected universities
Corrective actions and Final version
presentation
Training users and holding workshops
at 22 selected universities

ISSN#:
254
Behavior Approach
DIAGRAM 4: Process of Implementation of Evaluation Monitoring System in the Ministry of
Science, Research and Technology of Iran (Behavioral Approach)
Results
TABLE 2: Results of Implementation of Information Management System in Construction
Sector of Ministry of Science and Technology of Iran(Iran Ministry Of Science, 2018) Related Indicators Results
• University area
• Type of ownership
• Occupancy level of buildings
• Data network
• Gas supply
• Power supply
• Power grid capacity
• Branch and water meter
• Address
Organizing 422 universities
and higher education centers
Running
plans
• Project Specifications
• Place of financing
• Outsourcing implementation and
consulting process
• Runtime Forecast Management
Identify 124 projects under
study at 422 universities and
higher education centers
Plans under
study
• Project Title
• Type of Usage
• Executed subtractions area
Identify, organize and register
1,363 completed projects
among 422 universities and
higher education centers
Completed
Plans
Provide solutions to resolve negative conflicts and reinforce positive organizational conflictsImproving sense of
belonging of experts man and professional
staff
Promote authentic communication
Listen with understanding rather
than evaluation
Help warning parties see that they are
dependent on each other
Assist the parties to form their own views, rather than trying to
sell them on your own
Identify organizational negative conflicts
Identify the level of analysis of damage in the organization
Pathology due to lack of system implementation in the organization

ISSN#:
255
TABLE3: Results of Implementation of Monitoring and Evaluation System with Two
Technical and Behavioral Approaches in the Construction of Higher Education System in Iran System strategy Staff Structure Indicators
of readiness
for
deployment
MANAGEMENT
INFORMATION
SYSTEM
(MIS)
Innovation in
system design,
deployment and
development
Synergy between
subsystems and
integration with
other systems to
achieve
organizational
goals
Training before, during and
after deployment
Matrix Technical
Ap
pro
ach
CUSTOMER
KNOWLDEGE
MANAGEMENT
(CKM)
Provide solutions
to resolve negative
conflicts and
reinforce positive
organizational
conflicts
• Improving sense of belonging
of experts man and
professional staff
• Promote authentic
communication
• Listen with understanding
rather than evaluation
• Help warning parties see that
they are dependent on each
other
• Assist the parties to form
their own views, rather than
trying to sell them on your
own
Flat Behavioral
MIS7 => Technical Level ➔Efficiency in Organization
CM8=> Human Level➔ Effectiveness in Organization
MIS + CM➔ Change ➔Efficiency+Effectivness = Productivity in Organization
7 Management Information System
8 Conflict Management

ISSN#:
256
References
1- Budiarto, A., Kacamarga, M. F., Suparyanto, T., Purnamasari, S., Caraka, R. E., Muljo, H. H., & Pardamean, B. (2018). SMARTD Web-Based Monitoring and Evaluation System. Paper presented at the 2018 Indonesian Association for Pattern Recognition International Conference (INAPR .)
2- Dal Poz, M. R., Gupta, N., Quain, E., Soucat, A. L., & Organization, W. H. (2009). Handbook on
monitoring and evaluation of human resources for health: with special applications for low-and middle-income countries: World Health Organization .
3- IFRC. (2011). Project/Programme Monitoring and Evaluation (M&E) Guide. In: The International
Federation of Red Cross and Red Crescent Societies Geneva .
4- Iran Ministry Of Science, R. a. T. (2018). Development Plans System.
http://194.225.2/38.92Index.aspx
5- Palfrey, C. (2005). Evaluating mental health and housing services. Housing, Care and Support,
8(1), 33 .
6- Peersman, G., Rugg, D., & Carael, M. (2010). Basic terminology and frameworks for monitoring
and evaluation. UNAIDS, Geneva .
7- Tengan, C., Aigbavboa, C. O., & Oke, A. E. (2018). Evaluation of UFPA quality assessment criteria
for monitoring and evaluation system in the Ghanaian construction industry. African Journal of Science, Technology, Innovation and Development, 10(2), 177-181 .
doi:10.1080/20421338.2017.1423008
8- Tirivanhu, P., & Jansen van Rensburg, M. (2018). Assessing gender responsiveness of the
Government-wide Monitoring and Evaluation System in South Africa. Development Southern Africa, 35(2), 163-178. doi:10.1080/0376835X.2017.1396443
9- Warinda, E. (2019). Evaluating operationalisation of integrated monitoring and evaluation system
in Kisumu County: Implications for policy makers. African Evaluation Journal, 7(1). doi:10.4102/aej.v7i1.385
10- Zall Kusek, J., & Rist, R. (2 004 .) Ten steps to a results-based monitoring and evaluation system: a
handbook for development practitioners: The World Bank .

ISSN#:
257
AN INVESTIGATION INTO THE EFFECTS OF
CORPORATE SOCIAL RESPONSIBILITY ON
CUSTOMER SERVICE QUALITY IN THE UAE: THE
MODERATING ROLE OF NATIONAL CULTURE
Naseem M. Rafee Abdulla,
PhD student; School of Business & Quality Management; Hamdan Bin
Mohammed Smart University.
Introduction
This study investigates the moderating role of national culture on the relationship between
corporate social responsibility (CSR) and service quality. The focus on CSR lies in the
mounting research evidence that CSR has strategic significance to competitive manufacturing
and service market environments (Tilakasiri, 2012). A review of the extant literature indicates
that most of CSR studies assume a linear relationship between CSR and service quality. As a
result they are frequently devoid of critical analysis of the (in) direct effect of contextual forces
that could moderate this relationship. While different internal and external factors are expected
to play a part in the relationship between CSR and service quality and customer outcomes, more
recent research seems to give more weight to cultural norms and values in this relationship.
Objectives
The aim of the current study is to investigate the impact of national culture as a moderator in the
relationship between CSR and service quality in the United Arab Emirates (UAE). The specific
objectives are to: (1) explore the relationship between CSR and service quality; and (2) examine
the moderating effect of national culture on CSR impact on service quality.
Methods
In line with the aim of the study, a quantitative methodology with a cross-sectional time horizon
was adopted. A questionnaire was developed and distributed among the customers of several
UAE-based public and private service organizations.
Results & Conclusions
A total of 802 respondents completed the survey. Several statistical methods such as descriptive
analysis, ANOVA and regression analysis were used. More precisely, correlation analysis,
factor analysis, collinearity tests, and multiple regression analysis were used to test the
hypotheses. The influence of CSR on service quality and the moderating role of natural culture
were examined through several hypotheses outlining the relationship between the CSR
dimensions of philanthropic, ethical, legal, economic, and environmental and service quality

ISSN#:
258
along with the moderating role of cultural values of power distance, individualism, masculinity,
and uncertainty avoidance. Overall, the results seem to be rather varied.
All CSR dimensions had positive effect on service quality. Power distance induced negative
moderating role on the relationships between philanthropic, ethical and legal CSR dimensions
and service quality. Individualism induced negative moderating role on the relationships
between ethical and legal CSR dimensions and service quality. Masculinity induces negative
moderating role on the relationship between legal CSR dimension and service quality.
Uncertainty avoidance induced negative moderating role on the relationship between legal and
environmental CSR dimensions and service quality.
Theoretical contribution
CSR has emerged as an unavoidable priority for companies worldwide (Korathotage, 2012).
Visser (2008) has not only identified the importance of national context in CSR research, but
also argues that the Western-driven CSR models do not fully fit into the framework of
developing economies such as those of Middle East which have attracted the attention of many
different international firms. Moreover, the moderating effect of national culture on relationship
between CSR and service quality is limited. In this respect, the current study contributes
insights into the CSR practices in social cultural contexts of developing nations.
Originality/value
The moderating role of national culture in the relationships between CSR and service quality has
received less consideration in previous research.
Keywords: Corporate social responsibility, national culture, service quality, UAE.
1. CHAPTER 1: INTRODUCTION
1.1 Rationale and Background
Corporate social responsibility (CSR) is characterized as a high profile conception that has
strategic significance for many firms in the current competitive service market environments
(Kolodinsky et al., 2010). Corporate social responsibility philanthropic, ethical, legal,
economic, and environmental. For CSR to turn out as a win-win case for both society and the
firm, two important points have been ignored. The first point is the comprehensiveness of CSR
(Moratis, 2016), and second that CSR has as an impact- management strategy at the central
point of the corporate structure. Certainly, there are several noticeable parallels between the
development of CSR and the development of quality management.
The limited empirical data of previous research on the impact of CSR on consumer attitudes and
behaviors towards services are multidirectional (Sen & Bhattacharya, 2001). The data
emphasized that CSR had no effect on consumer attitudes where other studies opposed this
finding. This inconsistency in CSR impact critically indicates that the effect of CSR could be
dependent on other factors (Sen & Bhattacharya, 2001).

ISSN#:
259
The cultural disparity is one of the vital challenges for the possible success of CSR (Yaeger et
al., 2006), and therefore the necessity for intercultural sensitivity and the awareness of diverse
cultural values among significant proficiencies is essential for CSR practitioners. This research
particularly focuses on the national culture that seems to have far less interest from CSR
researchers (Chih et al., 2010; Moon, 2004) as the prominent aspect that verifies a firm’s CSR
practices.
Rettab et al. (2014) stated that more than two-thirds of companies based in Dubai – The United
Arab Emirates (UAE) were engaged in some ways of environmental reporting, monitoring, and
transparency. This is because the environmental impact has been given great attention in recent
years because the UAE is an attractive tourism spot. This led to massive construction projects
that induced environmental events and serious problems on the country level (Noeiaghaei,
2009). The UAE is encountering numerous dilemmas in its battle against environmental impact
and CSR that has captured the attention of the UAE government recently. All Middle Eastern
countries, including the UAE, have long roads ahead for CSR implementation. National culture
variables are likely to have an impact on how customers evaluate and react to CSR initiatives.
Previous studies identified cultural differences as a vital driver of how CSR was conceived and
practiced (Huang et al., 2014; Nakata & Sivakumar, 2001).
National culture is known as the vital feature that shapes differences between individuals’ and
firms’ values and principles, norms, and traditions within diverse cultural environments
(Boonghee et al., 2011). National cultural frameworks, particularly Hofstede’s framework, are
the most cited cultural framework. He initiated four dimensions including power distance,
collectivism versus individualism, femininity versus masculinity, and uncertainty avoidance
presented in the ‘Cultural Consequences’ (1980) publication (Hofstede & Hofstede, 2005;
Wiengarten et al., 2011).
This research investigated the cultural values with a particular focus on UAE. The UAE falls
into the class of large power distance cultures - high score of 90 - meaning that people from
these cultures regularly agree on the status variances and anticipate inequalities in opportunities
and practices (O'Regan & Alturkman, 2010). The UAE, with a score of 25, is considered a
collectivistic society. This manifests in a close long-term commitment to the member “group,”
be that a family, extended family, or extended relationships. In such society, primary focus is
on the welfare of the group where an individualist (IDV) culture focuses on immediate families
(Hofstede, 1980), and as a consequence and due to the fact that the CSR concept includes many
volunteers practices for the communities, a negative relationship between IDV and CSR exists
(Thanetsunthorn, 2014).
Another dimension of national culture is masculinity (MAS) that focuses more on power and
material reward for success (Hofstede, 1980) where in such societies, individuals present less
cooperative behaviors (Thanetsunthorn, 2014) and corporations present a high focus on certain
customers and their needs. The UAE scores 50 in terms of masculinity, and can thus be
considered neither masculine nor feminine. Uncertainty avoidance is another element of
national culture where the UAE scores 80 on this dimension and, thus, has a high preference
for avoiding uncertainty. Therefore, the focus of this research was to investigate the moderating
effect of national culture on the relationship between CSR and service quality in UAE
organizations.

ISSN#:
260
1.2 Research Problem/ Gap
Kolodinsky et al. (2010) studied the customers’ perceptions and behaviors towards firms’ social
practices and found positive attitudes in their findings. However, some research gaps are still
recognized (Liu et al., 2014). For instance, each concept like service quality, customer
satisfaction, customer loyalty, and national culture is still an extremely essential matter
discussed by many papers in top-quality journals; however, studies of the relationships among
CSR, service quality, and national culture are rare. Despite the bigger number of research
articles on the range of impacts of CSR, the issue of whether CSR is meaningful for the service
provider is yet to be tackled (Eisingerich et al., 2011).
Most of the current research studied CSR and customer perceptions of a company’s motives
and its impact on customer assessments of the product/company (Vlachos et al., 2009).
Consequently, preceding researches generally investigated the impact of a company’s
involvement in CSR initiatives on customer attitudes and behavioral intentions, perceived
quality of products/services, and the company’s value and performance (Guchait et al., 2011).
As per my knowledge, none of the previous research investigated the consumers’ perception
of service quality and CSR that was one of the focuses of this study. Previous studies’ results
relating culture to service quality were often inconsistent and conflicting in the literature (Mok
& Armstrong, 1998). For instance, Mok and Armstrong (1998) assessed hotel service quality
prospects of global travelers where the phrasing of the scale was adapted for the hotel situation.
Customers from five nations had distinctive outlooks in two of the five service quality
measurements. Therefore, problems ensue because it is hard to contrast cultural results among
diverse samples, environments, industries, or service encounters (Alshaibani & Bakir, 2017).
Most cultural studies investigating cultural sensitivity nearly split customers into Asian and
Western cultures. Consequently, to discover cultural sensitivity of customer behavior
systematically, it is vital to link national culture models (such as Hofstede national culture) to
service quality.
Though certain studies regarding CSR have been conducted in the UAE (Sajadifar, 2013), the
findings determined that CSR was an increasing idea that was still limited to philanthropic
practices only. None of the studies conducted in the UAE so far could answer the following
issue that still needs a solution, “whether the relationship between CSR and service quality is
affected by national culture dimensions,” because the aim of the previous research was
different. Because of the limited research, this research focused on answering this issue.
1.3 Research Questions
The following were the research questions for this research:
1. To what extent does CSR influence service quality in the public and private service
sectors in the UAE?
2. Does national culture have a moderating effect on the relationship between CSR and
service quality in the public and private service sectors in the UAE?
1.4 Primary Aim
This study sought to investigate the impact of national culture on the relationship between
CSR and service quality in public and private service sectors in the UAE. The objectives
were as follows:

ISSN#:
261
• Identify whether CSR influences service quality in the public and private service sectors
in the UAE. • Examine the moderating role of the national culture on the relationship between CSR and
service quality in the public and private service sectors in the UAE.
1.5 Conceptual Framework
Figure 1.1 depicts the conceptual framework of the study, which, as previously mentioned, built
on the CSR literature. A central tenet of this model was that (1) CSR influences service quality
and (2) national context, more specifically power distance, individualism, masculinity, and
uncertainty avoidance, serve as moderators of the effects of this relationship. The following
figure presents the research model incorporated with the directions of each hypotheses
explained further in the following chapter.
Figure 1.1: Conceptual framework
The conceptual framework for this research presents CSR as the main independent variable.
Corporate social responsibility includes the following five dimensions: philanthropy, legal,
ethical, economy, and environment. The national culture acts as a moderator of this relationship;
four dimensions for measuring national culture, as introduced by the researchers, were added
as independent variables of the study. Geert Hofstede (1980) identified the following
dimensions of national culture: power distance, uncertainty avoidance, individualism, and
masculinity. Service quality dimensions were the dependent variables and included empathy,
assurance, responsiveness, reliability, and tangibility (Parasuraman, 1991).
2. CHAPTER 2: LITERATURE REVIEW
2.1 Corporate Social Responsibility
There is a lack of conceptual understanding of CSR due to many factors in which the complexity
and dearth of consensual descriptions of the conception are considered critical (Gulyas, 2009).
Griffin (2000) stated that CSR could be conceptualized in a different way by different individuals
and various definitions of CSR have been argued. Indeed, a generally accepted definition of
CSR is yet to emerge despite it being widely used and discussed in theory and practice (Weber,
2008). The academics and practitioners have failed to reach a consensus description of CSR. In
ISSN#:
262
accordance with Marrewijk and Werre's (2003, 95) statement, the “one solution fits all”
definition of CSR is unfeasible because CSR has different meanings for every entity based on
the progress, consciousness, and desire levels of the firm.
Howard Bowen defined CSR as:
“Corporate social responsibility refers to the obligations of businessmen to pursue
those policies, to make decisions, or to follow those lines of action which are desirable
in term of the objectives and values of our society”. (Bowen, 1953, 6)
Different definitions of CSR have emerged since the twentieth century, in which the concept of
CSR has noticeably improved through the decades. Even though scholars and managers have
constantly used the terminology of CSR, its dimensions and contents have taken various forms
over time. Its conceptual margins have been demonstrated as a porous, emerging kind of
epistemological flexibility and the deliberations on the theoretical concept have a certain level
of “analytical looseness and lack of rigor” (Friedman, 1970).
Carroll (1979) defined CSR as:
“the social responsibility of business encompasses the economic, legal, ethical, and
discretionary (or philanthropic) expectations that society has of organizations at a
given point in time”. (Carroll, 1979, 4)
The European Commission (2002) defined CSR as:
“a concept whereby companies integrate social and environmental concerns in their
business operations and in their interactions with their stakeholders on a voluntary
basis”. (European Commission, 2002, 92)
ISO 26000 defines CSR by limiting its understanding with four specifications concerning the
business–society relationship as the:
[…] responsibility of an organization for the impacts of its decisions and activities on society
and the environment, through transparent and ethical behavior that contributes to sustainable
development, including health and the welfare of society; takes into account the expectations of
stakeholders; is in compliance with applicable law and consistent with international norms of
behavior; and is integrated throughout the organization and practiced in its relationships. (ISO,
2010, 3-4).
This researcher adopted Carroll’s (1991) definition of CSR, because it is important for an
organization to be concerned with profit maximization and about its CSR, corporate citizenship,
and sustainability, to which the fifth dimension of an environmental aspect is added. Therefore,
to answer the current research questions on the CSR impact on service quality within service
organizations and the moderating role of national culture on such relationship, the researcher
used the four dimensions of CSR (namely philanthropic, legal, economic, ethical; Carroll, 1991)
and added the environmental dimension (Elkington, 2012).

ISSN#:
263
2.1.1. CSR Dimensions
Corporate social responsibility is a perception that supports voluntary actions and/or social
responsibilities. Even though these actions may not be underlined with the direct firm’s
business, there is always an indirect positive impact for those firms (Hopkins, 2005). Corporate
social responsibility concept can be defined and understood in different ways by different people
(Griffin, 2000). Currently, CSR is known for what previously was used as a combination of
diverse terminologies including corporate philanthropy, business ethics, triple bottom line,
corporate accountability, corporate citizenship, stakeholding, corporate responsibility,
community involvement, socially responsible investment, and sustainability (Silberhorn &
Warren, 2007). In line with Griffin’s concept, the understanding of the above terminologies
fluctuates from one country to another (Hopkins, 2005). In general, economic, legal, ethical, and
discretionary aspects of CSR are identified.
Therefore, a socially responsible firm should adhere to the above components (Carroll, 1979).
Later, the definition of CSR has been based on multiple corporate social responsibilities in a
pyramid model, by Carroll (1991) named ‘Pyramid of Corporate Social Responsibility’ model
that the most well-known contributions in the field, in which economic responsibility forms the
base.
Economic CSR: The type of CSR is measured in terms of shareholders' wealth maximization;
generate profit, being competitive (high quality and low cost), operational efficiency, and
continuous profitability (Carroll, 1991).
Legal CSR: This type of CSR is measured in terms of the extent that organizational activities
are consistent with laws and regulations, law-abiding corporate citizen, fulfilling a legal
obligation, and goods and services (Carroll, 1991).
Ethical CSR: Carroll defined Ethical responsibility of CSR in terms of societal mores and
ethical norms, extent that organization adjusted themselves to emerging moral norms, degree of
compromising ethical standards or norms, corporate citizenship behavior accepted by society
and the extent that the organization went beyond the legal and regulatory requirements to
maintain the integrity of the organization (Carroll, 1991).
Philanthropic CSR: Carroll defined Philanthropic as the highest level of CSR, where it was
measured in terms of philanthropic and charitable expectation of society, assistance provided to
fine and performing arts, extent that managers and employees of the organization had
involvement in voluntary charitable activities organized by the community, and assistance
provided by organization to the projects that enhances “quality life” (Carroll, 1991).
2.1.2. CSR in the UAE
In the present position of global trends in corporate responsibility, the understanding of the CSR
concept in the UAE is ever more significant specifically in terms of its application and impact
for the country’s commercial sector. Global Education Research Network (Visser et al., 2010)
within a thorough study regarding the CSR practices worldwide chose UAE as the representative
country in the Middle East.
The UAE companies’ analysis of corporate citizenship is narrowed down to legal compliance,
business growth, and occupational health and safety. In 2002, for instance, none of the countries
was considered to have political solidity by the World Bank except for UAE, which was at the

ISSN#:
264
borderline (Kaufmann et al., 2003), as several Arab nations were going through a course of
change and redistribution in a very multifaceted and conflict-reach setting. Hamad Buamim, the
president and CEO of the Dubai Chamber of Commerce and Industry stated that CSR was the
language of business in society. He identified ways for UAE businesses to implement CSR
before it became an efficient driver for the long-term sustainable development of the country
(Azzam & Rettab, 2015).
Rettab et al. (2014) performed a study involving companies from five different economic
sectors and various employment sizes. The rise in CSR practices and the drivers for adopting it
are discussed in Rettab et al. studies that concluded the reasons to focus on CSR in the UAE:
o An increase from 13% to 23% in 2012 as the importance of CSR to a company’s
strategy (Rettab et al., 2014).
o Legal compliance as the most common CSR practice (i.e. implementation of policies
for health and safety - 82%) (Rettab et al., 2009).
o Environmental impacts reported by 55% for material usage, 54% for water usage; 52%
for both energy usage and transport (Rettab et al., 2014).
o Demonstration of a strong commitment to customers, reported by 96% for protection
of customers’ privacy, 90% for customer satisfaction (Rettab et al., 2009).
o Missing on the opportunity to involve suppliers and increasing the engagement in the
supply chain (Rettab et al., 2009).
Company reputation considered as the most common driver for CSR performance, reported by
66%; and legal compliance by 64% (Rettab et al., 2014).
2.2 Service Quality
Service quality has been defined in various ways by diverse inhabitants and there is no
harmony as to a concrete definition. The operational definition of the service quality for the
purpose of this research paper is the one used by Parasuraman et al. (1988, 5), which defines:
“service quality as the discrepancy between a customers’ expectation of a service and
the customers’ perception of the service offering.”
Parasuraman et al. (1985) described service quality as the following:
“Service quality is more difficult for the customer to evaluate than goods quality. Service
quality perceptions result from a comparison of consumer expectation with actual
service performance. Quality evaluations are not made solely on the outcome of a
service; they also involve evaluations of the process of service delivery” (42)
It is legitimate and even necessary for a company to know the opinion of its customers on its
services. But on what criteria does such an assessment rest? We must first identify what needs to
be measured. This step leads to the identification of what specialists usually call the elements
of the service. These elements are grouped under more general themes called dimensions. It is
widely recognized that the relative importance of the service dimensions is influenced by the
nature of the service and the characteristics of the clients; hence, the relevance of the following
question: What dimensions can satisfy the expectations of the customers and which allow them
to be satisfied? exceed?

ISSN#:
265
2.2.1. SERVQUAL
Parasuraman et al. (1991) introduced a concise multi-item scale called SERVQUAL in which
many valid inferences as representing scores were made about service quality that could be
utilized in different contexts. This tool was constructed by Parasuraman, Berry, and Zeithaml in
1985. Later, the same scholars improved the tool successively in 1988, 1991, and 1994.
SERVQUAL primarily was constructed of a hundred items condensed in ten dimensions titled
as: tangibles, reliability, responsiveness, competence, courtesy, credibility, security, access,
communication, and understanding. A concise 22-item tool with five dimensions has been
refined latterly.
The SERVQUAL tool includes 22 questions in each of the expectation and perception sections
with an extra section to ascertain customers’ assessment of the relative significance of the five
dimensions. Each statement is measured with a 7-point Likert scale ranging from 1 (strongly
disagree) to 7 (strongly agree). More sections on customers’ experiences about the service and
demographic information are included.
2.3 National Culture
Given the importance of globalization to both practicing managers and academics, a
supplementary area of research comes into view in the form of the study of analyzing the impact
of culture on business and services. The aim of section one is to present a background on national
culture in order to contextualize this research. This section includes various definitions of
culture. It then presents a range of national cultural frameworks, particularly, Hofstede’s (2005)
framework as the most cited cultural framework. It has been simulated, at least on several
dimensions, into many cross-cultural studies, until the GLOBE became the most comprehensive
cross-cultural study in terms of a range of countries and number of responses.
Hofstede and Hofstede (2005, 4) define culture as:
“the collective programming of the mind that distinguishes the members of one group or
category of people from others”.
Hofstede’s model:
Among many of the developed cultural frameworks, ‘Hofstede Five National Cultural
Dimensions’ is the most well-known. This model received its international recognition due to
its ability to measure national culture numerically. This is because scholars can use such a
calculation model to illustrate the national culture of countries and contrast diverse nations in a
practical way.
Hofstede is a Dutch anthropologist who initiated his work studying the cultural dimensions in
the 1970s by investigating and gathering data on the values of IBM staff from 50 different
countries working at local subsidiaries of the multinational through an empirical study using
responses from 116,000 questionnaires to assess differences of personal perceptions across
countries (Hofstede, 1980). In his post data analysis, Hofstede found that the four vital dilemma
fields of social inequality and the relationship with authority, the relationship between the
individual and the group, concepts of masculinity and femininity as well as ways of dealing
with uncertainty and ambiguity had country-specific solutions.

ISSN#:
266
Power distance:
“the extent to which the less powerful members of institutions and organizations within
a country expect and accept that power is distributed unequally” (Hofstede & Hofstede
2005, 46).
Uncertainty avoidance:
“the extent to which the members of a culture feel threatened by ambiguous or unknown
situations” (Hofstede & Hofstede 2005, 167).
Individualism versus collectivism:
“is the degree to which individuals are supposed to look after themselves or remain
integrated into groups, usually around family” (Hofstede & Hofstede 2005, 167).
Masculinity versus femininity:
“when the emotional roles are clearly distinct: men are supposed to be assertive, tough, and
focused on material success, whereas women are supposed to be more modest, tender, and
concerned with the quality of life” (Hofstede & Hofstede 2005, 120).
2.3.1. National Culture Model Used in Current Research
Hofstede's (1980) research remains the major reference in this field and his way of
conceptualizing cultures continues to be adopted in many works. Moreover, it must be
recognized that Hofstede was one of the first, in the field of management or more precisely
management control in the broad sense, to use not only technical dimensions or formal
organizational characteristics, but to propose less formalized and more psychosociological
dimensions, on which the geo-societal culture undoubtedly had more influence.
2.3.2. National Culture and CSR
Corporate Social Responsibility gained increasingly high attention in recent years but only in
the West. However, it is still emerging in other countries outside the West.
Two-thirds of U.S. companies that consider CSR an important objective list "it's the
right thing to do" as one of their top three reasons for engaging in CSR, followed by
improving external image and brand (61%), improving employee morale and hiring
(49%), and in response to legal or regulatory requirements (28%). (source: CFO
Survey, 2013).
Similarly, in Europe, studies like Capron and Lanoizelée (2010) and Matten and Moon (2004),
showed that the companies applied CSR more than half way beyond the minimum regulatory
requirement. Capron and Lanoizelée (2010) noted that despite its universality, CSR varied
conceptually and operationally from one region to another. Considering the cultural specificities
of the countries only emerged very recently. Bowen (1953) specified that his analysis of
economic systems was limited to the capitalist system of the United States and did not suggest a
relevance of the concept of CSR. The spread of the concept around the world and the
development of research in the 1970s in other countries proved Bowen's position.

ISSN#:
267
2.4 Hypotheses Development
National culture is a precursor of organizational culture, which sequentially acts as a
determinant of Service Quality and CSR approach. Many scholars claim that CSR operations on
the firm level may distract the firm business (KPMG, 2011). However, the point that both
opponents and proponents agree upon is the financial benefits any firm can get by operating
CSR, especially with any transactions with its customers. Figure 1.1 depicts the conceptual
framework of the study, which, as previously mentioned, this model indicates a relationship
between CSR and service quality and national context, more specifically power distance,
individualism, masculinity, and uncertainty avoidance, serve as moderators of the effects of this
relationship.
The conceptual framework for this research presents CSR as a variable with five dimensions:
philanthropy, legal, ethical, economy, and environment. Service quality is the outcome variable.
The national culture acts as a moderator of this relationship and four dimensions for measuring
national culture, are added as variables of the study: power distance, uncertainty avoidance,
individualism, and masculinity.
2.4.1. CSR and Service Quality Hypotheses
Some scholars present negative effects and sometimes no effect of CSR upon the new product
assessment. Sen and Bhattacharya (2001) justified the negative effect of CSR based on
corporate ability-CSR trade-off in which it introduced the feelings of the customers that any
firm has a high level of investment in CSR may not show the same level in its quality
development (He & Li, 2011). Some other scholars justified the weak effect due to CSR
information being less pertinent or indicative of the product evaluation (Brown and Dacin,
1997). Managers can leverage CSR to increase performance by aligning the company's
strategy with its CSR initiatives and maintaining the quality and innovation of its services
(Tingchi et al., 2014).
o H1: Customer’s perception of CSR positively influences service quality in the UAE.
2.4.2. Power Distance Index (PDI) and CSR
The UAE scores highly on the PDI dimension (a score of 90), which means that people accept
a hierarchical order in which everybody has a place and that needs no further justification.
Therefore, we expected that firms in the UAE with a high PDI culture to have a lower degree
of CSR, which in turn would decrease service quality (Hofstede, 2016). Based on the analysis
above we hypothesized that PDI moderated the relationship between CSR and service quality
in the UAE. The role of this study was to reveal whether this moderation negative or positive
for each CSR dimension.
o H2: PDI moderates the relationship between CSR and service quality in the UAE.
ISSN#:
268
2.4.3. Individualism (IDV) and CSR
An individualist (IDV) culture is one in which members focus on their own interests rather
than the group interest, such that individuals primarily focus on their immediate families
(Hofstede, 1980), and relationships between individuals are loose. Scholars such as Ringov
and Zollo (2007), and Ho et al. (2012) found a negative relationship between IDV and CSR
(Nakata & Sivakumar, 2001; Thanetsunthorn, 2014). The UAE, with a score of 25, is
considered a collectivistic society, and in collectivist cultures, as being group dominant
formation, harmonization of efforts to diminish confusion and competition, and subordination
of personal inclination are encouraged (Diener & Diener, 1995).
o H3: IDV moderates negatively the relationship between CSR and service quality in the
UAE.
2.4.4. Masculinity (MAS) and CSR
The hypothesis of a negative link between masculinity and company CSR level was validated
by Ringov and Zollo (2007) and Peng et al., (2012). Only the study by Ho et al. (2012)
concluded that the CSR score increased with the male orientation of society. However, on the
sub-scores, if the environmental performance was increasing with masculinity, the opposite
phenomenon was observed in the human capital. The UAE scored 50 in terms of MAS, and
can thus be considered neither masculine nor feminine (Hofstede, 2016). The following
hypotheses were formulated.
o H4: MAS moderates negatively the relationship between CSR and service quality in the
UAE.
2.4.5. Uncertainty Avoidance Index (UAI) and CSR
Uncertainty avoidance index is defined as the level of individuals’ acceptance of uncertainty
and ambiguity within society. Individuals with a high UAI score are uncomfortable with
uncertainty, and seek inflexible codes of conduct, and harsh laws and policies to lessen the
uncertainty (Hofstede, 1980). However, individuals with a low score exhibit riskier behaviors,
which is correlated with unethical practices (Thanetsunthorn, 2014). The UAE scores 80 on
this dimension and, thus, has a high preference for avoiding uncertainty. Therefore, we predict
that firms in the UAE, with high UAI and in which strict rules enacted, place more emphasis
on CSR and, in turn, have a high degree of service quality outcomes (Hofstede, 2016). We
hypothesized that the UAI moderates positively the relationship between CSR dimensions
and service quality. In summary, we formulated the following hypothesis:
o H5: UAI moderates positively the relationship between CSR and service quality in the
UAE.
3. CHAPTER 3: RESEARCH METHODOLOGY
This section illustrates the methodology of the current study and conceptual framework
discussed in the previous chapters.
3.1 Research Objectives
This study sought to investigate the impact of national culture on the relationship between
CSR and service quality in service sectors in the UAE. The objectives were as follows:

ISSN#:
269
• Identify whether CSR influences customer perceptions of service quality in the public
and private service sectors in the UAE.
Examine the moderating role of the national culture on the CSR relationship with service
quality, in public and private service sectors in the UAE.
3.2 Study Setting
The aim of this research was to explore the moderating role of national culture on the
relationship between CSR and service quality in the service sector in the UAE. The service
sector in UAE has been chosen as the setting against which to investigate the study phenomena
as service sector in the UAE encompasses 75% of the country’s GDP.
Further, the UAE is engaged in international and regional projects such as Expo 2020 and Abu
Dhabi’s Surface Transport Master Plan that will lead the growth in services. The UAE Ministry
of the Economy anticipates the growth in tourism and travel service sector will expand 5.4% on
an annual basis over the next decade worth (Dhs 236.8 billion by 2026;
https://gulfnews.com/business/).
Minister of Economy Sultan Bin Saeed Al Mansouri said that “the services sector in the UAE
played an important role in the economic growth of the country through its contribution to
achieving a set of basic requirements for the process of economic development as well as its
share in the formation of the GDP and creation of jobs” (www.uaeinteract.com). The minister
added that “in recent years, this sector achieved an effective contribution to the country's GDP,
and with an annual cumulative total of about 2 percent it also enhanced the position of the UAE
as a link between the world continents” (www.uaeinteract.com). The researcher utilized the
UAE service sector list from 2017, published in the Ministry of Economy official website.
3.3 Time Horizon: Cross-Sectional
The cross-sectional study design is an observational study that help researchers compare
multiple variables at a time. The cross-sectional design takes forms of descriptive or exploratory
information in which it basically indicates a description of behavior or attitudes. Given the
objectives of this research and the accessibility of the data for the current study, a cross-sectional
time horizon was implemented as it made it possible to assemble data on the researched
phenomenon at a single point in time from more than a single source (Neuman, 2011).
3.4 Sampling: Description and Size
In respect to the sample frame, a database from the UAE service sector was used from the Dubai
Government customer profile that included around three million email addresses of the
customers for the government sector (Dubai Executive Council, 2016). For sample size
calculation, Item-Response Theory with the rule of thumb suggested by Foxcroft and Roodt
(2010) was used. Around 810 expected respondents for this research was calculated. Data were
collected during the period 14 December 2017 to 8 July 2018.

ISSN#:
270
3.5 Survey Tool
Following steps were used for questionnaire development:
Review of the literature:
A total of 15 items were recorded for the philanthropic responsibility construct from a minimum
of five sources. A total of 17 items been recorded for the ethical responsibility construct from a
minimum of six sources. A total of 12 items were recorded for the legal responsibility construct
from a minimum of six sources. A total of 14 items were recorded for the economic
responsibility construct from a minimum of five sources. A total of 12 items were recorded for
the environmental responsibility construct from a minimum of six sources.
The current research questionnaire is composed of six sections used to measure the moderating
role of national culture in the relationship between CSR and service quality. The introductory
part of the questionnaire included a question on whether the respondent had ever used any service
(partially or fully) at any service organizations in the UAE. The first section asked about
demographic information. Section two discusses the service profile. Section three asked about
CSR dimensions. Section four asked about service quality dimensions. Section five asks about
national culture dimensions with 16 statements adapted from Hofstede (1991). A five-point
Likert scale (strongly disagree=1, disagree=2, neither agree nor disagree=3, agree=4, strongly
agree=5) was used to answer each statement. This survey was designed to be self-completed by
the respondents through a web-based electronic link sent to the respondents’ emails.
3.5.1. Statistical Analysis
Data was exported from the computer application as a Microsoft Excel 2010© spreadsheet and
analyses were conducted using SPSS version 20. Data were cleaned prior to analysis. Two
researchers helped in the data cleansing process to ensure there was no missing data detected.
Descriptive statistics were used to describe the demographic characteristics of the sample using
frequencies (percentages) or means (standard deviation) as appropriate.
If differences were found between subgroups of the sample (age, gender, educational status,
nationality of the respondents, etc.), these differences were tested for statistical significance
using a chi-square test for categorical variables and ANOVA for continuous variables. The
distribution of the characteristics of the study population for each of the outcome variables was
tabulated. For characteristics that are categorical variables, frequencies and percentages are
shown and for characteristics that are continuous variables, means are shown. A chi- square test
or ANOVA was used as appropriate to test for statistical differences.
4. CHAPTER 4: DATA ANALYSIS AND RESULTS
4.1 Demographic Characteristics of the Study Participants
The demographic characters of the participants are described in table 4.1. It gives an overview
of the participant’s gender, age (in years), nationality of the respondents, work experience,
occupation, education level, and income.

ISSN#:
271
Table 4.1: Frequency table for demographic characteristics Demographic Group Frequency (%)
Gender Male 158 (19.7%)
Female
644 (80.2%)
Age Up to 18 10 (1.2%)
19-25 82 (10.2%)
26-35 388 (48.4%)
36-45 231 (28.8%)
46 or Above
91 (11.3%)
Nationality Emirati 35 (4.36%)
Middle East/North Africa 108 (13.47%)
South Asia 517 (64.46%)
East Asia/Pacific 74 (9.23%)
Central Asia/Europe 32 (3.99%)
Africa 6 (0.75%)
Latin America/Caribbean 20 (2.5%)
Western Europe /North America/
Australia
10 (1.25%)
Work
Experience
No work experience 21 (2.6%)
Up to 1 year 57 (7.1%)
1 - up to 2 years 84 (10.5%)
2 - up to 5 years 128 (16%)
5 - up to 10 years 216 (26.9%)
10 - up to 15 years
15 years and above
147 (18.3%)
149 (18.6%)
Occupation Owner 47 (5.9%)
Private 14 (1.7%)
Employed 712 (88.8%)
Unemployed 4 (0.5)
Student 25 (3.1%)
Current
education
degree
PhD 8 (1%)
Master or equivalent 146 (18.2%)
Bachelor or equivalent 343 (42.8%)
Diploma 7 (0.9%)
High school 298 (37.2%)
Income
(monthly)
Up to 5000 AED 346 (43.1%)
5000 - 10000 AED 230 (28.7%)
10000 - 20000 AED 141 (17.6%)
20000 – up to 30000 AED 31 (3.9%)
30000 – up to 40000 AED 18 (2.2%)
40000 AED and above 36 4.5%)
4.2 Correlation between CSR and Service Quality
Table 4.2 presents the correlation coefficients between CSR and service quality dimensions
along with p-values. These p-values were provided from the results of the Pearson correlation for
testing the assumption that no correlation was present between CSR and service quality

ISSN#:
272
dimensions. The results brief that all CSR dimensions had a significant positive correlation with
all service quality dimensions.
Table 4.2: Correlation between CSR and service quality
CSR
Dimensions
Service Quality Dimensions
RL TG RES ASS EMP Overall
Philanthropic
Responsibility
0.581
***
0.626
***
0.579
***
0.617
***
0.562
***
0.664
*** Ethical
Responsibility
0.638
***
0.634
***
0.586
***
0.635
***
0.602
***
0.695
*** Legal
Responsibility
0.627
***
0.673
***
0.608
***
0.670
***
0.598
**
0.711
*** Economic
Responsibility
0.555
***
0.512
***
0.481
***
0.515
***
0.519
***
0.582
*** Environmental
Responsibility
0.581
***
0.636
***
0.565
***
0.561
***
0.539
***
0.647
***
4.2.1 Correlation of National Culture and Service Quality
The correlation coefficients between national culture and service quality dimensions were
calculated . These p-values were provided from the results of the Pearson correlation for testing
the assumption that no correlation was present between national culture and service quality
dimensions. National culture dimensions (power distance, individualism, masculinity,
uncertainty avoidance) individually and overall showed a significant positive association with
service quality dimensions (reliability, tangibility, responsiveness, assurance, empathy).
National culture dimensions had a significant positive relationship with service quality
dimensions.
4.2.2. Correlation of CSR, Service Quality and National Culture
Five regression models are presented and each model analyzes service quality as a dependent
variable with CSR dimensions (philanthropic responsibility, ethical responsibility, legal
responsibility, economic responsibility, and environmental responsibility) as an independent
variables, in addition to the moderators (power distance, individualism, masculinity, and
uncertainty avoidance) to test effects on service quality. Table 4.3 recaps the results.
Overall 0.700
***
0.728
***
0.666
***
0.708
***
0.663
***
0.777
** ***. Correlation is significant at the 0.001 level (2-tailed).
**. Correlation is significant at the 0.01 level (2-tailed).
*. Correlation is significant at the 0.05 level (2-tailed).
RL= Reliability, TG= Tangibility, RES= Responsiveness, ASS=
Assurance, EMP= Empathy

ISSN#:
273
Table 4.3: Summary of the results of hypotheses tests
Hypothesized relationship Status
H1: CSR →
Service Quality
H1a: Philanthropic CSR → Service Quality Accepted
H1b: Ethical CSR → Service Quality Accepted
H1c: Legal CSR → Service Quality Accepted
H1d: Economic CSR → Service Quality Accepted
H1e: Environmental CSR → Service Quality Accepted
National Culture Dimension as a Moderator: Power Distance
H2: CSR →
Service Quality
H2a: Philanthropic CSR → Service Quality Accepted
H2b: Ethical CSR → Service Quality Accepted
H2c: Legal CSR → Service Quality Accepted
H2d: Economic CSR → Service Quality Rejected
H2e: Environmental CSR → Service Quality Rejected
National Culture Dimension as a Moderator: Individualism
H3: CSR →
Service Quality
H3a: Philanthropic CSR → Service Quality Rejected
H3b: Ethical CSR → Service Quality Accepted
H3c: Legal CSR → Service Quality Accepted
H3d: Economic CSR → Service Quality Rejected
H3e: Environmental CSR → Service Quality
Rejected
National Culture Dimension as a Moderator: Masculinity
H4: CSR →
Service Quality
H4a: Philanthropic CSR → Service Quality Rejected
H4b: Ethical CSR → Service Quality Rejected
H4c: Legal CSR → Service Quality Accepted
H4d: Economic CSR → Service Quality Rejected
H4e: Environmental CSR → Service Quality Rejected
National Culture Dimension as a Moderator: Uncertainty Avoidance
H5: CSR →
Service Quality
H5a: Philanthropic CSR → Service Quality Rejected
H5b: Ethical CSR → Service Quality Rejected
H5c: Legal CSR → Service Quality Partial
accepted
H5d: Economic CSR → Service Quality Rejected
H5e: Environmental CSR → Service Quality Partial
accepted
5. CHAPTER 5: DISCUSSION & CONCLUSION
5.1 Impact of CSR on Service Quality
In this research, the researcher hypothesized that firms’ socially responsible practices had a
direct and positive effect on service quality (measured by means of reliability, responsiveness,
assurance, empathy, and tangibility). Results confirmed that firms’ socially responsible
practices had a direct and positive effect on service quality (measured by means of reliability,
responsiveness, assurance, empathy, and tangibility).

ISSN#:
274
5.2 Impact of National Culture on Service Quality
The findings from the present study indicated that customers or service users more likely to
expect and accept that power within a society that is distributed unequally. Their average power
distance score was 76.5% (95% CI: [75.5– 77.5]). Our findings identified a positive relationship
between power distance and tangibility (r=0.263, p=0.000) and between power distance and
assurance (r=0.321, p=0.000). These results were consistent with the findings of Furrer et al.
(2000). This is because tangibles are similarly essential for powerful and influential customers
as they understand this element as an icon of respect.
5.3 Research Implications
The current research brings about several contributions to knowledge, practiced policy on the
moderating role of Hofstede's cultural values on the impact of CSR dimensions on service quality
in the UAE. The results enhance the emergent knowledge of how different cultural values might
affect the relationships between CSR and service quality. Different studies discussed in the
previous chapters present variation of this relationship, our results are aligned with some
scholars and do not go along with others. Our discussion and comparison between the results of
these studies and our results can be considered as an important contribution to knowledge.
Noticeably, the research outcomes and the above-mentioned managerial implications position
a critical challenge for the policy-makers in the UAE, in that the executive councils of the UAE
government need to work on the linking role among the concerned parties involved in the
service sector.
5.4 Limitations of the Study and Future Research
Research focus: the research data were collected from one country, namely the UAE while for
cross-cultural studies the claimed data collection is from different countries to guarantee the
generalization of the research findings. Given that the data were drawn from the UAE service
sector, it is vital to endorse the findings further by investigating the other sectors too (i.e. the
manufacturing sector). In addition, the current research collected the data from a single
customer from each service organization; further research is essential to collect the data from
different hierarchical levels in the firm (i.e., top-level managers, middle-level managers).
References
Alshaibani, E., and Bakir, A. (2017) A reading in cross-cultural service encounter: Exploring
the relationship between cultural intelligence, employee performance and service quality.
Tourism and Hospitality Journal. 17(3). 249-263.
Boonghee, Y., Donthu, N., and Lenartowicz, T. (2011) Measuring Hofstede's five dimensions
of cultural values at the individual level: development and validation of CVSCALE. Journal
of International Consumer Marketing. 23(3-4). 193-210.
Brown, T., and Dacin, P. (1997) The company and the product: corporate associations and
consumer product responses. Journal of Marketing. 61(1). 68-84.
Capron, M., and Quairel-Lanoizelée, F. (2010) Corporate social responsibility. Les éditions des
Récollets. 2-5.

ISSN#:
275
Carroll, A.B. (1979) A three-dimensional conceptual model of corporate performance.
Academy of Management Review. 4(4). 497–505.
Carroll, A.B. (1991) The pyramid of corporate social responsibility: towards the moral
management of organisational stakeholder. Business Horizons. 34(4). 39-49.
Chih, H.L., Chih, H.H., and Chen, T.Y. (2010) On the determinants of corporate social
responsibility: international evidence on the financial industry. Journal of Business Ethics.
93(1). 115-135.
Diener, E., and Diener, M. (1995) Cross-cultural correlates of life-satisfaction and self-
esteem. Journal of Personality and Social Psychology. 68(4). 653-663.
Eisingerich, A.B., Rubera, G., Seifert, M. and Bhardwaj, G. (2011) Doing good and doing
better despite negative information? the role of corporate social responsibility in consumer
resistance to negative information. Journal of Service Research. 14(1). 60-75.
Elkington, John. (2012) The Zeronauts. London: Routledge.
European Commission. (2002) Communication from the commission concerning corporate
social responsibility: a business contribution to sustainable development. Available from
http://europa.eu.int. [Accessed: 13 Sep 2017].
Friedman, Milton. (1970) The Social responsibility of business is to increase its profits. The
New York Times Magazine. 33(30). 122-125.
Griffin, J.J. (2000) Corporate social performance: research directions for the 21st century.
Business and Society. 39(4). 479.
Guchait, P., Anner, M., and Wu, L. (2011) Customer perceptions of corporate social
responsibility of service firms: impact on customer attitudes and behavioral intentions.
Available from https://pdfs.semanticscholar.org/97b9. [Accessed: 30 April 2016].
Gulyas, A. (2009) Corporate social responsibility in the British media industries preliminary
findings media. Culture and Society. 31(4). 657-668.

ISSN#:
276
He, H., and Li, Y. (2011) CSR and service brand: the mediating effect of brand identification
and moderating effect of service quality. Journal of Business Ethics. 100. 673–688.
Ho, F.N., Wang, H.M.D., and Vitell, S.J. (2012) A global analysis of corporate social
performance: the effects of cultural and geographic environments. Journal of Business
Ethics. 107(4).423-433
Hofstede, G., and Hofstede, G.J. (2005) Cultures and organizations, software of the mind.
Hofstede, Greet. (1980) Culture’s consequences: International differences in work-related
values. Beverly Hills, CA: Sage.
Hopkins, M. (2005) Measurement of corporate social responsibility. International Journal of
Management and Decision Making. 6(3). 213–231.
Huang, C.C., Yen, S.W., Liu, C.Y., and Huang, P.C. (2014) The relationship among corporate
social responsibility, service quality, corporate image and purchase intention. The
International Journal of Organizational Innovation. 6(3). International Standardization
Organization (ISO). (2010) ISO 26000 – Guidance on Social Responsibility. ISO: Geneva.
Kaufmann, D., Kraay, A., and Mastruzzi, M. (2003) Governance Matters III: Governance
indicators for 1996–2002. Washington D.C.: World Bank
Kolodinsky, R.W., Madden, T.M., and Zisk, D.S. (2010) Attitudes about corporate social
responsibility: business student predictors. Journal of Business Ethics. 91(2). 167.
KPMG (2011) KPMG international survey of corporate responsibility reporting. KPMG
Liu, M.T., Wong, I.A., Shi, G., Chu, R., and Brock, J.L. (2014) The impact of corporate social
responsibility (CSR) performance and perceived brand quality on customer-based brand
preference. Journal of Services Marketing. 28(3). 181-194.
Marrewijk, M., and Were, M. (2003) Multiple levels of corporate sustainability. Journal of
Business Ethics. 44(2/3). 107-119.
Mok, C., and Armstrong, R.W. (1998) Expectations of hotel services: do they differ from
culture to culture? Journal of Vacation Marketing. 4(4). 381-391.

ISSN#:
277
Moon, J. (2004) Government as a driver of CSR. Research paper series international center
for corporate social responsibility (ICCSR). Business School Nottingham University.
Available from http://195.130.87.21:8080. [Accessed: 15 November 2017].
Moratis, Lars. (2016) Out of the ordinary? Appraising ISO 26000's CSR definition.
International Journal of Law and Management. 58(1). 26-47.
Nakata, C., and Sivakumar, K. (2001) Instituting the marketing concept in a multinational
setting: the role of national culture. Journal of the Academy of Marketing Science. 29(3). 255-
276.
Neuman, W.L. (2011) Social Research Methods: Qualitative and Quantitative Approaches.
7th edition. Boston: Pearson Education, Inc.
Noeiaghaei, Nazanin. (2009) Corporate social responsibility in UAE: a case study of
Jumeirah group’s CSR practices. PhD dissertation. British University in Dubai.
O'Regan, K., and Alturkman, W.S. (2010) A review of the 8th international conference of the
academy of HRD (Asia chapter) & 1st international conference of the academy of HRD
(MENA chapter) held in Bahrain in December 2009: A cultural dimensions perspective.
Human Resource Development International. 13(2). 237-243.
Parasuraman, A., Berry, L., and Zeithaml, V.A. (1991) Refinement and reassessment of the
SERVQUAL scale. Journal of Retailing. 67(4). 420–450.
Parasuraman, A., Berry, L.L., and Zeithaml, V.A. (1985) A conceptual model of service
quality and its implications for future research. Journal of Marketing. 49(4). 41-50.
Parasuraman, A., Zeithaml, V.A., and Berry, L. (1988) SERVQUAL: a multiple-item scale for
measuring consumer perceptions of service quality. Journal of Retailing. 64(1). 12– 40.
Peng, Y.S., Dashdeleg, A.U., and Chih, H.L. (2012) Does national culture influence firm’s
CSR engagement: a cross country study. International Proceedings of Economics
Development and Research. 58(9). 40-44.

ISSN#:
278
Rettab, B., and Morada, M., Wong, W.K., and Ali, S.A. (2014) Gaining grounds: corporate
social responsibility in Dubai. Dubai Chamber Center for Responsible Business. Dubai: UAE.
Rettab, B., Brik, A.B., and Mellahi, K. (2009) A study of management perceptions of the
impact of corporate social responsibility on organisational performance in emerging
economies: the case of Dubai. Journal of Business Ethics. 89. 37.1
Ringov, D., and Zollo, M. (2007) Corporate responsibility from a socio-institutional
perspective: the impact of national culture on corporate social performance. Corporate
Governance. Emerald Group Publishing Limited. 7(4). 476 – 481.
SajadiFar, Vajiheh. (2013) Corporate social responsibility (CSR) in the United Arab
Emirates. Master thesis. The British University in Dubai, UAE.
Sen, S., and Bhattacharya, C.B. (2001) Does doing good always lead to doing better? consumer
reactions to corporate social responsibility. Journal of Marketing Research. 38(2). 225–243.
Silberhorn, D., and Warren, R.C. (2007) Defining corporate social responsibility: a view from
big companies in Germany and the UK. European Business Review. 19(5). 352- 372.
Thanetsunthorn, Namporn. (2014) Ethical organization: the effects of national culture on CSR.
Organization Development Journal. 32(3). 89.
Tingchi Liu, M., Anthony Wong, I., Shi, G., Chu, R., and L. Brock, J. (2014) The impact of
corporate social responsibility (CSR) performance and perceived brand quality on
customer-based brand preference. Journal of Services Marketing. 28(3). 181-194.
Visser, W., Matten, D., Pohl, M., and Tolhurst, N. (2010) The A to Z of corporate social
responsibility. Chichester: John Wiley and Sons.
Vlachos, P.A., Tsamakos, A., Vrechopoulos, A.P., and Avramidis, P.K. (2009) Corporate
social responsibility: attributions, loyalty, and the mediating role of trust. Journal of the
Academy of Marketing Science. 37(2). 170-180.

ISSN#:
279
Weber, M. (2008) The business case for corporate social responsibility: a company- level
measurement approach for CSR. European Management Journal. 26. 247-261.
Wiengarten, F., Fynes, B., Pagell, M., and de Búrca, S. (2011) Exploring the impact of
national culture on investments in manufacturing practices and performance: an empirical
multi-country study. International Journal of Operations and Production Management.
31(5). 554-578.

ISSN#:
280
Business Innovation Strategies – Thinkinova
Mohammad Musleh, Founder Thinkinova FZ-LLC
Introduction
New technology and digital transformation will bring in a new era of innovation; where many
corporations and startups will create new innovative ideas to penetrate the market and deliver
new value to their customer. However, the real innovation disruption and value-creation are not
any more dependent on High-Tech innovation since the new strategies in “business innovation”
are highly-effective in creating a competitive edge in the market.
Recent practices and studies have proven that new strategies in business innovation are helping
to add values to corporations and startups, which will allow them to serve their customers better
and deliver the desired values. Creating new business models to manage value-creation and
value-delivering is considered as a new disruptive revolution, alongside developing co-creation
and empathy with customers to understand the real needs to create new solutions for them is
the new approach for business innovation.
Nevertheless, rethinking the way we innovate is the new approach of the business innovation
revolution. Applying new methodologies and approaches in business is crucial for innovation.
▪ Design Thinking for Innovation (apply in Business and Product) – A solution-based
method following a systematic approach to solve problems in a creative and customer-
oriented way, which will be desirable for the market, feasible for the company capability
and viable for the profitability of the business
▪ Business Model Innovation (deliver new value to the market) – Approach to organize
the business based on business patterns and concepts, including the basic building
blocks and transformation of your business framework. The model is all about creating
and working on conditions that allow ideas and different business model approaches to
flourish and surface, in order to optimize and re-engineer the business models to ensure
true growth and add values in your business.
▪ Open Innovation – Approach to allow companies to inflows and outflows of
knowledge to accelerate internal innovation, and expands the market for external use of
innovation (Henry Chesbrough 2003).
▪ Agile Development – To give your business an entrepreneurial outlook, apply lean
startup methodologies with the aim to re-engineer your product development and
business growth techniques. Employing the lean startup approach, will enable your
businesses to steer the business development with optimal acceleration.

ISSN#:
281
Effects of Digital Screens Exposure on Children: Research
Proposal Maryam AlMajidi,
HBMSU Learner: 200111917
Abstract
The number of children, aged 0-5 years, exposed to digital screens over the past decade have increased
exponentially. Unfortunately, little information is available regarding the positive and negative effects of digital
screens on children’s cognition, social behavior, and physical well-being. The reviewed literature reveals varied
opinions from experts and caregivers that digital screens may or may not be healthy for children in terms of
cognitive development, including those who are under the age of 2 years. However, most literature agree that the
type of media viewed define the social habits and responsiveness in children. Further agreement across the
literature was found regarding the negative effect of digital screens exposure on the sleeping habits and diet of
children in addition to introducing other issues such as cardiovascular risks. With this being said, the objective of
this research proposal is to investigate the effect of digital screens exposure on children’s cognitive development,
social behavior, and physical and psychological well-being. Another objective is to establish a set of guidelines
for parents and caregivers that will ensure healthy digital screens exposure for their children. These objectives
may be achieved through conducting a quantitative survey research method with Quota sampling of 50 boys and
girls from three nurseries following different curriculum located in the same area. The time scale proposed is
longitudinal, where monthly data will be collected from samples 4-5 times, based on the requirement. The research
hypotheses suggest that digital screens exposure has a positive correlation with cognitive development, and a
negative correlation with social behavior, physical and psychological well-being.
Introduction
The past 10-15 years have had a great impact in changing the core methods on how to get things
done. Traditionally, play would mean to go outside in the garden, shopping would mean to go
to the shopping mall, studying would mean to read books, family time would usually include
board games. However, nowadays, all these definitions have changed. To play, socialize, shop,
learn, etc. all would require an individual to use digital screens regardless of the physical model,
may it be a smart phone, TV, tablet, notepad or a computer. Studies have shown that most 4-
year old children own personal mobile phones mainly used for internet surfing and gaming and
are usually used on an average of more than 3 hours on a daily basis (Kabali et al., 2015).
Furthermore, Kebali et al. (2015) also state that many parents are relying on these devices to
keep their children, aged 6 to 18-months old, quiet while completing their house chores.
However, the effects of such exposure are yet to be known.
As concerned parents, it is vital to aim at investigating the effects of digital screens on children’s
cognitive development, social behavior, and physical and psychological well-being. In addition,
to establish a set of guidelines that would assist in maintaining healthy exposure of children to
digital screens. In this regard, this research proposal first introduces a literature review on the
topic from the view-point of field experts and caregivers who are witnessing first-hand the
impact of digital screens on their children. Next, it suggests a research methodology to gather
the necessary data to address the mentioned concerns, followed by the expected findings and
hypotheses of the research.
ISSN#:
282
Literature review
The recent emergence of the touchscreen devices, in 2010, and the fact that the topic in question
mainly focuses on very young children in particular areas, conclusive studies are yet to be
published on the level of impact of digital screens on children. Therefore, most of the literature
reviewed is merely based on expert opinion and researcher’s diligence, not on concrete evidence
that are impossible to be proven wrong. The reason being that most of the literature reviewed
are responses to parents, teachers and caregivers concerns on whether or not it is healthy for
their children to be exposed to digital screens. Nevertheless, based on the data collected, this
section will discuss the benefits and risks according to the literature reviewed about the impact
of digital screens on young children, aged 0-5 years, in terms of cognitive development, social
behavior, physical and psychological well-being, as well as the recommendations on parental
guidelines for healthy screen-time. Cognitive Development and Learning
An important fact about digital screens, specifically in touch screen devices, is that they can
react to what a child does, allow joint play between adults and children and can be used
anywhere at any time, which is similar to traditional toys (Christakis, 2014). Christakis (2014)
adds that touchscreen devices differ from traditional toys in which they can stimulate certain
reactions from a child based on actions taken, can be tailored as per the child’s preferences, may
be continued later and enable a child to build on his/her understanding according to the available
stages. However, other digital screens, such as television, do not offer any of the above-
mentioned features (Christakis, 2014). With this being said, viewing educational media using
touchscreen devices may be considered healthy for children above 2 years old as it may improve
their literacy (Chassiakos, Radesky, Christakis, Moreno, & Cross, 2016; Sharkins, Newton,
Albaiz, & Ernest, 2015; Canadian Pediatric Society [CPS], 2017), cognition and learning
(Chassiakos et al., 2016; Przybylski & Weinstein, 2019; Sharkins et al., 2015; CPS, 2017) with
moderate use only, around 1-2 hours/day (Kardefelt-Winther, 2017). Nevertheless, according
to CPS (2017) and Chassiakos et al. (2016), parental and caregivers’ interaction is still favored
above all due to the difficulty that infants and toddlers go through when transferring 2-
dimensional learning to the 3-dimensional reality.
Furthermore, Christakis (2014) expresses his opinion that children aged less than 2 years should
also be exposed to these educational programs for the same reasons. However, the researcher
disagrees with Christakis (2014) on that notion and side with CPS (2017), Anderson &
Subrahmanyam (2017) and Chassiakos et al. (2016) because most educational programs target
children above 2 years old, and having infants who are younger than that age be exposed to
such programming would only distort their cognition and would actually cause more harm than
good.
Social Interaction and Behavior
Another dimension that is expected to be affected by the exposure to digital screens is children’s
social interaction and behavior. Based on the literature reviewed, it is a unanimous agreement
that the content of the media being viewed is what affects the social behavior of children, where
being exposed to media that draws empathy and tackles racial equality causes children to be
more empathetic and caring towards others (CPS, 2017). However, violent media results in
aggressive behavior of children and makes them less empathetic towards injustice and brutality
(Sharkins et al., 2015; Chassiakos et al., 2016; CPS, 2017). Furthermore, in case of prolonged
exposure to digital screens, children may go through tantrums if they were suddenly

ISSN#:
283
disconnected from the media source (Chassiakos et al., 2016). Studies discussed by Christakis,
Zimmerman, DiGiuseppe, & McCarty (as cited in Christakis, 2014) and Neumann (2015) have
shown that high exposure to digital screens may even cause attention span disorders in children.
Moreover, Dunckley (2015) takes a stronger stand in which she claims that the exposure of
children to digital screens is the reason behind their poor focus, rages, aggressive and vindictive
behavior, agreed by CPS (2017) and Neumann (2015), and is usually misdiagnosed as bipolar
disorder instead of Disruptive Mood Dysregulation Disorder (DMDD). In my view, Dunckley
(2015) seems to have an extreme point-of-view resulting from children that may have been left
in front of the digital screens without adult supervision or interaction for several hours, and this
scenario may not be applicable to many children. However, the researcher stands firmly with
the earlier statement that the content being viewed on the media is what shapes the children’s
behavior both interactive and social.
Physical and Psychological Well-being
The third aspect under investigation is the physical health and psychological well-being of
children exposed to digital screens. For the physical health, the literature reviewed appears to
agree that there is a positive correlation between time spent on digital screens and childhood
obesity (Neumann, 2015; CPS, 2017; Sharkins et al., 2015; Przybylski & Weinstein, 2019;
Kardefelt-Winther, 2017; Chassiakos et al., 2016) as well as increased cardiovascular risk
throughout the child’s life (Chassiakos et al., 2016).
The reason being, as Kardefelt-Winther (2017) explains, is that as the time spent on digital
screens replaces the time that may be allocated for physical activities, hence, leading to a slight
increase in both the BMI ratio and risk of having adopting an unhealthy diet. In addition,
Rosenfield (2011) discusses the computer vision syndrome (CVS) and the impacts that follow,
such as headaches, visual discomfort, eyestrain, and blurred vision when looking at a distance
after gazing at a digital screen for too long. Rosenfield (2011) explains that the reason behind
the mentioned symptoms is the decrease in blink rate and increase in corneal exposure after
spending hours focusing on a digital screen.
Similarly, for the psychological well-being, a positive correlation is argued between the time
spent on digital screens and depression as well as sleep deprivation (Sharkins et al., 2015,
Przybylski & Weinstein, 2019; Chassiakos et al., 2016). In fact, CPS (2017) suggests that the
presence of any electronic device in the bedroom would cause fewer minutes of sleep, partly
due to the suppression of Melatonin – a natural sleep hormone released by the body in a dark
environment.
Another study by LeBourgeois et al. (2017) suggests that the light emitted from digital screens
may have adverse effects on the circadian rhythm, sleep physiology, and alertness. The
researcher strongly agrees with the literature regarding the physical and psychological well-
being of children as obesity has been witnessed in children who spend a lot of time on digital
screens as well as sleep deprivation when the digital devices are being utilized in a dimmed
environment.
Parental Guidelines Recommendations
As mentioned earlier, most of the literature reviewed aims to answer questions from parents
and caregivers on their concerns on whether or not it is safe for their children to use digital
devices at an age as young as 2 years. It is recommended that children experience educational

ISSN#:
284
programs or applications that would have a positive influence on their learning and interaction
with the device (Sharkins et al., 2015), that is under the supervision of a parent or caregiver
(Chassiakos et al., 2016; CPS, 2017; Kardefelt-Winther, 2017).
In addition, children should be encouraged to ask questions while viewing any program in order
to increase their learning through thorough comprehension of the media being viewed based on
the answers received, where in that case, the digital screen will have a less negative effect
because most of the child’s attention will be focused on the responder rather than the digital
screen (CPS, 2017; Sharkins et al., 2015). In other words, the presence of the caregiver around
the child during their exposure to digital screens is highly recommended.
Further recommendations include the viewing time to be limited to 1-2 hours (Przybylski &
Weinstein, 2019; Kardefelt-Winther, 2017) in order to save time for physical activities for at
least 3 hours per day (Neumann, 2015), however, programs that provoke group physical
movement (Chassiakos et al., 2016), e.g. Wii or dance programs, may suffice (Neumann, 2015).
Other literature suggests that the digital screen last viewing time be at least one hour apart from
bedtime (CPS, 2017).
Nevertheless, researchers encourage parents and caregivers to ask “what would my child be
doing if digital screens did not exist?” and act upon the answer to that question. The most
favored answer, however, is “reading a book” alongside with a parent or caregiver (Chassiakos
et al., 2016). Furthermore, Chassiakos et al. (2016) and Lauricella, Wartella and Rideout (2015)
studies provide evidence that the time spent by parents on digital screens influences the time
spent by children on digital screens. With this being said, parents must first control their own
screen time in order to act as role-models for their children.
Methodology
The study proposed is an exploratory study to understand and explore the effects of digital
screens exposure on children’s cognitive development, social behavior, and physical and
psychological well-being through Quantitative Survey Research method. In order to determine
the effect of the digital screen exposure duration, the independent variable, on the children’s
cognition, social behavior, and physical and psychological well-being – the dependent
variables, the researcher must have minimal interference with the subject and allow them to be
in a non-contrived setting.
As for the time-scale, a longitudinal study is proposed in order to collect data from the parent
or caregiver without any exposure of the children to digital screens for at least one month,
collect data again after one month of exposure for 1 hour daily. The data collection process will
be repeated monthly with 1 hour increment every month until the exposure duration reaches 4
hours daily. The correlation between the dependent and independent variables are expected to
be revealed after the third or fourth time the data has been collected.
The sampling process for the research will be as follows: the population for the sample is
defined as Bur Dubai area, divided into clusters of nurseries based on the curriculum followed
– American, British, and IB. The sample would be selected from the nursery clusters based on
Quota sampling strategy where 10 subjects will be selected from each age (1-5 years), and
equally divided between boys and girls. Nurseries are proposed to be selected as clusters, rather
than households because it will be easier to obtain information related to a child’s cognition and
social interaction with other children as well as their physical and psychological well-being

ISSN#:
285
because, in that setting, the child is expected to have a certain level of knowledge, and it is
detectable whether or not the child possesses additional or less knowledge and skills.
However, limitations in this sampling method will include the absence of varied financial status
and ethnic background, hence, the data collected may not be generalized on a larger population.
Another methodology limitation is identified where it is expected to be difficult to obtain
parents’ approval to expose their children to digital screens for up to 3 or 4 hours daily for the
sake of conducting research.
The survey will show the relationship between digital screens exposure and the three
dimensions under evaluation after the completion of the research duration. However, on a
monthly basis, the same questions must be answered regarding screen-time observation,
cognitive development assessment, social behavior observation, physical and psychological
assessment, as well as general information about the sample for categorizing purposes. The
sections related to observation will be answered using ordinal scales because they are merely
based on opinion, however, for the assessment sections, they may be answered using ratio scale
because the answers will be based on actual quantifiable data such as the number of hours of
sleep or BMI ratio. Finally, the data for all samples may be combined for each month separately
in order to reveal the overall relation.
Expected Findings
Based on the literature review and the researcher’s personal experience, it is predicted that the
exposure of digital screens on children has positive and negative effects on different aspects.
Firstly, regarding the effect of digital screens on children’s cognitive development and learning,
a positive relation is expected to be revealed from the research where continuous repetition of
certain information daily would most likely be remembered or learned than if it was informed
only once a day.
Secondly, a negative correlation is predicted between time spent on digital screens and
children’s social interaction and behavior due to the fact that when a child is exposed to digital
screens for longer periods of time, without disturbance, they would cause them to be detached
from their surroundings. This would usually result in lack of verbal communication and dealing
with others people personally, hence, the child would not be able to respond properly or feel
comfortable around others, resulting an increase in the child’s rage and annoyance levels.
The third aspect pertaining to the child’s physical and psychological well-being, it is most likely
to observe a negative relation in that aspect as well where increase in digital screens exposure
would make the child lose track of time and probably skip meals or pass the specified bedtime,
especially if the caregiver was not paying close attention. With this being said, the parents’ or
caregivers’ role is vital for a healthy exposure to digital screens. Parental guidelines would
include the continuous involvement of the parent or caregiver in the type of media being viewed,
as well as when and for how long. Specific timings must be set in order to ensure that the child
will have enough time to spend on social interaction in the real world with other children, or
people for that matter, as well as meals, physical exercises and required sleeping hours
recommended based on the child’s age.
This research proposal is expected to help raise future generations that combine knowledge,
interpersonal skills, and good health; a generation that will be powerful enough to control
themselves against the temptations of the digital world. The available literature is merely based
on expert opinion and caregiver observation through cross-sectional studies. However, in order

ISSN#:
286
to ensure that the observed behavior or sleep pattern is not being affected by other variables, a
longitudinal study would serve the purpose to collect the data multiple times with slight
manipulation of the independent variable, which is the exposure duration to digital screens.
Through that study, it may be possible to answer the major questions: What is the effect of
digital screens exposure on children’s cognition, behavior, and physical and psychological well-
being? And what should the parents do from their end to optimize the benefits and minimize
the risks of digital screens exposure on their children?
References
Anderson, D. R., & Subrahmanyam, K. (2017). Digital Screen Media and Cognitive Development.
Pediatrics, 140(s2), S57-S61.
Chassiakos, Y. R., Radesky, J., Christakis, D., Moreno, M. A., & Cross, C. (2016). Children and
Adolescents and Digital Media. Pediatrics, 138(5), e1-e18.
Christakis, D. A. (2014). Interactive Media Use at Younger Than the Age of 2 Years: Time to Rethink
the American Academy of Pediatrics Guideline? JAMA Pediatrics, 168(5), 399-400.
Dunckley, V. L. (2015). Introduction: Something Wicked This Way Comes. In V. L. Dunckley, Reset
Your Child's Brain: A four-week plan to end meltdowns, raise grades and boost social skills by
reversing the effects of electronic screen-time. California: New World Library.
Kabali, H. K., Irigoyen, M. M., Nunez-Davis, R., Budacki, J. G., Mohanty, S. H., Leister, K. P., &
Bonner, R. L. (2015). Exposure and Use of Mobile Media Devices by Young Children. Pediatrics,
136(6), 1045-1050.
Kardefelt-Winther, D. (2017). How does the time children spend using digital technology impact their
mental well-being, social relationships and physical activity? An evidence-focused literature
review. Florence: UNICEF Office of Research - Innocenti.
Lauricella, A. R., Wartella, E., & Rideout, V. J. (2015). Young Children's screen time: The complex
role of parent and child factors. Journal of Applied Developmental Psychology, 36, 11-17.
LeBourgeois, M. K., Hale, L., Chang, A.-M., Akacem, L. D., Montgomery-Downs, H. E., & Buzton,
O. M. (2017). Digital Media and Sleep in Childhood and Adolescence. Pediatrics, 140(s2), S92-
S96.
Neumann, M. M. (2015). Young children and screen time: Creating a mindful approach to digital
technology. Australian Education Computing, 30(2).
Przybylski, A. K., & Weinstein, N. (2019, February). Digital Screen Time Limits and Young
Children's Psychological Well-Being: Evidence From a Population-Based Study. Child
Development, 90(1), e56-e65.
Rosenfield, M. (2011). Computer vision syndrome: a review of ocular causes and potential treatments.
Ophthalmic & Physiological Optics, 31, 502-515.
Sharkins, K. A., Newton, A. B., Albaiz, N. E., & Ernest, J. M. (2015). Preschool Children's Exposure
to Media, Technology, and Screen Time: Perspectives of Caregivers from Three Early Childcare
Settings. Early Childhood Education, 44, 437-444.

ISSN#:
287
Internal vs. External Auditing; A Comparison between the
Rules and Regulations in the UAE. Hind Al-Ali, Fatima Al Saidi, Farida Khorrami, Mohamed El Baradie
Hamdan Bin Mohammed Smart University Introduction
In today’s dynamic business world where risks arise, new opportunities are emerging when it
comes to auditing. Auditing had become a very important aspect to provide assurance to the
different stakeholders and to the management. Auditing can be defined as the process of
examining financial statements and records by an independent party where audit standards are
followed. Auditing can be divided into two main functions which are an internal and external
audit. The aim of this study is to analyze the differences between the rules, regulations,
procedures, planning, and reporting of internal and external auditing. Furthermore, to present a
real-life example of entities and how they implement the audit.
Methodology
A research methodology presents the procedure of conducting the research. This current study
is a qualitative one. Data were collected from both primary and secondary sources to ensure the
accuracy of data. The primary sources are the interviews that were conducted to collect the
needed data as per the appendix. The interviewees were an audit professional and a financial
manager from two different organizations. Open-ended questions were asked in the interviews
and the responses were recorded in a written form to generate findings accordingly.
Furthermore, the secondary sources depended on reviewing literature which are the previously
published reports and articles that are useful for the purpose of this study. The study will start
by presenting the differences between the internal and external auditing in many aspects. Then,
it will provide an example of the audit procedures in a private and a public entity.
Literature Review
Internal auditing is a “structured, controlled approach and objective appraisal by internal
auditors of various functions within the organization to assess and enhance the risk
management, internal control and corporate governance” (Sawyer, 2003). External auditing is
to report the condition of the organization’s financial position and verify the reasonableness of
the financial reports to protect the shareholders’ interests (Ferreira, 2018).
As stated by Hay & Cordery (2018), audit in accounting of a public sector entity is not generally
intended to provide top management with information; nevertheless, audit provides them with
the assurance about what is going on within remote corners of entity. Financial audit in public
sector is intended for verifying the financial declarations, balances and accounts. The main aim
of performing audit is to ensure financial statements published by the organizations are free
from errors and mistakes.

ISSN#:
288
As per the opinion of Madawaki, Ahmi & Ahmad (2017), in the private sector, members of
audit committee are involved in appointment, evaluation as well as dismissal of head of internal
audit function. Private company can be subject to GAAP for satisfying the lenders and insurance
companies. Most of the private companies do not publish audited financial reports as their main
concern is decreasing taxes.
The Overall Audit Process
To start with, there are many key characteristics that both internal and external audit
professionals must have. First, Competence, which indicates that auditors must meet their
expert duties with competence, unprejudiced and in conformance with the assigned
international standards for this profession and implement the obtained skills. Second,
Independence, where the auditor should be independent from other parties that may have a
financial appeal in the business being audited. Thirds, Due professional care, to sustain
competent knowledge throughout the auditing activity. Fourth, Objective, which is revealed by
auditors in constructing reports and drawing opinions and conclusions derived from the
acquired documents and examined in conformance with the standards of auditing.
Internal Audit
The internal auditing activity requires an evaluation of three primary aspects. Firstly,
Corporate governance, where the internal audit activity should evaluate and proved relevant
suggestions to enhance the processes of corporate governance. Secondly, Risk management,
where the internal audit activity must present developments of the process of risk management
and should assess the effectiveness. Thirdly, Internal control, where the undertaking of the
internal audit should assess the vulnerability of risk concerned with the corporate’s information
systems and governance.
Internal audit planning:
The internal audit planning is essential to make sure that all the procedures are following the
rules and regulations, and to eliminate the risks. The annual internal auditing plan is based on
the following steps:
1. Preparing the audit universe – auditable units such as a department,
section, project, process, function or committee.
2. Risk assessment for each auditable unit.
Rate the risk - by giving a score of risk or ranking by identifying the highest to the lowest risk
based on the available resources.
The steps of internal audit:
The first step of the internal auditing is planning, where the chief audit executive initiates a plan
of risk assessment to prioritize the activity of the internal audit, which is constant with the
organization’s objectives. Then the plan of engagement is reviewed and adjusted by the chief
audit executive. The next step that should be done by the chief audit executive is to manage the
activity of internal auditing to assure that it adds value to the institution.
The third step by the chief audit executive is to execute the plan, the requirements of resources,
and the effect of the limitations of the resources of the internal audit activity to the board of

ISSN#:
289
directors and the senior management. After that, comes the reporting of the internal audit
activity, where the chief audit executive should report regularly to the board of directors and
the senior management on the purpose and responsibility of the internal audit respective to the
plan and the compliance of the IIE’s standards.
The report includes recommendations that must be executed and implemented within the time
frame provided. Then, a follow up with the concerned department should be done to ensure the
execution of the recommendations. In case of a lack of execution, this should be reported to the
board of directors. The audit report has an executive summary that includes specific issues and
related recommendation or action plans and appendix information such as detailed graphs and
charts or process information.
The steps of internal auditing can be summarized as the following:
1. Setting and identifying the objectives.
2. Assessing the internal control system over departments.
3. Preparing an internal audit plan.
4. Preparing an audit program.
5. Preparing the audit reports after testing the weaknesses and deficiencies in three
elements of internal control which are corporate governance, risk assessment, and
internal control.
6. Sets recommendations and observations in the report.
7. Submit the report to the board of directors.
8. If the concerned department disagreed with the report, then the department should prove
that the evidence is not sufficient.
External Auditing
When it comes to the external auditing, an examination of the accounting records and financial
statements take place. The external audit is commonly conducted once a year to provide
assurance for investors, third parties, and different stakeholders. External auditors must not be
affiliated with the audited company to ensure accurate and unbiased audit report and opinion.
Finally, the cost of an external audit for a company with a high internal control tends to be lower
than the cost of auditing a company with a weak internal control.
External audit planning:
Before performing an external audit, the auditor must conduct a meeting with the audited
company’s management and do the following:
1. Asses the internal control of the company that is being audited.
2. Assess the risk. 3. Design the audit procedure.
The steps of external audit:
The overall steps of preparing the external audit can be summarized as the following:
1. To have a business understanding about the firm that will be audited, since having a
general understanding can help the auditing process to be more efficient.
2. Risk assessment which means to evaluate and identify the potential risks of audit where
it helps to assess the control risk and make it lower by high tests of control.
3. Based on the previous step, the detection risk is determined.
4. Planning and distribution of the assignment (allocation of tasks).

ISSN#:
290
5. Prepare the audit program (do what and when).
6. Execution of the audit program with assurance (fieldwork).
7. Prepare the audit report, which can come in four types: Unqualified opinion, Qualified
opinion, Disclaimer of opinion and Adverse opinion.
8. Submit the report to the shareholders.
After completing the audit fieldwork, a management letter which includes notes and
recommendations should be written by the external auditor. The management letter can include
and states immaterial errors and mistakes. External auditors perform an audit in accordance
with specific laws and rules of the financial statement of the company and it is independent of
the entity that is being audited.
The Sources of Rules and Regulations Used During the Audit Process
Internal Auditing
Internal auditing is performed in various legal environments for organizations ranging in
structure and size, and by individuals within an organization or outside an organization. It is
necessary to comply with the “Institute of Internal Auditors (IIE)” standards for the competent
practice of the internal audit process and fulfilling the internal auditors’ responsibilities (IIE,
2016). The IIE standards are used for both sectors: private and public.
The IIE standards consist of two primary classifications: Attribute standards and performance
standards. The attribute standards embark on the organizations characteristics and individuals
executing the internal auditing. Whereas, the performance standards present quality basis contra
to the measurement of these services’ performance and outlines the internal auditing’s nature.
Both classifications apply to the process of internal auditing.
External Auditing
When it comes to external auditing, it is conducted based on the international rules and
regulations of the concerned country. In the UAE, the external audit requires to be performed
by the “Financial Audit Authority” (FAA) as per Law No. 4 of 2018. The external auditor
reviews the accounts of the organization and prepares the audit report by forming an audit
opinion. The role of the external auditor is to assure that the organization’s financial reports are
error-free and accurate. They also assure that the accounts were developed in conformance with
IFRS.
Auditing in the Private Sector
Al Arif Contracting Co LLC
The auditor will follow the International Standards Auditing (ISA) in order to assure
compliance with the International Financial Reporting Standards (IFRS) and International
Accounting Standards (IAS) which are issued by the International Accounting Standards Board
(IASB).
The auditing process will be planned through the following steps:
1. Engagement of the audit
2. Plan for the audit
3. Provide trial balance and the sub-ledger reports
4. Start the fieldwork, confirmation of final financial statements’ reports and closing
entries

ISSN#:
291
Before performing the audit process, the following steps are usually undertaken:
1. The first step is to ensure all accounting entries have been passed during the year such as
expenses and revenues. 2. Trial balance closing must match with the sub-ledger reports.
Performing the internal audit:
Firstly, is to identify the area which requires the internal audit within the organization.
Secondly, to prepare the audit schedule and notify the concerned department about the internal
audit. Finally, to start the audit process by providing reports and supporting documents as an
evidence in order to finalize the final audit report.
After the auditing takes place, we must verify the audit report to ensure the final audit draft
matches the provided data and the final trial balance. Once the verification is over, the final
consolidated financial report will be signed by the chairman of the board member as a final step.
Finally, the audit reports are being prepared as the following:
1. Prepare the general ledger and the trial balance.
2. Reconcile all the accounts specially the vendor accounts, the banks yearend balance
confirmation, and all the loans and bank overdrafts.
3. Pass all the provisions entries such as provision for leave salary, air tickets, and gratuity
and payroll reports.
4. Fix assets schedule showing the assets purchased and sold during the year.
5. Provide the general ledger dump.
6. Stocks and inventories report and stock taking at the year-end.
7. All accruals and prepaid expenses preparation.
Auditing in the Public Sector
The Financial Audit Authority
Internal audit in Dubai government entities is required by law issued by H.H Sheikh
Mohammed bin Rashid that encourages the principles of integrity and transparency. The
internal auditing implemented in government entities of Dubai is used to audit transactions and
financial statements, as well as, for annual budget assurance. All departments in government of
Dubai are required to use smart accounting and financial systems. The auditor in the public
sector in the UAE is required to comply with IFRS standards if the public company was listed
on Dubai Financial Service Authority (DFSA), NASDAQ Dubai, and Abu Dhabi Securities
Exchange.
When it comes to external auditing, the Financial Audit Authority (FAA) is the public authority
that is responsible for auditing all government entities in Dubai, ensure their compliance with
the policies and regulations, provide expert auditors, verify the accuracy of data, provide
recommendations and advice, follow up and review, etc.
The responsibilities of the Financial Audit Authority (FAA) are the following:
1. Financial and compliance audit
2. Performance audit
3. Audit the audit systems
4. Audit the effectiveness and efficiency of the audit Systems

ISSN#:
292
Auditing procedures of the Financial Audit Authority:
The authority can audit records, documents, accounts, etc. that is important to complete the
audit successfully. The audit process can be conducted either at the authority’s headquarter, the
auditees’ headquarter, or at the entity where the required documents are kept. Furthermore, it
can be required from the auditee to link the authority’s system with their audit systems to ease
the process of audit. All audit data and information are kept confidential.
Audit of records and documents:
The employees assigned to perform the audit can have access to the documents and records
needed to conduct the audit. They can also have direct contact with the employees of the audited
entity to inquire and investigate. Where they can also interview the employees who are involved
in violations in the audited entity. The auditee is required to help and collaborate with the
Authority’s employees ‘the auditors’ by offering them the necessary records and documents
that will help them perform the audit. As well as, to offer them a proper place to work in.
Internal audit units:
The authority has the power to check and assess the work and the plans of the internal auditors
as well as the external auditors of the audited entity, to confirm that they have implemented the
recommendations stated in the reports, and to state an opinion about these reports.
Audit reports and findings:
After performing the audit, the authority will collect the findings and prepare the reports which
contain recommendations and observations. The audited entity is required to implement these
recommendations and to submit a response or feedback in 30 days after notifying. The deadline
can be extended in some cases. If no response was made by the audited company during the
specified period, then the audit report prepared by the authority is considered final and correct.
Findings
Both the private and the public sectors have internal and external auditing to assure the
fulfilment of standards compliance. The process of auditing is somehow similar in both sectors.
However, when it comes to internal and external audit, the difference is that the internal auditing
is concerned with the organization’s corporate governance, risk management, and internal
control and usually reports to the board of directors and the management. Whereas, the external
auditor is concerned with expressing an opinion on the fairness of the financial statements and
only reports to the shareholders.
Conclusion
To conclude, auditing is a very crucial process in today’s world since it provides assessment
and assurance related to financial, operational, as well as strategic goals and procedures in a
business. Both internal and external audit are essential to be implemented in almost every
organization. As per this study, it was found that the audit procedures are somehow similar in
both the private and the public sector. This was determined through the analysis and comparison
of the auditing processes and practices in both sectors. Finally, when it comes to internal and
external audit, the two types do differ as presented previously.

ISSN#:
293
References Anon., 2018. Law No. (4) of 2018 Establishing the Financial Audit Authority, s.l.: The
Supreme Legislation Committee in the Emirate of Dubai.
Ferreira, J. M. B. V., 2018. The role of the external auditor in corporate governance: The case
of companies listed in the NYSE Euronext Lisbon. University of Coimbra, pp. 38-51.
IIE, 2016. INTERNATIONAL STANDARDS FOR THE PROFESSIONAL PRACTICE OF
INTERNAL AUDITING (STANDARDS). Institute of Internal Auditors, pp. 1-25.
Sawyer, L., 2003. Sawyer's Internal Auditing, The practice of Modern Internal Auditing.. The
Institute of Internal Auditors, Volume 5, pp. 120-121.
Hay, D., & Cordery, C. (2018). The value of public sector audit: Literature and
history. Journal of Accounting Literature, 40, 1-15. Retrieved from
https://publications.aston.ac.uk/id/eprint/31742/1/The_Value_of_Public_Sector_Audit_Literat
ure_and_History.pdf
Madawaki, A., Ahmi, A., & Ahmad, H. (2017). Internal audit function: a comparison between
private and public sector in Nigeria. In SHS Web of Conferences (Vol. 34, pp. 1-4). EDP
Sciences. Retrieved from http://repo.uum.edu.my/20991/1/shsconf_four2017%201%207.pdf
Appendix
Interview (1)
Interviewers Name: Fatima Al Saidi – Farida Khorrami – Hind Al Ali
Interviewee Name: Dr. Ehab Elbahar – Assistant Professor at the American University in the
Emirates – External & Internal auditing, corporate governance and risk management
professional
Date and Time: Monday, 25th November 2019 at 12:00 PM
Interview Questions
1. What are the sources of rules and regulations that are used during the audit process?
2. How do you plan the auditing process?
3. Explain the steps that you take before an audit process?
4. Explain what you should do after the audit?
5. How do you prepare the audit reports?

ISSN#:
294
Interview (2)
Interviewers Name: Fatima Al Saidi – Farida Khorrami – Hind Al Ali
Interviewee Name: Arif Abdulla – Financial Manager at Al Arif Contracting Co LLC
Date and Time: Wednesday, 4th December 2019 at 11:00 AM
Interview Questions
1. What are the sources of rules and regulations that are used during the audit process?
2. How do you plan the auditing process?
3. Explain the steps that you take before an audit process?
4. Explain what you should do after the audit?
5. How do you prepare the audit reports?

ISSN#:
295
Change management: Merger of X and Y companies
Amna Mohamed Saleh AlJasmi,
HBMSU Learner: 200109027
Introduction
Nowadays, many companies change in different ways not because it’s their goal to change but
it’s a way to ensure their company sustainability that’s why change management became an
important tool to ensure their adaptation with the rapidly changing work environment. One of
the changes type is merger and it’s combining two companies and more for different reasons
such as financial growth, gaining competitive advantage and surviving.
The aim of this report is to give a consultancy advice to X company and Y company on how to
deal with the change that they want to implement which is merging both companies. The report
will include different issues of the change that might face the companies and how to deal with
it.
Possible impacts of the change
Many companies decide to merge because of its benefits although merger has positive impact
it has negative impacts also, which the companies must put it in their consideration before
starting the change, the following are the possible impacts that might face the companies while
merging.
1. Impact on employees
Merger may have a major impact on employees, one of the impacts is that it might be difficult
for them to adapt with the new situation since the work environment will change, also there will
be a new system and new work processes and procedures that means the current routine will
change and all these new changes needs new skills or improve the old skills to fit with the new
work requirements this lead the employees to feel fear of failure of adaption (Long hall
consulting, n.d.). Another impact due to merger is the employees may suffer from workload
because of merging the projects of both companies which leads to increasing the work
(Richards, n.d.). Moreover, merger might change the organizational structure and cancel some
jobs or it will be sufficient with the amount of employees, they need less amount of employees
therefore some employees will lose their jobs (Jeyanthi, et al., 2016).
2. Impact on management
The chance of losing jobs might be higher in the management level than the lower level
employees due to corporate culture conflict, the new corporate culture will effect on the
management behavior because they might do things they don’t agree with this will cause stress
to them (Jeyanthi, et al., 2016). Merger might be difficult for the managers to manage and
deliver the change for their employees and some managers have lack of confidence that they
can do it, this might cause a resistance to change from the management side (Stark, 2015).

ISSN#:
296
3. Impact on shareholders
Merger has some economic impact on shareholders of both companies in different way. The
impact depends on many factors such as company size, economic environment and the merger
management (Jeyanthi, et al., 2016). One of the merged company will benefit from the merger
because the share value will rise while small size company may suffer because the share value
could drop (Beers, 2019).
Ways to deal with these impacts
1. Communication
Communication is the most important tool in change management which relieves the impact of
the change. Communication will be by providing timely, clear, consistent and correct
information to the stakeholders about the change, discuss with them about the change to start
on the change project and also by listening to their problems.
Communication with stakeholders enhance and increase their understanding, motivation and
commitment to the project (Hao & Yazdanifard, 2015). Ineffective communication will increase
stakeholders’ resistance to change. Therefore, communication must start before implementing
the change, beginning of the change, during the change and should continue after the change
(Rosin, 2018).
2. Stakeholders’ involvement
Involve the stakeholders from both companies in the planning and preparing stage of the
change, and involve them in taking decisions this will increase their satisfaction with the new
changes and make the image clear to them (Contributor, 2017). Involving the stakeholders on
the change project will build commitment toward the success of the new change. Building the
commitment will be when they help in developing the change and they become part of the
change success (Cordas & Cicos, 2017).
3. Training
Training is another way to deal with merger impact. Training on the new system, processes,
procedure not only technical training but also providing suitable training programs for
employees to develop their skills and gain new skills, and provide programs for managers on
how to deal with employees during the change, this will decrease the fear of failure and will
make the adaptation to change easier (Go fluent, 2017). Without effective training it would be
difficult for stakeholders to accept the change and they might leave the organization, training
will increase their confidence and they will let them stay and will increase the change success
(Courtney, 2016).
4. Change step by step
The implementing of change step by step and on stages increase the stakeholders’ acceptance
and response to change. Also choose the suitable time to start the implementation and the best
time is when the required resources are available (Insights, n.d.).

ISSN#:
297
Change leader
Leadership is important in change management since it makes a great difference and helps in
increasing the success of the project (Thomas, 2014). The change leader can be from the
company or from outside the company. In merging X company and Y company it’s preferable
that the leader is from one of the merging companies but he must be selected based on some
characteristics.
Change leader must have in-depth understanding of the change, the reasons of the change, the
problems and barriers that affect the change implementation and the requirement of the change,
this understanding will help him to set a clear direction of the change for the team to follow
(Anderson, 2016). Furthermore, the leader must have the ability to communicate always with
employees and understand their problems, suggestions, ideas and their needs with providing
them an effective feedback which improves the relationship between the leader and employees
(Hao & Yazdanifard, 2015). The leader must motivate himself and his team and empower them
which encourage them to innovate in the period of change which makes them find solution for
any problem they might face during the change. Aligning employees’ work with the company’s
strategy is one of the change leader roles, this could happen by understanding and defining the
vision, mission and culture of the company. Moreover, it’s important that the change leader can
manage the challenges and the risks because he will help a lot to make the change much easier
for the employees (Anderson, 2016).
Leadership style
The selected leadership style for the merging of X and Y companies is visionary leadership
which it depends on three key characteristic. The first is risk taking, change needs a leader that
is brave enough to take any un expected risk that occur during the change because taking risks
and finding solutions at the same time will help the change process continue without any
barriers (Patrick, 2019).
The second is listening, visionary leader accept the advice and don’t ignore and stick to what
he thinks is the best. The visionary leader listens to his team and take the advantage of their
advice to improve and give confidence to his team and build trusted relationship. The third
character is taking responsibility, the visionary leader takes responsibility of his actions and
vision the reason behind this is to keep the change project move forward. The leader
responsibility is to make sure that everyone is treated equally and fairly. A leader with vision
guide his people with vision and set for them a clear direction to do the work, he also leads them
with passion by making the bad situations to better by finding innovative ideas (The balance
careers, n.d.).
Change team
For successful change management it’s important to structure the change management team,
there are many different effective structures can be used to manage the change (Smith, 2018).
In merging X and Y the suggested structure of change team contains five roles, the table below
will show the roles and responsibility for each role (Lockitt, 2004) & (Prosci, n.d.).

ISSN#:
298
Role Responsibility
1. Change management
resource/team
- Develop the change management strategy and plans.
- Support the executives, project team, supervisors
and project support functions.
2. Executives and senior
managers
- Participate in the change project actively and visibly
which means their participation must be seen from
beginning to the end.
- Communicate with employees about the change
directly.
- Take part in managing resistance.
3. Managers and
Supervisors
- Communicate with employees about how the change
may impact them directly.
- They must advocate the change from beginning and
be role model for their employees which they follow
him.
- Coaching employees.
- The best way to manage employees’ resistance is by
the direct supervisor.
- Contact and interact with project team and provide
feedback.
4. Project team - Design the change and how people do their work.
- Managing the technical side of change.
- Work with change management team to ensure that
the people side and technical side are aligned.
- Combine change management plan with project
plan.
5. Project support
functions
- Use their experience to support the current change.
- Use their knowledge in helping project team and
change management team.
- Provide the tools that support the change activities.
Change model
There are many models to implement change, using models to implement change provides
support and clear direction to the change, it also provides understanding of the processes and
the impact of the change (Anastasia, 2015). In the case of merging X company and Y company
the suggested model is ADKAR which contains five phases and they are Awareness, Desire,
Knowledge, Ability and Reinforcement. The following is the explanation of how to achieve
each phase according to (Accipio, n.d.)& (Pearson, n.d.).
1. Awareness
This phase is about identification the need of change, reasons of change, the desired goal,
explain expected results of the change and estimate the needed resources to implement the
change this must happen through the following tools:
• The result of the internal and external evaluation of both companies based on KPIs.
• Stakeholders’ suggestions.
• Work requirement.
• Benchmarking with pioneer companies in merging.

ISSN#:
299
2. Desire
It’s the process of specifying the desired goal of the change, set the plan and take the decision
of the following points:
• Identify steps and stages of the change implementation according to specific period of time
and KPIs in order to monitor the progress.
• Identify the responsibilities of each member of the change team and the procedure of the
implementation.
• Identify the impacted stakeholders and inform them about the change.
• Identify the expected risks and set procedures to prevent and deal with it.
3. Knowledge
It’s the phase of providing the required skills and information through designing training
programs to fill the gaps of the needed skills.
4. Ability
Empower the team to use and implement the skills and information to achieve the change, also
to remove the barriers and obstacles to the change. Implementing the change must be in limited
scale and then implement it to the whole organization based on the achieved results.
5. Reinforcement
Following up the achievement and its aim to achieve and sustain the change through
monitoring and measuring the progress of the achievement through the KPIs that helps in
developing and improving the change continuously.
New organizational culture
X company and Y company have different culture. It’s not a good idea to use both cultures
because it’s ineffective that means the new merged organization must have new culture to
succeed the change (Jacoby, n.d.). The new culture can be integration of both cultures but
selecting the best features of each culture and then they have to inform the employees about the
new culture (Wisdom jobs, n.d.).
Sustainability issues
The most important issue which cause a barrier to change sustainability is resistance. Resistance
to change means the unacceptance to the change that occur in the company because they see it
as a risk to them (Changing minds, n.d.). Resistance to change happens because of different
reasons such as feeling fear of losing the jobs, thinking that the current situation is better than
the new situation and other reasons (Tanner, 2019).
Change sustainability
Sustainability of change is not easy; many organizations fail in sustaining the changes. There
are different ways to ensure change sustainability. Leadership is one of the factors that have
huge impact on the change sustainability, therefore selecting the suitable leader needs a lot of
work. Sustaining change needs a powerful leader which have an influence in the organization,

ISSN#:
300
flexible, align the work with the company strategy and communicate to understand the needs
and wants of the internal and external customers (Smith, 2014). Moreover, to ensure change
sustainability it’s important to find out the main and most important problems and solve them
and always monitor these problems (Thwink, n.d.).
Involving customers in change implementation is important as involving employees because
they give the organization new ideas from their perspective that the organization might never
think of which helps in thinking innovatively and sustaining the change (Ontario, 2013).
Another way is to Use rapid cycle testing which is a method to implement PDSA the purpose
of this tool is to test the change in small scale to know what are the strength and weakness and
then improve in the next implementations (Niatx, n.d.). PDSA (Plan, Do, Study and Act), plan
is to set a plan for the test by identifying the people will involve, team member responsibilities
and explain the processes and procedures.
Do is to start doing the planned test. Study is to analyze and study the results of the test. Act is
to decide what to do when applying the change again based on the result that was studied
(Ontario, 2013). The benefit of this tool is minimizing the resistance to change which is one of
the sustainability issues, reduce time and money consuming and learn from the testing and take
the good ideas for the next implementations (Niatx, n.d.).
Sustainable change strategy
The selected strategy for the merging of X and Y company is educative strategy. Although it
takes long time to implement the change and it cost the company it has advantages to use
(Lockitt, 2004). This strategy changes employees values and beliefs in order to support the
change and moving it forward. In this strategy consultants and specialists lead different
activities, training and educational programs in order to educate the individuals. The advantage
of this strategy that it makes the individuals have a positive commitment (Ohtonen, 2012).
Summary
Now we can say that X and Y company is aware enough of the merger. The report explained
the possible impacts of merging both companies the impacts are related to employees, managers
and stakeholders. It also provides ways to deal with these impacts and they are effective
communication, training, stakeholders involvement and change step by step.
The suggested leadership style was visionary leadership since it can help in succeeding the
merger and also the change team was addressed each member have different responsibilities all
they work together to move the change forward. The recommended change model was ADKAR
model, it’s simple and very clear model which makes the change implementation easier the
model supports the change and provides a clear direction to the change.
When the two companies merged the new company must have new culture therefore the
companies must integrate their culture to build one new culture which support the change. No
merger is free of change sustainability issue like change resistance but every issue have a
solution for this issue the selected solution is to implement educative strategy to ensure the
company sustainability.

ISSN#:
301
References
Accipio, n.d. The ADKAR Model. [Online]
Available at: https://www.accipio.com/eleadership/mod/wiki/view.php?id=1705
[Accessed 13 November 2019].
Anastasia, 2015. Major Approaches & Models of Change Management. [Online]
Available at: https://www.cleverism.com/major-approaches-models-of-change-management/
[Accessed 13 November 2019].
Anderson, D. D., 2016. Creating a Change Leadership Team: What Roles Are Critical?. [Online]
Available at: https://blog.beingfirst.com/change-leadership-what-roles-are-critical
[Accessed 13 November 2019].
Beers, B., 2019. How Does a Merger Affect Shareholders?. [Online]
Available at: https://www.investopedia.com/ask/answers/040815/how-does-merger-affect-
shareholders.asp
[Accessed 12 November 2019].
Changing minds, n.d. Resistance to Change. [Online]
Available at: http://changingminds.org/disciplines/change_management/resistance_change/resistance_change.htm
[Accessed 15 November 2019].
Contributor, S., 2017. The Key Factors of Successful Change Management. [Online]
Available at: https://www.shmula.com/the-key-factors-of-successful-change-management/22526/
[Accessed 13 November 2019].
Cordas, D. & Cicos, L., 2017. Change Management and Stakeholder Engagement: Involving End Users
and Executive Sponsors. [Online]
Available at: https://evolllution.com/managing-institution/operations_efficiency/change-
management-and-stakeholder-engagement-involving-end-users-and-executive-sponsors/
[Accessed 13 November 2019].
Courtney, F., 2016. Change Management: 3 Reasons Why Training Supports Organizational Change.
[Online]
Available at: https://elearningindustry.com/change-management-3-reasons-training-supports-
organizational-change
[Accessed 13 November 2019].
Go fluent, 2017. How Training Leads to Effective Change Management. [Online]
Available at: https://www.gofluent.com/blog/training-leads-effective-change-management/
[Accessed 13 November 2019].
Hao, M. J. & Yazdanifard, D. R., 2015. How Effective Leadership can Facilitate Change in Organizations
through Improvement and Innovation. Effective Leadership, 15(9), pp. 1-3.
Insights, n.d. Dealing with resistance to change. [Online]
Available at: https://www.insights.com/resources/dealing-with-resistance-to-change/
[Accessed 13 November 2019].

ISSN#:
302
Jacoby, J., n.d. The Merging of Organizational Cultures. [Online]
Available at: https://www.lc-global-us.com/change-talk/the-merger-of-organizational-cultures
[Accessed 15 November 2019].
Jeyanthi, D. S. B. Q., Kalaivani, C. & Sumathi, B., 2016. General Impacts of Merger and Acquisition on
Companies. POSSIBLE IMPACTS OF MERGERS AND ACQUISITIONS, 4(2), p. 94.
Lockitt, B., 2004. Change management. [Online]
Available at:
https://web.archive.org/web/20061010032354/http://nt6139.vs.netbenefit.co.uk/pdf/CHANGEMAN
AGEMENT3t.pdf
[Accessed 16 November 2019].
Long hall consulting, n.d. 12 Reasons Why Employees Resist Organizational Change. [Online]
Available at: http://longhallconsulting.com/12-reasons-why-employees-resist-organizational-change/
[Accessed 13 November 2019].
Niatx, n.d. Rapid-cycle testing: How to Conduct a Plan-Do-Study-ACT (PDSA) Cycle. [Online]
Available at: https://niatx.net/Content/ContentPage.aspx?NID=148
[Accessed 15 November 2019].
Ohtonen, J., 2012. Effective Change Strategies to Support BPM. [Online]
Available at: https://www.bpmleader.com/2012/05/08/effective-change-strategies-to-support-bpm/
[Accessed 16 November 2019].
Ontario, 2013. Implementing and sustaining change. [Online]
Available at: http://www.hqontario.ca/Portals/0/documents/qi/qi-implementing-and-sustaining-
changes-primer-en.pdf
[Accessed 15 November 2019].
Patrick, M., 2019. Characteristics of Visionary Leadership. [Online]
Available at: https://smallbusiness.chron.com/characteristics-visionary-leadership-31332.html
[Accessed 13 November 2019].
Pearson, S., n.d. What’s the ADKAR Model and How to Use It. [Online]
Available at: https://tallyfy.com/adkar-model/
[Accessed 13 November 2019].
Prosci, n.d. Employee Roles In Initiating Successful Change Management. [Online]
Available at: https://www.prosci.com/resources/articles/change-management-roles
[Accessed 16 November 2019].
Richards, L., n.d. The Effects of Merger and Acquisition on Employee Morale. [Online]
Available at: https://smallbusiness.chron.com/effects-merger-acquisition-employee-morale-
3196.html
[Accessed 13 November 2019].
Rosin, T., 2018. The CEO’s Guide to Successful Change Management. [Online]
Available at: https://blog.walkme.com/change-management-guide/
[Accessed 12 November 2019].
Smith, C., 2018. A Quick-and-Dirty Guide to Change Management Team Structure. [Online]
Available at: https://change.walkme.com/change-management-team-structure/
[Accessed 15 November 2019].

ISSN#:
303
Smith, J. L., 2014. Six Steps to Sustain Organizational Change. [Online]
Available at: https://www.peoriamagazines.com/ibi/2014/may/six-steps-sustain-organizational-
change
[Accessed 15 November 2019].
Stark, P. B., 2015. Why Managers Resist Coaching. [Online]
Available at: https://peterstark.com/why-managers-resist-coaching/
[Accessed 13 November 2019].
Tanner, R., 2019. Organizational Change: 8 Reasons Why People Resist Change. [Online]
Available at: https://managementisajourney.com/organizational-change-8-reasons-why-people-
resist-change/
[Accessed 15 November 2019].
The balance careers, n.d. Visionary Leadership. [Online]
Available at: https://www.thebalancecareers.com/visionary-leadership-4174279
[Accessed 13 November 2019].
Thomas, D. O. O., 2014. Change Management and its Effects on Organizational Performance of
Nigerian Telecoms Industries: Empirical Insight from Airtel Nigeria. 1(11), pp. 174-175.
Thwink, n.d. Change Resistance as the Crux of the Environmental Sustainability Problem. [Online]
Available at: https://www.thwink.org/sustain/articles/009/ChangeResistanceAsCrux.htm
[Accessed 15 November 2019].
Wisdom jobs, n.d. Managing Organizational Culture during Mergers - Principles of Management.
[Online]
Available at: https://www.wisdomjobs.com/e-university/principles-of-management-tutorial-
293/managing-organizational-culture-during-mergers-9411.html
[Accessed 15 November 2019].

ISSN#:
304
4th Industrial Revolution: how people and technology are
shaping the future of organizations
Miguel Salvato Rombert Trigo,
University Fernando Pessoa
Abstract
We live in a VUCA world, this reality is very well illustrated by current Danone CEO Emmanuel Faber in stating
"What Keeps me awake at the pace of change. Are we changing too fast? Or not to fast? And where?". A number
of factors contribute to this reality that entire companies, institutions and industries (and the people who work in
them) are facing. Let us then analyze these factors from the work of authors such as Eric Ries (Ries, 2017) and
Rita McGrath (McGrath, 2019). The phenomenon of globalization means that organizations and their employees
do not know today where their main competitors or some of the buyers of their products / services will come from.
"… Software is eating the world." wrote Marc Andreessen in 2012, referring to the growing number of businesses
/ industries that operate using software and offer their services online, and foreseeing that in the next 10 years
more industries would be victims of "software disruption." The disruption will be increasing, thanks to the
advances made daily in the area of artificial intelligence and machine learning enhanced by the increased
capabilities provided by the internet of things. People have changed. They live longer years. They are more active.
They are more knowledgeable and demanding consumers and workers. Global communication, rentable means of
production, and global supply chains at marginal costs enable you to reduce initial costs and increase successful
launch conditions for new products or businesses. McGrath (2019) argues that firms that have already realized
this have abandoned the premise that business stability is the norm and are trying to find new ways based on what
patterns of change they can identify. It is time to rethink organizational models, management models and labor
relations in a way that business, people and society can grow together.
Keywords: 4th Industrial Revolution, Inflection Points, Technology Exponentials Convergence, People Trends,
Organizations Competitive Environment, Innovation.
The world we live in
The world is becoming more and more V.U.C.A. (the acronym for volatile, uncertain, complex
and ambiguous) and, increasingly marked by the transformations that have been enhanced by
something Kelly9 (for whom the computer age only started when computers merged with the
phone) called a “robust hybrid”, resulting from the convergence between communication and
computing, with which we get used to living under the format of a system that combines
“internet / web / mobile”. This phenomenon was undoubtedly responsible for other changes that
have been taking place since the 1980s.
A good way to begin an analysis of the world we currently live in is to build on the concept of
strategic inflection points from former Intel CEO Andy Grove:
“A strategic inflection point is a time in the life of a business when it's fundamentals are
about to change ”(Grove, 2010)10.
9Kelly, K. (2016). The Inevitable: Understanding the 12 Technological Forces That Will Shape Our Future. Penguin Books.
10Grove, AS (2010). Only the Paranoid Survive: How to Exploit the Crisis Points That Challenge Every Company. Currency.

ISSN#:
305
In Rita McGrath's opinion when we look at strategic inflection points, we should compare them
to the way Mike Campbell's (character in Hemingway's book The Sun Also Rises) responds
when asked how he went bankrupt: “Gradually, then Suddenly.”
According to her, an inflection point has the power to change the assumptions by which
organizations were created, appearing as a shift in the business environment that creates
dramatic changes in the competitive dynamics of a functioning system, which may mean the
emergence of new entrepreneurial opportunities but may also result in “… potentially
devastating consequences for those still operating under the old model or assumptions.”
(McGrath, 2019)11.
The most common triggers of a turning point are as follows:
● technological changes,
● regulatory changes,
● social possibilities,
● demographic changes,
● new connections between elements (common to digital disruption)
● political changes.
Inflection points main triggers currently hovering over us and our organizations: technological
changes, new connections between elements, and social possibilities.
Technology, what is changing?
Andreessen wrote that “… software is eating the world…” (Andreessen, 2011)12 when
describing how a growing amount of business and / or industrial sectors had started to operate
based on software and offered as online services.
History has shown that Andreessen was right, the huge and rapid worldwide expansion of
software powered by the “internet / web / mobile” system and the phenomenal growth in the
number of smartphones (with ever increasing processing and storage capacity, and access to
knowledge) that came into the hands, or pockets, of a large number of the inhabitants of planet
earth is helping to fulfill the predictions made by Andreessen in the article cited above, when
he anticipated that in the following 10 years, more industries would fall victim to software
disruption.
But the technological innovations (and the transformations that their evolution allowed to
create) do not stop here, nor stop accelerating at a high pace, in an article published in 2016,
Klaus Schwab stated that “We stand on the brink of a technological revolution that will
fundamentally alter the way we live, work, and report to one another. In its scale, scope, and
complexity, the transformation will be unlike anything humankind has experienced before.”
(Schwab, 2016)13.
11
McGrath, R. (2019). Seeing Around Corners: How to Spot Inflection Points in Business Before They Happen. Houghton Mifflin
Harcourt. 12
Why Software Is Eating the World - Andreessen Horowitz. (2011, August 20). Retrieved from
https://a16z.com/2011/08/20/why-software-is-eating-the-world. 13
The Fourth Industrial Revolution: What it means and how to respond. (2020, January 07). Retrieved from
https://www.weforum.org/agenda/2016/01/the-fourth-industrial-revolution-what-it-means-and-how-to-respond

ISSN#:
306
Schwab continues his analysis, arguing that the 4th Industrial Revolution and the
transformations it brings with it could not be compared with previous revolutions, nor be
understood as a mere extension of the 3rd Industrial Revolution because of the “… velocity,
scope, and systems impact.” adding that “The speed of current breakthroughs has no historical
precedent.” and that the 4th Industrial Revolution “… is evolving at an exponential rather than
a linear pace.”
Diamandis and Kotler (2015)14help us to have a more concrete notion of the speed with which
the changes are and will continue to happen, by clarifying that contrary to the linear progression
in which from 1, we pass to 2,3,4, etc., the technology of “the world we live in” grows
exponentially, that is, from 1 to 2, then to 4, and from 4 to 8 and so on, always doubling its
power.
It is this type of growth that:
● enables the smartphone we use today to be a thousand times faster and a million
times cheaper than a supercomputer from the 1970s;
● allows us to predict that in 2023 a computer that costs around a thousand dollars
will have a computing capacity equal to that of the human brain and that, 25
years later, therefore in 2048, it will have a capacity equal to the totality of the
human brains on planet earth ;
● will be responsible for, as Kelly believes, we may cease to have past or future,
and we will live in a permanent and endless present, marked by constant updates
and upgrades of systems and technologies that transform us into eternal newbies,
always looking to stay up to date (which will hardly happen because the
obsolescence cycle is also constantly accelerating).
● Makes Vijay Govindarajan15, argue that the future should be understood as a
software that is constantly being updated, reaching us in daily doses that must
be properly identified and analyzed.
Professors Brynjolfsson and McAfee contend that the world we live in is marked by“… the
emergence of real, useful artificial intelligence (AI) and the connection of most people on the
planet via a common digital network." They state that these, which are the two most important
moments in our history, came about thanks to the coexistence of three elements:“… sustained
exponential improvement in most aspects of computing, extraordinarily large amounts of
digitized information, recombinant innovation. ”(Brynjolfsson and McAfee, 2014)16
Let us look a little further at the three elements identified by Brynjolfsson and McAfee. With
exponential improvement, the authors seek to convey the idea that what may have previously
existed is in no way demonstrative or indicative of what it is to come because “The accumulated
doubling of Moore's Law, and the ample doubling still to come, gives us a world where
supercomputer power becomes available to toys in just a few years, where ever-cheaper sensors
enable inexpensive solutions to previously intractable problems, and where science fiction
keeps becoming reality. ”
14
Diamandis, PH, & Kotler, S. (2015). Bold: How to Go Big, Create Wealth and Impact the World (Exponential Technology
Series). Simon & Schuster. 15
Govindarajan, V. (2016). Planned Opportunism. https://hbr.org/2016/05/planned-opportunism 16
Brynjolfsson, E., & McAfee, A. ( 2014). The Second Machine Age: Work, Progress, and Prosperity in a Time of Brilliant
Technologies. WW Norton & Company.

ISSN#:
307
Regarding digitization, the transformation into zeros and ones (the native language of
computers) of all kinds of information and media, be it texts, sounds, photos, videos, data
collected by sensors and instruments, news, maps, personal updates, social networks,
information requests and their answers, etc., allowed the emergence of “… two of the well-
understood and unique economic properties of digital information: such information is non-
rival, and it has close to zero marginalization cost of reproduction. ", ie information can be"
consumed "by more than one person at a time (non-rival) and, as " Copying bits is also
extremely cheap, fast, and easy to do.” making additional copies of an original costs almost
zero (zero marginalization cost of reproduction).
As for the third element, the authors maintain that "… digital innovation is recombinant
innovation in its purest form. Each development becomes a building block for future
innovations. Progress doesn't run out; it accumulates.” They add that the digital world respects
no boundaries, extending itself to the physical world as it’s happening with autonomously
driven cars and airplanes and printers that create replacement parts. They conclude by giving a
sense of digitization potential “…makes available massive bodies of data relevant to almost any
situation, and this information can be infinitely reproduced and reused because it is non-rival.”
These three elements are at the origin of what Diamandis calls “Six D's of Exponentials”, the
concept he developed to present us his vision of the new growth cycle of exponential
technologies:
1. Digitization. As soon as a technology or branch of knowledge (e.g., biology, medicine,
manufacturing, etc.) becomes digital and, it becomes possible to represent it through the
binary code of zeros and ones (the native language of computing), hitches a ride from
Moore’s17law and increases the speed (and at the same time expands access) with which
everything happens, including knowledge sharing, also increasing the chances of innovation
happening. Soon, with quantum computing, the ride will be on the back of Rose's Law,18
which will certainly make the acceleration much greater.
2. Disappointment. Period during which exponential growth goes largely unnoticed
because the duplication of small numbers produces results so tiny that they are often
(incorrectly) interpreted as the blossoming of linear growth. However, as soon as
doubling reaches the whole numbers barrier (1,2,4,8, etc.), it is only 20 duplications far
to achieve a million-fold improvement and 30 duplications to a billion-fold
improvement. .
3. Disruption. This is what happens when exponentials really start to make an impact on
the world, to put it simply, it is the time when an innovation starts to lead to the
discontinuity of existing products, services, markets and industries. As disruption
always comes after disappointment, the initial technological threat always seems very
small and, as a rule, is not perceived in time.
4. Demonetization. It is about the emergence of new solutions that eliminate the need to
purchase something that was previously paid for (eg: camera rollers, music CDs,
international phone calls). As the disruption happens immediately after the
disappointment phase, the change is not perceived in a timely manner.
17
So called after the finding made by Gordon Moore (in 1965) that, every 18 months the number of transistors in an integrated
circuit doubled. 18
In 2012 Geordie Rose, the founder of a quantum computing company, stated that the number of qubits (quantum bits) in a
quantum computer doubles each year.

ISSN#:
308
5. Dematerialization. It boils down to the disappearance of goods and services that were
previously considered important and that ceased to be important or that started to be
offered in a different way (eg: gps devices, voice recorders, digital clocks, cameras, all
became offered in smartphone app format).
6. Democratization. This is what happens when the costs that continue to exist to create
something become so low that they become available and accessible to almost anyone.
We are currently moving towards a future of convergence between different technologies. This
situation seems to be configured as the main turning point that organizations need to be aware
of at the technological level. A good example of what is happening is what Diamandis and
Kotler report about the development of new drugs, that is accelerating not only because
advances in biotechnology are advancing at an exponential rate, but also because artificial
intelligence, quantum computing and a series of other technologies are converging, overlapping
/ stacking on top of each other, producing tsunamis of knowledge and innovations capable of
making everything that comes their way disappear.
The same authors argue that when exponential technologies converge, the potential for
disruption also increases in terms of scale, that is, while a solitary exponential technology is
capable of causing the disruption of a product, service or market “…convergent exponentials
wash away products, services, and markets, as well as the structures that support them.”.
And it is precisely this type of convergence that we are witnessing and that, enables the
emergence of increasingly agile and intelligent robots (the result of the convergence of
exponential sensor technologies, AI with neural networks, and the cloud), is also allowing for
an exponential acceleration in the development and capabilities of autonomous transportation.
What is changing about People?
“Our World in Data” website19estimates that the world population in 2020 will comprise
approximately 7,800,000,000 people, with 49.6% being female and 50.4% male. About 56% of
these people will live in one of the ten most populous countries in the world.
The average age of the world population will be 29.8 years, the fertility rate of 2.5 live births
per woman, and the infant mortality rate of 2.61%. Of the entire world population, 43.3% should
be considered rural and 55.7% urban. It is estimated that, in 2020, the annual growth rate of the
world population will be fixed at 1.05%, and that the average life expectancy will be 72/73
years.
In generational terms, in 2020 the world population will have the following structure:
● 40.6% of the population is between 25 and 54 years old;
● 25.4% are between 0 and 14 years old;
● 15.5% are between 15 and 24 years old;
● 9.3% are 65 or older;
● 9.1% are between 55 and 64 years old
19
Ritchie, H., & Roser, M. (2019). Age Structure. Our World in Data. Retrieved from https://ourworldindata.org/age-structure

ISSN#:
309
When we talk about generations pyramids, we should focus on studying the increasing number
of people who will be living 65 years or more and, the people who in 2020 will be between 26
and 42 years old (the millennials). In addition to being numerous the two will be responsible
for the main socioeconomic changes in the near future.
As for the first group, A United Nations report20on aging populations says that we are facing a
global phenomenon, with the number of people aged 65 and over projected to double to 1.5
billion by 2050 (an expected increase of 120% between 2019-2050 ). The report presents other
important data, such as: the survival rate after completing 65 years will go from 17 years
(estimated value for 2015-2020), to the 19 years between 2045-2050; the aging of the
population in countries with lower intergenerational transfers will put substantial pressure on
older people to become self-sufficient while testing the sustainability of state support systems.
The previous predictions and the fact that the ageing process is becoming slower brings other
challenges, ranging from the increase on the retiring age - what will force to rethink the current
model of work (working more years less hours a day will be one of the hypotheses) and the way
we are educating ourselves (lifelong learning must be the new normal) - to new consumer needs
and customer expectations.
Moving on to millennials, in 2008 Canadian Don Tapscott published a book21in which he
presented the results of a study, involving almost 8,000 people from 12 different countries, all
born between 1978 and 1994. In the book, Tapscott presents 8 norms that according to him
almost all participants shared (even if they were from different countries and cultures). These
norms were: Freedom; Customization; Scrutiny; Integrity; Collaboration; Entertainment;
Speed; Innovation.
Although in many organizations the practice shows that “we have always done things this way”
still prevails, the reality is that all the changes we have addressed in the previous paragraphs
require organizations to reposition themselves and to do things in different ways.
To cope with new technological, social, labor market, and consumer trends, products/ services
and business model innovation it is not enough. Of course it still remains essential but, given
the speed with which changes (in habits, in the way of doing things, and in the way of thinking)
happen, organizations will also have to innovate in the way they organize themselves
(innovation in organizational design) and innovate in the way its management is practiced.
Organizations for a V.U.C.A. world
As Peter Drucker stated22 “There is only one valid definition of business propose: to create a
customer (…) The customer is the foundation of a business and keeps it in existence.”, so with
no possible doubt the first task for a V.U.C.A. world organization is to have deep knowledge of
its customers: who they are, the jobs they need to get done and what their habits and behaviors
are.
20
United Nations, Department of Economic and Social Affairs, Population Division (2019). World Population Ageing 2019:
Highlights (ST / ESA / SER.A / 430). Retrieved from https://www.un.org/en/development/desa/population/publications/pdf/ageing/WorldPopulationAgeing2019-Highlights.pdf on January 24, 2020. It 21
Tapscott, D. (2008). Grown Up Digital: How the Net Generation is Changing Your World. McGraw-Hill Education 22
Drucker, P. F. (1954). The Practice of Management. HarperCollins Publishers.

ISSN#:
310
2020 Consumers: the V.U.C.A. world customers
The previously presented trends about changes occuring in technology, in people demography
and behaviors and, the way they converge themselfs are the responsibles for the type of
consumers of 2020.
In general, we can say that V.U.C.A. world customers:
● Are more aware of the reality that surrounds them, due to the ease they have in accessing
information;
● Are more demanding about how they are treated by organizations. This applies to the
quality of the products/services that are offered, the shopping and after-sales experience,
the transparency with which the whole process takes place and, that the solution being
offered (products/services) help them to complete the jobs they need to do without extra
effort needed;
● Want freedom of choice: what they buy, where they buy, to customize or not and, when
to buy;
● For some of their choices they prefer to consider accessing rather than owning the
good(s);
● [Especially the millennials] want speed in the process (the speed with which they can
try / buy or get feedback on a product / service or question they have asked)
● [Especially the group of people aged 65 and over] need products and services that allow
them to enjoy longevity enjoying better health conditions.
The competitive ecosystem
The current pace of convergence in exponential technologies associated with the phenomenon
that communication means became global, the means of production became rentable and, global
supply chains can be enjoyed almost at their cost price, reduce the initial barriers and increase
the conditions for successful launch of new products or businesses.
Currently, support Brynjolfsson and McAfee, a creator of a digital app, no matter how modest
its facilities or the size of its team, it becomes a micro-multinational with the capacity to reach
global audiences, almost instantly. The power of the cloud allows him, in a matter of minutes,
to start a new project with access to the number of servers and computing power he needs, and
as soon as he needs to increase the contracted capacity, the process is as simple as the initial
one.
As Diamandis and Kotler expose, it is no longer necessary to spend money on buying
excessively expensive equipment, spend months installing, configuring and programming that
equipment, and worrying about what happens if it breaks down or becomes obsolete. And
technology, in this case access to infinite computing, allows you to experiment with ideas and
learn from mistakes - which, believing in Jeff Bezos statement23 is the best way to guarantee an
organization's success - while spending less and less time and money.
23
Dennis Green, BIU (2019). Jeff Bezos has said that Amazon has had failures worth billions of dollars - here are some of the
biggest ones. Business Insider Singapore. Retrieved from https://bit.ly/2SmQrfE

ISSN#:
311
Global means of communication also gave the “app creator/ micro-multinational” access to a
global market of collaborators to make his project viable:
● With the help of the crowd, he can now launch a new business or a new product with
less risk because, the insights that the “crowd” can contribute in the development phase
can help to develop something that corresponds in such a way to the needs and / or
expectations of a high number of members that, when going to the market, there are
already a large number assured sales among this crowd.
● By being able to recruit on a global level, the chances of finding and attracting the right
people increased. And, at least for some tasks, diversifying the offer in terms of talent
and, the different levels of expected remuneration.
● Finally, capital has also become more accessible, thanks to the crowd's investment.
According to Diamandis and Kotler, in 2025 crowdfunding could be an ecosystem in
which it will move around 300 billion dollars.
Meanwhile, the digitization of the economy is contributing to a new reality in terms of
competition in the markets. As Brynjolfsson and McAfee reiterate, the economies of scale that
can be achieved when an activity (such as accounting) goes digital, allow market leaders to gain
a huge cost advantage and the space needed to beat the prices of any competitor, while
continuing to generate some profits to.
This factor can lead to a reality where small local markets with several smaller leaders are no
longer possible, and that there will only exist global markets in which the most capable (and
increasingly powerful) win more customers while the second and third will face greater
competition from all sides.
The robotization of the workforce and the automation of production are also changing the face
of the competitive environment of the industrial sector. As the gains obtained with the relocation
of production to places where the value of labor is lower start to disappear, the relocation of
production is no longer a competitive factor. The level of automation that the organization is
able to reach, while still meeting the expectations of its customers, has become much more
important namely, in terms of delivery times. Therefore, manufacturing will move, more and
more, according to the demand of the market and not so much with the demand for cheaper
human labor.
Yeung and Ulrich advocate that to seize these opportunities as “The pace of external change
guarantees that the right thing will inevitably become the wrong thing, often soon.” it is
necessary that "... organizations must respond to change and adopt new ways of doing things,
even if you fail in the short term.” and these changes must be at least as rapid as “… their
circumstances do.” otherwise the near future can be similar to some of the findings from the
authors:
“In the last fifteen years, we found that more than 50 percent of the Standard & Poor's
companies have disappeared; in the next ten years, estimates are that more than 40
percent will disappear.” (Yeung and Ulrich, 2019)24
So, what kind of changes are we talking about? I believe the most important change must be in
24
Yeung, A., & Ulrich, D. (2019). Reinventing the Organization: How Companies Can Deliver Radically Greater Value in Fast-
Changing Markets. Harvard Business Review Press.

ISSN#:
312
mindsets. We will have to realize that as Barry Diller states25one has to learn to unlearn - to
give up everything that has helped achieve results before, and learn to do it differently. The
scientific method should be adopted, and experimentation should be one of the strongest allies
to uncover the best ways forward.
I think the above are two key ingredients for the changes needed in organizations in order to
become what I like to call “Synchronized Organizations” that is, they are organized and
managed to ensure that they deliver value propositions and design their business models in sync
with the present times (ie: focused on its customers26 present needs and expectations, and in
tune with its surrounding environment, which will always be constantly evolving).
It will be necessary to realize that, as Paul Kruger says27 “Productivity is not everything, but in
the long run it is almost everything.” And that, as Brynjolfsson and McAfee clarify, “…
productivity growth comes from innovations in technology and techniques of production.” not
from increasing the number of hours worked. For that I believe it is important for organizations
to fully embrace the benefits of artificial intelligence and automation, and start looking
immediately for all the processes and tasks that can be improved by incorporating them.
But this incorporation should not happen in a logic of simple replacement of people by machines
in the accomplishment of some tasks, the logic It should be a matter of finding the tasks for
which each one should be responsible, because “Effective production is more likely to require
both human and machine inputs, and the value of human inputs will grow, not shrink, as the
power of machines increases. (Brynjolfsson and McAfee, 2014).
The path must also be through the transformation of management practices and organizational
models to make them more outward-looking, customer centric and more agile, able to take full
advantage of the increased productivity and capabilities brought by automation and AI, freeing
humans from tasks where the use of their (so far unique) skills - ideation, broad-frame pattern
recognition, and complex communication - to “… create opportunities to produce goods and
services that could never have been created by unaugmented humans, or machines that simply
mimicked people…” providing “… a path to productivity growth based on increased output
rather than reduced inputs. (Brynjolfsson & McAfee, 2014)
What will organizations look like in the 4th Industrial Revolution? As I mentioned earlier, In
my point of view they will be …
Synchronized Organizations
I believe “Synchronized Organizations” are the ones that can be characterized by adopting
innovative organizational designs and management practices that allow them to become
ambidextrous and exploit their current business while exploring new opportunities. This
combination allows them to continually launch:
● incremental innovations (increasing the value of their current products/services or
making their operations more efficient),
● architectural innovations (e.g., the incorporation of artificial intelligence and
automation into processes and tasks) and
25
Barry Diller - Masters of Scale. (2020, January 09). Retrieved from https://mastersofscale.com/learn-to-unlearn 26
Customer in the sense of those to whom their services and / or products are intended. 27
Paul Kruger in Brynjolfsson, Erik. The Second Machine Age (p. 72).

ISSN#:
313
● disruptive innovations (e.g., new products/services, business models), drastically
reducing the risk of becoming irrelevant when the people and the world around them
change.
You can be a “synchronized organization” regardless of size or age, but one cannot adopt a
model that was designed for a time when the external environment of organizations was much
different. In order to be in sync with our times, the model for the “synchronized organization”
must be designed to thrive and grow amid volatility, uncertainty, complexity and ambiguity.
It should be designed to allow the organization to be disciplined in rigorously running its core
business (making the most of its current capabilities) but at the same time, explore new
opportunities through a much greater focus outside the organization than within the
organization, ensuring close proximity between employees and consumers (to learn more about
and sense their needs and desires), and exploring opportunities for effective partnerships (where
sharing resources, capabilities and information produces better and more resilient organizations
and new and innovative value propositions for customers).
“Synchronized organizations” employees know (and are comfortable with that) the real CEO
it’s the customer, so organizational design and culture follows that fact with internal functional
areas sharing the mission of helping all employees serve the customer and, sharing
responsibility for achieving results. In 2004, in an article published in the Harvard Business
Review, Charles A. O'Reilly and Michael L.Tushman argue that decision makers need to get
their organizations to become ambidextrous, exploring new opportunities while continuing to
work in a disciplined manner to take maximum advantage of the exploitation of their current
capabilities and products or services.
O'Reilly and Tushman came to the conclusion that few companies could do it competently, and
for the ones that did the key success factors were: a) the separation that had been made between
the units that had the mission to explore new opportunities from the ones that had to focus on
exploiting and improving the existing business; b) the close coordination between exploration
and exploitation units that existed at the level of the organization's top executives.
This model, based on the five principles presented in the table below, allows exploration units
to launch radical or disruptive innovations while having access to the resources (money, talent
and customers) provided by exploitation units. It also makes it possible to protect the units
dedicated to exploration from the constraints caused by the anti-innovation stance they might
encounter in the existing organization, which is so well summarized in the sentence “this is not
how things are done here!”. A third gain is that it frees up time for existing units to focus
exclusively on improving current operations and products and better serving present customers.

ISSN#:
314
Table I - 5 Principles for Successful Ambidexterity
5 Principles for Successful Ambidexterity
● A compelling strategic intent that intellectually justifies the importance of both exploration
and exploitation.
● An articulation of a common vision and values that provide for a common identity across the
exploitative and exploratory units.
● A senior team that explicitly owns the unit's strategy of exploration and exploitation; there is a
common-fate reward system; and the strategy is relentlessly communicated.
● Separate but aligned organizational architectures (business models, structure, incentives,
metrics, and cultures) for the exploratory and exploitative units and targeted integration at both
senior and tactical levels to properly leverage organizational assets.
● The ability of senior leadership to tolerate and resolve tensions from separate alignments.
Another approach that distinguishes “synchronized organizations” it's being market driven.
Yeung and Ulrich call Market Oriented Ecosystems (MOEs), to the type of organization that
builds on the opportunities detected in the market, organizes people and other resources in a
model that presents an ecosystem-inspired design, aiming to succeed in the markets where it is
present. They explain that they’re made up of platforms, cells / teams, and strategic allies /
partners and flourish through the connections and learning that takes place between and within
the organizational units.
The great connecting force between this series of Independent units is the recognition that in
this way they are able to respond more quickly to changing conditions because together they
get more customer information, more innovation capabilities and greater agility. The table
below shows the six principles and actions that allow the development of such an organizational
design.
Table II - Market-Oriented Ecosystems 6 Principles and Actions
Environment
⇨
Strategy
⇨
Capability
⇨
Morphology
⇨
Governance
⇨
Leadership
Do we understand
and anticipate the
changing
environmental
conditions that
will shape our
future?
Do we have a
clear strategy
for growth and
a pathway for
making it
happen?
Have we
articulated &
Implemented
the capabilities
that leverage
the MOE?
Have we
designed the
right
organizational
form or structure
to enable our
growth strategy?
Have we
designed and
delivered the
practice in the
six governance
mechanisms that
leverage the
MOE?
Do we have
leaders at the
top and a shared
leadership
brand
throughout the
organization to
ensure success?
Appreciate and
anticipate
Clarify and
facilitate
Diagnose and
embed
Design and
deliver
Architect and
implement
Be, coach, and
build

ISSN#:
315
Conclusion
There is no doubt that living in a world where velocity is exponential means that the scale, scope
and complexity of the changes and transformations that will occur will be unprecedented. Much
more technologies and knowledge branches will be digitized and the continuing convergence
of exponentials will be responsible for washing away more and more products, services, and
markets, as well as the structures that support them.
So, organizations that lose the ability to be in tune with their target audiences, the ability to
perceive trends and anticipate changes and stay too long, doing extremely well what they
shouldn't be doing at all will probably join companies like Blockbuster and Kodak as examples
of once market leaders that “Gradually, then Suddenly.”ceased to exist.
Reference List
Barry Diller - Masters of Scale. (2020, January 09). Retrieved from
https://mastersofscale.com/learn-to-unlearn
Brynjolfsson, E., & McAfee, A. ( 2014). The Second Machine Age: Work, Progress, and
Prosperity in a Time of Brilliant Technologies. WW Norton & Company.
Dennis Green, BIU (2019). Jeff Bezos has said that Amazon has had failures worth billions of
dollars - here are some of the biggest ones. Business Insider Singapore. Retrieved from
https://bit.ly/2SmQrfE
Diamandis, PH, & Kotler, S. (2015). Bold: How to Go Big, Create Wealth and Impact the
World (Exponential Technology Series). Simon & Schuster.
Drucker, P. F. (1954). The Practice of Management. HarperCollins Publishers.
Govindarajan, V. (2016). Planned Opportunism. https://hbr.org/2016/05/planned-opportunism
Grove, AS (2010). Only the Paranoid Survive: How to Exploit the Crisis Points That
Challenge Every Company. Currency.
Kelly, K. (2016). The Inevitable: Understanding the 12 Technological Forces That Will Shape
Our Future. Penguin Books.
McGrath, R. (2019). Seeing Around Corners: How to Spot Inflection Points in Business
Before They Happen. Houghton Mifflin Harcourt.
Paul Kruger in Brynjolfsson, Erik. The Second Machine Age (p. 72).
Ritchie, H., & Roser, M. (2019). Age Structure. Our World in Data. Retrieved from
https://ourworldindata.org/age-structure
Tapscott, D. (2008). Grown Up Digital: How the Net Generation is Changing Your World.
McGraw-Hill Education
The Fourth Industrial Revolution: What it means and how to respond. (2020, January 07).

ISSN#:
316
Retrieved from https://www.weforum.org/agenda/2016/01/the-fourth-industrial-revolution-
what-it-means-and-how-to-respond
United Nations, Department of Economic and Social Affairs, Population Division (2019).
World Population Ageing 2019: Highlights (ST / ESA / SER.A / 430). Retrieved from
https://www.un.org/en/development/desa/population/publications/pdf/ageing/WorldPopulatio
nAgeing2019-Highlights.pdf on January 24, 2020. It
Why Software Is Eating the World - Andreessen Horowitz. (2011, August 20). Retrieved from
https://a16z.com/2011/08/20/why-software-is-eating-the-world.
Yeung, A., & Ulrich, D. (2019). Reinventing the Organization: How Companies Can Deliver
Radically Greater Value in Fast-Changing Markets. Harvard Business Review Press.

ISSN#:
317
AN EMPIRICAL EXAMINATION OF THE IMPACT OF
ACCREDITATION ON HOSPITALS’ QUALITY
PERFORMANCE: THE MODERATING ROLE OF
CORPORATE GOVERNANCE
Ghada A. Al Mohammed, PhD student; School of Business & Quality Management; Hamdan Bin Mohammed
Smart University
Ebrahim Soltani, School of Business & Quality Management; Hamdan Bin Mohammed Smart
University; Dubai- United Arab Emirates
Adrian Wilkinson, Director, Centre for Work, Organization and Wellbeing, Griffith University, Nathan
Queensland, Australia
Purpose
Limited knowledge is available regarding the impact of governance and the accreditation
process on the healthcare organization and health authorities in the United Arab Emirates. This
research project investigated the moderating effect of governance on the relationship between
accreditation and hospitals’ quality performance in public hospitals of the United Arab
Emirates.
Methods
This study included a combination of both quantitative and qualitative techniques to collect and
analyse the data. A cross-sectional research approach was used to assemble quantitative data
from the questionnaires distributed to 651 employees while the qualitative phase included semi-
structured interviews conducted from 15 individuals and 12 focus groups (10-12 members per
group) between June 2017 and December 2017. Thematic analysis was used to analyse
qualitative data, whereas SPSS was used to analyse descriptive statistics. Pearson’s correlation
coefficient and multivariate multiple linear regression were used for data analysis. Findings
were elucidated in two stages to make it easy for the readers to obtain a clear picture from the
results.
Findings Three hypotheses were tested. The results of the hypothesis demonstrated a statistically
significant and positive association between Hospital accreditation and the quality performance
(p=0.000; r = 0.536) and employees’ satisfaction (p=0.000; r = 0.354) of the Ministry of Health
and Prevention hospitals. These results demonstrate that hospital accreditation is an effective
tool for improving hospital quality performance that positively influences the satisfaction of the
employees. The third hypothesis suggested that effective governance does have a moderation

ISSN#:
318
effect on the relationship between a hospital’s accreditation and the hospital’s quality
performance as perceived by the hospital employees. When all the survey variables were
accounted for in the model, the introduction of governance factor improved the overall quality
of the model.
The qualitative findings implied that corporate governance of hospitals including effective
board structures, processes, long-range planning, financial oversight and quality oversight
might lead to better clinical outcomes, effectiveness, efficiency, patient safety culture within
hospitals, as well as improved employee satisfaction. This was also confirmed through face to
face interviews where the employees affirmed that accreditation is useful in healthcare settings
if an organization has a well-structured governing body.
The respondents in the focus group also confirmed that the governing body also played an
essential role in making the organization’s mission and vision clear to everyone, putting the
strategic and operational plan into action, facilitating the accreditation process, staff
engagement, providing the needed resources/support to employees, empowering them to
facilitate provision of resources, and in making sure that the employees are compliant with the
standards, rules, and regulations. This may serve as a vehicle to promote the voluntary uptake
of best practice, increase the satisfaction of employees and bring uniformity in quality and
safety among hospitals to achieve excellence.
Originality/value/Contribution
The study is the first to be conducted in the UAE as the factor of governance is unique. Diverse
evidence on governance mechanisms and quality performance outcomes will offer decision-
makers a better basis for planning future initiatives. This study also contributed to the
knowledge by answering the identified gaps such as moderate effect of governance. The study
also provided empirical support on the association between accreditation programs and their
impact on hospitals’ quality performance. The study should, however, be replicated in different
cultures, using different structures, and types of hospitals along with concentrating on patient
satisfaction in future to have put governance on the agenda of the health service and hospitals.
Limitations
The generalizability of the study is limited due to small sample size. More government, private
hospitals, and primary care institutions should be considered in future studies to get a more
generalizable and reliable understanding of the subjects. Due to data confidentiality, the degree
of access to the information would limit the scope of the current study.
Keywords: Accreditation; governance; United Arab Emirates (UAE); healthcare; quality
performance; employee; satisfaction.

ISSN#:
319
References
1. Aagja, J. P., & Garg, R. (2017). Measuring perceived service quality for public hospitals
(PubHosQual) in the Indian context. International Journal of Pharmaceutical and
Healthcare Marketing, 4(1), 60-83.
2. Abbasi, S., Shooshtari, S., & Tofighi, S. (2018). Developing a Conceptual Model of the
Hospital Incident Command System (HICS) Via Quality Improvement Models in Iran.
Journal of Research in Medical and Dental Science, 6(2), 257-268.
3. Abdulrahman, M., Farooq, M. M., Al Kharmiri, A., Al Marzooqi, F., & Carrick, F. R.
(2018). Burnout and depression among medical residents in the United Arab Emirates: A
Multicenter study. Journal of family medicine and primary care, 7(2), 435.
4. Ahmed, Y and Sidika K.(2014). Perceptions of nurses on the impact of accreditation on
quality of care A survey in a hospital in Turkey. Clinical Governance: An International
Journal. Vol. 19 No. 2.
5. Aspers, P., & Corte, U. (2019). What is Qualitative in Qualitative Research. Qualitative
Sociology, 1-22.
6. Dixon-Woods, M., & Martin, G. P. (2016). Does quality improvement improve
quality. Future Hospital Journal, 3(3), 191-194.
7. Doran, T., Maurer, K. A., & Ryan, A. M. (2017). Impact of provider incentives on quality
and value of health care. Annual review of public health, 38, 449-465.
8. Ehlers, L. H., Jensen, M. B., Simonsen, K. B., Rasmussen, G. S., & Braithwaite, J. (2017).
Attitudes towards accreditation among hospital employees in Denmark: a cross-sectional
survey. International Journal for Quality in Health Care, 29(5), 693-698.
9. Devkaran, S., O’Farrell, P., Ellahham, S., & Arcangel, R. (2019). Impact of repeated
hospital accreditation surveys on quality and reliability, an 8-year interrupted time series
analysis. BMJ Open, 9(2), e024514. doi: 10.1136/bmjopen-2018-024514
10. Ghareeb, A., Said, H., & El Zoghbi, M. (2018). Examining the impact of accreditation on a
primary healthcare organization in Qatar. BMC medical education, 18(1), 216.
11. Jaafaripooyan, E., Agrizzi, D., (2011), “Healthcare accreditation systems: further
perspectives on performance measures International” Journal for Quality in Health Care.
Vol 23, No. 6, pp. 645 –656

ISSN#:
320
Workers and Thermal Environment in the UAE
Maryam AL Ali, HBMSU learner#: 200106458
Introduction:
In the Arabian Gulf especially in the United Arab Emirates recruits many labors in the
construction areas and other industries, these labors are most likely from south Asia. Abu Dhabi
and Dubai rely on a huge numbers of these expertise workers, which they form more than the
third of the population. (Bates, Graham P., et al).
However, during summer seasons labors and site managers suffers from the torture of the sun,
heat and humidity and it’s known that the heat temperatures in the United Arab Emirates during
the summer days could rises to more than 45 degrees Celsius, while the humidity could be more
than 90%. (Gulfnews, 2011).
As a result of the rising temperatures of the heat in 2010 the emirate of Abu Dhabi has witnessed
(3,017) cases of heat- related illness and that’s according to an official statistics that took place
in Abu Dhabi. There are some heat injuries which they are deadly as any other severe injuries.
(Gulfnews, 2011)
Hence, these labors and site managers are exposed to heat stroke especially if they were not
hydrated enough. Heat stroke can be defined as a hyperthermia; it’s a resultant of an abnormal
high body temperature with physical and neurological symptoms. These symptoms can be
shown as form of: (Gulfnews, 2011)
• Vomiting
• Fatigue
• Nausea
• Headache
• Dizziness
• Muscle cramps
Heat stroke and the dehydration that all the labors are exposed on under the heat, consider as a
risk in the workplace which is important to discuss and debate about it. Because; it effects on
their health in the workplace and there is an urgent need to conduct risk assessment and identify
the actions that should be taken, for some cases are severe and can be fatal. Also, Comparative
risk assessment can be useful to identify the significant health problems and set priorities for
this heated environment in the management perspective.

ISSN#:
321
Goals and objectives
The objectives of this research is to study the hydration conditions for the labors who perform
physical activities in constructions and different industrial areas, which make them loose a lot
of sodium amount under the summer heat of the United Arab Emirates, which can result on
heat-related illness and severe injuries, and to check the hours that the labors could endure under
the stressful heat. (Bates, Graham P., et al). The aim of this research is to prevent the severe
injuries of heat related- illness such as heat stroke and provide safety and good health for the
labors who works under the sun heat, and to implement the method of risk assessment and to
define the ranking priorities by risk management.
Literature Review
The environmental conditions during the summer season are the harshest because of the heat,
especially in the United Arab Emirates which is known by its hot semi- arid climate. Labors
who work under these harsh environments are at risk of heat illness and they should be protected
against it. Some data has been collected to have the knowledge of the physical strain that labors
undergo through the rough heat and wither their bodies are hydrated enough. (Bates, Graham,
Schneider. 2008).
The significance of hydration
In order to tolerate the rough heat of the sun that cause a stress for the bodies of the labors, the
hydration conditions should be very high for it consider as crucial indicator for tolerance.
Because; in maintaining an adequate level of hydration the risk of getting heat illness will
minimize and it will be easier to avoid excessive fatigue. (Bates, Graham P., et al). Some of the
labors who works in the industrial areas or in the construction areas, preform physical activities
for many hours, some of them take about 12 hours per day, for six days or a week. (Holmes,
Nicola A., et al), which will result of progressive dehydration and that’s because of the large
volume of fluid loose over the work under the heat. Hence, this would put the worker at risk of
heat related illness and tough injuries. (Holmes, Nicola A., et al).
In addition, the process of evaporating the sweat is significant because of the smooth movement
of the air and the low humidity would ease the body temperature of the worker. However, since
the humidity is very high in the United Arab Emirates a large amount of sweats will run out of
the labors skin causing potential skin disorder and depleting fluid reserve. (Miller, Veronica S.,
and Graham P. Bates. 2009).
Moreover, there are factors affecting the perspiration rates such as the climate conditions, the
materials of clothing and the physical activities. (Bates, Graham, Schneider. 2008)
According to few studies showed that the hot environment can effect on the heart rate, body
temperatures and the cardiac output, which can reach to the point of exhaustion. Also, with poor
hydration can cause of increase the rate of glycogen depletion and decrease of the energy to
work. (Bates, Graham, Schneider. 2008).
Hence, the health authority of Abu Dhabi always urge for the labors to stay hydrated through
the day specially in summer season, all labor have to drink about two liters of water at least for
every two or three hours, because the human body depend on sweating to cool it down under
the heat and poor hydration would prevent it, which will result on exhaustion from the heat.
(The National, 2010).

ISSN#:
322
So, the health authority of Abu Dhabi provided some shaded areas for the labors and made a
law that during the summer seasons there is a mandatory break for the labors who works under
the sun and that’s from 12:30 pm to 3:00 pm. (The National, 2010).
Also, inspectors from the ministry of labor inspect if there are any labor working during the
break time and there are penalties issues for breaking this law which is possible closure for the
field and fines up to Dh 15,000. (The National, 2010).
To avoid these penalties, the ministry of labor had distributed some booklets with different
languages to all the business owners about the break time for the labors and some workshops
to educate about the heat stress. (The National, 2010).
Physical Exhaustion
The prolonged physical effort especially under the heat with level of humidity will result of
exhaustion and body fatigue which can be classified as local fatigue and systematic fatigue.
(Bates, Graham, Schneider. 2008).
The local fatigue can happen in high intensity work, and can be developed when the blood flow
is not enough in an active muscle, resulting to reduce the amount of Oxygen (O2) and the tissues
will increase the anaerobic metabolism and the lactic acid. (Bates, Graham, Schneider. 2008).
On the other hand, light to moderate work can be contributed to the systematic fatigue; it can
be quantified by measuring the Oxygen (O2), blood pressure, heart rate, body temperature of a
labor. (Bates, Graham, Schneider. 2008).
In addition, the World Health Organization (WHO) recommended that the average heart rate of
a worker should not exceed a (110) beats min-1. Also, exhaustion due to lack of sleep could
cause prolonged heart rate recovery after overwork under the heat. (Bates, Graham, Schneider.
2008).
During this research the Thermal Work Limit (TWL) have been used as method of
environmental risk assessment to indicate the thermal stress index during working hours, it
consider as a validate modern heat index which can predict the maximum work that can be done
at given environment, especially in hot environments it can determine the safe work periods
and providing guidelines. (Bates, Graham, Schneider. 2008).
Moreover, the Thermal Work Limit has five parameters that can be use: (Miller, Veronica, et
al)
• Dry bulb
• Wet bulb
• Glob temperature
• Wind speed
• Atmospheric pressure
Methods and Measures
Methods and measures has been taking to assess the hydration conditions for labors during
summer season which was on May, and these measures took place in Al Ain city and Abu
Dhabi, some of the labors volunteered and participated in this study which was approved by Al
Ain Medical District Human Research Ethics Committee. (Bates, Graham, Schneider. 2008).

ISSN#:
323
The labors who participated in this study were from different nationalities in south Asia such
as (India, Pakistan and Bangladesh) and they all been informed gave a written consent for this
study since it consider as a risk assessment in workplace . (Miller, Veronica, et al).
At the beginning of the study the health risk and the lifestyle behavior were gathered by making
interviews with the worker who were about 22 participants and worked in constructional area
for 12 hours shift for 6 days per week. (Bates, Graham, Schneider. 2008). The aim of this study
was to determine if the labors were experiencing any physical fatigue during these 12 hours by
using heart rate monitoring, and to define the hydration conditions for the labors, and using the
Thermal Work Limit as an index to perform a workplace heat stress risk assessment. (Bates,
Graham, Schneider. 2008).
The hydration conditions were determined by the specific gravity of the urine samples of the
participants from the beginning of their shift until the end of it. As for the heart rates each
participant wore a monitor to take the measurements of the heart rate, the participant wore these
monitors until the study ends. (Bates, Graham, Schneider. 2008). For recording the thermal
stress, it was quantified by the Thermal Work Limit (TWL) which was monitored at workplace
regularly throughout the day by using heat stress meter. (Miller, Veronica, et al).
Analysis
As for the results and the analysis for this study, it showed that the environmental stress that
been measured by the Thermal Work Limit (TWL) altered by the periods of the day, it showed
that the stress reading was lower in the morning period and late afternoon. (Bates, Graham,
Schneider. 2008).
However, it was harsher during the mid-day period, also the temperature of the labors were
constant during the study days and the heart rates as well did not alter during the shift, regardless
the increasing of the environmental thermal stress the labors weren’t feeling any physical
fatigue. (Bates, Graham, Schneider. 2008).
As for the hydration data, it showed that the labors began their work hydrated and maintained
their hydration conditions during the working hours. Hence, the results of this study illustrated
good hydration prior and at the beginning of the shift, and the labors that begin their work
hydrated they remain hydrated during the shift hours which will avoid any risk of heat related
illness. (Bates, Graham, Schneider. 2008).
Recommendations and Conclusions
It’s recommendable to have an educational program to spread awareness about the significant
of hydration and having the need to offer a practical advice to the labors who work under the
heat, and such program should contain a debate about health, safety and adequate hydration.
(Bates, Graham, Schneider. 2008).
Also, employers who asses in risk management should protect the health of their labors since
it’s from their responsibilities by ensuring a risk assessment that is implemented, where heat
risk hazard is exist and who is at risk from the heat related illness, and ensuring that the
worksites having a mid-day break during summer season as the UAE Ministry of Labor
required. (Department of health, 2019). In addition, employers should provide shaded areas for
the labors, and having medical clearance for any worker having chronic medical conditions
such as high blood pressure. (Department of health, 2019).

ISSN#:
324
As for the labors, they should involve in educational program about the importance of
maintaining a good hydration by drinking water every two to three hours and the risks of
working under the heat and recognizing the signs of heat illness. (Department of health, 2019).
In conclusion, this study showed a data that demonstrated well hydrated labors can work
without getting heat stroke or any heat related illness, and the Thermal Work Limit (TWL) it’s
validate in a controlled environment and it’s a measure of heat stress that would be appropriate
to use, it can measure all the environment parameters, it takes the clothing into consideration
and provide a metabolic rate. (Bates, Graham, Schneider. 2008). Hence, working under the
summer heat should be taken into consideration to avoid any heat related illness and the
individual should stay hydrated all the time.
References
• Bates, G. P., Miller, V. S., & Joubert, D. M. (2009). Hydration status of expatriate
manual workers during summer in the Middle East. Annals of occupational
hygiene, 54(2), 137-143.
• Bates, G. P., & Schneider, J. (2008). Hydration status and physiological workload of
UAE construction workers: A prospective longitudinal observational study. Journal of
occupational medicine and toxicology, 3(1), 21.
• Holmes, N. A., Miller, V. S., Schneider, J., Hasan, O., & Bates, G. P. (2011). Plasma
sodium levels and dietary sodium intake in manual workers in the Middle East. Annals
of occupational hygiene, 55(4), 397-402.
• Miller, V. S., & Bates, G. P. (2009). Hydration, hydration, hydration. Annals of
occupational hygiene, 54(2), 134-136.
• Miller, V., Bates, G., Schneider, J. D., & Thomsen, J. (2011). Self-pacing as a protective
mechanism against the effects of heat stress. Annals of occupational hygiene, 55(5),
548-555.