Systems Biology of Metabolism - 2021 ChE/BE 163
35
Systems Biology of Metabolism Jens Nielsen 1,2,3 1 Department of Biology and Biological Engineering, Chalmers University of Technology, SE41128 Gothenburg, Sweden; email: [email protected] 2 Novo Nordisk Foundation Center for Biosustainability, Technical University of Denmark, DK2800 Lyngby, Denmark 3 Science for Life Laboratory, Royal Institute of Technology, SE17121 Stockholm, Sweden Annu. Rev. Biochem. 2017. 86:245–75 First published as a Review in Advance on March 8, 2017 The Annual Review of Biochemistry is online at biochem.annualreviews.org https://doi.org/10.1146/annurev-biochem- 061516-044757 Copyright c 2017 by Annual Reviews. All rights reserved Keywords genome-scale metabolic models, metabolic engineering, metabolomics, proteomics, systems medicine, transcriptomics Abstract Metabolism is highly complex and involves thousands of different connected reactions; it is therefore necessary to use mathematical models for holis- tic studies. The use of mathematical models in biology is referred to as systems biology. In this review, the principles of systems biology are de- scribed, and two different types of mathematical models used for studying metabolism are discussed: kinetic models and genome-scale metabolic mod- els. The use of different omics technologies, including transcriptomics, pro- teomics, metabolomics, and fluxomics, for studying metabolism is presented. Finally, the application of systems biology for analyzing global regulatory structures, engineering the metabolism of cell factories, and analyzing hu- man diseases is discussed. 245 Click here to view this article's online features: • Download figures as PPT slides • Navigate linked references • Download citations • Explore related articles • Search keywords ANNUAL REVIEWS Further Annu. Rev. Biochem. 2017.86:245-275. Downloaded from www.annualreviews.org Access provided by Chalmers University of Technology on 06/30/17. For personal use only.
-
Upload
khangminh22 -
Category
Documents
-
view
0 -
download
0
Transcript of Systems Biology of Metabolism - 2021 ChE/BE 163

BI86CH11-Nielsen ARI 11 May 2017 14:16
Systems Biology of MetabolismJens Nielsen1,2,3
1Department of Biology and Biological Engineering, Chalmers University of Technology,SE41128 Gothenburg, Sweden; email: [email protected] Nordisk Foundation Center for Biosustainability, Technical University of Denmark,DK2800 Lyngby, Denmark3Science for Life Laboratory, Royal Institute of Technology, SE17121 Stockholm, Sweden
Annu. Rev. Biochem. 2017. 86:245–75
First published as a Review in Advance onMarch 8, 2017
The Annual Review of Biochemistry is online atbiochem.annualreviews.org
https://doi.org/10.1146/annurev-biochem-061516-044757
Copyright c© 2017 by Annual Reviews.All rights reserved
Keywords
genome-scale metabolic models, metabolic engineering, metabolomics,proteomics, systems medicine, transcriptomics
Abstract
Metabolism is highly complex and involves thousands of different connectedreactions; it is therefore necessary to use mathematical models for holis-tic studies. The use of mathematical models in biology is referred to assystems biology. In this review, the principles of systems biology are de-scribed, and two different types of mathematical models used for studyingmetabolism are discussed: kinetic models and genome-scale metabolic mod-els. The use of different omics technologies, including transcriptomics, pro-teomics, metabolomics, and fluxomics, for studying metabolism is presented.Finally, the application of systems biology for analyzing global regulatorystructures, engineering the metabolism of cell factories, and analyzing hu-man diseases is discussed.
245
Click here to view this article'sonline features:
• Download figures as PPT slides• Navigate linked references• Download citations• Explore related articles• Search keywords
ANNUAL REVIEWS Further
Ann
u. R
ev. B
ioch
em. 2
017.
86:2
45-2
75. D
ownl
oade
d fr
om w
ww
.ann
ualr
evie
ws.
org
Acc
ess
prov
ided
by
Cha
lmer
s U
nive
rsity
of
Tec
hnol
ogy
on 0
6/30
/17.
For
per
sona
l use
onl
y.

BI86CH11-Nielsen ARI 11 May 2017 14:16
Contents
1. INTRODUCTION . . . . . . . . . . . . . . . . . . . . . . . . . . . . . . . . . . . . . . . . . . . . . . . . . . . . . . . . . . . . 2462. SYSTEMS BIOLOGY AS A DISCIPLINE . . . . . . . . . . . . . . . . . . . . . . . . . . . . . . . . . . . . . . 2483. MATHEMATICAL MODELING OF METABOLISM . . . . . . . . . . . . . . . . . . . . . . . . . 250
3.1. Kinetic Models . . . . . . . . . . . . . . . . . . . . . . . . . . . . . . . . . . . . . . . . . . . . . . . . . . . . . . . . . . . . . 2503.2. Genome-Scale Metabolic Models . . . . . . . . . . . . . . . . . . . . . . . . . . . . . . . . . . . . . . . . . . . 252
4. INTEGRATIVE ANALYSIS OF OMICS DATA . . . . . . . . . . . . . . . . . . . . . . . . . . . . . . . . 2564.1. Transcriptomics . . . . . . . . . . . . . . . . . . . . . . . . . . . . . . . . . . . . . . . . . . . . . . . . . . . . . . . . . . . . 2574.2. Proteomics . . . . . . . . . . . . . . . . . . . . . . . . . . . . . . . . . . . . . . . . . . . . . . . . . . . . . . . . . . . . . . . . . 2584.3. Metabolomics . . . . . . . . . . . . . . . . . . . . . . . . . . . . . . . . . . . . . . . . . . . . . . . . . . . . . . . . . . . . . . 2594.4. Fluxomics . . . . . . . . . . . . . . . . . . . . . . . . . . . . . . . . . . . . . . . . . . . . . . . . . . . . . . . . . . . . . . . . . . 260
5. APPLICATIONS . . . . . . . . . . . . . . . . . . . . . . . . . . . . . . . . . . . . . . . . . . . . . . . . . . . . . . . . . . . . . . . 2605.1. Basic Biology . . . . . . . . . . . . . . . . . . . . . . . . . . . . . . . . . . . . . . . . . . . . . . . . . . . . . . . . . . . . . . . 2605.2. Engineering Microbial Metabolism. . . . . . . . . . . . . . . . . . . . . . . . . . . . . . . . . . . . . . . . . . 2635.3. Human Metabolism . . . . . . . . . . . . . . . . . . . . . . . . . . . . . . . . . . . . . . . . . . . . . . . . . . . . . . . . 265
1. INTRODUCTION
All life forms depend on the ability to convert nutrients into chemical species that can be usedas building blocks for macromolecules such as proteins, lipids, deoxyribonucleic acids (DNAs),ribonucleic acids (RNAs), and carbohydrates. Many cells are also producing so-called secondarymetabolites that are secreted by the cell and serve important functions such as defense and commu-nication. The set of these chemical reactions is referred to as metabolism, and most cells performthousands of different reactions, most of which are catalyzed by specific enzymes. Metabolismis typically divided into catabolism, the breakdown of carbon and energy sources to 12 precur-sor metabolites, and anabolism, the biosynthesis of building blocks and their further assemblyinto macromolecules (Figure 1a). Catabolism is associated with the generation of Gibbs free en-ergy, which is primarily captured in the high-energy phosphate bonds of adenosine triphosphate(ATP), and redox power, which is stored in reduced nicotinamide adenine dinucleotidephos-phate (NADPH) or reduced nicotinamide adenine dinucleotide (NADH). NADPH is used forthe biosynthesis of macromolecules, and NADH is oxidized either through the conversion of pre-cursor metabolites to chemicals that can be secreted by the cells, for example, by the conversionof pyruvate to lactate, or through oxidative phosphorylation (Figure 1a).
The 1920s and 1930s were the golden age of metabolism studies when many cellular metaboliteswere identified and the enzymes of all key catabolic pathways were identified. The two mostprominent examples of pathways identified during this period are the Embden–Meyerhof–Parnas(EMP) pathway, which after identification of the pathway intermediates by Otto Fritz Meyerhofbetween 1912 and 1918 was described as a complete pathway by Gustav Georg Embden in the1930s, and the Krebs cycle, also referred to as the tricarboxylic acid (TCA) cycle or the citricacid cycle, which was discovered by Hans Krebs in 1937. The EMP pathway, often referred to asglycolysis, is the most highly conserved metabolic pathway. It is present in practically all livingcells, and it most likely evolved as a series of spontaneous reactions in the prebiotic world for theconversion of glucose to pyruvate (1). In the 1950s and 1960s, many other pathways were identified,including the Leloir pathway (1951), in which galactose is converted to glucose-6-phosphate, andmany amino acid biosynthetic pathways.
246 Nielsen
Ann
u. R
ev. B
ioch
em. 2
017.
86:2
45-2
75. D
ownl
oade
d fr
om w
ww
.ann
ualr
evie
ws.
org
Acc
ess
prov
ided
by
Cha
lmer
s U
nive
rsity
of
Tec
hnol
ogy
on 0
6/30
/17.
For
per
sona
l use
onl
y.

BI86CH11-Nielsen ARI 11 May 2017 14:16
CytoplasmMitochondria
Endoplasmicreticulum
HXK
GPI
PFK
G6P
F6P
F1,6bP
Glucose
ATP
ADP
a
c d
b Glucose
G6P
F6P
F1,6bP
ATP
ADPHXK
GPI
PFK ATP
ADP
Nutrients
Precursor metabolites
Building blocks
Macromolecules
Cell
Primarymetabolites
Secondarymetabolites
ATP, NADPH NADH
NADH
NADH
ATP, NADPH
ATP
NADH NAD+
ATP
0.5 O2
Figure 1The structure and connectivity of metabolism. (a) Metabolism can be divided into catabolism, in whichnutrients are converted into a set of 12 precursor metabolites, adenosine triphosphate (ATP), andnicotinamide adenine dinucleotidephosphate (NADPH), and anabolism, in which these precursormetabolites are converted into building blocks that are further converted into macromolecules with theconsumption of ATP and NADPH. The precursor metabolites are glucose-6-phosphate (G6P),fructose-6-phosphate (F6P), ribose-5-phosphate, erythrose-4-phosphate, glyceraldehyde-3-phosphate,3-phospho-glycerate, phosphoenolpyruvate, pyruvate, acetyl-CoA, 2-oxoglutarate, oxaloacetate, andsuccinyl-CoA. There are approximately 50 building blocks, which include amino acids, fatty acids, andnucleotides. Catabolism and the biosynthesis of building blocks results in the net production of nicotinamideadenine dinucleotide (NADH), which can be consumed either through the conversion of precursormetabolites into primary metabolites or through oxidative phosphorylation, in which NADH is oxidized bymolecular oxygen via the electron transport chain and ATP is formed. Secondary metabolites are formedfrom precursor metabolites and/or building blocks, for example, amino acids. (b) A canonical pathway inmetabolism, glycolysis (top), is illustrated. (c) Illustration of how cofactors like ATP and ADP connectdifferent enzymes of glycolysis (top) into a metabolic network. (d ) Illustration of the genome-scaleconnectivity in metabolism. The network illustrated is a representation of yeast metabolism (Sanchez BJ,Zhang C, Nilsson A, Lahtvee P-J, Kerkhoven E, et al., unpublished manuscript). Green nodes aremetabolites, and the other nodes specify enzymes present in different compartments, three of which areindicated. Panel d provided by Benjamın Sanchez.. Abbreviations: F1,6bP, fructose-1,6-bisphosphate; HXK,hexokinase; GPI, glucose phosphate isomerase; PFK, phosphofructokinase.
The identification of these canonical pathways laid the foundation for how we study andunderstand metabolism today and mapped the stoichiometry of the individual reactions in thesepathways (Figure 1b). Despite 100 years of studying metabolism, however, many parts of cellularmetabolism remain unknown. For example, the transporter of pyruvate into the mitochondria,a very important step for the complete oxidation of glucose via glycolysis and the TCA cycle ineukaryotic cells, was only recently discovered (2, 3). In particular, secondary metabolism is less welldefined. Here, precursor metabolites or building blocks are converted to complex natural products
www.annualreviews.org • Systems Biology of Metabolism 247
Ann
u. R
ev. B
ioch
em. 2
017.
86:2
45-2
75. D
ownl
oade
d fr
om w
ww
.ann
ualr
evie
ws.
org
Acc
ess
prov
ided
by
Cha
lmer
s U
nive
rsity
of
Tec
hnol
ogy
on 0
6/30
/17.
For
per
sona
l use
onl
y.

BI86CH11-Nielsen ARI 11 May 2017 14:16
that cells use for communication or defense (Figure 1a). Secondary metabolism is extremelydiverse, and plants and microorganisms have the ability to produce a wide range of differentnatural products, several of which are useful as pharmaceuticals, food ingredients, and pesticides.
Even though metabolism is traditionally organized into canonical pathways, there is a veryhigh degree of connectivity among different reactions. A very large number of metabolic reactionsuse ATP, NADH, and NADPH, and the common usage of these cofactors ties together reactionsthat are otherwise parts of different canonical pathways (Figure 1c). The 12 precursor metabolitesare also used in a large number of reactions, and glutamate and glutamine are used as aminodonors in a large number of reactions involved in the biosynthesis of amino acids and nucleotides.Thus, in yeast, >10% of all metabolites participate in more than 10 reactions each, and >4% areinvolved in more than 20 reactions. ATP participates in >180 reactions; NADPH participatesin approximately 80; and glutamate participates in approximately 70 (4). Metabolism is thereforehighly connected and consequently forms a very dense biological network (Sanchez BJ, ZhangC, Nilsson A, Lahtvee P-J, Kerkhoven E, et al., unpublished manuscript) (Figure 1d ). This highdegree of connectivity has a significant impact on metabolism and, concomitantly, makes the studyof the individual parts of metabolism difficult because perturbing a single metabolic pathway mayimpact the function of a large part of the complete network.
The high degree of connectivity in metabolism has three major implications. First, to ensurethe proper function of cells, it is important to balance the activity of the many different metabolicpathways to the needs of the cell, for example, the need for building blocks, Gibbs free energy,and redox power. This balancing is generally referred to as the homeostasis of metabolism. Withthe high degree of connectivity of the many different cellular pathways, it is necessary to haveextensive regulation at different levels, that is, at the levels of transcription, translation, and en-zymatic function. All cells have therefore evolved complex regulatory systems that attempt toensure metabolic homeostasis even when exposed to widely varying environmental conditions,including stress. The dysfunction of these regulatory systems has major implications for the cell,and thus there is much interest in studying them. Second, with the high degree of connectivityand the extensive regulation imposed to maintain homeostasis, it is inherently difficult to engi-neer metabolism, for example, to engineer microorganisms for the production of chemicals to beused as fuels, materials, and pharmaceuticals. Third, because of the high degree of connectivityin metabolism, it is difficult to obtain mechanistic insight into the underlying causes for manyhuman metabolic diseases. However, this connectivity also means that almost any perturbation incellular function will lead to an altered metabolism and therefore result in a metabolic signature.Studies of how metabolic networks respond to the development of human disease may thereforelead to the identification of novel biomarkers and to new therapeutic opportunities.
Here, three aspects of metabolism will be discussed, namely, global regulation, engineering ofmetabolism, and human metabolism in response to disease. This will be prefaced with a descriptionof the concepts of systems biology, which in short is the use of mathematical models to studybiological systems, followed by a discussion of how different types of mathematical models can beused to obtain a holistic understanding of metabolism. Much focus will be on studies of the yeastSaccharomyces cerevisiae and the bacterium Escherichia coli, as they are probably the best studiedorganisms in terms of metabolism.
2. SYSTEMS BIOLOGY AS A DISCIPLINE
Systems biology has evolved as a scientific discipline in which computational and mathematicalmodeling is used to study biological systems (5). These systems typically involve complex metabolicnetworks, as illustrated in Figure 1d, or signaling networks with a similar complexity. Systems
248 Nielsen
Ann
u. R
ev. B
ioch
em. 2
017.
86:2
45-2
75. D
ownl
oade
d fr
om w
ww
.ann
ualr
evie
ws.
org
Acc
ess
prov
ided
by
Cha
lmer
s U
nive
rsity
of
Tec
hnol
ogy
on 0
6/30
/17.
For
per
sona
l use
onl
y.

BI86CH11-Nielsen ARI 11 May 2017 14:16
biology uses a holistic approach that studies the complete system, as opposed to molecular biology,which focuses on subsystems often studied via in vitro experiments (6). Another characteristic ofsystems biology is that it involves quantitative analysis, unlike the largely qualitative nature ofmolecular biology that focuses on hypothesis testing, which is used to determine whether a given(verbal) model describing the system is true or false (6). Despite the different approaches, systemsbiology is highly dependent on the extensive biological information that has been acquired throughmolecular biology, and systems biology studies often result in the generation of hypotheses thatrequire confirmation using a reductionist approach.
There are two different approaches to systems biology (7): in top-down systems biology, dif-ferent types of high-throughput generated data, often referred to as omics data, are analyzed inan integrative fashion, and in bottom-up systems biology, detailed models for specific processes,for example, enzymatic reactions, are assembled into a model describing the system being studied.The two approaches are complementary; top-down systems biology is useful for mapping cellu-lar functions at the genome scale, whereas bottom-up systems biology enables detailed timescaleresolution of the impact of individual components on overall system properties. Both approachesallow the identification of what are often referred to as the emergent properties of the biologicalsystem, that is, how the interactions between the many different cellular components give rise tobiological functions that cannot be identified through a reductionist approach.
Bottom-up systems biology is in essence an older approach that developed from theoreticalbiology. In the 1950s and 1960s, systems theory was already being used to study biological systems,with Denis Noble’s (8) computer model describing the function of the heart pacemaker being alandmark study. In the late 1960s and early 1970s, two lines of research led to the developmentof rigorous mathematical frameworks that today form the fundamentals of bottom-up systemsbiology. One approach was driven by chemical engineers who translated reaction engineeringprinciples to model biological systems, with the main objective being to improve industrial fer-mentation process designs. This research was driven primarily by Arnold Fredrickson and HenryTsuchiya (9) at the University of Minnesota, who developed an extensive modeling frameworkfor cellular growth models.
The other line of research was driven by biochemists/biophysicists who were seeking to under-stand complex biological processes, such as signaling pathways and metabolic pathways, throughthe use of mathematical modeling. A key driver was Reinhart Heinrich at Humboldt University.In 1974, he and Tom Rapoport (10) described a modeling framework that allowed the quantifica-tion of flux control in metabolic pathways. A few months earlier, Henrik Kacser at the Universityof Edinburgh had published a similar mathematical framework with the same objective (11), andthese two frameworks have now been combined into what is referred to as metabolic controlanalysis (MCA). MCA has since been significantly developed, particularly by Hans Westerhoffand Douglas Kell (12), and today is widely used as a conceptual framework for studying cellularprocesses and for classroom illustration of how fluxes are controlled in metabolic pathways.
A major limitation to the application of these modeling frameworks has been access to high-quality experimental data. The genomics revolution not only resulted in the provision, for thefirst time, of complete lists of components of the living cells but also resulted in the developmentof a number of high-throughput experimental techniques that formed the basis for establishingtop-down systems biology. This type of omics data provides a wealth of information about the cell,in particular, when it is obtained for cells grown in different conditions. However, the difficultyof gaining biological information from gene lists was soon realized, and this led to the annotationof genes into functional groups, with gene ontologies (GO) as the most important contribution(13). A breakthrough in the analysis of omics data occurred when these data were analyzed inthe context of annotated biological networks, as illustrated in a study of the galactose regulon of
www.annualreviews.org • Systems Biology of Metabolism 249
Ann
u. R
ev. B
ioch
em. 2
017.
86:2
45-2
75. D
ownl
oade
d fr
om w
ww
.ann
ualr
evie
ws.
org
Acc
ess
prov
ided
by
Cha
lmer
s U
nive
rsity
of
Tec
hnol
ogy
on 0
6/30
/17.
For
per
sona
l use
onl
y.

BI86CH11-Nielsen ARI 11 May 2017 14:16
yeast by Trey Ideker and coworkers (14). This led to the coining of the term systems biology byLeroy Hood (15) and Hiroaki Kitano (16, 17), who independently established the first institutesfor systems biology in Seattle and Tokyo, respectively, in 2000. Today, systems biology finds wideapplication in basic studies of biology, engineering cells for the production of valuable chemicals,and understanding the molecular mechanisms underlying complex human diseases.
3. MATHEMATICAL MODELING OF METABOLISM
Mathematical models used to describe natural phenomena are generally referred to as laws ofnature. However, they are also widely used by engineers to design complex physical systems.One key advantage of using mathematical models is that they can capture information in a veryconcise way, as is very well illustrated by the Michaelis–Menten equation for enzyme kinetics thatessentially describes the kinetics of an enzyme using two key parameters. Mathematical models asa consequence are widely used in biology. However, as there are many aspects of cellular functionthat are unknown—not just the known-unknowns but even the unknown-unknowns—it has notbeen possible to build all cellular processes into a comprehensive mathematical model for a livingcell. There have, however, been several attempts to build whole-cell models. The most notableof these attempts are (a) the so-called Cornell model for E. coli, developed by Mike Shuler (18) inthe 1970s, which described cellular functions by 14 (later expanded to 20) key variables; (b) the E-CELL model, also for E. coli, developed by Masaru Tomita (19) in the 1990s, which allows the userto simulate cellular functions based on specific inputs; and (c) a model for Mycoplasma genitalium,developed by Markus Covert (20) and published in 2012, which represents the most comprehensivemathematical model for a whole cell. This latter model captures many key biological processesand enables the simulation of the linkage between metabolism and other biological processesinvolved in cellular growth, but it is still based on a coarse description of the different biologicalprocesses. This coarseness is inherent to mathematical models as they are an abstraction of the realsystem, and their key value is in testing hypotheses in biological systems that are represented in asimplified manner. A “complete” mathematical description of a biological system may be of lessuse, as illustrated in the dialogue with Mein Herr about the value of maps in the book Sylvie andBruno Concluded by Lewis Carroll (1893): “‘And then came the grandest idea of all! We actuallymade a map of the country, on the scale of a mile to the mile!’ ‘Have you used it much?’ I enquired.‘It has never been spread out, yet,’ said Mein Herr: ‘the farmers objected: they said it would coverthe whole country, and shut out the sunlight! So we now use the country itself, as its own map,and I assure you it does nearly as well.’” Therefore, in biology, mathematical models do not aimto reconstruct all elements of the system studied but are instead used as research tools for gainingnew insight and assisting in the design of experiments.
There are many different types of mathematical models, but for describing metabolism, thesecan be divided into two groups: kinetic models and stoichiometric models (or constraint-basedmodels).
3.1. Kinetic Models
Through evolution, enzymes have fine-tuned their kinetic parameters to coordinate the distri-bution of fluxes emerging from the networks of metabolic reactions. From an analysis of thedistribution of kcat values for all enzymes in metabolism, it was found that enzymes involved incentral carbon metabolism have the highest kcat values, followed by enzymes of biosynthetic path-ways (e.g., amino acid biosynthesis), whereas enzymes involved in secondary metabolism havethe lowest kcat values (21; Sanchez BJ, Zhang C, Nilsson A, Lahtvee P-J, Kerkhoven E, et al.,
250 Nielsen
Ann
u. R
ev. B
ioch
em. 2
017.
86:2
45-2
75. D
ownl
oade
d fr
om w
ww
.ann
ualr
evie
ws.
org
Acc
ess
prov
ided
by
Cha
lmer
s U
nive
rsity
of
Tec
hnol
ogy
on 0
6/30
/17.
For
per
sona
l use
onl
y.

BI86CH11-Nielsen ARI 11 May 2017 14:16
unpublished manuscript). This finding is consistent with the typical flux requirements for cellgrowth; that is, higher fluxes are needed in central carbon metabolism, which provides energy andprecursor metabolites, than in the biosynthesis of vitamins and cofactors. Enzymes of central car-bon metabolism most likely also evolved earlier than enzymes of secondary metabolism and thushave had more time to acquire higher efficiency. Despite generally high kcat values for enzymesin central carbon metabolism, it is interesting to note that they cover more than four orders ofmagnitude, that is, from approximately 1 to 20,000 per second (22).
The proper function of a metabolic pathway requires that the metabolite levels be adjustedsuch that flux through each of the enzymes in the pathway is balanced. If not, there will be a rapidincrease in the level of certain metabolites, which could have detrimental effects on the overallfunction of the pathway. Metabolite levels are to a large extent determined by the environmentalconditions but also by the kinetic parameters of the enzymes. Typically, only a few enzymes ina pathway are regulated allosterically, but this type of regulation is very important for pathwayfunction; for example, in amino acid biosynthesis, there is extensive feedback regulation to ensure abalanced supply of the different amino acids required for protein synthesis. There have been manystudies on the kinetics of enzymes, and much of this information is collected in the BRENDAdatabase (http://www.brenda-enzymes.org).
However, most of these studies are based on in vitro analyses using purified enzymes, andfor some enzymes, the resulting kinetic expression is quite complex, for example, for phospho-fructokinase, which has several allosteric regulators. In pioneering studies on the mathematicalmodeling of the glycolysis of yeast and E. coli headed by Matthias Reuss (23, 24), it was neces-sary to significantly adjust parameters for enzyme kinetics determined in vitro to allow for thefunctional simulation of glycolysis. The authors validated their model using dynamic chemostatexperiments in which all glycolytic intermediates, ATP, ADP, and AMP, were measured at atimescale resolution of seconds, for 3 min. They observed that certain glycolytic intermediatesrapidly acquired new pseudosteady state levels; for example, in yeast, fructose-1,6-bisphosphateand phosphoenolpyruvate changed rapidly in the first few seconds, whereas other metabolitesacquired a new pseudosteady state after 2–3 min (23). The detailed metabolite measurementswere then used to build a kinetic model for glycolysis, and a key finding was that much of theallosteric regulation identified from in vitro studies does not seem to play a role in the studiedconditions (23). This implies that many enzymes have evolved allosteric regulation to cope withextreme conditions, whereas normal environmental conditions do not require all elements of thisregulation.
This finding of course has important implications for the mathematical modeling of metabolismbecause it may be possible to significantly simplify kinetic expressions and still preserve the properfunction of complete metabolic pathways. Another key finding from this study on yeast glycolysiswas that flux control seems to reside in glucose transport, which is consistent with earlier findingsthat the overexpression of glycolytic enzymes does not result in increased glycolytic flux either en-zyme by enzyme or in combination (25, 26). However, increasing the drain of ATP—for example,by adding a weak organic acid such as benzoic acid that causes decoupling of the plasma mem-brane pH gradient—is known to increase glycolytic flux in yeast, a phenomenon often referredto as metabolic pull. Similarly, in Lactococcus lactis, introduction of an additional ATP-consumingreaction via expression of F1-ATPase also increased glycolytic flux by increasing ATP demand (27).
The important role of ATP in controlling glycolytic flux has been elegantly illustrated usinga simple kinetic model by Bas Teusink (28). Similar to other catabolic pathways, glycolysis ischaracterized by first requiring the activation of substrates through phosphorylation. Investedenergy is then recouped downstream in the pathway to result in a net production of 2 moles of ATPper mole of glucose converted to pyruvate. If there is a rapid increase in glycolytic flux, for example,
www.annualreviews.org • Systems Biology of Metabolism 251
Ann
u. R
ev. B
ioch
em. 2
017.
86:2
45-2
75. D
ownl
oade
d fr
om w
ww
.ann
ualr
evie
ws.
org
Acc
ess
prov
ided
by
Cha
lmer
s U
nive
rsity
of
Tec
hnol
ogy
on 0
6/30
/17.
For
per
sona
l use
onl
y.

BI86CH11-Nielsen ARI 11 May 2017 14:16
if yeast is transferred from conditions with glucose limitation to conditions with excess glucose,complete drainage of ATP can occur, leading to substrate-accelerated death or stuck fermentation.Yeast is very capable of handling such changes, and this capability can be demonstrated using asimple mathematical model for key glycolytic reactions. Teusink (28) showed that this can beexplained by the feedback inhibition of hexokinase by trehalose-6-phosphate (T6P), producedfrom G6P by T6P synthase (Tps1p). This role of Tps1p could explain why a yeast strain withTPS1 deletion cannot grow when glucose is in excess; it simply accumulates hexose phosphatesand rapidly consumes ATP and inorganic phosphate (29).
With a so-called turbo design, in which energy is initially invested to obtain even more energylater, glycolytic flux must be balanced with ATP consumption, and if there is no initial “brake”on glycolysis, that is, the feedback regulation of hexokinase, then a sudden shift to excess glucoseresults in imbalance. Mammalian cells do not have trehalose biosynthesis and therefore do not havethis feedback regulation. Instead, they inhibit hexokinase by G6P, which appropriately handlesthe relatively small perturbations in glucose concentrations observed by these cells. However,for the large perturbations that yeast may experience, it is necessary to have a more complexfeedback loop such as the one involving T6P. Recently, Teusink and coworkers (30) performed afar more thorough analysis of the TPS1 deletion mutant, including a more detailed mathematicalmodel, and found that the mutant could operate with stable glycolysis under the right initialconcentrations of glycolytic intermediates. The extensive analysis of the TPS1 deletion mutant,involving mathematical modeling, metabolic flux analysis, and metabolome analysis, is an excellentexample of how mathematical modeling can contribute to novel physiological insight (31).
Another seminal example of how kinetic modeling can be used to gain insight into metabolismis a joint study by the groups of Edda Klipp and Stefan Hohmann (32) on how the Hog1ppathway is involved in the regulation of glycerol production in response to osmotic stress in yeast.Hog1p is a mitogen-activated protein (MAP) kinase that regulates the expression of genes involvedin stress tolerance, including genes associated with the production of glycerol as an osmoprotectant.As with other MAP kinases, Hog1p is activated by a kinase cascade involving a series of kinases(MAPK kinase and MAPKK kinase); Heinrich (33) had earlier shown, using a simple modelingscheme, that such a cascade of kinases and associated phosphatases allows for a delay in the onset ofregulation in response to environmental changes. This creates stability if there are rapid changesin environmental conditions and therefore explains the evolution of kinase cascades in manysignal transduction pathways. In their model of the Hog1p pathway, Klipp and coworkers (32)combined a model for the Hog1p kinase cascade with a gene expression module, a metabolismmodule describing a few key enzymatic reactions, a phosphorelay module responsible for activatingthe Hog1p pathway, and finally, a module describing biophysical changes in the cell, such as waterflow across the cytoplasmic membrane. Upon combining these different modules into a coherentmodel, it was possible to simulate the dynamic response of yeast cells to osmotic stress in greatdetail and even to predict the metabolic effects of deleting key metabolic genes (32). Their modelwas later expanded to include more features and could then be used to follow how osmostressrapidly reroutes glycolytic flux towards glycerol (34).
3.2. Genome-Scale Metabolic Models
Genome-scale metabolic models (GEMs) are in silico reconstructions of the complete metabolismof a given organism (Figure 2). These models are built in a bottom-up approach in which genomeinformation is combined with knowledge about the metabolic capabilities of the cell to reconstructa complete metabolic map. In this map, the stoichiometry of each metabolic reaction is specified,including specification of the cofactor usage, and each metabolic reaction is linked to an enzyme.
252 Nielsen
Ann
u. R
ev. B
ioch
em. 2
017.
86:2
45-2
75. D
ownl
oade
d fr
om w
ww
.ann
ualr
evie
ws.
org
Acc
ess
prov
ided
by
Cha
lmer
s U
nive
rsity
of
Tec
hnol
ogy
on 0
6/30
/17.
For
per
sona
l use
onl
y.

BI86CH11-Nielsen ARI 11 May 2017 14:16
S =
–1 0 0 0 01 –1 0 0 00 1 –1 0 00 0 1 0 0
–1 1 0 0 00 0 0 –1 1. . . . .. . . . .
Reactions
Metabolites
GEM
M1
ν1 = ν2 + ν3
ν1
ν1
ν2 ν2
ν3 ν3
Computational analysis
Model reconstruction
Literature Databases Genome
Use of GEMs
NetworkcomparisonLoss and gainof function
PhysiologicalanalysisEssentialityanalysis (genes,substrates, etc.)
Omics analysisIdentification ofnoncanonicalreporter pathways
MetabolicengineeringGuiding design ofoptimal metabolicnetworks
Time
TCA cycle
Figure 2The concept of genome-scale metabolic models (GEMs). GEMs are reconstructed using information fromthe literature, databases, and an annotated genome sequence. The GEM is represented by a metabolicnetwork and by a stoichiometric matrix, which can be used for computational analysis. Here, flux balanceanalysis, in which the fluxes around each metabolite are balanced, is used and allows for the identification ofa feasible flux space (blue cone). A reconstructed GEM can be used for topology (or network) comparison(e.g., between healthy and diseased cells); physiological analysis (e.g., the simulation of growth andperforming essentiality analysis); integrative analysis of omics data, in which the GEM is used as a scaffoldfor identifying reporter pathways and/or reporter metabolites; and identification of metabolic engineeringtargets (i.e., reactions that should be added to or removed from the network to improve the production of aspecific chemical). Abbreviation: TCA, tricarboxylic acid.
Thus, the model provides gene-protein–reaction connectivity, which allows for a direct link be-tween the genotype and metabolic capability. Bernhard Palsson and coworkers reconstructed thefirst GEMs for Haemophilus influenzae (35), E. coli (36), and Helicobacter pylori (37). Shortly there-after, a GEM was reconstructed for S. cerevisiae, which was the first GEM for a eukaryotic organism(38, 39).
Today, GEMs have been reconstructed for a large number of microorganisms (40) coveringall key phylogenetic groups (41), various plants (42), mammalian model organisms such as themouse, and human cells, as discussed below. The process of GEM reconstruction often results inthe identification of nonannotated parts of metabolism, and it is therefore a driver of biologicaldiscovery and/or the curation of conflicting experimental data. Table 1 summarizes key char-acteristics of GEMs for a few microorganisms (42–47). A particular strength of these models is
www.annualreviews.org • Systems Biology of Metabolism 253
Ann
u. R
ev. B
ioch
em. 2
017.
86:2
45-2
75. D
ownl
oade
d fr
om w
ww
.ann
ualr
evie
ws.
org
Acc
ess
prov
ided
by
Cha
lmer
s U
nive
rsity
of
Tec
hnol
ogy
on 0
6/30
/17.
For
per
sona
l use
onl
y.

BI86CH11-Nielsen ARI 11 May 2017 14:16
Table 1 Properties of key microbial genome-scale models
Organism No. of genesNo. of
reactionsNo. of
metabolitesNo. of
compartments Reference
Haemophilus influenzae — 488 343 2 35
Escherichia colia 1,366 2,251 1,136 3 43
Saccharomyces cerevisiaeb 916 3,493 2,218 14 44
Aspergillus niger 871 2,240 782 3 45
Penicillium chrysogenum 1,006 1,471 1,235 4 46
aMost recently updated model. Several models presented in the past (47).bYeast 7.0. The large number of metabolites is due to an expansion of lipid metabolism. Continuously updated at http://yeast.sf.net. Previous modelsdiscussed in Reference 48.
that they represent a knowledge base; that is, extensive information can be collected, and whenmore information is obtained, the models can be expanded to include additional reactions or ad-ditional cellular compartments. Thus, many GEMs have been updated/expanded, and for E. coliand S. cerevisiae, there is a continuous advancement in the coverage of these models. The mostrecent GEM for E. coli, updated based on new experimental data obtained from the phenotypicscreening of 1,075 knockout strains, comprises 1,366 genes, 2,251 metabolic reactions, and 1,136unique metabolites (43). Several different research groups have been involved in expanding theyeast GEM, resulting in the establishment of a consensus GEM (49). This consensus yeast GEMhas been further expanded and is now continuously updated by a community effort (44, 50); thus,it is a continuously expanding knowledge base for yeast metabolism (48).
GEMs can be used for simulations based on the concept of flux balance analysis (FBA). FBAis an old modeling concept that was first used in 1979 by Shuichi Aiba, a pioneer of biochemicalengineering, for the analysis of citric acid production using a simple metabolic network (51). Severaldifferent research groups took this concept further for the analysis of more complex metabolicnetworks. David Fell (52), while studying human adipocyte metabolism in the late 1980s, was thefirst to use FBA together with linear programming to quantify metabolic capabilities of a metabolicnetwork. Through linear programming, it is possible to simulate metabolic network operation evenfor very large networks. Indeed, Palsson (53) showed that FBA can be used to simulate the entiremetabolic capabilities of E. coli using a GEM. FBA relies on balancing metabolic fluxes aroundeach of the metabolites in the network, resulting in a set of constraints on the metabolic fluxes(Figure 2). When this balancing is combined with an appropriate objective function, a solutioncan be identified using linear programming. The most frequently applied objective function is themaximization of growth, which works very well for microorganisms, but other objective functionshave also been evaluated, such as maximizing ATP production (54).
GEMs have found a number of different applications (55) (Figure 2); for example, they canbe used directly to compare the metabolic capabilities between different cells. This comparisonis relevant in biotechnology, in which it is important to choose the right cell factory for theproduction of a given chemical, but it is also valuable in studies of human metabolism, for example,for comparison of the metabolic capabilities of a cancer cell with those of its predecessor celltype. GEMs can also be used for physiological analyses, which involve the evaluation of geneessentiality, growth on different substrates, the ability to produce different metabolites, and so on.In the first GEM reconstructions, it was important to validate the models against physiologicaldata, and these models provided relevant new insight into metabolic redundancies and explainedthe nonessentiality of many genes. Furthermore, the models also provided insight into the cellular
254 Nielsen
Ann
u. R
ev. B
ioch
em. 2
017.
86:2
45-2
75. D
ownl
oade
d fr
om w
ww
.ann
ualr
evie
ws.
org
Acc
ess
prov
ided
by
Cha
lmer
s U
nive
rsity
of
Tec
hnol
ogy
on 0
6/30
/17.
For
per
sona
l use
onl
y.

BI86CH11-Nielsen ARI 11 May 2017 14:16
ability to grow on different carbon and energy sources, and an analysis of E. coli showed thatthere is a remarkable higher model-predicted growth rate on glycerol than what is experimentallyobserved (56). This deviation could be explained by the fact that GEMs do not consider regulatoryconstraints on metabolism, but it also clearly shows that E. coli has the metabolic capacity to growfaster on glycerol. This was confirmed through adaptive laboratory evolution (ALE) in whichE. coli could be evolved to increase their specific growth rate on glycerol, reaching a value consistentwith the model prediction (56).
This important finding provides three very important messages: (a) GEMs provide the totalmetabolic capabilities of a cell, but regulatory constraints may reduce this; (b) through ALE,it is possible for microorganisms to acquire new metabolic phenotypes that are consistent withGEM predictions; and (c) applying growth optimization as an objective is generally applicable forsubstrates encountered in the environmental niche of the organism but not for other substrates,for example, glycerol for E. coli. Work by Uwe Sauer (57) on Bacillus subtilis further demonstratesthat regulation in bacteria often results in the suppression of growth on certain substrates, as theauthors found that the deletion of various genes involved in regulation results in faster growth.
Even though GEMs basically rely on stoichiometric constraints, it is possible to add kineticinformation about individual enzymes and thereby further constrain the flux through the individ-ual reactions. However, it is challenging to add detailed kinetic expressions for all the reactions inGEMs without violating stoichiometric, thermodynamic, or physiological constraints. By usingan advanced computational framework, Vassily Hatzimanikatis and coworkers (58) demonstratedhow an E. coli GEM can be reduced to 146 intracellular reactions that still capture the completemetabolism. With this reduced model, they incorporated enzyme kinetics and thereby determinedmetabolite concentration ranges, which allowed the direct integration of metabolomics data (58).This analysis suggests that enzymes in metabolic networks have evolved to operate at differentlevels of saturation, which may give more flexibility and robustness to metabolic networks (58).The integration of kinetics into GEMs has also been demonstrated for a reduced model of yeast(22). Using a model covering central carbon metabolism, the enzyme concentration allocated foreach reaction was estimated using the kcat value. By constraining the total protein mass within thecell, this reduced model could predict the Crabtree effect in yeast, namely, overflow metabolism toethanol (22). The analysis explains the intriguing usage of the energetically less efficient fermenta-tion route, which generates only 2 moles of ATP per mole of glucose, instead of the energeticallymore efficient respiratory route, which generates approximately 20 moles of ATP per mole ofglucose: The amount of ATP that can be produced per gram of protein is lower when usingthe catalytically inefficient components of oxidative phosphorylation, particularly the F1F0-ATPsynthase (22).
Although GEMs focus primarily on metabolism, there have been recent attempts to expandthis modeling concept to allow description of protein synthesis and other cellular processes. Forexample, Palsson (59) developed a modeling framework that allows description of protein synthesisfor all E. coli enzymes and thereby links the metabolic network with transcription and translation.To integrate the usage of enzymes in the different metabolic reactions, a pseudostoichiometriccoefficient was used that was determined by an average kcat for all the metabolic enzymes. Theexpanded model contains a total of 76,589 reactions and has been shown to have greatly improvedpredictive power. In another study, protein structure information was incorporated into an E. coliGEM, allowing for the correct prediction of growth at different temperatures (60). It is also possibleto include nonchemical transformation processes into GEMs, as illustrated with a model describingthe protein secretory pathway of S. cerevisiae (61). This protein secretory model accounts for thetranslocation of proteins between different compartments, such as from endoplasmic reticulum toGolgi, and for posttranslational modification processes, such as folding and glycosylation. Using
www.annualreviews.org • Systems Biology of Metabolism 255
Ann
u. R
ev. B
ioch
em. 2
017.
86:2
45-2
75. D
ownl
oade
d fr
om w
ww
.ann
ualr
evie
ws.
org
Acc
ess
prov
ided
by
Cha
lmer
s U
nive
rsity
of
Tec
hnol
ogy
on 0
6/30
/17.
For
per
sona
l use
onl
y.

BI86CH11-Nielsen ARI 11 May 2017 14:16
a
d Saccharomyces cerevisiae
Escherichia coli
Metabolicregulation
Transcriptionalregulation
Posttranslationalregulation
Subnetwork
Network TRN
Metabolite networks
b c
cRP
NRG1 INO4SKN7
SWI6
MBP1FKH2
FKH1ABF1
Externalconcentrations
Signalingnetwork
Expression regulation
Enzymes
Translation
Transcription
Figure 3Illustration of different levels of metabolic control, integrative analysis, and transcription factor networks(TRNs). (a) The activity of an enzyme is determined by transcriptional regulation, posttranslationalregulation, and metabolic regulation. (b) Overlaying transcription or proteome data on a biological networkallows the identification of coregulated subnetworks. The significance of a change in gene expression/protein level is indicated by color; dark gray indicates high significance. (c) TRNs can be used to identifyreporter transcription factors (red ), and similarly, metabolic networks can be used to identify reportermetabolites ( green). (d ) Genome-scale TRNs for Saccharomyces cerevisiae and Escherichia coli. Panel b adaptedwith permission from Reference 73.
this model, it was possible to calculate the exact metabolic needs for the secretion of differentproteins and thereby gain insight into how protein secretion is linked to metabolism (61).
4. INTEGRATIVE ANALYSIS OF OMICS DATA
The availability of high-throughput experimental techniques, often referred to as omics tech-niques, has allowed a more in-depth study of metabolism. In particular, it has become possible tobegin to address the general question of how metabolic fluxes are controlled (Figure 3a), that is,at the transcriptional, translational, and posttranslational levels and/or at the level of metabolite–enzyme interactions. Analysis of omics data is traditionally performed using statistical and clus-tering methods, but these analytical methods are inherently naıve with respect to the underlyingbiology. Using biological networks for integrative analysis has made it possible to identify partsof large networks that are coregulated (62) (Figure 1b). In this context, metabolic networks aretherefore well suited because they are reconstructed using detailed biochemical information (63).Other biological networks, including GO annotations that also reveal connections between genes,
256 Nielsen
Ann
u. R
ev. B
ioch
em. 2
017.
86:2
45-2
75. D
ownl
oade
d fr
om w
ww
.ann
ualr
evie
ws.
org
Acc
ess
prov
ided
by
Cha
lmer
s U
nive
rsity
of
Tec
hnol
ogy
on 0
6/30
/17.
For
per
sona
l use
onl
y.

BI86CH11-Nielsen ARI 11 May 2017 14:16
can also be used to identify gene-enrichment groups or reporter features (63, 64) (Figure 3c), forexample, reporter metabolites or reporter transcription factors. Many of these techniques can beeasily implemented by employing the statistics programming language R, and many bioinformat-ics packages are available through Bioconductor (http://www.bioconductor.org), including thePIANO package for the identification of reporter features (65).
4.1. Transcriptomics
Today, transcription analysis is predominantly performed using RNA sequencing, a techniquethat has become possible with next-generation sequencing, but originally, DNA (or oligo) arrayswere used. In the first study that described the development of this technology, the global re-programming of yeast metabolism during the diauxic shift from growth on glucose to growth onethanol was shown (66). The genome-wide transcription analysis showed for the first time howthis change involves the upregulation of a large number of genes in the TCA cycle and respira-tion and the downregulation of genes in glycolysis (66). Following this study, DNA arrays andRNA sequencing have been used to study changes in metabolism in many different organisms,but due to the high degree of connectivity in metabolism, it is often difficult to learn new biology.It was therefore a breakthrough when the utility of GEMs, in performing integrative analysis oftranscription data, was demonstrated. In most likely the first approach to integrate omics datawith GEMs, my group used transcription data to constrain fluxes in the metabolic network andthereby improved the predictive strength of yeast GEM simulations (67). Shortly thereafter, wedemonstrated how the network property of GEMs could be used for integrative analysis to findcoregulated subnetworks and reporter metabolites that are hot spots in the metabolic networkin terms of transcriptional changes in response to a certain perturbation (61). Since then, manyother methods have been developed for the integration of transcription data into GEMs (68).With the expansion of GEMs to cover descriptions of protein synthesis in E. coli, it is possible todirectly integrate gene expression data as input for simulations. This approach has proved to allowsignificantly improved model predictions, for example, for growth on different carbon sources andoverflow metabolism, which results in acetate production during rapid growth on glucose (69).
Control of gene transcription can be explored by deletion of a given transcription factor (TF)and quantifying genome-wide expression, or determining TF binding to the promoter region ofspecific genes. The first approach gives a direct answer about the effect of a given TF on thecellular phenotype, but it is difficult to interpret the results as TFs interact with each other; thatis, they may influence the expression of other TFs, and the binding of multiple TFs to the samepromoter can occur. This complexity was illustrated in a large study by Sauer and colleagues (70),who quantified transcription and metabolic fluxes in 119 TF yeast deletion mutants under fivedifferent growth conditions. From their multiomics data, the authors mapped how different TFsinteract in controlling TCA cycle activity and reconstructed a signaling cascade underlying thiscontrol (70). The second approach, determining TF binding to the promoter region of specificgenes, provides direct information about TF binding, but this does not necessarily correlate withthe control of transcription. TF binding can be determined by chromatin immunoprecipitation(ChIP) followed by the identification of the bound DNA, either by hybridization to DNA arrays(ChIP-chip) or by sequencing (ChIP-seq). ChIP-chip was first used for mapping TF binding inyeast (71), and to date, these data remain the most valuable resource for TF regulation of geneexpression for this organism. One key finding from this analysis was that TF binding is extremelycomplex in eukaryotic cells. Some TFs have more than 2,500 targets (72), and many TFs targetthe expression of other TFs, resulting in a highly connected transcription factor network (TRN)(73). The ChIP-chip data are limited by the fact that only a single environmental condition was
www.annualreviews.org • Systems Biology of Metabolism 257
Ann
u. R
ev. B
ioch
em. 2
017.
86:2
45-2
75. D
ownl
oade
d fr
om w
ww
.ann
ualr
evie
ws.
org
Acc
ess
prov
ided
by
Cha
lmer
s U
nive
rsity
of
Tec
hnol
ogy
on 0
6/30
/17.
For
per
sona
l use
onl
y.

BI86CH11-Nielsen ARI 11 May 2017 14:16
studied. By mapping TF binding at different growth conditions, my group recently showed thatit is possible to identify new functions for individual TFs (74). In this study, we used ChIP-exo,which relies on exonuclease cleavage of the DNA bound to the TF, and therefore gives a veryhigh resolution of TF binding. This technique has also been used extensively by the Palsson group(75) to map genome-wide TF binding in E. coli, for example, to identify the TRN of amino acidmetabolism.
A key question in metabolism is how flux through the individual reactions of the metabolicnetwork is controlled (Figure 3a). Hans Westerhoff (76) expanded the concept of MCA by intro-ducing two levels of flux control: (a) hierarchical flux control, meaning regulation at the levels oftranscription, translation, and posttranslational enzyme modification and (b) metabolic flux con-trol, meaning flux regulation determined at the level of metabolite-enzyme interactions. Therehave been several studies to identify flux control by transcription, one of the key components ofhierarchical flux control, but these studies generally indicate that only certain key fluxes are con-trolled through transcriptional regulation. For example, in B. subtilis, only fluxes in the TCA cycleseem to be regulated by transcription, and there also seems to be little regulation at the metaboliclevel, indicating that allosteric regulation and posttranslational modification of proteins play animportant role in flux control (77, 78). A similar finding was made in yeast, basically that onlyfluxes in the TCA cycle are transcriptionally regulated when metabolism changes from growth onglucose to growth on ethanol (79).
4.2. Proteomics
Proteome analysis was originally based on high-resolution gel electrophoresis, but with the ad-vancement of mass spectrometry, it became possible to quantify thousands of proteins by gel-freeanalysis. This field has further advanced to enable measurement of protein modifications such asphosphorylation and acetylation. Using internal standards, it is possible to absolutely quantify pro-tein concentration; when this quantification is combined with absolute measurements of mRNAs,it allows the generation of genome-wide quantitative data, namely, copies of mRNAs and proteinsper cell (80). This has enabled the generation of proteome libraries, such as the quantification of2,300 proteins in E. coli grown under 22 different growth conditions (81).
These types of quantitative data enable the detailed analysis of protein allocation to differentmetabolic pathways, and several recent studies have shown that protein allocation is extremelyimportant for determining cellular phenotype. It was previously mentioned that the Crabtreeeffect in yeast can be explained by the reallocation of protein mass from the catalytically less butenergetically more efficient respiration that includes F1F0-ATP synthase to the catalytically morebut energetically less efficient glycolysis (22). This type of trade-off between rate and yield is oftenfound in biology and is consistent with the concept from nonequilibrium thermodynamics thatflux is inversely proportional to thermodynamic efficiency. Thus, in a detailed systems biologystudy of two yeast species, a fast growing strain was found to have a lower biomass yield on glucosethan a slower growing strain, and this could be explained by higher protein turnover in the fastergrowing strain (82, 83).
Increased protein turnover enables a faster response to changes in environmental conditionsand results in increased levels of amino acids in the cells, thereby increasing the translation rate, butthe trade-off is increased ATP costs and therefore a lower biomass yield (82). Protein costs forma key determinant of cellular phenotype, as has been illustrated by Naama Barkai and coworkers(84). By overexpression of an “unnecessary” fluorescent protein, at different levels in yeast, theyquantified the effect of transcription and translation on cellular physiology under different growthconditions, with a key conclusion being that cells adapted to enforced protein production by
258 Nielsen
Ann
u. R
ev. B
ioch
em. 2
017.
86:2
45-2
75. D
ownl
oade
d fr
om w
ww
.ann
ualr
evie
ws.
org
Acc
ess
prov
ided
by
Cha
lmer
s U
nive
rsity
of
Tec
hnol
ogy
on 0
6/30
/17.
For
per
sona
l use
onl
y.

BI86CH11-Nielsen ARI 11 May 2017 14:16
becoming larger. A limitation of their study, however, was a lack of quantitative analysis of theyeast proteome to evaluate whether the expression of the inert protein resulted in the reallocationof the yeast proteome.
Such a quantitative study has been performed for E. coli by Terry Hwa and coworkers (85).By expressing β-galactosidase with an inducible promoter, they could vary expression of the“unnecessary” protein and found that increasing β-galactosidase expression resulted in a reducedgrowth rate of the bacterium. The experimental results could be explained by a simple proteinallocation model that was derived from the analysis of rRNA/protein ratios at different growthconditions, as well as from using data obtained from different levels of translational inhibition(85). Later, the same group used quantitative proteomics to study protein allocation to differentmetabolic pathways during growth under different conditions and for different deletion strains(86). From this analysis, they clearly showed that overflow metabolism in E. coli, which resultsin acetate production instead of respiration, is due to this metabolism being more energeticallyefficient per unit protein mass. This conclusion is consistent with the GEM-derived predictionsconcerning protein synthesis, as discussed above (69).
4.3. Metabolomics
One would intuitively think that the quantification of cellular metabolites would be the key methodfor studying cellular metabolism. However, there are two reasons why this is not the case: (a) It isinherently difficult to obtain quantitative data on the cellular metabolome, and (b) it is difficult todraw biological conclusions from metabolomics data alone. It is difficult to quantitatively measureintracellular metabolites because they are present in very low concentrations; their turnover rateis extremely high; metabolites are susceptible to chemical modifications; and many metabolitesare not present in a free state within the cell. Thus, the turnover rate for most metabolites ison the order of seconds; for example, in yeast, it is approximately 3–10 s for ATP and mostglycolytic intermediates. It is therefore necessary to quench metabolism extremely rapidly toobtain a representative sample (87). Another challenge is that due to the large chemical diversityof cellular metabolites, it is difficult to extract all the metabolites using the same solvent. Thechemical diversity also makes it challenging to analyze all metabolites by one method. Althoughseveral different quenching and extraction methods have been developed, there is little consistencyin terms of the recovery of metabolites between methods (82, 88). From a large interlaboratoryexperiment in which several different extraction and analytical methods were used, there was alsopoor consistency in terms of absolute measures for individual metabolites; however, metaboliteratios were similar across the different methods (82).
This variability subsequently suggests that it is difficult to obtain trustworthy quantitativemetabolome data and that one should therefore be careful in comparing kinetic parameters suchas KM values from Michaelis–Menten kinetics with metabolome measurements, for example. Theapproach of estimating kinetics, including the parameters, from dynamic in vivo metabolomicsdata, as performed by Reuss (23) in their analysis of yeast glycolysis (see discussion above), istherefore recommended for the kinetic analysis of metabolic pathways. To overcome the problemof measuring the large chemical diversity represented in the cellular metabolome, Uwe Sauer andNicola Zamboni (89) have recently developed a method based on direct injection of cell suspensionsinto a mass spectrometer, which enabled high-resolution analysis of the E. coli metabolome.
Despite these advances in metabolome analysis it is still challenging to draw biological con-clusions from metabolome data. For example, although GEMs can be used as a scaffold for theanalysis of metabolome data (90), only a fraction of the metabolome is typically quantified. Thelimitation of metabolome analysis for gaining novel biological insight was discussed several years
www.annualreviews.org • Systems Biology of Metabolism 259
Ann
u. R
ev. B
ioch
em. 2
017.
86:2
45-2
75. D
ownl
oade
d fr
om w
ww
.ann
ualr
evie
ws.
org
Acc
ess
prov
ided
by
Cha
lmer
s U
nive
rsity
of
Tec
hnol
ogy
on 0
6/30
/17.
For
per
sona
l use
onl
y.

BI86CH11-Nielsen ARI 11 May 2017 14:16
ago (91), and this limitation exists because metabolite levels are determined by so many otherfactors, such as enzyme concentration, enzyme activation by posttranslational modification, andenzyme kinetics. The trend for analyzing metabolome data is therefore to combine these datawith other omics measurements to confirm generated hypotheses, for example, from an analysisof transcriptome or proteome data.
4.4. Fluxomics
The quantification of metabolic fluxes can be performed by feeding a labeled substrate to the cellfollowed by measurement of the labeling distribution in intracellular metabolites and subsequentanalysis of the data using a stoichiometric model of metabolism (92). This approach was pioneeredby Wolfgang Wiechert (92), who was among the first to develop the computational frameworkrequired for analysis of the data and has further advanced the field significantly. Thus, it is currentlyused extensively for studies on both cell cultures and more complex biological systems such astissues and organs (93). Traditionally, this method relied on a measurement of the labeling patternfor amino acids incorporated into proteins and therefore required a steady state of metabolism.It is now possible to quantify the fluxes during dynamic conditions through measurements of thelabeling pattern in precursor metabolites, amino acids, and proteins and the use of a far moreadvanced modeling framework (94, 95). This concept of dynamic flux analysis has been used tostudy the dynamic response of cholesterol biosynthesis when primary rat hepatocytes are exposedto statins (96). The combined analysis of pathway intermediates and fluxes revealed that flux controlresides primarily at 3-hydroxy-3-methylglutaryl-CoA reductase (HMGR), the target enzyme forstatins.
Fluxomics has been widely used for the analysis of microbial cells used for the industrialproduction of fuels and chemicals, but it has generally been difficult to use this type of datafor the identification of bottlenecks or to guide further engineering of strains. However, thetechnique has been shown to be valuable for the analysis of human cellular metabolism, primarilybecause human cells rely on several carbon and energy sources. It is therefore possible to usefluxomics to obtain insight into the relative contributions of different pathways, for example, forthe generation of energy and cofactors. For example, in a study of glutamine metabolism by cancercell lines, it was found that glutamine is converted to acetyl-CoA through the reductive action ofisocitrate dehydrogenase under hypoxic conditions (97). This finding explains the large uptake ofglutamine by cancer cells at hypoxia conditions, which far exceeds their need for nitrogen: The cellsuse the carbon of glutamine for lipogenesis, whereas a major part of the glucose is converted tolactate due to the Warburg effect. Using the same type of analysis, it has also been found thatblocking glucose oxidation, for example, by adding metformin, results in reductive glutaminemetabolism in prostate cancer cells (98).
5. APPLICATIONS
The systems biology of metabolism has found application in both basic and applied sciences.Such applications have involved the engineering of cell factories for the production of fuels andchemicals and for facilitating the discovery of novel drug targets or biomarkers, an approach oftenreferred to as systems medicine.
5.1. Basic Biology
All cells have evolved global regulatory systems to ensure that metabolic homeostasis is maintained.These regulatory systems sense the energy and redox status of the cell, which are manifested in
260 Nielsen
Ann
u. R
ev. B
ioch
em. 2
017.
86:2
45-2
75. D
ownl
oade
d fr
om w
ww
.ann
ualr
evie
ws.
org
Acc
ess
prov
ided
by
Cha
lmer
s U
nive
rsity
of
Tec
hnol
ogy
on 0
6/30
/17.
For
per
sona
l use
onl
y.
BI86CH11-Nielsen ARI 11 May 2017 14:16
the relative levels of cofactor pairs such as ATP/ADP, NADH/NAD+, and NADPH/NADP+. Asmentioned above, the extensive use of these cofactors in metabolic reactions is the primary reasonfor the high degree of connectivity in metabolism; thus, metabolism must be controlled globallyto keep these cofactor pairs in proper ratios. Metabolism has evolved to use two different electroncarriers, NADH and NADPH, because they are used in different parts of metabolism. Thus, NAD+
is used as a substrate and an electron acceptor in many catabolic reactions, and NADH donateselectrons either to the respiratory system or to pyruvate when it is converted to fermentativeproducts such as lactic acid. In both cases, there is a large thermodynamic driving force that canensure the regeneration of NAD+; it is therefore possible to maintain a higher concentration ofNAD+ compared to NADH in the cell. NADPH, however, is used in biosynthesis and is importantfor donating electrons to precursor metabolites that are being converted to building blocks, forexample, in the conversion of acetyl-CoA to fatty acids and sterols.
NADPH is generated in very few oxidative metabolic reactions. The three main contributorsare (a) the first two reactions of the oxidative pentose phosphate pathway (converting G6P toribulose-5-phosphate), (b) the NADP+-dependent isocitrate dehydrogenase, and (c) the malicenzyme, which converts malate to pyruvate. All these reactions have a high thermodynamic drivingforce due to the splitting off of CO2 and can ensure the generation of NADPH even though theconcentration of NADPH in the cell is higher than that of NADP+. Because it is important forthe cell to maintain different concentrations of these two cofactors, it is not possible to transferelectrons from NADH to NADPH without investing energy. In E. coli, this can be performed usinga membrane-bound transhydrogenase that couples the conversion to the proton gradient, which isbasically equivalent to the expenditure of ATP. Some organisms have a cytosolic transhydrogenase,but they always catalyze the transfer of electrons only from NADPH to NAD+.
Due to the central roles of NADPH and NADH in cellular metabolism, distortions in theirmetabolism or their interconversion can be detrimental to the cell; for example, the excessive useof NADPH during oxidative stress and in many human diseases has been shown to be linked to thealtered metabolism of these cofactors (99). In biotechnology, it is also important to ensure a properbalance of these cofactors, and by engineering cofactor usage, my group previously showed it tobe possible to improve yeast bioethanol production in this way (100). Specifically, we engineeredammonia assimilation to use NADH as a cofactor instead of NADPH; as this process accounts forapproximately 50% of the NADPH usage in the cell, an alternative NADH sink was created in thecell. Under anaerobic conditions, the only way cells can dispose of excess NADH is through theconversion of glucose to glycerol, and by having the alternative NADH sink, glycerol productioncould be reduced by 50%, which allowed for an increased ethanol production (100).
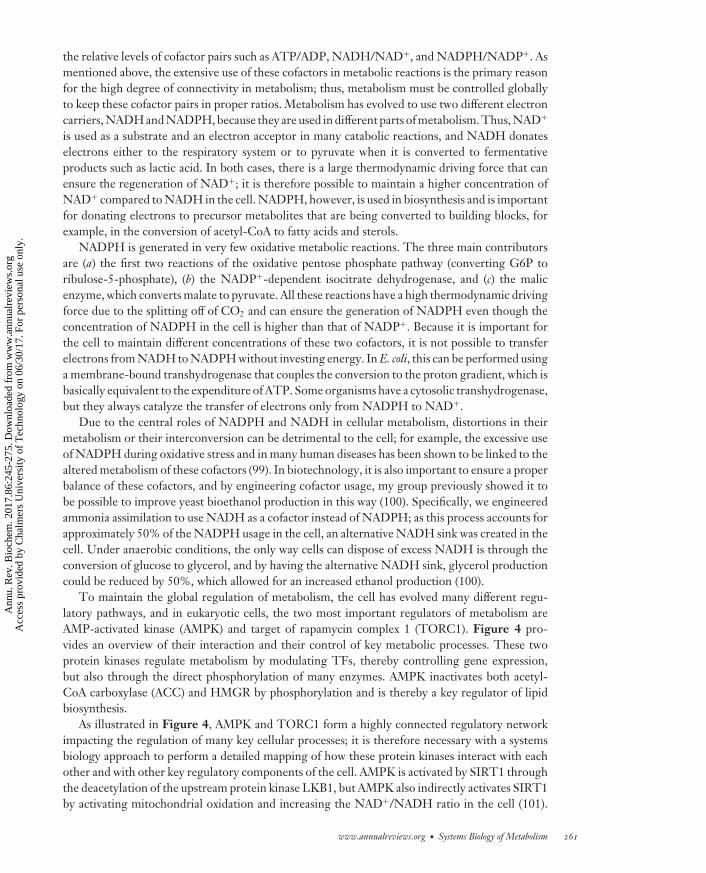
To maintain the global regulation of metabolism, the cell has evolved many different regu-latory pathways, and in eukaryotic cells, the two most important regulators of metabolism areAMP-activated kinase (AMPK) and target of rapamycin complex 1 (TORC1). Figure 4 pro-vides an overview of their interaction and their control of key metabolic processes. These twoprotein kinases regulate metabolism by modulating TFs, thereby controlling gene expression,but also through the direct phosphorylation of many enzymes. AMPK inactivates both acetyl-CoA carboxylase (ACC) and HMGR by phosphorylation and is thereby a key regulator of lipidbiosynthesis.
As illustrated in Figure 4, AMPK and TORC1 form a highly connected regulatory networkimpacting the regulation of many key cellular processes; it is therefore necessary with a systemsbiology approach to perform a detailed mapping of how these protein kinases interact with eachother and with other key regulatory components of the cell. AMPK is activated by SIRT1 throughthe deacetylation of the upstream protein kinase LKB1, but AMPK also indirectly activates SIRT1by activating mitochondrial oxidation and increasing the NAD+/NADH ratio in the cell (101).
www.annualreviews.org • Systems Biology of Metabolism 261
Ann
u. R
ev. B
ioch
em. 2
017.
86:2
45-2
75. D
ownl
oade
d fr
om w
ww
.ann
ualr
evie
ws.
org
Acc
ess
prov
ided
by
Cha
lmer
s U
nive
rsity
of
Tec
hnol
ogy
on 0
6/30
/17.
For
per
sona
l use
onl
y.

BI86CH11-Nielsen ARI 11 May 2017 14:16
Hypoxia
SIRT1
LKB1
VHL
AMPK
HIF1α
Glycolysisβ-oxidation
Mitochondrialbiogenesis
Hypoxiagenes
AMP
NAD+/NADH
Glucose TORC1
TSC2
Nitrogen
TranslationLipid biosynthesis
Amino acid biosynthesisGluconeogenesis
AutophagyProteolysis
Figure 4Illustration of the interactions between adenosine monophosphate–activated kinase (AMPK) and target ofrapamycin complex 1 (TORC1) to control metabolism. AMPK is activated by AMP (which is indicative oflow energy status in the cell) and inactivated by excess glucose. TORC1 is activated by the presence ofnitrogen sources, and if both glucose and a nitrogen source are present, cell growth is activated (whichrequires protein translation and amino acid and lipid biosynthesis). If the energy status of the cell is low,energy-consuming processes (e.g., translation and biosynthesis) are repressed and energy generation (e.g.,β-oxidation and mitochondrial biogenesis) is activated. The network includes two known tumor suppressors,TSC2 (tuberous sclerosis complex 2) and VHL (von Hippel–Lindau).
SIRT1 is inactive during hypoxia, most likely due to a low NAD+/NADH ratio, and is a repres-sor of HIF1α (102), a TF that activates the expression of hypoxia-responsive genes. Because theexpression of hypoxia genes is important for cancer cells, SIRT1 and AMPK play important rolesduring the onset of cancer metabolism. There have therefore been several attempts to developdrugs that activate SIRT1 for cancer treatment, and studies in several different model organ-isms have also shown that SIRT1 activation improves life span (103, 104). Supplementation withresveratrol, a polyphenol present in grapes and red wine, causes effects similar to those of SIRT1activation and has a number of health benefits in both mice (105) and humans (106), but SIRT1is not directly activated by resveratrol (107).
Another key regulator of metabolism is TORC1, which is activated by the presence of nitrogensources, such as amino acids, and stimulates growth by activating a large number of biosyntheticprocesses and concomitantly inactivates autophagy and proteolysis. The protein kinase, a targetof the anticancer drug rapamycin, is a key component in ensuring cellular proliferation when en-vironmental conditions are favorable. Recently, it was shown that rapamycin may also increase lifespan (108), most likely through its activation of autophagy via TORC1 (109). This result is sup-ported by the finding that the activation of autophagy through supplementation with spermidineimproves life span (110).
The regulatory network shown in Figure 4 is highly conserved in eukaryotic cells. Extensiveknowledge of AMPK was first acquired from studies in yeast, and using a systems biology studyinvolving transcriptome, proteome, and metabolome analysis, the regulatory functions of the yeastAMPK, Snf1, were reconstructed (111). In a similar study also involving phosphoproteomics, theinteractions between AMPK and TORC1 in yeast were reconstructed and once again agreedwell with findings in mammalian cells (112). AMPK/Snf1 is activated by phosphorylation andinactivated by dephosphorylation; recognizing the dynamics of its activation (by phosphorylation)is therefore necessary to understand how metabolism responds to perturbations in environmentalconditions. Yeast is a well-suited model organism to study this as it is possible to generate several
262 Nielsen
Ann
u. R
ev. B
ioch
em. 2
017.
86:2
45-2
75. D
ownl
oade
d fr
om w
ww
.ann
ualr
evie
ws.
org
Acc
ess
prov
ided
by
Cha
lmer
s U
nive
rsity
of
Tec
hnol
ogy
on 0
6/30
/17.
For
per
sona
l use
onl
y.

BI86CH11-Nielsen ARI 11 May 2017 14:16
different mutants that have, for example, an overexpressed upstream kinase and/or phosphataseand then measure the dynamic response to environmental changes in these mutants. This approachwas used to build a kinetic model for the regulatory network around Snf1 and gain insight intohow Snf1 controls some of its downstream targets (113). Yeast has also been used to study therole of TORC1 in the regulation of nucleotide and amino acid biosynthesis, and key targets ofTORC1 have been identified by analyzing the phosphoproteome following changes in nitrogensources and rapamycin addition (114).
5.2. Engineering Microbial Metabolism
Microorganisms have been used since ancient times for the production of fermented food and bev-erages, and after the identification of its antibiotic properties during World War II, the industrial-scale production of penicillin and many other antibiotics began. Today, a wide range of differentchemicals is being produced using microbial fermentation (Figure 5a), for example, bioethanolused as a biofuel and lysine as a feed additive. With the introduction of genetic engineering, ithas become possible to engineer microbial cell factories for the production of a vast range ofother chemicals, an approach referred to as metabolic engineering (115–117). There are severalsuccess stories on developing novel bioprocesses through metabolic engineering of cell factories,for example, the production of lactic acid by a low pH–tolerant yeast strain to allow its direct usein the production of polylactate. From these developments and many other studies, it has becomeclear that due to the high degree of connectivity in metabolism, a holistic analysis is importantfor metabolic engineering. Such analysis involves a design-build-test cycle (DBT cycle) (118) inwhich strains are designed, built, and then tested repeatedly until a sufficiently efficient cell factoryhas been built (Figure 5b).
There are many examples of reconstructing heterologous pathways in different cell factories(118–131). Yeast and E. coli have, however, been the preferred platform cell factories to date(132), and Table 2 provides a list of some prominent examples. Typically, a 3- to 5-year periodof further development and an investment in excess of US$50 million is required between theidentification of a proof-of-principle strain, that is, a strain that can produce small amounts of thedesired chemical, and the acquisition of a strain that meets the requirements for a commerciallyviable process (118). This development involves many rounds of the DBT cycle, and with recent
Fuels andchemicals
Crops and biomass Fermentation Cell factory
Design
Build
Test
Learn
a b
Figure 5The concept of industrial biotechnology and metabolic engineering. (a) In industrial biotechnology, crops orbiomass are used as feedstock for the production of fuels and chemicals. The biotransformation occurs in abioreactor via microbial fermentation. In this process, a cell factory is used that is often geneticallyengineered to have its metabolism optimized for the conversion of the feedstock to the product of interest.(b) Optimization of the cell factory is performed through the design-build-test cycle of metabolicengineering. Generally, much is learned by engineering metabolism and testing different designs, and theknowledge can then be used for future design strategies.
www.annualreviews.org • Systems Biology of Metabolism 263
Ann
u. R
ev. B
ioch
em. 2
017.
86:2
45-2
75. D
ownl
oade
d fr
om w
ww
.ann
ualr
evie
ws.
org
Acc
ess
prov
ided
by
Cha
lmer
s U
nive
rsity
of
Tec
hnol
ogy
on 0
6/30
/17.
For
per
sona
l use
onl
y.

BI86CH11-Nielsen ARI 11 May 2017 14:16
Table 2 Examples of engineering metabolism for the production of valuable chemicals
Product Cell factory Product application Reference(s)
Isobutanol S. cerevisiae Biofuel with better properties than ethanol Primarily covered in the patent literaturea
Alkanes E. coli Drop-in fuels for use in trucks and jets 119
S. cerevisiae Drop-in fuels for use in trucks and jets 120
Fatty alcohols E. coliS. cerevisiae
Solvents or biofuels 121120
Farnesene S. cerevisiae Biodiesel for use in trucks and jets Primarily covered in the patent literaturea
PDOb E. coli Polymer production, e.g., SORONA R© 122
BDOc E. coli Polymer production 123
Lysine C. glutamicum Feed additive 124
Valine E. coli Feed additive 125
Santalene S. cerevisiae Perfume ingredient 126
Artemisinic acid S. cerevisiae Antimalarial drug 127
Cortisone S. cerevisiae Anti-inflammatory drug 128
Opioids S. cerevisiae Drugs to relieve pain 129
Resveratrol S. cerevisiae Antioxidant 130
aPrimarily covered in the patent literature, which has been reviewed in Reference 131.b1,3-Propanediol.c1,4-Butanediol.
developments in genome engineering, such as CRISPR (clustered regularly interspaced shortpalindromic repeats)-Cas9 technology, the main challenge today is to rapidly phenotype newstrain designs and use this information to improve design in the next round of the DBT cycle.The systems biology of metabolism therefore has a significant impact on metabolic engineering,because by modeling metabolism, it will be possible to design optimal metabolic networks for theproduction of a given chemical, as in other engineering disciplines.
With their representation of stoichiometric coupling in the whole metabolic network, GEMsare quite well suited for metabolic engineering design, and through the introduction of bileveloptimization, it is possible to identify metabolic engineering targets that couple product forma-tion with growth (133, 134). This computational approach has been demonstrated to enable theimproved design of E. coli for lactic acid production (135) and of yeast for ethanol (136) and suc-cinic acid (137) production. More recently, Vassily Hatzimanikatis and coworkers (138) developedBNICE.ch, an advanced computational framework that allows both pathway identification and adetailed analysis of kinetic and thermodynamic constraints in metabolic networks. In addition tothe use of GEMs for designing cell factories, these models play important roles in the integrativeanalysis of engineered strains using the techniques discussed above (139). The DBT cycle there-fore also includes an element of learning, in which new information about the biological systembeing engineered is acquired and fed into the models.
Even though there are many examples of successful forward engineering, this approach dependson knowledge of the biological system to be engineered. For some complex traits, such as toleranceto high temperatures or low pH, it is difficult to identify suitable engineering targets. In these cases,ALE is very efficient because it allows the isolation of mutant strains with new acquired phenotypes,and causal mutations can be identified through genome sequencing. However, it is generallyimportant to perform systems biology analysis of the evolved strains to identify causal mutations.
264 Nielsen
Ann
u. R
ev. B
ioch
em. 2
017.
86:2
45-2
75. D
ownl
oade
d fr
om w
ww
.ann
ualr
evie
ws.
org
Acc
ess
prov
ided
by
Cha
lmer
s U
nive
rsity
of
Tec
hnol
ogy
on 0
6/30
/17.
For
per
sona
l use
onl
y.

BI86CH11-Nielsen ARI 11 May 2017 14:16
Thus, ALE was used for the isolation of yeast strains with improved growth on galactose (140),and the ALE-created strains had improved galactose metabolism compared with yeast strains thatwere engineered for improved galactose uptake, either by targeting regulatory components (141) ortargeting a key enzyme of the Leloir pathway (142). From systems biology analysis, it was found thatthe proper functioning of the Leloir pathway requires homeostasis of the pathway intermediates,and paradoxically, overexpression of pathway enzymes individually or in combination results inreduced galactose uptake and cell growth (143). ALE has also been used to isolate yeast strainswith the ability to grow at elevated temperatures (144). From a systems biology analysis of theseisolated strains, causal mutations in ERG3 were found. These mutations created stop codons thatdisabled Erg3p, an enzyme involved in ergosterol biosynthesis, and resulted in the accumulationof fecosterol, instead of ergosterol, in the cellular membranes. It was speculated that the bentstructure of fecosterol created a more rigid membrane than the straight structure of ergosteroland thereby conferred improved tolerance to higher temperatures (144).
5.3. Human Metabolism
All human diseases impact energy and redox metabolism in one or more cell types, and due tothe high degree of connectivity in metabolism, any human disease will carry a metabolic signaturethat can potentially be identified through analysis of the metabolome in tissues and/or plasma.However, because the number of chemicals present in plasma is very large, it is difficult to identifythese metabolic signatures from metabolome analysis alone. It is therefore generally necessaryto first analyze the metabolism of the diseased tissue and generate a hypothesis that can formthe basis for targeted metabolomics. It is believed that this approach could lead to improveddiagnostics and allow the stratification of patients into subgroups that can then be treated usingprecision or personalized medicine. Furthermore, by studying metabolism associated with diseasedevelopment, it may be possible to identify novel drug targets. This approach is particularly wellillustrated in the field of cancer treatment, in which studying metabolism has become a mainstreamtopic (145), and several metabolic enzymes have been identified as novel drug targets (146, 147).
With their holistic approach, GEMs are very well suited for the analysis of alterations in humanmetabolism in response to disease development (148). The first human GEMs were constructedin 2007 (149, 150) and formed the basis for the creation of a greatly expanded human GEM in2013 (151). This model was further expanded to cover lipid metabolism in more detail, resultingin Human Metabolic Reaction 2.0 (HMR2.0) (152), which is currently the most comprehensivegeneric human GEM, covering 3,765 genes, 8,181 reactions, and 6,007 metabolites. HMR2.0 hasbeen used as a scaffold for generating detailed models for adipocytes, hepatocytes, and myocytes(153–155). The adipocyte model was used to study metabolic changes in fat tissues in response toobesity, and model simulations revealed that lean subjects have larger dynamic changes in lipidbodies in adipocytes compared with obese subjects (153). The hepatocyte model was used to studymetabolic alterations in subjects with nonalcoholic fatty liver disease (NAFLD), and these subjectsappeared to have serine deficiency (154). This finding was later confirmed in a clinical study thatshowed improved health status for NAFLD subjects who were given serine supplements (156).The myocyte model was reconstructed using RNA-seq data from isolated myocytes, and the modelwas used to perform a meta-analysis of several transcriptome data sets and thereby identify newpotential biomarkers for type 2 diabetes (T2D) (155).
Other tissue-specific GEMs have also been reconstructed using tissue-specific transcriptomeanalysis (157) or data from the Human Protein Atlas (HPA) (http://www.proteinatlas.org) (152,158). HPA uses immunohistochemistry to identify the presence of proteins in more than 80 dif-ferent human cell types and more than 20 cancer cell lines and is therefore an extremely valuable
www.annualreviews.org • Systems Biology of Metabolism 265
Ann
u. R
ev. B
ioch
em. 2
017.
86:2
45-2
75. D
ownl
oade
d fr
om w
ww
.ann
ualr
evie
ws.
org
Acc
ess
prov
ided
by
Cha
lmer
s U
nive
rsity
of
Tec
hnol
ogy
on 0
6/30
/17.
For
per
sona
l use
onl
y.

BI86CH11-Nielsen ARI 11 May 2017 14:16
resource that provides information about the proteome at the cellular level. A recent study usingRNA-seq on 32 human tissues, however, showed that there is a good correlation between mRNApresence in a tissue and associated cell types (159), which is an important finding because mostclinical studies are based on the analysis of tissue biopsies. There is generally a poor overall cor-relation between mRNA abundance and protein abundance (160), but for specific genes/proteins,good correlation has been found across different cell lines (161), indicating that the poor overallcorrelation is due to large variability in protein translation and degradation rates. Thus, mRNAdata can be used as a good proxy for protein abundance (162), and the mRNA data from the 32human tissues could therefore be used to create 32 tissue-specific models (159).
GEMs are particularly well suited for the analysis of cancer metabolism because these modelscan be used not only for integrative data analysis but for model simulations (163) and the detectionof synthetic lethality in cancer cells (164). As discussed above, GEMs can be used to simulate cellgrowth if an appropriate objective function is specified, for example, maximizing cell growth. Fornormal human cells, it is difficult to specify an objective function, but it is reasonable to assumethat cancer cells strive to maximize cell growth. This imperative has been well illustrated by EytanRuppin, who showed through GEM simulations that cell proliferation causes the Warburg effectin cancer cells due to a proteome constraint (165), just like the Crabtree effect in yeast (22). Healso demonstrated the use of GEMs to identify novel drug targets for cancer treatment (166),and in a follow-up study, he specifically identified drug targets in argininosuccinate synthase(ASS1)-deficient tumors (167). ASS1-deficient cells have increased aspartate levels, which resultsin increased de novo pyrimidine biosynthesis, and it is possible to prevent cell proliferation byblocking this activity (167).
Cancer cells are very heterogeneous, which can impact treatment; to address this issue, mygroup used proteomics data from hepatocellular carcinoma (HCC) tumors from six individualsto generate personalized GEMs (152). Using these six GEMs, we identified antimetabolites—metabolite analogs that inhibit specific enzymes and are widely used in cancer therapy—for pre-venting cell proliferation in all six tumors; these could be potential drugs for HCC treatment. Inthis study, several known targets for cancer treatment were identified, but we also identified thecarnitine carrier system as a new target, responsible for fatty acid transport to the mitochondriafor β-oxidation. This target was verified experimentally using a cancer cell line (152). GEMs canalso be used to identify cancer-specific metabolism; using data from The Cancer Genome Atlas,we found that clear cell renal cell carcinoma (ccRCC), the most dominant form of kidney cancer,has a distinct metabolism that is associated with chromosome 3p loss of heterozygosity (168).Furthermore, we found that ccRCC is characterized by a significant deregulation of heparan andchondroitin sulfate metabolism, leading us to analyze associated metabolites in plasma and urine,which led to the identification of a very strong diagnostic biomarker for metastatic ccRCC (169).
The gut microbiome is a complex biological system that has been connected to human diseasedevelopment. The human gut harbors a vast number of different microbial species that interactwith the host immune system and metabolism (170). This microbiome can be analyzed throughmetagenome analysis of extracted DNA (171). Several studies have shown that the gut micro-biome composition is associated with disease development, for example, T2D (172, 173) andother metabolic diseases (174). Gut bacteria are involved in the biosynthesis of different vitaminsthat are important for overall metabolism of the host, but they also produce bioactive moleculessuch as β-carotene that can protect against atherosclerosis (175). The gut microbiome is to a largeextent determined by diet, and dietary interventions can therefore alter its composition (176).Computational models have been used to identify species co-occurrence in complex microbiomeecosystems (177), and recently, GEMs have also been used to model the overall metabolism ofthe gut ecosystem. Using GEMs for three dominant gut species, we simulated the interaction
266 Nielsen
Ann
u. R
ev. B
ioch
em. 2
017.
86:2
45-2
75. D
ownl
oade
d fr
om w
ww
.ann
ualr
evie
ws.
org
Acc
ess
prov
ided
by
Cha
lmer
s U
nive
rsity
of
Tec
hnol
ogy
on 0
6/30
/17.
For
per
sona
l use
onl
y.

BI86CH11-Nielsen ARI 11 May 2017 14:16
between these microbes when they colonized germ-free mice (178). This concept has also beenused to model the human gut microbiome so that metabolic changes in response to dietary inter-ventions can be described (179). The analysis involved two groups of subjects, one with a high genecount and a diverse gut microbiome (i.e., a high microbial gene richness) and one with a low genecount and a compressed gut microbiome. From the analysis, we found that the low-gene-countgroup was at elevated risk of developing T2D and other metabolic diseases when overweight, mostlikely due to inefficient digestion of food in the gut resulting in elevated amino acid levels in theplasma, a well-known risk factor for the development of the abovementioned diseases (179). Ourstudy therefore directly points to a connection between gut microbiome metabolism and plasmachemistry. Recently, gut microbiota composition has also been shown to impact the response toanticancer treatment using immunotherapy (180) and can in some cases even be associated withthe presence of a specific species (181).
SUMMARY POINTS
1. Due to the high connectivity in metabolism, it is necessary to use mathematical modelsfor its analysis, that is, systems biology.
2. Kinetic models can be used to obtain insight into the dynamic operation of pathways inresponse to environmental perturbations.
3. GEMs are knowledge bases of metabolism that can be used for both simulation and dataintegration.
4. Omics technologies are well suited to study metabolism because they make it possibleto obtain a holistic view. However, these data often require integration with biologicalnetwork models to obtain new biological insight.
5. Cells have evolved complex regulatory systems to ensure metabolic homeostasis. Theseregulatory systems are intertwined with metabolic readouts, which makes it difficult todissect their topology and dynamic operation.
6. Due to the high connectivity in metabolism and the extensive regulation, it is difficult toengineer cells to overproduce specific chemicals, but systems biology allows for identifi-cation of nonintuitive targets for engineering.
7. Most human diseases are associated with changes in metabolism that can be capturedas a metabolic signature in plasma or urine, and through systems biology analysis, it ispossible to identify such metabolic signatures.
DISCLOSURE STATEMENT
J.N. has received funding from Novo Nordisk Foundation, the Knut and Alice Wallenberg Foun-dation, Vetenskapsradet, FORMAS (The Swedish Research Council for Environment, Agricul-tural Sciences and Spatial Planning), and the Swedish Foundation for Strategic Research. He is ashareholder in Metabogen AB and Biopetrolia AB.
ACKNOWLEDGMENTS
I would like to acknowledge valuable discussions from all my colleagues and group members butparticularly from Kate Campbell, Francesco Gatto, Eduard Kerkhovem, Adil Mardinoglu, Ivan
www.annualreviews.org • Systems Biology of Metabolism 267
Ann
u. R
ev. B
ioch
em. 2
017.
86:2
45-2
75. D
ownl
oade
d fr
om w
ww
.ann
ualr
evie
ws.
org
Acc
ess
prov
ided
by
Cha
lmer
s U
nive
rsity
of
Tec
hnol
ogy
on 0
6/30
/17.
For
per
sona
l use
onl
y.
BI86CH11-Nielsen ARI 11 May 2017 14:16
Mijakovic, Avlant Nilsson, Dina Petranovic, Jonathan Robinson, Benjamın Sanchez, and VerenaSiewers. In writing this review, I had to restrict the number of references, which has resulted inthe omission of several important studies. My apologies for not being all-inclusive.
LITERATURE CITED
1. Keller MA, Turchyn A, Ralser M. 2014. Non-enzymatic glycolysis and pentose phosphate pathway-likereactions in a plausible Archean ocean. Mol. Syst. Biol. 10:725
2. Herzig S, Raemy E, Montessult S, Veuthey JL, Westermann B, et al. 2012. Identification and functionalexpression of the mitochondrial pyruvate carrier. Science 337:93–96
3. Bricker DK, Taylor EB, Schell JC, Orsak T, Boutron A, et al. 2012. A mitochondrial pyruvate carrierrequired for pyruvate uptake in yeast, Drosophila, and humans. Science 337:96–100
4. Nielsen J. 2003. It is all about metabolic fluxes. J. Bacteriol. 185:7031–355. Vidal M. 2009. A unifying view of 21st century systems biology. FEBS Lett. 583:3891–946. Kell DB, Oliver SG. 2004. Here is the evidence, now what is the hypothesis? The complementary roles
of inductive and hypothesis-driven science in the post-genomic era. BioEssays 26:99–1057. Jewett MC, Nielsen J. 2008. Impact of systems biology on metabolic engineering of Saccharomyces cere-
visiae. FEMS Yeast Res. 8:122–318. Noble D. 1960. Cardiac action and pacemaker potentials based on the Hodkin-Huxley equations. Nature
188:495–979. Fredrickson AG, Megee RD, Tsuchiya HM. 1970. Mathematical models for fermentation processes.
Adv. Appl. Microbiol. 13:419–6510. Heinrich R, Rapoport TA. 1974. A linear steady-state treatment of enzymatic chains. General properties,
control and effector strength. Eur. J. Biochem. 42:89–9511. Kacser H, Burns JA. 1973. The control of flux. Symp. Soc. Exp. Biol. 27:65–10412. Kell DB, van Dam K, Westerhoff HV. 1989. Control analysis of microbial growth and productivity.
Symp. Soc. Gen. Microbiol. 44:61–9313. Ashburner M, Ball CA, Blake JA, Botstein D, Butler H, et al. 2000. Gene ontology: tool for the unification
of biology. Nat. Genet. 25:25–2914. Ideker T, Thorsson V, Ranish JA, Christmas R, Buhler J, et al. 2001. Integrated genomic and proteomic
analyses of a systematically perturbed metabolic network. Science 292:929–3415. Ideker T, Galitski T, Hood L. 2001. A new approach to decoding life: systems biology. Annu. Rev.
Genom. Hum. Genet. 2:343–7216. Kitano H. 2002. Computational systems biology. Nature 420:206–1017. Kitano H. 2002. Systems biology: a brief overview. Science 295:1662–6418. Domach MM, Leung SK, Cahn RE, Cocks GG, Shuler ML. 1984. Computer model for glucose-limited
growth of a single cell of Escherichia coli B/r-A. Biotechnol. Bioeng. 26:203–1619. Tomita M, Hashimoto K, Takahashi K, Shimizu TS, Matsuzaki Y, et al. 1999. E-CELL: software
environment for whole-cell simulation. Bioinformatics 15:72–8420. Karr JR, Sanghvi JC, MacKlin DN, Gutschow MV, Jacobs JM, et al. 2012. A whole-cell computational
model predicts phenotype from genotype. Cell 150:389–40121. Bar-Even A, Noor E, Savir Y, Liebermeister W, Davidi D, et al. 2011. The moderately efficient enzyme:
evolutionary and physicochemical trends shaping enzyme parameters. Biochemistry 50:4402–1022. Nilsson A, Nielsen J. 2016. Metabolic trade-offs in yeast are caused by F1F0-ATP synthase. Sci. Rep.
6:2226423. Rizzi M, Baltes M, Theobald U, Reuss M. 1997. In vivo analysis of metabolic dynamics in Saccharomyces
cerevisiae: II. Mathematical model. Biotechnol. Bioeng. 55:592–60824. Chassagnole C, Noissomit-Rizzi N, Schmid JW, Mauch K, Reuss M. 2002. Dynamic modeling of the
central carbon metabolism of E. coli. Biotechnol. Bioeng. 79:53–7325. Schaff I, Heinisch J, Zimmermann FK. 1989. Overproduction of glycolytic enzymes in yeast. Yeast
5:285–290
268 Nielsen
Ann
u. R
ev. B
ioch
em. 2
017.
86:2
45-2
75. D
ownl
oade
d fr
om w
ww
.ann
ualr
evie
ws.
org
Acc
ess
prov
ided
by
Cha
lmer
s U
nive
rsity
of
Tec
hnol
ogy
on 0
6/30
/17.
For
per
sona
l use
onl
y.

BI86CH11-Nielsen ARI 11 May 2017 14:16
26. Smits HP, Hauf J, Muller S, Hobley TJ, Zimmermann FK, et al. 2000. Simultaneous overexpressionof enzymes of the lower part of glycolysis can enhance fermentative capacity of Saccharomyces cerevisiae.Yeast 16:1325–34
27. Koebmann BJ, Solem C, Pedersen MB, Nilsson D, Jensen PR. 2002. Expression of genes encoding F1-ATPase results in uncoupling of glycolysis from biomass production in Lactococcus lactis. Appl. Environ.Microbiol. 68:4274–82
28. Teusink B, Walsch MC, van Dam K, Westerhoff HV. 1998. The danger of metabolic pathways withturbo design. Trends Biochem. Sci. 23:162–69
29. van de Poll K, Kerkenaar A, Schamhart DHJ. 1974. Isolation of a regulatory mutant of fructose-1,6-diphosphatase in Saccharomyces cerevisiae. J. Bacteriol. 117:965–70
30. van Heerden JH, Wortel MT, Bruggeman FJ, Heijnen JJ, Bollen YJ, et al. 2014. Lost in transition:start-up of glycolysis yields subpopulations of non-growing cells. Science 343:1245114
31. Fraenkel D, Nielsen J. 2016. Trehalose-6-phosphate synthase and stabilization of yeast glycolysis. FEMSYeast Res. 16:fov100
32. Klipp E, Nordlander B, Kruger R, Gennemark P, Hohmann S. 2005. Integrative model of the responseof yeast to osmotic shock. Nat. Biotechnol. 23:975–82
33. Heinrich R, Neel BG, Rapoport TA. 2002. Mathematical models of protein kinase signal transduction.Mol. Cell 9:957–70
34. Petelenz-Kurdziel E, Kuehn C, Nordlander B, Klein D, Hong K-K, et al. 2012. Quantitative analysis ofglycerol accumulation, glycolysis and growth under hyper osmotic stress. PLOS Comput. Biol. 9:e1003084
35. Edwards JS, Palsson BO. 1999. Systems properties of the Haemophilus influenzae Rd metabolic genotype.J. Biol. Chem. 274:17410–16
36. Edwards JS, Palsson BO. 2001. The Escherichia coli MG1655 in silico metabolic genotype. Its definition,characteristics, and capabilities. PNAS 97:5528–33
37. Schilling CH, Covert MW, Famili I, Church GM, Edwards JS, et al. 2002. Genome-scale metabolicmodel of Helicobacter pylori 26695. J. Bacteriol. 184:4582–93
38. Forster J, Famili I, Fu P, Palsson BO, Nielsen J. 2003. Genome-scale metabolic reconstruction of theSaccharomyces cerevisiae metabolic network. Genome Res. 13:244–53
39. Famili I, Forster J, Nielsen J, Palsson BO. 2003. Saccharomyces cerevisiae phenotypes can be predicted byusing constraint-based analysis of a genome-scale reconstructed metabolic network. PNAS 100:13134–39
40. Kim TY, Sohn SB, Kim YB, Kim WJ, Lee SY. 2012. Recent advances in reconstruction and applicationsof genome-scale metabolic models. Curr. Opin. Biotechnol. 23:617–23
41. Monk J, Nogales J, Palsson BO. 2014. Optimizing genome-scale network reconstructions. Nat. Biotechnol.32:447–52
42. Collakova E, Yen JY, Senger RS. 2012. Are we ready for genome-scale modeling in plants? Plant Sci.191–192:53–70
43. Orth JB, Conrad TM, Na J, Lerman JA, Nam H, et al. 2011. A comprehensive genome-scale recon-struction of Escherichia coli metabolism—2011. Mol. Syst. Biol. 7:535
44. Aung HW, Henry SA, Walker LP. 2013. Revising the representation of fatty acid, glycerolipid, andglycerophospholipid metabolism in the consensus model of yeast metabolism. Ind. Biotechnol. 9:215–29
45. Andersen MR, Nielsen ML, Nielsen J. 2008. Metabolic model integration of the bibliome, genome,metabolome and reactome of Aspergillus niger. Mol. Syst. Biol. 4:178
46. Agren R, Liu L, Shoaie S, Vongsangnak W, Nookaew I, et al. 2013. The RAVEN toolbox and its use forgenerating a genome-scale metabolic model for Penicillium chrysogenum. PLOS Comput. Biol. 9:e1002980
47. McCloskey D, Palsson BO, Feist AM. 2013. Basic and applied uses of genome-scale metabolic networkreconstructions of Escherichia coli. Mol. Syst. Biol. 9:661
48. Sanchez BJ, Nielsen J. 2015. Genome scale models of yeast: towards standardized evaluation and con-sistent omic integration. Integr. Biol. 7:846–58
49. Herrgard MJ, Swainston N, Dobson P, Dunn WB, Arga KY, et al. 2008. A consensus yeast metabolic net-work reconstruction obtained from a community approach to systems biology. Nat. Biotechnol. 26:1155–60
50. Heavner BD, Smallbone K, Price ND, Walker LP. 2013. Version 6 of the consensus yeast metabolicnetwork refines biochemical coverage and improves model performance. Database 2013:bat059
www.annualreviews.org • Systems Biology of Metabolism 269
Ann
u. R
ev. B
ioch
em. 2
017.
86:2
45-2
75. D
ownl
oade
d fr
om w
ww
.ann
ualr
evie
ws.
org
Acc
ess
prov
ided
by
Cha
lmer
s U
nive
rsity
of
Tec
hnol
ogy
on 0
6/30
/17.
For
per
sona
l use
onl
y.

BI86CH11-Nielsen ARI 11 May 2017 14:16
51. Aiba S, Matsuoka M. 1979. Identification of metabolic model: citrate production from glucose by Candidalipolytica. Biotechnol. Bioeng. 21:1373–86
52. Fell DA, Small JK. 1986. Fat synthesis in adipose tissue. An examination of stoichiometric constraints.Biochem. J. 238:781–86
53. Edwards JS, Ibarra RU, Palsson BO. 2001. In silico predictions of Escherichia coli metabolic capabilitiesare consistent with experimental data. Nat. Biotechnol. 19:125–30
54. Schuetz R, Kuepfer L, Sauer U. 2007. Systematic evaluation of objective functions for predicting intra-cellular fluxes in Escherichia coli. Mol. Syst. Biol. 3:119
55. O’Brien EJ, Monk JM, Palsson BO. 2015. Using genome-scale models to predict biological capabilities.Cell 161:971–87
56. Ibarra RU, Edwards JS, Palsson BO. 2002. Escherichia coli K12 undergoes adaptive evolution to achievein silico predicted optimal growth. Nature 420:186–89
57. Fischer E, Sauer U. 2005. Large-scale metabolic in vivo flux analysis shows rigidity and suboptimalperformance of Bacillus subtilis metabolism. Nat. Genet. 37:636–40
58. Chakrabarti A, Miskovic L, Soh KC, Hatzimanikatis V. 2013. Towards kinetic modeling of genome-scalemetabolic networks without sacrificing stoichiometric, thermodynamic and physiological constraints.Biotechnol. J. 8:1043–57
59. Thiele I, Ronan MTF, Que R, Bordbar A, Diep D, et al. 2012. Multiscale modeling of metabolism andmacromolecular synthesis in E. coli and its applications to the evolution of codon usage. PLOS ONE7:e45635
60. Chang RL, Andrews K, Kim D, Li Z, Godzik A, et al. 2013. Structural systems biology evaluation ofmetabolic thermotolerance of Escherichia coli. Science 340:1220–23
61. Feizi A, Osterlund T, Petranovic D, Bordel S, Nielsen J. 2013. Genome-scale modeling of the proteinsecretion machinery in yeast. PLOS ONE 8:e63284
62. Ideker T, Ozier O, Schwikowski B, Siegel AF. 2002. Discovering regulatory and signaling circuits inmolecular interaction networks. Bioinformatics 18:S233–40
63. Patil KR, Nielsen J. 2005. Uncovering transcriptional regulation of metabolism by using metabolicnetwork topology. PNAS 102:2685–89
64. Oliveira A, Patil KR, Nielsen J. 2008. Architecture of transcriptional regulatory circuits is knitted overthe topology of bio-molecular interaction networks. BMC Syst. Biol. 2:17
65. Varemo L, Nielsen J, Nookaew I. 2013. Enriching the gene set analysis of genome-wide data by in-corporating directionality of gene expression and combining statistical hypothesis and methods. NucleicAcids Res. 41:4378–91
66. DeRisi JL, Iyer VR, Brown PO. 1997. Exploring the metabolic and genetic control of gene expressionon a genomic scale. Science 278:680–86
67. Akesson M, Forster J, Nielsen J. 2004. Integration of gene expression data into genome-scale metabolicmodels. Metab. Eng. 6:285–93
68. Machado D, Herrgard M. 2014. Systematic evaluation of methods for integration of transcriptomic datainto constraint-based models of metabolism. PLOS Comput. Biol. 10:e1003580
69. O’Brien EJ, Lerman JA, Chang RL, Hyduke DR, Palsson BO. 2013. Genome-scale models of metabolismand gene expression extend and refine growth phenotype predictions. Mol. Syst. Biol. 9:693
70. Fendt S-M, Oliveira AP, Christen S, Picotti P, Dechant RC, et al. 2010. Unraveling condition-dependentnetworks of transcription factors that control metabolic pathway activity in yeast. Mol. Syst. Biol. 6:432
71. Harbison CT, Gordon DB, Lee TI, Rinaldi NJ, Macisaac KD, et al. 2004. Transcriptional regulatorycode of a eukaryotic genome. Nature 431:99–104
72. Hughes TR, de Boer CG. 2013. Mapping yeast transcriptional networks. Genetics 195:9–3673. Osterlund T, Bordel S, Nielsen J. 2015. Controllability analysis of transcriptional regulatory networks
reveals circular control patterns among transcription factors. Integr. Biol. 7:560–6874. Liu G, Bergenholm D, Nielsen J. 2016. Genome-wide mapping of binding sites reveals multiple biolog-
ical functions of the transcription factor Cst6 in Saccharomyces cerevisiae. mBio 7:e00559–1675. Cho B-K, Federowicz S, Park Y-S, Zengler K, Palsson BO. 2011. Deciphering the transcriptional reg-
ulatory logic of amino acid metabolism. Nat. Chem. Biol. 8:65–71
270 Nielsen
Ann
u. R
ev. B
ioch
em. 2
017.
86:2
45-2
75. D
ownl
oade
d fr
om w
ww
.ann
ualr
evie
ws.
org
Acc
ess
prov
ided
by
Cha
lmer
s U
nive
rsity
of
Tec
hnol
ogy
on 0
6/30
/17.
For
per
sona
l use
onl
y.

BI86CH11-Nielsen ARI 11 May 2017 14:16
76. Rossell S, van der Weijden CC, Lindenbergh A, van Tuijl A, Francke C, et al. 2006. Unraveling the com-plexity of flux regulation: a new method demonstrated for nutrient starvation in Saccharomyces cerevisiae.PNAS 103:2166–71
77. Chubukov V, Uhr M, Le Chat L, Kleijn RJ, Jules M, et al. 2013. Transcriptional regulation is insufficientto explain substrate-induced flux changes in Bacillus subtilis. Mol. Syst. Biol. 9:709
78. Gerosa L, Haverkorn van Rijsewijk BRB, Christodoulou D, Kochanowski K, Schmidt TSB, et al. 2015.Pseudo-transition analysis identifies the key regulators of dynamic metabolic adaptations from steady-state data. Cell Syst. 1:270–82
79. Bordel S, Agren R, Nielsen J. 2010. Sampling the solution space in genome-scale metabolic networksreveals transcriptional regulation in key enzymes. PLOS Comput. Biol. 6:e1000859
80. Marguerat S, Schmidt A, Codlin S, Chen W, Aebershold R, et al. 2012. Quantitative analysis of fissionyeast transcriptomes and proteomes in proliferating and quiescent cells. Cell 151:671–83
81. Schmidt A, Kochanowski K, Vedelaar S, Ahrne E, Volkmer B, et al. 2016. The quantitative and condition-dependent Escherichia coli proteome. Nat. Biotechnol. 34:104–10
82. Canelas AB, Harrison N, Fazio A, Zhang J, Pitkanen JP, et al. 2010. Integrated multilaboratory systemsbiology reveals differences in protein metabolism between two reference yeast strains. Nat. Commun.1:145
83. Hong K-K, Hou J, Shoaie S, Nielsen J, Bordel S. 2012. Dynamic 13C-labeling experiments proveimportant differences in protein turnover rate between two Saccharomyces cerevisiae strains. FEMS YeastRes. 12:741–47
84. Kafri MN, Metzi-Raz E, Jona G, Barkai N. 2016. The costs of protein synthesis. Cell Rep. 14:1–1085. Scott M, Gunderson CW, Mateescu EM, Zhong Z, Hwa T. 2010. Interdependence of cell growth and
gene expression: origins and consequences. Science 330:1099–10286. Basan M, Hui S, Okano H, Zhang Z, Shen Y, et al. 2015. Overflow metabolism in Escherichia coli results
from efficient proteome allocation. Nature 528:99–10487. Theobald U, Mailinger W, Baltes M, Rizzi M, Reuss M. 1997. In vivo analysis of metabolic dynamics
in Saccharomyces cerevisiae: I. Experimental observations. Biotechnol. Bioeng. 55:305–1688. Villas-Boas SG, Højer-Pedersen J, Akesson M, Smedsgaard J, Nielsen J. 2005. Global metabolite analysis
of yeast: evaluation of sample preparation methods. 22:1155–6989. Link H, Fuhrer T, Gerosa L, Zamboni N, Sauer U. 2015. Real-time metabolome profiling of the
metabolic switch between starvation and growth. Nat. Methods 12:1091–9790. Cakir T, Patil KR, Onsan ZI, Ulgen KO, Kirdar B, et al. 2006. Integration of metabolome data with
metabolic networks reveals reporter reactions. Mol. Syst. Biol. 2:5091. Nielsen J, Oliver S. 2005. The next wave in metabolome analysis. Trends Biotechnol. 23:544–4692. Wiechert W. 2001. 13C metabolic flux analysis. Metab. Eng. 3:195–20693. Zamboni N. 2011. 13C metabolic flux analysis in complex systems. Curr. Opin. Biotechnol. 22:103–894. Noh K, Gronke K, Luo B, Takors R, Oldiges M, et al. 2007. Metabolic flux analysis at ultra short time
scale: isotopically non-stationary 13C labeling experiments. J. Biotechnol. 129:249–6795. Leighty RW, Antoniewicz MR. 2011. Dynamic metabolic flux analysis (DMFA): a framework for deter-
mining fluxes at metabolic non-steady state. Metab. Eng. 13:745–5596. Maier K, Hofmann U, Bauer A, Niebel A, Vacun G, et al. 2009. Quantification of statin effects on hepatic
cholesterol synthesis by transient 13C-flux analysis. Metab. Eng. 11:292–30997. Metallo CM, Gemeiro PA, Bell EL, Mattaini KR, Yang J, et al. 2012. Reductive glutamine metabolism
by IDH1 mediates lipogenesis under hypoxia. Nature 481:380–8498. Fendt S-M, Bell EL, Keibler MA, Davidson SM, Wirth GJ, et al. 2013. Metformin decreases glucose
oxidation and increases the dependency of prostate cancer cells on reductive glutamine metabolism.Cancer Res. 73:4429–38
99. Ying W. 2008. NAD+/NADH and NADP+/NADPH in cellular functions and cell death: regulationand biological consequences. Antioxid. Redox Signal. 10:179–206
100. Nissen T, Kielland-Brandt MC, Nielsen J, Villadsen J. 2000. Optimization of ethanol production inSaccharomyces cerevisiae by metabolic engineering of the ammonium assimilation. Metab. Eng. 2:69–77
101. Canto C, Gerhart-Hines Z, Feige JN, Lagouge M, Noriega L, et al. 2009. AMPK regulates energyexpenditure by modulating NAD+ metabolism and SIRT1 activity. Nature 458:1056–60
www.annualreviews.org • Systems Biology of Metabolism 271
Ann
u. R
ev. B
ioch
em. 2
017.
86:2
45-2
75. D
ownl
oade
d fr
om w
ww
.ann
ualr
evie
ws.
org
Acc
ess
prov
ided
by
Cha
lmer
s U
nive
rsity
of
Tec
hnol
ogy
on 0
6/30
/17.
For
per
sona
l use
onl
y.

BI86CH11-Nielsen ARI 11 May 2017 14:16
102. Lim J-H, Lee Y-M, Chun Y-S, Chen J, Kim J-E, et al. 2010. Sirtuin 1 modulates cellular responses tohypoxia by deacetylating hypoxia-inducible factor 1α. Mol. Cell 38:864–78
103. Howitz KT, Bitterman KJ, Cohen HY, Lamming DW, Lavu S, et al. 2003. Small molecular activatorsof sirtuins extend Saccharomyces cerevisiae lifespan. Nature 425:191–96
104. Canto C, Auwerx J. 2009. Calorie restriction, SIRT1 and longevity. Trends. Endocrinol. Metab. 20:325–31105. Baur JA, Pearson KJ, Price NL, Jamieson HA, Lerin C, et al. 2006. Resveratrol improves health and
survival of mice on a high-calorie diet. Nature 444:337–42106. Timmers S, Konings E, Bilet L, Houtkooper RH, van de Weijer T, et al. 2011. Calorie restriction-like
effects of 30 days or resveratrol supplementation on energy metabolism and metabolic profile in obesehumans. Cell Metab. 14:612–22
107. Beher D, Wu J, Cumine S, Kim KW, Lu S-C, et al. 2009. Resveratrol is not a direct activator of SIRT1enzyme activity. Chem. Biol. Drug Des. 74:619–24
108. Ehninger D, Neff F, Xie K. 2014. Longevity, aging and rapamycin. Cell. Mol. Life Sci. 71:4325–46109. Diaz-Troya S, Perez-Perez ME, Florencio FJ, Crespo JL. 2008. The role of TOR in autophagy regulation
from yeast to plants and mammals. Autophagy 4:851–65110. Madeo F, Eisenberg T, Buttner T, Ruckenstuhl C, Kroemer G. 2010. Spermidine: a novel autophagy
inducer and longevity elixir. Autophagy 6:160–62111. Usaite R, Jewett MC, Oliveira AP, Yates JR III, Olsson L, Nielsen J, et al. 2009. Reconstruction of the
yeast Snf1 kinase regulatory network reveals its role as a global energy regulator. Mol. Syst. Biol. 5:319112. Zhang J, Vaga S, Chumnanpuen P, Kumar R, Vemuri GN, et al. 2011. Mapping the interactions of Snf1
with TORC1 in Saccharomyces cerevisiae. Mol. Syst. Biol. 7:545113. Garcia-Salcedo R, Lubitz T, Beltran G, Elbing K, Tian Y, et al. 2014. Glucose de-repression by yeast
AMP-activated protein kinase SNF1 is controlled via at least two independent steps. FEBS J. 281:1901–17
114. Oliveira AP, Ludwig C, Zampieri M, Weisser H, Aebershold R, et al. 2015. Dynamic phosphoproteomicsreveals TORC1-dependent regulation of yeast nucleotide and amino acid biosynthesis. Sci. Signal. 8:1–15
115. Bailey JE. 1991. Toward a science of metabolic engineering. Science 252:1668–74116. Stephanopoulos G, Vallino JJ. 1991. Network rigidity and metabolic engineering in metabolite over-
production. Science 252:1675–81117. Nielsen J. 2001. Metabolic engineering. Appl. Microbiol. Biotechnol. 55:263–83118. Nielsen J, Keasling JD. 2016. Engineering cellular metabolism. Cell 164:1185–97119. Choi YJ, Lee SY. 2013. Microbial production of short-chain alkanes. Nature 502:571–74120. Zhou YJ, Buijs NA, Zhu Z, Qin J, Siewers V, et al. 2016. Production of fatty acid-derived oleochemicals
and biofuels by synthetic yeast cell factories. Nat. Commun. 7:11709121. Steen EJ, Kang Y, Bokinsky G, Hu Z, Schirmer A, et al. 2010. Microbial production of fatty-acid-derived
fuels and chemicals from plant biomass. Nature 463:559–62122. Nakamura CE, Whited GM. 2003. Metabolic engineering for the microbial production of 1,3-
propanediol. Curr. Opin. Biotechnol. 14:454–59123. Yim H, Haselbeck R, Niu W, Pujol-Baxley C, Burgard A, et al. 2011. Metabolic engineering of Escherichia
coli for direct production of 1,4-butanediol. Nat. Chem. Biol. 7:445–52124. Becker J, Zelder O, Hafner S, Schroder H, Wittmann C. 2011. From zero to hero—design-based systems
metabolic engineering of Corynebacterium glutamicum for L-lysine production. Metab. Eng. 13:159–68125. Park JH, Lee KH, Kim TY, Lee SY. 2007. Metabolic engineering of Escherichia coli for the production
of L-valine based on transcriptome analysis and in silico gene knockout simulation. PNAS 104:7797–802126. Scalcinati G, Knuf C, Partow S, Chen Y, Maury J, et al. 2012. Dynamic control of gene expression in
Saccharomyces cerevisiae engineered for the production of plant sesquiterpene α-santalene in a fed-batchmode. Metab. Eng. 14:91–103
127. Ro D-K, Paradise EM, Ouellet M, Fisher KJ, Newman KL, et al. 2006. Production of the antimalarialdrug precursor artemisinic acid in engineered yeast. Nature 440:940–43
128. Szczebara FM, Chandeller C, Villeret C, Masurel A, Dupont C, et al. 2003. Total biosynthesis ofhydrocortisone from a simple carbon source in yeast. Nat. Biotechnol. 21:143–49
129. Galanie S, Thodey K, Tenchard IJ, Interrante MF, Smolke CD. 2015. Complete biosynthesis of opioidsin yeast. Science 349:1095–100
272 Nielsen
Ann
u. R
ev. B
ioch
em. 2
017.
86:2
45-2
75. D
ownl
oade
d fr
om w
ww
.ann
ualr
evie
ws.
org
Acc
ess
prov
ided
by
Cha
lmer
s U
nive
rsity
of
Tec
hnol
ogy
on 0
6/30
/17.
For
per
sona
l use
onl
y.

BI86CH11-Nielsen ARI 11 May 2017 14:16
130. Li M, Kildegaard KR, Rodriguez A, Borodina I, Nielsen J. 2015. De novo production of resveratrol fromglucose or ethanol by engineered Saccharomyces cerevisiae. Metab. Eng. 32:1–11
131. Hong K-K, Nielsen J. 2012. Metabolic engineering of Saccharomyces cerevisiae: a key cell factory platformfor future biorefineries. Cell. Mol. Life Sci. 69:2671–90
132. Nielsen J. 2015. Yeast cell factories on the horizon. Science 349:1050–51133. Burgard AP, Maranas CD. 2001. Probing the performance limits of the Escherichia coli metabolic network
subject to gene additions or deletions. Biotechnol. Bioeng. 74:364–75134. Patil KR, Rocha I, Forster J, Nielsen J. 2005. Evolutionary programming as a platform for in silico
metabolic engineering. BMC Bioinform. 6:308135. Fong SS, Burgard AP, Herring CD, Knight EM, Blattner FR, et al. 2005. In silico design and adaptive
evolution of Escherichia coli for production of lactic acid. Biotechnol. Bioeng. 91:643–48136. Bro C, Regenberg B, Forster J, Nielsen J. 2006. In silico aided metabolic engineering of Saccharomyces
cerevisiae for improved bioethanol production. Metab. Eng. 8:102–11137. Otero JM, Cimini D, Patil KR, Poulsen SG, Olsson L, et al. 2013. Industrial systems biology of Saccha-
romyces cerevisiae enables novel succinic acid cell factory. PLOS ONE 8:e54144138. Hadadi N, Hatzimanikatis V. 2015. Design of computational retrobiosynthesis tools for the design of
de novo synthetic pathways. Curr. Opin. Chem. Biol. 28:99–104139. Brunk E, George KW, Alonso-Gutierrez J, Thompson M, Baldoo E, et al. 2016. Characterizing strain
variation in engineered E. coli using a multi-omics-based workflow. Cell Syst. 2:335–46140. Hong K-K, Vongsangnak W, Vemuri GN, Nielsen J. 2011. Unravelling evolutionary strategies of yeast
for improving galactose utilization through integrated systems level analysis. PNAS 108:12179–84S141. Ostergaard S, Olsson L, Johnston M, Nielsen J. 2000. Increasing galactose consumption by Saccharomyces
cerevisiae through metabolic engineering of the GAL gene regulatory network. Nat. Biotechnol. 18:1283–86
142. Bro C, Knudsen S, Regenberg B, Olsson L, Nielsen J. 2005. Improvement of galactose uptake in Sac-charomyces cerevisiae through overexpression of phosphoglucomutase: example of transcript analysis as atool in inverse metabolic engineering. Appl. Environ. Microbiol. 71:6465–72
143. de Jongh WA, Bro C, Ostergaard S, Regenberg B, Olsson L, et al. 2008. The roles of galactitol, galactose-1-phosphate, and phosphoglucomutase in galactose-induced toxicity in Saccharomyces cerevisiae. Biotechnol.Bioeng. 101:317–26
144. Caspeta L, Chen Y, Ghiaci P, Feizi A, Buskov S, et al. 2014. Altered sterol composition renders yeastthermotolerant. Science 346:75–78
145. Vander Heiden MG, Cantley LC, Thompson CB. 2009. Understanding the Warburg effect: themetabolic requirements of cell proliferation. Science 324:1029–33
146. Frezza C, Zheng L, Folger O, Rajagopalan KN, MacKenzle ED, et al. 2011. Haem oxygenase is syn-thetically lethal with the tumour suppressor fumarate hydratase. Nature 477:225–28
147. Yun J, Mullarky E, Lu C, Bosch KN, Kavalier A, et al. 2015. Vitamin C selectively kills KRAS and BRAFmutant colorectal cancer cells by targeting GADPH. Science 350:1391–96
148. Mardinoglu A, Nielsen J. 2015. New paradigms for metabolic modeling of human cells. Curr. Opin.Biotechnol. 34:91–97
149. Duarte NC, Becker SA, Jamshidi N, Thiele I, Mo ML, et al. 2007. Global reconstruction of the humanmetabolic network based on genomic and bibliome data. PNAS 104:1777–82
150. Ma H, Sorokin A, Mazein A, Selkov A, Selkov E, et al. 2007. The Edinburgh human metabolic networkreconstruction and its functional analysis. Mol. Syst. Biol. 3:135
151. Thiele I, Swainston N, Fleming RMT, Hoppe A, Sahoo S, et al. 2013. A community-driven globalreconstruction of human metabolism. Nat. Biotechnol. 31:419–25
152. Agren R, Mardinoglu A, Asplund A, Kampf C, Uhlen M, et al. 2014. Identification of anticancer drugsfor hepatocellular carcinoma through personalized genome-scale metabolic modeling. Mol. Syst. Biol.10:721
153. Mardinoglu A, Agren R, Kampf C, Asplund A, Uhlen M, et al. 2013. Integration of clinical data with agenome-scale metabolic model of the human adipocyte. Mol. Syst. Biol. 9:949
www.annualreviews.org • Systems Biology of Metabolism 273
Ann
u. R
ev. B
ioch
em. 2
017.
86:2
45-2
75. D
ownl
oade
d fr
om w
ww
.ann
ualr
evie
ws.
org
Acc
ess
prov
ided
by
Cha
lmer
s U
nive
rsity
of
Tec
hnol
ogy
on 0
6/30
/17.
For
per
sona
l use
onl
y.

BI86CH11-Nielsen ARI 11 May 2017 14:16
154. Mardinoglu A, Aagren R, Kampf C, Asplund A, Uhlen M, et al. 2014. Genome-scale metabolic modellingof hepatocytes reveals serine deficiency in patients with non-alcoholic fatty liver disease. Nat. Commun.5:3083
155. Varemo L, Scheele C, Broholm C, Mardinoglu A, Kampf C, et al. 2015. Proteome- and transcriptome-driven reconstruction of the human myocyte metabolic network and its use for identification of markersfor diabetes. Cell Rep. 11:1–13
156. Mardinoglu A, Bjornson E, Zhang C, Klevstig M, Soderlund S, et al. 2017. Personal model-assistedidentification of NAD+ and glutathione metabolism as intervention target in NAFLD. Mol. Syst. Biol.13:916
157. Shlomi T, Cabili MN, Herrgard MJ, Palsson BO, Ruppin E. 2008. Network-based prediction of humantissue-specific metabolism. Nat. Biotechnol. 26:1003–10
158. Agren R, Bordel S, Mardinoglu A, Pornputtapong N, Nookaew I, et al. 2012. Reconstruction of genome-scale active metabolic networks for 60 human cell types and 16 cancer types using INIT. PLOS Comput.Biol. 8:e1002518
159. Uhlen M, Fagerberg L, Hallstrom BM, Lindskog C, Oksvold P, et al. 2015. Tissue-based map of thehuman proteome. Science 347:1260419
160. Liu Y, Beyer A, Aebershold R. 2016. On the dependency of cellular protein levels on mRNA abundance.Cell 165:535–50
161. Lundberg E, Fagerberg L, Klevebring D, Matic I, Geiger T, et al. 2010. Defining the transcriptome andproteome in three functionally different human cell lines. Mol. Syst. Biol. 6:450
162. Uhlen M, Hallstrom BM, Lindskog C, Mardinoglu A, Ponten F, et al. 2016. Transcriptomics resourcesof human tissues and organs. Mol. Syst. Biol. 12:862
163. Yizhak K, Chaneton B, Gottlieb E, Ruppin E. 2015. Modeling cancer metabolism on a genome scale.Mol. Syst. Biol. 11:817
164. Jerby-Arnon L, Pfetzer N, Waldman YY, McGarry L, James D, et al. 2014. Predicting cancer-specificvulnerability via data-driven detection of synthetic lethality. Cell 158:1199–209
165. Shlomi T, Benyamini T, Gottlieb E, Sharan R, Ruppin E. 2011. Genome-scale metabolic modeling elu-cidates the role of proliferative adaptation in causing the Warburg effect. PLOS Comput. Biol. 7:e1002018
166. Folger O, Jerby L, Frezza C, Gottlieb E, Ruppin E, et al. 2011. Predicting selective drug targets in cancerthrough metabolic networks. Mol. Syst. Biol. 7:501
167. Rabinovich S, Adler L, Yizhak K, Sarver A, Silberman A, et al. 2015. Diversion of aspartate in ASS1-deficient tumours fosters de novo pyrimidine synthesis. Nature 527:379–83
168. Gatto F, Nookaew I, Nielsen J. 2014. Chromosome 3p loss of heterozygosity is associated with a uniquemetabolic network in clear cell renal carcinoma. PNAS 111:E866–75
169. Gatto F, Volpi N, Nilsson H, Nookaew I, Maruzzo M, et al. 2016. Glycosaminoglycan profiling inpatients’ plasma and urine predicts the occurrence of metastatic clear cell renal cell carcinoma. Cell Rep.15:1–15
170. Tremaroli V, Backhed F. 2012. Functional interactions between the gut microbiota and host metabolism.Nature 489:242–49
171. Qin J, Li R, Raes J, Arumigam M, Burgdorf KS, et al. 2010. A human gut microbial gene catalogueestablished by metagenomic sequencing. Nature 464:59–65
172. Qin J, Li Y, Cai Z, Li S, Zhu J, et al. 2012. A metagenome-wide association study of gut microbiota intype 2 diabetes. Nature 490:55–60
173. Karlsson F, Tremaroli V, Nookaew I, Bergstrom G, Behre CJ, et al. 2013. Gut metagenome in Europeanwomen with normal, impaired and diabetic glucose control. Nature 498:99–103
174. Karlsson F, Tremaroli V, Nielsen J, Backhed F. 2013. Assessing the human gut microbiota in metabolicdiseases. Diabetes 62:3341–49
175. Karlsson F, Fak F, Nookaew I, Tremaroli V, Fagerberg B, et al. 2012. Symptomatic atherosclerosis isassociated with an altered gut metagenome. Nat. Commun. 3:1245
176. David LA, Maurice CF, Carmody RN, Gootenberg DB, Button JE, et al. 2014. Diet rapidly and repro-ducibly alters the human gut microbiome. Nature 505:559–63
177. Zelezniak A, Andrejev S, Ponomarova O, Mende DR, Bork P, et al. 2015. Metabolic dependencies drivespecies co-occurrence in diverse microbial communities. PNAS 112:6449–54
274 Nielsen
Ann
u. R
ev. B
ioch
em. 2
017.
86:2
45-2
75. D
ownl
oade
d fr
om w
ww
.ann
ualr
evie
ws.
org
Acc
ess
prov
ided
by
Cha
lmer
s U
nive
rsity
of
Tec
hnol
ogy
on 0
6/30
/17.
For
per
sona
l use
onl
y.

BI86CH11-Nielsen ARI 11 May 2017 14:16
178. Shoaie S, Karlsson F, Mardinoglu A, Nookaew I, Bordel S, et al. 2013. Understanding the interactionsbetween bacteria in the human gut through metabolic modeling. Sci. Rep. 3:2532
179. Shoaie S, Ghaffari P, Kovatcheva-Datchary P, Mardinoglu A, Sen P, et al. 2015. Quantifying diet-inducedmetabolic changes of the human gut microbiome. Cell Metab. 22:320–31
180. Vetizou M, Pitt JM, Daillere R, Lepage P, Waldschmitt N, et al. 2015. Anticancer immunotherapy byCTLA-4 blockade relies on the gut microbiota. Science 350:1079–84
181. Sivan A, Corrales L, Hubert N, Williams JB, Aquino-Michaels K, et al. 2015. Commensal Bifidobacteriumpromotes antitumor immunity and facilitates anti-PD-L1 efficacy. Science 350:1084–89
www.annualreviews.org • Systems Biology of Metabolism 275
Ann
u. R
ev. B
ioch
em. 2
017.
86:2
45-2
75. D
ownl
oade
d fr
om w
ww
.ann
ualr
evie
ws.
org
Acc
ess
prov
ided
by
Cha
lmer
s U
nive
rsity
of
Tec
hnol
ogy
on 0
6/30
/17.
For
per
sona
l use
onl
y.

ANNUAL REVIEWSConnect With Our Experts
New From Annual Reviews:Annual Review of Cancer Biologycancerbio.annualreviews.org • Volume 1 • March 2017
Co-Editors: Tyler Jacks, Massachusetts Institute of Technology Charles L. Sawyers, Memorial Sloan Kettering Cancer Center
The Annual Review of Cancer Biology reviews a range of subjects representing important and emerging areas in the field of cancer research. The Annual Review of Cancer Biology includes three broad themes: Cancer Cell Biology, Tumorigenesis and Cancer Progression, and Translational Cancer Science.
TABLE OF CONTENTS FOR VOLUME 1:• How Tumor Virology Evolved into Cancer Biology and
Transformed Oncology, Harold Varmus• The Role of Autophagy in Cancer, Naiara Santana-Codina,
Joseph D. Mancias, Alec C. Kimmelman• Cell Cycle–Targeted Cancer Therapies, Charles J. Sherr,
Jiri Bartek• Ubiquitin in Cell-Cycle Regulation and Dysregulation
in Cancer, Natalie A. Borg, Vishva M. Dixit• The Two Faces of Reactive Oxygen Species in Cancer,
Colleen R. Reczek, Navdeep S. Chandel• Analyzing Tumor Metabolism In Vivo, Brandon Faubert,
Ralph J. DeBerardinis• Stress-Induced Mutagenesis: Implications in Cancer
and Drug Resistance, Devon M. Fitzgerald, P.J. Hastings, Susan M. Rosenberg
• Synthetic Lethality in Cancer Therapeutics, Roderick L. Beijersbergen, Lodewyk F.A. Wessels, René Bernards
• Noncoding RNAs in Cancer Development, Chao-Po Lin, Lin He
• p53: Multiple Facets of a Rubik’s Cube, Yun Zhang, Guillermina Lozano
• Resisting Resistance, Ivana Bozic, Martin A. Nowak• Deciphering Genetic Intratumor Heterogeneity
and Its Impact on Cancer Evolution, Rachel Rosenthal, Nicholas McGranahan, Javier Herrero, Charles Swanton
• Immune-Suppressing Cellular Elements of the Tumor Microenvironment, Douglas T. Fearon
• Overcoming On-Target Resistance to Tyrosine Kinase Inhibitors in Lung Cancer, Ibiayi Dagogo-Jack, Jeffrey A. Engelman, Alice T. Shaw
• Apoptosis and Cancer, Anthony Letai• Chemical Carcinogenesis Models of Cancer: Back
to the Future, Melissa Q. McCreery, Allan Balmain• Extracellular Matrix Remodeling and Stiffening Modulate
Tumor Phenotype and Treatment Response, Jennifer L. Leight, Allison P. Drain, Valerie M. Weaver
• Aneuploidy in Cancer: Seq-ing Answers to Old Questions, Kristin A. Knouse, Teresa Davoli, Stephen J. Elledge, Angelika Amon
• The Role of Chromatin-Associated Proteins in Cancer, Kristian Helin, Saverio Minucci
• Targeted Differentiation Therapy with Mutant IDH Inhibitors: Early Experiences and Parallels with Other Differentiation Agents, Eytan Stein, Katharine Yen
• Determinants of Organotropic Metastasis, Heath A. Smith, Yibin Kang
• Multiple Roles for the MLL/COMPASS Family in the Epigenetic Regulation of Gene Expression and in Cancer, Joshua J. Meeks, Ali Shilatifard
• Chimeric Antigen Receptors: A Paradigm Shift in Immunotherapy, Michel Sadelain
ANNUAL REVIEWS | CONNECT WITH OUR EXPERTS
650.493.4400/800.523.8635 (us/can)www.annualreviews.org | [email protected]
ONLINE NOW!
Ann
u. R
ev. B
ioch
em. 2
017.
86:2
45-2
75. D
ownl
oade
d fr
om w
ww
.ann
ualr
evie
ws.
org
Acc
ess
prov
ided
by
Cha
lmer
s U
nive
rsity
of
Tec
hnol
ogy
on 0
6/30
/17.
For
per
sona
l use
onl
y.

BI86-FrontMatter ARI 1 June 2017 10:4
Annual Review ofBiochemistry
Volume 86, 2017ContentsAt the Intersection of Chemistry, Biology, and Medicine
Christopher T. Walsh � � � � � � � � � � � � � � � � � � � � � � � � � � � � � � � � � � � � � � � � � � � � � � � � � � � � � � � � � � � � � � � � � � � � � � � � � � 1
Protein Misfolding DiseasesF. Ulrich Hartl � � � � � � � � � � � � � � � � � � � � � � � � � � � � � � � � � � � � � � � � � � � � � � � � � � � � � � � � � � � � � � � � � � � � � � � � � � � � � � �21
Protein Misfolding, Amyloid Formation, and Human Disease:A Summary of Progress Over the Last DecadeFabrizio Chiti and Christopher M. Dobson � � � � � � � � � � � � � � � � � � � � � � � � � � � � � � � � � � � � � � � � � � � � � � � � �27
Structural Studies of Amyloid Proteins at the Molecular LevelDavid S. Eisenberg and Michael R. Sawaya � � � � � � � � � � � � � � � � � � � � � � � � � � � � � � � � � � � � � � � � � � � � � � � �69
Mechanisms and Functions of Spatial Protein Quality ControlEmily Mitchell Sontag, Rahul S. Samant, and Judith Frydman � � � � � � � � � � � � � � � � � � � � � � � � � �97
The Ubiquitin System, Autophagy, and Regulated Protein DegradationAlexander Varshavsky � � � � � � � � � � � � � � � � � � � � � � � � � � � � � � � � � � � � � � � � � � � � � � � � � � � � � � � � � � � � � � � � � � � � � � 123
Ubiquitin Ligases: Structure, Function, and RegulationNing Zheng and Nitzan Shabek � � � � � � � � � � � � � � � � � � � � � � � � � � � � � � � � � � � � � � � � � � � � � � � � � � � � � � � � � � � 129
Mechanisms of Deubiquitinase Specificity and RegulationTycho E.T. Mevissen and David Komander � � � � � � � � � � � � � � � � � � � � � � � � � � � � � � � � � � � � � � � � � � � � � � � 159
Proteasomal and Autophagic Degradation SystemsIvan Dikic � � � � � � � � � � � � � � � � � � � � � � � � � � � � � � � � � � � � � � � � � � � � � � � � � � � � � � � � � � � � � � � � � � � � � � � � � � � � � � � � � � � 193
Mechanisms of Autophagy InitiationJames H. Hurley and Lindsey N. Young � � � � � � � � � � � � � � � � � � � � � � � � � � � � � � � � � � � � � � � � � � � � � � � � � � 225
Systems Biology of MetabolismJens Nielsen � � � � � � � � � � � � � � � � � � � � � � � � � � � � � � � � � � � � � � � � � � � � � � � � � � � � � � � � � � � � � � � � � � � � � � � � � � � � � � � � � 245
Metabolite Measurement: Pitfalls to Avoid and Practices to FollowWenyun Lu, Xiaoyang Su, Matthias S. Klein, Ian A. Lewis, Oliver Fiehn,
and Joshua D. Rabinowitz � � � � � � � � � � � � � � � � � � � � � � � � � � � � � � � � � � � � � � � � � � � � � � � � � � � � � � � � � � � � � � 277
Isocitrate Dehydrogenase Mutation and (R)-2-Hydroxyglutarate:From Basic Discovery to Therapeutics DevelopmentLenny Dang and Shin-San Michael Su � � � � � � � � � � � � � � � � � � � � � � � � � � � � � � � � � � � � � � � � � � � � � � � � � � � 305
v
Ann
u. R
ev. B
ioch
em. 2
017.
86:2
45-2
75. D
ownl
oade
d fr
om w
ww
.ann
ualr
evie
ws.
org
Acc
ess
prov
ided
by
Cha
lmer
s U
nive
rsity
of
Tec
hnol
ogy
on 0
6/30
/17.
For
per
sona
l use
onl
y.

BI86-FrontMatter ARI 1 June 2017 10:4
Conceptual and Experimental Tools to Understand Spatial Effects andTransport Phenomena in Nonlinear Biochemical NetworksIllustrated with Patchy SwitchingRebecca R. Pompano, Andrew H. Chiang, Christian J. Kastrup,
and Rustem F. Ismagilov � � � � � � � � � � � � � � � � � � � � � � � � � � � � � � � � � � � � � � � � � � � � � � � � � � � � � � � � � � � � � � � 333
Biochemistry of Catabolic Reductive DehalogenationMaeva Fincker and Alfred M. Spormann � � � � � � � � � � � � � � � � � � � � � � � � � � � � � � � � � � � � � � � � � � � � � � � � � 357
Electric Fields and Enzyme CatalysisStephen D. Fried and Steven G. Boxer � � � � � � � � � � � � � � � � � � � � � � � � � � � � � � � � � � � � � � � � � � � � � � � � � � � � 387
Eukaryotic DNA Replication ForkPeter M.J. Burgers and Thomas A. Kunkel � � � � � � � � � � � � � � � � � � � � � � � � � � � � � � � � � � � � � � � � � � � � � � � 417
Telomerase Mechanism of Telomere SynthesisR. Alex Wu, Heather E. Upton, Jacob M. Vogan, and Kathleen Collins � � � � � � � � � � � � � � � � 439
Site-Specific Self-Catalyzed DNA Depurination: A BiologicalMechanism That Leads to Mutations and Creates SequenceDiversityJacques R. Fresco and Olga Amosova � � � � � � � � � � � � � � � � � � � � � � � � � � � � � � � � � � � � � � � � � � � � � � � � � � � � � � 461
A New Facet of Vitamin B12: Gene Regulation by Cobalamin-BasedPhotoreceptorsS. Padmanabhan, Marco Jost, Catherine L. Drennan,
and Montserrat Elıas-Arnanz � � � � � � � � � � � � � � � � � � � � � � � � � � � � � � � � � � � � � � � � � � � � � � � � � � � � � � � � � � 485
Engineering and In Vivo Applications of RiboswitchesZachary F. Hallberg, Yichi Su, Rebekah Z. Kitto, and Ming C. Hammond � � � � � � � � � � � � 515
Cyclic GMP–AMP as an Endogenous Second Messenger in InnateImmune Signaling by Cytosolic DNAKazuki Kato, Hiroki Omura, Ryuichiro Ishitani, and Osamu Nureki � � � � � � � � � � � � � � � � � � 541
A Bright Future for Antibiotics?Donna Matzov, Anat Bashan, and Ada Yonath � � � � � � � � � � � � � � � � � � � � � � � � � � � � � � � � � � � � � � � � � � 567
Molecular Characteristics and Biological Functions of Surface-Activeand Surfactant ProteinsMargaret Sunde, Chi L.L. Pham, and Ann H. Kwan � � � � � � � � � � � � � � � � � � � � � � � � � � � � � � � � � � � 585
How α-Helical Motifs Form Functionally Diverse Lipid-BindingCompartmentsLucy Malinina, Dinshaw J. Patel, and Rhoderick E. Brown � � � � � � � � � � � � � � � � � � � � � � � � � � � � � 609
The Evolution of Organellar Coat Complexes and Organization of theEukaryotic CellMichael P. Rout and Mark C. Field � � � � � � � � � � � � � � � � � � � � � � � � � � � � � � � � � � � � � � � � � � � � � � � � � � � � � � � 637
vi Contents
Ann
u. R
ev. B
ioch
em. 2
017.
86:2
45-2
75. D
ownl
oade
d fr
om w
ww
.ann
ualr
evie
ws.
org
Acc
ess
prov
ided
by
Cha
lmer
s U
nive
rsity
of
Tec
hnol
ogy
on 0
6/30
/17.
For
per
sona
l use
onl
y.

BI86-FrontMatter ARI 1 June 2017 10:4
Endoplasmic Reticulum–Plasma Membrane Contact SitesYasunori Saheki and Pietro De Camilli � � � � � � � � � � � � � � � � � � � � � � � � � � � � � � � � � � � � � � � � � � � � � � � � � � � 659
Mitochondrial Machineries for Protein Import and AssemblyNils Wiedemann and Nikolaus Pfanner � � � � � � � � � � � � � � � � � � � � � � � � � � � � � � � � � � � � � � � � � � � � � � � � � � � 685
Oxidative StressHelmut Sies, Carsten Berndt, and Dean P. Jones � � � � � � � � � � � � � � � � � � � � � � � � � � � � � � � � � � � � � � � � 715
Multiple Functions and Regulation of Mammalian PeroxiredoxinsSue Goo Rhee and In Sup Kil � � � � � � � � � � � � � � � � � � � � � � � � � � � � � � � � � � � � � � � � � � � � � � � � � � � � � � � � � � � � � � 749
Redox-Based Regulation of Bacterial Development and BehaviorAbigail J. Sporer, Lisa J. Kahl, Alexa Price-Whelan, and Lars E.P. Dietrich � � � � � � � � � 777
Extracellular Heme Uptake and the Challenge of Bacterial CellMembranesWeiliang Huang and Angela Wilks � � � � � � � � � � � � � � � � � � � � � � � � � � � � � � � � � � � � � � � � � � � � � � � � � � � � � � � � 799
Teaching Old Dyes New Tricks: Biological Probes Built fromFluoresceins and RhodaminesLuke D. Lavis � � � � � � � � � � � � � � � � � � � � � � � � � � � � � � � � � � � � � � � � � � � � � � � � � � � � � � � � � � � � � � � � � � � � � � � � � � � � � � � 825
Microbial Rhodopsins: Diversity, Mechanisms, and OptogeneticApplicationsElena G. Govorunova, Oleg A. Sineshchekov, Hai Li, and John L. Spudich � � � � � � � � � � � 845
Cellular Electron Cryotomography: Toward Structural Biology In SituCatherine M. Oikonomou and Grant J. Jensen � � � � � � � � � � � � � � � � � � � � � � � � � � � � � � � � � � � � � � � � � � � 873
Errata
An online log of corrections to Annual Review of Biochemistry articles may be found athttp://www.annualreviews.org/errata/biochem
Contents vii
Ann
u. R
ev. B
ioch
em. 2
017.
86:2
45-2
75. D
ownl
oade
d fr
om w
ww
.ann
ualr
evie
ws.
org
Acc
ess
prov
ided
by
Cha
lmer
s U
nive
rsity
of
Tec
hnol
ogy
on 0
6/30
/17.
For
per
sona
l use
onl
y.