Systematic Review on International Salt Reduction Policy in ...
25
International Journal of Environmental Research and Public Health Review Systematic Review on International Salt Reduction Policy in Restaurants Jingmin Ding 1 , Yuewen Sun 1 , Yuan Li 1,2, *, Jing He 1 , Harriet Sinclair 3 , Wenwen Du 4 , Huijun Wang 4 and Puhong Zhang 1,2 1 The George Institute for Global Health at Peking University Health Science Centre, Beijing 100600, China; [email protected] (J.D.); [email protected] (Y.S.); [email protected] (J.H.); [email protected] (P.Z.) 2 Faculty of Medicine, University of New South Wales, Sydney, NSW 2052, Australia 3 School of International Studies, American University, Washington, DC 20016, USA; [email protected] 4 Chinese Center for Disease Control and Prevention, National Institute for Nutrition and Health, Beijing 100050, China; [email protected] (W.D.); [email protected] (H.W.) * Correspondence: [email protected]; Tel.: +86-10-8280-0577 Received: 18 November 2020; Accepted: 18 December 2020; Published: 21 December 2020 Abstract: As the catering sector has increasingly contributed to population-level salt intake, many countries have begun developing salt-reduction strategies for restaurants. This paper aims to provide an overview of global salt reduction policies in restaurants. Scientific papers and website materials were systematically searched from Web of Science, Science Direct, and PubMed, as well as official websites of government departments and organizations. A total of 78 full-text papers and grey literature works were included. From 58 countries and regions, 62 independent policies were identified, 27 of which were mandatory (3 with fines). The most common strategy was menu labeling, which was a component of 40 policies. Target setting (n = 23) and reformulation (n = 13) of dishes were also widely implemented. Other salt-reduction strategies included education campaign, chef training, toolkits delivery, table salt removal, media campaign, and government assistance such as free nutrition analysis and toolkits distribution. Most policies focused on chain restaurants. Evaluations of these policies were limited and showed inconsistent results, and more time is needed to demonstrate the clear long-term effects. Attention has been paid to salt reduction in restaurants around the world but is still at its early stage. The feasibility and effectiveness of the strategies need to be further explored. Keywords: salt reduction; sodium; restaurant; policy; menu labelling; government initiative; behavior change 1. Introduction Excess salt intake has been proved to be a risk factor for non-communicable diseases (NCDs) such as hypertension and cardiovascular disease worldwide [1]. Many countries have developed strategies to reduce population salt consumption since it is one of the most effective measures to reduce the burden of NCDs [2–4]. The World Health Organization set a goal of a 30% relative reduction in population intake of salt by 2025 and recommended that daily salt intake should be less than 5 g [5]. The European Union and other countries have followed to make efforts to achieve the salt-reduction goal. China has also taken action to make a 20% reduction in per capita daily salt intake by 2030 [6]. Dietary salt comes from different foods. In developed countries, it was estimated that processed foods contributed most to salt intake [7]. Thus, the salt-reduction strategies in these countries started from the food manufacturing industry and have made significant progress to date. For example, Int. J. Environ. Res. Public Health 2020, 17, 9570; doi:10.3390/ijerph17249570 www.mdpi.com/journal/ijerph
-
Upload
khangminh22 -
Category
Documents
-
view
0 -
download
0
Transcript of Systematic Review on International Salt Reduction Policy in ...
International Journal of
Environmental Research
and Public Health
Review
Systematic Review on International Salt ReductionPolicy in Restaurants
Jingmin Ding 1, Yuewen Sun 1 , Yuan Li 1,2,*, Jing He 1, Harriet Sinclair 3, Wenwen Du 4,Huijun Wang 4 and Puhong Zhang 1,2
1 The George Institute for Global Health at Peking University Health Science Centre, Beijing 100600, China;[email protected] (J.D.); [email protected] (Y.S.); [email protected] (J.H.);[email protected] (P.Z.)
2 Faculty of Medicine, University of New South Wales, Sydney, NSW 2052, Australia3 School of International Studies, American University, Washington, DC 20016, USA;
[email protected] Chinese Center for Disease Control and Prevention, National Institute for Nutrition and Health,
Beijing 100050, China; [email protected] (W.D.); [email protected] (H.W.)* Correspondence: [email protected]; Tel.: +86-10-8280-0577
Received: 18 November 2020; Accepted: 18 December 2020; Published: 21 December 2020 �����������������
Abstract: As the catering sector has increasingly contributed to population-level salt intake,many countries have begun developing salt-reduction strategies for restaurants. This paper aims toprovide an overview of global salt reduction policies in restaurants. Scientific papers and websitematerials were systematically searched from Web of Science, Science Direct, and PubMed, as well asofficial websites of government departments and organizations. A total of 78 full-text papers andgrey literature works were included. From 58 countries and regions, 62 independent policies wereidentified, 27 of which were mandatory (3 with fines). The most common strategy was menu labeling,which was a component of 40 policies. Target setting (n = 23) and reformulation (n = 13) of dishes werealso widely implemented. Other salt-reduction strategies included education campaign, chef training,toolkits delivery, table salt removal, media campaign, and government assistance such as free nutritionanalysis and toolkits distribution. Most policies focused on chain restaurants. Evaluations of thesepolicies were limited and showed inconsistent results, and more time is needed to demonstrate theclear long-term effects. Attention has been paid to salt reduction in restaurants around the world butis still at its early stage. The feasibility and effectiveness of the strategies need to be further explored.
Keywords: salt reduction; sodium; restaurant; policy; menu labelling; government initiative;behavior change
1. Introduction
Excess salt intake has been proved to be a risk factor for non-communicable diseases (NCDs)such as hypertension and cardiovascular disease worldwide [1]. Many countries have developedstrategies to reduce population salt consumption since it is one of the most effective measures to reducethe burden of NCDs [2–4]. The World Health Organization set a goal of a 30% relative reduction inpopulation intake of salt by 2025 and recommended that daily salt intake should be less than 5 g [5].The European Union and other countries have followed to make efforts to achieve the salt-reductiongoal. China has also taken action to make a 20% reduction in per capita daily salt intake by 2030 [6].
Dietary salt comes from different foods. In developed countries, it was estimated that processedfoods contributed most to salt intake [7]. Thus, the salt-reduction strategies in these countries startedfrom the food manufacturing industry and have made significant progress to date. For example,
Int. J. Environ. Res. Public Health 2020, 17, 9570; doi:10.3390/ijerph17249570 www.mdpi.com/journal/ijerph
Int. J. Environ. Res. Public Health 2020, 17, 9570 2 of 25
the United Kingdom has set gradual salt reduction targets in processed food from 2006 [8]. In theUnited States, the government established short-term (2-year) and long-term (10-year) voluntarytargets of mean and upper bound sodium levels in processed and prepared food [9].
Meals eaten outside the home make up a large portion of food consumption both in high-incomecountries and in low- and middle-income countries. In the USA, food purchased from eatingout-of-home accounted for more than half of households’ food expenditures in 2018 [10]. In the UK,consumer spending on catering accounted for 28% of food, drink, and catering expenditure in 2017,which has increased by 34% during the past decade [11]. A similar trend has also been observed inCanada, where 83% of young people buy food away from home at least once a week [12]. In China,the Nutrition and Health Monitoring of Chinese Residents in 2010–2012 showed that 42.2% of urbanresidents had eaten out in the past week before the survey [13]. In India, 38% of adults stated they ate fastfood at quick-service restaurants one to three times per week in 2018 [14]. The contribution of restaurantfoods to dietary salt intake has become non-trivial. A survey reported that the restaurant foods hadthe highest sodium density (mg/1000 kcal) among American diets [15]. Therefore, salt reduction inrestaurants should be an integral part of overall salt reduction policies.
Several countries have implemented restaurant salt reduction policies. However, many governmentshave not yet taken action, particularly in developing countries, which have heavier burdens of NCDscompared to high-income countries [16]. Exploring existing restaurant salt reduction experiences willhelp many countries design and improve relevant strategies. Currently, there are several review papersdiscussing salt reduction policies [17–19], but mainly focusing on the general population and foodmanufacturing business due to the policy priorities on pre-packaged food. There is thus a gap in theliterature regarding salt reduction policies focused on the food service sector. The specific characteristicsof the catering industry [20] need to be considered in drawing up policies for restaurants. This study aimsto review the restaurant salt reduction policies administered at the national or regional level around theworld in order to provide suggestions for effective salt reduction in the catering and restaurant sectors.
2. Methods
2.1. Search Strategy
Scientific papers referring to relevant policies were searched from Web of Science, Science Direct,and PubMed using keywords “restaurant”, “salt”, “sodium”, or “menu label(l)ing”. The reference listsof included articles were also reviewed for additional sources. Grey literature works were searchedfrom Google and Bing, as well as official websites of government departments (e.g., Ministry of PublicHealth, Centers for Disease Control and Prevention, Food and Drug Administration) or regional orinternational organizations (e.g., World Health Organization, European Union, Consensus Action onSalt and Health [21], World Action on Salt and Health [22]), using the same keywords as the literaturesearch. A snowball search strategy was used to find additional relevant materials by accessing linkswithin the website pages.
2.2. Inclusion and Exclusion Criteria
Policies, programs, and initiatives issued by the government at all levels (of country and region)regarding reducing salt consumption from restaurants were included in this review. The original policydocuments published on the official sites and relevant news reports were included as grey literature.The policies were only considered if they had gone into effect or been passed for implementation.Materials only proposing or negotiating salt reduction without specific strategies were excluded.All materials had to be available in full text in English or Chinese. For policies with multiple availableversions, only the latest version was included in this review.
Int. J. Environ. Res. Public Health 2020, 17, 9570 3 of 25
2.3. Data Extraction
Key information of each independent policy was compiled into an Excel spreadsheet. The extractedinformation included the region in which the policy was implemented, enforcement department, dateof passage and/or implementation, whether the policy was voluntary or mandatory, main types ofstrategies, and what the effect was, if any. For the most commonly used strategies, more detailedinformation, including specific requirements and conditions of restaurants involved, was recorded.Two reviewers conducted data extraction independently and then discussed to reach a consensus.In addition, the PRISMA Checklist was used as a guideline [23].
3. Results
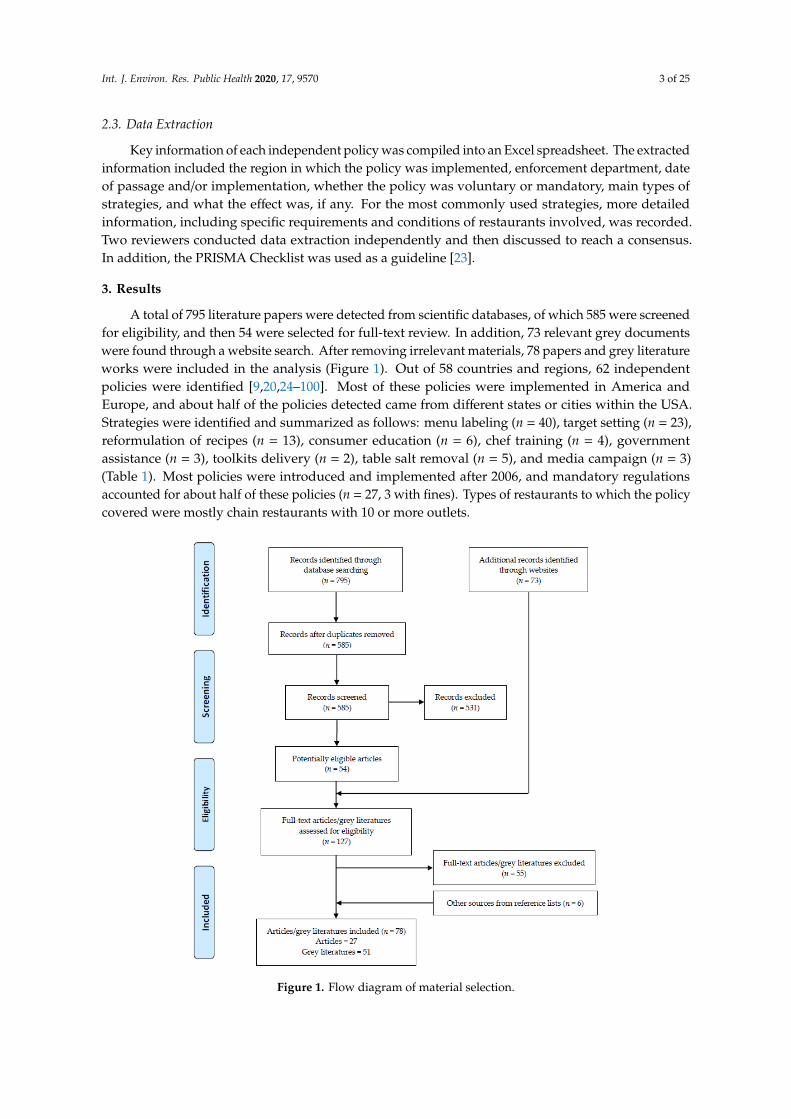
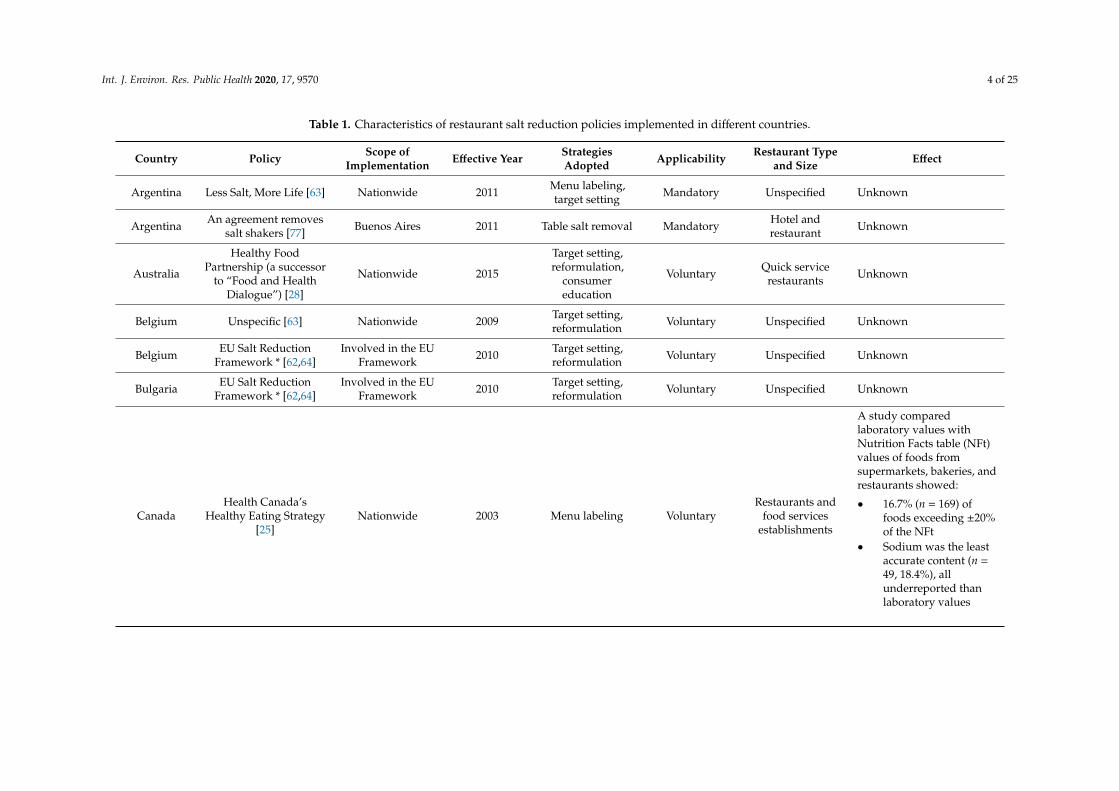
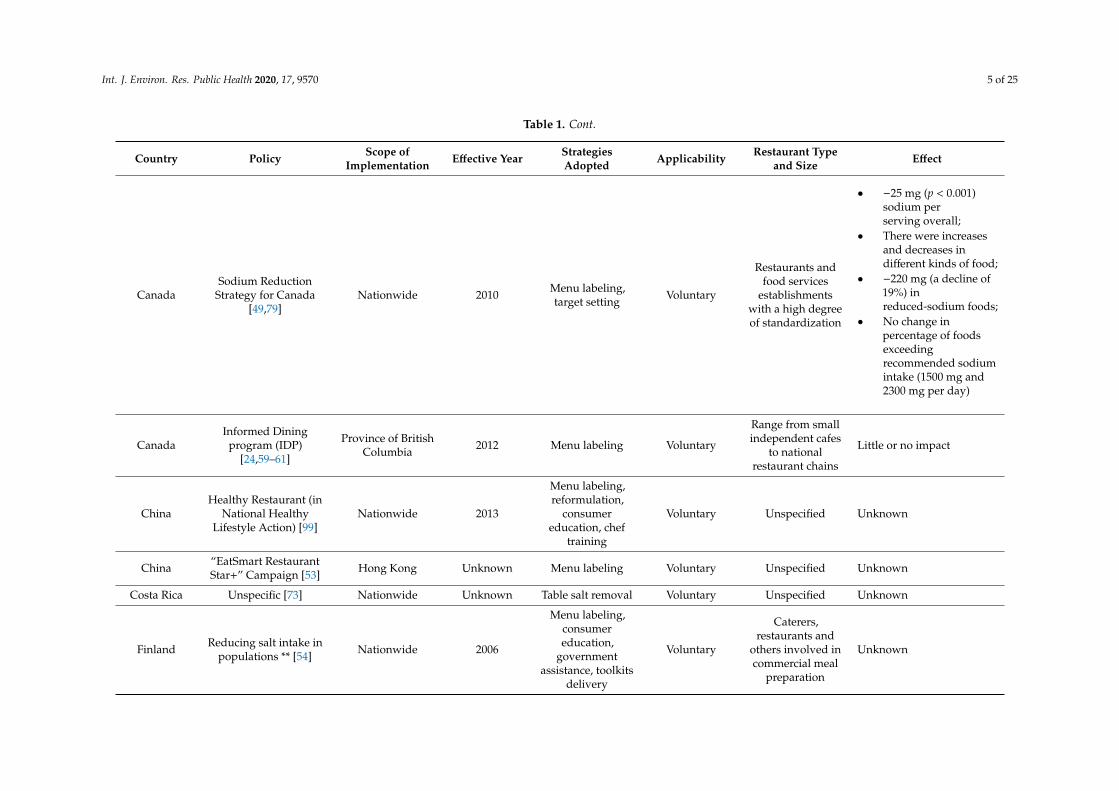
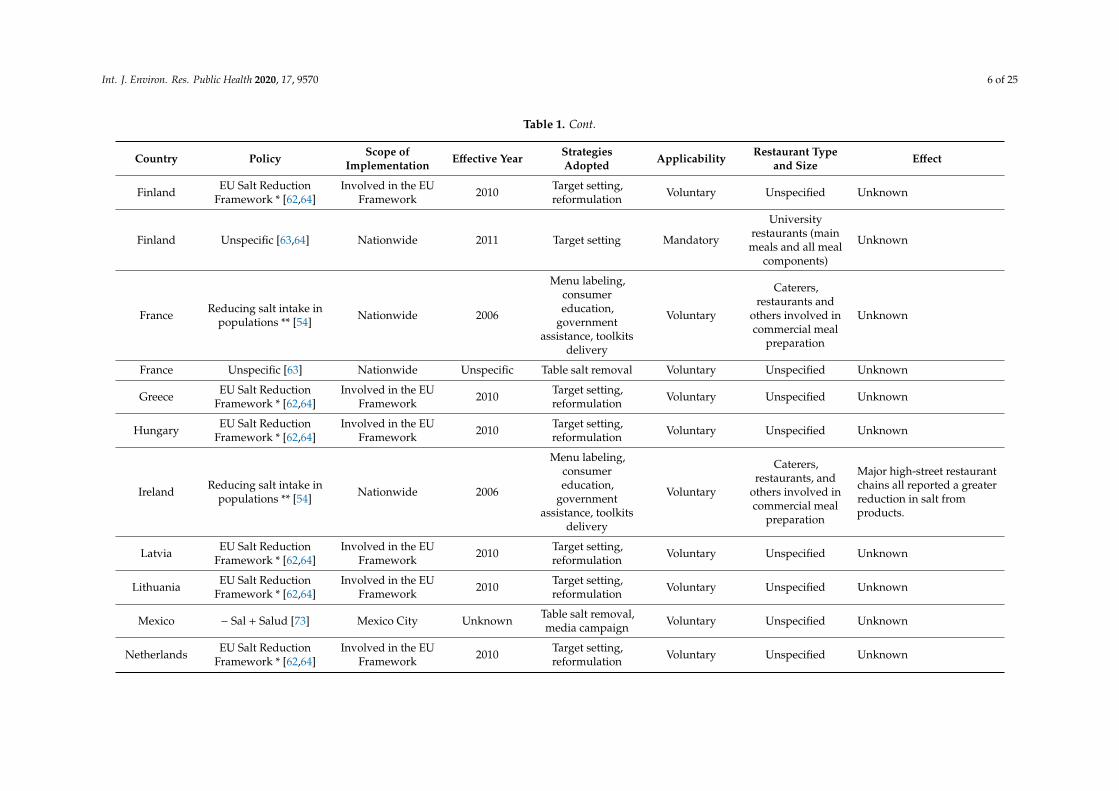
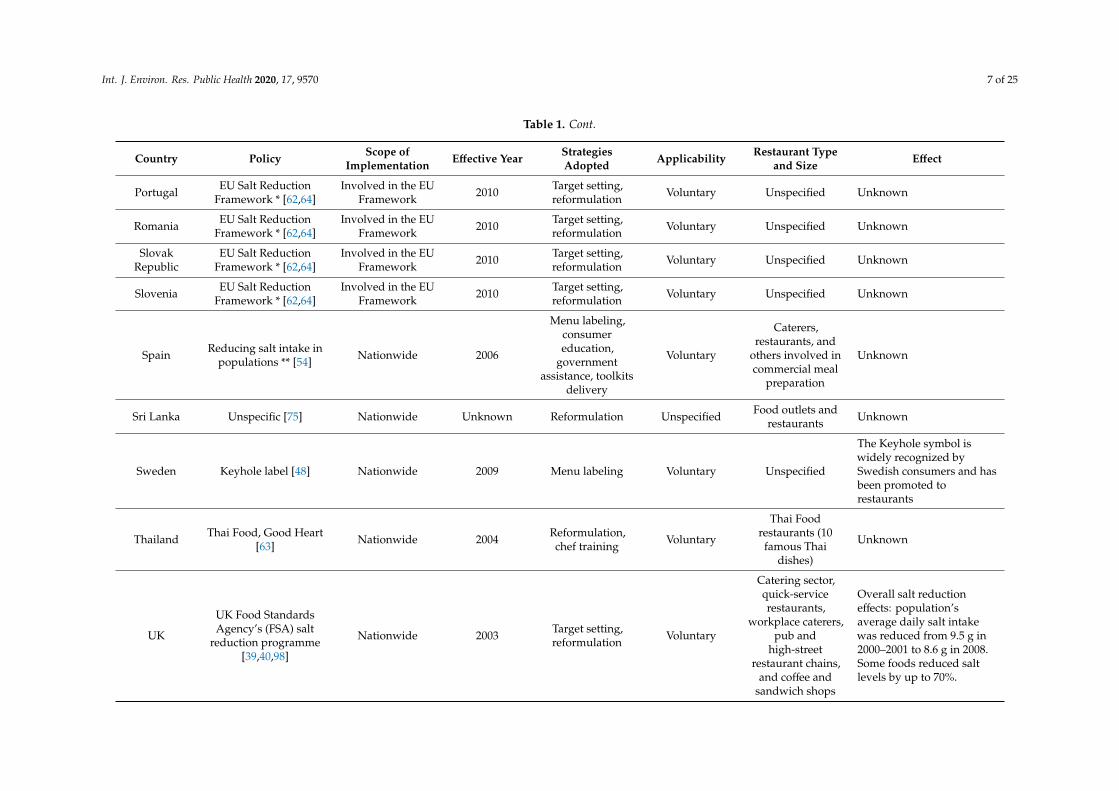
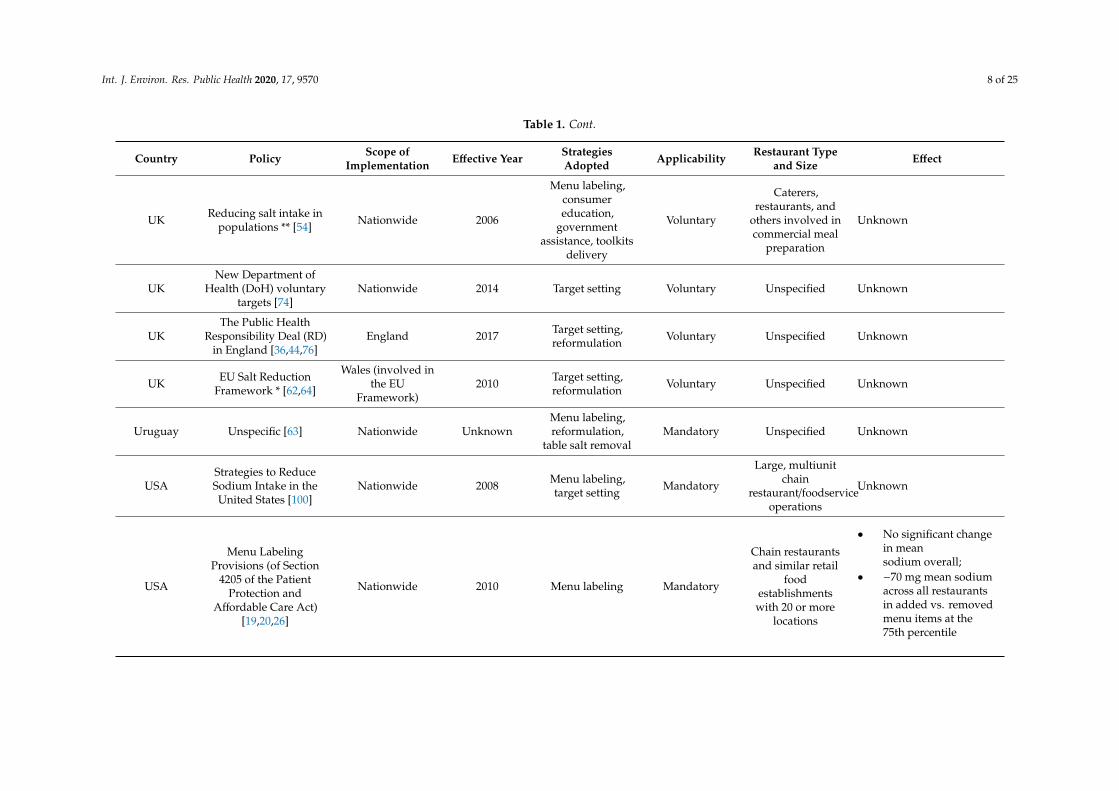
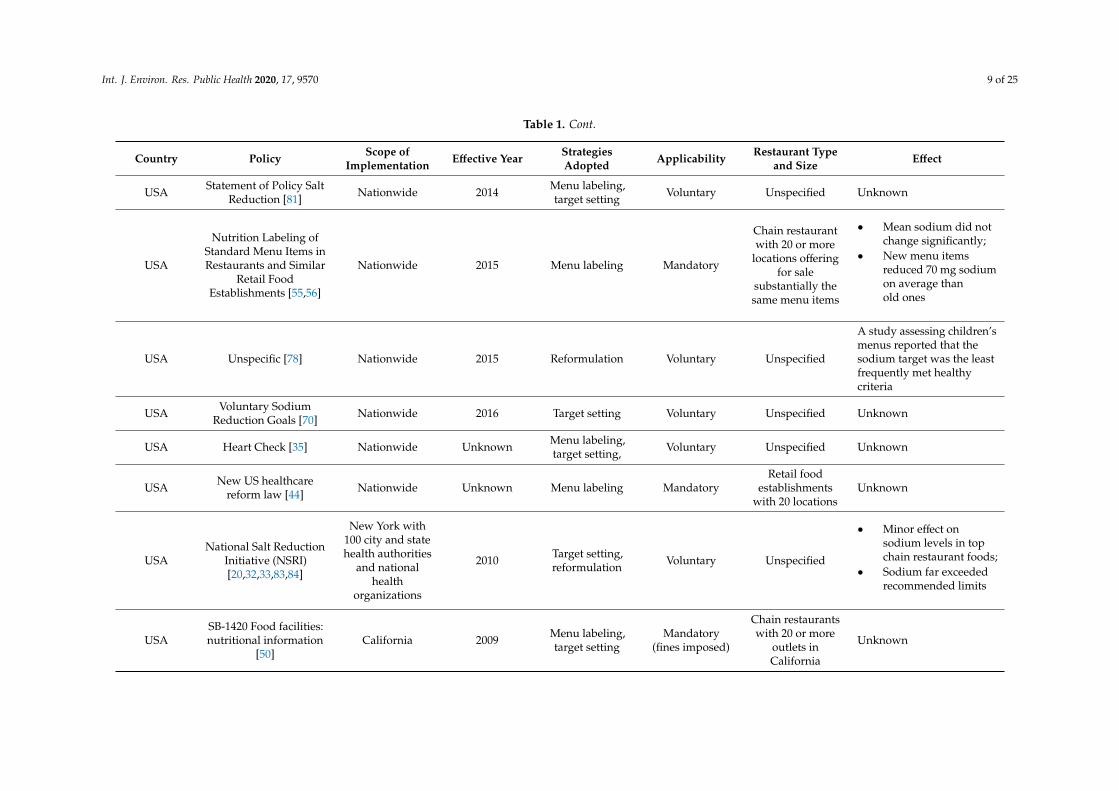
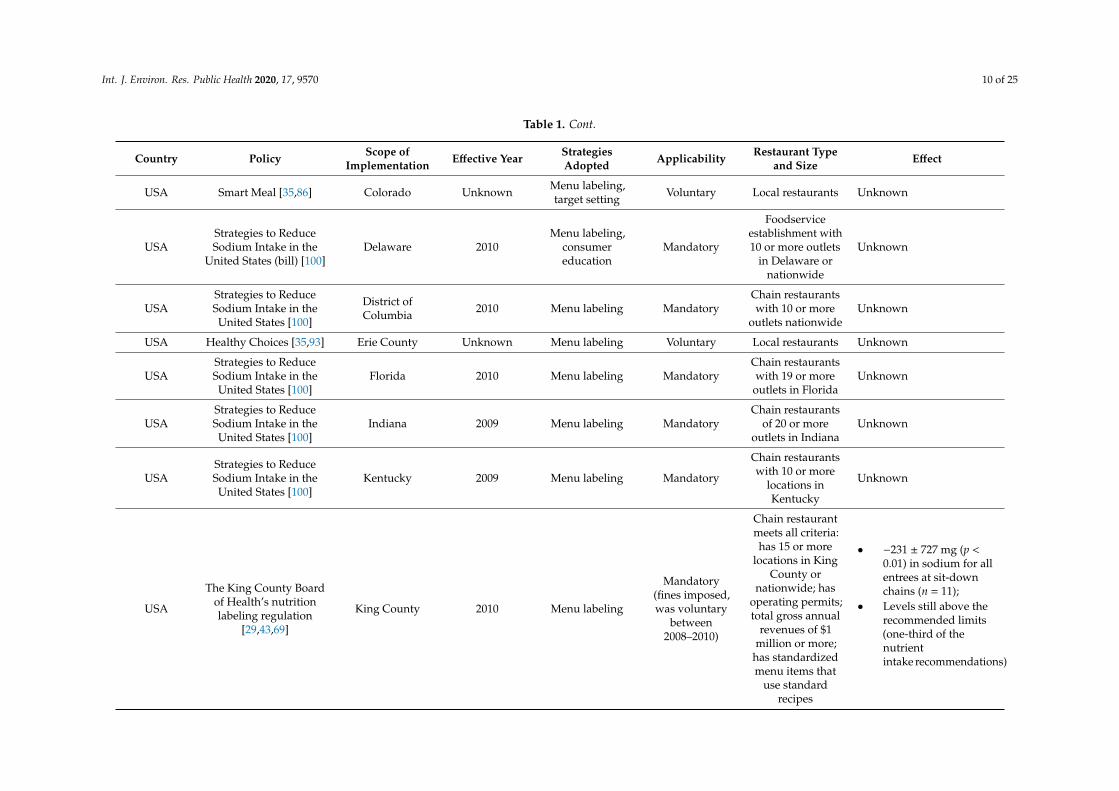
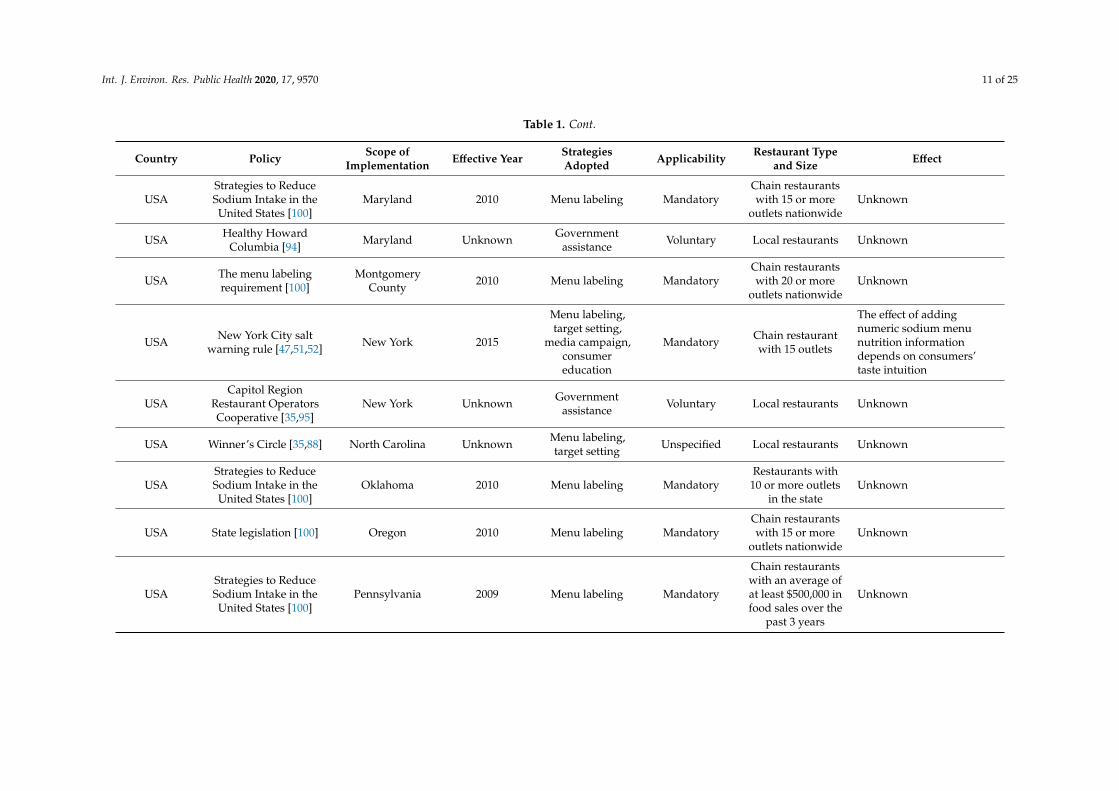
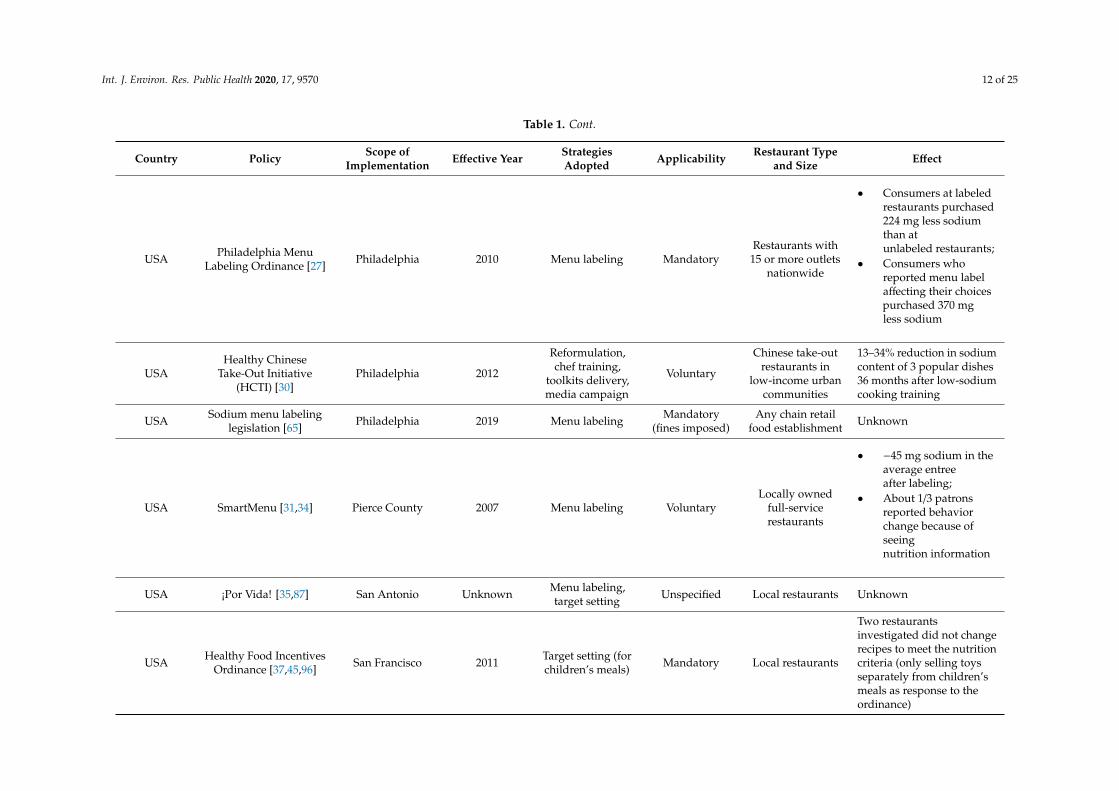
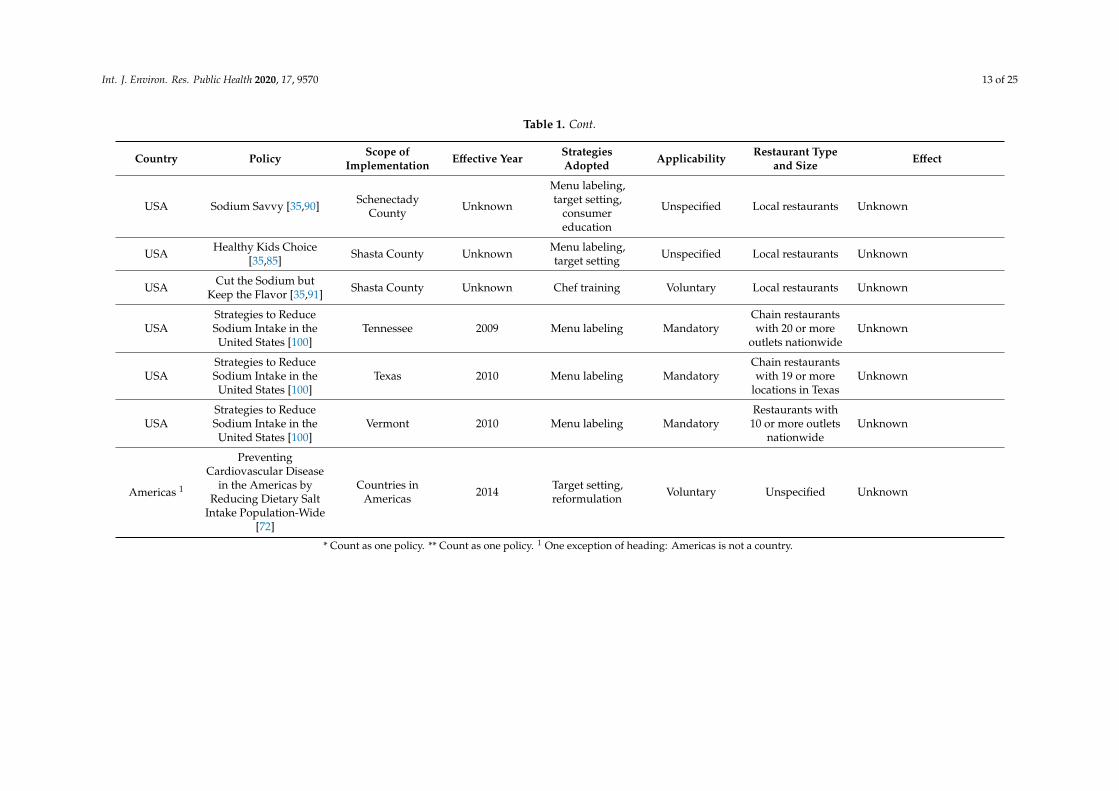
A total of 795 literature papers were detected from scientific databases, of which 585 were screenedfor eligibility, and then 54 were selected for full-text review. In addition, 73 relevant grey documentswere found through a website search. After removing irrelevant materials, 78 papers and grey literatureworks were included in the analysis (Figure 1). Out of 58 countries and regions, 62 independentpolicies were identified [9,20,24–100]. Most of these policies were implemented in America andEurope, and about half of the policies detected came from different states or cities within the USA.Strategies were identified and summarized as follows: menu labeling (n = 40), target setting (n = 23),reformulation of recipes (n = 13), consumer education (n = 6), chef training (n = 4), governmentassistance (n = 3), toolkits delivery (n = 2), table salt removal (n = 5), and media campaign (n = 3)(Table 1). Most policies were introduced and implemented after 2006, and mandatory regulationsaccounted for about half of these policies (n = 27, 3 with fines). Types of restaurants to which the policycovered were mostly chain restaurants with 10 or more outlets.
Int. J. Environ. Res. Public Health 2020, 17, x 3 of 25
2.3. Data Extraction
Key information of each independent policy was compiled into an Excel spreadsheet. The extracted information included the region in which the policy was implemented, enforcement department, date of passage and/or implementation, whether the policy was voluntary or mandatory, main types of strategies, and what the effect was, if any. For the most commonly used strategies, more detailed information, including specific requirements and conditions of restaurants involved, was recorded. Two reviewers conducted data extraction independently and then discussed to reach a consensus. In addition, the PRISMA Checklist was used as a guideline [23].
3. Results
A total of 795 literature papers were detected from scientific databases, of which 585 were screened for eligibility, and then 54 were selected for full-text review. In addition, 73 relevant grey documents were found through a website search. After removing irrelevant materials, 78 papers and grey literature works were included in the analysis (Figure 1). Out of 58 countries and regions, 62 independent policies were identified [9,20,24–100]. Most of these policies were implemented in America and Europe, and about half of the policies detected came from different states or cities within the USA. Strategies were identified and summarized as follows: menu labeling (n = 40), target setting (n = 23), reformulation of recipes (n = 13), consumer education (n = 6), chef training (n = 4), government assistance (n = 3), toolkits delivery (n = 2), table salt removal (n = 5), and media campaign (n = 3) (Table 1). Most policies were introduced and implemented after 2006, and mandatory regulations accounted for about half of these policies (n = 27, 3 with fines). Types of restaurants to which the policy covered were mostly chain restaurants with 10 or more outlets.
Figure 1. Flow diagram of material selection. Figure 1. Flow diagram of material selection.
Int. J. Environ. Res. Public Health 2020, 17, 9570 4 of 25
Table 1. Characteristics of restaurant salt reduction policies implemented in different countries.
Country Policy Scope ofImplementation Effective Year Strategies
Adopted Applicability Restaurant Typeand Size Effect
Argentina Less Salt, More Life [63] Nationwide 2011 Menu labeling,target setting Mandatory Unspecified Unknown
Argentina An agreement removessalt shakers [77] Buenos Aires 2011 Table salt removal Mandatory Hotel and
restaurant Unknown
Australia
Healthy FoodPartnership (a successor
to “Food and HealthDialogue”) [28]
Nationwide 2015
Target setting,reformulation,
consumereducation
Voluntary Quick servicerestaurants Unknown
Belgium Unspecific [63] Nationwide 2009 Target setting,reformulation Voluntary Unspecified Unknown
Belgium EU Salt ReductionFramework * [62,64]
Involved in the EUFramework 2010 Target setting,
reformulation Voluntary Unspecified Unknown
Bulgaria EU Salt ReductionFramework * [62,64]
Involved in the EUFramework 2010 Target setting,
reformulation Voluntary Unspecified Unknown
CanadaHealth Canada’s
Healthy Eating Strategy[25]
Nationwide 2003 Menu labeling VoluntaryRestaurants and
food servicesestablishments
A study comparedlaboratory values withNutrition Facts table (NFt)values of foods fromsupermarkets, bakeries, andrestaurants showed:
• 16.7% (n = 169) offoods exceeding ±20%of the NFt
• Sodium was the leastaccurate content (n =49, 18.4%), allunderreported thanlaboratory values
Int. J. Environ. Res. Public Health 2020, 17, 9570 5 of 25
Table 1. Cont.
Country Policy Scope ofImplementation Effective Year Strategies
Adopted Applicability Restaurant Typeand Size Effect
CanadaSodium Reduction
Strategy for Canada[49,79]
Nationwide 2010 Menu labeling,target setting Voluntary
Restaurants andfood services
establishmentswith a high degreeof standardization
• −25 mg (p < 0.001)sodium perserving overall;
• There were increasesand decreases indifferent kinds of food;
• −220 mg (a decline of19%) inreduced-sodium foods;
• No change inpercentage of foodsexceedingrecommended sodiumintake (1500 mg and2300 mg per day)
CanadaInformed Dining
program (IDP)[24,59–61]
Province of BritishColumbia 2012 Menu labeling Voluntary
Range from smallindependent cafes
to nationalrestaurant chains
Little or no impact
ChinaHealthy Restaurant (in
National HealthyLifestyle Action) [99]
Nationwide 2013
Menu labeling,reformulation,
consumereducation, chef
training
Voluntary Unspecified Unknown
China “EatSmart RestaurantStar+” Campaign [53] Hong Kong Unknown Menu labeling Voluntary Unspecified Unknown
Costa Rica Unspecific [73] Nationwide Unknown Table salt removal Voluntary Unspecified Unknown
Finland Reducing salt intake inpopulations ** [54] Nationwide 2006
Menu labeling,consumereducation,
governmentassistance, toolkits
delivery
Voluntary
Caterers,restaurants and
others involved incommercial meal
preparation
Unknown
Int. J. Environ. Res. Public Health 2020, 17, 9570 6 of 25
Table 1. Cont.
Country Policy Scope ofImplementation Effective Year Strategies
Adopted Applicability Restaurant Typeand Size Effect
Finland EU Salt ReductionFramework * [62,64]
Involved in the EUFramework 2010 Target setting,
reformulation Voluntary Unspecified Unknown
Finland Unspecific [63,64] Nationwide 2011 Target setting Mandatory
Universityrestaurants (mainmeals and all meal
components)
Unknown
France Reducing salt intake inpopulations ** [54] Nationwide 2006
Menu labeling,consumereducation,
governmentassistance, toolkits
delivery
Voluntary
Caterers,restaurants and
others involved incommercial meal
preparation
Unknown
France Unspecific [63] Nationwide Unspecific Table salt removal Voluntary Unspecified Unknown
Greece EU Salt ReductionFramework * [62,64]
Involved in the EUFramework 2010 Target setting,
reformulation Voluntary Unspecified Unknown
Hungary EU Salt ReductionFramework * [62,64]
Involved in the EUFramework 2010 Target setting,
reformulation Voluntary Unspecified Unknown
Ireland Reducing salt intake inpopulations ** [54] Nationwide 2006
Menu labeling,consumereducation,
governmentassistance, toolkits
delivery
Voluntary
Caterers,restaurants, and
others involved incommercial meal
preparation
Major high-street restaurantchains all reported a greaterreduction in salt fromproducts.
Latvia EU Salt ReductionFramework * [62,64]
Involved in the EUFramework 2010 Target setting,
reformulation Voluntary Unspecified Unknown
Lithuania EU Salt ReductionFramework * [62,64]
Involved in the EUFramework 2010 Target setting,
reformulation Voluntary Unspecified Unknown
Mexico − Sal + Salud [73] Mexico City Unknown Table salt removal,media campaign Voluntary Unspecified Unknown
Netherlands EU Salt ReductionFramework * [62,64]
Involved in the EUFramework 2010 Target setting,
reformulation Voluntary Unspecified Unknown
Int. J. Environ. Res. Public Health 2020, 17, 9570 7 of 25
Table 1. Cont.
Country Policy Scope ofImplementation Effective Year Strategies
Adopted Applicability Restaurant Typeand Size Effect
Portugal EU Salt ReductionFramework * [62,64]
Involved in the EUFramework 2010 Target setting,
reformulation Voluntary Unspecified Unknown
Romania EU Salt ReductionFramework * [62,64]
Involved in the EUFramework 2010 Target setting,
reformulation Voluntary Unspecified Unknown
SlovakRepublic
EU Salt ReductionFramework * [62,64]
Involved in the EUFramework 2010 Target setting,
reformulation Voluntary Unspecified Unknown
Slovenia EU Salt ReductionFramework * [62,64]
Involved in the EUFramework 2010 Target setting,
reformulation Voluntary Unspecified Unknown
Spain Reducing salt intake inpopulations ** [54] Nationwide 2006
Menu labeling,consumereducation,
governmentassistance, toolkits
delivery
Voluntary
Caterers,restaurants, and
others involved incommercial meal
preparation
Unknown
Sri Lanka Unspecific [75] Nationwide Unknown Reformulation Unspecified Food outlets andrestaurants Unknown
Sweden Keyhole label [48] Nationwide 2009 Menu labeling Voluntary Unspecified
The Keyhole symbol iswidely recognized bySwedish consumers and hasbeen promoted torestaurants
Thailand Thai Food, Good Heart[63] Nationwide 2004 Reformulation,
chef training Voluntary
Thai Foodrestaurants (10famous Thai
dishes)
Unknown
UK
UK Food StandardsAgency’s (FSA) salt
reduction programme[39,40,98]
Nationwide 2003 Target setting,reformulation Voluntary
Catering sector,quick-servicerestaurants,
workplace caterers,pub and
high-streetrestaurant chains,
and coffee andsandwich shops
Overall salt reductioneffects: population’saverage daily salt intakewas reduced from 9.5 g in2000–2001 to 8.6 g in 2008.Some foods reduced saltlevels by up to 70%.
Int. J. Environ. Res. Public Health 2020, 17, 9570 8 of 25
Table 1. Cont.
Country Policy Scope ofImplementation Effective Year Strategies
Adopted Applicability Restaurant Typeand Size Effect
UK Reducing salt intake inpopulations ** [54] Nationwide 2006
Menu labeling,consumereducation,
governmentassistance, toolkits
delivery
Voluntary
Caterers,restaurants, and
others involved incommercial meal
preparation
Unknown
UKNew Department of
Health (DoH) voluntarytargets [74]
Nationwide 2014 Target setting Voluntary Unspecified Unknown
UKThe Public Health
Responsibility Deal (RD)in England [36,44,76]
England 2017 Target setting,reformulation Voluntary Unspecified Unknown
UK EU Salt ReductionFramework * [62,64]
Wales (involved inthe EU
Framework)2010 Target setting,
reformulation Voluntary Unspecified Unknown
Uruguay Unspecific [63] Nationwide UnknownMenu labeling,reformulation,
table salt removalMandatory Unspecified Unknown
USAStrategies to ReduceSodium Intake in theUnited States [100]
Nationwide 2008 Menu labeling,target setting Mandatory
Large, multiunitchain
restaurant/foodserviceoperations
Unknown
USA
Menu LabelingProvisions (of Section
4205 of the PatientProtection and
Affordable Care Act)[19,20,26]
Nationwide 2010 Menu labeling Mandatory
Chain restaurantsand similar retail
foodestablishmentswith 20 or more
locations
• No significant changein meansodium overall;
• −70 mg mean sodiumacross all restaurantsin added vs. removedmenu items at the75th percentile
Int. J. Environ. Res. Public Health 2020, 17, 9570 9 of 25
Table 1. Cont.
Country Policy Scope ofImplementation Effective Year Strategies
Adopted Applicability Restaurant Typeand Size Effect
USA Statement of Policy SaltReduction [81] Nationwide 2014 Menu labeling,
target setting Voluntary Unspecified Unknown
USA
Nutrition Labeling ofStandard Menu Items inRestaurants and Similar
Retail FoodEstablishments [55,56]
Nationwide 2015 Menu labeling Mandatory
Chain restaurantwith 20 or more
locations offeringfor sale
substantially thesame menu items
• Mean sodium did notchange significantly;
• New menu itemsreduced 70 mg sodiumon average thanold ones
USA Unspecific [78] Nationwide 2015 Reformulation Voluntary Unspecified
A study assessing children’smenus reported that thesodium target was the leastfrequently met healthycriteria
USA Voluntary SodiumReduction Goals [70] Nationwide 2016 Target setting Voluntary Unspecified Unknown
USA Heart Check [35] Nationwide Unknown Menu labeling,target setting, Voluntary Unspecified Unknown
USA New US healthcarereform law [44] Nationwide Unknown Menu labeling Mandatory
Retail foodestablishments
with 20 locationsUnknown
USANational Salt Reduction
Initiative (NSRI)[20,32,33,83,84]
New York with100 city and statehealth authorities
and nationalhealth
organizations
2010 Target setting,reformulation Voluntary Unspecified
• Minor effect onsodium levels in topchain restaurant foods;
• Sodium far exceededrecommended limits
USASB-1420 Food facilities:nutritional information
[50]California 2009 Menu labeling,
target settingMandatory
(fines imposed)
Chain restaurantswith 20 or more
outlets inCalifornia
Unknown
Int. J. Environ. Res. Public Health 2020, 17, 9570 10 of 25
Table 1. Cont.
Country Policy Scope ofImplementation Effective Year Strategies
Adopted Applicability Restaurant Typeand Size Effect
USA Smart Meal [35,86] Colorado Unknown Menu labeling,target setting Voluntary Local restaurants Unknown
USAStrategies to ReduceSodium Intake in the
United States (bill) [100]Delaware 2010
Menu labeling,consumereducation
Mandatory
Foodserviceestablishment with10 or more outlets
in Delaware ornationwide
Unknown
USAStrategies to ReduceSodium Intake in theUnited States [100]
District ofColumbia 2010 Menu labeling Mandatory
Chain restaurantswith 10 or more
outlets nationwideUnknown
USA Healthy Choices [35,93] Erie County Unknown Menu labeling Voluntary Local restaurants Unknown
USAStrategies to ReduceSodium Intake in theUnited States [100]
Florida 2010 Menu labeling MandatoryChain restaurantswith 19 or more
outlets in FloridaUnknown
USAStrategies to ReduceSodium Intake in theUnited States [100]
Indiana 2009 Menu labeling MandatoryChain restaurants
of 20 or moreoutlets in Indiana
Unknown
USAStrategies to ReduceSodium Intake in theUnited States [100]
Kentucky 2009 Menu labeling Mandatory
Chain restaurantswith 10 or more
locations inKentucky
Unknown
USA
The King County Boardof Health’s nutritionlabeling regulation
[29,43,69]
King County 2010 Menu labeling
Mandatory(fines imposed,was voluntary
between2008–2010)
Chain restaurantmeets all criteria:has 15 or more
locations in KingCounty or
nationwide; hasoperating permits;total gross annual
revenues of $1million or more;
has standardizedmenu items that
use standardrecipes
• −231 ± 727 mg (p <0.01) in sodium for allentrees at sit-downchains (n = 11);
• Levels still above therecommended limits(one-third of thenutrientintake recommendations)
Int. J. Environ. Res. Public Health 2020, 17, 9570 11 of 25
Table 1. Cont.
Country Policy Scope ofImplementation Effective Year Strategies
Adopted Applicability Restaurant Typeand Size Effect
USAStrategies to ReduceSodium Intake in theUnited States [100]
Maryland 2010 Menu labeling MandatoryChain restaurantswith 15 or more
outlets nationwideUnknown
USA Healthy HowardColumbia [94] Maryland Unknown Government
assistance Voluntary Local restaurants Unknown
USA The menu labelingrequirement [100]
MontgomeryCounty 2010 Menu labeling Mandatory
Chain restaurantswith 20 or more
outlets nationwideUnknown
USA New York City saltwarning rule [47,51,52] New York 2015
Menu labeling,target setting,
media campaign,consumereducation
Mandatory Chain restaurantwith 15 outlets
The effect of addingnumeric sodium menunutrition informationdepends on consumers’taste intuition
USACapitol Region
Restaurant OperatorsCooperative [35,95]
New York Unknown Governmentassistance Voluntary Local restaurants Unknown
USA Winner’s Circle [35,88] North Carolina Unknown Menu labeling,target setting Unspecified Local restaurants Unknown
USAStrategies to ReduceSodium Intake in theUnited States [100]
Oklahoma 2010 Menu labeling MandatoryRestaurants with
10 or more outletsin the state
Unknown
USA State legislation [100] Oregon 2010 Menu labeling MandatoryChain restaurantswith 15 or more
outlets nationwideUnknown
USAStrategies to ReduceSodium Intake in theUnited States [100]
Pennsylvania 2009 Menu labeling Mandatory
Chain restaurantswith an average ofat least $500,000 infood sales over the
past 3 years
Unknown
Int. J. Environ. Res. Public Health 2020, 17, 9570 12 of 25
Table 1. Cont.
Country Policy Scope ofImplementation Effective Year Strategies
Adopted Applicability Restaurant Typeand Size Effect
USA Philadelphia MenuLabeling Ordinance [27] Philadelphia 2010 Menu labeling Mandatory
Restaurants with15 or more outlets
nationwide
• Consumers at labeledrestaurants purchased224 mg less sodiumthan atunlabeled restaurants;
• Consumers whoreported menu labelaffecting their choicespurchased 370 mgless sodium
USAHealthy Chinese
Take-Out Initiative(HCTI) [30]
Philadelphia 2012
Reformulation,chef training,
toolkits delivery,media campaign
Voluntary
Chinese take-outrestaurants in
low-income urbancommunities
13–34% reduction in sodiumcontent of 3 popular dishes36 months after low-sodiumcooking training
USA Sodium menu labelinglegislation [65] Philadelphia 2019 Menu labeling Mandatory
(fines imposed)Any chain retail
food establishment Unknown
USA SmartMenu [31,34] Pierce County 2007 Menu labeling VoluntaryLocally owned
full-servicerestaurants
• −45 mg sodium in theaverage entreeafter labeling;
• About 1/3 patronsreported behaviorchange because ofseeingnutrition information
USA ¡Por Vida! [35,87] San Antonio Unknown Menu labeling,target setting Unspecified Local restaurants Unknown
USA Healthy Food IncentivesOrdinance [37,45,96] San Francisco 2011 Target setting (for
children’s meals) Mandatory Local restaurants
Two restaurantsinvestigated did not changerecipes to meet the nutritioncriteria (only selling toysseparately from children’smeals as response to theordinance)
Int. J. Environ. Res. Public Health 2020, 17, 9570 13 of 25
Table 1. Cont.
Country Policy Scope ofImplementation Effective Year Strategies
Adopted Applicability Restaurant Typeand Size Effect
USA Sodium Savvy [35,90] SchenectadyCounty Unknown
Menu labeling,target setting,
consumereducation
Unspecified Local restaurants Unknown
USA Healthy Kids Choice[35,85] Shasta County Unknown Menu labeling,
target setting Unspecified Local restaurants Unknown
USA Cut the Sodium butKeep the Flavor [35,91] Shasta County Unknown Chef training Voluntary Local restaurants Unknown
USAStrategies to ReduceSodium Intake in theUnited States [100]
Tennessee 2009 Menu labeling MandatoryChain restaurantswith 20 or more
outlets nationwideUnknown
USAStrategies to ReduceSodium Intake in theUnited States [100]
Texas 2010 Menu labeling MandatoryChain restaurantswith 19 or more
locations in TexasUnknown
USAStrategies to ReduceSodium Intake in theUnited States [100]
Vermont 2010 Menu labeling MandatoryRestaurants with
10 or more outletsnationwide
Unknown
Americas 1
PreventingCardiovascular Disease
in the Americas byReducing Dietary Salt
Intake Population-Wide[72]
Countries inAmericas 2014 Target setting,
reformulation Voluntary Unspecified Unknown
* Count as one policy. ** Count as one policy. 1 One exception of heading: Americas is not a country.
Int. J. Environ. Res. Public Health 2020, 17, 9570 14 of 25
3.1. Menu Labeling
For salt reduction in restaurants, labeling nutrients including sodium of menu items was themost commonly used strategy. Different policies have various criteria for contents labeled on themenu. Besides sodium, calories are the most common nutritional information required for menulabeling, with the aim of obesity prevention [55]. Most relevant policies covered all standard menuitems in chain restaurants. Menu labels can take several forms. Six policies mentioned using iconsincluding obvious graphic salt warnings to intuitively display whether the dish is good or bad forhealth [20,47,48,50–53,58,65]. For example, the “Keyhole” symbol in Sweden [101] means the foodcontains less sugar and salt, more fiber and whole grains, or less fat than food products without thesymbol in the same product group. In Hong Kong, the “EatSmart Restaurant Star+” Campaign useda colorful mark and stars to indicate the healthy feature of dishes and restaurants. Dish with less fat,salt, and sugar can obtain a “3 Less” mark. Restaurants can get up to three stars by offering “More Fruitand Vegetables” dishes, “3 Less” dishes, and the “EatSmart Promotion” on a daily basis [53].
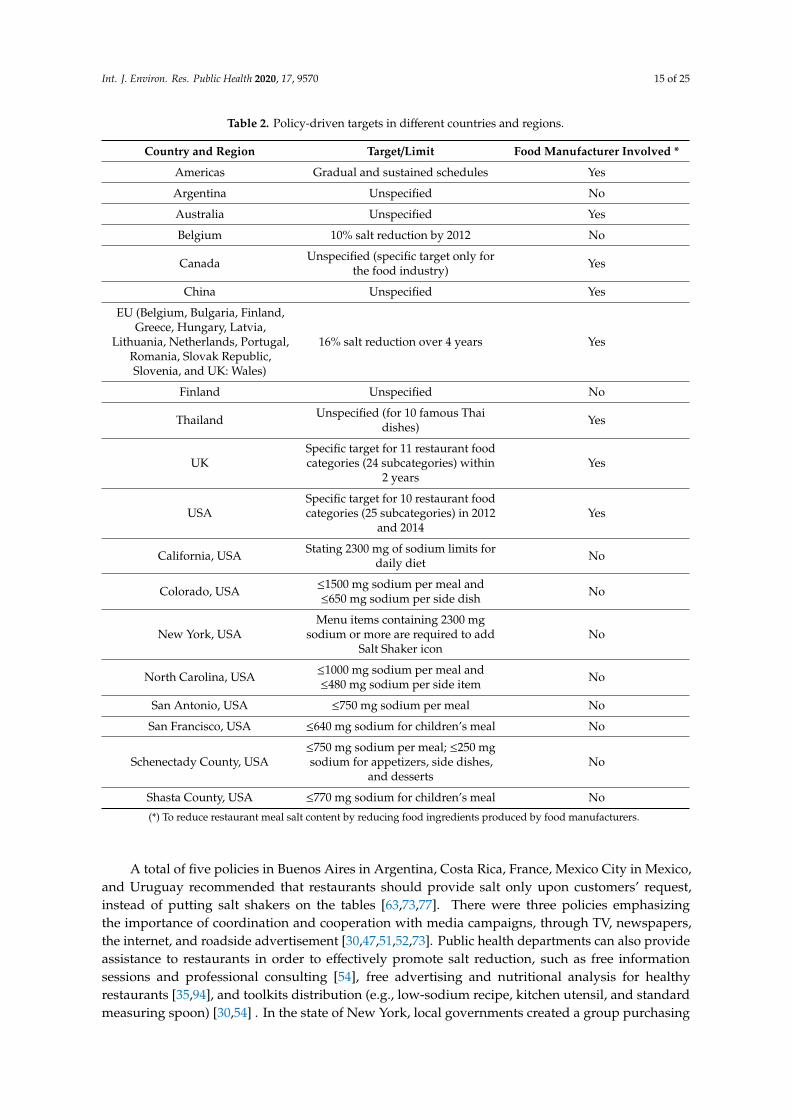
3.2. Target Setting and Reformulation
Some policies set mandatory or recommended salt reduction targets or salt limits for restaurants,and this strategy was often combined with the reformulation of recipes. These strategies wereimplemented in 32 countries and regions (Table 2). Among them, Australia, Belgium, China, UK,USA, the EU, and the Americas explicitly suggested restaurants to reformulate dishes to meet saltreduction targets. Only six target-setting policies were mandatory, and one in California involved fines.Types of restaurants involved were more diverse, such as quick-service restaurants, cafeterias, and localrestaurants. There were 13 policies that set specific salt reduction objectives, which can be divided intotwo general patterns: limit of maximum sodium content allowed in dishes or meals and goals for saltreduction by a certain percentage over a specific period of time (implemented in Belgium, UK, USA,and the EU). Different regions have different requirements for the upper sodium limit, which variedfrom 750 mg to 2300 mg sodium per meal. The UK and USA have established category-specifictargets for salt levels in restaurant foods [76,84]. For restaurants that sold dishes exceeding thelimit, there would be several restrictions, for example prohibiting the sale, requiring warning marks,and restricting giving away incentive items (such as free toys for children’s meals). San Francisco andShasta County of California State also have special requirements for children’s meals [45,85].
Relevant methods were given to reduce salt in dishes, including reformulating recipes,providing salt separately to the consumer instead of adding salt directly to the meals [75], adjusting saltcontent of dishes according to the requirements of customers [99], using less sauce or soy sauce,enhancing flavor using additional herbs and spices, and replacing canned vegetables with freshones [30]. It is important to reduce salt content in ingredients, since chain restaurants tend to usepackaged food (such as cheese and processed meat) to prepare dishes. This requires cooperation withfood manufacturers [28,39,40,63,99]. Eight policies have combined restaurant salt reduction with foodproducers, in terms of involving the whole food industry in the salt reduction process.
3.3. Other Strategies
As education is important to build a healthy environment, six policies suggested conductingeducation campaigns to improve consumer awareness, for example, the harm of high salt diets andinstructions on nutritional labels. In addition, China, Thailand, and Philadelphia, and Shasta County inthe USA have introduced salt reduction education for restaurant staff and low-sodium cooking trainingfor chefs to improve their knowledge, awareness, and practical skills for salt reduction. Chef trainingmay include: education regarding the effect of salt on health and disease, recommended salt intake,developing several kinds of low salt dishes, practical methods of salt reduction in cooking, and expertdemonstration [30,35,91,99].
Int. J. Environ. Res. Public Health 2020, 17, 9570 15 of 25
Table 2. Policy-driven targets in different countries and regions.
Country and Region Target/Limit Food Manufacturer Involved *
Americas Gradual and sustained schedules Yes
Argentina Unspecified No
Australia Unspecified Yes
Belgium 10% salt reduction by 2012 No
Canada Unspecified (specific target only forthe food industry) Yes
China Unspecified Yes
EU (Belgium, Bulgaria, Finland,Greece, Hungary, Latvia,
Lithuania, Netherlands, Portugal,Romania, Slovak Republic,Slovenia, and UK: Wales)
16% salt reduction over 4 years Yes
Finland Unspecified No
Thailand Unspecified (for 10 famous Thaidishes) Yes
UKSpecific target for 11 restaurant foodcategories (24 subcategories) within
2 yearsYes
USASpecific target for 10 restaurant foodcategories (25 subcategories) in 2012
and 2014Yes
California, USA Stating 2300 mg of sodium limits fordaily diet No
Colorado, USA ≤1500 mg sodium per meal and≤650 mg sodium per side dish No
New York, USAMenu items containing 2300 mg
sodium or more are required to addSalt Shaker icon
No
North Carolina, USA ≤1000 mg sodium per meal and≤480 mg sodium per side item No
San Antonio, USA ≤750 mg sodium per meal No
San Francisco, USA ≤640 mg sodium for children’s meal No
Schenectady County, USA≤750 mg sodium per meal; ≤250 mgsodium for appetizers, side dishes,
and dessertsNo
Shasta County, USA ≤770 mg sodium for children’s meal No
(*) To reduce restaurant meal salt content by reducing food ingredients produced by food manufacturers.
A total of five policies in Buenos Aires in Argentina, Costa Rica, France, Mexico City in Mexico,and Uruguay recommended that restaurants should provide salt only upon customers’ request,instead of putting salt shakers on the tables [63,73,77]. There were three policies emphasizingthe importance of coordination and cooperation with media campaigns, through TV, newspapers,the internet, and roadside advertisement [30,47,51,52,73]. Public health departments can also provideassistance to restaurants in order to effectively promote salt reduction, such as free informationsessions and professional consulting [54], free advertising and nutritional analysis for healthyrestaurants [35,94], and toolkits distribution (e.g., low-sodium recipe, kitchen utensil, and standardmeasuring spoon) [30,54] . In the state of New York, local governments created a group purchasing
Int. J. Environ. Res. Public Health 2020, 17, 9570 16 of 25
organization to enhance buying power for involved restaurants by increasing purchase volume anddecreasing the cost of low-sodium ingredients [35,95].
3.4. Effectiveness of Policies
There was limited evidence about the effects of policies after implementation. The results of theexisting evaluation were also inconsistent. Of the 17 studies reporting the evaluation after policyimplementation, 6 detected positive impacts, 8 showed little or no effect, and 3 described the overallsalt reduction effects (not focused on restaurants). The positive impacts mainly came from menulabeling policies, which included the decrease in sodium content in restaurant meals [24,29,30,49,54],the improvement of the salt reduction awareness of chefs and owners [30], and affecting consumer’schoices when purchasing meals with labels [27]. Although it has not yet shown remarkable impact, themenu nutrition information increased the consciousness of the chefs and restaurant operators, as theysometimes changed portion sizes or ingredients after seeing the results of menu analyses [31], or chefsreduced salt when creating new menu items [55,56].
4. Discussion
This review provides the first global overview of restaurant salt reduction policies. With theincrease in foods consumed out of households, many countries have included the food service sectorinto their national salt reduction program and gained valuable experience. Population salt reductionrequires coordinated efforts from multiple sectors, including restaurants, the food manufacturingindustry, and other relevant businesses. Salt and salt-based condiments, with a mainly sensory role,are added to foods to enhance the flavor. Thus, individual intervention may cause a noticeabledifference in taste and make salt reduction hard to accept. Therefore, multiple strategies for all foods inthe market are more effective to help consumers to form low-salt-eating habits whether at home or outof households by adapting taste buds and enhancing health awareness.
There are many different characteristics between restaurants and food processing industries.The interaction between sellers and consumers is the most important factor, directly affecting theoperation of restaurants and policy implementation. Thus, various salt reduction strategies wereadopted in different areas, as a one-size-fits-all policy could never fit the needs of all restaurants.The policy orientations can be divided into two types. One is to help consumers make moreinformed decisions when choosing restaurant foods, which is practiced as information disclosureand education. The other is encouraging restaurants to offer healthier food. This can be achieved byestablishing mandatory or voluntary targets and conducting recipe reformulation. The applicabilityand effectiveness of both buyer- and seller-driven policies will be discussed in the following sections.
4.1. Buyer-Driven Policies
Food labels can help consumers identify healthier foods by clearly showing nutrition contentor health degree and have been widely utilized in pre-packaged foods [102]. Finland required saltlabeling and inclusion of a warning mark for products with excess salt content early in the 1980s [103].This strategy has just begun to gain popularity among restaurant foods. For example, Sweden expandedthe “Keyhole” symbol certification from pre-packaged foods to restaurant meals in 2009 [48]. In the earlystage, menu labels included only the amount of calories, aiming to support obesity prevention [104,105],and have now been extended to salt. The current display of the menu label is to list the nutritionalinformation or place a warning icon next to menu items. Colored symbols like “Traffic light” icons and“Nutri-score”, which have been well applied in pre-packaged food [106–108], may also be promoted torestaurant menu items.
However, evidence was mixed and inconclusive regarding the impact of menu labeling.Some studies suggested that providing nutrition information of food service items was associatedwith informed choices for healthier dishes at restaurants [109], as well as the improvement of thehealth degree of menu items [24,49,110]. On the contrary, some researchers think that labels may cause
Int. J. Environ. Res. Public Health 2020, 17, 9570 17 of 25
consumers to choose dishes with unhealthy tag or warning mark as they are often regarded as deliciousfoods [27,47]. There is also concern that nutrition labels could potentially cause inequality betweendifferent socioeconomic groups, since understanding label content and choosing healthier food requireshealth literacy [111]. In this case, it is necessary to enhance the health literacy of the general public bymedia campaigns and education [112], to improve the effectiveness of menu labeling strategy.
Although there are few strategies focusing on education in restaurant policies, it is still a priorityto raise consumer’s awareness of healthy diet. Among many national or regional salt reductionpolicies, education for the general public is an important part [113]. That is, consumer educationhas been integrated into broader health education, instead of aiming at restaurants independently.With a more in-depth understanding of salt reduction, the general public would consciously choosehealthier restaurants and dishes.
4.2. Seller-Driven Policies
While encouraging consumers to choose healthier options through menu labeling can encouragehealth-conscious behavior, restaurants themselves also need to make changes to ensure that thereare healthy options available. This is primarily achieved by setting an achievable target in order togradually reduce salt content in meals. Specific targets vary between policies and were set mainlybased on national dietary intake recommendations. For example, restaurants in California wereasked to claim a recommended sodium intake of less than 2300 mg/d on menus in accordance withUS Department of Agriculture guidelines [114], and the New York City salt warning rule requiredrestaurants to place a Salt Shaker warning icon on any dish with more than 2300 mg sodium.
Most of the policies reviewed in this paper set a general upper limit of salt content for all foods onthe restaurant’s menu. While based on the experience of the food industry, targeted salt reduction inspecific groups of foods would be more effective [40]. A study showed that the progress of salt reductionin restaurants varied depending on food categories [49]. It was found that the salt content in some disheswas even increased and offset by a large reduction in others. For this reason, a general maximum targetmay be useful in encouraging restaurants to remove dishes with salt content exceeding daily adequateintake level, but this may not work for many other dishes. At present, the UK and the USA haveset specific targets for key food categories [76,84]. The Healthy Food Partnership action in Australiaalso planned to introduce a specific reformulation plan of Quick Service Restaurants [28]. However,establishing category-specific targets like pre-packaged food is demanding work, which would requirea comprehensive survey of existing restaurant foods, evaluating their contribution to population saltintake, and monitoring the progress under the oversight of the administration department. This needsto be supported by the popularization of menu labeling laws.
Although some evidence has demonstrated the effectiveness of setting targets and reformulatingrecipes to reduce salt in restaurants, there are still obstacles to implementing these plans in all types ofrestaurants. Reformulation and developing new dishes may be challenging and cost more time andmoney. Thus, the restaurant operators may not be willing to participate in the voluntary initiative,unless making commitments can generate extra profits [115]. Besides, as the revised targets becomemore challenging over time, participants are more likely to drop out of the agreement. What mayhelp to improve this situation is the support of the food industry. Directly reducing salt content in theingredients used for food preparation would bypass the technical limits on reformulating menu items.In Canada, food manufactures are asked to apply guiding benchmark sodium reduction levels to allfood products, including the ingredients destined for restaurant and foodservice sectors [116].
4.3. Applicability of Policies
A unified official policy may not be flexible enough to fit the specific situation of differenttypes of restaurants. Some strategies may work well for a particular type of restaurant but are notsuitable for other restaurants, especially those that lack resources and workforce capacity. Therefore,strategies should be developed in line with local conditions. This is why more policies were targeted at
Int. J. Environ. Res. Public Health 2020, 17, 9570 18 of 25
chain restaurants, as they had stronger management and standardized menu items that use standardrecipes [29]. For example, Canada recommended that restaurants involved in the voluntary policyshould have a high degree of standardization [79]. Some less adopted strategies, which perhapswere limited by objective factors to be widely used as a general method, also provided ideas for saltreduction in restaurants. Take chef training, for example: most fast foods served in quick servicerestaurants are produced by standardized ingredients, so their salt content cannot be changed bychefs, while in Asian countries like China, India, and Thailand, the amount of salt added to dishes islargely determined by the chef when cooking [30,63,117]. Under this circumstance, menu labeling andstandardized low-salt menu are less applicable. Policies adopted for these types of restaurants mayinvolve comprehensive aspects like consumer requirements, health education and chef training.
Current policies have taken diverse catering businesses into account but only set restrictionson sit-down meals. Food delivery services, which have popular in recent years, have rarely beenmentioned in policy measures [118]. It can be assumed that if a restaurant reformulates recipes andreduces salt content in dishes, the food it delivers would also have low salt content. But there is stillthe possibility that restaurant menus and takeaway foods are prepared separately in some restaurants.Besides, it is not clear that menu labels can be seen when people order foods on websites or mobilephones. The construction of a healthy environment in restaurants cannot have an impact on theseconsumers either. Therefore, intervention for delivery food should be introduced in new policy actions.Especially during the COVID-19 pandemic, food delivery service provides a new opportunity for thecatering industry, which might be widely adopted by restaurants in the future.
Moreover, in some low- and middle-income countries, foods sold in informal markets playan important role in people’s diets [119,120]. Their safety and health issues should also cause concern,particularly in more vulnerable communities. Strategies that work for chain restaurants like menulabeling and target setting would not be suitable for small businesses, as there are no standardizedprocesses and recipes. Referring to the experience of food safety management [121], health educationcan be integrated into food hygiene measures among informal food vendors. Meanwhile, guidance forlow-salt cooking can be provided together with safe food handling practices.
4.4. Evaluation of Policies
Some policies have obtained the support of the catering industry and demonstrated success in saltcontent and consumer feedback [27,29–31,79]. Take Ireland, for example: major chain restaurants havereported reducing salt in meals, and 250 hotels have committed to not adding salt to children’s food atpreparation, cooking, or serving stages [62,64]. However, some policies appeared to have had little or noimpact [19,24,26,58,78,100]. Most of the salt content information came from menu labels and restaurantwebsites, while the accuracy of the labels needs to be verified. Overall, the implications of restaurantsalt reduction policies remain unclear. A major reason is that, since the national salt reduction initiativesalways cover a broader range including the food industry, the food service sector, environment,and mass media [32], it may not be possible to capture the independent contribution of actionsundertaken in restaurants among such comprehensive approaches. Similarly, menu labeling focusedon restaurants is also combined with calorie labels. Some studies have found that energy content isreduced after labeling regulations, but sodium level is the least likely to meet the requirements [33].In addition, many policies have been enacted relatively recently, so more time is needed to demonstratelong-term effects. When political popularity is not well-established and sustainable, restaurants mayonly make a superficial commitment to participate but do not deliver any real change.
This study found that about half of restaurant policies were delivered as mandatory regulations,while others allowed restaurants to participate voluntarily. Evaluation studies showed that mandatoryapproaches were more likely to achieve positive outcomes, mainly for menu labeling laws [27,29].However, there are still some limitations. Legislation and supervision take up a considerable amount ofnational resources and require more time to enact and implement. For policies that require restaurantsto make changes, such as reformulating recipes to meet salt reduction targets, it would be more
Int. J. Environ. Res. Public Health 2020, 17, 9570 19 of 25
challenging for small businesses. Therefore, target-setting is preferred to be introduced as a voluntarystrategy, which provides operators more flexible choices. Although only big enterprises like chainrestaurants may be willing and capable to join in the voluntary initiatives, their large market sharecan achieve a powerful impact and advance the industry towards a healthier direction. In general,a combination of voluntary and mandatory approaches would be better at coping with differentintervention measures and regional situations.
4.5. Strength and Limitations
This review presents the first international overview of restaurant salt reduction policies usinga systematic method. It was found that many developed countries actively promoted salt reduction tothe food service sector, and effective strategies have been implemented in several areas internationally.There were few records of developing countries, which may indicate that the salt reduction process isstill at an early stage in these countries. However, the scope of inclusion is a limitation. Although wetried to implement a comprehensive strategy, it is possible that some relevant policies might havebeen missed due to the following reasons. Firstly, we only reviewed English and Chinese publications.As a result, some official policy documents that are not in English/Chinese, as well as studiesdone by non-English/Chinese speaking researchers, were excluded from this review. Additionally,unlike a database, it is not possible to find exhaustive relevant materials by searching on webpages.There were also link failure issues. In consideration of this problem, we did targeted searches on thenational government websites as a supplement to the website searching process.
5. Conclusions
Restaurant involvement is an integral part of developing a healthy environment. Along withsalt reduction programs in processed food, a series of restaurant salt reduction measures have beendeveloped and have matured in some regions. Two policy orientations were summarized in this review,including buyer-driven and seller-driven policies. Current experiences could be used to explore ideasfor policy development and improvement to support uptake in other countries. Further studies on theoutcomes of implemented policies would be useful to demonstrate the effectiveness and sustainabilityof different strategies and then inform future efforts to build a healthier restaurant environment.
Author Contributions: Conceptualization, J.D. and Y.L.; methodology, J.D. and P.Z.; material search, J.D.,Y.S. and H.S.; data extraction, J.D. and Y.S.; formal analysis, J.D.; writing—original draft preparation, J.D.;writing—review and editing, J.D., Y.S., Y.L., J.H., H.S., W.D., H.W., and P.Z.; supervision, H.W. All authors haveread and agreed to the published version of the manuscript.
Funding: This research was funded by the National Institute for Health Research, grant number 16/136/77and Chinese Nutrition Society (CNS) Nutrition Science Foundation—YUM China Dietary Health Foundation,grant number CNS-YUM2018A03. The APC was funded by the National Institute for Health Research.
Acknowledgments: We would like to thank the National Institute for Health Research (NIHR, NIHR GlobalHealth Research Unit Action on Salt China at Queen Mary University of London) and the Chinese Nutrition Society(CNS) Nutrition Science Foundation—YUM China Dietary Health Foundation—for supporting this research.The views expressed in this publication are those of the author(s) and not necessarily those of the NIHR or theDepartment of Health and Social Care.
Conflicts of Interest: The authors declare no conflict of interest.
References
1. Strazzullo, P.; D’Elia, L.; Kandala, N.B.; Cappuccio, F.P. Salt intake, stroke, and cardiovascular disease:Meta-analysis of prospective studies. BMJ 2009, 339, b4567. [CrossRef] [PubMed]
2. Aburto, N.J.; Ziolkovska, A.; Hooper, L.; Elliott, P.; Cappuccio, F.P.; Meerpohl, J.J. Effect of lower sodiumintake on health: Systematic review and meta-analyses. BMJ 2013, 346, f1326. [CrossRef]
3. Schorling, E.; Niebuhr, D.; Kroke, A. Cost-effectiveness of salt reduction to prevent hypertension and CVD:A systematic review. Public Health Nutr. 2017, 20, 1993–2003. [CrossRef] [PubMed]
Int. J. Environ. Res. Public Health 2020, 17, 9570 20 of 25
4. Lee, C.; Kim, D.-I.; Hong, J.; Koh, E.; Kang, B.-W.; Kim, J.W.; Park, H.-K.; Kim, C.-I. Cost-benefit analysis ofsodium intake reduction policy in Korea. Korean J. Community Nutr. 2012, 17, 341–352. [CrossRef]
5. World Health Organization. A Comprehensive Global Monitoring Framework Including Indicators andA Set of Voluntary Global Targets for the Prevention and Control of Non-Communicable Diseases. Availableonline: https://www.who.int/nmh/events/2012/discussion_paper2_20120322.pdf (accessed on 25 March 2020).
6. State Council. “Healthy China in 2030” Program Outline. Available online: http://www.gov.cn/zhengce/
2016-10/25/content_5124174.htm (accessed on 14 December 2020).7. Havas, S.; Dickinson, B.D.; Wilson, M. The urgent need to reduce sodium consumption. JAMA 2007,
298, 1439–1441. [CrossRef]8. Food Standards Agency. New Salt Reduction Targets Published. Available online: http://webarchive.
nationalarchives.gov.uk/20120206100416/http://food.gov.uk/news/newsarchive/2006/mar/salttargets(accessed on 18 November 2020).
9. Office of Foods and Veterinary Medicine, Center for Food Safety and Applied Nutrition. Draft Guidancefor Industry: Target Mean and Upper Bound Concentrations for Sodium in Commercially Processed,Packaged, and Prepared Foods for Voluntary Sodium Reduction Goals. Available online: https://www.fda.gov/Food/GuidanceRegulation/GuidanceDocumentsRegulatoryInformation/ucm494732.htm (accessed on31 January 2020).
10. US Department of Agriculture, Economic Research Service. Food Expenditure Series. Available online:https://www.ers.usda.gov/data-products/food-expenditure-series/ (accessed on 2 February 2020).
11. Department for Environment Food & Rural Affairs. Food Statistics in Your Pocket 2017: Food Chain.Available online: https://www.gov.uk/government/publications/food-statistics-pocketbook-2017/food-statistics-in-your-pocket-2017-food-chain#uk-consumer-expenditure-on-food-drink-and-catering (accessedon 4 February 2020).
12. Wiggers, D.; Vanderlee, L.; White, C.; Reid, J.; Minaker, L.; Hammond, D. Food sources among young peoplein five major Canadian cities. Can. J. Public Health 2018, 109, 506–515. [CrossRef] [PubMed]
13. Chang, J.; Wang, Y. Nutrition and Health Monitoring of Chinese Residents in 2010–2012; Peking UniversityMedical Press: Beijing, China, 2016.
14. Statista Research Department. India: How Often Do You Eat Fast Food (Any Quick Service Restaurant)in Any Given Week (on Average)? Available online: https://www.statista.com/statistics/561263/india-average-fast-food-consumption-per-week/ (accessed on 5 February 2020).
15. Quader, Z.S.; Zhao, L.X.; Gillespie, C.; Cogswell, M.E.; Terry, A.L.; Moshfegh, A.; Rhodes, D. Sodium intakeamong persons aged ≥2 Years—United States, 2013–2014. Morb. Mortal. Wkly. Rep. 2017, 66, 324–328. [CrossRef]
16. World Health Organization. GLOBAL HEALTH RISKS Mortality and Burden of Disease Attributableto Selected Major Risks. Available online: https://www.who.int/healthinfo/global_burden_disease/
GlobalHealthRisks_report_full.pdf (accessed on 5 February 2020).17. He, F.J.; MacGregor, G.A. A comprehensive review on salt and health and current experience of worldwide
salt reduction programmes. J. Hum. Hypertens. 2009, 23, 363–384. [CrossRef]18. Webster, J.; Trieu, K.; Dunford, E.; Hawkes, C. Target salt 2025: A global overview of national programs to
encourage the food industry to reduce salt in foods. Nutrients 2014, 6, 3274–3287. [CrossRef]19. Afshin, A.; Penalvo, J.; Del Gobbo, L.; Kashaf, M.; Micha, R.; Morrish, K.; Pearson-Stuttard, J.; Rehm, C.;
Shangguan, S.; Smith, J.D.; et al. CVD prevention through policy: A review of mass media, food/menulabeling, taxation/subsidies, built environment, school procurement, worksite wellness, and marketingstandards to improve diet. Curr. Cardiol. Rep. 2015, 17, 98. [CrossRef]
20. Henney, J.E.; Taylor, C.L.; Boon, C.S. National salt reduction initiative coordinated by the New York cityhealth department. In Strategies to Reduce Sodium Intake in the United States; The National Academies Press:Washington, DC, USA, 2010; pp. 443–451.
21. Action on Salt. Consensus Action on Salt and Health. Available online: http://www.actiononsalt.org.uk/
(accessed on 9 February 2020).22. World Action On Salt and Health. Available online: http://www.worldactiononsalt.com/ (accessed on
9 February 2020).23. Moher, D.; Liberati, A.; Tetzlaff, J.; Altman, D.G.; Group, P. Preferred reporting items for systematic reviews
and meta-analyses: The PRISMA statement. Ann. Intern. Med. 2009, 151, 264–269. [CrossRef] [PubMed]
Int. J. Environ. Res. Public Health 2020, 17, 9570 21 of 25
24. Goodman, S.; Vanderlee, L.; White, C.M.; Hammond, D. A quasi-experimental study of a mandatorycalorie-labelling policy in restaurants: Impact on use of nutrition information among youth and youngadults in Canada. Prev. Med. 2018, 116, 166–172. [CrossRef]
25. Fitzpatrick, L.; Arcand, J.; L’Abbe, M.; Deng, M.Y.; Duhaney, T.; Campbell, N. Accuracy of Canadian foodlabels for sodium content of food. Nutrients 2014, 6, 3326–3335. [CrossRef] [PubMed]
26. Wu, H.W.; Sturm, R. Changes in the energy and sodium content of main entrees in US chain restaurants from2010 to 2011. J. Acad. Nutr. Diet. 2014, 114, 209–219. [CrossRef] [PubMed]
27. Auchincloss, A.H.; Mallya, G.G.; Leonberg, B.L.; Ricchezza, A.; Glanz, K.; Schwarz, D.F. Customer responses tomandatory menu labeling at full-service restaurants. Am. J. Prev. Med. 2013, 45, 710–719. [CrossRef] [PubMed]
28. Jones, A.; Magnusson, R.; Swinburn, B.; Webster, J.; Wood, A.; Sacks, G.; Neal, B. Designing a healthy foodpartnership: Lessons from the australian food and health dialogue. BMC Public Health 2016, 16, 651. [CrossRef]
29. Bruemmer, B.; Krieger, J.; Saelens, B.E.; Chan, N. Energy, saturated fat, and sodium were lower in entrees atchain restaurants at 18 months compared with 6 months following the implementation of mandatory menulabeling regulation in King County, Washington. J. Acad. Nutr. Diet. 2012, 112, 1169–1176. [CrossRef]
30. Ma, G.X.; Shive, S.E.; Zhang, G.; Aquilante, J.; Tan, Y.; Pharis, M.; Bettigole, C.; Lawman, H.; Wagner, A.;Zhu, L.; et al. Evaluation of a healthy Chinese take-out sodium-reduction initiative in philadelphialow-income communities and neighborhoods. Public Health Rep. 2018, 133, 472–480. [CrossRef]
31. Pulos, E.; Leng, K. Evaluation of a voluntary menu-labeling program in full-service restaurants. Am. J.Public Health 2010, 100, 1035–1039. [CrossRef]
32. Choi, S.E.; Brandeau, M.L.; Basu, S. Expansion of the national salt reduction initiative: A mathematical modelof benefits and risks of population-level sodium reduction. Med. Decis. Mak. 2016, 36, 72–85. [CrossRef]
33. Namba, A.; Auchincloss, A.; Leonberg, B.L.; Wootan, M.G. Exploratory analysis of fast-food chain restaurantmenus before and after implementation of local calorie-labeling policies, 2005–2011. Prev. Chronic Dis. 2013,10, 8. [CrossRef] [PubMed]
34. Britt, J.W.; Frandsen, K.; Leng, K.; Evans, D.; Pulos, E. Feasibility of voluntary menu labeling among locallyowned restaurants. Health Promot. Pract. 2011, 12, 18–24. [CrossRef] [PubMed]
35. Levings, J.L.; Gunn, J.P. From menu to mouth: Opportunities for sodium reduction in restaurants.Prev. Chronic Dis. 2014, 11, 130237. [CrossRef] [PubMed]
36. Knai, C.; Petticrew, M.; Durand, M.A.; Eastmure, E.; James, L.; Mehrotra, A.; Scott, C.; Mays, N.Has a public–private partnership resulted in action on healthier diets in England? An analysis of thePublic Health Responsibility Deal food pledges. Food Policy 2015, 54, 1–10. [CrossRef]
37. Otten, J.J.; Saelens, B.E.; Kapphahn, K.I.; Hekler, E.B.; Buman, M.P.; Goldstein, B.A.; Krukowski, R.A.;O’Donohue, L.S.; Gardner, C.D.; King, A.C. Impact of San Francisco’s toy ordinance on restaurants andchildren’s food purchases, 2011–2012. Prev. Chronic Dis. 2014, 11, E122. [CrossRef]
38. Auchincloss, A.H.; Leonberg, B.L.; Glanz, K.; Bellitz, S.; Ricchezza, A.; Jervis, A. Nutritional value of meals atfull-service restaurant chains. J. Nutr. Educ. Behav. 2014, 46, 75–81. [CrossRef]
39. Wyness, L.A.; Butriss, J.L.; Stanner, S.A. Reducing the population’s sodium intake: The UK Food StandardsAgency’s salt reduction programme. Public Health Nutr. 2012, 15, 254–261. [CrossRef]
40. He, F.J.; Brinsden, H.C.; MacGregor, G.A. Salt reduction in the United Kingdom: A successful experiment inpublic health. J. Hum. Hypertens. 2014, 28, 345–352. [CrossRef]
41. Ahuja, J.K.; Pehrsson, P.R.; Haytowitz, D.B.; Wasswa-Kintu, S.; Nickle, M.; Showell, B.; Thomas, R.;Roseland, J.; Williams, J.; Khan, M.; et al. Sodium monitoring in commercially processed and restaurantfoods. Am. J. Clin. Nutr. 2015, 101, 622–631. [CrossRef]
42. Holden, J.M.; Pehrsson, P.R.; Nickle, M.; Haytowitz, D.B.; Exler, J.; Showell, B.; Williams, J.; Thomas, R.G.;Ahuja, J.K.C.; Patterson, K.Y.; et al. USDA monitors levels of added sodium in commercial packaged andrestaurant foods. In Proceedings of the 36th National Nutrient Databank Conference, Huston, TX, USA,25–28 March 2012; Stumbo, P., McNutt, S., Eds.; Elsevier Science BV: Amsterdam, The Netherlands, 2013;Volume 2, pp. 60–67.
43. Finkelstein, E.A.; Strombotne, K.L.; Chan, N.L.; Krieger, J. Mandatory menu labeling in one fast-food chainin King County, Washington. Am. J. Prev. Med. 2011, 40, 122–127. [CrossRef]
Int. J. Environ. Res. Public Health 2020, 17, 9570 22 of 25
44. Mozaffarian, D.; Afshin, A.; Benowitz, N.L.; Bittner, V.; Daniels, S.R.; Franch, H.A.; Jacobs, D.R., Jr.; Kraus, W.E.;Kris-Etherton, P.M.; Krummel, D.A.; et al. Population approaches to improve diet, physical activity, andsmoking habits: A scientific statement from the American Heart Association. Circulation 2012, 126, 1514–1563.[CrossRef] [PubMed]
45. McGuire, S. Institute of medicine. 2009. school meals: Building blocks for healthy children. Washington, DC:The National Academies Press. Adv. Nutr 2011, 2, 64–65. [CrossRef] [PubMed]
46. Ahuja, J.K.; Wasswa-Kintu, S.; Haytowitz, D.B.; Daniel, M.; Thomas, R.; Showell, B.; Nickle, M.; Roseland, J.M.;Gunn, J.; Cogswell, M.; et al. Sodium content of popular commercially processed and restaurant foods in theUnited States. Prev. Med. Rep. 2015, 2, 962–967. [CrossRef] [PubMed]
47. Byrd, K.; Almanza, B.; Ghiselli, R.F.; Behnke, C.; Eicher-Miller, H.A. Adding sodium information tocasual dining restaurant menus: Beneficial or detrimental for consumers? Appetite 2018, 125, 474–485.[CrossRef] [PubMed]
48. Nordstrom, J.; Thunstrom, L. The impact of price reductions on individuals’ choice of healthy meals awayfrom home. Appetite 2015, 89, 103–111. [CrossRef]
49. Scourboutakos, M.J.; L’Abbe, M.R. Changes in sodium levels in chain restaurant foods in Canada (2010–2013):A longitudinal study. CMAJ Open 2014, 2, E343–E351. [CrossRef]
50. California Legislative Information. SB-1420 Food Facilities: Nutritional Information. Available online: http://leginfo.legislature.ca.gov/faces/billNavClient.xhtml?bill_id=200720080SB1420 (accessed on 29 January 2020).
51. Los Angeles Times. Appeals Court OKs New York City Salt-Warning Rule for Some Restaurants. Availableonline: https://www.latimes.com/nation/nationnow/la-na-new-york-salt-20170210-story.html (accessed on29 January 2020).
52. Kevin, B.O. Appeals Court OKs Salt-shaker Sodium Warnings at Chain Restaurants. Available online:https://www.ama-assn.org/delivering-care/hypertension/appeals-court-oks-salt-shaker-sodium-warnings-chain-restaurants (accessed on 29 January 2020).
53. Department of Health EatSmart Restaurant Star+ Campaign. Embrace the Trend of Healthy Eating. Availableonline: https://restaurant.eatsmart.gov.hk/eng/content.aspx?content_id=4 (accessed on 20 December 2020).
54. Pan American Health Organization. DROPPING THE SALT—Practical Steps Countries are Taking to PreventChronic Non-communicable Diseases through Population-wide Dietary Salt Reduction. Available online:New.paho.org/hq/dmdocuments/2009/DroppingthesaltEN.pdf (accessed on 31 January 2020).
55. Office of Foods and Veterinary Medicine, Center for Food Safety and Applied Nutrition. Guidance forIndustry: A Labeling Guide for Restaurants and Retail Establishments Selling Away-From-Home Foods—Part,I. Available online: https://www.fda.gov/regulatory-information/search-fda-guidance-documents/guidance-industry-labeling-guide-restaurants-and-retail-establishments-selling-away-home-foods-part (accessed on31 January 2020).
56. Office of Foods and Veterinary Medicine, Center for Food Safety and Applied Nutrition. Small EntityCompliance Guide: Nutrition Labeling of Standard Menu Items in Restaurants and Similar Retail FoodEstablishments. Available online: https://www.fda.gov/regulatory-information/search-fda-guidance-documents/small-entity-compliance-guide-nutrition-labeling-standard-menu-items-restaurants-and-similar-retail (accessed on 31 January 2020).
57. New York City Health Department. Health Department Announces 5 Year Results of National Salt ReductionInitiative. Available online: https://www1.nyc.gov/site/doh/about/press/pr2016/pr066-16.page (accessed on20 May 2019).
58. New York City Health Department. Health Department Launches New Sodium Warning Label Campaign,“Look Before You Eat”. Available online: https://www1.nyc.gov/site/doh/about/press/pr2016/pr100-16.page(accessed on 20 May 2019).
59. Healthy Families BC. Informed Dining. 2012. Available online: https://www.healthyfamiliesBC.ca/home/
informed-dining (accessed on 20 May 2019).60. Healthy Families BC. Informed Dining Program Participation Guide. 2012. Available online: https://www.
healthyfamiliesbc.ca/sites/hfbcprox-prod.health.gov.bc.ca/files/documents/participation-guide.pdf (accessedon 20 May 2019).
61. Healthy Families BC. Informed Dining/Food Service Establishments. 2012. Available online: https://www.healthyfamiliesbc.ca/home/informed-dining-food-service-establishments (accessed on 20 May 2019).
Int. J. Environ. Res. Public Health 2020, 17, 9570 23 of 25
62. Directorate-General Health and Consumers, European Commission. Implementation of the EU Salt ReductionFramework. Available online: https://ec.europa.eu/health/sites/health/files/nutrition_physical_activity/docs/salt_report1_en.pdf (accessed on 20 December 2020).
63. Center for Science in the Public Interest. International Action on Sodium. Availableonline: https://cspinet.org/sites/default/files/attachment/CSPI%202016%20International%20Action%20On%20Sodium%20Fact%20Sheet%20Final.pdf (accessed on 31 January 2020).
64. World Health Organization. Mapping Salt Reduction Initiatives in the WHO European Region. Availableonline: http://www.euro.who.int/__data/assets/pdf_file/0009/186462/Mapping-salt-reduction-initiatives-in-the-WHO-European-Region.pdf (accessed on 31 January 2020).
65. Department of Public Health, Office of the Mayor. Mayor Kenney Signs Chain Restaurant Sodium MenuLabeling Bill into Law. Available online: https://www.phila.gov/2018-09-14-mayor-kenney-signs-chain-restaurant-sodium-menu-labeling-bill-into-law/ (accessed on 31 January 2020).
66. World Health Organization. Meeting of the WHO Action Network on Salt Reduction in the Population inthe European Region (ESAN). Available online: http://www.euro.who.int/__data/assets/pdf_file/0009/361989/
meeting-report-esan-2017.pdf (accessed on 31 January 2020).67. U.S. Food and Drug Administration. Menu Labeling Rule Key Facts for Industry. Available online:
https://www.fda.gov/media/116000/download (accessed on 31 January 2020).68. European Commission. National Salt Initiatives—Implementing the EU Framework for Salt Reduction
Initiatives. Available online: https://ec.europa.eu/health/archive/ph_determinants/life_style/nutrition/
documents/national_salt_en.pdf (accessed on 31 January 2020).69. King County Board of Health. Nutrition Labeling Requirements for King County Chain Food
Establishments. Available online: https://www.kingcounty.gov/depts/health/environmental-health/food-safety/food-business-permit/menu-labeling.aspx (accessed on 31 January 2020).
70. Department of Health and Human Services, Food and Drug Administration Draft Guidance for Industry:Questions and Answers Regarding Implementation of the Menu Labeling Provisions of Section 4205 of thePatient Protection and Affordable Care Act of 2010. Available online: https://www.govinfo.gov/content/pkg/
FR-2010-08-25/pdf/2010-21065.pdf (accessed on 31 January 2020).71. Susan, J.M. Philadelphia Petitions FDA for Exemption from Menu Labeling. Available online: http:
//www.fdalawblog.net/2011/10/philadelphia-petitions-fda-for-exemption-from-menu-labeling/ (accessed on31 January 2020).
72. Pan American Health Organization. Policy Statement: Preventing Cardiovascular Disease in the Americas byReducing Dietary Salt Intake Population-Wide. Available online: https://www.paho.org/hq/dmdocuments/2014/Salt-policy-statement-eng.pdf (accessed on 31 January 2020).
73. Pan American Health Organization. Report for the Technical Meeting on Setting Targets and Timelinesto Reduce the Salt Content of Food. Available online: https://www.paho.org/hq/dmdocuments/2013/salt-content-mexico-dec-2013-meeting-report.pdf (accessed on 31 January 2020).
74. Local Government Association. Restaurant and Pub Chains Urged to Sign up to Salt Reduction Targetsto Combat Heart Attack and Stroke. Available online: https://webarchive.nationalarchives.gov.uk/
20140807110427tf_/http://www.local.gov.uk/web/guest/media-releases/-/journal_content/56/10180/6389402/
NEWS (accessed on 31 January 2020).75. World Health Organization. Review of Salt and Health: Situation in South-East Asia Region. Available
online: http://www.searo.who.int/entity/noncommunicable_diseases/events/ncd_twg_bangkok_technical_paper_review_of_salt_and_health.pdf (accessed on 21 May 2019).
76. Public Health England. Salt Reduction Targets for 2017. Available online: https://assets.publishing.service.gov.uk/government/uploads/system/uploads/attachment_data/file/604338/Salt_reduction_targets_for_2017.pdf(accessed on 31 January 2020).
77. CNN Wire Staff. Salt Shakers Disappear from Buenos Aires Tables. Available online: http://edition.cnn.com/
2011/WORLD/americas/06/11/argentina.salt/index.html (accessed on 31 January 2020).78. US Department of Agriculture. Scientific Report of the 2015 Dietary Guidelines Advisory Committee. Available
online: https://ods.od.nih.gov/pubs/2015_DGAC_Scientific_Report.pdf (accessed on 31 January 2020).79. Sodium Working Group. Sodium Reduction Strategy for Canada. Available online: https://www.hc-sc.gc.ca/
fn-an/alt_formats/pdf/nutrition/sodium/strateg/reduct-strat-eng.pdf (accessed on 31 January 2020).
Int. J. Environ. Res. Public Health 2020, 17, 9570 24 of 25
80. CSPI President Dr. Peter, G. Lurie. Philadelphia Menu Sodium Warning Bill Makes Sense, Says CSPI. Availableonline: https://cspinet.org/news/philadelphia-menu-sodium-warning-bill-makes-sense-says-cspi-20180125(accessed on 31 January 2020).
81. National Association of Country and City Health Officials. STATEMENT OF POLICY Salt Reduction.Available online: https://www.naccho.org/uploads/downloadable-resources/Programs/Community-Health/
14-12-Salt-reduction.pdf (accessed on 31 January 2020).82. Million Hearts in Action. The Healthy Chinese Take-Out Initiative. Available online: https://www.heart.org/-/
media/files/professional/million-hearts/success-stories/healthy-chinese-takeout-initiative-ucm_479858.pdf(accessed on 31 January 2020).
83. New York City Department of Health and Mental Hygiene. National Salt Reduction Initiative. Availableonline: https://www1.nyc.gov/site/doh/health/health-topics/national-salt-reduction-initiative.page (accessedon 31 January 2020).
84. New York City Department of Health and Mental Hygiene. National Salt Reduction Initiative RestaurantFood Categories and Targets. Available online: https://www1.nyc.gov/assets/doh/downloads/pdf/cardio/
cardio-salt-nsri-restaurant.pdf (accessed on 31 January 2020).85. Healthy Shasta. Healthy Kids Choice. Available online: https://healthyshasta.org/eat-healthy/healthy-kids-
choice/ (accessed on 31 January 2020).86. Colorado Department of Public Health and Environment. Smart Meal™ Seal program. Available
online: http://www.centertrt.org/content/docs/Intervention_Documents/Intervention_Templates/Smart_Meal_Seal_Template.pdf (accessed on 31 January 2020).
87. City of San Antonio. San Antonio’s Healthy Menu Initiative. Available online: https://www.sanantonio.gov/
Health/HealthyEating/HealthyDining (accessed on 20 December 2020).88. North Carolina Prevention Partners. Eating Healthy should Be Easy. Available online: http://www.
ncpreventionpartners.org/dnn/WhatWeDo/Programs/WinnersCircle/tabid/76/Default.aspx (accessed on21 May 2019).
89. American Heart Association. Heart-Check Meal Certification Program. Available online: https://www.heart.org/en/healthy-living/company-collaboration/heart-check-certification (accessed on 31 January 2020).
90. Healthy Dining Finder. Healthy Dining Finder Nutrition Criteria. Available online: http://www.healthydiningfinder.com/sodium-savvy/SS-criteria (accessed on 21 May 2019).
91. Healthy Shasta. Restaurant Guide: Cut the Sodium but Keep the Flavor. Available online: http://www.restaurantnutrition.com/Images/HDF_2012_SodiumToolkit.aspx (accessed on 21 May 2019).
92. Schenectady County Public Health Services. Become Sodium Savvy. Available online: http://www.schenectadycounty.com/FullStory.aspx?m=855&amid=9804 (accessed on 21 May 2019).
93. Erie County Department of Health. Healthy Choices Program. Available online: http://www2.erie.gov/
health/index.php?q=healthy-choices (accessed on 21 May 2019).94. Healthy Howard. Healthy Restaurants. Available online: https://healthyhowardmd.org/program/healthy-
restaurants/ (accessed on 31 January 2020).95. Restaurant Operators Cooperative. What‘s in It for me? Available online: http://www.albanyroc.com/phone/
why-join-roc.html (accessed on 20 December 2020).96. Michael Martinez, CNN. San Francisco Overrides Mayoral Veto, Bans Happy Meals with Toys. Available
online: http://edition.cnn.com/2010/US/11/23/california.happy.meals.ban/ (accessed on 31 January 2020).97. Public Health Responsibility Deal. Available online: https://webarchive.nationalarchives.gov.uk/
20130104155639/http://responsibilitydeal.dh.gov.uk/ (accessed on 4 January 2013).98. Department of Business. Salt Reduction Programme (Food Standards Agency, 2004): Case Study. Available
online: https://www.gov.uk/government/publications/salt-reduction-programme-food-standards-agency-2004-case-study (accessed on 21 December 2020).
99. Chinese Center for Disease Control and Prevention. Guidance Plan for Health Supporting EnvironmentConstruction of National Healthy Lifestyle Action. Available online: http://www.jiankang121.cn/TxtDetail.aspx?id=768 (accessed on 29 July 2020).
100. Henney, J.E.; Taylor, C.L.; Boon, C.S. Strategies to Reduce Sodium Intake in the United States; The NationalAcademies Press: Washington, DC, USA, 2010.
101. Livsmedelsverket. The Keyhole. Available online: https://www.livsmedelsverket.se/en/food-and-content/labelling/nyckelhalet?AspxAutoDetectCookieSupport=1 (accessed on 14 February 2020).
Int. J. Environ. Res. Public Health 2020, 17, 9570 25 of 25
102. McGuire, S. Institute of Medicine. 2012. front-of-package nutrition rating systems and symbols: Promotinghealthier choices. Washington, DC: The National Academies Press. Adv. Nutr. 2012, 3, 332–333. [CrossRef]
103. Pietinen, P.; Valsta, L.M.; Hirvonen, T.; Sinkko, H. Labelling the salt content in foods: A useful tool inreducing sodium intake in Finland. Public Health Nutr. 2008, 11, 335–340. [CrossRef]
104. Long, M.W.; Tobias, D.K.; Cradock, A.L.; Batchelder, H.; Gortmaker, S.L. Systematic review and meta-analysisof the impact of restaurant menu calorie labeling. Am. J. Public Health 2015, 105, e11–e24. [CrossRef]
105. Sinclair, S.E.; Cooper, M.; Mansfield, E.D. The influence of menu labeling on calories selected or consumed:A systematic review and meta-analysis. J. Acad. Nutr. Diet. 2014, 114, 1375–1388.e15. [CrossRef]
106. Malam, S.; Clegg, S.; Kirwan, S.; McGinigal, S. Comprehension and Use of UK Nutrition Signpost LabellingSchemes; Food Standards Agency: London, UK, 2009.
107. Food Standards Agency. Front of Pack Nutritional Signpost Labelling Technical Guidance. Availableonline: https://www.foodwatch.org/fileadmin/Themen/Ampelkennzeichnung/guidance_ampel_issue_1_januar_2007.pdf (accessed on 21 December 2020).
108. Shrivastava, S.R.; Shrivastava, P.S.; Ramasamy, J. Adoption of the Nutri-score system in France to reduce theincidence of noncommunicable diseases. J. Res. Med. Sci. 2017, 22, 111. [CrossRef] [PubMed]
109. Burton, S.; Creyer, E.H.; Kees, J.; Huggins, K. Attacking the obesity epidemic: The potential health benefits ofproviding nutrition information in restaurants. Am. J. Public Health 2006, 96, 1669–1675. [CrossRef] [PubMed]
110. Wu, H.W.; Sturm, R. What’s on the menu? A review of the energy and nutritional content of US chainrestaurant menus. Public Health Nutr. 2013, 16, 87–96. [CrossRef] [PubMed]
111. Auchincloss, A.H.; Young, C.; Davis, A.L.; Wasson, S.; Chilton, M.; Karamanian, V. Barriers andfacilitators of consumer use of nutrition labels at sit-down restaurant chains. Public Health Nutr. 2013,16, 2138–2145. [CrossRef]
112. Sutherland, L.A.; Kaley, L.A.; Fischer, L. Guiding stars: The effect of a nutrition navigation program onconsumer purchases at the supermarket. Am. J. Clin. Nutr. 2010, 91, 1090S–1094S. [CrossRef]
113. World Cancer Research Fund International. NOURISHING Database. Available online: https://www.wcrf.org/int/policy/nourishing-database (accessed on 9 February 2020).
114. United States Department of Agriculture. Dietary Guidelines for Americans. Available online: https://www.dietaryguidelines.gov/ (accessed on 18 February 2020).
115. Glanz, K.; Resnicow, K.; Seymour, J.; Hoy, K.; Stewart, H.; Lyons, M.; Goldberg, J. How major restaurant chainsplan their menus: The role of profit, demand, and health. Am. J. Prev. Med. 2007, 32, 383–388. [CrossRef]
116. Health Canada. Guidance for the Food Industry on Reducing Sodium in Processed Foods.Available online: https://www.canada.ca/en/health-canada/services/food-nutrition/legislation-guidelines/guidance-documents/guidance-food-industry-reducing-sodium-processed-foods-2012.html (accessed on18 February 2020).
117. Thomas, R.G.; Ahuja, J.K.C.; Daniel, M.G. Nationwide variation of sodium levels and portion sizes of Chineserestaurant menu items. Procedia Food Sci. 2015, 4, 138–147. [CrossRef]
118. IMARC Group. Online Food Delivery Market: Global Industry Trends, Share, Size, Growth, Opportunity andForecast 2020–2025. Available online: https://www.imarcgroup.com/online-food-delivery-market (accessedon 16 December 2020).
119. Gómez, M.I.; Ricketts, K.D. Food value chain transformations in developing countries: Selected hypotheseson nutritional implications. Food Policy 2013, 42, 139–150. [CrossRef]
120. Pilz, M.; Uma, G.; Venkatram, R. Skills development in the informal sector in India: The case of street foodvendors. Int. Rev. Educ. 2015, 61, 191–209. [CrossRef]
121. World Health Organization. Basic Steps to Improve Safety of Street-vended Food. Available online: https://www.who.int/foodsafety/fs_management/No_03_StreetFood_Jun10_en.pdf (accessed on 17 December 2020).
Publisher’s Note: MDPI stays neutral with regard to jurisdictional claims in published maps and institutionalaffiliations.
© 2020 by the authors. Licensee MDPI, Basel, Switzerland. This article is an open accessarticle distributed under the terms and conditions of the Creative Commons Attribution(CC BY) license (http://creativecommons.org/licenses/by/4.0/).
https://www.foodwatch.org/fileadmin/Themen/Ampelkennzeichnung/guidance_ampel_issue_1_januar_2007.pdf