
Systematic design of supersaturation controlled crystallisation ...
11
This item was submitted to Loughborough's Research Repository by the author. Items in Figshare are protected by copyright, with all rights reserved, unless otherwise indicated. Systematic design of supersaturation controlled crystallisation processes Systematic design of supersaturation controlled crystallisation processes PLEASE CITE THE PUBLISHED VERSION PUBLISHER © The authors LICENCE CC BY-NC-ND 4.0 REPOSITORY RECORD Aamir, Erum, Zoltan K. Nagy, and Chris D. Rielly. 2009. “Systematic Design of Supersaturation Controlled Crystallisation Processes”. figshare. https://hdl.handle.net/2134/4804.
-
Upload
khangminh22 -
Category
Documents
-
view
0 -
download
0
Transcript of Systematic design of supersaturation controlled crystallisation ...
This item was submitted to Loughborough's Research Repository by the author. Items in Figshare are protected by copyright, with all rights reserved, unless otherwise indicated.
Systematic design of supersaturation controlled crystallisation processesSystematic design of supersaturation controlled crystallisation processes
PLEASE CITE THE PUBLISHED VERSION
PUBLISHER
© The authors
LICENCE
CC BY-NC-ND 4.0
REPOSITORY RECORD
Aamir, Erum, Zoltan K. Nagy, and Chris D. Rielly. 2009. “Systematic Design of Supersaturation ControlledCrystallisation Processes”. figshare. https://hdl.handle.net/2134/4804.

This item was submitted to Loughborough’s Institutional Repository (https://dspace.lboro.ac.uk/) by the author and is made available under the
following Creative Commons Licence conditions.
For the full text of this licence, please go to: http://creativecommons.org/licenses/by-nc-nd/2.5/
Systematic Design of Supersaturation Controlled Crystallization Processes
Z. K. Nagy*, E. Aamir, C. D. Rielly
Chemical Engineering Department, Loughborough University, Loughborough, LE11 3TU, United Kingdom
*e-mail: [email protected] The paper presents a novel methodology for the systematic design of the setpoint operating curves for supersaturation controlled crystallization processes, which produce a desired target crystal size distribution (CSD). The population balance model is solved using the method of characteristics under the assumptions of constant supersaturation and growth dominated process, yielding a simplified analytical expression for the size distribution. A design parameter for supersaturation controlled processes is introduced as a function of the supersaturation and time. Based on the design parameter and the simplified analytical model, the supersaturation setpoint and batch time are determined using an optimization approach to obtain a target distribution with a desired shape. A methodology is also described, which can be used to obtain the temperature profiles in the time domain, corresponding to a desired target CSD, providing a systematic direct design approach for practical applications and scale-up. Additionally, a method for designing the seed distribution is proposed, which can be used in conjunction with the supersaturation setpoint design, for shaping the product CSD. The proposed methods are exemplified for the model system of potash alum in water, for which the size dependent growth kinetic parameters have been identified based on industrial experimental data. 1. Introduction
Crystallization from solution is an industrially important unit operation due to its ability to provide a high purity separation. Batch cooling crystallization provides the advantages of being simple, flexible, and generally requires less process development and investment than many other separation/purification techniques. Many problems in downstream processes can be attributed to poor particle characteristics established in the crystallization step [1,2]. The shape of a crystal size distribution (CSD) produced from crystallisation, affects the efficiency of downstream operations such as filtration, drying and washing. Most of the product qualities are also directly related to the crystal size distribution [2] and the main difficulty in batch crystallization is to accomplish uniform and reproducible CSD [3]. One way to enhance the control of CSD is to use supersaturation control (SSC), which drives the process within the metastable zone to avoid nucleation [4]. Although this approach has proved to produce high quality crystals, the setpoint operating profiles for the supersaturation controller is usually chosen arbitrarily or by trial-and-error experimentation [4]. The paper presents a novel approach for the systematic design of the setpoint trajectory for the supersaturation controller so that a target CSD with a desired shape is obtained. In the case of seeded batch cooling crystallization processes controlled at constant supersaturation, the main governing phenomenon is growth. For these systems an analytical solution of the population balance equation can be obtained, which gives the entire CSD at any moment of the batch. A design parameter, as a function of the batch time and supersaturation, is introduced for supersaturation controlled crystallisation processes. The optimal design
parameter is obtained by solving a constrained nonlinear optimization problem with the objective to achieve a desired shape of the CSD at the end of the batch, while maintaining a required minimum yield. The supersaturation setpoint and batch time to achieve the desired CSD can be obtained from the optimal design parameter taking into account the boundaries of the metastable zone, with additional uncertainty margins for robust operating profiles. A methodology is also illustrated, to derive the temperature versus time profiles from the optimal design parameter, which can be readily implemented in the case of industrial crystallizers based on classical temperature control systems. The methodology is extended for the design of the optimal seed distribution required to achieve the desired shape of CSD, which due to the characteristics of the growth kinetics may not be possible to achieve by optimizing the supersaturation only. The methodology is derived for processes with generic size dependent growth kinetics, and it is exemplified for the crystallisation of potash alum in water, using a mathematical model identified based on industrial experimental data [5]. 2. Direct Design Approach
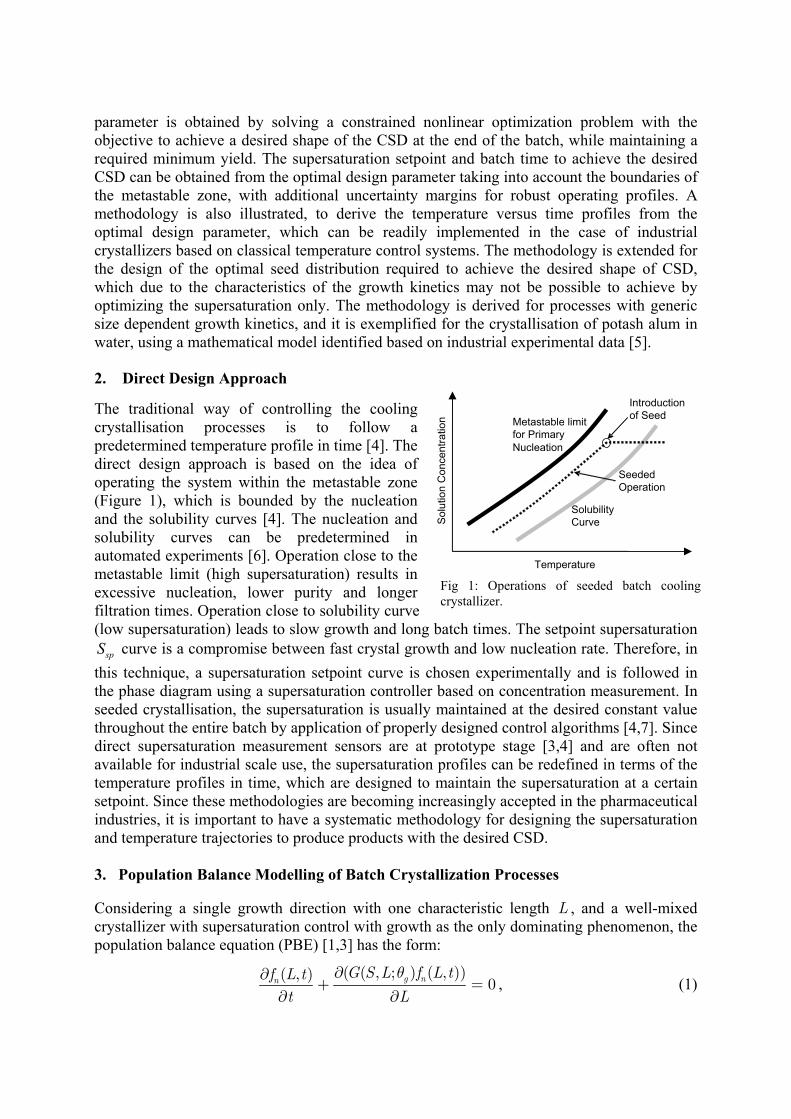
The traditional way of controlling the cooling crystallisation processes is to follow a predetermined temperature profile in time [4]. The direct design approach is based on the idea of operating the system within the metastable zone (Figure 1), which is bounded by the nucleation and the solubility curves [4]. The nucleation and solubility curves can be predetermined in automated experiments [6]. Operation close to the metastable limit (high supersaturation) results in excessive nucleation, lower purity and longer filtration times. Operation close to solubility curve (low supersaturation) leads to slow growth and long batch times. The setpoint supersaturation
spS curve is a compromise between fast crystal growth and low nucleation rate. Therefore, in this technique, a supersaturation setpoint curve is chosen experimentally and is followed in the phase diagram using a supersaturation controller based on concentration measurement. In seeded crystallisation, the supersaturation is usually maintained at the desired constant value throughout the entire batch by application of properly designed control algorithms [4,7]. Since direct supersaturation measurement sensors are at prototype stage [3,4] and are often not available for industrial scale use, the supersaturation profiles can be redefined in terms of the temperature profiles in time, which are designed to maintain the supersaturation at a certain setpoint. Since these methodologies are becoming increasingly accepted in the pharmaceutical industries, it is important to have a systematic methodology for designing the supersaturation and temperature trajectories to produce products with the desired CSD. 3. Population Balance Modelling of Batch Crystallization Processes Considering a single growth direction with one characteristic length L , and a well-mixed crystallizer with supersaturation control with growth as the only dominating phenomenon, the population balance equation (PBE) [1,3] has the form:
( ( , ; ) ( , ))( , )
0g nnG S L f L tf L t
t L
θ∂∂+ =
∂ ∂, (1)
Fig 1: Operations of seeded batch cooling crystallizer.
Temperature
Seeded Operation
Introduction of Seed
Solubility Curve
Metastable limit for Primary Nucleation
Sol
utio
n C
once
ntra
tion
where ( , )nf L t is the crystal size distribution expressed as the number density function (number of crystal per unit mass of slurry), t is time, ( , ; )gG S L θ is the rate of crystal growth,
( )satS C C= − is the absolute supersaturation, C is the solute concentration, ( )sat satC C T= is the saturation concentration, T the temperature, and gθ is a vector of growth kinetic parameters. The generic PBE (1) can be reduced to a system of ODEs by applying the method of characteristics (MOCH). The aim of the MOCH is to solve the PBE by finding characteristic curves in the L t− plane that reduce the partial differential equation to a system of ODEs [1]. If seed is added to suppress nucleation in the case of supersaturation controlled crystallisation, the process will be dominated by growth. For the generic case of size dependent growth, for which the kinetics are given by,
(1 )g pgG k S Lγ= + , (2)
where [ , , , ]g gk g pθ γ= is the growth parameter vector. Applying the MOCH equation (1) is reduced to the following system of two ODEs:
(1 )g pg
dLk S L
dtγ= + , (3)
1( , )(1 ) ( , )g pn
g n
df L tk S p L f L t
dtγ γ −= − + . (4)
In the case of well-controlled constant supersaturation, which follows the desired set-point value, spS the system (3)-(4) can be solved analytically [11] with the solution given by,
1
1 10(((1 ) (1 )) 1)/p g p
gL L k S t pγ γ γ− −= + + − − , (5)
1
,0 0 10
(1 )( ) ( ) 1
(1 )
pg p
gn n p
k S t pf L f L
L
γγ
−
−
⎛ ⎞− ⎟⎜ ⎟= +⎜ ⎟⎜ ⎟⎜ +⎝ ⎠. (6)
Discretizing the initial (seed) distribution ,0 0 0( ) ( )n seedf L f L= for different values of 0L , equations (5)-(6) can be used to compute the dynamic evolution of the CSD for a generic growth dominated process (the analytical solution is valid for 1p ≠ and 0γ ≠ , however the methodology and equations (3)-(4) apply to the particular case of size independent growth
0γ = , and/or 1p = , for which simple analytical solutions also exist). 4. Systematic Design of Supersaturation Controlled Crystallisation The CSD given by the system (5)-(6) is determined by the product between gS and t , hence a design parameter ( )φ can be defined as,
gS tφ = . (7)
The optimal supersaturation control (SSC) design parameter (φ ) can be determined by minimizing the difference between the discretized target distribution and the predicted CSD obtained from the analytical estimator (5)-(6):
2, ,
1
min{ ( ) }dN
v i v ii
f fφ
=
−∑ , (8)
subject to: max0 φ φ≤ ≤ , (9) ,max( )batch fC t C≤ , (10)
where dN is the number of discretization, ,v if is the discretized target CSD (volume particle density function), 3 3
, , ,1/ ( )dNv i n i i n i i iif f L f L L== ∆∑ is the discretized, estimated volumetric
particle density, ( )batchC t is the solute concentration at the end of the batch and ,maxfC is the maximum acceptable concentration at the end of the batch to achieve a required yield. The Matlab (MathWorks Inc.) function fmincon was used to solve the constrained nonlinear optimization problem (8)-(10). Once the design parameter φ is optimised for a desired target distribution, by using equation (7) it is possible to determine the supersaturation setpoint ( spS ) for a given batch time ( batcht ), or to calculate the required batch time to achieve the desired distribution by controlling the process at a given supersaturation value. A batch processing unit may be a multi-purpose unit, which is used for several processing phases and may support multi-product manufacturing. In these case, the batch scheduling may become of key importance due to raw material and time constraints. The control design parameter φ , gives the flexibility to adjust the supersaturation for a fixed batch time, which can be calculated as,
1/
/g
sp batchS tφ⎡ ⎤= ⎣ ⎦ , (11)
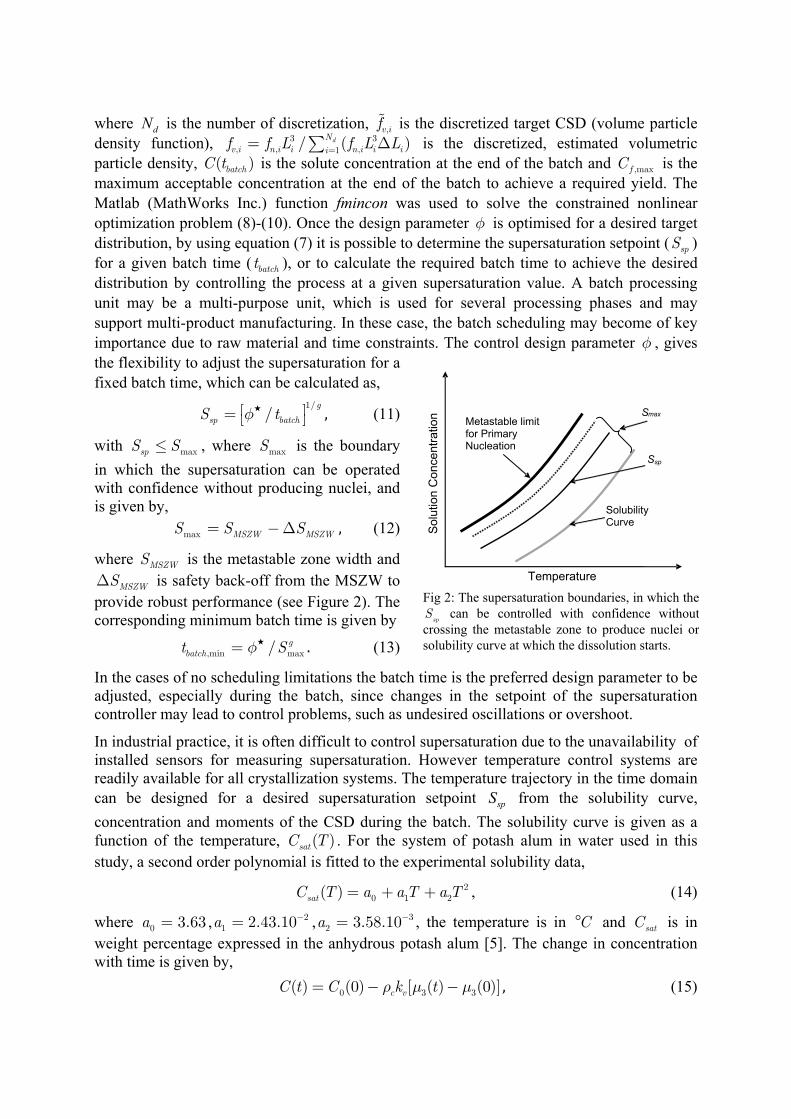
with maxspS S≤ , where maxS is the boundary in which the supersaturation can be operated with confidence without producing nuclei, and is given by,
max MSZW MSZWS S S= −∆ , (12)
where MSZWS is the metastable zone width and MSZWS∆ is safety back-off from the MSZW to
provide robust performance (see Figure 2). The corresponding minimum batch time is given by
,min max/ gbatcht Sφ= . (13)
In the cases of no scheduling limitations the batch time is the preferred design parameter to be adjusted, especially during the batch, since changes in the setpoint of the supersaturation controller may lead to control problems, such as undesired oscillations or overshoot.
In industrial practice, it is often difficult to control supersaturation due to the unavailability of installed sensors for measuring supersaturation. However temperature control systems are readily available for all crystallization systems. The temperature trajectory in the time domain can be designed for a desired supersaturation setpoint spS from the solubility curve, concentration and moments of the CSD during the batch. The solubility curve is given as a function of the temperature, ( )satC T . For the system of potash alum in water used in this study, a second order polynomial is fitted to the experimental solubility data,
20 1 2( )satC T a aT a T= + + , (14)
where 0 3.63a = , 21 2.43.10a −= , 3
2 3.58.10a −= , the temperature is in C° and satC is in weight percentage expressed in the anhydrous potash alum [5]. The change in concentration with time is given by,
0 3 3( ) (0) [ ( ) (0)]c vC t C k tρ µ µ= − − , (15)
Fig 2: The supersaturation boundaries, in which the spS can be controlled with confidence without crossing the metastable zone to produce nuclei or solubility curve at which the dissolution starts.
Ssp
maxS
Temperature
Sol
utio
n C
once
ntra
tion
Solubility Curve
Metastable limit for Primary Nucleation
where 0C is the initial concentration in %wt , cρ is the density of crystals in 3kg mµ − , vk is the volumetric shape factor, 3(0)µ is the initial third moment of the seed CSD and 3( )tµ is the third moment of the CSD at time t , with units of 3 1( )m kg slurryµ − . The moments of crystal size distribution can be obtained from,
,10
( ) ( )dN
k kk n n i i i
i
t f L dL f L Lµ∞
=
= ≈ ∆∑∫ , where 0,1,2,...k = ∞ . (16)
The temperature profile in the time domain used as the setpoint for the temperature controller, ( )spT T t= , can be obtained by solving the nonlinear equation,
22 1 0( ) ( ) 0spS t C t a T aT a− + + + = . (17)
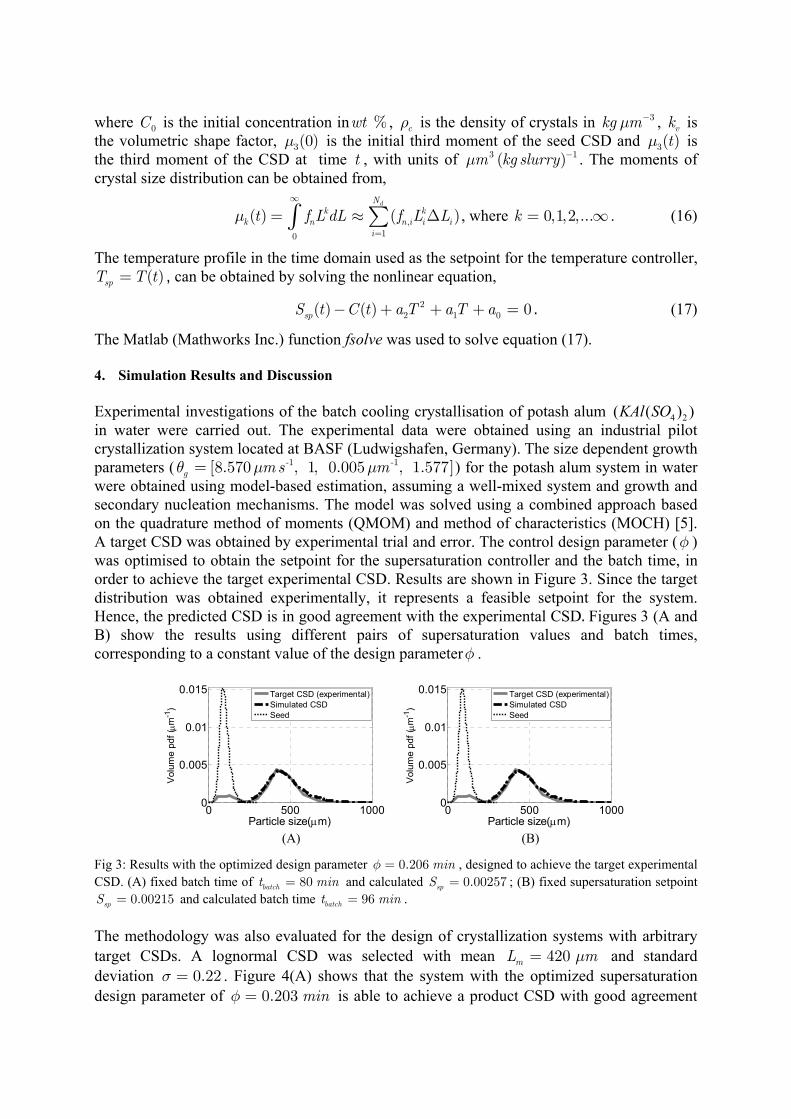
The Matlab (Mathworks Inc.) function fsolve was used to solve equation (17). 4. Simulation Results and Discussion Experimental investigations of the batch cooling crystallisation of potash alum 4 2( ( ) )KAl SO in water were carried out. The experimental data were obtained using an industrial pilot crystallization system located at BASF (Ludwigshafen, Germany). The size dependent growth parameters ( -1 -1[8.570 , 1, 0.005 , 1.577]g m s mθ µ µ= ) for the potash alum system in water were obtained using model-based estimation, assuming a well-mixed system and growth and secondary nucleation mechanisms. The model was solved using a combined approach based on the quadrature method of moments (QMOM) and method of characteristics (MOCH) [5]. A target CSD was obtained by experimental trial and error. The control design parameter (φ ) was optimised to obtain the setpoint for the supersaturation controller and the batch time, in order to achieve the target experimental CSD. Results are shown in Figure 3. Since the target distribution was obtained experimentally, it represents a feasible setpoint for the system. Hence, the predicted CSD is in good agreement with the experimental CSD. Figures 3 (A and B) show the results using different pairs of supersaturation values and batch times, corresponding to a constant value of the design parameterφ .
0 500 10000
0.005
0.01
0.015
Vol
ume
pdf (µm
-1)
Particle size(µm)
Target CSD (experimental)Simulated CSDSeed
(A)
0 500 10000
0.005
0.01
0.015
Vol
ume
pdf (µm
-1)
Particle size(µm)
Target CSD (experimental)Simulated CSDSeed
(B)
Fig 3: Results with the optimized design parameter 0.206 minφ = , designed to achieve the target experimental CSD. (A) fixed batch time of 80batcht min= and calculated 0.00257spS = ; (B) fixed supersaturation setpoint
0.00215spS = and calculated batch time 96batcht min= .
The methodology was also evaluated for the design of crystallization systems with arbitrary target CSDs. A lognormal CSD was selected with mean 420mL mµ= and standard deviation 0.22σ = . Figure 4(A) shows that the system with the optimized supersaturation design parameter of 0.203 minφ = is able to achieve a product CSD with good agreement
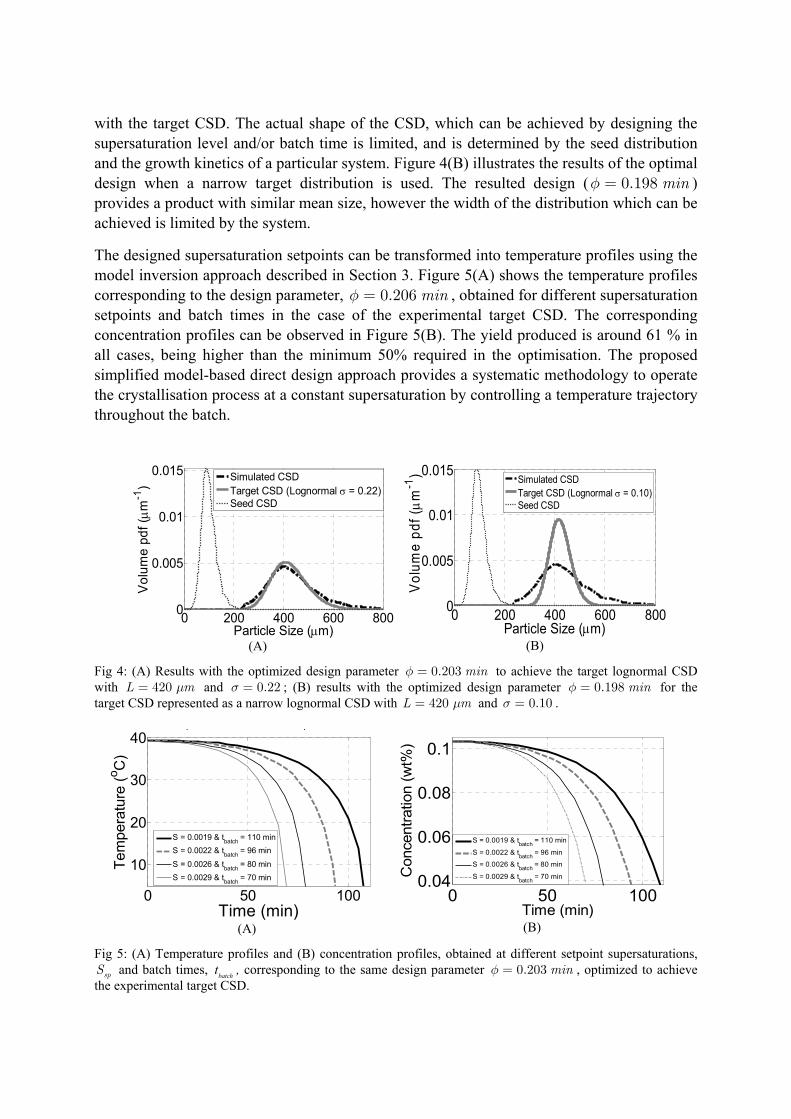
with the target CSD. The actual shape of the CSD, which can be achieved by designing the supersaturation level and/or batch time is limited, and is determined by the seed distribution and the growth kinetics of a particular system. Figure 4(B) illustrates the results of the optimal design when a narrow target distribution is used. The resulted design ( 0.198 minφ = ) provides a product with similar mean size, however the width of the distribution which can be achieved is limited by the system.
The designed supersaturation setpoints can be transformed into temperature profiles using the model inversion approach described in Section 3. Figure 5(A) shows the temperature profiles corresponding to the design parameter, 0.206 minφ = , obtained for different supersaturation setpoints and batch times in the case of the experimental target CSD. The corresponding concentration profiles can be observed in Figure 5(B). The yield produced is around 61 % in all cases, being higher than the minimum 50% required in the optimisation. The proposed simplified model-based direct design approach provides a systematic methodology to operate the crystallisation process at a constant supersaturation by controlling a temperature trajectory throughout the batch.
0 200 400 600 8000
0.005
0.01
0.015
Particle Size (µm)
Vol
ume
pdf (µm
-1)
Simulated CSDTarget CSD (Lognormal σ = 0.22)Seed CSD
(A)
0 200 400 600 8000
0.005
0.01
0.015
Particle Size (µm)
Vol
ume
pdf (µ m
-1)
Simulated CSDTarget CSD (Lognormal σ = 0.10)Seed CSD
(B)
Fig 4: (A) Results with the optimized design parameter 0.203 minφ = to achieve the target lognormal CSD with 420L mµ= and 0.22σ = ; (B) results with the optimized design parameter 0.198 minφ = for the target CSD represented as a narrow lognormal CSD with 420L mµ= and 0.10σ = .
0 50 100
10
20
30
40
Time (min)
Tem
pera
ture
(o C)
p φ
S = 0.0019 & tbatch = 110 minS = 0.0022 & tbatch = 96 min
S = 0.0026 & tbatch = 80 minS = 0.0029 & tbatch = 70 min
(A)
0 50 1000.04
0.06
0.08
0.1
Time (min)
Con
cent
ratio
n (w
t%)
S = 0.0019 & tbatch = 110 min
S = 0.0022 & tbatch = 96 min
S = 0.0026 & tbatch = 80 min
S = 0.0029 & tbatch = 70 min
(B)
Fig 5: (A) Temperature profiles and (B) concentration profiles, obtained at different setpoint supersaturations, spS and batch times, batcht , corresponding to the same design parameter 0.203 minφ = , optimized to achieve
the experimental target CSD.
5. Shaping the CSD through Seed Recipe Design
In addition to the supersaturation and batch time (determined by the design parameter φ ) the seed recipes can also be optimised [8] to obtain the desired target CSD, which may not be achieved by optimizing the φ only. A particular seed CSD can be obtained experimentally by mixing different amounts of seeds with different size distributions. The seed recipe was represented by a sum of Gaussians and the optimisation problem with the objective of shaping the distribution at the end of the batch was formulated as follows,
2, ,
1min ( )
dN
v i v ii
f fβ
=
⎧ ⎫−⎨ ⎬
⎩ ⎭∑ , (18)
Subject to: max0 β β≤ ≤ , (19)
, ,1
( , )gN
n seed i i m i ii
f w N L σ=
=∑ , (20)
where 1 ,1 1 ,[ , , ,..., , , ]g g gm N m N Nw L w Lβ σ σ= is the seed design vector with gN the number of
Gaussians, iw the weights, ,m iL the mean sizes (µm) and iσ (µm) the standard deviations of the respective Gaussians distributions, iN , 1, 2, , gi N= … .
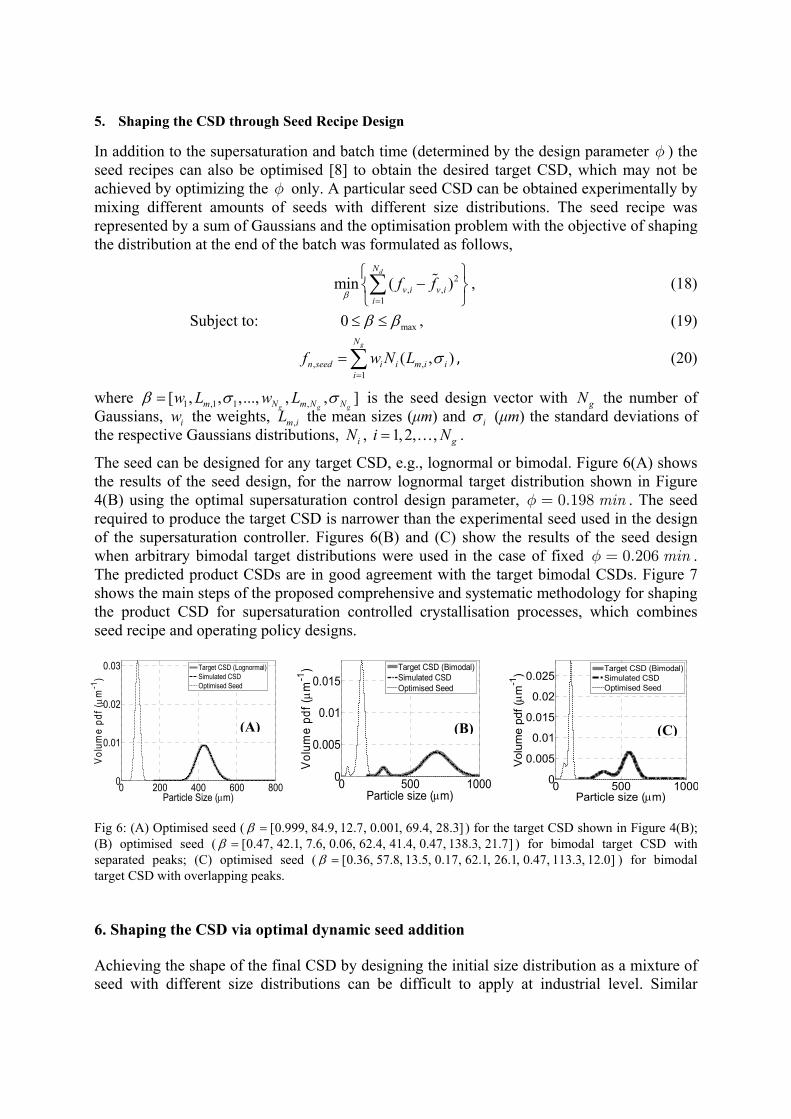
The seed can be designed for any target CSD, e.g., lognormal or bimodal. Figure 6(A) shows the results of the seed design, for the narrow lognormal target distribution shown in Figure 4(B) using the optimal supersaturation control design parameter, 0.198 minφ = . The seed required to produce the target CSD is narrower than the experimental seed used in the design of the supersaturation controller. Figures 6(B) and (C) show the results of the seed design when arbitrary bimodal target distributions were used in the case of fixed 0.206 minφ = . The predicted product CSDs are in good agreement with the target bimodal CSDs. Figure 7 shows the main steps of the proposed comprehensive and systematic methodology for shaping the product CSD for supersaturation controlled crystallisation processes, which combines seed recipe and operating policy designs.
0 200 400 600 8000
0.01
0.02
0.03
Particle Size (µm)
Volu
me
pdf (µm
-1)
Target CSD (Lognormal)Simulated CSDOptimised Seed
0 500 10000
0.005
0.01
0.015
Particle size (µm)
Vol
ume
pdf (µ m
-1)
Target CSD (Bimodal)Simulated CSDOptimised Seed
0 500 10000
0.005
0.01
0.015
0.02
0.025
Particle size (µm)
Volu
me
pdf (µ m
-1)
Target CSD (Bimodal)Simulated CSDOptimised Seed
Fig 6: (A) Optimised seed ( [0.999, 84.9, 12.7, 0.001, 69.4, 28.3]β = ) for the target CSD shown in Figure 4(B); (B) optimised seed ( [0.47, 42.1, 7.6, 0.06, 62.4, 41.4, 0.47, 138.3, 21.7]β = ) for bimodal target CSD with separated peaks; (C) optimised seed ( [0.36, 57.8, 13.5, 0.17, 62.1, 26.1, 0.47, 113.3, 12.0]β = ) for bimodal target CSD with overlapping peaks. 6. Shaping the CSD via optimal dynamic seed addition Achieving the shape of the final CSD by designing the initial size distribution as a mixture of seed with different size distributions can be difficult to apply at industrial level. Similar
(A) (B) (C)
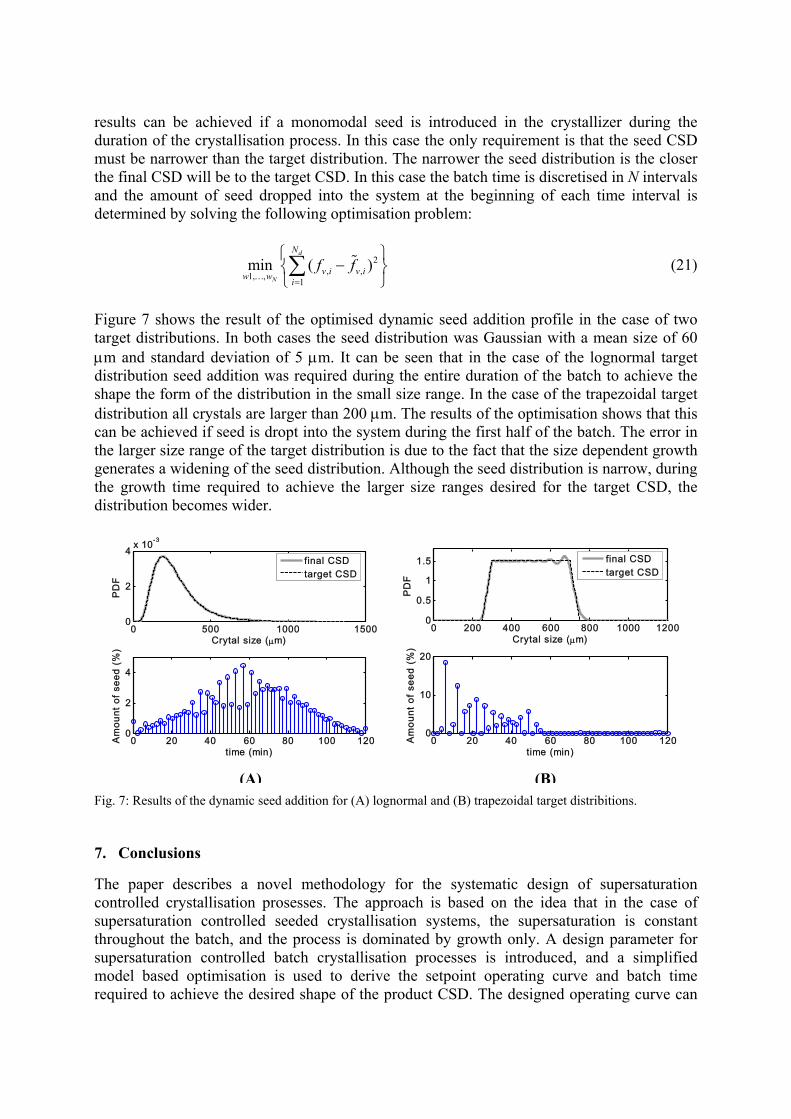
results can be achieved if a monomodal seed is introduced in the crystallizer during the duration of the crystallisation process. In this case the only requirement is that the seed CSD must be narrower than the target distribution. The narrower the seed distribution is the closer the final CSD will be to the target CSD. In this case the batch time is discretised in N intervals and the amount of seed dropped into the system at the beginning of each time interval is determined by solving the following optimisation problem:
2, ,1, , 1
min ( )d
N
N
v i v iw w if f
=
⎧ ⎫−⎨ ⎬
⎩ ⎭∑…
(21)
Figure 7 shows the result of the optimised dynamic seed addition profile in the case of two target distributions. In both cases the seed distribution was Gaussian with a mean size of 60 µm and standard deviation of 5 µm. It can be seen that in the case of the lognormal target distribution seed addition was required during the entire duration of the batch to achieve the shape the form of the distribution in the small size range. In the case of the trapezoidal target distribution all crystals are larger than 200 µm. The results of the optimisation shows that this can be achieved if seed is dropt into the system during the first half of the batch. The error in the larger size range of the target distribution is due to the fact that the size dependent growth generates a widening of the seed distribution. Although the seed distribution is narrow, during the growth time required to achieve the larger size ranges desired for the target CSD, the distribution becomes wider.
0 500 1000 15000
2
4x 10⁻³
Crytal size (µm)
PD
F
0 20 40 60 80 100 1200
2
4
time (min)
Am
ount
of s
eed
(%)
f inal CSDtarget CSD
0 200 400 600 800 1000 12000
0.5
1
1.5
Crytal size (µm)
PD
F
0 20 40 60 80 100 1200
10
20
time (min)
Am
ount
of
seed
(%
)
final CSDtarget CSD
Fig. 7: Results of the dynamic seed addition for (A) lognormal and (B) trapezoidal target distribitions. 7. Conclusions
The paper describes a novel methodology for the systematic design of supersaturation controlled crystallisation prosesses. The approach is based on the idea that in the case of supersaturation controlled seeded crystallisation systems, the supersaturation is constant throughout the batch, and the process is dominated by growth only. A design parameter for supersaturation controlled batch crystallisation processes is introduced, and a simplified model based optimisation is used to derive the setpoint operating curve and batch time required to achieve the desired shape of the product CSD. The designed operating curve can
(A) (B)
be implemented in the phase diagram using supersaturation control, or in the time domain using classical temperature control. An approach to design an optimal seed recipe is also presented, which can be used to achieve a desired shape of the product CSD, in conjunction with the supersaturation control design. The methods are exemplified in the case of the batch cooling crystallisation of potash alum system in water, for which a model has been developed and identified based on industrial experimental data.
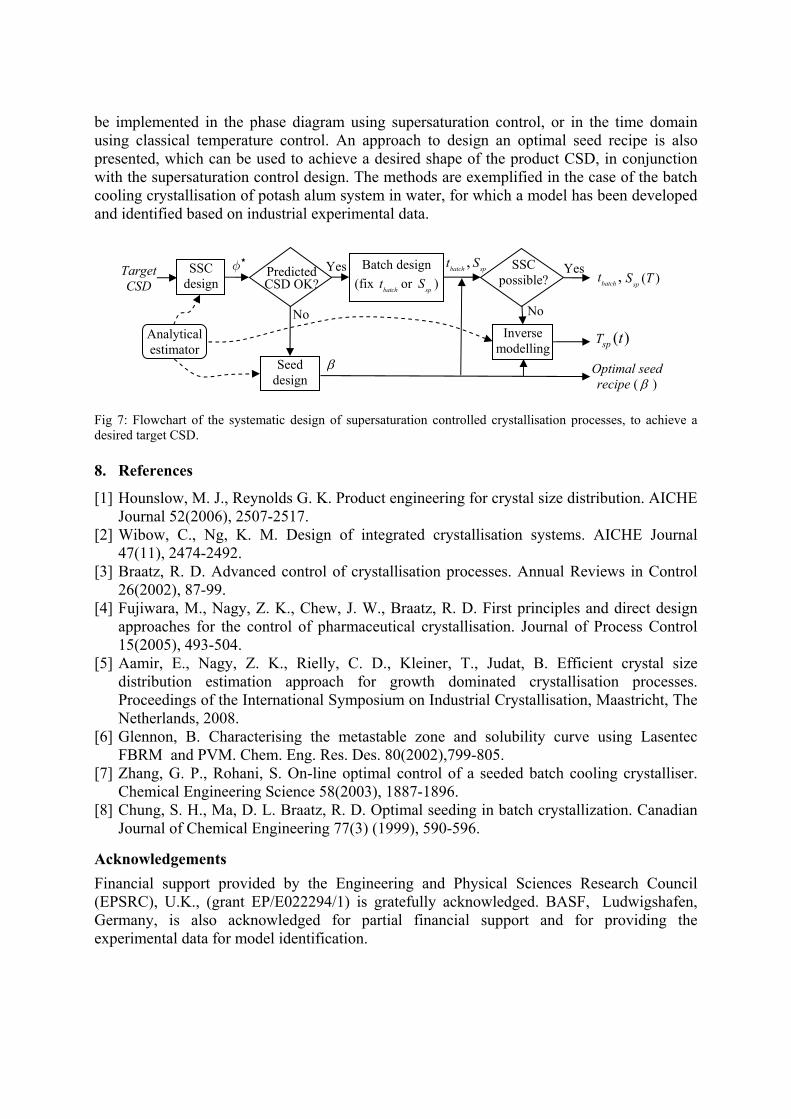
Fig 7: Flowchart of the systematic design of supersaturation controlled crystallisation processes, to achieve a desired target CSD. 8. References
[1] Hounslow, M. J., Reynolds G. K. Product engineering for crystal size distribution. AICHE Journal 52(2006), 2507-2517.
[2] Wibow, C., Ng, K. M. Design of integrated crystallisation systems. AICHE Journal 47(11), 2474-2492.
[3] Braatz, R. D. Advanced control of crystallisation processes. Annual Reviews in Control 26(2002), 87-99.
[4] Fujiwara, M., Nagy, Z. K., Chew, J. W., Braatz, R. D. First principles and direct design approaches for the control of pharmaceutical crystallisation. Journal of Process Control 15(2005), 493-504.
[5] Aamir, E., Nagy, Z. K., Rielly, C. D., Kleiner, T., Judat, B. Efficient crystal size distribution estimation approach for growth dominated crystallisation processes. Proceedings of the International Symposium on Industrial Crystallisation, Maastricht, The Netherlands, 2008.
[6] Glennon, B. Characterising the metastable zone and solubility curve using Lasentec FBRM and PVM. Chem. Eng. Res. Des. 80(2002),799-805.
[7] Zhang, G. P., Rohani, S. On-line optimal control of a seeded batch cooling crystalliser. Chemical Engineering Science 58(2003), 1887-1896.
[8] Chung, S. H., Ma, D. L. Braatz, R. D. Optimal seeding in batch crystallization. Canadian Journal of Chemical Engineering 77(3) (1999), 590-596.
Acknowledgements
Financial support provided by the Engineering and Physical Sciences Research Council (EPSRC), U.K., (grant EP/E022294/1) is gratefully acknowledged. BASF, Ludwigshafen, Germany, is also acknowledged for partial financial support and for providing the experimental data for model identification.
Analytical estimator
SSC design
Batch design (fix batcht or spS )
Predicted CSD OK?
SSC possible?
Inverse modelling
Seed design
φ ,batch spt S
Optimal seed recipe ( β )
No
Yes Yes,batcht ( )spS T
( )spT tNo
β
Target CSD