Systematic Association Mapping Identifies NELL1 as a Novel IBD Disease Gene
13
Systematic Association Mapping Identifies NELL1 as a Novel IBD Disease Gene Andre Franke 1 , Jochen Hampe 2 , Philip Rosenstiel 1 , Christian Becker 3,4 , Florian Wagner 4 , Robert Ha ¨ sler 1 , Randall D. Little 5 , Klaus Huse 6 , Andreas Ruether 7 , Tobias Balschun 1 , Michael Wittig 7 , Abdou ElSharawy 1 , Gabriele Mayr 8 , Mario Albrecht 8 , Natalie J. Prescott 9 , Clive M. Onnie 9 , He ´le ` ne Fournier 5 , Tim Keith 5 , Uwe Radelof 4 , Matthias Platzer 6 , Christopher G. Mathew 9 , Monika Stoll 10 , Michael Krawczak 7,11 , Peter Nu ¨ rnberg 3,12 , Stefan Schreiber 1,2,7 * 1 Institute for Clinical Molecular Biology, Christian-Albrechts University Kiel, Kiel, Germany, 2 First Department of Medicine, University Hospital Schleswig-Holstein, Kiel, Germany, 3 Cologne Center for Genomics, University of Cologne, Ko ¨ ln, Germany, 4 RZPD German Resource Center for Genome Research, Berlin, Germany, 5 Genizon BioSciences5, Que ´bec, Canada, 6 Genome Analysis Group, Leibniz Institute for Age Research, Jena, Germany, 7 PopGen Biobank, Christian-Albrechts University Kiel, Kiel, Germany, 8 Max-Planck Institute for Informatics, Saarbru ¨ cken, Germany, 9 Department of Medical and Molecular Genetics, King’s College London School of Medicine, London, United Kingdom, 10 Leibniz-Institute for Arteriosclerosis Research, University Mu ¨ nster, Mu ¨ nster, Germany, 11 Institute of Medical Statistics and Informatics, Christian-Albrechts University Kiel, Kiel, Germany, 12 Center for Molecular Medicine Cologne, University of Cologne, Ko ¨ ln, Germany Crohn disease (CD), a sub-entity of inflammatory bowel disease (IBD), is a complex polygenic disorder. Although recent studies have successfully identified CD-associated genetic variants, these susceptibility loci explain only a fraction of the heritability of the disease. Here, we report on a multi-stage genome-wide scan of 393 German CD cases and 399 controls. Among the 116,161 single-nucleotide polymorphisms tested, an association with the known CD susceptibility gene NOD2, the 5q31 haplotype, and the recently reported CD locus at 5p13.1 was confirmed. In addition, SNP rs1793004 in the gene encoding nel-like 1 precursor (NELL1, chromosome 11p15.1) showed a consistent disease-association in independent German population- and family-based samples (942 cases, 1082 controls, 375 trios). Subsequent fine mapping and replication in an independent sample of 454 French/Canadian CD trios supported the authenticity of the NELL1 association. Further confirmation in a large German ulcerative colitis (UC) sample indicated that NELL1 is a ubiquitous IBD susceptibility locus (combined p,10 26 ; OR = 1.66, 95% CI: 1.30–2.11). The novel 5p13.1 locus was also replicated in the French/Canadian sample and in an independent UK CD patient panel (453 cases, 521 controls, combined p,10 26 for SNP rs1992660). Several associations were replicated in at least one independent sample, point to an involvement of ITGB6 (upstream), GRM8 (downstream), OR5V1 (downstream), PPP3R2 (downstream), NM_152575 (upstream) and HNF4G (intron). Citation: Franke A, Hampe J, Rosenstiel P, Becker C, Wagner F, et al (2007) Systematic Association Mapping Identifies NELL1 as a Novel IBD Disease Gene. PLoS ONE 2(8): e691. doi:10.1371/journal.pone.0000691 INTRODUCTION An estimated 1.4 million individuals in the United States and 2.2 million individuals in Europe suffer from inflammatory bowel disease [1] (IBD, MIM 601458, 266600, 191390), a life-long disease that occurs in the form of one of two major sub-phenotypes, Crohn disease (CD) or ulcerative colitis (UC). The pathophysiology of IBD is characterized by a highly activated state of the mucosal immune system and excessive mucosal destruction. The enteric flora appears to play a key role as a stimulating agent [2]. Familial clustering [3,4] and an increased concordance rate of IBD among monozygotic twins [5,6] are hallmarks of the genetic aetiology of IBD, a notion that is further supported by the discovery of several disease genes. This includes NOD2 [7–9] (IBD1), a risk haplotype in the 5q31 (IBD5) locus [10,11], DLG5 [12,13], TNFSF15 [14], ATG16L1 [15], CARD4 [16], and recently IL23R [17]. High-density SNP arrays have enabled genome-wide associa- tion scans (GWS) to be performed at reasonable costs. Yamazaki and colleagues reported the first GWS for CD, which resulted in the identification of associated polymorphisms in the TNFSF15 gene [14]. Recently, two other GWS reported the novel CD susceptibility loci IL23R [17] and 5p13.1 [18]. We recently performed a genome- wide candidate gene analysis, using 19,779 non-synonymous SNPs, which led to the identification of a common variant (T300A) in the ATG16L1 gene as predisposing to CD [15], a finding that was later replicated by four other groups [18–21]. Here, we report upon the identification of additional risk loci for CD through a multi-stage genome-wide association scan (Figure S1) in 393 German cases and 399 German population-representative controls, using the Affymetrix GeneChipH Human Mapping 100K Set [22]. In order to enrich our samples with risk alleles [23] and to reduce phenotypic heterogeneity, CD patients in the GWS were selected for a ‘‘severe’’ phenotype, including a positive IBD family history, age of onset#25 years, and no change in diagnosis over the last five years. The SNPs representing the top 200 association leads were re-genotyped in both, a large independent German case- control sample and a family-based sample comprising 375 nuclear families. In addition to replicating NOD2, IBD5, and 5p13.1, a novel susceptibility locus was identified on chromosome 11p15.1, namely the nel-like 1 precursor-encoding gene (NELL1). Academic Editor: Greg Gibson, North Carolina State University, United States of America Received June 15, 2007; Accepted June 20, 2007; Published August 8, 2007 Copyright: ß 2007 Franke et al. This is an open-access article distributed under the terms of the Creative Commons Attribution License, which permits unrestricted use, distribution, and reproduction in any medium, provided the original author and source are credited. Funding: This study was supported by the German Ministry of Education and Research (BMBF) through the National Genome Research Network (NGFN), the German Research Council (Ha3091/1-2), by the POPGEN biobank, the German Research Council, the Wellcome Trust and CORE (UK). We acknowledge use of genotype data from the British 1958 Birth Cohort DNA collection, funded by Medical Research Council grant G0000934 and Wellcome Trust grant 068545/Z/ 02. Competing Interests: The authors have declared that no competing interests exist. * To whom correspondence should be addressed. E-mail: s.schreiber@mucosa. de PLoS ONE | www.plosone.org 1 August 2007 | Issue 8 | e691
-
Upload
independent -
Category
Documents
-
view
2 -
download
0
Transcript of Systematic Association Mapping Identifies NELL1 as a Novel IBD Disease Gene
Systematic Association Mapping Identifies NELL1 asa Novel IBD Disease GeneAndre Franke1, Jochen Hampe2, Philip Rosenstiel1, Christian Becker3,4, Florian Wagner4, Robert Hasler1, Randall D. Little5, Klaus Huse6,Andreas Ruether7, Tobias Balschun1, Michael Wittig7, Abdou ElSharawy1, Gabriele Mayr8, Mario Albrecht8, Natalie J. Prescott9, Clive M. Onnie9,Helene Fournier5, Tim Keith5, Uwe Radelof4, Matthias Platzer6, Christopher G. Mathew9, Monika Stoll10, Michael Krawczak7,11,Peter Nurnberg3,12, Stefan Schreiber1,2,7*
1 Institute for Clinical Molecular Biology, Christian-Albrechts University Kiel, Kiel, Germany, 2 First Department of Medicine, University HospitalSchleswig-Holstein, Kiel, Germany, 3 Cologne Center for Genomics, University of Cologne, Koln, Germany, 4 RZPD German Resource Center forGenome Research, Berlin, Germany, 5 Genizon BioSciences5, Quebec, Canada, 6 Genome Analysis Group, Leibniz Institute for Age Research, Jena,Germany, 7 PopGen Biobank, Christian-Albrechts University Kiel, Kiel, Germany, 8 Max-Planck Institute for Informatics, Saarbrucken, Germany,9 Department of Medical and Molecular Genetics, King’s College London School of Medicine, London, United Kingdom, 10 Leibniz-Institute forArteriosclerosis Research, University Munster, Munster, Germany, 11 Institute of Medical Statistics and Informatics, Christian-Albrechts University Kiel,Kiel, Germany, 12 Center for Molecular Medicine Cologne, University of Cologne, Koln, Germany
Crohn disease (CD), a sub-entity of inflammatory bowel disease (IBD), is a complex polygenic disorder. Although recent studieshave successfully identified CD-associated genetic variants, these susceptibility loci explain only a fraction of the heritability ofthe disease. Here, we report on a multi-stage genome-wide scan of 393 German CD cases and 399 controls. Among the 116,161single-nucleotide polymorphisms tested, an association with the known CD susceptibility gene NOD2, the 5q31 haplotype, andthe recently reported CD locus at 5p13.1 was confirmed. In addition, SNP rs1793004 in the gene encoding nel-like 1 precursor(NELL1, chromosome 11p15.1) showed a consistent disease-association in independent German population- and family-basedsamples (942 cases, 1082 controls, 375 trios). Subsequent fine mapping and replication in an independent sample of 454French/Canadian CD trios supported the authenticity of the NELL1 association. Further confirmation in a large Germanulcerative colitis (UC) sample indicated that NELL1 is a ubiquitous IBD susceptibility locus (combined p,1026; OR = 1.66, 95%CI: 1.30–2.11). The novel 5p13.1 locus was also replicated in the French/Canadian sample and in an independent UK CD patientpanel (453 cases, 521 controls, combined p,1026 for SNP rs1992660). Several associations were replicated in at least oneindependent sample, point to an involvement of ITGB6 (upstream), GRM8 (downstream), OR5V1 (downstream), PPP3R2(downstream), NM_152575 (upstream) and HNF4G (intron).
Citation: Franke A, Hampe J, Rosenstiel P, Becker C, Wagner F, et al (2007) Systematic Association Mapping Identifies NELL1 as a Novel IBD DiseaseGene. PLoS ONE 2(8): e691. doi:10.1371/journal.pone.0000691
INTRODUCTIONAn estimated 1.4 million individuals in the United States and 2.2
million individuals in Europe suffer from inflammatory bowel
disease [1] (IBD, MIM 601458, 266600, 191390), a life-long
disease that occurs in the form of one of two major sub-phenotypes,
Crohn disease (CD) or ulcerative colitis (UC). The pathophysiology
of IBD is characterized by a highly activated state of the mucosal
immune system and excessive mucosal destruction. The enteric
flora appears to play a key role as a stimulating agent [2]. Familial
clustering [3,4] and an increased concordance rate of IBD among
monozygotic twins [5,6] are hallmarks of the genetic aetiology of
IBD, a notion that is further supported by the discovery of several
disease genes. This includes NOD2 [7–9] (IBD1), a risk haplotype in
the 5q31 (IBD5) locus [10,11], DLG5 [12,13], TNFSF15 [14],
ATG16L1 [15], CARD4 [16], and recently IL23R [17].
High-density SNP arrays have enabled genome-wide associa-
tion scans (GWS) to be performed at reasonable costs. Yamazaki
and colleagues reported the first GWS for CD, which resulted in the
identification of associated polymorphisms in the TNFSF15 gene
[14]. Recently, two other GWS reported the novel CD susceptibility
loci IL23R [17] and 5p13.1 [18]. We recently performed a genome-
wide candidate gene analysis, using 19,779 non-synonymous SNPs,
which led to the identification of a common variant (T300A) in the
ATG16L1 gene as predisposing to CD [15], a finding that was later
replicated by four other groups [18–21].
Here, we report upon the identification of additional risk loci for
CD through a multi-stage genome-wide association scan (Figure S1)
in 393 German cases and 399 German population-representative
controls, using the Affymetrix GeneChipH Human Mapping 100K
Set [22]. In order to enrich our samples with risk alleles [23] and to
reduce phenotypic heterogeneity, CD patients in the GWS were
selected for a ‘‘severe’’ phenotype, including a positive IBD family
history, age of onset#25 years, and no change in diagnosis over the
last five years. The SNPs representing the top 200 association leads
were re-genotyped in both, a large independent German case-
control sample and a family-based sample comprising 375 nuclear
families. In addition to replicating NOD2, IBD5, and 5p13.1, a novel
susceptibility locus was identified on chromosome 11p15.1, namely
the nel-like 1 precursor-encoding gene (NELL1).
Academic Editor: Greg Gibson, North Carolina State University, United States ofAmerica
Received June 15, 2007; Accepted June 20, 2007; Published August 8, 2007
Copyright: � 2007 Franke et al. This is an open-access article distributed underthe terms of the Creative Commons Attribution License, which permitsunrestricted use, distribution, and reproduction in any medium, provided theoriginal author and source are credited.
Funding: This study was supported by the German Ministry of Education andResearch (BMBF) through the National Genome Research Network (NGFN), theGerman Research Council (Ha3091/1-2), by the POPGEN biobank, the GermanResearch Council, the Wellcome Trust and CORE (UK). We acknowledge use ofgenotype data from the British 1958 Birth Cohort DNA collection, funded byMedical Research Council grant G0000934 and Wellcome Trust grant 068545/Z/02.
Competing Interests: The authors have declared that no competing interestsexist.
* To whom correspondence should be addressed. E-mail: [email protected]
PLoS ONE | www.plosone.org 1 August 2007 | Issue 8 | e691
RESULTS
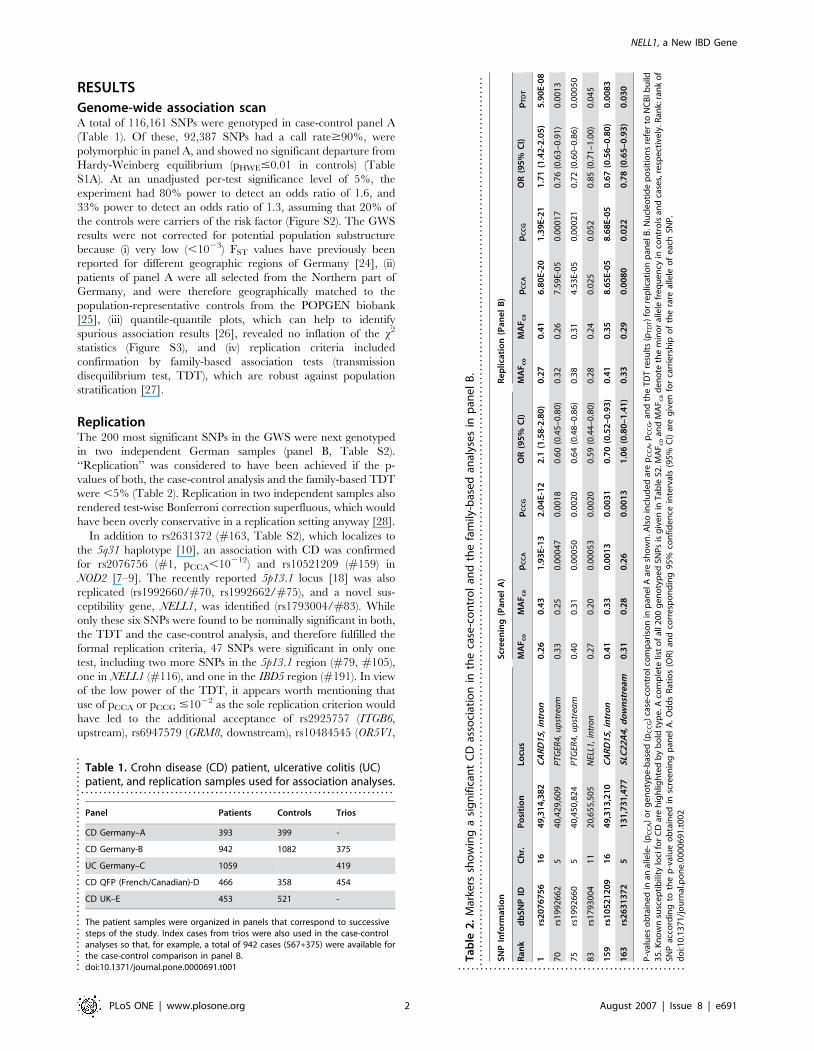
Genome-wide association scanA total of 116,161 SNPs were genotyped in case-control panel A
(Table 1). Of these, 92,387 SNPs had a call rate$90%, were
polymorphic in panel A, and showed no significant departure from
Hardy-Weinberg equilibrium (pHWE#0.01 in controls) (Table
S1A). At an unadjusted per-test significance level of 5%, the
experiment had 80% power to detect an odds ratio of 1.6, and
33% power to detect an odds ratio of 1.3, assuming that 20% of
the controls were carriers of the risk factor (Figure S2). The GWS
results were not corrected for potential population substructure
because (i) very low (,1023) FST values have previously been
reported for different geographic regions of Germany [24], (ii)
patients of panel A were all selected from the Northern part of
Germany, and were therefore geographically matched to the
population-representative controls from the POPGEN biobank
[25], (iii) quantile-quantile plots, which can help to identify
spurious association results [26], revealed no inflation of the x2
statistics (Figure S3), and (iv) replication criteria included
confirmation by family-based association tests (transmission
disequilibrium test, TDT), which are robust against population
stratification [27].
ReplicationThe 200 most significant SNPs in the GWS were next genotyped
in two independent German samples (panel B, Table S2).
‘‘Replication’’ was considered to have been achieved if the p-
values of both, the case-control analysis and the family-based TDT
were ,5% (Table 2). Replication in two independent samples also
rendered test-wise Bonferroni correction superfluous, which would
have been overly conservative in a replication setting anyway [28].
In addition to rs2631372 (#163, Table S2), which localizes to
the 5q31 haplotype [10], an association with CD was confirmed
for rs2076756 (#1, pCCA,10212) and rs10521209 (#159) in
NOD2 [7–9]. The recently reported 5p13.1 locus [18] was also
replicated (rs1992660/#70, rs1992662/#75), and a novel sus-
ceptibility gene, NELL1, was identified (rs1793004/#83). While
only these six SNPs were found to be nominally significant in both,
the TDT and the case-control analysis, and therefore fulfilled the
formal replication criteria, 47 SNPs were significant in only one
test, including two more SNPs in the 5p13.1 region (#79, #105),
one in NELL1 (#116), and one in the IBD5 region (#191). In view
of the low power of the TDT, it appears worth mentioning that
use of pCCA or pCCG #1022 as the sole replication criterion would
have led to the additional acceptance of rs2925757 (ITGB6,
upstream), rs6947579 (GRM8, downstream), rs10484545 (OR5V1,
Table 1. Crohn disease (CD) patient, ulcerative colitis (UC)patient, and replication samples used for association analyses.
. . . . . . . . . . . . . . . . . . . . . . . . . . . . . . . . . . . . . . . . . . . . . . . . . . . . . . . . . . . . . . . . . . . . . .
Panel Patients Controls Trios
CD Germany–A 393 399 -
CD Germany-B 942 1082 375
UC Germany–C 1059 419
CD QFP (French/Canadian)-D 466 358 454
CD UK–E 453 521 -
The patient samples were organized in panels that correspond to successivesteps of the study. Index cases from trios were also used in the case-controlanalyses so that, for example, a total of 942 cases (567+375) were available forthe case-control comparison in panel B.doi:10.1371/journal.pone.0000691.t001....
....
....
....
....
....
....
....
....
....
....
....
Ta
ble
2.
Mar
kers
sho
win
ga
sig
nif
ican
tC
Das
soci
atio
nin
the
case
-co
ntr
ol
and
the
fam
ily-b
ase
dan
alys
es
inp
ane
lB
...
....
....
....
....
....
....
....
....
....
....
....
....
....
....
....
....
....
....
....
....
....
....
....
....
....
....
....
....
....
....
....
....
....
....
....
....
....
....
....
....
....
....
....
....
....
....
....
....
....
.
SN
PIn
form
ati
on
Scr
ee
nin
g(P
an
el
A)
Re
pli
cati
on
(Pa
ne
lB
)
Ra
nk
db
SN
PID
Ch
r.P
osi
tio
nLo
cus
MA
Fc
oM
AF
ca
pC
CA
pC
CG
OR
(95
%C
I)M
AF
co
MA
Fc
ap
CC
Ap
CC
GO
R(9
5%
CI)
pT
DT
1rs
20
76
75
61
64
9,3
14
,38
2C
AR
D1
5,
intr
on
0.2
60
.43
1.9
3E
-13
2.0
4E
-12
2.1
(1.5
8-2
.80
)0
.27
0.4
16
.80
E-2
01
.39
E-2
11
.71
(1.4
2-2
.05
)5
.90
E-0
8
70
rs1
99
26
62
54
0,4
29
,60
9P
TGER
4,u
pst
rea
m0
.33
0.2
50
.00
04
70
.00
18
0.6
0(0
.45
–0
.80
)0
.32
0.2
67
.59
E-0
50
.00
01
70
.76
(0.6
3–
0.9
1)
0.0
01
3
75
rs1
99
26
60
54
0,4
50
,82
4P
TGER
4,u
pst
rea
m0
.40
0.3
10
.00
05
00
.00
20
0.6
4(0
.48
–0
.86
)0
.38
0.3
14
.53
E-0
50
.00
02
10
.72
(0.6
0–
0.8
6)
0.0
00
50
83
rs1
79
30
04
11
20
,65
5,5
05
NEL
L1,
intr
on
0.2
70
.20
0.0
00
53
0.0
02
00
.59
(0.4
4–
0.8
0)
0.2
80
.24
0.0
25
0.0
52
0.8
5(0
.71
–1
.00
)0
.04
5
15
9rs
10
52
12
09
16
49
,31
3,2
10
CA
RD
15
,in
tro
n0
.41
0.3
30
.00
13
0.0
03
10
.70
(0.5
2–
0.9
3)
0.4
10
.35
8.6
5E
-05
8.6
8E
-05
0.6
7(0
.56
–0
.80
)0
.00
83
16
3rs
26
31
37
25
13
1,7
31
,47
7S
LC2
2A
4,
do
wn
stre
am0
.31
0.2
80
.26
0.0
01
31
.06
(0.8
0–
1.4
1)
0.3
30
.29
0.0
08
00
.02
20
.78
(0.6
5–
0.9
3)
0.0
30
P-v
alu
es
ob
tain
ed
inan
alle
le-
(pC
CA
)o
rg
en
oty
pe
-bas
ed
(pC
CG
)ca
se-c
on
tro
lco
mp
aris
on
inp
ane
lAar
esh
ow
n.A
lso
incl
ud
ed
are
pC
CA
,pC
CG
,an
dth
eT
DT
resu
lts
(pT
DT)
for
rep
licat
ion
pan
elB
.Nu
cle
oti
de
po
siti
on
sre
fer
toN
CB
Ib
uild
35
.Kn
ow
nsu
sce
pti
bili
tylo
cifo
rC
Dar
eh
igh
ligh
ted
by
bo
ldty
pe
.Aco
mp
lete
list
of
all2
00
ge
no
typ
ed
SNP
sis
giv
en
inT
able
S2.M
AF
co
and
MA
F ca
de
no
teth
em
ino
ral
lele
fre
qu
en
cyin
con
tro
lsan
dca
ses,
resp
ect
ive
ly.R
ank:
ran
ko
fSN
Pac
cord
ing
toth
ep
-val
ue
ob
tain
ed
insc
ree
nin
gp
ane
lA
.O
dd
sR
atio
s(O
R)
and
corr
esp
on
din
g9
5%
con
fid
en
cein
terv
als
(95
%C
I)ar
eg
ive
nfo
rca
rrie
rsh
ipo
fth
era
real
lele
of
eac
hSN
P.
do
i:10
.13
71
/jo
urn
al.p
on
e.0
00
06
91
.t0
02
...................................................
NELL1, a New IBD Gene
PLoS ONE | www.plosone.org 2 August 2007 | Issue 8 | e691
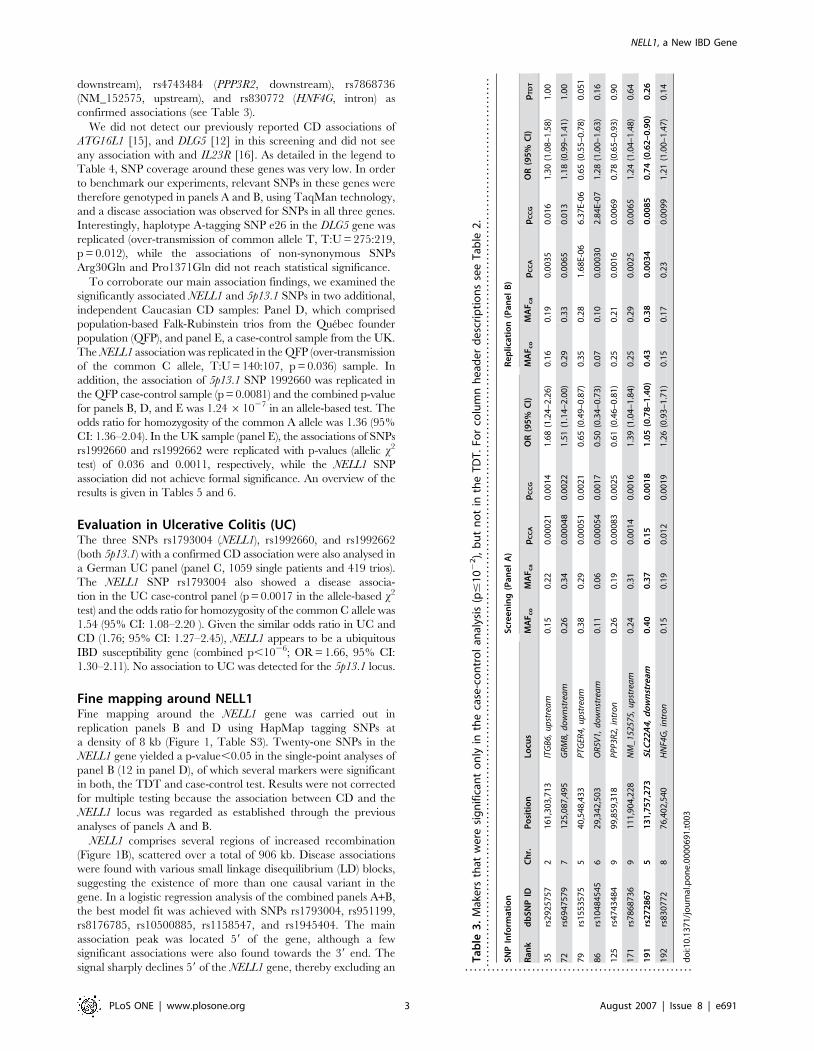
downstream), rs4743484 (PPP3R2, downstream), rs7868736
(NM_152575, upstream), and rs830772 (HNF4G, intron) as
confirmed associations (see Table 3).
We did not detect our previously reported CD associations of
ATG16L1 [15], and DLG5 [12] in this screening and did not see
any association with and IL23R [16]. As detailed in the legend to
Table 4, SNP coverage around these genes was very low. In order
to benchmark our experiments, relevant SNPs in these genes were
therefore genotyped in panels A and B, using TaqMan technology,
and a disease association was observed for SNPs in all three genes.
Interestingly, haplotype A-tagging SNP e26 in the DLG5 gene was
replicated (over-transmission of common allele T, T:U = 275:219,
p = 0.012), while the associations of non-synonymous SNPs
Arg30Gln and Pro1371Gln did not reach statistical significance.
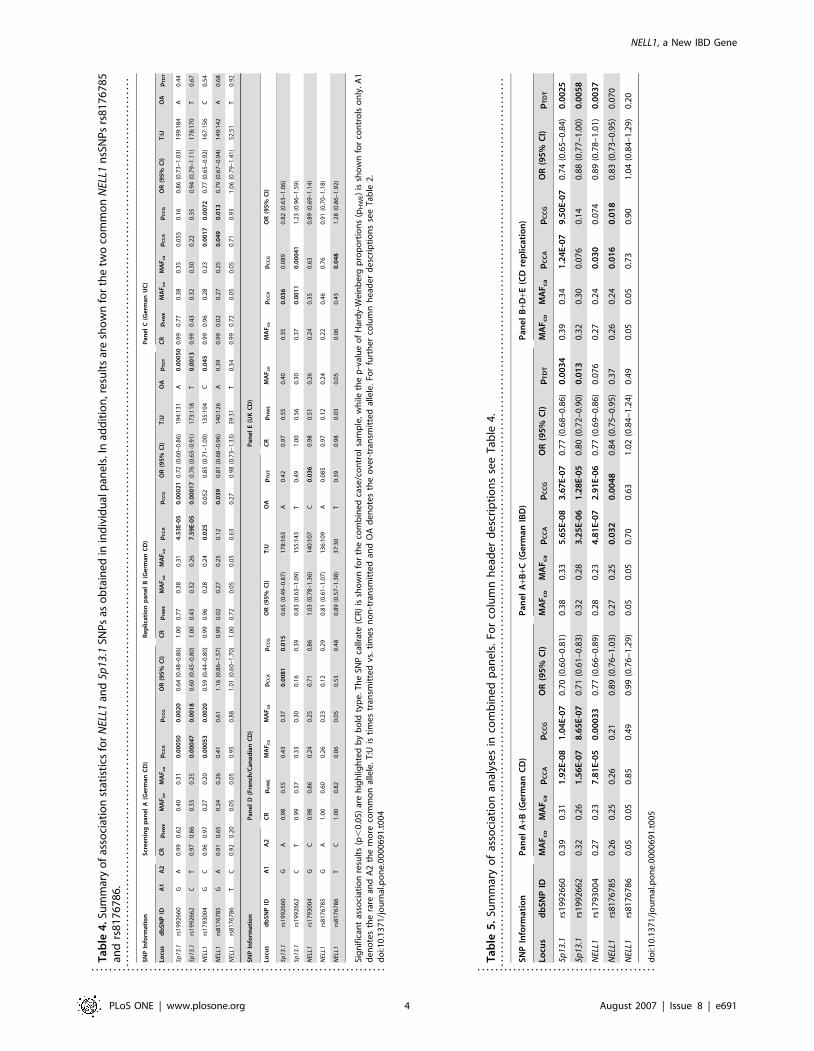
To corroborate our main association findings, we examined the
significantly associated NELL1 and 5p13.1 SNPs in two additional,
independent Caucasian CD samples: Panel D, which comprised
population-based Falk-Rubinstein trios from the Quebec founder
population (QFP), and panel E, a case-control sample from the UK.
The NELL1 association was replicated in the QFP (over-transmission
of the common C allele, T:U = 140:107, p = 0.036) sample. In
addition, the association of 5p13.1 SNP 1992660 was replicated in
the QFP case-control sample (p = 0.0081) and the combined p-value
for panels B, D, and E was 1.2461027 in an allele-based test. The
odds ratio for homozygosity of the common A allele was 1.36 (95%
CI: 1.36–2.04). In the UK sample (panel E), the associations of SNPs
rs1992660 and rs1992662 were replicated with p-values (allelic x2
test) of 0.036 and 0.0011, respectively, while the NELL1 SNP
association did not achieve formal significance. An overview of the
results is given in Tables 5 and 6.
Evaluation in Ulcerative Colitis (UC)The three SNPs rs1793004 (NELL1), rs1992660, and rs1992662
(both 5p13.1) with a confirmed CD association were also analysed in
a German UC panel (panel C, 1059 single patients and 419 trios).
The NELL1 SNP rs1793004 also showed a disease associa-
tion in the UC case-control panel (p = 0.0017 in the allele-based x2
test) and the odds ratio for homozygosity of the common C allele was
1.54 (95% CI: 1.08–2.20 ). Given the similar odds ratio in UC and
CD (1.76; 95% CI: 1.27–2.45), NELL1 appears to be a ubiquitous
IBD susceptibility gene (combined p,1026; OR = 1.66, 95% CI:
1.30–2.11). No association to UC was detected for the 5p13.1 locus.
Fine mapping around NELL1Fine mapping around the NELL1 gene was carried out in
replication panels B and D using HapMap tagging SNPs at
a density of 8 kb (Figure 1, Table S3). Twenty-one SNPs in the
NELL1 gene yielded a p-value,0.05 in the single-point analyses of
panel B (12 in panel D), of which several markers were significant
in both, the TDT and case-control test. Results were not corrected
for multiple testing because the association between CD and the
NELL1 locus was regarded as established through the previous
analyses of panels A and B.
NELL1 comprises several regions of increased recombination
(Figure 1B), scattered over a total of 906 kb. Disease associations
were found with various small linkage disequilibrium (LD) blocks,
suggesting the existence of more than one causal variant in the
gene. In a logistic regression analysis of the combined panels A+B,
the best model fit was achieved with SNPs rs1793004, rs951199,
rs8176785, rs10500885, rs1158547, and rs1945404. The main
association peak was located 59 of the gene, although a few
significant associations were also found towards the 39 end. The
signal sharply declines 59 of the NELL1 gene, thereby excluding an
Ta
ble
3.
Mak
ers
that
we
resi
gn
ific
ant
on
lyin
the
case
-co
ntr
ol
anal
ysis
(p#
10
22),
bu
tn
ot
inth
eT
DT
.Fo
rco
lum
nh
ead
er
de
scri
pti
on
sse
eT
able
2.
....
....
....
....
....
....
....
....
....
....
....
....
....
....
....
....
....
....
....
....
....
....
....
....
....
....
....
....
....
....
....
....
....
....
....
....
....
....
....
....
....
....
....
....
....
....
....
....
....
...
SN
PIn
form
ati
on
Scr
ee
nin
g(P
an
el
A)
Re
pli
cati
on
(Pa
ne
lB
)
Ra
nk
db
SN
PID
Ch
r.P
osi
tio
nLo
cus
MA
Fc
oM
AF
ca
pC
CA
pC
CG
OR
(95
%C
I)M
AF
co
MA
Fc
ap
CC
Ap
CC
GO
R(9
5%
CI)
pT
DT
35
rs2
92
57
57
21
61
,30
3,7
13
ITG
B6,
up
stre
am
0.1
50
.22
0.0
00
21
0.0
01
41
.68
(1.2
4–
2.2
6)
0.1
60
.19
0.0
03
50
.01
61
.30
(1.0
8–
1.5
8)
1.0
0
72
rs6
94
75
79
71
25
,08
7,4
95
GR
M8,
do
wn
stre
am
0.2
60
.34
0.0
00
48
0.0
02
21
.51
(1.1
4–
2.0
0)
0.2
90
.33
0.0
06
50
.01
31
.18
(0.9
9–
1.4
1)
1.0
0
79
rs1
55
35
75
54
0,5
48
,43
3P
TGER
4,u
pst
rea
m0
.38
0.2
90
.00
05
10
.00
21
0.6
5(0
.49
–0
.87
)0
.35
0.2
81
.68
E-0
66
.37
E-0
60
.65
(0.5
5–
0.7
8)
0.0
51
86
rs1
04
84
54
56
29
,34
2,5
03
OR
5V1,
do
wn
stre
am
0.1
10
.06
0.0
00
54
0.0
01
70
.50
(0.3
4–
0.7
3)
0.0
70
.10
0.0
00
30
2.8
4E-
07
1.2
8(1
.00
–1
.63
)0
.16
12
5rs
47
43
48
49
99
,85
9,3
18
PP
P3R
2,in
tro
n0
.26
0.1
90
.00
08
30
.00
25
0.6
1(0
.46
–0
.81
)0
.25
0.2
10
.00
16
0.0
06
90
.78
(0.6
5–
0.9
3)
0.9
0
17
1rs
78
68
73
69
11
1,9
04
,22
8N
M_
1525
75,
up
stre
am
0.2
40
.31
0.0
01
40
.00
16
1.3
9(1
.04
–1
.84
)0
.25
0.2
90
.00
25
0.0
06
51
.24
(1.0
4–
1.4
8)
0.6
4
19
1rs
27
28
67
51
31
,75
7,2
73
SLC
22
A4
,d
ow
nst
ream
0.4
00
.37
0.1
50
.00
18
1.0
5(0
.78
–1
.40
)0
.43
0.3
80
.00
34
0.0
08
50
.74
(0.6
2–
0.9
0)
0.2
6
19
2rs
83
07
72
87
6,4
02
,54
0H
NF4
G,
intr
on
0.1
50
.19
0.0
12
0.0
01
91
.26
(0.9
3–
1.7
1)
0.1
50
.17
0.2
30
.00
99
1.2
1(1
.00
–1
.47
)0
.14
do
i:10
.13
71
/jo
urn
al.p
on
e.0
00
06
91
.t0
03
...................................................
NELL1, a New IBD Gene
PLoS ONE | www.plosone.org 3 August 2007 | Issue 8 | e691
Ta
ble
4.S
um
mar
yo
fas
soci
atio
nst
atis
tics
for
NEL
L1an
d5p
13.1
SNP
sas
ob
tain
ed
inin
div
idu
alp
ane
ls.I
nad
dit
ion
,re
sult
sar
esh
ow
nfo
rth
etw
oco
mm
on
NEL
L1n
sSN
Ps
rs8
17
67
85
and
rs8
17
67
86
...
....
....
....
....
....
....
....
....
....
....
....
....
....
....
....
....
....
....
....
....
....
....
....
....
....
....
....
....
....
....
....
....
....
....
....
....
....
....
....
....
....
....
....
....
....
....
....
....
....
.
SN
PIn
form
ati
on
Scr
ee
nin
gp
an
el
A(G
erm
an
CD
)R
ep
lica
tio
np
an
el
B(G
erm
an
CD
)P
an
el
C(G
erm
an
UC
)
Locu
sd
bS
NP
IDA
1A
2C
Rp
HW
EM
AF
co
MA
Fc
ap
CC
Ap
CC
GO
R(9
5%
CI)
CR
pH
WE
MA
Fc
oM
AF
ca
pC
CA
pC
CG
OR
(95
%C
I)T
:UO
Ap
TD
TC
Rp
HW
EM
AF
co
MA
Fc
ap
CC
Ap
CC
GO
R(9
5%
CI)
T:U
OA
pT
DT
5p13
.1rs
19
92
66
0G
A0
.99
0.6
20
.40
0.3
10
.00
05
00
.00
20
0.6
4(0
.48
–0
.86
)1
.00
0.7
70
.38
0.3
14
.53
E-0
50
.00
02
10
.72
(0.6
0–
0.8
6)
19
4:1
31
A0
.00
05
00
.99
0.7
70
.38
0.3
50
.05
50
.16
0.8
6(0
.73
–1
.03
)1
99
:18
4A
0.4
4
5p13
.1rs
19
92
66
2C
T0
.97
0.8
60
.33
0.2
50
.00
04
70
.00
18
0.6
0(0
.45
–0
.80
)1
.00
0.4
30
.32
0.2
67
.59
E-0
50
.00
01
70
.76
(0.6
3–
0.9
1)
17
3:1
18
T0
.00
13
0.9
90
.43
0.3
20
.30
0.2
20
.35
0.9
4(0
.79
–1
.11
)1
78
:17
0T
0.6
7
NEL
L1rs
17
93
00
4G
C0
.96
0.9
70
.27
0.2
00
.00
05
30
.00
20
0.5
9(0
.44
–0
.80
)0
.99
0.9
60
.28
0.2
40
.02
50
.05
20
.85
(0.7
1–
1.0
0)
13
5:1
04
C0
.04
50
.99
0.9
60
.28
0.2
30
.00
17
0.0
07
20
.77
(0.6
5–
0.9
2)
16
7:1
56
C0
.54
NEL
L1rs
81
76
78
5G
A0
.91
0.6
50
.24
0.2
60
.41
0.6
11
.16
(0.8
6–
1.5
7)
0.9
90
.02
0.2
70
.25
0.1
20
.03
90
.81
(0.6
8–
0.9
6)
14
0:1
26
A0
.39
0.9
90
.02
0.2
70
.25
0.0
49
0.0
13
0.7
9(0
.67
–0
.94
)1
49
:14
2A
0.6
8
NEL
L1rs
81
76
78
6T
C0
.92
0.2
00
.05
0.0
50
.95
0.8
81
.01
(0.6
0–
1.7
0)
1.0
00
.72
0.0
50
.05
0.6
30
.27
0.9
8(0
.73
–1
.33
)3
9:3
1T
0.3
40
.99
0.7
20
.05
0.0
50
.71
0.9
31
.06
(0.7
9–
1.4
1)
52
:51
T0
.92
SN
PIn
form
ati
on
Pa
ne
lD
(Fre
nch
/Ca
na
dia
nC
D)
Pa
ne
lE
(UK
CD
)
Locu
sd
bS
NP
IDA
1A
2C
Rp
HW
EM
AF
co
MA
Fc
ap
CC
Ap
CC
GO
R(9
5%
CI)
T:U
OA
pT
DT
CR
pH
WE
MA
Fc
oM
AF
ca
pC
CA
pC
CG
OR
(95
%C
I)
5p13
.1rs
19
92
66
0G
A0
.98
0.5
50
.43
0.3
70
.00
81
0.0
15
0.6
5(0
.49
–0
.87
)1
78
:16
3A
0.4
20
.97
0.5
50
.40
0.3
50
.03
60
.08
90
.82
(0.6
3–
1.0
6)
5p13
.1rs
19
92
66
2C
T0
.99
0.3
70
.33
0.3
00
.16
0.3
90
.83
(0.6
3–
1.0
9)
15
5:1
43
T0
.49
1.0
00
.56
0.3
00
.37
0.0
01
10
.00
04
11
.23
(0.9
6–
1.5
9)
NEL
L1rs
17
93
00
4G
C0
.98
0.8
60
.24
0.2
50
.71
0.8
61
.03
(0.7
8–
1.3
6)
14
0:1
07
C0
.03
60
.98
0.5
10
.26
0.2
40
.35
0.6
30
.89
(0.6
9–
1.1
4)
NEL
L1rs
81
76
78
5G
A1
.00
0.6
00
.26
0.2
30
.12
0.2
90
.81
(0.6
1–
1.0
7)
13
6:1
09
A0
.08
50
.97
0.1
20
.24
0.2
20
.46
0.7
60
.91
(0.7
0–
1.1
8)
NEL
L1rs
81
76
78
6T
C1
.00
0.8
20
.06
0.0
50
.53
0.4
80
.89
(0.5
7–
1.3
8)
37
:30
T0
.39
0.9
80
.03
0.0
50
.06
0.4
30
.04
81
.28
(0.8
6–
1.9
2)
Sig
nif
ican
tas
soci
atio
nre
sult
s(p
,0
.05
)ar
eh
igh
ligh
ted
by
bo
ldty
pe
.T
he
SNP
callr
ate
(CR
)is
sho
wn
for
the
com
bin
ed
case
/co
ntr
ol
sam
ple
,w
hile
the
p-v
alu
eo
fH
ard
y-W
ein
be
rgp
rop
ort
ion
s(p
HW
E)
issh
ow
nfo
rco
ntr
ols
on
ly.
A1
de
no
tes
the
rare
and
A2
the
mo
reco
mm
on
alle
le.
T:U
isti
me
str
ansm
itte
dvs
.ti
me
sn
on
-tra
nsm
itte
dan
dO
Ad
en
ote
sth
eo
ver-
tran
smit
ted
alle
le.
For
furt
he
rco
lum
nh
ead
er
de
scri
pti
on
sse
eT
able
2.
do
i:10
.13
71
/jo
urn
al.p
on
e.0
00
06
91
.t0
04
..................................................................
Ta
ble
5.
Sum
mar
yo
fas
soci
atio
nan
alys
es
inco
mb
ine
dp
ane
ls.
For
colu
mn
he
ade
rd
esc
rip
tio
ns
see
Tab
le4
...
....
....
....
....
....
....
....
....
....
....
....
....
....
....
....
....
....
....
....
....
....
....
....
....
....
....
....
....
....
....
....
....
....
....
....
....
....
....
....
....
....
....
....
....
....
....
....
....
....
.
SN
PIn
form
ati
on
Pa
ne
lA
+B(G
erm
an
CD
)P
an
el
A+B
+C(G
erm
an
IBD
)P
an
el
B+D
+E(C
Dre
pli
cati
on
)
Locu
sd
bS
NP
IDM
AF
co
MA
Fc
ap
CC
Ap
CC
GO
R(9
5%
CI)
MA
Fc
oM
AF
ca
pC
CA
pC
CG
OR
(95
%C
I)p
TD
TM
AF
co
MA
Fc
ap
CC
Ap
CC
GO
R(9
5%
CI)
pT
DT
5p13
.1rs
19
92
66
00
.39
0.3
11
.92
E-0
81
.04
E-0
70
.70
(0.6
0–
0.8
1)
0.3
80
.33
5.6
5E
-08
3.6
7E
-07
0.7
7(0
.68
–0
.86
)0
.00
34
0.3
90
.34
1.2
4E
-07
9.5
0E
-07
0.7
4(0
.65
–0
.84
)0
.00
25
5p13
.1rs
19
92
66
20
.32
0.2
61
.56
E-0
78
.65
E-0
70
.71
(0.6
1–
0.8
3)
0.3
20
.28
3.2
5E
-06
1.2
8E
-05
0.8
0(0
.72
–0
.90
)0
.01
30
.32
0.3
00
.07
60
.14
0.8
8(0
.77
–1
.00
)0
.00
58
NEL
L1rs
17
93
00
40
.27
0.2
37
.81
E-0
50
.00
03
30
.77
(0.6
6–
0.8
9)
0.2
80
.23
4.8
1E
-07
2.9
1E
-06
0.7
7(0
.69
–0
.86
)0
.07
60
.27
0.2
40
.03
00
.07
40
.89
(0.7
8–
1.0
1)
0.0
03
7
NEL
L1rs
81
76
78
50
.26
0.2
50
.26
0.2
10
.89
(0.7
6–
1.0
3)
0.2
70
.25
0.0
32
0.0
04
80
.84
(0.7
5–
0.9
5)
0.3
70
.26
0.2
40
.01
60
.01
80
.83
(0.7
3–
0.9
5)
0.0
70
NEL
L1rs
81
76
78
60
.05
0.0
50
.85
0.4
90
.99
(0.7
6–
1.2
9)
0.0
50
.05
0.7
00
.63
1.0
2(0
.84
–1
.24
)0
.49
0.0
50
.05
0.7
30
.90
1.0
4(0
.84
–1
.29
)0
.20
do
i:10
.13
71
/jo
urn
al.p
on
e.0
00
06
91
.t0
05
........................................
NELL1, a New IBD Gene
PLoS ONE | www.plosone.org 4 August 2007 | Issue 8 | e691
involvement of the proximate SLC6A5 gene. A gender-stratified
analysis (data not shown) of the 117 SNPs in panel B confirmed
a disease association in both genders.
Detection of Additional DNA Sequence VariantsSince rs1793004 clearly localizes to NELL1, a systematic search for
additional, potentially disease-associated variants in the gene was
carried out by re-sequencing all exons, splice sites, and the
promoter region in 47 CD patients (Table S4; for primer sequences
see Table S5). Apart from verifying 26 already annotated variants,
five new polymorphisms were identified, two of which represented
novel non-synonymous SNPs (nsSNPs): NELL01_02 (R136S) and
NELL01_03 (A153T). Both nsSNPs were located in exon 4 and
mapped to the thrombospondin N-terminal domain (TSPN) of the
NELL1 protein. Two known, common nsSNPs were verified
among the 26 annotated SNPs, namely rs8176785 (Q82R) in exon
3 and rs8176786 (R354W) in exon 10. Variant Q82R is located in
the TSPN domain, while R354W resides in a von Willebrand
factor type C (VWC) domain. In-silico analysis, including multiple
sequence alignment of NELL homologues and structural modeling
of the TSPN domain, revealed a strong conservation of the variant
positions (see Text S1 and Figure S4).
The novel nsSNPs were too rare to warrant formal statistical
analysis (total occurrence of heterozygotes in panel B (CD/
controls): 2/0 for R136S and 10/9 for A153T). While common
nsSNP rs8176786 showed a disease association in panel E
(p = 0.048), the second common nsSNP, rs8176785, was signifi-
cantly associated with CD in panel B (p = 0.039), and with UC in
panel C (p = 0.013). The combined p-value in the full German
IBD sample (A+B+C) was 0.0048 in a genotype-based x2 test (2
degrees of freedom).
Expression and Localization of NELL1 within the
Intestinal MucosaWhen NELL1 transcript levels were investigated by RT-PCR in
a tissue panel, high expression became apparent in small intestine,
kidney, prostate, and brain, whereas moderate expression was seen
in colonic mucosa and in immune-relevant organs/cells such as
thymus and spleen (Figure 2A). The localization of NELL1 in the
colonic mucosa was investigated by immunohistochemistry
(Figures 2B and 2C). Immunoreactivity was confined to large mono-
nuclear cells in the lamina propria. In Western blot experiments
using colonic biopsy specimen from normal controls and CD
patients (Figure 2E), the antibody recognized a single 90 kDa band
corresponding to the correct size of the annotated NELL1 transcript
(AK127805). Real-time quantitative PCR revealed no significant
difference between normal and patient tissue (data not shown).
Fine Mapping of 5p13.1The 650 kb susceptibility region on 5p13.1, upstream of the
PTGER4 gene, was subjected to fine mapping in panels B (1 SNP/
24 kb) and D (1 SNP/3 kb). Several SNPs showed a consistent
disease association in both panels (Table S6, Figure S5). The
strongest effect in the combined case-control panel (A+B) was seen
for SNP rs1553575 (odds ratio for homozygotes of the common G
allele: 1.78; 95% CI: 1.32–2.40).
Interestingly, the gender-stratified analysis of 5p13.1 SNPs
showed that the association signal was stronger in females than in
males (Table S7), suggesting that females carrying the predisposing
allele(s) of this locus are at higher risk to develop Crohn disease
than their male counterparts. To have comparable power, the
same number of male and female individuals were randomly
drawn from the combined panel (378 controls, 343 cases).
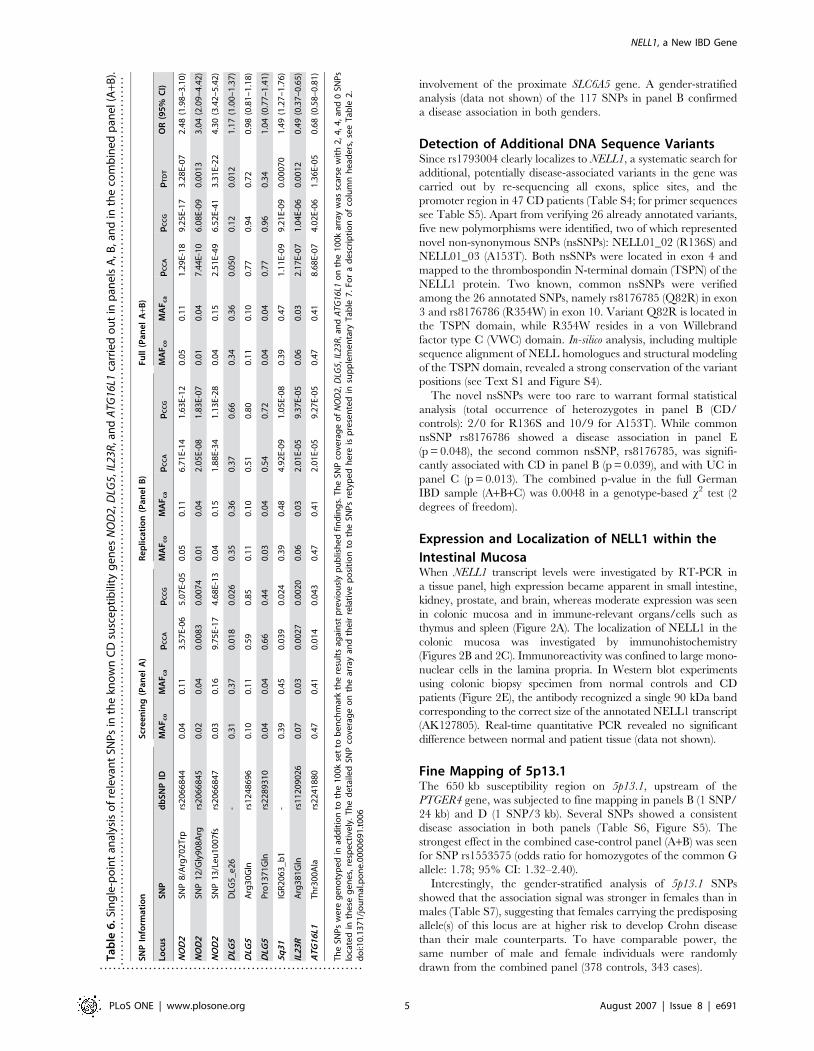
Ta
ble
6.
Sin
gle
-po
int
anal
ysis
of
rele
van
tSN
Ps
inth
ekn
ow
nC
Dsu
sce
pti
bili
tyg
en
es
NO
D2,
DLG
5,IL
23R
,an
dA
TG16
L1ca
rrie
do
ut
inp
ane
lsA
,B,a
nd
inth
eco
mb
ine
dp
ane
l(A
+B).
....
....
....
....
....
....
....
....
....
....
....
....
....
....
....
....
....
....
....
....
....
....
....
....
....
....
....
....
....
....
....
....
....
....
....
....
....
....
....
....
....
....
....
....
....
....
....
....
....
...
SN
PIn
form
ati
on
Scr
ee
nin
g(P
an
el
A)
Re
pli
cati
on
(Pa
ne
lB
)F
ull
(Pa
ne
lA
+B)
Locu
sS
NP
db
SN
PID
MA
Fc
oM
AF
ca
pC
CA
pC
CG
MA
Fc
oM
AF
ca
pC
CA
pC
CG
MA
Fc
oM
AF
ca
pC
CA
pC
CG
pT
DT
OR
(95
%C
I)
NO
D2
SNP
8/A
rg7
02
Trp
rs2
06
68
44
0.0
40
.11
3.5
7E-
06
5.0
7E-
05
0.0
50
.11
6.7
1E-
14
1.6
3E-
12
0.0
50
.11
1.2
9E-
18
9.2
5E-
17
3.2
8E-
07
2.4
8(1
.98
–3
.10
)
NO
D2
SNP
12
/Gly
90
8A
rgrs
20
66
84
50
.02
0.0
40
.00
83
0.0
07
40
.01
0.0
42
.05
E-0
81
.83
E-0
70
.01
0.0
47
.44
E-1
06
.08
E-0
90
.00
13
3.0
4(2
.09
–4
.42
)
NO
D2
SNP
13
/Le
u1
00
7fs
rs2
06
68
47
0.0
30
.16
9.7
5E-
17
4.6
8E-
13
0.0
40
.15
1.8
8E-
34
1.1
3E-
28
0.0
40
.15
2.5
1E-
49
6.5
2E-
41
3.3
1E-
22
4.3
0(3
.42
–5
.42
)
DLG
5D
LG5
_e
26
-0
.31
0.3
70
.01
80
.02
60
.35
0.3
60
.37
0.6
60
.34
0.3
60
.05
00
.12
0.0
12
1.1
7(1
.00
–1
.37
)
DLG
5A
rg3
0G
lnrs
12
48
69
60
.10
0.1
10
.59
0.8
50
.11
0.1
00
.51
0.8
00
.11
0.1
00
.77
0.9
40
.72
0.9
8(0
.81
–1
.18
)
DLG
5P
ro1
37
1G
lnrs
22
89
31
00
.04
0.0
40
.66
0.4
40
.03
0.0
40
.54
0.7
20
.04
0.0
40
.77
0.9
60
.34
1.0
4(0
.77
–1
.41
)
5q
31
IGR
20
63
_b
1-
0.3
90
.45
0.0
39
0.0
24
0.3
90
.48
4.9
2E-
09
1.0
5E-
08
0.3
90
.47
1.1
1E-
09
9.2
1E-
09
0.0
00
70
1.4
9(1
.27
–1
.76
)
IL2
3R
Arg
38
1G
lnrs
11
20
90
26
0.0
70
.03
0.0
02
70
.00
20
0.0
60
.03
2.0
1E-
05
9.3
7E-
05
0.0
60
.03
2.1
7E-
07
1.0
4E-
06
0.0
01
20
.49
(0.3
7–
0.6
5)
AT
G1
6L1
Th
r30
0A
lars
22
41
88
00
.47
0.4
10
.01
40
.04
30
.47
0.4
12
.01
E-0
59
.27
E-0
50
.47
0.4
18
.68
E-0
74
.02
E-0
61
.36
E-0
50
.68
(0.5
8–
0.8
1)
Th
eSN
Ps
we
reg
en
oty
pe
din
add
itio
nto
the
10
0k
set
tob
en
chm
ark
the
resu
lts
agai
nst
pre
vio
usl
yp
ub
lish
ed
fin
din
gs.
Th
eSN
Pco
vera
ge
of
NO
D2,
DLG
5,
IL23
R,
and
ATG
16L1
on
the
10
0k
arra
yw
assc
arse
wit
h2
,4
,4
,an
d0
SNP
slo
cate
din
the
seg
en
es,
resp
ect
ive
ly.
Th
ed
eta
iled
SNP
cove
rag
eo
nth
ear
ray
and
the
irre
lati
vep
osi
tio
nto
the
SNP
sre
typ
ed
he
reis
pre
sen
ted
insu
pp
lem
en
tary
Tab
le7
.Fo
ra
de
scri
pti
on
of
colu
mn
he
ade
rs,
see
Tab
le2
.d
oi:1
0.1
37
1/j
ou
rnal
.po
ne
.00
00
69
1.t
00
6
...........................................................
NELL1, a New IBD Gene
PLoS ONE | www.plosone.org 5 August 2007 | Issue 8 | e691
Interaction with Known Disease LociLogistic regression analysis and a Breslow-Day test for odds ratio
heterogeneity were used to analyse the full German case-control
panel (A+B) for potential epistatic effects. No statistically
significant interactions were observed, neither between poly-
morphisms within the NELL1 gene (rs1793004) or the 5p13.1
region (rs1992660 and rs1992662), nor between these loci and any
of the known disease-associated variants in IL23R (rs11209026/
Arg381Gln), NOD2 (rs2066844/Arg702Trp, rs2066845/
Gly908Arg, rs2066847/Leu1007fs), ATG16L1 (rs2241880/
T300A), DLG5 (rs1248696/Arg30Gln), or in the IBD5 region
(tagging SNP IGR2063_b1 [11,29]).
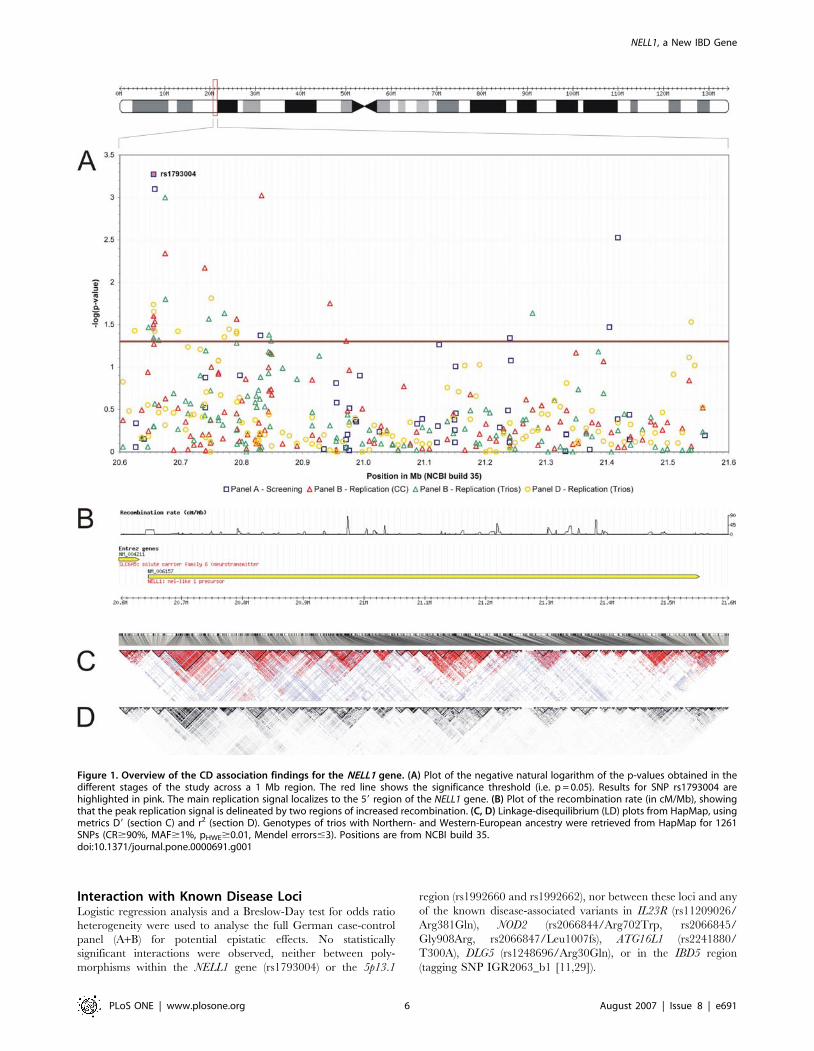
Figure 1. Overview of the CD association findings for the NELL1 gene. (A) Plot of the negative natural logarithm of the p-values obtained in thedifferent stages of the study across a 1 Mb region. The red line shows the significance threshold (i.e. p = 0.05). Results for SNP rs1793004 arehighlighted in pink. The main replication signal localizes to the 59 region of the NELL1 gene. (B) Plot of the recombination rate (in cM/Mb), showingthat the peak replication signal is delineated by two regions of increased recombination. (C, D) Linkage-disequilibrium (LD) plots from HapMap, usingmetrics D9 (section C) and r2 (section D). Genotypes of trios with Northern- and Western-European ancestry were retrieved from HapMap for 1261SNPs (CR$90%, MAF$1%, pHWE$0.01, Mendel errors#3). Positions are from NCBI build 35.doi:10.1371/journal.pone.0000691.g001
NELL1, a New IBD Gene
PLoS ONE | www.plosone.org 6 August 2007 | Issue 8 | e691

DISCUSSION
We have identified NELL1 as a novel disease gene for Crohn
disease (CD), a result that was obtained in a genome-wide case-
control association scan with 116,161 SNPs and by extensive
replication in three independent samples from three distinct
ethnicities. In a recently published GWAS from the UK
population [30,31] (1,748 CD patients and 2,938 controls
genotyped), the NELL1 region was covered with 263 SNPs (see
http://www.wtccc.org.uk/). Of these, 23 SNPs were significantly
associated with CD (p,0.05 under an additive or general model)
and six SNPs had a p,0.01: rs7122630, rs4475916, rs7115151,
rs11025862, rs2063913, rs11026037. The NELL1 region was not
subjected to replication in the UK scan, since none of the 23 SNPs
fell below the chosen cut-off (p,01025).
In addition to identifying NELL1 as a CD risk factor, we also
replicated the disease association recently described for the 5p13.1
region [18]. The genome-wide scan also confirmed two of the
previously known CD loci, NOD2 and 5q31, but it should be
pointed out that the marker set only covered 31% of the genome
[32,33]. As has been detailed in Table 4, the previously established
disease association of neither IL23R [17], nor DLG5 [12], nor
Figure 2. Expression and localization of NELL1. (A) Transcript levels of NELL1 in a set of different tissues were quantified by RT-PCR. Parallelamplification of b-actin (ACTB) is shown. Expression and localization of the NELL1 protein in healthy colonic tissue is demonstrated in sections B (206)and C (406; bar = 10 mm) by immunohistochemistry. Immunoreactivity is confined to mononuclear/lymphocytic cells in the lamina propria (brownDAB reaction product, arrows). A control without the primary antibody is shown in section D. No major expression differences between colonicspecimen from normal controls (N) and Crohn disease (CD) were detected in the Western blot (section E) with the same antibody as applied insections B and C. The single detected band (90 kDa) corresponds to the predicted molecular weight of the isoform encoded by GenBank AK127805(UniProt accession number Q92832).doi:10.1371/journal.pone.0000691.g002
NELL1, a New IBD Gene
PLoS ONE | www.plosone.org 7 August 2007 | Issue 8 | e691

ATG16L1 [15], were detected. However, not a single SNP, for
example, in the ATG16L1 gene was present on the Affymetrix
GeneChipH Human Mapping 100K Set (Table S8) and coverage
of all these genes was low. Targeted post-hoc genotyping of the
relevant SNPs in the German screening and replication panel was
therefore carried out and confirmed the CD associations of
ATG16L1, IL23R and DLG5 in our study sample (Table 4). We
replicated the association of a haplotype A-tagging SNP in DLG5
which is supported by several other replications of the association
between DLG5 and CD association [34–42]. Results for the two
nonsynonymous SNPs in DLG5 were not reaching significance.
However, as it has been speculated in our original description [12],
we do not consider these SNPs as causative at this point. They are
either part of a larger number of putatively causative SNPs not yet
discovered or mere additional markers for unknown causative
variants. We expect further relevant, hitherto unknown and rare
variants in DLG5 that may only be detectable by large-scale
sequencing of the gene [43]. It should also be noted that the DLG5
association has not been replicated in each and every population
analysed so far [44–46]. Recent studies have proposed gender-
and/or age at onset-related associations of DLG5 [13,34,40–42]
that would require exact matching of the study groups to become
detectable. Our sample used in this study contained mainly CD
patients with disease onset during early adulthood (average age at
onset.22 years). This may have contributed to a replication that
was weaker than the original description in statistical terms (for
review see [47]).
The targeted replication of the CD association of ATG16L1,
IL23R and DLG5 also serves to illustrate the highly conservative
criteria employed in our study, which may have resulted in an
under-appreciation of most initial association findings. Using these
criteria, ATG16L1/Thr300Ala and IL23R/Arg381Gln would not
have been included in the follow-up because the p-values of the
two variants (0.014 for Thr300Ala and 0.0027 for Arg381Gln)
both exceeded the cut-off of 0.0021 (attained by rs3790889 as
number 200 of the ranked SNP list). Therefore, future efforts to
replicate the major findings of our study should also include those
SNPs that yielded a significant p-value in only one of the
replication panels.
The neural epidermal growth-factor-like (nel) gene was first detected
in neural tissue from an embryonic chicken cDNA library, and its
human orthologue NELL1 was later discovered in B-cells [48–50].
The arrangement of the functional domains of the 810 aa protein
bears resemblance to thrombospondin-1 (TSP-1) and consists of
a thrombospondin N-terminal domain (TSPN) and several von
Willebrand factor, type C (VWC), and epidermal growth-factor
(EGF) domains [51]. As NELL1 binds to, and is phosphorylated
by, PKC-b1 via the EGF domains [52], it has been suggested that
this protein belongs to a novel class of cell-signalling ligand
molecules critical for growth and development. Re-sequencing and
fine mapping revealed several non-synonymous SNPs of which the
known Q82R variant and the novel R136S and A153T variants
affect the TSPN domain, while R354W is located in a VWC
domain (Figure 3) [51]. A153T is close to two highly conserved C-
terminal cysteines forming a disulfide bond in the TSPN domain
structure of TSP-1 [53] and may cause local conformational
changes due to its buried position in the molecule. Generally, the
TSPN domain has been shown to serve as a protein-protein
interaction module, which binds membrane proteins and proteo-
glycans and exhibits versatile cell-specific effects on adhesion,
migration, and proliferation [54,55]. Since VWC domains occur
in numerous proteins of diverse functions and are generally
assumed to be involved in protein oligomerization [56], R354W
may interfere with NELL1 trimerization [51].
Bone development is severely disturbed in transgenic mice,
where over-expression of NELL1 leads to craniosynostis [57] and
NELL1 deficiency manifests in skeletal defects due to reduced
chondro- and osteogenesis [58]. Interestingly, osteopenia and
osteoporosis are leading co-morbidities in IBD patients, even
without the use of glucocorticoids [59–61]. PTGER4, which has
been suggested as the causative gene in the 5p13.1 locus, is among
the key genes that are down-regulated in NELL1-deficient mice
[58]. However, no statistical interaction was seen in our study
between the NELL1 and 5p13.1 SNPs.
The replication criteria used in our study were particularly strict
and required a significant p-value in both, the family-based and
the case-control association test in two different populations. Other
studies used less stringent criteria for the replication of genome-
wide association findings, and based their conclusions upon a single
independent case control sample only [14,17]. With such criteria,
several additional SNPs would have been considered replicated in
our study, some of which point towards genes putatively involved
in the pathophysiology of IBD. Integrin beta 6 (ITGB6), for
example, regulates activation of TGF-b [62], a cytokine that has
been established as an anti-inflammatory regulator in TNF-related
CD pathopysiology [63,64]. Two hits point towards the glutamate
pathway, namely glutamate receptor type 8 (GRM8) and glutamate
receptor, ionotropic, N-methyl-D-aspartate 3A (GRIN3A, formerly
PPP3R2). Normal glutamate metabolism has been found to be
important for the maintenance of intestinal function. Finally, SNP
rs7868736 is located approximately 100 kb upstream of the
ZNF618 gene encoding a zinc finger protein clearly expressed in
human colon.
In summary, we have successfully performed a systematic
genome-wide association scan in Crohn disease that led to the
identification of the NELL1 gene on chromosome 11p15.1 as a novel
susceptibility gene for IBD. We confirmed 5p13.1 as a CD-associated
locus relating to PTGER4 that is probably regulated by NELL1.
METHODS
Patient RecruitmentGerman patients and controls in panels A, B, and C partially
overlap with samples that have been used in other studies before
[12,15,65,66]. Panels A and B almost completely overlap with the
panels (also termed panel A and B) that were used in a recently
published IBD association screen of non-synonymous SNPs [15].
In this non-synonymous SNP scan no coding SNPs that were
evaluable were located in NELL1. All patients were recruited at the
Charite University Hospital (Berlin, Germany) and the De-
partment of General Internal Medicine of the Christian-
Albrechts-University (Kiel, Germany), with the support of the
Figure 3. In silico protein analysis. Domain architectures of NELL1/NELL2 and TSP1. The positions of variant amino acids are annotated.Abbreviations are as follows: SP: signal peptide; TSPN: thrombospondinN-terminal domain; CC: coiled-coil region; VWC: von Willebrand factor,type C domain; EGF: EGF domain; TSP-3: thrombospondin-3 repeat;TSP_C: thrombospondin C-terminal domain.doi:10.1371/journal.pone.0000691.g003
NELL1, a New IBD Gene
PLoS ONE | www.plosone.org 8 August 2007 | Issue 8 | e691
German Crohn and Colitis Foundation (Table 1). Clinical,
radiological and endoscopic (i.e. type and distribution of lesions)
examinations were required to unequivocally confirm the di-
agnosis of Crohn disease or ulcerative colitis [67,68], and
histological findings also had to be confirmative of, or compatible
with, the diagnosis. In the case of uncertainty, patients were
excluded from the study. German control individuals were
obtained from the POPGEN biobank [25].
The UK patients (Panel E) were recruited as described before
[69]; UK controls were obtained from the 1958 British Birth
Cohort (http://www.b58cgene.sgul.ac.uk).
The French/Canadian trios (Panel D) were sampled from the
Quebec founder population (QFP). Membership of the founder
population was defined as having four grandparents with French
Canadian family names who were born in the Province of Quebec,
Canada, or in adjacent areas of the Provinces of New Brunswick
and Ontario, or in New England or New York State (USA).
Informed written consent was obtained from all study
participants. All collection protocols were approved by the
institutional review committees of the participating centres.
SNP Genotyping with the Affymetrix 100k Gene
Chip ArrayGenotyping of cases and controls was carried out using the
Affymetrix GeneChipH Human Mapping 50K Xba and Hind
Arrays (Affymetrix, Santa Clara, CA, USA). Genotypes were
called by the GeneChipH DNA Analysis Software (GDAS v2.0,
Affymetrix). Gender was verified by counting the heterozygous
SNPs on the X chromosome. Quality checks further comprised the
verification of individual sample call rates ($90%) and, to ensure
that no samples were confused, the 31 identical SNPs present on
both chips were checked for identical genotypes for the same
individual. SNPs that had a low genotyping success rate (,90%),
were monomorphic, or deviated from Hardy-Weinberg equilibri-
um (p#0.01) were eliminated from subsequent analyses. Exper-
imental details concerning the genotyping of the 100k SNP set are
provided in Matsuzaki et al. [22].
Follow-up Genotyping and SequencingSNPlexTM (Applied Biosystems, Foster City, CA, USA) genotyping
of panels A, B, and C was carried out as recently described [15].
Genotype concordance rates for SNPs rs1793004, rs1992660, and
rs1992662 were checked using TaqMan (Applied Biosystems) as
an independent genotyping technology on an automated platform
[70] and the functionally tested assays C____392093_10,
C__11472026_10, and C__11472042_10. All three concordance
rates were .98%, excluding genotyping errors as a potential
source of false-positive associations. The same three TaqMan
assays were also used to genotype panels C and E. Genotypes for
panel D were generated at Genizon BioSciences using the Illumina
GoldenGateTM platform (Illumina, San Diego, CA, USA). All
process data were logged into, and administered by, a database-
driven LIMS [71]. TaqMan genotyping of NOD2/Arg702Trp,
NOD2/Gly908Arg, NOD2/Leu1007fs, DLG5/Arg30Gln, DLG5/
Pro1371Gln, DLG5/e26, and ATG16L1/Thr300Ala was per-
formed using previously described assays [12,15,72]. IL23R/
Arg381Gln, NELL1/rs8176785, and NELL1/rs8176786 were
genotyped in panels A, B, C, and E using the functionally tested
assay C___1272298_10, C___3203197_10, and C__
32647553_10, respectively (Applied Biosystems). Prior to statistical
analyses, the same cut-off criteria as described above for the 100k
analysis (pHWE.0.01, MAFcontrols.0, callrate$90%) were applied
to the SNPs under study.
Sequencing of genomic DNA was performed using Applied
Biosystems BigDyeTM chemistry according to the supplier’s
recommendations (for primer sequences, see supplementary Table
S1). Traces were inspected for the presence of SNPs and InDels
using novoSNP [73].
Statistical AnalysisGenome-wide data analysis was carried out using an updated
version of GENOMIZER [74]. Association hits that passed the
quality criteria were extracted using the ‘‘GenomizerHits’’ tool
(http://www.ikmb.uni-kiel.de/genomizer/). Haploview 4.0 [75]
was used for association analysis, transmission disequilibrium tests,
and LD quantification of the replication data. Fisher’s exact test
was used when appropriate. The supplementary p-value plots
(Figure S7) and quantile-quantile plots (Figure S3) were created
using R (http://www.r-project.org/). Single-marker disease asso-
ciations and possible marker-marker interactions were assessed for
statistical significance by means of logistic regression analysis
(forward selection), as implemented in the procedure LOGISTIC
of the SAS software package (SAS Institute, Cary NC, USA).
Haplotype analyses were carried out using COCAPHASE 2.403
[76] and PHASE 2.1 [77,78].
RT-PCR, Western Blot and ImmunohistochemistryFor the assessment of tissue-specific expression patterns, a com-
mercial tissue panel was employed (Clontech, Palo Alto, CA,
USA). Primers used for amplification of NELL1 were (NELL1_14-
16_F ACCTTCCTGGGTTATATCGCTGTG and NELL1_14-
16_R TCTCGCAGTGGCTTCCTGTG, expected amplicon
length: 285 bp). The following conditions were applied: de-
naturation for 5 min at 95uC; 40 cycles of 30 sec at 95uC, 20 sec
at 60uC, 45 sec at 72uC; final extension for 10 min at 72uC. To
confirm the use of equal amounts of RNA in each experiment, all
samples were checked in parallel for b-actin mRNA expression.
All amplified DNA fragments were analyzed on 2% agarose gels
and subsequently documented by a BioDoc Analyzer (Biometra,
Gottingen, Germany).
Paraformaldehyde-fixed paraffin-embedded biopsies from nor-
mal controls (n = 6) and from patients with confirmed colonic CD
(n = 6) were analysed. Two slides of each biopsy were stained with
hematoxylin-eosin for routine histological evaluation. The other
slides were subjected to a citrate-based antigen retrieval procedure,
permeabilized by incubation with 0.1% Triton X-100 in 0.1M
phosphate-buffered saline (PBS), washed three times in PBS and
blocked with 0.75% bovine serum albumin in PBS for 20 minutes.
Sections were subsequently incubated with the primary antibody
(anti-NELL1, Abnova , mouse monoclonal) at a 1:500 dilution in
0.75% BSA overnight at 4uC. After washing in PBS, tissue-bound
antibody was detected using biotinylated goat-anti mouse (Vector
Laboratory, Burlingame, CA) followed by HRP-conjugated
avidin, both diluted at 1:100 in PBS. Controls were included
using irrelevant primary antibodies as well as omitting the primary
antibodies using only secondary antibodies and/or HRP-conju-
gated avidin. No significant staining was observed with any of
these controls (data not shown). Bound antibody was detected by
standard chromogen technique (Vector Laboratory) and visualized
by an Axiophot microscope (Zeiss, Jena, Germany). Pictures were
captured by a digital camera system (Axiocam, Zeiss).
Western blot analysis was performed as described [79]. In brief,
20 mg of protein lysates freshly derived from colonic biopsies of
four healthy controls without any obvious intestinal pathology and
four CD patients with confirmed ileal and colonic inflammation
were lysed, separated by SDS polyacrylamide gel electrophoresis
NELL1, a New IBD Gene
PLoS ONE | www.plosone.org 9 August 2007 | Issue 8 | e691

and transferred to PVDF membrane by standard techniques.
NELL1 was detected using the same monoclonal anti-NELL1
antibody also employed for immunohistochemistry.
In silico Protein AnalysisAligned sequences (Figures S4A and S4B) were retrieved from the
UniProt database (http://www.uniprot.org) and protein domain
architectures taken from the NCBI conserved domain search
website (http://www.ncbi.nlm.nih.gov:80/Structure/cdd/wrpsb.
cgi). To predict the 3D structure of the N-terminal domain of
NELL1, we explored the fold recognition results returned by the
web servers GenTHREADER (http://bioinf.cs.ucl.ac.uk/
psipred/) and FFAS03 (http://ffas.ljcrf.edu). Based upon the very
similar server predictions, a pair-wise sequence-structure align-
ment of NELL1 to the crystal structure of the human
thrombospondin-1 N-terminal domain (TSPN) was constructed
as input for the 3D-modeling server WHATIF (http://swift.cmbi.
kun.nl/WIWWWI/), which returned a structure model of the
NELL1 N-terminal domain (Figure 4). Additional details are given
in the supplements (Text S1).
SUPPORTING INFORMATION
Text S1 Supplementary methods, results, and discussion -
Protein in silico analysis.
Found at: doi:10.1371/journal.pone.0000691.s001 (0.58 MB
PDF)
Figure S1 Workflow diagram summarizing the different stages
of the experiment.
Found at: doi:10.1371/journal.pone.0000691.s002 (0.22 MB
PDF)
Figure S2 Power calculation for the present genome-wide
association scan of 393 cases and 399 controls (a = 0.05). Five
different allele frequencies in controls (p0) are shown: 50%, 30%,
20%, 10%, and 5%. The scan had e.g. 80% power to detect an
Odds ratio of 1.6 assuming that 20% of the controls are exposed.
Calculations were done using the software PS Power and Sample
Size Calculations.
Found at: doi:10.1371/journal.pone.0000691.s003 (0.15 MB
PDF)
Figure S3 Quantile-quantile plots (A) before and (B) after
exclusion of lowquality SNPs (callrate,90%, pHWE,0.01,
MAF.0.99). The ranked, observed Chi2-values of the allelic test
are plotted against the values expected for sampling from a Chi2
distribution with one degree of freedom (the distribution expected
under the null hypothesis). The inflation of the Chi2 distribution is
significantly reduced by removing low-quality SNPs and there is no
visible indication of population structure. The outlier in the upper
right corner of the diagram B represents genuine association of SNP
rs2076756 in the NOD2 gene with CD (see Table S2, Lead #1).
Found at: doi:10.1371/journal.pone.0000691.s004 (0.22 MB
PDF)
Figure S4 (A) Structure-based multiple sequence alignment of
the N-terminal domains of NELL1 and NELL2 homologs and the
N-terminal domain of human thrombospondin-1 (TSP-1). The
DSSP secondary structure assignment of the TSPN structure (PDB
code 1z78, chain A) is depicted at the top of the alignment. (B)
Multiple sequence alignment of NELL1 and NELL2 homologs.
Domain locations are represented as colored bars at the top of the
alignment (green: VWC domain; pink: EGF-like domain).
Alignment columns with more than 70% physicochemically
similar amino acids are highlighted in blue boxes with white
letters. Text labels point to the N-terminal signal peptide and the
sequence variants, which are marked yellow in all homologs.
Residue numbering in the alignment is based on complete protein
sequences as derived from corresponding UniProt entries.
Found at: doi:10.1371/journal.pone.0000691.s005 (0.41 MB
PDF)
Figure S5 Overview of the results for the 5p13.1 locus. (A) Plot
of the negative common logarithm of the p-values of the different
tiers across the 650 kb region. The red line shows the significance
threshold of p = 0.05. Results of the two lead SNPs rs1992662 and
rs1992660 are highlighted in pink color. The broad replicated
peak between 40.29 Mb and 40.66 Mb localizes to a gene desert
upstream of PTGER4. (B) Recombination rate in cM/Mb shows
that the peak region is delineated by two sites of increased
recombination. (C) Linkage-disequilibrium (LD) plot from Hap-
Map, using the metrics D9 and (D) r2. Genotypes of trios with
northern and western European ancestry for 633 SNPs
(CR. = 90%, MAF. = 1%, pHWE. = 0.01, Mendel er-
rors. = 3) were retrieved from HapMap. Positions are from
NCBI build 35.
Found at: doi:10.1371/journal.pone.0000691.s006 (1.36 MB
PDF)
Figure S6 Secondary structure prediction for human NELL1
(UniProt accession number Q92832). The PSIPRED web server
produced the depicted prediction.
Found at: doi:10.1371/journal.pone.0000691.s007 (0.13 MB
PDF)
Figure S7 The diagrams on the first page show the results of the
whole genome association scan for Crohn disease and subsequent
pages show the enlarged diagrams for each chromosome. The
negative common logarithm of the p-values for the allelic test are
shown. Only markers that passed the quality criteria listed in
Table S1 were used for plotting (n = 92,387). ‘‘Outlier’’ SNP
Figure 4. In silico protein analysis. Computationally derived 3Dstructure model of the N-terminal domain of the NELL1 protein. Themodel was created using the TSPN (PDB code 1z78, chain A) asa structure template for NELL1. The locations of variant amino acids aswell as of two cysteines forming a disulfide bridge are annotated.doi:10.1371/journal.pone.0000691.g004
NELL1, a New IBD Gene
PLoS ONE | www.plosone.org 10 August 2007 | Issue 8 | e691
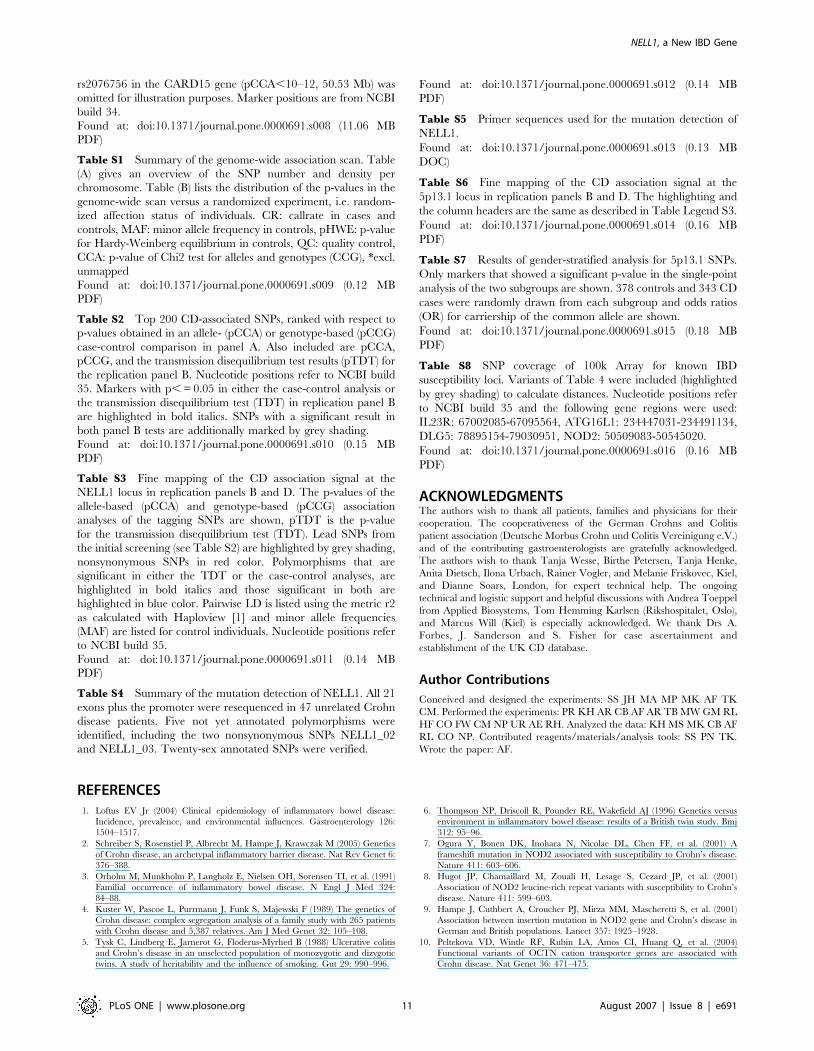
rs2076756 in the CARD15 gene (pCCA,10–12, 50.53 Mb) was
omitted for illustration purposes. Marker positions are from NCBI
build 34.
Found at: doi:10.1371/journal.pone.0000691.s008 (11.06 MB
PDF)
Table S1 Summary of the genome-wide association scan. Table
(A) gives an overview of the SNP number and density per
chromosome. Table (B) lists the distribution of the p-values in the
genome-wide scan versus a randomized experiment, i.e. random-
ized affection status of individuals. CR: callrate in cases and
controls, MAF: minor allele frequency in controls, pHWE: p-value
for Hardy-Weinberg equilibrium in controls, QC: quality control,
CCA: p-value of Chi2 test for alleles and genotypes (CCG), *excl.
unmapped
Found at: doi:10.1371/journal.pone.0000691.s009 (0.12 MB
PDF)
Table S2 Top 200 CD-associated SNPs, ranked with respect to
p-values obtained in an allele- (pCCA) or genotype-based (pCCG)
case-control comparison in panel A. Also included are pCCA,
pCCG, and the transmission disequilibrium test results (pTDT) for
the replication panel B. Nucleotide positions refer to NCBI build
35. Markers with p, = 0.05 in either the case-control analysis or
the transmission disequilibrium test (TDT) in replication panel B
are highlighted in bold italics. SNPs with a significant result in
both panel B tests are additionally marked by grey shading.
Found at: doi:10.1371/journal.pone.0000691.s010 (0.15 MB
PDF)
Table S3 Fine mapping of the CD association signal at the
NELL1 locus in replication panels B and D. The p-values of the
allele-based (pCCA) and genotype-based (pCCG) association
analyses of the tagging SNPs are shown, pTDT is the p-value
for the transmission disequilibrium test (TDT). Lead SNPs from
the initial screening (see Table S2) are highlighted by grey shading,
nonsynonymous SNPs in red color. Polymorphisms that are
significant in either the TDT or the case-control analyses, are
highlighted in bold italics and those significant in both are
highlighted in blue color. Pairwise LD is listed using the metric r2
as calculated with Haploview [1] and minor allele frequencies
(MAF) are listed for control individuals. Nucleotide positions refer
to NCBI build 35.
Found at: doi:10.1371/journal.pone.0000691.s011 (0.14 MB
PDF)
Table S4 Summary of the mutation detection of NELL1. All 21
exons plus the promoter were resequenced in 47 unrelated Crohn
disease patients. Five not yet annotated polymorphisms were
identified, including the two nonsynonymous SNPs NELL1_02
and NELL1_03. Twenty-sex annotated SNPs were verified.
Found at: doi:10.1371/journal.pone.0000691.s012 (0.14 MB
PDF)
Table S5 Primer sequences used for the mutation detection of
NELL1.
Found at: doi:10.1371/journal.pone.0000691.s013 (0.13 MB
DOC)
Table S6 Fine mapping of the CD association signal at the
5p13.1 locus in replication panels B and D. The highlighting and
the column headers are the same as described in Table Legend S3.
Found at: doi:10.1371/journal.pone.0000691.s014 (0.16 MB
PDF)
Table S7 Results of gender-stratified analysis for 5p13.1 SNPs.
Only markers that showed a significant p-value in the single-point
analysis of the two subgroups are shown. 378 controls and 343 CD
cases were randomly drawn from each subgroup and odds ratios
(OR) for carriership of the common allele are shown.
Found at: doi:10.1371/journal.pone.0000691.s015 (0.18 MB
PDF)
Table S8 SNP coverage of 100k Array for known IBD
susceptibility loci. Variants of Table 4 were included (highlighted
by grey shading) to calculate distances. Nucleotide positions refer
to NCBI build 35 and the following gene regions were used:
IL23R: 67002085-67095564, ATG16L1: 234447031-234491134,
DLG5: 78895154-79030951, NOD2: 50509083-50545020.
Found at: doi:10.1371/journal.pone.0000691.s016 (0.16 MB
PDF)
ACKNOWLEDGMENTSThe authors wish to thank all patients, families and physicians for their
cooperation. The cooperativeness of the German Crohns and Colitis
patient association (Deutsche Morbus Crohn und Colitis Vereinigung e.V.)
and of the contributing gastroenterologists are gratefully acknowledged.
The authors wish to thank Tanja Wesse, Birthe Petersen, Tanja Henke,
Anita Dietsch, Ilona Urbach, Rainer Vogler, and Melanie Friskovec, Kiel,
and Dianne Soars, London, for expert technical help. The ongoing
technical and logistic support and helpful discussions with Andrea Toeppel
from Applied Biosystems, Tom Hemming Karlsen (Rikshospitalet, Oslo),
and Marcus Will (Kiel) is especially acknowledged. We thank Drs A.
Forbes, J. Sanderson and S. Fisher for case ascertainment and
establishment of the UK CD database.
Author Contributions
Conceived and designed the experiments: SS JH MA MP MK AF TK
CM. Performed the experiments: PR KH AR CB AF AR TB MW GM RL
HF CO FW CM NP UR AE RH. Analyzed the data: KH MS MK CB AF
RL CO NP. Contributed reagents/materials/analysis tools: SS PN TK.
Wrote the paper: AF.
REFERENCES1. Loftus EV Jr (2004) Clinical epidemiology of inflammatory bowel disease:
Incidence, prevalence, and environmental influences. Gastroenterology 126:
1504–1517.
2. Schreiber S, Rosenstiel P, Albrecht M, Hampe J, Krawczak M (2005) Genetics
of Crohn disease, an archetypal inflammatory barrier disease. Nat Rev Genet 6:
376–388.
3. Orholm M, Munkholm P, Langholz E, Nielsen OH, Sorensen TI, et al. (1991)
Familial occurrence of inflammatory bowel disease. N Engl J Med 324:
84–88.
4. Kuster W, Pascoe L, Purrmann J, Funk S, Majewski F (1989) The genetics of
Crohn disease: complex segregation analysis of a family study with 265 patients
with Crohn disease and 5,387 relatives. Am J Med Genet 32: 105–108.
5. Tysk C, Lindberg E, Jarnerot G, Floderus-Myrhed B (1988) Ulcerative colitis
and Crohn’s disease in an unselected population of monozygotic and dizygotic
twins. A study of heritability and the influence of smoking. Gut 29: 990–996.
6. Thompson NP, Driscoll R, Pounder RE, Wakefield AJ (1996) Genetics versus
environment in inflammatory bowel disease: results of a British twin study. Bmj
312: 95–96.
7. Ogura Y, Bonen DK, Inohara N, Nicolae DL, Chen FF, et al. (2001) A
frameshift mutation in NOD2 associated with susceptibility to Crohn’s disease.
Nature 411: 603–606.
8. Hugot JP, Chamaillard M, Zouali H, Lesage S, Cezard JP, et al. (2001)
Association of NOD2 leucine-rich repeat variants with susceptibility to Crohn’s
disease. Nature 411: 599–603.
9. Hampe J, Cuthbert A, Croucher PJ, Mirza MM, Mascheretti S, et al. (2001)
Association between insertion mutation in NOD2 gene and Crohn’s disease in
German and British populations. Lancet 357: 1925–1928.
10. Peltekova VD, Wintle RF, Rubin LA, Amos CI, Huang Q, et al. (2004)
Functional variants of OCTN cation transporter genes are associated with
Crohn disease. Nat Genet 36: 471–475.
NELL1, a New IBD Gene
PLoS ONE | www.plosone.org 11 August 2007 | Issue 8 | e691
11. Rioux JD, Daly MJ, Silverberg MS, Lindblad K, Steinhart H, et al. (2001)
Genetic variation in the 5q31 cytokine gene cluster confers susceptibility to
Crohn disease. Nat Genet 29: 223–228.
12. Stoll M, Corneliussen B, Costello CM, Waetzig GH, Mellgard B, et al. (2004)
Genetic variation in DLG5 is associated with inflammatory bowel disease. Nat
Genet 36: 476–480.
13. Biank V, Friedrichs F, Babusukumar U, Wang T, Stoll M, et al. (2007) DLG5
R30Q variant is a female-specific protective factor in pediatric onset Crohn’s
disease. Am J Gastroenterol 102: 391–398.
14. Yamazaki K, McGovern D, Ragoussis J, Paolucci M, Butler H, et al. (2005)
Single nucleotide polymorphisms in TNFSF15 confer susceptibility to Crohn’s
disease. Hum Mol Genet 14: 3499–3506.
15. Hampe J, Franke A, Rosenstiel P, Till A, Teuber M, et al. (2007) A genome-wide
association scan of nonsynonymous SNPs identifies a susceptibility variant for
Crohn disease in ATG16L1. Nat Genet 39: 207–211.
16. McGovern DP, Hysi P, Ahmad T, van Heel DA, Moffatt MF, et al. (2005)
Association between a complex insertion/deletion polymorphism in NOD1
(CARD4) and susceptibility to inflammatory bowel disease. Hum Mol Genet 14:
1245–1250.
17. Duerr RH, Taylor KD, Brant SR, Rioux JD, Silverberg MS, et al. (2006) A
genome-wide association study identifies IL23R as an inflammatory bowel
disease gene. Science 314: 1461–1463.
18. Libioulle C, Louis E, Hansoul S, Sandor C, Farnir F, et al. (2007) Novel Crohn
Disease Locus Identified by Genome-Wide Association Maps to a Gene Desert
on 5p13.1 and Modulates Expression of PTGER4. PLoS Genet 3: e58.
19. Cummings JR, Cooney R, Pathan S, Anderson CA, Barrett JC, et al. (2007)
Confirmation of the role of ATG16l1 as a Crohn’s disease susceptibility gene.
Inflamm Bowel Dis..
20. Rioux JD, Xavier RJ, Taylor KD, Silverberg MS, Goyette P, et al. (2007)
Genome-wide association study identifies new susceptibility loci for Crohn
disease and implicates autophagy in disease pathogenesis. Nat Genet 39:
596–604.
21. Prescott NJ, Fisher SA, Franke A, Hampe J, Onnie CM, et al. (2007) A
Nonsynonymous SNP in ATG16L1 Predisposes to Ileal Crohn’s Disease and Is
Independent of CARD15 and IBD5. Gastroenterology 132: 1665–1671.
22. Matsuzaki H, Dong S, Loi H, Di X, Liu G, et al. (2004) Genotyping over
100,000 SNPs on a pair of oligonucleotide arrays. Nat Methods 1: 109–111.
23. Fingerlin TE, Boehnke M, Abecasis GR (2004) Increasing the power and
efficiency of disease-marker case-control association studies through use of allele-
sharing information. Am J Hum Genet 74: 432–443.
24. Steffens M, Lamina C, Illig T, Bettecken T, Vogler R, et al. (2006) SNP-based
analysis of genetic substructure in the German population. Hum Hered 62:
20–29.
25. Krawczak M, Nikolaus S, von Eberstein H, Croucher PJ, El Mokhtari NE, et al.
(2006) PopGen: population-based recruitment of patients and controls for the
analysis of complex genotype-phenotype relationships. Community Genet 9:
55–61.
26. Clayton DG, Walker NM, Smyth DJ, Pask R, Cooper JD, et al. (2005)
Population structure, differential bias and genomic control in a large-scale, case-
control association study. Nat Genet 37: 1243–1246.
27. Spielman RS, McGinnis RE, Ewens WJ (1993) Transmission test for linkage
disequilibrium: the insulin gene region and insulin-dependent diabetes mellitus
(IDDM). Am J Hum Genet 52: 506–516.
28. McIntyre LM, Martin ER, Simonsen KL, Kaplan NL (2000) Circumventing
multiple testing: a multilocus Monte Carlo approach to testing for association.
Genet Epidemiol 19: 18–29.
29. Fisher SA, Hampe J, Onnie CM, Daly MJ, Curley C, et al. (2006) Direct or
indirect association in a complex disease: the role of SLC22A4 and SLC22A5
functional variants in Crohn disease. Hum Mutat 27: 778–785.
30. Parkes M, Barrett JC, Prescott NJ, Tremelling M, Anderson CA, et al. (2007)
Sequence variants in the autophagy gene IRGM and multiple other replicating
loci contribute to Crohn’s disease susceptibility. Nat Genet.
31. Genome-wide association study of 14,000 cases of seven common diseases and
3,000 shared controls. Nature 447: 661–678.
32. Nicolae DL, Wen X, Voight BF, Cox NJ (2006) Coverage and characteristics of
the Affymetrix GeneChip Human Mapping 100K SNP set. PLoS Genet 2: e67.
33. Barrett JC, Cardon LR (2006) Evaluating coverage of genome-wide association
studies. Nat Genet 38: 659–662.
34. Lin Z, Poritz LS, Li T, Byrnes KA, Wang Y, et al. (2007) Gender related
association of DLG5 variant R30Q with inflammatory bowel disease (IBD) in
a familial IBD registry. Gastroenterology 132: A450 (abstract).
35. Daly MJ, Pearce AV, Farwell L, Fisher SA, Latiano A, et al. (2005) Association
of DLG5 R30Q variant with inflammatory bowel disease. Eur J Hum Genet 13:
835–839.
36. Newman WG, Gu X, Wintle RF, Liu X, van Oene M, et al. (2006) DLG5
variants contribute to Crohn disease risk in a Canadian population. Hum Mutat
27: 353–358.
37. Yamazaki K, Takazoe M, Tanaka T, Ichimori T, Saito S, et al. (2004)
Association analysis of SLC22A4, SLC22A5 and DLG5 in Japanese patients
with Crohn disease. J Hum Genet 49: 664–668.
38. Lin Z, Poritz LS, Li T, Byrnes KA, Wang Y, et al. (2007) Genetic variants of
DLG5 gene, E514Q, P979L, G1066G, and P1371Q in a familial inflammatory
bowel disease (IBD) registry. Gastroenterology 132: A451 (abstract).
39. Weersma RK, Stokkers PC, van Bodegraven AA, van Hogezand RA,
Verspaget HW, et al. (2007) A large, nationwide, case-control study for the
association of DLG5, OCTN1/2 and CARD15 with Inflammatory Bowel
Diseases in the Netherlands. Gastroenterology 132: A445 (abstract).
40. Russell RK, Drummond HE, Nimmo ER, Anderson N, Wilson DC, et al. (2007)
The contribution of the DLG5 113A variant in early-onset inflammatory bowel
disease. J Pediatr 150: 268–273.
41. de Ridder L, Weersma RK, Dijkstra G, van der Steege G, Benninga MA, et al.
(2007) Genetic susceptibility has a more important role in pediatric-onset
Crohn’s disease than in adult-onset Crohn’s disease. Inflamm Bowel Dis advance
online publication, DOI: 10.1002/ibd.20171.
42. Friedrichs F, Brescianini S, Annese V, Latiano A, Berger K, et al. (2006)
Evidence of transmission ratio distortion of DLG5 R30Q variant in general and
implication of an association with Crohn disease in men. Hum Genet 119:
305–311.
43. Romeo S, Pennacchio LA, Fu Y, Boerwinkle E, Tybjaerg-Hansen A, et al.
(2007) Population-based resequencing of ANGPTL4 uncovers variations that
reduce triglycerides and increase HDL. Nat Genet 39: 513–516.
44. Noble CL, Nimmo ER, Drummond H, Smith L, Arnott ID, et al. (2005) DLG5
variants do not influence susceptibility to inflammatory bowel disease in the
Scottish population. Gut 54: 1416–1420.
45. Vermeire S, Pierik M, Hlavaty T, Claessens G, van Schuerbeeck N, et al. (2005)
Association of organic cation transporter risk haplotype with perianal
penetrating Crohn’s disease but not with susceptibility to IBD. Gastroenterology
129: 1845–1853.
46. Torok HP, Glas J, Tonenchi L, Lohse P, Muller-Myhsok B, et al. (2005)
Polymorphisms in the DLG5 and OCTN cation transporter genes in Crohn’s
disease. Gut 54: 1421–1427.
47. Friedrichs F, Stoll M (2006) Role of discs large homolog 5. World J Gastroenterol
12: 3651–3656.
48. Matsuhashi S, Noji S, Koyama E, Myokai F, Ohuchi H, et al. (1996) New gene,
nel, encoding a Mr 91 K protein with EGF-like repeats is strongly expressed in
neural tissues of early stage chick embryos. Dev Dyn 207: 233–234.
49. Matsuhashi S, Noji S, Koyama E, Myokai F, Ohuchi H, et al. (1995) New gene,
nel, encoding a M(r) 93 K protein with EGF-like repeats is strongly expressed in
neural tissues of early stage chick embryos. Dev Dyn 203: 212–222.
50. Luce MJ, Burrows PD (1999) The neuronal EGF-related genes NELL1 and
NELL2 are expressed in hemopoietic cells and developmentally regulated in the
B lineage. Gene 231: 121–126.
51. Kuroda S, Oyasu M, Kawakami M, Kanayama N, Tanizawa K, et al. (1999)
Biochemical characterization and expression analysis of neural thrombospondin-
1-like proteins NELL1 and NELL2. Biochem Biophys Res Commun 265:
79–86.
52. Kuroda S, Tanizawa K (1999) Involvement of epidermal growth factor-like
domain of NELL proteins in the novel protein-protein interaction with protein
kinase C. Biochem Biophys Res Commun 265: 752–757.
53. Tan K, Duquette M, Liu JH, Zhang R, Joachimiak A, et al. (2006) The
structures of the thrombospondin-1 N-terminal domain and its complex with
a synthetic pentameric heparin. Structure 14: 33–42.
54. Bornstein P (1995) Diversity of function is inherent in matricellular proteins: an
appraisal of thrombospondin 1. J Cell Biol 130: 503–506.
55. Chen H, Herndon ME, Lawler J (2000) The cell biology of thrombospondin-1.
Matrix Biol 19: 597–614.
56. Voorberg J, Fontijn R, Calafat J, Janssen H, van Mourik JA, et al. (1991)
Assembly and routing of von Willebrand factor variants: the requirements for
disulfide-linked dimerization reside within the carboxy-terminal 151 amino
acids. J Cell Biol 113: 195–205.
57. Zhang X, Kuroda S, Carpenter D, Nishimura I, Soo C, et al. (2002)
Craniosynostosis in transgenic mice overexpressing Nell-1. J Clin Invest 110:
861–870.
58. Desai J, Shannon ME, Johnson MD, Ruff DW, Hughes LA, et al. (2006) Nell1-
deficient mice have reduced expression of extracellular matrix proteins causing
cranial and vertebral defects. Hum Mol Genet 15: 1329–1341.
59. Abitbol V, Roux C, Chaussade S, Guillemant S, Kolta S, et al. (1995) Metabolic
bone assessment in patients with inflammatory bowel disease. Gastroenterology
108: 417–422.
60. Roux C, Abitbol V, Chaussade S, Kolta S, Guillemant S, et al. (1995) Bone loss
in patients with inflammatory bowel disease: a prospective study. Osteoporos Int
5: 156–160.
61. Compston JE, Judd D, Crawley EO, Evans WD, Evans C, et al. (1987)
Osteoporosis in patients with inflammatory bowel disease. Gut 28: 410–415.
62. Jenkins RG, Su X, Su G, Scotton CJ, Camerer E, et al. (2006) Ligation of
protease-activated receptor 1 enhances alpha(v)beta6 integrin-dependent TGF-
beta activation and promotes acute lung injury. J Clin Invest 116: 1606–1614.
63. Monteleone G, Del Vecchio Blanco G, Monteleone I, Fina D, Caruso R, et al.
(2005) Post-transcriptional regulation of Smad7 in the gut of patients with
inflammatory bowel disease. Gastroenterology 129: 1420–1429.
64. Waetzig GH, Rosenstiel P, Arlt A, Till A, Brautigam K, et al. (2005) Soluble
tumor necrosis factor (TNF) receptor-1 induces apoptosis via reverse TNF
signaling and autocrine transforming growth factor-beta1. Faseb J 19: 91–93.
65. Croucher PJ, Mascheretti S, Hampe J, Huse K, Frenzel H, et al. (2003)
Haplotype structure and association to Crohn’s disease of CARD15 mutations in
two ethnically divergent populations. Eur J Hum Genet 11: 6–16.
NELL1, a New IBD Gene
PLoS ONE | www.plosone.org 12 August 2007 | Issue 8 | e691

66. Hampe J, Schreiber S, Shaw SH, Lau KF, Bridger S, et al. (1999) A
genomewide analysis provides evidence for novel linkages in inflammatory boweldisease in a large European cohort. Am J Hum Genet 64: 808–816.
67. Lennard-Jones JE (1989) Classification of inflammatory bowel disease.
Scand J Gastroenterol Suppl 170: 2–6; discussion 16–19.68. Truelove SC, Pena AS (1976) Course and prognosis of Crohn’s disease. Gut 17:
192–201.69. Onnie CM, Fisher SA, Pattni R, Sanderson J, Forbes A, et al. (2006)
Associations of allelic variants of the multidrug resistance gene (ABCB1 or
MDR1) and inflammatory bowel disease and their effects on disease behavior:a case-control and meta-analysis study. Inflamm Bowel Dis 12: 263–271.
70. Hampe J, Wollstein A, Lu T, Frevel HJ, Will M, et al. (2001) An integratedsystem for high throughput TaqMan based SNP genotyping. Bioinformatics 17:
654–655.71. Teuber M, Koch W, Manaster C, Waechter S, Hampe J, et al. (2005) Improving
quality control and workflow management in high-throughput single-nucleotide
polymorphism genotyping environments. Journal of the Association forLaboratory Automation 10: 43–47.
72. Hampe J, Grebe J, Nikolaus S, Solberg C, Croucher PJ, et al. (2002) Associationof NOD2 (CARD 15) genotype with clinical course of Crohn’s disease: a cohort
study. Lancet 359: 1661–1665.
73. Weckx S, Del-Favero J, Rademakers R, Claes L, Cruts M, et al. (2005)
novoSNP, a novel computational tool for sequence variation discovery. Genome
Res 15: 436–442.
74. Franke A, Wollstein A, Teuber M, Wittig M, Lu T, et al. (2006) GENOMIZER:
an integrated analysis system for genome-wide association data. Hum Mutat 27:
583–588.
75. Barrett JC, Fry B, Maller J, Daly MJ (2005) Haploview: analysis and
visualization of LD and haplotype maps. Bioinformatics 21: 263–265.
76. Dudbridge F (2003) Pedigree disequilibrium tests for multilocus haplotypes.
Genet Epidemiol 25: 115–121.
77. Stephens JC, Schneider JA, Tanguay DA, Choi J, Acharya T, et al. (2001)
Haplotype variation and linkage disequilibrium in 313 human genes. Science
293: 489–493.
78. Stephens M, Donnelly P (2003) A comparison of bayesian methods for haplotype
reconstruction from population genotype data. Am J Hum Genet 73:
1162–1169.
79. Waetzig GH, Seegert D, Rosenstiel P, Nikolaus S, Schreiber S (2002) p38
mitogen-activated protein kinase is activated and linked to TNF-alpha signaling
in inflammatory bowel disease. J Immunol 168: 5342–5351.
NELL1, a New IBD Gene
PLoS ONE | www.plosone.org 13 August 2007 | Issue 8 | e691