Synthesis, Physicochemical and Electrochemical Properties of Nickel Ferrite Spinels Obtained by...
15
Int. J. Electrochem. Sci., 7 (2012) 4959 - 4973 International Journal of ELECTROCHEMICAL SCIENCE www.electrochemsci.org Synthesis, Physicochemical and Electrochemical Properties of Nickel Ferrite Spinels Obtained by Hydrothermal Method for the Oxygen Evolution Reaction (OER) M. S. Al-Hoshan 1,3 , J. P. Singh 2,* , A. M. Al-Mayouf 2,3,* , A. A. Al-Suhybani 2 , M. N. Shaddad 2 1 Chemical Engineering Department, College of Engineering, King Saud University, Riyadh 11421, Saudi Arabia. 2 Department of Chemistry, College of Science, King Saud University, Riyadh 11451, Saudi Arabia. 3 The Hydrogen Energy Research Group, Sustainable Energy Technologies (SET), King Saud University, Riyadh, Saudi Arabia. * E-mail: [email protected] , [email protected] Received: 14 April 2012 / Accepted: 19 May 2012 / Published: 1 June 2012 The electrocatalysis of oxygen evolution reaction (OER) has been studied at the face centered cubic (FCC) Ni x Fe 3-x O 4 (0 ≤ x ≤ 1.0) anodes in 1M KOH solutions at 25 0 C. These oxides were synthesized by the hydrothermal method and reproduced in the form of film on a nickel support by an oxide-slurry painting technique. The effect of Ni substitution in the base oxide (Fe 3 O 4 ) was investigated with regards to morphology, structure and catalytic performance by using techniques, such as, scanning electron microscopy (SEM), infrared (IR), X-ray diffraction (XRD), cyclic voltammetry (CV), Tafel polarization, and electrochemical impedance spectroscopy (EIS). Among synthesized oxides, the NiFe2O4 electrode was found to be the most active anode for oxygen evolution (OE). Tafel slope values (b = 41±6 mV decade -1 ) were approximately the same for each electrocatalyst in spite of the amount of the Ni-metal being doped and the order for the OER with respect to OH - concentration were found to be ~ 2. The electrocatalytic activities of the electrodes are correlated with their surface roughness. Based on the electrode kinetic results, mechanism of the oxygen evolution is suggested. Keywords: Nickel ferrite, Hydrothermal method, Electrocatalysis, Electrochemical properties, Oxygen evolution reaction 1. INTRODUCTION Oxygen evolution is the basic anodic reaction of water electrolysis. As the oxygen electrode reaction possesses high activation overpotential (η) in aqueous solutions [1], intensive research has been conducted to reduce this overpotential. The essential prerequisite for the optimization of this
-
Upload
independent -
Category
Documents
-
view
5 -
download
0
Transcript of Synthesis, Physicochemical and Electrochemical Properties of Nickel Ferrite Spinels Obtained by...
Int. J. Electrochem. Sci., 7 (2012) 4959 - 4973
International Journal of
ELECTROCHEMICAL SCIENCE
www.electrochemsci.org
Synthesis, Physicochemical and Electrochemical Properties of
Nickel Ferrite Spinels Obtained by Hydrothermal Method for
the Oxygen Evolution Reaction (OER)
M. S. Al-Hoshan1,3
, J. P. Singh2,*
, A. M. Al-Mayouf2,3,*
, A. A. Al-Suhybani2
, M. N. Shaddad
2
1Chemical Engineering Department, College of Engineering, King Saud University, Riyadh 11421,
Saudi Arabia. 2Department of Chemistry, College of Science, King Saud University, Riyadh 11451, Saudi Arabia.
3The Hydrogen Energy Research Group, Sustainable Energy Technologies (SET), King Saud
University, Riyadh, Saudi Arabia. *E-mail: [email protected], [email protected]
Received: 14 April 2012 / Accepted: 19 May 2012 / Published: 1 June 2012
The electrocatalysis of oxygen evolution reaction (OER) has been studied at the face centered cubic
(FCC) NixFe3-xO4 (0 ≤ x ≤ 1.0) anodes in 1M KOH solutions at 25 0C. These oxides were synthesized
by the hydrothermal method and reproduced in the form of film on a nickel support by an oxide-slurry
painting technique. The effect of Ni substitution in the base oxide (Fe3O4) was investigated with
regards to morphology, structure and catalytic performance by using techniques, such as, scanning
electron microscopy (SEM), infrared (IR), X-ray diffraction (XRD), cyclic voltammetry (CV), Tafel
polarization, and electrochemical impedance spectroscopy (EIS). Among synthesized oxides, the
NiFe2O4 electrode was found to be the most active anode for oxygen evolution (OE). Tafel slope
values (b = 41±6 mV decade-1
) were approximately the same for each electrocatalyst in spite of the
amount of the Ni-metal being doped and the order for the OER with respect to OH- concentration were
found to be ~ 2. The electrocatalytic activities of the electrodes are correlated with their surface
roughness. Based on the electrode kinetic results, mechanism of the oxygen evolution is suggested.
Keywords: Nickel ferrite, Hydrothermal method, Electrocatalysis, Electrochemical properties,
Oxygen evolution reaction
1. INTRODUCTION
Oxygen evolution is the basic anodic reaction of water electrolysis. As the oxygen electrode
reaction possesses high activation overpotential (η) in aqueous solutions [1], intensive research has
been conducted to reduce this overpotential. The essential prerequisite for the optimization of this
Int. J. Electrochem. Sci., Vol. 7, 2012
4960
reaction is the selection of the anode material. A variety of electrocatalysts have been investigated [1 –
6]. Among them, transition metal oxides with spinel-type (AB2O4; where, A & B are a bivalent &
trivalent transition metal ions, respectively) and perovskite-type (ABO3; where, A is mainly La and B
= Co, Ni or Mn) structures are considered the most promising and are extensively studied [1 – 6].
Fe3O4 and its substituted products are potent catalytic materials for several important
heterogeneously catalyzed reactions such as an anode catalysts for chlorine and chlorate production
[2], synthesis of ammonia [7], decomposition of H2O2 [8], application in the electron transfer of
hemoglobin [9], and in a biosensors [10]. As compared to Co3O4 [1, 3, 11, 12], these oxides have
considerably higher overpotential for oxygen evolution reaction (OER) [13] and are little investigated
for the electrocatalysis of OER [1, 14]. Earlier, these oxides were prepared by conventional ceramic
methods [14, 15] and usually have high resistivity and low specific surface area, which thereby lead to
relatively low electrocatalytic activities. In the quest to improve the specific surface area vis-à-vis the
electrocatalytic properties, electrocatalysts were synthesized by adopting, mainly, two strategies; first,
the development of new low temperature preparation methods [1 – 10, 16 – 20] and second, partial
replacement of A or/and B sites(s) by suitable metal ions [11 – 14, 21 – 23]. Very recently, Singh et al.
[23] prepared a series of Cr-substituted ferro nano-spinels (13–21 nm) using a low temperature
precipitation method with a controlled pH (= 11) and found considerable enhancement in the
electrocatalytic properties towards the OER. Keeping the above facts in mind, herein, we synthesized
Fe3O4 and its Ni-substituted products by using low temperature hydrothermal method and studied their
physiochemical and electrocatalytic properties towards OER in alkaline solution and results of the
study are presented in this paper.
2. EXPERIMENTAL
All the reagents were of analytical grade and used without further purification. Fe3O4 and Ni-
substituted spinellic oxides were synthesized through a simple hydrothermal process [24]. For the
purpose, as per requirements for the particular oxide, ferrous ammonium sulfate (AR, BDH, 99%) and
nickel sulfate (AG, E-MERCK) were mixed in a stoichiometric ratio. The solution of metal sulfates
and 250 ml of 10 M NaOH solution were simultaneously poured into a Teflon-lined stainless steel
autoclave (Parr Instrument Company, U.S.A., Model: 452HC2 T316) and kept at 150 0C. The sealed
autoclave provides a high-temperature and high-pressure environment for the annealing of oxide. After
24 h of aging, the autoclave was cooled to room temperature and the precipitate deposited at the
bottom was washed repeatedly with de-ionized (DI) water until free from SO42-
ions. The precipitate,
so obtained, was dried at 80 0C in a vacuum oven over night and finally sintered at 400
0C for 8 h in an
electrical furnace (Nabertherm; Germany).
Materials were characterized by recording IR spectra (NEXUS-670, FT-IR Thermo Nicolet;
Thermo Scientific) and XRD (Ultima IV, X-ray diffractometer: Rigaku). In case of IR, oxide powder
and purified KBr were mechanically mixed and pressed into disc shape. IR was used to analyze the
changes in the surface chemical bonding and structure in the frequency range of 4000–400 cm−1
. The
spinel-phase was confirmed via XRD using Cu-Kα radiation (λ = 0.15418 nm; 40 kV, 40 mA) source
Int. J. Electrochem. Sci., Vol. 7, 2012
4961
and the data was collected at the scan rate 0.03 deg. s-1
. The morphology of the oxide powders was
examined using a high performance scanning electron microscope (SEM; JSM-6380LA).
Electrochemical characterizations of the materials were carried out in the form of oxide film
electrode. For the purpose, slurry of the oxide-powder prepared with a few drops of Triton X-100 was
painted on one side of the pretreated Ni (Aldrich, 99.9%) support, as described elsewhere [25] and
subsequently heat treated in an electrical furnace at 350 0C for 2 h to obtain an adherent oxide film.
The electrical contact with the oxide film was made using a crocodile clip on a small, oxide-free strip
of the plate. The back of the electrode was covered with an inert nonconductive epoxy and only a
single face of area 0.3 cm2 was kept uncovered to expose with the electrolyte. The oxide loadings
ranged between 2 to 3 mg cm-2
.
Electrochemical studies, namely, cyclic voltammograms (CV), electrochemical impedance
spectra (EIS) and Tafel polarization were performed in a conventional three-electrode single
compartment Pyrex glass cell using a computerized potentiostat/galvanostat (Autolab, PGSTAT30).
The commercial reference and the auxiliary electrodes were Hg/HgO/1M KOH (Koslow, scientific
testing instruments; Model: 5088) and pure Pt-foil, respectively. All potentials mentioned in the text
are based on the Hg/HgO (E0 = 0.098 V vs. NHE at 25
0C) electrode only. The software used for
impedance, cyclic voltammetry, and Tafel polarization measurements was NOVA 1.5. The EIS of the
oxide catalysts/1M KOH interface was measured over the frequency range 0.1-105 Hz at a potential
0.55 V, which is the region of the commencement of the OER. The double layer capacitance (Cdl) was
analyzed using "ZSimpWin version 3.10" software.
3. RESULTS AND DISCUSSION
3.1. Physical Properties
3.1.1 Morphology of oxide powder
A B
Int. J. Electrochem. Sci., Vol. 7, 2012
4962
C D
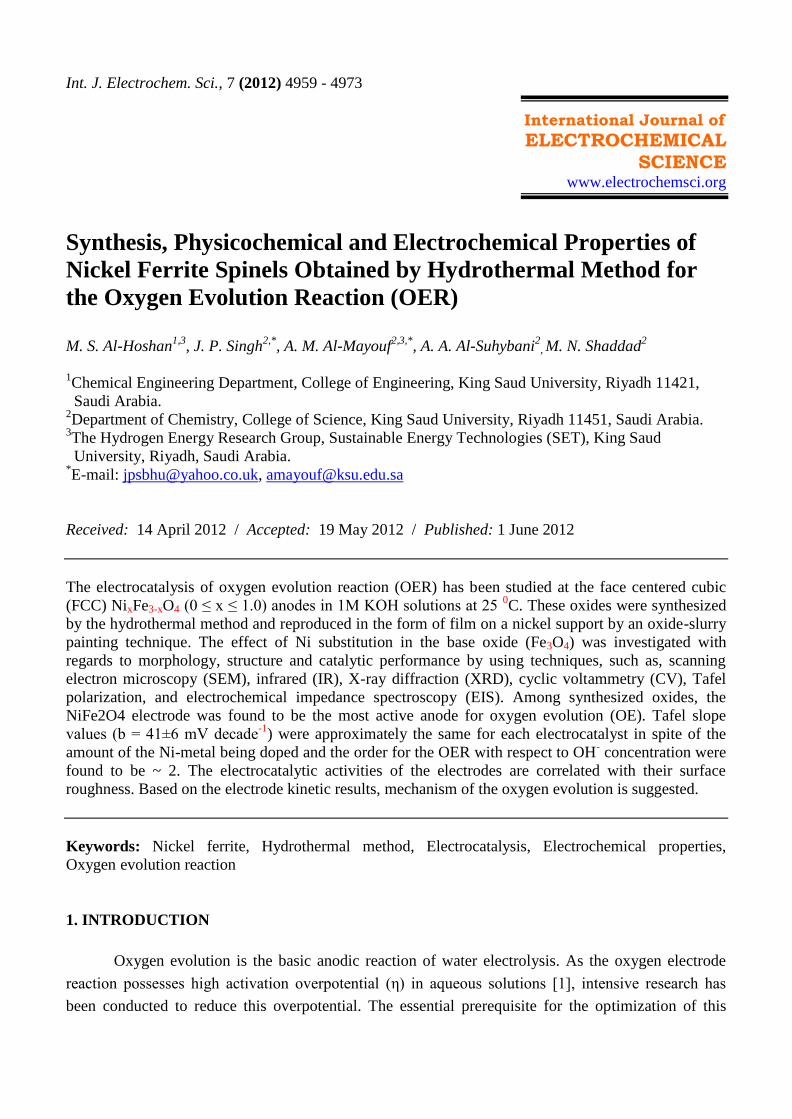
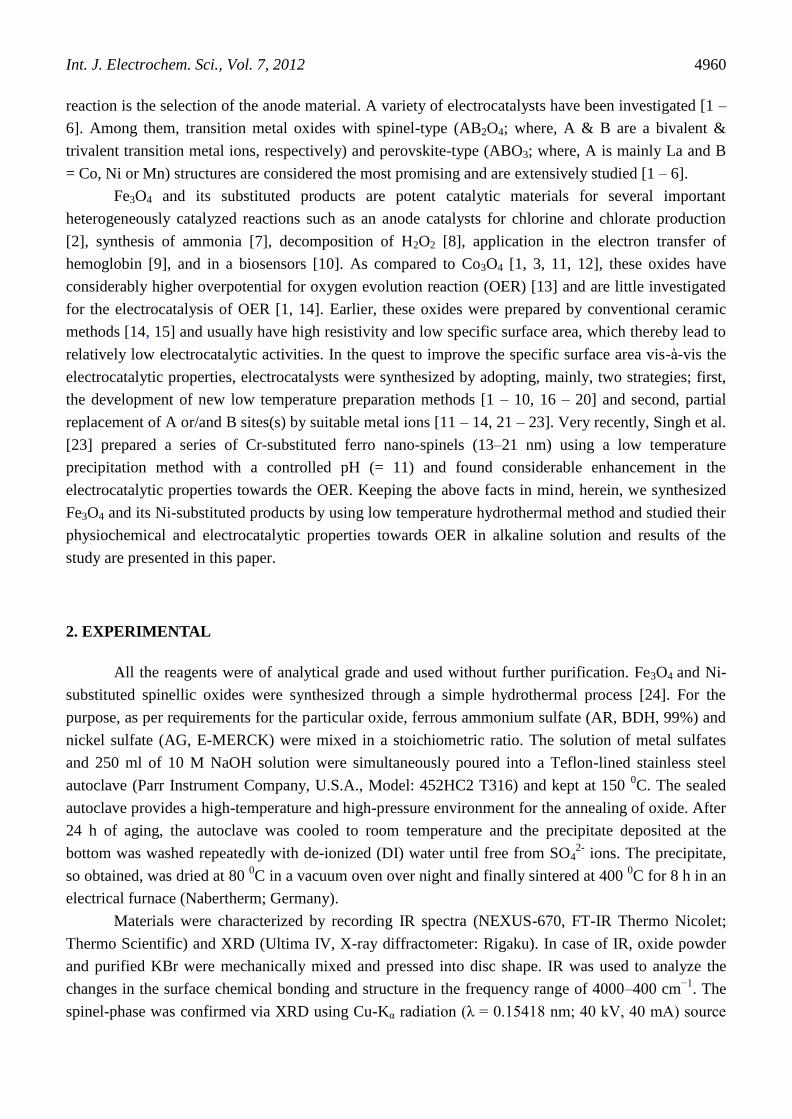
Figure 1. SEM micrographs of oxide powders; heated at 400 0C for 8 h at two magnifications: Fe3O4:
(a) ×2,000; (b) × 5,000; NiFe2O4: (c) × 2,000; (d) ×5,000.
SEM micrographs of Fe3O4 and NiFe2O4 oxide powders, sintered at 400 0C for 8 h, are
represented in the Fig. 1 (a & b) and Fig. 1 (c & d), respectively, at two different magnifications. From
Fig. 1 (a & b), it is revealed that oxide particles have an octahedron shape with conspicuous crystal
faces and inhomogeneous grain size. Some aggregates have also been observed in the morphology of
Fe3O4 (Fig. 1a). In the case of NiFe2O4 [Fig. 1 (c & d)], the crystals are distributed more uniformly
having smaller grain size. Some authors [24, 26 – 28] have also observed similar morphology on the
metal oxide; highly alkalinity favors the growth of various morphologies, possibly due to the multitude
of factors which influence the morphologies of the crystal grown.
3.1.2. Infrared spectra
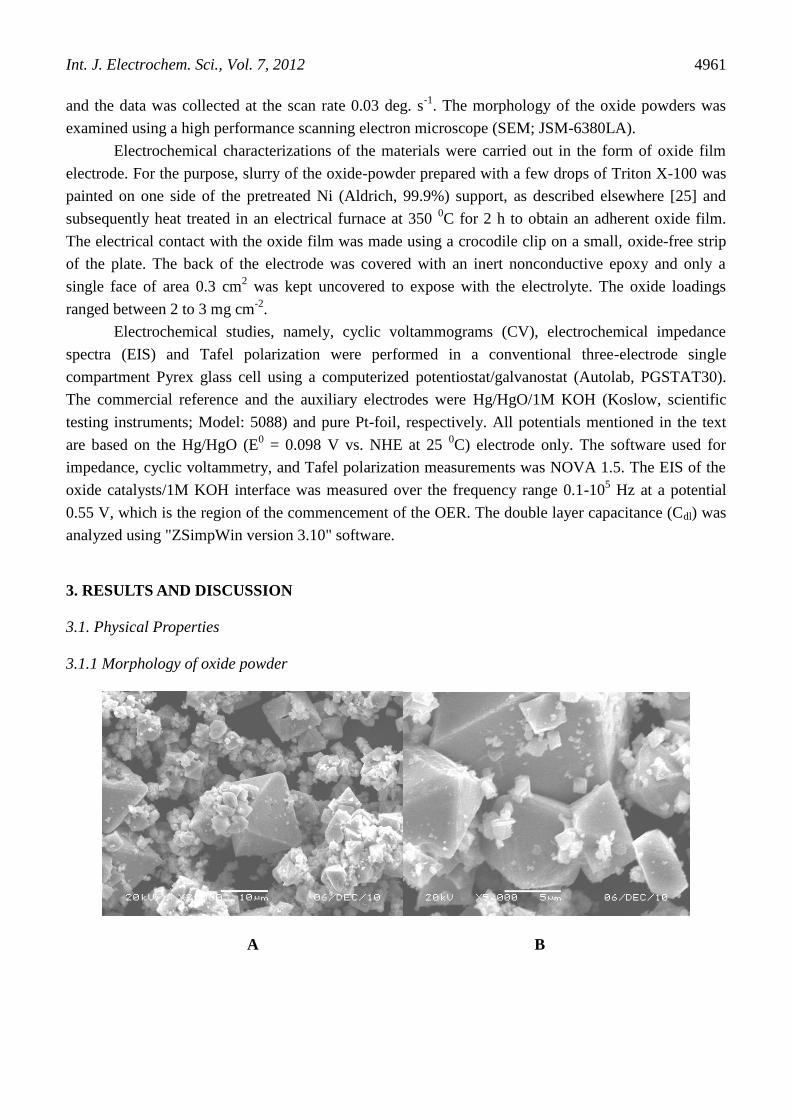
Figure 2. IR spectra of oxides; Fe3O4 and NiFe2O4, sintered at 400 0C for 8 h.
Int. J. Electrochem. Sci., Vol. 7, 2012
4963
IR spectra for Fe3O4 and NiFe2O4, sintered at 400 0C for 8 h, recorded in the region of 4000-
400 cm-1
are shown in the Fig. 2. The frequency bands (ν1) (~ 558 & ~ 577 cm-1
) and (ν2) (~ 459 & ~
457 cm-1
), as shown in the figure 2, revealed the formation of pure spinel ferrites phase with two sub-
lattices tetrahedral (A-site) and octahedral (B-site) sites [29 – 32]. Absorption bands ν1 and ν2 are
attributed to the tetrahedral and octahedral site, respectively, of each oxide. The peak values ~ 3434
and ~ 3459 cm-1
represent the characteristic hydroxyl group (O−H) that can be attributed to the water
molecule adsorbed onto the surface of Fe3O4 and NiFe2O4, respectively. The presence of hydroxyl
group on the ferrite may help in the conjugation and dispersion of nano materials [33]. It may also help
in the agglomeration of ferrite particles as the SEM images show at high resolution.
3.1.3. X-ray diffraction
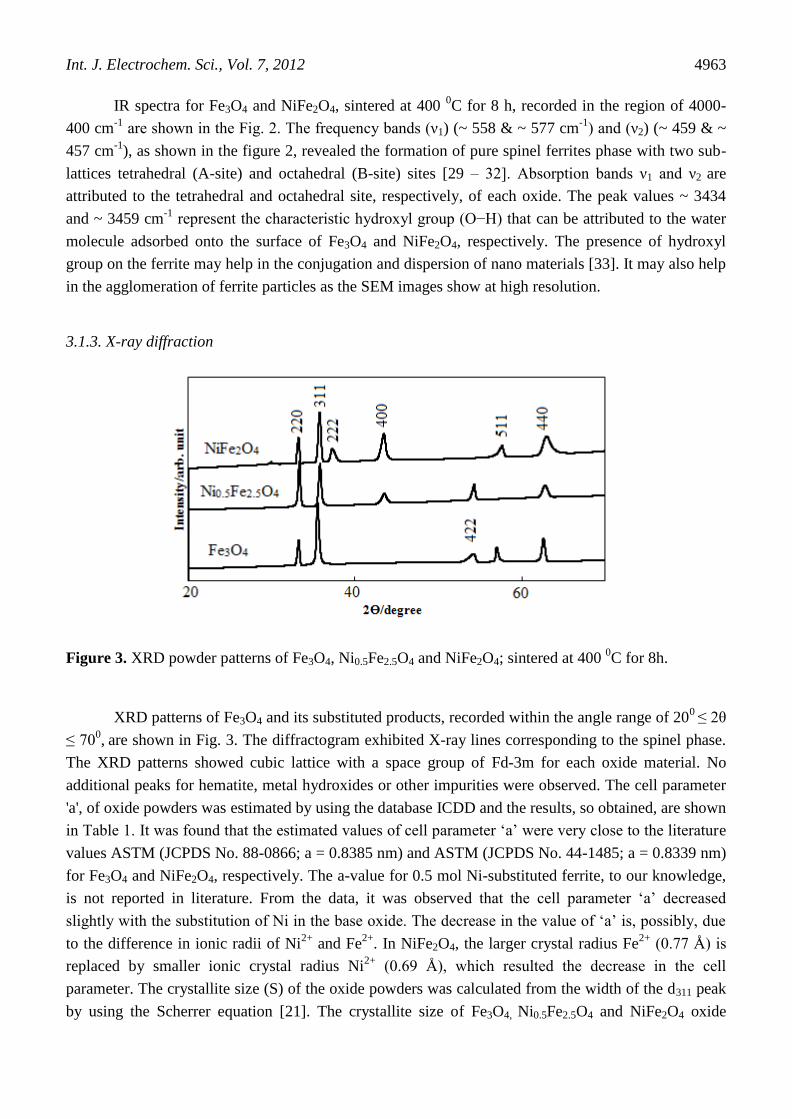
Figure 3. XRD powder patterns of Fe3O4, Ni0.5Fe2.5O4 and NiFe2O4; sintered at 400 0C for 8h.
XRD patterns of Fe3O4 and its substituted products, recorded within the angle range of 200
≤ 2θ
≤ 700, are shown in Fig. 3. The diffractogram exhibited X-ray lines corresponding to the spinel phase.
The XRD patterns showed cubic lattice with a space group of Fd-3m for each oxide material. No
additional peaks for hematite, metal hydroxides or other impurities were observed. The cell parameter
'a', of oxide powders was estimated by using the database ICDD and the results, so obtained, are shown
in Table 1. It was found that the estimated values of cell parameter ‘a’ were very close to the literature
values ASTM (JCPDS No. 88-0866; a = 0.8385 nm) and ASTM (JCPDS No. 44-1485; a = 0.8339 nm)
for Fe3O4 and NiFe2O4, respectively. The a-value for 0.5 mol Ni-substituted ferrite, to our knowledge,
is not reported in literature. From the data, it was observed that the cell parameter ‘a’ decreased
slightly with the substitution of Ni in the base oxide. The decrease in the value of ‘a’ is, possibly, due
to the difference in ionic radii of Ni2+
and Fe2+
. In NiFe2O4, the larger crystal radius Fe2+
(0.77 Å) is
replaced by smaller ionic crystal radius Ni2+
(0.69 Å), which resulted the decrease in the cell
parameter. The crystallite size (S) of the oxide powders was calculated from the width of the d311 peak
by using the Scherrer equation [21]. The crystallite size of Fe3O4, Ni0.5Fe2.5O4 and NiFe2O4 oxide
Int. J. Electrochem. Sci., Vol. 7, 2012
4964
powders were found to be ~18, ~15 and ~13 nm, respectively. The strong and sharp peaks in the XRD
pattern revealed the crystalline nature of the oxide powder as also observed in the SEM observation.
Table 1. The unit cell dimensions for nickel ferrites (F. C. C. Structure)
Oxides Space group T/ 0C a/ nm S/ nm
Fe3O4 (01-087-0246 ICDD) Fd-3m 400 0.8391 ~18
Ni0.5Fe2.5O4 (01-087-2338 ICDD) Fd-3m 400 0.8361 ~15
NiFe2O4 (00-054-0964 ICDD) Fd-3m 400 0.8337 ~13
3.2. Electrochemical properties
3.2.1. Cyclic Voltammetry (CV)
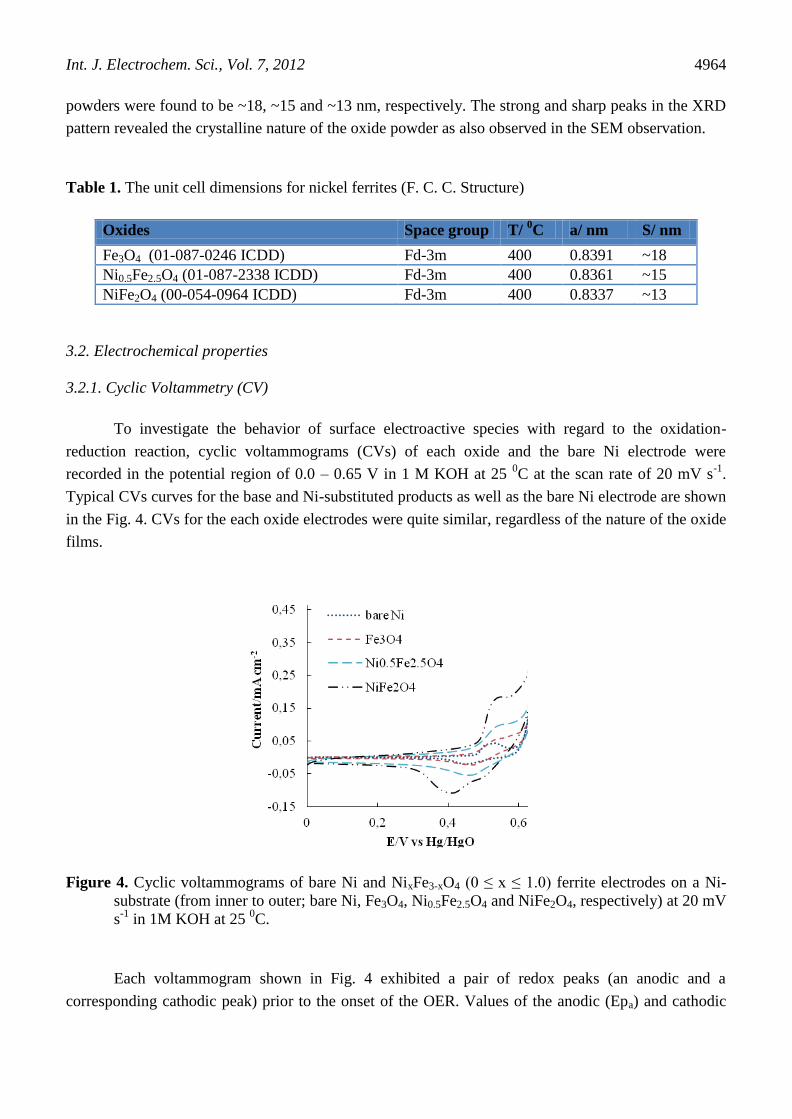
To investigate the behavior of surface electroactive species with regard to the oxidation-
reduction reaction, cyclic voltammograms (CVs) of each oxide and the bare Ni electrode were
recorded in the potential region of 0.0 – 0.65 V in 1 M KOH at 25 0C at the scan rate of 20 mV s
-1.
Typical CVs curves for the base and Ni-substituted products as well as the bare Ni electrode are shown
in the Fig. 4. CVs for the each oxide electrodes were quite similar, regardless of the nature of the oxide
films.
Figure 4. Cyclic voltammograms of bare Ni and NixFe3-xO4 (0 ≤ x ≤ 1.0) ferrite electrodes on a Ni-
substrate (from inner to outer; bare Ni, Fe3O4, Ni0.5Fe2.5O4 and NiFe2O4, respectively) at 20 mV
s-1
in 1M KOH at 25 0C.
Each voltammogram shown in Fig. 4 exhibited a pair of redox peaks (an anodic and a
corresponding cathodic peak) prior to the onset of the OER. Values of the anodic (Epa) and cathodic

Int. J. Electrochem. Sci., Vol. 7, 2012
4965
(Epc) peak potentials, the separation potential (∆E = Epa - Epc), and the formal redox potential {E0 =
(Epa + Epc)/2} were estimated and their values, at the scan rate of 20 mV s-1
, are listed in Table 2. The
result shows that there is appreciable increase in the ∆E values with the oxide film on Ni. However,
Ni-substitution in Fe3O4 matrix did not influence the ∆E value. Almost, similar E0
value is observed
with each electrode, except base oxide.
Figure 5. Cyclic voltammograms of pure ferrite (Fe3O4) and nickel ferrite (NiFe2O4) electrodes on a
Ti-substrate at 20 mV s-1
in 1M KOH at 25 0C.
Figure 6. Cyclic voltammograms of the Ni/Ni0.5Fe2.5O4 electrode at different scan rates (from inner to
outer; 20 mV s-1
, 40 mV s-1
, 60 mV s-1
, 80 mV s-1
, 100 mV s-1
and 120 mV s-1
, respectively) in
1M KOH at 25 0C.
In order to know occurrence of redox peaks prior to the onset of OER, CV of the catalytic film
on Ti was recorded under similar experimental conditions. CVs curves of Fe3O4 and NiFe2O4 on Ti-

Int. J. Electrochem. Sci., Vol. 7, 2012
4966
substrate, as shown in Fig. 5, did not give any redox peak in the potential region of 0.0 – 0.65 V. This
observation and the E0 value, shown in the Table 2, indicate that the observed redox peaks correspond
to the oxidation-reduction of nickel ions from the support and not to the oxidation of ferrite films.
Similar results of CVs have also been observed by some authors [11, 34 – 36]. Also, it is considered
that during the experiment, the electrolyte may penetrate [37] the catalytic layer through pores, cracks,
crevices, inter-crystalline gap, etc., and came in contact with the substrate and oxidize the latter.
However, it does not affect the stability of the oxide film. From Table 2, it is also observed that the
oxide catalyst influenced the anodic peak current density (jpa) significantly. The effect is found to be
greatest for the electrocatalytically most active NiFe2O4 electrode (jpa= 0.17 mA cm-2
). This increase
in the anodic peak current density might be due to the fact that the catalysts stimulate not only the
oxygen evolution reaction but also the redox couple. It is thought that Ni2+
ions, produced at the
Ni/oxide interface due to the oxidation of nickel support [18, 35] during electrolysis, influence the
anodic peak current density of the catalytic films.
Figure 7. jpa vs (scan rate)1/2
plot for the Ni/Ni0.5Fe2.5O4 electrode.
Table 2. Results of the cyclic voltammetry of pure and nickel ferrites in 1M KOH at 20 mV s-1
and 25 0C.
Electrode Epa
/mV
Epc
/mV
∆E=(Epa - Epc)
/mV
E0=(Epa+Epc)/2
/mV
Anodic peak
current density
(jpa) /mA cm-2
Actual anodic peak
current density
(jpa)/mA cm-2
Ni (bare) 505 447 58 476 0.01 -----
Fe3O4 581 471 110 526 0.08 0.07
Ni0.5Fe2.5O4 540 429 111 485 0.10 0.09
NiFe2O4 530 410 120 470 0.18 0.17
To account the effect of the scan rate, CV for Ni/Ni0.5Fe2.5O4 was recorded at different scan rate
(ν) and shown in Fig. 6. The plot jpa vs. (ν) 1/2
, as shown in Fig. 7, was found to be linear, which
indicates that the electrochemical reaction is controlled by a diffusion process [38].
Int. J. Electrochem. Sci., Vol. 7, 2012
4967
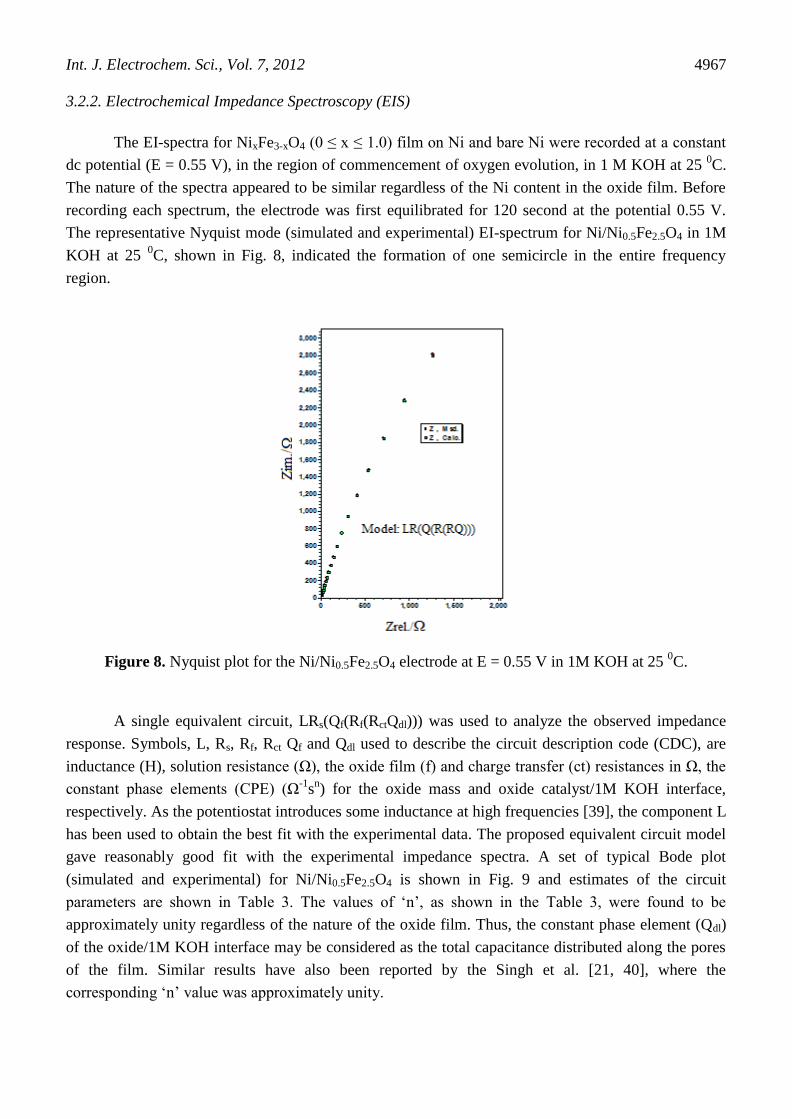
3.2.2. Electrochemical Impedance Spectroscopy (EIS)
The EI-spectra for NixFe3-xO4 (0 ≤ x ≤ 1.0) film on Ni and bare Ni were recorded at a constant
dc potential (E = 0.55 V), in the region of commencement of oxygen evolution, in 1 M KOH at 25 0C.
The nature of the spectra appeared to be similar regardless of the Ni content in the oxide film. Before
recording each spectrum, the electrode was first equilibrated for 120 second at the potential 0.55 V.
The representative Nyquist mode (simulated and experimental) EI-spectrum for Ni/Ni0.5Fe2.5O4 in 1M
KOH at 25 0C, shown in Fig. 8, indicated the formation of one semicircle in the entire frequency
region.
Figure 8. Nyquist plot for the Ni/Ni0.5Fe2.5O4 electrode at E = 0.55 V in 1M KOH at 25 0C.
A single equivalent circuit, LRs(Qf(Rf(RctQdl))) was used to analyze the observed impedance
response. Symbols, L, Rs, Rf, Rct Qf and Qdl used to describe the circuit description code (CDC), are
inductance (H), solution resistance (Ω), the oxide film (f) and charge transfer (ct) resistances in Ω, the
constant phase elements (CPE) (Ω-1
sn) for the oxide mass and oxide catalyst/1M KOH interface,
respectively. As the potentiostat introduces some inductance at high frequencies [39], the component L
has been used to obtain the best fit with the experimental data. The proposed equivalent circuit model
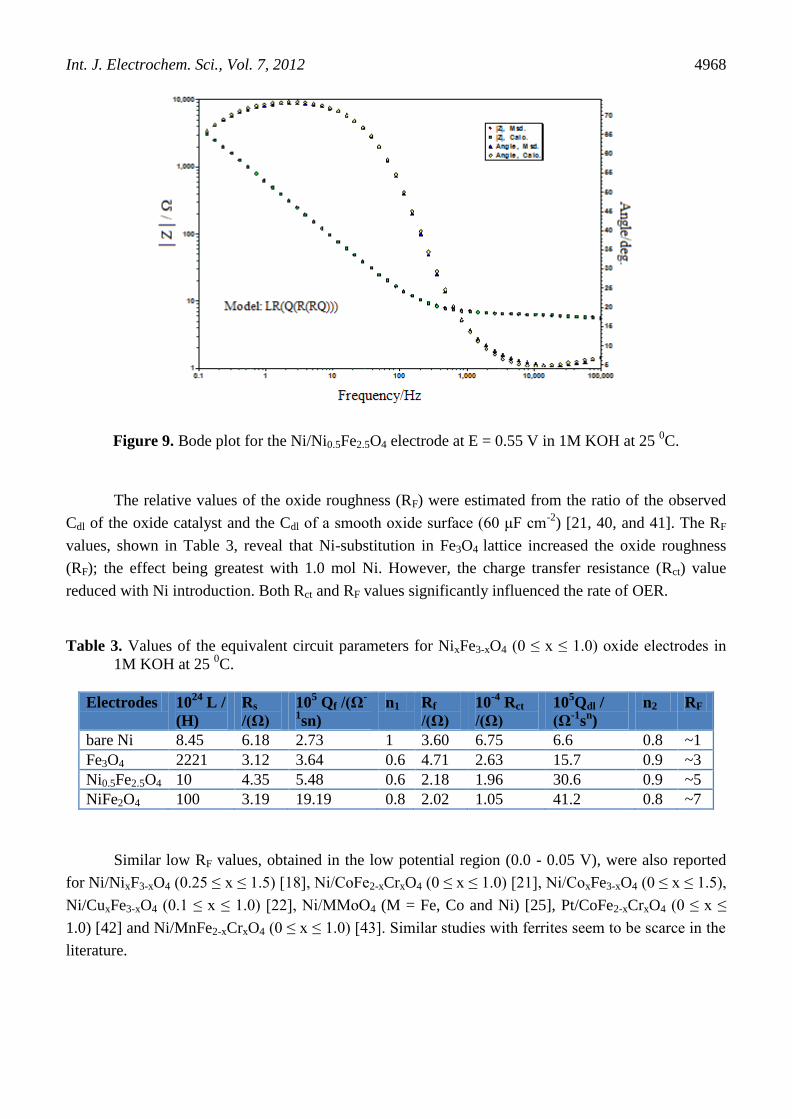
gave reasonably good fit with the experimental impedance spectra. A set of typical Bode plot
(simulated and experimental) for Ni/Ni0.5Fe2.5O4 is shown in Fig. 9 and estimates of the circuit
parameters are shown in Table 3. The values of ‘n’, as shown in the Table 3, were found to be
approximately unity regardless of the nature of the oxide film. Thus, the constant phase element (Qdl)
of the oxide/1M KOH interface may be considered as the total capacitance distributed along the pores
of the film. Similar results have also been reported by the Singh et al. [21, 40], where the
corresponding ‘n’ value was approximately unity.
Int. J. Electrochem. Sci., Vol. 7, 2012
4968
Figure 9. Bode plot for the Ni/Ni0.5Fe2.5O4 electrode at E = 0.55 V in 1M KOH at 25 0C.
The relative values of the oxide roughness (RF) were estimated from the ratio of the observed
Cdl of the oxide catalyst and the Cdl of a smooth oxide surface (60 μF cm-2
) [21, 40, and 41]. The RF
values, shown in Table 3, reveal that Ni-substitution in Fe3O4 lattice increased the oxide roughness
(RF); the effect being greatest with 1.0 mol Ni. However, the charge transfer resistance (Rct) value
reduced with Ni introduction. Both Rct and RF values significantly influenced the rate of OER.
Table 3. Values of the equivalent circuit parameters for NixFe3-xO4 (0 ≤ x ≤ 1.0) oxide electrodes in
1M KOH at 25 0C.
Electrodes 1024
L /
(H)
Rs
/(Ω)
105 Qf /(Ω
-
1sn)
n1 Rf
/(Ω)
10-4
Rct
/(Ω)
105Qdl /
(Ω-1
sn)
n2 RF
bare Ni 8.45 6.18 2.73 1 3.60 6.75 6.6 0.8 ~1
Fe3O4 2221 3.12 3.64 0.6 4.71 2.63 15.7 0.9 ~3
Ni0.5Fe2.5O4 10 4.35 5.48 0.6 2.18 1.96 30.6 0.9 ~5
NiFe2O4 100 3.19 19.19 0.8 2.02 1.05 41.2 0.8 ~7
Similar low RF values, obtained in the low potential region (0.0 - 0.05 V), were also reported
for Ni/NixF3-xO4 (0.25 ≤ x ≤ 1.5) [18], Ni/CoFe2-xCrxO4 (0 ≤ x ≤ 1.0) [21], Ni/CoxFe3-xO4 (0 ≤ x ≤ 1.5),
Ni/CuxFe3-xO4 (0.1 ≤ x ≤ 1.0) [22], Ni/MMoO4 (M = Fe, Co and Ni) [25], Pt/CoFe2-xCrxO4 (0 ≤ x ≤
1.0) [42] and Ni/MnFe2-xCrxO4 (0 ≤ x ≤ 1.0) [43]. Similar studies with ferrites seem to be scarce in the
literature.
Int. J. Electrochem. Sci., Vol. 7, 2012
4969
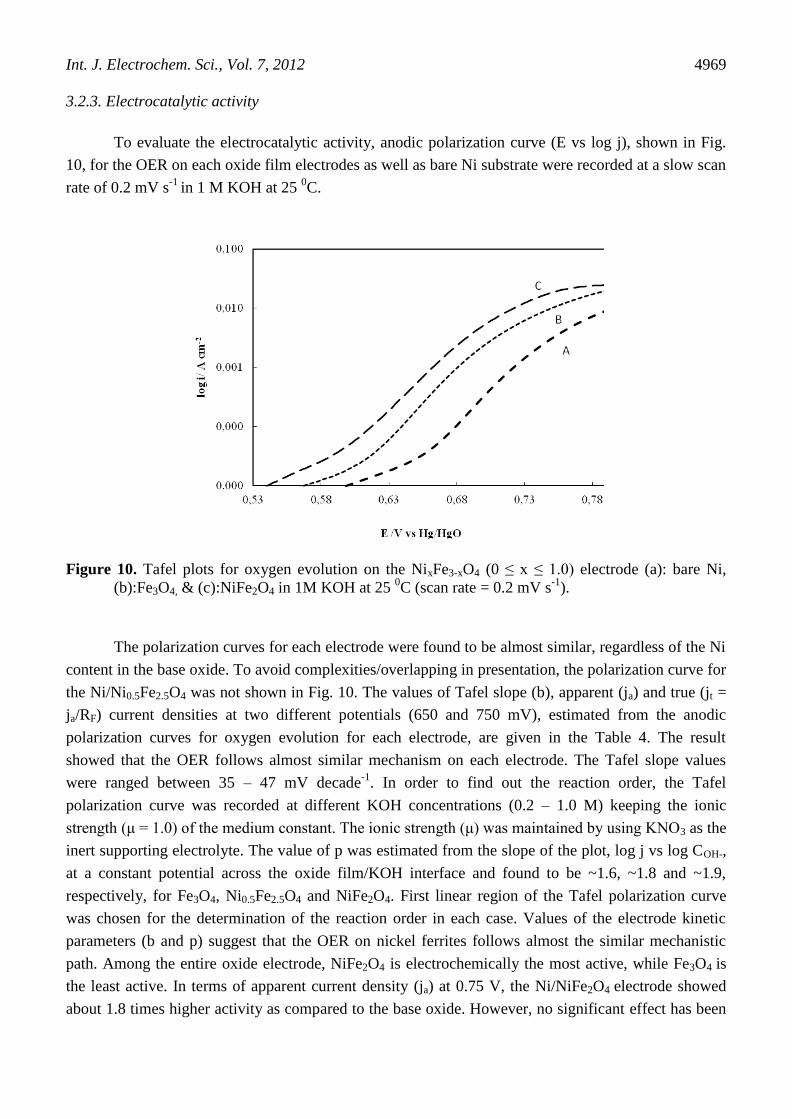
3.2.3. Electrocatalytic activity
To evaluate the electrocatalytic activity, anodic polarization curve (E vs log j), shown in Fig.
10, for the OER on each oxide film electrodes as well as bare Ni substrate were recorded at a slow scan
rate of 0.2 mV s-1
in 1 M KOH at 25 0C.
Figure 10. Tafel plots for oxygen evolution on the NixFe3-xO4 (0 ≤ x ≤ 1.0) electrode (a): bare Ni,
(b):Fe3O4, & (c):NiFe2O4 in 1M KOH at 25 0C (scan rate = 0.2 mV s
-1).
The polarization curves for each electrode were found to be almost similar, regardless of the Ni
content in the base oxide. To avoid complexities/overlapping in presentation, the polarization curve for
the Ni/Ni0.5Fe2.5O4 was not shown in Fig. 10. The values of Tafel slope (b), apparent (ja) and true (jt =
ja/RF) current densities at two different potentials (650 and 750 mV), estimated from the anodic
polarization curves for oxygen evolution for each electrode, are given in the Table 4. The result
showed that the OER follows almost similar mechanism on each electrode. The Tafel slope values
were ranged between 35 – 47 mV decade-1
. In order to find out the reaction order, the Tafel
polarization curve was recorded at different KOH concentrations (0.2 – 1.0 M) keeping the ionic
strength (μ = 1.0) of the medium constant. The ionic strength (μ) was maintained by using KNO3 as the
inert supporting electrolyte. The value of p was estimated from the slope of the plot, log j vs log COH-,
at a constant potential across the oxide film/KOH interface and found to be ~1.6, ~1.8 and ~1.9,
respectively, for Fe3O4, Ni0.5Fe2.5O4 and NiFe2O4. First linear region of the Tafel polarization curve
was chosen for the determination of the reaction order in each case. Values of the electrode kinetic
parameters (b and p) suggest that the OER on nickel ferrites follows almost the similar mechanistic
path. Among the entire oxide electrode, NiFe2O4 is electrochemically the most active, while Fe3O4 is
the least active. In terms of apparent current density (ja) at 0.75 V, the Ni/NiFe2O4 electrode showed
about 1.8 times higher activity as compared to the base oxide. However, no significant effect has been

Int. J. Electrochem. Sci., Vol. 7, 2012
4970
observed in the true catalytic activity. The increase in the apparent electrocatalytic activity (ja) of the
oxides with Ni content can be ascribed to an increase in the specific surface area/the roughness factor
of the oxides. The consistent changing trend of RF and catalytic activity of electrodes suggests that the
electrode surface roughness plays an important role in the catalytic activity.
Based on values of the apparent current density (ja) at E = 0.75 V in 1M KOH at 25 0C, the
oxide catalysts can be arranged in the following order:
Fe3O4 < Ni0.5Fe2.5O4 < NiFe2O4
Table 4. Electrode kinetic parameters for O2 evolution on Ni/NixFe3-xO4 (0≤x≤ 1.0) 1M KOH at 25 0C.
Electrodes Tafel slope (b)
/mV decade-1
Current (j/mA cm-2
) at E/mV
650 750
ja jt ja jt
bare Ni 47 0.03 0.03 3.2 3.20
Fe3O4 43 0.20 0.07 10.3 3.43
Ni0.5Fe2.5O4 35 0.31 0.06 13.3 2.66
NiFe2O4 42 0.62 0.09 18.7 2.67
Most importantly, the NixFe3-xO4 (0 ≤ x ≤ 1.0) electrodes prepared in this study were much
more active than those of the other ferrite electrodes already reported in the literature. For instance, at
ηO2 = 0.34 V, for NiFe2O4 in 30 wt% KOH, the current density observed by Orehotsky et al. [14] was
10 mA cm-2
; however, our NiFe2O4 electrode gave the same current density at ηO2 ≈ 0.43 V in 1M
KOH at 25 0
C. The overpotential (ηO2) = E - EO2/OH-, where, E and EO2/OH
- are the applied potential
across the catalysts/1M KOH interface and the theoretical equilibrium potential in 1M KOH at 25 0C;
EO2/OH-= 0.303 V vs Hg/HgO. At E = 0.7 V, the same electrode prepared in this study produced ~ 6
mA cm-2
, whereas Singh et al. [22] observed 1.2 mA cm-2
in 1M KOH at 25 0C for the CuFe2O4
electrode prepared by the hydroxide precipitation method at controlled pH (= 11). It was observed that
the electrocatalytic activity of NiFe2O4 electrode, obtained by us, was much greater than the electrodes
of other spinel magnetite family NixAl1-xMn2O4 [20]. For instance, at E = 0.65 V in 1M KOH at 25 0C
the apparent electrocatalytic activity of this electrode (ja = 0.62 mA cm-2
) was much higher than the
aluminum substituted nickel magnetites (ja = 0.1 mA cm-2
at ηO2 = 0.6V) electrodes obtained by the
sol-gel as well as co-precipitation of metal hydroxides methods. However, the new electrode (E = 0.75
V at 18.7 mA cm-2
) showed approximately similar electrocatalytic activity to other spinel cobaltite
family of Ni/MnCo2O4 electrode (ηO2 = 0.4 V at 15 mA cm-2
) [44] prepared by the sol-gel route.
The observed Tafel slope (b) values (2×2.303RT/3F) were in fair agreement with those
recently reported for the similar oxide electrode; CoFe2-xCrxO4 (b = 40-51 mV decade-1
) [21], NixFe3-
xO4 (b = ~40 mV decade-1
) [18], MMoO4 (M = Fe, Co and Ni) (b = 37-44 mV decade-1
) [25], MnxFe3-
xO4 (b = 36 mV decade-1
) [35], MnFe2-xCrxO4 (b = 34 - 41 mV decade-1
) [43], and NiFe2-xCrxO4 (b =
38 – 41 mV decade-1
) [45]. Very recently, Lyons et al. have also obtained same Tafel slopes (b = 37–
47 mV decade-1
) on oxidized nickel, cobalt and iron electrodes in basic medium for oxygen evolution
reaction [46]. A similar value for the electrode kinetic parameter (b) was also found on sprayed
Int. J. Electrochem. Sci., Vol. 7, 2012
4971
NiCo2O4 film (b = 42 mV decade-1
), Ni [47], CuCo2O4 films (b = 42 mV decade-1
), Ni, LaPO4- bonded
on Ni prepared by thermal decomposition of the metal nitrates [48, 49], electrodeposited Ni-Fe alloys
on mild steel (b = 37- 45 mV decade-1
) [50], and on austenitic stainless steels (b = 28-35 mV decade-1
)
[36].
To account the observed electrode kinetic parameters (b and p), obtained in the present study,
for oxygen evolution on spinel ferrites, the following mechanism has been proposed:
S + OH- ↔ SOH + e
- (1)
SOH + OH- → SO + H2O + e
- (2)
2SO ↔ 2S + O2 (3)
where ‘S’ is an active site on the oxide surface, OH-, and O are the surface adsorbed
intermediates. This mechanism is similar to Bockris’s (electrochemical oxide path) [51], Singh and
coworkers [5, 22, 25, 35, 45], also Lyons et al. [46]. The possibility of other mechanisms such as
Krasil’shchikov’s path [52] and Bockris-Otagawa’s peroxide path [41] cannot be ruled out.
At low overpotentials, considering step (2) as the rate determining and the total coverage (ӨT =
ӨOH + ӨO) under Langmuir conditions and applying quasi-equilibrium conditions to step (1), the
overall rate and hence the current density for the OER can be given as:
J = nFk2k1C2
OH- exp [(1+β) FE/RT] (4)
k1 is the standard equilibrium constant for reaction (1) and k2 is the standard rate constant for
reaction (2). All other symbols have their usual meanings. Assuming β ~ 0.5, equation (4) gives the
second order of reaction (p) with respect to OH- concentration and Tafel slope (b) = 2.303×RT/3F ≈ 40
mV decade-1
, which are in accordance with our experimental findings.
4. CONCLUSION
The investigation shows that the partial replacement of Fe by Ni in the Fe3O4 spinel lattice
greatly enhances the apparent electrocatalytic activity of the oxide toward the OER. The oxide,
NiFe2O4, indicated approximately 1.8 times more catalytic activity and ≈ 2.5 times more roughness
than base oxide (Fe3O4) in 1M KOH at 25 0C.
ACKNOWLEDGEMENTS
The authors are grateful to Dr. N. K. Singh, Department of Chemistry of Lucknow University, India
for reading the manuscript, correction of the written English and for his useful suggestions.
Int. J. Electrochem. Sci., Vol. 7, 2012
4972
References
1. E.J.M. O’Sullivan, E.J. Calvo (1987) In: R.G. Compton (ed) Comprehensive chemical kinetics, vol.
27. Elsevier, Amsterdam, pp 247.
2. S. Trasatti, G. Lodi (1981) In: S. Trasatti (ed) Electrodes of conductive metallic oxides, part B,
Elsevier, Amsterdam, pp 521.
3. S. Trasatti (1994) In: J. Lipkowski, P.N. Ross (eds) Electrochemistry of novel materials. VCH, New
York, pp 207.
4. S.K. Tiwari, S.P. Singh, R.N. Singh, J. Electrochem. Soc. 143 (1996) 1505.
5. B. Lal, N.K. Singh, S. Samuel, R.N. Singh, J. New Mater. Electrochem. Systems 2 (1999) 59.
6. M. Hamdani, R.N. Singh, P. Chartier, Int. J. Electrochem. Sci. 5 (2010) 556.
7. R.R. Rajaram, A. Sermon, J. Chem. Soc. Faraday Trans. 81 (1985) 2577.
8. C.B. Roy, J. Catal. 12 (1968) 29.
9. G. Zhao, J.-J. Xu, H.-Y. Chen, Electrochem. Commun. 8 (2006) 48.
10. K.S. Loh, Y.H. Lee, A. Musa, A.-A. Salmah, I. Zamri, Sensors 8 (2008) 775.
11. F. Svegl, B. Orel, I. Grabec-Svegl, V. Kaucic, Electrochim. Acta 45 (2000) 4359.
12. E. Rios, P. Chartier, J.-L. Gautier, Solid State Sci. 1 (1999) 267.
13. P.D. Allen, N.A. Hampson, G.J. Bignold, J. Electroanal. Chem. 99 (1979) 299.
14. J. Orehotsky, H. Huang, C.R. Davidson, S. Srinivasan, J. Electroanal. Chem. 95 (1979) 233.
15. I. Nikolov, R. Darkaou, E. Zhechevo, R. Stayanova, N. Dimitrov, T. Vitanov, J. Electroanal.
Chem. 429 (1997) 157.
16. E. Rios, J.-L. Gautier, G. Poillerat, P. Chartier, Electrochim. Acta 44 (1998) 491.
17. S. Ayyappan, J. Philip, B. Raj, Mater. Chem. Phy. 115 (2009) 712.
18. N.K. Singh, R.N. Singh, Ind. J. Chem. 38 (1999) 491.
19. D. Peng, S. Beysen, Q. Li, J. Jian, Y. Sun, J. Jiwuer, Particuology 7 (2009) 35.
20. J. Ponce, J.-L. Rehspringer, G Poillerat, J.-L. Gautier, Electrochim, Acta 46 (2001) 3373.
21. R.N. Singh, N.K. Singh, J.P. Singh, Electrochim. Acta 47 (2002) 3873.
22. J.P. Singh, N.K. Singh, R.N. Singh, Int. J. Hydrogen Energy 24 (1999) 433.
23. R.N. Singh, J.P. Singh, B. Lal, A. Singh, Int. J. Hydrogen Energy 32 (2007) 11.
24. B. Mao, Z. Kang, E. Wang, S. Lian, L. Gao, C. Tian, C. Wang, Mater. Res. Bull. 41 (2006) 2226.
25. R.N. Singh, J.P. Singh, A. Singh, Int. J. Hydrogen Energy 33 (2008) 4260.
26. W.J. Zheng, W.Q. Pang, G.Y. Meng, D.K. Peng, J. Mater. Chem. 9 (1999) 2833.
27. S.Y. Lian, E.B. Wang, L. Gao, Z.H. Kang, D. Wu, Y. Lan, L. Xu, Solid State Commun. 132 (2004)
375.
28. X.M. Liu, S.Y. Fu, H.M. Xiao, Mater. Lett. 60 (2006) 2979.
29. S.A. Patil, V.C. Mahajan, A.K. Ghatage, S.D. Lotke, Mater. Chem. Phys. 57 (1998) 86.
30. Z. J. Zhang, X. Y. Chen, B. N. Wang, C. W. Shi, J. Crystal Growth 310 (2008) 5453.
31. L. G. She, L. L. Ping, R. L. Smith Jr., H. Inomata, J. Mol. Stuct.560 (2001) 87.
32. A. Pradeep, P. Priyadharsini, G. Chandrasekaran, Mater. Chem. Phys. 112 (2009) 572.
33. B. Dong, B.L. He, Y.M. Chai, C.G. Liu, Mater. Chem. Phys. 120 (2010) 404.
34. X. Wang, H. Luo, H. Yang, P.J. Sebastian, S.A. Gamboa, Int. J. Hydrogen Energy 29 (2004) 967.
35. N.K. Singh, S.K. Tiwari, K.L. Anitha, R.N. Singh, J. Chem. Soc. Faraday Trans. 92 (1996) 2397.
36. S.K. Tiwari, K.L. Anitha, R.N. Singh, J. Electroanal. Chem. 319 (1991) 263.
37. C. Iwakura, A. Honji, H. Tamura, Electrochim. Acta 26 (1981) 1319.
38. J.P. Singh, X.G. Zhang, H.-L. Li, A. Singh, R.N. Singh, Int. J. Electrochem. Sci. 3 (2008) 416.
39. B.A. Boukamp, Solid State Ionics 20 (1986) 31.
40. R.N. Singh, B. Lal, M. Malviya, Electrochim. Acta 49 (2004) 4605.
41. J.O.M. Bockris, T. Otagawa, J. Electrochem. Soc. 131 (1984) 290.
42. R.N. Singh, N.K. Singh, J.P. Singh, G. Balaji, N.S. Gajbhiye, Int. J. Hydrogen Energy 31 (2006)
701.
Int. J. Electrochem. Sci., Vol. 7, 2012
4973
43. R.N. Singh, J.P. Singh, H.N. Cong, P. Chartier, Int. J. Hydrogen Energy 31 (2006) 1372.
44. J.P. Singh, R.N. Singh, Ind. J. Chem. 39A (2000) 819.
45. R.N. Singh, J.P. Singh, B. Lal, M.J.K. Thomas, S. Bera, Electrochim. Acta 51 (2006) 5515.
46. M.E.G. Lyons, M.P. Brandon, J. Electroanal. Chem. 641 (2010) 119.
47. S.K. Tiwari, S. Samuel, R.N. Singh, G. Poillerat, J.-F. Koenig, P. Chartier, Int. J. Hydrogen Energy
20 (1995) 9.
48. N. Fradette, B. Marsan, J. Electrochem. Soc. 145 (1998) 2320.
49. K. Fatih, B. Marsan, Can. J. Chem. 75 (1997) 1597.
50. R.N. Singh, J.P. Pandey, K.L. Anitha, Int. J. Hydrogen Energy 18 (1993) 467.
51. J.O.M. Bockris, T. Otagawa, J. Phys. Chem. 87 (1983) 2960.
52. A.I. Krasil’schikov, Zh Foziche Khim 37 (1963) 531.
© 2012 by ESG (www.electrochemsci.org)