Proton-bound dimers of aliphatic carboxamides: gas-phase basicity and dissociation energy
Upload
khangminh22Category
view
2download
0
Synthesis of nanoparticlesin the gas phase
for functional applications
Frank Einar Kruis


Synthesis of nanoparticlesin the gas phase
for functional applications
Vom Fachbereich Elektrotechnik der
Gerhard-Mercator-Universität Duisburg
Zur Erlangung der Lehrbefähigung im Lehrgebiet
Prozeßtechnik nanostrukturierter Materialien
genehmigte Habilitationsschrift
von
Dr.-Ing. Frank Einar Kruis
aus
Bergen op Zoom (Niederlande)


Table of Contents
1. Introduction 1
2. Electronic, optical and magnetic applications 72.1 Microelectronic and optoelectronic applications of
zero-dimensional structures (quantum dots) 72.2 Luminescent nanocrystalline silicon and other materials 112.3 Gas sensors 112.4 Resistors and varistors 122.5 Conducting films 132.6 Capacitive materials 142.7 High-temperature superconductors (HTS) 142.8 Thermoelectric materials 152.9 Optical materials 152.10 Magnetic materials 162.11 Conclusions: Control parameters for properties of functional
applications 18
3. Synthesis methods in the gas phase 193.1 Processes based on homogeneous nucleation in the gas phase 19
3.1.1 Furnace flow reactors 213.1.2 Laser reactors 213.1.3 Laser vaporization of solids 223.1.4 Flame reactors 223.1.5 Plasma reactors 233.1.6 Spark source and exploding wire 233.1.7 Sputtering 243.1.8 Inert gas condensation 243.1.9 Expansion-cooling 25
3.2 Laser ablation of solids 263.3 Electrospray systems 263.4 Spray pyrolysis 273.5 Conclusions: Processes suitable for functional applications 28

4. Physical phenomena in gas-phase synthesis 294.1 Particle formation by nucleation, condensation and coagulation:
application to synthesis in tube furnaces 304.1.1 Theory 314.1.2 Results and discussion 33
4.2 Coagulation and aggregation: a Monte Carlo simulation 364.2.1 Direct Simulation Monte Carlo methods 384.2.2 A Fast DSMC method 414.2.3 Comparison with theoretical solutions for aggregation 434.2.4 Comparison with numerical solutions for coagulation 484.2.5 Case study 1: Chemical reaction in coagulating droplets (microreactors) 504.2.6 Case study 2: Coating of particles with smaller particles by aggregation 52
4.3 Mixing by means of aggregation of charged particles 544.3.1 Theory of bipolar aggregation 564.3.2 Simulation of aggregation of charged aerosols for mixing purposes 584.3.3 Results 60
4.4 Conclusions: Mechanisms relevant for gas-phase synthesis 63
5. Review of synthesis in the gas phase for functionalaplications 65
5.1 Synthesis for microelectronic and optoelectronic applicationsof zero-dimensional structures (quantum dots) 65
5.2 Synthesis of luminescent nanocrystalline silicon 675.3 Fabrication of gas sensors 695.4 Fabrication of conducting films 745.5 Synthesis of high-temperature superconductors (HTS) 745.6 Synthesis of magnetic materials 755.7 Conclusions: Process requirements for selected
functional applications 76
6. Controlling nanoparticle behaviour by use of electricalEffects 79
6.1 Nanoparticle charging using a twin Hewitt charger 806.1.1 Experimental setup 81 6.1.1.1 The twin Hewitt charger 81 6.1.1.2 Setup for measuring charging efficiencies 82

6.1.2 Ion concentration in the charging zone 846.1.3 Charging efficiency 87 6.1.3.1 Effects of frequency and electrical potential 87 6.1.3.2 Effects of length of charging zone and residence time 906.1.4 Particle losses in the charging zone 936.1.5 Discussion 94
6.2 Differential mobility analysis, with outlook at lower pressures 956.3 An electrostatic precipitator suited for investigation of thin
nanoparticle films 1056.4 Conclusions: Instrumentation for controlling nanoparticle
behavior 107
7. Synthesis of PbS and SnOx nanoparticles for functional applications 109
7.1 Synthesis of size-classified PbS nanoparticles in the gas phase 1107.1.1 Experiments 1117.1.2 Analysis of evaporation and sintering mechanisms of PbS 120
7.2 Synthesis of size-classified SnOx nanoparticles in the gas phasefor gas-sensing applications 1247.2.1 Experimental set-up 1257.2.2 Results of structural and electrical characterization 125
7.3 Quantum confinement in size-classified PbS nanoparticles 1337.3.1 Experimental methods 1337.3.2 Results and discussion 134
7.4 Experimental investigation of synthesis of tailoredcomposite nanoparticles in the gas phase 1377.4.1 Experimental methods 1387.4.2 Results and discussion 139
7.5 Conclusions: Synthesis of PbS and SnOx nanoparticles forfunctional applications 144
8. Conclusions 145
Acknowledgements 148
List of references 149

1. Introduction
1
1. Introduction
Nanoparticles have attracted the attention of an increasing number ofresearchers from several disciplines in the last ten years. The term ‘nanoparticle’ cameinto frequent use in the early 1990s together with the related concepts, ‘nanoscaled’ or‘nanosized’ particle. Until then, the more general terms submicron and ultrafineparticles were used. The term nanoparticle is generally used now in materials sciencecommunity to indicate particles with diameters smaller than 100 nm (El-Shall andEdelstein, 1996). The term nanoparticles is used here interchangeably to refer toparticles in aerosols and particles in other situations respectively. A closely related butnot identical concept, ‘cluster’, indicates smaller nanoparticles with less than 104
molecules or atoms, corresponding to a diameter of only a few nanometers.Nanomaterials or nanostructured materials have a characteristic length scale of
less than 100 nm, and therefore also include uni-axially stacked multilayers andcoatings. A further subset can be distinguished in these nanomaterials, i.e. thenanophase materials which have a three-dimensional structure with a domain sizesmaller than 100 nm. Nanophase materials are usually produced by compaction of apowder of nanoparticles. They are characterized by a large number of grain boundaryinterfaces in which the local atomic arrangements are different from those of thecrystal lattice (Weissmüller, 1996).
The small size of nanoparticles, which is responsible for the different properties(electronic, optical, electrical, magnetic, chemical and mechanical) of nanoparticlesand nanostructured materials with respect to the bulk material, makes them suitable fornew applications. Having a size between the molecular and bulk solid-state structures,nanoparticles have hybrid properties which are incompletely understood today,creating a challenge for theoreticians as well. Some examples of these properties arelower melting temperature (Goldstein et al., 1992), increased solid-solid phasetransition pressure (Tolbert and Alivisatos, 1995), lower effective Debye temperature(Fujita et al., 1976), decreased ferroelectric phase transition temperature (Ishikawa etal., 1988), higher self-diffusion coefficient (Horvath et al., 1987), changedthermophysical properties (Qin et al., 1996) and catalytic activity (Sarkas et al., 1993).
‘Nanocomposites’ consist of nanoparticles dispersed in an continuous matrix,creating a compositional heterogeneity of the final structure. The nanocompositesusually involve a ceramic or polymeric matrix and are not restricted only to thin films.These materials show interesting properties such as alloying of normally immiscible
2
materials (Linderoth and Moerup, 1990) and higher critical superconductor transitiontemperature (Goswami et al., 1993).
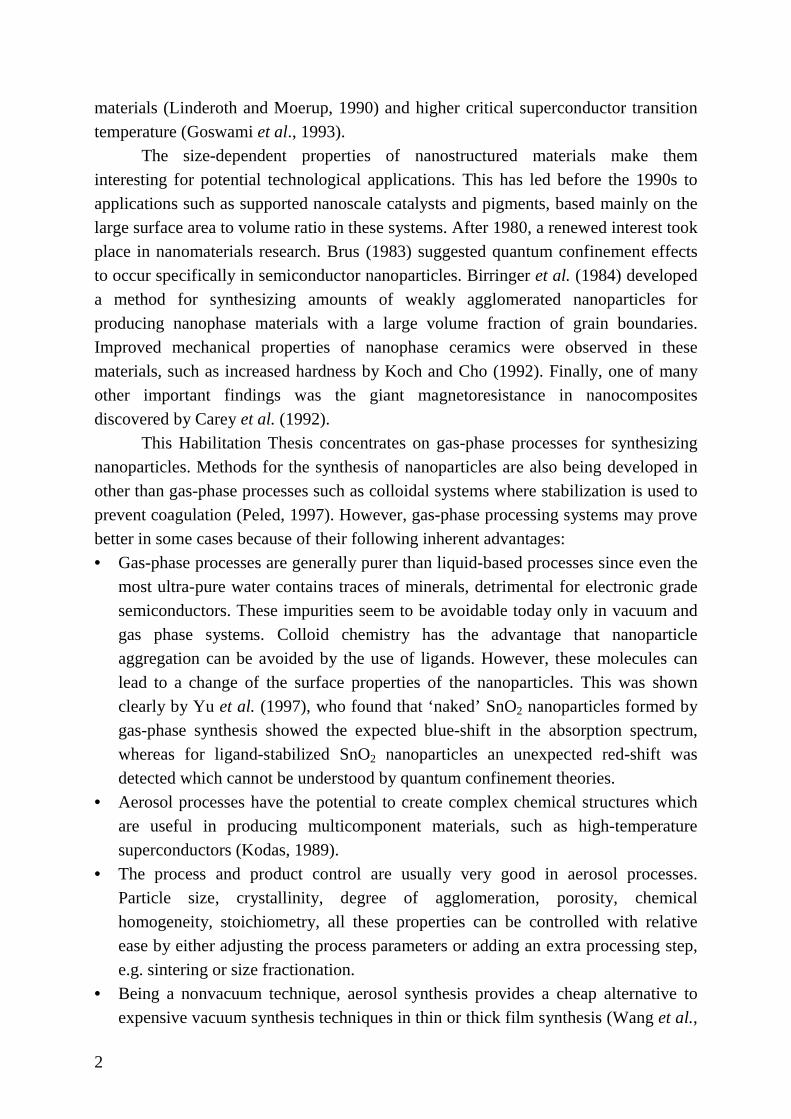
The size-dependent properties of nanostructured materials make theminteresting for potential technological applications. This has led before the 1990s toapplications such as supported nanoscale catalysts and pigments, based mainly on thelarge surface area to volume ratio in these systems. After 1980, a renewed interest tookplace in nanomaterials research. Brus (1983) suggested quantum confinement effectsto occur specifically in semiconductor nanoparticles. Birringer et al. (1984) developeda method for synthesizing amounts of weakly agglomerated nanoparticles forproducing nanophase materials with a large volume fraction of grain boundaries.Improved mechanical properties of nanophase ceramics were observed in thesematerials, such as increased hardness by Koch and Cho (1992). Finally, one of manyother important findings was the giant magnetoresistance in nanocompositesdiscovered by Carey et al. (1992).
This Habilitation Thesis concentrates on gas-phase processes for synthesizingnanoparticles. Methods for the synthesis of nanoparticles are also being developed inother than gas-phase processes such as colloidal systems where stabilization is used toprevent coagulation (Peled, 1997). However, gas-phase processing systems may provebetter in some cases because of their following inherent advantages:• Gas-phase processes are generally purer than liquid-based processes since even the
most ultra-pure water contains traces of minerals, detrimental for electronic gradesemiconductors. These impurities seem to be avoidable today only in vacuum andgas phase systems. Colloid chemistry has the advantage that nanoparticleaggregation can be avoided by the use of ligands. However, these molecules canlead to a change of the surface properties of the nanoparticles. This was shownclearly by Yu et al. (1997), who found that ‘naked’ SnO2 nanoparticles formed bygas-phase synthesis showed the expected blue-shift in the absorption spectrum,whereas for ligand-stabilized SnO2 nanoparticles an unexpected red-shift wasdetected which cannot be understood by quantum confinement theories.
• Aerosol processes have the potential to create complex chemical structures whichare useful in producing multicomponent materials, such as high-temperaturesuperconductors (Kodas, 1989).
• The process and product control are usually very good in aerosol processes.Particle size, crystallinity, degree of agglomeration, porosity, chemicalhomogeneity, stoichiometry, all these properties can be controlled with relativeease by either adjusting the process parameters or adding an extra processing step,e.g. sintering or size fractionation.
• Being a nonvacuum technique, aerosol synthesis provides a cheap alternative toexpensive vacuum synthesis techniques in thin or thick film synthesis (Wang et al.,

1. Introduction
3
1990). Furthermore, the much higher deposition rate as compared to vacuumtechniques may enable mass production.
• An aerosol droplet resembles a very small reactor in which chemical segregation isminimized, as any phases formed cannot leave the particle (Kodas, 1989).
• Gas-phase processes for particle synthesis are usually continuous processes, whileliquid-based synthesis processes or milling processes are often performed in abatch form. Batch processes can result in product characteristics which vary fromone batch to another.
One important field of research deals with aerosol-assisted processes used forfilm synthesis in which liquid droplets dispersed in a gas are used as source andtransport vehicles to the substrate. These processes are called aerosol-assistedchemical vapor deposition (AACVD) (Xu et al., 1994), aerosol metal-organic CVD(A-MOCVD) (Fröhlich et al., 1995), the pyrosol process (Blandenet et al., 1981) andaerosol CVD (Tourtin et al., 1995). Common to these processes is the evaporation ofmicron-sized droplets in proximity to the substrate to produce epitaxial orpolycrystalline films (Jergel et al., 1992). Small nanocrystallites might be found in thefilms but are not formed in the gas phase, therefore these processes are not consideredhere.
In this Habilitation Thesis, various processes and techniques which can beapplied for the synthesis of functional nanomaterials are described. By using the word‘functional’, the classical distinction which is made in ceramics between structural andfunctional applications is applied. The structural applications are based on themechanical properties of the nanostructured or nanophase materials, leading to, e.g.,superplastic ceramics or extremely hard metals, using the nanoparticles rather aspassive basic building units. Functional applications however rely on a transformationof external signals, such as the filtering of incident light, the change of electricalresistance in different gas concentrations and luminescent behaviour when electricallyactivated. The functional applications dealt with in this work are mainly electronic andoptical.
In order to clarify the methodological approach followed here, the variousdisciplines involved are shown in Fig. 1.1. The functional applications all base on thespecial properties of nanoparticles, which are studied in physics, materials science andchemistry. Essential for practical application are the synthesis and handlingtechniques, here in the gas phase. The handling of nanoparticles, which is bringing theproduced nanoparticles in the desired condition for the application, is an oftenunderestimated but essential field. Examples of handling techniques are post-synthesisconditioning such as controlled oxidation, crystallisation and mixing but also thedeposition onto suitable substrates. Here, the input of several other disciplines is

4
essential, such as aerosol science for understanding particle behavior, materials sciencefor understanding materials properties, aerosol instrumentation for process monitoringand process technology for process control and optimization.
Fig. 1.1phase s
The
• Chaspecare d
• Chathe g
• ChawhicThetechstepthe agglmodcomseve
. The various disciplines contributing to functional applications based on gas-ynthesized nanoparticles.
organization of this Habilitation Thesis is as follows:
pter 2 gives an introduction into functional applications which are based on theial properties of nanoparticles. Electronic, optical and magnetic applicationsiscussed.
pter 3 gives an overview of the current synthesis methods of nanoparticles inas phase.
pter 4 concentrates on several physical phenomena occurring in the gas phaseh are important for specific synthesis and handling methods of nanoparticles.
physical processes taking place during the evaporation-condensation synthesisnique applied in this work are modeled in order to understand the synthesis and to facilitate synthesis of other materials. Aerosols are inherent instable, asconstituting particles tend to collect in flocs, so-called aggregates oromerates, when the temperature is below the melting point. This process iseled by a Monte Carlo simulation technique in order to be able to describeplex systems, such as multi-component or multidimensional systems withral variables, e.g. particle size and charge. The method is useful for describing
Properties of nanoparticles
Functional applications
Gas-phase synthesisand handling
Aerosol science
Aerosol instrumentation
Process technology
Materials science

1. Introduction
5
the mixing of charged nanoparticles, which is an example of an handling techniqueand which is also studied experimentally in Chapter 7.
• Chapter 5 reviews the various works done on the synthesis of nanoparticles in thegas phase for functional applications, arranged so as to emphasize the applicationrather than the method of preparation. The requirements for gas-phase processessuitable for functional applications are stated.
• Chapter 6 describes experimental techniques which are important for themeasurement and control of nanoparticle aerosols. These methods base on thetransport of charged nanoparticle in an electric field. For obtaining chargednanoparticles, a new nanoparticle charger has been developed and characterized.Differential mobility analysis allows to fractionate charged nanoparticles accordingto their electrical mobility. This can be used for a direct particle size distributionanalysis or for producing almost equal-sized nanoparticles (‘monodispersity’). Itspotential for application at sub-atmospheric pressures will be investigated. Anelectrostatic precipitator suited for investigation of the electrical properties of thinnanoparticle films will be described.
• Chapter 7 describes the synthesis of PbS and SnOx nanoparticles which apply withthe requirements for use in functional applications. Both materials are IV-VIsemiconductors, where PbS is mainly interesting for its quantum confinementeffects and SnOx for its application in gas sensors. The quantum confinementeffects in PbS are shown by means of a shift in the optical absorption spectrum.Furthermore, an experimental technique which allows the creation of nanoparticlepairs composed of two different chemical components is described. This can beused for the controlled doping of gas sensors.
• Chapter 8 summarizes and concludes the work.

6

2. Electronic, optical and magnetic applications of nanoparticles
7
2. Electronic, optical and magneticapplication of nanoparticles
In this chapter, the use of nanoparticles for electronic, optical and magneticapplications is discussed. A broad spectrum of materials including insulators,semiconductors, superconductors, metals and alloys, optical, and artificially structuredmaterials can be used for these purposes. Most applications use films composed ofnanoparticles, supported by a substrate material. Part of the material presented here hasbeen published (Kruis et al., 1998d). In this chapter the main phenomena makingspecific applications possible are reviewed, while in Chapter 5 examples of gas-phasesynthesis methods aiming at these applications are given.
2.1 Microelectronic and optoelectronic applications of zero-dimensional structures (quantum dots)
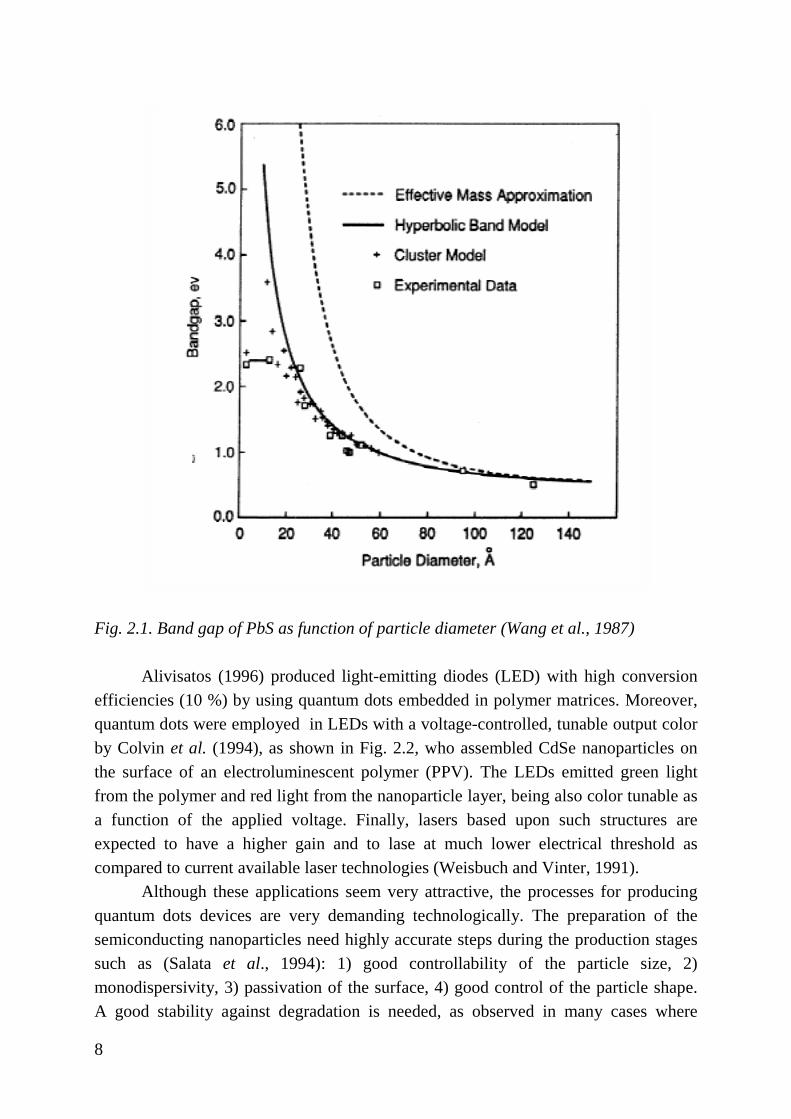
Nanoparticles have been suggested recently for various potential applications inelectronics where quantum confinement effects may be of advantage. When electronsare confined to a small domain such as a nanoparticle the system is called a ‘quantumdot’ or zero-dimensional (0-D) structure. Then the electrons are behaving like‘particles-in-a-box’ and their resulting new energy levels are determined by quantum‘confinement’ effects. These new energy levels give rise to a modification of theoptoelectronic properties as compared to the corresponding properties determined bythe bulk material electronic structure (Brus, 1983; Yoffe, 1993). As a result, discreteenergy levels are needed to describe the electron excitation and transport in quantumdots. Quantum confinement effects lead for example to higher energy level transitionsas compared to the bulk material observed as a shorter wavelength optical absorptionedge, indicated by a spectral ‘blue shift’. An example is given in Fig. 2.1.
Quantum dots can be used also to produce light emitters of various colors by‘band gap tuning’ using particle size effects rather than the current complex techniquesof synthesizing compound semiconductors (Service, 1996). Another advantage of 0-Dsemiconductor structures stems from the very long life time of electrons in the excitedstates, which is an important requirement in laser optical applications (Weisbuch andVinter, 1991).
8
Fig. 2.1. Band gap of PbS as function of particle diameter (Wang et al., 1987)
Alivisatos (1996) produced light-emitting diodes (LED) with high conversionefficiencies (10 %) by using quantum dots embedded in polymer matrices. Moreover,quantum dots were employed in LEDs with a voltage-controlled, tunable output colorby Colvin et al. (1994), as shown in Fig. 2.2, who assembled CdSe nanoparticles onthe surface of an electroluminescent polymer (PPV). The LEDs emitted green lightfrom the polymer and red light from the nanoparticle layer, being also color tunable asa function of the applied voltage. Finally, lasers based upon such structures areexpected to have a higher gain and to lase at much lower electrical threshold ascompared to current available laser technologies (Weisbuch and Vinter, 1991).
Although these applications seem very attractive, the processes for producingquantum dots devices are very demanding technologically. The preparation of thesemiconducting nanoparticles need highly accurate steps during the production stagessuch as (Salata et al., 1994): 1) good controllability of the particle size, 2)monodispersivity, 3) passivation of the surface, 4) good control of the particle shape.A good stability against degradation is needed, as observed in many cases where

2. Electronic, optical and magnetic applications of nanoparticles
9
properties of the nanoparticles vary with time. A current technological approach tocircumvent the inherent reactivity and instability of nanoparticles is by imbeddingthem in a glass (Ohtsuka et al., 1992) or in a semiconductor having a wider band gap(Danek et al., 1994). These nanocomposite structures can then be used in real lifeoptical and electrooptical applications.
Fig. 2.2.controlle
Enalso of gproducinsilicate gdispersedbased onthe refracfields (Blight, ena
Electroluminescence as function of current for use in LEDs with a voltage-d, tunable output color (Colvin et al., 1994).
hancement of the nonlinear optical properties by quantum size effects arereat interest today. This effect has been applied already commercially for
g optical cut-off color filters based on CdSxSe1-x nanoparticles embedded inlasses. It is expected also that nanoparticles such as CdS, CdSe, GaAs and Si in glasses will have applications in fast optical switches and optical fibers the nonlinear optical behavior (Yoffe, 1993). In nonlinear optical materials,tive index can be changed either by carrier injection or by applying electrical
rus, 1991). This change in the refractive index allows electronic modulation ofbling for instance faster electro-optical switching as compared to electronical
10
switching.Another potential application of quantum dots is the fabrication of optical
memories. A 3-D array of quantum dots which are addressed optically can pack in thesame volume much larger amounts of information than current planar-basedmicroelectronic memory devices. This can be done for instance by spectral holeburning (Peyghambarian et al., 1996), in which those quantum dots in resonance witha specific laser wavelength will be excited and thus ‘bleach’. This enables thus‘writing’ a ‘0’ or a ‘1’ memory ‘state’ with a resolution smaller than the size of thelaser spot.
For semiconductor applications other than optical, the nanoparticles should becontacted electrically efficiently. This forms one main difficulty for producingelectronic devices based on quantum dots. Since attaching electrical leads to an arrayof quantum dots is a formidable technological task, one way of making an efficientcontact is by using a semiconductor structure consisting of an ensemble of quantumdots. The voltage-tunable LED described earlier is a successfully implementedexample which uses a matrix of quantum dots. Another example of efficient contactscan be found in photovoltaics. Hodes et al. (1987) measured photocurrents arisingfrom a film consisting of CdSe nanoparticles on glass and reported quantum effects.To allow conversion of significant quantities of light into an electrical current forobtaining an efficient solar cell, a rather ‘thick’ film up to twenty monolayers ofparticles had to be deposited. Increasing the contact area between nanoparticles andelectrode to increase the signals is possible by depositing the nanoparticles on a veryporous TiO2 electrode. (Weller, 1993).
In microelectronics, the need for faster switching times calls for a reduction inthe size of the electronic components. At present, one switching cycle in a transistorgives rise to the movement of many thousands of electrons, requiring a considerableamount of switching energy and producing excessive heat which can hardly bedissipated in high-frequency applications. This calls for developing single-electrondevices, in which the switching occurs with the motion of only a single electron. Sucha device may be realized by a quantum dot in which the charge of an added electroneffectively blocks the flow of other electrons by the so-called ‘Coulomb blockade’.Both switching, which performs logic operations, and storage of information arepossible with these devices. Here again, one finds that electrical contacts are very hardto produce (Lüth, 1995). Such contacts were nevertheless obtained by Bezryadin et al.(1997), using an liquid-phase electrostatic trapping method of Pd nanoparticlesbetween nanoelectrodes with a 4 nm gap.
2.2 Luminescent nanocrystalline silicon and other materials

2. Electronic, optical and magnetic applications of nanoparticles
11
Porous structures and other nanometer sized particles have found in the lastdecade a very important potential application for electrolumiscent silicon baseddevices. The interest in luminescent Si is due to the desire for integration ofoptoelectronic devices, based now mainly on III-V semiconductors which are not yetintegrable monolithically with the dominant Si microelectronics (Kanemitsu, 1995).Light-emitting Si hence would open the way to optical and electrical functionality onone integrated monolithic Si chip. Silicon electroluminescence, in which theluminescence is controlled electrically, would enable also to implement new devicessuch as light-emitting diodes, with voltage tuned color, and also many otheroptoelectronic integrated circuits concepts. Being an indirect-gap semiconductor inwhich interband transitions need phonons (a quantum of energy associated with atomicvibrations), Si in its bulk form is not luminescent, as radiative transitions are of verylow probability. Takagi et al. (1990) observed visible luminescence from Sinanocrystals at room temperature although the phenomenon was first observed inporous silicon. Until now, there is no generally accepted mechanism for visibleluminescence although there are indications that the light absorption by thenanoparticle is influenced by quantum effects and the photoluminescence is dominatedby the electronic states of the surface (Kanemitsu, 1995, Prokes, 1996).
Seraphin et al. (1996) reported that unpassivated Si nanoparticles exhibit novisible photoluminescence. As the particles age in air, the surface becomes passivatedgradually with SiO2 and exhibits a strong orange emission behavior. Koch andPetrova-Koch (1996) even reported luminescence from SiO2 nanoparticles. Othernanoparticles of indirect-gap semiconductors such as Ge (Kanemitsu et al., 1992) andSiC (Mimura et al., 1994) showed also luminescence in the visible.
2.3 Gas sensors
Gas sensors have nowadays many established production technologies. It seemshowever that this field can take advantage from the nanoparticles recent developmentsas well. A gas sensor consist quite generally of a material with measurable physicalproperties such as electrical or optical, which change when a gas is present. A solidstate chemical sensor selectively converts microscopic chemical interactions into ameasurable electrical signal. Sensors should possess selective and reversible sensingproperties and be compatible with the transducer device (Holtz et al., 1996). Thesimplest ‘nanomaterials’ based sensor concept involves measuring the changes in theelectrical resistance of a nanocrystalline metal when exposed to hydrogen. Volkeninget al. (1995) used palladium nanoparticles (10-15 nm) for hydrogen sensing, since thePd-H system is well understood in terms of the dissociative reactions of H2 at the Pd

12
surface and the diffusive properties of H2 into Pd. They found the response in thenanocrystalline material to be faster as compared to palladium with conventionalmicron-size particles, due to the smaller diffusion distances.
Traditionally, semiconducting oxides such as SnO2, ZnO and Fe2O3 are usedextensively in gas sensor technology (Göpel, 1996). Usually, the sensor is constructedas a porous sintered ceramic body, heated between 300 °C and 700 °C. The sensingbehavior appears to be governed by the adsorption of oxygen in the neck regionsbetween the grains. A positive space charge, also called depletion layer, develops inthe oxide layer as electrons transfer to the adsorbed oxygen, and a negative chargeaccumulates on the surface. Reducing gases can remove some of the O2- ions from thesurface, thereby increasing the electrical conductivity (Moulson and Herbert, 1990).
The sensitivity of gas sensors can be increased by doping, usually with noblemetal catalysts such as platinum, rhodium or palladium. Labeau et al. (1993, 1994)investigated the sensitivity of a nanocrystalline SnO2 gas sensor doped with Pt and Pdnanoparticles. These particles probably act as a catalyst for the adsorption of CO andethanol molecules, leading to a lower activation energy of the surface reactions. In thework of Gautheron et al. (1993), the CO sensitivity was increased by a factor of 30 byadding Pd nanoparticles.
2.4 Resistors and varistors
Nanometer particles have found new applications also in the production ofresistors and varistors. Granular films consisting of small conducting particlesembedded in an insulating matrix of ceramic or glass exhibit a great variability of theelectrical conductivity. It was also shown that by a proper control of the volumefraction of W in Al2O3 stable, high-resistance films with a low temperature coefficientof resistivity(TCR) can be produced (Abeles et al., 1975). When the particle size canalso be controlled, a wider range of the electrical transport properties is attainable,making these materials suitable for thick film resistors production. The electricalresistance is modeled here by percolation and quantum effects such as electrontunneling (Kundu and Chakravorty, 1996). An example of thick film resistors whoseresistivities can be controlled by changing the nanoparticle size is the LaB6
nanoparticle-glass nanocomposite system, which is compatible with copper hybridintegrated circuits (Ito et al., 1991).
Since varistors are voltage-dependent resistors, characterized by a very lowresistance at high voltage, they are used for protection of low-power circuits fromhigh-voltage transients. They are prepared from sintered ceramic materials such asZnO or SiC with some added minor constituents. The resistance is assumed to becontrolled by either direct grain-boundary contacts or by intergranular insulating layers

2. Electronic, optical and magnetic applications of nanoparticles
13
between the conducting grains. The use of nanoparticles with their large volume ofgrain boundaries in varistors is expected to improve their properties. Brankovic et al.(1994) investigated ZnO based varistors. Using particles with sizes below 100 nm, avaristor with more homogeneous phase distribution and microstructure was obtained,resulting in good nonlinear electrical characteristics. Viswanath et al. (1995) appliedZnO nanoparticles of 3 - 10 nm. Apart from good nonlinear characteristics, thenormalized breakdown voltage was increased by a factor of 20 in comparison tocoarse-grained ZnO varistors.
2.5 Conducting films
Nanometer structured, polycrystalline conducting thin films, have foundpotential also in the production of transparent conductive electrodes forphotoconductor and solar cells applications. Polycrystalline thick films made ofclosely packed crystalline grains are often used for optoelectronic films. They are usedfor instance to conduct electrical charges in devices such as solar cells, displays andother applications where a large surface area is needed and epitaxial films are notfeasible. These polycrystalline films are nowadays routinely made by spraytechnologies which have substantial advantages being inexpensive, using only smallamounts of material and with high deposition rates (Service, 1996). However,conventional spraying techniques produce a relatively rough film surface with manygaps due to the micrometric size of the droplets. These gaps might reach from thesurface of the film down to the substrate decreasing thereby the electrical conductivityof the films. By spraying a colloid of 3 nm nanoparticles on a heated substrate, Pehntet al. (1995) produced very smooth conducting thin CdTe films without gaps and witha roughness smaller than 5 nm, for use in solar cells.
Thin films of wide optical band gap oxides such as SnO2 and In2O3 which aretransparent in the visible spectral region are applied in many areas, e.g. as electrodesand anti-reflection coatings in solar cells, photodetectors and charge-coupled imagingdevices. Transparent conducting films require high transmission in the visible regionand a high or even metallic-like electrical conductivity (Chopra et al., 1983). For thisend, inhomogeneities in the film created by the presence of large particles, causingdetrimental light absorption and scattering in the visible region, can be minimized bypreparing films from nanoparticles. Another advantage obtained with nanomaterials iscontrol on the absorption characteristics by particle size variation leading to quantumconfinement effects as described previously. Zhao and Pan (1994) showed that the IRabsorption peaks of a film composed of ZnO nanoparticles can be changed by varyingthe particle size.
Another potentially applicable phenomenon is the electrical bistability of a thin
14
layer of Ag nanoparticles sandwiched between two layers of a conducting polymer. Upto a certain threshold voltage, no current flows while above it the conductanceincreases by a factor of 107 rendering the film conductive. These films can thus haveswitching applications in electronics. (Gao et al., 1995)
2.6 Capacitive materials
Dielectric elements based on nanometer structures are of recent interest due tothe reduction in capacitance caused by the continuing scaling down of dynamicrandom access memories (DRAMs). Since materials with a high dielectric constantcan store more electrical charges in capacitors, materials with ever larger dielectricpermittivities are sought for the shrinking DRAMs. One method for increasing thedielectric permittivity is by dispersing conductive particles in a dielectric matrix.Thedissipation factor becomes, in this case however, too large. Kundu and Chakravorty(1995) showed that 2-8 nm Ag nanoparticles in a lead zirconate titanate (PZT) matrixhas a high dielectric permittivity with low dissipation factor. The smaller particles ledto lower dielectric permittivities but on the other hand improved the dissipation factor.Vezzoli et al. (1994) showed from the percolation theory of dielectrics that an optimaltopology for high dielectric nanocomposites consists of ellipsoidal metal particles witha small interparticle spacing in the insulating matrix. A high dielectric constant of5000 was obtained by embedding elongated Au nanoparticles with a length of 80 nmand a width of 30 nm in a matrix of SiO2.
2.7 High-temperature superconductors (HTS)
Nanoparticles are currently suggested as a solution to ‘flux pinning’improvement in HTS devices. The problem occurs if the magnetic flux entering theHTS material is not distorted or ‘pinned’ by suitable defects. Then, the material loosesits superconducting properties. In general, non-superconducting particles can act asflux pinning centers in a superconductive material. Nanoparticles can be used asdefects when added to the superconducting material enhancing flux pinning, andincreasing thereby the critical current density. Chadda et al. (1991) reported that small-grained , 25-50 nm precursor particles of YBa2Cu3O7-x and CuO were necessary toobtain YBa2Cu4O8, which upon heat treatment developed YBa2Cu3O7-x with CuO fluxpinning centers. Takao et al. (1996) added BaZrO3 nanoparticles to an HTS material,YBa2Cu3O7, and obtained an increase of more than one order of magnitude in thecritical current density.
2.8 Thermoelectric materials

2. Electronic, optical and magnetic applications of nanoparticles
15
Nanoparticles can be used also for producing thermoelectric materials. Thethermoelectric effect creates a voltage difference between two conductor junctionskept at different temperatures. This effect is used mainly for thermocouple-typesensors. Kizaki et al. (1993) produced thermoelectric thin films of an nanometric-structured Fe-Si alloy. Using FeSi2+x (0<x<1) nanoparticles allowed film deposition atlow temperatures. A homogeneous film of mixed Fe and SiO nanoparticles of some 10nm showed after thermal treatment a high Seebeck coefficient of -1400 µV K-1.
2.9 Optical materials
Inorganic pigments such as TiO2 are used to absorb and scatter UV radiation(Parker, 1996). The particles normally used for pigments, however, impart anunfavorable whiteness to the protected surface. Since the scattered light intensity is afunction of the wavelength of the incident light and the particle diameter, an optimalparticle size can be found which attenuates UV but only slightly attenuates the visiblelight. This particle size happens to be located in the nanometer size range.Nanoparticles in a suitable dispersion are already commercially used for solarprotection creames and in films which protect plastics against color degradation.Another successful development is the use of pigments as an active scattering mediumin a semiconducting polymer. Hide et al.(1996) was able thus to obtain laser emissionfrom a semiconducting polymer, MEH-PPV, by incorporating TiO2 nanoparticles inthe polymeric medium. The random scattering by the nanoparticles significantlyincreases the path length traversed by the emitted light, and lasing occurs if gain bymultiple scattering exceeds loss by absorption.
Another optical phenomenon uses electrochromism in nanomaterials. Inelectrochromic materials the optical properties can be altered reversibly by applying anelectric field. Windows made from these materials allow the control of solar energyinflow into buildings and are used also to produce mirrors with a variable reflectanceand nonemissive displays with a high-contrast. Estrada et al. (1988) showed that thesolar transmittance of a NiOxHy film with a grain size of about 10 nm could bechanged between 29 and 74 %. Chen et al. (1995) showed that NiO films consisting of5-10 nm sized grains have good electrochromic characteristics and that theirperformance becomes poorer with increasing grain size. The large number of grainboundaries is thought to play an important role in the transport of the alkali metal ions,which are responsible for the coloring, into the grains.
2.10 Magnetic materials
16
Magnetic nanoparticles approach the size of a single magnetic domain, in whichthe magnetic spins are aligned all to produce a magnetic moment in one direction. Theparticle size for single-domain formation in the ferromagnetic elements Fe, Co and Niis typically several tens of nanometers. For applications using high density magneticrecording materials a high coercivity (representing the resistance to demagnetization)and a high magnetization are essential. It was shown that a maximum value for thecoercivity is obtained for nanocrystalline magnetic materials with crystallite in sizeclose to the single magnetic domain. Crystallite sizes smaller and larger than themagnetic domain lead to a sharp decrease in the coercivity. Fe powder with acrystallite size of 13 nm showed a coercivity of 900 Oe in comparison with 10 Oe inbulk Fe (Gangopadhyay et al., 1992). Greatly enhanced values of the coercivity occurin ferromagnetic nanometer-sized metal particles embedded in an insulating oxidefilm. Xiao and Chien (1987) reported for a Fe-SiO2 nanocomposite magneticcoercivities as high as 2500 Oe.
In contrast to hard magnetic materials, soft magnetic materials need the otherextreme, i.e., very low coercivities. Typical examples are FeSi and FeNi alloys, ferritesand garnets. They are used in power transformers, magnetic recording heads andmicrowave applications. Until ten years ago, relatively coarse-grained alloys wereused since smaller grain sizes caused an increase in the coercivity. It was foundhowever that a maximum in the coercivity vs. grain size curve occurs at about 100 nm(Fig. 2.3). For smaller particles then the coercivity decreases steeply. An alloy with 10- 20 nm nanocrystals embedded in an amorphous phase shows very low values for thecoercivity. Additional useful properties of these materials are very low eddy-currentlosses and good high-frequency properties. (Yoshizawa et al., 1988, Yamauchi andYoshizawa, 1995).
Nanocomposites have also good potential in magnetic refrigeration technology(Zachariah et al., 1995) based on the magnetocaloric effect. Bulk magnetic materialsshow usually a decrease in magnetization upon temperature increase and limits thetemperature range in one refrigeration cycle. Superparamagnetic nanoparticles in anon-magnetic host can overcome this limitation by combining the highermagnetization of ferromagnets with the higher magnetocaloric effect of paramagnets.Zachariah et al. (1995) found a superparamagnetic behavior for 5-10 nm Fe2O3
particles embedded in much bigger SiO2 particles.

2. Electronic, optical and magnetic applications of nanoparticles
17
Fig. 2.3. Dependence of coercivity on crystallite size for various soft magnetic alloys(Herzer, 1990).
A novel important property found in recent years for nanocomposites is thegiant magnetoresistance (GMR) effect. This is the phenomenon of a large decrease inthe electrical resistivity of certain materials when exposed to a magnetic field. Theresistivity-temperature change can be up to 80 % as compared to only a few percent inregular metals. Its applications are for magnetic sensors and for new storage deviceswith very high density. First discovered in magnetic multilayers, it was also found inthe granular Co-Cu system, in which ferromagnetic Co nanocrystals are dispersed in anonmagnetic Cu matrix (Xiao et al., 1992). The magnetic field aligns theferromagnetic domains, and reduces the scattering of electrons, thereby decreasing theelectric resistivity. GMR is observed in immiscible metals, such as Co-Cu, Fe-Ag, Fe-Cu, Fe-Au and Co-Ag. The smaller the particle size, the bigger the GMR effect is. The

18
effect is highest near the percolation threshold (Wang and Xiao, 1994).
2.11 Conclusions: control parameters for properties of functionalapplications
As shown at length in this chapter, there are many parameters influencing theproperties of functional applications based on nanoparticles. These are:• Mean particle size• Width of the particle size distribution• Crystalline properties, such as the crystal phase and the size of the crystallites• Chemical composition, e.g. deviation from stoichiometry• Amount of impurities present in the nanoparticles or on the surface• ‘Packing’ of the nanoparticles, e.g. intimately contacting (nanophase materials),
forming a porous film or with sintered connections between them (‘necks’)• Mixing with other material, e.g. imbedded in a matrix (glass, ceramic material or
polymer) or in close contact with other nanoparticles (e.g. SnO2 gas sensors dopedwith noble metal nanoparticles)
Depending on the application, one or more of these parameters should be controllable.It is the process which yields these properties. Gas-phase processes, although havingsome drawbacks, have a high level of control. The different gas-phase synthesismethods will be described in the next chapter.
A review of synthesis of nanoparticles in the gas phase for electronic, optical andmagnetic applications
19
3. Synthesis methods of nanoparticles in thegas phase
The synthesis methods for nanoparticles can be divided into three main groups.The first group comprises the liquid-phase methods, which apply chemical reactions insolvents. This leads to colloids, in which the nanoparticles formed can be stabilizedagainst aggregation by surfactants or ligands. The second group consists of methodsbasing on surface growth under vacuum conditions. Diffusion of atoms or smallclusters on suitable substrates can lead to island formation, which can be seen asnanoparticles. An important example is Stranski-Krastanow growth, which is used forgrowing III-V quantum dots. The last group, gas-phase synthesis, is the subject of thisChapter.
Most synthesis methods of nanoparticles in the gas phase are based onhomogeneous nucleation in the gas phase and subsequent condensation andcoagulation. The ablation of a solid source with a pulsed laser can also yieldnanoparticles, but the formation mechanism is at present not very clear. A micron-sized aerosol droplet may also yield nanoparticles by evaporating a solute-containingdroplet. Electrospray systems are often applied as droplet generators, as they producevery small droplets being quite monodisperse in comparison to other spray processes.Additionally, droplet explosion due to an electrical charge which exceeds the Rayleighlimit during evaporation may yield even smaller droplets. Finally, initiatinghomogeneous nucleation inside aerosol droplets can result in many nanosized nuclei inthe droplet, which upon drying will yield nanoparticles. This is, in fact, not a formationmechanism in the gas phase but for sake of completeness it will be shortly discussed inthis Chapter, as this so-called spray pyrolysis is a well-known aerosol synthesis route.In the following sections these methods will be described in detail. Part of this materialhas been published (Kruis et al., 1998d). A preview of the gas-phase synthesismethods is shown in Fig. 3.1.
3.1 Processes based on homogeneous nucleation in the gas phase
Several methods with which condensable monomers are produced will be dealtwith hereby. The generation of nanoparticles from the vapor phase requires theestablishment of supersaturation. This is made possible by physical or chemicalmethods. The physical methods involve some form of cooling of the monomers, byexpansion, by mixing with a cooler gas or by heat transfer to the surroundings.

20
Fig. 3.1. Schematic view of different synthesis methods.

A review of synthesis of nanoparticles in the gas phase for electronic, optical andmagnetic applications
21
Supersaturation can be achieved also by chemical reactions which produce anonvolatile condensable product. These reactions are usually decomposition reactionsinitiated by a rise in temperature and used extensively in laser and flame reactors.
Various heating and evaporation methods of interest will be dealt with in thenext section. Furthermore, methods for rapidly cooling the vapor will be describedbecause fast cooling processes are especially important when very small particles haveto be synthesized and when the formation of hard agglomerates has to be avoided.
3.1.1 Furnace flow reactors
Oven sources are the simplest systems to produce a saturated vapor forsubstances having a large vapor pressure at intermediate temperatures up to about1700°C. A crucible containing the source material is placed in a heated flow of inertcarrier gas. This has the disadvantage that the operating temperature is limited by thechoice of crucible material and that impurities from the crucible might be incorporatedin the nanoparticles. Nanoparticles are formed by subsequent cooling, such as naturalcooling or dilution cooling. For very small particles a rapid temperature decrease isneeded which can be achieved by the free jet expansion method described later.Another method is cooling in a turbulent jet (Bartz et al.,1987). Materials with too lowvapor pressure for obtaining appreciable particle density have to be fed in the form ofsuitable precursors, such as organometallics or metal carbonyls, in the furnace. Thesedecompose in the oven to yield a condensable material. Using furnace flow reactors,elemental nanoparticles such as Ag (Scheibel and Porstendorfer, 1983) and Ga(Deppert et al., 1996) and also compounds such as PbS (Kruis et al., 1996) can beobtained.
3.1.2 Laser reactors
In the laser pyrolysis technique, being a special class of laser processingtechniques (Peled et al, 1996), a flowing reactant gas is heated rapidly with an IR lasersuch as a cw CO2 laser. The source molecules are heated selectively by absorption ofthe laser beam energy, whereas the carrier gas is only indirectly heated by collisionswith the reactant molecules. A gas phase decomposition of the reactants takes placedue to the temperature increase and supersaturation is created. As an example, SiH4
pyrolysis results in Si nanoparticle formation (Kruis et al., 1998b) and Fe(CO)5
decomposition leads to Fe nanoparticles (Majima et al., 1994). The main advantage oflaser-heating in gas-flow systems is the absence of heated walls which reduces thedanger of product contamination.

22
UV lasers can be used to obtain photochemical dissociation. Tamir and Berger(1995) showed that SiH4 can be dissociated by a two-photon absorption of an ArFexcimer laser beam with a wavelength of 193 nm, forming nanoparticles.
3.1.3 Laser vaporization of solids
This technique uses a laser which evaporates a sample target in an inert gasflow reactor (Powers et al., 1982). The source material is locally heated to a hightemperature enabling thus vaporization. The vapor is cooled by collisions with theinert gas molecules and the resulting supersaturation induces nanoparticle formation.Kato (1976) used a continuous-wave CO2 laser with a power of 100 W. Nanoparticlesbetween 6 and 100 nm of many complex refractory oxides such as Fe3O4, CaTiO3 andMg2SiO4 were synthesized under an inert gas pressure of 1 mbar to 5 bar frompowders, single crystals or sintered blocks. Nanocomposites can also be produced, asshown e.g. by Chow et al. (1989). They evaporated simultaneously a metallic and aceramic target by a cw CO2 laser creating a composite film close to the target. Thematrix consisted of Al and the dispersed phase consisted of amorphous SiO2 fiberswith diameters between 25 and 120 nm.
3.1.4 Flame reactors
Nanoparticles are produced by employing the flame heat to initiate chemicalreactions producing condensable monomers. The flame route has the advantage ofbeing an inexpensive method, however usually it yields agglomerated particles. Anexample is the oxidation of TiCl4, SiCl4 or SnCl4 in a CH4/O2 flame leading to TiO2,SiO2 or SnO2 particles with primary particle sizes between 10 and 100 nm (Vemury etal., 1997). More complex products can be also obtained. Zachariah et al. (1995) addedsmall amounts of Fe(CO)5 and SiO2(CH3)6 to a premixed CH4/O2 flame withtemperatures at about 2000°C, forming Fe3O4 particles of 5-10 nm embedded in largerSiO2 host particles. The synthesis was conducted at relatively high temperatures underoxygen-rich conditions to minimize carbon contamination.
A method to reduce the agglomeration of nanoparticles, avoiding oxidation, isto encapsulate them within a material which can be later removed. Dufoux andAxelbaum (1995) applied a Na coflow flame with a burner consisting of severalconcentric tubes. A TiCl4 vapor was fed to the central tube while the Na vapor was fedto the concentric surrounding tube. An inert gas acts as a sheath gas between these twoflows and shields the flame from ambient air. Ti particles with sizes of 10-30 nm wereproduced and were confined within larger NaCl particles. The NaCl can be removedby washing with water, glycerin or by sublimation.
A review of synthesis of nanoparticles in the gas phase for electronic, optical andmagnetic applications
23
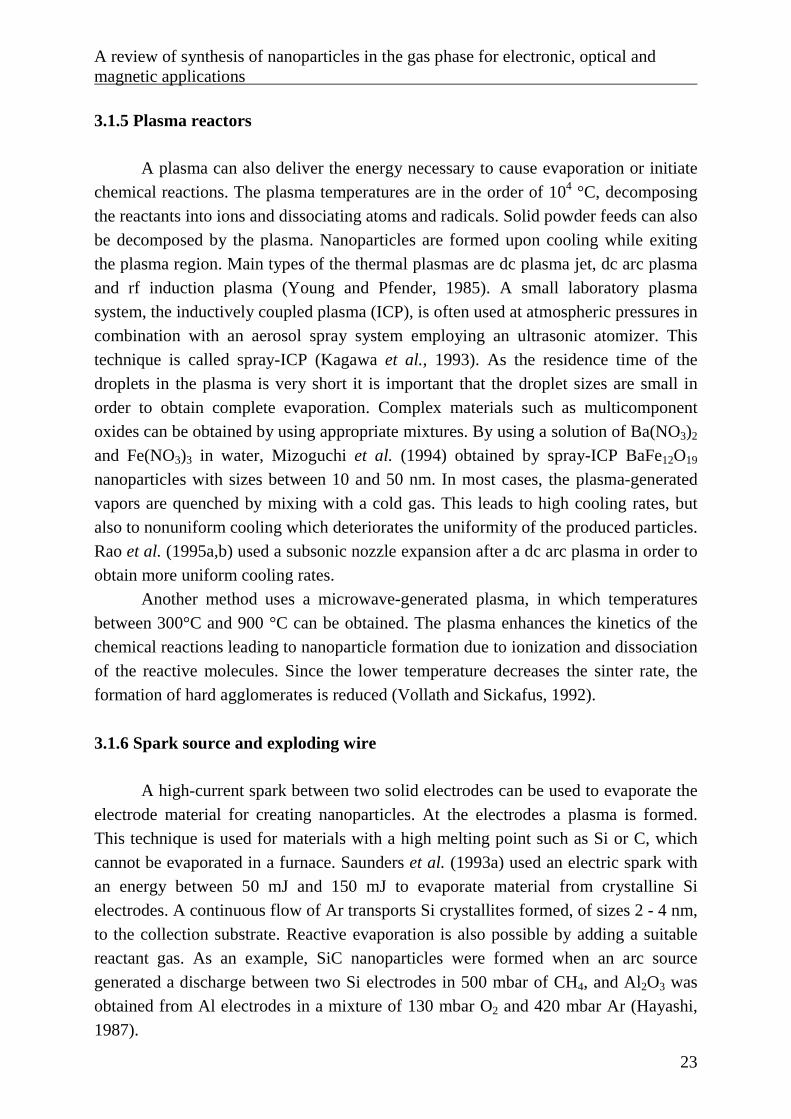
3.1.5 Plasma reactors
A plasma can also deliver the energy necessary to cause evaporation or initiatechemical reactions. The plasma temperatures are in the order of 104 °C, decomposingthe reactants into ions and dissociating atoms and radicals. Solid powder feeds can alsobe decomposed by the plasma. Nanoparticles are formed upon cooling while exitingthe plasma region. Main types of the thermal plasmas are dc plasma jet, dc arc plasmaand rf induction plasma (Young and Pfender, 1985). A small laboratory plasmasystem, the inductively coupled plasma (ICP), is often used at atmospheric pressures incombination with an aerosol spray system employing an ultrasonic atomizer. Thistechnique is called spray-ICP (Kagawa et al., 1993). As the residence time of thedroplets in the plasma is very short it is important that the droplet sizes are small inorder to obtain complete evaporation. Complex materials such as multicomponentoxides can be obtained by using appropriate mixtures. By using a solution of Ba(NO3)2
and Fe(NO3)3 in water, Mizoguchi et al. (1994) obtained by spray-ICP BaFe12O19
nanoparticles with sizes between 10 and 50 nm. In most cases, the plasma-generatedvapors are quenched by mixing with a cold gas. This leads to high cooling rates, butalso to nonuniform cooling which deteriorates the uniformity of the produced particles.Rao et al. (1995a,b) used a subsonic nozzle expansion after a dc arc plasma in order toobtain more uniform cooling rates.
Another method uses a microwave-generated plasma, in which temperaturesbetween 300°C and 900 °C can be obtained. The plasma enhances the kinetics of thechemical reactions leading to nanoparticle formation due to ionization and dissociationof the reactive molecules. Since the lower temperature decreases the sinter rate, theformation of hard agglomerates is reduced (Vollath and Sickafus, 1992).
3.1.6 Spark source and exploding wire
A high-current spark between two solid electrodes can be used to evaporate theelectrode material for creating nanoparticles. At the electrodes a plasma is formed.This technique is used for materials with a high melting point such as Si or C, whichcannot be evaporated in a furnace. Saunders et al. (1993a) used an electric spark withan energy between 50 mJ and 150 mJ to evaporate material from crystalline Sielectrodes. A continuous flow of Ar transports Si crystallites formed, of sizes 2 - 4 nm,to the collection substrate. Reactive evaporation is also possible by adding a suitablereactant gas. As an example, SiC nanoparticles were formed when an arc sourcegenerated a discharge between two Si electrodes in 500 mbar of CH4, and Al2O3 wasobtained from Al electrodes in a mixture of 130 mbar O2 and 420 mbar Ar (Hayashi,1987).
24
A closely related technique is the exploding wire, in which the wire material isvaporized instantaneously by a capacitor in a chamber filled with an inert gas. Thismethod has the disadvantage of being non-repetitive. As an example, GaAsnanoparticles were synthesized by using a GaAs wire (Saunders et al., 1992).
3.1.7 Sputtering
Sputtering is a method of vaporizing materials from a solid surface bybombardment with high-velocity ions of an inert gas, causing an ejection of atoms andclusters. Sputter sources such as an ion gun or an hollow-cathode plasma sputtersource are normally used in vacuum systems, below 10-3 mbar, as a higher pressurehinders the transportation of the sputtered material. Instead of ions, electrons from anelectron gun can be also used. Iwama et al. (1982) operated an electron gun at 10-5
mbar separated by a differential pumping system from a 1 mbar evaporation chamberin order to evaporate Ti and Al targets in a N2 or NH3 atmosphere, producing TiN andAlN nanoparticles smaller than 10 nm. Günther and Kumpmann (1992) applied anelectron beam in an inert gas atmosphere with pressures up to 5 mbar in order toproduce 5 nm Al2O3 and SiO2 particles. Hahn and Averback (1990) showed that aDC/RF magnetron sputter source can be operated in the mbar range, ejectingnanoparticles of sizes between 5 and 20 nm. Sputtering has the advantage that it ismainly the target material which is heated and that the composition of the sputteredmaterial is the same as that of the target.
3.1.8 Inert gas condensation
One of the earliest methods used to synthesize nanoparticles, is the evaporationof a material in a cool inert gas, usually He or Ar, at low pressures conditions, of theorder of 1 mbar. It is usually called ‘inert gas evaporation’. Common vaporizationmethods are resistive evaporation (Tasaki et al., 1965), laser evaporation (Chow et al.,1989) and sputtering (Hahn and Averback, 1990). A convective flow of inert gaspasses over the evaporation source and transports the nanoparticles formed above theevaporative source via thermophoresis towards a substrate with a liquid N2 cooledsurface (Granqvist and Buhrman, 1976). A modification which consists of a scraperand a collection funnel allows the production of relatively large quantities ofnanoparticles, which are agglomerated but do not form hard agglomerates and whichcan be compacted in the apparatus itself without exposing them to air. This methodwas pioneered by the group of Birringer and Gleiter (Birringer et al., 1984). Increasedpressure or increased molecular weight of the inert gas leads to an increase in the meanparticle size. This so-called Inert Gas Condensation method is already used on a

A review of synthesis of nanoparticles in the gas phase for electronic, optical andmagnetic applications
25
commercial scale for a wide range of materials. Also reactive condensation is possible,usually by adding O2 to the inert gas in order to produce nanosized ceramic particles(Siegel, 1994). Another method replaces the evaporation boat by a hot-wall tubularreactor into which an organometallic precursor in a carrier gas is introduced. Thisprocess is known as Chemical Vapor Condensation referring to the chemical reactionstaking place as opposed to the inert gas condensation method (Kear and Strutt, 1995).Finally, the Gas Deposition Method is also used in industry. In this method,nanoparticles are formed by evaporation in an inert gas at atmospheric pressure andtransported by a special designed transfer pipe to the spray chamber at a pressure ofabout 0.3 mbar. By moving the nozzle at the end of the transfer pipe, the particleswhich have a mean velocity of 300 m/s can be deposited in required places on thesubstrate in the spray chamber. Using this technique writing micron-sized patterns wasdemonstrated. (Oda et al., 1992).
3.1.9 Expansion-cooling
Expansion of a condensable gas through a nozzle leads to cooling of the gas anda subsequent homogeneous nucleation and condensation. Turner et al. (1988) showedby numerical simulations that by expanding an organometallic precursor in N2 in asubsonic nozzle results in the formation of particles of about 100 nm with a relativenarrow size distribution. The expansion caused the pressure to decrease from 2 bar to0.75 bar. In order to produce nanoparticles smaller than 5 nm, supersonic free jetsexpanding in a vacuum chamber with pressures smaller than 10-4 mbar have been used.(Yamada et al., 1987). In the work of Bowles et al. (1981) an inert gas containing ametal vapor was subjected to multiple expansions. Nuclei are formed as a result of twosonic expansions. Then a nuclei growth region in a subsonic, low-pressure reactorproduced nanoparticles with mean sizes below 2.5 nm. The separation of nucleationand condensation processes results in a narrower size distribution than usuallyachieved by supersonic expansion. Further growth is stopped by expansion in avacuum. Converging nozzles which create an adiabatic expansion in a low-pressureflow have also been used to produce nanoparticles (Bayazitoglu et al., 1996).Although the particles sizes are larger than in a vacuum expansion, particles of theorder of 100 nm were obtained with a relatively high production rate. Rao et al.(1995a,b) produced 4-10 nm sized nanoparticles by expanding a thermal plasmacarrying vapor-phase precursors through a ceramic-lined subsonic nozzle. A specialnozzle design minimizes boundary layer effects and approaches a one-dimensionaltemperature gradient in the flow direction. This leads to a highly uniform quench rateand thus to nanoparticles with a narrow size distribution.
26
3.2 Laser ablation of solids
Laser ablation is a technique in which a pulsed laser rapidly heats a very thin (<100 nm) layer of substrate material, resulting in the formation of an energetic plasmaabove the substrate. This technique should be distinguished from laser vaporization, asapart from atoms and ions also fragments of solid or liquid material are ablated fromthe substrate surface which vary in size from sub-nanometric to micrometric.Therefore it cannot be considered as a pure homogeneous nucleation process. Thepulse duration and energy determines the relative amounts of ablated atoms andparticles. The nonequilibrium nature of the short-pulse (10-50 ns) laser heating enablesthe synthesis of nanoparticles of materials which normally would decompose whenvaporized directly, such as most semiconductors and superconductive materials.Typically used lasers are the Nd:YAG (532 nm) and excimer (191, 248 and 308 nm)lasers. The material removal rate by laser ablation decreases with longer targetexposure times, therefore the target is usually rotated. When used for producing films,this technique is called pulsed laser deposition (PLD). Here, the fine particles are notdesired as they deteriorate the film quality and the operating conditions are chosen soas to minimize particle formation (Venkatesan and Green, 1996). Yamamoto andMazumder (1996) showed that laser ablation of NbAl3 at He pressures of 0.1 mbar didnot produce any nanoparticles while an operating pressure of 1 mbar resulted in theformation of 6 nm nanoparticles with the same stoichiometry as the substrate. Typicalproduction rates are in the order of micrograms per pulse with pulse frequencies ofabout 50 Hz, yielding 10-100 mg powder per hour. Reactive laser ablation in which areaction of the ablated material with the reactor gas occurs is also used. Johnston et al.(1992) ablated an Al target in an O2 atmosphere, producing Al2O3 nanoparticles.
3.3 Electrospray systems
A simple way to produce nanoparticles is to evaporate micron-sized droplets ofa dilute solution. By choosing the appropriate solute concentration, nanosized particlesconsisting of the solid residue can be obtained. For instance, drying a 1 µm dropletcontaining a 1 ppm solution of NaCl will yield a 10 nm NaCl particle. A seriousproblem here is that all the impurities present in the liquid will concentrate in the solidresidue (Rulison and Flagan, 1994). Furthermore, it is necessary to start from smalldroplet sizes which are difficult to obtain in normal spray systems.
Chen and Pui et al. (1995) showed that an electrospray system operated in thecone-jet mode could yield small droplets with a narrow size distribution. To avoiddroplet explosion during evaporation, the highly charged aerosol is first passedthrough a radioactive neutralizer before the evaporation takes place. It is important

A review of synthesis of nanoparticles in the gas phase for electronic, optical andmagnetic applications
27
here to avoid droplet explosion since that would deteriorate the narrowness of the sizedistribution. Using a sucrose solution, particles as small as 4 nm were obtained. Inanother work (Hull et al., 1997) Ag particles with a mean size of 10 nm were producedby electrospraying a dilute AgNO3 solution in methanol onto a grounded substrate. A 1mW He-Ne laser focused just below the capillary tip of the electrospray catalyzed thereduction of the Ag+ ion. The droplets were not discharged before evaporation in thiscase, so Rayleigh explosion is probable.
Kim and Rye (1994) developed a special charge injection technique in order toobtain very high charge densities. It is stated that the higher the surface charge densityof the electrospray jet is, the smaller is the size of the ejected droplets. The systemconsists of a spray capillary containing a sharp needle connected to a high voltagesupply. This charge injection system stabilizes the multijet-mode, in which a largenumber of small droplet-emitting jets form on the wetted capillary surface. Spraying a10 vol.-% TEOS solution in ethanol in a chamber filled with O2 resulted in 30-100 nmsized SiO2 particles.
3.4 Spray pyrolysis
In spray pyrolysis, a droplet containing a solute is evaporated or dissociated bya chemical reaction. During the shrinkage of the droplet, a supersaturated solution iscreated, as the amount of solute remains constant, and small particles may form insidethe droplet Spray pyrolysis normally results in micron-sized particles which often havea hollow shape. This method is intermediate between gas-phase and liquid-phase, asthe droplet are gas-carried, but the particle formation inside the droplets is in vtheliquid phase.
In some cases, nanoparticles were obtained. Lyons et al. (1992) obtainednanocrystalline PdO and V2O5 particles by spray pyrolysis. The droplets containing aprecursor solution were decomposed at relatively low temperatures. This methodavoids grain growth and densification, while the temperature is still high enough tofully decompose the precursors. The product consisted of 5 to 10 nm crystallitespacked together in spheres, showing the form of the originating droplet anddemonstrating that the droplets were not fragmented. This possibility was suggestedtheoretically by Leong (1987) who pointed out that formation of multiple crystals in adroplet is possible when the solubility is low, the solute mass is high or the rate ofsolvent evaporation is high. Kang et al.(1995) showed that in spray pyrolysis ofultrasonically nebulized nitrate or acetate solutions the particle size can be reduced toabout 10 nm by using a low pressure system (80 mbar). The same phenomenon wasobserved when zinc acetate droplets of 2 µm were generated by expanding a liquidthrough a glass filter into a low pressure chamber and subsequently pyrolyzed,

28
yielding ZnO nanoparticles (<20 nm). A mechanism was proposed in which gasevolution, due to solute decomposition with increasing temperature, resulted in thefragmentation of droplet containing the nanocrystals (Kang and Park, 1996a).However, by varying the solution concentration it only changed the particle sizemarginally, indicating a more complex mechanism (Kang and Park, 1996b).
3.5 Conclusions: processes suitable for functional applications
In many cases the choice of the process or precursors is based on economicconsiderations (Kruis et al., 1992). For structural applications such as production ofceramics, a process capable of producing larger quantities of nanoparticle powder isnecessary, such as flame or plasma reactors. For functional applications, however, thequality more than the quantity of the nanoparticles is decisive, as most of thefunctional applications need only thin films. The purity of the nanoparticles is alsovery important, so that most processes basing on chemical reactions are not suitabledue to incorporation of byproducts in or on the nanoparticles. Processes based on purephysical processes are, therefore, used more often.
One of the most simple methods is evaporation of a source material in a flowinggas, followed by condensation into nanoparticles in the cooler parts of the system. Agood purity can be obtained by using a purified inert gas and high-quality sourcematerial. It is difficult, however, to avoid some contamination of the particle surfacewith residual gas impurities. These contaminations can be reduced by reducing theprocess pressure, thereby reducing the number of collisions of gas collisions with theparticle surface.
The evaporation method is not always suitable for synthesizing compounds,such as compound semiconductors. We found that direct evaporation of GaAs and InPis not possible due to decomposition (Deppert et al., 1998). The use of chemicalreactions with synthesized metal nanoparticles is one possibility to obtain the desiredstoichiometry. Another possibility is the use of laser ablation, in which thestoichiometry of the ablated material is more or less retained.
Another problem of the usual evaporation-condensation process is that theparticle size distributions are relatively wide. The geometrical standard deviation is atleast 1.35 due to Brownian coagulation. But the Brownian coagulation can also bemade useful for obtaining composite materials. As the evaporation-condensationprocess is the process of choice in this work, important phenomena occurring in thisprocess will be investigated in the next Chapter.

4. Physical phenomena in gas-phase synthesis
29
4. Physical phenomena in gas-phase synthesis
In synthesis in the gas phase, many phenomena play a role. The most important are:- Homogeneous nucleation- Condensation- Collisions due to Brownian movement- Coalescence due to solid state diffusion or viscous flow- Surface reactionsThese mechanisms are schematically shown in Fig. 4.1. Additionally, transportprocesses, e.g. due to thermophoresis or Brownian diffusion, play a role.
Fig. 4.1. Mechanisms in gas-phase nanoparticle synthesis
In this Chapter, several mechanisms related to relevant problems in the gas-phase synthesis of nanoparticles for functional applications are investigated. In
solidsliquids
gas
molecular clusters
homogeneous nucleation
condensation
coagulationnanoparticles
aggregates
coalescence
surface reactions
capped particles
agglomerates
sintering

30
Chapter 4.1, the formation of nanometer-sized particles by the evaporation-condensation technique will be analyzed using a moment model describing nucleation,condensation and coagulation. This allows to predict the minimum furnacetemperatures needed to form nanoparticles. The coagulation and aggregationphenomenon is modeled by a Monte Carlo simulation technique in order to be able todescribe complex systems, such as multi-component or multidimensional systems withseveral variables, e.g. particle size and charge. The contents of Chapter 4.2 have beenaccepted for publication (Kruis et al., 2000a). The method is useful for describing themixing of charged nanoparticles for the synthesis of composite nanoparticles (Chapter4.3).
4.1 Particle formation by nucleation, condensation andcoagulation: application to synthesis in tube furnaces
Most of synthesis methods for gas phase nanoparticle synthesis are formationare still in the laboratory stage, and process design and product development relyheavily on experience. Aerosol science provides a theoretical framework forunderstanding particle formation processes in the gas phase, which can be used tounderstand experimental results or to find favorable process conditions. Modeling ofmost aerosol reactors is very complex due to the interplay of many physicochemicalphenomena and due to the problematic description of complex phenomena such asexploding wires and laser evaporation of solid material. Therefore, a gas which isheated and subsequently rapidly cooled down is chosen here as a model system. In thisso-called evaporation-condensation process (Scheibel and Porstendörfer, 1983), asaturated vapor is cooled resulting in a supersaturation, thereby producing nanosizedparticles. The same basic phenomena occur in the more complex systems as laserablation and inert-gas condensation but there the process conditions are not so easilydefined.
Several approaches for modeling particle formation in tube furnaces have beendescribed in the literature. Panda and Pratsinis (1995) assume a monodisperse sizedistribution to describe the formation of aluminium particles in a furnace. A moredetailed model describes the changes in the first three moments of the particle sizedistribution due to nucleation and condensation (Friedlander, 1983). This allows toassume a lognormal particle size distribution. In order to close these three moments,Pratsinis (1988) assumed a lognormal size distribution and added the coagulationmechanism. More advanced modeling techniques do not assume a shape of the particlesize distribution but require longer computation times and more complexe numericalmethods.

4. Physical phenomena in gas-phase synthesis
31
In this subchapter, particle formation in tube furnaces is analyzed using amoment model, based on Pratsinis (1988) but modified for the non-isothermalconditions of tube furnaces. After validation of the model, most of the chemicalelements have been screened in order to find conditions necessary for nanoparticlesynthesis using the evaporation-condensation mechanism in tube furnaces.
4.1.1 Theory
In the evaporation-condensation process, a vapor is generated by slowevaporation or sublimation of a powder material in an evaporation boat and can formparticles by homogeneous nucleation when cooling down. In order to calculate thesupersaturation the saturation vapor pressure is described in terms of the generalequation:
log logp AT
B T C T D T Es = + + + +2 (4.1.1)
This expression is fitted to the experimental data (Honig and Kramer, 1969) for mostof the elements. The expression proposed by Girshick and Chiu (1990) for thehomogeneous nucleation rate is used here:
( )I v
mn S
Ss= −
1
1
23
22 4
27γ
πθ θexp
ln(4.1.2)
using the dimensionless surface tension group θ :
θ γ= sk TB
1 (4.1.3)
A linearly temperature-dependent surface tension (Mezey and Giber, 1982) is used inthis work. The supersaturation S is found using:
Snn
g
s
=1ρ (4.1.4)
the number of monomers in the particles formed by homogeneous nucleation is:
kS
*
ln=
23
3θ (4.1.5)

32
The particle dynamics can be described in terms of the three leading moments of thesize distribution, approximating the form of the distribution as lognormal:
( ) ( )n v t
v vv
g,ln
expln /
ln= −
⋅
13 2 18
12
2σ σ(4.1.6)
The moments M0 , M1 and M2 are related to the geometric average particle volume vg
and the standard deviation σ by:
M M v kk gk=
0
2 292
exp ln σ (4.1.7)
Following Pandas and Pratsinis (1995) the moments and the monomer concentrationare expressed per unit mass of carrier gas instead of using concentrations per unitvolume of carrier gas. This is done in order to cope with the non-isothermal conditionsin the system. We define:
M Mk
k
g
=ρ
(4.1.8)
this transforms the moment equation into:
d
dd
dMt
I Mtg coag
0 0= +
ρ(4.1.9)
d
dd
d
*Mt
I k v Mtg cond
1 1 1= +
ρ(4.1.10)
( )d
dd
dd
d
*Mt
I k v Mt
Mtg coag cond
2 12
2 2= +
+
ρ(4.1.11)
in which the change of the moments due to a specific mechanism (nucl=nucleation,cond=condensation, coag=coagulation) is a function of the moments themselves,derived by Pratsinis (1986). Harmonic averaging is being applied in order to cope withthe different coagulation and condensation rates in the free-molecular and continuumregime. The monomer mass balance, also expressed per unit mass carrier gas, is:
d
dd
d
*nt
Ik ntg cond
1 1= − +
ρ(4.1.12)

4. Physical phenomena in gas-phase synthesis
33
The gas density, gas viscosity and mean free path of the gas are described usingtemperature-dependent functions.
4.1.2 Results and discussion
Until now, no systematic study of the nucleation behaviour of the elements hasbeen carried out. It is, however, very useful to know which temperatures are needed toinduce particle formation. Applying the homogeneous nucleation formula, thefollowing screening procedure is used. At a certain maximum temperature, which canbe thought of as the furnace temperature for instance, a monomer concentration isgenerated in accordance with the saturation pressure. Then the gas is cooled andsupersaturation is created. The nucleation rate has to be screened over the whole rangebetween maximum temperature and room temperature, as it is possible that a systemshows no nucleus formation (here defined where the nucleation rate is smaller than 1cm-3/s, which is an often encountered criterion for particle formation) at roomtemperature but it does at intermediate temperatures. B, C, W, Cr, Ge and Si e.g. showthis behaviour. This can be seen in Fig. 4.1.1 which shows the nucleation rate ofseveral elements when initially a temperature of 60 % of the melting point isestablished and then cooled down to the indicated temperature. This maximum in thenucleation rate is however an exception, usually a continuously increasing nucleationrate is found when going to lower temperatures.
The moment method was applied to follow the complete particle formationprocess with nucleation, condensation and coagulation. In order to validate the model,experimental results for silver nanoparticles (Scheibel and Porstendörfer, 1983) aremodeled. In these experiments, silver powder in a boat is heated in a tube furnace,forming nanoparticles during the cooling down. The temperature and cooling rate wasdetermined experimentally and the particle size distribution was measured using aDMA. The temperature at the center of the tube was found to be 70 K lower than thefurnace temperature. In Fig. 4.1.2 it can be seen that the model describes theexperiments (which apply a cooling rate of 3300 K/s) satisfactorily, in view of theincertainties in the surface tension and the nucleation model. The influence of thecooling rate is also shown: the higher the cooling rate, the smaller the resulting particlesize at a given temperature. This can be explained from the competition betweennucleation at the one hand and condensation and coagulation at the other hand. A slowcooling down results in a lower nucleation rate, so that the particles formed have moretime for interaction which each other and with condensing molecules.

Fig. 4.1.1. Nucleation rate of different elements in N2 at 1 bar as function oftemperature, after creating saturation at T=0.6 Tm (2294 K for C, 2210 K for W, 1278K for Cr)
1.0E+0
1.0E+3
1.0E+6
1.0E+9
1.0E+12
0 500 1000 1500 2000 2500T (K)
I (cm
3 /s)
Cr
W
C
34
Fig. 4maxT to
mome
1
10
100
1000
dg
nm
.1.2. Geometric mean particle diameter of Ag particles when cooling down from room temperature with different cooling rates indicated. Lines are based on the
nt model, experimental data is shown as points.
800 900 1000 1100 1200 1300 1400T max
model at experimental conditionsexperiments(Scheibel and Porstendörfer, 1983)model
°C
-102 K/s -103 K/s
-3300 K/s
-104 K/s
-105 K/s
4. Physical phenomena in gas-phase synthesis
35
The nucleation model and the moment model are now used to screen thedifferent elements on their ability to form nanoparticles. Here we distinguishnucleation ability and particle formation ability. In table 1 it can be seen to whattemperatures a material has to be heated to initiate nucleus formation, indicated by Tn.As can be seen, almost all elements show initial particle formation when heated up tothe melting point. The results are independent of system pressure or carrier gas, as thesaturation pressure is pressure-independent. It has to be pointed out that the surfacetension is a very critical parameter in calculating the nucleation rate. Small changes inthe surface tension lead to dramatic changes in the nucleation rate. Therefore the tableshould be viewed with some care. The other way around, nucleation experiments couldbe used to check the correctness of the applied surface tension.
The next question is to what particle size the nuclei will grow when nucleationoccurs. Using the standard submicron particle detection techniques such ascondensation nucleus counters particles as small as 3 nm can be detected. For theelements shown in Table 4.1, the moment model was applied in order to find themaximum temperature needed resulting in a geometric particle diameter of 3 nm. Thistemperature is indicated in the table by Tp. A cooling rate of 103 K/s was chosen whichis a normal cooling rate to be expected in tube furnaces. Rates in the order of 105 K/sare more characteristic for plasma- and laser-driven syntheses. The calculation hasbeen performed until the temperature reaches room temperature.
As can be seen from the table, is this temperature Tp in most cases hundredsdegrees Kelvin higher than the maximum temperature where the nucleation starts.Thus it seems that this ‘nucleation’ criterion expressed by Tn is not a practical criterionin order to predict the start of detectable particle formation. The table can be used inorder to get an idea of the minimum furnace temperatures needed for nanoparticleformation of the different elements.
From this table, also the limitations of the evaporation-condensation methodusing tube furnaces become clear: the temperature needed for nanoparticle formationis for many elements above 2000 K, so that the use of tube furnaces becomesquestionable due to material problems and too elevated costs. An example of such anelement is Pt, which is potentially interesting as dopant in gas sensing applications.For these elements, alternative methods have to be applied which are crucible-free,such as laser ablation.

36
Table 4.1. Melting temperature Tm, maximum temperatures necessary for nucleusformation Tn (I > 1 cm-3/s) and maximum temperature Tp needed for reaching ageometric particle diameter of 3 nm. For the calculation of Tp, a cooling rate of 103
K/s until room temperature was used with N2 at atmospheric pressure as carrier gas.
Tm/K Tn/K Tp/K Tm/K Tn/K Tp/K Tm/K Tn/K Tp/K
Ag 1235 740 1190 K 337 380 430 Ru 2583 1550 2330Al 934 840 1310 La 1193 1120 1740 S 386 310 360As 1267 480 560 Li 454 450 690 Sb 904 490 720Au 1338 960 1530 Mg 922 610 660 Sc 1812 940 1410B 2573 1440 2110 Mo 2890 1620 2490 Se 490 320 460Be 1551 840 1300 Mn 1517 730 1120 Si 1683 1080 1620Bi 545 530 840 Na 371 390 490 Sr 1042 480 690C 3823 1760 2450 Nb 2741 1810 2630 Ta 3269 1900 2940Ca 1112 530 760 Ni 1726 1210 1590 Tc 2445 1610 2450Co 1768 1130 1660 Os 3318 1860 2850 Te 723 390 580Cr 2130 980 1530 P 317 310 420 Ti 1933 1120 1740Cu 1357 790 1250 Pb 601 550 870 Tl 577 590 800Fe 1808 1010 1590 Pd 1825 950 1530 U 1406 1180 1740Ga 303 720 1150 Po 527 360 530 V 2163 1210 1860Ge 1211 820 1260 Pt 2045 1350 2130 W 3683 1990 3020Hf 2500 1950 2950 Rb 312 360 390 Y 1796 1040 1620In 430 450 560 Re 3453 1865 2900 Zn 693 570 600Ir 2638 1790 2480 Rh 2239 1300 2060 Zr 2125 1450 2340
4.2 Coagulation and aggregation: a Monte Carlo simulation
Once particles are formed and are solid, coalescence will not any more be rapidand aggregates consisting of primary particles develop. When the collision takes placeat room temperature, in general the primary particles will conserve their originalshape. At higher temperatures, solid state diffusion or viscous flow between theprimary particles can lead to complicated structures.
The classical way of dealing with coagulation (here defined as describingcolliding droplets) and aggregation (describing colliding solid particles) is theSmoluchowski equation (Smoluchowski, 1917). An analytical solution to this equationis only possible in the case of simple collision kernels, which are not relevant for the

4. Physical phenomena in gas-phase synthesis
37
systems of interest discussed above. In the case of complex coagulation kernelshowever, the problem has to be solved by numerical means.
This population balance problem is traditionally solved by discrete populationbalances, moment methods or sectional methods. Solving the discrete particle (or’cluster ‘) dynamic equation based on the Smoluchowski equation for the wholesubmicron size spectrum implies that more than 109 differential equations have to besolved simultaneously in order to describe the particle size distribution ),( tvn between1 nm and 1 µm. This is computational too expensive at the moment. It has been done,however, for only a small part of the particle size spectrum, e.g. up to 20 basic units ina particle whereas the larger particles are described by the sectional representation(Landgrebe and Pratsinis, 1990). Another way of numerical simulation assumes someform of the particle size distribution, e.g. a log-normal one, which results in a fewrelatively easy to solve equations for the moments of the distribution (Pratsinis, 1988,Otto and Fissan, 1999). Finally, the particle size distribution can be cut into sectionsfor which differential equations can be derived (Litster et al., 1995). It provides thesolution accurately when the number of sections is high enough with a reasonablecomputational time.
All these methods have the following drawbacks:- There is no information about the history of each particle. The particles are
described by means of their volume. It cannot be traced back which particlescollided to form a bigger particle and the information about the internal structure islost. Especially in case of aggregates this is a problem, as sometimes the sizedistribution of the primary particles composing an aggregate has to be known. Suchcases are e.g. the mixing of solid particles with different composition and thecoating of large particles with smaller ones.
- When more-dimensional systems have to be dealt with, the sectional representationresults in very complex algorithms. Examples are additional information about theagglomerate form (Xiong and Pratsinis, 1993) using a particle size distribution
),,( tavn describing the particle volume and area or about the charge distribution(Vemury et al., 1997) which requires the solution of ),,( tqvn describing volumeand charge level.A classical method to overcome such drawbacks is to use Monte Carlo simulation
methods. A well-known example of this method is the simulation of the Brownianmovement by stochastic processes. When a sufficient number of particles is taken,collisions will result from the random Brownian motions and a change in the particlesize distribution can be recorded. With the help of such trajectory methods based onthe Langevin equation Brownian coagulation of droplets (Pearson et al., 1984) andagglomerate formation by Brownian coagulation (Gutsch et al., 1995) have beendescribed. Such methods can deliver a priori coagulation rates, but are time-consuming

38
and are not suited for simulating large number of particles. The number of simulatedparticles is here usually between 500 and 1000.
When the collision rates are known, a much simpler method can be used. Thismethod bases on choosing collision partners by a stochastic game and is known as theDirect Simulation Monte Carlo method (DSMC, Bird, 1976). It was originallydeveloped for describing gas dynamics and is essentially the simulation of molecularcollisions without regarding their spatial positions. As the number of particles in realsystems is too large for the present computer memories, the simulation volume ischosen such that a reasonable amount (104 – 105) of simulation particles results.Advantageous is that information about the history and internal structure of theparticles is available, and that multi-dimensional systems such as charged andmulticomponent aerosols, requiring the solution of ),,,( tcqvn describing particlevolume, charge level and composition, can be simulated. Monte Carlo (MC)simulations are computationally expensive, computer power has reached however alevel where simulations with up to 105 particles are now possible on fast PCs.Furthermore, more care has to be taken to ascertain that the numerical solutions, whichvary due to the use of random numbers, are representative ones. The MC algorithmsfor solving particle dynamics are however easily programmed, and it can be said thatin comparison to sectional models the time spent on solving a problem is shifted fromthe programmer to the computer.
The DSMC method has been used before to solve complex problems whichinvolved particle collisions (e.g. Shah et al., 1977, Bapat et al., 1983). There arehowever few studies in which different DSMC methods for solving the coagulationand aggregation problem are investigated and tested more in detail. In this subchapter,these methods are briefly described and then a related method is proposed which iscomputationally more efficient. The accuracy of the solutions is tested by comparingthem with (I) analytical solutions and (II) numerical results from a sectional model.Two examples of industrial relevance are given to show the suitability of the DSMCmethod for describing complex multi-dimensional particle dynamics.
4.2.1 Direct Simulation Monte Carlo methods
It is assumed that the N colliding particles with an initial distribution )(0 vn arecontained in a fluid of volume V. This volume is chosen such that N is a reasonablenumber, with the present personal computer power not more than 105. It is furtherassumed that all collisions are binary, i.e. we are not dealing with concentrateddispersions or slurries, and that the sticking coefficient is unity. The collision rate β isa known function which depends on the properties of the medium and on theproperties of the colliding particles.

4. Physical phenomena in gas-phase synthesis
39
The particulate system considered here is usually described by theSmoluchowski equation:
−
=
∞
=−− −=
∂∂ 1
1 1,,2
1 k
i iikikikiiki
k nnnnt
n ββ (4.2.1)
where t is the time, nk is the number concentration of the k-fraction and ki ,β is thecollision rate of the particle pair (i,k) which defines the kinetics of the process. In theDSMC method, particle pairs are selected by stochastic methods based on thetransformation of collisions rates into collision probabilities.
Garcia et al. (1987) describes two stochastic methods based on the simulationprocedure for a Markov process. The methods were not tested by these authors,however. The mean time between two collisions events is τ , which can be calculatedby:
= +=
= N
i
N
ij
Vji
1 1,
1
βτ (4.2.2)
in which Vβ is the collision rate in a volume V. It is assumed that τ is anexponentially distributed random variable. This time is therefore selected by means ofa random number generator. The coagulation pair (i,j) is chosen on the basis of theprobability jiPr , which is calculated by:
=
= +=
N
k
N
kl
Vlk
Vji
jiPr
1 1,
,,
β
β(4.2.3)
As it is in this method necessary to calculate the collision rates of all possibleparticle pairs (inverse method) which is time-consuming, Garcia et al. (1987) proposeda second method based on the acceptance-rejection procedure (Bird, 1976). Here, aparticle pair (i,j) is selected entirely at random independent of the collision probability.Then this pair is accepted as a collision pair if
Vlk
VjiR
,
,
max ββ
< (4.2.4)
where R is a random number uniformly distributed between 0 and 1. When the pair isrejected, a new random number is selected, and so on, until the condition is fulfilled.This method is only practical when the maximum of the collision rate can easily be

40
determined and might introduce an error according to Garcia et al. (1987). In order toinvestigate this error, simulations are compared based on this method with theanalytical solution for the simple collision kernel )( jiA +=β (described further in thissubchapter). The results are shown in Fig. 4.2.1. Even with 105 simulation particles,the error in the total particle number is rather large as in comparison with the resultswhich will be shown further on. Furthermore, when the range of particle sizesincreases the ratio of the randomly generated collision rate and the maximum collisionrate becomes very small, the large number of rejections slows down the programconsiderably. As an example, in an aerosol system with wide range of particle classesundergoing Brownian coagulation )nm100,nm1(/)nm1,nm1( 2121 ==== dddd ββat standard conditions is in the order of 10-3 .
A third method is proposed by Liffman (1992) who uses a two-step method.The mean time which particle i experiences between two collision events is:
=
= N
j
Vji
i
1,
1
βτ (4.2.5)
Fig 4.2.1. Decrease in relative total number concentration 0/ NN : comparisonbetween theory (Case 2 , βi,j=A(i+j) ) and the acceptance-rejection Monte Carlosimulation procedure of Garcia et al. (1987). Number of simulation particles: 10.000
0.1
1
0 1 2t (s)
N/N
0
theory
acceptance-rejection method

4. Physical phenomena in gas-phase synthesis
41
It is assumed that this time is an exponentially distributed function. A time step ischosen which should be much smaller than the smallest value of all possible iτ ’s.Then, the particle i is accepted if
∆−−< i
t
eR τ21 (4.2.6)
When i has been found, the collision partner j is found by computing first all collisionprobabilities between the chosen particle i and any other particle j:
=
=
N
k
Vki
Vji
jPr
1,
,
β
β(4.2.7)
and then selecting j by means of:
≤≤=
−
=
j
kk
j
kk PrRPr
1
1
1(4.2.8)
As in the acceptance-rejection method of Garcia et al. (1987), selecting one particlepair might take a large number of random numbers which is computationallyexpensive. A further problem is that it is no clear criterion to select the time step.Nevertheless, the simulation results were extensively compared with analyticalsolutions and found to be correct.
4.2.2 A Fast DSMC method
A new method is proposed which is related to the inverse method. As thecollision kernel represents the probability of a binary collision in unit time, the sumover all collision kernels will be the probability that one collision takes place in theparticle ensemble in unit time. So the mean time τ needed for one collision takingplace in the particle ensemble is the inverse of the sum of all collision kernels:
=
= ≠=
N
i
N
jii
Vji
1 ,1,
2
βτ (4.2.9)
The factor 2 is added in order to account for the double counting of the particlepairs. A collision pair is chosen by making a list of all pairs and accumulate thecollision rate until the sum surpasses a random number. If a random number R is
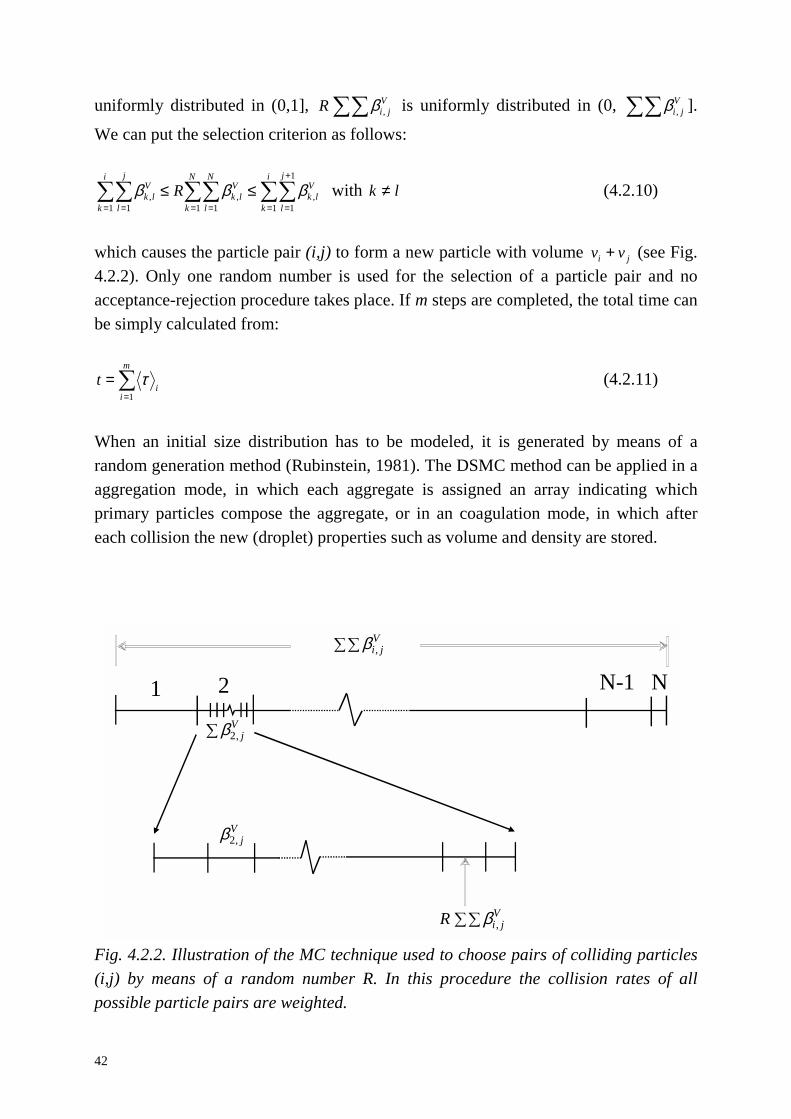
42
uniformly distributed in (0,1], V
jiR ,β is uniformly distributed in (0, V
ji ,β ].
We can put the selection criterion as follows:
= = =
+
== =
≤≤i
k
j
l
i
k
j
l
Vlk
N
k
N
l
Vlk
Vlk R
1 1 1
1
1,
1 1,, βββ with lk ≠ (4.2.10)
which causes the particle pair (i,j) to form a new particle with volume ji vv + (see Fig.4.2.2). Only one random number is used for the selection of a particle pair and noacceptance-rejection procedure takes place. If m steps are completed, the total time canbe simply calculated from:
=
=m
ii
t1τ (4.2.11)
When an initial size distribution has to be modeled, it is generated by means of arandom generation method (Rubinstein, 1981). The DSMC method can be applied in aaggregation mode, in which each aggregate is assigned an array indicating whichprimary particles compose the aggregate, or in an coagulation mode, in which aftereach collision the new (droplet) properties such as volume and density are stored.
Fig. 4.2.2. Illustration of the MC technique used to choose pairs of colliding particles(i,j) by means of a random number R. In this procedure the collision rates of allpossible particle pairs are weighted.
V
jiR ,β
1 N-12 N
Vj,2β
V
j,2β
V
ji,β
4. Physical phenomena in gas-phase synthesis
43
During the simulation the number of simulation particles N drops, which meansthat the error increases as the sample error is in the order of N/σ . In order toencounter this, the simulation volume V and the number of particles N are doubledwhen the concentration has dropped by half. The properties of each ‘old’ particle areof course copied to the ‘new’ particles in the additional volume in order to conservethe statistical properties. This procedure is discussed by Liffman (1996).
It should be pointed out that this method necessitates the calculation of thecollision rates of all possible particle pairs. If N is large, the storage of N2 collisionrates becomes prohibitive: 105 simulation particles would mean the storage of 1010
collision rates. In order to overcome this, for each particle only the sum of possiblecollision rates is stored and by means of the random number it is determined whichparticle i is selected. Then the collision rates of i with the other particles is calculatedand summated until the condition 10 is met. This method implies the storage of only Nvalues. After each pair selection, a simple correction can be made in the summatedcollision rate values to account for the change in particle properties and, consequently,in the collision rates. The large number of calculations of the collision rate, which areindependent of each other, makes the simulation very suitable for parallel computing.
The method described here is similar to the inverse method of Garcia et al.(1987). However, exponentially distributed time steps between collisions which wouldnecessitate a random number and a correction of all collision rates as in the work ofGarcia are not used, instead a calculated deterministic mean time is used. This ispossible due to the large number of simulated particles and greatly accelerates thesimulation procedure.
4.2.3 Comparison with theoretical solutions for aggregation
Obviously, the fast DSMC must be compared to known theoretical solutions todetermine if it is a valid method of analysis and to become an idea of the accuracy.There exist only a few forms of the collision kernel for which an analytical solution ofthe Smoluchovski equation exists (Spouge, 1983). βi,j=A, βi,j=A(i+j), βi,j=Aij. Here Ais a constant, i,j are the section numbers. The fast DSMC method is examined usingthese collision kernels. The initial particle size distribution is monodisperse.
Case 1. βi,j=A. If we define N0 as the initial number of primary particles at 0=t , thetotal number of particles N at time t is
2/1 0
0
AtNN
N+
= (4.2.12)

44
The probability of obtaining a particle, containing k primary particles is:
k
k
k AtNAtN
P)2/1(
)2/(
0
10
+=
−
(4.2.13)
Case 2. βi,j=A(i+j). In this case the decrease of particle number can be expressed as:
AtNeNN 00
−= (4.2.14)
with the probability of obtaining a k-aggregate
)1(11
00 )1(
!AtNekkAtN
k
k eek
kP−−−−−
−
−= (4.2.15)
Case 3. βi,j=Aij. In this case there exists only an analytical solution for times shorterthan a finite time t=1/N0A,
)2/1( 00 AtNNN −= , AN
t0
10 <≤ (4.2.16)
AtkNkk
k eAtN
AtNk
kP 0
)2/1()(
! 0
10
2−
−−
−= ,
ANt
0
10 <≤ (4.2.17)
The results of the simulations for N0=1012 m-3 and A=1/N0 are shown in Figs.4.2.3 and 4.2.4. Fig. 4.2.3 demonstrates the high degree of accuracy of the DSMCmethod in simulating the decrease in relative total number concentration. Here, usingeven only 1000 simulation particles results in very accurate results for the total numberconcentration. The doubling procedure is a necessity, as can be seen in Fig. 4.2.3awhere the total number concentration drops with a factor of 103. This results in some 8doubling procedures, clearly resulting in an accurate description. Fig. 4.2.b,c show thetwo other test cases. The probability distribution of aggregates with k primary particlesfor the above mentioned test cases is however a more sensitive function of the numberof simulation particles. The statistical nature of Monte Carlo simulations becomeevident when there are only few aggregates in the simulation volume. This can be seenin Fig. 4.2.4a,c. where the scatter increases at large k-numbers. Fig. 4.2.4b showsclearly the decrease of the statistical scattering when increasing the number ofsimulation particles from 10.000 to 100.000.

4. Physical phenomena in gas-phase synthesis
a)
b)
b)
a)
0.001
0.01
0.1
1
0.01 0.1 1 10 100 1000t (s)
N/N
0
DSMCtheory
45
0.1
1
0 0.5 1 1.5 2 2.5t (s)
N/N
0
theoryDSMC

46
c)
Fig. 4.2.3. Decrease in relative total number concentration 0/ NN : comparisonbetween theory and the Direct Simulation Monte Carlo method for (a) Case 1, βi,j=A(b) Case 2, βi,j=A(i+j). and (c) Case 3, βi,j=Aij. Number of simulation particles: 1000.
0.4
0.6
0.8
1
0 0.2 0.4 0.6 0.8 1t (s)
N/N
0
theoryDSMC

4. Physical phenomena in gas-phase synthesis
a)
1.0E-06
1.0E-05
1.0E-04
1.0E-03
1.0E-02
1.0E-01
1 10 100 1000k
P k
DSMCtheory
b)
47
0.0001
0.001
0.01
0.1
1
1 10 100 1000k
P k
DSMC (N=100000)DSMC (N=10000)theory

48
c)
Fig. 4.2.4. The probability kP of obtaining an aggregate containing k primaryparticles versus the size of the particles: comparison between theory and the DSMCmethod for (a) Case 1, βi,j=A at t=7.5 s (b) Case 2, βi,j=A(i+j) at t= 3.5 s and (c) Case3, βi,j=Aij at t= 1 s. Number of simulation particles: 100.000 (a), 10.000 and 100.000(b) and 100.000 (c).
4.2.4 Comparison with numerical solutions for coagulation
The form of the particle size distribution is an important issue in particlesynthesis. In order to check the validity of the DSMC method in a more realisticsystem than cluster aggregation, a coagulating aerosol is simulated. In Fig. 4.2.5 thedevelopment of the geometric standard deviation gσ in an initially polydisperseaerosol is shown. As reference a sectional model (Landgrebe and Pratsinis, 1990) isused with a section spacing of 1.08. It can be seen that two simulations with the samenumber of simulation particles can give different results due to the stochastic nature ofthe modeling. It is seen that when a sufficient number of particles is taken, thedeviations to the sectional model are in the order of 1 %. As both methods arenumerical it is difficult to say which one is the more correct one. The stochastic effectcan be reduced by repeating the simulation with different random numbers. This is
1.0E-05
1.0E-04
1.0E-03
1.0E-02
1.0E-01
1.0E+00
1 10 100 1000k
P k
DSMCtheory

4. Physical phenomena in gas-phase synthesis
49
shown in Fig. 4.2.5 for the case of 40.000 simulation particles, where the simulationnow shows a smooth curve after taking the mean of 3 different simulations.
Fig. 4.2.5. The geometric standard deviation gσ of a coagulating aerosol system(initially 5.53=gd nm, 910=N cm-3 and 8.1=gσ ) as a function of time t: comparisonbetween a sectional model and the DSMC method. The collision kernel used is fromDahneke (1983) and the sectional model used is by Landgrebe and Pratsinis (1990).The number of simulation particles N is indicated in the legend.
The statistic errors can be quantified by calculating the standard deviation fromdifferent simulations. This procedure is illustrated in Fig. 4.2.6, where the so-calledself-preserving particle size distribution (Friedlander, 1977) for the collision kernel
( ) ( )( )3/13/13/13/1, −− ++= jijiji vvvvvvβ is shown. Ten DSMC simulations were made so
that an estimation of the statistical errors could be obtained by the standard σ method(corresponding to a probability of 67 %). As can be seen from the figure, the form ofthe distribution is correctly described by the DSMC method and the standard σmethod generally overestimates the error in the simulations. The statistical errors canbe further reduced by increasing the number of simulations and/or the number ofsimulation particles. This was not further pursued here. Curve-fitting can also be
1.3
1.4
1.5
1.6
1.7
1.8
1.9
1.0E-02 1.0E-01 1.0E+00 1.0E+01 1.0E+02 1.0E+03 1.0E+04 1.0E+05t (s)
σ g
sectional model
N=2000
N=10000
N=20000 (1)
N=20000 (2)
N=40000 (mean of 3simulations)

50
applied here. The most striking feature in the figure is that the left-hand side of thecurve shows much larger statistical deviations than the right-hand side. This is due tothe fact that the method is particle number-based: to the left of the maximum lesssimulation particles are available for one data point due to the logarithmic axis.
Fig. 4.2.6. Self-preserving particle size distribution for the collision kernel( ) ( )( )3/13/13/13/1, −− ++= jijiji vvvvvvβ , in which the dimensionless particle density
function Ψ (defined as 2/),( NtvVn where V and N are the total particle volume andnumber) is a function of a dimensionless particle volume η (defined as VNv / ). TheDSMC results are compared with results from Vemury et al. (1994) who use asectional model. A confidence range of σ± is calculated from 10 simulations.
4.2.5 Case study 1: Chemical reaction in coagulating droplets (microreactors)
The standard numerical solution schemes, e.g. sectional models, for solvingcoagulating particle systems are more computer time-efficient than the DSMCsimulation. They are however not very well suited for solving more complex systemssuch a reacting microdroplets. In order to show the applicability of the DSMCsimulations, the reactive mixing of two sprays containing two different solutions ischosen. A chemical reaction takes place when droplets with solution A coagulate withdroplets containing solution B, producing a new droplet acting as ‘microreactor’ in
0
0.1
0.2
0.3
0.4
0.5
0.6
0.7
0.8
0.9
1
0.001 0.01 0.1 1 10η
Ψ
sectional model
mean of 10 MC sim.

4. Physical phenomena in gas-phase synthesis
51
which the product C is formed. This kind of mixing is used to mix two liquid reactantsvery fast. The chemical kinetics is given by:[ ] [ ] [ ]BAdCd kt
= (5.2.18)
where [ ]A denotes the concentration of A and k is a reaction constant. The problem isanalogous with that of a chemical reaction in a liquid-liquid dispersion described byShah et al. (1977). However, a polydisperse initial size distributions is used here. Thechemical reaction is closely related to the droplet dynamics as a collision eventchanges the concentrations of the reactants and product, depending on the relativevolume of the colliding droplets. The coagulation version of the DSMC code is veryeasily adapted for calculating the change in concentrations due to the chemicalreaction between two collisions by adding only a few additional program lines.
The results of the simulation are plotted in Fig. 4.2.7. As collision kernel thecollision frequency for the continuum regime (Friedlander, 1977) is taken. The resultsfor the volume fraction of droplets v/V having the indicated product concentration [C]are shown in a histogram-fashion, with the values of the concentration located at themidpoint of a section. Here also several simulations were made to get an idea of theaccuracy of the results by using the standard σ method. It is seen that only a fewsimulations are necessary to get a relative accurate result. The DSMC is an easilyprogrammed method to calculate complicated multi-dimensional size distributions, inthis case )],[],[],[,( tCBAvn .

52
Fig. 4.2.7. Distribution of product concentration [C] resulting from the chemicalreaction A+B→C with a reaction rate k=2.067 10-3 l/(mol s) between an A-containingspray (initially 310][ −=A mol/l, 1=gd µm, 2105=N cm-3 and 5.1=gσ ) and a B-containing spray (initially 310][ −=B mol/l, 1=gd µm, 2105=N cm-3 and 6.1=gσ ).
v/V is the volume fraction of droplets having a concentration [C]. The time elapsed is4.37 105 s. The initial number of simulation particles is 30.000 particles for eachspray. The error bars ( σ± ) result from repeating the simulation 4 times.
4.2.6 Case study 2: Coating of particles with smaller particles by aggregation
A second example of a problem which is very difficult to solve with standardparticle dynamical models is the coating of solid particles with nanoparticles with bothparticle fractions having an initially polydisperse size distribution. Particle coating isapplied in industry to apply a functional, protective or wear-resistive layer and is oftencarried out in a fluidized bed reactor (Li and Hua, 1997). The problem is to determinehow much of the surface of the larger particles (1 µm) is covered with the smallerparticles (100 nm). This is expressed in the surface coverage, which is defined as theratio of the sum of the area of all nanoparticles deposited on a large particle and thesurface area of the large particle. Due to the polydisperse size distribution and the
0
0.01
0.02
0.03
0.04
0.05
0.06
0.07
0.08
0.09
0.1
1.0E-07 1.0E-06 1.0E-05 1.0E-04 1.0E-03 [C] (mol/l)
v/V

4. Physical phenomena in gas-phase synthesis
53
random nature of the collision process, the surface coverage of the large solid particleswill be a distributed variable.
For the DSMC simulation, it means that the aggregation mode has to be usedwhere information on the primary particles composing an aggregate is stored. As anapproximation, the collision kernel for the continuum regime (Friedlander, 1977) isused. The results are shown in Fig. 4.2.8 as a cumulative distribution of the surfacecoverage for different coating times indicated in the legend. As can be seen from theslopes of the curve, there is a rather broad distribution of surface coverage of the largeparticles. The results of the DSMC method are in fact a solution of the multi-dimensional size distribution ),,...,,( 21 tvvvn
pn in which np is the number of particles inthe aggregate.
Fig. 4.2.8. Cumulative distribution of the surface coverage as a result of coating largeparticles ( 1=gd µm, 310=N cm-3 and 2.1=gσ ) with nanoparticles ( 100=gd nm,
610=N cm-3 and 5.1=gσ ) for different coating times indicated in the legend. Theinitial number of simulation particles is 20.000 for the nanoparticles, the simulationwas repeated 5 times.
0
20
40
60
80
100
0 0.5 1 1.5 2 2.5 3surface coverage of large particles
perc
entil
e
t=26 mint=1.125 hourst=2.6 hourst=5.8 hourst=12.75 hours

5
4.3 Mixing by means of aggregation of charged particles
A special case of nanomaterials is formed by composite particles, here definedas aggregates composed of two different particle classes. The technological use ofsuch particles is manyfold, e.g.:- improve the functional properties of semiconductor nanoparticles by adding a
second semiconductor particle which provides a charge transfer, thereby improvingthe quantum yield,
- improve the functional properties of nanoparticles by adding another nanoparticlewhich has catalytic properties, such as Pt or Pd which enhances the sensitivity ofSnO2 nanoparticles used for gas sensors,
- improve the superconductive properties of YBCO particles by adding smallerparticle which act as flux pinning enhancement (Takao et al., 1997),
- improve the mixing characteristics when two ultrafine powders have to be mixed:when the powders are mixed in aerosol form, the occurance of large aggregates ofone component, which is detrimental for the mixing, can be suppressed.
When mixing of primary particles of different chemical composition (e.g., componentA and B) takes place by Brownian coagulation, the mixing is a stochastic process inwhich as many aggregates composed of two A particles will occur as compositeparticles A-B when both particle components have the same size. The mixing qualitycan be enhanced by applying electrical forces. When the two particle components areoppositely charged, it is clear that more well-mixed A-B composite particles will beobtained than unmixed doublets of A or B (Fig. 4.3.1).
F
4
ig. 4.3.1. Principle of influencing aggregate formation by charges on particles.
Brownian aggregation
Electrical bipolar aggregation
+ -

4. Physical phenomena in gas-phase synthesis
55
The dynamic behavior of such systems is complicated, because the aggregatesformed may consist of particles dissimilar with respect to size, electrical charge andcomposition. Numerical techniques have to be applied in order to simulate thedynamical behavior when no assumptions about the form of the particle sizedistribution are made. These techniques, such as the sectional model (Gelbard et al.,1980), require complicated programs. The addition of charges further complicatesthese models. Oron and Seinfeld (1989) developed a detailed but very elaboratesectional model for the dynamics of charged particles, necessitating the solution of thetwo-dimensional distribution ),( qvn as a function of time. Vemury et al. (1997) usedthe simpler sectionalization technique developed by Litster et al. (1995). Even whensimplifying assumptions such as a log-normal shape of the size distribution and a fixedcharge distribution are made (Otto, 1997), the mathematical description remains verycumbersome. Models involving charge and size have mainly been applied fordescribing the charging of particles by ions and the increase in mean particle size bybipolarly charging an aerosol which has to be precipitated (Otto et. al., 1996).
Several studies considered the coagulation of two- or multi-componentaerosols. Lushnikov (1976) was the first to consider the coagulation of two-componentmixtures, deriving an analytical solution for a size-independent coagulation kernel.Gelbard and Seinfeld (1980) developed a sectional technique for dynamic behavior ofparticle size and chemical composition. However, both the setting up of the kineticequations and their numerical solution are very time-consuming. Another numericaltechnique for dealing with two-component coagulation was independently developedby Piskunov et al. (1997). These models have mainly been applied to atmosphericaerosols, e.g. to account for chemical reactions in water droplets or to describeaccidental release of radioactive species and their deposition onto aerosols. At present,however, no models exist for simultaneously solving the size, electrical charge andcomposition of an aerosol.
In this subchapter, we investigate what are optimal conditions for obtainingcomposite particles containing the same number of primary particles of the differentcomponents. When a large fraction of such agglomerates is present, the primaryparticles can be considered as well mixed. We consider several possible methods: themixing of bipolarly charged aerosols, the mixing of unipolarly charged aerosols andthe laboratory method of mixing size-selected and oppositely charged nanoparticles.The use of the newly developed DSMC technique (Chapter 4.2.) allows us to obtaininsight in the behavior of these complicated processes, in which the formed particlesare in the form ji BA (with i,j≥0) and where the primary particles have a size andcharge distribution.

56
4.3.1 Theory of bipolar aggregation
For the case of spherical uncharged particles, Fuchs (1964) proposed aninterpolation formula for the coagulation coefficient valid in the whole particle sizerange:
1
,
,
,,, )(
82
)(2−
++
+++
+=jiji
ji
jiji
jijijiki ddv
Ddd
ddddD
δπβ (4.3.1)
with
22, jiji δδδ += , iiiii
iii ddd
d−
+−+
= 2
3223 )()(
31 λλλ
δ (4.3.1a)
i
ii v
Dπ
λ 8= (4.3.1b)
i
Bi m
Tkvπ8= (4.3.1c)
22, jiji vvv += (4.3.1d)
i
Bi d
TCkDπη3
= (4.3.1e)
jiji DDD +=, (4.3.1f)
where m is the particle mass, kB is the Boltzmann constant, T is the fluid temperature,η is the dynamic gas viscosity, d is the particle diameter, C is the slip correction factor,and the indexes i and j refer to the colliding particles. Different particle densities of thecolliding particles are taken into account by this formula. If the particles are charged,the Coulomb forces have to be considered and the coagulation coefficient has to becorrected into:
qpji
jielji W .
,
,;,
ββ = , (4.3.2)
where qpjiW ,
, is the Fuchs stability function (Fuchs, 1964):

4. Physical phenomena in gas-phase synthesis
57
κκ )exp(1,
,−−=qp
jiW (4.3.2a)
Tkddpqe
Bji )(42
0
2
+=
πεεκ (4.3.2b)
where p and q are the numbers of elementary charges on particles i and j, respectively.This correction factor qpW ,
2,1/1 is shown in Fig. 4.3.2 for singly charged nanoparticles. Itcan be seen that this correction becomes important for smaller particles.
Fig. 4.3.2. Correction factor qpW ,2,1/1 for the influence of opposite charges (p= -1,
q= 1) on two coagulating particles
Furthermore, it is important to take into account in the calculation of thecoagulation coefficient that the aggregates formed are not any more spherical, incontrast to the primary particles. This leads to a higher coagulation coefficient incomparison to the case when the new particle has again a spherical shape (Katzer et.al., 1998). A commonly used correction method is to describe the effective aggregatediameter d by means of a fractal dimension fD (Matsoukas and Friedlander, 1991):
p
D
Ndd f
=
0, (4.3.3)
0
2
4
6
8
10
12
14
1 10 100d (nm)
1/W
d1=d2d2=5 d1d2=0.2 d1

58
in which Np is the number of primary particles with diameter d0. This method is,however, only applicable for equal-sized primary particles. To overcome this problemthe effective diameter of an aggregate composed of primary particles of any size isestimated by calculating the projected outer diameter and taking the mean over allpossible orientations. By comparing the results with the expression of Matsoukas andFriedlander for the effective aggregate diameter d (1991), eq. (5.3.3), the methods arefound to be equivalent for fD =1.43. Smaller fractal dimensions are encountered onlyfor magnetic particles which tend to align. In order to be able to describe theaggregation process for higher fractal dimensions, we simply interpolate between thislower boundary and the densest possible aggregate with a fD =3.
4.3.2 Simulation of aggregation of charged aerosols for mixing purposes
With the coagulation coefficient for charged particles and aggregates composedof unequal-sized primary particles now being known, the dynamics of the aggregationprocess can be studied by means of the DSMC method described in Chapter 4.2. . Thesimulations are performed for a bicomponent mixture with equal numberconcentrations of both components ( BA NN = ). The number of simulation particles is20000. Each simulation was repeated five times with different random numbers toreduce the influence of the stochastic nature of the simulation process. Mean valueswere computed from these five simulations. Each component has an initial lognormalsize distribution, which is also generated by means of random numbers (Rubinstein,1981). The initial charge distribution can be based on any formula for the chargingmethod used, such as bipolar charging or unipolar charging. The bipolar chargeequilibrium for particles larger than 50 nm can be described by the Boltzmann chargedistribution, where the concentration ratio of particles carrying q elementary charges is(Fuchs, 1964):
−= 2
2
0 2exp
σq
N
N q
(4.3.4)
where 0N is the total particle number and with
22eTdkB=σ (4.3.5)
As the Boltzmann theory underestimates the number of charged particles withdiameters smaller as 50 nm, the following approximation formula is used(Wiedensohler, 1988):
4. Physical phenomena in gas-phase synthesis
59
= =
5
0
log)(
10)( ii nm
dqa
qF (4.3.6)
where F(q) is the distribution function and ai(q) are coefficients as determined byWiedensohler.
The aerosols investigated have initial geometric mean diameters gd in the 10 to100 nm range. For smaller nanoparticles it is more difficult to reach sufficiently highcharge levels for influencing the aggregation process, and they were therefore notconsidered. The aggregates which were formed were assumed to have a fractaldimension fD =1.43. The same initial number concentrations are used in all the cases,
50,0, 105×== == tBtA NN cm-3 in order to be able to compare the results for different
cases. Higher or lower values of these values only influence the kinetics of the mixingprocess, not its qualitative behavior. Particle densities were taken to be 7500 kg/m3
and 9600 kg/m3 for aerosols A and B, respectively. As carrier gas N2 at 20°C wastaken.
The simulation results in a complex mixture which consist of the numberconcentrations of ji BA aggregates containing primary particles with different sizesand charges. The mixing quality can be shown by means of the distribution function.The distribution function of primary particles ( ) NN jii + is based on the ratio of thenumber of primary particles of one component to the total number of primary particlesin the aggregate, ( )jii + . Here, i corresponds to the number of primary particles ofcomponent A and j refers to the primary particles of component B. In Fig. 4.3.3 anexample is given of the time evolution of the distribution function of primary particlesin the case of two bipolarly charged aerosols with mean particle diameters of 10 nm.
The initial unmixed situation shows two peaks, indicating the unaggregatedprimary particles. At the half time 5.0t (689 s) maximum values at ( )jii + = 33, 50 and66 % develop, representative for A2nBn, AnBn and AnB2n aggregates. At longer timeslarger and more complex aggregates develop, but there is still a maximum aroundsymmetric aggregates.
In order to simplify the representation of the results, another definition is usedhere. The number fraction of symmetric aggregates NNsym represents the fraction ofsymmetric iji BA = aggregates, which corresponds to perfectly mixed aggregates. Insome way NNsym is an indication of the mixing selectivity.
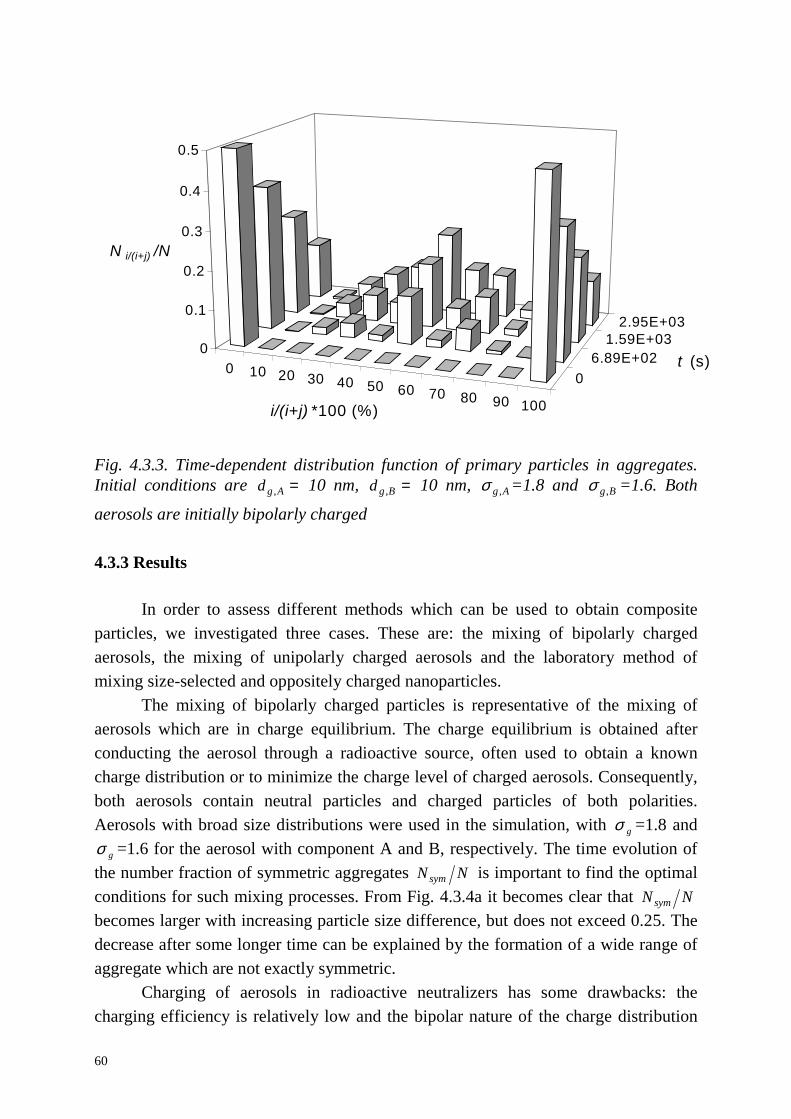
60
0 10 20 30 40 50 60 70 80 90 100
06.89E+02
1.59E+032.95E+03
0
0.1
0.2
0.3
0.4
0.5
N i/(i+j) /N
i/(i+j) *100 (%)
t (s)
Fig. 4.3.3. Time-dependent distribution function of primary particles in aggregates.Initial conditions are =Agd , 10 nm, =Bgd , 10 nm, Ag ,σ =1.8 and Bg ,σ =1.6. Both
aerosols are initially bipolarly charged
4.3.3 Results
In order to assess different methods which can be used to obtain compositeparticles, we investigated three cases. These are: the mixing of bipolarly chargedaerosols, the mixing of unipolarly charged aerosols and the laboratory method ofmixing size-selected and oppositely charged nanoparticles.
The mixing of bipolarly charged particles is representative of the mixing ofaerosols which are in charge equilibrium. The charge equilibrium is obtained afterconducting the aerosol through a radioactive source, often used to obtain a knowncharge distribution or to minimize the charge level of charged aerosols. Consequently,both aerosols contain neutral particles and charged particles of both polarities.Aerosols with broad size distributions were used in the simulation, with gσ =1.8 and
gσ =1.6 for the aerosol with component A and B, respectively. The time evolution ofthe number fraction of symmetric aggregates NNsym is important to find the optimalconditions for such mixing processes. From Fig. 4.3.4a it becomes clear that NNsym
becomes larger with increasing particle size difference, but does not exceed 0.25. Thedecrease after some longer time can be explained by the formation of a wide range ofaggregate which are not exactly symmetric.
Charging of aerosols in radioactive neutralizers has some drawbacks: thecharging efficiency is relatively low and the bipolar nature of the charge distribution

4. Physical phenomena in gas-phase synthesis
61
decreases the selectivity of the aggregation process. Unipolar chargers applying analternating electric field (Büscher et al., 1994, Kruis et al., 1998) allow to solve theseproblems. They possess a higher charging efficiency than radioactive neutralizers asthey are not limited by the bipolar charge equilibrium, and all charges are of one sign.Therefore, mixing unipolar aerosols can be more suitable for industrial application.For our simulations, aerosols with the same particle size distribution function as forbipolar charged particles ( Ag ,σ =1.8, Bg ,σ =1.6) were used, but this time one of themcontains only positively charged particles (A), and the other (B) contains only negativecharges with some amount of uncharged particles in both aerosols. Chargingefficiencies in both aerosols are taken similar to those described by Büscher et al.(1994) for positively charged particles. The increased fraction of charged particles ascompared to the bipolar case and the fact that particles of different kinds carry onlycharges of opposite signs have a positive influence on the fraction of symmetricaggregates, as can be seen from Fig. 4.3.4b. Remarkable is not only an increase of
NNsym of roughly a factor 2 with respect to bipolarly charged aerosols, but alsodifferent conditions leading to a maximum of selectivity. It was found that themaximum of NNsym is for both aerosols having the largest diameters. This is due tothe competition of two effects: on the one hand the coagulation coefficient increaseswith increasing difference in particle sizes, on the other hand for larger particles thecorrection factor due to electric charge strongly increases due to the multiple charges.Clearly, the first effect dominates in case of bipolarly charged aerosols due to a lowfraction of multiple charged particles while in case of unipolarly charged aerosols thesecond effect prevails.
Comparison of the results for the bipolar and unipolar cases leads to recognitionof the importance of the number and sign of charges on particles for the aggregationprocess. For further study a bicomponent mixture of particles with a narrow sizedistribution ( gσ =1.1) carrying an equal charge number but of opposite sign (qA=-qB)was taken. These aerosols can be obtained using the standard equipment for particlefractionation consisting of an aerosol charger and a Differential Mobility Analyzer.For applications, however, it has one main disadvantage: the maximum particlenumber concentration which can be obtained is relatively low. The evolution of
NNsym , representing the selectivity, is presented in Fig.4.3.4c for Agd , = Bgd , = 30nm. The maximum charge level is taken to be three elementary charges, as this is thelimit for the diffusion charging for 30 nm sized particles according to Fuchs (1963). Itcan be seen that only multiply charged particles result in high selectivity, over 80 %for triply charged particles. It was found in simulations not shown here that the highestselectivity is obtained for the smallest particle sizes and the highest charge levelstaken. This is due to the fact that all particles are charged and to the higher mobility ofsmaller particles.

a)
62
b)
0
0.05
0.1
0.15
0.2
0.25
10 100 1000 10000t (s)
Nsy
m/N d(a) =10nm
d(a) =30nm
d(a) =50nm
d(a) =70nm
d(a) =90nm
d g,A
d g,A
d g,A
d g,A
d g,A
0
0.1
0.2
0.3
0.4
0.5
1 10 100 1000 10000t (s)
Nsy
m/N
d(a)=100nmd(a)=70nmd(a)=50nmd(a)=30nmd(a)=10nmdg,A=10nmdg,A=30nmdg,A=50nmdg,A=70nmdg,A=100nm

4. Physical phenomena in gas-phase synthesis
c)
Fa1dBc(l
4
aUcaocc
63
igure 4.3.4. Fraction of "symmetric" aggregates as function of time:) in the case of initially polydisperse bipolarly charged (according to Wiedensohler,988) primary particles for different mean geometric diameters of component A withg,B=90 nm, b) in the case of initially polydisperse unipolarly charged (according toüscher et al., 1994) primary particles for different mean geometric diameters ofomponent A with dg,B=90 and c) in the case of initially quasi monodispersedg,B=dg,A=30 nm) oppositely charged (qA=-qB) primary particles for different chargeevels.
.4 Conclusions: mechanisms relevant for gas-phase synthesis
The formation of nanoparticles by the evaporation-condensation technique wasnalyzed using a moment model describing nucleation, condensation and coagulation.sing the model, it was shown that the temperature in the evaporation furnace and the
ooling rate determines the mean particle size and that an aerosoldynamical modelllows the prediction of the temperatures needed for nanoparticle formation. Forbtaining particle in the nanometer size-range, a temperature range of some 200-300 Kan be found for each element. In the Chapters 7.1 and 7.2 the evaporation-ondensation technique is experimentally applied.
0
0.2
0.4
0.6
0.8
1
1 10 100 1000 10000t (s)
Nsy
m/N
|q|=3|q|=2|q|=1|q|=0

64
For more complicated systems having more degrees of freedom, such asdistribution of particle sizes, different chemical compositions, distribution of chargesand distribution of number of primary in an aggregate, a newly developed DirectSimulation Monte Carlo method showed to be suitable. Two examples of practicalrelevance containing multi-dimensional particle dynamics were given: coagulationwith chemical reaction in droplets (microreactors) and the coating of solid particleswith nanoparticles.
Aggregation of mixtures of charged nanoparticles is useful for obtainingcomposites. This was studied by means of the Direct Simulation Monte Carlo method.The selectivity of mixing is characterized by means of the fraction of symmetricaggregates. It was shown that for each charge distribution different conditions lead to ahighest possible selectivity. Chapter 7.4 will describe an experiment designed forobtaining very well-defined composite nanoparticles, based on charges onnanoparticles.

5. A review of synthesis of nanoparticles in the gas phase for electronic, optical and magnetic applications
65
5. A review of synthesis of nanoparticles inthe gas phase for electronic, optical andmagnetic applicationsIn the preceding chapters the applications of nanoparticles, the synthesis methods andthe relevant mechanisms were described. In this chapter most of the relevant works aredescribed which are done using gas-phase methods to obtain nanoparticles ornanoparticle-based films and powders for electronic, optical and magneticapplications. Parts of this review have been published (Kruis et al., 1998d). Thisbackground allows to choose two interesting functional applications. The requirementsfor a process suitable for complying with the requirements for these applications willbe discussed, finally leading to the selection of a synthesis process.
5.1. Synthesis for microelectronic and optoelectronic applicationsof zero-dimensional structures (quantum dots)
Synthesis of semiconducting nanoparticles was pioneered by Kaito et al.(1976), who evaporated CdS powder from a boat heated at 1100°C in a low-pressureinert gas. The particles, ranging from 10 to 100 nm, were collected on TEM grids atvarious positions in the produced aerosol. The same procedure was also applied byKaito et al. (1983) to CdTe. Agata et al. (1990) synthesized CdS nanoparticles of 20-150 nm by evaporating CdS powder in low-pressure Ar. However, quantum effectswere not detected in the photoluminescent spectra due to the relatively large size of theparticles. Nevertheless the photoluminescence intensities increased with decreasingparticle size, probably related to the appearance of new electronic states on the freesurface. Hayashi et al. (1989) detected quantum effects in gas-evaporated ZnTenanoparticles with sizes between 20 and 80 nm by measuring the Raman spectrum.The change in the relative intensities of the different Raman lines indicated a blue shiftof the ground-state energy. In order to avoid problems due to incongruent evaporation,Kaito and Saito (1990) co-evaporated the metals (Zn, Cd) and the chalcogenides (S,Se, Te) from two boats kept at different temperatures. Thus the vapor pressures of bothelements could be matched and several II-VI semiconductor nanoparticles compoundswere obtained.
Saunders et al. (1992) synthesized semiconductor nanoparticles from the gasphase in order to obtain quantum confinement effects. GaAs nanoparticles in the 5-10

66
nm size range were formed from the nonequilibrium vapor created by the explodingwire method. Optical extinction measurements of the nanoparticles when collected in aliquid were suggestive of quantum size effects, especially due to the fact that a distinctabsorption edge at the bulk material band gap was absent. Sercel et al. (1992) obtainedGaAs nanoparticles by using an organometallic precursor. (CH3)3Ga was mixed in afurnace flow reactor with AsH3 gas yielding crystalline GaAs particles with sizesbetween 10 and 20 nm. Saunders et al. (1993b) showed that when (CH3)3Ga waspyrolyzed to form Ga nanoparticles, the GaAs nanoparticles obtained after the additionof AsH3 had a different morphology as compared to the case where (CH3)3Ga andAsH3 were premixed. In the premixed case, homogeneous nucleation of GaAs clusterswas probably the dominant mechanism. The optical absorption spectrum showed inthis case quantum confinement effects.
As the quantum confinement effect is a sensitive function of particle size(Yoffe, 1993), a narrow size distribution is required to observe it experimentallyotherwise the size effect will be averaged out. To this end, a differential mobilityanalyzer (DMA) can be used to ‘size-select’ an aerosol at atmospheric pressure (Fissanet al., 1996). An indirect way to obtain quantum dot structures is by depositing size-selected metallic aerosol particles onto InP wafers. After etching away the uncoveredsurface of the wafer, free-standing columns of semiconducting material result(Wiedensohler et al., 1992; Stratmann et al., 1993; Deppert et al., 1994). The diameterof these columns, between 20 and 50 nm, was defined by the size of the maskingaerosol particles. The height of these columns, typically 150 nm, is dependent on theetching time. Maximov et al. (1993) measured cathodoluminesence of the createdquantum dot structures and obtained a blue shift in the luminescence peak, althoughthis effect could not be explained by confinement effects alone. A similar etchingmethod was used by Kim and Rye (1994) to obtain GaAs quantum dots by reactive ionetching of a GaAs wafer covered with SiO2 nanoparticles. These particles weresynthesized by electrospraying a TEOS solution in ethanol in an O2 atmosphere.
Size-selected quantum dots can also be produced directly. Deppert et al. (1996)evaporated Ga in a furnace flow reactor and then size-selected the formed Gananoparticles. Finally, by adding AsH3 gas in a second furnace, the Ga nanoparticleswere reacted to obtain GaAs nanoparticles. This complicated route was used becauseGaAs does not evaporate stoichiometrically. Kruis et al. (1996) on the other handshowed that PbS, which belongs to the group of IV-VI semiconductors, can be directlysublimated in a furnace flow reactor without decomposition. This yielded amorphousPbS nanoparticles which were then size-selected. Control over particle deposition wasobtained by creating a lateral electric field between the electrodes, resulting in theparticles depositing preferentially on one electrode. Another method uses photoresist

5. A review of synthesis of nanoparticles in the gas phase for electronic, optical and magnetic applications
67
patterns on the substrate. The particles deposit preferentially on the areas withoutphotoresist, probably due to charging of the photoresist. The photoresist is removedafterwards without visible loss of particles. As a first device application metal-semiconductor-metal photodetectors with multifinger interdigitated electrodes wereproduced. After nanoparticles deposition the detectors show a higher sensitivity, 4x ona GaAs substrate and 60x on a Si substrate (Prost et al., 1998).
Koyama et al. (1992) used laser ablation to obtain CdS and CdTe nanoparticleswith stoichiometric composition. Substrates placed in a low-pressure chamber wereablated using a pulsed Nd:YAG laser. The nanoparticles formed were transportedthrough a pipe into a vacuum collection chamber where they deposited onto a coldfinger and were covered with frozen methanol. The nanoparticle diameter could becontrolled between 4 and 10 nm by changing the laser power and the inert gaspressure. Absorption spectra indicated quantum size effects. Using the sameexperimental setup, a glass doped with CdTe microcrystallites was produced byablating alternatively a CdTe target and a SiO target in an O2 atmosphere (Ohtsuka etal., 1992). In this case, nanoparticles with nonlinear optical properties were obtained.
Danek et al. (1994) prepared quantum dot nanocomposites consisting of CdSenanoparticles embedded in ZnSe thin films, which is a larger band gap semiconductor.The semiconductor matrix was expected to stabilize the quantum dots and protect themagainst oxidation. The CdSe nanoparticles were brought in the aerosol phase by usingthe electrospray method. The aerosol was transported into an organometallic CVDreactor where the ZnSe film was being deposited. It was observed that the opticalproperties of these quantum dots were preserved during this process. Another kind ofnanocomposite quantum dot was synthesized by Salata et al. (1994a), who imbeddedPbS nanoparticles in a polymer film. An aerosol of a liquid containing Pb(NO3)2 and apolymer precursor was obtained by an electrospray system and then reacted with H2Sfrom the gas phase producing PbS nanoparticles. The PbS nanoparticles covered witha polymer layer were then driven by the electrical field towards the substrate. Theoptical absorption spectrum showed a large blue shift, corresponding to a theoreticalmean particle diameter of 4.6 nm. Using a Cd(NO3)2 solution, CdS nanoparticles werealso obtained with an average diameter smaller than 5 nm claimed to have a narrowsize distribution (Salata et al., 1994b).
5.2 Synthesis of luminescent nanocrystalline silicon
Littau et al. (1993) synthesized Si nanoparticles with sizes between 3 and 8 nmby pyrolysis of 3-30 ppm Si2H6 at 865 °C in a furnace flow reactor operated at 1.4 barHe. The aerosol was then diluted with He and reacted with O2 in a second furnace at

68
700°C, yielding a passivating layer of SiO2. The shell thickness of the nanoparticleswas 1.2 nm. The aerosol was collected as colloid in ethylene glycol and size-selectedusing a liquid phase method. The luminescence of the colloid obtained was weak butcould be improved through chemical treatment to reach a quantum yield of 5 % atroom temperature and 50 % quantum yield below 50 K (Wilson et al., 1993). Theluminescence shifted to higher energy with decreasing particle size, indicating therebyquantum confinement effects (Brus et al., 1995).
Both Kanemitsu et al. (1993) and Kawaguchi and Miyazima (1993)decomposited SiH4 with a Nd:YAG laser at 10-20 mbar and obtained Si nanoparticleswith sizes between 3 and 20 nm. The samples were oxidized at room temperatures forseveral weeks in a clean air box, resulting in a thin amorphous SiO2 layer around theparticles. These particles exhibited a strong visible photoluminescence at roomtemperature, the maximum-intensity wavelength being however independent of the Sicore size. Takagi et al. (1990) applied a microwave plasma to decompose SiH4. Thediameter of the Si nanocrystals could be varied in this case from 2.5 to 20 nm. Theywere blown through a transfer pipe onto a substrate in a vacuum chamber andoxidized. Here, the luminescence peak showed a weak dependence on the particlediameter. Saunders et al. (1993) produced 2 - 4 nm sized Si crystallites by a sparksource. Immediately after synthesis, the sample consisting of a 10 nm thick particulatefilm showed little or no visible photoluminescence. After exposure to air however, theluminescence increased dramatically. Werwa et al. (1994) used pulsed laser ablationcombined with supersonic expansion and obtained 2-3 nm Si nanoparticles, which thenshowed visible photoluminescence after surface passivation by chemical means. Moredetailed studies (Seraphin et al., 1996) showed that the maximum-intensity wavelengthis determined by the particle size, while the luminescence intensity is determined bythe degree of surface passivation.
The first report on size classification in the gas phase originates from Camata etal. (1996). They obtained Si nanoparticles with a high-voltage electric spark dischargein an inert gas at atmospheric pressure and then size-selected them by a DMA. Thenanoparticles, with sizes selected between 2.8 and 11 nm, were collected on a substrateby an electrostatic precipitator or hypersonic impactor. The standard deviation of theclassified aerosol was 1.2 - 1.3. The size distribution of the smallest particles selected,i.e., 2.8 nm, showed however also the presence of a significant amount of largerparticles. This was due to the omission of the neutralizer at this size resulting inmultiply charged particles.

5. A review of synthesis of nanoparticles in the gas phase for electronic, optical and magnetic applications
69
5.3 Fabrication of gas sensors
Ogawa et al. (1981a, b) produced a thick film consisting of SnO2 nanoparticleswith mean sizes between 3 and 15 nm. A heated boat containing Sn was placedunderneath an RF-induced plasma in a low-pressure O2 gas. The SnO2 nanoparticleswere deposited on a substrate placed above the O2 plasma. The macrostructure of thefilms, which ranged from porous columnar to spongy, was found to be dependent onthe O2 pressure. The porous columnar structure had the highest selectivities, and wasused to detect water, ethanol and isobutane vapor. A similar reactive plasma systemwas used by Zhu et al. (1993), who replaced the RF coil by the more economic d.c.gas discharge ring electrode. The nanoparticles in the film had a mean size of 40 nmand exhibited a good sensitivity to ethanol vapor.
The results obtained by Ogawa will be analyzed here more in detail, as theyprovide a good insight in the mechanisms of gas sensing. A 10 -50 µm thick porousfilm composed of 15 nm SnO2 particles showed a high gas sensitivity and an improvedgas selectivity in comparison to sensors consisting of micron-size grains (Ogawa et al.,1981b). From mobility measurement results it was postulated that due to the smalldimensions of the conduction channels in the nanoparticles the depletion layer has alarge influence on the conductivity (Ogawa et al., 1982).
Gas sensors based on semiconducting metaloxides are applied for the detectionof explosive or toxic gases. The measurement signal bases on the conductivity, σ, ofthe material. In the temperature range normally used (400-700 K) the chemical sensingmechanism is a result of a surface reaction between chemically adsorbed oxygen andreducing gases. The oxygen is chemically adsorbed in the form of O2
-, O- or O2- andinduces a depletion zone at the surface which has a lower conductivity in comparisonwith the bulk because electrons are bounded to the adsorbed oxygen. A reducing gaswill reduce the concentration of chemically adsorbed oxygen so that the conductivityincreases. Chemical reactions at the surface were investigated by means of mass-spectrometric measurements of the desorption products when the film is heated (Kohl,1989). The following reaction was found when ethanol reacts with O- at the surface ofSnO2:
C2H5OH + O- ↔ CH3CHO + H2O + e (5.1)
The adsorbed C2H5OH molecules oxidize at 250°C to CH3CHO. The electron which isfreed by this reaction effectively increases the conductivity of the SnO2.
Gas sensors based on ultrafine thin films of metal oxides are known sinceseveral decades. A porous film composed of particles with diameters between 6 and 20
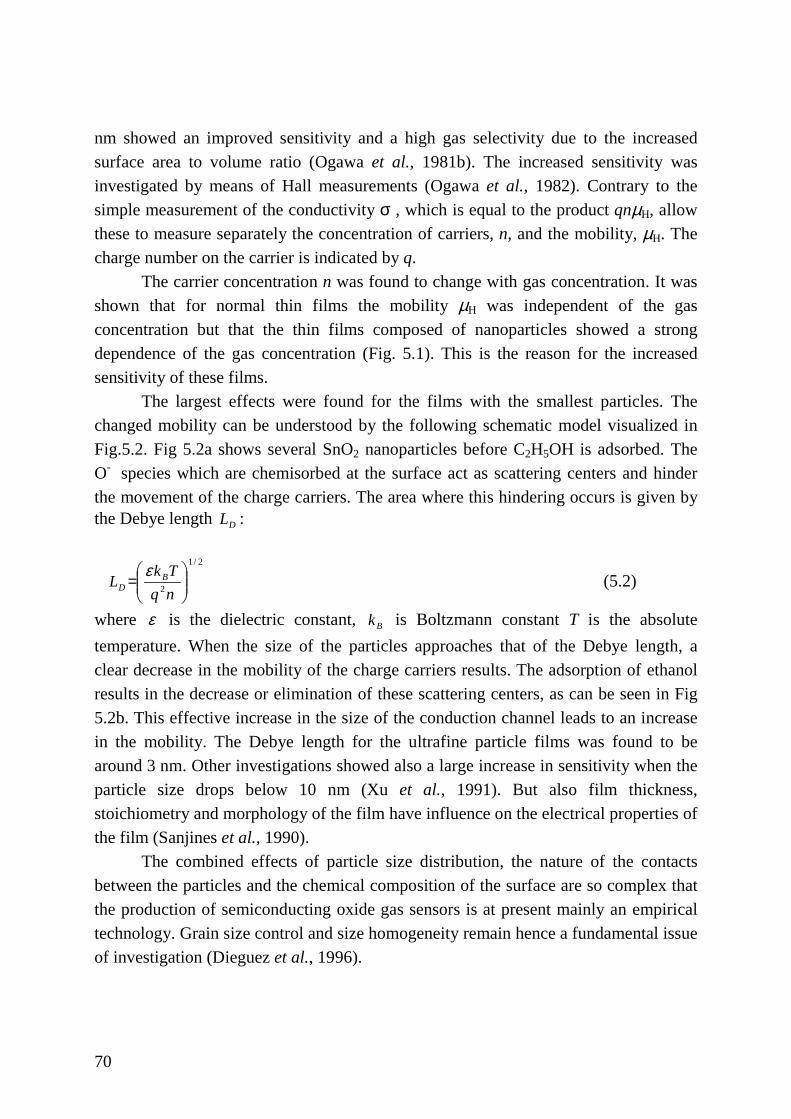
70
nm showed an improved sensitivity and a high gas selectivity due to the increasedsurface area to volume ratio (Ogawa et al., 1981b). The increased sensitivity wasinvestigated by means of Hall measurements (Ogawa et al., 1982). Contrary to thesimple measurement of the conductivity σ , which is equal to the product qnµH, allowthese to measure separately the concentration of carriers, n, and the mobility, µH. Thecharge number on the carrier is indicated by q.
The carrier concentration n was found to change with gas concentration. It wasshown that for normal thin films the mobility µH was independent of the gasconcentration but that the thin films composed of nanoparticles showed a strongdependence of the gas concentration (Fig. 5.1). This is the reason for the increasedsensitivity of these films.
The largest effects were found for the films with the smallest particles. Thechanged mobility can be understood by the following schematic model visualized inFig.5.2. Fig 5.2a shows several SnO2 nanoparticles before C2H5OH is adsorbed. TheO- species which are chemisorbed at the surface act as scattering centers and hinderthe movement of the charge carriers. The area where this hindering occurs is given bythe Debye length DL :
2/1
2
=
nqTkL B
Dε (5.2)
where ε is the dielectric constant, Bk is Boltzmann constant T is the absolutetemperature. When the size of the particles approaches that of the Debye length, aclear decrease in the mobility of the charge carriers results. The adsorption of ethanolresults in the decrease or elimination of these scattering centers, as can be seen in Fig5.2b. This effective increase in the size of the conduction channel leads to an increasein the mobility. The Debye length for the ultrafine particle films was found to bearound 3 nm. Other investigations showed also a large increase in sensitivity when theparticle size drops below 10 nm (Xu et al., 1991). But also film thickness,stoichiometry and morphology of the film have influence on the electrical properties ofthe film (Sanjines et al., 1990).
The combined effects of particle size distribution, the nature of the contactsbetween the particles and the chemical composition of the surface are so complex thatthe production of semiconducting oxide gas sensors is at present mainly an empiricaltechnology. Grain size control and size homogeneity remain hence a fundamental issueof investigation (Dieguez et al., 1996).

5. A review of synthesis of nanoparticles in the gas phase for electronic, optical and magnetic applications
71
Fig. 5.1. Hall measurements for nanoparticle film (a) and thin film (b) (fromOgawa et al., 1982)

72
Fig. 5.2. Schematic model for the modification of the conductivity channel by gasadsorption a) before gas adsorption and b) after gas adsorption (from Ogawa et al,1982)
Adachi et al. (1988) applied an evaporation-reaction type aerosol generator toproduce SnO2 particles. Sn was vaporized in a furnace and reacted with O2, yieldingupon cooling SnO2 particles with mean sizes between 10 and 100 nm. The particle sizedistribution was measured using a DMA-CNC combination. Thin nanoparticle filmson a glass substrate were produced by accelerating the particles through a criticalorifice into a low-pressure chamber. The electrical properties of the films weresensitive to H2 especially at room temperature.
H HO H H
O
H HO
HHO
O -O -
O -
O -ee
e
e
e
O -O -
O - O - O -
O -
O -O - O - O - O -
O - O -
D L c
δδδδ
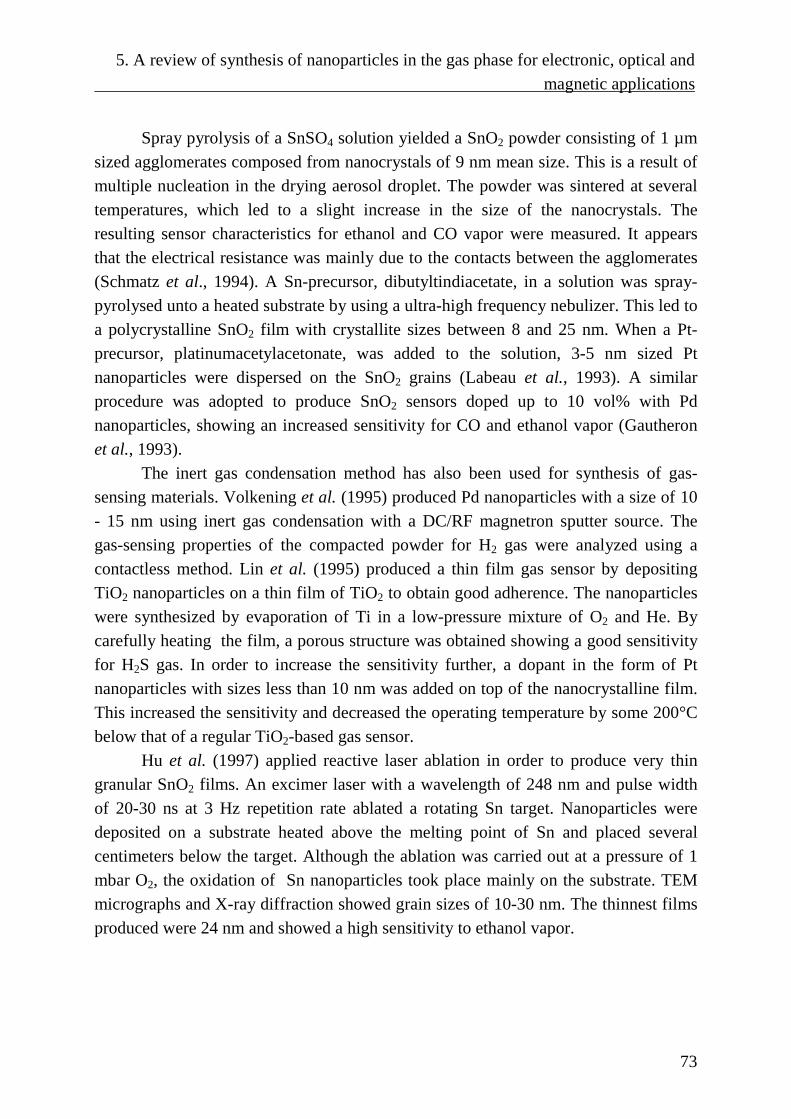
5. A review of synthesis of nanoparticles in the gas phase for electronic, optical and magnetic applications
73
Spray pyrolysis of a SnSO4 solution yielded a SnO2 powder consisting of 1 µmsized agglomerates composed from nanocrystals of 9 nm mean size. This is a result ofmultiple nucleation in the drying aerosol droplet. The powder was sintered at severaltemperatures, which led to a slight increase in the size of the nanocrystals. Theresulting sensor characteristics for ethanol and CO vapor were measured. It appearsthat the electrical resistance was mainly due to the contacts between the agglomerates(Schmatz et al., 1994). A Sn-precursor, dibutyltindiacetate, in a solution was spray-pyrolysed unto a heated substrate by using a ultra-high frequency nebulizer. This led toa polycrystalline SnO2 film with crystallite sizes between 8 and 25 nm. When a Pt-precursor, platinumacetylacetonate, was added to the solution, 3-5 nm sized Ptnanoparticles were dispersed on the SnO2 grains (Labeau et al., 1993). A similarprocedure was adopted to produce SnO2 sensors doped up to 10 vol% with Pdnanoparticles, showing an increased sensitivity for CO and ethanol vapor (Gautheronet al., 1993).
The inert gas condensation method has also been used for synthesis of gas-sensing materials. Volkening et al. (1995) produced Pd nanoparticles with a size of 10- 15 nm using inert gas condensation with a DC/RF magnetron sputter source. Thegas-sensing properties of the compacted powder for H2 gas were analyzed using acontactless method. Lin et al. (1995) produced a thin film gas sensor by depositingTiO2 nanoparticles on a thin film of TiO2 to obtain good adherence. The nanoparticleswere synthesized by evaporation of Ti in a low-pressure mixture of O2 and He. Bycarefully heating the film, a porous structure was obtained showing a good sensitivityfor H2S gas. In order to increase the sensitivity further, a dopant in the form of Ptnanoparticles with sizes less than 10 nm was added on top of the nanocrystalline film.This increased the sensitivity and decreased the operating temperature by some 200°Cbelow that of a regular TiO2-based gas sensor.
Hu et al. (1997) applied reactive laser ablation in order to produce very thingranular SnO2 films. An excimer laser with a wavelength of 248 nm and pulse widthof 20-30 ns at 3 Hz repetition rate ablated a rotating Sn target. Nanoparticles weredeposited on a substrate heated above the melting point of Sn and placed severalcentimeters below the target. Although the ablation was carried out at a pressure of 1mbar O2, the oxidation of Sn nanoparticles took place mainly on the substrate. TEMmicrographs and X-ray diffraction showed grain sizes of 10-30 nm. The thinnest filmsproduced were 24 nm and showed a high sensitivity to ethanol vapor.

74
5.4 Fabrication of conducting films
Lee et al. (1996) applied a RF plasma reactor operating at atmospheric pressureto produce thin ITO films based on nanoparticles. A precursor solution containingSnCl4 and In(NO3)3 was ultrasonically nebulized and introduced into the plasmaregion. The film on the substrate located underneath the plasma consisted of particleswith sizes between 50 and 150 nm and was optically transparent. The resistivity wasfound too high for practical applications except for using these films in transparentelectrical heaters. Zhao and Pan (1994) obtained ZnO nanoparticle films byevaporating Zn in a dc arc jet using O2 as the plasma forming gas in a low pressureenvironment (0.1-10 mbar). The optical properties of the films which were composedof particles with mean sizes between 20 and 80 nm showed a transmission between 20and 80 % in the visible spectrum. The IR spectra showed size effects and the electricalproperties were found to depend on the amount of O2 absorption.
5.5 Synthesis of high-temperature superconductors (HTS)
Aerosols have been used extensively in the preparation of HTS films, butmainly as a means of transport of the precursors to the reaction zone where theyevaporate (Wang et al., 1990, Salazar et al., 1992). The HTS material can also beproduced as a powder, which can be sintered into larger HTS units. This has been donemainly by spray pyrolysis yielding particles in the size range of 0.1-5 µm. Okuyama etal. (1993) obtained particles of about 50 nm of a bismuth oxide superconductor(Bi2CaSr2Cu2Ox) by evaporating volatile organometallic precursors and reacting thegas mixture of the different precursors with O2 in a furnace reactor. The particles werethen collected with an electrostatic precipitator. The presence of the 80 K phase wasfound by X-ray diffraction, and it was shown that a precise control of the reactortemperature and residence time could avoid the undesirable formation of the 10 Kphase.
Chadda et al. (1991) obtained an YBa2Cu3O7-y /CuO composite powderconsisting of 25-50 nm crystallites by spray pyrolysis of a nitrate solution. Thispowder could be converted into YBa2Cu4O8 by heating it in an O2 atmosphere.However, this conversion was not successful when using a larger grained powder of100-250 nm. YBa2Cu4O8 has certain advantages over YBa2Cu3O7-y with respect to theflux pinning requirement, see section 2.7. Takao et al. (1996) used an electrostaticaerosol mixing process to produce composite BaZrO3/YBa2Cu3O7-y particles. Here,after a separate synthesis of the two compounds the BaZrO3 aerosol particles smallerthan 100 nm were electropositively charged while the YBa2Cu3O7-y particles with a

5. A review of synthesis of nanoparticles in the gas phase for electronic, optical and magnetic applications
75
size of 500 nm were electronegatively charged. By imparting a multiple charge to thesuperconducting particles and singly charging the nanoparticles, a coating of BaZrO3
nanoparticles on the YBa2Cu3O7-y particles resulted after mixing. After sintering thepowder to a superconducting composite body, the critical current density increased bya factor of ten as compared to the same superconducting material without BaZrO3
nanoparticles.
5.6 Synthesis of magnetic materials
Inert gas evaporation using a low-pressure, between 1 and 10 mbar, is usedroutinely to produce magnetic nanoparticles for research purposes. It stems from thepioneering work in the group of Uyeda who produced Fe, Co and Ni particles from 8to 200 nm by evaporating the metal in low-pressure Ar (Tasaki et al. ,1965). As anexample of a more recent work, Gangopadhyay et al. (1992) evaporated Fe from aheated crucible and obtained nanoparticles on a cooled substrate by thermophoresis.The Fe nanoparticles with sizes between 5 and 20 nm were subjected to a slowoxidation in a Ar-air mixture to passivate the surface. The resulting Fe-oxides layerswere 1-2 nm thick. The highest coercivity at room temperature was 1050 Oe fornanoparticles with a diameter of 13 nm. Particles smaller than 9 nm weresuperparamagnetic.
Alloy nanoparticles have also been obtained using inert gas evaporation. Theyhave magnetic properties of technological importance when composed of a magneticmaterial imbedded in a nonmagnetic material. Li et al. (1994) obtained by evaporatingthe alloy in Ar gas FeCr particles having mean sizes between 8 and 36 nm. Some Feand Fe-oxide was also detected in the particles, making the interpretation of themagnetic properties difficult.
A method better suited for large scale synthesis is inert gas condensation.Balachandran et al. (1995) evaporated Cr in low pressure He and collected the Crnanoparticles on a cold finger. The powder could be compacted in-situ after anoxidation step with O2 to form Cr2O3. The nanophase powder with a mean particle sizeof 10 nm exhibited superparamagnetic behavior. Sintering led to an increase in particlesize, up to 80 nm at the highest sintering temperature, with the superparamagneticproperties partly retained.
Pyrolysis in a oxyhydrogen flame of Fe(CO)5 or iron acetylacetonate dissolvedin toluene led to γ-Fe2O3 powders with particle sizes as small as 5 nm (Grimm et al.,1997). Laser pyrolysis of Fe(CO)5 using a pulsed CO2 laser has been applied byMajima et al. (1994), who obtained nanoparticles with a mean size of 13 nm. Theparticles contained a large percentage of γ-Fe which is normally stable at high

76
temperatures and which is paramagnetic up to room temperatures. Vollath et al. (1995)synthesized γ-Fe2O3 particles in the size range 4-5 nm by heating FeCl3 in amicrowave plasma. The particles were found to be superparamagnetic. Asuperparamagnetic nanocomposite was synthesized by Zachariah et al. (1995), whoused a CH4/O2 flame as the reaction environment to which Fe and Si-bearingprecursors such as Fe(CO)5 and SiO2(CH3)6, were added. The magnetic Fe2O3
nanoparticles of 5-10 nm were encapsulated in SiO2 particles ranging from 30 to 100nm. The samples showed evidence for superparamagnetism over a wide temperaturerange. Hwang et al. (1997) synthesized 18 nm Ni nanoparticles encapsulated by agraphite layer several nanometers thick, to protect them against oxidation. This wasdone by an arc discharge plasma in a He environment with Ni contained in a graphiteanode. The encapsulated Ni nanocrystals showed a significant lowering of themagnetic coercivity and saturation magnetization , as compared with bulk Ni.
Spray pyrolysis has been used to produce nanoparticles of magnetic materialssuch as ferrites and garnets. Tang et al. (1989) atomized a solution of Fe(NO3)3 andBa(NO3)2 in water, and obtained after pyrolysis in a furnace spherical particles ofBaFe12O19 with sizes between 40 and 80 nm. Post-annealing was necessary to obtain acrystalline phase and achieve high coercivity values, up to 5360 Oe at roomtemperature.
Mizuguchi et al. (1994) introduced aqueous metal nitrate solutions in aerosolform into an ICP and obtained BaFe12O19 nanoparticles with sizes between 10 and 50nm. Film formation, obtained by an electrostatic precipitator at elevated temperaturesusing a H2-O2 flame, proved problematic due to deviations from stoichiometry. DeMarco et al.(1993) used a R.F. plasma suited for large scale nanoparticle production.Ni0.5Zn0.5Fe2O4 and NiFe2O4 nanoparticles with a mean size of about 55 nm wereproduced, containing Fe3O4 as an impurity. The nanoparticle powders had highercoercivities than the bulk material.
5.7 Conclusions: special process requirements for selectedfunctional applications
Two chemical compounds are selected for the remaining of this work. Onecomponent is selected for its potential quantum confinement effects. PbS is a narrow-gap IV-VI semiconductor with a cubic rock salt structure and is an attractive candidatefor the study of quantum confinement effects as its hole Bohr radius is 9 nm. Thisresults in strong confinement effects as compared to the II-VI semiconductors such asCdS and CdSe with Bohr radii of about 1 nm (Machol et al., 1994). The confinementresults in a blue shift in the optical absorption spectrum (Brus, 1984). The other

5. A review of synthesis of nanoparticles in the gas phase for electronic, optical and magnetic applications
77
material, SnO2, is selected for its gas-sensing properties, which were describedextensively in Chapter 5.3.
A size uniformity is important in order to study or make use of quantum sizeeffects, as a distribution of particle sizes will decrease or smear out these effects. Inview of the high specific surface and activity of SnO2 nanoparticles, considerableimprovement in sensing properties is expected. In order to understand the relationshipbetween gas-sensing behaviour and particle size better it is necessary to generatemonodisperse nanoparticles, because a distribution of particle sizes will decrease thespecial properties and complicates the interpretation of the experimental results. Thiswas also emphasized by Göpel and Schierbaum (1995) in their review article on futureprospects of SnO2 gas sensors: ‘Particular emphasis is put on preparing thin films ofSnO2 with homogeneous particle sizes in the nanometre range’. At the moment no gassensors based on almost equal-sized nanoparticles are available. As shown in thepreceding chapter, Brownian coagulation rules out the synthesis of monosizedparticles by gas-phase synthesis. Therefore, a size-fractionation technique will beapplied in this work in which a narrow fraction is taken from the original widedistribution.
Apart from the size homogeneity, the chemical composition is important. Incase of PbS, it should be investigated if it is possible to retain the stoichiometry whensublimating the source material directly. Furthermore, the particles should becrystalline as amorphous material does not show semiconducting properties. In case ofthe SnO2, some deviation of stoichiometry is desirable, as in substoichiometric SnO2,denoted by SnOx, the electrical transport properties are more suitable for gas sensingapplications. Furthermore, some special handling techniques are necessary. Thenanoparticles have to be brought onto a suitable substrate for use in functionalapplications. For some applications, e.g. doped gas sensors, a control over the mixingof two different nanoparticle flows is needed. It will be shown in the next chapter thatthe use of electrical effects allows size-fractionation, nanoparticle deposition andcontrolled mixing.


6. Controlling nanoparticle behaviour by use of electrical effects
79
6. Controlling nanoparticle behaviour by use ofelectrical effects
A control of gas-phase nanoparticle synthesis is possible on the basis of the movementof charged particles in an electric field. This allows size fractionation, direct particlesize measurement, deposition of nanoparticles onto suitable substrates and controlledmixing.
This requires nanoparticles which are charged. Therefore, a charger especiallysuited for nanoparticles is needed. In the newly developed twin Hewitt charger twocorona discharge zones are connected by a charging zone where the nanoparticleaerosol flows. Ions move into the charging zone alternating from each coronadischarging zone by means of a square-wave voltage. The operation parameters of thedevice are experimentally characterized and described in Chapter 6.1 with the goal tooptimize the charging efficiency in N2 carrier gas. The contents of this subchapter hasbeen published (Kruis and Fissan, 2001).
Most nanoparticle formation paths in the gas phase involve particle growthinduced by particle collision due to the Brownian motion. This leads to a minimumgeometric standard deviation of 1.4 (see Fig. 4.2.5), which is further increased byturbulence and variations in residence time. Narrowing the size distribution is possibleby use of a DMA at the cost of decreased particle number concentration. The standardDMA design is, however, not suitable for use at sub-atmospheric pressures. Lowerpressures are desirable for the synthesis because it will lead to a smaller mean particlesize and to a reduction of gas-phase impurities. Therefore, a new DMA has beendesigned to operate at lower pressures. Theoretical and practical considerations for thedesign will be shown in Chapter 6.2.
The application of the so-called electrical mobility analysis allows the directmeasurement of particle size distributions. For this goal, a DMA is connected to aparticle counter such as a condensation nucleus counter or an electrometer. Aninversion technique combined with the transfer function of the DMA and the chargingefficiency of the charging device allows to calculate the particle size distribution. Thistechnique will also benefit from an increased charging efficiency, as this increases thesensitivity in the nanoparticle size range. Furthermore, a DMA capable for operating atlower processes enables size measurements in low pressure reactors, which are used inindustry for TiO2 , SiO2 and soot particle synthesis.
The characterization of the electrical properties of thin nanoparticle films washampered by problems of contamination of the samples by air as the sample wastransported from the reactor to measurement set-up. A nanoparticle film formation
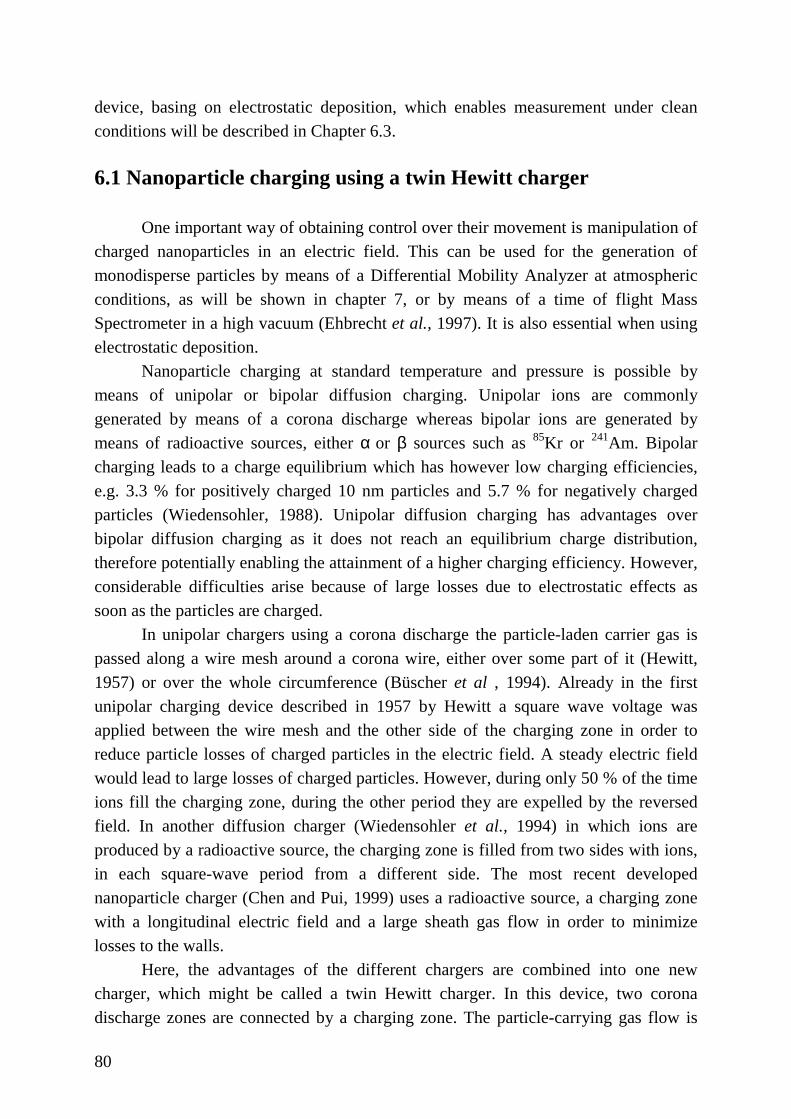
80
device, basing on electrostatic deposition, which enables measurement under cleanconditions will be described in Chapter 6.3.
6.1 Nanoparticle charging using a twin Hewitt charger
One important way of obtaining control over their movement is manipulation ofcharged nanoparticles in an electric field. This can be used for the generation ofmonodisperse particles by means of a Differential Mobility Analyzer at atmosphericconditions, as will be shown in chapter 7, or by means of a time of flight MassSpectrometer in a high vacuum (Ehbrecht et al., 1997). It is also essential when usingelectrostatic deposition.
Nanoparticle charging at standard temperature and pressure is possible bymeans of unipolar or bipolar diffusion charging. Unipolar ions are commonlygenerated by means of a corona discharge whereas bipolar ions are generated bymeans of radioactive sources, either α or β sources such as 85Kr or 241Am. Bipolarcharging leads to a charge equilibrium which has however low charging efficiencies,e.g. 3.3 % for positively charged 10 nm particles and 5.7 % for negatively chargedparticles (Wiedensohler, 1988). Unipolar diffusion charging has advantages overbipolar diffusion charging as it does not reach an equilibrium charge distribution,therefore potentially enabling the attainment of a higher charging efficiency. However,considerable difficulties arise because of large losses due to electrostatic effects assoon as the particles are charged.
In unipolar chargers using a corona discharge the particle-laden carrier gas ispassed along a wire mesh around a corona wire, either over some part of it (Hewitt,1957) or over the whole circumference (Büscher et al , 1994). Already in the firstunipolar charging device described in 1957 by Hewitt a square wave voltage wasapplied between the wire mesh and the other side of the charging zone in order toreduce particle losses of charged particles in the electric field. A steady electric fieldwould lead to large losses of charged particles. However, during only 50 % of the timeions fill the charging zone, during the other period they are expelled by the reversedfield. In another diffusion charger (Wiedensohler et al., 1994) in which ions areproduced by a radioactive source, the charging zone is filled from two sides with ions,in each square-wave period from a different side. The most recent developednanoparticle charger (Chen and Pui, 1999) uses a radioactive source, a charging zonewith a longitudinal electric field and a large sheath gas flow in order to minimizelosses to the walls.
Here, the advantages of the different chargers are combined into one newcharger, which might be called a twin Hewitt charger. In this device, two coronadischarge zones are connected by a charging zone. The particle-carrying gas flow is

6. Controlling nanoparticle behaviour by use of electrical effects
81
parallel to the corona wires and the wire mesh. Ions move into the charging zonealternating from each corona discharging zone by means of a square-wave voltagebetween the two wire meshes.
6.1.1 Experimental setup
6.1.1.1 The twin Hewitt charger
Fig. 6.1.1 shows the schematic diagram of the newly developed twin Hewittcharger. The particle-laden gas is introduced via a short inlet section into a squarecharging zone with a width of 16 mm and a height of 10 mm. The charging zone isseparated from the two ion production zones by means of metal wire meshes, and thebottom and top are composed of isolating material. The wire screens are connected totwo square-wave generators with opposite phase and a maximal voltage difference V∆of 600 V. The use of the square wave with a frequency f allows the use of a relativelylarge potential between both grids which results in a high ion concentration in thecharging zone. The use of a non-alternating field would lead to a continuousmovement of the charged particles toward the wire mesh.
Positive ions are produced by corona discharge of a 25 µm thick Au wire placedin the center of in a metal cylinder, which has at one side a slit of a length 15 cm and aheight 1 cm. This slit is placed towards the charging zone and is covered with the wiremesh. The careful handling of the thin Au wire is critical for obtaining a long life timeof the wire. The wire attached by glue to a needle is inserted through the openings atthe end of the cylinder, and immobilized by means of a isolation strip and a drop ofglue. Its’ electrical contact is made by means of a drop of silver paste.
The length of the charging zone L with a maximum length of 15 cm can beadjusted by covering part of the wire meshes with thin Al sheets. The exposed wiremeshes are always as close to the exit as possible.
Initial measurements using a constant high voltage connected to the coronasshowed problems with stability and reproducibility. This problem was solved by usingtwo different high voltage sources which were so regulated that a constant current inthe range 10 to 100 µA was obtained. The largest part of this current will flow via thecylinder and the square-wave generators, which are electrically connected, towardsground potential. This did not affect the functioning of the square-wave generators,which was checked by means of an oscilloscope.

82
A
HVHV
A
outlet
∆V
ion productionzone 1
ion productionzone 2
charging zone
34 mm16 mm
15 cm
inlet
Fig. 6.1.1. Schematic diagram of the twin Hewitt charger. Ions are produced in twocylindrical sections with a central Au wire with a diameter of 25 µm and move througha slit covered with wire mesh into the charging zone. A square wave electric potentialis established between both wire meshes.
6.1.1.2 Setup for measuring charging efficiencies
Fig. 6.1.2 shows the schematic diagram of the experimental setup used inmeasuring the charging efficiency. It consists of four parts: a generator ofmonodisperse particles, a device used for discharging the particles, the twin Hewittcharger and the measurement section for distinguishing charged and unchargedparticles.
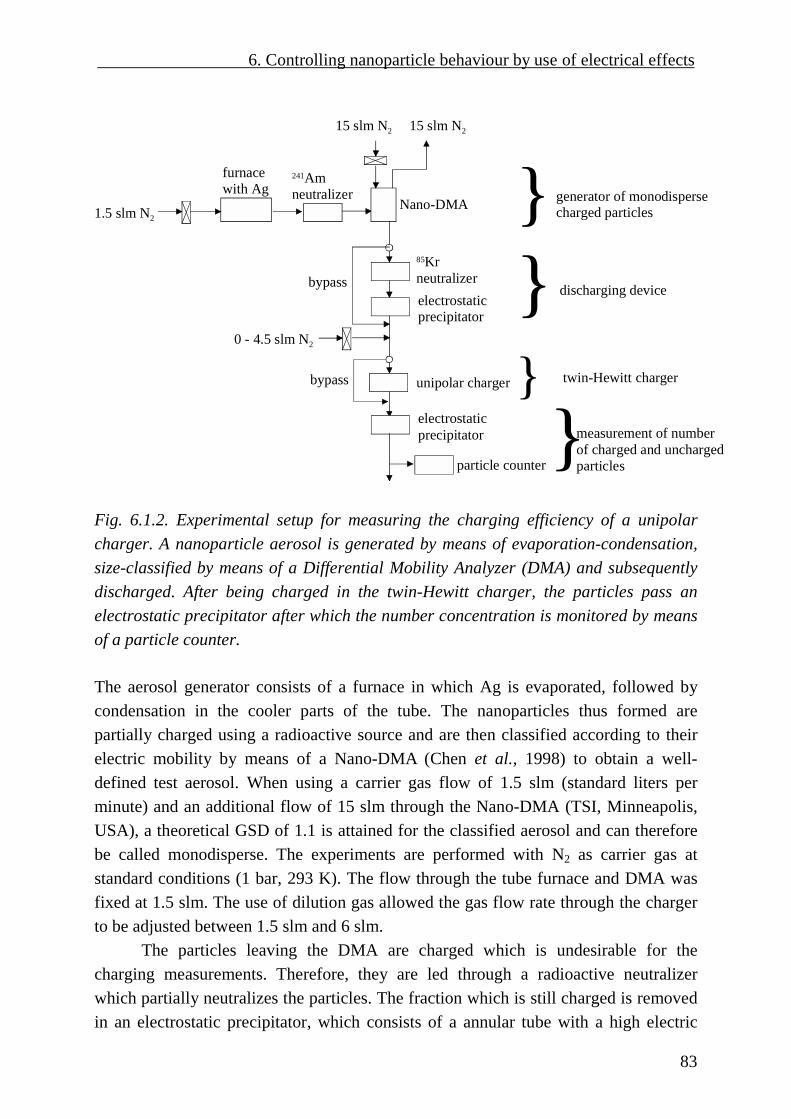
6. Controlling nanoparticle behaviour by use of electrical effects
83
furnacewith Ag
1.5 slm N2
241Amneutralizer
15 slm N215 slm N2
85Krneutralizerelectrostatic precipitator
Nano-DMA
bypass
0 - 4.5 slm N2
unipolar charger
electrostatic precipitator
particle counter
generator of monodispersecharged particles
discharging device
twin-Hewitt charger
measurement of number of charged and uncharged particles
bypass
Fig. 6.1.2. Experimental setup for measuring the charging efficiency of a unipolarcharger. A nanoparticle aerosol is generated by means of evaporation-condensation,size-classified by means of a Differential Mobility Analyzer (DMA) and subsequentlydischarged. After being charged in the twin-Hewitt charger, the particles pass anelectrostatic precipitator after which the number concentration is monitored by meansof a particle counter.
The aerosol generator consists of a furnace in which Ag is evaporated, followed bycondensation in the cooler parts of the tube. The nanoparticles thus formed arepartially charged using a radioactive source and are then classified according to theirelectric mobility by means of a Nano-DMA (Chen et al., 1998) to obtain a well-defined test aerosol. When using a carrier gas flow of 1.5 slm (standard liters perminute) and an additional flow of 15 slm through the Nano-DMA (TSI, Minneapolis,USA), a theoretical GSD of 1.1 is attained for the classified aerosol and can thereforebe called monodisperse. The experiments are performed with N2 as carrier gas atstandard conditions (1 bar, 293 K). The flow through the tube furnace and DMA wasfixed at 1.5 slm. The use of dilution gas allowed the gas flow rate through the chargerto be adjusted between 1.5 slm and 6 slm.
The particles leaving the DMA are charged which is undesirable for thecharging measurements. Therefore, they are led through a radioactive neutralizerwhich partially neutralizes the particles. The fraction which is still charged is removedin an electrostatic precipitator, which consists of a annular tube with a high electric

84
field intensity (2 kV/cm). The discharging section can also be bypassed in order toproduce monodisperse charged particles for the measurement of electric losses in thecharger.After being charged in the twin-Hewitt charger, the particles pass a secondelectrostatic precipitator before being counted in a particle counter (UCPC 3025, TSI,Minneapolis, USA) which has a detection threshold of about 3 nm. The numberconcentration of charged particles +n is determined by taking the difference betweenparticles counted without an electric field (giving 0nn ++ ) applied in the electrostaticprecipitator and particles counted with an electric field applied field (giving thenumber concentration of uncharged particles 0n ) applied. The extrinsic chargingefficiency can be calculated by the following equation:
ine n
nE += (6.1.1)
where inn is the number concentration of particle entering the charger. The chargingthus defined is called extrinsic because the charging efficiency is actually higher, butcharged particles are lost more easily than uncharged particles. In the remainder of thisarticle, when referring to charging efficiency the extrinsic charging efficiency ismeant. The intrinsic charging efficiency iE is defined as the fraction of particles whichare charged inside the charger, but which also can be lost there.
6.1.2 Ion concentration in the charging zone
In this section, the ion concentration in the charging section is estimated. Thecharging zone is in between 0=x and ax = , a is the width of the charging channel.We calculate the electrical field )(xE and the ion concentration )(xn for the case ofconstant grid voltage. On the basis of Maxwell’s theory, the electrical field betweenthe two grids can described by:
0
)(divε
ρ xE = (6.1.2)
where )(xρ is the space charge density and 0ε the dielectric constant of vacuum. Asthe upper and lower end of the charging channel is an isolator, we assume that the fieldlines do only have a component in x -direction:
0
)()(ε
ρ xdx
xdE = (6.1.3)

6. Controlling nanoparticle behaviour by use of electrical effects
85
The ion current density j is given by:
vj ρ= (6.1.4)
The ion velocity ionv is determined by:
)()( xEZxv ionion = (6.1.5)
where ionZ is the electric mobility of the ions. The current density can be expressed onthe basis of the ion current I through the grid, which has an effective area of wL , as:
wLIxEZx ion =)()(ρ (6.1.6)
The space charge defines the ion concentration:
enion=ρ (6.1.7)
so that the space charge can be eliminated, leading to a differential equation for )(xE :
cwLZ
IxxEion
+=0
2)(ε
(6.1.8)
In order to determine I and ionn from experiments, we have to solve:
∆=a
VdxxE0
)( (6.1.9)
leading to
VccwLZ
IaI
wLZ
ion
ion ∆=
−
+ 2/3
2/3
0
0 23 ε
ε(6.1.10)
For each pair ( )IV ,∆ we can determine c by solving this equation iteratively and determine
the ion concentration in the charging zone:

86
The ion current per unit area of wire mesh wLI / , measured with constant electric fieldapplied over the charging zone, showed little dependence on the length of the chargingzone, as expected. Using the model the ion concentration can be calculated based onthe experimental values of the ion current. The product of ion concentration and time
tnion , an important parameter in the charging process, is shown in Fig. 6.1.3. The ionconcentration varies over the width of the charging zone, therefore the ionconcentration in the middle of the charging zone is taken. Increasing L or decreasingthe flow rate for φ yield a higher value of tnion . The nonlinear increase of tnionindicates that the ion concentration is not constant at various L . A possibleexplanation is that the electric field will extend beyond the charging zone into theaerosol in- and outlet, leading to a higher effective length. This boundary effect isobviously less important at higher L .

6. Controlling nanoparticle behaviour by use of electrical effects
87
0
2E+13
4E+13
6E+13
8E+13
0 5 10 15L (cm)
nio
nt
(m-3
s-1
)
1.5 slm
3 slm
6 slm
Fig. 6.1.3. The product of ion concentration and time tnion as function of the length ofthe charging zone L for different flow rates as indicated in the figure. ionn is calculated
at ax21= .
6.1.3 Charging efficiency
6.1.3.1 Effects of frequency and electrical potential
The charging efficiency was measured as function of the square wave frequencyand the voltage difference applied between the two meshes in order to find the bestoperating conditions. The extrinsic charging efficiency as function of the frequency isshown in Fig. 6.1.4 for different particle sizes. At frequencies above 100 Hz, theextrinsic charging efficiency decreases but is almost constant below 100 Hz.Frequencies below 10 Hz result in undesirable fluctuations of the high voltage of thecorona wires, as the voltage supply is used in the constant current mode. In theremainder of the experiments a frequency of 50 Hz was used.

88
Fig. 6.1.4. Extrinsic charging efficiency as function of the frequency of the squarewave generator for different particle sizes. Further conditions were cI = 50 µA, V∆ =400 V, φ = 1.5 slm , L = 15 cm.
Fig. 6.1.5 shows the extrinsic charging efficiency as function of the voltagedifference V∆ using the whole length of the charging zone, L = 15 cm. After an initialincrease, the charging efficiency eE is not affected by the value of V∆ when
V∆ >300V. Using a very short charging zone, L = 1 cm, eE steadily increases withV∆ . The increase seems to level off around 600 V. Higher voltage differences could
not be applied as the current through the square wave generators became too high.Therefore, V∆ = 600 V seemed to be optimal for obtaining a high charging efficiencyfor all lengths of charging zones.
0
5
10
15
20
25
30
10 100 1000f (Hz)
Ee (%
)
20 nm
10 nm
6 nm
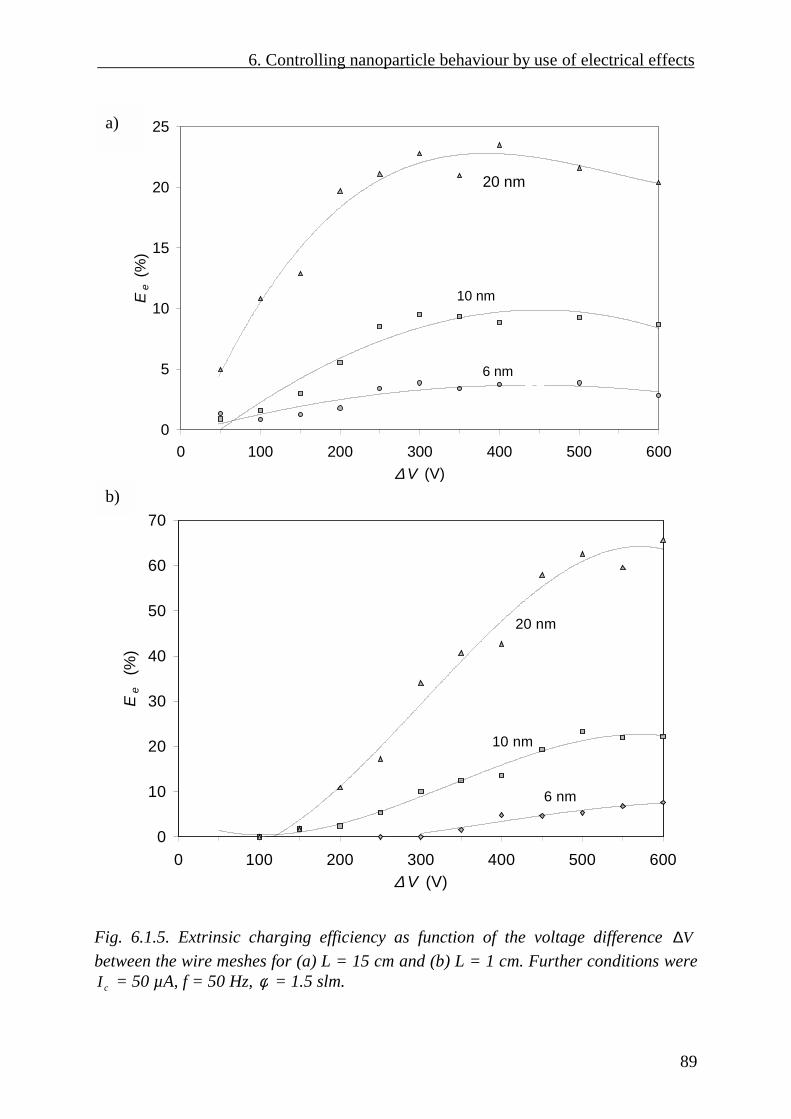
6. Controlling nanoparticle behaviour by use of electrical effects
Fb
0
5
10
15
20
25
0 100 200 300 400 500 600∆ V (V)
Ee (%
)
20 nm
10 nm
6 nm
70
a)
b)
89
ig. 6.1.5. Extrinsic charging efficiency as function of the voltage difference V∆etween the wire meshes for (a) L = 15 cm and (b) L = 1 cm. Further conditions werecI = 50 µA, f = 50 Hz, φ = 1.5 slm.
0
10
20
30
40
50
60
0 100 200 300 400 500 600∆ V (V)
Ee
(%
)
20 nm
6 nm
10 nm

90
6.1.3.2 Effects of length of charging zone and residence time
After obtaining a lower charging efficiency than we expected with L = 15 cm,we decided to perform a systematic study into the effect of the length of the chargingzone. The method described earlier for obtaining a variable length is not ideal becausethe shorter charging zones have a relatively long entrance zone which causes somediffusion losses. This will be discussed later on. Building differently sized chargers ishowever unpractical and uneconomical. The lowest flow rate through the charger φwas 1.5 slm, a common flow rate when operating DMAs. For material synthesisapplications, higher flow rates are desirable so this flow rate was increased to 3 and 6slm in order to investigate the effect of having a shorter residence time in the charger.The residence times in the charging zone with L = 15 cm are τ = 0.96, 0.46 and 0.23 sfor 1.5, 3 and 6 slm, resp.
Fig. 6.1.6 shows the effect of varying L and φ for particles with diameter 6 nm(Fig. 6.1.6a), 10 nm (Fig 6.1.6b) and 20 nm (Fig 6.1.6c). For each particle size and φthere exists a length where eE is maximal. This length is L = 3-5 cm for φ = 1.5 slmand around L = 10 cm for φ = 6 slm, independent of particle size. For larger flow ratesclearly a longer charging zone is needed. Furthermore, when the particles becomesmaller it seems to become increasingly difficult at higher flow rates to reach the samecharging efficiencies as with φ = 1.5 slm by changing L.
0
5
10
0 5 10 15L (cm)
E (%
)
3 slm
1.5 slm
6 slm
a)
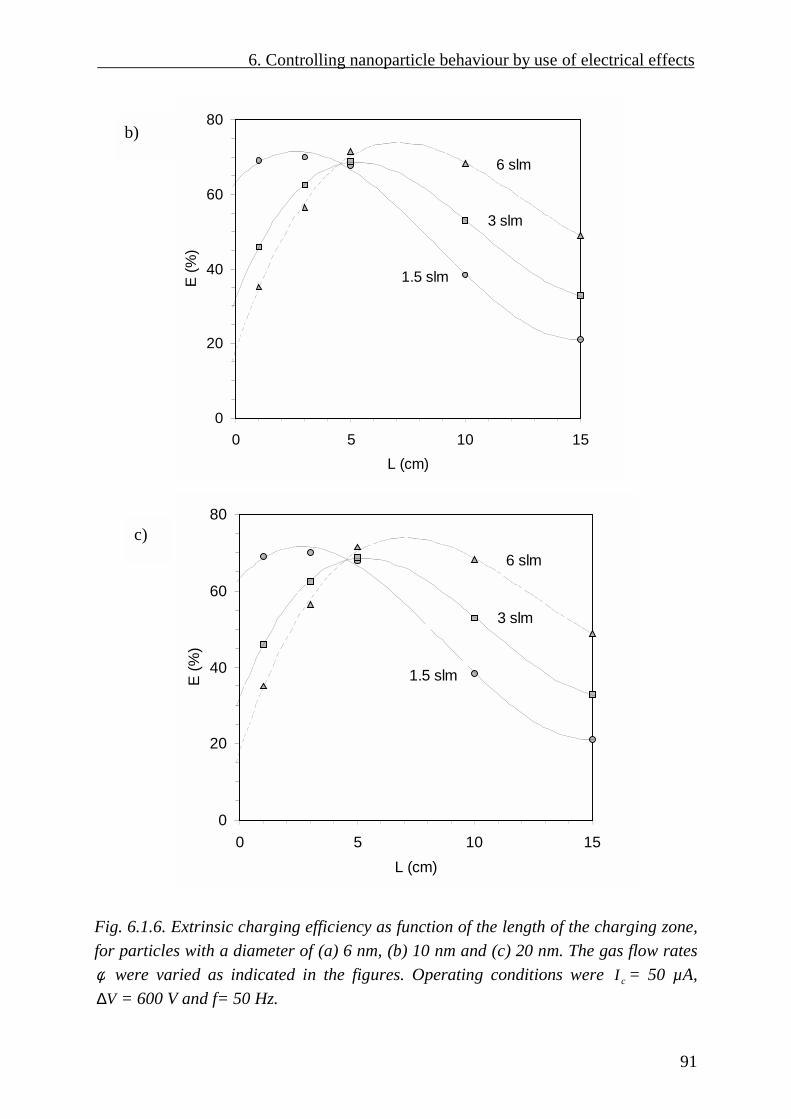
6. Controlling nanoparticle behaviour by use of electrical effects
91
0
20
40
60
80
0 5 10 15L (cm)
E (%
)
3 slm
1.5 slm
6 slm
Fig. 6.1.6. Extrinsic charging efficiency as function of the length of the charging zone,for particles with a diameter of (a) 6 nm, (b) 10 nm and (c) 20 nm. The gas flow ratesφ were varied as indicated in the figures. Operating conditions were cI = 50 µA,
V∆ = 600 V and f= 50 Hz.
b)
c)
0
20
40
60
80
0 5 10 15L (cm)
E (%
)
3 slm
1.5 slm
6 slm

92
Fig. 6.1.7 shows the charging efficiency eE as function of the particle size up to50 nm, for φ =1.5 slm (Fig 6.1.7a) and 6 slm (Fig 6.1.7b). Decreasing the particle sizealso decreases eE , below 6 nm the efficiency becomes too low for accuratemeasurement and for practical application.
0
20
40
60
80
100
0 10 20 30 40 50Dp (nm)
E (%
)
L=1 cm
L=3 cm
L
L=15 cm
Fiofsh
a)
b)
0
20
40
60
80
100
0 10 20 30 40 50Dp (nm)
E (%
)
L=1 cm
L=3 cm
L=15 cm
g. 6.1.7. Extrinsic charging efficiency as function of particle diameter for a flow rate (a) 1.5 slm and (b) 6 slm. Curves for different lengths of the charging zone L areown. Operating conditions as in Fig. 6.1.5.
6. Controlling nanoparticle behaviour by use of electrical effects
93
6.1.4 Particle losses in the charging zone
A key in understanding the performance of a nanoparticle charger lies inunderstanding by what mechanisms the particles are lost. There are severalmechanisms which might be responsible for the particle losses:(i) The Brownian diffusion losses affects both charged and uncharged particles.(ii) The oscillation of charged particles due to the alternating electrical field will
lead to particles moving toward the wire mesh, so that particles relatively closeto the wire mesh will be lost there.
(iii) The space charge due to the unipolar ions in the charging zone will drivecharged particles toward the walls, which are the wire meshes and the upperand lower isolated parts of the channel. This is difficult to describe by a model,because the system is two-dimensional and periodically changing.
(iv) Electrostatic effects which will be especially important for the aerosol in thevicinity of the isolating material at the top and bottom of the charging channel.The material can become charged due to static electricity or deposition ofcharged particles.
Especially the last two effect are very difficult to model, so a series of experimentswere done to investigate the importance of particle losses. The experiments wereperformed with charged particles, as diffusion losses of uncharged particles werefound to be small in magnitude compared to the losses of charged particles. The resultsare shown in Fig. 6.1.8. Most experiments were performed with the longest chargingsection (L=15 cm), because this is the system with the largest losses.
First consider the case (a) with φ=6 slm and V∆ =0 V, so without applied field.The fraction of charged particles lost increases with decreasing particle sizes, becausesmaller particles have a higher electrical mobility, so that they are more ‘sensitive’ toelectrical fields and electrostatic effects. Applying now the square wave potential overthe charging channel, case (b), no significant change in the particle loss is observed.This means that effect (ii), losses due to the oscillation of the particles, is probably notvery important and that the effects (iii) and (iv) are dominant. When the gas flow rateφ is decreased to 1.5 slm, case (c), the losses are seen to increase, except for particlesbelow some 10 nm. It is probable that a kind of layer exists next to the walls and wiremeshes of the charging channel, where particles have a high probability of being lostby mechanism (ii) or (iv). The width of this layer will be larger for smaller particles. Alonger residence time increases the probability that charged particles enter this layer byBrownian diffusion or space charge effects, and furthermore the longer the particlesremain in this layer next to the wall, the higher the probability they will get lost. Thisis clearly illustrated by comparison of case (c) for L=15 cm and (d) for L=3 cm. Thelosses for L=3 cm are a factor of 5-8 smaller than for L=15 at this low gas flow rate.
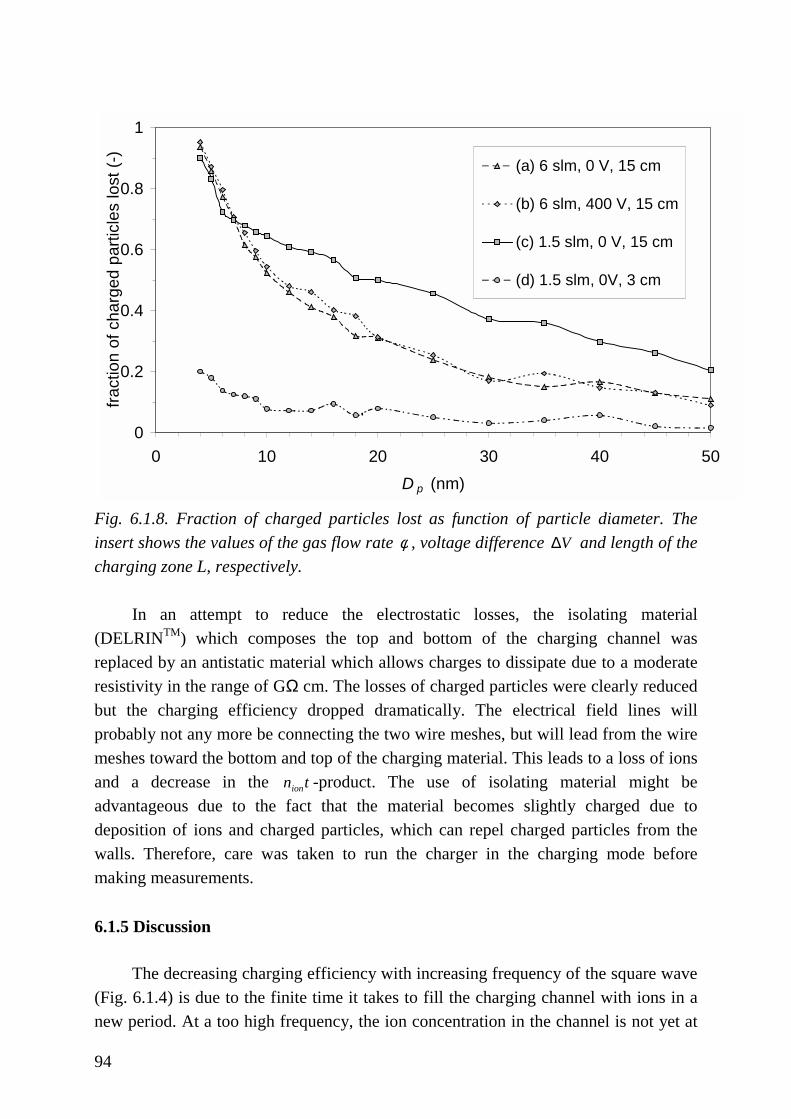
94
Fig. 6.1.8. Fraction of charged particles lost as function of particle diameter. Theinsert shows the values of the gas flow rate φ , voltage difference V∆ and length of thecharging zone L, respectively.
In an attempt to reduce the electrostatic losses, the isolating material(DELRINTM) which composes the top and bottom of the charging channel wasreplaced by an antistatic material which allows charges to dissipate due to a moderateresistivity in the range of GΩ cm. The losses of charged particles were clearly reducedbut the charging efficiency dropped dramatically. The electrical field lines willprobably not any more be connecting the two wire meshes, but will lead from the wiremeshes toward the bottom and top of the charging material. This leads to a loss of ionsand a decrease in the tnion -product. The use of isolating material might beadvantageous due to the fact that the material becomes slightly charged due todeposition of ions and charged particles, which can repel charged particles from thewalls. Therefore, care was taken to run the charger in the charging mode beforemaking measurements.
6.1.5 Discussion
The decreasing charging efficiency with increasing frequency of the square wave(Fig. 6.1.4) is due to the finite time it takes to fill the charging channel with ions in anew period. At a too high frequency, the ion concentration in the channel is not yet at
0
0.2
0.4
0.6
0.8
1
0 10 20 30 40 50D p (nm)
fract
ion
of c
harg
ed p
artic
les
lost
(-)
(a) 6 slm, 0 V, 15 cm
(b) 6 slm, 400 V, 15 cm
(c) 1.5 slm, 0 V, 15 cm
(d) 1.5 slm, 0V, 3 cm

6. Controlling nanoparticle behaviour by use of electrical effects
95
its’ maximum. The mean ion concentration will therefore drop above a certainfrequency, thereby lowering the charging efficiency. Increasing the voltage difference
V∆ over the charging channel (Fig. 6.1.5) also increases the ion concentration. AboveV∆ =500 V the increase in charging efficiency starts to level off, probably because the
particle loss mechanisms (ii) and (iii) which are dependent on the applied field becomemore dominant.
The maximum in the charging efficiency as function of the length L of thecharging channel (Fig. 6.1.6) is more complicated to understand. From themeasurements of the losses of charged particles (Fig. 6.1.8), it is clear that a smallervalue of L leads to a significant decrease in charged particle losses. At the same time,however, the tnion -product which influences directly the intrinsic charging efficiencydrops with lower L. From Fig. 6.1.3 it can be seen that the decrease in the tnion -product is more pronounced at lower values of L, probably due to non-uniformity ofthe electric field, as the length of the charging channel L is shorter than its’ width atthe smallest value of L. Therefore, the maximum in the charging efficiency occursthere where the tnion -product is sufficiently high for obtaining a high intrinsic chargingefficiency, but where L is not too high in order to minimize the losses of chargedparticles. A higher value of the gas flow rate φ leads to a lower tnion -product atconstant L (Fig. 6.1.3), so that a longer charging channel is necessary.
The present charger does not use a sheath gas flow along the walls or wiremeshes. A sheath flow have been used in order to decrease the losses of chargedparticles. Chen and Pui (1999) report reaching an extrinsic charging efficiency of 65 %(with a definition based on absolute particle number, not on particle concentration) forparticles with a diameter of 10 nm. However, a large sheath gas flow is applied whichresults in a dilution of the aerosol by a factor of four. This dilution is usually notdesired. Using our definition of extrinsic charging efficiency (eq. 6.2.1), an extrinsiccharging efficiency of 16 % would result.
6.2 A Differential Mobility Analyzer design for low pressures
The differential mobility analyzer (DMA) is the predominant instrument for measuringthe size distribution of submicron aerosols. Additionally, the instrument is more andmore being used as a source for delivering particles with a narrow size distribution. Ina DMA, charged particles are separated according to their electrical mobility. In acylindrical DMA, the median value of the electrical mobility of the classified particlesis given by (Knutson and Whitby, 1975):
( )LV
RRQZ cp π2/ln 12= (6.2.1)

96
in which L is the effective electrode length, 1R and 2R the inner and outer radii, V theapplied voltage and cQ the flow rate of the sheath gas. In another DMA design, theradial DMA originating from Pourprix and tested by Fissan et al. (1998) the electricalmobility is given by:
( )VRRhQ
Z cp 2
122 −
=π
(6.2.2)
in which h is the distance between the electrodes. Both DMA types are available inseveral design types, and their performance was tested by Fissan et al. (1996). In Fig.6.2.1 both types are shown.
The mobility pZ can be related to a mobility-equivalent diameter:
p
cp d
neCZ
πµ3= (6.2.3)
where n , e , cC , µ and pd are the number of elementary charges, the elementaryelectrical charge, the Cunningham correction factor, and the gas viscosity,respectively. For charged nanoparticles, the number of elementary charges is usuallyone.
The performance and suitability of a DMA for a certain application, i.e a givenflow rate and pressure, is a function of the following instrument characteristics:• Deviation from the ideal transfer function, e.g. by diffusional broadening effects.
Diffusional broadening is caused by the Brownian movement of the nanoparticlesbetween inlet and outlet slits, and increases with decreasing particle size.
• Particle losses inside the instrument, e.g. by diffusional or electrostatic losses.• The maximal voltage before sparking between the two electrodes occurs.• The maximal flows allowed in the instrument before turbulence occurs.• Pressure drop inside the instrument.The dynamic range of the instrument is usually limited to smaller particle sizes by theallowed value of the diffusional broadening , and to larger sizes the limitation is givenby the voltage at which sparking occurs.
DMA’s are designed to operate at atmospheric pressure. However, manynanoparticle synthesis systems operate in the mbar-range. There has been only onereport on a DMA capable to operate under lower pressure conditions, 70-760 Torr(Seto et al., 1997). The instrument is of the cylindrical type.
There are several considerations for low-pressure operation. When decreasingthe pressure, the diffusion coefficient of particles increases as it is a linear function ofthe mean free path. This can be offset by increasing the velocity inside the instrument.Seto et al. (1997) found out that the performance could be kept on an acceptable level

6. Controlling nanoparticle behaviour by use of electrical effects
97
when keeping the mass flow rate of the gas constant. A constant mass flow rateimplies a higher gas velocity, as the product of velocity and density is constant.
In this work, a radial DMA is taken as geometry. The main reason is that theinstrument is easily constructed in comparison to cylindrical DMA’s. This can clearlybe seen in Fig. 6.2.1. The performance of radial DMA’s at atmospheric pressure hasbeen experimentally found to be equal or even surpass that of a cylindrical geometry.
The tendency of a flow to become turbulent is determined by the Reynoldsnumber. For a simple tube flow, it is given by:
µρ tubevD
=Re (6.2.4)
with ρ as gas density, v as gas velocity and tubeD as tube diameter. When decreasingthe pressure by a factor C , the gas velocity v is not affected. The gas density changeswith a factor C/1 and the gas velocity is multiplied with a factor C . This means thatthe Reynolds number is not affected by changing the pressure. For geometries otherthan a tube, the hydraulic diameter hD has to be used in eq. 6.2.4. The conclusion thatthe Reynolds number is independent of system pressure is also valid for other DMAgeometries, as the pressure does not change the hydraulic diameter. For the cylindricalDMA geometry, the hydraulic diameter can be derived to be:
( )21
21
222
rrrrDh +
−= (6.2.5)
For a radial DMA, the hydraulic diameter is:
hDh 2= (6.2.6)
The standard conditions for DMA operation are an aerosol flow of 1.45 slm, sheathflow of 15 slm and N2 carrier gas at STP. It can be shown that most cylindrical DMA’soperate with Reynolds numbers below 1000. However, for the radial DMA thevelocity is highest close to the central exit. When calculating for r =1.5 mm theReynolds number, a value of 3890 is found which is in the turbulent range.Interestingly, the existing instrument does not show signs of turbulence which wouldhave been detected by an increase in the transfer function. This can be understood bythe practical experience that it takes some time for turbulences to develop. Because theflow is initially laminar and the actual position where the flow becomes turbulent isclose to the exit, it looks like turbulence did not develop. The system is, however,sensitive to small disturbances.

98
Fig. 6.2.1. a) Cylindrical (Chen et al., 1998) and (b) radial (Fissan et al., 1998) DMAdesign.
a)
b)

6. Controlling nanoparticle behaviour by use of electrical effects
99
We can now derive the ratio of the Reynolds numbers of the two geometries:
rad
cylcyl
cylhrad
radhcyl
cyl
rad
rrr
DADA
2ReRe ,2,1
,
, +== (6.2.7)
Because the typical radial dimensions of a cylindrical DMA are in the cm-range and inthe mm-range for a radial DMA, the radial DMA with a central outlet shows a highertendency for turbulence. One solution to decrease the Reynolds number for the radialDMA which is adopted here, is not to use a central outlet but a slit at some distance tothe central axis. This increases the value of radr and decreases thus the value of theReynolds number.
When designing a DMA, an important performance criterion is the diffusionalbroadening at the lowest particle diameter to be classified. This broadening might beestimated by means of the Péclet number, which is the ratio of the particle convectiveto diffusive transport. For the radial DMA, the Péclet number is given by:
( )DRRhQ
Pe crad 2
122 −
=π
(6.2.8)
in which D is the particle diffusion coefficient. Fissan et al. (1997) showed that thehalf-width of the transfer function increases with decreasing Péclet number, based onthe mean velocity. This can be seen in Fig 6.2.2. This diagram shows that thedifference from the ideal value of 0.1 becomes more than 50 % when the Pécletnumber becomes below smaller than 1000. This result can be used in order to estimatefor given geometry and experimental conditions the smallest particle diameter whichcan be fractionated with reasonable accuracy.
Practical experience showed that a DMA configuration usually allows a particlesize range between one and two decades. Therefore it was decided to design twoDMA’s, so that by combining the two instruments a larger measurement range isobtained. In table 6.2.1. the chosen geometry parameters are shown. Two slits, a largerone for the aerosol entrance and a smaller one for the monodisperse aerosol outlet areused. The Reynolds number at the aerosol outlet is now in the laminar range. For thecalculations which assume a slit with zero width, the middle of the slit is used as theradial position of the slit.

100
Fig 6.2.2. Experimental and analytical half-width HW of a radial DMA (SMEC) and acylindrical DMA (TSI-short) as a function of the Péclet number. The sheath flow rateis 10 slm and 15 slm, respectively (Fissan et al., 1997).
Table 6.2.1. Geometry parameters (in mm) of the proposed low-pressure radialDMA’s.
type R1, inner R1, outer R2, inner R2, inner hLP-RDMA1 4.6086 6.6517 21 21.9876 10LP-RDMA2 4.6086 6.6517 82 82.9876 15
For predicting the measurement range of the instruments at a lower pressure, thefollowing procedure is followed. For each particle size, the Péclet number is calculatedfor the usual operation at 1 bar and also at 100 mbar. This is shown in Fig. 6.2.3 forboth DMA geometries. The smaller one (LP-RDMA1) is usually operated with higherflow rates (15 slm) in order to reduce the diffusional losses, whereas the larger one(LP-RDMA2) is operated with a lower flow rate in order to enable size fractionation oflarger particles.
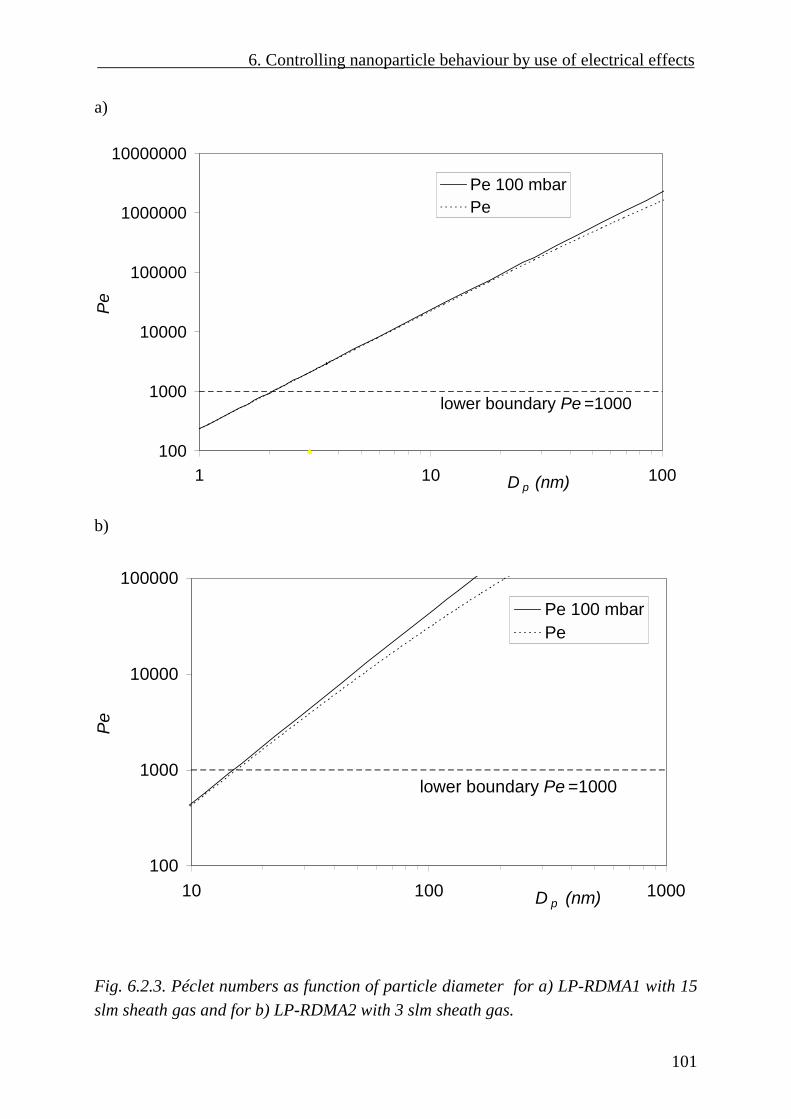
6. Controlling nanoparticle behaviour by use of electrical effects
101
a)
b)
Fig. 6.2.3. Péclet numbers as function of particle diameter for a) LP-RDMA1 with 15slm sheath gas and for b) LP-RDMA2 with 3 slm sheath gas.
100
1000
10000
100000
1000000
10000000
1 10 100D p (nm)
Pe
Pe 100 mbarPe
lower boundary Pe =1000
100
1000
10000
100000
10 100 1000D p (nm)
Pe
Pe 100 mbarPe
lower boundary Pe =1000

102
It is interesting to see that the Péclet number is not changing substantially whenoperating at lower pressures as compared to standard conditions. This is due to themass flow rate being constant, so that the actual velocity increases. The increaseddiffusion coefficient of particles at lower pressures is compensated by the higher flowrate at lower pressures. Because the ratio of volumetric flow rate and diffusioncoefficient is used in the Péclet number, it does not change. For larger particles thedeviation is due to the fact that the particles are not any more in the free-molecularregime for which the diffusion coefficient is inversely proportional to pressure. Fromthe figures it becomes clear that, when taking Pe=1000 as lower limit where adequatefractionation is still possible, the LP-RDMA1 has a lower particle diameter limit of 2nm and the LP-RDMA2 of about 15 nm.
The upper limit for the particle size is determined by the voltage which can beapplied before sparking occurs. The maximal field strength is, however, a pressure-dependent function and decreases when the pressure decreases, until some point in thesub-mbar range where it increases again which is not of interest here. In Fig. 6.2.4 thevoltage which has to be applied is shown as function of particle diameter. As indicatedin the figure, the maximum voltage which can be applied is lower in case of the lowerpressure. The upper particle limit with the given sheath flow rates is 30 nm for thesmall type and 250 nm for the large type. These are of course estimations and willhave to be experimentally determined.
The preceding engineering estimations result in a particle size range of 2-30 nmand 15-250 nm at 100 mbar for the small and large type, respectively. It can beconcluded that the lower particle limit is not affected essentially by pressure decreasebut that the reduced maximal field strength results in a lower maximum particle sizethan in case of standard conditions. Each particle size decade probably requires anappropriate DMA.
After these quantitative estimations of the operation range of the two proposedradial DMA’s, construction designs were made. The design is shown schematically inFig. 6.2.5. Important features are:• The aerosol outlet is a slit.• The excess gas flow is directed toward the outlet by means of a protrusion in the
middle of the central electrode.• The electric field is almost perfectly homogeneous inside the fractionation channel.• Stainless steel is used for all metal parts and delrin is used as isolation material.• There are no holes for screws at the outside of the instrument, as this is not
compliant with the requirement for vacuum tightness. Much care was taken to putthe screws inside the vacuum chamber, but outside the main fractionation channel.The design requires the upper and lower parts to be assembled before finalassemblage.

6. Controlling nanoparticle behaviour by use of electrical effects
103
a)
b)
Fig. 6.2.4. Voltage to be applied as function of particle diameter for a) LP-RDMA1with 15 slm sheath gas and for b) LP-RDMA2 with 3 slm sheath gas.
1.00E+01
1.00E+02
1.00E+03
1.00E+04
1.00E+05
1.00 10.00 100.00D p (nm)
U (V
)
U 100 mbarU
upper boundaries due to sparking
1.00E+01
1.00E+02
1.00E+03
1.00E+04
1.00E+05
10.00 100.00 1000.00D p (nm)
U (
V)
U 100 mbarU
upper boundaries due to sparking

104
• Standard KF16 vacuum connections are used as gas and aerosol in- and outlets.• The sheath gas is introduced through four large inlet ports. A porous inset (not
shown in the figure) will be used as flow laminarisator. The excess gas outlet hasonly one outlet port.
• The DMA can very quickly be opened and cleaned, which is important formaterials synthesis applications.
• Both aerosol in- and outlet are positioned at the axis of the instrument.• The aerosol inlet does not have a swirling velocity compound in tangential
direction• The design is such that the main components can easily be replaced. Several other
delrin isolation inserts allow the distance between the electrodes to be easilymodified.
• The internal tightness of the different flow channels is obtained by means of O-rings.
Fig. 6.2.5. Schematic design of the new LP-RDMA.
aerosol inlet excess gas outlet
sheath gas inlet (4x)monodisperse aerosol outlet

6. Controlling nanoparticle behaviour by use of electrical effects
105
The main uncertainties concern the pressure drop in the instrument and the distributionof the aerosol flow inside the inlet slit. These will have to be resolved experimentally.
6.3 An electrostatic precipitator for measurements underclean conditions
A nanoparticle aerosol will be of no practical use when the particles are not in someway deposited on a substrate or imbedded in some matrix. In the method applied inthis work to produce well-defined nanoparticles, the particles leaving the process areunipolarly charged. A simple method to deposit them onto a substrate is to use anelectrostatic precipitator (ESP). Here, a central electrode connected to a high voltage(5-15 kV) with the opposite polarity as that of the particles extracts the nanoparticlesfrom the flow. When a substrate is placed on the central electrode, a thin layer ofnanoparticles develops in form of a circular deposit with a diameter of 5-10 mm,depending on particle size, electrode diameter and voltage. The ESP is schematicallyshown in Fig. 6.3.1.
Fig. 6.3.1. Schematic view of the electrostatic precipitator (ESP).
HV
SampleSample Support Support
ElectrodeElectrode
FluidFluid
Unipolarly charged aerosolUnipolarly charged aerosol
particlesparticles

106
The first version of the ESP was developed by Dixkens and Fissan (1997) andwas subsequently adopted for our goals. The modifications include construction fromstainless steel, an easily exchangable central electrode with the goal to change itsdiameter and the possibility to insert a small inlet tube which extends closer to theelectrode. Over a critical orifice in the central inlet the apparatus can be used as a low-pressure impactor when a pump is connected to the gas outlet. This second mechanismfor particle deposition onto a substrate allows the deposition of uncharged particlesand increases the deposition velocity so that particle adhesion can be improved.Furthermore, it is expected that films formed by uncharged particles are morehomogeneous than those formed by charged particles, as charged particles can lead tothe formation of dendrites, long particle chains pointing away from the surface. Thepresent version allows to apply both deposition mechanisms and even a combinationof them.
During preliminary measurements of electrical properties of thin films of PbSnanoparticles, it was found that measurements in ambient air were not particularlyreproducable. The substrates with deposited nanoparticles had to be taken from theESP toward a probe station, so that surface contamination occurred. An measurementof the electrical properties without air exposure is preferable and thus a special ESPhas been constructed. It consists of a deposition chamber, where the ESP itself issituated, and a chamber which can be evacuated in which the deposition electrode canbe placed after particle deposition. The electrical contact is obtained overmicromanipulators with meaurement tips. The substrate is in its measurement positionplaced close to an observation window for accurate observation of the contactingprocess by means of a macroscope. Fig. 6.3.2 shows the schematics of the M-ESP.
The advantage of the system is that immediately after particle deposition, theelectrode can be brought in measurement position and evacuated. A pressure of 10-3
mbar was obtained, which was limited by the characteristics of the pump. Theinstrument is constructed such that the substrate can easily be connected to a liquid N2-cooling system.

6. Controlling nanoparticle behaviour by use of electrical effects
107
Fig. 6.3.2. Schematics of the measurement-ESP (M-ESP).
6.4 Conclusions: Instrumentation for controlling nanoparticlebehavior
In this Chapter, newly developed instrumentation for controlling nanoparticle behavior‘in-flight’ is described which allow to obtain more control over processes which areessential for the synthesis and handling methods chosen in this work. These processesare nanoparticle charging, nanoparticle size fractionation and nanoparticle deposition.
A newly developed nanoparticle charger, the twin-Hewitt charger, allows alarger fraction of the nanoparticles to be charged, which is important to get a higheryield. A higher yield would result in a shorter deposition time, which is importantbecause the deposition of thin nanoparticle layers takes at present still too long. Theinstrument has been extensively investigated experimentally in order to find theoptimal charging conditions.
Differential Mobility Analysis at lower pressures than atmospheric pressure hasbeen investigated theoretically. It was found that the lower particle limit is not changedfundamentally with lower pressures when keeping the mass flow rate constant, but thatthe higher particle limit is decreased due to decrease of the maximum allowed fieldstrength. A Differential Mobility Analyzer design for low pressure has been presented.It is important to perform size fractionation at pressures lower than atmopsheric
HV
+ -
vacuum chamber
deposition chamber
1
2
3
aerosol flow
Micromanipulatorswith measurement tips
depositionelectrode
gas outlet
observationwindow
to I-V measurement setup

108
pressure, as usually the system pressure is decreased in order to get a higher yield ofsmaller nanoparticles.
An Electrostatic Precipitator has been developed which allows the investigationof electrical properties of nanoparticle films under clean conditions direct afterdeposition. This is especially important for semiconductor nanoparticles, where thesurface influences the optical and electronic properties.

7. Synthesis of PbS and SnOx nanoparticles for functional applications
109
7. Synthesis of PbS and SnOx nanoparticles forfunctional applications
The synthesis of semiconducting material (PbS) via the evaporation-condensationroute is undertaken in combination with the control techniques described in thepreceding chapter such as size fractionation and on-line particle size measurements.By means of an on-line measurement of the agglomerate diameter the evaporationand sintering characteristics of PbS nanoparticles are investigated and reported inChapter 7.1. The measurements allow to obtain a theoretical description of theevaporation and sintering process. Strictly speaking, the particles are sublimatingbut generally the term evaporation is used. These experiments have partly beenpublished in Kruis et al. (1998c) and the evaluation of the sintering appeared inKruis et al. (2000b). Similar synthesis experiments for obtaining SnOx nanoparticlesfor gas-sensing applications will be reported in Chapter 7.2.
Quantum confinement effects in semiconducting nanocrystals have beenwidely studied since Brus in 1983 focussed the attention of the scientificcommunity on this phenomenon (Brus, 1983). Almost all investigations have beendone for colloid systems, i.e. in the liquid phase. For most practical applications,these particles will, however, have to be supported on a substrate. The gas-phasetechniques described in this Habilitation Thesis are ideally suited for this, as bothsynthesis and deposition are done in the gas phase. For the system chosen in thiswork, PbS, the confinement effects have until now only been reported for PbSnanoparticles synthesized in the liquid phase. In Chapter 7.3 optical absorptionspectra indicative for quantum confinement effects in size-fractionated PbSnanoparticles from the gas phase will be shown.
Finally, an experimental method to obtain well-defined composite aggregatesof size-selected nanoparticles in the gas phase is proposed. Such compositeaggregates are interesting for applications in which the properties ofsemiconducting nanoparticles are modified by addition of another nanoparticlematerial. A well-known example is the addition of Pt nanoparticles to SnO2
nanostructured material, which increases the sensitivity of the gas sensor,presumably due to catalytic surface reactions on the Pt. As a model for thecomposite system semiconductor-metal, PbS-Ag is chosen here, as for bothmaterials exists experience with the synthesis. Both materials are synthesizedseparately by nucleation and aggregation processes in a furnace reactor. The twooppositely charged aerosols which have been size-selected on the basis of their

110
electrical mobility are mixed. The fact that nanoaggregates which contain the twodifferent materials are uncharged is used in order to separate them fromunaggregated particles and aggregates containing only one component. A paperdedicated to this subject has been published (Maisels et al., 2000).
7.1 Preparation of size-classified PbS nanoparticles in the gasphase
Nanocrystals of semiconducting materials can exhibit quantum-size effectswhen the particle size becomes comparable to or smaller than the spatial extent ofthe wavefunctions of electrons or holes. This results in a blue shift in the opticalabsorption spectrum (Brus, 1984). A size uniformity is important in order to studyor make use of quantum size effects, as a distribution of particle sizes will decreasethese effects.
The synthesis of nanocrystals in the vapor phase has several advantages overother methods such as controlled chemical purity and the generation of clusters withfree surfaces (Saunders et al., 1992). Size-selection has been proven to be alsopossible in the gas phase and was applied to produce Si (Camata et al., 1996) andGaAs (Deppert et al., 1996) nanocrystals. However, the lower atomic mobilities inthe solid phase can inhibit crystallization of the particles and the stoichiometry ofthe material is in some systems difficult to maintain (Saunders et al., 1992).
The generation of nearly monodisperse PbS nanocrystals in the gas phase isdemonstrated in this subchapter. PbS is a narrow-gap IV-VI semiconductor with acubic rock salt structure. PbS is an attractive candidate for the study of quantumconfinement effects as its hole Bohr radius is 9 nm. This results in strongconfinement effects as compared to the II-VI semiconductors such as CdS and CdSewith Bohr radii of about 1 nm (Machol et al., 1994).
Previously reported syntheses of PbS nanocrystals with sizes below 20 nmare all performed in a liquid phase. They include controlled precipitation inpolyvinylalcohol (Nenadovic et al., 1990), sol-gel synthesis (Gacoin et al., 1995) ,synthesis on Langmuir monolayers (Zhao and McCormick, 1992) andelectrostatically spraying a PbNO3 solution in a H2S atmosphere (Salata et al.,1994a). Earlier studies on gas-phase synthesis reported loss of stoichiometry due todissociation when directly evaporating PbS in Ar (Kaito et al., 1987). On the otherhand, it is known that the IV-VI semiconductors evaporate essentially in amolecular form (El-Rahaiby and Rao, 1982), and that film formation ofstoichiometric IV-VI compounds is possible by direct evaporation (Lopez-Otero,
7. Synthesis of PbS and SnOx nanoparticles for functional applications
111
1987). Hereby, the tendency to dissociate is smaller the lower the evaporationtemperature and the higher the pressure.
7.1.1 Experiments
In the present work a gas-phase synthesis method is used at normal pressurefor the preparation of sub-20 nm, crystalline, quasi-spherical, monodisperse PbSparticles. Heating a furnace containing the PbS powder at temperatures between600°C and 700°C resulted in appreciable particle formation as measured with acondensation nucleus counter. These particles are formed by homogeneousnucleation and subsequent aggregation by Brownian motion. Transmission electronmicrographs showed amorphous and partially sintered particles with a standarddeviation between 1.4 and 1.6, typical for gas-phase synthesis.
In order to obtain crystalline and spherical particles, the aerosol flow waspassed initially through a second furnace. Electron micrographs showed crystallineparticles, which were however mostly present in aggregates consisting of severalquasi-spherical particles bonded together by amorphous material. Therefore, it canbe concluded that the particle number concentration is too high when the aerosolenters the second furnace, causing aggregation at the same time crystallization andsintering are taking place.
The experimental setup was then changed to that depicted in Fig. 7.1.1. Itcontains six elements: a nanocrystal source, an aerosol charger, a size classifier, atube furnace, an electrostatic precipitator and a particle size measurement systemconsisting of a Differential Mobility Analyzer (DMA) and a condensation nucleuscounter. Fig. 7.1.1 shows a schematic diagram of the setup, which is similar to thatused by Deppert et al. (1994). A PbS aerosol is formed by sublimating a PbSpowder in a tube furnace and after dilution (1:2) charged by a radioactive β−source(Kr85). Nitrogen obtained from evaporating liquid nitrogen is used as carrier gas.The total gas flow was kept at 1.5 l/min by means of mass flow controllers (MFC),and the system is operated at atmospheric pressure. In a Differential MobilityAnalyzer the charged particles are size-selected on the basis of their electricmobility, which is a function of their charge level, mass and shape. The mobilityequivalent diameter based hereon is defined as the diameter Dm related to theStokes-Cunningham formula (Hinds, 1982) and is equal to the geometric diameterwhen the particles are singly charged and spherical. The DMA (NANO-DMA, TSI,Minneapolis, USA) is capable of delivering monodisperse aerosols with sizesadjustable between 2 and 50 nm and standard deviations between 1.05 and 1.20,depending on the flow conditions in the apparatus (Chen et al., 1998) .

112
Fig. 7.1.1. Schematic drawing of the experimental setup for gas-phase synthesis andsize fractionation of PbS nanocrystals. Particles are generated in tube furnace 1,charged by means of a bipolar charger, size-fractionated utilizing a firstDifferential Mobility Analyzer (DMA), sintered in tube furnace 2 and depositedonto a substrate within a deposition chamber. A second DMA, in combination witha nucleus counter, is used to measure the particle size distribution. The N2 gas flowis controlled by mass flow controllers (MFCs).
In our studies, the flow ratio was chosen to get a theoretical distribution indiameter of ± 0.1 Dm.
N2
N2
MFC
MFC
tube furnace 1
tube furnace 2
Differential MobilityAnalyzer 1
Differential MobilityAnalyzer 2
nucleus counter
HV
HV
HV
depositionchamber
exhaust
bipolar charger

7. Synthesis of PbS and SnOx nanoparticles for functional applications
113
An electrostatic precipitator enables the aerosol to be deposited with nearly100 % efficiency on a substrate placed in a high-voltage field. A condensationnucleus counter (3025, TSI, Minneapolis, USA) with a lower detection limit of 3nm enables the monitoring of the aerosol number concentration. By means of asecond DMA after the second furnace it is possible to detect on-line the change inmobility diameter due to the passage through the second furnace.
As the sintering step now takes place after the size fractionation, the particlenumber concentration in the second furnace is roughly two decades smaller, thusdecreasing the rate of aggregation during the crystallization and sintering step. Thesmaller number concentration has two causes: the charging efficiency in theradioactive charger, which is only 5 % for particle with diameter of 10 nm, and thesize fractionation, which takes out part of the size spectrum. The final productionrates of sintered particles with initial mobility diameters Dm
unsintered =15 nm (sinteredat 400°C) and Dm
unsintered =50 nm (sintered at 500°C) are 3 104/cm3 and 105/cm3,respectively. Typical electron micrographs now showed single crystalline particles.
The second furnace proved to be necessary to obtain monocrystallineparticles. Above 350°C, crystalline particles were detected by XRD, with thecrystallite size increasing with sintering temperature. In Fig.7.1.2 a HRTEMmicrograph of a monocrystalline PbS nanoparticle is shown, as obtained aftersintering a particle fraction with an initial mobility diameter of 50 nm.
However, at too high temperatures the particles evaporated. This can be seenin Fig. 7.1.3, which shows a size distribution for particles having initially a mobilitydiameter of 15 nm. Strictly speaking, the word size distribution is not correct as thecurves are not corrected for the transfer function of the DMA and the chargingefficiency. For our purposes, however, the exact form of the size distribution beforethe charger and DMA is not of interest, what is important is the yield of particlesafter the size fractionation, as the DMA is an integral part of our synthesis setup.The amorphous nature of the particles makes sintering however necessary. It can beseen that the mean mobility diameter shifts to smaller sizes. This is due to thecompaction process caused by restructuring, sintering and crystallization.Restructuring and sintering processes are known to lead to a smaller mobilityequivalent diameter with increasing temperature (Schmidt-Ott, 1988). This is due toincreased solid state diffusion coefficients which result in more compact particles.The total number concentration of particles decreases at increasing sinteringtemperatures because of increased thermophoretic losses when exiting the furnace,and at the highest temperature also because of evaporation.

114
Fig.7.1.2. HRTEM micrograph of a monocrystalline PbS nanoparticle.

7. Synthesis of PbS and SnOx nanoparticles for functional applications
115
Fig. 7.1.3. Size distribution of size-selected PbS nanoparticles ( md =15 nm) as afunction of sintering temperature.
The mean mobility diameter as a function of sinter temperature is shown inFig. 7.1.4 for PbS particles having different initial mobility diameters. It can be seenthat initially larger particles show a higher decrease in mobility diameter, indicatingan increased compaction rate. This is confirmed by TEM microscopy, from whichwe observe a more porous and open structure containing tens of primary particlesfor the larger unsintered aggregates, which can be stronger compacted due tosintering. Smaller particles contain however few primary particles and are thereforemore compact, which means that they can be less easily compacted. At the highesttemperature used, the particle size decreases rapidly.
0.0
5000.0
10000.0
15000.0
20000.0
25000.0
0 5 10 15 20mobility diameter dm after sintering (nm)
parti
cle
num
ber c
once
ntra
tion
[#/c
m3 ]
23°C200°C300°C425°C450°C475°C
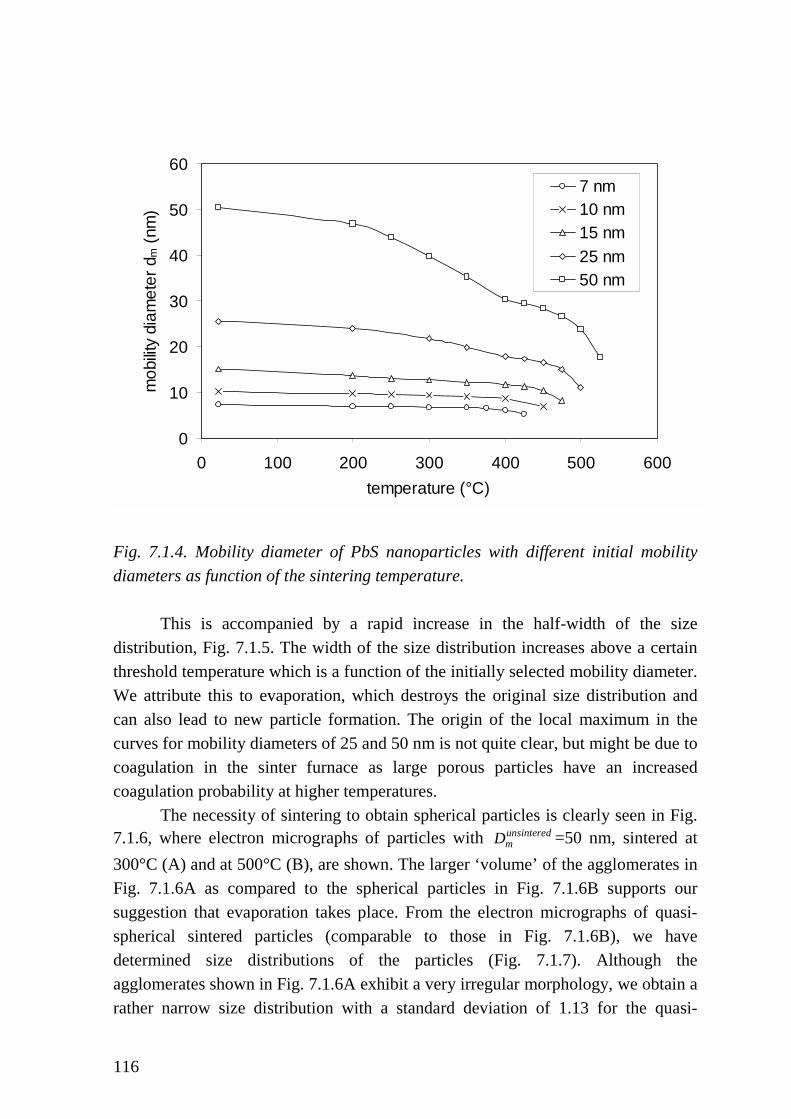
116
Fig. 7.1.4. Mobility diameter of PbS nanoparticles with different initial mobilitydiameters as function of the sintering temperature.
This is accompanied by a rapid increase in the half-width of the sizedistribution, Fig. 7.1.5. The width of the size distribution increases above a certainthreshold temperature which is a function of the initially selected mobility diameter.We attribute this to evaporation, which destroys the original size distribution andcan also lead to new particle formation. The origin of the local maximum in thecurves for mobility diameters of 25 and 50 nm is not quite clear, but might be due tocoagulation in the sinter furnace as large porous particles have an increasedcoagulation probability at higher temperatures.
The necessity of sintering to obtain spherical particles is clearly seen in Fig.7.1.6, where electron micrographs of particles with Dm
unsintered =50 nm, sintered at300°C (A) and at 500°C (B), are shown. The larger ‘volume’ of the agglomerates inFig. 7.1.6A as compared to the spherical particles in Fig. 7.1.6B supports oursuggestion that evaporation takes place. From the electron micrographs of quasi-spherical sintered particles (comparable to those in Fig. 7.1.6B), we havedetermined size distributions of the particles (Fig. 7.1.7). Although theagglomerates shown in Fig. 7.1.6A exhibit a very irregular morphology, we obtain arather narrow size distribution with a standard deviation of 1.13 for the quasi-
0
10
20
30
40
50
60
0 100 200 300 400 500 600temperature (°C)
mob
ility
diam
eter
dm
(nm
)
7 nm10 nm15 nm25 nm50 nm
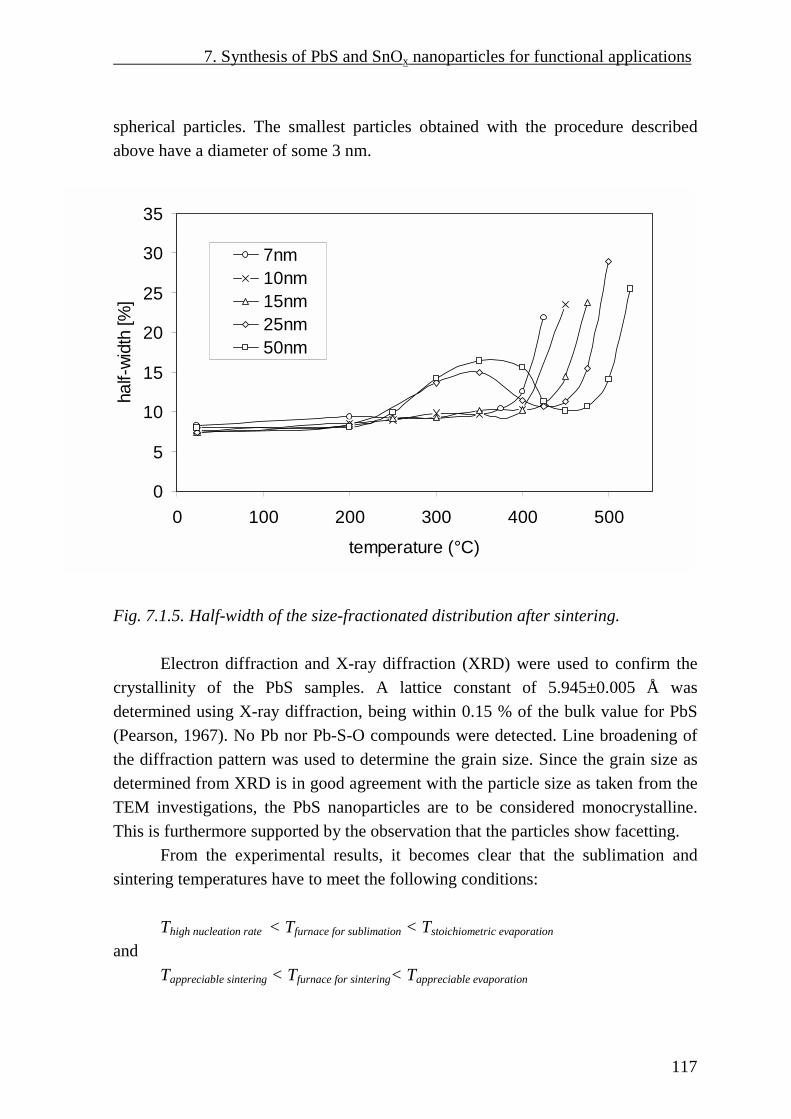
7. Synthesis of PbS and SnOx nanoparticles for functional applications
117
spherical particles. The smallest particles obtained with the procedure describedabove have a diameter of some 3 nm.
Fig. 7.1.5. Half-width of the size-fractionated distribution after sintering.
Electron diffraction and X-ray diffraction (XRD) were used to confirm thecrystallinity of the PbS samples. A lattice constant of 5.945±0.005 Å wasdetermined using X-ray diffraction, being within 0.15 % of the bulk value for PbS(Pearson, 1967). No Pb nor Pb-S-O compounds were detected. Line broadening ofthe diffraction pattern was used to determine the grain size. Since the grain size asdetermined from XRD is in good agreement with the particle size as taken from theTEM investigations, the PbS nanoparticles are to be considered monocrystalline.This is furthermore supported by the observation that the particles show facetting.
From the experimental results, it becomes clear that the sublimation andsintering temperatures have to meet the following conditions:
Thigh nucleation rate < Tfurnace for sublimation < Tstoichiometric evaporation
andTappreciable sintering < Tfurnace for sintering< Tappreciable evaporation
0
5
10
15
20
25
30
35
0 100 200 300 400 500temperature (°C)
half-
widt
h [%
]
7nm10nm15nm25nm50nm

118
and
Fig. 7.1.6. Electron micrographs of PbS particles with Dmunsintered =50 nm sintered at
(a) 300°C and (b) 500°C.
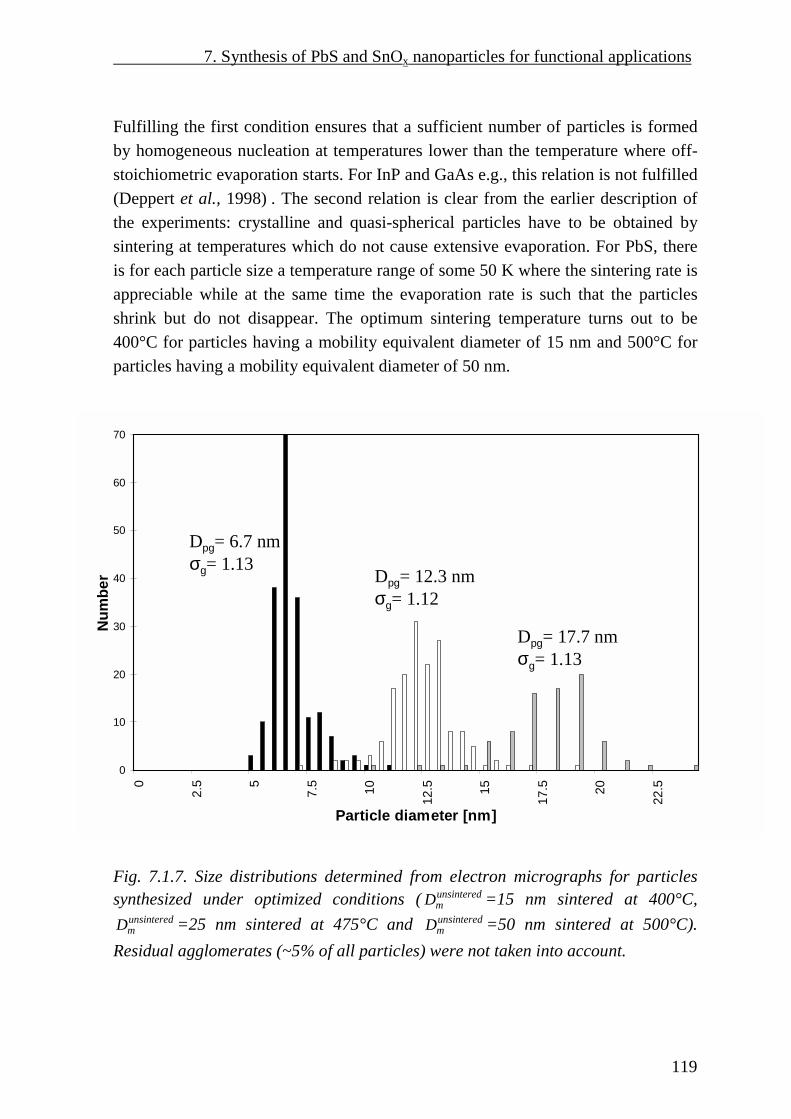
7. Synthesis of PbS and SnOx nanoparticles for functional applications
Fulfilling the first condition ensures that a sufficient number of particles is formedby homogeneous nucleation at temperatures lower than the temperature where off-stoichiometric evaporation starts. For InP and GaAs e.g., this relation is not fulfilled(Deppert et al., 1998) . The second relation is clear from the earlier description ofthe experiments: crystalline and quasi-spherical particles have to be obtained bysintering at temperatures which do not cause extensive evaporation. For PbS, thereis for each particle size a temperature range of some 50 K where the sintering rate isappreciable while at the same time the evaporation rate is such that the particlesshrink but do not disappear. The optimum sintering temperature turns out to be400°C for particles having a mobility equivalent diameter of 15 nm and 500°C forparticles having a mobility equivalent diameter of 50 nm.
119
Fig. 7.1.7. Size distributions determined from electron micrographs for particlessynthesized under optimized conditions ( Dm
unsintered =15 nm sintered at 400°C,Dm
unsintered =25 nm sintered at 475°C and Dmunsintered =50 nm sintered at 500°C).
Residual agglomerates (~5% of all particles) were not taken into account.
0
10
20
30
40
50
60
70
0
2.5 5
7.5 10
12.5 15
17.5 20
22.5
Particle diameter [nm]
Num
ber
Dpg= 6.7 nmσg= 1.13
Dpg= 12.3 nmσg= 1.12
Dpg= 17.7 nmσg= 1.13

120
7.1.2 Analysis of evaporation and sintering mechanisms of PbS
In order to assess the evaporation mechanism, the evaporation rate of a PbSparticle is calculated using the following formula (Hinds, 1982):
λλλ
ρ42.333.5
24d
d2
++
+
−=
∞
∞
pp
p
s
s
pp
vp
dd
dTp
Tp
dRMD
td
(7.1.1)
where vD is the diffusion coefficient of the vapor, M is the molecular weight of theparticle, R is the gas constant, pρ is the particle density, pd is the particle size, ∞pand sp refer to the partial pressure in the background gas and at the particle surface,T is the temperature and λ is the mean free path of the gas. ∞p is assumed to benegligible in comparison to sp , for which we use the vapor pressure of PbS, fittedfrom data in the range 755–1108°C (Gmelin, 1979):
3531.9(K)10809.5(K)1101.126-(Torr)log 45 ++= − T
Tp (7.1.2)
The resulting evaporation rates are shown in table 7.1.1. As can be seen fromthe table, the evaporation rate is only a slight function of the particle size. With aresidence time of 6 s in the second furnace, the calculations on the evaporation rateof the PbS nanoparticles predict a decrease in particle diameter of 2.2 nm(@450°C), 7.2 nm (@475°C), 23 nm (@500°C) and 65 nm (@525°C). Thiscorresponds well with the experimental observation, e.g. particles with an initialmobility diameter of 15 nm have completely disappeared with a furnacetemperature of 500°C.
Table 7.1.1. Evaporation rates t
d p
dd
(nm/s ) of PbS nanoparticles.
Evaporation rate(nm/s )
Temperature (°C)
Diameter (nm) 425 450 475 500 5257 0.09 0.34 1.1 3.6 10.350 0.1 0.36 1.2 3.8 10.9

7. Synthesis of PbS and SnOx nanoparticles for functional applications
121
It is clear that at temperatures below 450°C evaporation will not play animportant role according to this calculation and that the change in mobilityequivalent diameter will be almost exclusively due to restructuring and sintering.Therefore, a sintering model can be applied in order to obtain information about thecharacteristic sintering time. According to Koch and Friedlander (1990) thefollowing expression can be used to account for the reduction of surface area of anaerosol particle being an agglomerate of primary particles:
)(1dd
sphaata −−=
τ(7.1.3)
where a is the surface area of the agglomerate and spha is the surface area of the
equivalent sphere. The characteristic sinter time τ can be written in the followingform, in which the dependencies on the temperature and the primary particle sizeare separated:
np
Tcnp dedTc '2
1 ττ == (7.1.4)
where 1c and 2c are constants, T is the temperature, 'τ is some temperature-dependent sintering function, which is however independent of the primary particlediameter, n is a coefficient which varies with the sinter mechanism which is stillunknown for PbS nanoparticles (n=3 for volume sintering, n=4 for grain boundaryor surface sintering) and pd is the diameter of the primary particles composing theagglomerate:
av
d sphp
6= (7.1.5)
in which sphv is the volume of the equivalent sphere. The reason for separating thedependencies of the characteristic sinter time on the primary particle diameter andthe temperature is that both parameters are varying in the experiments. Forsubstances with well-known properties, the constants 1c and 2c can be calculated(see e.g. Kruis et al. (1993) for Si), but for PbS these parameters are not available.Therefore, they are determined on the basis of the experimental data.
According to Seto et al. (1995), the diameter of primary particles can bedetermined from experiments using:

122
2
3
m
sphp d
dd = (7.1.6)
This bases on eq. (7.1.5) with the assumption that the mobility diameter fornonspherical particles is related to its surface area. Using the measurements of mdfrom Fig. 7.1.4, we still need to know the diameter of the particle when sintering iscompleted, i.e. sphd , for which the mobility diameter at the temperature beforeevaporation starts is taken. It is estimated that the sintering is complete at 450°C forparticles having an initial mobility equivalent diameter of 50 nm, at 425°C for 25nm, at 400°C for 15 nm, at 375°C for 10 nm and at 350°C for 7 nm. This is basedon the experimental observations of the sudden increase of the half-width of the sizedistribution above these temperatures (Fig. 7.1.5), which are consistent with TEMobservations of particle morphology at different sintering temperatures and initialmobility diameter. This enables us to calculate the primary particle size pd (Fig.7.1.8a) and consequently the number of primary particles in an aggregate (Fig.7.1.8b).
The initial primary particle diameter of 5 to 10 nm is in agreement with TEMobservations. The larger number of primary particles in an agglomerate for particleswith larger initial mobility diameters in the case without sintering (at a temperatureof 20°C) has also been observed by means of TEM investigations. It has often beenobserved in gas-phase processes that agglomerates of different sizes differ mainly inthe number of primary particles, not so much in primary particle diameter. This isdue to strong dependence of the characteristic sinter time τ on the primary particlesize pd according to eq. (7.1.4), so that during the initial agglomerate formation justafter the first furnace the sintering stops when the primary particle size reaches acertain size. It is also possible to simulate numerically the sintering by solving theequations (7.1.3) – (7.1.5) for the given residence time in the second furnace, usingthe initial conditions obtained from the experiments and using a given value of thesintering function 'τ which is constant at a given temperature. It is possible toobtain information about the values of 'τ by means of a comparison of the primaryparticle diameter obtained from the experiments (Fig.7.1.8a) and from thesimulations as a function of temperature. The results are shown in Fig. 7.1.9 for twodifferent values of the coefficient n.

7. Synthesis of PbS and SnOx nanoparticles for functional applications
123
Fig. 7.1.8. (a) Primary particle diameter pd calculated from experiments on thebasis of eq. (7.1.6) as function of the sintering temperature and initial mobilityequivalent diameter of the corresponding agglomerate and (b) the correspondingnumber of primary particles in an agglomerate.
0
5
10
15
20
25
30
0 100 200 300 400temperature (°C)
prim
ary
parti
cle
diam
eter
dp (
nm)
50 nm25 nm15 nm10 nm7 nm
0
5
10
15
20
25
30
35
0 100 200 300 400temperature (°C)
num
ber o
r prim
ary
parti
cles 50 nm
25 nm15 nm10 nm7 nm
a)
b)
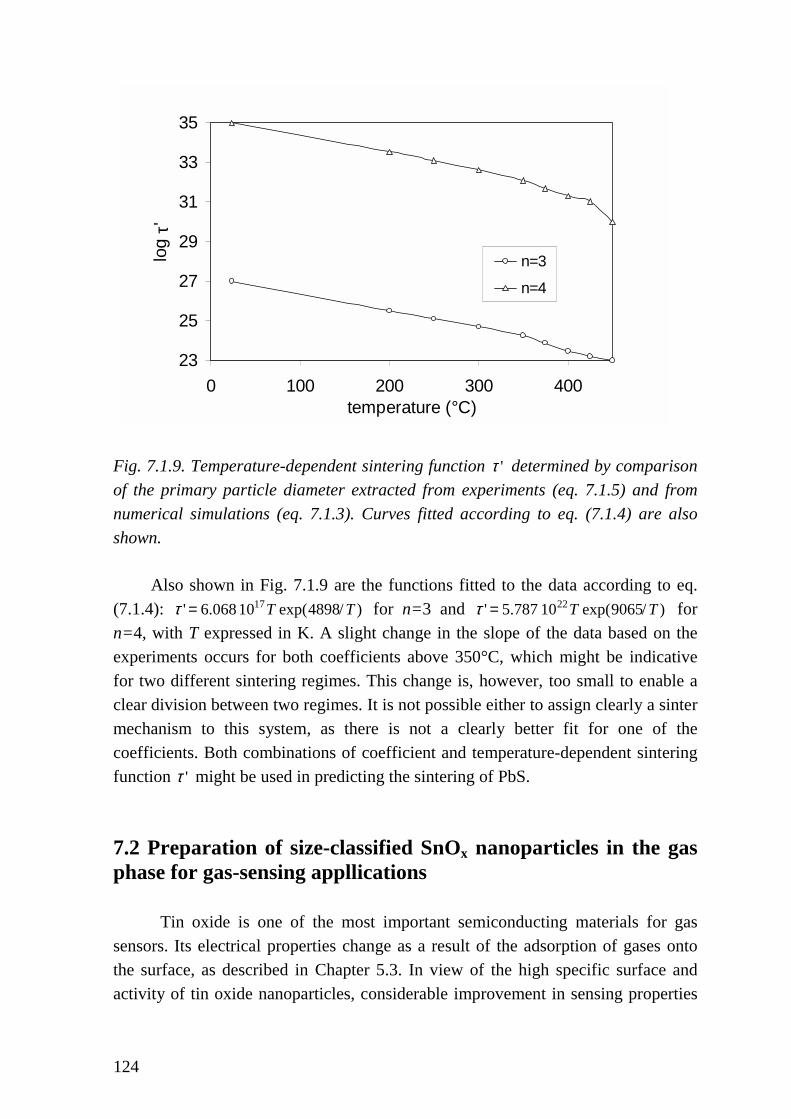
124
Fig. 7.1.9. Temperature-dependent sintering function 'τ determined by comparisonof the primary particle diameter extracted from experiments (eq. 7.1.5) and fromnumerical simulations (eq. 7.1.3). Curves fitted according to eq. (7.1.4) are alsoshown.
Also shown in Fig. 7.1.9 are the functions fitted to the data according to eq.(7.1.4): )/4898exp(10068.6' 17 TT=τ for n=3 and )/9065exp(10787.5' 22 TT=τ forn=4, with T expressed in K. A slight change in the slope of the data based on theexperiments occurs for both coefficients above 350°C, which might be indicativefor two different sintering regimes. This change is, however, too small to enable aclear division between two regimes. It is not possible either to assign clearly a sintermechanism to this system, as there is not a clearly better fit for one of thecoefficients. Both combinations of coefficient and temperature-dependent sinteringfunction 'τ might be used in predicting the sintering of PbS.
7.2 Preparation of size-classified SnOx nanoparticles in the gasphase for gas-sensing appllications
Tin oxide is one of the most important semiconducting materials for gassensors. Its electrical properties change as a result of the adsorption of gases ontothe surface, as described in Chapter 5.3. In view of the high specific surface andactivity of tin oxide nanoparticles, considerable improvement in sensing properties
23
25
27
29
31
33
35
0 100 200 300 400temperature (°C)
log
τ'
n=3
n=4

7. Synthesis of PbS and SnOx nanoparticles for functional applications
125
is expected. In order to understand the relationship between gas-sensing behaviourand particle size better it is necessary to generate monodisperse nanoparticles,because a distribution of particle sizes will decrease the special properties andcomplicates the interpretation of the experimental results. This was also emphasizedby Göpel and Schierbaum (1995) in their review article on future prospects of SnO2
gas sensors: ‘Particular emphasis is put on preparing thin films of SnO2 withhomogeneous particle sizes in the nanometre range’. At the moment no gas sensorsbased on almost single sized particles are available. A similar technique asdescribed in the preceding section is applied here to synthesize monodisperse SnOx
nanoparticles. The subscript ‘x’ is used in order to stress that stoichiometry is herenot necessarily obtained, in fact some oxygen deficiency is desirable.
7.2.1 Experimental set-up
The experimental set-up is similar to the PbS synthesis set-up, the differenceis however that in the second tube furnace a combined oxidation-sintering step isperformed. Sn (99.999 %, Aldrich, Germany) is evaporated to form a Sn aerosol inthe tube furnace 1. In a second experiment SnO powder (>99 %, Aldrich, Germany)is used. Nitrogen obtained from evaporating liquid nitrogen is used as carrier gas.The system is operated at atmospheric pressure. The gas flow through the furnacewas kept at 1.5 l/min.
In the second tube furnace the size-fractionated Sn and SnO nanoparticlescan be sintered at different temperatures in order to obtain quasi-spherical particles,as the as-formed particles are agglomerates. The oxidation rate of the nanoparticlescan be adjusted in the second tube furnace by means of an oxygen flow, controlledby a MFC. A second DMA allows on-line monitoring of the change in the particlesize distribution due to the sintering and/or oxidation in the second furnace.
7.2.2 Results of structural and electrical characterization
The DMA monitoring technique allows fast optimization of the processconditions. For each desired particle size, the evaporation temperature in the firsttube furnace has to be tuned for getting the maximal particle number concentration,whereas the final particle morphology and composition depends on the temperatureof the second furnace. It was found for Sn as evaporation material that themaximum particle amount shifts to larger particle sizes and that the total quantity ofthe particles increases with increasing evaporation temperature. When thetemperature of the second tube furnace was increased up to 750°C, the curves

126
shifted to smaller particle sizes and the maximum particle number concentrationdecreased with increasing temperature. Two mechanisms can be responsible for thisphenomenon: the first is a compaction process caused by restructuring, sinteringand crystallisation. The second mechanism is evaporating of the particles. In thissystem, increasing the temperature from 600 °C to 750 °C did not change the meanparticle diameter any more, which decreased from 10 nm to 6 nm due torestructuring and sintering.
The evaporation of Sn was not a stable process, however. This can beattributed to contamination of the carrier gas with oxygen. Therefore theevaporating material was changed to SnO, resulting in stable particle concentrationsover several days. In Fig. 7.2.1 the particle size distributions are shown whenchanging the evaporation temperature. The sintering of the size-fractionated aerosol(Fig. 7.2.2) shows the compaction and sintering behavior already encountered forPbS. However, with temperatures above 670 °C a bimodal particle size distributionappears if SnO is evaporated due to a evaporation-recondensation mechanism (Fig.7.2.3). Here, the SnO vapour from the evaporating particles condenses after leavingthe sintering furnace, leading to a new particle fraction with smaller diametertogether with the fraction of partly evaporated particles.
Fig. 7.2.1. Particle size distribution when using SnO as evaporation material atdifferent evaporation temperatures in the first furnace.
1 10 1000
100
200
300
400
500
[nm]
[103/cm3] 700°C 800°C 820°C 870°C
N
Dp
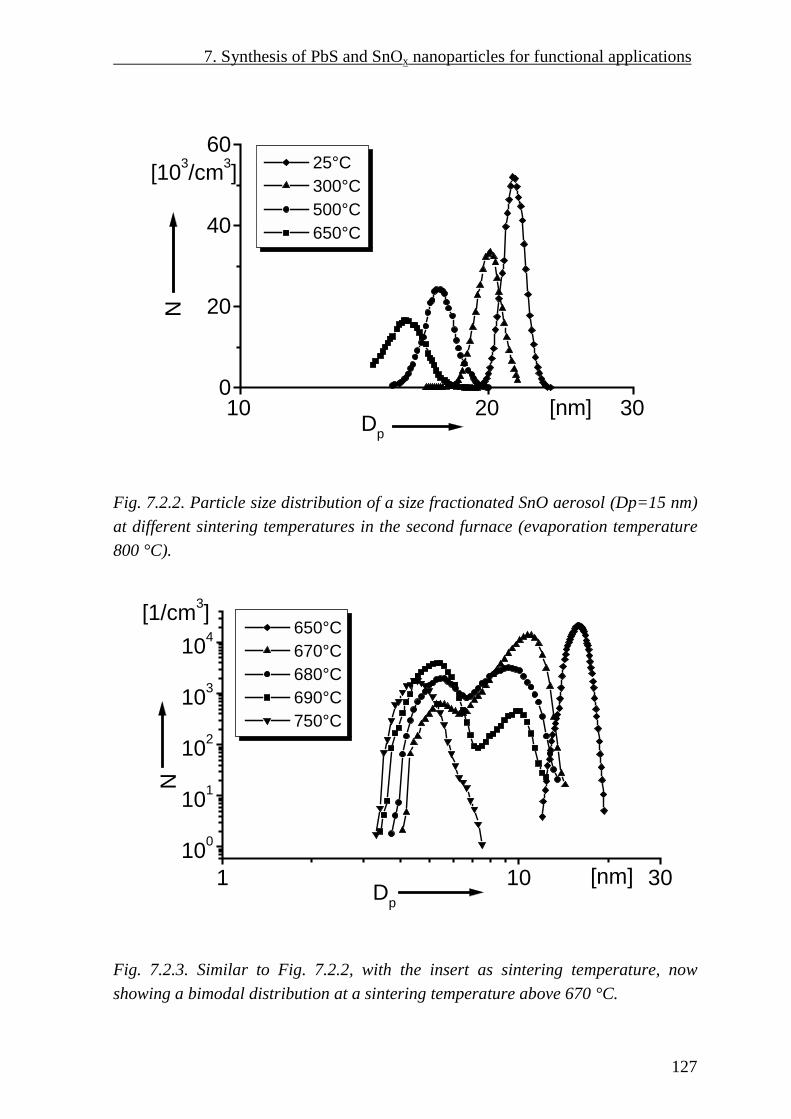
7. Synthesis of PbS and SnOx nanoparticles for functional applications
127
Fig. 7.2.2. Particle size distribution of a size fractionated SnO aerosol (Dp=15 nm)at different sintering temperatures in the second furnace (evaporation temperature800 °C).
Fig. 7.2.3. Similar to Fig. 7.2.2, with the insert as sintering temperature, nowshowing a bimodal distribution at a sintering temperature above 670 °C.
10 20 300
20
40
60
[nm]
[103/cm3] 25°C 300°C 500°C 650°C
N
Dp
1 10 30100
101
102
103
104
[nm]
[1/cm3] 650°C 670°C 680°C 690°C 750°C
N
Dp

128
It is remarkable that after a running time of several days, the evaporationbehaviour of Sn and SnO becomes similar. This can be understood on the basis ofthe vapour pressures of these materials. The vapour pressure of SnO is much highercompared to Sn at the same temperature, leading to more condensable material inthe gas phase. This explains the higher particle concentrations measured in the SnOsystem. If the carrier gas contains a small amount of O2, it is assumed that Sn willbe oxidized and will evaporate due to the high vapour pressure of the SnO. Anotherpossibility would be to use SnO2 as starting material, but SnO2 decomposes intoSnO and O2 upon heating so that this is not a stable evaporating system.
In order to investigate the morphology of the synthesized nanoparticles,TEM micrographs were made. In Fig. 7.2.4 a TEM micrograph is shown of SnOx
nanoparticles coming from the first furnace, i.e., without size-fractionation andsintering/oxidation. The particles are clearly not monocrystalline and monodisperse,they show however appreciable necking due to sintering, which took place duringthe cooling down after the first furnace. The TEM micrographs of size-fractionatedand sintered nanoparticles (Fig. 7.2.5) show much more homogeneous particles.Electron diffraction was used to identify the crystalline structure.
Fig. 7.2.4. TEM micrograph of unfractionated SnOx nanoparticles coming from thefirst tube furnace (T=870°C).

7. Synthesis of PbS and SnOx nanoparticles for functional applications
129
Fig. 7.2.5. TEM micrographs of fractionated SnOx nanoparticles a) withoutaddition of O2 in the sinter furnace and b) with addition of O2 (evaporationtemperature 820°C, sintering temperature 650°C, Dp=20 nm). The electrondiffraction patterns are characteristic of romarchite (a) and casserite (b).

130
The crystal structure of the nanoparticles which were sintered without addition ofoxygen shows a tetragonal crystal structure, romarchite, characteristic for SnO.When a flow of O2 was added to the SnO aerosol flow in the sintering furnace, sothat the O2 percentage was approximately 50 vol%, the crystal structure found was atetragonal phase, casserite, characteristic for SnO2. Although the exactstoichiometry could not directly be determined, the presence of different crystalstructures induced by O2 addition indicates that it will be possible to vary thestoichiometry by changing the concentration of O2 in the second furnace.
In order to get a first impression of the feasibility of the synthesized SnO2
nanoparticles for use in gas-sensing investigations, an electrical characterizationwas carried out. To this end, an approximately 0.2 µm thick film of nanoparticleswith a diameter of 35 nm after size-fractionation was deposited on a glass substrate.The film was electrically contacted by means of silver paste and the I-Vcharacteristic was measured (Fig. 7.2.6). The addition of 0.5 vol% CO, which is areducing gas, increases the current at constant voltage. Thus, the resistancedecreases, which is expected according to the qualitative model described inChapter 5.3, which states that a reducing gas decreases the concentration ofchemically absorbed oxygen so that the conductivity increases.
Fig. 7.2.6. I-V characteristics of a thin film (~0.2 µm) of SnO2 nanoparticles whichwere 35 nm in diameter after sintering at 650°C. The film itself has not beensintered.
0 10 20 30 40 500
1000
2000
3000[nA]
[V]
in air T=303°C 0,5% CO in air
curre
nt I
Voltage V

7. Synthesis of PbS and SnOx nanoparticles for functional applications
131
Gas sensors detect changes in the gas concentrations by measuring changesof the resistance of the sensor in a certain gas atmosphere, gR , when compared withits resistance in pure air, aR . Therefore, the sensitivity, defined here as ga RR / , isshown in Fig. 7.2.7 and shows the expected increase with temperature, mostprobably due to the changes in surface chemistry with temperature. This increasedsensitivity is the reason why gas sensors are operated at higher temperatures,usually between 200 and 400°C.
Fig. 7.2.7. The sensitivity ga RR / of a thin SnO2 film (described in Fig. 7.2.5) in 0.5vol% CO as a function of the temperature in the measurement cell.
Another important characteristic of a gas sensor is its response time. This istested by changing rapidly the gas atmosphere, in Fig. 7.2.8 from a CO atmosphereto air and back to CO. Due to the use of a flow system and a small volume of themeasurement cell, it takes some 5 s to exchange the gas atmosphere. It can be seenfrom the figure that the change on adding CO is relatively rapid, in the order of 2minutes, while it takes longer to recover when the CO is not any more present. It isclear that the process is not completely reversible, presumable due to thecomplicated relationship between chemistry and material properties.
0 100 200 3001.0
1.1
1.2
1.3
1.4
1.5
1.6
[°C]
Sens
itivi
ty R
a/Rg
Temperature

132
Fig. 7.2.8. The time-dependence of the resistance of the thin SnO2 layer (describedin Fig. 7.2.6) when changing the gas atmosphere from 0.5 vol% CO to air and backto 0.5 vol% CO (T=303°C)
The measurements shown were done for thin films which were not yetsintered, so that the interparticle contacts, which are essential for the gas-sensingmechanism, were probably not yet fully established. These preliminarymeasurements show that it is possible to create thin gas-sensitive layers composedof equal-sized SnO2 nanoparticles. The experimental procedure allows to producethin films, in which the properties of the nanoparticles can be independentlycontrolled by size-fractionation and in-flight sintering and oxidation. In the usualthin film synthesis techniques, such as sputtering and vacuum-evaporation, theparticle formation and film formation take place in one step, so that the control overthe final morphology of the nanostructured film is not as good as in the methoddescribed here.
0 150 300 450 600 750 9008.4
8.8
9.2
9.6
10.0
[s]
[106Ω] 0,5% CO in air air 0,5% CO in air
Res
ista
nce
R
Time t

7. Synthesis of PbS and SnOx nanoparticles for functional applications
133
7.3 Quantum confinement in size-classified PbS nanoparticles
As already discussed in Chapter 2.1, it well known that semiconductornanocrystals exhibit quantum confinement effects when the particle size is of theorder of the Bohr exciton. This is indicated by a blue shift in the optical absorptionspectra. PbS is an attractive candidate for the study of quantum confinement effectsas the Bohr radius is 9 nm and the effect in PbS nanoparticles synthesized bydifferent chemical routes are well studied (Wang et al., 1987, Zhao andMcCormick, 1992, Salata et al., 1994a). Quantum confinement effects have alsobeen observed in evaporated composite films of PbS nanoparticles (Thielsch et al.,1998). In this subchapter, quantum confinement effects in PbS nanoparticlessynthesized in the gas phase are reported. Advantages of the gas-phase synthesismethod described earlier in this chapter over liquid-phase synthesis methods forinvestigating quantum confinement effects are the possibility of size-fractionationand the absence of ligands and other impurities. Furthermore, the sintering processinvolved in the synthesis allows control over crystallinity and shape.
7.3.1 Experimental methods
Single crystalline PbS nanoparticles with different crystalline sizes aresynthesized by the gas phase technique described earlier in this chapter. For theoptical absorption studies, different crystalline sizes are sintered at differenttemperature. The name of the samples are given according to the initial mobilitydiameter. In this context it is worth pointing out that the size and shape of theparticles depend on the sintering temperature. The sintering temperatures are wellbelow the respective evaporation temperatures. Several monolayers of nanoparticleswere deposited by means of the electrostatic precipitator onto a glass substrate.
The optical absorption spectra at room temperature were recorded using aBeckman-spectrophotometer (Model UV-5240) which is able of recording spectrabetween 300 and 3000 nm. For this, a bare glass plate was put in front of thereference beam while the glass substrate with PbS films was placed in front of thesample beam. The thickness of the PbS layers was estimated by knowing the area ofdeposition, the rate of deposition and the size of the particles deposited with theassumption that the particles are spherical. The absorption spectra were normalizedwith respect to the thickness of the film thus estimated.

134
7.3.2 Results and discussion
The optical absorption spectra for PbS nanoparticles with different sizes areshown in Fig. 7.3.1. As PbS is a direct band gap semiconductor, the band gap canbe determined from the plot ( )2ναh vs νh by extrapolating ( )2ναh to zero value,where α is the absorption coefficient and νh is the photon energy. The band gap isthe value of νh for which ( )2ναh is zero. The large blue shift in the absorptionspectra with respect to the bulk band gap of 0.4 eV is indicative of the quantumconfinement effect.
Fig. 7.3.1. The optical absorption spectrum (normalized with respect to filmthickness) of PbS nanoparticles of different sizes ( 0mD is the initial mobilitydiameter and mD is the mobility diameter after in-flight sintering at sT )
It can be seen from the figure that the band gaps of the particles withmobility diameters between 6 and 17 nm are all between 1.5 and 1.8 eV, whereasthis band gap range was found for PbS nanoparticles synthesized in a liquidbetween 3 and 4 nm, as can be seen from Fig. 2.1. Several explanations arepossible. The mobility diameter is not related in any way to the crystallite size. Aparticle might be polycrystalline and be composed of several smaller crystallites, so
0
0.002
0.004
0.006
1.20 1.30 1.40 1.50 1.60 1.70 1.80 1.90energy hν (eV)
( αh ν
)2
Dm0=7 nm, Dm=6.2 nm, Ts=375 C
Dm0=10 nm, Dm=8.7 nm, Ts=375 C
Dm0=15 nm, Dm=11.5 nm, Ts=400 C
Dm0=25 nm, Dm=17 nm, Ts=425 C

7. Synthesis of PbS and SnOx nanoparticles for functional applications
135
that a larger bandgap would result. Another possibility is that the particle arecomposed of a crystalline core with an amorphous shell or even an oxide layer,which would reduce the effective crystallite diameter. Furthermore, the literaturedata (as shown in Fig 2.1) are for particles suspended in a liquid and protectedagainst aggregation by means of organic ligands, which might influence theirelectronic properties. The compact PbS nanoparticle films investigated here do nothave such ligands, but the nanoparticles have no or very small interparticledistances, which also might influence their properties. Finally, the possibility existsthat the particles are non-spherical. When they are in the form of platelets, this isdifficult to detect using TEM, and the smallest particle dimension tends to have thelargest influence on the quantum confinement (Zhao and McCormick, 1992).
The comparison between the samples with different diameters is difficult dueto the fact that both the initial mobility diameter and the sintering temperature playa role. An attempt to elucidate the effect of sintering temperature is shown in Fig.7.3.2.
Fig. 7.3.2. The optical absorption spectrum (normalized with respect to filmthickness) of PbS nanoparticles with an initial mobility diameter of 50 nm andsintered at the temperature indicated.
0
0.001
0.002
0.003
0.004
0.4 0.5 0.6 0.7 0.8 0.9 1 1.1
energy hν (eV)
( αh ν
)2
400 °C450 °C475 °C
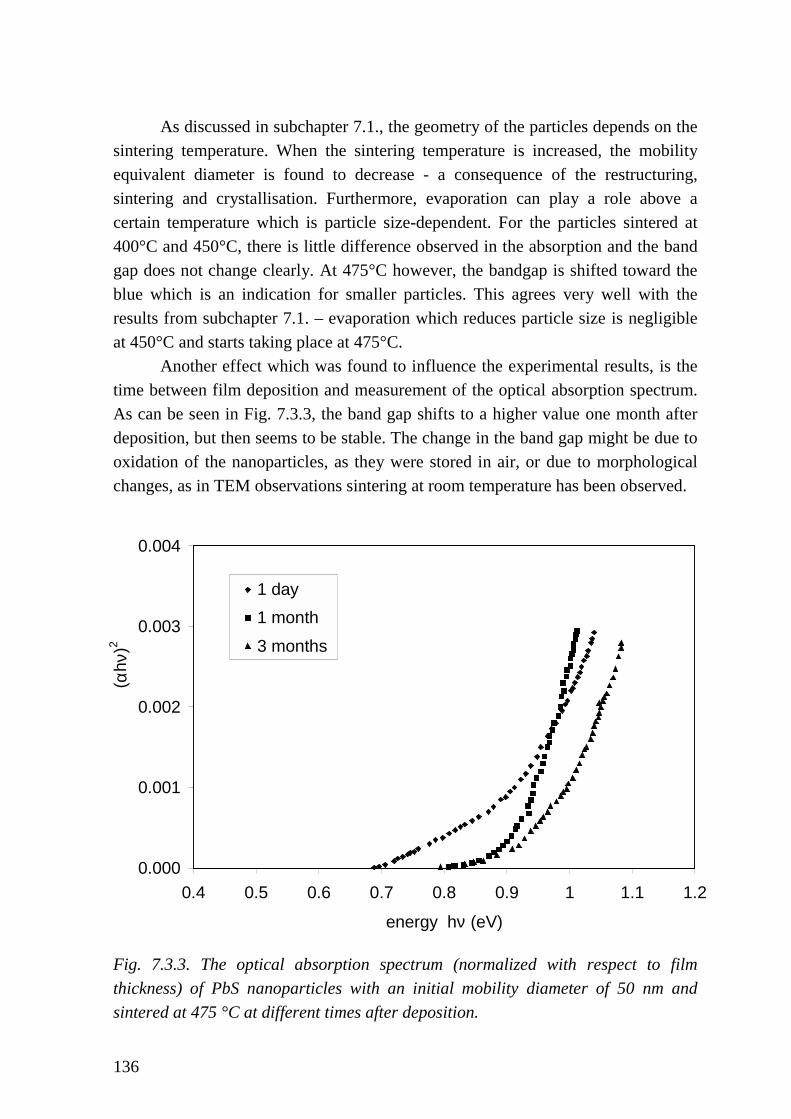
136
As discussed in subchapter 7.1., the geometry of the particles depends on thesintering temperature. When the sintering temperature is increased, the mobilityequivalent diameter is found to decrease - a consequence of the restructuring,sintering and crystallisation. Furthermore, evaporation can play a role above acertain temperature which is particle size-dependent. For the particles sintered at400°C and 450°C, there is little difference observed in the absorption and the bandgap does not change clearly. At 475°C however, the bandgap is shifted toward theblue which is an indication for smaller particles. This agrees very well with theresults from subchapter 7.1. – evaporation which reduces particle size is negligibleat 450°C and starts taking place at 475°C.
Another effect which was found to influence the experimental results, is thetime between film deposition and measurement of the optical absorption spectrum.As can be seen in Fig. 7.3.3, the band gap shifts to a higher value one month afterdeposition, but then seems to be stable. The change in the band gap might be due tooxidation of the nanoparticles, as they were stored in air, or due to morphologicalchanges, as in TEM observations sintering at room temperature has been observed.
Fig. 7.3.3. The optical absorption spectrum (normalized with respect to filmthickness) of PbS nanoparticles with an initial mobility diameter of 50 nm andsintered at 475 °C at different times after deposition.
0.000
0.001
0.002
0.003
0.004
0.4 0.5 0.6 0.7 0.8 0.9 1 1.1 1.2
energy hν (eV)
( αh ν
)2
1 day1 month3 months

7. Synthesis of PbS and SnOx nanoparticles for functional applications
137
When comparing the band gaps for the samples having initially a mobilitydiameter of 50 nm, in the range 0.6-0.7 eV, and for the samples having a mobilitydiameter of 25 nm or smaller, in the range 1.5-1.8 eV, it is interesting to see that therange of 0.7-1.5 eV is not yet covered. This range contains the commerciallyinteresting range around 1.3 eV, used for very fast optical data transfer by means ofGaAs solid state lasers. By choosing initial mobility diameters in between 25 and 50nm, it should be possible to attain this band gap. Further investigations should beaccompanied by careful observations of the actual particle diameter and crystallinityafter sintering at different temperatures, preferably by means of high-resolutiontransmission microscopy.
7.4 Experimental investigation of synthesis of tailored compositenanoparticles in the gas phase
A special case of nanostructured materials is formed by composite particles, heredefined as aggregates composed of two different particle classes. Three differentbasic classes of such composite particles can be distinguished (Fig. 7.4.1):- a single particle containing two compounds mixed on an atomic scale,- a ‘core-shell’ particle, in which the core and the shell are composed of different
compounds,- a ‘nanoaggregate’, which is a compound particle consisting of two particles of
different chemical composition
Fig. 7.4.1. Basic classes of composite nanoparticles: a composite nanoparticle, acore-shell nanoparticle and a nanoaggregate.
The technological use of such particles is manyfold, e.g.:- improve the mixing characteristics when two ultrafine powders have to be
mixed: when the powders are mixed in aerosol form, the occurance of largeaggregates of one component, which is detrimental for the mixing, can besuppressed,

13
- improve the functional properties of semiconductor nanoparticles by adding asecond semiconductor particle which provides a charge transfer, therebyimproving the quantum yield,
- improve the functional properties of nanoparticles by adding anothernanoparticle which has catalytic properties, such as Pt or Pd which enhances thesensitivity of SnO2 nanoparticles used for gas sensors,
- improve the superconductive properties of YBCO particles by adding smallerparticle which act as flux pinning enhancement (Takao et al., 1997)
Most methods rely on Brownian aggregation between two different aerosols, whichis however difficult to control. Here an experimental procedure is proposed for thecontrolled synthesis of composite nanoparticles in the gas phase. The theoreticalbackground is already given in Chapter 4.3. Two oppositely charged aerosol flowswith different nanoparticles are mixed and the ensuing aggregation will lead toformation of a fraction of composite nanoparticles.
7.4.1 Experimental methods
Nanoparticles of two different substances, PbS and Ag, were generatedseparately in the gas phase by means of the DMA fractionation technique. andmixed bipolarly. The experimental set up is presented in Fig. 7.4.2.
Fian
+H V
8
g. 7.4.2. Experimental set up for synthesis of composite particle pairs, here PbSd Ag.
AMT-
P045
6
Tube furnace 1 Tube furna ce 2DM ANe utra lise r
Aggregat ion tube
Ne utra lise r DM A UC PCEl. filte r
NN22
NN22
ESP
Ag
PbS
+HV
-H V

7. Synthesis of PbS and SnOx nanoparticles for functional applications
139
The experimental setup contains five main elements: two synthesis unitswhich deliver monosized quasi-spherical nanoparticles of PbS and Ag, anaggregation tube, an electrostatic precipitator and a particle size measurementsystem. The entire process took place in purified N2 at 1 bar. The synthesis unit forPbS has been described earlier. Briefly, powders of PbS or Ag are heated at 680°Cand 1150°C, respectively, in a tube furnace under flowing N2 and form particles byhomogeneous nucleation in the cooling vapor and subsequent aggregation byBrownian motion. It results in relative broad size distribution. The aerosols arecharged bipolarly by a radioactive β−source (Kr85) and size-selected by means of aDifferential Mobility Analyzer (NANO-DMA, TSI, Minneapolis, USA and VIE06-3/150, HAUKE GmbH, Austria). The DMA selects particles on the basis on theirelectrical mobility and is operated such that geometric standard deviations of about1.1 are obtained. Applying voltages of opposite polarities inside the DMA’s one canobtain oppositely singly charged aerosols. The irregularly–formed aerosol particlesare then sintered in-flight ( Ct °= 400Ag sinter, , Ct °= 475PbS sinter, ) in order to obtain quasi-spherical nanoparticles, which facilitates their identification. The values of particlenumber concentrations for both components were approximately matched (between7.0×104 cm-3 and 9.5×104 cm-3), measured by means of a condensation nucleuscounter (UCPC, TSI, Minneapolis, USA).
Both the PbS and Ag aerosols with quasi-spherical, monosized andoppositely charged nanoparticles were lead to the aggregation tube, which consistedof copper tubes with a length of 5 or 10 m and a diameter of 20 or 32 mm. Theresulting size distribution was measured by a measurement setup consisting of abipolar charger, a DMA and a condensation nucleus counter. To remove theremaining charged particles, the aerosol flow could be passed through anelectrostatic filter so that only electrically neutral particles came through. Anelectrostatic precipitator (ESP) was used to deposit these selected compositenanoparticles on a TEM grid after recharging them by means of an excimer lamp( λ =172 nm) or a radioactive source.
7.4.2 Results and discussion
The resulting particle size scans after mixing oppositely charged Ag and PbSnanoparticles with diameters of about 20 and 24 nm, respectively, are shown in Fig.7.4.3 for different residence times in the aggregation tube. Again, these scans havenot been corrected for charging efficiency of the radioactive source andtransmission efficiency of the DMA, and are strictly speaking no size distributions.The curves show three features: the first two corresponding to primary,
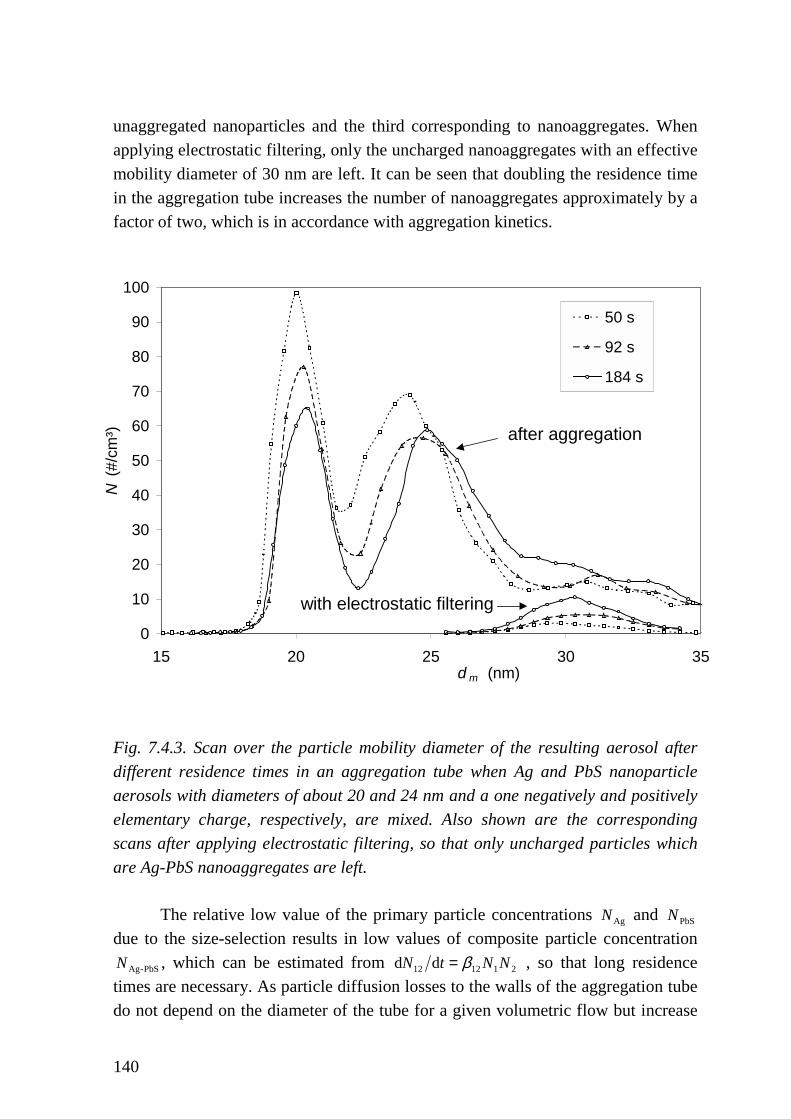
140
unaggregated nanoparticles and the third corresponding to nanoaggregates. Whenapplying electrostatic filtering, only the uncharged nanoaggregates with an effectivemobility diameter of 30 nm are left. It can be seen that doubling the residence timein the aggregation tube increases the number of nanoaggregates approximately by afactor of two, which is in accordance with aggregation kinetics.
Fig. 7.4.3. Scan over the particle mobility diameter of the resulting aerosol afterdifferent residence times in an aggregation tube when Ag and PbS nanoparticleaerosols with diameters of about 20 and 24 nm and a one negatively and positivelyelementary charge, respectively, are mixed. Also shown are the correspondingscans after applying electrostatic filtering, so that only uncharged particles whichare Ag-PbS nanoaggregates are left.
The relative low value of the primary particle concentrations AgN and PbSNdue to the size-selection results in low values of composite particle concentration
PbS-AgN , which can be estimated from 211212 dd NNtN β= , so that long residencetimes are necessary. As particle diffusion losses to the walls of the aggregation tubedo not depend on the diameter of the tube for a given volumetric flow but increase
0
10
20
30
40
50
60
70
80
90
100
15 20 25 30 35d m (nm)
N (#
/cm
³)
50 s
92 s
184 s
after aggregation
with electrostatic filtering

7. Synthesis of PbS and SnOx nanoparticles for functional applications
141
with the tube length, increasing the diameter of the aggregation tube seems to be thebest way to obtain a larger residence time and thus a higher concentration ofcomposite nanoparticles. With the largest residence time some 7% of the primaryparticles are aggregated in form of composite nanoparticles, so that afterelectrostatic filtering a concentration of 7 103 cm-3 of composite nanoparticles isobtained.
An additional information contained in Fig. 7.4.3 is the direct experimentaldetermination of the mobility diameter for aggregates consisting of two well-defined primary particles. The aggregate mobility diameter can be estimated usingthe concept of fractal dimension. In this approach, the value of the mobilitydiameter md depends on the primary particle diameter 0d , number of primaryparticles in the aggregate n and the fractal dimension fD as follows:
fDm ndd 0= (7.4.1)
This equation was shown to be valid for small aggregates ( 20<n ) in the freemolecular regime, for which a fractal dimension of 2.18 was experimentally found(Cai and Sorensen, 1994). Using eq. (7.4.1) yields a mobility diameter of 30.6 nmwith the primary particle diameter taken here as the volumetric mean value of thetwo diameters (20 and 24 nm). This value agrees well with the experimentallyfound mobility diameter, being about 30 nm.
On transmission electron micrographs of the deposited compositenanoparticles (Fig. 7.4.4) one can clearly see nanoaggregates composed of twoprimary particles to prevail. Also some nanoaggregates composed of four primaryparticles were observed, which results from the electrostatic filtering allowing topass only uncharged aggregates. Uncharged aggregates can be composed of equalnumbers of PbS and Ag primary particles. In the TEM micrograph, also someparticles look like single primary particles. This might be due to a discharging ofprimary particles in the aggregation tube or due to one particle being shielded fromview by another one.
Electron diffraction shows the presence of both silver and lead sulfide incrystalline form. An EDX line-scan over a single nanoaggregate along a linebetween the particle centers is shown in Fig. 7.4.5. Both Ag and PbS were detected,the maxima of the distributions being some 13 nm apart which is approximately thedistance between primary particle centers as determined from TEM (the insert in thefigure). The relatively broad distribution of the components is due to the finitewidth of the electron beam, here about 10 nm.

142
Fig. 7.4.4. Transmission electron micrograph of Ag-PbS nanoaggregates,composed of PbS nanoparticles with a mobility diameter of 17.5 nm and Agnanoparticles with a mobility diameter of 21.5 nm.

7. Synthesis of PbS and SnOx nanoparticles for functional applications
143
Fig. 7.4.5. EDX line-scan over a nanoaggregate, composed of size-fractionated Agand PbS primary particles, as described in the caption of Fig. 7.4.4. The insertshows the TEM micrograph of the corresponding nanoaggregate.
Due to the low concentrations of the nanoparticle pairs formed (some 103
cm-3), the applications of the method are at present limited to fundamentalinvestigations of the properties of the formed particle pairs, e.g. in optical materials,sensors, solar cells and catalyst and to applications where only very thin layers areneeded. Higher concentrations can be reached when the size fractionation step isdeleted and two aerosols are mixed after having been charged unipolarly andoppositely, but at expense of the high degree of control in the present process

144
7.5 Conclusions: Synthesis of PbS and SnOx nanoparticles forfunctional applications
Synthesis of the semiconductors PbS and SnOx is showed to be possible with thehelp of carefully controlled techniques such as size fractionation and in-flightsintering. With techniques basing on electrical effects, nanoparticle composite pairshave been obtained experimentally. The process of sintering PbS has beeninvestigated for PbS with help of a quantitative model which allowed thedetermination of sintering parameters. As a first indication of changing physicalproperties with particle size, the absorption spectrum of PbS particles is shown toshift toward the blue, indicative for quantum confinement effects. Thin filmscomposed of SnOx nanoparticles show gas-sensitive behavior.

8. Conclusions
145
8. Conclusions
There is a great deal of interest today in the special properties of nanoparticles andtheir potential applications. An overview of the potential functional applications,which include electronic, optical and magnetic applications, based on these specialproperties shows the broad range of possible applications. Most applications demandsome control over particle size, width of the particle size distribution, crystallinity,stoichiometry, inter-particle connections and mixing or doping with other materials.
Gas-phase processes, although having some drawbacks, have the largest meansof control and are therefore the method of choice here. Processes based on purephysical processes are used more often than chemical methods as they allow to obtainthe highest purity. The evaporation-condensation method is chosen in this work assynthesis method. The Brownian coagulation inherent to this method makes itimpossible to obtain narrow particle size distributions but allows to obtain a mixing ofparticles of different materials for the synthesis of nanocomposites.
The formation of nanoparticles by the evaporation-condensation technique wasanalyzed using a moment model describing nucleation, condensation and coagulation.Using the model, it was shown that the temperature in the evaporation furnace and thecooling rate determines the mean particle size and that an aerosoldynamical modelallows the prediction of the temperatures needed for nanoparticle formation.
For describing more complicated systems having more degrees of freedom,such as distribution of particle sizes, different chemical compositions, distribution ofcharges and distribution of number of primary in an aggregate, a newly developedDirect Simulation Monte Carlo method was shown to be suitable. Two examples ofpractical relevance containing multi-dimensional particle dynamics were given:coagulation with chemical reaction in droplets (microreactors) and the coating of solidparticles with nanoparticles.
Aggregation of mixtures of charged nanoparticles is useful for obtainingcomposites. This was studied by means of the Direct Simulation Monte Carlo method.The selectivity of mixing is characterized by means of the fraction of symmetricaggregates. It was shown that for each charge distribution different conditions lead to ahighest possible selectivity of mixing.
Two chemical compounds were selected for further experimental study basedon a literature review. One component is selected for its potential quantumconfinement effects. PbS is a narrow-gap IV-VI semiconductor with a cubic rock saltstructure and is an attractive candidate for the study of quantum confinement effects asits hole Bohr radius is 9 nm. This results in strong confinement effects. The

146
confinement results in a blue shift in the optical absorption spectrum. The othermaterial, SnOx, is selected for its gas-sensing properties.
A size uniformity is important in order to study or make use of quantum sizeeffects, as a distribution of particle sizes will decrease or smear out these effects. Inview of the high specific surface and activity of SnOx nanoparticles, considerableimprovement in sensing properties is expected. In order to understand the relationshipbetween gas-sensing behaviour and particle size better it is necessary to generatemonodisperse nanoparticles, because a distribution of particle sizes will decrease thespecial properties and complicates the interpretation of the experimental results. At themoment no gas sensors based on almost equal-sized nanoparticles are available. Forthis goal, size fractionation by means of a Differential Mobility Analyzer was applied.This decreases the yield, but for functional applications the quality more than thequantity of the nanoparticles is decisive, as most of the functional applications needonly thin films.
Several new instruments have been developed in this work which allow toobtain more control over processes which are essential for the synthesis methodchosen here. They allow nanoparticle charging, nanoparticle size fractionation andnanoparticle deposition.
A newly developed nanoparticle charger, the twin Hewitt charger, allows alarger fraction of the nanoparticles to be charged, which is important to get a higheryield. A higher yield would result in a shorter deposition time, which is importantbecause the deposition takes at present hours to days. The instrument has beenextensively investigated experimentally in order to find the optimal chargingconditions.
Differential Mobility Analysis at lower pressures than atmospheric pressure hasbeen investigated theoretically. It was found that the lower particle limit is not changedfundamentally with lower pressures when keeping the mass flow rate constant, but thatthe higher particle limit is decreased due to decrease of the maximum allowed fieldstrength. A Differential Mobility Analyzer design for low pressure has been presented.It is important to perform size fractionation at pressures lower than atmosphericpressure, as usually the system pressure is decreased in order to get a higher yield ofsmaller nanoparticles and to increase the cleanness of the system.
An Electrostatic Precipitator has been developed which allows the investigationof electrical properties of nanoparticle films under clean conditions direct afterdeposition. This is especially important for semiconductor nanoparticles, where thesurface influences the optical and electronic properties.
Synthesis of the semiconductors PbS and SnOx in form of almost equal-sizedmonocrystalline nanoparticles is showed to be possible with the help of carefullycontrolled techniques such as size fractionation and in-flight sintering. The processes

8. Conclusions
147
of sintering of PbS has been investigated with help of a quantitative model whichallowed the determination of sintering parameters, which are usually unknown forsemiconducting materials. The process should be controlled such that sufficientsintering and crystallisation but no evaporation and re-condensation occurs, as thisdestroys the monodispersity.
As examples of the suitability of synthesized PbS and SnOx nanoparticles forfunctional applications, the absorption spectrum of PbS and the gas-sensitivity of thinfilms composed of SnOx nanoparticles were investigated. As a first indication ofchanging physical properties with particle size, the absorption spectrum of PbSparticles is shown to shift toward the blue, indicative for quantum confinement effects.The measurements also indicate that the optical properties are strongly influenced bythe handling of the nanoparticles directly after their formation, such as sintering and/orevaporation processes taking place in the sintering furnace. By choosing suitable initialmobility diameters, it should be possible to attain the commercially interestingbandgap range around 1.3 eV, used for very fast optical data transfer by means ofGaAs solid state lasers. Further investigations should be accompanied by carefulobservations of the actual particle diameter and crystallinity after sintering at differenttemperatures, preferably by means of high-resolution transmission microscopy.
First measurements show that it is possible to create thin gas-sensitive layerscomposed of equal-sized SnO2 nanoparticles. The experimental procedure allows toproduce thin films, in which the properties of the nanoparticles can be independentlycontrolled by size-fractionation and in-flight sintering and oxidation. Furtherproperties of the films, such as the inter-particle contacts which are very important forthe electrical conductivity, can be influenced by post-deposition annealing This opensa way to investigate fundamental gas-sensing properties of a better controlledmicrostructure than available at present.
Finally, the possibility of gas-phase synthesis of tailored compositenanoparticles by means of aggregation of oppositely charged, size-selectednanoparticles of two different materials is shown. Electrical effects are applied forsize-selection, selective mixing, separating the composite nanoparticles fromunaggregated nanoparticles and the deposition of nanoaggregates. Size, size dispersionand materials can be selected independently. As an illustration of the method,composite nanoparticles consisting of differently sized Ag and PbS nanoparticles havebeen obtained. The method allows the investigation of fundamental properties ofcomposite nanoparticles both in-flight and after deposition in form of a thin film.
Concluding, the field of nanoparticles for functional applications is exciting andrapidly developing. Synthesis and handling methods are available, but the mainchallenge lies in obtaining a better control over the particle characteristics so that thedesired properties of the functional applications can be attained.

148
Acknowledgements
At the first place, I would like to convey my sincere thanks to my mentor,Prof.Dr.-Ing. H. Fissan, whose experience in all aspects of research was invaluable. Heencouraged and enabled me to start many research projects which were crucial for thisHabilitation Thesis.
I am indebted to a number of persons who contributed to this work. First of all,the members of the present nanoparticle group in the process- and aerosolmeasurement technology section (AMT). Arkadi Maisels performed the simulationswith the Monte Carlo technique, and was also responsible for the experiments with thebipolar mixing. Karuna Nanda recorded the optical absorption spectra of the PbSnanoparticles. Marcus Kennedy was responsible for the SnOx synthesis andcharacterization of the gas-sensitive thin films. Frank Otten initiated the constructionof the electrostatic precipitator, amongst numerous other activities. Ralf Langeperformed the first SnOx synthesis trials. Frank Jordan gave useful advise for settingup and testing the charger. Our technical assistent, Christoph Kleinert, was of greathelp in constructing the numerous new experimental setups, while Klaus Kubernus,Fiete Kapitza and Siegfried Neumann enabled the work in the laboratories and atpersonal computers. Heidi Giesen and Rongrong Wang assisted in the administrativepart. Important contributions came also from the students, Kornelius Nielsch whoassisted with the first synthesis experiments, Sami Kilani who constructed the chargerand Willy Gerber who constructed the electrostatic precipitator. I am further indebtedto our guest scientists, Aaron Peled for his critical comments on my reviewing of thefunctional applications and Bodh Mehta for his advise and help with the electricalcharacterization of the SnOx films.
Without the help from the low-temperature physics section of the physicsdepartment, especially Bernd Rellinghaus and Mehmet Acet, the particlecharacterization would have been impossible. I would like to thank also the chairmenand other members of the Special Research Program “Nanoparticles from the gasphase: formation, structure, properties” (SFB 445) for their support and valuablediscussions. The help of the German National Science Foundation (DFG) for financingseveral projects from which results were shown here is gratefully acknowledged.
Finally, I would like to thank my wife, Sabine, for her patience with mypreoccupation with these invisible small particles and for her love and support.

149
List of references
Abeles, B., Pinch, H.L. and Gittleman, J.I. (1975) Percolation conductivity in W-Al2O3
granular metal films. Phys.Rev.Lett. 35 (4) 247-250
Adachi, M., Okuyama, K., Kousaka, Y. and Tanaka, H. (1988) Preparation of gassensitive film by deposition of ultrafine tin dioxide particles. J.Aerosol Sci. 19 (2) 253-263
Agata, M., Kurase, H., Hayashi, S. and Yamamoto, K. (1990) Photoluminescencespectra of gas-evaporated CdS microcrystals. Solid State Comm. 76 (8) 1061-1065
Alivisatos, A.P. (1996) Semiconductor clusters, nanocrystals, and quantum dots.Science 271 933-937
Andres, R.P., Averback, R.S., Brown, W.L., Brus, L.E., Goddard, W.A, Kaldor, A.,Louie, S.G., Moscovits, M., Peercy, P.S., Riley, S.J., Siegel, R., Spaepen, F. andWang, Y. (1989) Research opportunities on clusters and cluster-assembled materials -A department of energy, council on materials science panel report. J.Mater.Res. 4 (3)704-734
Balachandran, U., Siegel, R.W., Liao, Y.X. and Askew, T.R. (1995) Synthesis,sintering, and magnetic properties of nanophase Cr2O3. Nanostruct.Matls. 5 505-512
Bapat, P.M., L.L. Tavlarides and G.W. Smith (1983) Monte Carlo Simulations ofMass Transfer in Liquid-Liquid Dispersions. Chem. Eng. Sci., 38 2003-2008
Bartz, H., Fissan, H. and Liu, B.Y.H. (1987) A new generator for ultrafine aerosolsbelow 10 nm. Aerosol Sci. Technol., 6 163-171
Bayazitoglu, Y., Brotzen, F.R. and Zhang, Y. (1996) Metal vapor condensation in aconverging nozzle. Nanostruct.Matls. 7 789-803
Bezryadin, A., Dekker, C. and Schmid, G. (1997) Electrostatic trapping of singleconducting nanoparticles between nanoelectrodes. Appl.Phys.Lett. 71 (9) 1273-1275
Bird, G.A., Molecular gas Dynamics, Clarendon Press, Oxford (1976)
150
Birringer, R., Gleiter, H., Klein, H.P. and Marquardt, P. (1984) Nanocrystallinematerials , an approach to a novel solid structure with gas like disorder.Phys.Lett 102A365
Blandenet, G., Court, M. and Lagarde, Y. (1981) Thin layers deposited by the pyrosolprocess. Thin Solid Films 77 81-90
Bowles, R.S., Kolstad, J.J., Calo, J.M. and Andres, R.P. (1981) Generation ofmolecular clusters of controlled size. Surf.Sci. 106 117-124
Brankovic, Z., Milosevic, O., Uskokovic, D., Poleti, D. and Karanovic, L. (1994)Nanostructured constituents of ZnO-based varistors prepared by mechanical attrition.Nanostruct.Matls. 4 149-157
Brus, L.E. (1983) A simple model for the ionization potential, electron affinity, andaqueous redox potentials of small semiconductor crystallites. J.Chem.Phys. 79(11)5566-5571
Brus, L.E. (1984) Electron-electron and electron-hole interactions in smallsemiconductor crystallites: the size dependence of the lowest excited electronic state.J.Chem.Phys. 80(9) 4403-4409
Brus, L. (1991) Quantum crystallites and nonlinear optics. Appl.Phys. A 53 465-474
Brus, L.E., Szajowski, P.F., Wilson, W.L., Harris, T.D., Schuppler, S. and Chitrin,P.H. (1995) Electronic spectroscopy of Si nanocrystals: relationship to bulk c-Si andporous Si. J.Am.Ceram.Soc. 117 2915-2922
Büscher, P., Schmidt-Ott, A., Wiedensohler, A. (1994) Performance og an Unipolar"Square Wave" Diffusion Charger with Variable nt-Produkt. J. Aerosol Sci, 25 651-665
Cai, J. and Sorensen, C.M. (1994) Diffusion of fractal aggregates in the free molecularregime. Phys. Rev. E 50 3397-3400
Camata, R.P., Atwater, H.A., Vahala, K.J. and Flagan, R.C. (1996) Size classificationof silicon nanocrystals. Appl.Phys.Lett. 68 (22) 3162-3164

151
Cannon, W.R., Danforth, S.C., Flint, J.C., Haggerty, J.S. and Marra, R.A. (1982)Sinterable ceramic powders from laser-driven reactions. J.Am.Ceram.Soc. 65 324-335
Carey, M.J., Young, A.P, Starr, A., Rao, D. and Berkowitz, A.E. (1992) Giantmagnetoresistance in heterogeneous AgCo alloy films. Appl.Phys.Lett 61 (24) 2935-2937
Chadda, S., Ward, T.L., Carim, A., Kodas, T.T., Ott, K. and Kroeger, D. (1991)Synthesis of Ba2Cu3O7-y and YBa2Cu4O8 by aerosol decomposition. J. Aerosol Sci. 22(5) 601-616
Chen, D.-R., Pui, D.Y.H. and Kaufman, S.L. (1995) Electrospraying of conductingliquids for monodisperse aerosol generation in the 4 nm to 1.8 µm diameter range.J.Aerosol Sci. 26 (6) 963-977
Chen, X., Hu, X. and Feng, J. (1995) Nanostructured nickel oxide films and theirelectrochromic properties. Nanostruct.Matls. 6 309-312
Chen, D.-R., Pui, D.Y.H., Hummes, D., Fissan, H., Quant, F.R. and Sem, G.J. (1998)Design and Evaluation of a Nanometer Aerosol Differential Mobility Analyzer (Nano-DMA). J. Aerosol Sci. 29 (5/6) 497-509
Chen, D. and Pui, D.Y.H. (1999) A high efficiency, high throughput unipolar aerosolcharger for nanoparticles. Nanoparticle Res. 1 115-126
Chopra, K.L., Major, S. and Pandya, D.K. (1983) Transparent conductors - a statusreview. Thin Solid Films 102 1-46
Chow, G.-M., Klemens, P.G. and Strutt, P.R. (1989) Nanometer-size fiber compositesynthesis by laser-induced reactions. J.Appl.Phys. 66 (7) 3304-3308
Colvin, V.L., Schlamp, M.C. and Alivisatos, A.P. (1994) Light-emitting diodes madefrom cadmium selenide nanocrystals and a semiconducting polymer. Nature 370 354-356
Collins, R. T., Fauchet, F. M. and Tischler, M. A. (1997) Physics Today 50 (January),24

152
Dahneke, B (1983) “Simple kinetic theory of Brownian diffusion in vapors andaerosols”. In Theory of Dispersed Multiphase Flow (Edited by Meyer, R.E.), pp. 97-133. Academic Press, New York
Danek, M., Jensen, K.F., Murray, C.B. and Bawendi, M.G. (1994) Preparation of II-VIquantum dot composites by electrospray organometallic chemical vapor deposition.J.Crystal Growth 145 714-720
De Marco, M., Wang, X.W., Snyder, R.L., Simmins, J., Bayya, S., White, M. andNaughton, M.J. (1993) Mössbauer and magnetization studies of nickel ferrites.J.Appl.Phys. 73 (10) 6287-6289
Deppert, K., Maximov, I., Samuelson, L., Hansson, H.-C. and Wiedensohler, A.(1994) Sintered aerosol masks for dry-etched quantum dots. Appl.Phys.Lett. 64 (24)3293-3295
Deppert, K., Bovin, J.-O., Malm, J.-O- and Samuelson, L. (1996) A new method tofabricate size-selected compound semiconductor nanocrystals: aerotaxy. J.CrystalGrowth 169 13-19
Deppert,K, Nielsch, K., Magnusson, M.H., Dumpich, G., Kruis, F.E. and Fissan, H.(1998) Feasibility study of nanoparticle synthesis from powders of compounds withincongruent sublimation behavior by the evaporation/condensation method.Nanostruct. Matls.10 (4) 565-573
Dieguez, A., Romano-Rodriguez, A., Morante, J.R., Weimar, U., Schweizer-Berberich, M. and Göpel, W. (1996) Morphological analysis of nanocrystalline SnO2
for gas sensor applications. Sensors and Actuators B 31 1-8
Dixkens, J. and Fissan, H. (1997) Design of a Sampling System for Off-Line ParticleAnalysis. In “Fine Solid Particles”; Schwerpunktprogramm der DFG (1991-1997),214-222, Shaker-Verlag GmbH, Aachen, ISBN3-8265-3050-0, ISSN 0945-1021
Dufoux, D.P. and Axelbaum, R.L. (1995) Nanoscale unagglomerated nonoxideparticles from a sodium coflow flame. Combust. Flame 100 350-358
Ehbrecht, M., Kohn, B., Huisken, F., Laguna, M.A. and Paillard, V. (1997)Photoluminescence and resonant Raman spectra of silicon films produced by size-selected cluster beam deposition. Phys. Rev. B 56 6958-6964

153
El-Shall, M.E. and Edelstein, A.S. (1996) Formation of clusters and nanoparticlesfrom a supersaturated vapor and selected properties, pp. 13-54 in: „Nanomaterials:synthesis, properties and applications“, ed. by A.S. Edelstein and R.C.Cammarata,Institute of Physics Publishing, Bristol, UK
El-Rahaiby, S.K. and Rao, Y.K. (1982) Kinetics of vaporization of lead sulfide.Metall. Trans B 13B 633-641
Estrada, W., Andersson, A.M. and Granqvist, C.G. (1988) Electrochromic nickel-oxide-based coatings made by reactive dc magnetron sputtering: preparation andoptical properties. J.Appl.Phys. 64 (7) 3678-3683
Fissan, H., Hummes, D., Stratmann, F., Büscher, P., Neumann, S., Pui, D.Y.H. andChen, D.R. (1996) Experimental comparison of four Differential Mobility Analyzersfor nanometer aerosol measurements. Aerosol Sci. Technol. 24 1-13
Fissan, H., Pöcher, A., Neumann, S., Boulaud, D. and Pourprix, M. (1998) Analyticaland empirical transfer functions of a simplidfied Spectromètre de mobilité electriquecirculaire (SMEC) for nanoparticles. J. Aerosol Sci. 29 289-293
Friedlander, S.K (1983) Ann.N.Y.Acad.Sci., 40 354
Friedlander, S.K. (1977) Smoke, Dust and Haze, Wiley, New York.
Fröhlich, K., Machajdik, D., Rosova, A., Vavra, I., Weiss, F., Bochu, B. and Senateur,J.P. (1995) Growth of SrTiO3 thin epitaxial films by aerosol MOCVD. Thin SolidFilms 260 187-191
Fuchs, N.A. (1964) The Mechanics of Aerosols. Pergamon Press, Elmsford, NY.
Fujita, T., Oshima, K., Kuroishi, T. (1976) Temperature dependence of electricalconductivity in films of fine particles. J.Phys.Soc.Japan 40 (1) 90-92
Gacoin, T., Boilot, J.P., Gandais, M., Ricolleau, C. and Chamarro, M. (1995)Transparent sol-gel matrices doped with quantum sized PbS particles. MRS Res.Symp.Proc. 358 247-252
154
Gangopadhyay, S., Hadjipanayis, G.C., Dale, B., Sorensen, C.M., Klabunde, K.J.,Papaefthymiou, V. and Kostikas, A. (1992) Magnetic properties of ultrafine ironparticles. Phys.Rev.B 45 (17) 9778-9787
Gao, H.J., Xue, Z.Q., Wu, Q.D. and Pang, S.J. (1995) Structure and electricalproperties of Ag-ultrafine-particle-polymer thin films. J.Vac.Sci.Technol.B 13(3)1242-1246
Garcia, A.L., C. van den Broek, M. Aertsens and R. Serneels (1987) A Monte CarloMethod of Coagulation. Physica, 143A 535-546
Gautheron, B., Labeau, M., Delabouglise, G. and Schmatz, U. (1993) Undoped andPd-doped SnO2 thin films for gas sensors. Sensors and Actuators B 15-16 357-362
Gelbard, F. Tambour, Y. and Seinfeld, J.H. (1980) Sectional Representations forSimulating Aerosol Dynamics. J. Colloid and Interface Sci. 76 541-550
Gelbard, F. and Seinfeld, J.H. (1980) Simulation of Multicomponent AerosolDynamics. J. Colloid and Interface Sci. 78 485-501
Girshick, S.L. and Chiu, C.P.(1989) Kinetic nucleation theory: A new expression forthe rate of homogeneous nucleation from an indeal supersaturated vapor. J.Chem.Phys. 93 1273-1277
Gmelin, L. )1979) Gmelin handbook of inorganic chemistry, ed. by E.H.E. Pietsch,Springer, Berlin
Goldstein, A.N., Echer, C.M. and Alivisatos, A.P. (1992) Melting in semiconductornanocrystals. Science 256 1425-1427
Göpel, W. and Schierbaum, K.D. (1995) SnO2 sensors: current status and futureprospects. Sensors and Actuators 26 (1) 71-98
Göpel, W. (1996) Ultimate limits in the miniaturization of chemical sensors. Sensorsand Actuators A 56 83-102
Goswami, R., Banerjee, S., Chattopadhyay, K. and Raychaudhuri, A.K. (1993)Superconductivity in rapidly quenched metallic systems with nanoscale structure.J.Appl.Phys. 73 (6) 2934-2940
155
Granqvist, C.G. and Buhrman, R.A. (1976) Ultrafine metal particles. J.Appl.Phys. 47(5) 2200-2219
Grimm, S., Schultz, M., Barth, S. and Müller, R. (1997) Flame pyrolysis - apreparation route for ultrafine pure -Fe2O3 powders and the control of their particlesize and properties. J.Mater.Sci. 32 (1997) 1083-1092
Günther, B. and Kumpmann, A. (1992) Ultrafine oxide powders prepared by inert gasevaporation. Nanstruct.Matls. 1 27-30
Gutsch, A., S.E. Pratsinis and F. Löffler (1995) Agglomerate Structure and GrowthRate by Trajectory Calculations of Monomer-Cluster Collisions. J. Aerosol Sci., 26187
Hadjipanayis, G.C., Klabunde, K.J. and Sorensen, C.M. (1996) Magnetic andstructural properties of nanoparticles. pp. 375-394 in: „Nanomaterials: synthesis,properties and applications“, ed. by A.S. Edelstein and R.C.Cammarata, Institute ofPhysics Publishing, Bristol, UK
Hahn, H. and Averback, R.S. (1990) The production of nanocrystalline powders bymagnetron sputtering. Appl.Phys.Lett. 67(2) 1113-1115
Harrison, M.R., Hall, S.R., Jacobson, D.M. and Dineen, C. (1996) High-currentconductors using high-temperature superconductors. GEC J. of Res. 13 (3) 146-158
Hayashi, C. (1987) Ultrafine particles. J.Vac.Sci.Technol. A 5(4) 1375-1384
Hayashi, S., Sanda, H., Agata, M. and Yamamoto, K, (1989) Resonant Ramanscattering from ZnTe microcrystals: Evidence for quantum size effects. Phys.Rev.B. 40(8) 5544-5547
Herzer, G. (1990) Grain size dependence of coercivity and permeablity innanocrystalline ferromagnets. IEEE Trans. Magn. 26 (5) 1397-1402
Hewitt, G.W. (1957) AIEE Trans. 76 300
Hide, F., Schwartz, B.J., Diaz-Garcia, M.A. and Heeger; A.J. (1996) Laser emissionfrom solutions and films containing semiconducting polymer and titanium dioxidenanocrystals. Chem.Phys.Lett. 256 424-430

156
W.C. Hinds (1982) Aerosol Technology, p. 44 (John Wiley, New York)
Hodes, G., Albu-Yaron, A., Decker, F. and Motisuke, P. (1987) Three-dimensionalquantum-size effect in chemically deposited cadmium selenide films. Phys.Rev.B 364215-4221
Hogan, H. (1996) The gigachips are coming. Industrial Physicist 7-8
Holtz, R.L., Provenzano, V. and Imam, M.A. (1996) Overview of nanophase metalsand alloys for gas sensors, getters, and hydrogen storage. Nanostruct.Matls. 7 259-264
Honig, R.E. and Kramer, D.A. (1969), “Vapor Pressure Data for the Solid and LiquidElements“, report, RCA Laboratories, Princeton NJ
Horvath, J., Birringer, R. and Gleiter, H. (1987) Diffusion in nanocrystalline material.Sol. State Comm. 62(5) 319-322
Hu, W.S., Liu, Z.G., Zheng, J.G., Hu, X.B., Guo, X.L., and Göpel, W. (1997)Preparation of nanocrystalline SnO2 thin films used in chemisorption sensors bypulsed laser reactive ablation. J.Mater Sci.Mater.Elec. 8 155-158
Huang, Y.K., Menovsky, A.A: and Boer, F.R. de. (1993) Electrical resistivity ofnanocrystalline copper. Nanostruct.Matls. 2 505-513
Hull, P.J., Hutchison, J.L., Salata, O.V. and Dobson, P.J. (1997) Synthesis ofnanometer-scale silver crystallites via a room-temperature electrostatic sprayingprocess. Adv.Mater. 9 (5) 413-417
Hwang, J.-H., Dravid, V.P., Teng, M.H., Host, J.J., Elliott, B.R., Johnson, D.L. andMason, T.O. (1997) Magnetic properties of graphitically encapsulated nickelnanocrystals. J.Mater.Res. 12 (4) 1076-1082
Ishikawa, K., Yoshikawa, K. and Okada, N. (1988) Size effect on the ferroelectricphase transition in PbTiO3 ultrafine particles. Phys.Rev.B. 37 (10) 5852-5855
Ito, O., Asai, T., Ogawa, T., Hasegawa, M., Ikegami, A., Endoh, Y., Araya, T., Atoh,K. and Kobayashi, T. (1991) Effect of conduction particle size on LaB6 thick filmreesistor. Thin Solid Films 198 17-27

157
Iwama, S., Hayakawa, K. and Arizumi, T. (1982) Ultrafine powders of TiN and AlNproduced by a reactive gas evaporation technique with electron beam heating.J.Crystal Growth 56 265-269
Jergel, M., Hanic, F., Strbik, V., Liday, J., Plesch, G., Melisek, T. and Kubranova, M.(1992) Thin BSCCO films prepared by deposition from aerosol. Supercond. Sci.Technol., 5 (11) 663-670
Johnston, G.P., Muenchausen, R., Smith, D.M., Fahrenholtz, W. and Foltyn, S. (1992)Reactive laser ablation synthesis of nanosize alumina powder. J.Am.Ceram.Soc. 75(12) 3293-3298
Kaito, C., Fujita, K. and Shiojiri, M. (1976) Growth of smoke particles prepared byevaporation in inert gases. J.Appl.Phys. 47 (12) 5161-5166
Kaito, C., Fujita, K. and Shiojiri, M. (1983) Growth of CdTe smoke particles preparedby gas evaporation technique. J.Crystal Growth 62 375-383
Kaito, C., Saito, Y. and Fujita, K. (1987) A new preparation method of ultrafineparticles of metallic sulfides. J.Appl.Phys. 2 26 1973-1975
Kaito, C. and Saito, Y. (1990) Growth of ultrafine particles of II-VI compounds by anew gas evaporation technique. J.Crystal Growth 99 743-746
Kanemitsu, Y., Uto, H., Matsumoto, Y. and Maeda, Y. (1992) On the origin of visiblephotoluminescence in nanometer-size Ge crystallites. Appl.Phys.Lett. 61 2187-2189
Kanemitsu, Y., Ogawa, T., Shiraishi, K. and Takeda, K. (1993) Visiblephotoluminescence from oxidized Si nanometer-sized spheres: exciton confinement ona spherical shell. Phys.Rev.B 48 (7) 4883-4886
Kanemitsu, Y. (1995) Light emission from porous silicon and related materials.Phys.Rep. 263 1-91
Kang, Y.C., Park, S.B. and Kang, Y.W. (1995) Preparation of high surface areananophase particles by low pressure spray pyrolysis. Nanostruct.Matls. 5 777-791
Kang, Y.C. and Park, S.B. (1996a) Preparation of nanometre size oxide particles usingfilter expansion aerosol generator. J.Mater.Sci. 31 2409-2416

158
Kang, Y.C. and Park, S.B. (1996b) Effect of preparation conditions on the formationof primary ZnO particles in filter expansion aerosol generator. J.Mater.Sci., accepted
Kato, M. (1976) Preparation of ultrafine particles of refractory oxides by gas-evaporation method.Jap.J. Appl.Phys. 15(5) 757-760
Kagawa, M., Suzuki, M., Mizoguchi, Y., Hirai, T. and Syono, Y. (1993) Gas-phasesynthesis of ultrafine particles and thin films of Y-Al-O by the spray-ICP technique.J.Aerosol Sci. 24 349-355
Katzer, M., Weber, A. P., Schmidt, E. and Kasper, G. (1998) Collision Frequences ofFractal-like Aerosol Particles. Advanced Technologies for Particle Processing, 1, pp.93-98
Kawaguchi, T. and Miyazima, S. (1993) Visible photoluminescence from Simicrocrystalline particles. Jpn.J.Appl.Phys. 32 L215-L217
Kear, B.H. and Strutt, P.R. (1995) Chemical processing and applications fornanostructured materials. Nanostruct.Matls. 6 227-236
Kim, K. and Rye, C.K. (1994) Generation of charged liquid cluster beam of liquid-mixprecursors and applications to nanostructured materials. Nanostruct.Matls 4 597-602
Kizaki, Y., Osada, H. and Aoki, H. (1993) Ultrafine particle beam deposition III:Applications to thermoelectric materials. Jpn. J. Appl. Phys. 32 5778-5790.
Klabunde, K.J. (1994) Free atoms ,clusters, and nanoscale particles. Academic Press,San Diego.
Knutson, E.O. and Whitby, K.T. (1975) Aerosol classification by electric mobility:Apparatus, theory, and applications. J. Aerosol Sci. 6 443-451
Koch, W. and Friedlander, S.K. (1990) The effect of particle coalescence on thesurface area of a coagulating aerosol. J. Colloid Interface Sci. 140 419-427
Koch, F. and Petrova-Koch, V. (1996) Light from Si-nanoparticle systems - acomprehensive view. J. of Non-Cryst. Solids 198-200 840-846.
159
Kodas, T.T., Engler, E.M., Lee, V.Y., Jacowitz, R., Baum, T.H., Roche, K., Parkin,S.S.P., Young, W.S., Hughes, S., Kleder, J. and Auser, W. (1988) Aerosol flow reactorproduction of fine Y1Ba2Cu3O7 powder: Fabrication of superconducting ceramics.Appl. Phys. Lett. 52 (19) 1622-1624
Kodas, T.T., Engler, E.M. and Lee, V.Y. (1989) Generation of thick Ba2YCU3O7 filmsby aerosol deposition. Appl.Phys.Lett. 54 (19) 1923-1925
Kohl, D. (1989) Surface processes in the detection of reducing gases with SnO2-baseddevices. Sensors and Actuators 18 71-113
Koyama, T., Ohtsuka, S., Nagata, H. and Tanaka, S. (1992) Fabrication ofmicrocrystallites of II-VI compound semiconductors by laser ablation method,J.Crystal Growth 117 156-160
Kreibig, U. (1974) Electronic properties of small silver particles: the optical constantsand their temperature dependence. J.Phys.F: Metal Phys. 4 999-1014
Kruis, F.E., Scarlett, B., Bauer, R.A. and Schoonman, J. (1992) ThermodynamicCalculations on the Chemical Vapor Deposition of Silicon Nitride and Silicon fromSilane and Chlorinated Silanes. J. Am. Ceram. Soc. 75(3) 619-628
Kruis, F.E., Kusters, K.A., Pratsinis, S.E. and Scarlett, B. (1993) A Simple Model forthe Evolution of the Characteristics of Aggregate Particles undergoing Coagulationand Sintering. Aerosol Sci. Technol. 19 514-526
Kruis, F.E., Goossens, A. and Fissan, H. (1996) Synthesis of SemiconductingNanoparticles. J. Aerosol Sci. 27 S1 165-166
Kruis, F.E., Otten, F., Jordan F., and Fissan, H (1998a) A new efficient unipolarcharger for nanoparticles. J. Aerosol Sci. 29 1021-1022
Kruis, F.E., Oostra, W., Marijnissen, J., Schoonman, J., Scarlett, B. (1998b) Particleformation paths in the synthesis of silicon nitride powder in a laser-heated aerosolreactor. J. Eur. Ceram. Soc. 18 1025-1036
Kruis, F.E., Nielsch, K., Fissan, H., Rellinghaus, B. and Wassermann, E.F. (1998c)Preparation of size-classified PbS nanoparticles in the gas phase. Appl.Phys.Lett. 73 4547-549

160
Kruis, F.E., Fissan, H. and Peled, A. (1998d) Synthesis of nanoparticles in the gasphase for electronic, optical and magnetic applications - A review. J.Aerosol Sci 29 5/6511-535
Kruis, F.E. Maisels, A. and Fissan, H. (2000a) A Direct-Simulation Monte CarloMethod for Particle Coagulation and Aggregation. AIChE J. 46, 1735-1742
Kruis, F.E., Fissan, H. and Rellinghaus, B. (2000b) Sintering and EvaporationCharacteristics of Gas-phase Synthesis of Size-selected PbS Nanoparticles.Mat.Sci.Eng. B 69-70 329-334
Kruis, F.E. and Fissan, H. (2001) Nanoparticle charging using a twin Hewitt charger.J. Nanoparticle Res. 3 39-50
Kundu, T.K. and Chakravorty, D. (1995) Nanocomposite films of lead zirconatetitanate and metallic nickel by sol-gel route. Appl.Phys.Lett. 66 (26) 3576-3578
Kundu, T.K. and Chakravorty, D. (1996) Electrical properties of sol-gel derived filmscontaining composites of glass-ceramics and nanocrystalline silver. J.Mater.Res. 11(1)200-203
Labeau, M., Gautheron, B., Cellier, F., Vallet-Regi, M., Garcia, E. and GonzalezCalbet, J.M. (1993) Pt nanoparticles dispersed on SnO2 thin films: a microstructuralstudy. J.Sol. St.Chem 102 434-439
Labeau, M., Gas’kov, A.M., Gautheron, B. and Senateur, J.P. (1994) Synthesis of Pd-doped SnO2 films on silicon and interaction with ethnol and CO. Thin Solid Films 2486-11
Landgrebe, J.D., and S.E. Pratsinis (1990) A Discrete-sectional Model for ParticulateProduction by Gas-phase Chemical Reaction and Aerosol Coagulation in the Free-molecular Regime. J. Colloid Interface Sci., 139 63-86
Lee, D.H., Vuong, K.D., Williams, J.A.A., Fagan, J., Condrate, R.A. and Wang, X.W.(1996) RF aerosol plasma fabrication of indium tin oxide and tin oxide thin films.J.Mater.Res. 11 (4) 895-903
Leong, K.H. (1987) Morphological control of particles generated from the evaporationof solution droplets: theoretical considerations. J.Aerosol Sci. 18 (5) 511-524

161
Li, C. and Hua, B. (1997) Preparation of nanocrystalline SnO2 thin film coated Al2O3
ultrafine particles by fluidized chemical vapor deposition. Thin Solid Films, 310 238-240
Li,Y., Gong,W., Hadjipanayis,G.C., Sorensen,C.M., Klabunde,K.J.,Papaefthymiou,V., Kostikas,A., Simopolous,A. (1994) Size effects on the magneticproperties of fine Fe-Cr particles. J. Magn.Magn.Mater. 130 261-266
Liffman, K (1992) A Direct Simulation Monte Carlo Method for Cluster Coagulation.J. Comp. Phys., 100 116-127
Linderoth, S. and Moerup, S. (1990) Ultrasmall iron particles prepared by use ofsodium amalgam. J.Appl. Phys. 67 (9) 4496-4498
Litster, J.D., D.J. Smit and M.J. Hounslow (1995) Adjustable Discretized PopulationBalance for Growth and Aggregation. AIChE J. 41 591-603
Littau, K.A., Szajowski, P.J., Muller, A.J., Kortan, A.R. and Brus, L.E. (1993) Aluminiscent silicon nanocrystal colloid via a high temperature aerosol reaction.J.Phys.Chem. 97 1224-1230
Lopez-Otero, A. (1978) Hot wall epitaxy. Thin Solid Films 49 1-57
Lushnikov, A.A. (1976) Evolution of Coagulating Systems. III. Coagulating Mixtures,J. of Colloid Interface Sci., 54 94-101
Lüth, H. (1995) Nanostructures and semiconductor electronics. Phys.Stat.Sol. B 192287-299
Lyons, S.W., Wang, L.M. and Kodas, T.T. (1992) Nanophase oxide formation byintraparticle reaction. Nanostruct.Matls. 1 283-291
Machol, J.L., Wise, F.W., Patel, R., and Tanner, D.B. (1994) Optical studies of IV-VIquantum dots. Physica A 207 427-34
Maisels, F.E. Kruis, H. Fissan, B. Rellinghaus, H. Zähres (2000) Synthesis of tailoredcomposite nanoparticles in the gas phase. Appl.Phys.Lett. 77, 4431-4433

162
Majima, T., Miyahara, T., Haneda, K., Ishii, T. and Takami, M. (1994) Preparation ofIron ultrafine particles by the dielectric breaksown of Fe(CO)5 using a transverselyexcited atmospheric CO2 laser and their characteristics. Jpn.J.Appl.Phys. 33 4759-4763
Matsoukas, T. and Friedlander, S.K. (1991) Dynamics of Aerosol AgglomerateFormation. J. of Colloid Interface Sci. 146 495-518
Maximov, I., Gustfsson, A., Hansson, H.-C., Samuelson, L., Seifert, W. andWiedensohler, A. (1993) Fabrication of quantum dot structures using aerosoldeposition and plasma etching techniques. J.Vac.Sci.Technol. A 11 (4) 748-753
Mezey, L.Z. and Giber (1982) Jpn.J.Appl.Phys. 21 1569
Mimura, H., Matsumoto, T. and Kanemitsu, Y. (1994) Blue electroluminescence fromporous silicon carbide Appl.Phys.Lett. 65 3350-3352
Mizuguchi, Y., Kagawa, M., Suzuki, M., Syono, Y. and Hirai, T. (1994) Synthesis ofultrafine particles and thin films of BaFe12O19 by the spray-ICP technique.Nanostruct.Matls. 4 591-596
Moulson, A.J. and Herbert, J.M. (1990) Electroceramics - Materials, properties,applications. Chapman and Hall, London, UK.
Nenadovic, M.T., Comor, M.I., Vasic, V., Micic, O.I. (1990) Transient bleaching ofsmall PbS colloids: Influence of surface properties. J. Phys.Chem. 94 6390-6396
Oda, M., Fuchita, E., Tsuneizumi, M., Kashu, S. and Hayashi, C. (1992) Gasdeposition films of ultra fine particles. Nanostruct.Matls. 1 203-206
Ogawa, H., Abe, A., Nishikawa, M. and Hayakawa, S. (1981a) Preparation of tinoxide films from ultrafine particles. J.Electrochem.Soc. 128 (3) 685-689
Ogawa, H., Abe, A., Nishikawa, M. and Hayakawa, S. (1981b) Electrical properties oftin oxide ultrafine particle films. J.Electrochem.Soc. 128 (9) 2020-2025
Ogawa, H., Nishikawa, M. and Abe, A. (1982) Hall measurement studies and anelectrical conduction model of tin oxide ultrafine particle films. J.Appl.Phys. 53(6)4448-4455

163
Ohtsuka, S., Koyama, T., Tsunetomo, K., Nagata, H. and Tanaka, S. (1992) Nonlinearoptical properties of CdTe microcrystallites doped glasses fabricated by laserevaporation method. Appl.Phys.Lett. 61 (25) 2953-2954
Okuyama, K., Shimada, M., Adachi, M. and Tohge, N. (1993) Preparation of ultrafinesuperconductive Bi-Ca-Sr-Cu-O particles by metalorganic chemical vapor deposition.J. Aerosol Sci. 24 (3) 357-366
Oron, A. and Seinfeld, J.H. (1989) The dynamic behavior of charged aerosols. Part II:Numerical solution by the sectional method. J. Colloid Interface Sci. 133 66-80
Otto, E., Gutsch, A. and Fissan, H. (1996) Gas Cleaning Due to Enhanced BipolarCoagulation. Proc. 3d Int. Symposium and Exhibition on Gas Cleaning at HighTemperatures, Karlsruhe (edited by Eberhard Schmidt, Peter Gäng, Torsten Pilz andAchim Dittler), pp. 48-59.
Otto, E. (1997) Modellierung Brownscher und elektrischer Koagulation submikronerPartikel. PhD Thesis, Gerhard-Mercator-Universität GH Duisburg. Shaker Verlag,Aachen.
Otto, E. and Fissan, H. (1999) Brownian Coagulation of Submicron Particles. Adv.Powder Technol. 10 1-20
Panda, S. and Pratsinis, S. (1995) J.Nanostruct.Mater. 5, 755
Parker, J.C. (1996) Commercialization oppurtunities for nanophase ceramics : a small-company perspective, pp. 573-581 in: „Nanomaterials: synthesis, properties andapplications“, ed. by A.S. Edelstein and R.C.Cammarata, Institute of PhysicsPublishing, Bristol, UK
Pearson, W.B. (1967) A handbook of lattice spacings and structures of metals andalloys. 2nd edition, Vol. 2, Part 1, p. 353 (Pergamon Press, Oxford)
Pearson, H.J. (1984) Monte Carlo Simulations of Coagulation in Discrete Particle-sizeDistributions. Part 1. Brownian Motion and fluid shearing. J. Fluid Mech. 143 367-385Pehnt, M., Schulz, D.L., Curtis, C.J., Jones, K.M. and Ginley, D.S. (1995)Nanoparticle precursor route to low-temperature spray deposition of CdTe thin films.Appl.Phys.Lett. 67 (15) 2176-2178

164
Peled, A., Friesem, A.A. and Shapira, Y. (eds.) (1996) Proceedings of the SecondInternational Conference on Photo-excited Processes and Applications. Appl.Surf.Sci.106 pp.1-540
Peled, A. (1997) Review: State of the art in liquid phase photodeposition processesand applications(LPPD).Lasers in Engineering.6 41-72
Peyghambarian, N., Hanamura, E., Koch, S.W., Masumoto, Y. and Wright, E.M.(1996) Optical characterization and applications of semiconductor quantum dots, pp.395-436 in: „Nanomaterials: synthesis, properties and applications“, ed. by A.S.Edelstein and R.C.Cammarata, Institute of Physics Publishing, Bristol, UK
Piskunov, V.N., Golubev, A.I., Goncharov, E.A. and Izmailova, N.A. (1997) KineticModeling of Composite Particles Coagulation. J. Aerosol Sci. 28 1215-1231
Powers, D.E., Hansen, S.G., Guesic, M.E., Pulu, A.C., Hopkins, J.B., Dietz, J.B.,Duncan, M.A., Langridge-Smith, P.R.R. and Smlley, R.E. (1982) Supersonic metalcluster beams: laser photoionization studies of Cu2. J.Phys.Chem. 86 2556-2560
Pratsinis, S.E. (1988) Simultaneous Nucleation, Condensation and Coagulation inAerosol Reactors. J. Colloid Interface Sci., 124 416
Prokes, S.M. (1996) Porous silicon nanostructures, pp. 439-457 in: „Nanomaterials:synthesis, properties and applications“, ed. by A.S. Edelstein and R.C.Cammarata,Institute of Physics Publishing, Bristol, UK
Prost, W., Kruis, F.E., Otten, F., Nielsch, K., Rellinghaus, B., Auer, U., Peled, A.,Wassermann, E.F., Fissan, H. and Tegude, F.J. (1998) Monodisperse aerosol particledeposition: Prospects for nanoelectronics, J. Microelect. Eng. 41/42 535-538
Qin, X.Y., Wu, B.M., Du, Y.L., Zhang, L.D. and Tang, H.X. (1996) An experimentalstudy of thermal diffusivity of nanocrystalline Ag. Nanostruct.Matls. 7 383-391
Rao, N., Micheel, B., Hansen, D., Fandrey, C., Bench, M., Girshick, S., Heberlein, J.and McMurry, P. (1995a) Nanoparticle formation using a plasma expansion process.Plasma Chem.Plasma Process. 15 (4) 581-606

165
Rao, N., Micheel, B., Hansen, D., Fandrey, C., Bench, M., Girshick, S., Heberlein, J.and McMurry, P. (1995b) Synthesis of nanophase silicon, carbon, and silicon carbidepowders using a plasma expansion process. J.Mater.Res. 10 (8) 2073-2084
Reed, T.B. (1961) Induction-coupled plasma torch. J.Appl.Phys. 32 (5) 821-824
Rubinstein, R.Y. (1981) Simulation and the Monte Carlo Method. John Wiley andSons, New York, p. 91
Rulison, A.J. and Flagan, R.C. (1994) Synthesis of yttria powders by electrospraypyrolysis. J.Am.Ceram.Soc. 77 3244-3250
Salata, O.V., Dobson, P.J., Hull, P.J. and Hutchison, J.L. (1994a) Fabrication of PbSnanoparticles embedded in a polymer film by gas-aerosol reactive electrostaticdeposition technique. Adv.Mater. 6(10) 772-775
Salata, O.V., Dobson, P.J., Hull, P.J. and Hutchison, J.L. (1994b) Fabrication of CdSnanoparticles embedded in a polymer film by gas-aerosol reactive electrostaticdeposition technique. Thin Solid Films 251 1-3
Salazar, K.V., Ott, K.C., Dye, R.C., Hubbard, K.M., Peterson, E.J. and Coulter, J.Y.(1992) Aerosol assisted chemical vapor deposition of superconducting YBa2Cu3O7-x.Physica C 198 303-308
Sanjines, R., Demarne, V. and Levy, F. (1990) Hall effect measurements in SnOx filmsensors exposed to reducing and oxidizing gases. Thin Solid Films 193 935-942
Sarkas, H.W., Arnold, S.T., Hendricks, J.H., Kidder, L.H., Jones, C.A. and Bowen,K.H. (1993) An investigation of catalytic activity in mixed metal oxide nanophasematerials. Z.Phys.D 26 46-50
Saunders, W.A., Sercal, P.C., Atwater, H.A., Vahala, K.J. and Flagan, R.C. (1992)Vapor phase synthesis of crystalline nanometer-scale GaAs clusters. Appl.Phys.Lett.60 (8) 950-952
Saunders, W.A., Sercel, P.C., Lee, R.B., Atwater, H.A., Vahala, K.J., Flagan, R.C. andEscorcia-Aparcio, E.J. (1993a) Synthesis of luminescent silicon clusters by sparkablation. Appl.Phys.Lett. 63 1549-1551
166
Saunders, W.A., Sercel, P.C., Flagan, R.C., Atwater, H.A. and Vahala, K.J. (1993b)The role of Ga-droplet formation in nanometer-scale GaAs cluster synthesis fromorganometallic precursors. Z.Phys.D. 26 219-221
Scheibel, H.G. and Porstendörfer, J. (1983) Generation of monodisperse Ag- andNaCl-aerosol with particle diameters between 2 and 300 nm. J.Aerosol Sci. 14 113-126
Schmatz, U., Delabouglise, G., Labeau, M. and Garden, J. (1994) Electrical andmicrostructural studies of SnO2 ceramics obtained by tin sulfate pyrolysis.J.Electrochem.Soc. 141 (11) 3254-3258
A. Schmidt-Ott, J. (1988) J. Aerosol Sci. 19 553
Seraphim, A.A., Ngiam, S.-T. and Kolenbrander, K.D. (1996) Surface control ofluminescence in silicon nanoparticles. J.Appl.Phys. 80 (11) 6429-6433
Sercel, P.C., Saunders, W.A., Atwater, H.A., Vahala, K.J. and Flagan, R.C. (1992)Nanometer-scale GaAs clusters from organometallic precursors. Appl.Phys.Lett. 61 (6)696-698
Service, R.F. (1996) Small clusters hit the big time. Science 271 920-922
Seto, T., Shimade, M. and Okuyama, K. (1995) Evaluation of sintering of nanometer-sized titania using aerosol method. Aerosol Sci. Technol. 23 183-200
Seto ,T., Nakamoto, T., Okuyama, K., Adachi, A., Kuga, Y. and Takeuchi, K. (1996)Size distribution measurements of nanometer-sized aerosol particles using DMA underlow-pressure conditions. J. Aerosol Sci. 28 193-206
Shah, B.H., D. Ramkrishna and J.D. Borwanker (1977) Simulation of ParticulateSystems Using the Concept of the Interval of Quiescence. AIChE J 23 897-904
Shi, J., Gider, S., Babcock, K. and Awschalom, D.D. (1996) Magnetic clusters inmolecular beams, metals, and semiconductors. Science, 271 937-941Siegel, R.W. (1994) Nanophase materials: Synthesis, structure, and properties. Pp. 65-105, Vol. 26 in „Series in material sciences“, Springer-Verlag, Berlin. Ed. byF.E.Fujita.

167
Smoluchowski, M.V. (1917) Versuch zur Mathematischen Theorie derKoagulationskinetik Kolloider Lösungen. Z. Phys. Chem. 92 129-168
Spouge, J.L. (1983) Solutions and critical times for the polydisperse coagulationequation when CxyyxBAyxa +++= )(),( . J. Phys. A: Math. Gen. 16 3127-3130
Stratmann, F., Wiedensohler, A., Maximov, I., Samuelson, L., Hansson, H.-C., Fissan,H. (1993) Deposition of ultrafine particles on semiconductors for use as dry etchingmasks: Numerical calculation and experimental verification. J.Aerosol Sci. 24 (5) 687-690
Takagi, H., Ogawa, H., Yamazaki, Y., Ishizaki, A. and Nakagiri, T. (1990) Quantumsize effects on photoluminescence in ultrafine Si particles. Appl.Phys.Lett. 56 2379-2380
Takao, Y., Awano, M., Kuwahara, Y. and Murase, Y. (1996) Preparation of oxidesuperconductive composite by an electrostatic mixing process. Sensors and ActuatorsB 31 (1-2) 131-133
Tamir, S. and Berger, S. (1995) Laser induced deposition of nanocrystalline Si withpreferred crystallographic orientation. Appl.Surf.Sci. 86 514-520
Tang, Z.X., Nafis, S., Sorensen, C.M., Hadjipanayis, G.C. and Klabunde, K.J. (1989)Magnetic properties of aerosol synthesized barium ferrite particles. IEEE Trans.Magn. 25 (5) 4236-4238
Tasaki, A., Tomiyama, S., Iida, S., Wada, N. and Uyeda, R. (1965) Magneticproperties of ferromagnetic metal fine particles prepared by evaporation in argon gas.Jap.J.Appl.Phys. 4 (10) 707-711
Thielsch, R., Böhme, T., Reiche, R., Schläfer, D., Bauer, H. -D. and Böttcher, H.(1998) Quantum-size effects of PbS nanocrystallites in evaporated composite films.Nanostr. Mater. 10 131-149
Tolbert, S.H. and Alivisatos, A.P. (1995) High-pressure structural transformations insemiconductor nanocrystals. Ann.Rev.Phys.Chem. 46 595-625

168
Tourtin, F., Daviero, S., Ibanez, A., Haidoux, A., Avinens, C., Philippot, E. (1995)Low temperature deposition of gallium phosphate amorphous dielectric thin films byaerosol CVD, J. of Non-Cryst. Solids, 187 435-442.
Turner, J.R., Kodas, T.T. and Friedlander, S.K. (1988) Monodisperse particleproduction by vapor condensation in nozzles. J.Chem.Phys. 88 (1) 457-465
Vemury, S., K. Kusters and S.E. Pratsinis (1994) Time-Lag for Attainment of the Self-preserving Particle Size Distribution by Coagulation. J. Colloid Interface Sci. 165 53-59
Vemury, S., Pratsinis, S.E. and Kibbey, L. (1997) Electrically controlled flamesynthesis of nanphase TiO2, SiO2 and SnO2 powders. J.Mater.Res. 12 1031-1042
Vemury, S., C. Janzen, C. and S.E. Pratsinis (1997) Coagulation of Symmetric andAsymmetric Bipolar Aerosols. J. Aerosol Sci. 28 599-609
Venkatesan, T. and Green, S. (1996) Pulsed-laser deposition: Thin films in a flash.Industrial Physicist 2 (3) 22-24
Vezzoli, G.C., Chen, M.F. and Caslavsky, J. (1994) New high dielectric constantmaterials: micro/nanocomposites of suspended Au clusters in SiO2/SiO2-Al2O3-Li2Ogels and relevant theory for high capacitance applications. Nanostruct.Matls. 4 985-1009
Viswanath, R.N., Ramasamy, S., Ramamoorthy, R., Jayavel, P. and Nagarajan, T.(1995) Preparation and characterization of nanocrystalline ZnO based materials forvaristor applications. Nanostruct.Matls. 6 993-996
Volkening, F.A., Naidoo, M.N., Candela, G.A., Holtz, R.L. and Provenzano, V. (1995)Characterization of nanocrystalline palladium for solid state gas sensor applications.Nanostruct.Matls. 5 (3) 373-382
Vollath, D., Szabo, D.V., Taylor, R.D., Willis, J.O. and Sickafus, K.E. (1995)Synthesis and properties of nanocrystalline superparamagnetic γ-Fe2O3.Nanostruct.Matls. 6 (1995) 941-944Vollath, D. and Sickafus, K.E. (1992) Synthesis of nanosized ceramic oxide powdersby microwave plasma reactions. Nanostruct.Matls 1 427-437
169
Wang, Y., Suna, A., Mahler, W. and Kasowski, R. (1987) PbS in polymers. Frommolecules to bulk solids. J. Chem. Phys. 87 7315-7322
Wang, J and Xiao, G. (1994) Transition-metal granular solids: Microstructure,magnetic properties, and giant magnetoresistance. Phys.Rev.B 49 3982-3996
Wang, X.W., Zhong, H.H. and Snyder, R.L. (1990) RF plasma aerosol deposition ofsuperconductive Y1Ba2Cu3O7-d films at atmospheric pressure. Appl. Phys. Lett. 57(15)1581-1583
Wautelet, M. (1991) Estimation of the variation of the melting temperature with thesize of small particles, on the basis of a surface-phonon instability model. J.Phys.D:Appl.Phys. 24 343-346
Weisbuch, C. and Vinter, B. (1991) Quantum semiconductor structures: fundamentalsand applications. Acedemic Press, San Diego, USA.
Weissmüller, J. (1996) Characterization by scattering techniques and EXAFS. pp. 219-276 in: „Nanomaterials: synthesis, properties and applications“, ed. by A.S. Edelsteinand R.C.Cammarata, Institute of Physics Publishing, Bristol, UK
Weller, H. (1993) Colloidal semiconducting Q-particles: Chemistry in the transitionregion between solid state and molecules. Angew.Chem.Int.Ed.Engl. 32 41-53
Werwa, E., Seraphin, A.A., Chiu, L.A., Zhou, C. and Kolenbrander, K.D. (1994)Synthesis and processing of silicon nanocrystallites using a pulsed laser ablationsupersonic expansion method. Appl.Phys.Lett. 64 (14) 1821-1823
Wiedensohler, A., Büscher, P., Hansson, H.-C., Martinsson, B.G., Stratmann, F. ,Ferron, G. and Busch, B. (1994) J. Aerosol Sci. 25 639
Wiedensohler, A. (1988) An Approximation of the Bipolar Charge Distribution forParticles in Submicron Size Range. J. Aerosol Sci. 19 387-394
Wiedensohler, A., Hansson, H.-C., Maximov, I. and Samuelson, L. (1992) Nanometerpatterning of InP using aerosol and plasma etching techniques. Appl.Phys.Lett. 61 (7)837-839
170
Wilson, W.L., Szajowski, P.F. and Brus, L.E. (1993) Quantum confinement in size-selected, surface-oxidized silicon nanocrystals. Science 262 1242-1244
Woodruff, D.W. and Redwing, J.M. (1991) Chemical vapor deposition of fine-grainedequiaxed tungsten films. Surf.Coat.Technol. 49 215-220
Xiao, G. and Chien, C.L. (1987) Giant magnetic coercivity and percolation effects ingranular Fe-(SiO2) solids. Appl.Phys.Lett. 51 (16) 1280-1282
Xiong, Y. and S.E. Pratsinis (1993) Formation of Agglomerate Particles byCoagulation and Sintering: I. A Two-Dimensional Solution to the Population BalanceEquation. J. Aerosol Sci. 24 283-292
Xu, C., Tamaki, J., Miura, N. and Yamazoe, N. (1991) Grain size effects on gassensitivity of porous SnO2-based elements. Sensors and Actuators B 3 147-155
Xu, C.; Hampden-Smith, M.J.; Kodas, T.T. (1994) Aerosol-assisted chemical vapordeposition (AACVD) of silver, palladium and metal alloy (Ag1-xPdx, Ag1-xCux and Pd1-
xCux) films. Adv. Mater 6 (10) 746-748
Yamada, I., Usui, H. and Takagi, T. (1987) Formation mechanism of large clustersfrom vaporized solid material. J.Phys.Chem. 91 2463-2468
Yamamoto, T. and Mazumder, J. (1996) Synthesis of nanocrystalline NbAl3 by laserablation technique. Nanostruct.Matls. 7 305-312
Yamauchi, K. and Yoshizawa, Y. (1995) Recent development of nanocrystalline softmagnetic alloys. Nanostruct.Matls. 6 247-254
Yoffe, A.D. (1993) Low-dimensional systems: quantum size effects and electronicproperties of semiconductor microcrystallites (zero-dimensional systems) and somequasi-two-dimensional systems. Adv.Phys. 42 (2) 173-266
Yoshizawa, Y., Oguma, S. and Yamauchi, K. (1988) New Fe-based soft magneticalloys composed of ultrafine grain structure. J.Appl.Phys. 64 (10) 6044-6046Young, R.M. and Pfender, E. (1985) Generation and behavior of fine particles inthermal plasmas - A review. Plasma Chem.Plasma Process. 5 (1) 1-37

171
Yu, B., Zhu, C. and Gan, F. (1997) Exciton spectra of SnO2 nanocrystals with surficialdipole layer. Opt.Mater. 7 15-20
Zachariah, M.R., Aquino, M.I., Shull, R.D. and Steel, E.B. (1995) Formation ofsuperparamagnetic nanocomposites from vapor phase condensation in a flame.Nanostruct.Matls. 5 383-392
Zhang, S.C., Messing, G.L. and Huebner, W. (1991) YBa2Cu3O7-d superconductorpowder synthesis by spray pyrolysis of organic acid solutions. J.Aerosol Sci.22(5) 585-599
Zhao, X.K. and McCormick, L.D. (1992) Oriented crystal particles of semiconductorPbS on Langmuir monolayer surfaces. Appl.Phys.Lett 61 849-851
Zhao, D. and Pan, X. (1994) Investigation of optical and electrical properties of ZnOultrafine particle films prepared by direct current gas discharge activated reactivemethod. J.Vac.Sci.Technol. B 12(5) 2880-2883
Zhu, Y., Lu, H., Lu, Y. and Pan, X. (1993) Characterization of SnO2 films depositedby d.c. gas discharge activating reaction evaporation onto amorphous and crystallinesubtrates. Thin Solid Films 224 82-86
Copyright © 2022 FDOKUMEN