Global Travel Restrictions during COVID-19 Outbreak - The ...
ORI GIN AL PA PER
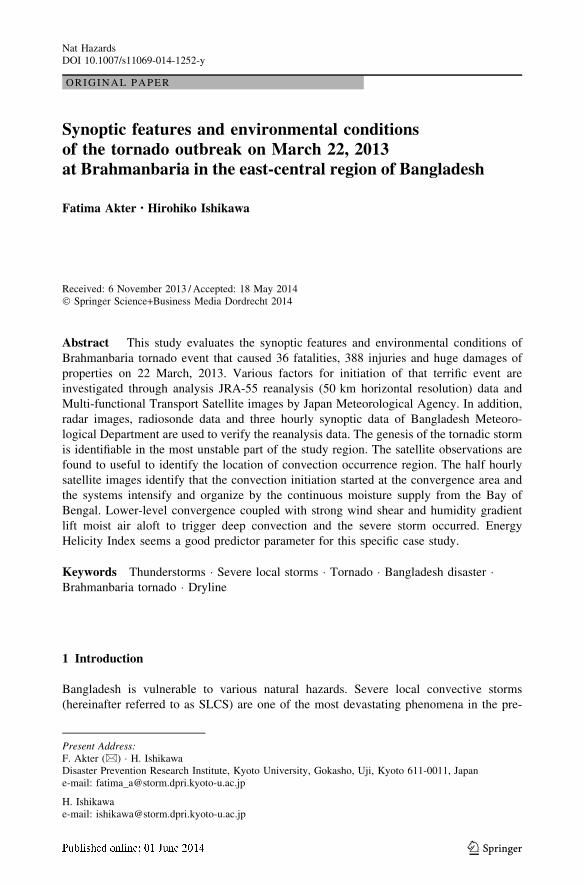
Synoptic features and environmental conditionsof the tornado outbreak on March 22, 2013at Brahmanbaria in the east-central region of Bangladesh
Fatima Akter • Hirohiko Ishikawa
Received: 6 November 2013 / Accepted: 18 May 2014� Springer Science+Business Media Dordrecht 2014
Abstract This study evaluates the synoptic features and environmental conditions of
Brahmanbaria tornado event that caused 36 fatalities, 388 injuries and huge damages of
properties on 22 March, 2013. Various factors for initiation of that terrific event are
investigated through analysis JRA-55 reanalysis (50 km horizontal resolution) data and
Multi-functional Transport Satellite images by Japan Meteorological Agency. In addition,
radar images, radiosonde data and three hourly synoptic data of Bangladesh Meteoro-
logical Department are used to verify the reanalysis data. The genesis of the tornadic storm
is identifiable in the most unstable part of the study region. The satellite observations are
found to useful to identify the location of convection occurrence region. The half hourly
satellite images identify that the convection initiation started at the convergence area and
the systems intensify and organize by the continuous moisture supply from the Bay of
Bengal. Lower-level convergence coupled with strong wind shear and humidity gradient
lift moist air aloft to trigger deep convection and the severe storm occurred. Energy
Helicity Index seems a good predictor parameter for this specific case study.
Keywords Thunderstorms � Severe local storms � Tornado � Bangladesh disaster �Brahmanbaria tornado � Dryline
1 Introduction
Bangladesh is vulnerable to various natural hazards. Severe local convective storms
(hereinafter referred to as SLCS) are one of the most devastating phenomena in the pre-
Present Address:F. Akter (&) � H. IshikawaDisaster Prevention Research Institute, Kyoto University, Gokasho, Uji, Kyoto 611-0011, Japane-mail: [email protected]
H. Ishikawae-mail: [email protected]
123
Nat HazardsDOI 10.1007/s11069-014-1252-y
monsoon months (March–May) in Bangladesh and adjoining northeastern India. The SLCS
accompany gusty wind, heavy downpours and hails after a long dry season, and often
spawn tornadoes. SLCS cause huge damages to our lives and properties in a very short
period. These storms are locally termed as Nor’wester (Kalbaishakhi—in Bengali) since
the system migrates from northwest to southeast. Every year the SLCS of Bangladesh
cause the highest death toll in the World. Annual death toll accounts for 179 deaths per
year caused only from tornadoes in Bangladesh from the period of 1967–1996 (Ono 2001).
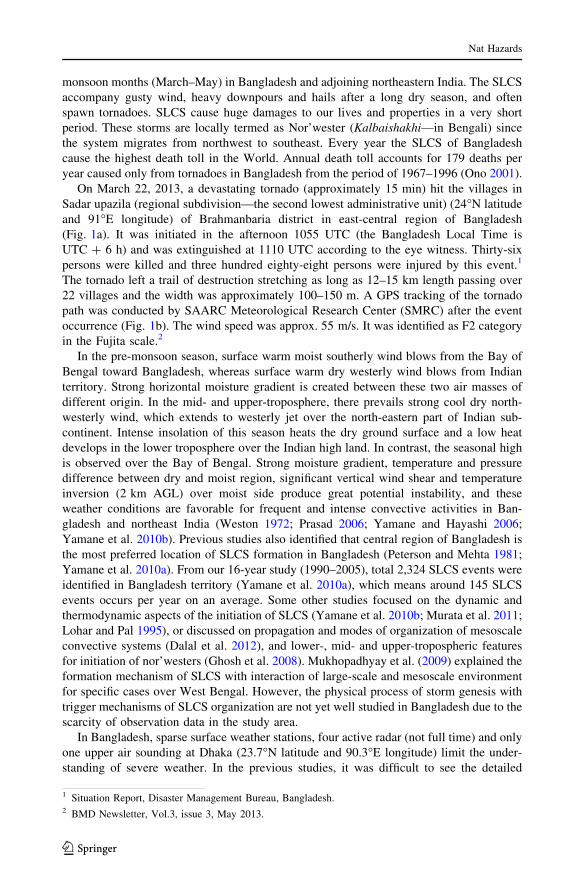
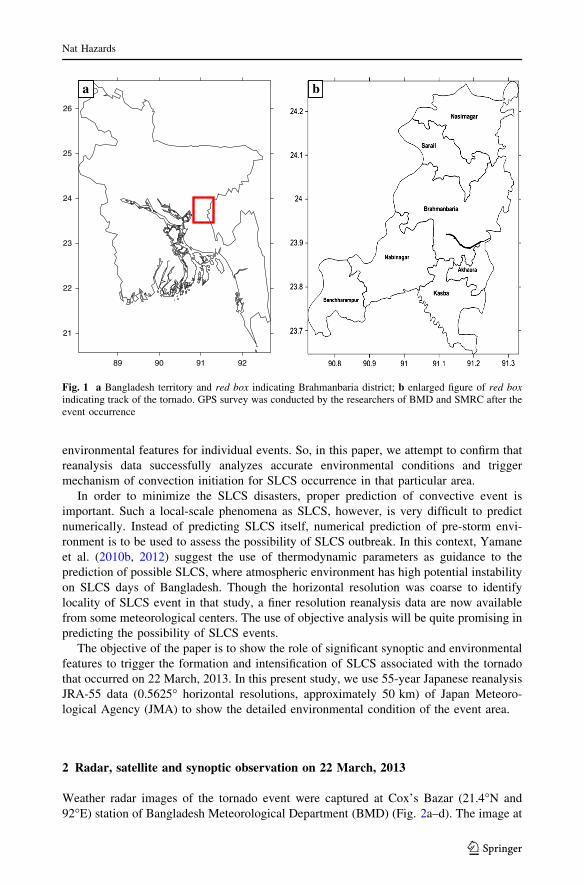
On March 22, 2013, a devastating tornado (approximately 15 min) hit the villages in
Sadar upazila (regional subdivision—the second lowest administrative unit) (24�N latitude
and 91�E longitude) of Brahmanbaria district in east-central region of Bangladesh
(Fig. 1a). It was initiated in the afternoon 1055 UTC (the Bangladesh Local Time is
UTC ? 6 h) and was extinguished at 1110 UTC according to the eye witness. Thirty-six
persons were killed and three hundred eighty-eight persons were injured by this event.1
The tornado left a trail of destruction stretching as long as 12–15 km length passing over
22 villages and the width was approximately 100–150 m. A GPS tracking of the tornado
path was conducted by SAARC Meteorological Research Center (SMRC) after the event
occurrence (Fig. 1b). The wind speed was approx. 55 m/s. It was identified as F2 category
in the Fujita scale.2
In the pre-monsoon season, surface warm moist southerly wind blows from the Bay of
Bengal toward Bangladesh, whereas surface warm dry westerly wind blows from Indian
territory. Strong horizontal moisture gradient is created between these two air masses of
different origin. In the mid- and upper-troposphere, there prevails strong cool dry north-
westerly wind, which extends to westerly jet over the north-eastern part of Indian sub-
continent. Intense insolation of this season heats the dry ground surface and a low heat
develops in the lower troposphere over the Indian high land. In contrast, the seasonal high
is observed over the Bay of Bengal. Strong moisture gradient, temperature and pressure
difference between dry and moist region, significant vertical wind shear and temperature
inversion (2 km AGL) over moist side produce great potential instability, and these
weather conditions are favorable for frequent and intense convective activities in Ban-
gladesh and northeast India (Weston 1972; Prasad 2006; Yamane and Hayashi 2006;
Yamane et al. 2010b). Previous studies also identified that central region of Bangladesh is
the most preferred location of SLCS formation in Bangladesh (Peterson and Mehta 1981;
Yamane et al. 2010a). From our 16-year study (1990–2005), total 2,324 SLCS events were
identified in Bangladesh territory (Yamane et al. 2010a), which means around 145 SLCS
events occurs per year on an average. Some other studies focused on the dynamic and
thermodynamic aspects of the initiation of SLCS (Yamane et al. 2010b; Murata et al. 2011;
Lohar and Pal 1995), or discussed on propagation and modes of organization of mesoscale
convective systems (Dalal et al. 2012), and lower-, mid- and upper-tropospheric features
for initiation of nor’westers (Ghosh et al. 2008). Mukhopadhyay et al. (2009) explained the
formation mechanism of SLCS with interaction of large-scale and mesoscale environment
for specific cases over West Bengal. However, the physical process of storm genesis with
trigger mechanisms of SLCS organization are not yet well studied in Bangladesh due to the
scarcity of observation data in the study area.
In Bangladesh, sparse surface weather stations, four active radar (not full time) and only
one upper air sounding at Dhaka (23.7�N latitude and 90.3�E longitude) limit the under-
standing of severe weather. In the previous studies, it was difficult to see the detailed
1 Situation Report, Disaster Management Bureau, Bangladesh.2 BMD Newsletter, Vol.3, issue 3, May 2013.
Nat Hazards
123
environmental features for individual events. So, in this paper, we attempt to confirm that
reanalysis data successfully analyzes accurate environmental conditions and trigger
mechanism of convection initiation for SLCS occurrence in that particular area.
In order to minimize the SLCS disasters, proper prediction of convective event is
important. Such a local-scale phenomena as SLCS, however, is very difficult to predict
numerically. Instead of predicting SLCS itself, numerical prediction of pre-storm envi-
ronment is to be used to assess the possibility of SLCS outbreak. In this context, Yamane
et al. (2010b, 2012) suggest the use of thermodynamic parameters as guidance to the
prediction of possible SLCS, where atmospheric environment has high potential instability
on SLCS days of Bangladesh. Though the horizontal resolution was coarse to identify
locality of SLCS event in that study, a finer resolution reanalysis data are now available
from some meteorological centers. The use of objective analysis will be quite promising in
predicting the possibility of SLCS events.
The objective of the paper is to show the role of significant synoptic and environmental
features to trigger the formation and intensification of SLCS associated with the tornado
that occurred on 22 March, 2013. In this present study, we use 55-year Japanese reanalysis
JRA-55 data (0.5625� horizontal resolutions, approximately 50 km) of Japan Meteoro-
logical Agency (JMA) to show the detailed environmental condition of the event area.
2 Radar, satellite and synoptic observation on 22 March, 2013
Weather radar images of the tornado event were captured at Cox’s Bazar (21.4�N and
92�E) station of Bangladesh Meteorological Department (BMD) (Fig. 2a–d). The image at
89 90 91 92
21
22
23
24
25
26
a b
Fig. 1 a Bangladesh territory and red box indicating Brahmanbaria district; b enlarged figure of red boxindicating track of the tornado. GPS survey was conducted by the researchers of BMD and SMRC after theevent occurrence
Nat Hazards
123
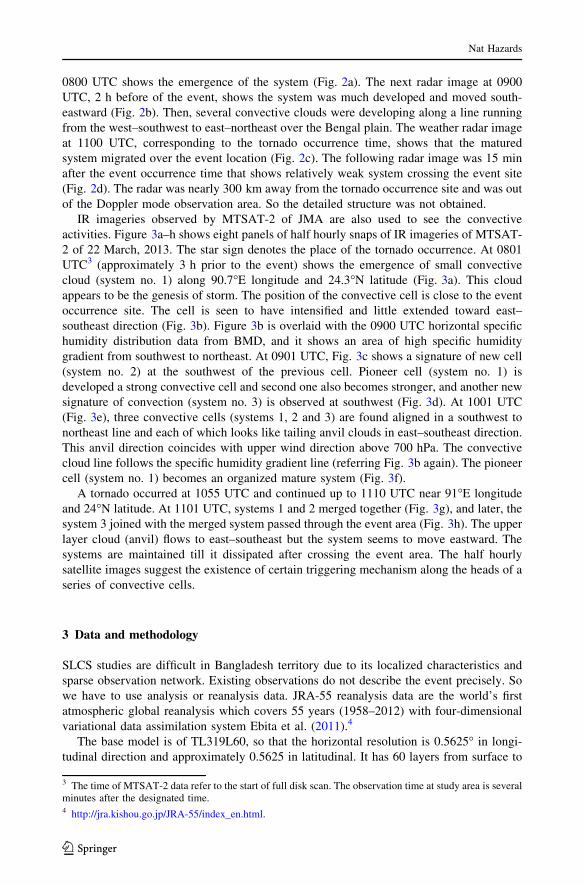
0800 UTC shows the emergence of the system (Fig. 2a). The next radar image at 0900
UTC, 2 h before of the event, shows the system was much developed and moved south-
eastward (Fig. 2b). Then, several convective clouds were developing along a line running
from the west–southwest to east–northeast over the Bengal plain. The weather radar image
at 1100 UTC, corresponding to the tornado occurrence time, shows that the matured
system migrated over the event location (Fig. 2c). The following radar image was 15 min
after the event occurrence time that shows relatively weak system crossing the event site
(Fig. 2d). The radar was nearly 300 km away from the tornado occurrence site and was out
of the Doppler mode observation area. So the detailed structure was not obtained.
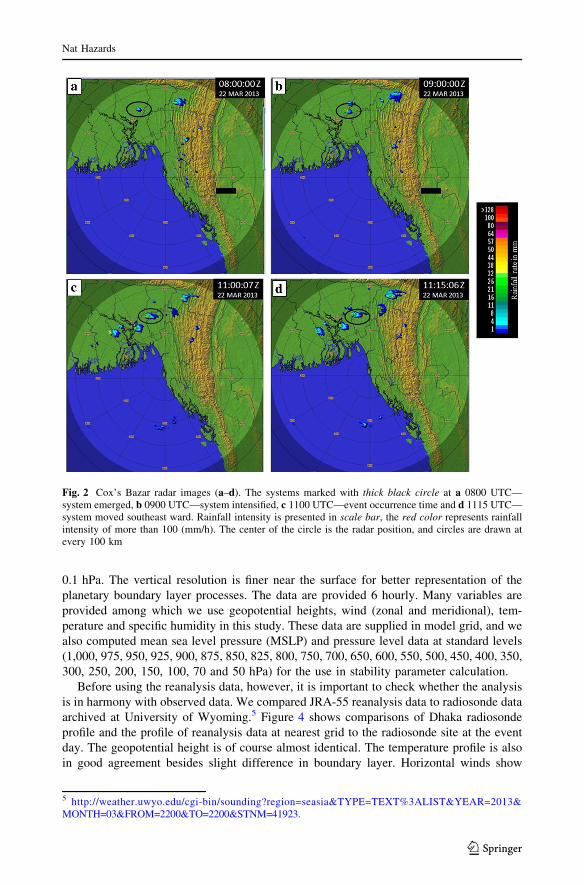
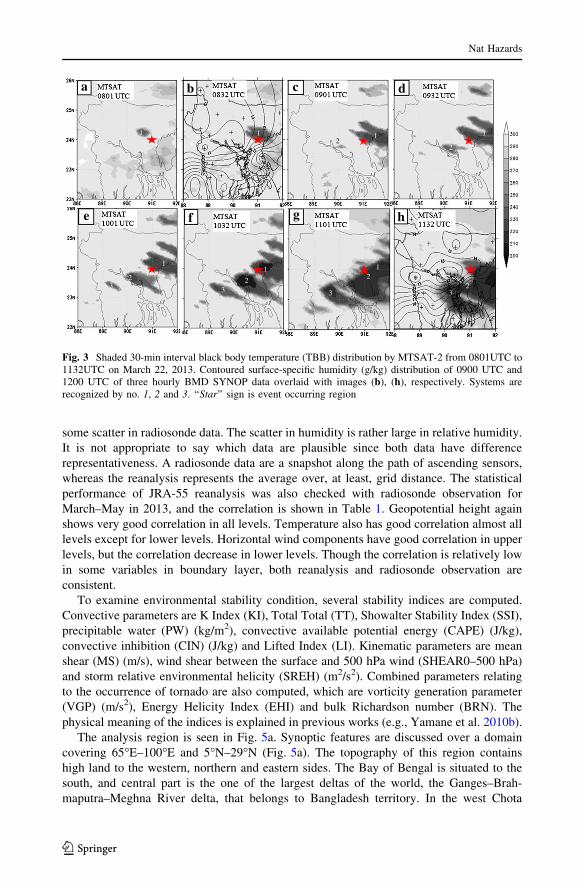
IR imageries observed by MTSAT-2 of JMA are also used to see the convective
activities. Figure 3a–h shows eight panels of half hourly snaps of IR imageries of MTSAT-
2 of 22 March, 2013. The star sign denotes the place of the tornado occurrence. At 0801
UTC3 (approximately 3 h prior to the event) shows the emergence of small convective
cloud (system no. 1) along 90.7�E longitude and 24.3�N latitude (Fig. 3a). This cloud
appears to be the genesis of storm. The position of the convective cell is close to the event
occurrence site. The cell is seen to have intensified and little extended toward east–
southeast direction (Fig. 3b). Figure 3b is overlaid with the 0900 UTC horizontal specific
humidity distribution data from BMD, and it shows an area of high specific humidity
gradient from southwest to northeast. At 0901 UTC, Fig. 3c shows a signature of new cell
(system no. 2) at the southwest of the previous cell. Pioneer cell (system no. 1) is
developed a strong convective cell and second one also becomes stronger, and another new
signature of convection (system no. 3) is observed at southwest (Fig. 3d). At 1001 UTC
(Fig. 3e), three convective cells (systems 1, 2 and 3) are found aligned in a southwest to
northeast line and each of which looks like tailing anvil clouds in east–southeast direction.
This anvil direction coincides with upper wind direction above 700 hPa. The convective
cloud line follows the specific humidity gradient line (referring Fig. 3b again). The pioneer
cell (system no. 1) becomes an organized mature system (Fig. 3f).
A tornado occurred at 1055 UTC and continued up to 1110 UTC near 91�E longitude
and 24�N latitude. At 1101 UTC, systems 1 and 2 merged together (Fig. 3g), and later, the
system 3 joined with the merged system passed through the event area (Fig. 3h). The upper
layer cloud (anvil) flows to east–southeast but the system seems to move eastward. The
systems are maintained till it dissipated after crossing the event area. The half hourly
satellite images suggest the existence of certain triggering mechanism along the heads of a
series of convective cells.
3 Data and methodology
SLCS studies are difficult in Bangladesh territory due to its localized characteristics and
sparse observation network. Existing observations do not describe the event precisely. So
we have to use analysis or reanalysis data. JRA-55 reanalysis data are the world’s first
atmospheric global reanalysis which covers 55 years (1958–2012) with four-dimensional
variational data assimilation system Ebita et al. (2011).4
The base model is of TL319L60, so that the horizontal resolution is 0.5625� in longi-
tudinal direction and approximately 0.5625 in latitudinal. It has 60 layers from surface to
3 The time of MTSAT-2 data refer to the start of full disk scan. The observation time at study area is severalminutes after the designated time.4 http://jra.kishou.go.jp/JRA-55/index_en.html.
Nat Hazards
123
0.1 hPa. The vertical resolution is finer near the surface for better representation of the
planetary boundary layer processes. The data are provided 6 hourly. Many variables are
provided among which we use geopotential heights, wind (zonal and meridional), tem-
perature and specific humidity in this study. These data are supplied in model grid, and we
also computed mean sea level pressure (MSLP) and pressure level data at standard levels
(1,000, 975, 950, 925, 900, 875, 850, 825, 800, 750, 700, 650, 600, 550, 500, 450, 400, 350,
300, 250, 200, 150, 100, 70 and 50 hPa) for the use in stability parameter calculation.
Before using the reanalysis data, however, it is important to check whether the analysis
is in harmony with observed data. We compared JRA-55 reanalysis data to radiosonde data
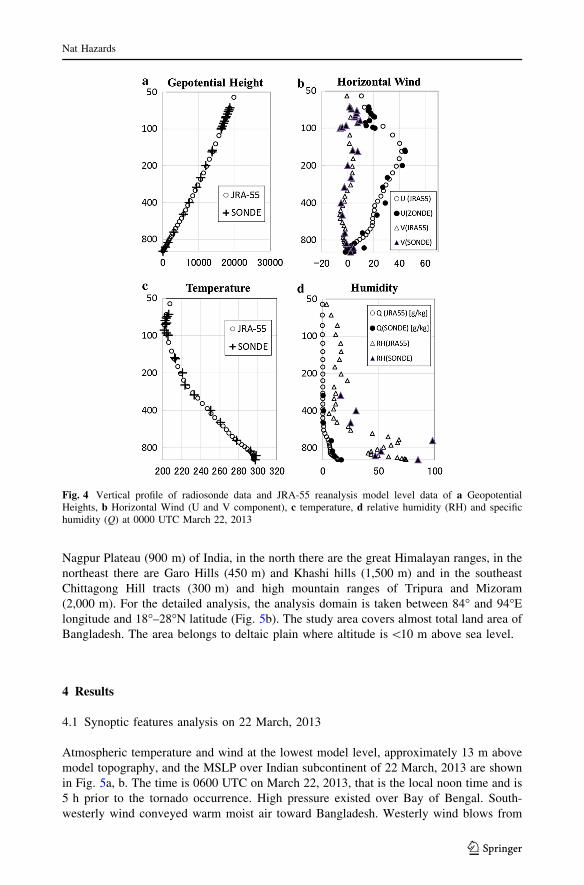
archived at University of Wyoming.5 Figure 4 shows comparisons of Dhaka radiosonde
profile and the profile of reanalysis data at nearest grid to the radiosonde site at the event
day. The geopotential height is of course almost identical. The temperature profile is also
in good agreement besides slight difference in boundary layer. Horizontal winds show
Fig. 2 Cox’s Bazar radar images (a–d). The systems marked with thick black circle at a 0800 UTC—system emerged, b 0900 UTC—system intensified, c 1100 UTC—event occurrence time and d 1115 UTC—system moved southeast ward. Rainfall intensity is presented in scale bar, the red color represents rainfallintensity of more than 100 (mm/h). The center of the circle is the radar position, and circles are drawn atevery 100 km
5 http://weather.uwyo.edu/cgi-bin/sounding?region=seasia&TYPE=TEXT%3ALIST&YEAR=2013&MONTH=03&FROM=2200&TO=2200&STNM=41923.
Nat Hazards
123
some scatter in radiosonde data. The scatter in humidity is rather large in relative humidity.
It is not appropriate to say which data are plausible since both data have difference
representativeness. A radiosonde data are a snapshot along the path of ascending sensors,
whereas the reanalysis represents the average over, at least, grid distance. The statistical
performance of JRA-55 reanalysis was also checked with radiosonde observation for
March–May in 2013, and the correlation is shown in Table 1. Geopotential height again
shows very good correlation in all levels. Temperature also has good correlation almost all
levels except for lower levels. Horizontal wind components have good correlation in upper
levels, but the correlation decrease in lower levels. Though the correlation is relatively low
in some variables in boundary layer, both reanalysis and radiosonde observation are
consistent.
To examine environmental stability condition, several stability indices are computed.
Convective parameters are K Index (KI), Total Total (TT), Showalter Stability Index (SSI),
precipitable water (PW) (kg/m2), convective available potential energy (CAPE) (J/kg),
convective inhibition (CIN) (J/kg) and Lifted Index (LI). Kinematic parameters are mean
shear (MS) (m/s), wind shear between the surface and 500 hPa wind (SHEAR0–500 hPa)
and storm relative environmental helicity (SREH) (m2/s2). Combined parameters relating
to the occurrence of tornado are also computed, which are vorticity generation parameter
(VGP) (m/s2), Energy Helicity Index (EHI) and bulk Richardson number (BRN). The
physical meaning of the indices is explained in previous works (e.g., Yamane et al. 2010b).
The analysis region is seen in Fig. 5a. Synoptic features are discussed over a domain
covering 65�E–100�E and 5�N–29�N (Fig. 5a). The topography of this region contains
high land to the western, northern and eastern sides. The Bay of Bengal is situated to the
south, and central part is the one of the largest deltas of the world, the Ganges–Brah-
maputra–Meghna River delta, that belongs to Bangladesh territory. In the west Chota
1 1 1 1
22
2
1
3
1
2 2
3 3 3
2
1
a b c d
e f g h
Fig. 3 Shaded 30-min interval black body temperature (TBB) distribution by MTSAT-2 from 0801UTC to1132UTC on March 22, 2013. Contoured surface-specific humidity (g/kg) distribution of 0900 UTC and1200 UTC of three hourly BMD SYNOP data overlaid with images (b), (h), respectively. Systems arerecognized by no. 1, 2 and 3. ‘‘Star’’ sign is event occurring region
Nat Hazards
123
Nagpur Plateau (900 m) of India, in the north there are the great Himalayan ranges, in the
northeast there are Garo Hills (450 m) and Khashi hills (1,500 m) and in the southeast
Chittagong Hill tracts (300 m) and high mountain ranges of Tripura and Mizoram
(2,000 m). For the detailed analysis, the analysis domain is taken between 84� and 94�E
longitude and 18�–28�N latitude (Fig. 5b). The study area covers almost total land area of
Bangladesh. The area belongs to deltaic plain where altitude is \10 m above sea level.
4 Results
4.1 Synoptic features analysis on 22 March, 2013
Atmospheric temperature and wind at the lowest model level, approximately 13 m above
model topography, and the MSLP over Indian subcontinent of 22 March, 2013 are shown
in Fig. 5a, b. The time is 0600 UTC on March 22, 2013, that is the local noon time and is
5 h prior to the tornado occurrence. High pressure existed over Bay of Bengal. South-
westerly wind conveyed warm moist air toward Bangladesh. Westerly wind blows from
Fig. 4 Vertical profile of radiosonde data and JRA-55 reanalysis model level data of a GeopotentialHeights, b Horizontal Wind (U and V component), c temperature, d relative humidity (RH) and specifichumidity (Q) at 0000 UTC March 22, 2013
Nat Hazards
123
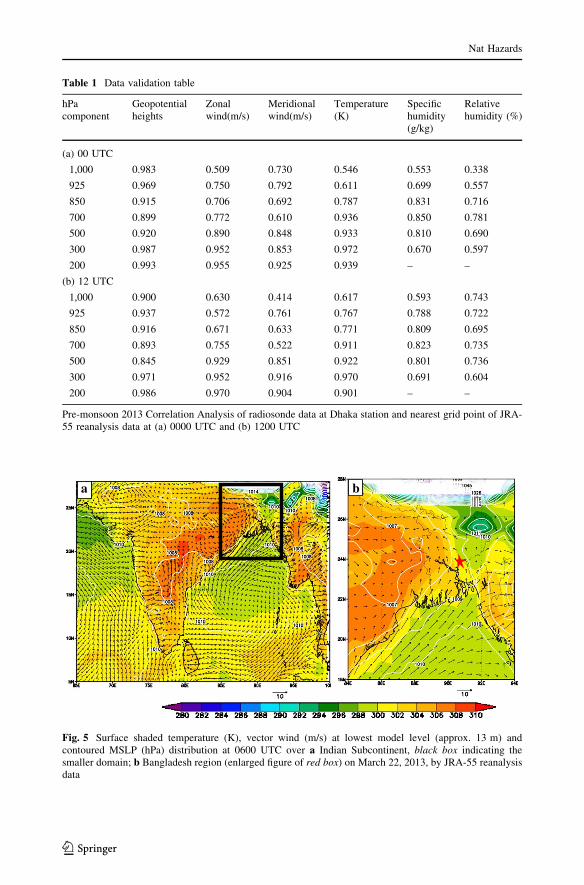
a b
Fig. 5 Surface shaded temperature (K), vector wind (m/s) at lowest model level (approx. 13 m) andcontoured MSLP (hPa) distribution at 0600 UTC over a Indian Subcontinent, black box indicating thesmaller domain; b Bangladesh region (enlarged figure of red box) on March 22, 2013, by JRA-55 reanalysisdata
Table 1 Data validation table
hPacomponent
Geopotentialheights
Zonalwind(m/s)
Meridionalwind(m/s)
Temperature(K)
Specifichumidity(g/kg)
Relativehumidity (%)
(a) 00 UTC
1,000 0.983 0.509 0.730 0.546 0.553 0.338
925 0.969 0.750 0.792 0.611 0.699 0.557
850 0.915 0.706 0.692 0.787 0.831 0.716
700 0.899 0.772 0.610 0.936 0.850 0.781
500 0.920 0.890 0.848 0.933 0.810 0.690
300 0.987 0.952 0.853 0.972 0.670 0.597
200 0.993 0.955 0.925 0.939 – –
(b) 12 UTC
1,000 0.900 0.630 0.414 0.617 0.593 0.743
925 0.937 0.572 0.761 0.767 0.788 0.722
850 0.916 0.671 0.633 0.771 0.809 0.695
700 0.893 0.755 0.522 0.911 0.823 0.735
500 0.845 0.929 0.851 0.922 0.801 0.736
300 0.971 0.952 0.916 0.970 0.691 0.604
200 0.986 0.970 0.904 0.901 – –
Pre-monsoon 2013 Correlation Analysis of radiosonde data at Dhaka station and nearest grid point of JRA-55 reanalysis data at (a) 0000 UTC and (b) 1200 UTC
Nat Hazards
123
Indian highland toward Bangladesh. Surface air temperature was high in dry Indian
highland but was relatively low over Bangladesh territory. The surface temperature
increased more than 10� over Indian subcontinent from 0000 UTC (0600 BST) to 1200
UTC (1800 BST), but it was several degrees in Bangladesh. At 0600 UTC, warm advection
is analyzed near south coast toward the Bangladesh (fig. not shown). This warm moist
advection can bring instability in lower atmosphere. In the morning, easterly wind com-
ponent was prominent near the surface, Fig. 4b. Wind shear between surface and 500 hPa
was 23.2 at 0000 UTC at event location (24�N and 91�E). At 0600 UTC, it slightly
increased to 23.3 m/s wind shear between surface southeasterly wind (1.6 m/s) and the
500 hPa westerly wind (20.5 m/s). It further strengthened to 24.3 m/s at 1200 UTC around
event site. This wind shear was rather stronger than the statistical value in SLCS days as
calculated by Yamane et al. (2010b) and was attributed to the tough upper layer as
discussed in Yamane et al. (2012).
Surface-specific humidity was higher over Bangladesh territory than west side of Indian
territory. Specific humidity distribution (Fig. 6a–c) exhibited higher values near the coast
than the inland. That is consistent with the pre-monsoonal climatological studies by Ro-
matschke et al. (2010) over this region. Surface-specific humidity ranged from 10 to 15 g/
kg over Bangladesh. In contrast, the surface-specific humidity was lower, typically
between 6 and 10 g/kg over West Bengal of India. It reached to 15 g/kg at 0600 UTC
around the east-central region where the event occurred (Fig. 6b). It was evident that
southern, eastern and central region became much moist than the north-western region of
Bangladesh. Temperature increased slowly over the moist east side than Indian dry area
(Fig. 5b). Looking at the vertical cross section at 24�N latitude at 0600 UTC (Figure is not
shown) east to west, decrease of specific humidity is analyzed between 84�E and 94�E
longitude and vertically from surface to about 600 hPa. The sharp change of specific
humidity was specifically seen 88.5�E–90.5�E (10–15 g/kg) in the lower level up to about
900 hPa without any detectable inclination, and west of this specific humidity was
decreased 10–6 g/kg.
In relation to storm genesis in Great Plains in the USA, a line of moisture discontinuity,
which is termed as dryline, has been discussed. Dryline is a mesoscale narrow boundary
that separates moist maritime tropical air masses of Gulf of Mexico from continental
tropical dry air masses of the deserts in the western Great Plains in the USA during the
warm season (Fujita 1958; Miller 1959; Rhea 1966). During the spring and early summer,
the convective storms are frequently initiated along the dryline. Thus, we examine specific
humidity gradient in the present case. The strength of specific humidity gradient is com-
puted by
r � qj j ¼
ffiffiffiffiffiffiffiffiffiffiffiffiffiffiffiffiffiffiffiffiffiffiffiffiffiffiffiffiffiffiffiffi
oq
ox
� �2
þ oq
oy
� �2s
;
where q is specific humidity (g/kg). In this study, we calculate specific humidity gradient
g/kg over 100 km and identify maximum gradient line as dryline from the plot.
Dryline in our case was a line of strong moisture gradient between warm dry air mass of
Indian highland and moist air mass of Bay of Bengal, which was aligned in southwest to
northeast direction (Fig. 6a–c). This line also coincides with the direction of cloud line
(Fig. 3f). From 0600 UTC to 1200 UTC, strong gradient region (6 g/kg/100 km) moved
eastward and squeezed, and the sharpest moisture gradient (10 g/kg/100 km) reached to
88.5�E longitude at 1200 UTC (Fig. 6c). Though the analysis time (1200UTC) is 1 h after
the event, we can assume that the stronger gradient existed before the event occurrence.
Nat Hazards
123
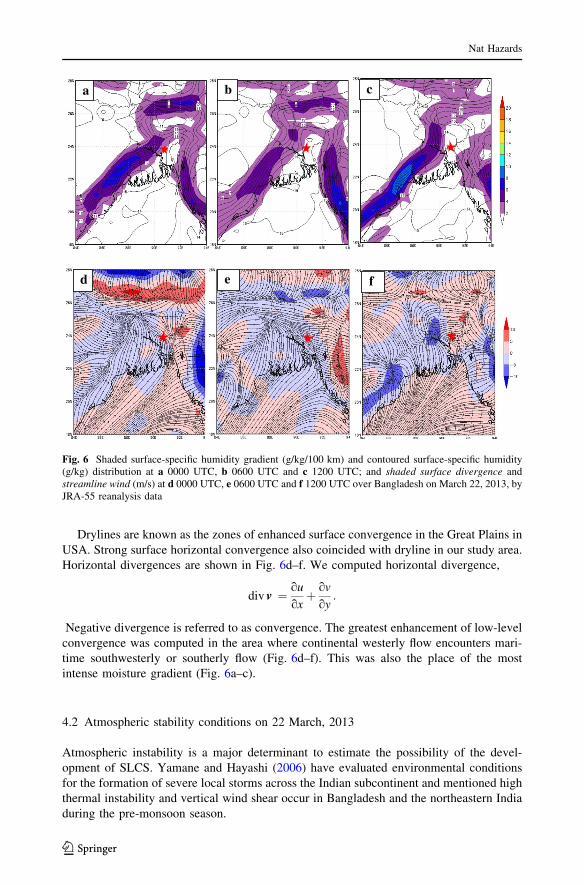
Drylines are known as the zones of enhanced surface convergence in the Great Plains in
USA. Strong surface horizontal convergence also coincided with dryline in our study area.
Horizontal divergences are shown in Fig. 6d–f. We computed horizontal divergence,
div v ¼ ou
oxþ ov
oy:
Negative divergence is referred to as convergence. The greatest enhancement of low-level
convergence was computed in the area where continental westerly flow encounters mari-
time southwesterly or southerly flow (Fig. 6d–f). This was also the place of the most
intense moisture gradient (Fig. 6a–c).
4.2 Atmospheric stability conditions on 22 March, 2013
Atmospheric instability is a major determinant to estimate the possibility of the devel-
opment of SLCS. Yamane and Hayashi (2006) have evaluated environmental conditions
for the formation of severe local storms across the Indian subcontinent and mentioned high
thermal instability and vertical wind shear occur in Bangladesh and the northeastern India
during the pre-monsoon season.
fd e
ca b
Fig. 6 Shaded surface-specific humidity gradient (g/kg/100 km) and contoured surface-specific humidity(g/kg) distribution at a 0000 UTC, b 0600 UTC and c 1200 UTC; and shaded surface divergence andstreamline wind (m/s) at d 0000 UTC, e 0600 UTC and f 1200 UTC over Bangladesh on March 22, 2013, byJRA-55 reanalysis data
Nat Hazards
123
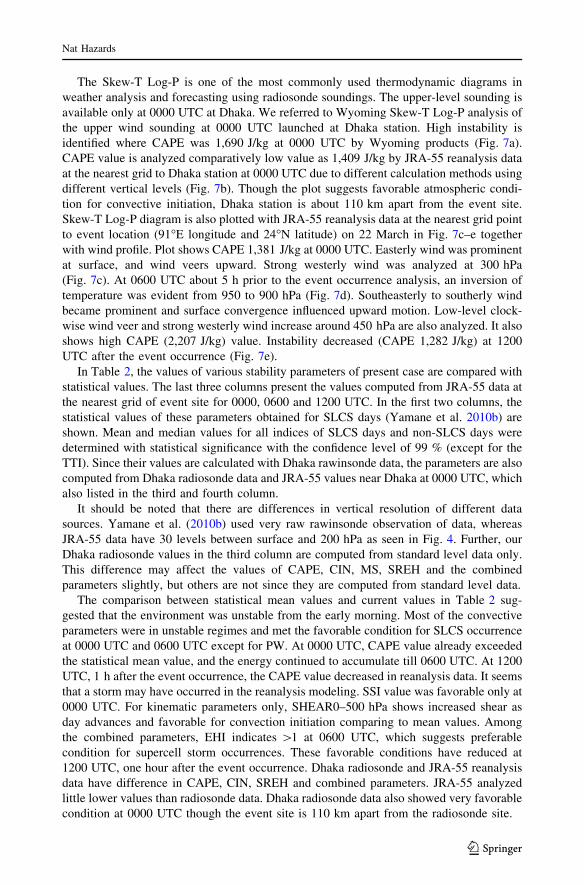
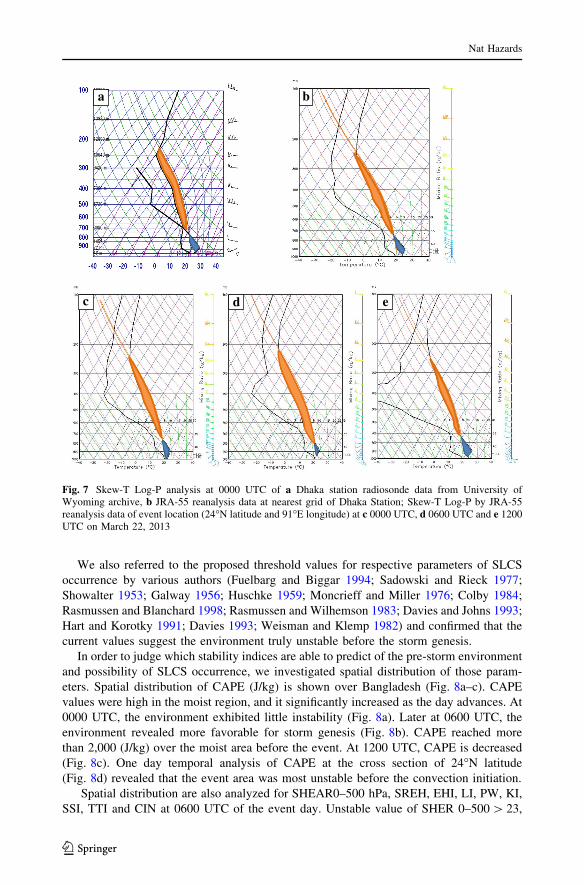
The Skew-T Log-P is one of the most commonly used thermodynamic diagrams in
weather analysis and forecasting using radiosonde soundings. The upper-level sounding is
available only at 0000 UTC at Dhaka. We referred to Wyoming Skew-T Log-P analysis of
the upper wind sounding at 0000 UTC launched at Dhaka station. High instability is
identified where CAPE was 1,690 J/kg at 0000 UTC by Wyoming products (Fig. 7a).
CAPE value is analyzed comparatively low value as 1,409 J/kg by JRA-55 reanalysis data
at the nearest grid to Dhaka station at 0000 UTC due to different calculation methods using
different vertical levels (Fig. 7b). Though the plot suggests favorable atmospheric condi-
tion for convective initiation, Dhaka station is about 110 km apart from the event site.
Skew-T Log-P diagram is also plotted with JRA-55 reanalysis data at the nearest grid point
to event location (91�E longitude and 24�N latitude) on 22 March in Fig. 7c–e together
with wind profile. Plot shows CAPE 1,381 J/kg at 0000 UTC. Easterly wind was prominent
at surface, and wind veers upward. Strong westerly wind was analyzed at 300 hPa
(Fig. 7c). At 0600 UTC about 5 h prior to the event occurrence analysis, an inversion of
temperature was evident from 950 to 900 hPa (Fig. 7d). Southeasterly to southerly wind
became prominent and surface convergence influenced upward motion. Low-level clock-
wise wind veer and strong westerly wind increase around 450 hPa are also analyzed. It also
shows high CAPE (2,207 J/kg) value. Instability decreased (CAPE 1,282 J/kg) at 1200
UTC after the event occurrence (Fig. 7e).
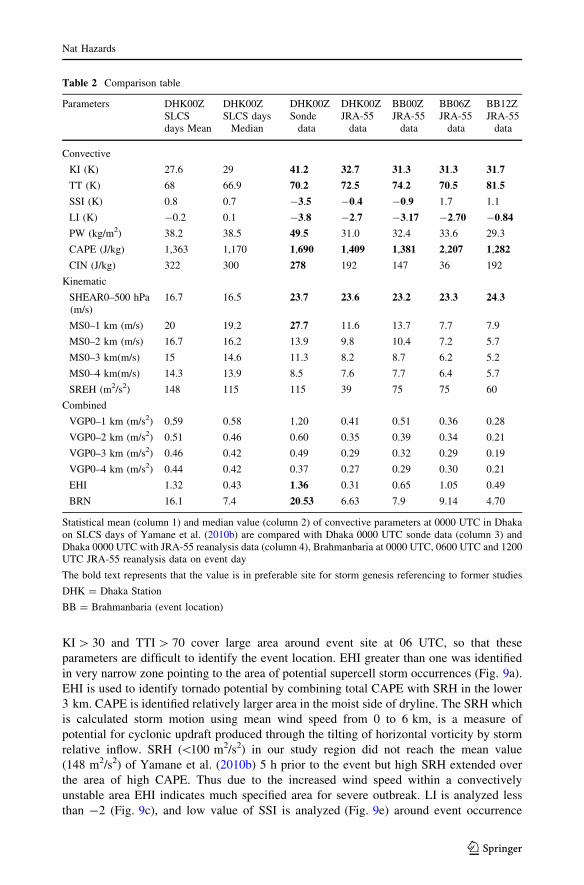
In Table 2, the values of various stability parameters of present case are compared with
statistical values. The last three columns present the values computed from JRA-55 data at
the nearest grid of event site for 0000, 0600 and 1200 UTC. In the first two columns, the
statistical values of these parameters obtained for SLCS days (Yamane et al. 2010b) are
shown. Mean and median values for all indices of SLCS days and non-SLCS days were
determined with statistical significance with the confidence level of 99 % (except for the
TTI). Since their values are calculated with Dhaka rawinsonde data, the parameters are also
computed from Dhaka radiosonde data and JRA-55 values near Dhaka at 0000 UTC, which
also listed in the third and fourth column.
It should be noted that there are differences in vertical resolution of different data
sources. Yamane et al. (2010b) used very raw rawinsonde observation of data, whereas
JRA-55 data have 30 levels between surface and 200 hPa as seen in Fig. 4. Further, our
Dhaka radiosonde values in the third column are computed from standard level data only.
This difference may affect the values of CAPE, CIN, MS, SREH and the combined
parameters slightly, but others are not since they are computed from standard level data.
The comparison between statistical mean values and current values in Table 2 sug-
gested that the environment was unstable from the early morning. Most of the convective
parameters were in unstable regimes and met the favorable condition for SLCS occurrence
at 0000 UTC and 0600 UTC except for PW. At 0000 UTC, CAPE value already exceeded
the statistical mean value, and the energy continued to accumulate till 0600 UTC. At 1200
UTC, 1 h after the event occurrence, the CAPE value decreased in reanalysis data. It seems
that a storm may have occurred in the reanalysis modeling. SSI value was favorable only at
0000 UTC. For kinematic parameters only, SHEAR0–500 hPa shows increased shear as
day advances and favorable for convection initiation comparing to mean values. Among
the combined parameters, EHI indicates [1 at 0600 UTC, which suggests preferable
condition for supercell storm occurrences. These favorable conditions have reduced at
1200 UTC, one hour after the event occurrence. Dhaka radiosonde and JRA-55 reanalysis
data have difference in CAPE, CIN, SREH and combined parameters. JRA-55 analyzed
little lower values than radiosonde data. Dhaka radiosonde data also showed very favorable
condition at 0000 UTC though the event site is 110 km apart from the radiosonde site.
Nat Hazards
123
We also referred to the proposed threshold values for respective parameters of SLCS
occurrence by various authors (Fuelbarg and Biggar 1994; Sadowski and Rieck 1977;
Showalter 1953; Galway 1956; Huschke 1959; Moncrieff and Miller 1976; Colby 1984;
Rasmussen and Blanchard 1998; Rasmussen and Wilhemson 1983; Davies and Johns 1993;
Hart and Korotky 1991; Davies 1993; Weisman and Klemp 1982) and confirmed that the
current values suggest the environment truly unstable before the storm genesis.
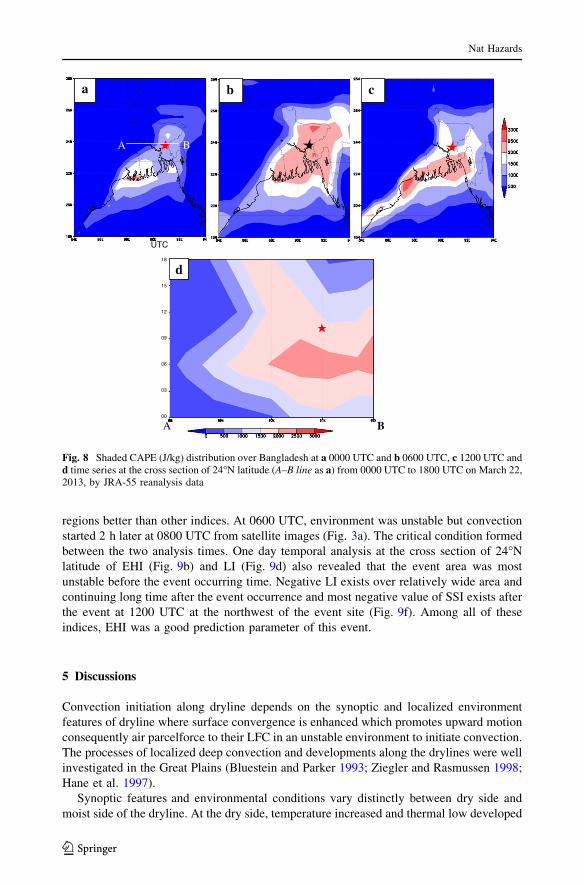
In order to judge which stability indices are able to predict of the pre-storm environment
and possibility of SLCS occurrence, we investigated spatial distribution of those param-
eters. Spatial distribution of CAPE (J/kg) is shown over Bangladesh (Fig. 8a–c). CAPE
values were high in the moist region, and it significantly increased as the day advances. At
0000 UTC, the environment exhibited little instability (Fig. 8a). Later at 0600 UTC, the
environment revealed more favorable for storm genesis (Fig. 8b). CAPE reached more
than 2,000 (J/kg) over the moist area before the event. At 1200 UTC, CAPE is decreased
(Fig. 8c). One day temporal analysis of CAPE at the cross section of 24�N latitude
(Fig. 8d) revealed that the event area was most unstable before the convection initiation.
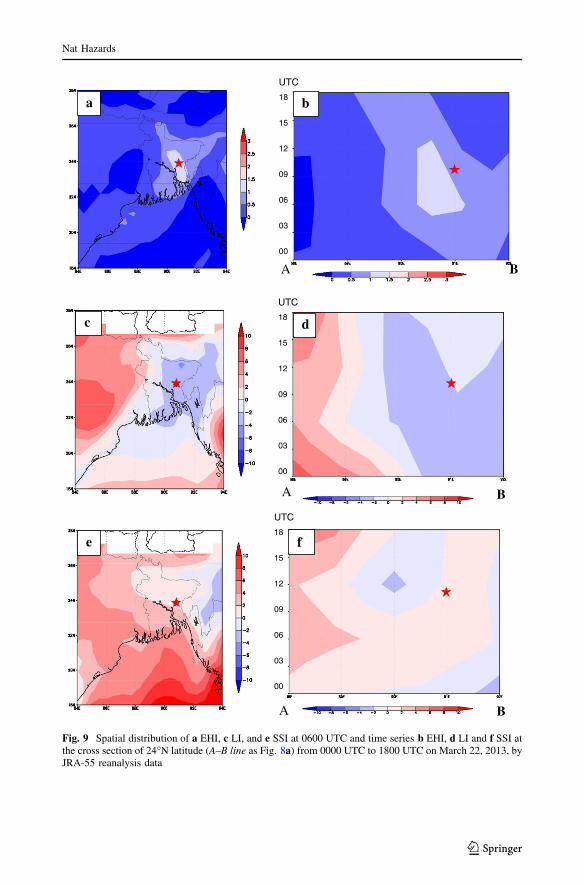
Spatial distribution are also analyzed for SHEAR0–500 hPa, SREH, EHI, LI, PW, KI,
SSI, TTI and CIN at 0600 UTC of the event day. Unstable value of SHER 0–500 [ 23,
a b
c d e
Fig. 7 Skew-T Log-P analysis at 0000 UTC of a Dhaka station radiosonde data from University ofWyoming archive, b JRA-55 reanalysis data at nearest grid of Dhaka Station; Skew-T Log-P by JRA-55reanalysis data of event location (24�N latitude and 91�E longitude) at c 0000 UTC, d 0600 UTC and e 1200UTC on March 22, 2013
Nat Hazards
123
KI [ 30 and TTI [ 70 cover large area around event site at 06 UTC, so that these
parameters are difficult to identify the event location. EHI greater than one was identified
in very narrow zone pointing to the area of potential supercell storm occurrences (Fig. 9a).
EHI is used to identify tornado potential by combining total CAPE with SRH in the lower
3 km. CAPE is identified relatively larger area in the moist side of dryline. The SRH which
is calculated storm motion using mean wind speed from 0 to 6 km, is a measure of
potential for cyclonic updraft produced through the tilting of horizontal vorticity by storm
relative inflow. SRH (\100 m2/s2) in our study region did not reach the mean value
(148 m2/s2) of Yamane et al. (2010b) 5 h prior to the event but high SRH extended over
the area of high CAPE. Thus due to the increased wind speed within a convectively
unstable area EHI indicates much specified area for severe outbreak. LI is analyzed less
than -2 (Fig. 9c), and low value of SSI is analyzed (Fig. 9e) around event occurrence
Table 2 Comparison table
Parameters DHK00ZSLCSdays Mean
DHK00ZSLCS days
Median
DHK00ZSonde
data
DHK00ZJRA-55
data
BB00ZJRA-55
data
BB06ZJRA-55
data
BB12ZJRA-55
data
Convective
KI (K) 27.6 29 41.2 32.7 31.3 31.3 31.7
TT (K) 68 66.9 70.2 72.5 74.2 70.5 81.5
SSI (K) 0.8 0.7 -3.5 -0.4 -0.9 1.7 1.1
LI (K) -0.2 0.1 -3.8 -2.7 -3.17 -2.70 -0.84
PW (kg/m2) 38.2 38.5 49.5 31.0 32.4 33.6 29.3
CAPE (J/kg) 1,363 1,170 1,690 1,409 1,381 2,207 1,282
CIN (J/kg) 322 300 278 192 147 36 192
Kinematic
SHEAR0–500 hPa(m/s)
16.7 16.5 23.7 23.6 23.2 23.3 24.3
MS0–1 km (m/s) 20 19.2 27.7 11.6 13.7 7.7 7.9
MS0–2 km (m/s) 16.7 16.2 13.9 9.8 10.4 7.2 5.7
MS0–3 km(m/s) 15 14.6 11.3 8.2 8.7 6.2 5.2
MS0–4 km(m/s) 14.3 13.9 8.5 7.6 7.7 6.4 5.7
SREH (m2/s2) 148 115 115 39 75 75 60
Combined
VGP0–1 km (m/s2) 0.59 0.58 1.20 0.41 0.51 0.36 0.28
VGP0–2 km (m/s2) 0.51 0.46 0.60 0.35 0.39 0.34 0.21
VGP0–3 km (m/s2) 0.46 0.42 0.49 0.29 0.32 0.29 0.19
VGP0–4 km (m/s2) 0.44 0.42 0.37 0.27 0.29 0.30 0.21
EHI 1.32 0.43 1.36 0.31 0.65 1.05 0.49
BRN 16.1 7.4 20.53 6.63 7.9 9.14 4.70
Statistical mean (column 1) and median value (column 2) of convective parameters at 0000 UTC in Dhakaon SLCS days of Yamane et al. (2010b) are compared with Dhaka 0000 UTC sonde data (column 3) andDhaka 0000 UTC with JRA-55 reanalysis data (column 4), Brahmanbaria at 0000 UTC, 0600 UTC and 1200UTC JRA-55 reanalysis data on event day
The bold text represents that the value is in preferable site for storm genesis referencing to former studies
DHK = Dhaka Station
BB = Brahmanbaria (event location)
Nat Hazards
123
regions better than other indices. At 0600 UTC, environment was unstable but convection
started 2 h later at 0800 UTC from satellite images (Fig. 3a). The critical condition formed
between the two analysis times. One day temporal analysis at the cross section of 24�N
latitude of EHI (Fig. 9b) and LI (Fig. 9d) also revealed that the event area was most
unstable before the event occurring time. Negative LI exists over relatively wide area and
continuing long time after the event occurrence and most negative value of SSI exists after
the event at 1200 UTC at the northwest of the event site (Fig. 9f). Among all of these
indices, EHI was a good prediction parameter of this event.
5 Discussions
Convection initiation along dryline depends on the synoptic and localized environment
features of dryline where surface convergence is enhanced which promotes upward motion
consequently air parcelforce to their LFC in an unstable environment to initiate convection.
The processes of localized deep convection and developments along the drylines were well
investigated in the Great Plains (Bluestein and Parker 1993; Ziegler and Rasmussen 1998;
Hane et al. 1997).
Synoptic features and environmental conditions vary distinctly between dry side and
moist side of the dryline. At the dry side, temperature increased and thermal low developed
A B
a c b
UTC
18
15
12
09
06
03
00
d
BA
Fig. 8 Shaded CAPE (J/kg) distribution over Bangladesh at a 0000 UTC and b 0600 UTC, c 1200 UTC andd time series at the cross section of 24�N latitude (A–B line as a) from 0000 UTC to 1800 UTC on March 22,2013, by JRA-55 reanalysis data
Nat Hazards
123
a b
c d
f
UTC
18
15
12
09
06
03
00
UTC
18
15
12
09
06
03
00
UTC
18
15
12
09
06
03
00
e
A B
A B
A B
Fig. 9 Spatial distribution of a EHI, c LI, and e SSI at 0600 UTC and time series b EHI, d LI and f SSI atthe cross section of 24�N latitude (A–B line as Fig. 8a) from 0000 UTC to 1800 UTC on March 22, 2013, byJRA-55 reanalysis data
Nat Hazards
123
in Indian highland as the day advances (Fig. 5b). Diurnal difference of surface temperature
was 10� or more over Indian subcontinent from morning to evening. A deep, well-mixed
dry layer developed over the Indian highland from ground to about 680 hPa (Figure not
includes). Westerly wind was analyzed in all levels and no wind veer in low level. Strong
Jet prevailed over this region above 300 hPa. This deep upper westerly wind advected the
deep mixed layer eastward side, and it overlaid on surface moist southwesterly to southerly
moist tongue.
As the day advances, increase of surface temperature was smaller at moist side than dry
side by few degrees. High MSLP was analyzed over Bay of Bengal and east side of dryline
over Bangladesh territory. Surface winds turn toward the dryline and results in enhanced
surface convergence at the dryline, which can enhance lift and aid convective initiation. In
the current case, surface convergence induced upward motion near dryline. As day
advances, CAPE increased due to enhanced moisture incursions in the lower level from the
Bay of Bengal at the east side of the dryline. But elevated mixed layer above the moist
region acted like cap or lid over the moist region and protected release of instability.
Dryline advanced to the east and moisture gradient squeezed and localized convergence
became stronger and lifted moist air aloft. Eventually, it forced air parcels to break the lid
and reach their LFC to trigger deep convection. Presence of westerly wind and strong wind
shear maintained and enhanced the triggered convection and the westerly wind also con-
veys this system to eastward. The system intensified and became matured enough to spawn
as tornado at Brahmanbaria. This mechanism is very similar to the Great Plains convection
intimation along dryline as mentioned in Hane et al. 1997, Murphey et al. 2006 and Ziegler
and Rasmussen 1998.
There can be another question how much the event day differ from other days. In order
to check the uniqueness of the event day, we also analyzed two days (March 20 and 21,
2013) before the event day. Pre-monsoon weather condition was prevailing similar to event
day. But, specific humidity (8–12 gm/kg at 0600 UTC) and SHEAR0–500 hPa (12–14 m/
s) were relatively low over Bangladesh territory. As day advanced to 1200 UTC, moisture
intrusion is analyzed with a little increase of SHEAR0–500 hPa in coastal area. For these
two non-event days, surface temperature increase was more rapid from morning to
evening and the low-level humidity was less than the event day over Bangladesh. Con-
vergence along dryline was not strong enough due to weak moisture inflow. Surface low
moisture cannot create enough instability. Thus, weak convergence along dryline could not
uplift air parcel to LFC on non-event days.
6 Summary
In the present study, we examined the synoptic features and environmental conditions for
the tornado case on 22 March, 2013, that is the severest in the recent past occurrences.
SLCS studies are very difficult in the study region due to its localized characteristics and
sparse observation network. Convective parameters and synoptic conditions for the par-
ticular case are computed by 50-km-resolution JRA-55 reanalysis data. This case study
suggests that low-level convergence along dryline lift the lower atmosphere up to the level
of free convection in a significantly unstable environment, where the initial convection
triggered. Environmental condition is very favorable for severe convection and storm
initiation comparing it with statistical data. EHI is a good predictor to identify SLCS
occurrence place. In the previous studies, the data resolution was poor, so that the regional
preference of storm genesis is not known. The use of good-resolution reliable and
Nat Hazards
123
homogenous data may produce better prediction of severe storm in this area. It is also
suggested that better time resolution data is required for pointing the high-risk regions.
Acknowledgments The JRA-55 reanalysis data of JMA used in this study was provided by way ofMeteorological Research consortium, a framework for research cooperation of JMA and MeteorologicalSociety of Japan (MSJ). I am grateful to Prof. Hayashi T, Dr. Yamane Y and Dr. Murata F for their valuablesuggestions and discussions. I am also thankful to Mr. Abdul Mannan for providing 3 hourly Synopticdata and Radar data from BMD.
References
Bluestein HB, Parker SS (1993) Modes of isolated, severe convective storm formation along the dryline.Mon Weather Rev 121:1354–1372
Colby FP (1984) Convective inhibition as a predictor of convection during AVE-SESAM-2. Mon WeatherRev 112:2239–2252
Dalal S, Lohar D, Sarkar S, Sadhukhan I, Debnath GC (2012) Organizational modes of squall-typemesoscale convective systems during premonsoon season over eastern India. Atmos Res 106:120–138
Davies JM (1993) Hourly helicity, instability, and EHI in forecasting supercell tornadoes. In: Proceedings of17th conference on severe local storms. St. Louis, MO, American Meteorological Society, pp 107–111
Davies JM, Johns RH (1993) Some wind and instability parameters associated with strong and violenttornadoes. 1. Wind shear and helicity, In: Curch C, Burges D, Doswell C, Davies-Jones R (eds) TheTornado: its structure, dynamics, prediction, and hazard. Geophys Monogr No. 79, Am GeophysUnion, pp 573–582
Ebita A, Kobayashi S, Ota Y, Moriya M, Kumabe R, Onogi K, Harada Y, Yasui S, Miyaoka K, TakahashiK, Kamahori H, Kobayashi C, Endo H, Soma M, Oikawa Y, Ishimizu T (2011) The Japanese 55-yearreanalysis ‘‘JRA-55’’: an interim report. SOLA 7:149–152
Fuelbarg HE, Biggar DG (1994) The preconvective environment of summer thunderstorms over the FloridaPanhandle. Weather Forecast 9:316–326
Fujita TT (1958) Structure and movement of a dry front. Bull Am Meteorol Soc 39:574–582Galway JG (1956) The lifted index as a predictor of latent instability. Bull Am Meteorol Soc 37:528–529Ghosh A, Lohar D, Das J (2008) Initiation of Nor’wester in relation to mid-upper and low-level water vapor
patterns on METEOSAT-5 images. Atmos Res 87:116–135Hane CE, Bluestein HB, Crawford TM, Baldwin ME, Rabin RM (1997) Severe thunderstorm development
in relation to along-dryline variability: a case study. Mon Weather Rev 125(2):231–251Hart JA, Korotky W (1991) The SHARP workstation v1.50 users guide. National Weather Service, NOAA,
US. Department of Commerce, p 30Huschke RE (1959) Glossary of meteorology. American Meteorological Society, Boston 638Lohar D, Pal B (1995) The effect of irrigation on pre-monsoon season precipitation over south West Bengal,
India. J Clim 8(1995):2567–2570Miller RC (1959) Tornado-producing synoptic patterns. Bull Am Meteorol Soc 40:465–472Moncrieff M, Miller MJ (1976) The dynamics and simulation of tropical cumulonimbus and squall lines. Q J
R Meteorol Soc 102:373–394Mukhopadhyay P, Mahakur M, Singh HAK (2009) The interaction of large scale and mesoscale environ-
ment leading to formation of intense thunderstorms over Kolkata Part I: Doppler radar and satelliteobservations. J Earth Syst Sci 118(5):441–466
Murata F, Terao T, Kiguchi M, Fukushima A, Takahashi K, Hayashi T, Arjumand H, Bhuiyan MSH,Choudhury SA (2011) Daytime thermodynamic and airflow structures over northeast Bangladeshduring the pre-monsoon season: a case study on 25 April 2010. J Meteorol Soc Jpn 89A:167–179
Murphey HV, Wakimoto RM, Flamant C, Kingsmill DE (2006) Dryline on 19 June 2002 during IHOP, partI: airborne Doppler and LEANDRE II analyses of the thin line structure and convection initiation. MonWeather Rev 134:406–430
Ono Y (2001) Design and adoption of household tornado shelters to mitigate the tornado hazard in Ban-gladesh. PhD Dissertation, Kent State University
Peterson RE, Mehta KC (1981) Climatology of tornadoes of India and Bangladesh. Arch Meteorol GeophysBioklimatol Ser B 29:345–356
Nat Hazards
123
Prasad K (2006) Environmental and synoptic conditions associated with no’westers and tornadoes inBangladesh—an appraisal based on numerical weather prediction (NWP) guidance products. 14threport of SAARC Meteorological Research Center, Dhaka, Bangladesh
Rasmussen EN, Blanchard DO (1998) A baseline climatology of sounding derived supercell and tornadoforecast parameters. Weather Forecast 13:1148–1164
Rasmussen EN, Wilhemson RB (1983) Relationships between stormcharacteristics and 1200 GMT hodo-graphs, low-level shear, and stability. In: Proceedings of 13th conference on severe local storms, Tulsa,OK: American Meteorological Society, pp J5–J8
Rhea JO (1966) A study of thunderstorm formation along dry lines. J Appl Meteorol 5:58–63Romatschke U, Medina S, Houze RA (2010) Regional, seasonal, and diurnal variations of extreme con-
vection in the south Asian region. J Clim 23:419–439Sadowski AF, Rieck RE (1977) Technical procedures bulletin no. 207: stability indices. National Weather
Service, Silver Spring, p 8Showalter AK (1953) A stability index for thunderstorm forecasting. Bull Am Meteorol Soc 34:250–252Weisman ML, Klemp JB (1982) The dependence of numerically simulated convective storms on vertical
wind shear and buoyancy. Mon Weather Rev 110:504–520Weston KJ (1972) The dry-line of northern India and its role in cumulonimbus convection. Q J R Meteorol
Soc 98(417):519–531Yamane Y, Hayashi T (2006) Evaluation of environmental conditions for the formation of severe local
storms across the Indian subcontinent. Geophys Res Lett 33:L17806Yamane Y, Hayashi T, Dewan AM, Akter F (2010a) Severe local convective storms in Bangladesh: part 1.
Climatol Atmos Res 95:400–406Yamane Y, Hayashi T, Dewan AM, Akter F (2010b) Severe local convective storms in Bangladesh: part 2.
Environmental conditions. Atmos Res 95:407–418Yamane Y, Hayashi T, Kiguchi M, Akter F, Dewan AM (2012) Synoptic situations of severe local con-
vective storms during the pre-monsoon season in Bangladesh. Int J Climatol 33:725–734Ziegler CL, Rasmussen EN (1998) The initiation of moist convection at the dryline: forecasting issues from
a case study perspective. Weather Forecast 13:1106–1131
Nat Hazards
123
Copyright © 2022 FDOKUMEN