Synergy of rising nitrogen depositions and atmospheric CO2 on land carbon uptake moderately offsets...
12
Synergy of rising nitrogen depositions and atmospheric CO 2 on land carbon uptake moderately offsets global warming Galina Churkina, 1,2 Victor Brovkin, 3,4 Werner von Bloh, 3 Kristina Trusilova, 1 Martin Jung, 1 and Frank Dentener 5 Received 1 July 2008; revised 27 July 2009; accepted 4 August 2009; published 26 November 2009. [1] Increased carbon uptake of land in response to elevated atmospheric CO 2 concentration and nitrogen deposition could slow down the rate of CO 2 increase and facilitate climate change mitigation. Using a coupled model of climate, ocean, and land biogeochemistry, we show that atmospheric nitrogen deposition and atmospheric CO 2 have a strong synergistic effect on the carbon uptake of land. Our best estimate of the global land carbon uptake in the 1990s is 1.34 PgC/yr. The synergistic effect could explain 47% of this carbon uptake, which is higher than either the effect of increasing nitrogen deposition (29%) or CO 2 fertilization (24%). By 2030, rising carbon uptake on land has a potential to reduce atmospheric CO 2 concentration by about 41 ppm out of which 16 ppm reduction would come from the synergetic response of land to the CO 2 and nitrogen fertilization effects. The strength of the synergy depends largely on the cooccurrence of high nitrogen deposition regions with nonagricultural ecosystems. Our study suggests that reforestation and sensible ecosystem management in industrialized regions may have larger potential for climate change mitigation than anticipated. Citation: Churkina, G., V. Brovkin, W. von Bloh, K. Trusilova, M. Jung, and F. Dentener (2009), Synergy of rising nitrogen depositions and atmospheric CO 2 on land carbon uptake moderately offsets global warming, Global Biogeochem. Cycles, 23, GB4027, doi:10.1029/2008GB003291. 1. Introduction [2] Burning of fossil fuel and land use change release carbon dioxide (CO 2 ), which is the most important green- house gas with a radiative forcing of about 1.66 W/m 2 . If carbon uptake of the land or ocean weakens in the future, atmospheric CO 2 concentrations increase even faster [Raupach et al., 2007]. Future trajectories of atmospheric CO 2 concentrations depend on the land responses to chang- ing climate as well as to simultaneous rising of atmospheric CO 2 and nitrogen deposition, which both can increase plant growth [DeLucia et al., 2005; Finzi et al., 2007] and soil respiration [King et al., 2004]. Although regional climate changes can have both positive and negative effects on carbon uptake, recent modeling studies point to reduction of global land uptake in the future primarily because plant and soil respiration increase with elevated temperatures [Friedlingstein et al., 2006]. Physiological effect of ele- vated atmospheric CO 2 on plant productivity is considered to offset the negative effect of climate and is debatably used to explain an increase in the global carbon uptake of land in the end of last century. Model simulations [Cramer et al., 2001] suggest net global carbon uptake of 2.4 PgC/yr in 1990s due to the CO 2 fertilization effect alone. This study assumes that productivity of land ecosystems is not limited by nitrogen availability. Nitrogen is however reported to be a primary limiting nutrient throughout terrestrial ecosys- tems of mid and high latitudes, and an important limiting nutrient for plant growth throughout subtropical and trop- ical ecosystems [Vitousek et al., 1998], where phosphorus is a colimiting or limiting nutrient [D’Antonio and Mack, 2006; Tanner et al., 1998]. Recent findings from field stud- ies [Reich et al., 2006] point to nitrogen availability being a constraint to CO 2 -induced stimulation of plant growth. Low availability of nitrogen in the soils appears to suppress the positive response of plant growth to elevated CO 2 . Anthropogenic increase in nitrogen deposition enhances availability of nitrogen in soil and this increase has been shown to correlate with the sequestration of carbon by the European forests [Magnani et al., 2007]. Although the amount of reactive nitrogen globally has doubled between 1860 and 1990s [Galloway et al., 2004], continues to increase, and is mostly deposited on land, it is still far from being plentiful nutrient for land ecosystems [Hungate et al., 2003], which are usually nitrogen limited [Vitousek et al., 2002]. It is a matter of debate how land ecosystems respond to simultaneously changing climate, rising atmospheric CO 2 , and nitrogen deposition. [3] A number of global scale studies addressed the responses of land ecosystems to rising nitrogen deposition GLOBAL BIOGEOCHEMICAL CYCLES, VOL. 23, GB4027, doi:10.1029/2008GB003291, 2009 Click Here for Full Article 1 Max Planck Institute for Biogeochemistry, Jena, Germany. 2 Leibniz Centre for Agricultural Landscape Research, Mu ¨ncheberg, Germany. 3 Potsdam Institute for Climate Impact Research, Potsdam, Germany. 4 Max Planck Institute for Meteorology, Hamburg, Germany. 5 Joint Research Centre, Institute for Environment and Sustainability, European Commission, Ispra, Italy. Copyright 2009 by the American Geophysical Union. 0886-6236/09/2008GB003291$12.00 GB4027 1 of 12
Transcript of Synergy of rising nitrogen depositions and atmospheric CO2 on land carbon uptake moderately offsets...

Synergy of rising nitrogen depositions and atmospheric CO2 on land
carbon uptake moderately offsets global warming
Galina Churkina,1,2 Victor Brovkin,3,4 Werner von Bloh,3 Kristina Trusilova,1
Martin Jung,1 and Frank Dentener5
Received 1 July 2008; revised 27 July 2009; accepted 4 August 2009; published 26 November 2009.
[1] Increased carbon uptake of land in response to elevated atmospheric CO2
concentration and nitrogen deposition could slow down the rate of CO2 increase andfacilitate climate change mitigation. Using a coupled model of climate, ocean, and landbiogeochemistry, we show that atmospheric nitrogen deposition and atmospheric CO2
have a strong synergistic effect on the carbon uptake of land. Our best estimate of theglobal land carbon uptake in the 1990s is 1.34 PgC/yr. The synergistic effect couldexplain 47% of this carbon uptake, which is higher than either the effect of increasingnitrogen deposition (29%) or CO2 fertilization (24%). By 2030, rising carbon uptake onland has a potential to reduce atmospheric CO2 concentration by about 41 ppm out ofwhich 16 ppm reduction would come from the synergetic response of land to the CO2 andnitrogen fertilization effects. The strength of the synergy depends largely on thecooccurrence of high nitrogen deposition regions with nonagricultural ecosystems. Ourstudy suggests that reforestation and sensible ecosystem management in industrializedregions may have larger potential for climate change mitigation than anticipated.
Citation: Churkina, G., V. Brovkin, W. von Bloh, K. Trusilova, M. Jung, and F. Dentener (2009), Synergy of rising nitrogen
depositions and atmospheric CO2 on land carbon uptake moderately offsets global warming, Global Biogeochem. Cycles, 23, GB4027,
doi:10.1029/2008GB003291.
1. Introduction
[2] Burning of fossil fuel and land use change releasecarbon dioxide (CO2), which is the most important green-house gas with a radiative forcing of about 1.66 W/m2. Ifcarbon uptake of the land or ocean weakens in the future,atmospheric CO2 concentrations increase even faster[Raupach et al., 2007]. Future trajectories of atmosphericCO2 concentrations depend on the land responses to chang-ing climate as well as to simultaneous rising of atmosphericCO2 and nitrogen deposition, which both can increase plantgrowth [DeLucia et al., 2005; Finzi et al., 2007] and soilrespiration [King et al., 2004]. Although regional climatechanges can have both positive and negative effects oncarbon uptake, recent modeling studies point to reductionof global land uptake in the future primarily because plantand soil respiration increase with elevated temperatures[Friedlingstein et al., 2006]. Physiological effect of ele-vated atmospheric CO2 on plant productivity is consideredto offset the negative effect of climate and is debatably usedto explain an increase in the global carbon uptake of land in
the end of last century. Model simulations [Cramer et al.,2001] suggest net global carbon uptake of 2.4 PgC/yr in1990s due to the CO2 fertilization effect alone. This studyassumes that productivity of land ecosystems is not limitedby nitrogen availability. Nitrogen is however reported to bea primary limiting nutrient throughout terrestrial ecosys-tems of mid and high latitudes, and an important limitingnutrient for plant growth throughout subtropical and trop-ical ecosystems [Vitousek et al., 1998], where phosphorusis a colimiting or limiting nutrient [D’Antonio and Mack,2006; Tanner et al., 1998]. Recent findings from field stud-ies [Reich et al., 2006] point to nitrogen availability beinga constraint to CO2-induced stimulation of plant growth.Low availability of nitrogen in the soils appears to suppressthe positive response of plant growth to elevated CO2.Anthropogenic increase in nitrogen deposition enhancesavailability of nitrogen in soil and this increase has beenshown to correlate with the sequestration of carbon by theEuropean forests [Magnani et al., 2007]. Although theamount of reactive nitrogen globally has doubled between1860 and 1990s [Galloway et al., 2004], continues toincrease, and is mostly deposited on land, it is still far frombeing plentiful nutrient for land ecosystems [Hungate et al.,2003], which are usually nitrogen limited [Vitousek et al.,2002]. It is a matter of debate how land ecosystems respondto simultaneously changing climate, rising atmosphericCO2, and nitrogen deposition.[3] A number of global scale studies addressed the
responses of land ecosystems to rising nitrogen deposition
GLOBAL BIOGEOCHEMICAL CYCLES, VOL. 23, GB4027, doi:10.1029/2008GB003291, 2009ClickHere
for
FullArticle
1Max Planck Institute for Biogeochemistry, Jena, Germany.2Leibniz Centre for Agricultural Landscape Research, Muncheberg,
Germany.3Potsdam Institute for Climate Impact Research, Potsdam, Germany.4Max Planck Institute for Meteorology, Hamburg, Germany.5Joint Research Centre, Institute for Environment and Sustainability,
European Commission, Ispra, Italy.
Copyright 2009 by the American Geophysical Union.0886-6236/09/2008GB003291$12.00
GB4027 1 of 12

during the last few decades. Based on results from a seriesof 15N-tracer field experiments, Nadelhoffer et al. [1999]argued that increased inputs of nitrogen from the atmo-sphere made a minor contribution to land carbon uptakewith an additional 0.25 PgC per year being sequestered.In contrast, model based estimates [Holland et al., 1997;Townsend et al., 1996] showed significant increases in landcarbon uptake. Using the ecosystem model CENTURYand various predicted spatial distributions of atmosphericnitrogen deposition,Holland et al. [1997] estimated carbonuptake of 1.5–2.0 Pg per year induced by nitrogen depo-sition. The most recent study with the BIOME-BGC model[Churkina et al., 2007] showed that elevated nitrogendeposition would not significantly enhance land carbonuptake unless effects on regrowing forests are considered.They reported that nitrogen enriched land ecosystemssequestered 0.75–2.21 PgC in the 1990s depending onthe proportion and age of regrowing forests. Thornton et al.[2007] investigated the importance of carbon-nitrogeninteractions on land for the climate system. They pointedout that including carbon-nitrogen interactions in the landcarbon model substantially changes dynamics of severalcritical feedbacks between land and climate system. Forinstance, the sensitivity of land carbon fluxes to changingtemperature and precipitation decreases with rising atmo-spheric CO2. The question to what extent nitrogen depositionhas potential to slow down the atmospheric CO2 increase andthus to mitigate climate change remains open.[4] We use a coupled model of climate, ocean, and land
biogeochemistry to investigate feedbacks between increasingatmospheric nitrogen depositions, land ecosystems, atmo-spheric CO2, and climate. First we isolate the contributions oftransient changes in climate, atmospheric CO2, and nitrogendeposition to the net carbon flux variability of land from 1860to 2030. We also investigate how this impacts concentrationof CO2 in the atmosphere and global temperature.
2. Methods
2.1. Coupled System
[5] To investigate feedbacks between climate, atmosphericCO2, atmospheric nitrogen deposition and carbon uptakeof the land over almost two centuries, we coupled an earthsystem model of intermediate complexity, CLIMBER-2 witha biogeochemical process model BIOME-BGC.2.1.1. CLIMBER-2 Description[6] CLIMBER-2 [Petoukhov et al., 2000] comprises a
2.5-dimensional dynamical-statistical atmosphere model(10� latitude and 51� longitude), a 3-basin, zonally averagedocean model (latitudinal resolution 2.5�), a sea-ice model, aterrestrial vegetation model (used here for parameterizationof biophysical processes of land surface – atmosphereexchange), and a model of oceanic biogeochemistry [Brovkinet al., 2002]. CLIMBER-2 is able to reproduce present-dayand paleoclimates [Claussen et al., 1999] and compares wellwith complex climate system models [Ganopolski et al.,2001].2.1.2. BIOME-BGC Description[7] The terrestrial biogeochemical model BIOME-BGC
[Running and Hunt, 1993; Thornton, 1998] calculates water,
carbon, and nitrogen pools as well as their fluxes on a dailybasis. The model is able to reproduce carbon and waterfluxes, stem increments, and other components of the carboncycle for a range of ecosystems [Churkina and Running,2000; Cienciala et al., 1998; Thornton et al., 2002; Vetter etal., 2005]. BIOME-BGC is also able to replicate responses innet carbon exchange of forest ecosystems to different levelsof atmospheric nitrogen deposition [Churkina et al., 2003].Themodel is forced bymaximum andminimum surface dailyair temperature, precipitation, air humidity, and solar radia-tion data. Carbon dynamics include calculations of the plantphotosynthesis, growth, allocation of assimilates to thedifferent plant organs, mortality as well as litter and soilorganic matter decomposition. Plant demand for nitrogen iscalculated from potential gross primary productivity andcarbon to nitrogen ratios of plant organs. Demand of soilmicrobial community for nitrogen is determined by potentiallitter and soil organic matter available for decomposition andcarbon to nitrogen ratios of corresponding pools. The amountof nitrogen available to satisfy this demand is computed asthe sum of nitrogen deposited from atmosphere, biologicalfixation, and nitrogen mineralized from soil organic matterdecomposition. Soil microbial community has a priority ingetting mineralized nitrogen. If the demand for nitrogen ofthe plant or the soil is not met, the potential gross primaryproductivity and soil decomposition are reduced accordingly.Therefore, the model is able to reproduce direct feedbacksbetween nitrogen availability and biomass growth or soildecomposition. Nitrogen loss from ecosystem includesleaching of nitrogen with water outflow and gaseous lossesduring fire. Volatilization of nitrogen from soil mineralnitrogen pool is not explicitly calculated, because globalscale controls over denitrification are still under development[Kulkarni et al., 2008]. Nitrogen leaching from ecosystem isdetermined by the amount of soluble mineral nitrogen avail-able, water outflow, and soil water content. Detailed descrip-tion of nitrogen cycle can be found elsewhere [Thornton,1998]. Possible forest dieback subjected to high nitrogeninputs was not considered in this study, because the atmo-spheric nitrogen depositions were averaged over relativelycoarse grid cells and did not reach the high values, whichcould cause nutritional imbalance of forests.2.1.3. BIOME-BGC Parameterization andInitialization[8] The model (version 4.1.1 with carbon and nitrogen
allocation routine from 4.1) was parameterized for sevenvegetation types such as deciduous broadleaf forest, ever-green needleleaf forest, evergreen broadleaf forest, evergreendeciduous forest, shrubland, C4 and C3 grasslands. Param-eters for evergreen needleaf and deciduous broadleaf forests(e.g., carbon to nitrogen ratios of forest ecosystem’s pools)were optimized from field measurements of net carbon fluxes[Trusilova et al., 2009]. Parameterizations for evergreenbroadleaf forest, deciduous needleaf forest, shrublands, C3and C4 grasslands were from White et al. [2000].[9] All input data were transformed to a 1� � 1� spatial
resolution and subsequent spatially explicit simulations withthe BIOME-BGC model were performed at this spatialresolution as well. Input land surface characteristics includ-
GB4027 CHURKINA ET AL.: CO2, N, CARBON UPTAKE AND GLOBAL WARMING
2 of 12
GB4027

ed digital elevation map, soil texture map, and land coverclassification.[10] Carbon and nitrogen state variables of the BIOME-
BGC model represent amounts of carbon and nitrogen storedin simulated plant and soil pools. State variables can beinitialized either from measurements or from model simu-lations (spin-up run). In the spin-up run, the model is run to asteady state to obtain the size of the ecosystem’s carbon andnitrogen pools under the assumption of ecosystem being inequilibrium with the long-term climate. Since measuredvalues for model’s state variables globally are not available,model simulations were performed for their initialization inthis study. The model spin-up simulation was performed withdaily climate data from NCEP Reanalysis [Kalnay et al.,1996] for 1968–1977, constant preindustrial atmosphericnitrogen deposition (0.0002 kgN/m2/yr) and CO2 concentra-tion (286 ppm).
2.2. Estimation of Atmospheric CO2 in a CoupledSystem
[11] Atmospheric CO2 concentrations are modified byCO2 fluxes from ocean and land. In this study the changein atmospheric CO2 was resolved on an annual time step as:
CA t þ 1ð Þ ¼ CA tð Þ þ b�fE tð Þ þ FOA tð Þ þ FLA t;CA t � 1ð Þð Þg;ð1Þ
where CA is atmospheric CO2 concentration (ppmv), b is aconversion factor (0.47 ppmv/Pg C) from units of carbon tounits of CO2, E is anthropogenic CO2 emissions (Pg C/yr),FOA and FLA are annual ocean-atmosphere and land-atmosphere net carbon fluxes (PgC/yr), respectively.[12] The CLIMBER-2 model was used for the calculation
of atmospheric CO2 concentration (equation (1)) and climateanomalies that were passed to BIOME-BGC (Figure 1).Anthropogenic CO2 emissions (E) for years 1860–2000 andfor the IPCC SRES A2 scenario for the period 2000–2030were obtained from the recent C4MIP intercomparisonstudy [Friedlingstein et al., 2006]. Anthropogenic emis-sions included CO2 fluxes from fossil fuel burning and landuse change (except one sensitivity simulation which did notinclude the land use emissions). Carbon fluxes resultingfrom photosynthesis and respiration of land ecosystem wereestimated with the BIOME-BGC model each year, whileannual carbon fluxes from the ocean (FOA) were modeled byCLIMBER-2 The atmospheric CO2 (CA) calculated inaccordance with equation (1) was used as an input forBIOME-BGC in calculating FLA for the next year, thuscreating the biogeochemical feedback between CLIMBER-2and BIOME-BGC. CLIMBER-2 provided BIOME-BGC
with monthly anomalies of surface air temperature, precip-itation, and downward shortwave radiation. These anoma-lies were computed as differences between correspondingclimate variables in the current year of the transient run andthe year 1860 (initial simulation year). The climate simu-lated by CLIMBER-2 responded to atmospheric CO2 in-crease. Biogeochemical and hydrological processes withinBIOME-BGC were forced by simulated trend in climateobtained from CLIMBER-2. The climate anomalies fromCLIMBER were added to the daily climatology for one yearwhich was randomly selected from the NCEP Reanalysisdata [Kalnay et al., 1996] for the years 1948–1952. Wechose climate data for the earliest part of the reanalysisperiod, when climate was least affected by anthropogenicchange. Absolute climate anomalies were used for temper-ature and radiation. Relative climate anomalies were usedfor precipitation because absolute values of precipitationsimulated by climate models are often biased. The modifiedclimate variables were used to drive simulations of theBIOME-BGC model for the next year, thus generating aclimatic feedback between CLIMBER-2 and BIOME-BGC.Radiative forcings of other greenhouse gases such as CH4
and N2O, as well as of sulphate aerosols were neglected.
2.3. Model Simulations
[13] To evaluate effects of different factors on land carbonuptake and consequently on atmospheric CO2, we per-formed seven simulations (Table 1) of the coupled modelfrom 1860 to 2030. The atmospheric CO2 and ocean carboncycle were interactive in all runs. In the control simulation(Control), CLIMBER-2 atmosphere and ocean model wereinteractive with rising CO2 concentrations driven by emis-sions from fossil fuel burning and land use change. TheBIOME-BGC model was driven by daily NCEP Reanalysisclimate values for 1948–52, with years randomly shuffled,constant CO2 concentrations (286 ppm) and nitrogen depo-sition (0.0002 kgN/m2/yr) as in spin-up simulation. Thecontrol simulation represents the state of biosphere undis-turbed by climate change, CO2 and nitrogen fertilization.We isolated and combined the effects of climate change,elevated CO2, and nitrogen deposition by simulations withclimate change only (Clim), with CO2 increase but noclimate change and no nitrogen deposition increase (CO2),and with nitrogen deposition increase but no climate changeand no CO2 increase (Nhigh). Three model simulations (Clim +CO2 +Nhigh, Clim+CO2 +Nlow, andClim+CO2 +Nhigh-LU),were performed with all factors changing. Simulation ‘‘Clim +CO2 + Nlow’’ was performed with low nitrogen depositionfrom IIASA maximum feasible reduction scenario 2030[Dentener et al., 2006]. The ‘‘Clim + CO2 + Nhigh’’ simula-
Figure 1. Coupled modeling system used for simulations in this study.
GB4027 CHURKINA ET AL.: CO2, N, CARBON UPTAKE AND GLOBAL WARMING
3 of 12
GB4027

tion was executed with high nitrogen deposition from SRESA2 2030 scenario [Dentener et al., 2006] and with CO2
emissions from land cover conversion. To estimate the effectof CO2 emissions from land use change on temperature andatmospheric CO2 we also performed model simulation withhigh nitrogen deposition and no emissions from land use(LU) change (Clim + CO2 + Nhigh-LU). Because land coverconversion is not simulated with the current version of theBIOME-BGC model, carbon flux from land use change hasbeen prescribed in this simulation from [Friedlingstein et al.,2006].[14] All above mentioned simulations were first performed
with potential (described below) and then with present veg-etation (SYNMAP) [Jung et al., 2006]. In simulation withpresent vegetation, net carbon balance of croplands wasassumed to be close to neutral given that their biomass isregularly harvested. Although we assume no changes invegetation cover in all simulations, we account for carbonemissions from land use change when calculating atmo-spheric CO2 as described above.[15] A new potential vegetation map optimized for BI-
OME-BGC vegetation classes and compatible with thepresent vegetation map [Jung et al., 2006] was constructed(see Text S1).1 This map is based on adaptive filtering ofanthropogenic classes such as urban and cropland withreplacement of the majority class of natural vegetation usingseveral high resolution (1km) land cover products. Theadvantages of this potential vegetation map is that it is basedon an advanced reproduction method (more recent data setsand advanced filtering approach than other maps) and isoptimized for applications with carbon cycle models.2.3.1. Climate Change[16] Climate anomalies were calculated by CLIMBER-2
and imposed over daily NCEP Reanalysis climate values for1948–52 as described above. The BIOME-BGC simula-tions were driven by these modified climate values at a dailytime step.2.3.2. Atmospheric CO2 Change[17] In the year 1860, atmospheric CO2 concentration was
prescribed to 286 ppmv in accordance with ice core data[Etheridge et al., 1996]. Hereafter, atmospheric CO2 dynam-ics were calculated interactively by the coupled modelingsystem as described above (equation (1)) and used to drivesimulations of the BIOME-BGC model in all simulationsexcept the ones with fixed CO2.
2.3.3. Nitrogen Deposition Change[18] State-of-the-art atmospheric nitrogen deposition esti-
mates for 1860–2030 were used to drive simulations ofBIOME-BGC (Figure 2). The spatial distribution of atmo-spheric nitrogen deposition was estimated with the threedimensional atmospheric chemical transport model TM3[Rodhe et al., 2002] for 1860–1980 and with the mean ofan ensemble of model results [Dentener et al., 2006] for2000 and 2030. The estimates included wet and drydepositions of both NOy and NHx. The depositions ofreactive nitrogen in 2030 were estimated with two scenarios:(1) a ‘‘low emission’’ scenario assuming maximum emissionreduction that is currently technologically feasible; (2) a‘‘high emission’’ scenario which corresponds to the IPCCSRES A2 scenario. The original decadal model outputs for1860–1980 as well as for 2000 and 2030 were transformedinto time series of annual atmospheric nitrogen depositionsusing linear interpolation for each grid pixel.[19] To analyze the relative contributions of rising atmo-
spheric CO2 and nitrogen deposition to the land carbonuptake we calculated the difference of the global carbonbalance of the respective scenario and of the control run forthe 1990s. The relative contributions were given as percentchange of the net carbon flux.
3. Results and Discussion
3.1. Responses of Land Ecosystems
3.1.1. Corroboration[20] Our global and continental scale estimates of land
carbon uptake in 1990s are consistent with previouslyreported data. Our best estimate of global land carbonuptake is 1.34 PgC/yr for 1990s. This estimate is a resultfrom model simulations for present vegetation cover with allfactors included (Clim + CO2 + Nhigh). Our best estimate iswithin the uncertainty range of the uptake reported recentlyfor 1990s 0.9 to 4.3 PgC (best estimate: 2.6 PgC) [Solomonet al., 2007]. We estimate the carbon uptake of geographicEurope at 0.08 PgC/yr, which is comparable to the previousestimate of 0.11 ± 0.28 PgC/yr from the analysis of differentland-based approaches [Janssens et al., 2003]. The NorthAmerican ecosystems sequester around 0.23 PgC/yr accord-ing to our model simulations that is also within the uncer-tainty range of recent estimate 0.5 ± 0.25 PgC/yr from avariety of sources [King et al., 2007]. Our estimates of landcarbon fluxes are on the low side because no land manage-ment or forest age effects were included in our modelsimulations, but in the other estimates they were. In addition
Table 1. Protocol of Simulations Performed With the Coupled Model for 1860–2030a
Simulation Climate Change Fossil Fuel Emissions Land Use Emissions Nitrogen Deposition Change
Control No No Yes NoClim Yes No Yes NoCO2 No Yes Yes NoNhigh No No Yes SRES A2 2030Clim + CO2 + Nhigh Yes Yes Yes As aboveClim + CO2 + Nhigh-LU Yes Yes No As aboveClim + CO2 + Nlow Yes Yes Yes IIASA maximum feasible reduction scenario 2030
aEmissions of CO2 from fossil fuel burning and land use change for years 1860–2000 and the climate IPCC SRES A2 scenario for the period 2000–2030 were obtained from the recent C4MIP intercomparison study [Friedlingstein et al., 2006]. Nitrogen deposition was estimated with TM3 [Rodhe etal., 2002] for 1860–1980 and with the mean of an ensemble of model results for 2000 and 2030 [Dentener et al., 2006].
1Auxiliary materials are available in the HTML. doi:10.1029/2008GB003291.
GB4027 CHURKINA ET AL.: CO2, N, CARBON UPTAKE AND GLOBAL WARMING
4 of 12
GB4027

areas dominated by croplands were excluded from thesecalculations.[21] Although a direct validation of the responses of
modeled NPP to nitrogen deposition and elevated CO2 isdesirable, it remains problematic because of the differencesin experimental designs of field and model experiments.Soil nitrogen status, frequency and intensity of nitrogenadditions play important roles in the ecosystem’s responseto it. Frequency and magnitude of nitrogen addition in thefield (1–2 times per year, 1–1000 kgN/ha/yr) cannot bedirectly compared to the continuing nitrogen depositionfrom atmosphere (2–45 kgN/ha/yr) in our numerical simu-lations. Moreover, the atmospheric nitrogen deposition isalready included as a background deposition in addition tothe nitrogen fertilizers in the control experimental studies.The modeled global NPP increase (on average 4% in 1990s)is lower than the results of recent meta-analyses of nitrogenaddition experiments, but not unreasonable given the differ-ences on experimental designs of field and model experi-ments. Aboveground NPP was increased by approximately28–29% in the cross-biome analyses of terrestrial plants[Elser et al., 2007; LeBauer and Treseder, 2008]. Theaverage biomass response to low nitrogen addition amounts(approx. 10–50 kgN/ha/yr) was 24.6% for woody and 50%for herbaceous plants [Xia and Wan, 2008]. The modeledresponse of global NPP to elevated CO2 (8% increase at560 ppm of CO2) is also lower than the response of the drymatter production reported in field studies, which rangesfrom 10% for C3 grasses to 28% for forests at 550–600 ppmof CO2 [Ainsworth and Long, 2005]. Trees grown undernutrient limitations however had a nonsignificant 14% stim-ulation in aboveground biomass [Ainsworth and Long,2005]. Again ecosystems can have different responses toCO2 continuously rising over 130 years in modeling exper-
iment and to high CO2 levels kept at a constant level for 6–10 years in field experiments. Some field studies suggest thatplant growth response to elevated CO2 slows over time, likelydue to reduced nitrogen availability [Hungate et al., 2006].[22] In addition to differences in experimental designs,
changes in allocation patterns of ecosystems in CO2 andnitrogen enrichment experiments [Finzi et al., 2006a; Finziet al., 2006b; Gill et al., 2006; Norby and Iversen, 2006]may be responsible for discrepancies between model andexperimental results. The allocation pattern change has notbeen accounted for in the BIOME-BGC model, becausemechanisms behind the different and sometimes contrast-ing allocation responses of ecosystems are still poorlyunderstood.
3.1.2. Attribution[23] The dominant anthropogenic driver of net ecosystem
productivity (NEP) shifts in the model over 170 years(Figure 3). Before 1990 NEP increases more in responseto elevated atmospheric CO2 than to rising nitrogen depo-sition. Starting in the 1990s, the effect of nitrogen deposi-tion overtakes the fertilization effect of rising CO2 on netcarbon uptake. By 2030 the global NEP driven by increas-ing nitrogen deposition is higher than NEP driven by risingCO2, which saturates at 0.3 PgC/yr. Global gross primaryproductivity (GPP) of land ecosystems in response toelevated CO2 does not saturate although NEP (Figure 4)and net primary productivity (NPP, not shown) do. GPPdriven by rising CO2 is higher than GPP driven by risingdeposition of nitrogen until 2020. Global modeled NPP inresponse to elevated CO2 slows down over time similar togrowth responses of plants [Hungate et al., 2006], due toreduced nitrogen availability. The saturation in NEP re-sponse to elevated atmospheric CO2 in the ‘‘CO2’’ only
Figure 2. The global atmospheric nitrogen deposition for 1860–2030 used in the model simulations.Two scenarios with high (black line, SRES A2 2030) [Dentener et al., 2006] and low (gray line, IIASAMaximum feasible reduction scenario 2030) [Dentener et al., 2006] nitrogen depositions are displayed.Two scenarios coincide for 1960–2000. The estimates include wet and dry depositions of both NOy
and NHx.
GB4027 CHURKINA ET AL.: CO2, N, CARBON UPTAKE AND GLOBAL WARMING
5 of 12
GB4027

simulation is related to respiration which increases at ratescomparable with GPP after 1990s.[24] The effect of changing climate on net carbon fluxes of
land is almost negligible (Figure 3), because GPP (Figure 4)and respiration (not shown) are increasing at similar rates. Insimulations with potential vegetation changing climate leadsto a slight increase of NEP (0.1 PgC/yr in the 1990s), whichindicates that GPP increase is higher than respiration rise. In
the case of potential vegetation the area of nitrogen limitedforests is more extensive. Rising temperatures enhancedecomposition of forest soil and release more inorganicnitrogen reducing nitrogen limitation of forest carbon uptakewhich overcompensates the respiration loss.
3.1.3. Synergistic Effect[25] Our model simulations suggest a considerable syner-
gistic or nonadditive effect of increasing atmospheric CO2
Figure 3. Effects of increasing atmospheric CO2 and nitrogen deposition on net carbon flux from land.Shaded area shows effect of vegetation on NEP response. The upper bound of the shaded area wassimulated with potential vegetation cover. The lower bound (black solid line) was simulated with presentvegetation cover and crops assumed to be carbon neutral. NEP is steadily increasing in scenarios withrising nitrogen deposition only and in with all factors changing.
Figure 4. Effects of increasing atmospheric CO2 and nitrogen deposition on GPP of land ecosystems.GPP was simulated with present vegetation cover and crops assumed to be carbon neutral. After 1990s,GPP continues to increase in scenario with increasing CO2 only, even though NEP levels off.
GB4027 CHURKINA ET AL.: CO2, N, CARBON UPTAKE AND GLOBAL WARMING
6 of 12
GB4027

and nitrogen deposition on global NEP, GPP, and NPP(Table 2). In the 1990s the global synergistic effect forNEP is about 47%, which is higher than either the effect ofincreasing nitrogen deposition (29%) or CO2 fertilization(24%). The synergistic effect for GPP and NPP (36% and28% respectively) are lower than for NEP. Synergy impliesthat the net effect of both atmospheric CO2 and nitrogendeposition on NEP is higher than a sum of effects of eachforcing taken separately. The synergistic (nonlinear) effectcan be observed in the ecosystems colimited by severalfactors such as climate, CO2 and nitrogen availability. Whenthese limitations on ecosystem productivity simultaneouslyrelease, one can observe synergistic effect [Henry et al.,2006; Oren et al., 2001]. The simultaneous release of a fewlimitations does not always have a synergistic effect in amodel. The effect will be additive if a productivity iscalculated as a sum of functions of independent variables.The effect will be synergistic if productivity is a complexnonlinear function of independent variables, which is thecase in the BIOME-BGC model, G’DAY model [Pepper etal., 2005] and in a model by Lloyd [1999]. In contrast,effects of different treatments are additive in DAYCENT[Pepper et al., 2005].[26] In our study the synergy represents effects averaged
over different ecosystems and climate conditions. In previousfield and modeling studies the synergistic effect was reportedfor single ecosystems and is slightly lower than our results. Infield studies the synergistic effect of CO2 and nitrogenfertilization was about 25% for woody tissues increment ofneedleaf forest [Oren et al., 2001], which is consistent withour simulated 28% NPP increase. In a modeling study thesynergistic effect for net ecosystem productivity of a decid-uous forest was between 34 and 43% increasing with highernitrogen deposition loads [Lloyd, 1999]. Recent experimentalstudy of grassland by Henry et al. [2006] points to thecomplexity of interactions between CO2, nitrogen additions,soil moisture and burning effects on the productivity. Inunburned plots they found no interactive effects of elevatedCO2 and nitrate additions on plant productivity. However,fire can substantially modify responses of ecosystems to CO2
and nitrate additions.[27] In model simulations with present vegetation, the
synergistic effect is slightly lower in Europe than in NorthAmerica. It amounts to 45% and 53% respectively forpresent vegetation (Table 2). The CO2 fertilization has alsoa lower impact on carbon uptake in Europe (19%) than inNorth America (26%). In opposite, the rising nitrogendeposition enhances the carbon uptake of Europe more
(40%) than the carbon uptake of North America (22%). Agreater sensitivity of North American ecosystems to CO2
fertilization effect can be explained by a relatively highproportion of grasslands and shrublands (43% of land area),which are mostly water limited [Churkina and Running,1998] and are sensitive to CO2 fertilization effect. Europeanecosystems are limited mostly by radiation and temperature,therefore their response to increase in atmospheric CO2 islower. In Europe nitrogen deposition has a higher fertiliza-tion effect on land ecosystems than in North America,because more nitrogen-limited ecosystems, such as forests,are exposed to high deposition of reactive nitrogen. In-creased nitrogen deposition was recently shown to correlatewith carbon uptake of European forests [Magnani et al.,2007].
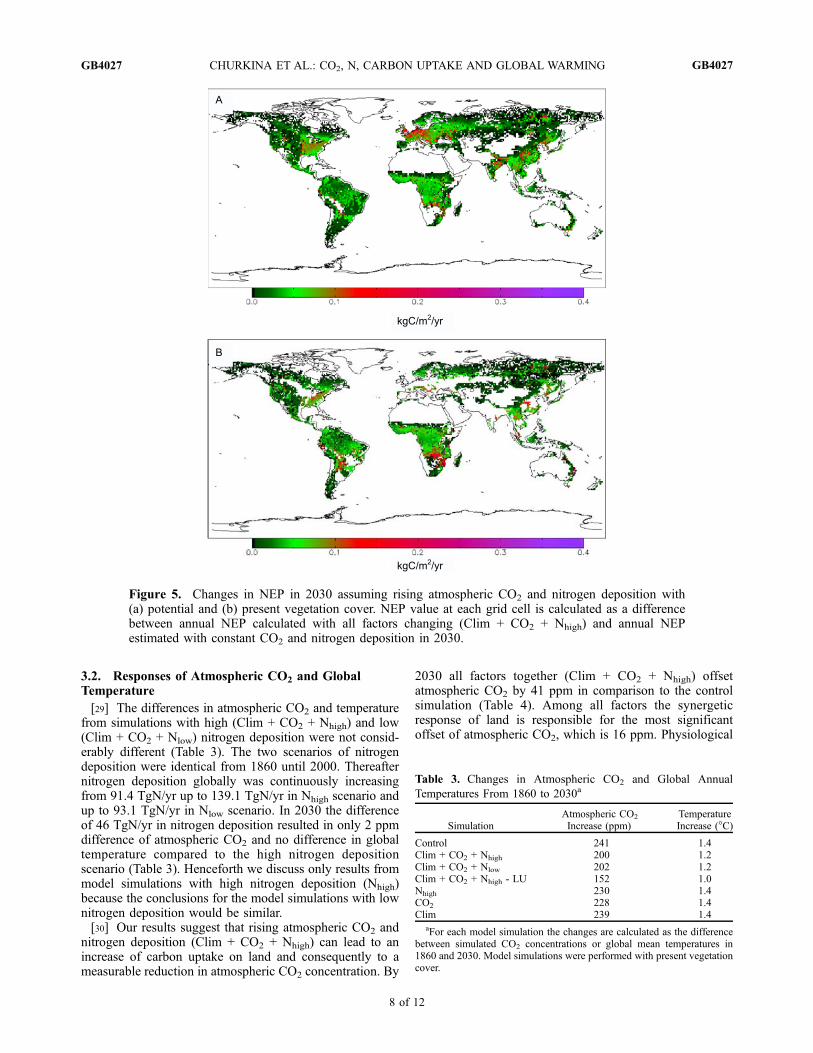
3.1.4. Spatial Patterns[28] We found that largest changes in simulated carbon
uptake on land have happened in industrial regions such asEastern North America, Europe, and South East Asia(Figures 5a and 5b), where nitrogen emissions and deposi-tion are the highest. In 2030 areas with carbon uptakeincrease higher than 0.2 kgC/m2 per year cover not only’’old’’ industrial regions (Europe, North America and SouthEast Asia) but also ‘‘emerging’’ industrial regions (Africaand South America). In 2030, the increase in annual carbonuptake reaches 0.4 kgC/m2 in South East Asia. The strengthof land response to the combined effect of anthropogenicforcings and its implications for atmospheric CO2 concen-trations and global temperature is related to vegetation typesand their distribution in the industrial regions. The strongesteffect (Figure 5a) is obtained with potential vegetation,where large areas of Europe, North America, and Asiaare covered by forests. Since forests have high carbon tonitrogen ratios and long lifetimes of carbon in wood, a mostsignificant effect was obtained in forests. The result fromsimulations with present vegetation shows a considerablyweaker response of land. The industrial regions havecurrently not only the highest nitrogen emission and depo-sition, but also large areas covered by managed ecosystems(e.g., croplands, pastures, urban sprawl) which alreadyreceive high fertilization additions and are mostly insensi-tive to environmental changes considered in the study[Ewert et al., 2007]. Reforestation of the industrial regionshowever may increase the carbon uptake on land and itsinfluence on the rising atmospheric CO2, given the highsensitivity of the regrowing trees to synergistic effect[Churkina et al., 2007].
Table 2. Relative Contributions of Elevated Atmospheric CO2, Nitrogen Deposition, Climate, and Combined Effect of All Factors on
Modeled GPP, NPP, and NEP of Land Ecosystemsa
Factors Affecting Land Carbon Fluxes Global GPP (%) Global NPP (%) Global NEP (%) European NEP (%) North American NEP (%)
CO2, climate and N deposition 100 100 100 100 100N deposition 23 35 28.7 39.7 21.7CO2 30 29 24.2 19.3 26.5Climate 11 7 �0.2 �3.6 �1.7Synergistic 36 28 47.3 44.6 53.5
aEach relative contribution is given as a percent change of the respective annual carbon flux averaged for the 1990s. All values were calculated in fourmodel simulations (CO2, Nhigh, Clim, and Clim + CO2 + Nhigh) with present vegetation cover. The fertilization effects of atmospheric CO2 and nitrogendeposition on NEP are nonadditive.
GB4027 CHURKINA ET AL.: CO2, N, CARBON UPTAKE AND GLOBAL WARMING
7 of 12
GB4027
3.2. Responses of Atmospheric CO2 and GlobalTemperature
[29] The differences in atmospheric CO2 and temperaturefrom simulations with high (Clim + CO2 + Nhigh) and low(Clim + CO2 + Nlow) nitrogen deposition were not consid-erably different (Table 3). The two scenarios of nitrogendeposition were identical from 1860 until 2000. Thereafternitrogen deposition globally was continuously increasingfrom 91.4 TgN/yr up to 139.1 TgN/yr in Nhigh scenario andup to 93.1 TgN/yr in Nlow scenario. In 2030 the differenceof 46 TgN/yr in nitrogen deposition resulted in only 2 ppmdifference of atmospheric CO2 and no difference in globaltemperature compared to the high nitrogen depositionscenario (Table 3). Henceforth we discuss only results frommodel simulations with high nitrogen deposition (Nhigh)because the conclusions for the model simulations with lownitrogen deposition would be similar.[30] Our results suggest that rising atmospheric CO2 and
nitrogen deposition (Clim + CO2 + Nhigh) can lead to anincrease of carbon uptake on land and consequently to ameasurable reduction in atmospheric CO2 concentration. By
2030 all factors together (Clim + CO2 + Nhigh) offsetatmospheric CO2 by 41 ppm in comparison to the controlsimulation (Table 4). Among all factors the synergeticresponse of land is responsible for the most significantoffset of atmospheric CO2, which is 16 ppm. Physiological
Figure 5. Changes in NEP in 2030 assuming rising atmospheric CO2 and nitrogen deposition with(a) potential and (b) present vegetation cover. NEP value at each grid cell is calculated as a differencebetween annual NEP calculated with all factors changing (Clim + CO2 + Nhigh) and annual NEPestimated with constant CO2 and nitrogen deposition in 2030.
Table 3. Changes in Atmospheric CO2 and Global Annual
Temperatures From 1860 to 2030a
SimulationAtmospheric CO2
Increase (ppm)TemperatureIncrease (�C)
Control 241 1.4Clim + CO2 + Nhigh 200 1.2Clim + CO2 + Nlow 202 1.2Clim + CO2 + Nhigh - LU 152 1.0Nhigh 230 1.4CO2 228 1.4Clim 239 1.4
aFor each model simulation the changes are calculated as the differencebetween simulated CO2 concentrations or global mean temperatures in1860 and 2030. Model simulations were performed with present vegetationcover.
GB4027 CHURKINA ET AL.: CO2, N, CARBON UPTAKE AND GLOBAL WARMING
8 of 12
GB4027

fertilization effect of CO2 on plants gives offset of 13 ppmand increasing nitrogen deposition on land ecosystemsreduces atmospheric CO2 by 11 ppm. The offset in atmo-spheric CO2 is considerably higher (76 ppm in 2030) ifpotential vegetation cover is used in the model simulations.[31] Global temperature shows a moderate response to the
effect of increasing nitrogen deposition, rising CO2, andchanging climate, because we performed model simulationsin this study over a relatively short period of time. By 2030,response of land reduces temperature by 0.2–0.4�C depend-ing if emissions from land use change were included in thesimulations with present vegetation or not (Table 3). Pro-jections of both NOy and NHx depositions until 2100 wouldbe desirable to investigate feedbacks between climate,carbon flux from nitrogen fertilized land ecosystems, andatmospheric CO2 concentrations.[32] Changes in climate from 1860 to 2030 do not play a
significant role in net carbon uptake on land with presentvegetation (Figure 3 and Table 2). Therefore, the differencein atmospheric CO2 concentrations estimated with andwithout changes in climate (Clim and Control simulations)
is almost negligible. By 2030 the difference between resultsfrom these two simulations is �2 ppm (Table 3). Becauseour study is focused on land carbon response to anthropo-genic forcing, we have not performed an analysis of oceanicCO2-temperature feedback. This analysis would require anadditional simulation without climate change effect onocean biogeochemistry such as uncoupled simulation byFriedlingstein et al. [2006]. An effect of sea surface warm-ing on oceanic CO2 uptake (which results in a CO2 releasefrom the ocean) is accounted for in simulations with andwithout climate change.[33] Increase in atmospheric CO2 concentrations simu-
lated with the coupled model in this study is comparablewith observations (Figure 6). In 2000 observed concen-trations are 9 ppm higher than CO2 concentrations simu-lated without accounting for emissions from land usechange (Climate + CO2 + Nhigh - LU). Simulated atmo-spheric CO2 concentration is 17 ppm higher than theatmospheric measurements once we include land useemissions in our calculations (Climate + CO2 + Nhigh).These estimates of atmospheric CO2 include three sourcesof uncertainty: emissions from land use change, fluxesfrom land ecosystems, and the ocean. The largest uncer-tainty here arises from estimates of emissions from landuse change. Land use emissions we use are possibly over-estimated [Brovkin et al., 2004; Jones et al., 2003]. Therecent estimate of emissions from land-use change during1990s was 1.6 PgC/yr [Solomon et al., 2007], which is40% less than emissions assumed in our scenario. Alsouncertainties in the estimated ocean carbon sink can con-tribute to the discrepancy between modeled and observedatmospheric CO2 concentrations. Ocean uptake in the(Climate + CO2 + Nhigh) simulation was 2.0 PgC/yr during1990s, which is slightly lower than the recent estimate of2.2 PgC/yr [Solomon et al., 2007].
Table 4. Contributions of Different Mechanisms Affecting Land
Carbon Balance to Changes in Atmospheric CO2 Concentrationsa
Factor AffectingLand NEP
Change in Atmospheric CO2
During 1860–2030 (ppmv)Factor Contribution
(%)
CO2, climate andN deposition
�41 100
N deposition �11 26CO2 �13 30Climate �2 5Synergistic �16 38
aCO2 concentrations are obtained from four model simulations (CO2,Nhigh, Clim, and Clim + CO2 + Nhigh). Synergy is a nonlinear term in thefull factor experiment.
Figure 6. Response of atmospheric CO2 concentration to increasing nitrogen deposition and changes incarbon uptake on land with present vegetation. ‘‘Clim + CO2 + Nhigh -LU’’ scenario refers to modelsimulation excluding CO2 emissions from land use change.
GB4027 CHURKINA ET AL.: CO2, N, CARBON UPTAKE AND GLOBAL WARMING
9 of 12
GB4027

3.3. Uncertainties in Land and Ocean Responses
[34] In this study we were not able to quantify uncertain-ties associated with certain effects of nitrogen on land andocean ecosystems. First, we did not include inhibitingeffects of airborne pollutant nitrogen and high nitrogenloads on land ecosystems. These effects comprise increasein export of dissolved organic carbon and nitrogen ratherthan enhanced forest growth [Pregitzer et al., 2004], forestdieback in areas with nitrogen saturated soils [Galloway etal., 2004; Likens et al., 1996], and reduced vegetationproductivity due to high ozone concentrations in areas withhigh nitrous oxide emissions [Chameides et al., 1994]. Allthree above mentioned effects would dampen the positiveeffect of increased nitrogen availability on plant growth.These effects were not included in the model, because themechanisms behind them in different ecosystems types arenot well understood. Second, our model does not includethe mechanism for nitrogen uptake through the stomata ofleaves. Several field studies [Johnson and Lindberg, 1992;McLaughlin et al., 1996] suggest that forest canopies canintercept dry atmospheric nitrogen and assimilate retainedreactive nitrogen from air. It is a matter of debate howsignificant the proportion of total incoming inorganic nitro-gen intercepted by the canopy is. The reported proportionranges from 16% to 90%. If all intercepted nitrogen is takenup by foliage then the nitrogen-induced carbon sink may behigher than estimated in our study. Third, we did notaccount for responses of regrowing forests in Europe andNorth America to rising CO2 and nitrogen deposition. Arecent modeling study [Churkina et al., 2007] howeversuggests that regrowing forests have higher carbon uptakein response to elevated nitrogen deposition than matureforests. Including response of regrowing forests wouldincrease land carbon uptake estimated in our study. Finally,we assumed no response of marine biota to the nitrogendeposition to the surface ocean. Although there is evidencethat atmospheric nitrogen deposition and river nitrogensupply can increase marine productivity [Cotrim da Cunhaet al., 2007; Fanning, 1989] of the coastal ocean, otherstudies [Knap et al., 1986] suggest that deposition ofatmospheric nitrogen has a minimal effect on the produc-tivity of the euphotic zone. A recent review [Duce et al.,2008] suggests that the effect of atmospheric deposition ofanthropogenic nitrogen on the open ocean is twofold. Onone hand it may account for up to �3% of new marinebiological production or � 0.3 PgC per year. On the otherhand, this input of nitrogen may account for up to �1.6 Tgof N2O emitted per year. It means that �10% of the ocean’suptake of atmospheric CO2 may result from atmosphericnitrogen fertilization, leading to a decrease in radiativeforcing, up to about two thirds of this amount to be offsetby the increase in N2O emissions.
4. Conclusions
[35] Increasing nitrogen deposition and the physiologicaleffect of elevated atmospheric CO2 on plants have thepotential to increase the land carbon sink, to offset the riseof CO2 concentration in the atmosphere, and to reduceglobal warming. The magnitude of this offset depends on
response of land ecosystems and possibly also ocean biotato the synergistic effect of nitrogen deposition and atmo-spheric CO2 as well as to changes in the patterns of nitrogendeposition in the future. The land response will be driven bydistribution of different ecosystems in current and emergingindustrial regions and their possibly not only positiveresponses to simultaneously increasing atmospheric CO2
and nitrogen deposition. Although croplands currentlydominate industrial regions, there is a trend toward refor-estation in Europe and North America. Regrowing forestsare more sensitive to the rising CO2 and nitrogen depositionthan mature forests. Therefore reforestation would amplifythe synergistic response and thereby play a more importantrole in climate change mitigation (‘buying time’) thancurrently thought.
[36] Acknowledgments. This study was partially supported byENIGMA project funded by Max-Planck Society of Germany and byCARBOEUROPE-Integrated Project (contract GOCE-CT-2003-505572).
ReferencesAinsworth, E. A., and S. P. Long (2005), What have we learned from 15years of free-air CO2 enrichment (FACE)? A meta-analytic review of theresponses of photosynthesis, canopy properties and plant production torising CO2, New Phytol., 165, 351 – 372, doi:10.1111/j.1469-8137.2004.01224.x.
Brovkin, V., J. Bendtsen, M. Claussen, A. Ganopolski, C. Kubatzki,V. Petoukhov, and A. Andreev (2002), Carbon cycle, vegetation, andclimate dynamics in the Holocene: Experiments with the CLIMBER-2model, Global Biogeochem. Cycles, 16(4), 1139, doi:10.1029/2001GB001662.
Brovkin, V., S. Sitch, W. Von Bloh, M. Claussen, E. Bauer, and W. Cramer(2004), Role of land cover changes for atmospheric CO2 increase andclimate change during the last 150 years, Global Change Biol., 10,1253–1266, doi:10.1111/j.1365-2486.2004.00812.x.
Chameides, W. L., P. S. Kasibhatla, J. Yienger, and H. Levy II (1994),Growth of continental scale metro-agro-plexes, regional ozone pollution,and world food production, Science, 264, 74 – 76, doi:10.1126/science.264.5155.74.
Churkina, G., and S. W. Running (1998), Contrasting climatic controls onthe estimated productivity of different biomes, Ecosystems, 1, 206–215,doi:10.1007/s100219900016.
Churkina, G., and S. W. Running (2000), Investigating the balance betweentimber harvest and productivity of the global coniferous forests underglobal change, Clim. Change , 47 , 167 – 191, doi:10.1023/A:1005620808273.
Churkina, G., et al. (2003), Analyzing the ecosystem carbon dynamicsof four European coniferous forest using a biogeochemistry model,Ecosystems, 6, 168 –184, doi:10.1007/s10021-002-0197-2.
Churkina, G., K. Trusilova, M. Vetter, and F. J. Dentener (2007), Contribu-tions of nitrogen deposition and forest re-growth to land carbon uptake,Carbon Balance Manage., 2, 5, doi:10.1186/1750-0680-2-5.
Cienciala, E., S. W. Running, A. Lindroth, A. Grelle, and M. G. Ryan(1998), Analysis of carbon and water fluxes from the NOPEX borealforest: Comparison of measurements with Forest-BGC simulations,J. Hydrol., 212–213, 62–78, doi:10.1016/S0022-1694(98)00202-9.
Claussen, M., V. Brovkin, A. Ganopolski, C. Kubatzki, V. Petoukhov, andS. Rahmstorf (1999), A new model for climate system analysis: Outlineof the model and application to palaeoclimate simulations, Environ.Model. Assess., 4, 209–216, doi:10.1023/A:1019016418068.
Cotrim da Cunha, L., E. T. Buitenhuis, C. Le Quere, X. Giraud, andW. Ludwig (2007), Potential impact of changes in river nutrient supplyon global ocean biogeochemistry, Global Biogeochem. Cycles, 21,GB4007, doi:10.1029/2006GB002718.
Cramer, W., et al. (2001), Global response of terrestrial ecosystem structureand function to CO2 and climate change: Results from six dynamic globalvegetation models, Global Change Biol., 7, 357 –373, doi:10.1046/j.1365-2486.2001.00383.x.
D’Antonio, C., and M. C. Mack (2006), Nutrient limitation in a fire-derived, nitrogen rich Hawaiian grassland, Biotropica, 38, 458–467,doi:10.1111/j.1744-7429.2006.00170.x.
DeLucia, E. H., D. J. Moore, and R. J. Norby (2005), Contrasting responsesof forest ecosystems to rising atmospheric CO2: Implications for the
GB4027 CHURKINA ET AL.: CO2, N, CARBON UPTAKE AND GLOBAL WARMING
10 of 12
GB4027
global C cycle, Global Biogeochem. Cycles, 19, GB3006, doi:10.1029/2004GB002346.
Dentener, F. J., et al. (2006), Nitrogen and sulfur deposition on regional andglobal scales: A multimodel evaluation, Global Biogeochem. Cycles, 20,GB4003, doi:10.1029/2005GB002672.
Duce, R. A., et al. (2008), Impacts of atmospheric anthropogenic nitrogenon the open ocean, Science, 320, 893 – 897, doi:10.1126/science.1150369.
Elser, J. J., et al. (2007), Global analysis of nitrogen and phosphorus limita-tion of primary producers in freshwater, marine and terrestrial ecosystems,Ecol. Lett., 10, 1135–1142, doi:10.1111/j.1461-0248.2007.01113.x.
Etheridge, D. M., L. P. Steele, R. L. Langenfelds, R. J. Francey, J.-M.Barnola, and V. I. Morgan (1996), Natural and anthropogenic changesin atmospheric CO2 over the last 100 years from air in Antarctic ice andfirn, J. Geophys. Res., 101, 4115–4128, doi:10.1029/95JD03410.
Ewert, F., et al. (2007), Crop models, CO2, and climate change, Science,315, 459–460, doi:10.1126/science.315.5811.459c.
Fanning, K. A. (1989), Influence of atmospheric pollution on nutrient lim-itation in the ocean, Nature, 339, 460–463, doi:10.1038/339460a0.
Finzi, A., R. Sinsabaugh, T. Long, and M. Osgood (2006a), Microbialcommunity responses to atmospheric carbon dioxide enrichment in awarm-temperate forest, Ecosystems, 9, 215–226, doi:10.1007/s10021-005-0078-6.
Finzi, A. C., et al. (2006b), Progressive nitrogen limitation of ecosystemprocesses under elevated CO2 in a warm-temperate forest, Ecology, 87,15–25, doi:10.1890/04-1748.
Finzi, A. C., et al. (2007), Increases in nitrogen uptake rather than nitrogen-use efficiency support higher rates of temperate forest productivity underelevated CO2, Proc. Natl. Acad. Sci. U. S. A., 104, 14,014–14,019,doi:10.1073/pnas.0706518104.
Friedlingstein, P., et al. (2006), Climate-carbon cycle feedback analysis:Results from the C4MIP-model intercomparison, J. Clim., 19, 3337–3353, doi:10.1175/JCLI3800.1.
Galloway, J. N., et al. (2004), Nitrogen cycles: Past, present, and future,Biogeochemistry, 70, 153–226, doi:10.1007/s10533-004-0370-0.
Ganopolski, A., V. Petoukhov, S. Rahmstorf, V. Brovkin, M. Claussen,A. Eliseev, and C. Kubatzki (2001), CLIMBER-2: A climate systemmodel of intermediate complexity. Part II: Model sensitivity, Clim.Dyn., 17, 735–751, doi:10.1007/s003820000144.
Gill, R. A., L. J. Anderson, H. W. Polley, H. B. Johnson, and R. B. Jackson(2006), Potential nitrogen constraints on soils carbon sequestration underlow and elevated atmospheric CO2, Ecology, 87, 41–52, doi:10.1890/04-1696.
Henry, H., N. Chiariello, P. Vitousek, H. Mooney, and C. Field (2006),Interactive effects of fire, elevated carbon dioxide, nitrogen deposition,and precipitation on a California annual grassland, Ecosystems, 9, 1066–1075, doi:10.1007/s10021-005-0077-7.
Holland, E. A., et al. (1997), Variation in the predicted spatial distributionof atmospheric nitrogen deposition and their impact on carbon uptake byterrestrial ecosystems, J. Geophys. Res., 102, 15,849 – 15,866,doi:10.1029/96JD03164.
Hungate, B. A., J. S. Dukes, M. R. Shaw, Y. Luo, and C. B. Field (2003),Nitrogen and climate change, Science, 302, 1512–1513, doi:10.1126/science.1091390.
Hungate, B. A., et al. (2006), Nitrogen cycling during seven years of atmo-spheric CO2 enrichment in a scrub oak woodland, Ecology, 87, 26–40,doi:10.1890/04-1732.
Janssens, I. A., et al. (2003), Europe’s terrestrial biosphere absorbs 7 to 12%of European anthropogenic CO2 emissions, Science, 300, 1538–1542,doi:10.1126/science.1083592.
Johnson, D. W., and S. E. Lindberg (1992), Atmospheric Deposition andForest Nutrient Cycling, 707 pp., Springer, New York.
Jones, C. J., P. M. Cox, R. L. H. Essery, D. L. Roberts, and M. J. Woodage(2003), Strong carbon cycle feedbacks in a climate model with interactiveCO2 and sulphate aerosols, Geophys. Res. Lett., 30(9), 1479,doi:10.1029/2003GL016867.
Jung, M., M. Herold, K. Henkel, and G. Churkina (2006), Exploitingsynergies of land cover products for carbon cycle modelling, RemoteSens. Environ., 101, 534–553, doi:10.1016/j.rse.2006.01.020.
Kalnay, E., et al. (1996), The NCEP/NCAR reanalysis project, Bull. Am.Meteorol. Soc., 77, 437 – 471, doi:10.1175/1520-0477(1996)077<0437:TNYRP>2.0.CO;2.
King, A. W., et al. (Eds.) (2007), The First State of the Carbon CycleReport (SOCCR): The North American Carbon Budget and Implicationsfor the Global Carbon Cycle, 242 pp., U.S. Clim. Change Sci. Program,Washington, D. C.
King, J. S., P. J. Hanson, E. Bernhardt, P. DeAngelis, R. J. Norby, and K. S.Pregitzer (2004), A multiyear synthesis of soil respiration responses to
elevated atmospheric CO2 from four forest FACE experiments, GlobalChange Biol., 10, 1027–1042, doi:10.1111/j.1529-8817.2003.00789.x.
Knap, A. H., T. D. Jickells, A. Pszenny, and J. N. Galloway (1986), Thesignificance of atmospheric derived fixed nitrogen on the productivity ofthe Sargasso Sea, Nature, 320, 158–160, doi:10.1038/320158a0.
Kulkarni, M. V., P. M. Groffman, and J. B. Yavitt (2008), Solving the globalnitrogen problem: It is a gas!, Front. Ecol. Environ, 6, 199 – 206,doi:10.1890/060163.
LeBauer, D. S., and K. K. Treseder (2008), Nitrogen limitation of netprimary productivity in terrestrial ecosystems is globally distributed,Ecology, 89, 371–379, doi:10.1890/06-2057.1.
Likens, G. E., C. T. Driscoll, and D. C. Buso (1996), Long-term effects ofacid rain: Response and recovery of a forest ecosystem, Science, 272,244–246, doi:10.1126/science.272.5259.244.
Lloyd, J. (1999), The CO2 dependence of photosynthesis, plant growthresponses to elevated CO2 concentrations and their interaction with soilnutrient status: II. Temperate and boreal forest productivity and the com-bined effects of increasing CO2 concentrations and increased nitrogendeposition at a global scale, Funct. Ecol., 13, 439–459, doi:10.1046/j.1365-2435.1999.00350.x.
Magnani, F., et al. (2007), The human footprint in the carbon cycle oftemperate and boreal forests, Nature, 447, 849–851.
McLaughlin, J. W., I. J. Fernandez, and K. J. Richards (1996), Atmosphericdeposition to a low-elevation spruce-fir forest, Maine, USA, J. Environ.Qual., 25, 248–259.
Nadelhoffer, K. L., et al. (1999), Nitrogen deposition makes a minor con-tribution to carbon sequestration in temperate forests, Nature, 398, 145–148, doi:10.1038/18205.
Norby, R. J., and C. M. Iversen (2006), Nitrogen uptake, distribution, turn-over, and efficiency of use in a CO2 enriched sweetgum forest, Ecology,87, 5–14, doi:10.1890/04-1950.
Oren, R., et al. (2001), Soil fertility limits carbon sequestration by forestecosystems in a CO2-enriched atmosphere, Nature, 411, 469 –472,doi:10.1038/35078064.
Pepper, D. A., S. J. Del Grosso, R. E. McMurtrie, and W. J. Parton (2005),Simulated carbon sink response of shortgrass steppe, tallgrass prairie andforest ecosystems to rising [CO2], temperature and nitrogen input, GlobalBiogeochem. Cycles, 19, GB1004, doi:10.1029/2004GB002226.
Petoukhov, V., A. Ganopolski, V. Brovkin, M. Claussen, A. Eliseev, C.Kubatzki, and S. Rahmstorf (2000), CLIMBER-2: A climate systemmodel of intermediate complexity. Part I: Model description and perfor-mance for present climate, Clim. Dyn., 16, 1 – 17, doi:10.1007/PL00007919.
Pregitzer, K. S., D. R. Zak, A. J. Burton, J. A. Ashby, and N. W. Macdonald(2004), Chronic nitrate additions dramatically increase the export of car-bon and nitrogen from northern hardwood ecosystems, Biogeochemistry,68, 179–197, doi:10.1023/B:BIOG.0000025737.29546.fd.
Raupach, M. R., G. Marland, P. Ciais, C. Le Quere, J. G. Canadell,G. Klepper, and C. B. Field (2007), Global and regional drivers ofaccelerating CO2 emissions, Proc. Natl. Acad. Sci. U. S. A., 104,10,288–10,293, doi:10.1073/pnas.0700609104.
Reich, P. B., et al. (2006), Nitrogen limitation constrains sustainabilityof ecosystem response to CO2, Nature, 440, 922–925, doi:10.1038/nature04486.
Rodhe, H., F. J. Dentener, and M. Schulz (2002), The global distribution ofacidifying wet deposition, Environ. Sci. Technol., 36, 4382 –4388,doi:10.1021/es020057g.
Running, S. W., and E. R. J. Hunt (1993), Generalization of a forest eco-system process model for other biomes, Biome-BGC, and an applicationfor global-scalemodels, in Scaling Physiological Processes: Leaf toGlobe,edited by J. R. Ehleringer and C. B. Field, pp. 141–158, Academic, SanDiego, Calif.
Solomon, S., et al. (Eds.) (2007), Climate Change 2007: The PhysicalScience Basis. Contribution of Working Group I to the Fourth AssessmentReport of the Intergovernmental Panel on Climate Change, 996 pp.,Cambridge Univ. Press, U. K.
Tanner, E. V. J., P. Vitousek, and E. Cuevas (1998), Experimental investi-gation of nutrient limitation of forest growth on wet tropical mountains,Ecology, 79, 10–22.
Thornton, P. E. (Ed.) (1998), Regional Ecosystem Simulation: CombiningSurface- and Satellite-Based Observations to Study Linkages betweenTerrestrial Energy and Mass Budgets, 280 pp., Univ. of Montana,Missoula.
Thornton, P. E., et al. (2002), Modeling and measuring the effects of dis-turbance history and climate on carbon and water budgets in evergreenneedleleaf forests, Agric. For. Meteorol., 113, 185–222, doi:10.1016/S0168-1923(02)00108-9.
GB4027 CHURKINA ET AL.: CO2, N, CARBON UPTAKE AND GLOBAL WARMING
11 of 12
GB4027

Thornton, P. E., J.-F. Lamarque, N. A. Rosenbloom, and N. M. Mahowald(2007), Fundamental influence of terrestrial carbon-nitrogen cycle cou-pling on modeled CO2 fertilization and climate-carbon cycle dynamics,Global Biogeochem. Cycles, 21, GB4018, doi:10.1029/2006GB002868.
Townsend, A. R., B. H. Braswell, E. A. Holland, and J. E. Penner (1996),Spatial and temporal patterns in terrestrial carbon storage due to deposi-tion of fossil fuel nitrogen, Ecol. Appl., 6, 806 –814, doi:10.2307/2269486.
Trusilova, K., J. Trembath, and G. Churkina (2009), Parameter estimationand validation of the terrestrial ecosystem model BIOME-BGC usingeddy-covariance flux measurements, Tech. Rep. 16, 62 pp., Max-PlanckInst. for Biogeochem., Jena.
Vetter, M., C. Wirth, H. Bottcher, G. Churkina, E. D. Schulze, T. Wutzler,and G. Weber (2005), Partitioning direct and indirect human-inducedeffects on carbon sequestration of managed coniferous forests using mod-el simulations and forest inventories, Global Change Biol., 11, 810–827,doi:10.1111/j.1365-2486.2005.00932.x.
Vitousek, P., L. O. Edin, P. A. Matson, J. H. Fownes, and J. Neff (1998),Within-system element cycles, input-output budgets, and nutrient limita-tions, in Success, Limitations, and Frontiers in Ecosystem Science, editedby M. Pace and P. Groffman, pp. 432–451, Springer, New York.
Vitousek, P., S. Hattenschwiler, L. Olander, and S. Allison (2002), Nitrogenand nature, Ambio, 2, 97–101.
White, M. A., P. E. Thornton, S. W. Running, and R. R. Nemani (2000),Parameterization and sensitivity analysis of the BIOME-BGC terrestrialecosystem model: Net primary production controls, Earth Interact., 4, 1–85, doi:10.1175/1087-3562(2000)004<0003:PASAOT>2.0.CO;2.
Xia, J., and S. Wan (2008), Global response patterns of terrestrial plantspecies to nitrogen addition, New Phytol., 179, 428–439, doi:10.1111/j.1469-8137.2008.02488.x.
�������������������������V. Brovkin and W. von Bloh, Potsdam Institute for Climate Impact
Research, PO Box 60 12 03, D-14412 Potsdam, Germany.G. Churkina, M. Jung, and K. Trusilova, Max Planck Institute for
Biogeochemistry, Hans-Knoll-Str. 10, D-07745 Jena, Germany.F. Dentener, Joint Research Centre, Institute for Environment and
Sustainability, European Commission, Via E. Fermi 2749, I-21027, Ispra,Italy.
GB4027 CHURKINA ET AL.: CO2, N, CARBON UPTAKE AND GLOBAL WARMING
12 of 12
GB4027