Symbiosis Institute of Business Management, Bangalore Macro Economics Assignment 1 -Nandana.N MBA EE...
30
1 Symbiosis Institute of Business Management, Bangalore Macro Economics Assignment 1 -Nandana.N MBA EE Sem II
-
Upload
independent -
Category
Documents
-
view
4 -
download
0
Transcript of Symbiosis Institute of Business Management, Bangalore Macro Economics Assignment 1 -Nandana.N MBA EE...

1
Symbiosis Institute of Business Management, Bangalore
Macro Economics
Assignment 1
-Nandana.N
MBA EE Sem II
2
INDEX
Introduction to GDP,GDP growth rate,
Unemployment Rate,Inflation and Exchange
Rate-Page 3
2. Literature Reviews-Pupose of
study,Methodologies used,Results(GDP and
unemployment rate)-Page 7
3. Literature Reviews-Pupose of study,Methodologies used,Results (Inflation rate and exchange rate)-Page 114. Data analysis, Interpretation and conclusion-Page 165.References-Page 20

3
4
Introduction to GDP,GDP growth rate, Unemployment Rate,Inflation and Exchange Rate
I.GDP- Gross Domestic Product:
In order to analyze the health of an economy or examineeconomic growth, it's necessary to have a way to measure the size of an economy. The gross domestic product (GDP) is one of the primary indicators used to gauge the health of a country's economy. It presents a sum of a country's production which consists of all purchases of goods and services produced by a country and services used by individuals, firms, foreigners andthe governing bodies.
Importance of GDP
GDP consists of consumer spending, Investment expenditure, government spending and net exports hence it portrays an all inclusive picture of an economy because of which it provides an insight to investors which highlights the trend of the economyby comparing GDP levels as an index
GDP is used as an indicator for most governments and economic decision-makers for planning and policy formulation
In case of GDP, each component is given the weight of its relative price. In market economics it clicks as prices reflect both marginal cost of the producer and marginal utility for the consumer,

5
i.e. people sell at a price that others are willingto pay
GDP helps the investors to manage their portfolios by providing them with guidance about the state of the economy
Calculation of GDP provides with the general health of the economy. A negative GDP growth portrays bad signalsfor the economy. Economists analyse GDP to find out whether the economy is in recession, depression or boom.
Gross Domestic Product is good measure for an economy and with improvement in research and quality of data, statisticians and governments are trying to find out measures to strengthen GDP and make it a comprehensive indicator of national income of a country.
GDP Growth rate:
A measure of economic growth from one period to anotherexpressed as a percentage and adjusted for inflation (i.e. expressed in real as opposed to nominal terms). The real economic growth rate is a measure of the rate of change that a nation's gross domestic product (GDP) experiences from one year to another.
II.Unemployment rate:
Unemployment is an important social and economic problem. Getting a precise and internationally
6
comparable assessment of its magnitude is therefore of interest in its own right. The appropriate measure of unemployment is, however, likely to depend on the purpose at hand. Unemployment may be used as an indicator of inflationary pressures in the labour market, as a gauge of social hardship or as a measure of under-utilization of labour.
Who is an “unemployed”?
Those persons ready, desirous and capable of working ina particular capacity to a desired extent, but who are unable to obtain paid employment in such capacity to the desired extent, are unemployed.
Unemployment is a social scourge. It is wasteful and impoverishing and generates discontent, frustration andresentment. Ultimately, if not checked and reversed, itcan lead to the disintegration or destruction of the society itself.
Unemployment Rate:
Unemployment Rate gives us a quick gauge of the health of the labour market. A deeper analysis of the unemployment rate by demographic and socio-economic characteristics, highlight vulnerable groups who might find it harder to secure employment. The number of unemployed persons provides a gauge of the magnitude ofthe problem. Characteristics most often studied includeage and educational attainment.
7
III.Inflation:
Inflation is a term used in economics to measure the increase and decrease in prices. In simpler terms inflation is a decline in the purchasing power of moneyfor goods and services.
Inflation is a consistent increase in the price of goods and services over time. During inflationary times, money loses its "buying" or "purchasing" power, and it takes more units of currency to purchase the same units of goods or services. Over time, inflation lowers the value of each unit of currency..
What inflation means for most people is a higher cost of living.
Economists generally favor a low and steady rate of inflation. The job of keeping inflation under control is assigned to the monetary authorities at the Reserve Bank of India. Increases and decreases to the money supply can be used to regulate the growth of the economy. The levers used to control the money supply include interest rates, buying and selling of government securities and bank reserve requirements.
Inflation Rate:
8
The rate of change of price of goods and services, overa period of time (usually annually) is defined as the inflation rate.
A measure of how fast a currency loses its value. That is, the inflation rate measures how fast prices for goods and services rise over time, or how much less oneunit of currency buys now compared to one unit of currency at a given time in the past. The inflation rate may increase due to massive printing of money, which increases supply in the economy and thus reduces demand. Equally, it may occur because certain important commodities become rarer and thus more expensive.
IV.Exchange rate:
The price of one country's currency expressed in another country's currency.
It is the value of two currencies relative to each other. The exchange rate is used when simply convertingone currency to another (such as for the purposes of travel to another country), or for engaging in speculation or trading in the foreign exchange market. There are a wide variety of factors which influence the exchange rate, such as interest rates,inflation, and the state of politics and the economy in each country. It is also called rate of exchange or foreign exchange rate or currency exchange

9
rate. Although some exchange rates are fixed by agreement, most fluctuate or float from day to day.
10
Literature Reviews-Pupose of study,Methodologies used,Results(GDP and unemployment rate)
1.http://www.bjournal.co.uk/paper/BJASS_14_2/
BJASS_14_02_02.pdf
Relationship among GDP, Per Capita GDP, Literacy
Rate and Unemployment Rate – by M. Shafiqur Rahman
Objective of study:
This paper investigates the relationship among
GDP, literacy rate and unemployment rate.It
analyses the GDP, per capita GDP data, literacy
rate and unemployment rate of Arab league
countries, and OECD countries to test whether
there exist any relationship between these
variables. This paper also finds out the strategy
that a country should take for it’s development.
Methodology used for the research:
In order to study the relationship among GDP,
PGDP, literacy rate and unemployment rate, the
Pearson’s Product moment correlation coefficient
is first calculated for all the variables.The
11
correlation coefficient r is calculated.The
Spearman’s rank correlation is also used to
calculate the relationship between the variables.
Finding:
Using scatter diagrams, the final conclusion was
drawn in this paper that there exists a
significant negative relationship between GDP and
Unemployment Rate. Increasing Literacy Rate will
reduce Unemployment Rate and increase
PGDP ,resulting in the development of the
country.
2.http://www.ersj.eu/repec/ers/papers/08_4_p10.pdf
Particularities of the Correlation Between the Unemployment
Rate
and the GDP in the Dynamics of the Romanian Economy- By
Dorel Savulea
Objective of study:
12
This paper tries to outline some aspects of the
interdependency between
the unemployment rate and the GDP rhythm under
the specific circumstances of the Romanian
economy in the pre-accession period to the EU.It
shows that the reversed connection between the
two macroeconomic variables cannot be applied for
Romania in the analyzed period. These situations
are also proved and the end of the paper presents
the way of using the results obtained for the
preparation of
predictions.
Methodology used for the research:
In order to study the relationship among GDP and
unemployment rate , this paper uses two methods.
The version of the level of the gross domestic
product (LGDP) and the version of the growth rate
(GR).
The basic idea underlined by LGDP is that when
the output is under the
level of the total employment, the unemployment
rate will exceed the natural rate.
13
The version of the growth rate (GR) underlines
the fact that when the
output grown in a more slowly way than the full
employment output, the unemployment will grow
because the use of the production factors
decreases.
Finding:
Using regression and correlation analysis,in the
Romanian economy from the period 2000-2006,the
research pointed out, that the Okun’s law is
only valid to a small extent. This situation is
argued through the fact that the growth rate of
the GDP only partly explains the evolution of the
unemployment rate; the correlation coefficient
has a quite small value.
3.http://www.idosi.org/wasj/wasj12(BES)11/10.pdf
Analysis of correlation between inflation rate and employment
rate with Gross Domestic Product- World Applied science
journals
Objective of study:
14
This paper tries to study the correlation between
GDP and unemployment rate.The variables were
selected based on relevant economic theories that
allow such interactions between the variables.The
study was done using multivariate time series
analysis available in STATA software.The
researcher can discern the movement of variables
clearly using time series data.
.
Methodology used for the research:
In order to study the relationship among GDP and
unemployment rate , this paper uses time series
data ranging from 1982 to 2006 and the scope is
in Malaysia. STATA software was used to process
the data using the log log model in this study.
Unit Root test, Co Integration test and Trace
test ,Maximal Eigenvalue test, VECM test, granger
causality test were performed in order to reach
conclusive results.
Finding:
Using the above test, the paper concludes that
the inflation rate and employment rate influence
15
the GDP rate in the short run.But GDP is unable
to affect either of the other two independent
variables.It concludes that there is a negative
relationship between GDP and employment rate in
the log run.
16
Literature Reviews-Pupose of study,Methodologies used,Results (Inflation rate and exchange rate):
1.http://www.m-hikari.com/ams/ams-2012/ams-29-32-
2012/sekAMS29-32-2012.pdf
Investigating the Relationship between Exchange Rate and
Inflation- Siok Kun Sek:
Objective of study:
This paper conducts empirical investigation on
the relationship between exchange rate and
inflation targeting regime in the three developed
and three emerging Asian economies that have
adopted inflation targeting (IT) regime. Using a
multivariate GARCH model under BEKK
specification, we investigate if exchange rate
affect the performance of IT and the performance
of IT is compared between Asian and European
economies. The comparison is made in terms of
changes in economic structure and the
disinflation cost.
Methodology used for the research:

17
For the purpose of analysis, a multivariate GARCH
(1,1) model with BEKK specification is applied.
The BEKK model is used to investigate: (1) the
correlations between the three variables i.e.
exchange rate, industrial production index and
inflation rate; (2) the impact of shock for past
value; and (3) the persistency of the three
variables to economy
Finding:
The results show significant correlation between
exchange rate movements and inflation and output
movements in both sub-periods. IT also has
significant impacts on the movements of
inflation, output and exchange rate. IT is
associated with higher volatility in exchange
rate movement in majority economies. Comparing
the performance of IT across economies, we
observe that the volatility in exchange rate has
increased dramatically and it is very volatile in
emerging Asia compare to the developed economies.
The decline in inflation impulse is larger in
emerging Asia than in developed economies. The
implementation of IT does not lead to the trade-

18
off of inflation-output in Asia but the trade-off
relationship is detected in developed economies.
We can say that IT has
effectively in lowered the inflation rate and
boost up the emerging economies in Asia compared
to the developed economies.
2.http://www.bapress.ca/Journal-2/Exchange%20Rates
%20and%20Inflation%20Rates-Exploring%20Nonlinear
%20Relationships.pdf
Exchange Rates and Inflation Rates: Exploring Nonlinear
Relationships- by Bahram Adrangi and Mary E. Allender
Objective of study:
This paper investigates the Purchasing Power
Parity Theory (PPP) in the context of possible
nonlinear relationships between prices and
exchange rates of three key currencies. The main
contribution of this paper is testing for
nonlinearities and nonlinear relationships in a
framework of information arrival.

19
Methodology used for the research:
This paper starts out by analyzing exchange rates
and inflation rates for stationarity, non-
linearities, and ARCH effects based on commonly
know statistics. To rule in or out the existence
of chaotic behavior, the researchers have applied
the Brock, Dechert, and Scheinkman test (BDS) and
Correlation Dimension tests of chaos to each
series. There is also application of
autoregressive models for the exchange rates and
inflation rates, along with bivariate GARCH
models of variances for the three exchange rate
and inflation rate series that show evidence that
volatility spillovers occur across prices and
exchange rates.
Finding:
The results show strong evidence that the
exchange series exhibit nonlinear dependencies.
However, there is evidence that the series
behavior may be inconsistent with chaotic
20
structure. The GARCH process best explains the
nonlinearities in the monthly exchange rates and
inflation rates. Therefore, the paper concludes
with the proposal of use of the bivariate GARCH
models of the variances to ascertain the flow of
information between exchange rates and prices.
Estimation results of the bivariate GARCH models
offer evidence that the shock transmission
between domestic prices and exchange rates occur
in both directions.
3.http://www.ijcb.org/journal/ijcb06q4a6.pdf
The Impact of Monetary Policy on
the Exchange Rate- by Jonathan Kearns and Phil Manners
Objective of study:
21
The paper investigates the impact of monetary
policy on the exchange rate using an event study
with intraday data for four countries. It also
shows that the impact depends on how the surprise
affects expectations of future monetary policy.
If expectations of future policy are revised by
the full amount of the surprise, then the impact
on the exchange rate is larger (0.4 percent) than
if the surprise only brings forward an
anticipated change in policy.
Methodology used for the research:
This paper uses use an event-study approach,
estimating the change in the exchange rate around
the announcement of monetary policy decisions.
Decisions include both announced changes to
monetary policy and announcements of decisions to
not change policy, so long as the market knew for
certain that a policy announcement would take
place. For each of the events, we measure the
movement in the exchange
rate around the event using intraday data. A
short seventy minute
22
event window is used. This reduces the amount of
information
received by the market in the event window,
reducing the number
of events that would have to be discarded due to
the exchange
rate and interest rate jointly responding to
other news, such as a
macroeconomic data release. Because the interest
rate surprise will
be a more-dominant piece of information in a
short event window,
it should also result in more-accurate estimates
Finding:
This paper uses an event study to isolate the
impact of changes
in monetary policy on the exchange rate. The
impact of monetary policy changes on the exchange
rate is found to occur virtually instantaneously.
If we use an event window that ends well after
the monetary policy decision, the estimates do
not change, indicating that the news is rapidly
incorporated into exchange rates, although the
23
standard errors widen. Despite using a narrow
event window in which no other identifiable
events occurred, the monetary shock explains only
10–20 percent of the variation in the exchange
rate in that short window. In general, the
results
suggest that monetary policy can account for only
a small part of the observed volatility in the
exchange rate. The small proportion explained by
such high-profile news indicates that there is
still much to learn in explaining exchange rate
movements.
24
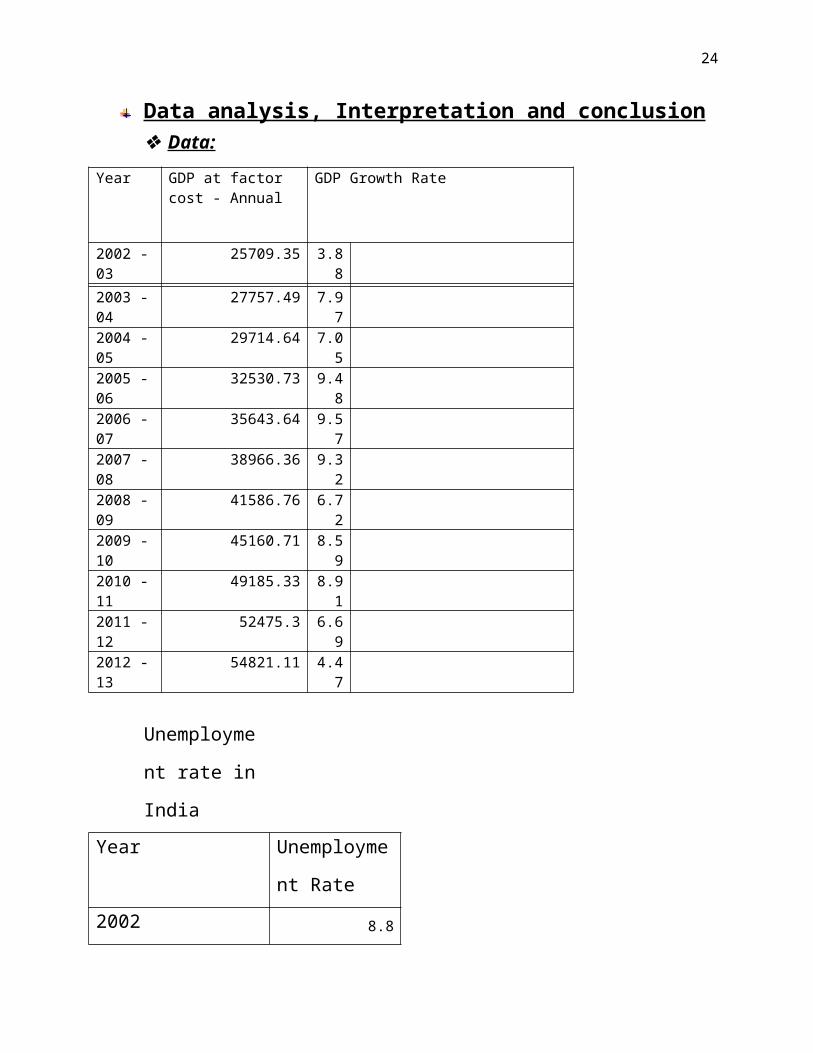
Data analysis, Interpretation and conclusion Data:
Year GDP at factor cost - Annual
GDP Growth Rate
2002 -03
25709.35 3.88
2003 -04
27757.49 7.97
2004 -05
29714.64 7.05
2005 -06
32530.73 9.48
2006 -07
35643.64 9.57
2007 -08
38966.36 9.32
2008 -09
41586.76 6.72
2009 -10
45160.71 8.59
2010 -11
49185.33 8.91
2011 -12
52475.3 6.69
2012 -13
54821.11 4.47
Unemployme
nt rate in
IndiaYear Unemployme
nt Rate2002 8.8
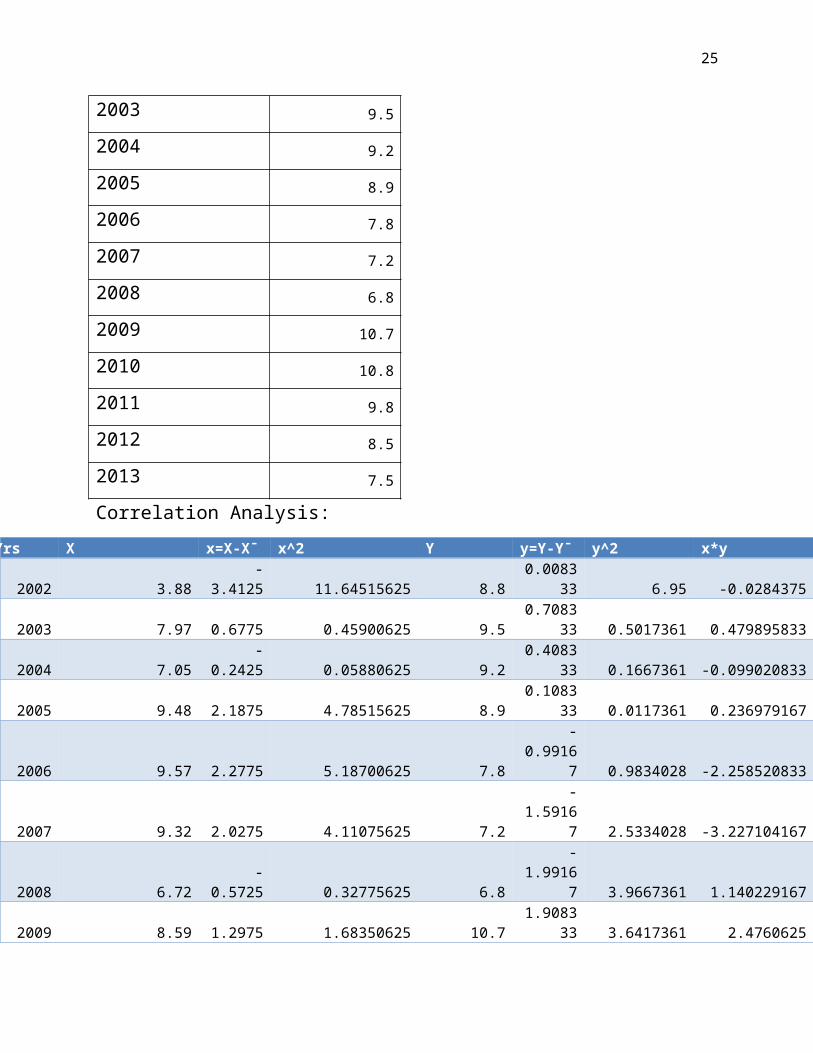
25
2003 9.5
2004 9.2
2005 8.9
2006 7.8
2007 7.2
2008 6.8
2009 10.7
2010 10.8
2011 9.8
2012 8.5
2013 7.5
Correlation Analysis:Yrs X x=X-X¯ x^2 Y y=Y-Y¯ y^2 x*y
2002 3.88-
3.4125 11.64515625 8.80.0083
33 6.95 -0.0284375
2003 7.97 0.6775 0.45900625 9.50.7083
33 0.5017361 0.479895833
2004 7.05-
0.2425 0.05880625 9.20.4083
33 0.1667361 -0.099020833
2005 9.48 2.1875 4.78515625 8.90.1083
33 0.0117361 0.236979167
2006 9.57 2.2775 5.18700625 7.8
-0.9916
7 0.9834028 -2.258520833
2007 9.32 2.0275 4.11075625 7.2
-1.5916
7 2.5334028 -3.227104167
2008 6.72-
0.5725 0.32775625 6.8
-1.9916
7 3.9667361 1.140229167
2009 8.59 1.2975 1.68350625 10.71.9083
33 3.6417361 2.4760625
26
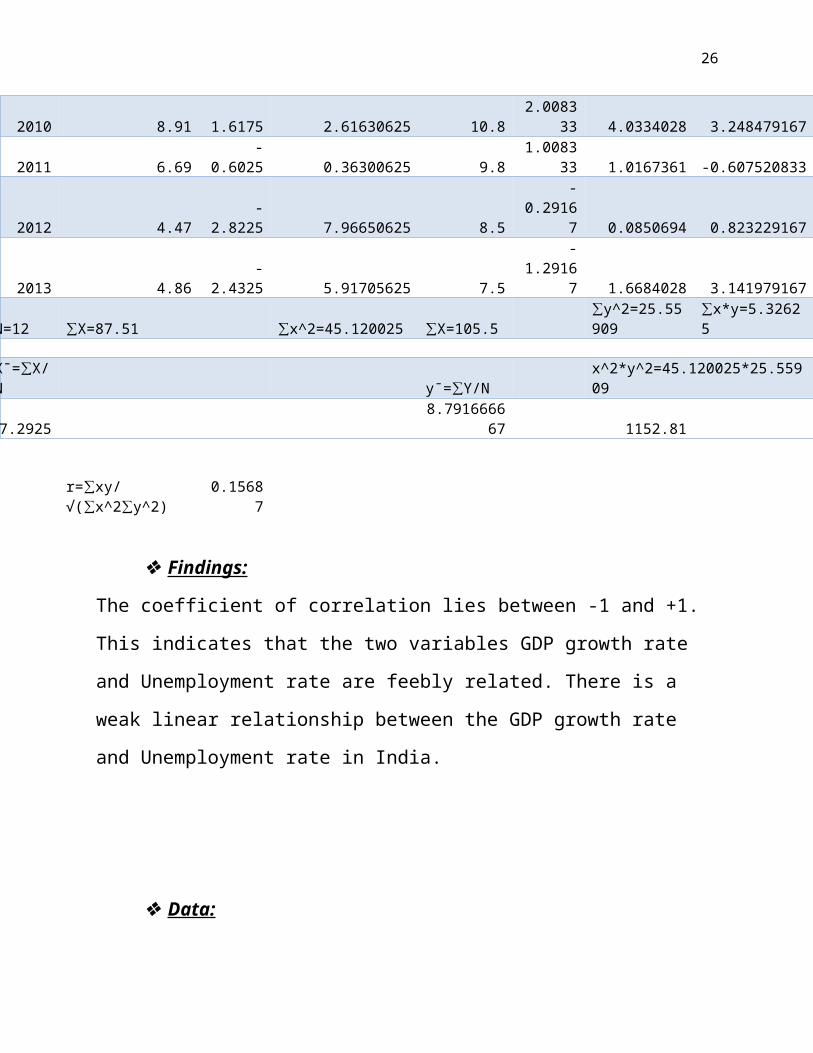
2010 8.91 1.6175 2.61630625 10.82.0083
33 4.0334028 3.248479167
2011 6.69-
0.6025 0.36300625 9.81.0083
33 1.0167361 -0.607520833
2012 4.47-
2.8225 7.96650625 8.5
-0.2916
7 0.0850694 0.823229167
2013 4.86-
2.4325 5.91705625 7.5
-1.2916
7 1.6684028 3.141979167
N=12 ∑X=87.51 x^2=45.120025∑ X=105.5∑y^2=25.55∑
909x*y=5.3262∑
5
X¯= X/∑N y¯= Y/N∑
x^2*y^2=45.120025*25.55909
7.29258.7916666
67 1152.81
r= xy/∑√( x^2 y^2)∑ ∑
0.15687
Findings:
The coefficient of correlation lies between -1 and +1.
This indicates that the two variables GDP growth rate
and Unemployment rate are feebly related. There is a
weak linear relationship between the GDP growth rate
and Unemployment rate in India.
Data:
27
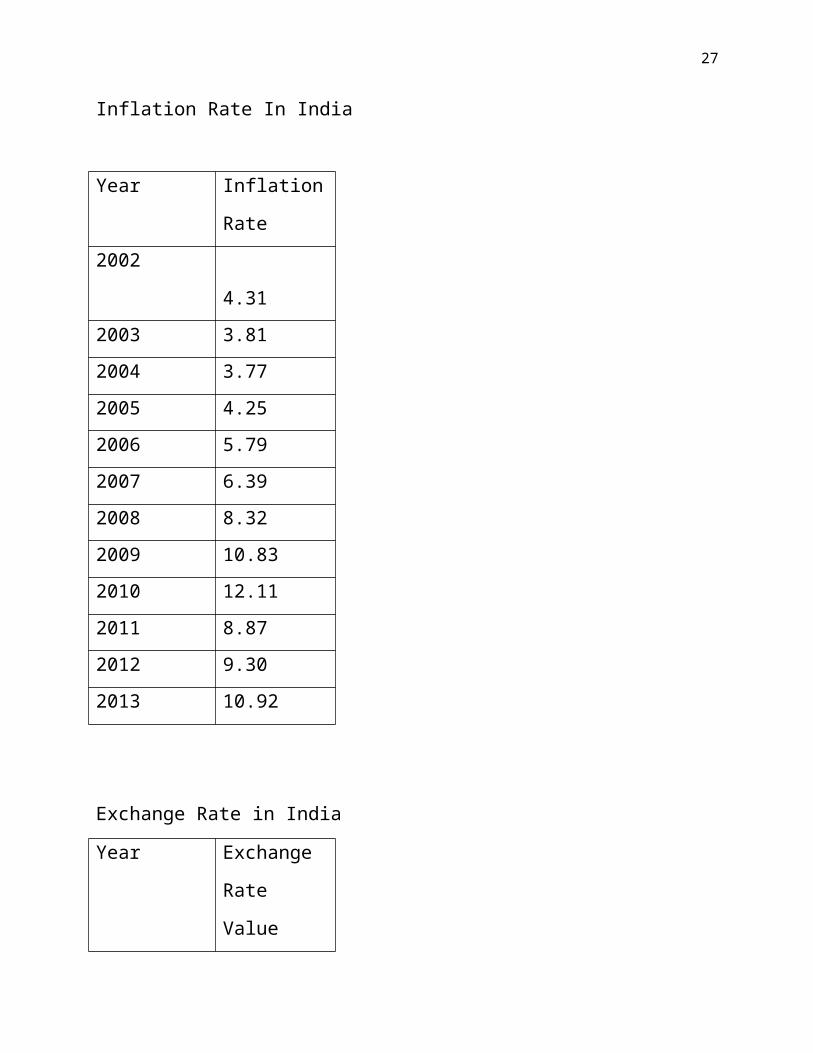
Inflation Rate In India
Year Inflation
Rate2002
4.312003 3.812004 3.772005 4.252006 5.792007 6.392008 8.322009 10.832010 12.112011 8.872012 9.302013 10.92
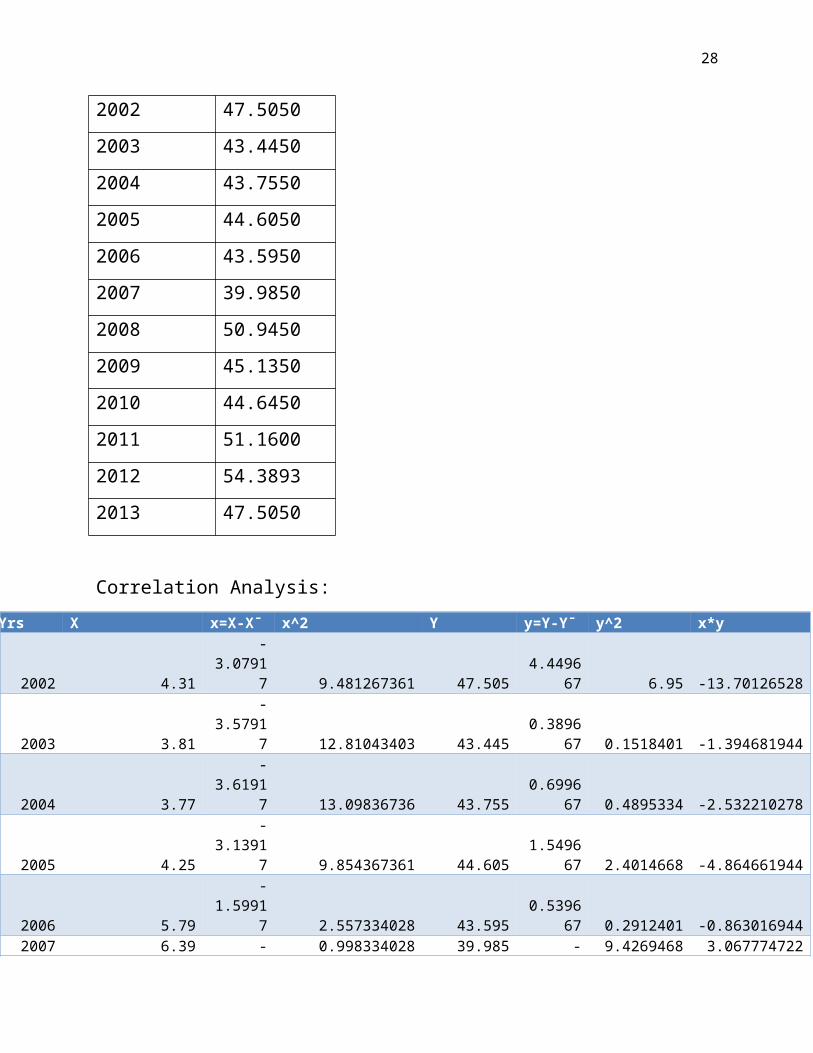
Exchange Rate in India
Year Exchange
Rate
Value
28
2002 47.50502003 43.44502004 43.75502005 44.60502006 43.59502007 39.98502008 50.94502009 45.13502010 44.64502011 51.16002012 54.38932013 47.5050
Correlation Analysis:Yrs X x=X-X¯ x^2 Y y=Y-Y¯ y^2 x*y
2002 4.31
-3.0791
7 9.481267361 47.5054.4496
67 6.95 -13.70126528
2003 3.81
-3.5791
7 12.81043403 43.4450.3896
67 0.1518401 -1.394681944
2004 3.77
-3.6191
7 13.09836736 43.7550.6996
67 0.4895334 -2.532210278
2005 4.25
-3.1391
7 9.854367361 44.6051.5496
67 2.4014668 -4.864661944
2006 5.79
-1.5991
7 2.557334028 43.5950.5396
67 0.2912401 -0.8630169442007 6.39 - 0.998334028 39.985 - 9.4269468 3.067774722
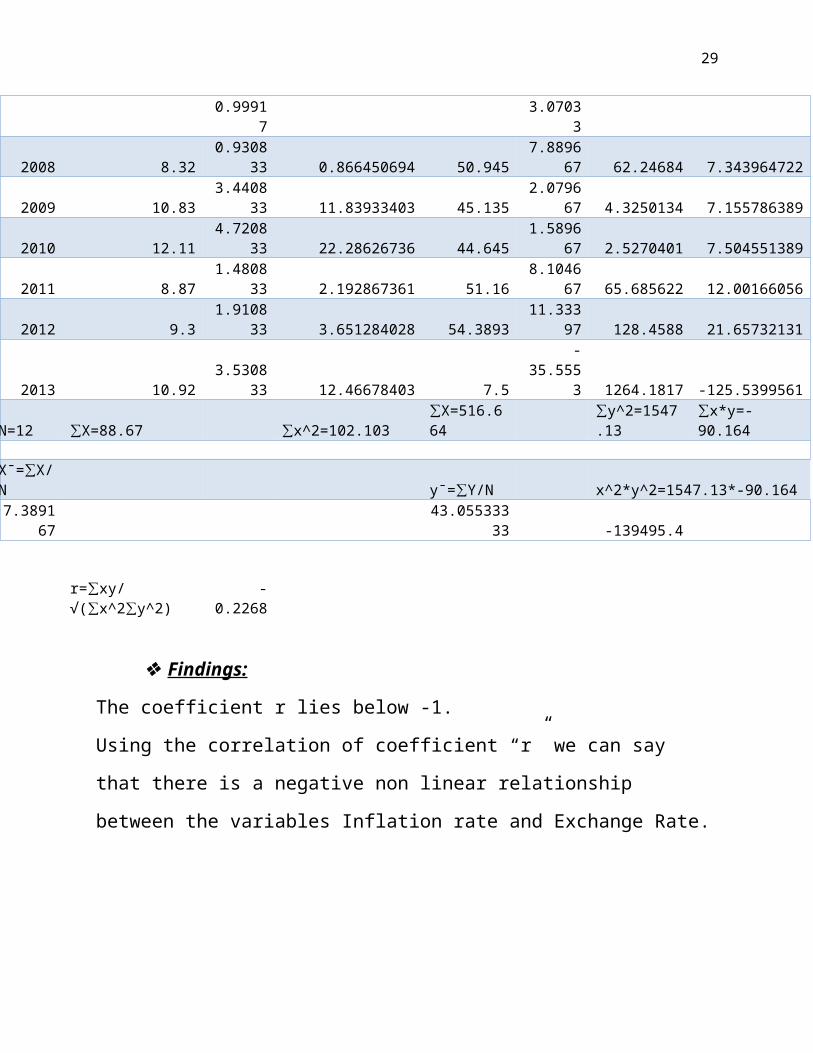
29
0.99917
3.07033
2008 8.320.9308
33 0.866450694 50.9457.8896
67 62.24684 7.343964722
2009 10.833.4408
33 11.83933403 45.1352.0796
67 4.3250134 7.155786389
2010 12.114.7208
33 22.28626736 44.6451.5896
67 2.5270401 7.504551389
2011 8.871.4808
33 2.192867361 51.168.1046
67 65.685622 12.00166056
2012 9.31.9108
33 3.651284028 54.389311.333
97 128.4588 21.65732131
2013 10.923.5308
33 12.46678403 7.5
-35.555
3 1264.1817 -125.5399561
N=12 ∑X=88.67 x^2=102.103∑X=516.6∑
64y^2=1547∑
.13x*y=-∑
90.164
X¯= X/∑N y¯= Y/N∑ x^2*y^2=1547.13*-90.1647.3891
6743.055333
33 -139495.4
r= xy/∑√( x^2 y^2)∑ ∑
-0.2268
Findings:
The coefficient r lies below -1.
Using the correlation of coefficient “r” we can say
that there is a negative non linear relationship
between the variables Inflation rate and Exchange Rate.
30
References : Investopedia
Wikipedia
RBI
CSO
Indexmundi.com
www.inflation.eu/inflation-rates/india/historic-inflation/cpi-inflation-india.aspx