Swedish School Leavers' Oral Proficiency in English - DiVA ...
324
ACTA UNIVERSITATIS UPSALIENSIS Studia Anglistica Upsaliensia 123 Editores Rolf Lundén, Merja Kytö & Monica Correa Fryckstedt
-
Upload
khangminh22 -
Category
Documents
-
view
2 -
download
0
Transcript of Swedish School Leavers' Oral Proficiency in English - DiVA ...

ACTA UNIVERSITATIS UPSALIENSIS
Studia Anglistica Upsaliensia
123
Editores
Rolf Lundén, Merja Kytö & Monica Correa Fryckstedt


Stellan Sundh
Swedish School Leavers’ Oral Proficiency in English
Grading of Production and Analysis of Performance

Dissertation for the degree of Doctor of Philosophy in English presentedat Uppsala University in 2003
ABSTRACT
Sundh, S. 2003. Swedish School Leavers’ Oral Proficiency in English. Grading of Pro-duction and Analysis of Performance. Acta Universitatis Upsaliensis.
Studia AnglisticaUpsaliensia
123. 320 pp. Uppsala. ISBN 91-554-5681-2.
This study deals with the testing and grading of Swedish school-leaving students’ oralproficiency in English, and with certain aspects of these students’ linguistic competence.The analyses and results are based on material drawn from an assessment project carriedout at Gothenburg University in 1993.
The 29 students taking part in the project were interviewed three times by three differ-ent interviewers in tests comprising three tasks, similar in structure but different in con-tent. The interviewers were of three categories: school teachers of English, universityteachers of English and native speakers of English. The student production was gradedon a five-point scale according to a set of rating criteria.
The interviewers assigned generally positive but often differing grades to the studentperformance. The grades were influenced by the students’ ability to communicate andspeak with flow, and by gaps in vocabulary and by occurrences of grammatical errors.The students’ use of discourse phenomena and compensatory strategies was also of im-portance to the grades assigned. Many students were considered to have acceptable into-nation and rhythm, but nevertheless an evident Swedish accent. The linguistic featuresstudied comprised the verbal group, vocabulary, discourse markers and pronunciation.
Differences could be observed between the members of the interviewer categoriesregarding the grades they assigned to student production. The school teachers seem tohave paid special attention to grammatical accuracy, and the native speakers appear tohave had a notion of communicative competence where accuracy plays a less importantrole.
Differences in the grades assigned could also be explained by the order in which theinterviews were made, by some students’ hesitant delivery, by the positive or negativeeffect of various fillers in the students’ speech, and by the interviewing methods used bythe interviewers in the tests.
Stellan Sundh, Department of English, Uppsala University, Box 527, 751 20 Uppsala,Sweden
© Stellan Sundh 2003
ISSN 0562-2719ISBN 91-554-5681-2
Typesetting: Uppsala University, Editorial OfficePrinted in Sweden by Elanders Gotab, Stockholm 2003Distributor: Uppsala University Library, Box 510, SE-751 20 Uppsala, Swedenwww.uu.se, [email protected]

5
List of Tables and Figures . . . . . . . . . . . . . . . . . . . . . . . . . . . . . . . . . . . 11Tables. . . . . . . . . . . . . . . . . . . . . . . . . . . . . . . . . . . . . . . . . . . . . . . . . 11Figures . . . . . . . . . . . . . . . . . . . . . . . . . . . . . . . . . . . . . . . . . . . . . . . . 14
Preface . . . . . . . . . . . . . . . . . . . . . . . . . . . . . . . . . . . . . . . . . . . . . . . . . . 15
Introduction . . . . . . . . . . . . . . . . . . . . . . . . . . . . . . . . . . . . . . . . . . . . . . 171. Preliminary Remarks . . . . . . . . . . . . . . . . . . . . . . . . . . . . . . . . . . . 172. The Background to the Gothenburg Project . . . . . . . . . . . . . . . . . 183. The Gothenburg Project . . . . . . . . . . . . . . . . . . . . . . . . . . . . . . . . . 214. The Organisation of the Study . . . . . . . . . . . . . . . . . . . . . . . . . . . . 22
Part 1: Testing Oral Proficiency
CHAPTER 1: Historical Background and Previous Research . . . . . . . 271.1. Measuring Student Performance. . . . . . . . . . . . . . . . . . . . . . . . . 271.2. Oral Proficiency Testing . . . . . . . . . . . . . . . . . . . . . . . . . . . . . . . 381.3. Linguistic Analyses of Students’ Proficiency. . . . . . . . . . . . . . . 44
CHAPTER 2: Methodological Considerations . . . . . . . . . . . . . . . . . . . 572.1. Introduction. . . . . . . . . . . . . . . . . . . . . . . . . . . . . . . . . . . . . . . . . 572.2. Oral Proficiency . . . . . . . . . . . . . . . . . . . . . . . . . . . . . . . . . . . . . 572.3. Reliability . . . . . . . . . . . . . . . . . . . . . . . . . . . . . . . . . . . . . . . . . . 612.4. Validity . . . . . . . . . . . . . . . . . . . . . . . . . . . . . . . . . . . . . . . . . . . . 632.5. Acceptability and Intelligibility . . . . . . . . . . . . . . . . . . . . . . . . . 652.6. Concluding Remarks. . . . . . . . . . . . . . . . . . . . . . . . . . . . . . . . . . 67
CHAPTER 3: Formats: Tasks and Organisation . . . . . . . . . . . . . . . . . . 683.1. The Oral Test: Definition . . . . . . . . . . . . . . . . . . . . . . . . . . . . . . 683.2. Three International Oral Tests: Descriptions and Comparisons . 693.3. Discussion . . . . . . . . . . . . . . . . . . . . . . . . . . . . . . . . . . . . . . . . . . 71
Contents

6
Part 2: The Aims of the Study and Hypotheses to Be Tested
CHAPTER 4: The Aims and Hypotheses of the Study . . . . . . . . . . . . . 754.1. Aims . . . . . . . . . . . . . . . . . . . . . . . . . . . . . . . . . . . . . . . . . . . . . . 754.2. Hypotheses . . . . . . . . . . . . . . . . . . . . . . . . . . . . . . . . . . . . . . . . . 76
Part 3: Grading Students’ Oral Performance and Analysing Their Competence
CHAPTER 5: Grading Student Performance . . . . . . . . . . . . . . . . . . . . 815.1. Principles in the Assessment . . . . . . . . . . . . . . . . . . . . . . . . . . . 815.2. Global and Factorial Grades . . . . . . . . . . . . . . . . . . . . . . . . . . . . 825.3. Sources of Variation . . . . . . . . . . . . . . . . . . . . . . . . . . . . . . . . . . 83
CHAPTER 6: Analysing the Students’ Linguistic and Strategic Competence . . . . . . . . . . . . . . . . . . . . . . . . . . . . . . . . . . . . . . . . . . . . . . 86
6.1. Criteria and Principles . . . . . . . . . . . . . . . . . . . . . . . . . . . . . . . . 866.2. Linguistic Features . . . . . . . . . . . . . . . . . . . . . . . . . . . . . . . . . . . 896.3. Classifying Student Performance into Test Rating Categories. . 926.4. Issues to Take into Account: The Amount of Student Speech,
the Length of the Oral Tests and the Correlation Coefficients . . . 936.5. Defining Standard English and Non-standard Instances . . . . . . 946.6. Sources of Error in the Linguistic Analysis . . . . . . . . . . . . . . . . 94
Part 4: The Practical Organisation of the Testing Session
CHAPTER 7: Selecting, Testing and Assessing: Organising the Testing and Collecting the Material . . . . . . . . . . . . . . . . . . . . . . . . . . . 99
7.1. The Material of the Gothenburg Project . . . . . . . . . . . . . . . . . . . 997.2. Students. . . . . . . . . . . . . . . . . . . . . . . . . . . . . . . . . . . . . . . . . . . . 1017.3. Interviewers . . . . . . . . . . . . . . . . . . . . . . . . . . . . . . . . . . . . . . . . 1037.4. Tasks . . . . . . . . . . . . . . . . . . . . . . . . . . . . . . . . . . . . . . . . . . . . . . 1057.5. Rating Criteria . . . . . . . . . . . . . . . . . . . . . . . . . . . . . . . . . . . . . . 1077.6. The Organisation of the Testing Session . . . . . . . . . . . . . . . . . . 1107.7. Summary. . . . . . . . . . . . . . . . . . . . . . . . . . . . . . . . . . . . . . . . . . . 112
Part 5: The Results of the Project
CHAPTER 8: Grades Awarded to the Students’ Oral Proficiency . . . . 1158.1. Global Performance Grades . . . . . . . . . . . . . . . . . . . . . . . . . . . . 1168.2. Communication and Fluency Grades . . . . . . . . . . . . . . . . . . . . . 1188.3. Grammar and Vocabulary Grades . . . . . . . . . . . . . . . . . . . . . . . 121

7
8.4. Pronunciation Grades . . . . . . . . . . . . . . . . . . . . . . . . . . . . . . . . . 1248.5. Comparative Discussion of the Four Grades Given . . . . . . . . . . 1268.6. Grades Assigned to the Individual Students . . . . . . . . . . . . . . . . 1308.7. Grades in Relation to the Length and Order of the Interviews . . 1328.8. Grades in Relation to Background Variables . . . . . . . . . . . . . . . 1358.9. Students’ Opinions about the Tests. . . . . . . . . . . . . . . . . . . . . . . 1398.10. Summary . . . . . . . . . . . . . . . . . . . . . . . . . . . . . . . . . . . . . . . . . . 140
CHAPTER 9: The Individual Linguistic Features Included in the Analysis: An Introduction . . . . . . . . . . . . . . . . . . . . . . . . . . . . . . . . 142
9.1. Verbal Group . . . . . . . . . . . . . . . . . . . . . . . . . . . . . . . . . . . . . . . 1429.1.1. The Third Person Singular Marker . . . . . . . . . . . . . . . . . . . 1439.1.2. The Progressive . . . . . . . . . . . . . . . . . . . . . . . . . . . . . . . . . . 144
9.2. Vocabulary . . . . . . . . . . . . . . . . . . . . . . . . . . . . . . . . . . . . . . . . . 1479.2.1. Abstract Nouns. . . . . . . . . . . . . . . . . . . . . . . . . . . . . . . . . . . 1489.2.2. Modifiers of Adjectives . . . . . . . . . . . . . . . . . . . . . . . . . . . . 1509.2.3. Students’ Lexical Errors and Compensatory Strategies. . . . 151
9.3. Discourse Markers . . . . . . . . . . . . . . . . . . . . . . . . . . . . . . . . . . . 1579.3.1.
Well
... . . . . . . . . . . . . . . . . . . . . . . . . . . . . . . . . . . . . . . . . . . 1589.3.2.
You know
... . . . . . . . . . . . . . . . . . . . . . . . . . . . . . . . . . . . . . 1629.4. Aspects of Pronunciation . . . . . . . . . . . . . . . . . . . . . . . . . . . . . . 165
9.4.1. Intonation . . . . . . . . . . . . . . . . . . . . . . . . . . . . . . . . . . . . . . . 1659.4.2. Stress . . . . . . . . . . . . . . . . . . . . . . . . . . . . . . . . . . . . . . . . . . 1669.4.3. Speech Rate . . . . . . . . . . . . . . . . . . . . . . . . . . . . . . . . . . . . . 167
CHAPTER 10: Verbal Group . . . . . . . . . . . . . . . . . . . . . . . . . . . . . . . . 16810.1. The Third Person Singular Marker . . . . . . . . . . . . . . . . . . . . . . 168
10.1.1. Overall Distribution . . . . . . . . . . . . . . . . . . . . . . . . . . . . . . 16810.1.2. The Occurrence of the Third Person Singular Marker
in Individual Students’ Production . . . . . . . . . . . . . . . . . . . . . . 16910.1.3. Linguistic Factors. . . . . . . . . . . . . . . . . . . . . . . . . . . . . . . . 17010.1.4. Occurrences of the Third Person Singular Marker
in Relation to Interviewer Categories, Tasks and Background Variables . . . . . . . . . . . . . . . . . . . . . . . . . . . . . . . . 172
10.1.5. Summary . . . . . . . . . . . . . . . . . . . . . . . . . . . . . . . . . . . . . . 17510.2. The Progressive. . . . . . . . . . . . . . . . . . . . . . . . . . . . . . . . . . . . . 175
10.2.1. Overall Distribution . . . . . . . . . . . . . . . . . . . . . . . . . . . . . . 17510.2.2. Linguistic Factors. . . . . . . . . . . . . . . . . . . . . . . . . . . . . . . . 17710.2.3. The Occurrence of the Progressive in Individual Students’
Production . . . . . . . . . . . . . . . . . . . . . . . . . . . . . . . . . . . . . . . . . 17910.2.4. Occurrences of the Progressive in Relation to
Interviewer Categories, Tasks and Background Variables . . . . 18010.2.5. Summary . . . . . . . . . . . . . . . . . . . . . . . . . . . . . . . . . . . . . . 182

8
CHAPTER 11: Vocabulary . . . . . . . . . . . . . . . . . . . . . . . . . . . . . . . . . . 18411.1. Abstract Nouns . . . . . . . . . . . . . . . . . . . . . . . . . . . . . . . . . . . . . 184
11.1.1. Overall Distribution . . . . . . . . . . . . . . . . . . . . . . . . . . . . . . 18411.1.2. Linguistic Factors . . . . . . . . . . . . . . . . . . . . . . . . . . . . . . . 18611.1.3. Occurrences of Abstract Nouns in Relation to
Interviewer Categories, Tasks and Background Variables . . . . 19111.1.4. Summary . . . . . . . . . . . . . . . . . . . . . . . . . . . . . . . . . . . . . . 193
11.2. Modifiers of Adjectives . . . . . . . . . . . . . . . . . . . . . . . . . . . . . . 19411.2.1. Overall Distribution . . . . . . . . . . . . . . . . . . . . . . . . . . . . . . 19411.2.2. The Types of Modifier. . . . . . . . . . . . . . . . . . . . . . . . . . . . 19611.2.3. Occurrences of Modifiers of Adjectives in Relation
to Interviewer Categories and Background Variables . . . . . . . . 19711.2.4. Summary . . . . . . . . . . . . . . . . . . . . . . . . . . . . . . . . . . . . . . 199
11.3. Students’ Lexical Errors and Compensatory Strategies . . . . . . 19911.3.1. Occurrences of Lexical Errors . . . . . . . . . . . . . . . . . . . . . . 19911.3.2. Students’ Compensatory Strategies . . . . . . . . . . . . . . . . . . 20111.3.3. Summary . . . . . . . . . . . . . . . . . . . . . . . . . . . . . . . . . . . . . . 204
CHAPTER 12: Discourse Markers . . . . . . . . . . . . . . . . . . . . . . . . . . . . 20512.1.
Well
... . . . . . . . . . . . . . . . . . . . . . . . . . . . . . . . . . . . . . . . . . . . . 20512.1.1. Overall Distribution . . . . . . . . . . . . . . . . . . . . . . . . . . . . . . 20512.1.2. Discoursal Factors . . . . . . . . . . . . . . . . . . . . . . . . . . . . . . . 20612.1.3. Occurrences of
well
in Relation to Interviewer Categories, Tasks and Background Variables . . . . . . . . . . . . . . 207
12.1.4. Summary . . . . . . . . . . . . . . . . . . . . . . . . . . . . . . . . . . . . . . 21012.2.
You know
... . . . . . . . . . . . . . . . . . . . . . . . . . . . . . . . . . . . . . . . . 21112.2.1. Overall Distribution . . . . . . . . . . . . . . . . . . . . . . . . . . . . . . 21112.2.2. Collocational and Discoursal Factors . . . . . . . . . . . . . . . . 21212.2.3. Occurrences of
you know
in Relation to Interviewer Categories, Tasks and Background Variables . . . . . . . . . . . . . . 214
12.2.4. Summary . . . . . . . . . . . . . . . . . . . . . . . . . . . . . . . . . . . . . . 217
CHAPTER 13: Aspects of Pronunciation . . . . . . . . . . . . . . . . . . . . . . . 21913.1. Intonation . . . . . . . . . . . . . . . . . . . . . . . . . . . . . . . . . . . . . . . . . 219
13.1.1. Results from the Observations of Students’ Intonation . . . 21913.1.2. Summary . . . . . . . . . . . . . . . . . . . . . . . . . . . . . . . . . . . . . . 220
13.2. Stress: Some Relevant Issues . . . . . . . . . . . . . . . . . . . . . . . . . . 22113.2.1. Overall Distribution of Non-standard English Stress:
Sentences and Words . . . . . . . . . . . . . . . . . . . . . . . . . . . . . . . . . 22113.2.2. The Occurrence of Non-standard English Stress in
Relation to Background Variables. . . . . . . . . . . . . . . . . . . . . . . 22313.2.3. Summary . . . . . . . . . . . . . . . . . . . . . . . . . . . . . . . . . . . . . . 223
13.3. Speech Rate . . . . . . . . . . . . . . . . . . . . . . . . . . . . . . . . . . . . . . . 224

9
13.3.1. Overall Distribution . . . . . . . . . . . . . . . . . . . . . . . . . . . . . . 22413.3.2. Speech Rate in Relation to Interviewer Categories
and Background Variables . . . . . . . . . . . . . . . . . . . . . . . . . . . . . 22513.3.3. Summary . . . . . . . . . . . . . . . . . . . . . . . . . . . . . . . . . . . . . . 226
Part 6: Discussion
CHAPTER 14: Grading Swedish Students’ Oral Proficiency in English . . . . . . . . . . . . . . . . . . . . . . . . . . . . . . . . . . . . . . . . . . . . . . . . 229
14.1. Global Performance Grades . . . . . . . . . . . . . . . . . . . . . . . . . . . 22914.2. Factorial Grades . . . . . . . . . . . . . . . . . . . . . . . . . . . . . . . . . . . . 23114.3. Interviewer Categories . . . . . . . . . . . . . . . . . . . . . . . . . . . . . . . 23214.4. Individual Students’ Grades . . . . . . . . . . . . . . . . . . . . . . . . . . . 23414.5. Results in Relation to Background Variables . . . . . . . . . . . . . . 24214.6. Concluding Remarks. . . . . . . . . . . . . . . . . . . . . . . . . . . . . . . . . 243
CHAPTER 15: Swedish Students’ Oral Proficiency in English . . . . . . 24515.1. Verbal Group . . . . . . . . . . . . . . . . . . . . . . . . . . . . . . . . . . . . . . 24515.2. Vocabulary . . . . . . . . . . . . . . . . . . . . . . . . . . . . . . . . . . . . . . . . 24815.3. Discourse Markers . . . . . . . . . . . . . . . . . . . . . . . . . . . . . . . . . . 25115.4. Aspects of Pronunciation . . . . . . . . . . . . . . . . . . . . . . . . . . . . . 25415.5. Interference from Swedish . . . . . . . . . . . . . . . . . . . . . . . . . . . . 25515.6. Concluding Remarks. . . . . . . . . . . . . . . . . . . . . . . . . . . . . . . . . 257
Conclusion . . . . . . . . . . . . . . . . . . . . . . . . . . . . . . . . . . . . . . . . . . . . . . . 2601. Summary and Conclusions . . . . . . . . . . . . . . . . . . . . . . . . . . . . . . 2602. Reflections . . . . . . . . . . . . . . . . . . . . . . . . . . . . . . . . . . . . . . . . . . . 266
Bibliography . . . . . . . . . . . . . . . . . . . . . . . . . . . . . . . . . . . . . . . . . . . . . 273
Appendix
APPENDIX 1: The Organisation of the Project:The Numbers Given to the Tests . . . . . . . . . . . . . . . . . . . . . . . . . . . . . . . . . . . . . . . . . . . . . . . 285
APPENDIX 2: The Distribution of the Interviewers in the Tests on 8 May, 1993 . . . . . . . . . . . . . . . . . . . . . . . . . . . . . . . . . . . . . . . . . . . . . . 286
APPENDIX 3: The Organisation of the Tests on 8 May, 1993. . . . . . . 287
APPENDIX 4A: The Instructions and Tasks of the Students in Testswith School Teachers . . . . . . . . . . . . . . . . . . . . . . . . . . . . . . . . . . . . . . . 288
APPENDIX 4B: The Instructions and Tasks of the Students in Tests with University Teachers . . . . . . . . . . . . . . . . . . . . . . . . . . . . . . . . . . . . 291

10
APPENDIX 4C: The Instructions and Tasks of the Students in Tests with Native Speakers. . . . . . . . . . . . . . . . . . . . . . . . . . . . . . . . . . . . . . . 294
APPENDIX 5: The Instructions for the Interviewers . . . . . . . . . . . . . . 298
APPENDIX 6: The Questionnaire to the Interviewers . . . . . . . . . . . . . 299
APPENDIX 7: The Questionnaire to the Students . . . . . . . . . . . . . . . . 300
APPENDIX 8: The Rating Criteria . . . . . . . . . . . . . . . . . . . . . . . . . . . . 301
APPENDIX 9: The Oral Mark Sheet. . . . . . . . . . . . . . . . . . . . . . . . . . . 302
APPENDIX 10: The Length of the Tests . . . . . . . . . . . . . . . . . . . . . . . 303
APPENDIX 11: The Number of Students’ Words in the Tests. . . . . . . 304
APPENDIX 12: Illustrative Samples of Three Oral Tests . . . . . . . . . . 305
Index . . . . . . . . . . . . . . . . . . . . . . . . . . . . . . . . . . . . . . . . . . . . . . . . . . . 319

11
List of Tables and Figures
Tables
Table 6.1. Sub-hypotheses of the ten linguistic features . . . . . . . . . 91Table 6.2. Oral tests across the test rating categories . . . . . . . . . . . . 92Table 7.1. Students’ background variables . . . . . . . . . . . . . . . . . . . . 101Table 7.2. Students’ school grades in English . . . . . . . . . . . . . . . . . 102Table 7.3. The rating criteria of Communication and Fluency
versus the rating criteria of CEF . . . . . . . . . . . . . . . . . . . 110Table 7.4. The rating criteria of Grammar and Vocabulary versus
the rating criteria of CEF . . . . . . . . . . . . . . . . . . . . . . . . . 111Table 8.1. The Global Grades of the 29 students (A-WW) by
School Teachers (ST), University Teachers (UT) and Native Speakers (NS) . . . . . . . . . . . . . . . . . . . . . . . . . . . 117
Table 8.2. Factorial Grade 2a (Communication and Fluency) of the 29 students (A-WW) by School Teachers (ST), University Teachers (UT) and Native Speakers (NS) . . . 120
Table 8.3. Factorial Grade 2b (Grammar and Vocabulary) of the29 students (A-WW) by School Teachers (ST), University Teachers (UT) and Native Speakers (NS) . . . 122
Table 8 4. Factorial Grade 2c (Pronunciation) of the 29 students (A-WW) by School Teachers (ST), University Teachers (UT) and Native Speakers (NS) . . . . . . . . . . . . . . . . . . . . 125
Table 8.5. Number of tests for which the Global grades werethe same as or different from the Factorial grades respectively . . . . . . . . . . . . . . . . . . . . . . . . . . . . . . . . . . . 127
Table 8.6. Factorial Grades 2a, 2b and 2c versus interviewer categories (School Teachers (ST), University Teachers (UT) and Native Speakers (NS); . . . . . . . . . . . . . . . . . . . 128
Table 8.7. Correlations between the categories of interviewers’ Global and Factorial grades . . . . . . . . . . . . . . . . . . . . . . . 128
Table 8.8. Number of students whose Global or Factorial grades were the same or different in their three oral tests . . . . . 130

12
Table 8.9. Number of students who were assigned the same, two different or three different Global or Factorial grades in the three tests by the three different interviewers . . . . 131
Table 8.10. Global grades assigned to boys’ and girls’ production . . 136Table 8.11. Global grades by age . . . . . . . . . . . . . . . . . . . . . . . . . . . . 136Table 8.12. Global grades by course programme . . . . . . . . . . . . . . . . 137Table 8.13. Global grades versus school grades in English . . . . . . . . 137Table 8.14. Global grades versus grades in the National Test of
English . . . . . . . . . . . . . . . . . . . . . . . . . . . . . . . . . . . . . . . 139Table 10.1. Uses of the third person singular marker by test rating
categories . . . . . . . . . . . . . . . . . . . . . . . . . . . . . . . . . . . . . 168Table 10.2. Proportions of the third person singular marker in
individual students’ production . . . . . . . . . . . . . . . . . . . . 169Table 10.3. Proportions of non-standard English types of the third
person singular marker by test rating categories . . . . . . . 170Table 10.4. Proportions of types of subject in non-standard English
instances of the third person singular marker by test rating categories . . . . . . . . . . . . . . . . . . . . . . . . . . . . . . . 171
Table 10.5. Instances of the third person singular marker ending in sibilants by test rating categories . . . . . . . . . . . . . . . . . . 172
Table 10.6. The third person singular marker by interviewer categories . . . . . . . . . . . . . . . . . . . . . . . . . . . . . . . . . . . . . 173
Table 10.7. The third person singular marker versus the tasks of the tests . . . . . . . . . . . . . . . . . . . . . . . . . . . . . . . . . . . . . . . . . 174
Table 10.8. The third person singular marker in comparison with school grades in English . . . . . . . . . . . . . . . . . . . . . . . . . 174
Table 10.9. The progressive by test rating categories . . . . . . . . . . . . 176Table 10.10. The progressive simple and the progressive complex by
test rating categories . . . . . . . . . . . . . . . . . . . . . . . . . . . . 177Table 10.11. Standard English and non-standard instances of the
progressive by test rating categories . . . . . . . . . . . . . . . . 178Table 10.12. Types of standard English instances of the progressive
by test rating categories . . . . . . . . . . . . . . . . . . . . . . . . . . 178Table 10.13. Non-standard English instances of the progressive by
test rating categories . . . . . . . . . . . . . . . . . . . . . . . . . . . . 179Table 10.14. Non-standard English instances of the progressive by
test rating categories . . . . . . . . . . . . . . . . . . . . . . . . . . . . 179Table 10.15. The progressive by interviewer categories . . . . . . . . . . . 180Table 10.16. The progressive by the tasks of the tests . . . . . . . . . . . . . 181Table 10.17. The progressive in comparison with school grades in
English . . . . . . . . . . . . . . . . . . . . . . . . . . . . . . . . . . . . . . . 182Table 11.1. Abstract nouns (tokens) by test rating categories . . . . . . 184

13
Table 11.2. Abstract nouns (types) by test rating categories . . . . . . . 185Table 11.3. Countable and uncountable abstract nouns by test rating
categories . . . . . . . . . . . . . . . . . . . . . . . . . . . . . . . . . . . . . 186Table 11.4. Standard English and non-standard English uses of
uncountable abstract nouns by test rating categories . . . 187Table 11.5. The distribution of 119 types of abstract nouns by test
rating categories . . . . . . . . . . . . . . . . . . . . . . . . . . . . . . . 188Table 11.6. Abstract nouns by interviewer categories . . . . . . . . . . . . 191Table 11.7. Abstract nouns by the tasks of the tests . . . . . . . . . . . . . . 192Table 11.8. Abstract nouns and the tasks of the tests by test rating
categories . . . . . . . . . . . . . . . . . . . . . . . . . . . . . . . . . . . . . 192Table 11.9. Abstract nouns in by school grades in English . . . . . . . . 193Table 11.10. Abstract nouns by the students’ sex . . . . . . . . . . . . . . . . . 193Table 11.11. Modifiers of adjectives (tokens) by test rating categories 194Table 11.12. Modifiers of adjectives (types) by test rating categories . 195Table 11.13. The types of modifiers of adjectives in descending order
of frequency . . . . . . . . . . . . . . . . . . . . . . . . . . . . . . . . . . . 196Table 11.14. Twelve types of modifiers of adjectives by test rating
categories . . . . . . . . . . . . . . . . . . . . . . . . . . . . . . . . . . . . . 197Table 11.15. Modifiers of adjectives by interviewer categories . . . . . . 198Table 11.16. Modifiers of adjectives by school grades in English . . . . 198Table 11.17. Modifiers of adjectives by the students’ sex . . . . . . . . . . 199Table 11.18. Lexical errors (tokens) by test rating categories . . . . . . . 200Table 11.19. Lexical errors (types) by test rating categories . . . . . . . . 201Table 11.20. Compensatory strategies by test rating categories . . . . . . 201Table 11.21. Twelve types of compensatory strategy by test rating
categories . . . . . . . . . . . . . . . . . . . . . . . . . . . . . . . . . . . . . 202Table 11.22. Twelve types of compensatory strategy by interviewer
categories . . . . . . . . . . . . . . . . . . . . . . . . . . . . . . . . . . . . . 203Table 12.1.
Well
by test rating categories . . . . . . . . . . . . . . . . . . . . . . 206Table 12.2. Discoursal functions of
well
by test rating categories . . . 207Table 12.3.
Well
by interviewer categories . . . . . . . . . . . . . . . . . . . . . 208Table 12.4.
Well
and the tasks of the tests by test rating categories . . 209Table 12.5.
Well
and the tasks of the tests by interviewer categories . 209Table 12.6.
Well
by the students’ sex . . . . . . . . . . . . . . . . . . . . . . . . . 210Table 12.7.
Well
by school grades in English . . . . . . . . . . . . . . . . . . . 210Table 12.8.
You know
by test rating categories . . . . . . . . . . . . . . . . . . 212Table 12.9 .
You know
and the position in the utterance by test rating categories . . . . . . . . . . . . . . . . . . . . . . . . . . . . . . . . . . . . . 213
Table 12.10.
You know
and discoursal functions by test rating categories . . . . . . . . . . . . . . . . . . . . . . . . . . . . . . . . . . . . . 214
Table 12.11.
You know
by interviewer categories . . . . . . . . . . . . . . . . 215

14
Table 12.12. The introduction of
you know
by students or by interviewers by test rating categories . . . . . . . . . . . . . . . 215
Table 12.13.
You know
and the tasks of the tests by test rating categories . . . . . . . . . . . . . . . . . . . . . . . . . . . . . . . . . . . . . 216
Table 12.14.
You know
by the students’ sex . . . . . . . . . . . . . . . . . . . . . 216Table 12.15.
You know
by school grades in English . . . . . . . . . . . . . . 217Table 13.1.
And so on
by test rating categories . . . . . . . . . . . . . . . . . 222Table 13.2. The stress of
and so on
by test rating categories . . . . . . . 223Table 13.3. “Pruned words” per minute by test rating categories . . . 224Table 13.4. Average scores of pruned words per minute by
interviewer categories . . . . . . . . . . . . . . . . . . . . . . . . . . . 225Table 13.5. “Pruned words” per minute by school grades in English 226Table 14.1. Global and Factorial grades to the twelve students who
were assigned remarkably different grades . . . . . . . . . . . 235Table 15.1. Rejected or confirmed sub-hypotheses as regards the ten
linguistic features . . . . . . . . . . . . . . . . . . . . . . . . . . . . . . 258
Figures
Figure 8.1. Number of students receiving various mean Global grades . . . . . . . . . . . . . . . . . . . . . . . . . . . . . . . . . . . . . . . . 118
Figure 8.2. Number of students receiving various mean Communication and Fluency grades . . . . . . . . . . . . . . . . 121
Figure 8.3. Number of students receiving various mean Grammar and Vocabulary grades . . . . . . . . . . . . . . . . . . . . . . . . . . . 123
Figure 8.4. Number of students receiving various mean Pronunciation grades . . . . . . . . . . . . . . . . . . . . . . . . . . . . 126
Figure 8.5. The distribution of Global and Factorial grades to the tests. . . . . . . . . . . . . . . . . . . . . . . . . . . . . . . . . . . . . . . . . . 126
Figure 8.6. Agreement or non-agreement in grades assigned to the individual students’ three tests by their three interviewers . . . . . . . . . . . . . . . . . . . . . . . . . . . . . . . . . . . 132
Figure 8.7. Students’ Global grades versus length of students’ production in words . . . . . . . . . . . . . . . . . . . . . . . . . . . . . 133
Figure 8.8. Students’ Global grades versus length of student production in minutes. . . . . . . . . . . . . . . . . . . . . . . . . . . . 134
Figure 8.9. Students’ Global grades versus the order of the students’ interviews . . . . . . . . . . . . . . . . . . . . . . . . . . . . . 135
Figure 8.10. Factorial grades for Pronunciation versus school grades in English. . . . . . . . . . . . . . . . . . . . . . . . . . . . . . . . . . . . . 138

15
Preface
At an early stage of my postgraduate studies in Uppsala, I wanted to write athesis about Swedish students’ proficiency in English. Now that the thesisis completed, I wish to express my thanks to those people without whosesupport, advice and encouragement the completion of this dissertationwould not have been possible.
This project would never have been started if it had not been for the helpfrom Docent Torsten Lindblad at the Language Teaching and Testing Re-search Unit, the LTTC (Avdelningen för språkpedagogik), at the Depart-ment of Education and Educational Research, Gothenburg University. Do-cent Lindblad initiated and carried out the experiment from which the dataused in the present dissertation emanate. I am grateful to Docent Lindbladfor permission to use the material and for invaluable advice and perceptivecriticism of various parts of the manuscript. Thank you, Torsten.
At the early stages of my research, the guidance and the encouragementof Professor Mats Rydén were valuable. The discussions with my formerteacher Professor Gunnel Tottie inspired me to carry on my studies and alsobrought to my attention the fascinating characteristics of spoken English.
I would like to express my sincere thanks to my thesis supervisor Profes-sor Merja Kytö. She has generously guided me from the start to the finishby making detailed and relentlessly accurate comments on the many draftversions. I have profited greatly from our discussions regarding the planand method of my work. Her inspiring enthusiasm, friendliness and hu-mour have greatly contributed to bringing this work to a conclusion. Thankyou, Merja.
I would like to thank the persons who participated in the collection of thematerial of the Gothenburg project, both the 29 students interviewed andthe nine interviewers. I am also grateful to Marianne Demaret, who tran-scribed all the student production.
The participants in the English Linguistics seminars at Uppsala Univer-sity have been of tremendous help throughout the years. Docent Ingegerd
16
Bäcklund, Dr. Margareta Westergren Axelsson, Dr. Tore Nilsson and Do-cent Inger Ruin took a great interest in all my drafts and painstakingly readthe final manuscript. I also thank Dr. Christine Johansson, Donald Mac-Queen, Göran Rönnerdal and Dr. Pia Norell for valuable comments on mydrafts at numerous seminars. Their ideas for improving the text were ofgreat help. Special thanks are also due to Dr. Pia Norell and Dr. FrancisNolan, Cambridge University, for participating in the investigation of thestudents’ intonation. I also wish to thank Donald MacQueen, who kindlywent through my manuscript scrutinizing my English.
Warm thanks are due to Gudrun Erickson for valuable suggestions andcomments and to Malin Tyllered, who read and commented on parts of themanuscript. I owe thanks to Dr. Per Malmberg whose comments led to agreat improvement in several chapters. I also wish to thank Charlotte Lilja,headmaster at Richard Steffengymnasiet in Visby, for encouraging me tofinish this work and for generously giving me permission to print numerousdrafts.
For financial support I thank the Department of English at Uppsala Uni-versity for their trust and help during my postgraduate years. I am alsogreatly indebted to Professor Erik Tengstrand’s fund for financial help. Iwould also like to thank Hans-Eric Ekengren, Utvecklingsavdelningen atBarn- och Utbildningsförvaltningen, Gotlands Kommun, for providing fi-nancial support for the printing of the manuscript.
Warm thanks go to Mrs Eivor Back, who helped me and my family withmany practical arrangements so that I could work on the manuscript. Spe-cial thanks are due to Bengt and Svea Sundh, who also helped me to finishthe writing.
Finally, my deepest gratitude goes to Rosita who showed her unfailinglove and patience throughout the many years devoted to my doctoral work.I also thank Greta, Lydia, Natanael and Aron for all the inspiration theygave to me.
Uppsala June, 2003
Stellan Sundh

17
Introduction
1. Preliminary Remarks
The present study investigates the testing and grading of Swedish school-leaving students’ oral proficiency in English, and certain aspects of thesestudents’ linguistic competence in English. The analyses and results arebased on material drawn from an assessment project that will be referred toas “the Gothenburg project”.
For the purposes of the Gothenburg project, the data collection phasetook place at Gothenburg University in May 1993 under the supervision ofDocent Torsten Lindblad, head of the Foreign Language Teaching and Test-ing Research Unit, Gothenburg University, and initiator of the project. The29 students taking part in the project were interviewed three times by threedifferent interviewers in oral proficiency tests comprising three tasks, simi-lar in structure but different in content. The student production was gradedon a five-point scale according to a set of rating criteria. Each test wasassigned overall (Global) grades and three Factorial grades (for the aimsand design of the Gothenburg project, see Section 3 below).
Grading oral proficiency raises questions such as:
– What realistic ways are there of testing and grading oral proficiency inEnglish?
– Is there a consensus on how to define “good oral proficiency in English”?– If not, what do assessors disagree about?– If yes, what can teachers do to help students improve their proficiency?
These sociolinguistic and pedagogic questions are fundamental to thepresent study which seeks to analyse and compare the grades given by thedifferent interviewers to the student production in the oral tests and to in-vestigate how some linguistic features produced by the students tally withthe grades assigned to their production. At the same time it is of interest toscrutinize how the students use some particular linguistic features in their

18
production. The investigation of the students’ uses of certain linguistic fea-tures may provide interesting information as regards some aspects of thestudents’ spoken English. The aims and hypotheses of the study are elabo-rated on in Part 2 below.
2. The Background to the Gothenburg Project
As a background to the Gothenburg project and to the present study, a briefaccount of the status of English in the school system in Sweden and anoverview of testing and test research are relevant. This survey is based onselected literature on the topic and personal communication with the leaderof the Gothenburg project, Docent Lindblad (September 2002).
The status of English as a school subject has changed considerably overthe last 40 years, in both compulsory schools and in upper secondaryschools in Sweden. In 1962, the first Curriculum for Compulsory Schools(
Lgr 62
) was introduced. All children were to attend nine years of compul-sory schooling, and English was introduced as the first foreign language ingrade 4 and a compulsory subject for all children in grades 4 to 7. It wasoptional in grades 8 and 9 (
Lgr 62
). In the next curriculum, introduced in1969 (
Lgr 69
), the study of English was introduced in grade 3 and wasmade a compulsory subject all the way through grade 9 (Malmberg 1985:35). In the curriculum of 1980 (
Lgr 80
), pupils still started studying Englishin grade 3 (Marklund 1987: 142; Malmberg 1990; Lindblad 1982). In themost recent curriculum for the compulsory school system (
Lpo 94
) and therevised versions of the syllabi of 2000, individual schools decide when tointroduce English in pupils’ timetables (
Lpo 94
: 6).
1
Changes concerning the teaching of English also applied to upper sec-
ondary schools. In 1965, new curricula for the upper secondary schools(
Läroplan för gymnasiet 1965; Läroplan för fackskolan 1965
) were intro-duced, and a few years later, in 1970, additional changes were made in thesystem of upper secondary education in Sweden (
Lgy 70
). The new
gym-nasieskola
, as it is called in Swedish, included both the old upper secondaryschool (
the gymnasium
) and the vocational schools (
fackskolan
, previously
yrkesskolorna
). To begin with, the new
gymnasieskola
was organised intwo-, three- or four-year-streams (Marklund 1987: 335).
2
As far as Englishwas concerned, there were then three different courses: in the two-yearstreams, there were two, one more advanced (known as
särskild kurs
, i.e.
1
In 1998/99, 32% of the pupils in grade 1 of the Swedish comprehensive school studiedEnglish (Skolverket 1999: 14).
2
The streams were study programmes of a theoretical or practical character.

19
‘special course’) and one less demanding
(allmän kurs
, i.e. ‘generalcourse’), and in the three/four-year streams, there was a third one, the mostadvanced one and originally intended to prepare for higher education. Thismeant that the
gymnasieskola
in fact offered three different courses in Eng-lish. The curriculum of 1994 (
Lpf 94
) changed the structure of the uppersecondary school: all students now follow the same course of study at thelower levels. Regarding English, this is the so-called English A course. Themore theoretically oriented students go on to English B and, in the last year,there is a more advanced elective course, English C. In 2000, the syllabi ofEnglish of the upper secondary school were again revised.
In the late 1940s and 1950s, there was a change worldwide in the view oflanguage testing. New so-called standardized tests were introduced. InSweden, they were first used in compulsory schools in mathematics andSwedish, later in English. The tests were set by the National Board of Edu-cation (
Skolöverstyrelsen
). The purpose of these tests was to help teachersgive fair and nationally comparable grades. The construction and trying-outof these tests as well as follow-up work was entrusted to a group of educa-tion and subject specialists at the Teachers Training College (
Lärarhögsko-lan
) in Stockholm, and the tests were of course to be designed in line withthe latest professional standards, such as ‘objectivity’ and the minimizingof chance factors, i.e. with a strong stress on reliability. This meant that thetests were of the multiple-choice type and the student’s answers werescored 1 (correct) or 0 (erroneous). As far as the teaching and testing offoreign languages, primarily English, are concerned, it is of interest to no-tice that at this time, there were also discussions concerning the signifi-cance of the oral exam in language testing and the desire to develop the oralpart in the
studentexamen
3
(that is, the comprehensive school-leaving ex-amination)
(Thoren 1957: 136). Thorén also quotes a number of officialdocuments in which teachers are recommended to use English as often aspossible in their classes.
Later, the task of producing and following up the standardized tests wastaken over by the National Board of Education itself, where a testing de-partment was set up. The norm-referenced grading system used at the timeprescribed the distribution of the five grades 1–5. They were to be given to,respectively, 7 – 24 – 38 – 24 – 7 per cent of the age cohort in the country.Guidelines for individual schools and teachers were provided in accordancewith this and by means of nationwide test results. More or less identicalstandardized tests were used for 10 to 15 years.
3
The
studentexamen
(the baccalaureate) was taken at the very end of the last year of the
gymnasium
and consisted of two steps: written tests and a final oral exam. In this latter step,each student was tested in four or five subjects. This meant that only some students were testedin English. In the new kind of upper secondary school, there was no final examination.
20
Towards the end of the 1960s, the need was felt for new tests.
4
The taskof constructing these new tests was entrusted to the Foreign LanguageTeaching and Testing Unit, Gothenburg University, under the supervisionof Docent Lindblad. Initially, the tests were of the multiple-choice kind andfollowed the dominating testing theories of that period (see for exampleLado 1961 and Valette 1967). This meant that reliability (cf. 2.3. Reliabil-ity) was given high priority. Gradually the tests were revised, however, toinclude so-called open-ended items. In these tasks students were asked towrite one word, a string of words, or full sentences. In the early 1980s,completely new tests were produced under the leadership of Bror Andered,a language-teaching expert employed at the National Board of Education.These tests were almost a kind of trend-breakers in the Swedish schools asthey followed the language-testing theories and practices of that time. Be-sides reliability, there was now a greater interest in questions concerningvalidity (cf. 2.4. Validity). In these new tests, open-ended items with an-swers produced by the students were much more numerous (Lindblad1990).
Great changes have also been introduced in foreign language testing inupper secondary schools. The old
studentexamen
disappeared in the 1960swhen the new kind of upper secondary school (
gymnasieskola
) was created.New national tests were introduced and, to minimize the dramatic status ofthe old final tests, they were, as far as English was concerned, given in thelast year but one. From the beginning these new national tests, originallyonly given in the three/four-year streams, consisted of nothing but multiple-choice items. In the 1970s, Docent Lindblad and his research team wereentrusted with the task of producing tests for the two-year streams. Studiesshowed considerable differences in the mean achievement obtained for stu-dents enrolled in the different stream programmes when they were giventhe same tests (which was done as a large-scale research project in the1970s), but considerable overlap in test results could also be noticed: somestudents of the two-year programmes even had better results than somestudents of the three-year programmes. After 1994, all students in the Eng-lish A course took the same national tests.
According to Docent Lindblad, the view of languages as school subjectshas changed radically over the last 30 to 40 years. He sees two majorsources that have influenced the teaching and learning of foreign languagesin Sweden: the American and the European influence. To quote DocentLindblad,
4
In the late 1960s, there were lively discussions regarding language teaching in Sweden.These discussions were of great influence for the developments in the fields of language teach-ing and testing in the 1970s and 1980s in Sweden. Summaries of these discussions are foundin Edwardsson (1970).

21
The American influence – to simplify things slightly for the sake of brevity – con-sists of the introduction of the concept of Communicative Competence as the main,but not the only, goal and objective of foreign language study. The European influ-ence has come from the language project of the Council of Europe. This started outon a fairly small scale and its first widely known and discussed product was thebook
The Threshold Level for Modern Language Learning in Schools
by J.A van Ekfrom 1977 (Lindblad, personal communication, 2002).
The ideas by van Ek were further developed, for instance, concerning defi-nitions of communicative competence (van Ek 1986: 36) (cf. 2.1. Oral Pro-ficiency) and regarding the psychological, emotional and social conditionsof the language learner. The idea of adding this aspect to foreign languagelearning, and not only addressing the learners’ cognitive powers in lan-guage learning, has been of significance (Malmberg 2001). Furthermore,the Council of Europe made contributions regarding ideas and practicalillustrations of classroom activities in foreign languages (Shiels 1988).
In the 1980s, Docent Lindblad and his colleagues in Gothenburg had thefull responsibility for all national foreign-language tests. The research teamthen considered it necessary to launch studies of how to give and gradewritten and oral production tests, i.e. essays and oral proficiency interviews,and a ten-year project was started. During the first five years, starting in1982, various topics were tried out in compulsory essays in the nationaltests, and instructions were given for the grading of the essays by a group ofexperts. During the following five years, from 1988, oral tests were made apart of the national tests. The tests were compulsory for the teacher and his/her class but only for a limited number of students in each class. During thelast five years of the experiment, tasks for oral proficiency testing as well asdetailed instructions for the grading of the students were produced and triedout (Lindblad 1992).
The oral part has been a fully compulsory part of the tests of the uppersecondary school since 2000 (Erickson and Börjesson 2001), and in com-pulsory schools since 1998 (Erickson 1999).
3. The Gothenburg Project
As has been mentioned above, the material used in the present study wascollected in 1993 by Docent Lindblad and his team of researchers at theDepartment of Education and Educational Research, Gothenburg Univer-sity. In what follows, this material and the way in which it was collectedwill be described. The author of the present study participated in practicalarrangements on the day the material was collected (May 8, 1993).
5
5
The practical arrangements included, for instance, showing the students to the interview-ers’ rooms and assisting the interviewers with the tape-recorders.

22
A total of 29 students took part in the project. Each of them was testedthree times by three different interviewers. Each oral test consisted of threedifferent tasks, constructed along the same lines but using different topics(cf. 7.4. Tasks). Each interview lasted some 10 minutes. The students wereassessed by three types of interviewers, School Teachers (ST), UniversityTeachers (UT) and Native Speakers (NS). Consequently, the material to bepresented and discussed in the present study comprises three assessments ofeach one of the 29 students in three separate tests, all in all 87 student tests.
The interviewers were instructed to give each student four differentgrades: one grade for the overall Global impression of the student’s per-formance, and three grades for three different factors according to the crite-ria the interviewers had to adhere to. These three so-called Factorial gradeswere given for Communication and Fluency, Vocabulary and Grammar, andPronunciation.
The Gothenburg project material was thus collected in order to study theassessment of oral proficiency in English. Among the questions raisedwere, for instance, whether students’ demonstrated skills were assessed dif-ferently by the three different categories of interviewers, and if so, to whatdegree and in what respects interviewers differed from each other in theirassessments.
The present investigation used the material of the Gothenburg project(a) to compare the grades given by the different interviewers,(b) to analyse the students’ uses of certain linguistic features in their
production, and(c) to investigate the correlation between the occurrence of these features
and the grades assigned.
4. The Organisation of the Study
The present study is an inter-disciplinary product that brings together theframeworks of linguistic and pedagogical study and is structured in sixparts. In Part 1 (Ch. 1–3) the theoretical and empirical background of thestudy is dealt with. Apart from a brief survey of previous research, specialattention will be paid to five central concepts in the discussion of languagetesting, namely proficiency, reliability, validity, acceptability and intelligi-bility. Part 1 also includes a comparison of the Gothenburg project test withthree oral tests from other countries. Part 2 (Ch. 4) is devoted to a presenta-tion of the aims and the hypotheses of the study. In Part 3 (Ch. 5–6), theprinciples of the analyses are clarified, first the principles of the investiga-tion of the grading of the student production, then the principles of theanalyses of the linguistic features. Part 4 (Ch. 7) includes a discussion of

23
the practical organisation of the testing session, with reference to the partic-ipants, the students’ tasks and the principles of the assessment. Part 5 (Ch.8–13) presents the results, both as regards the grades assigned and the lin-guistic features studied. In this part, the results of the study of a number offactors that may have influenced the assessment, such as linguistic featuresrelated to accuracy and fluency and the different background of the inter-viewers are discussed. The results are expounded but not interpreted. Part 6(Ch. 14–15) provides a discussion and interpretations of the results pre-sented in Part 5. Finally, conclusions and some reflections are presented.

24

25
Part 1:Testing Oral Proficiency
In this part of the study, three issues concerning oral proficiency tests willbe elaborated on: historical background and previous research, methodo-logical considerations and formats of oral tests. The purpose is to provide abackground to the discussion of the testing and assessment methods used inthe oral proficiency interviews of the Gothenburg project.

26

27
CHAPTER 1
Historical Background and Previous Research
The present chapter will describe the historical background of languagetesting, previous research regarding measuring student performance andcertain issues with reference to the testing of oral proficiency. Furthermore,results from previous linguistic investigations not only of non-native stu-dents’ but also of native speakers’ use of certain linguistic features in theEnglish language will be discussed. These results are relevant to discuss asa background to the principles adopted in the linguistic analyses of thestudent performance, for instance regarding the classification of “standardEnglish” and “non-standard English” instances.
1.1. Measuring Student Performance
In this section the following issues are treated:
– the history of language testing,– basic distinctions in measuring student performance, – factorial assessments of students’ oral proficiency, – students’ achievements in different skills, and– students’ results in relation to the assessor’s background.
A Brief Survey of the History of Language Testing
By way of background to the principles adopted in the Gothenburg project(cf. Chapter 5), and in order to provide a historical context for oral profi-ciency testing investigated in the present study, a brief survey is given onthe history of language testing. The discussion is based mainly on McNa-mara (1996, 2000).
To begin with, Spolsky (1976, 1985) distinguishes three stages in thedevelopment of language testing:

28
1. The pre-scientific or traditional phase The measurement was based on the subjective judgement of one exam-iner or a group of examiners.
2. The psychometric-structuralist or modern phaseThe measurement was characterised by efforts made to emphasize ob-jectivity and reliability (cf. 2.3. Reliability). Knowledge of language wasgenerally broken up into small parts and measured by standardised tests,for instance multiple choice items. Testing focused on the students’knowledge of the grammatical system, of vocabulary and of aspects ofpronunciation (McNamara 2000: 14).
3. The psycholinguistic-sociolinguistic or post-modern phaseThe main concern in the measurement was to secure not only objectivityand reliability, but also validity (cf. 2.4. Validity). The relationship be-tween the students’ competence and performance was of interest, and itwas important to take into account the variability of language use. Thenew orientation resulted in tests which integrated knowledge of the sys-tematic features of language with an understanding of the situationalcontext (McNamara 2000: 15).
Three different trends in the history of language testing are also distin-guished by Simensen (1998: 268). They are the traditional trend of the1950s and before (sometimes described as pre-scientific), the discrete-pointtrend in the 1960s and 1970s (the ideal was to measure isolated skills andsmall elements in separate tests) and the communicative and meaning-ori-ented trend from the 1980s onwards (the focus was, and is still, on measur-ing language in context). An interest gradually developed in the use of qual-itative methods in language testing research in order better to understandstudents’ test-taking behaviours. The focus shifted to the student’s perspec-tive; how did they arrive at correct or incorrect answers (Alderson 1993: 4)?
The communicative language tests of this late period displayed two prin-cipal features. Firstly, the tests were performance tests, i.e. the studentswere engaged in an act of communication. Secondly, the tests paid attentionto the social context and the roles the students would have in real-life set-tings (McNamara 2000:17). There was thus a move from a focus on lan-guage structure and knowledge towards measuring students’ abilities tocommunicate. The emphasis was on the message as much as the form, andthe students’ ability to convey meaning appropriately and fluently was cru-cial. Furthermore, there was a desire for authenticity in teaching activitiesand this desire had great impact on test content, too. The test content at-tempted to reflect the students’ likely future language needs (Alderson1993: 9–11). In particular, it is the testing of oral proficiency that haschanged:

29
Nowhere is the contrast between the old and the new approaches to language testingclearer than in the testing of speaking, or more precisely, of oral interaction. (Carroll1985: 49)
Testing the oral skill in oral proficiency interviews, an approach initiated inUS government agencies, such as the Foreign Service Institute (FSI), in the1950s, spread to the assessment of foreign language skills at universities inthe 1980s through the American Council of the Teaching of Foreign Lan-guages (ACTFL).
1 The oral proficiency interview (OPI) and its rating scalewere used to determine the level of the students’ oral performance (McNa-mara 1996: 76; ACTFL 1989). Influences from these tests can still befound, for instance in the descriptions of rating scales. In describing the toplevel of the scale, the rating criteria of many rating scales make specificreference to the assumed performance of native speakers. This practicedates from the FSI Oral Proficiency Interview, where the highest level wasdefined as: “speaking proficiency equivalent to that of an educated nativespeaker” (Clark and Clifford 1988: 131; McNamara 1996: 184). The oralproficiency interview has remained the most commonly used means for thedirect testing of spoken language skills (McNamara 2000: 23).
Basic Distinctions in Measuring Student Performance
The procedure of grading student performance can be organised in variousways and alternative methods can be selected. In what follows, twelve dis-tinctions related to methods of measuring student performance are brieflypresented. The presentation is, partly, based on the Common EuropeanFramework of References for Languages (2001: 183–192). The twelve dis-tinctions are:
1. informal and formal assessment2. norm-referenced and criterion-referenced assessment3. mechanical and human assessment4. simultaneous and delayed assessment5. direct, semi-direct and indirect assessment6. proficiency and achievement assessment 7. assessment using global and factorial grades (holistic/analytical)8. performance and knowledge assessment9. subjective and objective assessment
10. continuous and fixed point assessment11. impression and guided assessment12. self-assessment and assessment by others
1 In a review of research from 1965, the testing of spoken English is claimed to be growingin importance and in volume (Hitchman 1965).
30
Informal and formal assessment. Informal assessment is carried out on adaily basis through observations of how students cope in various types oforal and written activities. In formal assessment, various types of tests areused (Simensen 1998: 265).
Norm-referenced and criterion-referenced assessment. In norm-referencedassessment, the student’s performance is judged in relation to the perform-ance of the other students in the same group. In criterion-referenced assess-ment, the student’s performance is measured against certain given criteria(Simensen 1998:266).
Mechanical and human assessment. In mechanical assessment of studentproduction, responses are converted automatically to the appropriate score,whereas in human assessment, a certain degree of thought or judgement isnecessary in order to arrive at the appropriate grade (Clark 1975: 12).
Simultaneous and delayed assessment. This distinction concerns the occa-sion of the assessment. Simultaneous assessment is carried out during ordirectly after the test. In delayed assessment, the test responses are evalu-ated on a later occasion.
Direct, semi-direct and indirect assessment. In the distinction between di-rect, semi-direct and indirect tests, the appeal to ‘real-life performance’provides the basis for the distinction. Clark (1975:10) discusses direct testsand states that
in direct proficiency testing, the test format and procedure attempt to duplicate asclosely as possible the setting and operation of the real-life situation in which theproficiency is normally demonstrated.
Direct proficiency tests should thus be very close to real-life language situ-ations with respect to setting and language. Indirect proficiency tests do nothave this requirement of a real-life situation and can be very different fromthe situations the students may encounter in real life:
Indirect measures are not required to reflect authentic language-use contexts and,indeed, they may in many cases bear little formal resemblance to linguistic situa-tions that the student would encounter in real life (Clark 1978: 26).
The fact that language is both the object and the instrument of the measure-ment is also of significance in the discussion of these notions. A third levelcan be distinguished in so-called semi-direct tests, resulting in the three-level classification given above: direct, semi-direct and indirect tests (Bach-man 1990:127; Clark 1979). The difference between direct, semi-direct and

31
indirect tests lies in the form of input used to elicit student production.Direct tests involve the use of the skills being tested. This is evident in anoral test or in a writing sample. In indirect tests other methods are used tocheck students’ knowledge, for instance a multiple-choice test to checkvocabulary. Semi-direct tests are different from direct tests in the form ofthe input used to elicit student production. In direct tests, the human input islive whereas semi-direct tests could contain some kind of indirect input, forinstance tape-recordings. It could be argued, however, that all languagetests are indirect since they are “indirect measures of the underlying traits”(Bachman 1990: 33).
Proficiency and achievement assessment. Proficiency tests are based on atheory of language proficiency or a specific domain of content and look tothe future situation of language use (without necessarily having any refer-ence to the process of teaching). Achievement tests, also called attainmenttests, are syllabus-based tests, drawing from the content of the course andare associated with the process of instruction related to the past (Bachman1990: 71; McNamara 2000: 6–7; Alderson, Clapham and Wall 1995: 12).2
Assessment using global and factorial grades. In a system of global (holis-tic) grades, the interviewer gives one overall grade to the impression he orshe has of the production as a whole. In a system of factorial (analytical)grades, several grades are assigned to the student production. The factorialgrades may focus on, for instance, pronunciation, fluency or grammaticalaccuracy. Oller (1979: 321) discusses global versus factorial assessmentsand offers a third possibility. In this third type, the interviewer has a numberof factorial grades to pay attention to according to the instructions but onlygives a global grade in the final assessment of the student production. Thismethod, i.e. analytic rating in which the scores for the separate aspects arecombined into a single overall score, is now common (McNamara 2000:43–44).3 Dyson (1972) compared the procedures of using exclusively glo-bal grades or only factorial grades in the assessment of oral proficiency inFrench. One of the purposes of the investigation was to see whether thelatter procedure led to more objective and reliable grades. The study cameto the conclusion that there was no significant difference in reliability be-tween the two types of assessments (ibid. 1972: 35). Another study showedsimilar results (Walker 1981).
2 Two additional terms can be distinguished. They are progress tests and diagnostic tests.Progress tests are given at various stages throughout a language course. Diagnostic tests seekto identify those areas in which a student needs further help (Alderson 1995: 12).
3 In the oral part of the Swedish National Test of English (Course A or B) of 2001, oneGlobal grade is to be given, but factors are given in the instructions to facilitate the assessment.These factors are, for instance, Content and Language.

32
Performance and knowledge assessment. Performance assessment requiresthe student to give a sample of speech or writing in a direct test (see above).In knowledge assessment, the student answers questions to provide evi-dence of their linguistic knowledge and control.
Subjective and objective assessment. Subjective assessment is a judgementby one assessor, normally of the quality of a student’s performance. Inobjective assessment, subjectivity is controlled, often by means of indirecttests (see above) in which items have one correct answer, for instance, mul-tiple choice tests.
Continuous and fixed point assessment. Continuous assessment evaluatesperformance which reflects a whole course or semester. Fixed point assess-ment is based on the performance on a particular occasion.
Impression and guided assessment. Impression assessment is a fully sub-jective judgement based on the student’s performance in class, for instance,and without reference to specific criteria. In guided assessment, the subjec-tivity is reduced by conscious assessment in relation to specific criteria.
Self-assessment and assessment by others. In self-assessment, the studentsmake judgements about their own proficiency. In assessment by others, thejudgements are made by an examiner.
In the following, the discussion will center on one of the above distinc-tions, namely assessment using global and factorial grades, with the focuson the use of factorial grades.
Factorial Assessments of Students’ Oral Proficiency
The combinations of factors that are used in factorial assessments of oralproficiency may vary (for the factors employed in the Gothenburg project,see 7.5. Rating Criteria and Appendix 8). Below follows a survey of suchcombinations used in research contexts or in actual assessments. The list ofstudies demonstrates the variability of the field.
Underhill (1987: 96) discusses possible factors in terms of ‘mark catego-ries’ and distinguishes between traditional mark categories and the moremodern style of mark categories. The former comprises, for instance,Grammar, Vocabulary, Style and Fluency, and Content. The latter has anemphasis on language as a tool for communication and the categories aredescribed as ‘performance criteria’. They are, for instance, Flexibility, Hes-itation, Repetition, and Independence. The purpose of the test decideswhich factors to use in the assessment.
Five factors were decided on by Haastrup (1977: 61) in a study of the
33
assessment of oral proficiency of English. The oral test was part of an inves-tigation of the language proficiency and communicative competence of 45teachers-to-be of English studying at the Royal Danish School of Educa-tional Studies. The five factors used in this test were Pronunciation, Gram-maticality, Vocabulary, Fluency, and Expressiveness comprising extra-lin-guistic features.
Higgs and Clifford (1982: 62) discuss three separate factors in the assess-ment of oral proficiency, which are referred to as the ‘functional trisectionof speaking ability’. The three components are Function, Content and Ac-curacy.
Interactive skill is an example of another factor which may be included inassessments, and it is one of the factors of the performance to be taken intoaccount in the assessment in the Canadian OTESL-test (St. John 1992:310). Interactive skill includes the student’s ability to participate in the con-versation in an active way with the help of responses such as backchannels,questions or comments.
Comprehensibility is another example of a factor. The American SPEAK-test added Comprehensibility to three common components, namely Pro-nunciation, Grammar and Fluency (Douglas and Selinker 1992: 319).
Six factors of oral proficiency were identified by Phillipson (1977: 74) inhis analysis of oral compositions at the English Department of CopenhagenUniversity:
(1) Fluency (building sentences into more complex and larger units), (2) Accuracy (using grammar and vocabulary correctly),(3) Variety (extending the range of usage and idiom),(4) Intelligibility (using intonation with more expressiveness),(5) Pronunciation (standard British or American English), and (6) Speed (talking with ease and confidence).
Six criteria were also the basis for the global grades assigned in some ex-periments with assessment of oral proficiency in the Finnish Foreign Lan-guage Diploma for Professional Purposes. The experiments were carriedout to create a nationwide system of certification for professional languagecompetence. The six criteria were Pronunciation, Speech Flow, Grammati-cal Accuracy, Vocabulary, Appropriacy, and Discourse Management. Theassessors were to use the approximate average of the factorial criteria whenassigning the Global grade. Furthermore, six additional features were listedwhich were allowed to influence the Global grade. The six features weretextual organization, dependence on the interlocutor for comprehension,relevance and adequacy of content, use of strategies to get around difficul-ties in communication and to enhance performance, mother tongue interfer-ence and interactiveness (Huhta, Sajavaara and Takala: 1993: 145–7).

34
Fulcher (1987) discusses the compromise between the “constructive in-terplay with unpredictable stimuli”, i.e. the ‘real life’ mirrored in the oralinterview, and “the scientific measurement” with the assessment scales pro-vided to the interviewer. In his description of the criteria of the InterviewAssessment Scale of the English Language Testing Service (ELTS), fivefactors are distinguished: Repetition, Hesitation, Stumbling, PropositionalDevelopment and Grammatical Accuracy. These five factors and the assess-ment scale are compared with the language of a short extract of authenticconversation. The assessment scale has been criticized for laying too muchemphasis on notional-functional considerations at the expense of discourseconsiderations.
In the Canadian OTESL-test, the examiners worked with two types ofassessments that had different purposes. First they applied an assessmentscale to show how well the students communicated. Then the assessorsgave a diagnostic assessment of the students’ strengths and weaknesses.The second assessment was given to provide extra information about thestudent. Five factors were to be considered in this second diagnostic assess-ment: Listening, Fluency and Pronunciation, Interactive Skills, Content,and finally, Grammar and Vocabulary (St. John 1992: 310).
Walker (1983: 43) distinguished three factors worth taking into consider-ation in assessments:
(1) linguistic factors (phonology, grammar and vocabulary), (2) paralinguistic factors (hesitations, voice quality and loudness, voice
dynamics), (3) non-linguistic factors (the sex of the assessor and the student, the per-
ceived personality of the student).
In a Dutch study on the assessment of oral proficiency in French as a for-eign language, the conclusion was drawn that “attainments along three di-mensions of oral proficiency should be reported separately: pronunciation,accuracy, and fluency”. These three dimensions were found to be positivelycorrelated, but an overall score was considered to constitute “an unwar-ranted simplification” (De Jong and Van Ginkel 1992: 203).
McNamara (1996: 132) discusses ratings assigned to student perform-ance as a function of the interaction of three factors. These three factors arethe ability of the candidate, the difficulty of the task, and the characteristicsof the assessor. In this model, information about each factor is taken fromthe data used; for instance, the characteristics of the assessor are deter-mined with the help of other ratings given in a testing material, and thedifficulty of a task is based on the performance of other candidates. Themodel, called the multi-faceted Rasch model, predicts the likely score forthe combination of candidate, task and assessor, and also evaluates the ac-

35
curacy of the prediction.4 This model thus states that the likelihood of aparticular grade on a task from a particular assessor and for a particularstudent can be predicted mathematically from the student’s ability, the dif-ficulty of the task, and the severity of the assessor. In this way, the modelseeks to move beyond raw scores and investigate the effect of the condi-tions of the assessment on the grades assigned.
The rating criteria in the assessments using factorial grades can beadapted so that they depend on the different test formats and the tasks.Chalboub-Deville (1995: 21) used different criteria for different tasks, forinstance, “linguistic maturity” was used for interview and narration,“proper temporal shift” and “creativity” for narration only, and “ability tomelodize the script to make reading meaningful” for read-aloud. Saleva(1997: 85) also used different criteria for different tasks in a study on 60Finnish school-leavers given oral tests which contained five subtests. In thefirst subtest called “Reading a letter aloud”, the two criteria “pronuncia-tion” and “fluency” were used, whereas, for instance, in the last one called“Reacting in situations and expressing opinions” only one was used,namely “appropriacy”. In the conclusion of this study, however, it was sug-gested that pronunciation and fluency are natural to use as criteria but “theyneed not be rated in every subtest” (ibid. 1997:145).
When factorial grades are used in the assessment of student production,one of the factors can be given special emphasis. Various methods havebeen used for the purpose of giving more emphasis to one or several of thefactors in the overall score (Underhill 1987: 97). For instance, in the Amer-ican FSI-test, a weighting is done with the help of a Conversion Table of thefive factors: Accent, Grammar, Vocabulary, Fluency, and Comprehension.Grammar is considered to be the most important of the five factors in thistest and is therefore given special emphasis by way of weighting (Wilds1975:38–39; Oller 1979: 323). Another way of weighting factors in facto-rial assessments is by assigning a percentage to each subtest. In this way,the weight of each subtest can be decided in advance in proportion to theother subtests. In Saleva (1997: 86), there were five subtests, and the great-est weight was given to the most demanding subtest called “PresentingFinnish education” comprising the two factors “Transmitting information”and “Fluency”. A third method of weighing was used by McNamara (1996)in the Occupational English Test (OET), which is an Australian government
4 The Rasch model is a variant of methods which belong to what is known as Item ResponseTheory (IRT). According to the IRT, it is possible to separate the difficulty of the item from theability of the student and thereby arrive at two separate measures: item difficulty and personability (Alderson 1993: 3). Three main IRT models have been worked out: the one-parametermodel which only takes account of candidate ability and item difficulty; the two-parametermodel, which also takes account of item discrimination; and the three-parameter model, whichin addition takes account of guessing (Alderson 1995: 91).

36
test of English for health professionals. The test is part of the registrationfor practice in Australia and has been the subject of considerable research.In the Speaking sub-test of the OET, six scales were used in the assessment:(1) Overall communicative effectiveness, (2) Intelligibility, (3) Fluency, (4)Comprehension, (5) Appropriateness of language and, (6) Resources ofgrammar and expression. The first category carried more weight than theothers in the computation of the results by way of determining the student’sfinal score in the following way: the score of overall communicative effec-tiveness was added to the average of the scores of the five other categories(McNamara 1996: 112–113, 220). It was of interest to investigate whatfactor that was the most significant for the total score. The results showedthat an interviewer’s “perception of the grammatical and lexical accuracy ofa candidate’s performance is the most significant factor in the allocation ofthe candidate’s total score” (ibid. 1996: 218).
It is against this general background that factorial grades were used in theassessment of the Gothenburg project (see 5.2. Global and FactorialGrades, and 7.5. Rating Criteria).
The Relationship between Students’ Achievement in Different Skills
Previous studies of the relationship between students’ achievement in thefour different skills, reading, writing, listening, and speaking are obviouslyof interest to a study like the present one.
When students’ achievement in different skills of English is compared,one can look at student performance in different tests which are designed tomeasure particular skills. In studies of students’ performance, there may bea distinction between mode and direction (De Jong and Van Ginkel 1992:187). Listening and speaking both represent oral skills as opposed to read-ing and writing, representing written skills (mode). On the other hand, lis-tening and reading are receptive skills, as opposed to the productive skills,writing and speaking (direction). Correlations in students’ results may thusbe investigated of achievements in oral skills (listening and speaking), writ-ten skills (reading and writing), receptive skills (listening and reading) andproductive skills (speaking and writing). According to Wood (1991: 231),evidence of substantial correlations between the oral skills (listening andspeaking) “and other more general verbal abilities” comes from severalsources, including studies of English as a foreign language.
Bachman and Palmer (1981) reported high correlations for foreign stu-dents between various measurements of speaking and reading. Five differ-ent methods of measuring reading were correlated with the correspondingmethods of measuring speaking.
In a study from Australia, tests with separate scales of rating for the fourskills (writing, reading, listening, and speaking) were used. Twenty stu-

37
dents, described as “moderately to well-educated” participated in thesetests. Of these twenty students, only six were assigned the same grade inthe four skills (Ingram 1984).
The results of students’ performance in reading skills and oral profi-ciency were compared in two other studies (Bachman and Palmer 1981,Reed 1992: 336–338). Reed used the written part in the TOEFL- test andcompared its results with the results in an oral proficiency interview. Hefound considerable variation in the results. There was less variation, how-ever, at the lower and upper ends of the rating scale. This would mean thatthere was a stronger correlation between the results in the tests of studentswho were at an advanced level or at a somewhat elementary level. Theconclusion was that, generally speaking, there was a weak relationship be-tween grades assigned in oral tests and those in written tests.
A similar tendency was shown in two additional studies: good results ina written test do not always predict good results in an oral test (St. John1992: 312, Farhady 1982). These results would suggest that students mayshow varying results in tests of separate skills, especially when the studentsare at an average level in general.
However, the opposite tendency was shown in a study on immersion inSwedish schools. The results put forward by Washburn (1997: 229) gavesupport to the idea that a written test could predict the students’ oral profi-ciency. Washburn found that the National Test of English in Sweden was areliable measure of the students’ oral proficiency. Tests of oral proficiencywere not included in the score at the time. The National Test only com-prised tests of vocabulary, reading comprehension, listening comprehen-sion, grammar, and so-called “cloze” tests.5 Washburn’s study concernedSwedish students participating in immersion classes, and their oral skillwas tested. The results were compared with the students’ results in theNational Test. The results obtained by measuring their oral proficiency withthe help of a limited number of linguistic features, such as grammaticalcorrectness, syntax, and lexicon, showed no great differences compared tothe results the students had obtained in the National Test.
Finally, regarding different results on different tasks included in oral pro-ficiency tests, Pietilä’s study (1999) on the oral proficiency of Finnish stu-dents of English at the university level showed interesting results. In herstudy, the students did not display different degrees of skill in their gram-matical competence, but did so in the “socio-pragmatic aspects of languageuse” that became apparent in the two tasks they were involved in (oralpresentations and group discussions). Success in one task did not necessar-ily predict success in the other task. As for these advanced students, the
5 In cloze tests, words are regularly omitted and the student is asked to fill in the missingwords.

38
conclusion was that they would benefit from increased awareness of variousspeaking conventions, such as conversational behaviour, and from in-creased opportunities to practise speaking.
Students’ Results in Relation to the Assessor’s Background
Chalhoub-Deville (1995) gives a summary of findings from a number ofstudies showing that, depending on their background, diverse assessorgroups may differ in their assessment of students’ oral proficiency. Thebackground variables listed are, for instance, teaching and non-teachingassessors and whether assessors reside in the students’ community or live inthe target language community. Different tendencies could be observed inthe various studies regarding the assessors’ severity; whilst one category ofassessors tended to be critical of students’ linguistic abilities, others couldbe more tolerant. In Chalhoub-Deville’s own study of six students of Arabicas a foreign language assessed by three assessor groups (82 assessors), theresults showed that the three assessor groups emphasized three dimensionsin different ways when assessing students’ overall oral ability.6 The resultswere not consistent with results from previous studies. Galloway (1980)and Hadden (1991) have shown, for instance, that teachers tend to empha-size grammar, and non-teachers tend to be concerned with the more com-municative aspects of language.
1.2. Oral Proficiency TestingIn this section, six issues are discussed with reference to the testing of oralproficiency:
– tasks in oral tests,– the interviewer’s methods in oral tests,– discourse structure and phases in oral proficiency tests,– particular difficulties of oral proficiency testing,– the length of oral tests, and – students’ attitudes to oral proficiency testing.
Tasks in Oral Tests
The test method and the tasks are important in oral proficiency tests. Chal-houb-Deville (1995) emphasizes the influences of the tasks and the testmethods on the results. Alderson, Clapham and Wall (1995: 62) also dis-cuss the need of oral interviews to be carefully structured so that important
6 The three dimensions were (1) grammar and pronunciation, (2) creativity and adequacy ofinformation in subject’s narration, and (3) amount of detail provided (Chalhoub-Deville 1995).

39
aspects are covered with each student and each student is tested in a similarway. “A brief chat” is not enough to be able to assess a student’s level ofproficiency.
Tasks which are to elicit talk may be compared in terms of difficulty.Brown, Anderson, Shillcock and Yule (1984: 64) make a classification oftasks of ascending difficulty. The easiest ones are static tasks, for instancedescribing a diagram, followed by dynamic tasks, such as telling a story.Abstract tasks are considered to be the most demanding ones, giving one’sown opinion, for instance. Obviously the tasks may also be easy or moredifficult within one of the three categories.
Whether the tasks of oral tests are prepared or unprepared may be con-sidered to be dependent on the students’ achieved level of proficiency. Pre-pared tasks may be the retelling of previously studied texts or various func-tional tasks which have been prepared. Unprepared tasks could be discus-sions of controversial issues and role-plays (Tornberg 2000: 157–158).
Weir (1990: 74–80) briefly lists some of the more useful tasks for testingspeaking according to the criteria for communicative language testing. Inwhat follows, eight types of tasks are described in order to give a picture ofvarious tasks in communicative oral tests.7
1. Verbal essay (the student is asked to speak on one or more specifiedgeneral topics)
2. Oral presentation (the student gives a talk on a topic which he/she hasprepared beforehand)
3. The free interview (a conversation which unfolds in an unstructuredway; no procedures are decided in advance)
4. The controlled interview (a conversation in which there are proceduresdetermined in advance for eliciting the student’s performance, for in-stance, a set of questions)
5. Information transfer: description of a picture sequence (the student seesa set of pictures depicting an ordered sequence of events and tells thestory)
6. Information transfer: questions on a single picture (the student is askedabout the content of the picture, the thoughts and attitudes of the peoplein the picture and future developments)
7. Interaction with information gap, interaction between two students orbetween a student and an examiner: completion of missing information(the student should complete the task by asking for missing information,for instance in a diagram or a set of notes)
8. Role play, between two students or between a student and an examiner(the student is expected to play one of the roles in an interaction)
7 The list and the terms are from Weir (1990: 74–80).

40
The ACTFL (American Council on the Teaching of Foreign Languages)oral proficiency interview is a widely used instrument to assess oral profi-ciency in a number of foreign languages. In this oral proficiency interview,the student should have the feeling of participating in a natural conversa-tion, yet the ACTFL test is highly structured. This oral test includes threebasic types of interaction (questions and answers, conversation, and roleplay) and four mandatory phases (the warm-up, the level checks, theprobes, and the wind-down). The examiners are provided with extensiveguidelines regarding strategies for eliciting speech, for instance the effect ofthe type of questions asked, and regarding the use of the package of rolecards provided for the highest levels of the test. Furthermore, the ACTFLTester Training Manual (Buck 1989) emphasises the use of natural conver-sational language and that “the transmission of meanings” is paramount.Experienced and trained examiners of the ACTFL interview are expected tothink of the oral proficiency interview as a series of topics, rather than aseries of questions. Conducting the ACTFL oral proficiency interview isdescribed as highly demanding. The results from Saleva’s study on Finnishstudents in ACTFL oral interviews showed that “particularly in the case ofadvanced candidates, the linguistic demands combined with the situationalcomplexity present so demanding a challenge to a non-native interviewerthat both reliability and validity may suffer” (Saleva 1997: 143).
The tasks in oral tests could be expected to provide a representative sam-ple of useful interactions in speech. In an Israeli study on 103 twelfth-grade-students, four experimental oral tests were used which representedfour speech styles of different domains of oral proficiency. The four testswere the oral interview (a dialogue with the examiner), the role play (spon-taneous speech behaviour within given roles eliciting speech functions), thereporting test (a monologue), and the group discussion (spontaneous dis-cussion of a controversial issue). Each test was rated separately and withthe same rating scale. The results of the study were, among other things,that there was a justification for the use of four different tests in order to tapoverall oral proficiency and a wide range of speech functions, and to offerthe student more than one opportunity to demonstrate his or her oral com-petence.
Tasks which are completed in language studios can be a means of ensur-ing that a range of situational contexts are covered. The Finnish ForeignLanguage Diploma for Professional Purposes contained an oral part(Huhta, Sajavaara and Takala 1993: 140–144).8 In this test, oral proficiencywas tested with the help of a language studio test. The tasks in the studiotests were, for instance, reading aloud, reacting in simulated telephone con-
8 The test is described in 1.1. Measuring Student Performance.

41
versations and various other contextual situations, and giving an oral pres-entation. In addition to the tasks of the language studio test, the studentswere engaged in a face-to-face interaction in two, or when necessary, threeparts. The tasks were a formal presentation, which was followed by aninterview or a discussion. The third task consisted of the student asking theinterviewer about certain issues.
The Interviewer’s Method
As discussed above, oral tests may occur in an interactional context. Theexaminer in an oral test is not just the assessor but often also the conversa-tional partner who is supposed to elicit a rich sample and support the studentin his or her oral production. Since all students are to be given the sameopportunities to show their competence, it may be argued that it is of impor-tance that the examiners conduct themselves in similar ways (for the instruc-tions for the interviewers of the Gothenburg project, see Appendix 5).
In a study on 58 Japanese language school students with varying levelsof proficiency who were interviewed by ten native speaker examiners in atwo-stage assessment of the CASE (Cambridge Assessment of SpokenEnglish), the types and patterns of the interviewers’ support were investi-gated. The analysis was descriptive, focusing on the range of speech behav-iours present in the material. Eight types of support were identified. Theyare described in what follows.
(1) Priming topics. The interviewer introduced the topic to the candidatebefore the question was asked.
(2) Supplying vocabulary or other collaborative completions. The inter-viewer supplied words or completed turns during a student’s answer.
(3) Giving evaluative responses. The interviewer gave evaluative re-sponses, such as “Good!” after a student’s answer.
(4) Echoing and correcting responses. The interviewer repeated, as confir-mation, or corrected the student’s answer.
(5) Repeating questions. When the student had difficulties answering, theinterviewer repeated the questions with slowed speech, more pausing,and over-articulation.
(6) Questions followed by statements that only require the student’s confir-mation. After the student had answered the interviewer’s question, theinterviewer gave statements that merely required confirmation.
(7) Drawing conclusions for the student. After the student had answered aquestion, the interviewer reacted with a conclusion based on that an-swer.
(8) Rephrasing questions. The interviewer rephrased questions to check orfacilitate comprehension.

42
The conclusions of the study were that processes of and practices in conver-sation obviously were present in the oral interviews, and that all the exam-iners supported the students to some degree. Differences could be observedin the types and frequencies of support employed by the ten examiners(Lazaraton 1996).
Young and Milanovic (1992) studied the discourse structure in the oralpart of the Cambridge First Certificate Examinations. Their investigation of30 examinations showed that students talked more than the interviewersdid, a finding which was not surprising since the purpose of the exam wasto make the candidates speak. The study also showed that only a minor partof the variation in the student’s oral production could be accounted for bythe interviewers’ behaviour.
Particular Difficulties of Oral Proficiency Testing
Oral proficiency testing is today considered to be a valuable and usefulmeans of obtaining a complete evaluation of a student’s speaking skill inEnglish. Many teachers regard oral proficiency tests as natural parts in theassessment of students’ overall performance of a foreign language. Theintroduction of oral proficiency tests of English, to complement tests ofessay writing and tests of reading and listening comprehension, has been anatural way of developing language testing at school.
Nevertheless, testing the ability to speak English has been, and is stillregarded, to a certain extent, to be the most problematic area both in termsof practical arrangements and in terms of reliable assessments (cf., for in-stance, Weir 1990: 73–74; Shohamy, Reves and Bejarano 1986, Ericsson1989: 399). Furthermore, testing the oral skill entails some particular diffi-culties that should be mentioned.
The oral proficiency interview is often carried out with the students’language teacher at school, and there is thus a communication in a foreignlanguage with individuals who have the same mother tongue. Particularly atelementary levels, the test may be constructed so that the examiner knowsthe answers to the questions which are posed, and this makes the conversa-tion far from authentic. Furthermore, the conversation can be limited todeal with the students’ personal matters, such as his/her family and hobby.The student may be unwilling to talk about these issues but at the same timemay lack appropriate means of expressions to discuss other topics. Ducro-quet (1986) discusses these issues as practical problems in communicativeoral language testing.
As to practical arrangements, oral interview tests are claimed to behighly time-consuming, whether they are carried out individually or ingroups of students. The fact that the oral interviews require the presence ofan assessor, often the students’ teacher, during the completion of the test

43
can make it a cumbersome means of evaluating students’ proficiency inEnglish. In addition, oral tests require special practical arrangements interms of rooms at schools; oral tests cannot, as other types of tests, takeplace in the same room in which other students are studying. Moreover, thefact that the oral test may be a new way of testing for many teachers involv-ing the use of new methods and equipment could be problematic in somecontexts and put new demands both on the school administration and on theteachers (von Elek 1995; Erickson 1996: 40; Olsson 1996).
The Length of Oral Tests
The length of the oral proficiency interview of the ACTFL (see above) isdescribed as varying with the proficiency level of the student; the higher thelevel, the longer it takes to elicit an adequate sample of speech due to theextensive rating criteria of the higher levels. Furthermore, the instructionsstate that “unusual cases of various kinds, such as particularly shy or re-served students, need longer interviews”. In general, the range of the lengthof the tests varies from under ten minutes at the most elementary level up tothirty minutes in the most unusual cases (Buck 1989: 4-1). According toUnderhill (1987: 40), oral tests are most often between eight and twelveminutes long. Factors that influence the length of the tests are the level ofthe student’s proficiency, the aims of the test, the personality and back-ground of the student, and practical considerations such as time available.
It is worth observing that the length of tests may be expected to be ofsignificance in the reliability of the test scores. The longer the test is, themore adequate the sample of the ability is expected to be (Bachman 1990:220) (for the presentation of the length of the oral tests in the Gothenburgproject, see 6.4. Issues to Take into Account: the Students’ Speech Rate andthe Length of the Oral Test, and Appendix 10).
Students’ Attitudes to Oral Proficiency Testing
Students’ attitudes to certain types of tests or testing in general should notbe neglected. The students’ attitudes and expectations could influence theirtest results. In a study of Finnish students, the results showed that the atti-tudes towards both learning and testing the spoken language were “stronglypositive” (Saleva 1997: 139). Erickson and Börjesson (2001) state that stu-dents seem to appreciate tasks which are felt to be authentic conversation,and that generally and irrespective of age or level of language proficiency,they like tasks which include free oral and written production in the SwedishNational Language Tests. In a report from the introduction of oral tests at aSwedish comprehensive school, the great majority of the students expressedin the questionnaire used that “oral tests are important or very important”(Olsson 1996). As regards the students’ attitudes to direct and indirect tests,

44
it seems that students have a positive attitude towards the former (Shohamy1982). (For the students’ attitudes in the Gothenburg project, see the ques-tionnaire in Appendix 7 and 8.9. Students’ Opinions about the Test).
1.3. Linguistic Analyses of Students’ ProficiencyAn important part of the present study includes the investigation of theextent to which the assessment of oral proficiency can be influenced bystudents’ use of certain linguistic features (cf. 6.2. Linguistic Features). Forthat reason, this section discusses results from previous analyses of studentproficiency, particularly with respect to the assessment of the linguistic fea-tures listed below and students’ uses of these features. The features are asfollows:
– the verbal group– vocabulary and compensatory strategies– discourse markers: well and you know– aspects of pronunciation
The reasons for including these particular linguistic features are partly thatthey are well-known difficulties for Swedish learners or foreign learners ofEnglish more or less generally, and partly that other researchers have foundthat they seem to influence the assessment of oral proficiency. (For a furtherdiscussion of the selection of the linguistic features, see 6.2. LinguisticFeatures.)
The Verbal Group
The third person singular marker. The third person singular marker istaught at an elementary level in Swedish schools, and teachers know thatSwedish students’ use of it differs from the usage prescribed in grammars.Furthermore, accuracy in verb morphology is generally recognised as anindex of development in second language acquisition (Bartning and Sch-lyter 1986: 9, Crookes 1989: 371).
The third person singular morpheme is also of interest due to the varia-tion found in some varieties of English. In African-American VernacularEnglish and in dialects of the East Anglian area, there is evidence of nativespeakers omitting the third person singular marker with all persons (Labov1972: 33). In western and northern dialects of England, on the other hand,the ending is added to all persons of the present tense on the verb (Trudgill1990: 94).
Students’ spoken language often contains a higher proportion of gram-matical errors than their written language. When students write, they havetime to correct their production and consequently can be more accurate
45
than in spontaneous speech. A lower level of accuracy can therefore beexpected in oral than in written data. In a study of grammatical morphemes,Tarone (1985) found lower levels of accuracy in speaking than in writing ina study of style shifting, and with a focus on three grammatical morphemes(the third person singular marker, the article, the plural -s) and one gram-matical structure (direct object pronouns) in three different tasks. Studentswere least accurate with the third person singular marker in an oral narra-tive. Similar findings are reported in a study on Arabic-speaking studentslearning English (Scott and Tucker 1974: 79). Those results showed thatverb errors had different frequency patterns in written and oral production.The third person singular verb was unmarked three times more often inspeaking than in writing.
The grammatical function of a morpheme is also of significance for itsoccurrence and distribution in student production. In a study of Japanesestudents of English, the students were more inclined to omit the third per-son singular marker than the plural -s when the latter morpheme containedinformation. This suggests that the redundancy of the third person singularmarker contributed to its omission (Saunders 1987: 261). The results are inline with what Young defines as “the functional hypothesis” (Young 1993).Furthermore, Larsen-Freeman (1976) found that language background (Ar-abic, Persian, Spanish and Japanese) did not have a significant effect on theway learners order English morphemes.
The fact that Swedish students, in contrast to native speakers, have diffi-culties with the prescriptive use of the third person singular marker is docu-mented in several studies. In the production by native speakers of English,omissions of the third person singular marker can be regarded as, for in-stance, slips of the tongue, whereas the same phenomenon in a non-nativespeaker’s production makes a different impression on the interlocutor(Thagg-Fisher 1985: 42 ; Fromkin 1973: 266).
Although non-standard instances of the third person singular marker areregarded as serious errors (see below), they are frequent in Swedish studentproduction.9 In a study carried out on Swedish university students of Eng-lish, the category of singular pronouns combined with unmarked verbforms (*he go) was the largest category of “contiguous” concord errors.Plural pronouns with marked forms (*they wants) yielded far fewer in-stances. The uses with noun subjects were distributed evenly between un-marked and marked verb forms (Thagg-Fisher 1985: 39).
Even though some varieties of English contain non-standard instances ofthe third person singular marker, there is evidence that assessors are criticalof students who do not follow the norm of the standard language. Native
9 For a discussion of the terms standard and non-standard, see 6.4. Defining Standard Eng-lish and Non-standard English instances.

46
informants showed this attitude in the study carried out by Thagg-Fisher(1985) on Swedish university students of English. The students participatedin oral tests with two tasks: storytelling and description of pictures. In thesetests, instances of concord error according to the pattern “singular pronoun/singular noun + plural verb”, i.e. the absence of the third person singularmarker, were assessed on a scale whose polar terms were “completely nat-ural and normal” to “extremely unnatural and abnormal”. Structures of thetype “plural noun + singular verb”, i.e. where a non-standard third personsingular marker was added, obtained the same assessment as those with theomission of a standard third person singular marker. The results led to thestructures with non-standard addition or omission of the third person singu-lar marker being categorised in the group “Extremely objectionable items”(Thagg-Fisher 1985: 182).
The progressive form. The acquisition of the progressive form in Englishmay pose difficulties for a native speaker of Swedish. One of the reasons isprobably that the construction does not exist in Swedish. The correct use ofthe progressive form, sometimes situationally bound, presupposes knowl-edge of aspect, which can be a very demanding concept to internalise evenfor the advanced language student. The considerable difficulties Swedishstudents have with the progressive aspect are discussed by e.g. Edström(1973: 128) and Axelsson and Hahn (2001).
In a school grammar of English used in Sweden, it is claimed thatSwedes tend to use the progressive form too often (Hargevik and Hargevik1993: 180). Hultfors (1986: 106) also points out foreigners’ tendency toexaggerate the use of the -ing participle. In Hultfors’ study, native speakers’attitudes to the improper use of the -ing participle with the usually stativeverb mean were investigated. The sentence “He is meaning this book, notthat one” made a “rather strong foreign impression on the informants butdid not cause much intelligibility difficulty” (Hultfors 1986: 186). The sen-tence was classified as more serious than most other errors.
Vocabulary
It may be assumed that students’ vocabulary is of significance for success-ful communication; the more words they know, the more likely they are toget their messages across. In spite of this assumption, students’ use of vo-cabulary seems to have been a neglected area of linguistic research(Jaatinen and Mankkinen 1993: 148). Vocabulary, as an open-ended sys-tem, has attracted less attention than more closed systems, such as grammar(Takala 1984: 1). Furthermore, vocabulary has not received much attentionin teaching either. Syntactic structures to be learnt seem to be more easilyspecified in a syllabus than size, types or range of vocabulary (Carter 1987:

47
145). The importance of vocabulary in the assessment of student produc-tion cannot be neglected, however. Students’ lexical errors may be lessgenerously tolerated than mistakes in syntax (Carter 1987: 145).
It is to be expected that an incorrect use of words could be an importantnegative factor in the assessment of oral proficiency. In a study of nativereactions to errors in Swedish students’ English, Johansson (1978: 71)found that lexical errors caused a higher degree of irritation than grammat-ical errors. Johansson states that this is not surprising since “grammar dealswith the rule-governed predictable aspects of language, the lexicon with theidiosyncratic, unpredictable aspects”. Similar results were found in a studyof Arabic students of English and the assessments of their written produc-tion. Native speakers tended to judge semantic errors as more serious thansyntactic errors (Khalil 1985). These tendencies were confirmed in a studyof Swedish university students and their errors in written and spoken Eng-lish: lexical errors were categorised as serious errors (Petti 1979). In thatstudy, three categories of lexical errors were identified. The first categoryincluded “very common words” such as the distinction between teach andlearn. The second category consisted of words that are almost identical inspelling in Swedish and English but have completely different meanings,for instance, novel in English and novell in Swedish (=short story). Thethird category included words that are or should be studied systematicallyowing to the differences in their uses and meanings in Swedish and English,for example the Swedish word skada, which can be translated in a numberof ways, such as injury, damage, harm, mischief and pity. A scale of 0 to 3/4 was used to describe the seriousness of errors. Most of the lexical errorswhich could be categorised in the first category, “very common words”,were assessed as “unacceptable usage and felt to be a serious error”. Theyoften caused irritation and/or misunderstanding.
In another Swedish study the conclusions were slightly different, how-ever. Five sentences were used in order to test native reactions to lexicalerrors, for instance the inappropriate choice of the verbs make or do. Theeffect of the lexical errors was described to be of medium gravity (Hultfors1986: 202).
The lexical errors described above are evidence of interference fromSwedish. According to Corder (1981: 24), interference is defined as theprocedure when “the student carries over habits of the mother tongue intothe second language”. Lexical errors occur when students use patterns ofvocabulary from their mother tongue in the foreign language. Evidently,interference may be either positive or negative. Positive interference leadsto grammatical and appropriate use since there are similar patterns andstructures in the student’ mother tongue and the target language. Negativeinterference leads to ungrammatical and inappropriate production.

48
Students’ vocabulary can be investigated not only in terms of correct andincorrect uses, but also from another perspective, namely whether the cho-sen words contribute to an impression of fluency in the assessment of stu-dents’ speech. In a 1994 study, the oral performance of Dutch students aged11 to 12 years was assessed in terms of fluency and delivery in narrativediscourse. Two variables were thought to be relevant for the prediction ofthe Global grades assigned. They were “lexical means for reinforcing orweakening narrative register” and “phonetic means”. A subcategory of theformer variable was “reinforcers of register”. This term was based on aclassification by Quirk et al. (1985) and included the subcategories adjec-tives and adverbs as modifiers (emphasizers, amplifiers, downtoners), verbswith a reinforcing function, reinforcing repeats, theatrical utterances, origi-nal metaphors, and lexical anaphors. The reinforcers of register were meas-ured by counting all instances of the subcategories above; they emerged asone of the most powerful predictors of the ratings of delivery (van Gelderen1994: 300). In this connection it is interesting to note that modifiers occurmore often in the spoken than in the written language. In a study of twocorpora,10 the distribution of the types and tokens of degree modifiers ofadjectives was investigated. The degree modifiers included in the investiga-tion were more common in the spoken than in the written data (Paradis1997: 40).
Compensatory strategies. One important aspect of students’ lexical difficul-ties to be studied is their ability to cope with their inadequate knowledge ofwords. Strategy is the term that frequently emerges in discussions of thesetechniques. In what follows, definitions and descriptions of categories ofcommunication / compensatory strategies are given in order to provide abackground to the twelve categories of compensatory strategies distin-guished in the present study (cf. 9.2.3. Students’ Lexical Errors and Com-pensatory Strategies).
Selinker (1972) was the first to discuss communication strategies: heused the term to account for certain errors made by students of a foreignlanguage. In the students’ attempts to express themselves in spontaneousspeech, these errors are consequences of inadequacies in their use of theforeign language. Corder (1981: 102) defines a communication strategy as:
a systematic technique employed by a speaker to express his / her meaning whenfaced with some difficulty.
Bialystok (1990: 1) defines communication strategies as attempts to over-come gaps between the students’ needs and their knowledge of English.
10 The London-Lund Corpus and the Lancaster-Oslo/Bergen Corpus.

49
These gaps can be of various types: a word, a structure, a phrase, a tensemarker, or an idiom.
The term compensatory strategy is used by Lennon (1990: 396) to de-scribe the methods students employ when they discover that their knowl-edge is not sufficient to communicate an intended message.11 Compensa-tory strategies are claimed to be distinguishing features of advanced stu-dents’ spoken performance. A compensatory strategy is defined as:
the strategies that learners employ, consciously or unconsciously, to communicateunder circumstances of impending breakdown when their linguistic resourcesthreaten to be inadequate for communicating the intended message.
Students may be either conscious or unconscious of their uses of strategies.Bialystok (1990: 3) discusses this characteristic trait, i.e. conscious or un-conscious use of strategies and adds two other characteristics common toall communication strategies. Firstly, the speaker has a problem that mayinterrupt the communication. Secondly, the student also masters a numberof strategies. With this perspective, the student may deliberately select onestrategy before another.
A communication strategy is not only a characteristic of non-nativespeakers but may also emerge in communication between native speakers.Researchers have tried to detect differences between strategies used by na-tive speakers and those used by non-native speakers. The results from sev-eral studies indicate that there are in fact few qualitative differences whennative and non-native speakers try to solve problems in communication.Parallels can be drawn between strategies employed by learners of a lan-guage and for instance, mechanisms developed in pidgins to extend a re-stricted vocabulary (Poulisse 1989: 8).
Tarone (1977) classifies strategies into three categories: paraphrases,borrowing, and avoidance. Paraphrases include approximation, word coin-age, and circumlocution. Borrowing comprises the subcategories of literaltranslation, language switch, appeals for assistance, and mime. Finally,avoidance includes either topic or message avoidance.
Varadi (1983) has a slightly different approach and bases his classifica-tion on the presumption that communication strategies involve message ad-justment. He distinguishes message adjustment by way of reduction or re-placement. Corder (1981: 104) also includes message adjustment in hisclassification, stating that students choose message adjustment strategies orresource expansion strategies. In the former category, message adjustmentincluding risk-avoidance strategies, students tailor their messages to the
11 Bygate (1987: 115) uses the term of compensation strategies to describe “ways of com-municating by improvising temporary substitutes when the speaker lacks normal language”.

50
linguistic resources that are available, for instance by topic or messageavoidance or message reduction; owing to the lack of linguistic resourcesstudents choose to say something different than what was planned. Thelatter category, resource expansion strategies, which could be risk-runningstrategies, includes strategies where students attempt to increase their re-sources with the risk of failure in the form of misunderstanding or commu-nication breakdown.
Faerch and Kasper (1980) describe a taxonomy of three categories ofstrategies with regard to whether students avoid difficulties or compensatein some way. The three general categories are formal reduction strategies,functional reduction strategies, and achievement strategies. In the first cate-gory, students avoid a linguistic item, for instance a word. In the secondcategory, they avoid an entire speech act, for instance an apology. Finally,in the third category, they do not avoid or omit linguistic elements but com-pensate in the form of transfer, paraphrase, or word coinage.
Bialystok (1983) categorises strategies according to the language used.The first category is language 1 based strategies, which includes strategieswhere students switch to their mother tongue. The second category is lan-guage 2 based strategies, where strategies such as circumlocution are used.The third category includes strategies of paralinguistic features.
Strategies of interaction with the interlocutor may be classified in a sepa-rate category as types of achievement strategy. In the classification by Tar-one (1977: 199), appeal for assistance is a category, and Faerch and Kasper(1980: 98) distinguishes cooperative strategies in their taxonomy. Interac-tional strategies are, for instance, appeal for help, and strategies when stu-dents try to talk about their difficulties in finding a word or arrive at solu-tions with the help of the interlocutor. Students’ talk about their languageuse was investigated in a study of Swedish students in immersion classes(Washburn 1997), mentioned above (cf. 1.1. Measuring Student Perform-ance). The primary reason for using such meta-linguistic comments wasvocabulary difficulties. Seven categories of compensatory strategies wereidentified, some of them involving meta-language: (1) the use of a Swedishword, (2) the abandonment of the message, (3) a request for help in Swed-ish, (4) a meta-linguistic comment in Swedish, (5) the use of an Englishparaphrase, (6) a meta-linguistic comment followed by an English para-phrase and finally, (7) a request for help in English.
Evidently, it would be useful to investigate the types of strategies used inrelation to the grades given to students’ performance. In a study on schoolchildren in New York who studied French, the results showed that thenumber of hesitations, self-corrections, false starts, incoherences, andword-creations did not affect the teacher’s global rating of oral proficiency(Snow and Dolbear 1989). On the other hand, the possible positive effect of

51
the use of strategies for communication is pointed out by Seliger (1980:90). Seliger states that some strategies act as clarification devices and areimportant for the understanding since the language produced by a studentmay contain elements that are strange to a native speaker. Hesitations, rep-etitions, false starts, and word searching could make the message clearerand facilitate understanding.
The next linguistic feature that is investigated in this study on the assess-ment of students’ oral proficiency concerns the use of certain discoursemarkers that are frequent in oral production.
Discourse Markers: Well and you know
Written language is organised so that meaning is made clear, for instance,by breaking up the text into manageable chunks such as chapters, subsec-tions and paragraphs. Spoken language may be organised, for instance inadjacency pairs or with the help of various conversational continuatives ordiscourse markers. These items may indicate that the speaker intends tocontinue or that the speaker wishes to involve the hearer in the communica-tive process (Collins and Hollo 2000: 165). In what follows, the use of twodiscourse markers in spoken language is discussed.
Well. Well is a frequent discourse marker in spoken English. In the Lon-don-Lund Corpus (casual conversation) there was an average of one wellfor every 150 words (Svartvik 1980: 169). Stenström (1984: 143) foundthat well was the most common initiator of any move in a Question-Re-sponse exchange. Aijmer and Olsson (1990: 41) claim that well is the mostcommon English “conversational phrase”, and that it occurs almost as fre-quently as the words is and was in English. Quirk et al. (1985: 444) empha-sise the significance of discourse markers because of their high frequencyas initiator in spoken English.
Bygate discusses four main ways in which speakers can facilitate pro-duction of speech. They are simplification, ellipsis, the use of formulaicexpressions and the use of fillers and hesitation devices. The fillers andhesitation devices give speakers the time they need for the planning of theproduction. Well and you know (cf. below) are listed as frequent types offillers (Bygate 1987: 18).
Well is attributed a range of characteristics and discoursal functions.Leech and Svartvik (1975: 114) describe well as an attention signal, a re-sponse to a statement to express surprise, pleasure, and/or regret. Stenström(1984: 139) classifies well as an initiator which has the main pragmaticfunction to reflect attitude. Schourup (1985) introduces the concept of evin-cive in a discussion of common discourse particles. He defines the evinciveitem as an item which indicates some form of unexpressed thinking on thepart of the speaker. According to his definition:

52
a linguistic item that indicates that at the moment at which it is said, the speaker isengaged in or has just been engaged in thinking, the evincive item indicates that thisthinking is now occurring or has just occurred but does not completely specify itscontent (Schourup 1985: 18).
One of the functions of evincives is backgrounding: the speakers show thatthey are or have just been thinking without exhibiting unnecessary details(Schourup 1985: 26). Well is described as an evincive used as an indicatorof some internal consultation speakers wish to bring up (Schourup 1985:90–91). The speaker has something in mind but does not say exactly what itis. Well may thus indicate that what is said has been subject to prior consid-eration. Other possible reasons for the occurrence of well in speech are, forinstance, topic shifts, closings, or changes from introductory to topic talk(Schourup 1985: 73). Lakoff (1972) discusses the use of well when conver-sational rules are violated. This assumption is based on the theory that inconversation we comply with certain rules. These so-called conversationalmaxims are described, among others by Grice (1968) and Gordon and La-koff (1971). Well, along with other items, is used if these rules are violatedand the participants in the conversation discover, for instance, contradic-tions. Lakoff states that such particles serve as:
warnings to participants in the discourse that one or more of these rules is about tobe or has been violated (Lakoff 1972: 916–917).
Well may also tell us something about the speakers’ attitudes either to theiraudience or to what they are saying. According to Leech and Svartvik(1975: 23) well can indicate such attitudes as agreement, reinforcement, ora positive reaction.
The survey above provides a picture of the fact that well is used in differ-ent contexts and for various purposes. It may be assumed that well is ofsignificance for the impression of fluency in spoken production. This idea isfurther discussed in what follows.
In Riggenbach’s study from 1991, the results suggest that the use of filledpauses – and well could be a filled pause – tends to be one of the factors thatcontribute to an impression of fluency (Riggenbach 1991). In this study,English instructors rated six non-native speakers of English as either fluentor non-fluent. Differences were found in the kinds of filled pauses that wereused by the two groups. Although the differences were not statistically sig-nificant, it was noteworthy that “fluent” non-native speakers used more socalled higher-level fillers, i.e. lexical fillers, than did “non-fluent” non-na-tive speakers, who tended to use non-lexical fillers and unfilled pauses(ibid. p. 431). The filled or unfilled pauses were considered the most impor-tant components for fluency in non-native speech.

53
In the light of the high frequencies and various functions of well listedabove, it may be expected that instances of well can influence the interview-ers’ impression of the students’ performance. For that reason, well is ahighly useful linguistic feature to include in the present survey.
You know. You know is the second discourse marker of interest in the presentstudy. When speakers use you know, they want hearers to adjust their orien-tation toward the reception of the message. Speakers use you know with anemphasis on the interaction. Östman (1981: 20) discusses this role of youknow and describes it in terms of switching from deference to camaraderie.You know could be a signal of a more informal level of conversation andindicate to the interlocutor that the speaker wants to be taken as an equalpartner in the conversation.
Another characteristic adhered to you know is its use for implicit trans-mission. The speaker communicates his attitudes and feelings to the propo-sitional content of what is being said but does not add anything new to themeaning of the sentence by using you know. Östman (1981: 17) defines thecore meaning of you know in the following way:
The speaker strives towards getting the addressee to co-operate and/or to accept thepropositional content of his utterance as mutual background knowledge.
Using you know is a plea for co-operation in understanding or interpretingwhat is being said.
Quirk et al. (1985: 1481) list you know among the comment clauses thatare used as direct allusions and appeals to the addressee. They are claimedto be characteristic of speech. Another interesting tendency worth mention-ing is that you know is found to be used more by women than by men(Östman 1981: 72). You know is one of the hedges (other examples are sortof, I think and perhaps) which express the speaker’s certainty or uncertaintyabout the proposition under discussion. Previous research has shown thatdifferences in men’s and women’s use of you know not only is a matter offrequencies but also of functions (Coates 1993: 116–118).
The position of you know in the utterance has also been investigated. Theoccurrence of you know as turn-initiator and in turn-final position is de-scribed by for instance Schiffrin (1987) and Östman (1981). Erman (1987:50) found that a great majority (84.6%) of the instances of you knowemerged in medial position. Finally, the contexts where you know occurshave been investigated. Östman found that you know was used “in particu-lar in narrative parts of conversations” (Östman 1981: 16).
Considering the functions of you know listed by these researchers, itseems reasonable to assume that the occurrence of you know in the studentproduction may be of significance for the assessment.
54
The fourth and final linguistic feature investigated in the present studyconcerns the students’ pronunciation.
Aspects of Pronunciation
In discussions of non-native speakers’ pronunciation of English, three is-sues should be taken into consideration. Firstly, pronunciation is geograph-ically and socially less uniform than many other variables, such as syntax orlexis (Saleva 1997: 43). With the many speakers of English throughout theworld, the question of norm is a matter of controversy (see for instance,Kachru 1992; Newbrook 1991). Secondly, the objective of the learning ofpronunciation is of significance for testing, i.e., what is the standard re-quired? Native-like fluency can be regarded to be the traditional aim. VanEls and De Bot (1987: 147) however discuss intelligibility and acceptabilityas desirable aims. If the two come into conflict, assessors’ decisions shouldbe based on considerations of the aims of the learning. Thirdly, we do notknow for sure about the role played by different errors of pronunciation forthe assessment, for instance, errors in the pronunciation of individualsounds in comparison with errors in pausing or stressing (Lehtonen 1977:41). Though the importance of different types of error is not clear, there isno doubt about the significance of pronunciation for the assessment in oralproficiency interviews. Mistakes of vocabulary and grammar can, at leastpartly, be avoided by efficient communication strategies, whereas pronunci-ation is present and is assessed throughout an oral test.
Intonation. Intonation is obviously important for meaning in many dif-ferent ways since it has many different functions. At the same time how-ever, intonation patterns are notoriously difficult to present concisely andaccurately, partly because they are so deeply interwoven with informationabout the speaker’s attitude to the interlocutors. The number of possiblecorrect intonation patterns is quite large (Minugh 1991: 66). Intonationcan modify, or even contradict, the literal content of an utterance. In con-texts where intonation and other elements come into conflict, the interloc-utors’ inferences on the meaning are based on the intonation used (Hurley1992). In investigations of non-native speakers’ intonation of English,there is evidence of how meaning is inferred from intonation. Seliger(1980: 89) discusses the use of rising intonation by students of English inone particular context. This intonation is used to indicate some form ofhypothesis-testing which allows the student some additional time to un-derstand what the partner in the conversation has said, as in the followingexample:
“– How do you feel as a foreign student?”“– Foreign student? (rising intonation)”

55
The repetition of a part of the question with rising intonation is a form ofcheck of what has been said. Intonation is used as a means of confirmingthe correctness of the student’s own hypothesis of his/her use of a word orstructure. The word or structure is first uttered, as it were, for inspection andthen uttered a second time to indicate its acceptability, the first time withrising intonation and the second time with falling intonation (Seliger 1980:93). The rising intonation can be interpreted as a request for confirmationfrom the listener, similar to a question.
Although descriptions of intonation emerge in rating criteria, intonationis seldom tested by itself. Saleva (1997: 49) discusses a number of explana-tions for this fact, which can be summarised as follows. Firstly, given theprevalent communicative approach in teaching and testing at school today,the testing of single features, such as intonation, is rare. Secondly, the com-plexity of the phenomenon itself and thereby the insufficient capacity of thetester contribute to other approaches in testing. Thirdly, in spite of variousattempts at systematization, no standard has emerged. Furthermore, for-merly established theories change, for instance, the rule about wh-questionshaving a falling tone, which is now partly disputed (Gutknecht 1991: 266).Fourthly, it is difficult to assess a phenomenon whose effect is dependent onthe context and the information that other elements, such as vocabulary orsyntax, bring to the utterance.
Speech rate. Fluency is associated with a temporal element, and speech maybe expected to have a regular pace and an even tempo. The Sajavaara-Lehtonen 1978 experiment, however, showed experimentally that speed wasnot constant across different discourse genres but varied and depended onthe task (Sajavaara and Lehtonen 1978). In that study, students and nativespeakers were asked to read aloud simple and complex English texts anddescribe two sets of cartoons in English. In the reading tasks, the speech ratewas faster than in the cognitively more demanding narration task.
Tauroza and Allison (1990) also showed that speech rate is different fordifferent types of discourse in British English. Their results showed higherspeed in, for instance, conversation than in lectures to audiences consistingmainly of non-native speakers of English. Their conclusion was that there isno correct rate of speech applicable to all situations.
Studies of non-native speech and ratings of fluency indicate that stu-dents’ speech rate shows a clear pattern of correlation to the grades as-signed. Riggenbach (1991) found significant differences in a study of sixnon-native speakers and pointed out that the “chunking together” of disflu-encies was important. A chunk of disfluency was defined as, for instance,“word search or ways of analysing, processing and observing what willcome next”. A high number of disfluency chunks leading to a low speech

56
rate may indicate low fluency, whereas a low number of disfluency chunksleading to a high speech rate may indicate high fluency.
The results of a study of German students of English point in the samedirection (Lennon 1990). The participants were four female German uni-versity students aged 20 to 24 years who were spending six months at theUniversity of Reading. On their arrival in Reading, they had a multiplechoice test which comprised grammar, vocabulary and reading comprehen-sion. The four students got high scores on the test. Within two weeks oftheir arrival they were also asked to retell a story with the help of somepictures. Shortly before their departure they were asked to re-tell the six-picture sequence again. The assessments of fluency were carried out bynine native-speaker teachers of English. They were asked to assign fluencyratings to each recording. The results of Lennon’s study show that the as-sessors had no difficulty in deciding for each subject which was the earlierand which was the later recording. A majority agreed that for each subjectthe second rendering was more fluent than the first one. To investigate flu-ency closely, Lennon used twelve measures, and in three of them all fourstudents changed their linguistic behaviour in the same direction. The threemeasures, namely speed, filled pauses and T-units followed by a pause aredescribed below. First, Lennon distinguishes “pruned words” per minute.Lennon defines “unpruned words” as all the words produced by the speakerwhereas “pruned words” exclude self-corrected words, repetitions, com-ments on the narrating task itself and words addressed to the interviewer.The second time there was an increase in speed. Speed was thus measuredby counting pruned words in the production. Secondly, Lennon countedfilled pauses per T-unit. In the second rendering there were fewer filledpauses. Thirdly, attention was paid to the percentage of T-units followed bya pause. Three students had a decrease the second time and one of them hadthe same score.
These aspects of students’ pronunciation, together with the other linguis-tic features discussed in this chapter, are components of students’ oral pro-ficiency in English. In the next chapter, certain central concepts, such asoral proficiency, are discussed.

57
CHAPTER 2
Methodological Considerations
2.1. IntroductionThe aim of the present chapter is to introduce five central concepts applica-ble to any kind of foreign language testing and necessary for the under-standing both of the test format employed in the Gothenburg project and ofthe analysis of the results. As has been described above in the Introduction,oral proficiency is one of the main goals of foreign language syllabi andneeds to be analysed in some detail. Secondly, the basic statistical and psy-chometric concepts of reliability and validity should be discussed with spe-cial reference to the testing of oral proficiency. Finally, the two concepts ofacceptability and intelligibility, which are crucial to the assessment of anykind of language production, will be analysed and defined.
2.2. Oral ProficiencyIn this subsection, proficiency, and in particular oral proficiency, is dis-cussed. In investigations of students’ mastery of a foreign language, certainterms are used. Besides proficiency, these terms are, among others, stu-dents’ ‘competence’, ‘capability’ and ‘capacity’. They sometimes refer tothe same phenomenon and they may also occur in similar contexts. Theirdefinitions are often more or less overlapping, as, for instance, Widdow-son’s (1983: 8) definition of ‘capacity’ which could very well be used todefine ‘proficiency’:
The ability to use, produce and understand utterances by using the resources of thegrammar in association with features of context to make meaning.
However, these concepts are often treated separately, with their own differ-ent definitions, as is the case in the following example where Ellis (1994:

58
720), as is quite common in foreign language literature, makes a distinctionbetween proficiency and competence1:
Proficiency is the student's skill in using the second language. Competence is theknowledge of the language the student has internalised. Proficiency is thus the abil-ity to use the knowledge in various tasks.
Proficiency, as well as the other notions mentioned above, is a broad termthat may have many implications. Jones (1985: 7), for example, maintainsthat proficiency covers the entire spectrum from beginners to those whohave a command of the language equivalent to that of an educated nativespeaker. Proficiency is also widely used in contexts of language testing butnot always defined in detail. Farhady (1982: 44), for instance, states thatlanguage proficiency is one of the most poorly defined concepts in the fieldof language testing.
Two types of proficiency are distinguished by Cummins (1983). The twotypes are abbreviated BICS and CALP. BICS (=Basic interpersonal com-munication skills) is the proficiency used for oral fluency and in socialcontexts. CALP (= Cognitive academic language proficiency) is the lin-guistic knowledge and proficiency required for academic work. Proficiencycan be regarded as two interacting continua comprising BICS and CALP(Cummins and Swain 1986).
Proficiency can also be defined with regard to the student’s ability to usehis/her knowledge in specific contexts. According to this view, the student’sproficiency is a variable factor as opposed to the student’s competence (El-lis 1990; Taylor 1988). In a study of Finnish-speaking students’ oral profi-ciency in Swedish, oral proficiency was seen theoretically as the strategicuse of the language user’s competencies in communicative language activi-ties (Hildén 2000).
The modern overall concept used in describing students’ command of, orproficiency in a foreign language in, for example, syllabi and descriptionsof tests and what to test, is communicative competence. In its earliest defi-nition, communicative competence referred to the native speaker’s abilityto produce and understand sentences which are appropriate to the context inwhich they occur (Hymes 1972). The notion, with its definition, spread tosecond language teaching and testing in the 1980s. In the definition mostcommonly used in the last ten years, communicative competence is consid-ered to consist of several kinds of competence, namely
1 Cf. The important distinction between ‘competence’ and ‘performance’ by Chomsky(1965).

59
(1) linguistic competence (e.g. morphology and syntax), (2) sociolinguistic competence (e.g. sociocultural rules), and(3) strategic competence (e.g. the ability to make up for lack of vocabu-
lary) (Canale & Swain 1980; Canale 1983).
In a discussion of the objectives for foreign language learning in a studyfrom the Council of Europe, van Ek also defines communicative compe-tence with the help of certain sub-competences (cf. Introduction and TheThreshold Level). Van Ek lists six components of communicative compe-tence: linguistic competence, sociolinguistic competence, discourse com-petence, strategic competence, sociocultural competence and social compe-tence (van Ek 1986: 36).
Svartvik (1990) describes communicative competence as one of threelevels in students’ mastery of a foreign language. The first level is the “sur-vival kit-level”, the second level includes the skill to use language correctly,and the third level implies not only correct but also adequate language use.
Communicative competence has become the term most commonly usedduring the last 15 to 20 years both in syllabi and in research on languageteaching and testing. Terms such as communicative language tests are oftenused (see e.g. Morrow 1979 and Weir 1988). The term CommunicativeLanguage Competence appears in Common European framework of refer-ence for languages: learning, teaching, assessment (2001: 108–130) and inthis context has three components: linguistic, sociolinguistic and pragmaticcompetence. Each competence is subdivided into specific categories:
– Linguistic competence: lexical, grammatical, semantic, phonological, or-thographic and orthoepic.2
– Sociolinguistic competence: the mastering of linguistic markers of socialrelations, politeness conventions, expressions of folk wisdom and regis-ter differences.
– Pragmatic competence: discoursal and functional.
Besides communicative competence, Bachman’s (1990: 84) definition ofthe concept “communicative language ability” (CLA) is useful to include indiscussions of oral proficiency since it is sometimes used in studies of stu-dents’ performance in English as a foreign language in at least two ways:CLA is either regarded as being equivalent to language proficiency (see e.g.Sasaki 1996), or it is used as the basic framework in analyses of the natureof oral proficiency (see e.g. Saleva 1997). Bachman also includes threecomponents, only slightly divergent from those used in the above two defi-nitions of communicative competence, in his CLA:
2 Orthographic competence concerns the perception and production of the symbols of thewritten text. Orthoepic competence regards the correct pronunciation of the written form.

60
(1) language competence– organizational competence– grammatical competence– textual competence– pragmatic competence– illocutionary competence– sociolinguistic competence
(2) strategic competence, and(3) psychophysiological mechanisms.
Each one of these has its own subcategories. Thus language competence (1)is divided into organizational competence and pragmatic competence. Theformer, i.e. organizational competence, includes grammatical competence(for instance morphology), and textual competence (for instance cohesion).The latter, i.e. pragmatic competence, is concerned with matters such as theability to use language appropriately according to given contexts. Two cat-egories of pragmatic competence are identified, namely illocutionary com-petence and sociolinguistic competence.
Strategic competence (2) is not only concerned with the ability to avoidthreatening communication breakdowns but also includes the entire solvingprocess. Finally, psychophysiological mechanisms (3) include the proc-esses involved in the actual execution of the language, for instance to makesounds.
A central issue is whether the concept of proficiency in a foreign lan-guage can be defined or tested in terms of several abilities or whether it isimpossible to isolate integrated skills, for instance, in a testing situation. Asfor oral proficiency, it is closely related to the concept of fluency. Speakinga foreign language fluently may take years to achieve. The struggle to thinkof what to say, to find the right words and to express oneself are clearlyreflected in the way we speak. Brown (1977: 108) discusses the complexityof spoken production and states that even very few native speakers are en-tirely fluent when they speak spontaneously. Tornberg (2000: 137) also em-phasizes that oral proficiency in a foreign language is very complex be-cause of the fact that all aspects of the speaker’s competence (pronuncia-tion, intonation, listening comprehension, grammar, vocabulary, sociolin-guistic and sociocultural knowledge) must be activated simultaneously andwithout much time for planning.
Oral proficiency as a sub-skill of proficiency has been investigated byHiggs and Clifford (1982: 69). In their Relative Contribution Model ofSpeaking Proficiency, they hypothesize how the sub-skills of proficiencyare proportioned at different levels of learning and using a foreign lan-guage. In this model, the five basic sub-skills are vocabulary, grammar,

61
pronunciation, fluency and sociolinguistic skills. Different percentages re-fer to the contributions of the five sub-skills to total language proficiency.Vocabulary has the highest percentage at a low level. Fluency and sociolin-guistic skills show an obvious increase from the lowest to the highest level.At advanced levels, not only sociolinguistic but also paralinguistic compe-tences can be included. This was evident in the Australian Second Lan-guage Proficiency Ratings (ASLPR). Proficiency in a foreign language wasdescribed not only as including the ability to communicate in particularsituational contexts, but also to have the knowledge of the ways in whichcommunication was performed. Paralinguistic and sociolinguistic aspectsof the performance were to be considered in the testing situation (Ingramand Wylie 1993: 221).3
By way of conclusion, concepts such as proficiency and communicativecompetence occur in descriptions of students’ use of a foreign language.Oral proficiency was the aspect of the students’ overall English proficiencyor communicative competence that was made the central concept in thetests of the Gothenburg project and was thus to be assessed.
2.3. ReliabilityWhen a test is described as being reliable, this implies that the test meas-ures whatever it measures in a reliable and non-random way. The studentwho knows the answer gives a correct reply, the one who does not know theanswer gives an incorrect reply. If the test results depend on factors suchas, students’ skill at guessing or teachers’ methods in correcting the an-swers, reliability can be described as low. Furthermore, the reliability of atest does not tell us anything of what is being measured, but only indicateswhether this is done systematically or not (Lindblad 1991: 36).
The reliability of a test is thus a matter of the quality of test scores.Bachman (1990:161) suggests the following question as a way of identify-ing test reliability:
How much of an individual's test performance is due to measurement error or tofactors other than the language ability we want to measure?
Alderson, Clapham and Wall (1995: 294) present the following definitionof test reliability:
Reliability is the extent to which test scores are consistent.
3 For discussions of students’ sociolinguistic competence and their social background asfactors of their overall language proficiency, see for instance Janicki (1985) and Mays (1982).

62
Reliability concerns questions such as to what extent an individual stu-dent’s test results are due, for instance, to measurement errors, randomvariables or the structure of the test rather than the student’s language profi-ciency which is what we want to measure. The following definition ofreliability appears in the Common European framework of reference forlanguages: learning, teaching, assessment (2001: 177):
It is basically the extent to which the same rank order of candidates is replicated intwo separate (real or simulated) administrations of the same assessment.
Discussions of the reliability of a test thus concern the consistency of theresults. Low reliability may be caused by the context of testing, the ratingscales, time pressure, and factors such as the lack of clear instructions, orinsufficient experience of the assessors, or weaknesses in the test itself(Bachman 1990:24; Alderson, Clapham and Wall 1995: 128). These factorsare unrelated to the abilities to be tested, but they can nevertheless affect thetest results. To achieve high reliability in the assessment of student produc-tion, the test constructor must be aware of these risks and do whatever canbe done to minimize errors of measurement. In addition to the factors men-tioned above, Bachman lists a number of factors causing errors of measure-ment (for instance, poor health, fatigue, lack of interest or motivation, andtest wiseness) and groups them in three categories: test method facets,4
personal attributes and random factors. The smaller the number of suchfactors affecting test scores, the greater is the reliability of the test scores(Bachman 1990: 160–164).
There are different kinds of reliability depending on the kind of test used.So-called itemized tests, i.e. tests that consist of individual tasks that aremarked as correct or incorrect are tested for reliability usually using a so-called test of homogeneity (with a formula known as Kuder-Richardson 21,KR21). The individual items are correlated with the test or subtest total, anditems that show low correlations are excluded from the test after try-out runs.This results in values of .90 or, for certain tests, even higher correlations.
When it comes to tests that demand student production, such as oralproficiency tests, this kind of reliability coefficient can not be calculated.Instead one can either have the same interviewer grade the recorded inter-views on two separate occasions. The correlation between these two grad-ings is referred to as the intra-rater reliability of the test. If instead two ormore interviewers grade the same interview, the correlation between thesecan be calculated and is referred to as the inter-rater reliability of the testscores.
4 Facets of a test could be, for instance, characteristics of the testing environment and of theinput.

63
A further possible source of measurement error is thus evident in testscores that are given subjectively. This pertains to inconsistencies in theraters’ assessment of oral interviews (Bachman 1990: 178).
As described above, two types of reliability can be described: intra-raterreliability and inter-rater reliability. Intra-rater reliability is a measure of thedegree to which one single assessor assign two independent grades to a givensample of language production and inter-rater reliability pertains to an anal-ysis of the grades assigned by several assessors of the same test (Alderson,Clapham and Wall 1995: 129). The consistency is thus checked across as-sessors. Effects due to sequencing, i.e. the order in which students’ perform-ance is assessed, may influence intra-rater reliability, and this could possiblyexplain differences in grades assigned. For instance, if there are two low-achievers in a row, the next student after these two may be assessed morefavourably simply because of the contrast to the two preceding students.Bachman (1990: 179) gives many examples of the effect of sequencing.
Factors other than sequencing that may influence reliability in the gradesassigned to students’ oral performance are the difficulty and the variabilityof the tasks, the characteristics of the interviewers (personality, age or sex),and the interaction between the interviewers and the students (Brindley1991: 156; Porter 1991). Topic choice may be another factor that couldinfluence student production and thereby the grades assigned (Shohamy1988). These factors may be regarded as being of minor importance for thereliability of the assessor’s subjective judgement of students’ oral perform-ance, however, and oral proficiency interviews are also described as reliableassessments of students’ skill of speaking English (Magnan 1987).
Bachman (1990: 225) discusses so-called “performance” tests, such asoral interviews, with respect to reliability and asks whether grades can beinterpreted as indicators of language competence or just regarded as theindividual’s ability to perform well in a specific test situation. The variancecomponent in oral interviews has been found to be substantial and in somecases even of greater importance than the components of the language abil-ity measured (Bachman and Palmer 1981, 1982).
Reliability is considered in the present study by looking at the variationin the Global and Factorial grades assigned to the individual student’s pro-duction in three tests. It is then assumed that the individual student’s oralproficiency did not vary substantially during the day the tests were carriedout.
2.4. ValidityIt is not enough, however, for a test to have reliability as discussed above. Atest must also give a correct picture of what one wanted to test or measure;

64
the test must have validity. The validity of a test is the extent to which itmeasures what one wants to measure and it is therefore related to the pur-poses of the test. There are different kinds of validity. If a test of English,for instance, seems to give an adequate picture of students’ proficiency inEnglish, the test can be claimed to have high validity. This validity is usedto be known as face validity.5
A more scientific term is concept validity which means that the test givesa correct measure of a concept, for instance, the concept of oral proficiency,as in the present study. Various methods can be used to ascertain whetherthe testing procedure actually fulfils the demands of concept validity. Twoother kinds of validity should be mentioned: prognostic validity, i.e. theability of the test and the test results to predict the future progress of thestudents, and empirical validity, which is established through correlationalstudies between the test which is to be validated and some other, often well-established and generally accepted, measure of the same skill (Lindblad1990: 278; 1991: 37).
Besides reliability, validity is thus an essential concept in measurementand testing theory. Reliability is closely related to validity: in order for atest score to be valid, it must be reliable. It should be noticed, however, thatthe opposite does not apply. The validity of a test is concerned with issuessuch as whether the test measures what it is supposed to measure, whatabilities contribute to the variance in the results, and how much of a stu-dent’s test performance is due to the language abilities which are to bemeasured. Validity is always relative to the purpose of the test because itrelates to the uses made of test scores and the ways in which test scores areinterpreted (Alderson 1995: 296).
Henning (1987: 89) offers the following definition of validity:
Validity in general refers to the appropriateness of a given test or any of its componentparts as a measure of what it is purported to measure. A test is said to be valid to theextent that it measures what it is supposed to measure. It follows that the term validwhen used to describe a test should usually be accompanied by the preposition for.
Bachman (1990: 25) also discusses the significance of the test interpretation:
While reliability is a quality of the test scores themselves, validity is a quality of testinterpretation and use.
The following definition of validity appears in the Common Europeanframework of reference for languages: learning, teaching, assessment(2001: 177):
5 Face validity may be regarded to be “a dead concept” in discussions of language testing.For a survey of a critical discussion of face validity, see Bachman (1990: 285–289).
65
A test or assessment procedure can be said to have validity to the degree that it canbe demonstrated that what is actually assessed is what, in the context concerned,should be assessed, and that the information gained is an accurate representation ofthe proficiency of the candidate concerned.
In examining the validity of tests, the focus is thus on the tests or tasks thatinvolve the ability tested. Furthermore, the content, the format of the testingprocedure, and how the students perform are considered. Other matters ofinterest in the validation of a test are identifying the specific abilities thetest is designed to measure and how the test is intended to be used (Bach-man 1990: 236–238).
A number of types of validity have already been described above. Thesedifferent types can be considered to be different methods of assessing valid-ity (Alderson, Clapham and Wall 1995: 171). For interesting further discus-sions of the types introduced above and definitions of other types of valid-ity, see among others, Alderson, Clapham and Wall (1995), Bachman(1996), Lindblad (1990), McNamara (2000) and Wood (1991).
In the present study, validity is considered from two angles. Firstly, thefocus is on the relationship between the students’ test performance andtheir performance in other contexts (for instance, comparisons between theGlobal grades assigned in the oral tests of the Gothenburg project and thestudents’ results from the National Test of English, although their oral pro-ficiency was not tested in this test). It could be expected that if the grades ofthe oral tests correspond to the students’ results from other contexts, suchas their school grades in English and the results from the written parts of theNational Test of English, it seems reasonable to assume that the gradesassigned to their performance in the oral tests are based on their languageproficiency. Secondly, the Global grades assigned to the student perform-ance are compared with the occurrence of certain linguistic features in theirproduction (see 6.2. Linguistic Features). If student production is assignedhigh grades, and their performance is grammatically correct and containsvaried and appropriate vocabulary, along with idiomatic intonation andstress, this would indicate that the tests measure what they are supposed tomeasure and thus show reasonable empirical validity.
2.5. Acceptability and IntelligibilityIn the assessment of student production of a foreign language, one of thecentral questions must be whether it is possible or not to describe accepta-bility and intelligibility in terms of quantity or quality. Intelligibility isclosely related to acceptability: how many errors can appear in a student’sproduction before the interlocutor, or the assessor in an oral test, claims that

66
it is unintelligible? Discussions of acceptability and intelligibility concernmatters investigated in studies of error evaluation and issues in researchcarried out on the effect of errors on the interlocutor, in this case the inter-viewer. This effect can be a matter of whether the addressee understands themeaning, his/her affective response to the errors, or, as in oral tests, theassessor’s evaluation and the grades which are assigned to the student pro-duction. Several studies of error evaluation were made in the 1970s and1980s (see for instance, Quirk and Svartvik 1966; Greenbaum and Quirk1970; Olsson 1973 and 1978), and some of the main tendencies in theresults of these studies are worth mentioning in this context. The presenta-tion that follows is based on Ellis (1994: 63–67).
Firstly, several studies have shown that native speakers tend to judgelexical errors as more serious than grammatical errors. Furthermore, errorsthat affect overall sentence organization are considered to affect compre-hension more than errors that affect single elements in a sentence.
Secondly, non-native speakers, and thus teachers of English, tend to bemore severe in their judgements, in particular regarding morphological er-rors. A Danish study of native speakers’ assessment of oral interviews cameto the conclusion that the frequency of errors was decisive, irrespective ofthe types of errors made: all errors are equally irritating ... irritation is directly predictable from the number oferrors regardless of the error type or other linguistic aspects (Albrechtsen, Henrik-sen and Faerch 1980: 394).
Thirdly, native speakers and non-native speakers seem to have differentcriteria for evaluating students’ errors. Native speakers tend to be focusedon the effect that an error has on their understanding, whereas non-nativespeakers tend to be influenced by their background knowledge of the sylla-bus, the textbook, the students’ use of grammatical structures studied andthe students’ mother tongue. However, it is difficult to draw conclusionsfrom studies of error analysis and error evaluation since, according to Ellis(1994: 67), it is not always clear what criteria assessors use when asked toassess the seriousness, intelligibility or acceptability of an error.
Svartvik (1985) provides teachers with guidelines for the assessment oferrors and their acceptability in student production of English in upper sec-ondary schools. When teachers correct and assess student production, theyare advised to have a descriptive view of errors, as opposed to a prescrip-tive one in the teaching situation. The descriptive view implies that theyare aware of the variation that may exist in English, for instance regardingthe use of there’s and there are followed by a plural noun. Besides thisdescriptive view recommended in assessments, three criteria for the assess-ment of student production are set forth by Svartvik (1985). These criteria

67
are intelligibility (what the student says is understood), usage (what thestudent says could have been produced by a native speaker of English) andappropriateness (what the student says is appropriate for the situation andin the linguistic context).
2.6. Concluding RemarksIn this chapter, concepts and issues have been presented which are of im-portance in discussions of assessing oral proficiency. Proficiency is thebroad concept which is in focus in the assessment of student performance.Although often used rather loosely, proficiency is a multi-faceted term thatmust be carefully defined if it is to be tested and graded. Reliability andvalidity are central concepts in testing and necessary terms in discussions ofthe interpretation of students’ test results. Finally, the notions of acceptabil-ity and intelligibility need to be considered, especially when students’ lin-guistic competence is studied and when, in that context, errors are analysedand discussed.
68
CHAPTER 3
Formats: Tasks and Organisation
In this chapter, the definition of the oral test will be scrutinized and threeways of organizing oral proficiency testing will be described. The formatsof three oral tests in varying degree different from the one used in theGothenburg project will be described and compared with each other andwith the test used in the Gothenburg project. The three oral tests are the oralpart of the CAE, i.e. the Cambridge Examination of Advanced English, anoral test from Holland and an oral test from Lithuania.
3.1. The Oral Test: DefinitionUnderhill (1987:7) defines oral tests in the following way:
An oral test is a repeatable procedure in which a learner speaks and is assessed onthe basis of what he says.
The definition above distinguishes oral tests from everyday conversation byway of introducing the procedure of assessment. In everyday conversationthe interlocutors may certainly assess one another on the basis of the lan-guage produced and thereby draw conclusions about the interlocutor’sbackground and social status, but in oral tests, one of the participants isinstructed to assess the other participant’s production. It is this process ofsystematic assessment of speech that makes a conversation a test. The sys-tematic assessment can be carried out by the interlocutor or by an assessorwho does not participate in the conversation but only assesses the student’sperformance.
The purpose of an ideal oral test is to elicit the richest possible speechsample from the student in the shortest period of time (Lowe 1976). Fur-thermore, the ideal oral test would sample a variety of speech styles, andwithin each style, sample the functions that are needed the most by thestudent in future authentic communicative situations.
69
3.2. Three International Oral Tests: Descriptions and Comparisons
In this section the oral tests and the assessment procedures of three examsare described. The three tests are the Cambridge Examination of AdvancedEnglish (CAE), a Dutch National Test of English and a Lithuanian NationalTest of English. The focus here is on the parts of the tests that are designedto test oral production. The description of these three tests is made with theaim of pointing out not only differences but also similarities in tests used indifferent situational and geographical contexts. The purpose is thus to pro-vide a background to an evaluation of the test used in the Gothenburgproject by comparing it to three other oral tests.1 The descriptions below arebased on test samples, handbooks or brief guidelines of these three tests andfocus on similarities and differences with regard to the
– number of parts in a test,– types of prompts in the tasks,– instructions to students,– preparation time for students,– assessment procedure, and– number of examiners.
The Certificate of Advanced English (CAE). The CAE is one of the highestlanguage-only qualifications in the examinations of the Local Examina-tions Syndicate of the University of Cambridge.2 Numerous handbooksand study guides are available to prepare students for the Cambridge ex-ams. In these handbooks, detailed descriptions of the tests are provided.Students can prepare themselves and decide to take the exam wheneverthey find appropriate, for instance, when they estimate their proficiency tobe at the level required.3 The test consists of a theme-directed conversationand other oral tasks based on a variety of stimuli. The test is organised infour parts: (1) general social interaction, (2) using transactional languagein individual long turns, e.g. comparing and contrasting, (3) negotiatingand collaborating, and (4) explaining, summarising and developing the dis-cussion. In (1), students are asked to respond to questions about them-selves; in (2), they are given visual prompts which they are to talk about, in(3), they are given visual or written prompts of two-way collaborative
1 These illustrative examples were selected for the following reasons. The CAE represents awidely used test of oral proficiency in English. The Dutch test was in use (1994) when thematerial of the Gothenburg project was collected. The Lithuanian test provides an illustrativeexample of a test of English as a Foreign Language from a different school context.
2 The examinations of the University of Cambridge Local Examinations Syndicate are ofsimilar types and span five levels. The CAE is at Cambridge Level Four.
3 Examinations are generally organised on two occasions every year.

70
problem-solving tasks such as comparing or selecting; and, finally, in (4),the topic area from (3) is developed in a discussion of wider issues.4 Thestandard format of the oral tests is two candidates and two examiners andthe test is expected to last for 15 minutes. The assessment is carried outwith the help of the rating criteria within the overall context of the Cam-bridge Common Scale for Speaking where the CAE is at level 4 on a 5-level scale. The two examiners assess the candidates with marks on a scaleof 0–5. The interviewer uses a Global scale, and the assessor applies de-tailed Analytical Scales of the following criteria: Grammar and Vocabulary(Accuracy and Appropriacy), Discourse Management, Pronunciation (Indi-vidual Sounds and Prosodic Features) and Interactive Communication(Turn-taking, Initiating and Responding).
The Dutch National Test of English. The Test of Oral Proficiency in Eng-lish, level 4 (the version of 1994 of the 16+ Examination, D-programme),of the Dutch School system comprises six tasks/parts: (1) warm up, (2)pronunciation, (3) structure, (4) description of events, (5) giving an opin-ion, and (6) engaging in a conversation.5 Task 1 is simply intended to putthe candidate at ease and is not evaluated. In Task 2, the student reads ashort written text. Separate sounds and sound combinations are to bejudged as correct or incorrect, and the focus seems to be on sounds that maycause difficulties for Dutch students. In Task 3, sentences are to be com-pleted (the first few words are given in the instructions to the student) andthese sentences are answers to questions posed by the interviewer. Picturesalong with three to five of the first words in the sentences are provided asguidance for the students. In Task 4, the students are asked to retell threestories with the help of series of pictures. In Task 5, the students are to givean opinion or an explanation, and finally in Task 6, the students participatein a conversation in which they are to take turns by either asking for infor-mation or answering a question. Each task is assessed separately using sep-arate rating criteria. In Task 2 the criteria are Correct or Incorrect in Task 3the students’ answers are to be rated as “No answer or illogical”, “Mean-ingful, but disturbing errors” or “Meaningful and almost error-free”. InTasks 4 to 6 there is a scale of four levels of different criteria, for instance,Intelligible, Correct, Complete and Fluent are used in Task 4. The assessoris to give a total number of points to the performance in each task. Theresponses in the individual test items are assessed and scores calculated.These points are summed up as the test score. Pronunciation is regarded as
4 The topics of the test materials introduced for the June 2001 session comprised for in-stance “Carrying things” (compare, contrast and hypothesize, Part 2) and “Competition” (dis-cuss, evaluate and select, Part 3 and 4).
5 The test was produced by CITO, the National Institute for Educational Measurement,Arnhem, Holland.

71
a separate skill within oral proficiency, and two separate test scores aretherefore reported: one for Pronunciation and one for general Oral Profi-ciency.
The Lithuanian National Test of English. The Speaking Part of the Lithua-nian National Test in English of the students’ 12th year at school (the ver-sion of 2000, levels A and B) comprises three tasks: (1) discussion express-ing an opinion on a given topic, (2) an information-gap activity and, finally,(3) a role-play with a role to act out in a given situation. The test is prefera-bly carried out with two students, one interviewer and one assessor. Theinterviewer is to conduct the test, the assessor to evaluate the performance.The students are given time to prepare the tasks just before the test is carriedout. Furthermore, detailed instructions are given to the students how theycan prepare for the test in the best possible way. The students’ performanceis rated with the help of a scale from 1 to 10 with rating criteria for Linguis-tic ability (Pronunciation, Fluency, Grammatical Accuracy, and VocabularyRange or Relevance of Content). Additional rating criteria are provided forevery task considering “transaction”, “interaction” or “discussion”.
3.3. DiscussionThe survey above displayed similarities and differences in three oral tests ofEnglish. The Cambridge Test of Advanced English has a rich diversity ofprompts and different themes in two parts of the conversation. Two examin-ers (interlocutor and assessor) assess the students’ performance but do so indifferent ways; global grades are given by one and analytical grades aregiven by the other. The Dutch oral test has more focus on the pronunciationof individual phonemes. The student is also given more detailed instruc-tions before the tasks and the responses are intended to follow certain struc-tures. Scores are calculated on the basis of the students’ results. A separatescore is given for pronunciation, besides oral proficiency. The Lithuaniantest uses an elaborated scale in the assessment, from 1 to 10, and the testformat is close to the CAE; the participation of two students is recom-mended, an interviewer conducts the test and an assessor grades the stu-dents’ performance.
In sum, the three tests provide examples of oral proficiency tests as back-ground to the test format and the assessment procedure used in the Gothen-burg project (cf. Chapters 5 and 7). Differences between the three testsdiscussed worth noticing concern
– the number of examiners and their tasks in the tests (eliciting or/andassessing),

72
– the types of prompts used (for instance, whether tasks are highly struc-tured, such as reading aloud or answering with the help a set of words ofthe expected answers, or organised around a common theme)
– the students’ preparations (for instance, whether advice how to preparefor the test is provided in instructions or in handbooks)
– the scales used in the assessment procedure (for instance, pronunciationmay be regarded as a separate skill, as an integrated skill or as two typesof abilities to be rated, namely individual sounds and prosody)
– the assessment procedure (the method used in the final scoring shows avariety of possibilities, from a detailed scoring of individual tasks togrades assigned to separate skills)
In the comparison between the three oral tests described above and the testused in the Gothenburg project, the following observations can be made. Inthe test of the Gothenburg project
– the procedure with one interviewer/assessor was used,– the tasks showed some similarities with the tasks described above, for
instance, the students were instructed to tell stories with the help of somepictures or express their own opinion,
– the students were given ten minutes to prepare two of the three tasks, notime for preparation was given before the last task,
– one global and three factorial grades were given,– grades were given for the students’ whole performance, i.e. the produc-
tion in the three tasks.
The presentations of the three illustrative examples of oral tests above showthat there is no obvious consensus on what methods are best to use in oralproficiency testing. There is thus a need for empirical studies in order tofind efficient and useful ways of measuring students’ ability to speak Eng-lish. This provides a justification for the present investigation of the testingand grading of Swedish students’ oral production.

73
Part 2:The Aims of the Study and Hypotheses
to Be Tested

74

75
CHAPTER 4
The Aims and Hypotheses of the Study
4.1. AimsThe present study has three main aims to be introduced in this chapter. Asexplained above, the study is based on the material of the Gothenburgproject. The aim of that project was
– to study to what extent different examiners tend to agree or disagree ingrading advanced Swedish students’ oral proficiency in English.
In the collection of the data for the project, nine English teachers, repre-senting three different categories of teachers, were engaged to interview tenstudents each (for the description of the interviewers, see 7.3.). Each of the29 students was thus interviewed by one teacher from each category, i.e.three times.1 In their evaluation of the students’ performance, the interview-ers were instructed to give each student four separate grades: one Global forthe overall oral proficiency impression and one for each of three differentFactors, namely Communication and Fluency, Grammar and Vocabulary,and Pronunciation (for a complete description of the material, see Chapter7). The research design was geared to investigate methods of assessing oralproficiency in view of the compulsory oral tests that were to be introducedas part of the National English Tests in Sweden a year later.
By way of an elaboration of the above aim of the Gothenburg project, thefirst aim of the present study is two-fold:
– to study the relationships between the Global grades and the three Facto-rial grades given by each of the nine interviewers individually;
– to study the relationships between the Global grades and the three Facto-rial grades for each of the three interviewer categories.
Along the lines of the Gothenburg project, this two-fold aim thus focuses onthe work done by the interviewers, not on the students’ proficiency as such.
1 29 students turned up out of the 30 who had been selected for the project.

76
In connection with the follow-up work based on the tape- and video-recorded interviews, a second aim was formulated for the purposes of thepresent study. This further aim makes this study an inter-disciplinary prod-uct that brings together the frameworks of linguistic and pedagogical study.The second aim is then
– to study the students’ linguistic competence, and to some extent theirstrategic competence, in terms of their standard English or non-standardEnglish use of certain “difficult features” in English, their vocabulary,their use of certain discourse markers, three aspects of their pronuncia-tion, and their ability to use efficient strategies (for the linguistic featuresstudied, see 6.1. and 6.2.).
This part of the investigation is a study of grammatical accuracy as well asof various discoursal and collocational features, and of the strategies thatstudents use to carry on the conversation without resorting to Swedish, evenwhen in want of an appropriate English word or expression.
Finally, as a combination of the above first and second aims, the thirdaim of the present study is
– to investigate to what extent the students’ linguistic and strategic compe-tence is graded differently by the three categories of interviewers, and tostudy the role played by the linguistic features in the Global grades as-signed to the students.
The results are discussed in six chapters focusing, on the one hand, on thegrades assigned (Chapter 8), and, on the other, on the students’ use of theselected linguistic features in their production (Chapters 9 to 13). The re-sults are then interpreted in Chapters 14 and 15.
4.2. HypothesesIn pedagogical research it is customary to start with a ‘null hypothesis’, i.e.no differences between the groups that are compared are expected. This isthe principle even if the researcher may have some ideas of what differ-ences to expect. The null hypothesis is important, among other things, toensure the use of proper statistical methods and interpretations.
The null hypothesis of the Gothenburg project was that no differenceswould be found between the grades given by the different individual inter-viewers to the same student, nor between the grades given by the differentcategories of interviewers. This implies that the project was planned andcarried out in such a way that no other hypotheses would be favoured.
For the linguistic analyses involved in the second aim of the study, differ-

77
ent principles could be adopted. These analyses pertain to the grammaticalcorrectness and communicative efficiency of the students’ performance inEnglish and therefore the following hypothesis could be formulated:
– Students who are at the lower end of the grading scale, both as far as theirprevious English grades from school, and the grades given by the inter-viewers are concerned, tend to make more elementary grammatical mis-takes, have larger lacunae in their vocabulary and a poorer strategic com-petence, which means that they may have a tendency to resort to Swedishwords, sometimes pronounced in an ‘English-like’ way to make themsound more correct.
In addition to the hypothesis formulated above, a further hypothesis con-cerning the third aim could be formulated as follows:
– Differences might be found in the attention paid by the members of thethree categories of interviewers to certain linguistic features (i.e. the stu-dents’ linguistic competence) when assigning the Global grades.2
These two main hypotheses and their extensions will be further dealt within Chapter 6 and Chapter 8.
2 Owing to space and time limitations, the discussion of differences in the Factorial gradesassigned (for instance Factorial grades for Grammar and Vocabulary) in comparison with theoccurrence of certain linguistic features will not be dealt with in the present study.

78

79
Part 3:Grading Students’ Oral Performance
and Analysing Their Competence
In Part 3, some basic principles will be presented regarding both the assess-ment of the students’ performance and the analysis of their linguistic andstrategic competence. These principles concern the methods employed, thecriteria used in the classification of certain categories, such as test ratingcategories, sources of variation in the grades assigned, and sources of errorin the linguistic analyses, which should be taken into account in the discus-sions of the results.

80

81
CHAPTER 5
Grading Student Performance
The following three issues are discussed in this chapter:
– principles in the assessment, – global and factorial grades, and– sources of variation.
5.1. Principles in the AssessmentThree important principles were applied in the assessment of the studentproduction in the Gothenburg project.1
(a) First of all, student production was graded by the interviewers duringor immediately after the interview. The interviewers assigned a Globalgrade and three Factorial grades to each student (cf. the instructions for theInterviewers and the Oral Mark Sheet, Appendices 5 and 9). Furthermore,the interviewers were asked to make relevant comments regarding othermatters, such as body language.
(b) Secondly, the grading was based on the interviewer’s interpretation ofa set of rating criteria. The interviewers (with a few exceptions) did notknow the students before they met for the interview and had no knowledgeabout the students’ grades or test results in English from school. The inter-viewers were given the criteria about a week before the day of the testingsession, but they did not discuss the interpretation of the rating criteria witheach other or with the research team of the project as a part of the organisa-tion before the assessment was carried out (cf. the Rating Criteria in Ap-pendix 8).
1 The design of the procedures and principles in the assessment of the Gothenburg projectwas decided by Docent Lindblad and his colleagues at the Language Teaching and TestingResearch Unit, Department of Education and Educational Research, Gothenburg University.
82
(c) Thirdly, the tasks were constructed in order to give all the students,independently of personal characteristics, interests and background, thepossibility of showing as much as possible of their oral skill.
The grades assigned are thus based on the interviewers’ assessment ofthe students’ performance during the interviews and their interpretations ofthe rating criteria provided. The interviews were organised in order to en-courage the students to speak as much as possible in spite of the somewhatunfamiliar and stressful surrounding, at least for some students.
In the discussion of the grades assigned to the student production, thefollowing two conditions should be kept in mind. Firstly, the grades wereassigned to the quality of the students’ proficiency such as it was on the daythe oral tests were carried out. Secondly, the grades assigned were probablyto some extent dependent on how well the interviewers succeeded in mak-ing the students speak, and whether the interviewers thus managed to makethe students do themselves justice and show their real oral skill.
5.2. Global and Factorial GradesAs described in the Introduction, the student production was graded byassigning each student’s test one Global grade and three Factorial grades.The three Factorial grades were based on the interviewers’ assessment ofthe students’ Communication and Fluency (2a), Grammar and Vocabulary(2b), and Pronunciation (2c). The three Factorial grades were formulatedin conformity with those that were used during the five-year experimentwith oral tests as part of the Swedish National Test of English used inSwedish schools at the time of the Gothenburg project (i.e. 1993, cf. Intro-duction).
In the assessments, specified sets of rating criteria for the Global gradeand for the three Factorial grades were used (for these rating criteria; see7.5. Rating Criteria and Appendix 8). In the present study, the gradesawarded will be studied and compared in the following two respects.Firstly, the grades (Global, Factorial 2a, 2b, or 2c) assigned by the threeinterviewers to the individual student’s three tests will be studied (cf. Tables8.1. to 8.4. and Tables 8.8. and 8.9.). Secondly, the Global grade and theFactorial grades assigned to each student’s production by her/his three in-terviewers will be presented (cf. Tables 8.5. to 8.7.).
The grades used by the interviewers were A (the highest), B, C, D, and E(the lowest). What these grades stood for is found in the lists of ratingcriteria for the Global grade and the three Factorial grades (cf. Appendix 8).In the tables and the discussions in Chapter 8, these ‘letter grades’ aretransformed into ‘figure grades’ (an A corresponds to 5, and then the fol-

83
lowing letters to 4, 3, 2, and 1). The original ‘letter grades’ represent a so-called ordinal scale, which means that an A is better than a B, and a B betterthan a C, etc. but these ‘steps’ cannot be guaranteed to be equal. When theletters are transformed into figures, the result is an interval scale, whichmeans that the ‘steps’ of the scale are equally large. In accordance withwhat has become common practice,2 the tables and the discussion thus con-tain means, standard deviations and correlations rather than medians andother non-parametric statistics.
5.3. Sources of VariationThe grades that were assigned in the Gothenburg project were based on therating criteria provided and the students’ oral proficiency in English. Never-theless, other factors could influence the grades assigned. These possiblefactors might have influenced the interviewers’ assessments, and theyshould therefore be mentioned. Four such potential sources of variation inthe assessment of student production will be discussed. They are:
(a) the students’ and the assessors’ previous experiences and expectations,(b) unknown background variables,(c) the so-called halo-effect, and(d) a tendency to go for the middle of the grading scale.
(a) The conversations in oral tests may seem to be similar to other conversa-tional situations, but in particular, the process of systematic assessmentmakes them different (cf. 3.1. The Oral Test: Definition). In other respects,oral proficiency interviews and everyday conversation can appear to besimilar. When people take part in conversations, they bring assumptionsand expectations about what is to be said, how the conversation will de-velop and what kind of contributions they are expected to make (Richardsand Schmidt 1983: 119–120). This is also the case for participants in oralproficiency interviews. These expectations, both the students’ and the inter-viewers’, may influence the students’ output and the grades assigned. Forinstance, the students could have ideas about what the interviewers expectfrom them. As regards the interviewers, their previous experience may in-fluence their interpretations of the rating criteria and their views on the
2 Similar principles are used, for instance, by the Swedish National Agency of Higher Edu-cation (Högskoleverket) in the calculation of students’ grades for entrance into higher educa-tion in Sweden. Individual students’ letter grades G, VG and MVG are transformed into thefigures 10, 15 and 20 respectively (cf. www.vhs.se and the principles for admission to highereducation by Verket för Högskoleservice).
84
students’ performance, in particular when the interviewers knew the stu-dents from school.3
From the students’ perspective, previous experience of oral testing mayplay an important role. The students may have had previous experiences oforal proficiency interviews with their language teacher as the assessor. Suchexperiences of successful or unsuccessful oral tests may, at least partly,explain why certain students felt nervous during the oral proficiency inter-views. In this context it is worth pointing out that encounters betweenteachers and students in teaching situations are often quite different fromtesting situations. Teaching is co-operative. Tests do not necessarily have tobe, but can perhaps sometimes be regarded by some students as too chal-lenging. There are possible outcomes which may be regarded as unfairlynegative to the student (Cheepen and Monaghan 1990: 91). Such students’performance may perhaps be influenced by the experiences they have ofteachers’ assessment of their oral proficiency, and their performance mightbe better in other contexts. Certain students are probably nervous and anx-ious whereas other students may feel quite relaxed and calm. Whether thestudents have experiences of being recorded may influence their oral pro-duction. The presence of a microphone can contribute to a more hesitantdelivery (Skolverket 1993: 121), and thus negatively influence the students’performance.
The students’ general knowledge concerning controversial issues andwhether they are used to debating in general are factors also worth mention-ing in the discussion of the possible significance of advanced students’background and previous experiences. Students who know about and whoare used to discussions in different contexts may have many ideas of whatto say and how to say it in an oral test of English where there is a discus-sion, as for instance in Task 3 of the Gothenburg project (cf. 7.6. Tasks). Itis thus evident that, in one way or another, the students’ general knowledgecontributes to their ability to communicate. The students’ general compe-tences, such as knowledge of the world and sociocultural knowledge, maybe regarded as aspects of their communicative competence (Common Euro-pean Framework of Reference for Languages 2001: 101). The students’personal characteristics may also be of influence. In a study of Finnishstudents in oral proficiency tests of Swedish, the results showed the ten-dency that extrovert and lively students scored higher than shy and silent,and in the same way, initiating speakers scored higher than passive speakers(Hildén 2000: abstract). Finally, the possibility that some students know theinterviewers whereas for others it may be the first time they meet them isalso a factor to take into account. The Gothenburg project collected infor-
3 School Teacher 2 knew two of the nine students he interviewed, and School Teacher 3knew seven of the ten students she interviewed.

85
mation regarding several aspects concerning the students’ background (cf.7.2. Students). Nevertheless, there may be background variables which arenot known and which could account for some students’ spoken perform-ance and the variation in the grades assigned.
The background and experiences of the interviewers are of great interestto the present investigation (cf. 4.1. The Aims of the Study, and 7.3. Inter-viewers). The different background and experiences of the interviewerswere the factors behind the three different interviewer categories of theGothenburg project. Whether, for instance, school teachers and nativespeakers make different interpretations of the rating criteria in the assess-ment of student production, and whether they put emphasis on differentaspects in the students’ performance, for instance, on accuracy or on pro-nunciation, are among the issues investigated in the present study.
The so-called halo-effect is the term which may be employed to describethe possibility that assessors are positively influenced by, for instance, his/her previous knowledge of a student, and thereby this knowledge may influ-ence the grades which are given to the student’s production. Furthermore,when assessors assign several Factorial grades, they may also be influencedby the grades assigned to the other factors. For instance, having just given ahigh grade for Vocabulary and Grammar, the assessor may be influenced bythis high grade when he/she assigns the grade for Pronunciation. This phe-nomenon could be explained by the demands put on the assessor to assessseveral aspects of student performance simultaneously. It may be hard forthe assessors to distinguish components in the course of their listening task(Yorozuya and Oller 1980; Oller and Hinofotis 1980). It may also beclaimed that judging several factors at the same time, such as vocabulary,grammar, and pronunciation, puts unreasonable demands on the assessors(Walker 1984: 43).
A factor that may influence the grades assigned is a tendency for theassessors to go for the middle of the grading scale. Marks may, for instance,cluster round the median 3 on a 5-point scale (Heaton 1975: 99). This ten-dency may thus particularly but not only occur in assessments when scaleswith, for instance, three or five grades are used. In these assessments, theassessors tend to use the grades which are in the centre of the scale, such asthe grade 3 on a scale of five grades. An even-numbered rating scale may bepreferred to avoid this phenomenon (ibid. 1975: 99)
The discussion above provides illustrative examples of factors that couldbe of significance for the grades assigned to the students’ performance inthe tests of the Gothenburg project.

86
CHAPTER 6
Analysing the Students’ Linguistic and Strategic Competence
In this chapter, the principles and method used in the linguistic analyseswill be described. The discussion will include
– the criteria and principles for the selection of the linguistic features,– the ten linguistic features selected,– the classification of the student production into test rating categories,– the influence of speech rate and the length of the oral tests on the results,– the classification of standard English and non-standard English instances,
and– possible sources of error in the linguistic analyses.
6.1. Criteria and PrinciplesLearner language, i.e. English produced by non-native speakers, may beregarded as a variety of the English language. This variety has characteris-tics in common even though there may be great differences of quality whenthe production by two individual learners is compared. The language ofnon-native speakers is described as a “simplified language” by Corder(1981: 79–81) who claims that “simplified languages” share structural sim-ilarities. Corder exemplifies this term with reference, for instance, to theinterlanguage of non-native speakers, pidgins and baby-talk and gives sev-eral examples of structural similarities which are considered to be the mostsalient:
– a simple or virtually non-existent morphological system, – a more or less fixed word order, – a simple personal pronoun system, – a small number of grammatical function words and grammatical catego-
ries,– little or no use of the copula,

87
– the absence of an article system, and– tense and aspect typically performed by lexical means, for instance by
using adverbs.
Even though the students of the Gothenburg project were at an advancedlevel of proficiency in English, Corder’s discussion of structural features of“simplified languages” was one of the influential works which were con-sulted at the early stages of the present study. His ideas were of significancein the first investigations of the language produced by the students and inthe selection of the ten linguistic features included in the present study, forinstance the third person singular marker.
The ten linguistic features selected comprise four areas: syntax and mor-phology (the verbal group), vocabulary and compensatory strategies, dis-course markers and aspects of pronunciation. For each feature, the selectionis based on at least one of the following three criteria:
1. The features are referred to in school grammars of English for Swedishstudents.
2. They represent different aspects of student production (morphology,syntax, vocabulary, strategies, discourse phenomena and pronunciation).
3. The features could be hypothesised as revealing differences in relation tothe Global grades assigned by the members of the interviewer catego-ries.
The interviewers’ comments in the questionnaires submitted directly afterthe completion of the testing sessions were also valuable for the choice offeatures as well as two additional interviews carried out after the testingsession (cf. 7.1. The Material of the Gothenburg Project). Some interview-ers’ comments on students’ production on the Oral Mark Sheet also con-tributed to the choice. Finally, my personal experiences from teaching Eng-lish in Swedish schools were of help in the selection of the features.1
The occurrence of, and the students’ mastery of, the selected linguisticfeatures are compared with the Global grades assigned to the students’ pro-duction. In the preliminary stages of the present investigation, both the Glo-bal grades and the three Factorial grades were taken into account. However,since this approach with four grades assigned to every student’s productiontended to complicate matters in an unnecessary way, the outline was
1 At an early stage of the present investigation more linguistic features were included. How-ever, it was not within the scope of this study to describe the occurrence of all these features instudent production. The linguistic features analysed at an early stage were the following:auxiliary do; relative clauses; the passive voice; adjectives, irregular verbs, adverbs with –ly;certain hedges: sort of, kind of, type of; the phrases I think so, I don’t really know; the discoursemarkers I mean, you see, oh, and, but, or; or-tags; topic-comment structure and meta-talk.

88
changed. Only the Global grades assigned are now used when the gradesare compared with the occurrence and the students’ mastery of the linguis-tic features.
Obviously, the Global grades assigned could be expected, at least partly,to be based on the adequate production or the occurrence of the linguisticfeatures investigated. It is evident that grammatical accuracy in a student’sproduction can influence not only the Factorial grades of Grammar andVocabulary but probably also the Global grades: we may notice the obviousinterdependence between student production assigned a high grade and theoccurrence of certain of the linguistic features, for instance, the standardEnglish use of the third person singular marker (cf. 6.5. Defining StandardEnglish and Non-standard Instances). It may be argued that there is a pre-dictable relationship between these two variables. One of the interestingissues in the linguistic analysis is to clarify the possible relationship be-tween the Global grades assigned and grammatical accuracy, i.e. the occur-rence of standard English instances of certain of the linguistic features inthe students’ production. In the same way, the investigations of the stu-dents’ use of vocabulary, their use of two discourse markers and their idio-matic, or unidiomatic intonation and stress may yield useful informationregarding the Global grades assigned and aspects of lexis, discourse andpronunciation. The linguistic investigation thus provides useful informationregarding the assessment of 29 students’ performance, and thereby the rela-tionship between the Global grades assigned and the students’ linguisticand, to a certain extent, strategic competence in English.
Because of the interdependence of the variables described above and theexpected linguistic results, the interest is focused on linguistic features thatshow great distributional differences in student production assigned differ-ent grades by the members of the three interviewer categories. Since feworal tests were assigned Low grades, the potential of the survey of the stu-dents’ use of the ten linguistic features lies in identifying features that dis-tinguish student production assigned a High grade from student productionassigned an Average grade (cf. the description of the three test rating cate-gories High, Average and Low in 6.3. Classifying Student Performance intoTest Rating Categories).
Finally, two caveats should be mentioned in the context of the analysis ofthe students’ language. Firstly, the present study describes the languageproduced in a specific setting and with a particular purpose. Secondly, un-derstandably enough, it is not possible to give a full description of the lin-guistic production of each student’s three interviews; only a survey of theiruse of certain linguistic features is provided.

89
6.2. Linguistic FeaturesIn the surveys of the ten linguistic features under scrutiny, raw, average andnormalised figures are used to describe the occurrence and the distributionacross the test rating categories. Furthermore, correlation coefficients, meanvalues and standard deviations are presented in order to show not only therelationship between the Global grades assigned and the occurrence of thelinguistic features, but also the distribution of the instances across and withinthe three test rating categories High, Average and Low.2 To give a full ac-count of the distribution within a test rating category, the figures for theoccurrence rates in all student production rated High, Average or Low aregiven in the presentations. The limited amount and the character of thematerial necessitate an approach with a discussion of the performance ofgroups of students and the Global grades assigned to their performance.
As stated above, the ten features included in the analysis cover four as-pects in student production. The ten features in question are:
Morphology and syntax: The third person singular markerThe progressive
Vocabulary: Abstract nounsModifiers of adjectivesLexical errors and compensatory strategies
Discourse phenomena: Well ...You know ...
Aspects of pronunciation: Intonation StressSpeech rate
There were various reasons for the selection of these linguistic features. Inwhat follows, some of the most evident reasons are presented. (The rea-sons for the selection of each linguistic feature are further discussed inChapter 9.)
The two features included in the category of Morphology and syntax (thethird person singular marker and the progressive) were of special interestsince they can both be regarded as accuracy markers and their uses aredescribed in the normative grammars of English used in Swedish schools.Difficulties with the third person singular marker are mentioned as typicalof learner language by Corder (1981: 79–81) and the use of the progressiveis described as a contrastive difficulty in English school grammars for
2 Standard deviations are generally calculated when the number of observations is large. Inthe present study, the numbers are small, in particular regarding certain linguistic features andstudent production assigned a Low grade. Standard deviations are nevertheless valuable inorder to show differences in distribution and between assessors.

90
Swedish students (see, for instance Hargevik and Hargevik 1993: 180). Ab-stract nouns were included because their presence may be correlated with ageneral range of vocabulary or they might indicate the degree of abstractthinking shown in students’ speech. Modifiers of adjectives were also worthpaying attention to, since they seemed to be used with highly varying fre-quencies by the students and differences in tokens and types of modifiersused could provide evidence of the significance of certain aspects of vocab-ulary for the assessment. Lexical errors were important to investigate sinceit seemed obvious that they could disturb communication. The occurrenceof lexical errors and the students’ compensatory strategies, i.e. the strate-gies the students employed when their knowledge of vocabulary was notsufficient, were mentioned by the interviewers as being of significance forthe assessment in the answers to the questions in the questionnaire (cf.9.2.3. Students’ Lexical Errors and Compensatory Strategies). The stu-dents’ use of the discourse markers well and you know was relevant toanalyse since these items are frequent in spoken English and because theywere used with remarkable frequency by some students. Furthermore, itcould be assumed that the students had been exposed to these discoursemarkers and that they used them for different purposes, for instance, well asa sign of thinking and you know as an indication of involving the interlocu-tor in the communicative process. The differences in frequency and usemay be expected to influence the assessments. It was natural to include thethree aspects of pronunciation (intonation, stress and speech rate) in aninvestigation of students’ spoken performance. It was evident that the stu-dents’ pronunciation was of significance, not only for the Factorial gradesfor Pronunciation, but also for the overall impression of the production andthe Global grades assigned.
The investigation of the ten linguistic features of the students’ linguisticcompetence may be summarised with the help of ten sub-hypotheses, eachone of them with reference to a linguistic feature. The ten sub-hypothesesare presented in Table 6.1.
A number of comments are in order concerning the sub-hypotheses inTable 6.1. As for the two features of the Verbal Group, the question largelyboils down to the proportions of standard English and non-standard Englishinstances in the student production. In the Vocabulary Group, the sub-hy-potheses pertain not only to mere frequencies but also to the types of occur-rences, what kinds of words are used, errors in words selected, and thesolutions found to lexical lacunae. The sub-hypotheses concerning the twoDiscourse Markers investigated deal with frequencies and discoursal func-tions of well and you know. Finally, the sub-hypotheses concerning thethree features in the ‘Aspects of Pronunciation Group’ all pertain to thefollowing expected results:
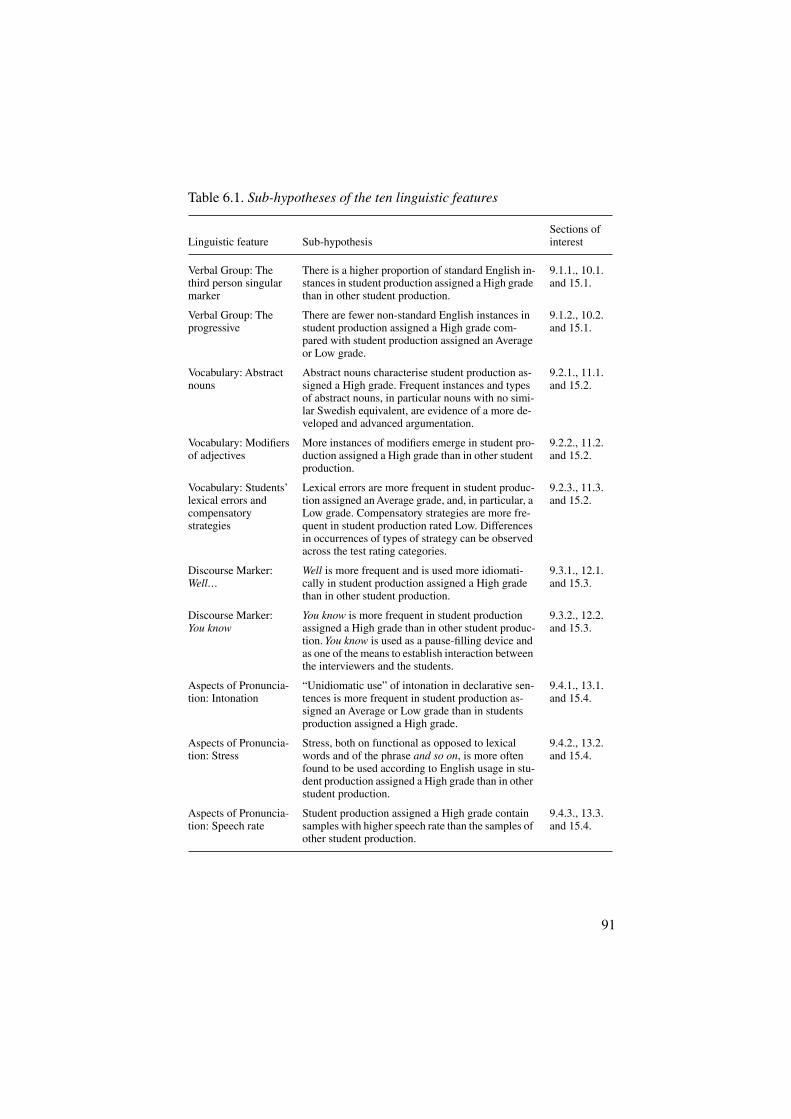
91
Table 6.1. Sub-hypotheses of the ten linguistic features
Linguistic feature Sub-hypothesisSections of interest
Verbal Group: The third person singular marker
There is a higher proportion of standard English in-stances in student production assigned a High grade than in other student production.
9.1.1., 10.1. and 15.1.
Verbal Group: The progressive
There are fewer non-standard English instances in student production assigned a High grade com-pared with student production assigned an Average or Low grade.
9.1.2., 10.2.and 15.1.
Vocabulary: Abstract nouns
Abstract nouns characterise student production as-signed a High grade. Frequent instances and types of abstract nouns, in particular nouns with no simi-lar Swedish equivalent, are evidence of a more de-veloped and advanced argumentation.
9.2.1., 11.1. and 15.2.
Vocabulary: Modifiers of adjectives
More instances of modifiers emerge in student pro-duction assigned a High grade than in other student production.
9.2.2., 11.2. and 15.2.
Vocabulary: Students’ lexical errors and compensatory strategies
Lexical errors are more frequent in student produc-tion assigned an Average grade, and, in particular, a Low grade. Compensatory strategies are more fre-quent in student production rated Low. Differences in occurrences of types of strategy can be observed across the test rating categories.
9.2.3., 11.3. and 15.2.
Discourse Marker: Well…
Well is more frequent and is used more idiomati-cally in student production assigned a High grade than in other student production.
9.3.1., 12.1. and 15.3.
Discourse Marker: You know
You know is more frequent in student production assigned a High grade than in other student produc-tion. You know is used as a pause-filling device and as one of the means to establish interaction between the interviewers and the students.
9.3.2., 12.2. and 15.3.
Aspects of Pronuncia-tion: Intonation
“Unidiomatic use” of intonation in declarative sen-tences is more frequent in student production as-signed an Average or Low grade than in students production assigned a High grade.
9.4.1., 13.1. and 15.4.
Aspects of Pronuncia-tion: Stress
Stress, both on functional as opposed to lexical words and of the phrase and so on, is more often found to be used according to English usage in stu-dent production assigned a High grade than in other student production.
9.4.2., 13.2. and 15.4.
Aspects of Pronuncia-tion: Speech rate
Student production assigned a High grade contain samples with higher speech rate than the samples of other student production.
9.4.3., 13.3. and 15.4.

92
– more instances of idiomatic pronunciation emerge in speech by the stu-dents assigned a High grade than by other students in the material.
A majority of the sub-hypotheses in Table 6.1. follow what can be ex-pected on the basis of common sense thinking: the students who were as-signed a top grade produced a higher proportion of standard English in-stances, used more varied vocabulary, made fewer mistakes and had moreidiomatic pronunciation. Other sub-hypotheses, for instance those statingthat high-achievers speak faster than others and that their production con-tains high frequencies of discourse markers, can be regarded to be morecontroversial.
6.3. Classifying Student Performance into Test Rating Categories
The 82 oral tests were categorised into three groups: those that received aHigh Global grade, an Average Global grade and a Low Global grade.These three categories were based on the Global grades assigned to the 82oral tests which were successfully recorded (cf. 7.1. The Material of theGothenburg Project). The Global grades were A, B, C, D and E, A being thetop grade (cf. the Rating Criteria in Appendix 8 for the description of theGlobal grades A, B, C, D and E). Student production graded A or B wasclassified as “High”, student production graded C was classified as “Aver-age” and student production graded D or E as “Low”).3 Table 6.2. shows thedistribution of the 82 oral tests across the three test rating categories.
As Table 6.2. shows, the material yielded only 13 oral tests assigned aLow Global grade. The small proportion of student production in the Lowcategory and the limited number of oral tests labelled Low is taken into
3 In the discussions in the present study, the terms “High”, “Average” and “Low” refer to thethree test rating categories.
Table 6.2. Oral tests across the test rating categories
Test rating category Number of oral tests Percentage of oral tests
High 32 oral tests 39%Average 37 oral tests 45%Low 13 oral tests 16%
Total 82 oral tests 100%

93
account in the discussion, for instance, when comparing normalised figuresin the discussion of frequencies (cf. 6.4. Issues to Take into Account: TheStudents’ Speech Rate and the Length of the Oral Tests).
6.4. Issues to Take into Account: The Amount of Student Speech, the Length of the
Oral Tests and the Correlation CoefficientsThe precise length of the oral tests could be a factor influencing the occur-rence of the linguistic features and the grades awarded and should thereforebe taken into account. This applies both to time (total number of minutes,thus including the time used by the interviewer) and the amount of spokenstudent production (number of student words). For this reason, the length ofthe oral tests was measured in minutes, starting from the first greeting untilthe moment when the students left the interviewers.4 The difference inlength between the shortest and the longest oral test was approximately 12minutes; the shortest oral test comprised 8.20 minutes, and the longest20.25 minutes (cf. Appendix 10. The Length of the Tests).
To take into account the amount of student speech, the words producedby the students were also counted (cf. Appendix 11. The Number of Stu-dents’ Words in the Tests). The material comprises 76,760 student words(tests assigned a High grade: 32,040 words, tests assigned an Averagegrade: 35,920 words, and tests assigned a Low grade: 8,800 words).
The frequencies of certain linguistic features (the progressive, abstractnouns, modifiers of adjectives, lexical errors, compensatory strategies, well,you know and and so on) in the student production were normalised per1,000 words (see Biber 1988: 14). Frequencies were divided by the numberof words of the respective test rating category, and this figure was multi-plied by 1,000. The following example illustrates the procedure: 30 abstractnouns appeared in tests assigned a Low grade comprising 8,800 words. 30 /8,800 = 0.003409, and then, 0.003409 x 1,000 = 3.409. The normalisedfigure is thus 3.4 per 1,000 words (cf. Table 11.1).
Finally, the correlation (r) given between the occurrence of certain lin-guistic features and the grades assigned should be commented on (cf. forinstance Table 10.9). A correlation coefficient is a figure that indicates towhat extent two sets of measures are related and to what extent variations inone of them tally with variations in the other (in the present study, forinstance, for the occurrence of the progressive and the Global grades as-signed, see Table 10.9, and, for the Global grades and the Factorial grades
4 Seconds were rounded upwards to the nearest interval of 5.

94
assigned, see Table 8.5). Correlation can be tested for significance and re-sults may be expressed in terms of a 5% or a 1% level of significance. In thepresent study, significance at these two levels will be indicated in the tableswith one asterisk (significance at the 5% level) or two asterisks (signifi-cance at the 1 % level) to indicate whether the results are significant or notand if so, at which significance level (the significance levels are fromWoods, Fletcher and Hughes 1986: 302).
6.5. Defining Standard English and Non-standard Instances
Since accuracy is one of the factors assumed to influence the assessment inthe present study, linguistic features in the student production which do notfollow standard usage as defined in normative school grammars are exam-ined. In a school context, these instances would be judged as “incorrect”.To avoid too prescriptive an approach in the discussion, the terms “standardEnglish” and “non-standard English” instances were used to distinguish thetwo types of uses. The distinction is applied in the analysis of the students’use of the third person singular marker, the progressive and uncountableabstract nouns.
The category of “standard English” instances includes structures whichare described in at least one of three normative school grammars used inSwedish schools, namely, Svartvik and Sager (1971), Hargevik and Harge-vik (1993) and Ljung and Ohlander (1992). Instances which were classifiedas “non-standard English” are not referred to in these school grammars.Certain “non-standard English” instances may of course occur in varietiesof the English language (cf. for instance 1.3. and the discussion of the thirdperson singular marker), but in this specific testing situation it is of interestto focus on structures not considered to be appropriate in a school contextand to see to what extent these features occurred in the student performanceacross the three test rating categories.5
6.6. Sources of Error in the Linguistic AnalysisResearchers who analyse spoken language are fully aware of the difficultiesand laborious work which may be involved in the collection of material. For
5 The notions of error and mistake are discussed in an investigation of grammatical errors inSwedish 16-year-old learners’ written production in English. In that study, the notion of errorstands for a form that is regarded as incorrect in relation to standard English grammar(Köhlmyr 2003: 17).

95
a researcher to analyse spoken production the material must in many casesbe transcribed. The quality of the transcription of the oral script is ex-tremely important for the subsequent linguistic analysis. In the presentstudy, a great majority of the oral tests were transcribed by a secretary at theDepartment of Education and Educational Research, Gothenburg Univer-sity. The written material was then compared with the tape recordings andcorrected by the researcher himself. In a few oral tests, the language had tobe transcribed with the help of the video-recorded material. Evidently, theremay sometimes be a discrepancy between what the transcriber wrote andwhat the students said. In some instances, due to bad sound quality or mis-understandings, there may be divergences. These sequences of bad soundquality should not be neglected but they are unlikely to have influenced theresults of the linguistic investigations to a great extent.
In the linguistic analyses of the linguistic features, various factors aretaken into account in order to describe the students’ performance. They are,for instance, discoursal factors, collocational factors, types of standardEnglish and non-standard English instances and the position of certain lin-guistic items in the utterance. In the presentations of the students’ uses ofthe linguistic features, more factors could be included. They are factorssuch as the way discourse markers or certain nouns attested were pro-nounced with regard to stress and rhythm, and the absence of certain verbforms where they would be expected to appear, for instance the progressive.It is not probable that these factors would have influenced the results. Nev-ertheless, they may be regarded as sources of error for the interpretations ofthe linguistic analyses.

96

97
Part 4:The Practical Organisation of
the Testing Session
The present study describes and interprets the results of the Gothenburgproject, i.e. the grades assigned by the interviewers and the language pro-duced by the students (cf. the Introduction and 4.1. Aims of the Study).Docent Lindblad, head of the Foreign Language Teaching and Testing Re-search Unit of the Department of Education and Educational Research,Gothenburg University, had the full responsibility of organising the testingand collecting the material. The principles of the organisation and the pro-cedures in the collection of the material will be described in this part of thestudy.1
1 The Gothenburg project also contains assessments of some of the students’ performanceby the interviewers in a second round, and by a group of international assessors. These assess-ments are not included in this study.

98

99
CHAPTER 7
Selecting, Testing and Assessing:Organising the Testing and Collecting
the Material
The present chapter provides a survey of the organisation of the testing andthe collection of the material of the Gothenburg project. This survey isstructured in the following way:
– the material of the Gothenburg project,– the 29 students and their background,– the nine interviewers and their background,– the three tasks and the topics, and– the rating criteria.
7.1. The Material of the Gothenburg ProjectThe material of the Gothenburg project, briefly described in the Introduc-tion, was collected on May 8, 1993, with the participation of nine inter-viewers and 29 students from the Swedish gymnasieskola, i.e. upper sec-ondary school.
The testing day yielded three kinds of material: the recordings of thetests, the grades assigned (four grades for each performance, cf. 5.2. Globaland Factorial Grades) and the answers to the questionnaires given by thestudents and the interviewers (cf. Appendices 6 and 7). The 82 successfullyrecorded oral tests are available on audio-tapes and video-tapes, distributedas follows (the total number of graded tests is given in brackets):2
Oral tests assessed by School Teachers: (29) 29 Oral tests assessed by University Teachers: (29) 24 Oral tests assessed by Native Speakers: (29) 29
Total of oral tests: (87) 82
2 Five oral tests were not recorded for technical reasons: one interviewer had trouble withthe tape-recorder and the video-camera.
100
Once the oral tests had been completed, an assistant at Gothenburg Univer-sity transcribed orthographically all that was said in the course of the tests.3
(Normal orthography was used.)Below follows a short extract of the beginning of one student’s produc-
tion given by way of illustration (cf. the pictures of Task 1 in Appendix 4C):
Interviewer: So right now my name is X okay and you are going to talk about somepictures.
Student: Yeah.Interviewer: Right have a good look so then right off we go.Student: Okay there are two boys eh who are going to the beach and they are lying
there on the beach and eating and so then they see a airplane a small airplane amodel in the mountains and they climb up to catch it.
Interviewer: Did you say the mountains? Cliff, I'll give you the word.Student: Aha, cliff okay and they climbs up to catch it and eh then they can't climb
down and eh and an old pair sees them and calls the police and then a policehelicopter comes and catch them and they eh thank the police and the old lady.
Interviewer: Right good (laugh) you have you ever been in a situation like that orso?
Student: No.Interviewer: Never had to be rescued by the police?Student: No (laugh).Interviewer: (laugh) No, boys will be boys. (Task 1, Test S19)
As illustrated in the extract above, non-verbal utterances, for instance, thestudents’ laughs or sighs were included in the transcription. All counting ofstudents words needed for the linguistic analysis was performed manuallyby me from the written transcripts.
The grades assigned comprise the assessments of all the 87 oral tests (82of which are available on tapes, cf. above). As described above (cf. 5.2.Global and Factorial Grades), the tests were assigned the following fourtypes of grades: a Global grade and three Factorial grades for Communica-tion and Fluency, Grammar and Vocabulary, and Pronunciation respec-tively. The grades were given with the help of a set of rating criteria (cf. 7.5.Rating Criteria).
Two questionnaires, one for the students and one for the interviewers,were distributed immediately after the oral tests had been carried out. Thequestions posed to the students dealt with, for instance, their achievementprofile at school, their spare time occupations and their attitudes to the oraltests they had just taken part in. The questions in the interviewers’ question-naire concerned issues such as the method used in the oral proficiency inter-views and their attitudes to the student language they had just heard (seeAppendices 6 and 7 for the questionnaires used).4
3 I transcribed a few oral tests myself.

101
7.2. StudentsThe group of students taking the tests consisted of 29 students from one andthe same school in Gothenburg who were about to finish school a fewweeks later.5 The students were asked by their teachers if they would bewilling to participate in oral tests at the university (no random samplingtook place). They were invited by letter to come to Gothenburg Universityon a Saturday and were remunerated with 200 Swedish crowns for theirparticipation in three oral tests. They were informed about the researchproject and told that the grades assigned would not affect their schoolgrades and that their production would be evaluated purely for researchpurposes. The background variables collected are given in Table 7.1.6
The group of students consisted of 17 girls and 12 boys. The great major-ity, 24 of them, were 19 years old, four were 20 years old and one studentwas 21 years old.
4 Two additional tape-recorded meetings were arranged by myself, one with a nativespeaker interviewer participating in the Gothenburg project and one with a test constructor inHolland. In these two interviews, certain students’ production was listened to and discussed.These discussions provided useful information on what linguistic features could be of signifi-cance for a top grade. They were also valuable in connection with the selection of the linguisticfeatures (cf. 6.1. Criteria and Principles).
5 No students were of immigrant background. The small-scale experiment of the Gothen-burg project did not give priority to collecting material produced by students of differentbackgrounds since the focus of interest was on the interviewers’ grading.
6 These background variables were collected in due course. In the collection of the materialfor the Gothenburg project, the focus of interest was on the grades awarded, not on the stu-dents’ performance as such.
Table 7.1. Students’ background variables
SexAgeCourse programme studiedSchool grade in EnglishSchool grade in SwedishOther foreign languages studiedSchool grades in foreign languagesResults in the National Test of EnglishTime spent in English-speaking countriesTime spent abroadParticipation in language courses abroadReading habitsAccess to international TV channelsInterest in English/American films

102
At the time of the testing, the Swedish gymnasieskola was structured in“study programmes” with different profiles. The students all followed so-called theoretical study programmes. The 29 students were not selected tobe representative of Swedish school-leaving students in general or a groupof average students of their age; instead, they belonged to the group ofstudents in the population who had chosen theoretical studies at upper sec-ondary school level, and with English as one of their subjects of interest.They could therefore be expected to be more interested in language studiesthan many other 19-year-old Swedish people. They represented threecourse programmes as follows:
Economics (Ekonomisk linje): 13 students,Social Science (Samhällsvetenskaplig linje): 12 students, andNatural Sciences (Naturvetenskaplig linje): 4 students.
The students had probably all studied English for nine years in the Swedishschool system.
At the time of the testing, the norm-referenced grading system withgrades ranging from 1 to 5 was still in use. A 5 was the highest grade, and a3 was laid down as the average grade.7 The grades of the 29 students takingthe tests are given in Table 7.2.
On the basis of the school grades above, the students represented bothstudents who could be considered to be successful in their English studiesat school, and some students whose proficiency was lower than average inthe group of students in the 3- and 4-year programmes preparing for higheracademic education. More students belonged to the former than to the lattercategory.
One possible reason for success in language studies could be the timespent abroad in English-speaking countries. According to the informationgiven by the students in the questionnaires, seven students had never visited
7 For a discussion of norm-referenced assessment, see 1.1. Measuring Student Performance.At a national level the five grades of the norm-referenced assessment were to follow a normaldistribution of 7%, 24%, 38%, 24% and 7% (cf. the Introduction).
Table 7.2. Students’ school grades in English
School grade Number of students Percentages
5 4 144 7 243 14 482 4 14
Total 29 100

103
countries where English is spoken, eighteen students had spent betweenone and five weeks in such countries and four students had spent more thanfive weeks (and up to 16 weeks) in countries where English is spoken. Mostof the students who participated in the collection of the material had thusspent only short periods, probably holidays, in English-speaking countries.Eight of the students had participated in a summer language course of Eng-lish arranged by a Swedish organisation.
Since English is the language of communication in many internationalcontexts, the students were asked whether they had spent periods abroadand then had been exposed to English in other countries than those whereEnglish is the primary language. The students’ answers showed that all ofthem had spent at least three weeks abroad. Nine students had spent be-tween three weeks and three months abroad. Eleven of them had beenabroad between three and six months, and seven had spent more than sixmonths abroad. (One student had been abroad for 72 weeks.) Generally, thestudents thus had experiences from time spent abroad and, it may be as-sumed, also from contexts where they had used the English language as ameans of communication.
The students were also asked about their reading habits and whether theyhad access to international TV channels. Of the 29 students, 19 answeredthat they often read books in English in their spare time, five students thatthey had done so only once, and five students stated that they had never readEnglish books outside school. Fifteen students had access to English orAmerican TV-channels such as BBC, CNN or MTV at home.
To sum up, the 29 Swedish students had slightly better grades in Englishthan the average student of English. They were enrolled in programmeswith a theoretical profile in the gymnasieskola. Furthermore, the majorityof the students had experiences of stays abroad, many of them from coun-tries where English is the main native language. A majority of them oftenread books in English in their spare time and had access to internationalTV-channels at home.
7.3. InterviewersThe interviewers were six men and three women, representing three inter-viewer categories: Teachers of English at the Swedish gymnasieskola, Uni-versity Teachers of English and Native Speakers of English (two of themspecially trained examiners, see below). In every category both male andfemale interviewers were represented. There were reasons for the choice ofeach one of the three categories of interviewers, and these reasons are de-scribed in what follows.

104
As for the first category, it was natural to include school teachers sinceoral tests rated by school teachers form the most common setting for oralproficiency testing of English in Sweden. In Swedish schools, the student’sown teacher of English is usually the interviewer and the assessor in theoral test even though teachers, in the last few years, have been encouragedto cooperate in different ways. Furthermore, school teachers are familiarwith the students’ expected level of proficiency in English. It was thus nat-ural that this category of interviewers should be included in the Gothenburgproject. The second category, the university teachers of English, can beexpected to have a thorough theoretical knowledge and to be used to testinguniversity students of English. With this background, their assessment ofthe students’ performance is of interest. The third category, the nativespeakers, may pay attention to different features, both positive and nega-tive, than do non-native speakers. Overall, the interest in the Gothenburgproject was not so much in the individual student’s grades as in the gradesassigned by the interviewers and particularly in the differences between themembers of the three categories of interviewers.8
All the nine interviewers had many years’ experience of Swedish stu-dents of English and the teaching of English in Sweden as well as of oralproficiency testing with Swedish students. The three School Teachers knewsome of the students from school, but only in a few cases were they theirteachers of English. Two of them had worked for more than twenty years onlanguage testing and the construction of the Swedish National Test in Eng-lish. As for the University Teachers, one of them was a native speaker buthad studied English at universities in Sweden and specialised in analysingyoung Swedish students’ written production. The fact that she was a nativespeaker of English was not regarded to be an influential factor because ofher academic studies in Sweden. Two of the Native Speakers had beenexaminers for the Cambridge exams in Sweden for more than twenty years.One of them also worked in the group that was responsible for the construc-tion of the National Test of English in Sweden at the time. The third NativeSpeaker had worked with the English language at university level both inSweden and in Great Britain. The three Native Speakers were thus wellacquainted with Sweden and could be expected to be familiar with the per-formance of Swedish students.
The nine interviewers in the three categories were all about fifty yearsold or older. This fact might, to a certain extent, have contributed to theinterviewers having similar ideas regarding the assessment of foreign stu-dents’ proficiency in English.
The fact that the interviewers represented three different categories of8 In the present study, the interviewer categories are discussed in terms of School Teachers
(ST), University Teachers (UT) and Native Speakers (NS).
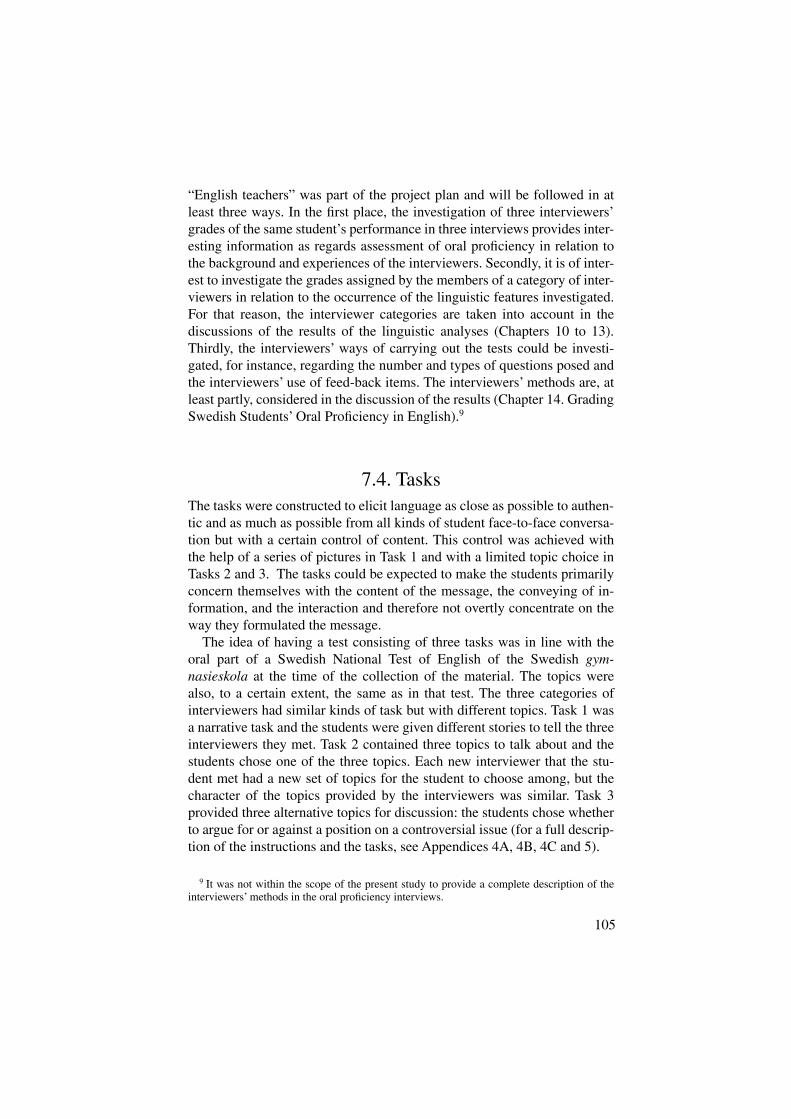
105
“English teachers” was part of the project plan and will be followed in atleast three ways. In the first place, the investigation of three interviewers’grades of the same student’s performance in three interviews provides inter-esting information as regards assessment of oral proficiency in relation tothe background and experiences of the interviewers. Secondly, it is of inter-est to investigate the grades assigned by the members of a category of inter-viewers in relation to the occurrence of the linguistic features investigated.For that reason, the interviewer categories are taken into account in thediscussions of the results of the linguistic analyses (Chapters 10 to 13).Thirdly, the interviewers’ ways of carrying out the tests could be investi-gated, for instance, regarding the number and types of questions posed andthe interviewers’ use of feed-back items. The interviewers’ methods are, atleast partly, considered in the discussion of the results (Chapter 14. GradingSwedish Students’ Oral Proficiency in English).9
7.4. TasksThe tasks were constructed to elicit language as close as possible to authen-tic and as much as possible from all kinds of student face-to-face conversa-tion but with a certain control of content. This control was achieved withthe help of a series of pictures in Task 1 and with a limited topic choice inTasks 2 and 3. The tasks could be expected to make the students primarilyconcern themselves with the content of the message, the conveying of in-formation, and the interaction and therefore not overtly concentrate on theway they formulated the message.
The idea of having a test consisting of three tasks was in line with theoral part of a Swedish National Test of English of the Swedish gym-nasieskola at the time of the collection of the material. The topics werealso, to a certain extent, the same as in that test. The three categories ofinterviewers had similar kinds of task but with different topics. Task 1 wasa narrative task and the students were given different stories to tell the threeinterviewers they met. Task 2 contained three topics to talk about and thestudents chose one of the three topics. Each new interviewer that the stu-dent met had a new set of topics for the student to choose among, but thecharacter of the topics provided by the interviewers was similar. Task 3provided three alternative topics for discussion: the students chose whetherto argue for or against a position on a controversial issue (for a full descrip-tion of the instructions and the tasks, see Appendices 4A, 4B, 4C and 5).
9 It was not within the scope of the present study to provide a complete description of theinterviewers’ methods in the oral proficiency interviews.

106
The three tasks represented a rising degree of difficulty in order to pro-vide challenges for all students and to give them the opportunity to use theEnglish language in different contexts and for various purposes. Task 1 wasconsidered to be an easy task. The purpose of this task was to make thestudents talk with ease at the beginning of the test. Task 1 was labelled “toentertain”: the students were to relate a simple story with the help of somepictures or to compare two pictures. Task 2 was given the label “to inform”:the students were to choose one out of three topics and speak about theirtopic for a few minutes. The topics were entitled, for instance, “An impor-tant meeting in my life” and “A book I would like to read again”. Thepurpose of Task 2 was to make the students speak freely about their ownexperiences or memories. In Task 3 the students were expected to discuss acontroversial issue and show their ability to argue for or against a specificposition. Task 3 was labelled “to argue a case”. The students were to chooseone of three topics. The topics were entitled, for instance, “The age forgetting a driving license should be lowered” and “Scientific experiments onanimals should be prohibited”. The students were given ten minutes ofpreparation for Task 1 and Task 2. Instructions for Task 3 were given duringthe test (cf. the discussion of prepared and unprepared tasks in 1.2. OralProficiency Testing).
For the purpose of illustration, the topics most often selected within eachinterviewer category are listed below:
Interviews with School Teachers: “It is necessary / not necessary to have marks atschool” and “The age for getting a driving license should be lowered / raised"(These two topics were equally popular.)
Interviews with University Teachers: “It is better to start a family early in life / whenyou are older”.
Interviews with Native Speakers: “Keeping up with new trends in clothing is impor-tant / not important”.
It is evident that if a student tells exactly the same story twice or threetimes, his or her performance may improve in the second and thirdrounds. Differences in grades could then be explained by the student’spractice in telling a story or talking about an identical topic. This wouldhave been the situation if the topics and the tasks had been identical in theGothenburg students’ three tests. For that reason, similar tasks were usedbut with different topics in the three tests assessed by the three groups ofinterviewers.

107
7.5. Rating CriteriaRating criteria in general are used to facilitate assessments and to give theassessors a common ground for their grades. Rating scales may thus beused to describe levels of language proficiency in guided criterion-refer-enced assessment (cf. 1.1. Measuring Student Performance). The scalesdescribe different levels of student performance, and assessors are to decidewhat descriptions the student production corresponds best to. Qualifierssuch as "sometimes", "most", "often" and "occasionally" are characteristicof the language of rating scales (Underhill 1987: 100). Rating scales typi-cally have between three and nine levels (McNamara 2000: 41).
The rating criteria were more or less the same as those being formulatedat the time by, among others, Docent Lindblad, for the new upper second-ary school national syllabus, known as Lpf 94 (cf. Introduction) and close tothose used in the National Test of English for the Swedish gymnasieskola(Centralprov 1993, åk 2:310). There were some differences, however. Moregrading levels were used in the assessment in the Gothenburg project: fiveas against the three used in the National Test. This applies both to the Glo-bal and the Factorial grades. The intention was that all the five levels of therating criteria should represent levels that might all be applicable in theassessment of the students who participated in the Gothenburg project.
The rating criteria of the Global Evaluation include descriptions on afive-step scale and range from
(A) – Distinction: Fluent and overall correct use of English to (E) – Poor: Poor production of English in many respects.
Parts of the wordings that occur in the global criteria of the other threegrades (grades given in brackets) are (B) production with minor inaccuracies,(C) acceptable language, and (D) often inaccurate.
The rating criteria of Factor 2a (Communication and Fluency) contain de-scriptions of the students’ initiatives. The criteria of four out of the fivegrades include descriptions of the students’ initiatives:
(A) frequently takes the initiative, (B) often takes the initiative, (C) sometimes takes the initiative, and(D) rarely takes the initiative.
10 2:3 = the second year of the three- and four-year study programmes.

108
The rating criteria of Factor 2b (Grammar and Vocabulary) focus not onlyon the occurrence of errors but also on the use of vocabulary and structures.Accuracy is of certain importance of this factorial grade since the one of thetwo words error or mistake appears in the criteria of all the five grades:
(A) errors never disturbing,(B) few errors when using complex structures,(B) basic errors very rare,(C) … a few noticeable basic errors,(D) basic errors are noticeable, (E) makes many kinds of mistake, and(E) frequent basic errors.
Factor 2c (Pronunciation) emphasises on intonation and the pronunciationof individual sounds. The concepts “intonation” and “pronunciation of indi-vidual sounds” are used in the criteria of four out of the five grades. Thecriteria which describe intonation include:
(A) very good intonation,(B) good intonation,(C) acceptable intonation, and(E) first language intonation.
Interference from Swedish is described in the rating criteria for Factor 2b(Grammar and Vocabulary) and, in particular, for Factor 2c (Pronuncia-tion). Regarding Factor 2b, the criteria describe interference from Swedishin the use of vocabulary:
(E) Sometimes uses Swedish words.
Descriptions of the influence of the mother tongue appear in the criteria ofthree grades for the assessment of Pronunciation:
(B) some influence of native language clearly detectable(C) foreign accent evident, and (E) first language intonation.
The acceptability of errors is pointed out in the top criteria of Grammar andVocabulary
(A) errors never disturbingwhereas the intelligibility of the student’s production is given prominencein the criteria of the grades at the bottom of the scale of Factor 2a:
(E) speech can be difficult to follow and of Factor 2c:

109
(D) some utterances difficult to understand, putting strain on the lis-tener, and
(E) difficult to understand due to pronunciation.
The rating criteria employed in the Gothenburg project thus reflect the lev-els of proficiency in English that the students taking part in the projectcould be expected to represent, i.e. students who were about to leave theSwedish gymnasieskola after studies in programmes preparing for aca-demic education in 1993 (cf. the Introduction). They also focus on, forinstance, the students’ degree of initiative and on interference from themother tongue.
It might be of interest to compare the rating criteria of the Gothenburgproject with other rating criteria developed to assess language proficiency.For comparison, the rating criteria developed in the Common EuropeanFramework of Reference for Languages: Learning, Teaching, Assessment(2001; note: eight years after the Gothenburg project) will be scrutinized.The Framework document (CEF)11 contains several criteria and an outlineof six broad levels is provided to give an adequate coverage of the learningspace relevant to European language learners (ibid. 2001: 23). The six lev-els are higher and lower interpretations, respectively, of the common divi-sion into basic, intermediate and advanced. The six levels are
A: Basic User (A1 Breakthrough; A2 Waystage),B: Independent User (B1 Threshold; B2 Vantage), andC: Proficient User (C1 Effective Operational Proficiency; C2 Mastery).
The descriptions of the Common Reference Levels regarding qualitativeaspects of spoken language use were selected for the comparison with therating criteria employed in the Gothenburg project. The CEF rating scalecontains criteria regarding five factors and rating criteria of the five factors– Range, Accuracy, Fluency, Interaction and Coherence – are thus providedfor the six levels described above.
In what follows below (see Table 7.3.), the rating criteria of the Gothen-burg project for Communication and Fluency, and Grammar and Vocabu-lary are compared with the rating criteria of the five factors of the CommonReference Levels in CEF.12 Formulations which I consider to be close inmeaning are matched.
11 The abbreviation CEF is used, as it is for the Common European Framework, for in-stance, by Andered (2001).
12 The rating criteria for Pronunciation of the Gothenburg project were excluded in thecomparison since there are no descriptions of intonation, stress, accent and the articulation ofindividual sounds in the Framework document.

110
The criteria of the levels C1 – B2 – B1 – A2 of CEF at least partly matchthe criteria of the grades A – B – C – D – E of Communication and Fluencyof the Gothenburg project. The rating criteria for Grammar and Vocabularyof the Gothenburg project are compared with the criteria of the five aspectsof CEF in Table 7.4.
The criteria of the levels C1 – B2 – B1 – A2 of CEF at least partly alsomatch the criteria of the grades A – B – C – D – E of Grammar and Vocab-ulary of the Gothenburg project. On the basis of the comparisons above, inspite of the fact that the rating criteria were constructed in different con-texts, it may be concluded that the descriptions in the rating criteria of theGothenburg project can be described in the following way according to thelevels of CEF: from “Effective Operational Proficiency of the ProficientUser (C1)” to “Waystage of the Basic User (A2)”.
7.6. The Organisation of the Testing SessionThe testing was arranged so that the students would meet as many differentinterviewers as possible and that few students would be interviewed by thesame three members of the three interviewer categories. The aim was to
Table 7.3. The rating criteria of Communication and Fluency versus therating criteria of CEF
The Rating Criteria of Communication and Fluency of the Gothenburg project The Rating Criteria of CEF
Grade A: “Performs with ease”
Grade A: “Comfortable and completely fluent”
Level C1 of Range: “Without having to re-strict what he/she wants to say”Level C 1 of Fluency: “Can express himself/herself fluently and spontaneously, almost ef-fortlessly”
Grade B: “Occasional hesitations and pauses for language search”
Level B2 of Fluency: “ …he/she can be hesi-tant as he/she searches for patterns and ex-pressions”
Grade C: “Sometimes produces longer and fairly coherent flow of language”
Level B2 of Fluency: “Can produce stretches of language with a fairly even tempo …”
Grade D: “Can generally only produce short and less complex utterances”
Level B1 of Coherence: “Can link a series of shorter, discrete simple elements into a con-nected linear sequence of points”
Grade E: “Constantly needs help” Level A2 of Interaction: “Is rarely able to un-derstand enough to keep conversation going of his/her own accord”

111
provide as many combinations as possible of the nine members of the threeinterviewer categories.
The order in which the tests were carried out was also taken into account.One third of the students started with interviews assessed by School Teach-ers, one third with interviews assessed by University Teachers and, finally,one third had their first performance assessed by Native Speakers. Moreo-ver, there was a break of at least 20 minutes between two oral proficiencyinterviews for each individual student.
On their arrival, the students were given a code: a letter (= the student)and three numbers (= the tests) (cf. Appendix 1). There were several rea-sons for this arrangement. Firstly, the aim was to facilitate both the identifi-cation of the individual student and his/her three interviews in further inves-tigations. Secondly, the letters employed (instead of the students’ names)made it possible to use the material in additional assessments without hav-
Table 7.4. The rating criteria of Grammar and Vocabulary versus the ratingcriteria of CEF
Rating Criteria of Grammar and Vocabulary of the Gothenburg project Rating Criteria of CEF
Grade A: “Accurate use of a wide range of structures”
“Errors never disturbing”
“Accurate use of a wide range of structures. Very good range of vocabulary”
Level C1 of Accuracy: “Consistently main-tains a high degree of grammatical accuracy”Level C1 of Accuracy: “Errors are rare, diffi-cult to spot and generally corrected when they do occur”Level C1 of Range: “Has a good command of a broad range of language …”
Grade B: “Few errors when using complex structures”
“Use of vocabulary and structures appropriate in most contexts”
Level B2 of Accuracy: “Shows a relatively high degree of grammatical control. Does not make errors which cause misunderstanding, and can correct most of his/her mistakes.”Level B2 of Range: “Has a sufficient range of language to be able to give clear descriptions, express viewpoints on most general topics…”
Grade C: “… in general good command of structure and vocabulary”“Range of vocabulary adequate”
Level B2 of Accuracy (cf. above)
Level B2 of Range (cf. above)
Grade D: “Structures limited in range”
“Dependent on paraphrase or simplification”
Level B1 of Accuracy: “ Uses reasonably ac-curately a repertoire of frequently used ‘rou-tines’ and patterns …”Level B1 of Fluency: “ … pausing for gram-matical and lexical planning and repair is very evident …”
Grade E: “Makes many kinds of mistake Frequent basic errors”
Level A2 of Accuracy: “Uses some simple structures correctly, but still systematically makes basic mistakes.”

112
ing to reveal the students’ identity. In these additional rounds of assess-ments (for instance, a second assessment by the nine interviewers of theproject) the students could be identified with the help of the numbers only.The numbers given to the students’ tests were arranged so that an assessorin an additional round of assessment would not have been able to identifythe individual student with the help of the number. In the present study, astudent’s performance is referred to as, for instance, A76 (A = the student;76 = the number of the test; information on the interviewer categories isadded where relevant). (The schedule of the testing on May 8, 1993, isprovided in Appendix 3.)
7.7. SummaryThe material of the Gothenburg project used in the present study consists ofrecorded oral proficiency interviews, the four grades assigned to each test,the interviewers’ comments on the tests and the answers to the questions ofquestionnaires. Twenty-nine Swedish students who were about to completetheir studies at the Swedish gymnasieskola and who represented three dif-ferent theoretical study programmes were interviewed. The participantswho were asked to interview the students in the tests and assess their per-formance were three Swedish school teachers of English at the gym-nasieskola, three university teachers of English and three native speakers ofEnglish. Three tasks were used which represented increasing levels of diffi-culty and were expected to give the students the opportunity to show theiroral proficiency in English. Rating criteria were employed to grade the stu-dents and the interviewers were instructed not only to give an overall Glo-bal grade, but also to grade the students for Communication and Fluency,Grammar and Vocabulary, and Pronunciation. The overall focus was not onthe grades given to the individual student but rather on the grades assignedby the members of the categories of interviewers.
The Gothenburg project was initiated, planned (the selection of students,the construction of tasks, the selection of interviewers, the organisation ofthe testing sessions, the principles in the assessments of the student per-formance and the formulation of the rating criteria) and carried out by Do-cent Lindblad of the Foreign Language Teaching and Testing Research Unitof the Department of Education, Gothenburg University.

113
Part 5:The Results of the Project

114

115
CHAPTER 8
Grades Awarded to the Students’ Oral Proficiency
The assessment of the 87 oral tests carried out by the nine interviewers willbe the topic of the present chapter. In the questionnaires and in spontane-ous discussions after the completion of the interviews, the interviewers ex-pressed their opinion that the students were good at speaking English. Wewill now see whether this generally positive attitude is confirmed by thegrades. The results will be reported and briefly discussed in the presentchapter, but will be subject to further discussion and interpretation inChapter 14.
The assessment resulted in Global grades for all 87 oral tests. Factorialgrades were given to almost all oral tests (Factor 2a to 85, Factor 2b to 84,and Factor 2c to 85 oral tests).1 Every test was thus assigned four differentgrades (Global grades and Factors 2a, 2b and 2c) with the help of the ratingscale A-B-C-D-E (cf. Appendix 8. The Rating Criteria). For the Globalgrades, the following short descriptions were provided: A = Distinction; B= Very good; C = Pass; D = Not enough; E = Poor. (For all the Global andFactorial rating criteria, see Appendix 8).
In what follows the grades awarded will be presented, first the students’Global grades and then the three Factorial grades. The three Factorialgrades comprise Communication and Fluency (Factor 2a), Vocabulary andGrammar (Factor 2b), and Pronunciation (Factor 2c). Then the four gradesassigned to each test will be compared. The focus will be not only on thegrades awarded by the interviewer categories but also on the individualinterviewer’s grades. Furthermore, the grades that each individual studentobtained for his/her production will be presented.
1 School Teacher 1 did not assign Factorial grade 2a to two tests, Factorial grade 2b to threetests, and Factorial grade 2c to two tests.

116
8.1. Global Performance GradesIn Table 8.1., all Global grades are presented together with the mean valuesand the standard deviation across the three interviewer categories2. Table8.1. and Figure 8.1. show that the students are not a homogeneous group ofhigh-flyers. This increases the interest in the other tables.
Table 8.1. shows that the highest mean grade (4.7) was given to studentsM and WW, and the lowest (2.0) to ZZ. Furthermore, it shows that theoverall mean of the 29 students is 3.3, and that 13 students have means of 3or 3.3. The rating criteria of the Global Evaluation are as follows:
In terms of the rating criteria, it is possible to describe this mean level of thestudents roughly in the following way: the students’ language is acceptablein spite of some errors, and their production is sometimes even consideredto be very good and only to have minor inaccuracies. As can be seen fromTable 8.1., the three interviewers’ Global grades do not always agree. Moststudents received two different grades, and some students even three. Thisis interesting and will be discussed at some length (cf. 14.1. Global Per-formance Grades). At this stage we can observe that the University Teach-ers and the Native Speakers gave higher Global grades to the students thandid the School Teachers. The grades (means and standard deviations) givenby the individual interviewers within each of these categories are also quitedifferent. The standard deviations of the grades assigned to the individualstudent in Table 8.1. point to differences between the interviewers.3 Astandard deviation of 0 indicates that the three interviewers gave the samegrades to a student. This is the case for eight out of the 29 students. It isworth observing that these eight students’ production was given either 3 or4 (cf. Table 8.1.).
The grades assigned represent the middle standard of the list of criteria.It is also notable that four students were given three different grades bythe three interviewers. Three of these four students were assigned the
2 For clarity, the grades in the Tables are presented in the following way: A=5; B=4; C=3;D=2 and E=1. For a discussion of the implications of transforming the original ‘letter grades’awarded by the interviewers into ‘figure grades’, see 5.2. Global and Factorial Grades.
A = 5 B = 4 C = 3 D = 2 E = 1
Fluent and overall correct use of English.
Very goodproduction with minor inaccuracies.
Acceptable language in spite of errors.
Not showing enough to be acceptable.
Poor production of English in many respects.
3 Cf. note 33 in Chapter 6.
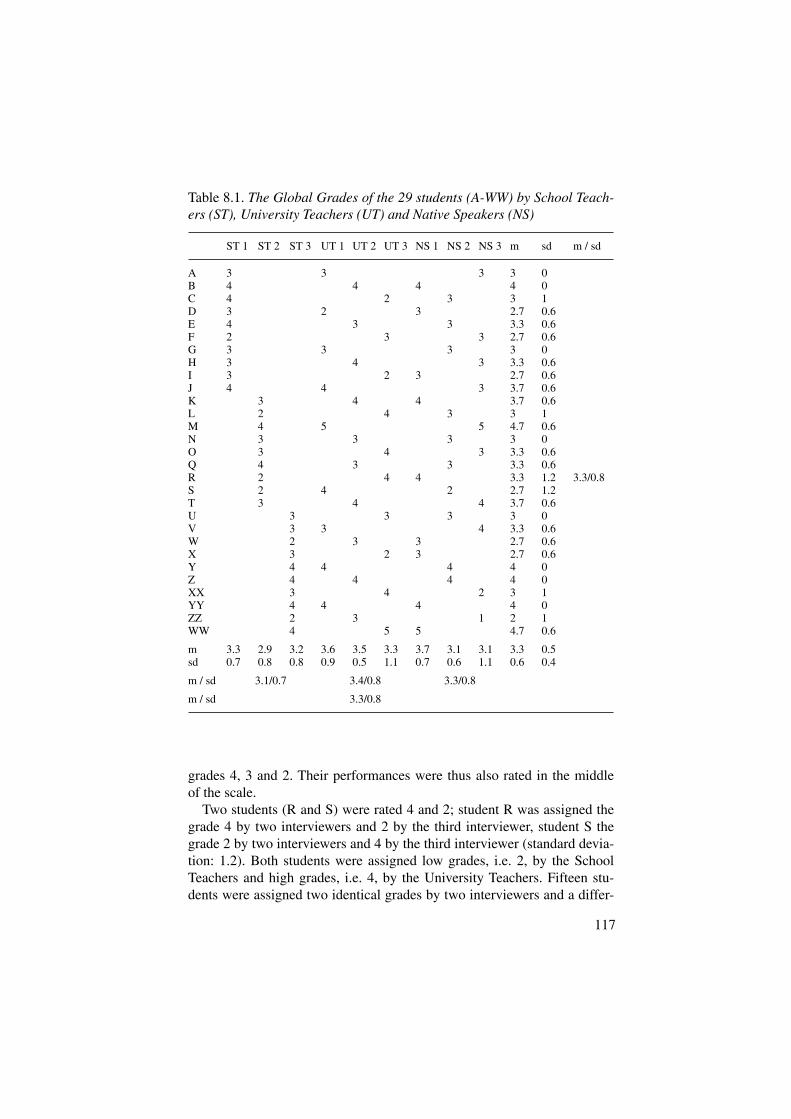
117
grades 4, 3 and 2. Their performances were thus also rated in the middleof the scale.
Two students (R and S) were rated 4 and 2; student R was assigned thegrade 4 by two interviewers and 2 by the third interviewer, student S thegrade 2 by two interviewers and 4 by the third interviewer (standard devia-tion: 1.2). Both students were assigned low grades, i.e. 2, by the SchoolTeachers and high grades, i.e. 4, by the University Teachers. Fifteen stu-dents were assigned two identical grades by two interviewers and a differ-
Table 8.1. The Global Grades of the 29 students (A-WW) by School Teach-ers (ST), University Teachers (UT) and Native Speakers (NS)
ST 1 ST 2 ST 3 UT 1 UT 2 UT 3 NS 1 NS 2 NS 3 m sd m / sd
A 3 3 3 3 0B 4 4 4 4 0C 4 2 3 3 1D 3 2 3 2.7 0.6E 4 3 3 3.3 0.6F 2 3 3 2.7 0.6G 3 3 3 3 0H 3 4 3 3.3 0.6I 3 2 3 2.7 0.6J 4 4 3 3.7 0.6K 3 4 4 3.7 0.6L 2 4 3 3 1M 4 5 5 4.7 0.6N 3 3 3 3 0O 3 4 3 3.3 0.6Q 4 3 3 3.3 0.6R 2 4 4 3.3 1.2 3.3/0.8S 2 4 2 2.7 1.2T 3 4 4 3.7 0.6U 3 3 3 3 0V 3 3 4 3.3 0.6W 2 3 3 2.7 0.6X 3 2 3 2.7 0.6Y 4 4 4 4 0Z 4 4 4 4 0XX 3 4 2 3 1YY 4 4 4 4 0ZZ 2 3 1 2 1WW 4 5 5 4.7 0.6
m 3.3 2.9 3.2 3.6 3.5 3.3 3.7 3.1 3.1 3.3 0.5sd 0.7 0.8 0.8 0.9 0.5 1.1 0.7 0.6 1.1 0.6 0.4
m / sd 3.1/0.7 3.4/0.8 3.3/0.8
m / sd 3.3/0.8

118
ent one by the third interviewer (standard deviation: 0.6). In more than halfof the instances, the School Teachers assigned these different grades (foreight of the 15 students).4 Six of these eight grades were lower than thoseassigned by the other two interviewers.
The means of the Global grades (as well as the standard deviations) ofthe individual interviewers are shown at the bottom of Table 8.1. For theinterpretation of the figures, it should be borne in mind that the interview-ers assessed different students. Nevertheless, it is worth observing that it isa School Teacher (School Teacher 2) that has the lowest mean. The SchoolTeachers (as a category) also show the lowest mean. This finding is com-mented on in Chapter 14. The distribution across the different grades interms of the students’ means in the three oral tests is illustrated in Figure8.1. The figure shows that most students have means of 2.7, 3.0 or 3.3, i.e.in the middle of the scale. More students have their means on the upperhalf than on the lower half of the scale. No students had means of 2.3, 2.5,3.5, 4.3, or 5.
8.2. Communication and Fluency GradesTable 8.2. shows the distribution of the grades assigned for Communicationand Fluency (Factorial grade 2a). The rating criteria are as follows
4 The University Teachers gave different grades to five of the 15 students and the NativeSpeakers assigned different grades to two of them.
Figure 8.1. Number of students receiving various mean Global grades.
0
1
2
3
4
5
6
7
8
9
10
2 2.3 2.5 2.7 3 3.3 3.5 3.7 4 4.3 4.7 5
Number ofstudents
Grades

119
The highest mean grade for Communication and Fluency was given to stu-dent M (5.0) and the lowest to ZZ (2.0). As can be seen in Table 8.2, eightof the 29 students were given the same grades by the three interviewers(standard deviation: 0). Seven of these eight students were assigned gradeson the upper half of the rating scale, either 4 or 5. They represent the bestperformances judged by the interviewers according to the rating criteria.Five students (students F, Q, S, T and ZZ) were assigned three differentgrades (standard deviation: 1.0)5. Four of these five students were assignedthe highest grades by the Native Speakers or by the University Teachers.One student (R) was assigned grade 2 by the School Teacher and grade 4by the other two interviewers (standard deviation: 1.2). Thirteen studentswere assigned two identical and one different grade (standard deviation:0.6). In the case of eight of these thirteen students it was the UniversityTeachers who disagreed with the other interviewers, either by awarding alower (four students) or a higher (four students) grade. The means of theinterviewer categories reveal that the School Teachers gave the lowestgrades and the Native Speakers the highest. The standard deviations ob-tained for the individual interviewers (within interviewer categories) varyfrom 0.5 to 1.1.
The results show that the students were given high grades for Commu-nication and Fluency. These grades were even higher than those assignedin the Global evaluation, i.e. the overall impression of the student produc-tion. This is obvious in the grades given by the Native Speakers, in par-ticular.
The distribution of the students’ means obtained for Communication andFluency is illustrated in Figure 8.2. As shown in this figure, the majority ofthe students’ means are between 3 and 4. In terms of the rating criteria,students are thus “easy (or very easy) to understand”. Moreover, “they take
A = 5 B = 4 C = 3 D = 2 E = 1
Comfortable and completely flu-ent. Performs with ease. Long and exhaustive answers. Takes frequent initia-tives.
Extended contri-butions at natural speed and tempo. Very easy to understand. Occasional hesi-tations and pauses for lan-guage searching. Takes initiatives.
Easy to under-stand. Takes some initiatives. Sometimes pro-duces longer and fairly coherent flow of language.
Can generally only produce short and less complex utter-ances. Initiatives are rare and con-tribute little. Needs help.
Frequent hesita-tions disrupt the flow of language. Speech can be difficult to fol-low. Constantly needs help.
5 Students A and D were assigned two grades only, and these were different. The standarddeviation shows 1 for two different grades assigned.

120
the initiative in the conversation and contribute at natural speed andtempo”. Figure 8.2. also reveals that the students’ means for Communica-tion and Fluency tend to spread more than the means for the Global grades(cf. Figure 8.1.).
Table 8.2. Factorial Grade 2a (Communication and Fluency) of the 29 stu-dents (A-WW) by School Teachers (ST), University Teachers (UT) and Na-tive Speakers (NS)
ST 1 ST 2 ST 3 UT 1 UT 2 UT 3 NS 1 NS 2 NS 3 m sd m / sd
A – 3 4 3.5 1B 4 4 4 4 0C 4 3 4 3.7 0.6D – 2 3 2.5 1E 4 3 4 3.7 0.6F 2 3 4 3 1G 3 3 3 3 0H 3 4 3 3.3 0.6I 3 2 3 2.7 0.6J 4 4 4 4 0K 4 4 4 4 0L 3 4 3 3.3 0.6M 5 5 5 5 0N 3 3 4 3.3 0.6O 4 5 4 4.3 0.6Q 2 3 4 3 1R 2 4 4 3.3 1.2 3.5/ .8S 2 4 3 3 1T 5 3 4 4 1U 4 3 3 3.3 0.6V 4 4 4 4 0W 3 3 4 3.3 0.6X 3 2 3 2.7 0.6Y 5 4 4 4.3 0.6Z 4 4 4 4 0XX 3 4 3 3.3 0.6YY 4 4 4 4 0ZZ 2 3 1 2 1WW 4 5 5 4.7 0.6
m 3.4 3.3 3.6 3.7 3.4 3.5 3.8 3.6 3.6 3.5 0.6sd 0.7 1.2 0.8 0.9 0.5 1.1 0.7 0.5 1.1 0.7 0.4
m / sd 3.4/ 0.9 3.5/ 0.8 3.7/ 0.8
m / sd 3.5/ 0.8

121
8.3. Grammar and Vocabulary GradesThe second Factorial grade (2b) pertains to Grammar and Vocabulary; therating criteria are as follows:
Table 8.3. shows that the mean is lower for this competence (3.1) than forCommunication and Fluency (3.5) in Table 8.2. or the Global grade in Table8.1. (3.3). A comparison of the means of the interviewer categories showsthat the School Teachers have the lowest mean. This is in line with thetendency observed in the grades for Communication and Fluency. Thegrades presented in Table 8.3. show that the interviewers gave lower gradesfor Grammar and Vocabulary and that the grades varied more than the Glo-bal grades and the grades for Communication and Fluency (the standarddeviations are slightly higher in Table 8.3. than in Table 8.1. or 8.2.). When
A = 5 B = 4 C = 3 D = 2 E = 1
Accurate use of a wide range of structures. Very good range of vocabulary. Errors never disturbing.
Use of vocabu-lary and struc-tures appropriate in most contexts. Few errors when using complex structures. Basic errors very rare.
Some inaccura-cies and a few noticeable basic errors but in gen-eral a good com-mand of structure and vocabulary. Range of vocabu-lary adequate.
Structures lim-ited in range. Ba-sic errors are no-ticeable. De-pendent on para-phrase or simplification. Shows a limited vocabulary re-source.
Makes many kinds of mistake. Very limited range of vocabu-lary. Frequent ba-sic errors. Some-times uses Swed-ish words.
Figure 8.2. Number of students receiving various mean Communication and Flu-ency grades.
0
1
2
3
4
5
6
7
8
9
10
2 2.3 2.5 2.7 3 3.3 3.5 3.7 4 4.3 4.7 5
Numberofstudents
Grades

122
the grades of the individual student’s mastery of grammar and vocabularyare compared, Table 8.3. shows that the highest mean grade was given tostudent M (5.0). The three interviewers agreed on her top performance(standard deviation: 0). The lowest mean grade was assigned to student ZZ(2.0). In his case, the interviewers had very different opinions about hisperformance and gave him three different grades (i.e. 1, 2 and 3; standarddeviation: 1). Seven of the 29 students were given identical grades by the
Table 8.3. Factorial Grade 2b (Grammar and Vocabulary) of the 29 stu-dents (A-WW) by School Teachers (ST), University Teachers (UT) and Na-tive Speakers (NS)
ST 1 ST 2 ST 3 UT 1 UT 2 UT 3 NS 1 NS 2 NS 3 m sd m / sd
A – 3 3 3 0B – 4 4 4 0C 3 2 3 2.7 0.6D – 2 3 2.5 1E 3 3 2 2.7 0.6F 2 2 3 2.3 0.6G 3 2 3 2.7 0.6H 3 3 2 2.7 0.6I 4 3 3 3.3 0.6J 4 4 3 3.7 0.6K 2 4 3 3 1L 2 3 3 2.7 0.6M 5 5 5 5 0N 3 3 3 3 0O 2 2 3 2.3 0.6Q 4 3 3 3.3 0.6R 3 4 3 3.3 0.6 3.1/0.9S 2 3 2 2.3 0.6T 2 4 4 3.3 1.2U 3 3 3 3 0V 3 2 3 2.7 0.6W 2 3 3 2.7 0.6X 3 2 2 2.3 0.6Y 4 3 4 3.7 0.6Z 4 4 4 4 0XX 3 4 2 3 1YY 4 4 4 4 0ZZ 2 3 1 2 1WW 4 5 5 4.7 0.6
m 3.1 2.7 3.2 3.1 3.4 3.0 3.3 3.0 2.9 3.1 0.5sd 0.7 1.1 0.8 1.1 0.5 1.1 0.9 0.7 1.1 0.7 0.3
m / sd 3.0/0.9 3.2/0.9 3.1/0.9
m / sd 3.1/0.9

123
three interviewers (standard deviation: 0; students A and D were only as-signed two grades, cf. note 52). These seven students represent either amiddle or a high standard in relation to the rating criteria (grades 3, 4 and5). For the majority of the students, however, the interviewers did not givethe same grades. Seventeen students were given two identical and one dif-ferent grade, 3, 3 and 4, for instance (standard deviation: 0.6). The deviantgrades were lower for ten students and higher for seven students. The devi-ant grades assigned spread across the three interviewer categories.6 Oneinterviewer gave an altogether different grade to one student (T) (standarddeviation: 1.2). The University Teacher and the Native Speaker agreed ongrade 4, but the School Teacher gave a different grade (grade 2).
Figure 8.3. presents the distribution of the students’ means. Many stu-dents were assigned grades in the middle of the rating scale: 16 of the 29students have means of 2.7, 3 or 3.3. With the help of the rating criteriatheir performances may be described in the following way: “The studentshave a good command of structure and vocabulary, but their productioncontains basic errors. They are sometimes dependent on paraphrase or sim-plification.”
6 For the ten students whose deviant grade was lower, the low grade was assigned by theSchool Teachers to three students, by the University Teachers to four students, and by theNative Speakers to three students. For the seven students whose deviant grade was higher, thehigh grade was assigned by the School Teachers to three students, by the University Teachersto two students, and by the Native Speakers also to two students.
Figure 8.3. Number of students receiving various mean Grammar and Vocabularygrades.
0
1
2
3
4
5
6
7
8
9
10
2 2.3 2.5 2.7 3 3.3 3.5 3.7 4 4.3 4.7 5
Numberofstudents
Grades

124
8.4. Pronunciation GradesTable 8.4. presents the grades for Pronunciation. The rating criteria for Pro-nunciation include descriptions of intonation, rhythm and individualsounds. They are as follows:
Again, student M was assigned top grades and has the highest mean (5.0).Student A has the lowest mean, of the two grades assigned (2.0)7. Eight ofthe 29 students were assigned the same grade for their pronunciation by thethree interviewers (standard deviation: 0; student A was only assigned twogrades). Five of these eight students were assigned grade 3. The remaining21 students were thus assigned different grades. Six of them were giventhree different grades by the interviewers (standard deviation: 1.0).8 Forfive of these six students, the grades are centred in the middle of the scale,from 2 to 4. The University Teachers assigned the highest grades to four ofthe six students and the Native Speakers gave the middle grade 3 to five ofthem. One student (Q) was given a remarkably different grade by theSchool Teacher (grade 5), but identical grades by the University Teacherand the Native Speaker (grade 3) (standard deviation: 1.2). Twelve studentswere assigned two identical and one different grade (standard deviation:0.6). For nine of them, the differing grade was lower; five of these lowgrades were given by the School Teachers.
The means of the interviewer categories are the same for School Teach-ers and Native Speakers (3.2), but there are slight differences in the spreadof the grades (standard deviations: 0.9 and 0.7). This implies that gradesgiven by the Native Speakers to Pronunciation tend to spread less than isthe case with the two other interviewer categories. This finding is furtherinvestigated in 8.5. Comparative Discussion of the Four Grades Given, anddiscussed in 14.3. Interviewer Categories.
A = 5 B = 4 C = 3 D = 2 E = 1
Correct pronun-ciation of indi-vidual sounds and very good in-tonation and rhythm. A for-eign accent may be discernible.
Very good pro-nunciation. Good intonation and rhythm. Some in-fluence of native language clearly detectable.
Good pronuncia-tion of most of the individual sounds and ac-ceptable intona-tion. Foreign ac-cent evident.
Individual sounds poorly ar-ticulated. Some utterances diffi-cult to under-stand, putting strain on the lis-tener.
Difficult to un-derstand due to pronunciation. First language in-tonation. Poor ar-ticulation of indi-vidual sounds.
7 No Factorial grade was assigned by one interviewer (cf. note 52). 8 Students B and D were assigned only two grades. The two grades were different for both
(standard deviation: 1.0).

125
Figure 8.4. shows the distribution of the student means. Ten students’means were 3.0, and these students’ pronunciation can be summarized inthe following way with the help of the rating criteria: “Good pronunciationwith evident foreign accent.”
Figure 8.5. gives a survey of the four grades assigned to the studentproduction discussed above. The figure shows that grade 4/B was given toapproximately 40 oral tests for Communication and Fluency (Factor 2a).The students’ pronunciation was assigned grade 3 in approximately 45cases. If grade 2 was given, it tended to be given for Grammar and Vocabu-lary (20 oral tests).
Table 8 4. Factorial Grade 2c (Pronunciation) of the 29 students (A-WW) bySchool Teachers (ST), University Teachers (UT) and Native Speakers (NS)
ST 1 ST 2 ST 3 UT 1 UT 2 UT 3 NS 1 NS 2 NS 3 m sd m / sd
A – 2 2 2 0B – 4 3 3.5 1C 4 2 3 3 1D – 2 3 2.5 1E 4 4 3 3.7 0.6F 3 2 3 2.7 0.6G 3 3 3 3 0H 3 3 3 3 0I 3 3 3 3 0J 5 4 3 4 1K 3 4 4 3.7 0.6L 2 4 3 3 1M 5 5 5 5 0N 3 4 3 3.3 0.6O 2 4 3 3 1Q 5 3 3 3.7 1.2R 3 4 3 3.3 0.6 3.3/0.8S 2 3 3 2.7 0.6T 2 4 3 3 1U 3 3 3 3 0V 3 3 4 3.3 0.6W 2 3 3 2.7 0.6X 3 2 3 2.7 0.6Y 4 4 4 4 0Z 3 4 4 3.7 0.6XX 3 4 2 3 1YY 3 3 3 3 0ZZ 3 3 2 2.7 0.6WW 4 5 5 4.7 0.6
m 3.6 3.0 3.1 3.2 3.6 3.3 3.3 3.2 3.0 3.3 0.6sd 0.8 1.2 0.6 1.0 0.5 1.1 0.7 0.4 0.9 0.6 0.4
m / sd 3.2/0.9 3.4/0.9 3.2/0.7
m / sd 3.3/0.8

126
8.5. Comparative Discussion of the Four Grades Given
Questions regarding the relationship between the Global grades and theFactorial grades are of great interest. If the Global grades and one of theFactorial grades, for instance Grammar and Vocabulary, are identical formany students, it could indicate that this aspect of the student production isthe most important for the overall impression in the assessment by the inter-
Figure 8.4. Number of students receiving various mean Pronunciation grades.
Numberofstudents
Grades
Figure 8.5. The distribution of Global and Factorial grades to the tests.(A/5 = Distinction; B/4 = Very good; C/3 = Pass; D/2 = Not enough; E/1 = Poor).
0
5
10
15
20
25
30
35
40
45
Global Factor 2a Factor 2b Factor 2c
Grade A/5
Grade B/4
Grade C/3
Grade D/2
Grade E/1
Numberoftests

127
viewers. The overall impression could also influence the Factorial gradesassigned by the interviewers (cf. the halo-effect in 7.3. Sources of Varia-tion). Table 8.5. shows the number of tests that were assigned the same ordifferent Global and Factorial grades.
The three Factorial grades show the same pattern when compared withthe Global grades assigned to the individual student’s production. The Fac-torial grades were different from the Global grades in roughly the samenumber of tests (24 or 25). This means that all three Factorial grades corre-late equally with the Global grades.
The background and the experiences of the interviewers may no doubthave influenced the grades they assigned to the students’ production, butobserved differences will mainly be followed up on the group level. Inter-esting tendencies may be observed in the distribution of the Factorial gradesfor Communication and Fluency, and for Pronunciation. Table 8.6. gives thethree Factorial grades assigned to the student production by the three cate-gories of interviewers: School Teachers (ST), University Teachers (UT) andNative Speakers (NS). These grades show two tendencies worth comment-ing on.
Firstly, the Native Speakers did not assign any student’s production thegrade D/2 (= Not enough) for Factor 2a (Communication and Fluency)whereas the other interviewers did so. (One student however was assignedthe lowest grade 1 for Communication and Fluency by a Native Speaker.)When commenting on the grades, the Native Speakers also emphasisedaspects of oral production such as “actually getting the message across”.Secondly, the grades for Factor 2c (Pronunciation) tend to be in the middleof the scale. Most student production was rated C/3 (= Pass), particularlywhen assessed by the Native Speakers. The Native Speakers were slightlymore reluctant to award the grades A/5 or B/4 for Pronunciation than werethe School Teachers or University Teachers. The correlation coefficients
Table 8.5. Number of tests for which the Global grades were the same as ordifferent from the Factorial grades respectively
Factor 2a Communicationand Fluency
Factor 2b Grammar and Vocabulary
Factor 2c Pronunciation
Global grade the same 60 60 61Global grade different 25 24 24
Total 85 84 85
Correlations with Global grades 0.78** 0.81** 0.78**

128
between the categories of interviewers’ Global and Factorial grades areprovided in Table 8.7.
Table 8.7. shows three tendencies worth pointing out. Firstly, the SchoolTeachers’ and the Native Speakers’ grades for Grammar and Vocabularycorrelated more (0.77 and 0.89) with the Global grades than did theirgrades for Communication and Fluency, and for Pronunciation. Secondly,the University Teachers’ grades for Communication and Fluency showedthe highest correlation coefficient (0.90). Thirdly, the School Teachers’grades for Communication and Fluency showed the lowest correlation(0.65). As a whole, it is interesting to observe the generally high correlationcoefficients and the low correlation figure for Communication and Fluencyin the grades assigned by the School Teachers.
The disagreement in the grades awarded to a student’s three oral tests bythe three interviewers is worth discussing at some length (cf. Chapter 14),with the focus on the grades given by the individual interviewer. In Tables
Table 8.6. Factorial Grades 2a, 2b and 2c versus interviewer categories(School Teachers (ST), University Teachers (UT) and Native Speakers (NS)
(A = Distinction; B = Very good; C = Pass; D = Not enough; E = Poor)
Factor 2a Communicationand Fluency
Factor 2b Grammar and Vocabulary
Factor 2c Pronunciation
Grade ST UT NS ST UT NS ST UT NS
A/5 3 3 2 1 2 2 3 2 2B/4 11 12 17 7 8 5 5 12 4C/3 8 11 9 10 12 16 14 10 20D/2 5 3 0 8 7 5 5 5 3E/1 0 0 1 0 0 1 0 0 0
Total 27 29 29 26 29 29 27 29 29
Table 8.7. Correlations between the categories of interviewers’ Global andFactorial grades
Factor 2a Communication and Fluency
Factor 2b Grammar and Vocabulary
Factor 2c Pronunciation
Means of correlation
School Teachers 0.65** 0.77** 0.73** 0.72University Teachers 0.90** 0.77** 0.80** 0.82Native Speakers 0.82** 0.89** 0.81** 0.84Means of correlation 0.78 0.81 0.78 0.79

129
8.1. to 8.4., we could observe that the interviewers assigned two or eventhree different Global or Factorial grades to certain students. The differ-ences were described in terms of standard deviation (0.6, 1.0 and 1.2). It isof interest to look more closely at the students whose three tests were as-signed three different grades (= standard deviation: 1.0), and the students’tests which were given one divergent grade besides two identical ones (withone grade apart), for instance 4 by one interviewer, and 2 by two interview-ers (= standard deviation: 1.2). Students whose production was assignedhighly different grades are discussed in 8.6. Grades Assigned to the Individ-ual Students, and in Chapter 14 (cf. 14.4. Individual Students’ Grades). Inwhat follows, the focus is on the interviewers.
As for the Global grades, six students (C, L, R, S, XX and ZZ) wereassigned very different grades (standard deviation: 1.0 or 1.2; cf. Table8.1.). For two of them (L and R), the School Teacher, and more preciselySchool Teacher 2, gave the lowest grade (of the three grades assigned). Thegrades for Communication and Fluency, and Pronunciation show the sametendency. School Teacher 2 gave the lowest grade for Communication andFluency to three (Q, R and S) of the six students (F, Q, R, S, T and ZZ)who were assigned very different grades (standard deviation: 1.0 or 1.2; cf.Table 8.2.). The grades for Pronunciation showed great differences forseven students (C, J, L, O, Q, T and XX). School Teacher 2 graded four ofthem (L, O, Q and T), and to three of them he gave the lowest grade of thethree grades assigned, for instance 2 when the other interviewers gave 4and 3. We may conclude that when differences in grades awarded to a stu-dent were found, School Teacher 2 gave the lowest grade to half of thesestudents9.
An investigation of the grades assigned by the individual interviewer canprovide information regarding whether members of one of the interviewercategories tended to show more variation, or consensus with the other twointerviewer categories. For that reason, it is also of interest to study theindividual interviewer’s assessment when the interviewers agreed on thegrades (cf. Table 8.8.). In Tables 8.1. to 8.4. we could see that some studentswere assigned the same grade in their three tests (standard deviation: 0).The interviewers agreed on the Global grades for eight students. The gradesawarded by Native Speaker 2 are found in the grades assigned to five ofthem and the grades assigned by School Teacher 3 appear in four of them.This tendency can also be seen in the grades for Grammar and Vocabulary.School Teacher 3 and Native Speaker 2 gave the same grades as other inter-
9 School Teacher 2 gave the lowest Global grade to three of six students, the lowest grade forCommunication and Fluency to three of six students, the lowest grade for Grammar and Vo-cabulary to two of four students and the lowest grade for Pronunciation to four of sevenstudents.

130
viewers to three of the five students who were given the same grades in theirthree interview.
As for Communication and Fluency, University Teacher 1 gave the samegrades as the other interviewers to five of the eight students who were as-signed the same grades.
We may conclude that School Teacher 3 and Native Speaker 2 tended togive the same grades as other interviewers did in their Global grade and intheir grade for Grammar and Vocabulary. University Teacher 1 did so in hisgrades for Communication and Fluency. These three interviewers thustended to show more consensus with other interviewers in their assess-ments. Further comments are given to these findings concerning the gradesassigned by the individual interviewers in Chapter 14 (cf. 14.3. InterviewerCategories).
8.6. Grades Assigned to the Individual StudentsAs described in Chapter 7, all the students were tested three times by threeinterviewers. In this section, the differences in the grades assigned by thethree interviewers to the individual student will be discussed in more detail.
Table 8.8. displays how many students were assigned the same grades bythe three interviewers and the number of students who were assigned differ-ent grades by their three interviewers (the Global and the three Factorialgrades are presented in separate columns).
Table 8.8. shows that for a majority of the students, 21 or 22 students out
Table 8.8. Number of students whose Global or Factorial grades were thesame or different in their three oral tests
Global grades
Factorial grades (2a) for Communication and Fluency
Factorial grades (2b) for Grammar and Vocabulary
Factorial grades (2c) for Pronunciation
The same grade in the student’s three tests 8 8 7a
a Two of these seven students were not assigned a Factorial grade in one of the three tests. (cf.Table 8.3.).
8b
b One of these eight students was not assigned a Factorial grade in one of the three tests. (cf.Table 8.4.).
Different grades in the student’s three tests 21 21 22 21
Total 29 29 29 29

131
of the 29, the assessors disagreed in their assignment of Global and/or Fac-torial grades. The same tendency is seen in all Global and Factorial grades.
It is interesting to investigate the degree of divergence in the grades as-signed to the individual student’s three oral tests, e.g. 5 – 5 – 4 (Student M)and 4 – 3 – 2 (Student C), (cf. Table 8.1.). Table 8.9. gives the number ofstudents who were assigned different Global and Factorial grades for theirproduction (“Two” stands for two different grades, e.g. 5 – 4 – 4; “Three”for three different grades, e.g. 5 – 4 – 3). Only students whose productionwas assigned different grades are included in Table 8.9. (cf. Table 8.8.).
Table 8.9. shows that most of the students who were assigned differentgrades in their three tests were rated differently in only two of the total ofthree tests (e.g. 4 in two tests, 3 in one). A few students, between three andsix, were assigned different grades in all three of their tests (e.g. 4 in one, 3in the second, and 2 in the third test).Very few of the students, i.e. only oneor two students, were assigned two identical grades and one remarkablydifferent grade (in their three tests (e.g. 4 in two tests, 2 in one).
Notice that the grades for Communication and Fluency and for Pronunci-ation show a slightly greater diversity in the individual student’s three teststhan do the grades for Grammar and Vocabulary. Figure 8.6.10 illustratesthese findings.
10 The two types of non-agreement of grades assigned to the individual students’ three tests(e.g. 4-4-3 or 4-4-2, cf. Table 8.9.) are presented together in the category “Two differentgrades”.
Table 8.9. Number of students who were assigned the same, two different orthree different Global or Factorial grades in the three tests by the threedifferent interviewersa
a The students who were not assigned one Factorial grades in one of the tests are included inTable 8.9. (cf. Table 8.8.).
Global grade
Factor 2a Communication and Fluency
Factor 2b Grammar and Vocabulary
Factor 2c Pronunciation
The same grade, e.g. 4-4-4 8 8 7 8Two different grades, one-step differential, e.g. 4-4-3 15 15 18 14Two different grades, two-step differential, e.g. 4-4-2 2 1 1 1Three different grades, e.g. 4-3-2 4 5 3 6
Total 29 29 29 29

132
The students who were given three different grades in their three tests areof interest. Four students were given three different Global grades by thethree interviewers. Three of them (students C, L and XX) were assignedgrades from the middle of the scale, namely 4, 3 and 2. The fourth (studentZZ) was given the grades 3, 2 and 1. This tendency of assigning grades inthe middle of the scale can also be observed in the grades for Communica-tion and Fluency. Five students were given three different grades (studentsF, Q, S, T and ZZ). The grades given to three of them (students F, Q and S)were 4, 3 and 2. Only three students were given three different grades forGrammar and Vocabulary (cf. Figure 8.6.). For two of them, the grades were4, 3 and 2. The grades for Pronunciation show slightly more differences: sixstudents were given three different grades. Five of them were given gradesin the middle of the scale (4, 3 and 2). Thus the differences in the gradesassigned seem to concern the assessment of “average” students and theinterpretation of the rating criteria in the middle of the scale. This finding isfurther developed in Chapter 14 and in Reflections in the Conclusion.
8.7. Grades in Relation to the Length and Order of the Interviews
The grades assigned might have been influenced by the length measured interms of number of words or minutes of the student performance, whetherthe interview was the individual student’s first, second or third one, andwhether the student was interviewed at the beginning or the end of thetesting session by the interviewers (cf. Appendix 3. The Organisation of theTests on May 8, 1993).
Figure 8.6. Agreement or non-agreement in grades assigned to the individual stu-dents’ three tests by their three interviewers.
0
2
4
6
8
10
12
14
16
18
20
Global Factor 2a Factor 2b Factor 2c
AgreementTwo different gradesThree different grades
Numberofstudents
Gradesassigned

133
In this section, the following relationships are therefore presented:
(a) the Global grades and the number of words produced by the students, (b) the Global grades and the length in time of the production, and finally, (c) the Global grades and the order of the production, i.e. the individual
student’s first, second and third interview of the testing session (cf. 7.6.The Organisation of the Testing Session).
(a) Number of words in student production and Global grades assigned. Asdescribed in 6.3., the student performances vary in length. In the shortestinterview a student spoke 480 student words and in the longest one anotherstudent used 2,010 words. Figure 8.7. illustrates the relationship betweenthe Global grades assigned and the number of student words in each inter-view. The results show that interviews which were given low grades, i.e. D(2) and 1 (E), consist of 500 to 700 words or 701 to 900 words respectively(the latter only grade D).
The interviewers did not assign low grades to performance which waslonger than 900 words. It is thus evident that the students to whom theinterviewers gave low grades did not speak at length. Long performancewas assigned grades in the middle of the scale, i.e. the grades 4 and 3.Many of the tests which were assigned grade 4 were long. The tests as-signed the highest grade were of average length (701 to 1100 words). Theoverall correlation between the Global grades assigned and the number ofstudents’ words was 0.31.11 Thus, it seems that little student talk, i.e. rela-
11 The correlations between the three Factorial grades and the length in words were asfollows: Communication and Fluency: 0.47; Grammar and Vocabulary: 0.20; Pronunciation:0.21.
Figure 8.7. Students’ Global grades versus length of students’ production in words.
Numberofstudents
Number ofwords
0
2
4
6
8
10
12
500-700 701-900 901-1100 1100 and morewords
Grade A/5
Grade B/4
Grade C/3
Grade D/2
Grade E/1

134
tively few words in a test, is related to low Global grades (for further dis-cussion of this observed tendency, see Chapter 14).
(b) Length of student production in minutes and Global grades assigned.The length of the student production was not only measured in students’words but also in minutes. The shortest student’s production was about 8minutes long, the longest slightly more than 20 minutes. Figure 8.8. illus-trates the relationship between the Global grades assigned and the length ofthe student production in minutes. The results show no very clear relation-ships but the same tendency as the one described above can be observed;student production assigned a Low grade, and in particular the grade 2,tends to be short, i.e. between 8 and 10 minutes long. The correlation was0.13 between the Global grades and the length in minutes.12 This correla-tion and Figure 8.8. show that there is no clear relationship between thelength of the interviews in time (as opposed to in words, see above) and thegrades awarded.
(c) The students’ first, second and third tests and the Global grades as-signed. Finally, the relationship between the grades assigned and the orderof the performance has been investigated. Figure 8.9. displays the distribu-tion of the grades in the students’ first, second and third interviews of thetesting session. Slightly more students were assigned low grades, in partic-ular grade 2, in their first production than in the second or third. The oppo-site tendency can be observed as regards the high grade 4; fewer studentswere assigned this high grade in their first interview than in their second or
12 The correlations between the three Factorial grades and the length in minutes were asfollows: Communication and Fluency: 0.13; Grammar and Vocabulary: 0.06; Pronunciation:0.11.
Figure 8.8. Students’ Global grades versus length of student production in minutes.
Numberof tests
Length oftest
0
2
4
6
8
10
12
14
16
18
8-10 min 10-12 min 12-14 min 14-20 min
Grade A/5
Grade B/4
Grade C/3
Grade D/2
Grade E/1

135
third. The order of the interviews does not seem to be of importance for thestudents who were assigned the top grade 5. The findings above are furtherdiscussed in Chapter 14.
The Global grades assigned were also compared with the order in whicheach interviewers assessed each test to see whether the order of the testscould have contributed to low or high grades (cf. the organisation of thetests in Appendix 3, and the effect of sequencing in 2.3. Reliability). Theresults of the investigation showed no clear tendencies. Both high and lowGlobal grades were given by the individual interviewers at the beginningand end of the testing day. Nor did the Global grades assigned by one of thethree interviewer categories show any clear tendency.
8.8. Grades in Relation to Background VariablesThis section focuses on the Global grades assigned to student production inrelation to a number of background variables. The Factorial grades are in-cluded in the discussion only where it seems relevant. First the distributionof the Global grades are studied relative to the students’ sex, age, educa-tional profile (the course programme studied in the Swedish gym-nasieskola) and their school grades in English from the previous autumnterm. Then the relationship between the grades assigned and the resultsobtained in the National Test of English one year earlier are dealt with.Finally, students’ experience of English (time spent in English-speakingcountries, time spent in other countries) in relation to the grades assigned inthe tests is discussed.
Table 8.10. below illustrates the distribution of the Global grades for theboys and the girls.
By and large, the grades of girls’ and boys’ performance had a similardistribution of the three grades 4, 3 and 2. The top Global grade 5 was onlyassigned to girls’ production.
Figure 8.9. Students’ Global grades versus the order of the students’ interviews.
0
2
4
6
8
10
12
14
First interview Second interview Third interview
Grade A/5
Grade B/4
Grade C/3
Grade D/2
Grade E/1
Numberof tests

136
A great majority of the students were 19 years old when they took thetest, five of them were 20 or 21 years old. The Global grades should becompared with the students’ age, although it might seem unlikely that oneor two years of difference in age would play a significant role here. Theresults of this comparison are presented in Table 8.11.
Table 8.11. shows that the age difference is not an important factor forthe high Global grades assigned. A majority of the students who were 20and 21 years old at the time of the testing were assigned average grades (9out of 15). Of the interviews with the 19-year-olds, 42% were assigned theaverage grade 3, compared with 60% of the interviews with the 20–21-year-olds.
As pointed out above, students from three course programmes of theSwedish gymnasium were represented in the material of the Gothenburgproject: four from “Natural Sciences”, twelve from “Social Sciences” andthirteen from “Economics” (cf. 7.2. Students). The Global grades assignedto the students are examined in relation to these three course programmes inTable 8.12.
Table 8.12. shows a slight tendency that the students who were taking“Natural Sciences” were assigned higher grades than other students. (Theaverage grades are as follows: Natural sciences: 3.9; Social sciences: 3.4;Economics: 3.0.) This is not surprising. When the project was carried out in1993, the course programme “Natural Sciences” was known to attract stu-dents with the highest grades from compulsory school.
Table 8.10. Global grades assigned to boys’ and girls’ production
Global grades A/5 B/4 C/3 D/2 E/1 Total
Boys’ production 0 14 (39%) 16 (44%) 5 (14%) 1 (3%) 36 (100%)Girls’ production 4 (8%) 17 (33%) 23 (45%) 7 (14%) 0 51 (100%)
Total 4 (5%) 31 (36%) 39 (44%) 12 (14%) 1 (1%) 87 (100%)
Table 8.11. Global grades by age
Grade Age A/5 B/4 C/3 D/2 E/1
Total tests
Number of students
19 4 28 30 10 0 72 2420 0 2 7 2 1 12 421 0 1 2 0 0 3 1
Total 4 31 39 12 1 87 29

137
At the time of the testing, a norm-referenced 1–5-point grading systemwas still in use, 5 being the top grade. No students included in the Gothen-burg study had the lowest grade 1 in English. The students were self-se-lected which may account for the lack of truly poor students (cf. 7.2. Stu-dents). In Table 8.13. the Global grades are compared with the students’grades in English at school. The correlation between the Global grades andthe school grades is 0.47.
The results above give rise to the following three observations. Firstly, ingeneral more students were given higher than lower grades in the oral testscompared with their school grades in English. Secondly, the Global gradesassigned to the students with the two top school grades 4 and 5 do not showany major differences in distribution. They spread in a similar way acrossthe three Global grades A/5, B/4 and C/3. (Students with the school grade5: 2 (15%), 7 (60%), and 3 (25%) tests; students with the school grade 4: 2(8%), 13 (55%) and 8 (33%) tests). Thirdly, the Global grades assigned tostudents who have the low grade 2 in English at school do not differ, pro-portionally speaking, from those assigned to students who had the averagegrade 3. (Students with the school grade 2: 2 (22%), 5 (56%), 1 (11%) and1 test (11%); students with the school grade 3: 9 (21%), 23 (55%) and 10tests (24%).) This indicates that some low-achievers had their strength inoral proficiency. According to this tendency observed, it may be assumed
Table 8.12. Global grades by course programme
Grades Course programme A/5 B/4 C/3 D/2 E/1
Total tests
Number of students
Natural sciences 2 7 3 0 0 12 4Social sciences 2 13 18 3 0 36 12Economics 0 11 18 9 1 39 13
Total 4 31 23 7 1 87 29
Table 8.13. Global grades versus school grades in English
Global grades School grades A/5 B/4 C/3 D/2 E/1
Total tests
Number of students
5 2 7 3 0 0 12 44 2 13 8 1 0 24 83 0 9 23 10 0 42 142 0 2 5 1 1 9 31 0 0 0 0 0 0 0
Total 4 31 39 12 1 87 29

138
that particularly the Factorial grades 2c (Pronunciation) assigned to thesestudents should show the same tendency, and possibly more strongly (asopposed to Factor 2a, Grammar and Vocabulary, which is probably tested inmany other contexts at school). Figure 8.10.13 tests this hypothesis.
Figure 8.10. confirms that students with the low grade 2 in English atschool were not awarded consistently lower factorial grades for pronuncia-tion than were students with the average school grade 3. The correlationbetween the Pronunciation grades and the School grades was 0.40.
Another tendency in Figure 8.10. is worthy of our attention. The resultsshow a slight difference in the proportions of the grades assigned to thestudents who have the high grade 4 at school. In Table 8.13, 13 out of the 24oral tests (i.e. 54%) were assigned the Global grade 4, whereas in Figure8.10., 8 of the 24 oral tests (i.e. 33%) were assigned the Factorial grade 4for Pronunciation. These students’ grades for Pronunciation were thussomewhat lower than their Global grades. No other such differences in pro-portions can be observed.
It is also of interest to study the relationship between the Global gradesand the results the students had obtained in the National Tests of English.These results are in the form of the grades 1 to 5. The students had takenthis test the year before the material of the Gothenburg project was col-lected, i.e. in the spring term of 1992.14
As a whole there are certain similarities between the students’ Globalgrades of the oral tests and the National Test Results, which are based onoverall proficiency, except that there was, at the time, no oral test included.The correlation coefficient between the Global grades and the Grades in theNational Test is 0.40. It is interesting to notice that students with poor re-sults in the National Test, i.e. the grades 1 or 2, may still have high or
13 Two tests were not given grades for Pronunciation. The students in these tests had grade 3in English at school.
14 This National Test was for the three- and four-year study programmes (cf. the Introduc-tion).
Figure 8.10. Factorial grades for Pronunciation versus school grades in English.
0
5
10
15
20
25
School grade 5 School grade 4 School grade 3 School grade 2
Grade A/5
Grade B/4
Grade C/3
Grade D/2
Grade E/1
Numberofstudents
Schoolgrade

139
average Global grades assigned to their oral tests in the material of theGothenburg project.
As was mentioned above, the students were asked about their experienceof stays in English-speaking countries. The purpose was to see how manyof the students had such experience and whether this background variableseemed to be of importance for the grades assigned. The answers in thequestionnaire showed that one student (L) had spent 16 weeks in English-speaking countries. This was considerably more than was the case with theother students. The grades of student L’s three oral tests were overall 4 or 3except for the grade for Grammar and Vocabulary in one assessment thatwas the low grade 2. This student was thus not among those who wereassigned the top grades. The same tendency could be observed when thegrades (the Global grades and the grades for Communication and Fluency)of twelve students who had experience from English-speaking countries15
were compared with those of seven students who had no such experiences.The mean Global grade was 3.15 for the former and 3.24 for the lattergroup of students (the mean grades for Communication and Fluency werefor the former 3.51 and for the latter group 3.50). To sum up, experiencefrom stays in English-speaking countries does not seem to have had anyeffects on the grades assigned.
8.9. Students’ Opinions about the TestsThe students were asked to answer 17 questions about the test in a question-naire after the testing sessions (for the questionnaire, see Appendix 7). Inwhat follows, the students’ answers to three of the questions are discussed:
15 The students had been in an English-speaking country for more than a week.
Table 8.14. Global grades versus grades in the National Test of Englisha
a The results from the National Test were not available for three students. One of these threestudents was assigned an E as the Global grade for his performance.
Global grades Grades in the National Test A/5 B/4 C/3 D/2 E/1
Total tests
Number of students
5 2 10 0 0 0 12 44 2 3 11 2 0 18 63 0 14 18 4 0 36 122 0 2 1 3 0 6 21 0 1 4 1 0 6 2
Total 4 30 34 10 0 78 26

140
– whether the students thought they were given the opportunity to showtheir competence,
– what they thought about the tasks, and– what they thought about the interviewers’ methods.
Twenty-six of the 29 students answered that they thought that they had beengiven the opportunity to show their competence in English in the oral profi-ciency interviews.
In the answers to the question regarding the tasks, it was evident that thestudents appreciated the discussion in task 3 (“to argue a case”) most. Task3 was considered to be quite authentic-like and stimulating, although someof the students thought it was difficult to discuss some issues without anytime for preparation. Another reason for their positive attitude to the lasttask was that they appreciated that they were given the opportunity to ex-press their own opinions.
As for the interviewers’ methods in the interviews, the students tend toprefer the conversations with the Native Speakers; 23 students answeredthat the Native Speakers were easy to talk to, whereas only 13 to 16 students,i.e. half of them, thought so about the other two interviewer categories.
8.10. SummaryIn this chapter the grades assigned to the student production were pre-sented. The Global grade and the three Factorial grades were compared andthe three interviewer categories and the grades assigned to the individualstudents’ three tests were taken into account. The relationships between thegrades assigned and a number of background variables were discussed.
The results of the investigation of the Global grades indicated that morestudents were rated on the upper than on the lower half of the rating scale.The rating criteria of these grades indicate that the interviewers regardedthe students’ output as “very good production” or “acceptable language inspite of errors”. The Factorial grades suggest that the students were consid-ered as being slightly better at Communication and Fluency than at Gram-mar and Vocabulary. The grades for Pronunciation tended to cluster in themiddle of the scale, particularly when assessed by the Native Speakers.
Generally, the School Teachers gave lower grades, both Global and Fac-torial than did the other two interviewer categories. The Native Speakersgave the highest grades for Communication and Fluency. Differences couldbe observed in the grades assigned by individual interviewers within aninterviewer category.
A majority of the students were assigned the same grades in two or all

141
three of their tests, but some students were given two, or even three, differ-ent Global or Factorial grades.
As for background variables, it was shown that age, sex, and time spentin English-speaking countries did not seem to influence the grades as-signed. The Global grades correlated slightly with the students’ grades ob-tained in English at school and with their results from the Swedish NationalTest of English, although students with low grades there were sometimesassigned high grades in the interviews, in particular for Pronunciation.
The results are further discussed and interpreted in Chapter 14.

142
CHAPTER 9
The Individual Linguistic Features Included in the Analysis:
An Introduction
In this chapter the ten linguistic features (cf. 6.2. Linguistic Features) willbe discussed with respect to the criteria for classification and the principlesadopted in the presentation of the results in Chapters 10 to 13. The tenlinguistic features selected are as follows:
1. the third person singular marker, 2. the progressive, 3. abstract nouns, 4. modifiers of adjectives, 5. lexical errors and compensatory strategies,6. well, 7. you know, 8. intonation, 9. stress, and
10. speech rate.
Illustrative examples will be given from the student performance for eachlinguistic feature.1 (For the reasons and principles in the selection of lin-guistic features, see 1.3. Linguistic Analyses of Students’ Proficiency, and6.2. Linguistic Features.)
9.1. Verbal GroupThere are good reasons for discussing some common problems in the stu-dents’ use of verbal constructions (cf. 1.3. Linguistic Analyses of Student’sProficiency). In general, the knowledge of how to make proper use of verbshas been claimed to be important from a communicative point of view in astudy on reactions to non-native English (Hultfors 1986: 188). Further-
1 The student’s letter and the test number are added to each example, for instance U6 =Student U in test number 6 (cf. 7.6.).

143
more, teachers are fully aware of the importance of a student’s mastery ofthe verbal group in communication, both in writing and in speaking, andthey also recognise that students at different levels can have great difficul-ties with the use of verbs.
In the material of the Gothenburg project, the samples of student produc-tion show great differences not only in the frequencies of the instances butalso in the types of some verbal expressions used. This is why the focus inthe present analysis is on both quantitative and relevant qualitative featuresof use in the investigations of the students’ uses of the third person singularmarker and the progressive. Their distribution is compared with the threetest rating categories High, Average and Low in order to ascertain the im-portance of these features for the impression of a successful oral production.
9.1.1. The Third Person Singular MarkerOccurrences of the third person marker are discussed in Chapter 10 in rela-tion to the test rating categories High, Average and Low (cf. 6.2. Classify-ing Student Performance into Test Rating Categories), together with thedistribution of the instances across the interviewer categories (SchoolTeachers, University Teachers and Native Speakers) and the three tasks (toentertain, to inform, to argue a case). Two background variables are alsotaken into account (sex and grades in English at school).
In the classification, non-standard English uses include instances of thethird person singular marker not recognised in prescriptive terms, as op-posed to standard English instances which occur in contexts where they areexpected to occur according to descriptions in school grammars (for a dis-cussion of these terms, see 6.4. Defining Standard English and Non-stand-ard English Instances).
The two categories of analysed instances are thus:
standard English: he takesnon-standard English:
type 1 *he taketype 2 *they takestype 3 other non-standard English instances with the
third person singular marker
Examples (1), (2) and (3) below from the data are given to illustrate thethree subcategories of the non-standard English uses:
type 1: (1) and then he fall asleep (L87)type 2: (2) his parents dies (G82)type 3: (3) an animal who gots hurt (H83)

144
Co-ordinated structures such as he plays and sings occur in the material.Since instances such as *he plays and sing emerged, every verb is countedas one instance. Self-corrected instances are not included in the discussion,2
nor are modals included as they lack number contrasts. 3
9.1.2. The ProgressiveThere is evidence from previous studies of students’ difficulties and thenegative impression that may be caused by the inappropriate use of theprogressive (cf. 1.3. Linguistic Analyses of Students’ Proficiency). The in-terviewers of the Gothenburg project also pointed out that the improper useof the progressive was a frequent feature in the student production. Thefollowing answer to a question in the interviewers’ questionnaire is givenfor illustration:
... och sedan så naturligtvis användningen utav den progressiva formen som mycketsällan användes på rätt sätt. (… and then of course the use of the progressive whichwas very seldom used in a correct way.) (University Teacher 1).
Besides the reasons discussed in 1.3, this answer suggests that the students’use of the progressive in oral production is a relevant topic to investigate inthe linguistic analysis. The three instances below illustrate the students’ useof the progressive in the material.
(4) “well it is really something if you’re coming as a tourist to Gothenburg (Z26)”
(5) “he makes a phone call and I think he’s calling the cops or the police andthat’s how he gets out” (Q2)
(6) “or I think I would be banging on the door I think” (G82)
The variation in the use of the progressive and simple forms in present-dayEnglish may lead to difficulties when deciding whether students’ use of theprogressive should be considered to be adequate or inadequate. Differentcriteria can be used in the assessment. In the present study, the instanceswere classified in standard English and non-standard English categories onthe basis of the descriptions found in three Swedish school grammars (cf.6.4. Defining Standard English and Non-standard English Instances). Onlysemantic and pragmatic contextual features were considered in the discus-sion and classification.4 Three categories of non-standard use of the pro-
2 167 instances of self-corrections of verbs, nouns, prepositions and pronouns emerged inthe student production.
3 Instances of the non-standard English type (*he cans) did not appear in the material. 4 The reason was that relatively few instances (15%) contained incorrect verb forms (errors
of concord or tense).

145
gressive were identified in the analysis of the student production. Accord-ing to the three school grammars consulted, the simple form is preferred inthese contexts (Hargevik and Hargevik 1993: 179; Svartvik and Sager1975: 141–143; Ljung and Ohlander 1992: 87–93).5 The three categories ofnon-standard use of the progressive are
1. Habit (The student talks about what he/she regularly does.)2. Objective circumstance (The student talks about facts or completed ac-
tions.)3. Stative verbs (The student uses verbs which describe the state of things,
for instance possess, like, contain, resemble, cost).
Four examples are given to illustrate the two categories of standard Englishand non-standard English instances and the various uses of the progressivein the student production. First two examples of standard English use andthen two examples of non-standard English use are given.
Standard English use:In (7), the student describes what she is doing while speaking in the inter-view.
(7) “now I’ve chosen to talk about my hobby my hobby is horses that’s why I’mlooking out the window” (G68).
In (8), the student argues for lowering the age when one can start practisingfor getting a driving license.
(8) “if you get eh what do you say well you’ve been doing it for such a long timeso it’s not a big deal any longer I think” (XX12).
Non-standard English use:In (9), the student discusses whether the age for getting a driving licenseshould be lowered or raised. In this discussion, he puts forward a fact fromexperiments. This instance is considered to be non-standard English ac-cording to the second criterion (cf. above, Objective circumstance).
(9) “it is showing in the experiments that in statistics that elderly drivers arebetter cause they are more experienced” (Y10) (instead for: it has beenshown).
In (10), the student describes why one house is expensive to rent in Task 1(cf. Appendix 4B). This instance is regarded to be non-standard English
5 These three Swedish school grammars do not describe all functions of the progressive. Fora discussion of the uses of the progressive, see for instance Rydén (1977).

146
according to the third criterion (cf. above, Stative verbs) because of the useof cost in the progressive.
(10) “yeah but I think it’s the area that’s costing you” (L42) (instead for: the areathat will cost you).
In order to provide a picture of the contexts where the progressive is used inthe student production, it is also of interest to investigate in what contextsthe standard English instances appear. Task 1 was a narrative task accom-plished with the help of a series of pictures which elicited instances of theprogressive. The proportions of standard English instances that are clearlyrelated to Task 1 in the students’ production are also presented in 10.2. TheProgressive. The progressive in these instances is used to describe an actionin progress in some pictures. These figures are compared with the instancesof other uses of the progressive in the students’ production. The standardEnglish instances were thus classified in two categories.
1. The progressive used to describe the action in progress of the pictures inTask 1.
2. The progressive used in other contexts.
Two examples are given to illustrate the two categories.In (11), representative of the first category, the student describes the se-
ries of pictures in Task 1 (cf. Task 1 in Appendix 4C).
(11) “so then they are at the beach and they’re drinking and eating and having fun,so” (WW30)
In (12), the student discusses why it is better to start a family when one isold than when one is young.
(12) “you can’t have children when you are so young because you don’t have a jobyou are maybe studying and you can’t do both things have children and studyI don’t think it’s too good” (D34)
According to differences in the complexity of the structures, the instancesof the progressive were also described in terms of the progressive simpleand the progressive complex. The progressive simple includes structureswith am, are, is, was, were and a present participle, whereas the progressivecomplex includes structures with two or more verbs and a present partici-ple. The progressive simple is taught at an elementary level in Swedishschools, and contains only one verb followed by the present participle. Itcould therefore be expected to be easier to learn. The progressive complexis introduced much later in Swedish schools and since it contains two ormore verbal elements followed by a present participle, it is expected to be

147
more difficult to acquire for the students. Complex progressive forms in thedata include structures with can be, has been, have been, will be and wouldbe followed by the present participle.
In co-ordinated uses, such as in (13), every present participle wascounted as a separate instance. Instances of self-correction were excludedfrom the discussion.
(13) “they’re drinking and eating and having fun” (WW30)
Thus, in Chapter 10, the students’ use of the progressive is discussed andexamined against the test rating categories High, Average and Low. In linewith the presentation of the third person singular marker, the discussion ofthe students’ use of the progressive comprises the distribution across thethree interviewer categories and the tasks of the tests. This is followed by adiscussion of the relationship to the same two background variables as withthe third person singular marker (the students’ sex and their school gradesin English).
9.2. VocabularyThe students’ vocabulary is important for the impression of their oral profi-ciency (cf. 1.3. Linguistic Analyses of Students’ Proficiency). This was alsodiscussed by the assessors in the Gothenburg project, particularly by theNative Speakers. In the answers to the questions of the questionnaire, thethree Native Speakers gave the following answers to the question “Whataspects of language or linguistic variables were important in your assess-ment?”(Question 5 in the questionnaire, cf. Appendix 6):
“Communication is most important. Willingness to communicate. Ability to dealwith vocabulary lacunae.” (Native Speaker 1)
“Accuracy + a wide range of vocabulary, stress and intonation, an ability to conversewith another person …” (Native Speaker 2)
“I think the vocabulary aspect is the one that most of all leads me to a high mark. So,I think that first of all vocabulary and idiom would be one of my five aspects.”(Native Speaker 3).
The students’ vocabulary was also discussed by two Native Speakers whenasked what could be particularly disturbing for the assessment. (Question 6in the questionnaire, cf. Appendix 6):
“Grammatical inaccuracy, poor vocabulary. I found it difficult to assess pupils whowere short on ideas anyway.” (Native Speaker 2)
“It’s the reverse of what I’ve just been saying, the lack of range of vocabulary, themisuse of certain words like mountain when cliff was the appropriate word. Thatobviously leads to a lower mark.” (Native Speaker 3)
148
In the answers to questions 5 and 6 of the Questionnaire, two (of the three)School Teachers discussed vocabulary as a significant factor for the assess-ment. Two (of the three) University Teachers mentioned the erroneous useof words such as nature, instead of countryside, and sea instead of lake asbeing particularly disturbing. These comments made it evident that the stu-dents’ lexical errors were relevant to include in the survey of the students’vocabulary.
The students’ vocabulary is investigated regarding their use of abstractnouns, modifiers to adjective and compensatory strategies in search for aword or phrase. Furthermore, the occurrence of lexical errors concerningtwelve frequent words across the three test rating categories is described.
9.2.1. Abstract NounsThe content in the student production and their capacity for abstract think-ing may be factors that contribute to the grades assigned to the studentproduction. Students who discuss more complicated matters, who argueabstract issues and thus tend to use many abstract nouns, may be assessedmore favourably than students who refrain from doing so. The relationshipbetween grades and the frequency of the types and tokens of abstract nounsin the student production may therefore be worth investigating.
My personal experience from assessing Swedish students’ written andspoken production of English at school also seems to indicate that stu-dents who have reached an advanced level of language proficiency tend touse abstract nouns in their essays and discussions. The frequency of ab-stract nouns seems to be evidence of the students’ mastery of discussingcontroversial issues and their having attained language proficiency. Spon-taneous discussions with language teachers have given further support tothis idea.
For illustration three extracts with examples of abstract nouns collectedfrom the data are provided below.
(14) “No it’s I don’t think it’s a difference at that age it’s everyone sort like saysit’s okay and that there is no problem later on when boys tend to continue todo that and girls sort like have to they don’t get the same attention.” (M63)
(15) “Because eh when you are old you have experience you know how it’s to beto how children are maybe in the world you have friends who has children or...” (A31)
(16) “Yeah but we have done this if we hadn’t have a eh so much pollution and soon so many people wouldn’t have cancer if we weren’t smoking and it’s ourfault.” (S4)
149
Among the abstract nouns identified in the student performance, uncounta-ble nouns emerged. These nouns are extensively discussed in school gram-mars, which distinguish between countable nouns, uncountable nouns andnouns with dual class membership (Hargevik and Hargevik 1995; Ljungand Ohlander 1995; Svartvik and Sager 1995). It may be expected that theuse of uncountable nouns may cause problems for the student, in particularwhen there is a countable equivalent in the student’s first language Swedish.The distribution of standard English and non-standard English instances ofabstract uncountable nouns in the student production of the three test ratingcategories was consequently of relevance to include in the presentation.
The abstract nouns identified in the student production were thus catego-rised as countable or uncountable nouns. Nouns of dual class membershipwere included in the first category.6 In what follows, six nouns from thestudent production are given to illustrate the two categories:
Countable nouns / Nouns of dual class membership: problem, result, solutionUncountable nouns: advice, knowledge, progress.
Abstract nouns are thus included in the study for two main reasons. Firstly,their presence in the student production may indicate mature thinking andso influence the Global grades assigned positively; secondly, abstract nounsthat are uncountable may lead to the use of non-standard English forms andperhaps influence the global grades assigned.
The term “abstract nouns” includes nouns that refer to concepts that are“typically non-observable and non-measurable” (Quirk et al. 1985: 247).The nouns included in the present study are nouns used in contexts wherethey have abstract meanings according to this definition. It is of courseimpossible to give a representative list of the abstract nouns used in thestudents’ production, and so the list presented is to some extent subjective.It is worth pointing out that in the selection of the types of nouns included,the decisive factor is the context and that the students give the noun anabstract meaning. The interpretation of each single instance is thus crucial.Some types of nouns occur both with abstract and concrete meanings. Thefollowing example illustrates an abstract meaning of a noun, key, also usedwith concrete meanings:
(17) “The story ends pretty sad and that’s you can say yeah you can say it’s a keyto his book 1984.” (T5)
When the abstract noun is repeated by the student, by way of correction orclarification, the two are counted as one instance.
6 The classification was checked in Collins Cobuild English dictionary (1995) and Oxfordadvanced learner’s dictionary (1995).

150
9.2.2. Modifiers of AdjectivesModifiers of adjectives are words used in contexts such as in
(18) “It’s a very good book I think.” (T5)(19) “Men are quite scared.” (W23)
They are considered to be characteristic of the spoken language or an infor-mal style (Crystal and Davy 1969: 110–113; Leech and Svartvik 1975:100–101). In the present investigation modifiers of adjectives, for instancequite and very, stood out as a category that seemed to be used differently bythe students in their oral production. At a first survey these modifiersseemed to be very frequent in certain students’ performance. Some stu-dents’ tendency to use many instances of modifiers in their speech providedgrounds to investigate whether modifiers were only used to intensify ordowngrade adjectives or also as one of the linguistic items that studentscould use as devices that contributed to an impression of fluency and influ-ence the Global grades assigned. Therefore it seemed reasonable to investi-gate whether the frequency of modifiers of adjectives was a factor thatcould be related to the Global grades assigned to their oral production.Furthermore, previous research had shown that adverbs as modifiers, as oneitem in one subcategory of the “reinforcers of register”, were important forthe assessment of fluency (cf. 1.3. Linguistic Analyses of Students’ Profi-ciency). For these reasons, modifiers of adjectives were selected as one ofthe subcategories in the present investigation of the students’ use of vocab-ulary.
In the presentation of the results (Chapter 11), the occurrence of modifi-ers of adjectives in the students’ production is described, both in terms ofoverall frequencies and in terms of the types of modifiers used. The scopeof the discussion is limited to modifiers of adjectives. Only adverbs as pre-modifiers of adjectives were thus selected. As for modifiers of adverbs, veryfew instances emerged in the material, and they were not included in theinvestigation. Both the modifiers which were used as intensifiers, e.g. very,and as downgraders, e.g. a little were taken into consideration. When themodifier is repeated, as in (20), the modifier is counted as if used once.
(20) “really really good” (G37)
Examples (21) – (23) are given to illustrate the students’ use of modifiers inthe production. These examples are from production with high frequencies.Three illustrative extracts are given.
(21) “... when you’ve read all the book and you feel well it’s rather sad becauseyou have to leave this book and that’s a bit sad, it’s very impressive ...”(Y10)

151
(22) “I’m thinking I come to think about my grandmother she is very funny in away because when grandfather lived she was very boring and a little bit angryand I thought she didn’t like me ...” (L42)
(23) “It’s a eh every pist have a sort of colour if it’s how dangerous eh difficult itand the green it’s very difficu ... easy eh it’s eh for children and blue it’s quiteeasy and red is eh quite difficult and black is very difficult.” (W23)
9.2.3. Students’ Lexical Errors and Compensatory StrategiesIn order to be successful in their performance students obviously need tohave a certain range of English vocabulary. In this section the focus is onthe occurrence of lexical errors and the strategies the students use whenthey cannot find an English word to express a specific meaning. The ques-tions raised are whether occurrences of lexical errors and compensatorystrategies tally with the Global grades assigned and whether there are dif-ferent strategies that characterise student production related to the three testrating categories High, Average or Low. The students are not given muchtime to plan how to cope with a situation where they have trouble findingappropriate words. In this respect the students in the oral interviews of theGothenburg project are close to authentic speech situations (cf. the discus-sion of the complexity of spoken production in 2.2. Oral Proficiency).
The investigation of the students’ lexical errors includes a description ofthe inappropriate use of certain words. The selection of the words wasbased on one or more of the following three criteria. Firstly, the studentswere corrected by the interviewers when they used these words in the inter-views or the interviewers commented on the erroneous use of these words,either on the Oral Mark Sheet or in the answers to the questions of thequestionnaire.7 Secondly, the words are described as “false friends” or oc-cur in the descriptions of “important groups of synonyms” in Rende andPetti (1990). Thirdly, based on my personal experience of teaching Englishin Sweden, the words were recognised as common English words where aSwedish student often goes wrong, partly because of interference fromSwedish. The words investigated were:
(1) the erroneous use of alley instead of avenue,(2) mark instead of brand or make(3) lonely or lonesome instead of alone,(4) little or small instead of young(5) mountain instead of cliff, hill or rock, and(6) nature instead of countryside, country, landscape or scenery.
7 Cf. the extract from an oral proficiency interview which provides an illustrative example ofan interviewer who corrected a student who used mountain instead of cliff (7.1. The Materialof the Gothenburg Project).

152
Furthermore, inappropriate uses of one word in the following word pairswere identified:
(7) can or know,(8) learn or teach,(9) live or stay
(10) make or do(11) read or study, and (12) unlock or lock up.
The interviewers commented on the students’ uses of strategies in the an-swers to the questions in the questionnaires used. The question “What fiveaspects do you think are significant for the grade?” yielded comments onthe students’ strategies and ability to cope with vocabulary gaps:
“I look favourably at the student employing strategies such as asking for help. Idon’t know what that’s called but I mean this using circumlocution.” (NativeSpeaker 3 in an answer to the questionnaire).
Native Speaker 1 writes about the importance of the students’ ability to dealwith vocabulary gaps and the question “What did you notice in particularthat could lead to a low grade?” led to the following answer given by aSchool Teacher:
“Words pronounced so that they weren’t understood and literal translations fromSwedish.” (School Teacher 3 in an answer to the questionnaire).
Literal translations could be categorised as a compensatory strategy. Thecomments above by the assessors and previous research on student produc-tion (cf. 1.3. Linguistic Analyses of Students’ Proficiency) made it seemrelevant to include a survey of the students’ uses of compensatory strategiesin the present study.
The present survey of the students’ uses of compensatory strategies is inline with the approach used in the Nijmegen project, a study of strategiesemployed by Dutch students of English (Poulisse 1989: 12). The Nijmegenproject used an approach where the focus of interest was on some types ofstrategies, deliberately setting aside other types.8
In the present study, the strategies are classified on the basis of the surveyof compensatory strategies in Chapter 1 (cf. 1.3. Linguistic Analyses ofStudents’ Proficiency) Twelve types of strategies in two categories weredistinguished: Strategies involving Swedish and Strategies in English. The
8 Reduction and message adjustment strategies seemed problematic to deal with within thescope of the present study. Other methods than the ones used would have been necessary, suchas listening to recorded tests together with the students and / or interviewers immediately afterthe completion of the tests.

153
boundary between these categories is fuzzy and the types classified shouldbe seen as points along a continuum. The twelve compensatory strategiesidentified in the material were as follows:
Strategies involving Swedish
1. Request for help in Swedish2. Swedish words used3. Swedish words pronounced in English4. Swedish words explained in English5. Swedish words added6. Word coinage based on Swedish
Strategies in English
7. Request for help in English8. Waiting for assistance9. Substitution by superordinate or approximate terms
10. Word coinage based on English11. Giving two alternatives12. Paraphrase (Comparison, Description and Reformulation)
In what follows these twelve compensatory strategies are defined and illus-trated with examples from the material.
1. Request for help in SwedishThe students asked in Swedish for the translation of a word.
(24) “Lantställe, vad heter det?” (E80) (=”Summer cottage, what is it called?)
(25) “He cleans and … vad heter ‘stryka’?” (G68) (=”How do you say ‘to iron’?)
(26) “I don’t think they are medvetna … hur säger man det? (G82) (=aware of…how do you say it?)
2. Swedish words usedThe students used Swedish words and pronounced them in Swedish.
(27) “you have to be uppmärksam.” (E80) (=attentive)
(28) “leaving me in the dagis” (H38) (=day-care centre)
(29) “you always see a three on the betyg” (G82) (=school report)
3. Swedish words pronounced in EnglishThe students pronounced Swedish words in an English way, as if thesewords existed in the English language.

154
(30) “and you have a lot of good things a parabol and …” (H38) (=a satellite dish)
(31) “then he saw this affisch with that the cinema showed Al Capone (S4) (=poster)
(32) “and as you have today at the university you have tentamens I think it is (T5)(=exams)
4. Swedish words explained in EnglishThe students first talked about the concept with the help of the Swedishword and then explained the concept in English or translated it into English.It seems that the students were planning out loud and searching for theappropriate English word. In some instances, the English word is pro-nounced with a rising intonation and could be interpreted as a question (cf.the discussion of intonation in 1.3. Linguistic Analysis of Students’ Profi-ciency). In the following illustrative example, the interviewer shows hisapproval of the student’s use of herring.
(33) Interviewer: “What do you eat?”Student: “Sill. Herring.”Interviewer: “Yes, that’s herring yeah.” (F81)
5. Swedish words addedAfter the students had said the appropriate English word, they added theSwedish word. The translation may have been added because they wantedto be as precise as possible.
(34) “it’s normal for a summer house maybe I don’t know I don’t know we call ittorp” (F36) (= summer cottage)
(35) “it’s a small animal it’s a water animal iller” (B77) (=polecat)
6. Word coinage based on SwedishThe students made up English words, often by means of literally translatingSwedish expressions and words. (36) “it’s a happy field I don’t know what to say merry-go-rounds and” (ZZ29)
(=funfair)
(37) “if there isn’t a back door maybe fire door or something you can he could findand get out that way” (O90) (=emergency exit)
7. Request for help in EnglishThe students asked for help in English about the appropriate English word.In the following example, the student asked about the pronunciation of aword.
(38) “industr …. indu what do you say?” (ZZ47)

155
8. Waiting for assistanceThe students made a pause and thought about how to go on. In this pause,the interviewers started to help the students by way of suggesting words.Evidently, this strategy is largely dependent on the interaction and the inter-viewer’s initiative (cf. the discussion concerning the interviewer’s methodin 1.2. Oral Proficiency Testing).
(39) Student: “Swedish women have lower …yeah.”Interviewer: “Pay?”Student: “Yeah, pay.” (F75)
(39) Student: “She’s more …”Interviewer: “Stricter?”Student: “Yes, stricter.” (H38)
9. Substitution by superordinate or approximate termsThe students used general terms or concepts close in meaning to the onesearched for. It is obvious that the students at first seemed to search for theappropriate word but then chose to use an approximate or superordinateword. Or-tags, such as or what do you call it and or what do you say, tendedto emerge in these instances.
(41) “he takes him as his pupil or whatever you can say” (U6) (=apprentice)
(42) “we make a ring” (E80) (= a wreathe)
(43) “we eat raw fish” (S4) (= pickled herring)
10. Word coinage based on EnglishThe students invented new, and non-existent, words with the help of theirknowledge of English.
(44) “everybody says that Swedes are so equalited” (F75) (= equal)
(45) “but I think that this youthness that we have now it’s important too to I meanto pay with our feelings to find ourselves of course” (Q59) (= youth)
11. Giving two alternativesIn the answer to one of the questions in the questionnaire, one of the inter-viewers discusses the significance of the students’ feeling confident in theirchoice of words and structures. Students that give two alternatives to con-cepts they wish to describe might signal uncertainty and lack of self-confi-dence (for discussions of the significance of self-confidence and anxiety,and the language learner, see Tarone and Yule 1989: 133). The strategycalled “Giving two alternatives” is regarded as a signal of the students’

156
difficulty in defining a phenomenon precisely; the students added a secondword to be sure that the message was understood.
(46) “he discovered he can’t come out the movie or the cinema” (E80)
(47) “they went to have a picnic by the sea or by the ocean” (O61)
(48) “very near to the shop or the supermarket or whatever you call it” (D34)
12. ParaphraseThe students paraphrased in order to get round the lack of vocabulary.Three ways of paraphrasing were identified: a) comparison, b) descriptionand c) reformulation.
Comparison
The students compared characteristics similar to or different from the con-cept. In the first illustrative example, the student pointed at similarities, inthe second at differences.
(49) “it’s like a tree, and you dance around it” (K86)(= Midsummer pole)
(50) “the toilet is not an ordinary one” (D34) (= outdoor lavatory)
Description
The students gave a careful physical description with regard to size, shape,colour, material, features, function or location.
(51) “I don’t know what you call it it’s a pole with flowers and leaves and it lookslike a cross with two circles under each arm” (YY13)(= maypole)
(52) “I don’t know what they are called, cottages which are white and then theyhave tree in …” (WW46) (= Tudor style)
Reformulation
The students started off but then went on to a paraphrase and reformulatedthe utterance to avoid the lack of vocabulary.
(53) “where they have different … you know they are different people who showtheir art” (O61) (=exhibitions)
(54) “I tie a … I don’t know the word in English but I tie them together so I havea ring to put on the head” (K86) (= wreathe)

157
9.3. Discourse MarkersAs described in Chapter 1, (cf. 1.3. Linguistic Analyses of Students’ Profi-ciency), discourse markers, such as well and you know, are used in a widerange of contexts and have several discoursal functions in communication.The students’ use of discourse markers, meta-talk and the ability to fillpauses in speech with words could be expected to contribute to the impres-sion of their proficiency in spoken English and the assessment in oral tests.In the present study, the students’ use of two selected discourse markers isanalysed.
When the transcription of the student production was checked it wasevident that the two discourse markers well and you know occurred fre-quently in certain students’ production. Other discourse phenomena such asquestion-tags were very rare. This is one of the reasons why the focus is onthe students’ use of well and you know in the present study.
Another reason for the interest in the two discourse markers was that agreat variation in the frequency of well in the students’ production could beobserved. A number of students produced 20 instances, whereas other stu-dents did not use it at all. For that reason, it seemed interesting to study therelationship between the occurrences of well and the Global grades as-signed. On the basis of the theory of possible new meanings and interpreta-tions of an item used in a wide range of contexts (cf. 1.3. Linguistic Analy-ses of Students’ Proficiency) and the observed high frequencies of well incertain students’ spoken English, it was relevant to take into account whatseemed to be the discoursal functions of the students’ uses of well andcompare them with the grades assigned. Furthermore, on the basis of thefindings by Riggenbach (1991) (cf. 1.3. Linguistic Analyses of Students’Proficiency), it might be expected that well was one of the lexical fillers thatcharacterise students’ speech assigned a High Global grade.
Based on my experiences of language teaching in Swedish schools, itseems that the appropriate use of discourse markers, such as well and youknow, is a feature of the English language that was hardly ever explicitlytaught at the time of the collection of the material. The students were left topick up these features without the aid of specific instruction or teaching.9
This is nothing new and was pointed out many years ago by Catford (1959:149):
I know of no practical English grammar for foreign learners which describes the useof oh, ah or the introductory or resumptive well. And yet the occurrences of thesewords, like the occurrences of all linguistic items are not random, they are system-atic and presumably describable.
9 English grammars for advanced students at university level contain descriptions of dis-course markers, such as well and you know, see for instance Johansson and Lysvåg (1986:229).
158
One of the reasons for the non-existence of the teaching of discourse mark-ers in most classroom situations may be that it is impossible to describe, forinstance, the uses of well in traditional grammatical terms. Inadequate usesof verbs can be corrected quite easily whereas the appropriate or inappro-priate uses of well may be more difficult to pin down. Yet, as Svartvik states(1980: 169):
... an inappropriate use of particles like well may have more unfortunate conse-quences for communication success than elementary grammatical errors.
Discourse markers such as well are also very hard to translate idiomaticallyinto another language (Svartvik 1980: 169). Even though Swedish is closeto English, the exact translations of well in the instances attested in thematerial are not evident. Discourse markers are thus used for certain prag-matic or contextual reasons and possibly appropriate use of well could bean indication of the students’ ability to think in English or a sign that theyhave adopted an English style which may influence the assessment.
Discourse markers can be defined as sequentially dependent elementswhich bracket units of talk (Schiffrin 1987: 31). In the present study, theuse of two discourse markers according to this definition is discussed: welland you know.
The purpose of the present study is to give qualitative descriptions be-sides the quantitative analysis. The qualitative analysis, with the discoursalfunctions attested in the student production, can provide evidence of in-stances of well and you know that serve the functions that are described inliterature as used by native speakers. This finding would confirm the rele-vance of frequency counts of well and you know in a study of assessment oforal proficiency.
9.3.1. Well...In this study, the focus is on a specific use of well, namely its use as a discoursemarker as defined by Schiffrin (1987). Schiffrin suggests two specific con-ditions that allow expressions to be used as discourse markers. Discoursemarkers have to be syntactically detachable from the sentence, and they haveto be commonly used in initial positions of the utterance. Both these criteriaare applicable to the instances of well included in the investigation.
The first two instances from extract (55) illustrate a student’s use of wellas an initiator and as a marker of reformulation. The extract is from a dis-cussion of school uniforms in Task 3.
(55) Interviewer: Would it be better to have a uniform?Student: Well I don’t think no not in Sweden I think it’s I shouldn’t work, wellif you yeah maybe it should be better I think ... (E74)10
10 Intonation makes the second instance of well a discourse marker and not an adverb.

159
The third illustrative instance of well is a student’s use of well in a shiftfrom description to indirect speech. Example (56) is from a description oftwo boys on a beach. The student uses well to emphasise that now she turnsto a description of what the two boys are thinking.
(56) “and they got to the beach and they sat down they ate had a lot of fun andsuddenly they saw this toy airplane aeroplane on a shelf on the on a rock rockand they thought well why don’t we go and get it.” (M63)
When the students repeated well several times in the same context, theinstances were counted as one instance, as in example (57):
(57) Interviewer: Which one did you choose?Student: Well, well, well I must think a little bit.
Five categories of discoursal functions of well were used to classify theinstances. These functions were found in the material and have been de-scribed in previous studies. The five categories are
(1) well in answers to the interviewers’ questions and requests,(2) well in reported speech,(3) well in repetitions,(4) well in contexts where students express difficulties with English, and(5) well as a finishing signal.
The instances of well that could not be categorised in the discoursal func-tions 1–5 are included in a sixth category. In this last category, no evidentexplanation could be given to the students’ use of well. The reasons for theoccurrence of well may be, for instance, hesitation, use as a pause-fillingdevice or simply an effort to make the utterance “sound English”. The crite-ria for setting up discoursal functions are based on structural clues in eachinstance. The instances of the category of indeterminate uses do not showstructural similarities that are possible to categorise and these instances arelabelled
(6) well in indeterminate contexts.
The six categories are commented on and exemplified below.
(1) Well in answers to the interviewers’ questions and requestsBrown (1977: 121) classifies well as a common introductory filler when thespeakers are asked a question and they are expected to produce an immedi-ate reply. Ball (1986: 117) describes well as a universal introductory filler inanswers to almost any question; this filler is followed by a pause. Well

160
indicates that the speaker is about to produce a reply. The following twoexamples illustrate the students’ uses of well in answers to the interviewers’questions and requests:
(58) Interviewer: Would it bother you if your girlfriend was ...?Student: Well that would bother me I think because I think ... (Y25)
(59) Interviewer: Now that’s gonna cost: Would that be a benefit for the town forexample?Student: Well it’s always good to have a big stadium. You can have rockconcerts and so on there. (Z26)
(2) Well in reported speech Well is used when the speakers introduce speech with verbs such as say andthink. Well is described as a member of the group of words which occurs asthe first item in direct quotations (Schourup 1985: 22). Svartvik (1980: 175)compares quotation marks in written English with well in spoken English.They both signal the beginning of direct speech. After the verb think, wellindicates that the speaker turns to what somebody else thinks. This is oftenin the form of a question, as if the speaker were speaking to her/himself.The following two examples illustrate the second discoursal function ofwell:
(60) “and he said well I deserve to go to the cinema” (Z11)
(61) “and they thought well why don’t we go and get it” (M63)
(3) Well in repetitionsInstances of well in repetitions were identified at an early stage of the anal-ysis. It is evident that in oral production, students may change their ways ofexpressing what they wish to say and choose alternative words or struc-tures. In doing so they may repeat what they have previously said. Thestructural criteria of this function are the students’ uses of two similarwords or expressions before and after well. In example (61), the studentdecided to reformulate her description of her father and repeated he is:
(62) “but not with my father he is well maybe when it’s raining and he is outrunning he have to take his medicine but …” (B77)
(4) Well in contexts where students express difficulties with EnglishThe students also used well as a marker of hesitation and reformulation.One evident reason for their pauses in speech is that they did not know theappropriate English words. In the instances of this category, the studentsexpressed their difficulties with or their doubt about the correctness of thewords selected. They did so by adding phrases such as I don’t know what

161
it’s called or what do I say? before or after well. These phrases are thestructural criterion applied to distinguish this fourth function. In the follow-ing example, the student showed his doubt about the appropriate use of theword strength.
(63) “to have the strength well what do you say” (ZZ47)
(5) Well as a finishing signalIn its conclusive function, well indicates that the speaker is about to finish.Well is one item along with others, such as OK, so and all right, signallingthat the speaker is willing to bring the conversation to an end before thefinal “Goodbye” (Wardhaugh 1985: 158; Ball 1986: 118). In the Gothen-burg material, well precedes concluding comments or final remarks about atopic in a part of the test or in the entire test. Well indicates that the studentshave completed a task or the whole test by the use of well. Example (64) isfrom the end of Task 1 in a test.
(64) “well he falls asleep in the cinema” (YY13)
In example (65) the student concluded his description of the houses in Task1 with an utterance initiated by well:
(65) “it’s also a small small house where you can sleep so there’s enough room forfour people cause it’s quite small the house and it cost about 1600 Swedishcrowns well that’s what I can tell you” (YY48)
(6) Well in indeterminate contextsInstances that cannot be classified into the five categories above seem to beused in a number of different contexts. Among these contexts, there weretwo contexts that could be identified. They are well as a hesitation markeror as a pause-filling device, and in reformulations or shifts of speaker orien-tation. There were three reasons for including the instances in the sixthcategory. Firstly, it was not possible to identify the definite reason for thestudents’ use of well. Secondly, the borders between the discoursal func-tions of the instances attested were not clear-cut. Thirdly, there were nostructural clues that could be used in the classification of the instances.
Nevertheless, the two possible discoursal functions of well distinguishedin certain instances in this category may be discussed. Firstly, well seems tofunction as a pause-filling device when the students pause to consider howto continue a sentence. Well is then a device serving to give speakers time tothink (Schourup 1985: 79; Wardhaugh 1985: 142). According to Ward-haugh (1985: 149) pauses generally tend to get filled with items such aswell by the speaker or by other participants in conversations. Aijmer and
162
Olsson (1990: 77) discuss the use of well as a word used when the speakerhesitates or searches for a word, or when the speaker needs a kind of mentalpause signalling: “let me consider it for a while”. Example (66) illustrates astudent’s use of well when he seems to hesitate or to fill a pause.
(66) “and well we dance around this tree with lots of flowers and things like thatsing sing songs and” (O90)
Secondly, in some other instances well seems to be used as a means ofsignalling a shift in speaker orientation, for instance from a description toan evaluation. In this function well served as a means of cohesion. Schiffrin(1985: 659) calls this kind of instances “reflexive frame breaks”. Amongthe instances identified, shifts occurred, for example, when students shiftedfrom describing to evaluating or from telling a story to adding a personalopinion. The evaluation or the addition of the personal opinion was thenintroduced by well. Example (67) illustrates this use. In this example thestudent shifts from the discussion of a book title to the observation of theoccasion when she read the book.
(67) Interviewer: Strange title, isn’t it?Student: Pretty but it makes it more interesting well it was a long time ago Iread it but it’s about a murderer and (J85)
In example (68) the student shifts from his evaluation of a trip to Paris to hisaccount of it:
(68) “it was a very interesting experience because I loved the city and well welived in old Paris and at a hotel and everything was okay” (Y51)
9.3.2. You know ...The second discourse marker investigated, which is you know, is of interestbecause of factors, such as its significance for the interaction, its character-istic of giving signals of a more informal level of conversation, the de-scribed plea for co-operation adhered to it, and as has already been men-tioned, its frequency in spoken English (cf. 1.3. Linguistic Analyses of Stu-dents’ Proficiency). Furthermore, you know differs from well as regards itsfunctions. You know is used in other contexts and with different meanings.
You know was also included in the present study because of its frequentoccurrence in the material (other types of discourse markers of interest,such as you see, appeared in remarkably fewer instances).
Only the instances of you know that can be described as discourse mark-ers according to the criteria by Schiffrin (1987) presented above (cf. 9.3.1.)are included in this study. This means that only those instances of you know

163
which can be left out of the structure without changing the meaning of theutterance to any noticeable extent, are considered. The two examples (69)and (70) are given to illustrate the students’ use of you know:
(69) “so he was locked inside the cinema ... you know screaming for help” (B77)
(70) “well I drive a lot but you know I think you have to have had your drivinglicense for ...” (E80)
In the oral tests, the interviewers could be expected to take some initiativestowards less formal conversation. For that reason, the interviewers’ uses ofyou know in the interviews that also contain instances of students’ use aretaken into account. It is of interest to see whether the interviewers startedusing you know before the students did so.
Three additional aspects of you know are of interest to consider in thediscussion on the basis of results from previous studies (cf. 1.3. LinguisticAnalyses of Students’ Proficiency). Firstly, the finding that you know isused more by women than by men (Östman 1981: 72; Coates 1993: 116–118) suggests that it is relevant to include a discussion of the proportions ofthe instances in boys’ and girls’ production in the material. Secondly, thefinding that you know is particularly used in narrative parts of conversationsmakes it interesting to investigate the distribution of the instances across thethree tasks (Östman 1981:16). Thirdly, the fact that you know seems tooccur to a great extent in medial position of the utterances (Erman 1987:50) is worth taking into account in the investigation of the instances at-tested.
Three discoursal functions of you know were identified in the material.Instances that could not be classified in one of the categories describedabove were included among the indeterminate instances.
1. Expressing an opinionYou know is used together with statements of the students’ opinions andtogether with I think, I don’t think, I thought, I like and I feel like. It seemsthat the students use you know as a softening item by way of making thepoint-of-view stated in a more indirect and less controversial way. The stu-dents seem to have tried to reach mutual understanding as to their stand-point. In (71) the student argues for starting a family late in life:
(71) “because I think you must have a good job and you know you have to live alittle by your own first” (L42)
2. Word searchingOn some occasions the students search for words or use words which theydo not know whether they are appropriate or not. In quite a few instances,

164
you know is combined with phrases such as I don’t know the word or whatdo you say. In these reformulations the students seem to use you know toprovide the extra time they need or to hedge words that they suspect thatthey have used incorrectly. In this discoursal function, instances of youknow are also combined with word-coinage or Swedish words (cf. 9.2.3.Students’ Lexical Errors and Compensatory Strategies). In (72) the studentis unsure of the correct use of language course:
(72) “there is a I don’t know what the word is but you know this language courseand I was ...”(XX49)
3. RepetitionIn instances placed in this category the students seem to use you know toprovide extra time in their planning of what they were going to say. There isno topic-shift but they go on discussing the same topic. The indication ofthis continuation is the repetition of at least two words after you know. Thisis the criterion of the instances assigned this discoursal function. In (73) thestudent explains why there is no predetermined age for starting a family anduses mature enough both before and after you know.
(73) “I think you never be mature enough if you think in that way you know whenyou are thirty you probably say oh no I’m not mature enough” (R58)
4. Indeterminate instancesThis category includes instances of you know when it is not used for obvi-ous reason. The reasons could be for instance, vocabulary gaps or need forclarifications of what has been said but evidently there could be other rea-sons that made the students include you know in their speech. In the exam-ples (74) and (75), there may be several reasons for the students’ use of youknow, for instance as an indication of switching from deference to camara-derie (cf. 1.3. Linguistic Analyses of Students’ Proficiency). In (74) thestudent discusses the fact that many girls who are interested in horseschoose other hobbies when they are 17. In (75) the student describes thefact that he moved some years ago.
(74) “yes you know in the age of 17 mostly girls stop riding” (G68)
(75) “you know I moved here two years three years ago so …”(O61)

165
9.4. Aspects of Pronunciation9.4.1. Intonation
The students’ intonation is of interest in the investigation mainly for threereasons. Firstly, intonation is mentioned four times in the rating criteria forPronunciation (Factorial grade 2c) (cf. the rating criteria in Appendix 8).Secondly, the interviewers gave comments on the students’ intonation onthe Oral Mark Sheet (cf. Appendix 10) and they also commented on thestudents’ intonation or the grading of pronunciation in the answers to thequestions of the questionnaire (cf. Appendix 6). The following examplesare given to illustrate these comments on intonation and pronunciation:
“intonation somewhat monotonous” (comment on B71 by Native Speaker 1)
“pronunciation, I find it very difficult to put on an A B C D E scale and the criteriawere very difficult to apply” (comment in answers to questionnaire by NativeSpeaker 3)
Thirdly, at an early stage of the investigation of the students’ intonation, itwas evident that there were instances of unidiomatic intonation in the stu-dents’ performance. This unidiomatic intonation was identified as risingintonation in declarative sentences. Because of these reasons, it could beassumed that the students’ intonation could influence the grades assigned.
Intonation is dependent on many contextual factors (cf. 1.3. LinguisticAnalyses of Students’ Proficiency). However, at least four functions ex-pressed by intonation may be distinguished. The speaker can single out theword that carries the most important information. This can be called theinformation function of intonation. A second function is to indicate thecommunication function of the utterance, i.e. whether the speaker wantsthe utterance to be interpreted as for instance a statement, a question, or arequest. Thirdly, the grammatical function may be distinguished: intona-tion distinguishes grammatical categories such as restrictive and non-re-strictive relative clauses (Johansson and Rönnerdal 1993: 157). Finally, in-tonation can give indications of the speaker’s attitude, either towards themessage or towards the interlocutor, and this is what can be named theattitudinal function.
Because of the complexity of intonation, illustrated above, it should beemphasised that it is not within the scope of the present study to provide acomplete description of the students’ intonation in their production. Onlyresults regarding one particular aspect of intonation in a specific contextand observed in a limited number of interviews will be presented. The ten-dencies observed may nevertheless provide useful information about thediversity and the quality of the students’ intonation patterns in relation tothe assessments.

166
As with the other linguistic features discussed above, the findings asregards the students’ intonation are compared with the normative descrip-tions found in school grammars and are discussed in terms of standardEnglish and non-standard English uses. Thus no full-scale description ofthe students’ intonation is provided. Only one basic feature of English into-nation has been studied: the nuclear falling intonation in declarative sen-tences.
The method used in the present study was purely auditory. No spectro-grams or other technical devices were used. The researcher himself togetherwith two phoneticians listened to and evaluated the students’ intonation.
9.4.2. StressStress and rhythm, along with intonation discussed above, may play impor-tant roles in the assessment of Swedish students’ spoken English. Stress isdiscussed, for instance by Axelsson (1994), in a handbook of pronunciationfor teachers of English in Sweden. The prominence of stress is described as“the feature that, above all, characterizes the rhythm of English and makesit different from Swedish” (Axelsson 1994: 17). In the present study, twolimited investigations of the students’ use of stress are included: one con-cerns the students’ stress of lexical and function words in a selected sample,the other the stress pattern of the attested 69 instances of and so on in thematerial. The general principle of unstressed function words as opposed tostressed lexical words applies in both English and Swedish, but the contrastis stronger in English. In a study on a Finnish-English contrastive basis, it isargued that the most important role of stress is “to indicate the constituentstructure of the sentence by structuring the flow of speech into specificdynamic patterns” (Lehtonen et al. 1977: 68). The contrast between thestress of lexical words that convey new information and unstressed func-tional words is one means for the speaker to indicate the structure of thesentence. A study of the students’ stress of the phrase and so on is usefulbecause of the difference in stress in Swedish and English: the correspond-ing Swedish expression is stressed on the last word, whereas and so on isstressed on the middle word. This fact is pointed out by Johansson andRönnerdal (1993: 135) who describe the use of and so on in a subsectionamong other examples where a Swedish speaker often goes wrong. Thedecision to do a special study of the students’ stress in the phrase and so onwas based on the assumption that stress may be a factor influencing theassessment. Of course, the correct or incorrect use of stress in one particu-lar instance may not reflect the general level of a student’s use of stress.Therefore this investigation was complemented with a study of the stress oflexical and function words in one-minute samples of nine students.

167
9.4.3. Speech RateIn the rating criteria of the Gothenburg project, the terms fluent and fluencyemerge twice. Factorial rating 2a has the heading “Communication andFluency” and the highest grade of this Factorial rating contains the descrip-tion “Comfortable and completely fluent” (cf. Appendix 8). The two con-cepts fluent and fluency can be associated with time and it is natural to speakof the temporal element of fluency (Saleva 1997: 54).11 Furthermore, speedappears in the criteria of the grade B of Factorial rating 2a: “Extendedcontributions at natural speed and tempo”. The students’ speech rate inrelation to the Global grades assigned is therefore of interest to investigate.
The investigation of the students’ speech rate is based on the method andfindings in the study by Lennon (1990) (cf. 1.3. Linguistic Analyses ofStudents’ Proficiency). One of the three factors that Lennon found to be avariable of fluency, namely “pruned words per minute” was chosen for acloser scrutiny. The present analysis covers the first minute in Task 1. Thereare three reasons for this decision. Firstly, Task 1 was a storytelling taskcompleted with the help of a series of pictures similar to the one used inLennon’s study (cf. 7.4. Tasks). Secondly, Task 1 lasted for at least oneminute in all the oral tests, and the students were rarely interrupted by theinterviewers during this first minute. Thirdly, the students had a series ofpictures to follow, and for that reason it could be expected that the studentproduction is more comparable than when they discussed different topics,as they did in Task 2 and Task 3. In the samples, the introductory phase, i.e.before the students began to tell the story, was excluded. The narration wasoften prompted by the interviewers with phrases such as “Ok, tell me thestory” or “Please start”. Furthermore, it should be mentioned that there wasan additional reason for the decision to focus on the first minute of Task 1.It may be argued that assessors decide about the grade at a very early stageof an oral proficiency interview. For that reason, it was relevant to investi-gate the students’ speech rate in the very early stages of their production.
After this introductory survey of the linguistic features included in thepresent study, the following chapters will present the results from the inves-tigation of these features in the students’ production.
11 Fillmore (1979: 93) distinguishes four types of native speaker fluency. One of these fourtypes includes a temporal element: “the ability to fill time with talk”.

168
CHAPTER 10
Verbal Group
10.1. The Third Person Singular Marker10.1.1. Overall Distribution
The material yielded 799 instances of the third person singular markerwhen all the standard English and non-standard English uses were counted.The distribution of the instances in student production across the three testrating categories High, Average and Low, and the distribution of normalisedfigures are given in Table 10.1.
The results show, as expected, that student production assigned a Highgrade has a higher proportion of standard English instances (75% of thetotal) and that student production assigned a Low or Average grade con-tains a higher proportion of non-standard English instances (31% and43%, respectively, of the total). The normalised figures per 1,000 wordsshow that non-standard English instances occur more often in student pro-duction assigned a Low grade (4.7) than in production assigned a Highgrade (2.2) and that standard English instances are frequent in productionassigned an Average grade (8.0). Furthermore, the normalised figures
Table 10.1. Uses of the third person singular marker by test rating categories
High Average Low Total
Standard English Total instances (proportion of all) Normalised figures
215 6.7 75%
287 8.0 69%
55 6.3 57%
557 7.3 70%
Non-standard English Total instances (proportion of all) Normalised figures
72 2.2 25%
129 3.6 31%
41 4.7 43%
242 3.2 30%
Total instances of both categories 287 100% 416 100% 96 100% 799 100%Number of oral tests 32 37 13 82

169
show that the standard English instances occur as often in student produc-tion rated Low (6.3) as in student production rated High (6.7). Obviouslymany standard English instances do not change the overall impression of aperformance that contains many non-standard English instances. Regard-less of grade, student production contains both standard English and non-standard English, but a higher proportion of non-standard English in-stances emerged in student production assigned an Average and, in partic-ular, a Low grade.
10.1.2. The Occurrence of the Third Person Singular Marker in Individual Students’ Production
In a single test, non-standard English instances of the third person singularmarker may appear either together with standard English instances or to-gether with non-standard English instances of other types. This fact canpossibly explain the interviewers’ tolerance of non-standard English in-stances in the assessment. This could be the case particularly for the 72non-standard English instances in the student production assigned a Highgrade (cf. Table 10.1). The proportions of standard English and non-stand-ard English instances in individual students’ production are provided inTable 10.2. In this presentation, all production is categorised in threegroups depending on the proportions of standard English and non-standardEnglish instances found. The three categories distinguished are:
1. The majority of the instances are standard English.2. There are an equal number of standard English and non-standard Eng-
lish instances.3. The majority of the instances are non-standard English.
According to the results, the majority of the student production (54 out ofthe total 82 oral tests, 66%) contains more standard English than non-stand-ard English instances. Relatively more oral tests of individual students’production assigned a Low grade contain a majority of non-standard Eng-
Table 10.2. Proportions of the third person singular marker in individualstudents’ production
High Average Low Total
1. Majority standard English 22 (68%) 25 (67%) 7 (54%) 54 (66%)2. An equal number 5 (16%) 4 (11%) 2 (16%) 11 (13%)3. Majority non-standard English 5 (16%) 8 (22%) 4 (30%) 17 (21%)
Total oral tests 32 (100%) 37 (100%) 13 (100%) 82 (100%)

170
lish instances (30%) than do oral tests of individual students’ productionassigned a High grade (16%). As could be supposed, the figures give evi-dence that most individual students’ production contains a majority ofstandard English instances, and moreover, that a higher proportion of indi-vidual students’ production assigned an Average (22%) or Low (30%)grade than production assigned a High grade (16%) contains a majority ofnon-standard English instances.
10.1.3. Linguistic FactorsTypes of Non-standard English Instances of the Third Person
Singular Marker
The non-standard English instances of the third person singular marker areof three types (see 9.1.1. The Third Person Singular Marker). It is of inter-est to see how the instances of the three types are distributed across thethree test rating categories High, Average and Low.
Type 1 (*he take) is generally the most common type of the three non-standard English types in the material. Moreover, Type 1 is by far the mostcommon type for the student production assigned a Low grade (80% asopposed to 49% and 48%) whereas production of other test rating catego-ries tends to have instances of Type 2 or 3, too. Type 2 is almost as frequentas Type 1 in student production assigned a High or Average grade.
The Type of the Subject
The type of subject used in the non-standard English instances of the thirdperson singular marker might account for the distribution across the testrating categories. In Table 10.4., the 242 non-standard English instances arecategorised in four categories depending on the type of the subject: pro-noun, noun, co-ordinated use and others (the last category includes omis-sions of subjects and instances in relative clauses). The following examplesof non-standard English Type 1 are given to illustrate the four categories:
Table 10.3. Proportions of non-standard English types of the third personsingular marker by test rating categories
High Average Low Total
Type 1 (*he take) 35 (49%) 62 (48%) 33 (80%) 130 (54%)Type 2 (*they takes) 28 (38%) 53 (41%) 4 (10%) 85 (35%)Type 3 (other types) 9 (13%) 14 (11%) 4 (10%) 27 (11%)Total instances 72 (100%) 129 (100%) 41 (100%) 242 (100%)
Total oral tests 32 37 13 82

171
a) personal pronoun: *he playc) noun: *the boy playe) co-ordinated use: *the boy smiles and playg) others: *the boy who play
The most common type of subject with the categories of the non-standardEnglish instances is a pronoun. This is probably the case for standard Eng-lish uses too. In Type 2, differences between types of subjects were lessmarked than in Type 1. The types of subject with non-standard Englishinstances and the three test rating categories show no clear correlation.Thus no great differences are found in the proportions of the types of sub-ject across the three test rating categories.
Verbs Ending in Sibilants
As is shown in Table 10.3., the omission of the third person singular markeris the most common non-standard English type. Next, the verbs used in theinstances of omission of the third person singular marker are examined, tosee whether the final phonemes of these verbs may, at least partly, account
Table 10.4. Proportions of types of subject in non-standard English in-stances of the third person singular marker by test rating categories
High Average Low Total
Type 1 (*he / the boy go)a. personal pronoun 27 77% 38 60% 24 75% 89 68%b. noun 2 6% 12 19% 2 6% 16 12%c. co-ordinated use 5 14% 9 14% 6 19% 20 15%d. others 1 3% 4 6% 0 0 5 5%
Total 35 100% 63 100% 32 100% 130 100%
Type 2 (*they / the boys goes)a. personal pronoun 14 50% 17 33% 2 33 39%b. noun 8 29% 13 25% 0 21 25%c. co-ordinated use 1 4 1 6 d. others 5 18% 18 35% 2 25 29%
Total 28 100% 52 100% 5 100% 85 100% Type 3 (other uses)a. personal pronoun 9 100% 12 86% 4 100% 25 93%b. noun 1 1d. others 1 1
Total 9 100% 14 100% 4 100% 27 100%
Total instances 72 129 41 242

172
for the occurrence of non-standard English instances. The verbs ending invoiced or voiceless sibilants require the ending [iz] and it is probable thatstudents need to make an extra effort in adding this ending. The sibilants ofthese verbs might have a knock-out effect on the use of the third personsingular marker by some students, who would adopt the principle of eco-nomical language, production with the least possible effort (cf. 1.3. Lin-guistic Analyses of Students’ Proficiency).
The material yielded 17 instances with 13 types of verbs ending in sibi-lants: catch, change, close, dance, finish, fix, manage, notice, pass, reach,realise, use and wish.
The figures are definitely very low but nevertheless interesting. The pro-portion of non-standard English instances of verbs ending in sibilants ishigher (53%) than the proportion of non-standard English instances of allthe verbs in the material (30%, cf. Table 10.1.). The standard English andnon-standard English instances appear particularly in student productionassigned an Average grade. No clear tendency can be observed across thethree test rating categories.
10.1.4. Occurrences of the Third Person Singular Marker in Relation to Interviewer Categories, Tasks and
Background VariablesIn this subsection, the role possibly played by the background of the inter-viewers is first discussed. Then the distribution of the instances in relationto the tasks of the students’ production is elaborated on, and finally thefocus is on two background variables: sex and the students’ school grades.
The proportions and normalised figures of the third person singularmarker in comparison with test rating categories and by interviewer catego-ries can be seen in Table 10.6.
High frequencies of the third person singular marker are found in studentproduction assessed by School Teachers (160, 255 and 61). This finding is
Table 10.5. Instances of the third person singular marker ending in sibi-lants by test rating categories
High Average Low Total
Standard English instances 2 5 1 8 (47%)Non-standard English instances 1 6 2 9 (53%)
Total 3 11 3 17 (100%)

173
further discussed below. Moreover, there is a higher proportion of standardEnglish than non-standard English instances in all student production irre-spective of interviewer category or test rating category. One interesting dif-ference should be pointed out, however. For two interviewer categories,School Teachers and University Teachers, the normalised figures show thatthe frequency of non-standard English instances is higher in student pro-duction assigned an Average or Low grade (ST: 4.9 and 6.4; UT: 2.3 and3.3) when compared with student production assigned a High grade (ST:2.5; UT: 1.3). No similar tendency is found in student production with Na-tive Speakers.
As mentioned above, there are more instances of the third person singu-lar marker in student production with School Teachers than in productionwith the other two interviewer categories. The topics of the tasks may, atleast partly, account for the differences in the recorded frequencies. Thetopic of Task 1 in the interviews with School Teachers was a storytellingtask about a single person whereas the topics of Task 1 in the other inter-views were about two houses and about two boys (cf. Appendices 4A, 4Band 4C). The distribution of the 799 instances in the three tasks of thestudent production can be seen in Table 10.7.
The third person singular marker was more common in student produc-tion assessed by School Teachers, and Task 1 in this production contains alarge proportion of these instances. The topic, to tell the story about MrBrown, seems to account for the differences in frequencies. The topic ofTask 1 with School Teachers provided a context for the students to use the
Table 10.6. The third person singular marker by interviewer categories
(ST = School Teachers; UT = University Teachers; NS = Native Speakers)
ST UT NS
High Av Low High Av Low High Av Low
Standard EnglishTotal instances 133 195 34 27 23 11 55 69 10Normalised figures 12.5 16.0 8.0 2.4 3.1 4.1 5.3 4.3 5.4
Non-standard EnglishTotal instances 27 60 27 14 17 9 31 52 5Normalised figures 2.5 4.9 6.4 1.3 2.3 3.3 3.0 3.2 2.7
Both categoriesTotal instances 160 255 61 41 40 20 86 121 15Normalised figures 15.1 20.6 14.4 3.7 5.4 7.4 8.3 7.5 8.1
Number of oral tests 10 13 6 12 8 4 10 16 3

174
types of third person singular marker described above more often than thetopics of Task 1 in the tests with the other two interviewer categories.
Two background variables are readily accessible, namely the students’sex and their grades in English in school. The investigation showed thatthere is no relation between the students’ sex and the use of the third personsingular marker: the distribution of standard English and non-standard Eng-lish instances in the 12 boys’ production and in the 17 girls’ productionshows no major differences.
The distribution of the standard English and non-standard English in-stances in comparison with the students’ grades in school is presented inTable 10.8. (grades 1 to 5, 5 being the top grade). The low number ofstudents with the grade 2 should be taken into account when the results areinterpreted.
Production by students who had high grades in English in school con-tains a high proportion of standard English instances. Not surprisingly, thehigher the student’s grade is, the higher is the proportion of standard Eng-lish instances in the production.
Table 10.7. The third person singular marker versus the tasks of the tests
(ST = School Teachers; UT = University Teachers; NS = Native Speakers)
ST UT NS Total
Task 1 (to entertain) 333 (70%) 42 (42%) 93 (42%) 468 (59%)Task 2 (to inform) 105 36 60 201Task 3 (to argue a case) 38 23 69 130
Total instances 476 (100%) 101 (100%) 222 (100%) 799 (100%)Number of oral tests 29 24 29 82
Table 10.8. The third person singular marker in comparison with schoolgrades in English
Grade 5 4 3 2 Total
Standard English instances 83 (86%) 158 (74%) 265 (67%) 51 (54%) 557 (70%)
Non-standard English instances 16 (14%) 55 (26%) 128 (33%) 43 (46%) 242 (30%)
Total 99 (100%) 213 (100%) 393 (100%) 94 (100%) 799 (100%)Total number of students 4 8 14 3 29

175
10.1.5. SummaryIn this survey of the students’ use of the third person singular marker, theresults indicated that student production assigned a High grade contained ahigher proportion of standard English instances than student productionassigned an Average and, in particular, a Low grade. Student productionassigned a High grade also contained a number of non-standard Englishinstances but a tendency was observed that these instances were often ac-companied by more standard English instances in the same production. Themost common non-standard type was Type 1 (*he take). Student productionrated Low contained a much higher proportion of this non-standard Englishtype than other student production did. No other remarkable differenceswere found.
When the students omitted the third person singular marker, the mostcommon type of subject was a pronoun. Instances with a non-standard Eng-lish addition of the third person singular marker did not show this tendency.No noteworthy differences were found in the types of subject used in thenon-standard English instances of student production or in the distributionof the non-standard English instances of the sibilant-final verbs across thethree test rating categories High, Average or Low.
The instances of the third person singular marker were more common ininterviews completed together with School Teachers as interviewers. Thetopic of Task 1 seemed to account, at least partly, for this difference infrequency.
An interesting tendency could be observed in the proportions of standardEnglish and non-standard English instances in student production assigneddifferent grades by the three interviewer categories. In student productionassessed by Native Speakers, there was no noteworthy proportional differ-ence between the student production assigned High, Average and Lowgrades. In the student production assessed by School Teachers and Univer-sity Teachers, there was a higher proportion of non-standard English in-stances in production assigned an Average or Low grade.
As to the background variables, the proportion of standard English andnon-standard English instances tallied with the students’ grades in Englishin school.
10.2. The Progressive10.2.1. Overall Distribution
The material yielded 228 instances of the progressive, and they are evenlyspread across the students’ production of the three test rating categories

176
High, Average and Low. The distribution of the 228 instances, the totals (n),means (m), standard deviations (s), correlation (r) and the normalised fig-ures per 1,000 words are provided in Table 10.9. The results show that 106instances of the progressive appear in the 32 oral tests assigned a Highgrade, 96 instances in the 37 oral tests assigned an Average grade and 26instances in the 13 oral tests assigned a Low grade.
The progressive is slightly more frequent in student production assigneda High grade than in other student production. All the nine oral tests thatcontain more than five instances of the progressive were assigned a High orAverage grade. Only one oral test rated High (out of the total of 32) doesnot contain any instances of the progressive. The normalised figures per1,000 words indicate no great differences between student production ratedHigh and production rated Low. The correlation is 0.20.
Table 10.9. includes all instances of the progressive in the material. It canbe assumed that there are differences of type in the total frequencies pre-sented above; these are described below.
Table 10.9. The progressive by test rating categories
Number of tests per test rating category Grade meansInstances of theprogressive High Average Low n m s
0 1 11 4 16 2.8 0.5 1 6 10 1 17 3.4 0.8 2 8 3 4 15 3.2 0.3 3 6 2 0 8 3.9 1.3 4 2 3 3 8 2.9 1.9 5 4 1 1 6 3.5 0.8 6 2 2 0 4 3.5 0.6 7 1 0 0 1 4.0 0 8 1 3 0 4 3.3 0.5 9 0 0 0 0 0 010 or more 1 2 0 3 3.7 1.2
n (oral tests) 32 37 13 82 r (correlation between Global grades and occurrences of the progressive) = 0.20
n (instances) 106 96 26 228m (instances) 3.3 2.6 2.0 2.8s (instances) 2.4 3.2 1.8 2.7normalised figuresa
a For a description of the calculation of the normalised figures, see 6.4. Issues to Take intoAccount: The Amount of Student Speech, the Length of the Oral Tests and the CorrelationCoefficients.
3.3 2.7 3.0 2.9

177
10.2.2. Linguistic FactorsThe Progressive Simple and the Progressive Complex
The material (228 instances) yielded 199 instances of the progressive sim-ple, and 29 instances of the progressive complex. Expectedly, the former isthus a much more frequent construction than the latter. The distributionover test rating categories is shown in Table 10.10.
The complex forms were rare in the material irrespective of test ratingcategory. There is thus nothing remarkable in the distribution of the twoforms in student production of the three test rating categories.
Standard English and Non-standard English Instances
The proportions of the standard English and non-standard English instancesacross the three test rating categories High, Average and Low are presentedin Table 10.11.
No great differences are found in the way the standard English and thenon-standard English instances are distributed, but the slight tendency forstudent production assigned a High grade to contain a higher proportion ofstandard English instances than does student production rated Average orLow can be distinguished.
In what follows, the types of standard English and non-standard Englishinstances are discussed.
Types of Standard English and Non-standard English Instances
Task 1 was a narrative accomplished with the help of a series of pictureswhich could elicit the use of the progressive (cf. Table 10.16.) In whatfollows, the proportions of standard English instances that are clearly re-lated to the topics of Task 1 in the student production are discussed. The
Table 10.10. The progressive simple and the progressive complex by testrating categories
High Average Low Total
The progressive simpleTotal instances 94 89% 82 85% 23 88% 199 87%Normalised figures 2.9 2.2 2.6 2.6
The progressive complexTotal instances 12 11% 14 15% 3 12% 29 13%Normalised figures 0.4 0.4 0.3 0.4
Total instances 106 100% 96 100% 26 100% 228 100%Total oral tests 32 37 13 82

178
progressive in these instances is used to describe an action in progress insome pictures. The distribution of these instances (describing an action inprogress in the pictures provided in Task 1) is compared with the distribu-tion of other uses of the progressive in the test, i.e. the progressive is used inother contexts than to describe the pictures of Task 1. The three test ratingcategories are taken into account. It is of interest to see whether a highproportion of the standard English instances of a test rating category ap-pears in other contexts than action in progress.
The results show that in almost half of the standard English instances(41%) the students used the progressive to describe an action in progressfound in the pictures of Task 1. The proportions are similar irrespective oftest rating category.
The 22 non-standard English instances attested, classified here accordingto semantic criteria, i.e. uses in inappropriate contexts will now be scruti-nized. The instances that are non-standard English owing to the semanticcontext were identified to be of three types (cf. 9.1.2. The Progressive).
Most of the non-standard English instances belong to the two categorieslabelled Habit and Objective circumstances. The raw figures are admittedlyvery low but nevertheless interesting. A slight tendency can be observedthat student production assigned a High grade contains non-standard Eng-lish instances which refer to objective circumstances and facts. Students inproduction assigned an Average grade, on the other hand, used the progres-sive in an inappropriate way when they discussed their habits and actionswhich were completed.
Table 10.11. Standard English and non-standard instances of the progres-sive by test rating categories
High Average Low Total
Standard English 99 (93%) 84 (87%) 23 (88%) 206 (90%)Non-standard English 7 (7%) 12 (13%) 3 (12%) 22 (10%)
Total instances 106 (100%) 96 (100%) 26 (100%) 228 (100%)
Table 10.12. Types of standard English instances of the progressive by testrating categories
High Average Low Total
1. Action in progress 40 (40%) 35 (42%) 10 (43%) 85 (41%)2. Other uses 59 (60%) 49 (58%) 13 (57%) 121 (59%)
Total instances 99 (100%) 84 (100%) 23 (100%) 206 (100%)

179
As seen in the description above, the students use the progressive inseveral contexts which can be described as non-standard use. They proba-bly also use the simple form in instances where the progressive would havebeen the appropriate form to use. These non-standard English instances,however, are not included in the present survey.
10.2.3. The Occurrence of the Progressive in Individual Students’ Production
The proportions of standard English and non-standard English instances inindividual students’ production could be one of the factors that influencesthe assessment. It is thus of interest to discuss the proportions of the twocategories in individual students’ production across the three test ratingcategories High, Average and Low.
Most non-standard English instances (a total of 82%; 41% and 41%, seeTable 10.14.) appear in student production that contains either only stand-ard English instances or both standard English and non-standard Englishinstances. The distribution across the test rating categories shows a slighttendency for instances in production rated Average to occur together withboth standard English and other non-standard English instances. The fig-
Table 10.13. Non-standard English instances of the progressive by test rat-ing categories
High Average Low Total
1. Habit 2 29% 9 75% 1 12 55% 2. Objective circumstances 4 57% 2 17% 2 8 36% 3. Stative verbs 1 14% 1 8% 2 9%
Total of non-standard English instances 7 100% 12 100% 3 100% 22 100%
Table 10.14. Non-standard English instances of the progressive by test rat-ing categories
High Average Low Total
Together with only standard English 4 2 3 9 41%Together with other non-standard English 2 2 9%Together with both categories 9 9 41%The only instance in the student’s production 1 1 2 9%
Total 7 12 3 22 100%

180
ures are very low throughout but they can possibly account for the toleranceof non-standard English instances in student production assigned a Highgrade in comparison with production assigned an Average grade.
10.2.4. Occurrences of the Progressive in Relation to Interviewer Categories, Tasks and Background Variables
In this subsection, the focus is on the occurrence of the standard Englishand non-standard English instances of the progressive in relation to inter-viewer categories, the three tasks and two background variables, namelysex and the students’ grades in English in school. The distribution of theinstances in relation to interviewer categories shows whether student pro-duction assessed by one category of interviewers in a particular test ratingcategory contains higher frequencies in general or a higher proportion ofstandard English or non-standard English instances than does the produc-tion assessed by other categories of interviewers in the same test ratingcategory, or whether the instances are evenly distributed. The frequenciesare listed for each test rating category (see Table 10.15.).
The normalised figures show the there are more standard English thannon-standard English instances in all student production irrespective of in-terviewer category and test rating category. Furthermore, three tendenciescan be noticed.
Firstly, when the normalised figures are compared within each inter-viewer category, student production assigned a High grade practically al-
Table 10.15. The progressive by interviewer categories
(ST = School Teachers; UT = University Teachers; NS = Native Speakers)
ST UT NS
High Av Low High Av Low High Av Low
Standard EnglishTotal instances 36 27 14 23 8 3 40 49 6Normalised figures 3.4 2.2 3.3 2.1 1.1 1.1 3.9 3.0 3.2
Non-standard EnglishTotal instances 2 0 1 5 0 0 0 12 2Normalised figures 0.2 0 0.2 0.5 0 0 0 0.7 1.1
Both categoriesTotal instances 38 27 15 28 8 3 40 61 8Normalised figures 3.6 2.2 3.5 2.4 1.1 1.1 3.9 3.7 4.3Number of oral tests 10 13 6 12 8 4 10 16 3

181
ways contains more standard English instances than other student produc-tion rated Average or Low by this interviewer category (ST: 3.4, 2.2 and3.3; UT: 2.1, 1.1 and 1.1; NS: 3.9, 3.0 and 3.2). Secondly, student produc-tion rated High by Native Speakers contains no non-standard English in-stances, as opposed to production rated High by School Teachers (0.2) orUniversity Teachers (0.5). All the non-standard English instances in pro-duction rated by Native Speakers were thus found in student productionassigned an Average and Low grade (0.7, 1.1). Thirdly, generally the stu-dents seem to use the progressive more often in their production assessedby Native Speakers than in other production. The explanation may lie in thetopics of the tasks that were different (though the tasks in the tests wereidentical).
The topics of Task 1 (to entertain) in the student production rated bySchool Teachers and Native Speakers were storytelling tasks. The studentswere to tell a story with the help of a series of pictures. Task 1 in the testsassessed by University Teachers was a description with no course of events(cf. 7.4. Tasks and Appendices 4A, 4B and 4C).
Most of the instances of the progressive in the student production as-sessed by School Teachers and Native Speakers are found in Task 1 (47%and 38%; see Table 10.16.). The topics of Task 1 with these two interviewercategories provided a context for the use of the progressive. This fact can, atleast partly, account for the higher frequencies of instances in productionwith two of the interviewer categories, namely those whose topics naturallyelicited the progressive.
The relationship to two background variables was also investigated: thestudents’ sex and their grades in English in school. No strong tendencieswere found in the distribution of the standard English and non-standardEnglish instances and the students’ sex.
The distribution of the instances with respect to the students’ schoolgrades in English is shown below. Table 10.17. provides the proportions of
Table 10.16. The progressive by the tasks of the tests
(ST = School Teachers; UT = University Teachers; NS = Native Speakers)
ST UT NS Total
Task 1 (to entertain) 38 47% 11 28% 41 38% 90 40%Task 2 (to inform) 23 28% 21 53% 35 33% 79 35%Task 3 (to argue a case) 20 25% 8 19% 31 29% 59 25%
Total 81 100% 40 100% 107 100% 228 100%Number of oral tests 29 24 29 82
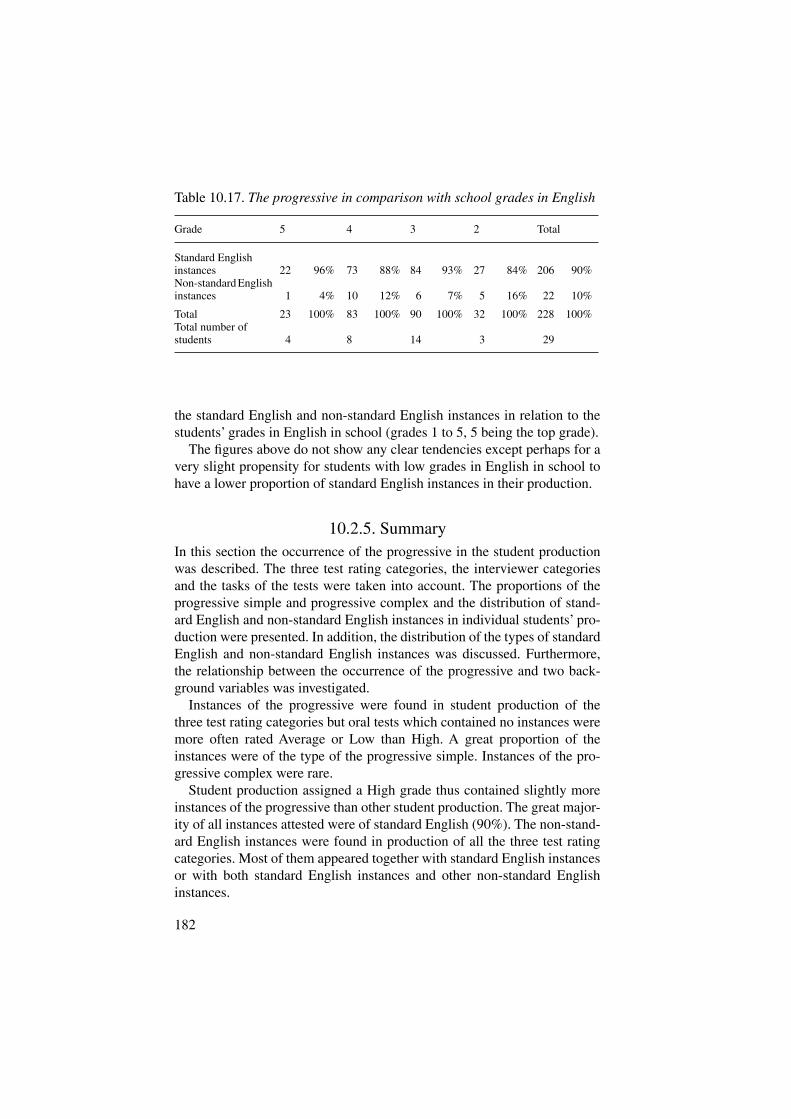
182
the standard English and non-standard English instances in relation to thestudents’ grades in English in school (grades 1 to 5, 5 being the top grade).
The figures above do not show any clear tendencies except perhaps for avery slight propensity for students with low grades in English in school tohave a lower proportion of standard English instances in their production.
10.2.5. SummaryIn this section the occurrence of the progressive in the student productionwas described. The three test rating categories, the interviewer categoriesand the tasks of the tests were taken into account. The proportions of theprogressive simple and progressive complex and the distribution of stand-ard English and non-standard English instances in individual students’ pro-duction were presented. In addition, the distribution of the types of standardEnglish and non-standard English instances was discussed. Furthermore,the relationship between the occurrence of the progressive and two back-ground variables was investigated.
Instances of the progressive were found in student production of thethree test rating categories but oral tests which contained no instances weremore often rated Average or Low than High. A great proportion of theinstances were of the type of the progressive simple. Instances of the pro-gressive complex were rare.
Student production assigned a High grade thus contained slightly moreinstances of the progressive than other student production. The great major-ity of all instances attested were of standard English (90%). The non-stand-ard English instances were found in production of all the three test ratingcategories. Most of them appeared together with standard English instancesor with both standard English instances and other non-standard Englishinstances.
Table 10.17. The progressive in comparison with school grades in English
Grade 5 4 3 2 Total
Standard English instances 22 96% 73 88% 84 93% 27 84% 206 90%Non-standard English instances 1 4% 10 12% 6 7% 5 16% 22 10%
Total 23 100% 83 100% 90 100% 32 100% 228 100%Total number of students 4
8 14 3 29
183
The grades assigned by the three interviewer categories did not accountfor any differences in the proportions of standard English and non-standardEnglish instances. However, for the Native Speakers, student productionrated High contained no non-standard instances, whilst production ratedAverage and Low by them did so. The progressive was also more frequentin student production assessed by Native Speakers, and by School Teach-ers. This difference in frequency may, at least partly, be explained by thetopics in Task 1.
The students’ standard English and non-standard English use of the pro-gressive did not tally with the students’ grades in English in school or withthe students’ sex.

184
CHAPTER 11
Vocabulary
11.1. Abstract Nouns11.1.1. Overall Distribution
The material yielded 579 tokens of abstract nouns. Of these, 278 instancesoccur in the 32 oral tests assigned a High grade, 271 in the 37 oral testsassigned an Average grade and 30 instances in the 13 oral tests assigned aLow grade. The overall distribution, normalised figures, means (m), stand-ard deviations (s) and the correlation (r) are provided in Table 11.1.
The results show that abstract nouns occur in 75 out of the total of 82 oraltests. Student production with no instances was assigned different grades.
Table 11.1. Abstract nouns (tokens) by test rating categories
Number of tests per test rating category Grade meansInstances of abstract nouns High Average Low n m s
0 3 2 2 7 3.1 0.9 1–3 10 12 6 28 3.1 0.9 4–6 5 8 5 18 3.1 0.9 7–9 1 4 0 5 3.2 0.410–12 2 3 0 5 3.6 0.913–15 4 1 0 5 4.2 0.816–18 4 5 0 9 3.4 0.519–21 1 0 0 1 4.0 022–24 1 1 0 2 3.5 0.725–27 0 1 0 1 3.0 028 and more 1 0 0 1 4.0 0
n (oral tests) 32 37 13 82 r (correlation between Global grades and occurrences of abstract nouns) = 0.26*
n (instances) 278 271 30 579m (instances) 8.7 7.3 2.3 7.1s (instances) 9.0 6.5 1.9 7.4Normalised figures of instances 8.7 7.5 3.4 7.5

185
Most student performance contains between one and six abstract nouns. Alloral tests with more than six instances were rated High or Average. Thenormalised figures reveal that student production rated High or Averagetends to contain more abstract nouns than student production rated Low andthe correlation is 0.26.
The distribution of the types, as opposed to tokens, of abstract noun inthe student production of the three test rating categories is presented below.The distribution, normalised figures, means, standard deviations and thecorrelation are given in Table 11.2. above.
Table 11.2. shows that many oral tests (38 tests out of the total 82, 46%)contain between one and three types of abstract nouns. Fourteen (44%) oraltests assigned a High grade and 15 (40%) oral tests assigned an Averagegrade contain more than four types of abstract nouns. All the tests assigneda Low grade contain fewer than five types. The results obtained show adifference between student production assigned a High or Average grade onthe one hand, and student production assigned a Low grade on the otherhand. In the former test rating categories there are more types of abstractnouns than in the latter category. The results are in line with the tendenciesobserved in Table 11.1.
Table 11.2. Abstract nouns (types) by test rating categories
Instances of Number of tests per test rating category Grade meanstypes of abstractnouns High Average Low n m s
0 3 2 2 7 3.1 0.9 1 5 6 5 16 2.9 0.9 2 6 4 2 12 2.8 1.5 3 2 6 2 10 3.0 0.7 4 2 4 2 8 3.1 1.0 5 0 3 0 3 3.0 0 6 2 1 0 3 4.0 1.0 7 1 1 0 2 3.5 0.7 8 2 2 0 4 3.5 0.6 9 1 0 0 1 4.0 010 and more 8 8 0 16 3.6 0.6
n (oral tests) 32 37 13 82 r (correlation between Global grades and occurrences of types of abstract nouns) = 0.24*
n (instances) 173 189 23 385m (types) 5.4 5.1 1.8 4.7s (types) 4.8 4.4 1.4 4.4Normalised figures of types 5.4 5.3 2.6 5.0

186
11.1.2. Linguistic FactorsCountable and Uncountable Abstract Nouns
In this section, the interest is on the quality of the abstract nouns in terms ofcountable (or count) and uncountable (or non-count) nouns. In the material,119 types of abstract nouns appeared, and they were categorised as counta-ble or uncountable nouns (cf. 9.2.1. Abstract Nouns). The proportions ofthe instances in the two categories in the production of the three test ratingcategories are presented in Table 11.3.
Table 11.3. shows that a great majority of the instances are countablenouns irrespective of test rating category.
Standard English and Non-standard English Instances
The students may have difficulties with the standard English use of theuncountable nouns (cf. 9.2.1. Abstract Nouns). For that reason, the distribu-tion of the standard English and non-standard English instances of uncount-able nouns is described.
The 45 instances of uncountable abstract nouns were classified as eitherstandard English or non-standard English. The classification was based onthe descriptions of common uncountable nouns in school grammars (cf.6.4. Defining Standard English and Non-standard English Instances). Thestandard English uses from the student production are given in (76) – (77).
(76) “if you gain more confidence from being who you are ...”(YY28)
(77) “I don’t think I would have enough courage” (WW46)
Examples of non-standard English uses comprise instances when uncount-able nouns are used as countable nouns, as in (78) – (79).
(78) “you can’t test a knowledge and you can’t describe a knowledge in marksbecause ...” (D79)
(79) “it has made a big progress” (M63)
Table 11.3. Countable and uncountable abstract nouns by test rating cate-gories
High Average Low Total
Countable nouns / Nouns of dual class membership 256 92% 250 92% 28 93% 534 92%Uncountable nouns 22 8% 21 8% 2 7% 45 8%
Total 278 100% 271 100% 30 100% 579 100%

187
These instances of non-standard English use above show the type foundin the majority of the non-standard English instances. In these instances,students’ difficulties lie in their use of uncountable nouns as countable nouns.
Table 11.4. shows the proportions of standard English and non-standardEnglish uses of uncountable nouns in student production of the three testrating categories. The raw figures are extraordinarily low (two instances)for student production rated Low. Since students assigned a Low gradegenerally used so few instances of abstract nouns, the interest is focused inparticular on the instances in production rated High as opposed to those inproduction rated Average.
The majority of the instances were used according to the descriptions inschool grammars. The proportion of standard English instances is higher inproduction rated Average than in production rated High.
Types of Abstract Nouns
As described above, 119 types of abstract noun appeared in the material.Different abstract nouns may characterise student production rated High,Average or Low. Certain types of abstract noun attested may be classified asbelonging to two categories. These two categories are abstract nouns whichwere given in the title of the tasks, and abstract nouns with Swedish equiv-alents such as problem (the same word appears in Swedish). As English isclose to Swedish, it may be expected that students who were assigned aLow grade were reluctant to leave Swedish and rather used English wordswhich have similar equivalents in Swedish. Consequently, student produc-tion rated High would then contain more, as it were, less common abstractnouns and abstract nouns which are entirely different from Swedish. It maythus be expected that there are higher frequencies of these two categories ofabstract nouns in student production rated Average or Low than in produc-tion rated High.
In Table 11.5. the distribution of the 119 types of abstract noun in studentproduction of the three test rating categories is presented. The number oftokens for each type attested is also provided.
Table 11.4. Standard English and non-standard English uses of uncounta-ble abstract nouns by test rating categories
High Average Low Total
Standard English uses 13 (59%) 16 (76%) 2 31 (69%)Non-standard English uses 9 (41%) 5 (24%) 0 14 (31%)
Total 22 (100%) 21 (100%) 2 45 (100%)

188
Table 11.5. The distribution of 119 types of abstract nouns by test ratingcategories
High Average Low Total
ability 8 1 9advantage 1 1adventure 5 2 7advice 1 1alternative 4 4anger 1 1appreciation 1 1atmosphere 1 6 7attention 1 1attraction 2 2background 1 1beginning 8 1 9calmness 1 1 2capacity 1 1 2career 1 2 3cause 1 1celebration 7 5 12childhood 2 2choice 2 2circumstance 1 1comfort 1 1competition 1 1confidence 1 1connection 2 2contact 1 1control 1 1courage 2 2culture 5 5decision 1 1 2democracy 2 2difference 10 4 1 15difficulty 1 2 3direction 3 3disadvantage 3 3disappointment 1 1disaster 1 1education 1 1effect 1 1end 4 1 5equality 5 9 14excitement 1 1experience 14 10 24explanation 1 1fantasy 1 1fault 3 3feeling 5 4 9freedom 1 1future 1 1glamour 1 1happening 1 1

189
High Average Low Total
history 2 2hobby 4 18 4 22honour 1 1hope 1 1idea 5 5 10identity 1 1impression 1 1influence 1 1interest 4 1 5key 2 2knowledge 2 7 9life 8 9 17love 1 1 2maturity 1 1meaning 1 1meeting 1 2 3mind 1 1mistake 1 1moment 1 1mythology 3 3 6occasion 1 1opinion 1 1 2opportunity 2 4 6opposite 2 2option 1 1part 2 4 6patience 1 1peacefulness 1 1personality 1 2 3pleasure 1 1point 1 1possibility 8 8position 1 1 2power 1 1prejudice 1 1pressure 1 1problem 25 21 1 47profit 1 1progress 5 1 6reality 1 2 3reason 2 1 3relation 1 1relationship 2 1 3resistance 1 1respect 1 1responsibility 11 6 17result 1 1 2revenge 2 2right 4 4risk 6 1 7sake 1 1 2school 5 6 11similarity 1 1

190
High Average Low Total
situation 6 2 8solution 9 9 2 20strength 1 1subject 2 2support 2 2suggestion 1 1symbol 1 1system 1 3 4thought 1 1time 12 18 5 35topic 3 1 4tradition 2 4 6trouble 3 1 4truth 1 1urge 1 1way 38 29 2 69
Total 278 271 30 579
Table 11.5. reveals that the majority of the types (73 of the 119 typesattested) occur once or twice in the material. The absolutely most frequenttype is way (69 tokens) followed by problem (47 tokens). Other types withmore than ten tokens are celebration, difference, equality, experience,hobby, idea, life, responsibility, school, solution and time. Most of the to-kens of difference, experience and responsibility occur in student produc-tion rated High. Ability, celebration, equality, hobby, life, meeting andprogress were given in the instructions of the tasks and this fact can explaintheir high frequencies. Thirty-one tokens of these seven types appear instudent production rated High, 47 tokens in student production rated Aver-age and 9 tokens in student production rated Low. The proportions of thetokens of these seven types given in the instructions compared with allinstances (production rated High 11%; production rated Average 17%; pro-duction rated Low 30%) show that the high-achievers used types whichwere not given in the instructions to a greater extent than the other studentsdid. This is also what could be expected. The proportion of the types ofnouns with similar Swedish equivalents such as problem and atmosphere(Swedish: problem and atmosfär), however, is not remarkably higher inproduction rated Low (17%) or Average (34%) than in production ratedHigh (32%).
Certain nouns tended to be used repeatedly by the students irrespectiveof test rating category, and these nouns seemed to be central in the descrip-tions and the discussions together with the students who participated in theinterviews. Among these types, a group of five emerges. These types areidea, problem, school, time and way.

191
11.1.3. Occurrences of Abstract Nouns in Relation to Interviewer Categories, Tasks and Background Variables
In this section occurrences of abstract nouns are described in relation to theinterviewer categories across the three test rating categories, and regardingthe distribution in the three tasks. Finally two background variables,namely the students’ sex and their grades in English in school, are takeninto account.
Table 11.6. provides the distribution and the normalised figures of thetypes and tokens of abstract nouns in student production of the three inter-viewer categories across the three test rating categories High, Average andLow.
In student production assessed by Native Speakers (NS), there is a cleartendency that the higher the grade, the higher are the normalised figures forabstract nouns. This applies both to the types and the tokens. Student pro-duction assessed by the other two interviewer categories does not show thisclear tendency when the distribution in production rated High and Averageis compared. Student production rated Low, on the other hand, always tendsto contain few instances irrespective of interviewer category.
The tests consisted of three tasks (cf. 7.4. Tasks and Appendices 4A, 4Band 4C). The topics of Task 3 were controversial issues to discuss, withthree alternatives to choose from in each interview. The topics could beexpected to elicit the use of some abstract nouns to a certain extent.
The distribution of the abstract nouns across the three tasks is of interestto investigate in order to see whether abstract nouns clustered in one of thethree tasks and if differences could be observed when the topics of the threecategories of interviewers are taken into account.
Table 11.7. shows that there is an identical tendency in production as-sessed by the members of the three interviewer categories: instances of
Table 11.6. Abstract nouns by interviewer categories
(ST = School Teachers; UT = University Teachers; NS = Native Speakers)
ST UT NS
High Av Low High Av Low High Av Low
Total instances 105 116 15 89 60 9 84 95 6Normalised figures 9.9 9.5 3.5 8.0 8.0 3.3 8.1 5.9 3.2
Total types 64 82 10 65 44 9 44 63 4Normalised figures 6.0 6.7 2.4 5.9 5.8 3.3 4.3 3.9 2.2
Number of oral tests 10 13 6 12 8 4 10 16 3

192
abstract nouns are most frequent in Task 3. Obviously, Task 3, irrespectiveof interviewer category, provided contexts for the students to use abstractnouns.
It is also of interest to investigate the distribution of the instances in thetasks in relation to the test rating categories. Since frequent uses of abstractnouns tend to characterise student production rated High (cf. Table 11.1.),the results would be consistent if a majority of the abstract nouns used bystudents with a High grade emerged in Task 3. The proportions are pre-sented in Table 11.8.
Table 11.8. gives support to the hypothesis above: in student productionrated High, abstract nouns tend to cluster in Task 3 (63%), whereas studentproduction rated Average or Low shows more similar percentages of ab-stract nouns in Tasks 2 and 3 (42% and 48% for the Average group, and43% and 50% for the Low group).
In what follows, occurrences of abstract nouns in relation to the students’sex and their grades in English in school are discussed. The distribution ofthe abstract nouns in relation to the students’ grades in English is presentedin Table 11.9. (1 to 5, 5 being the top grade).
It is evident in Table 11.9. that the students with the top grade 5 in Eng-lish in school used both more instances and more types of abstract nounsthan the other students did. The high figures for students with the grade 2 in
Table 11.7. Abstract nouns by the tasks of the tests
(ST = School Teachers; UT = University Teachers; NS = Native Speakers)
ST UT NS Total
Task 1 (“to entertain”) 24 10% 20 13% 17 9% 61 11%Task 2 (“to inform”) 85 36% 51 32% 61 33% 197 34%Task 3 (“to argue a case”) 127 54% 87 55% 107 58% 321 55%
Total 236 100% 158 100% 185 100% 579 100%Number of oral tests 29 24 29 82
Table 11.8. Abstract nouns and the tasks of the tests by test rating categories
High Average Low Total
Task 1 (“to entertain”) 32 12% 27 10% 2 7% 61 11%Task 2 (“to inform”) 70 25% 114 42% 13 43% 197 34%Task 3 (“to argue a case”) 176 63% 130 48% 15 50% 321 55%
Total 278 100% 271 100% 30 100% 579 100%Number of oral tests 32 37 13 82

193
English in school may, at least partly, be explained by the remarkably highfigures of one of the students (Q). This student had noticeable lacunae inother respects of his total performance, for instance grammatical accuracy(cf. 14.4. The Individual Student’s Grades).
The results for the second student parameter, the students’ sex, are givenin Table 11.10. which shows that boys’ production contains more instancesof abstract nouns than girls’. The normalised figures of the types show thesame strong tendency.
11.1.4. SummaryIn this section the distribution of the 579 abstract nouns was discussed. Theresults were compared with the three test rating categories. The interviewercategories, the tasks in the tests and two student background variables weretaken into account. Three linguistic factors, namely the occurrence ofcountable and uncountable nouns, the correctness in the students’ use ofuncountable nouns and the distribution of the 119 types of abstract nounsattested across the test rating categories, were described.
Student production assigned a High or Average grade contained moreabstract nouns, both as to types and tokens, than did student productionrated Low. In Native Speakers’ assessment, student production rated High
Table 11.9. Abstract nouns in by school grades in English
Grade 5 4 3 2 Total
Total instances (tokens) 175 118 193 93 579Normalised figures 15.6 5.5 5.6 10.2 7.5
Total instances (types) 101 83 140 61 385Normalised figures 9.0 3.9 4.1 6.7 5.0
Total number of students 4 8 14 3 29
Table 11.10. Abstract nouns by the students’ sex
Boys’ production
Girls’ production Total
Total instances (tokens) 345 234 579Normalised figures 9.9 5.6 7.5
Total instances (types) 221 164 385Normalised figures 6.3 3.9 5.0
Total number of students 12 17 29

194
contained more instances and types of abstract nouns than student produc-tion rated Average did.
Abstract nouns were more frequent in Task 3 than in the other tasks, inparticular in student production assigned a High grade.
The majority of the types of abstract noun attested were represented byone or two tokens in the material. Student production rated High containeda higher proportion of types not given in the instructions of the tests. Agreat majority of the abstract nouns found in the student production be-longed to the category of countable nouns.
The analysis of the relation to the two background variables showed astrong tendency for students with the top grade in English in school to usemany instances and types of abstract nouns in their production. Boys’ pro-duction contained more abstract nouns than girls’.
11.2. Modifiers of Adjectives11.2.1. Overall Distribution
The material yielded 728 instances of modifiers of adjectives. Table 11.11.shows the distribution, normalised figures, means (m), standard deviations(s) and the correlation (r).
There emerged 315 modifiers in the 32 oral tests rated High, 339 in the37 oral tests rated Average and 73 in the 13 oral tests rated Low. Most oral
Table 11.11. Modifiers of adjectives (tokens) by test rating categories
Instances of Number of tests per test rating category Grade meansmodifiers of adjectives High Average Low n m s
0–3 4 8 3 15 3.1 0.7 4–6 5 10 6 21 2.9 0.8 7–9 6 4 2 12 3.4 0.910–12 9 5 1 15 3.7 0.813–15 4 3 1 8 3.5 1.016–18 3 2 0 5 3.6 0.519–21 0 3 0 3 3.0 022–24 0 1 0 1 3.0 025–27 1 1 0 2 3.5 0.7
n (oral tests) 32 37 13 82 r (correlation between Global grades and occurrences of mod-ifiers of adjectives) = 0.23*
n (instances) 315 339 73 727m (instances) 9.8 9.2 5.6 8.9s (instances) 5.1 6.5 3.6 5.7Normalised figures of instances 9.8 9.4 8.2 9.5

195
tests contain up to twelve modifiers (63 out of the 82 tests, 77%). Thefrequency of instances in the individual student’s production ranges fromnone to 26 modifiers. The normalised figures in Table 11.10. show thatfrequencies do not vary greatly across the three test rating categories.There is only a weak tendency of more instances in student productionrated High or Average compared with production rated Low. The correla-tion is 0.23.
Not only frequencies but also the types of modifiers used should be con-sidered. Twelve types of modifiers of adjectives were found. In the individ-ual student’s production, up to six types were used. Table 11.12. gives thefrequencies of the types of modifier in the students’ production of the threetest rating categories. Furthermore, the normalised figures, means, standarddeviations and the correlation are provided.
In a great majority of the production (71 oral tests, 87%), the studentsused one to four types of modifiers. Student production which contains fivetypes or more tends to have been rated High. It should be noticed that thenormalised figures show that student production rated Low contains moretypes of modifiers of adjectives than other student production in the mate-rial. This unexpected tendency means that different types of modifiers ofadjectives were more frequent in student production rated Low than inother student production.
Table 11.12. Modifiers of adjectives (types) by test rating categories
Instances of Number of tests per test rating category Grade meanstypes of modifiersof adjectives High Average Low n m s
0 0 0 1 1 2.0 01 1 8 2 11 2.9 0.52 8 9 3 20 3.3 1.03 10 9 4 23 3.3 0.64 7 8 2 17 3.3 0.75 5 1 1 7 4.0 1.26 1 2 0 3 3.3 0.6
n (oral tests) 32 37 13 82 r (correlation between Global grades and occurrences of types of modifiers of adjectives) = 0.26*
n (types) 106 103 33 242m (types) 3.3 2.8 2.5 3.0s (types) 1.2 1.4 1.4 1.3Normalised figures of types 3.3 2.9 3.8 3.2

196
11.2.2. The Types of ModifierIn this subsection the focus is on the distribution of the twelve types ofmodifier attested in the material across the three test rating categories High,Average and Low. The twelve types of modifier are presented in order ofdescending frequency in Table 11.13.1 Examples are given to illustrate thestudents’ use of them.
Not surprisingly, the list of types of modifiers in Table 11.13. revealsthat very is by far the most frequent modifier of adjectives (382 instances).Quite is much more frequent than the other ten types (114 instances).These ten other types (others than very or quite) are all represented by 44or fewer instances each. The distribution of the twelve types across thethree test rating categories is provided in Table 11.14. Percentages aregiven showing the relative frequency of each modifier within each test rat-ing category.
As can be seen from Table 11.14., very is by far the most common mod-ifier of adjectives regardless of test rating category. Two other tendenciesare of interest. Firstly, the higher the grade, the lower is the proportion ofvery, and the higher is the proportion of alternative modifiers such as reallyor pretty. Students’ in production rated High thus used alternative types tovery. There is a higher proportion of the types a bit, a little bit, pretty, reallyand rather in production assigned a High grade than in production rated
1 Quite a bit and a little bit were grouped together with a bit as a bit is the head of theexpression.
Table 11.13. The types of modifiers of adjectives in descending order offrequency
Type Frequency Examples for illustration
very 382 (80) it’s not very big (ZZ14)quite 114 (81) that’s quite difficult to choose but ... (YY13)pretty 44 (82) a pretty fat lady (J66)a bit 43 (83) it’s a bit difficult (XX12)so 41 (84) when you are so young (D34)a little bit 32 (85) she’s a little bit crazy (WW15)really 31 (86) I was really amazed (XX49)rather 23 (87) it was a rather steep hill (Y25)totally 8 (88) it’s a totally unrealistic situation (Z11)a little 7 (89) it’s a little unfair to some people (K86)quite a bit 1 (90) but this house is quite a bit far away (C33)fairly 1 (91) I think it’s fairly expensive (O45)
Total 727
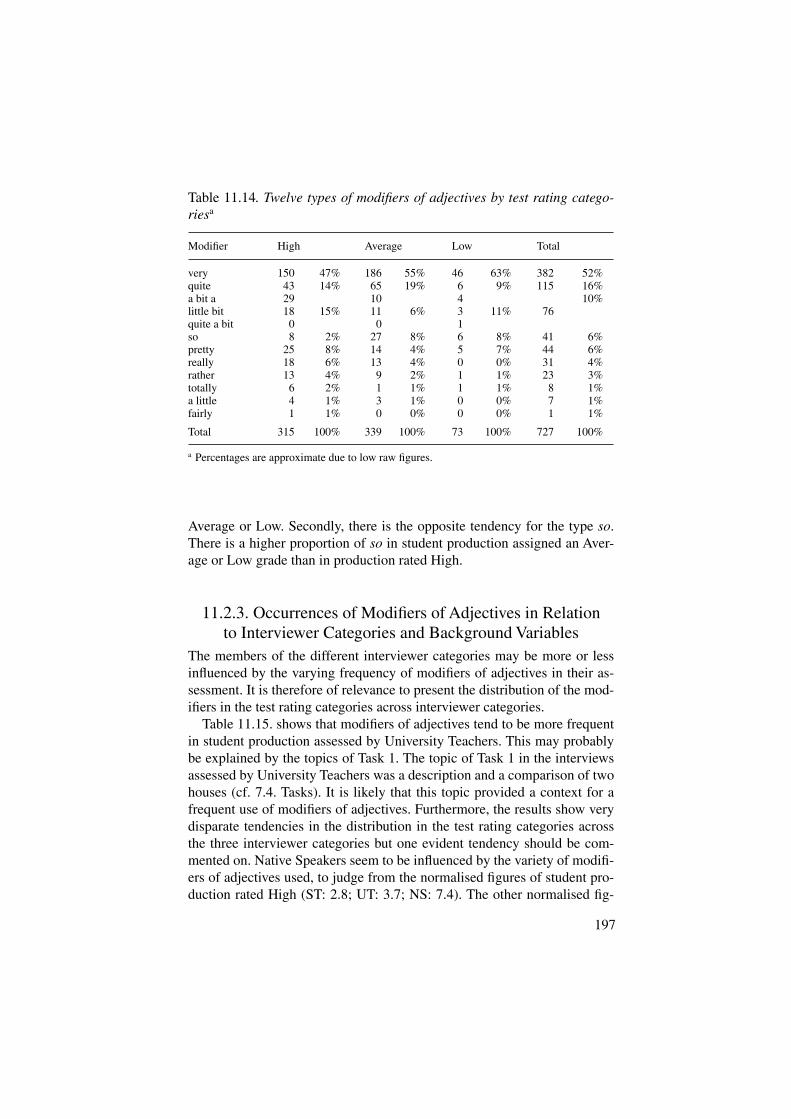
197
Average or Low. Secondly, there is the opposite tendency for the type so.There is a higher proportion of so in student production assigned an Aver-age or Low grade than in production rated High.
11.2.3. Occurrences of Modifiers of Adjectives in Relation to Interviewer Categories and Background Variables
The members of the different interviewer categories may be more or lessinfluenced by the varying frequency of modifiers of adjectives in their as-sessment. It is therefore of relevance to present the distribution of the mod-ifiers in the test rating categories across interviewer categories.
Table 11.15. shows that modifiers of adjectives tend to be more frequentin student production assessed by University Teachers. This may probablybe explained by the topics of Task 1. The topic of Task 1 in the interviewsassessed by University Teachers was a description and a comparison of twohouses (cf. 7.4. Tasks). It is likely that this topic provided a context for afrequent use of modifiers of adjectives. Furthermore, the results show verydisparate tendencies in the distribution in the test rating categories acrossthe three interviewer categories but one evident tendency should be com-mented on. Native Speakers seem to be influenced by the variety of modifi-ers of adjectives used, to judge from the normalised figures of student pro-duction rated High (ST: 2.8; UT: 3.7; NS: 7.4). The other normalised fig-
Table 11.14. Twelve types of modifiers of adjectives by test rating catego-riesa
a Percentages are approximate due to low raw figures.
Modifier High Average Low Total
very 150 47% 186 55% 46 63% 382 52%quite 43 14% 65 19% 6 9% 115 16%a bit a little bit quite a bit
29 18 0
15% 10 11 0
6% 4 3 1
11% 76 10%
so 8 2% 27 8% 6 8% 41 6%pretty 25 8% 14 4% 5 7% 44 6%really 18 6% 13 4% 0 0% 31 4%rather 13 4% 9 2% 1 1% 23 3%totally 6 2% 1 1% 1 1% 8 1%a little 4 1% 3 1% 0 0% 7 1%fairly 1 1% 0 0% 0 0% 1 1%
Total 315 100% 339 100% 73 100% 727 100%

198
ures do not tally with the Global grades assigned to the student productionby the three interviewer categories.
In what follows, the relation to two background variables is presented:the students’ grades in English in school and the students’ sex. The distribu-tion of the modifiers of adjectives and the normalised figures are presentedin relation to the students’ grades in English in school in Table 11.16.
The results show no convincing relationship between the frequency ofmodifiers of adjectives and the students’ grades in English in school. Nei-ther tokens nor types of modifiers of adjectives show any noteworthy ten-dencies.
In what follows the relationship between the students’ sex and the distri-bution of the modifiers of adjectives is described. The proportions and nor-malised figures are given in Table 11.17.
The results show a slight tendency for girls’ production to containmore types and more tokens of modifiers of adjectives than do boys’ pro-duction.
Table 11.15. Modifiers of adjectives by interviewer categories
(ST = School Teachers; UT = University Teachers; NS = Native Speakers)
ST UT NS
High Av Low High Av Low High Av Low
Frequencies of modifiers (tokens)Total instances 75 103 16 127 88 40 113 148 17Normalised figures 7.1 8.4 3.8 11.4 11.7 14.8 10.9 9.1 9.2
Frequencies of modifiers (types)Total types 30 33 10 41 29 13 76 41 10Normalised figures 2.8 2.7 2.4 3.7 3.9 4.8 7.4 2.5 5.4
Number of oral tests 10 13 6 12 8 4 10 16 3
Table 11.16. Modifiers of adjectives by school grades in English
Grade 5 4 3 2 Total
Total instances (tokens) 117 194 329 87 727Normalised figures 10.5 9.1 9.5 9.5 9.5Total instances (types) 38 74 101 29 242Normalised figures 3.4 3.5 2.9 3.2 3.2
Total number of students 4 8 14 3 29

199
11.2.4. SummaryIn this section the occurrence of modifiers of adjectives in the student pro-duction was presented. The three test rating categories and the three inter-viewer categories were taken into account. The distribution of the twelvetypes of modifiers of adjectives was presented in the three test rating cate-gories. Finally, two background variables were taken into account.
The results indicated a slight tendency for student production assigned aHigh or Average grade to contain more instances of modifiers than didproduction assigned a Low grade. The results were not decisive, however.Furthermore, the results showed that students in production rated High byNative Speakers used more types, i.e. showed variety in their use of modi-fiers.
The presentation of the distribution of the twelve types of modifiersshowed that very stood out as the most frequent modifier. The modifierspretty, rather and really tended to be more frequent in student productionassigned a High grade than in other production. There was the oppositetendency for so.
Frequent uses of modifiers of adjectives did not tally with the students’grades in English in school. There was a weak tendency of there being moremodifiers of adjectives in girls’ production than in boys’.
11.3. Students’ Lexical Errors and Compensatory Strategies
11.3.1. Occurrences of Lexical ErrorsThe material yielded 106 instances of lexical errors of the twelve typesselected for the investigation (cf. 9.2.3. Students’ Lexical Errors and Com-pensatory Strategies) in 48 of the 82 oral tests of the material.2 These 48
2 These errors were selected according to the criteria defined in 9.2.3.
Table 11.17. Modifiers of adjectives by the students’ sex
Boys’ production
Girls’ production Total
Total instances (tokens) 287 440 727Normalised figures 8.2 10.5 9.5Total instances (types) 99 143 242Normalised figures 2.8 3.4 3.2
Total number of students 12 17 29

200
tests which contain at least one lexical error spread across the three testrating categories High, Average and Low. The distribution, normalised fig-ures, means (m), standard deviations (s) and correlation (r) are presented inTable 11.18.
Most student production contains no errors or no more than one error (68of the 82 oral tests, 83%). Sixteen (50%) of the oral tests rated High do notcontain any instances of the lexical errors investigated. Fourteen tests(38%) rated Average and four tests (30%) rated Low also fall into this cate-gory. The normalised figures show that student production rated Low tendsto contain more lexical errors (1.9) than production rated Average (1.3) orHigh (1.3).
In what follows, the distribution of the number of types of lexical error inthe three test rating categories is presented. The distribution, normalisedfigures, means (m), standard deviations (s) and correlation (r) are given inTable 11.19.
The distribution and the normalised figures of the number of types oflexical errors in each test rating category tally with the results of frequen-cies described in Table 11.18. The normalised figures show that studentproduction rated Low generally contains more types of lexical errors thanother production (1.4 compared with 0.7 and 1.0). There is a differencebetween Tables 11.19. and 11.18. when student performances rated Highand Average are compared. In Table 11.18. production rated High and Av-erage yield the same results whereas in 11.19. student production ratedAverage contains slightly more types than production rated High.
Table 11.18. Lexical errors (tokens) by test rating categories
Number of tests per test rating category Grade meansInstances of lexical errors High Average Low n m s
0 16 (50%) 14 (38%) 4 (30%) 34 (32%) 3.4 0.81 8 9 5 22 3.1 0.82 2 8 2 12 3.0 0.63 0 3 1 4 2.8 0.54 2 2 0 4 3.5 0.65 2 1 1 4 3.0 1.46 2 0 0 2 4.5 0.7
n (oral tests) 32 (100%) 37 (100%) 13 (100%) 82 (100%) r (correlation between Global grades and occur-rences of lexical errors) = –0.02
n (instances) 42 47 17 106m (instances) 1.3 1.3 1.3 1.3s (instances) 1.9 1.3 1.4 1.6Normalised figures of instances 1.3 1.3 1.9 1.4
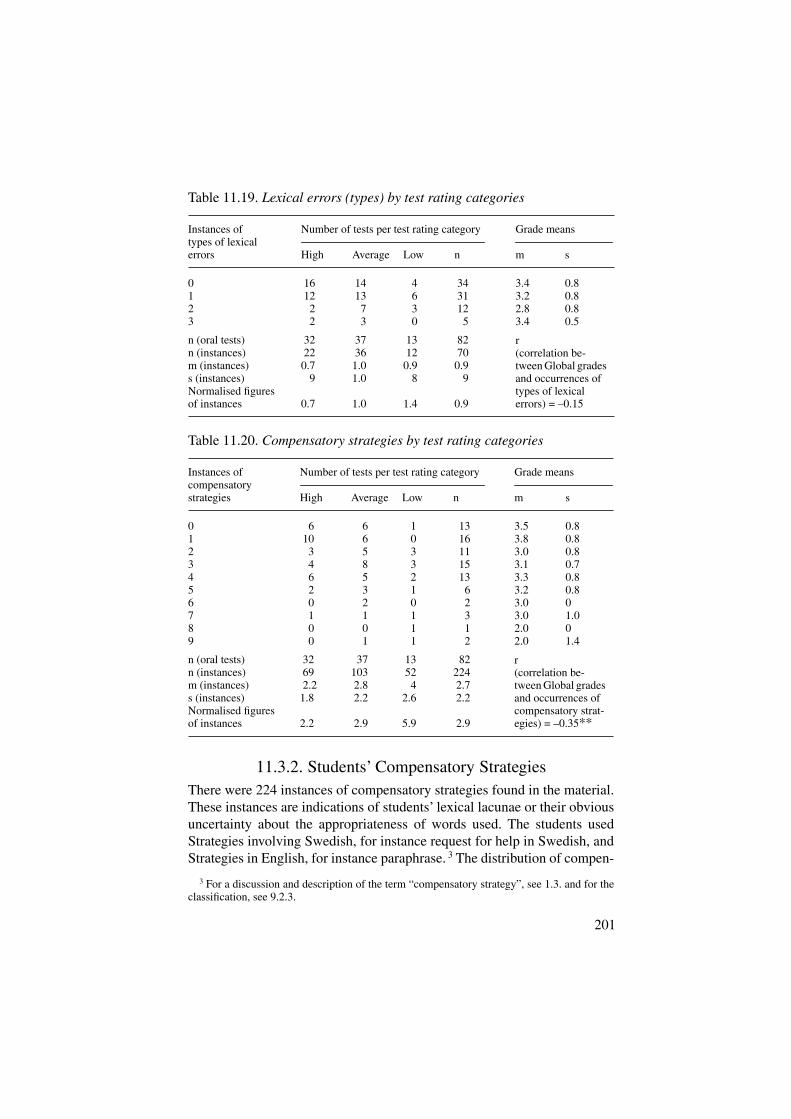
201
11.3.2. Students’ Compensatory StrategiesThere were 224 instances of compensatory strategies found in the material.These instances are indications of students’ lexical lacunae or their obviousuncertainty about the appropriateness of words used. The students usedStrategies involving Swedish, for instance request for help in Swedish, andStrategies in English, for instance paraphrase. 3 The distribution of compen-
3 For a discussion and description of the term “compensatory strategy”, see 1.3. and for theclassification, see 9.2.3.
Table 11.19. Lexical errors (types) by test rating categories
Instances of Number of tests per test rating category Grade meanstypes of lexicalerrors High Average Low n m s
0 16 14 4 34 3.4 0.81 12 13 6 31 3.2 0.82 2 7 3 12 2.8 0.83 2 3 0 5 3.4 0.5
n (oral tests) 32 37 13 82 r (correlation be-tween Global grades and occurrences of types of lexical errors) = –0.15
n (instances) 22 36 12 70m (instances) 0.7 1.0 0.9 0.9s (instances) 9 1.0 8 9Normalised figures of instances 0.7 1.0 1.4 0.9
Table 11.20. Compensatory strategies by test rating categories
Instances of Number of tests per test rating category Grade meanscompensatorystrategies High Average Low n m s
0 6 6 1 13 3.5 0.81 10 6 0 16 3.8 0.82 3 5 3 11 3.0 0.83 4 8 3 15 3.1 0.74 6 5 2 13 3.3 0.85 2 3 1 6 3.2 0.86 0 2 0 2 3.0 07 1 1 1 3 3.0 1.08 0 0 1 1 2.0 09 0 1 1 2 2.0 1.4
n (oral tests) 32 37 13 82 r (correlation be-tween Global grades and occurrences of compensatory strat-egies) = –0.35**
n (instances) 69 103 52 224m (instances) 2.2 2.8 4 2.7s (instances) 1.8 2.2 2.6 2.2Normalised figures of instances 2.2 2.9 5.9 2.9

202
satory strategies across test rating categories, normalised figures, means(m), standard deviations (s) and correlation (r) are presented in Table 11.20.
The normalised figures show that student production rated Low containsa considerably greater number of instances where the students resorted tocompensatory strategies than in other student production (5.9 comparedwith 2.2 and 2.9). There is only a weak tendency for more instances tooccur in student production rated Average than in student production ratedHigh. A single instance, or none, of a compensatory strategy in a test ismore frequent in student production rated High (16 tests, 50%), than inproduction rated Average (12 tests, 32%), or Low (1 test, 8%). The correla-tion is –0.35.
In what follows the distribution of the twelve types of strategy selected(cf. 9.2.3. Students’ Lexical Errors and Compensatory Strategies) is de-scribed across the three test rating categories.
The distribution of the total number of instances of the two categories(Strategies involving Swedish and Strategies in English) shows that stu-dents generally use more Strategies in English (71%) than Strategies in-volving Swedish (29%). This tendency is strongest however for studentsrated High (80% / 20%).
Table 11.21. Twelve types of compensatory strategy by test rating categories
Strategies High Average Low Total
Strategies involving Swedish1. Request for help in Swedish 1 5 2 82. Swedish words used 7 14 5 263. Swedish words pronounced in English 4 7 3 144. Swedish words explained in English 0 1 2 3 5. Swedish words added 1 2 0 36. Word coinage based on Swedish 1 5 5 11
Total Strategies involving Swedish 14 20% 34 33% 17 33% 65 29%
Strategies in English 7. Request for help in English 6 9 5 208. Waiting for assistance 2 3 1 69. Substitution by superordinate or approximate terms 9 15 12 3610. Word coinage based on English 2 10 1 1311. Giving two alternatives 23 21 7 5112. Paraphrase 13 11 9 33
Total Strategies in English 55 80% 69 67% 35 6% 159 71%Total Strategies used 69 100% 103 100% 52 100% 224 100%
Total number of oral tests 32 27 13 82

203
The most common type of strategy used is “Giving two alternatives” (51instances). There is a higher proportion of these instances in student pro-duction rated High (23 instances, 33%) than elsewhere (Average 21 in-stances, 20%; Low, 7 instances, 13%).
The interaction between the interviewers and students during the testsand the interviewers’ background may influence the students’ choice oftype of strategy. It may be expected, for instance, that student productionassessed by Swedish interviewers contains a higher proportion of Strategiesinvolving Swedish than production assessed by Native Speakers. When thestudents realised that the interviewers were Swedish they may have turnedto the Swedish language rather than trying to cope in English when facedwith vocabulary difficulties or when they found it difficult to express whatthey wanted to say. For that reason, a survey of the distribution of the 224instances of compensatory strategies across the three interviewer categoriesis provided in Table 11.22.
Table 11.22. Twelve types of compensatory strategy by interviewer cate-gories
(ST = School Teachers, UT = University Teachers, NS = Native Speakers)
Strategies ST UT NS Total
Strategies involving Swedish1. Request for help in Swedish 6 1 1 82. Swedish words used 17 4 5 263. Swedish words pronounced in English 7 2 5 144. Swedish words explained in English 2 1 0 3 5. Swedish words added 1 2 0 36. Word coinage based on Swedish 4 3 4 11
Total Strategies involving Swedish 37 37% 13 22% 15 23% 65 29%
Strategies in English 7. Request for help in English 14 0 6 208. Waiting for assistance 3 1 2 69. Substitution by superordinate or approximate terms 18 9 9 3610. Word coinage based on English 4 4 5 1311. Giving two alternatives 17 15 19 5112. Paraphrase 8 17 8 33
Total Strategies in English 64 63% 46 78% 49 77% 159 71%Total Strategies used 101 100% 59 100% 64 100% 224 100%
Total number of oral tests 29 24 29 82

204
The results show that students were more inclined to use compensatorystrategies, and in particular Strategies involving Swedish, in student pro-duction assessed by School Teachers (ST: 101 instances; UT. 59 instances;NS: 64 instances). Another tendency should also be commented on: ahigher proportion of strategies of request for help, in Swedish or in English,appeared in student production with School Teachers than with other inter-viewers. The tests with School Teachers contain 20 instances (20%), theones with University Teachers 1 instance (2%) and the ones with NativeSpeakers 7 instances (11%).
11.3.3. SummaryIn this section the discussion included a description of occurrences of lexi-cal errors related to a selected list of words and the compensatory strategiesthe students used to solve vocabulary difficulties. The compensatory strate-gies could also signal their uncertainty about the appropriateness of an Eng-lish word or phrase. The three test rating categories High, Average and Lowas well as the three interviewer categories were taken into account.
According to the results, most lexical errors emerged in student produc-tion rated Low. Student production rated High contained fewer instances,both in terms of types and tokens, than other student production. A slighttendency of more types of lexical errors in student production rated Aver-age, compared with production rated High, could be observed.
The survey indicated that student production rated Low contained con-siderably more instances of compensatory strategies than other student pro-duction. As regards the types of compensatory strategies used by the stu-dents, the results showed that the students in production assigned a Highgrade used a higher proportion of Strategies in English than Strategies in-volving Swedish compared to students in the Average or Low categorywhere Swedish was resorted to more often.
When the interviewer categories were compared, it was found that stu-dent production assessed by School Teachers contained a higher proportionof Strategies involving Swedish than production assessed by the membersof the other two interviewer categories. It also contained more requests forhelp in English and Swedish than production assessed by University Teach-ers or Native Speakers.

205
CHAPTER 12
Discourse Markers
12.1. Well...The present description of well in the student production is structured asfollows. First the occurrence of well in the three test rating categories High,Average and Low will be surveyed. Then the discoursal factors will bedescribed. Finally, the relationships to the three interviewer categories, thetasks of the tests and two background variables will be dealt with.
12.1.1. Overall DistributionThe data yielded 407 instances of well as a discourse marker. The distribu-tion, normalised figures, means (m), standard deviations (s) and the correla-tion (r) are provided in Table 12.1. The proportions (in percentages) withinthe test rating categories that contain no instances are also given.
The results show that the 407 instances were spread across the three testrating categories and that the frequencies in the individual students’ pro-duction range from none up to more than 15 instances. It may be observedthat 24 oral tests (29%) contain no instances and that higher proportions oforal tests rated Average (35%) or Low (38%) contain no instances com-pared with student production rated High (19%). Six oral tests contain rela-tively high frequencies with more than 15 instances (16, 16, 19, 19, 26 and27 instances). These oral tests were rated High or Average. The majority ofthe oral tests that contain 10 or more instances were rated High (12 out ofthe 18 oral tests). The normalised figures give support to the observationthat student production rated High contains more instances of well (7.0)than student production rated Average (4.5) or Low (2.6). The correlation is0.31. In what follows, the contexts of well attested in the students’ produc-tion are described.
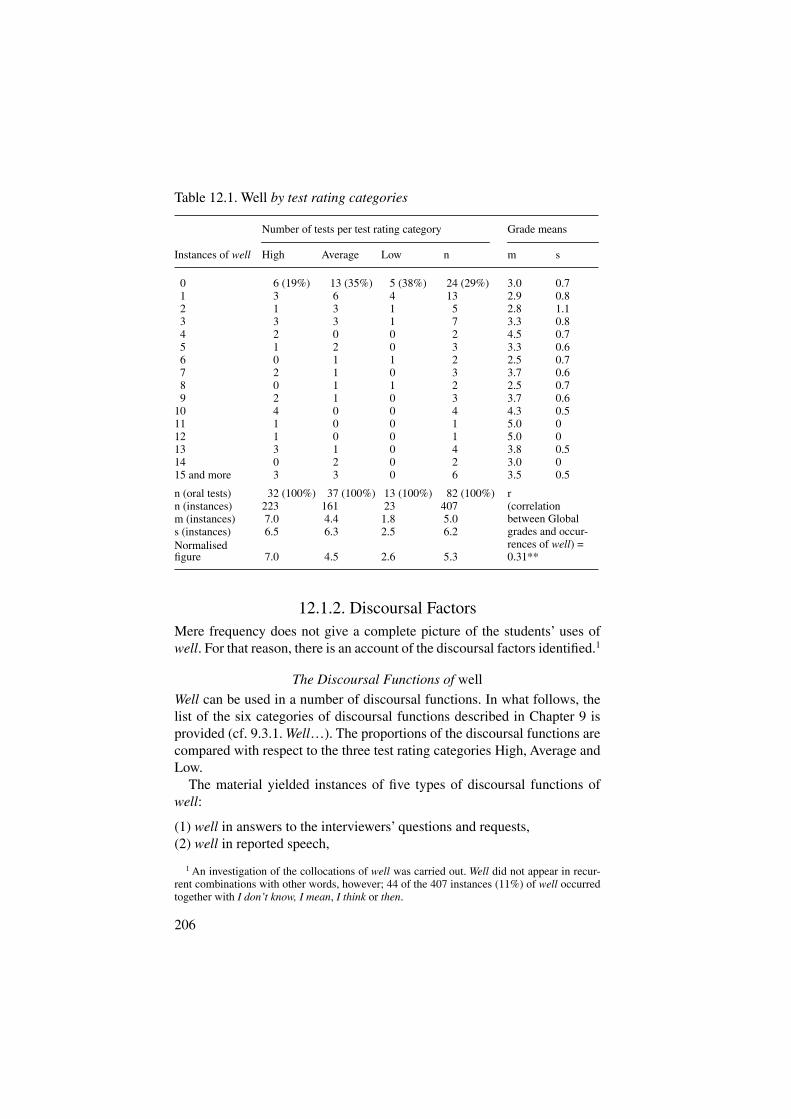
206
12.1.2. Discoursal FactorsMere frequency does not give a complete picture of the students’ uses ofwell. For that reason, there is an account of the discoursal factors identified.1
The Discoursal Functions of well
Well can be used in a number of discoursal functions. In what follows, thelist of the six categories of discoursal functions described in Chapter 9 isprovided (cf. 9.3.1. Well…). The proportions of the discoursal functions arecompared with respect to the three test rating categories High, Average andLow.
The material yielded instances of five types of discoursal functions ofwell:
(1) well in answers to the interviewers’ questions and requests,(2) well in reported speech,
1 An investigation of the collocations of well was carried out. Well did not appear in recur-rent combinations with other words, however; 44 of the 407 instances (11%) of well occurredtogether with I don’t know, I mean, I think or then.
Table 12.1. Well by test rating categories
Number of tests per test rating category Grade means
Instances of well High Average Low n m s
0 6 (19%) 13 (35%) 5 (38%) 24 (29%) 3.0 0.7 1 3 6 4 13 2.9 0.8 2 1 3 1 5 2.8 1.1 3 3 3 1 7 3.3 0.8 4 2 0 0 2 4.5 0.7 5 1 2 0 3 3.3 0.6 6 0 1 1 2 2.5 0.7 7 2 1 0 3 3.7 0.6 8 0 1 1 2 2.5 0.7 9 2 1 0 3 3.7 0.610 4 0 0 4 4.3 0.511 1 0 0 1 5.0 012 1 0 0 1 5.0 013 3 1 0 4 3.8 0.514 0 2 0 2 3.0 015 and more 3 3 0 6 3.5 0.5
n (oral tests) 32 (100%) 37 (100%) 13 (100%) 82 (100%) r (correlation between Global grades and occur-rences of well) = 0.31**
n (instances) 223 161 23 407m (instances) 7.0 4.4 1.8 5.0s (instances) 6.5 6.3 2.5 6.2Normalised figure 7.0 4.5 2.6 5.3

207
(3) well in repetitions,(4) well in contexts where students express difficulties with English, and(5) well as a finishing signal.
The remaining instances were classified as
(6) well in indeterminate contexts.
The distribution of the six types across the three test rating categories High,Average and Low is provided in Table 12.2.
The results show that nearly half of the instances occur in indeterminatecontexts (48%). By far the most frequent discoursal function identified iswell used in answers to the interviewers’ questions and requests (44%).This is the only discoursal function identified in student production ratedLow. In student production rated High, well appeared in connection withreported speech and in conclusions. Well was used in repetitions and incontexts of linguistic difficulties mainly by students assigned an Averagegrade.
12.1.3. Occurrences of well in Relation to Interviewer Categories, Tasks and Background Variables
In this section, the distribution of the instances in the student productionwith respect to the interviewer categories, the tasks of the tests and twobackground variables are discussed.
The purpose of investigating the instances in relation to interviewer cate-gories is to find out whether student production which contains many in-stances of well was assigned a High grade by all three categories of inter-viewers or not. The total and normalised figures in student production ratedHigh, Average and Low by the School Teachers (ST), the University Teach-ers (UT) and the Native Speakers (NS) are provided in Table 12.3.
Table 12.2. Discoursal functions of well by test rating categories
Discoursal function High Average Low Total
Well in answers 84 (38%) 80 (50%) 16 (70%) 180 (44%)Well in reported speech 6 1 0 7Well as a finishing signal 9 1 0 10 Well in repetitions 2 6 0 8Well and linguistic difficulties 1 6 0 7Well in indeterminate contexts 121 (54%) 67 (42%) 7 195 (48%)
Total instances 223 (100%) 161 (100%) 23 (100%) 407 (100%)

208
The normalised figures show a clear difference in the distribution of theinstances of well in student production across the three interviewer catego-ries. Student production rated High by School Teachers (ST) in particular,and to some extent by University Teachers (UT), contains more instances(9.9 and 5.8) than student production rated Average (5.0 and 2.1) or Low(1.2 and 3.0) by them. The instances in production rated by Native Speakers(NS) do not show this tendency (5.2, 5.2 and 5.4). This finding is discussedin 14.3. Interviewer Categories, and in 15.3. Discourse Markers.
A very high rate of well in one student’s production could explain theobserved differences between grades assigned in relation to the use of well.Moderate uses of well may result in positive assessments, whereas studentproduction with high frequencies could result in another grade. For thatreason, it was of interest to investigate the grades of the tests that contain aremarkably high frequency. Oral tests which contain more than ten in-stances of well were investigated in order to see whether this hypothesiscould account for the different tendencies observed in Table 12.1. The re-sults of the investigation showed that the distribution of the oral tests withten or more instances of well confirmed the tendencies observed in Table12.4. (High frequencies of well were rated differently by the interviewercategories.). Eight of the ten oral tests which contain more than ten in-stances and rated by School Teachers or University Teachers were assigneda High grade whereas four of the eight oral tests with more than ten in-stances were rated High by the Native Speakers. The other four oral testswere rated Average.
A description of the distribution of the instances of well in the three tasksof the tests may provide useful information. It could be expected that thegreat majority of the instances emerged in the unprepared discussion ofTask 3 (cf. 7.6. Tasks, and furthermore, the discussion of well as an evincivein 1.3. Linguistic Analyses of Students’ Proficiency). A high proportion ofwell in Task 3 could be evidence of the students’ need to use well in their
Table 12.3. Well by interviewer categories
(ST = School Teachers; UT = University Teachers; NS = Native Speakers)
ST UT NS
High Av Low High Av Low High Av Low
Total instances 105 61 5 64 16 8 54 84 10Normalised figures 9.9 5.0 1.2 5.8 2.1 3.0 5.2 5.2 5.4
Total oral tests 10 13 6 12 8 4 10 16 3
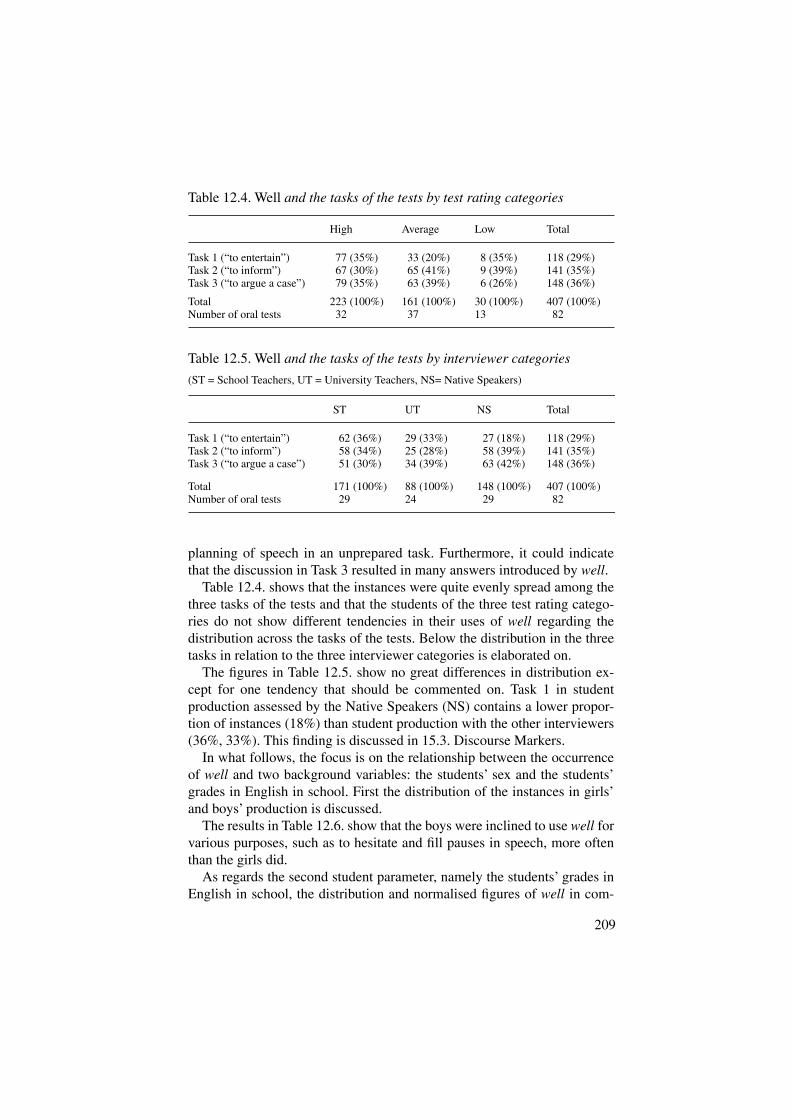
209
planning of speech in an unprepared task. Furthermore, it could indicatethat the discussion in Task 3 resulted in many answers introduced by well.
Table 12.4. shows that the instances were quite evenly spread among thethree tasks of the tests and that the students of the three test rating catego-ries do not show different tendencies in their uses of well regarding thedistribution across the tasks of the tests. Below the distribution in the threetasks in relation to the three interviewer categories is elaborated on.
The figures in Table 12.5. show no great differences in distribution ex-cept for one tendency that should be commented on. Task 1 in studentproduction assessed by the Native Speakers (NS) contains a lower propor-tion of instances (18%) than student production with the other interviewers(36%, 33%). This finding is discussed in 15.3. Discourse Markers.
In what follows, the focus is on the relationship between the occurrenceof well and two background variables: the students’ sex and the students’grades in English in school. First the distribution of the instances in girls’and boys’ production is discussed.
The results in Table 12.6. show that the boys were inclined to use well forvarious purposes, such as to hesitate and fill pauses in speech, more oftenthan the girls did.
As regards the second student parameter, namely the students’ grades inEnglish in school, the distribution and normalised figures of well in com-
Table 12.4. Well and the tasks of the tests by test rating categories
High Average Low Total
Task 1 (“to entertain”) 77 (35%) 33 (20%) 8 (35%) 118 (29%)Task 2 (“to inform”) 67 (30%) 65 (41%) 9 (39%) 141 (35%)Task 3 (“to argue a case”) 79 (35%) 63 (39%) 6 (26%) 148 (36%)
Total 223 (100%) 161 (100%) 30 (100%) 407 (100%)Number of oral tests 32 37 13 82
Table 12.5. Well and the tasks of the tests by interviewer categories
(ST = School Teachers, UT = University Teachers, NS= Native Speakers)
ST UT NS Total
Task 1 (“to entertain”) 62 (36%) 29 (33%) 27 (18%) 118 (29%)Task 2 (“to inform”) 58 (34%) 25 (28%) 58 (39%) 141 (35%)Task 3 (“to argue a case”) 51 (30%) 34 (39%) 63 (42%) 148 (36%)
Total 171 (100%) 88 (100%) 148 (100%) 407 (100%)Number of oral tests 29 24 29 82

210
parison with the students’ grades in English in school appear from Table12.7.
The normalised figures in Table 12.7. show the clear tendency that stu-dents who had the top grades 4 and 5 in English in school more often usedwell than did the other students. The normalised figure for the students withthe low grade 2 is remarkably high, however. This figure can be explainedby the fact that the performance by two of the three students who had thelow grade 2, hardly contains any instances at all, whereas one student (Q)used well up to 19 times in one interview. The normalised figure for stu-dents who had the low grade 2 is consequently highly influenced by theinstances in the performance by one individual student.
12.1.4. SummaryIn this section the students’ use of well was described. The test rating cate-gories, the three interviewer categories, the tasks of the tests and the rela-tion to two background variables were taken into account. Furthermore, asurvey of the discoursal functions was provided.
Generally, most instances of well emerged in student production ratedHigh. Individual students’ production which contained high frequencieswas assigned a High or Average grade. These were the tendencies in pro-duction rated by School Teachers or University Teachers. The distributionof the instances in student production assessed by Native Speakers did notshow this pattern. Their grading did not seem to have been influenced bythe occurrence of well.
Table 12.6. Well by the students’ sex
Boys’ production
Girls’ production Total
Total instances (tokens) 209 198 407Normalised figures 6.0 4.7 5.3
Total number of students 12 17 29
Table 12.7. Well by school grades in English
School Grade 5 4 3 2 Total
Total instances 126 151 92 38 407Normalised figures 11.3 7.1 2.7 4.2 7.5
Total number of students 4 8 14 3 29

211
The majority of the instances of well were in indeterminate contexts, andprobably used as an item used in for instance hesitations or as a gap-fillingdevice. Another identified function was in answers to the interviewers’questions and requests. Student production rated High contained a largerproportion of instances in other discoursal functions, such as in conclu-sions, than in answers to questions and requests.
The boys used well slightly more often than the girls did and the fre-quency of well correlated with the students’ grades in English in school. Inspite of some intra-group variation, it was clear that students with highgrades in English in school tended to use well more often.
12.2. You know...The structure of the present section is as follows. First the occurrence ofyou know is presented in the student production across the three test ratingcategories High, Average, and Low. Then collocational factors along withthe position of you know in the utterance are described. After these presen-tations, the discoursal functions of you know are taken into account. Fur-thermore, it is of interest to check the occurrence of you know across thestudent production rated by the three interviewer categories together with apresentation of the interviewers’ uses of you know in the interviews. Forthat reason, a subsection is included where the Global grades assigned tothe students’ production are compared with the uses of you know by themembers of the three interviewer categories. Finally, surveys of the distri-bution across the tasks of the tests and the relationship to two backgroundvariables are provided.
12.2.1. Overall DistributionThere were 94 instances of you know in 34 oral tests. Student productionwhich contains instances spread across the three test rating categories High,Average, and Low. Table 12.8. shows the distribution, normalised figures,means (m), standard deviations (s) and the correlation (r). Furthermore, theproportions (in percentages) of production within the test rating categoriesthat contain no instances are given.
The majority of the oral tests (59%) contain no instances of you know.No clear tendencies can be observed when the proportions of oral tests withno instances in the three test rating categories are compared. The normal-ised figures show some interesting tendencies, however. You know isslightly more frequent in student production assigned an Average or Low

212
grade (1.3 and 1.9) than in production rated High (0.9). Discoursal func-tions and syntactic contexts may account for these differences in the stu-dents’ uses.
12.2.2. Collocational and Discoursal FactorsIn this subsection, the distribution of the linguistic items that occur togetherwith you know is presented. Then, a survey of the position of you know inthe utterances in terms of turn-initial, medial, and turn-final position is pro-vided. Finally, the distribution of the instances in four discoursal functionsis described. In each survey, the proportions in the three test rating catego-ries High, Average and Low are compared.
Collocational Factors
The occurrence of recurrent linguistic items together with you know mayprovide useful information. These different linguistic items could possiblyprovide evidence of stylistic features of the student performance in one ofthe three test rating categories High, Average, and Low.
Only one type of collocation occurred more than twice in the material:and you know/you know and. Twelve instances were found of this colloca-tion and the great majority of them were in student production rated High:9 out of the 12 instances (75%). When the proportions of the instances of
Table 12.8. You know by test rating categories
Number of tests per test rating category Grade meansInstances of you know High Average Low n m s
0 18 (56%) 23 (62%) 7 (54%) 48 (59%) 3.3 0.91 9 4 2 15 3.5 1.22 1 0 1 2 3.0 1.43 1 4 2 7 2.4 1.04 0 3 0 3 3.0 05 2 2 0 4 3.8 1.06 1 0 0 1 5.0 07 0 0 1 1 2.0 09 0 1 0 1 3.0 0
n (oral tests) 32 (100%) 37 (100%) 13 (100%) 82 (100%) r (correlation between Global grades and occur-rences of you know) = –0.03
n (instances) 30 47 17 94m (instances) 0.9 1.3 1.3 1.1s (instances) 1.6 2.1 2.1 1.9
Normalised figures 0.9 1.3 1.9 1.2

213
and you know/you know and were compared with the total instances in onetest rating category, the highest proportion was found in student productionrated High (9 out of the total 30 instances, 30%).
The Position in the Utterance
The 94 instances were categorised as markers in turn-initial, medial, orturn-final position. The proportions of the instances in the three positionsacross the three test rating categories High, Average and Low are providedin Table 12.9.
The results show that a great majority of the instances are in medialposition irrespective of Global grades assigned. The results are in line withprevious research and native speakers’ use (Erman 1987: 50) described inChapter 1 (cf. 1.3. Linguistic Analyses of Students’ Proficiency).
Discoursal Functions
Three discoursal functions of you know were attested: expressing an opin-ion, word searching, and you know in contexts with repetition. Remaininginstances of you know were classified as indeterminate (cf. 9.3.2. Youknow…). In what follows, a survey of the instances in the three discoursalfunctions and the indeterminate instances across the three test rating cate-gories High, Average and Low are provided.
The figures in Table 12.10. show two tendencies worth commenting on.Firstly, the majority of the instances (66%) are in the category “Indetermi-nate instances”, and the tendency is evident irrespective of test rating cate-gory. Secondly, the remaining instances which were categorised show dif-ferences in distribution mainly across the two test rating categories Highand Average. You know emerged in contexts of students’ vocabulary gapsand in repetitions in student production rated Average whereas student pro-duction rated High contains more instances in contexts when the studentsexpressed their own opinion.
Table 12.9 You know and the position in the utterance by test rating catego-ries
High Average Low Total
Turn-initial position 2 3 0 5 Medial position 22 (73%) 31 (66%) 13 (76%) 66 (70%)Turn-final position 6 13 4 23
Total instances 30 (100%) 47 (100%) 17 (100%) 94 (100%)Number of oral tests 32 37 13 82

214
12.2.3. Occurrences of you know in Relation to Interviewer Categories, Tasks and Background Variables
There are at least two reasons why it is highly interesting to take into ac-count the three interviewer categories in the case of you know. Firstly, theinterviewers’ background can account for the different grades assigned tothe student production that contains many instances. You know is describedas stigmatised in some contexts (Schiffrin 1987) and the interviewers mayshow their approval or disapproval of the students’ idiomatic or unidio-matic use of such an item. It is therefore of interest to see whether membersof one of the three interviewer categories reacted in a negative way towardsthe students’ use of you know.
Secondly, as described in Chapter 1 (cf. 1.3.Linguistic Analyses of Stu-dents’ Proficiency), you know is an item which may be used as a signaltowards a more personal and relaxed conversation. It may be expected thatthe first step in this direction is taken by the interviewers in oral proficiencyinterviews. Evidently, there may be other items that work in the same direc-tion as you know, but nevertheless it is of great interest to investigate thestudents’ (cf. Table 12.12) and the interviewers’ use (cf. Table 12.13) of youknow in the interviews.
The occurrence of the 94 instances of you know in student productionassessed by the members of the three interviewer categories (School Teach-ers, University Teachers and Native Speakers) is provided in Table 12.11.
Table 12.11. shows remarkable differences in the distribution of youknow in the student production across the three interviewer categories. Stu-dent production rated Low by Native Speakers (NS) contains 13 instancesof you know and has a high normalised figure (7.0). Very few instancesemerged in student production rated Low by the other two interviewer cat-egories (UT: 2, ST: 2). Student production rated by University Teachersshows the opposite tendency: student production rated High contains manyinstances (17 instances, normalised figure: 1.5).
Table 12.10. You know and discoursal functions by test rating categories
High Average Low Total
Expressing opinion 8 2 2 12 Word searching 1 5 4 10 Repetition 1 7 2 10 Indeterminate instances 20 (67%) 33 (70%) 9 (53%) 62 (66%)
Total instances 30 (100%) 47 (100%) 17 (100%) 94 (100%)Number of oral tests 32 37 13 82

215
The focus of interest is now on the relationship of the students’ use ofyou know to the interviewers’ use of you know in the interviews. The resultsso far have indicated that the students’ use of you know rather characterisesstudent production rated Average or Low than High, at least when assessedby Native Speakers. The use of you know can be interpreted as a means ofcreating a more personal and intimate conversation. Since the interviewerswere expected to conduct the conversation in the oral test, they might haveregarded it as inappropriate if the students used linguistic items that did notfit into the interaction of the oral test. In the approach that follows, it isassumed that the students’ uses of you know were considered to be moreappropriate if they were accompanied by instances produced by the inter-viewers in the same interview. A higher proportion of oral tests that onlycontains the students’ use of you know, and thus no interviewers’ use,would be expected to be rated Average or Low rather than High.
The distribution of the tests that contain students’ uses of you know com-pared with the tests where the interviewers used or did not use you know ispresented in Table 12.12. Only the 34 oral tests that contain students’ usesof you know are included in the presentation (cf. Table 12.8.). The three testrating categories High, Average and Low are taken into account.
A majority of the instances of you know emerged in student productionwhen the interviewers did not use you know (65%). The results show thata higher proportion of the instances emerge in production rated High(50%) than Average (21%) when the interviewers also used you know.
Table 12.11. You know by interviewer categories
ST UT NS
High Av Low High Av Low High Av Low
Total instances 7 11 2 17 9 2 6 27 13Normalised figures 0.7 0.9 0.5 1.5 1.2 0.7 0.6 1.7 7.0
Total oral tests 10 13 6 12 8 4 10 16 3
Table 12.12. The introduction of you know by students or by interviewersby test rating categories
High Average Low Total
You know only used by the students 7 (50%) 11 (79%) 4 22 (65%) You know also used by the interviewers 7 (50%) 3 (21%) 2 12 (35%)
Total instances 14 (100%) 14 (100%) 6 34 (100%)
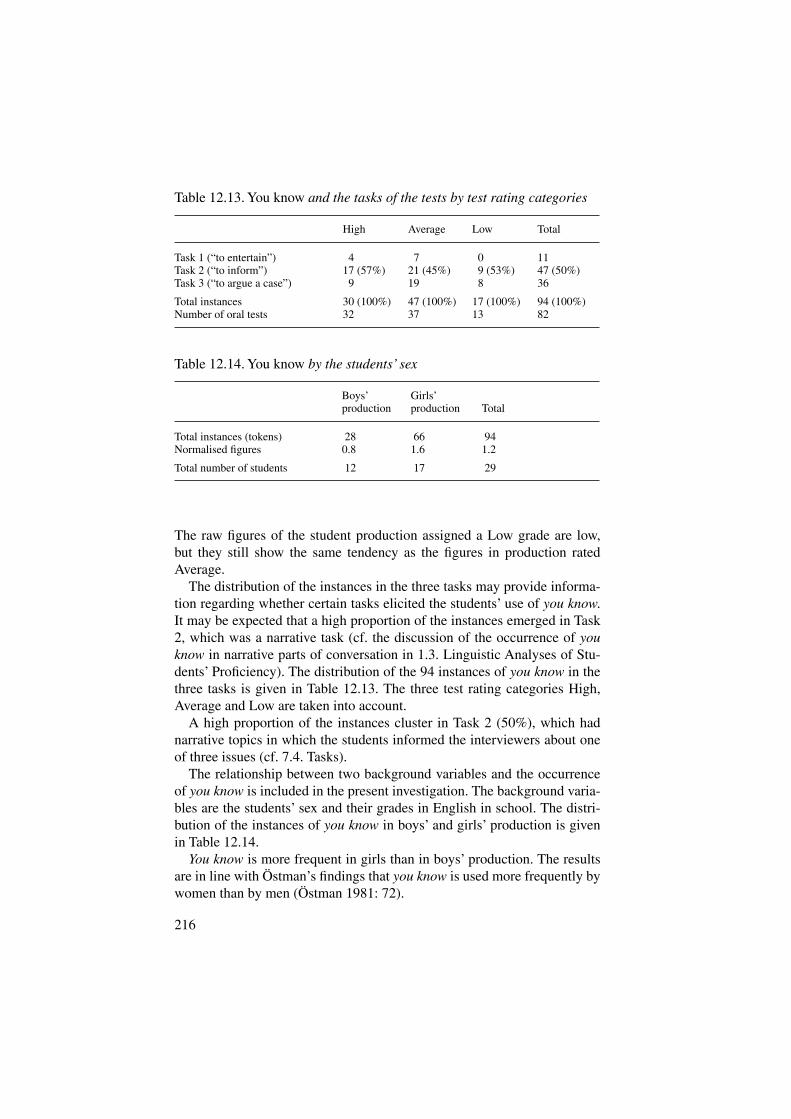
216
The raw figures of the student production assigned a Low grade are low,but they still show the same tendency as the figures in production ratedAverage.
The distribution of the instances in the three tasks may provide informa-tion regarding whether certain tasks elicited the students’ use of you know.It may be expected that a high proportion of the instances emerged in Task2, which was a narrative task (cf. the discussion of the occurrence of youknow in narrative parts of conversation in 1.3. Linguistic Analyses of Stu-dents’ Proficiency). The distribution of the 94 instances of you know in thethree tasks is given in Table 12.13. The three test rating categories High,Average and Low are taken into account.
A high proportion of the instances cluster in Task 2 (50%), which hadnarrative topics in which the students informed the interviewers about oneof three issues (cf. 7.4. Tasks).
The relationship between two background variables and the occurrenceof you know is included in the present investigation. The background varia-bles are the students’ sex and their grades in English in school. The distri-bution of the instances of you know in boys’ and girls’ production is givenin Table 12.14.
You know is more frequent in girls than in boys’ production. The resultsare in line with Östman’s findings that you know is used more frequently bywomen than by men (Östman 1981: 72).
Table 12.13. You know and the tasks of the tests by test rating categories
High Average Low Total
Task 1 (“to entertain”) 4 7 0 11 Task 2 (“to inform”) 17 (57%) 21 (45%) 9 (53%) 47 (50%) Task 3 (“to argue a case”) 9 19 8 36
Total instances 30 (100%) 47 (100%) 17 (100%) 94 (100%)Number of oral tests 32 37 13 82
Table 12.14. You know by the students’ sex
Boys’ production
Girls’ production Total
Total instances (tokens) 28 66 94Normalised figures 0.8 1.6 1.2
Total number of students 12 17 29

217
The figures in Table 12.15. give grounds for the following observation:students with the top grade 5 in English in school tended not to use youknow in the oral proficiency interviews.2
12.2.4. SummaryThis section discussed the occurrence of you know in the student produc-tion. Surveys were provided regarding the distribution across the three testrating categories, occurrences in student production rated by the three inter-viewer categories, and in the three tasks of the tests. Two discoursal factorswere taken into account, namely the discoursal function and the position ofyou know in the utterance. Whether you know was used together with cer-tain other words was also investigated. Furthermore, whether the interview-ers used you know in the tests when the students did so was discussed.Finally, the relationship to two background variables was presented.
The results showed that you know characterised student production ratedAverage and in particular, student production rated Low. The grades as-signed by the three interviewer categories showed different tendencies,however. High frequencies emerged in student production rated Low by theNative Speakers. The grades by the University Teachers showed the oppo-site tendency: high frequencies appeared in student production rated High.
It was not possible to classify a majority of the instances into obviousdiscoursal functions. Some tendencies could be observed in the distributionof the three discoursal functions which were possible to identify, however.Slightly more instances in student production rated Average or Low werefound in contexts of word searching, whereas the instances in student pro-duction rated High tended to cluster in contexts of expressing their ownopinion. What is more, a higher proportion of the instances in productionby students assigned a High grade was in tests in which the interviewersalso used you know.
2 The results cannot be explained by the fact that three of the four students with the topgrade 5 in English at school were boys. The three instances attested spread in different tests.
Table 12.15. You know by school grades in English
School grade 5 4 3 2 Total
Total instances 3 43 31 17 94Normalised figures 0.3 2.0 0.9 1.9 1.2
Total number of students 4 8 14 3 29

218
A majority of the instances appeared in the narrative part of the tests andas for the relation to background variables, two tendencies could be ob-served: the girls were more inclined to use you know than the boys were,and students with the top grade in English in school tended to refrain fromusing you know in their production.

219
CHAPTER 13
Aspects of Pronunciation
13.1. IntonationAs discussed in Chapter 9 (cf. 9.4.1. Intonation), one particular aspect ofintonation will be dealt with in the present study, namely, the students’rising intonation in declarative sentences.
Two issues should be mentioned in connection with the students’ intona-tion. Firstly, instances of rising intonation in declarative sentences occurredwhen the student wanted to have a confirmation by the interviewer of thecorrectness of a structure or a word (cf. 1.3. Linguistic Analyses of Stu-dents’ Proficiency). The following extract from test (H38) illustrates thisphenomenon. Student H had a rising intonation on fence.
(112) Student: …you see you don’t have the eh fenceInterviewer: Fence aroundStudent: around soInterviewer: and no trees
Secondly, the students came from the west coast of Sweden and had aSwedish accent characteristic of that area. A special feature of that accent isrising intonation in declarative sentences.1 The possible influence of theSwedish accent on the students’ intonation in English was not discussed bythe interviewers, however.
13.1.1. Results from the Observations of Students’ IntonationThe production by nine students was selected for an investigation of theirintonation in declarative sentences. The sample contains three oral testsassigned a High grade, three assigned an Average and three a Low grade.
1 Rising intonation in declarative sentences may occur in English in first-language coun-tries. The number of possibly correct intonation patterns in English is quite large (Minugh1991: 66).

220
Both boys’ and girls’ production was represented in this sample. Extracts ofone minute were selected from Task 1 when the students were interviewedand assessed by Native Speakers. The same task with the same category ofinterviewers was chosen since different tasks or topics could have influ-enced the results. The material used in this investigation of the students’intonation thus consists of nine minutes of the students’ spoken production.Apart from myself, the intonation in these extracts was analysed by twopersons: Dr. Pia Norell, senior lecturer at the English Department at Upp-sala University, and Dr. Francis Nolan, senior lecturer at the Department ofLinguistics at Cambridge University. The two researchers consulted wereinstructed to spot instances of “unidiomatic use” of intonation in declarativesentences in the one-minute-long extracts collected, and furthermore, tocomment generally on the students’ intonation. No information was givenabout the Global or Factorial grades assigned to the student performance.
The results of the investigation of the students’ intonation were as fol-lows:
(1) More instances of “unidiomatic use” of intonation, i.e. divergencefrom the falling intonation in declarative sentences, were spotted in studentproduction assigned Average or Low grades than High grades. The formercontains more than twice as many instances as the latter (Student produc-tion graded High 4 instances; student production graded Average 10 in-stances; student production graded Low 12 instances).
(2) Production by five of the six students assigned Average or Lowgrades was given the following comments on unidiomatic rises in utter-ance-final words: “end rises” or “many final rises”. The intonation in stu-dent production assigned a High grade was described as varied and full ofself-confidence whereas the intonation of student production rated Lowwas described as “monotonous, flat or unidiomatic”.
(3) The observations by one of the two experts (Dr. Nolan) were as fol-lows (my paraphrase):
The students’ intonation cannot be described in terms of correct and in-correct uses. Their rising intonation in a number of declarative statements isnot in itself disturbing or divergent from native speakers’ intonation (partic-ularly young speakers). Other features in the students’ pronunciation are ofsignificance to the assessment. These features may be rhythm, stress oreven the length of some types of phonemes before some consonants, suchas the length of the first phoneme pronounced in easy.
13.1.2. SummaryUnidiomatic intonation in declarative sentences was identified in certainstudents’ performance. The frequency of the instances of unidiomatic into-

221
nation tended to tally with the Global grades assigned, i.e. unidiomaticintonation emerged in performance assigned Low or Average grades. Con-sequently, the students’ idiomatic or unidiomatic intonation may, at leastpartly, have been of importance for the assessment of their pronunciationand the Global grades assigned.
Nevertheless, it was evident that other factors than rising intonation indeclarative sentences were important for the overall impression of the stu-dents’ pronunciation. These factors could have been variation in rhythmand stress, or the pronunciation of individual words.
By way of conclusion, further research is needed to analyse the assess-ment of advanced Swedish students’ intonation to see whether other factorsare at work or whether intonation in itself is decisive for the grades as-signed in assessments of oral proficiency.
13.2. Stress: Some Relevant Issues13.2.1. Overall Distribution of Non-standard English Stress:
Sentences and WordsIn this section, the students’ stress on function words as opposed to lexicalwords will first be discussed. Then a closer investigation of their stress ofand so on will be presented.
In order to investigate the students’ stress in the oral proficiency inter-views, their tendency to stress function words in one of the tasks was inves-tigated. In this investigation, the lexical words included nouns, lexicalverbs, adjectives, and adverbs. The function words were articles, auxiliaryverbs, conjunctions, prepositions and pronouns.
The sample included nine extracts of one minute from nine oral tests, allfrom the same task. There were three extracts from student production ratedHigh, three from student production rated Average and three from studentproduction rated Low. The extracts used were the same as the ones used inthe investigation of the students’ intonation (cf. 13.1.1. Results from theObservations of Students’ Intonation).
The method used was purely auditory. The nine extracts were listened toand observations were made of the occurrence of “unidiomatic” stress offunction words by the researcher himself. The results showed that instancesof stressed function words were only traced in student production assignedAverage or Low grades. There were more unidiomatic instances in studentproduction rated Low than Average (seven instances in Low, four instancesin Average). Pronouns and prepositions occurred in a great majority ofthese identified instances of unidiomatic stress.

222
In the second investigation of the students’ stress, the interest was on thestudents’ stress of and so on. First the overall frequencies are providedacross the test rating categories, and then follows the presentation of thestudents’ stress of the instances attested.
Table 13.1. provides a survey of the distribution of the 69 instances ofand so on which emerged in the material. The fact that the instances of andso on spread across the three test rating categories is useful in the investiga-tion of stress; differences in quality may be expected. The figures for stu-dent production rated Low are highly influenced by the occurrence in onestudent’s test, however (ten instances in one student’s test). When these teninstances are left out, the normalised figure for student production ratedLow is 0.9.
The 69 instances were categorised as “idiomatic stress”, “unidiomaticstress” or “indeterminate stress”. Instances of “idiomatic stress” are thosewhere the students’ stress was on so in and so on. When the students tendedto stress on in and so on, and thereby seemed to use the stress of the corre-sponding Swedish expression (Swedish = och så vidare), the instanceswere categorised as “unidiomatic stress”. Instances that could not be classi-fied into these two categories were placed in “indeterminate stress”. Theproportions of the three categories “idiomatic”, “unidiomatic” and “inde-terminate” stress across the three test rating categories High, Average andLow are provided in Table 13.2.
The results show that a great majority of the instances (55 of the total of69, 84%) were pronounced in an “unidiomatic” way. It is evident that most
Table 13.1. And so on by test rating categories
Number of tests per test rating category Grade meansNumber of and so on High Average Low n m s
0 18 (56%) 27 (73%) 7 (54%) 52 (63%) 3.0 1.3 1 5 6 4 15 3.1 0.9 2 3 2 0 5 3.6 0.5 3 4 0 0 4 4.0 0 4 1 1 1 3 3.0 1.0 5 1 1 0 2 3.5 0.710 0 0 1 1 2.0 0
n (oral tests) 32 (100%) 37 (100%) 13 (100%) 82 (100%) r (correlation between Global grades and occur-rences of and so on) = –0.03
n (instances) 32 19 18 69m (instances) 1 0.5 1.4 0.8s (instances) 1.4 1.1 7.9 1.6
Normalised figure 1.0 0.5 2.0 0.9

223
of the students had not adopted an English stress pattern of and so on. Theinstances of “idiomatic stress” cluster in student production assigned aHigh grade. In student production assigned a Low grade, and to a largeextent in production assigned an Average grade, the students pronouncedand so on in an unidiomatic way.
13.2.2. The Occurrence of Non-standard English Stress in Relation to Background Variables
The eleven instances of “idiomatic stress” of and so on occurred in produc-tion by four students. Three of the four students were girls. All four studentshad the top grades four or five in English in school. Although the raw fig-ures of “idiomatic stress” of and so on are admittedly very low, it maynevertheless be observed that “idiomatic stress” was found in production bystudents with a high grade in English at school. Furthermore, most of thesestudents were girls.
13.2.3. SummaryIn this part the students’ stress, firstly in function words and secondly, withfocus on the students’ pronunciation of and so on, was discussed. The threetest rating categories High, Average and Low and the students’ sex andgrades in English at school were taken into account.
The observations of the students’ stress of lexical and function wordsrevealed that instances of “unidiomatic” stress of function words werefound in student production rated Low and Average. No instances weretraced in student production rated High.
The investigation of the students’ pronunciation of and so on showed thata great majority of the instances were pronounced in an “unidiomatic” wayand that almost all the “idiomatic” instances were found in student produc-tion rated High.
Table 13.2. The stress of and so on by test rating categories
High Average Low Total
“Idiomatic stress” 10 (31%) 1 (5%) 0 11 (16%)“Unidiomatic stress” 22 15 18 55 (84%)“Indeterminate stress” 0 3 0 3
Total 32 (100%) 19 (100%) 18 (100%) 69 (100%)Number of oral tests 32 37 13 82

224
13.3. Speech Rate13.3.1. Overall Distribution
A survey of the students’ speech rate in the student production will nowfollow. This survey is provided by means of investigating samples of stu-dent performance and the numbers of “pruned words” occurring during thefirst minute of Task 1. “Pruned words” comprise all words pronounced bythe students, except for self-corrections, repetitions, comments on the nar-rating itself and questions addressed to the interviewers (cf. 9.4.3. Speechrate). The results in Table 13.3. provide the distribution across test ratingcategories, means (m), standard deviations (s) and correlation (r).
The students’ speech rate varied from 42 to 155 words during the firstminute of Task 1. The correlation between the students’ speech rates andthe Global grades assigned is 0.29.
The results show two tendencies. Firstly, the great majority of the stu-dents used 71 to 120 words in the first minute of Task 1 (in 67 of the 82 oraltests, 82%). These tests are evenly spread across the three test rating catego-ries. Secondly, high speech rate is related to High grades and low speechrate is related to Low grades. The students who spoke fast, i.e. used more
Table 13.3. “Pruned words” per minute by test rating categories
Number of tests per test rating category Grade means
“Pruned words” High Average Low n m s
42–40 0 1 0 1 3.0 0 51–60 1 0 0 1 5.0 0 61–70 0 0 3 3 1.7 0.6 71–80 5 5 3 13 3.2 0.8 81–90 2 6 2 10 3.0 0.7 91–100 6 8 1 15 3.4 0.7101–110 4 9 1 14 3.3 0.6111–120 5 7 3 15 3.1 0.7121–130 3 1 0 4 4.3 0.8131–140 2 0 0 2 4.0 0141–150 2 0 0 2 4.0 0151–155 1 0 0 1 4.0 0
n (oral tests) 32 37 13 82 r (correlation between Global grades and speech rate) = 0.29**
m 107 96 88 99
s 23.4 16.9 17.7 20.7

225
than 120 words, were assigned a High grade (one student was assigned anAverage grade). Three of the five students whose speech rate can be la-belled as slow, i.e. between 42 and 70 words, were assigned Low grades.
13.3.2. Speech Rate in Relation to Interviewer Categories and Background Variables
The background and experiences of the interviewers could account for dif-ferences in the Global grades assigned to student production that containssamples of high (i.e. students who used more than 120 words the firstminute) or low speech rate (i.e. students who used fewer than 70 words inthe first minute). For that reason, it is of interest to survey the figures of thestudents’ speech rate in relation to the Global grades assigned by the mem-bers of the three interviewer categories.
Table 13.4. shows high average scores of student production rated Highirrespective of interviewer category. The highest average scores and thehighest individual scores attested are in student production rated High. Thestudents who spoke fast in Task 1 tended to be assigned a High grade irre-spective of interviewer category.
The presentation of the relationship between speech rate and the twobackground variables may provide useful information. The backgroundvariables are the students’ grades in English in school and the students’ sex.Table 13.5. shows the scores of pruned words per minute in comparisonwith the students’ grades in English (grades 1 to 5, 5 being the top grade).
The results show the tendency that students who had high grades in Eng-lish in school spoke faster in the samples than those who had average or lowgrades. The investigation of the second background variable showed thatthere was no relationship between the students’ sex and their speech rate:the average score in the samples of the boys’ production was 101 words,and in the girls’ production the average score was 98 words.
Table 13.4. Average scores of pruned words per minute by interviewercategories
(ST = School Teachers; UT = University Teachers; NS = Native Speakers)
ST UT NS
High Av Low High Av Low High Av Low
Average score 112 97 92 94 91 89 116 99 78Highest score 155 117 116 139 127 111 141 118 86Lowest score 74 76 66 57 42 70 96 71 70
Number of oral tests 10 13 6 12 8 4 10 16 3

226
13.3.3. SummaryIn this section a survey of the students’ speech rate was provided. Themethod used was adopted from a study with German students of English(cf. 1.3. Linguistic Analyses of Students’ Proficiency, and Lennon 1990).
The results showed that students who spoke with a high speech rate(more than 120 words) during the first minute in Task 1 tended to be as-signed High grades. Another tendency could be observed: students who hadlow speech rate in their production were assigned Low grades. This rela-tionship between speech rate and the Global grades assigned was evident inthe assessments by all interviewers, irrespective of interviewer category.
There was a relationship between speech rate and the students’ grades inEnglish in school: students with high grades in English at school spokefaster than the other students did.
Table 13.5. “Pruned words” per minute by school grades in English
Grades 5 4 3 2 Total
Average scores 125 100 94 89 99Highest scores 155 127 139 120 –Lowest scores 91 57 70 42 –
Total number of students 4 8 14 3 29

227
Part 6: Discussion
The purpose of Part 6 is to interpret the results of the project presented inPart 5. In Chapter 14, the findings and observations regarding the gradesassigned will be discussed. In Chapter 15, the students’ linguistic compe-tence as it was demonstrated in the oral tests will be considered.

228

229
CHAPTER 14
Grading Swedish Students’ Oral Proficiency in English
In this chapter the results presented in Chapter 8 (Grades Awarded to theStudents’ Oral Proficiency) are interpreted. Firstly, the students’ Globalgrades are discussed. Secondly, the distribution of the three grades forCommunication and Fluency, Vocabulary and Grammar, and Pronunciationis analysed. Thirdly, the distribution of the grades assigned by the threeinterviewer categories is considered. Then, the assessment of the studentswhose production was assigned different grades by different assessors isdiscussed, and finally, the relationship between the background variablesand the Global grades is expounded.
14.1. Global Performance GradesMost of the students were assigned the Global grades B or C (cf. Table8.1.). The interviewers’ overall impression was thus that the students weregood or very good at speaking English. To a certain extent, the grades con-firm the spontaneous comments the interviewers gave when they filled inthe questionnaires immediately after the testing session: the student per-formance was considered good (cf. Chapter 8). More oral tests were gradedaccording to the rating criteria of the upper than of the lower half of thescale. Using the rating criteria, the distribution of the students’ Globalgrades can be described in the following way: the student performance wasacceptable or very good with minor inaccuracies, and a few students evenshowed fluent and overall correct use of English. Some students’ perform-ance was often inaccurate or inappropriate but hardly any could be de-scribed as poor in many respects.
A great majority of the students were assigned different Global gradesfor their production in the three oral tests assessed by the three assessors(cf. Table 8.8.). Since the assessments of their performance were carried outby very qualified interviewers (cf. 7.3. Interviewers), this finding is notable
230
and of great interest. The fact that four students were assigned three differ-ent Global grades on the five-step scale for their production and that 17 ofthe 29 students were assigned two different Global grades indicates howdifficult it is to assess students’ oral performance in a reliable way when theassessors use a carefully worked out set of rating criteria (cf. Table 8.9.).The grades assigned by the three interviewer categories show no differ-ences in this respect.
Several factors may explain these findings, such as the interviewers’ dif-ferent interpretation of the rating criteria or the influence of certain linguis-tic factors on the assessment of the student production in the three tests.The results also show that the length of the performance and the order inwhich the oral proficiency interviews were carried out, at least for some ofthe students, may explain the grades assigned. However, it is obvious thatthe interviewers of the Gothenburg project assessed the students’ oral profi-ciency very differently and therefore gave the students remarkably differentgrades for their performance on the same day. The differences in the gradesawarded will be discussed at some length as regards the interviewer catego-ries (14.3. Interviewer Categories) and the grades assigned to the individualstudent’s production (14.4. Individual Student’s Grades). But even at thisstage, it is evident that measures need to be taken, for instance in the formof teacher in-service training, to achieve acceptable reliability in gradingstudents’ oral performance (see Reflections).
Eight of the 29 students were assigned the same Global grade by theirassessors for their production in their three tests. These students’ perform-ance was in the middle or near the upper half of the scale. This could beinterpreted in two ways. The first interpretation is that the students whoseproficiency in English could be characterised as being of average or me-dium standard or just above are more easily graded in a reliable way thanother students. Their performance contains characteristics which the inter-viewers could match with the rating criteria “Very good production withminor inaccuracies” or “Acceptable language in spite of errors”. Anotherinterpretation is that the students were assigned the same grades becausethe interviewers had a tendency to go for the grades of the middle of thegrading scale (cf. 5.3. Sources of Variation). The interviewers tended to usethe grades which were in the centre of the scale even though the studentperformance might have been closer to the rating criteria of other grades. Itis not unreasonable to believe that both these explanations were of signifi-cance when all three interviewers gave the same grade.

231
14.2. Factorial GradesThe results of the three Factorial grades showed the same tendency as didthe Global grades: many students were assigned different grades in thethree assessments of the three tests. This would imply that even when theinterviewers used the rating criteria of one particular aspect of the studentperformance, such as Grammar and Vocabulary, it could nevertheless bedifficult for them to grade student production in a reliable way.
When the students were assigned the same grades for Communicationand Fluency, or Grammar and Vocabulary by the three assessors, they weregraded in the middle or just above the middle of the rating scale. (Eightstudents were assigned the same grade for Communication and Fluency,seven students were assigned the same grade for Grammar and Vocabulary,and eight students were assigned the same grade for Pronunciation, cf. Ta-ble 8.8.). This tendency is in line with the results obtained for the Globalgrades. When identical grades were given for Pronunciation, the studentproduction was graded in the middle of the scale (grade C/3).
When the Factorial grades are studied, it can be noticed that the students’strength lies in Communication and Fluency, and their weakness in Gram-mar and Vocabulary. Generally, the students were thus good at communi-cating what they wanted to say, but lacked vocabulary and made grammati-cal mistakes; some of the students even made basic errors, as the linguisticanalyses of the material show. The grades assigned for Pronunciation showthat the interviewers tended to find it difficult to make clear distinctionsbetween different students’ pronunciation and thus went for the grades inthe middle of the scale. One interpretation is that the students’ pronuncia-tion was of a similar kind and that the Swedish school-leavers who partici-pated in the Gothenburg project had all acquired good pronunciation butstill with certain typically Swedish features which made the interviewersassign grades of the middle of the scale. Another interpretation could bethat they came from the same region in Sweden (the Gothenburg area) andtherefore were influenced by the same kind of interference from theirSwedish accent. On the whole, it seems that the students were regarded tohave acceptable intonation and rhythm, although their pronunciationshowed evident traces of their Swedish accent.
As stated above, most students tended to be given different grades fortheir production in the three tests. The differences in the students’ Factorialgrades were as follows. For Communication and Fluency, 5 students wereassigned three different grades, and 16 students were assigned two differentgrades. For the second Factorial grade, Grammar and Vocabulary, 3 stu-dents were assigned three different grades, and 19 students were assignedtwo different grades. Finally, for Pronunciation, 6 students were assigned

232
three different grades, and 15 students were assigned two different grades(cf. Table 8.9.) Some tendencies in these differences in grades assignedcould be identified. The degree of divergence attested in the individual stu-dent’s three tests suggests that the interviewers differed to a greater extentin their opinion of the students’ skills in Communication and Fluency, aswell as in Pronunciation than of the resources the students had in Grammarand Vocabulary. The results give grounds for two interpretations. Firstly, itmay be easier to assess students’ command of grammar and vocabularythan their pronunciation or their skill to communicate with fluency accord-ing to the descriptions in the rating criteria. This would imply that pronun-ciation, and communication and fluency are more difficult to assess reliablywith a set of rating criteria than the students’ mastery of vocabulary andgrammar. It may be easy to identify non-standard English verb forms orinappropriate uses of vocabulary but more demanding to decide on a gradefor unidiomatic intonation or the lack of fluency in speech, in particularwhen the interviewers are requested to do so while the conversation is go-ing on or shortly after it. Secondly, the individual student’s grammaticalaccuracy and use of vocabulary may be of a similar kind in his/her threetests, and this skill is thus assigned similar grades by the three interviewers,but the student’s ways of communicating and showing fluency may depend,for instance, on the interlocutor or on the task. This would explain why thegrades assigned to Communication and Fluency are different in the stu-dent’s three tests. The differences in the grades assigned to Pronunciationmight also be due to real differences in the performance in the individualstudent’s three tests with the three different interviewers.
By and large, on the basis of the results of the Gothenburg project, thefirst interpretation, i.e. that vocabulary and grammar are more easily as-sessed than communication and fluency, and pronunciation, seems themost likely.
14.3. Interviewer CategoriesWhen the grades assigned by the members of the three interviewer catego-ries are compared, three tendencies may be identified: relatively highergrades were given by the Native Speakers, relatively lower grades weregiven by the School Teachers, and regarding the grades for Pronunciation,the Native Speakers tended to assign the grades in the middle of the scale tothe student production.
The grades awarded show that the Native Speakers generally had a some-what more positive view of the students’ performance. The reasons for thismay be that the Native Speakers interpreted the rating criteria so that higher

233
grades more often seemed to match the students’ performance. Highergrades can be observed, in particular, for Communication and Fluency.When all three interviewers gave different grades to a student, the NativeSpeaker tended to be the one who assigned the highest grade. Another inter-pretation is that the Native Speakers focused on “good” aspects in the stu-dents’ performance such as the ability “to communicate and be fluent” andnot on their lack of vocabulary or the occurrence of grammatical errors. Inthis way, the student production was given higher grades by the NativeSpeakers than by the other interviewers.
The School Teachers gave lower grades than did the other two inter-viewer categories. The School Teachers had the lowest means in their Glo-bal grades, in their grades for Communication and Fluency, and in theirgrades for Grammar and Vocabulary. When there was one deviant gradegiven to a student’s production, the tendency was that the School Teacherhad assigned the low grade. This might be due to the possibility that theSchool Teachers observed errors in the students’ uses of structures and vo-cabulary and paid attention to (and let this influence the grades they gave)grammatical errors since they recognised them from teaching situations atschool. This finding is in line with the discussion in Ellis (1994) (cf. 2.3.Reliability). It implies that the School Teachers tended to focus more onaccuracy than on fluency, and thereby the students’ weaknesses influencedtheir Global grades. Thus the School Teachers’ low grades for Grammarand Vocabulary influenced their Global grades and their grades for Commu-nication and Fluency (cf. the halo-effect in 5.3. Sources of Variation). TheSchool Teachers’ and the Native Speakers’ grades for Grammar and Vocab-ulary tended to correlate more with the Global grades assigned than did theother two Factorial grades. This tendency was not strong but is neverthelessof interest (cf. the correlations in Tables 8.7.).
The Native Speakers gave the same grades to many students’ pronuncia-tion. This could mean that the students showed less variation in their mas-tery of English pronunciation than, for instance, in their grammatical accu-racy. The three Native Speakers thus noticed little diversity in the Swedishstudents’ pronunciation of English: the students’ pronunciation, intonationand stress patterns showed interference from Swedish, and perhaps fromthe Gothenburg area, in particular, which made the interviewers assign sim-ilar grades to their production. The fact that the grades for Pronunciationtended to vary very little especially when assigned by the Native Speakersgives support to this interpretation. This was the most evident tendencyamong the interviewers to assign grades in the middle of the rating scalewithout noticing differences among the students.
On the whole, regarding the interviewer categories, the results show thatthe Native Speakers both were more appreciated as interviewers by the

234
students (cf. 8.9. Students’ Opinions about the Test), and to a certain extent,assessed the students differently than did the other interviewers in all re-spects except accuracy. The Native Speakers seemed to be more sensitive topronunciation (and perhaps also better judges of that factor) and to thestudents’ vocabulary, and indifferent, or even negative, to the students’ useof the two discourse markers (well and you know). Furthermore, it may beassumed that speaking to a native speaker brings out the best in a non-native speaker because of the authentic feed-back.
Individual Interviewers
School Teacher 2 was the interviewer who assigned the lowest grades. Thismay be because he, more than the other interviewers, focused on grammat-ical and lexical accuracy and inaccuracy and thereby assigned low grades tothe student production.
Native Speaker 2 was the interviewer who assigned the highest numberof identical grades to the student production when the grades are comparedwith the grades assigned by the other interviewers to the same student (cf.8.5. Comparative Discussion of the Four Grades Given). This interviewerwas a very experienced assessor of English, who had worked as an exam-iner for the Cambridge exams in Sweden for many years. It may be as-sumed that her background and skills contributed to grades that could bedescribed as fair and reliable because of the fact that many of the studentswhich she assessed were given the same grades for their production by thetwo other interviewers.
School Teacher 3 also gave the same Global grades and grades forGrammar and Vocabulary as did the other interviewers of the same students(cf. 8.5.). The fact that this interviewer knew seven of the ten students sheinterviewed from school may have contributed to grades that could be de-scribed as more reliable than most of the other ones; before the oral profi-ciency interviews started, this interviewer was aware of seven students’ reallevel of oral proficiency.1
14.4. Individual Students’ GradesAs described in Chapter 8, twelve students were assigned different grades(Global and/or Factorial grades, or both) for their production in the threeoral proficiency interviews. These individual students’ performance pro-vides a valuable source for further analyses. In what follows, the grades andthe performance of these students are discussed. The twelve students were
1 School Teacher 3 answered “yes” to the question “Do you know the candidate?” regardingseven of the ten students she interviewed.
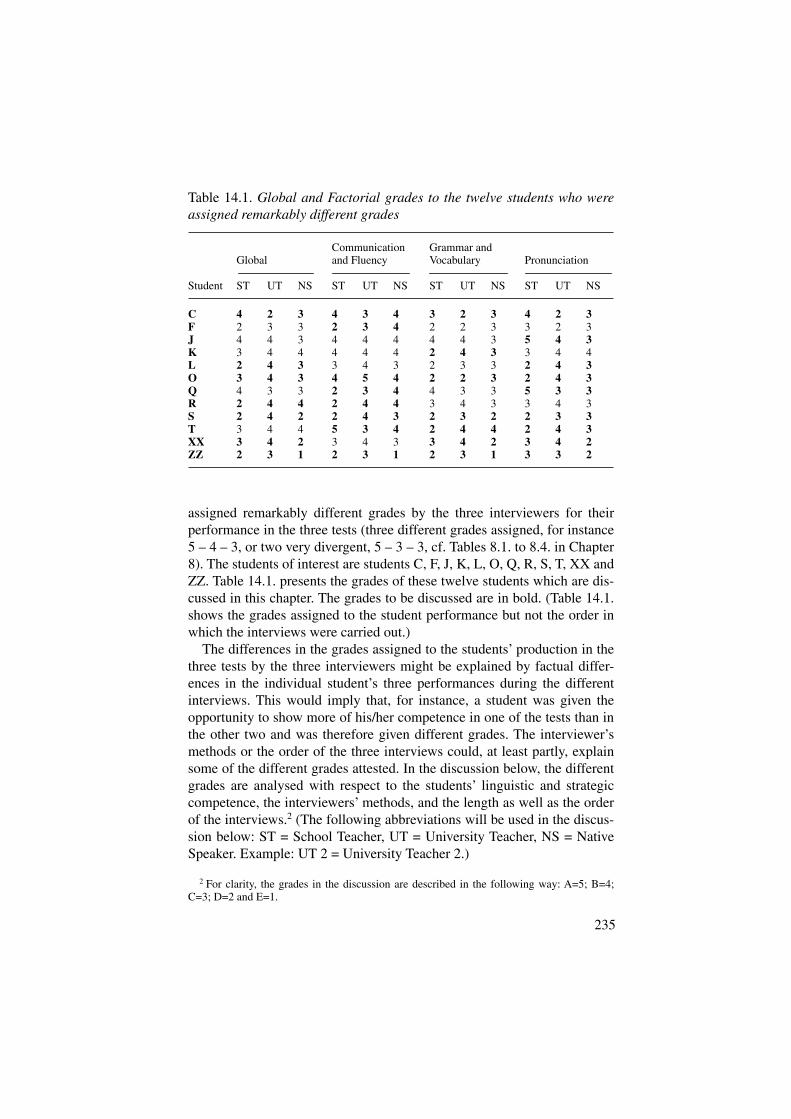
235
assigned remarkably different grades by the three interviewers for theirperformance in the three tests (three different grades assigned, for instance5 – 4 – 3, or two very divergent, 5 – 3 – 3, cf. Tables 8.1. to 8.4. in Chapter8). The students of interest are students C, F, J, K, L, O, Q, R, S, T, XX andZZ. Table 14.1. presents the grades of these twelve students which are dis-cussed in this chapter. The grades to be discussed are in bold. (Table 14.1.shows the grades assigned to the student performance but not the order inwhich the interviews were carried out.)
The differences in the grades assigned to the students’ production in thethree tests by the three interviewers might be explained by factual differ-ences in the individual student’s three performances during the differentinterviews. This would imply that, for instance, a student was given theopportunity to show more of his/her competence in one of the tests than inthe other two and was therefore given different grades. The interviewer’smethods or the order of the three interviews could, at least partly, explainsome of the different grades attested. In the discussion below, the differentgrades are analysed with respect to the students’ linguistic and strategiccompetence, the interviewers’ methods, and the length as well as the orderof the interviews.2 (The following abbreviations will be used in the discus-sion below: ST = School Teacher, UT = University Teacher, NS = NativeSpeaker. Example: UT 2 = University Teacher 2.)
2 For clarity, the grades in the discussion are described in the following way: A=5; B=4;C=3; D=2 and E=1.
Table 14.1. Global and Factorial grades to the twelve students who wereassigned remarkably different grades
GlobalCommunication and Fluency
Grammar and Vocabulary Pronunciation
Student ST UT NS ST UT NS ST UT NS ST UT NS
C 4 2 3 4 3 4 3 2 3 4 2 3F 2 3 3 2 3 4 2 2 3 3 2 3J 4 4 3 4 4 4 4 4 3 5 4 3K 3 4 4 4 4 4 2 4 3 3 4 4L 2 4 3 3 4 3 2 3 3 2 4 3O 3 4 3 4 5 4 2 2 3 2 4 3Q 4 3 3 2 3 4 4 3 3 5 3 3R 2 4 4 2 4 4 3 4 3 3 4 3S 2 4 2 2 4 3 2 3 2 2 3 3T 3 4 4 5 3 4 2 4 4 2 4 3XX 3 4 2 3 4 3 3 4 2 3 4 2ZZ 2 3 1 2 3 1 2 3 1 3 3 2

236
Student C
Student C was assigned three different Global grades: 4 by ST 1, 2 by UT3, and 3 by NS 2. The three grades for Pronunciation differ in the sameway. Student C had his first interview with UT 3 and said in the interviewthat he was very nervous. His state of mind may have influenced his per-formance and resulted in his low grade. In the interview with NS 2, hespoke at length. This interview has the most student words in comparisonwith all other tests (2,010 words; the average: 948 words/interview). Oneinterpretation that seems reasonable is that the communication worked welltogether with NS 2 and the student was given the opportunity to expresshimself freely. The student’s strength seems to lie in communication andfluency but not in accuracy. Two interviewers (UT 3 and NS 2) gave him thehighest grades for Communication and Fluency in relation to the Globalgrades and the two other grades assigned by them. When the student wasgiven the opportunity to speak at length, this may have influenced thegrades. By way of conclusion, the order in which the interviews were madeand the fact that one interviewer elicited student performance in amplequantities seem to account for the different grades assigned.
Student F
Student F was assigned three different grades for Communication and Flu-ency: 2 by ST 1, 3 by UT 3, and 4 by NS 3. One explanatory factor, as wasthe case with student C, could be the order in which the interviews weredone. The lowest grade was assigned to the first interview, the highest to thelast interview. Student F may have felt more self-confident in the last thanin the first interview of the day. The length of the interviews and the numberof words provide evidence of this hypothesis (560 student words in the firstproduction, 1,060 and 1,010 student words in the second and third produc-tion; nine minutes in the first production, approximately 12 and 13 minutesin the second and third production).
Student J
Student J was assigned three different grades for Pronunciation: 5 by ST 1,4 by UT 1, and 3 by NS 3. The other grades do not show similar differences.Again, the explanatory factor can be the order in which the interviews weremade. The lowest grade was assigned by NS 3 in the student’s first produc-tion, and the highest grade by ST 1 in the student’s last production. Further-more, student J spoke more in the last production compared with the othertwo (1,100 student words compared with 780 and 860 student words). Herspeech rate is slower than that of many other students, and her performancecontains few grammatical errors and many instances of the discourse mark-ers well. The three different grades assigned could also be evidence of the

237
three interviewers’ different impression of the student’s pronunciation.Low speech rate together with other aspects of pronunciation, such asrhythm and stress (which the Native Speakers were more sensitive to intheir assessment), could have been decisive factors for the different gradesassigned. It may be concluded that the order of the interviews, the fact thatthe student was not very talkative and spoke slowly in her first production,and the interviewers’ different impression of the student’s pronunciationseem to explain the different grades awarded.
Student K
Student K was assigned three different grades for Grammar and Vocabu-lary: 2 by ST 2, 4 by UT 2 and 3 by NS 1. Again, the order in which theinterviews were carried out shows the same pattern: the lowest grade wasassigned to the student’s first production and the highest grade was as-signed to the student’s last production. The production assessed by UT 2cannot be taken into account since it was not recorded, so only the student’stests graded 2 and 3 can be compared.3 The production graded 2 contains asignificantly higher proportion of non-standard English instances of thethird person singular marker. This may have influenced the SchoolTeacher’s lower grade (15 non-standard English instances / 7 standard Eng-lish instances compared with 7 / 6). The production graded 3 generallycomprises more speech and contains more student words than the produc-tion graded 2 (1,165 student words and eleven minutes compared with 970student words and approximately ten minutes). The production also con-tains few abstract nouns in comparison with other student production. Thiswould imply that the student did not discuss abstract or controversial issuesvery much, in particular in task 3. The factors explaining the differentgrades seem to be the order of the interviews, a somewhat hesitant perform-ance and the use of non-standard English verb forms in one of the tests.
Student L
Student L was assigned three different grades for the Global evaluation andfor Pronunciation. The grades, both Global and for Pronunciation, were asfollows: 2 by ST 2, 4 by UT 3 and 3 by NS 2. The lowest grade wasassigned to the first production and the highest grade to the second produc-tion. The lengths of the interviews are from approximately ten to thirteenminutes. The shortest interview was assigned the lowest grade. The stu-dent’s performance can generally be described as hesitant, in particularwhen she is interviewed by UT 3 (although the highest grade was assignedin this interview). This student’s production contains few student words
3 The interview assessed by UT 2 was one of the five interviews which were not recordeddue to technical problems (cf. 7.1.).

238
(690). Fillers such as I think so and or something tend to occur in herperformance as well as the discourse marker you know. The student’s use offillers and you know may have had different effects on the three interview-ers. When she was interviewed by NS 2, she tended to speak faster. Theimpression is that she had the courage to say more in the last productionassessed by NS 2. It seems that the explanation of the different grades canbe found, at least partly, in the order of the interviews. Furthermore, thestudent’s hesitant delivery and use of certain hesitation devices could haveinfluenced the interviewers differently, both regarding the Global evalua-tion and the grades for Pronunciation.
Student O
Student O was assigned three different grades for Pronunciation: 2 by ST 2,4 by UT 3, and 3 by NS 3. The three interviewers did not assign the samegrade (the Global or the two remaining Factorial grades) to his production.Higher grades were given for Communication and Fluency than for Gram-mar and Vocabulary or Pronunciation by all three interviewers. The lowestgrade for Pronunciation was given in the first interview (ST 2), the highestgrade in the last interview (UT 3). This interview (assessed by UT 3) is alsothe longest (approximately 16 minutes) and contains the most studentwords (1,330). No great differences in linguistic features can be traced inhis production in the three tests. Evidently the student had his strength incommunication and fluency in the interviews. It seems that the length of theproduction and the order of the interviews explain the different grades.
Student Q
Student Q was assigned three different grades for Communication and Flu-ency, and two, but one grade apart, for Pronunciation. The grades for Com-munication and Fluency were as follows: 2 by ST 2, 3 by UT 2 and 4 by NS2. The student’s grades for Pronunciation were the following: 5 by ST 2,and 3 by UT 2 and NS 2. Student Q was the only student who was giventwo different grades but two steps separated for Pronunciation (cf. Table8.4.). It is worth observing the different grades assigned by School Teacher1: 2 for Communication and Fluency, 5 for Pronunciation. Student Q is theonly one out of the 29 participating students who had American pronuncia-tion. His pronunciation is discussed in one of his oral tests:
“I asked you about this partly because when you came, when you started talking, Iof course at once spotted your American accent because you have an Americanaccent.” (University Teacher 2)
One possible explanation to this student’s different grades for Pronuncia-tion could be the interviewers’ different impressions of the student’s Amer-

239
ican pronunciation. The rating criteria of the grades assigned indicate thatST 2 considered that the student had good intonation and rhythm (grade 5)whereas the other two interviewers thought there was an evident Swedishaccent in his performance (grade 3). The student’s American pronunciationmay have caused the different grades. Furthermore, Student Q frequentlyused various expressions to give him time to plan his speech, such as I don’treally know and I mean. One possible explanation is that his obvious Amer-ican pronunciation together with his frequent use of certain expressionsmay have had different effects on the interviewers. His production mayhave been interpreted as being of poor quality and perhaps somewhat toocolloquial, and that he had difficulties in expressing what he wanted to say,particularly when assessed by the School Teacher. The different impres-sions of his production led to the different grades both for Communicationand Fluency, and Pronunciation
Student R
Student R was assigned two different grades (one grade level apart) for theGlobal evaluation and for Communication and Fluency: 2 by ST 1, and 4 byUT 1 and NS 1. The high grades were given to the performance of the firstand last oral tests. The tests are of similar lengths (between ten and elevenminutes long), but contain fewer student words than did other oral tests(790, 680 and 640 student words). She has a speech rate during the firstminute of the tests which is close to the average. The differences in thegrades assigned cannot be explained in terms of standard English or non-standard English instances. The performance could be described as carefuland hesitant with few discourse markers and no meta-talk. No obviousexplanation can be found of the School Teacher’s low grade. The SchoolTeacher did not know her from school. In the comment on the ratings as-signed added on the Oral Mark Sheet, the School Teacher discusses the factthat the student has very little to say about the topics of the tasks. Onepossible explanation to the different grades assigned to this student couldbe this student’s limited contributions in the interviews. Her production wasvery short and therefore the interviewers had different views about her levelof proficiency.
Student S
Student S was assigned two different Global grades but two grade levelsapart: 4 by UT 1, and 2 by ST 2 and NS 2. Three different grades weregiven for Communication and Fluency: 4, 3 and 2. The high Global gradewas given in the first interview. The production contains few student words(620, 730 and 620 student words) and the tests which were assessed by ST2 and UT 1 is shorter than the one assessed by NS 2 (the former approxi-

240
mately nine minutes long, the latter more than twelve minutes long). Thestudent had a very good start with UT 1. She spoke fast during the firstminute of that production. Her speech rate could have influenced the overallimpression and the high grade assigned. Differences in grades could thus beexplained by the successful performance in one of the tests and the fact thatthe grades were based on short student production.
Student T
Student T was assigned three different grades for Communication and Flu-ency: 5 by ST 2, 3 by UT 2 and 4 by NS 3. The highest grade was given inthe last production. For Pronunciation he was also given three differentgrades: 2 by the ST 2, 4 by the UT 2 and 3 by the NS 3. ST 2 also gave alower grade for Grammar and Vocabulary (grade 2) than did the other twointerviewers (grade 4). We may observe the great difference in grades as-signed by ST 2 (the grades 5 and 2). The other two interviewers gave thisstudent the grades 4 or 3. The student’s performance is long and containsmany student words (between 12 and 15 minutes long, and between 1,100and 1,400 student words). Evidently the student had no difficulty communi-cating, but his performance was interpreted differently with regard to therating criteria. The student’s performance contains many instances of meta-talk. The following phrases from his performance are given for illustration:as I told you, as I said, how to say it, I don’t know the English word, I don’tknow what it’s called in English, I’m going to start to describe …, I’mgoing to talk about…, so to say, that’s what you can say about …, the wordis …, you can say
The student’s performance was commented on by the interviewers asfollows:
“Eleven har talets gåva men språket och uttalet har många brister”. (= The studenthas the gift of the gab but his language and his pronunciation have many deficien-cies.) (School Teacher 2)
“Somewhat stiff” (University Teacher 2)“…he used body language to suggest effectively ‘We shouldn’t just sit back witharms folded …’” (Native Speaker 3)
The student’s pronunciation of and so on is unidiomatic (four instancesin the production assessed by the School Teacher, and two instances in theproduction assessed by the University Teacher). It seems that the order ofthe interviews and possible interference from Swedish (his production con-tains several examples of lexical and grammatical inaccuracies) led to thedifferent grades assigned. The student was good at fluency, but his pronun-ciation and choice of vocabulary showed interference from Swedish. Evi-dence of this interference may be observed in high frequencies of the lexi-

241
cal errors investigated. A few non-standard English instances emerged to-gether with many standard English ones of the third person singular markerand the progressive. It seems that ST 2 thought that these lexical errorstogether with certain grammatical errors were disturbing features in hisproduction, whereas the two other interviewers did not think so. The inter-ference from Swedish in his production may also have contributed to theinterviewers’ different grades for Pronunciation.
Student XX
Student XX was assigned three different grades for the Global evaluation,for Grammar and Vocabulary, and for Pronunciation: 3 was given by ST 3,4 by UT 3 and 2 by NS 3. Each interviewer thus assigned the same grade forthe Global evaluation, for Grammar and Vocabulary, and for Pronunciation(cf. Table 14.1.). The lowest grades were given for the first production (NS3) and the highest grades for the student’s last production (UT 3). The oralproficiency interviews are of the same length but the student spoke remark-ably more in the interview assessed by School Teacher 3 (930 student wordsin comparison with 670 and 570 words). One explanation could be that ST3 knew Student XX before they met in the interview; the student felt moreself-confident together with an interviewer from her own school (cf. 14.3.Interviewer Categories). There are many instances of you know in her per-formance, which may have had different effects on the interviewers’ grades(cf. 12.2. You know…). The order of the interviews may also have influencedthe student’s performance and thereby the different grades assigned.
Student ZZ
Student ZZ was assigned three different grades for the Global evaluation,Communication and Fluency, and Grammar and Vocabulary: 2 by ST 3, 3by UT 2 and 1 by NS 3. Each interviewer consistently assigned the samegrade for the Global evaluation, the two factorial ratings Communicationand Fluency, and Grammar and Vocabulary. The lowest grade was given tothe first production (NS 3) and the highest grade to the last production (UT2). The production assessed by UT 2 is almost twice as long as the produc-tion of the other two tests (i.e. more than 20 minutes long). This interviewerseems to have liked the conversation (the interviewer laughs several times),and even though the student’s production is by far the longest one, there arenot more than 1,060 student words. This is due to the fact that the studentdid not speak very much. In the production assessed by the Native Speaker,the student had certain difficulties expressing what he wanted to say. Thisinterview is the only one in which the interviewer interrupts the test afterTask 2, and throughout the interview the interviewer asks the student manyquestions, which the student answers very briefly. Student ZZ has overall

242
low figures for speech rate, grammatical correctness and range of vocabu-lary (for instance, abstract nouns). His production contains high frequen-cies of the lexical errors investigated and generally a higher proportion ofnon-standard English than standard English instances of the third personsingular marker and the progressive. Student ZZ was generally assignedlow grades for his production. No other production in the material wasgiven grade 1 (assigned by the Native Speaker). His production containsmany examples of incorrect and unidiomatic use of English. Obviously theNative Speaker, for some reasons, assessed these errors to be more seriousfor the overall impression of his performance than did the other two inter-viewers. Perhaps the order of the interviews, one interviewer’s technique,the student’s lack of initiative in one interview, and different views on theseriousness of lexical and grammatical errors may have contributed to thedifferent grades.
14.5. Results in Relation to Background VariablesAs already accounted for, the material of the Gothenburg project providedinformation regarding background variables, namely, the students’ sex, age,school grades in English and results from the National Test of English. Thecomparison between the grades assigned and these parameters showed thatthe top Global grade 5 were more often given to girls than to boys (cf. Table8.10.). However, there is no similar tendency between the other Globalgrades assigned (4, 3, 2 and 1) and the students’ sex. This indicates thatthere were more very proficient girls than boys who participated in theGothenburg project. Age did not seem to be of importance for a higher orlower Global grade (cf. Table 8.11.).
The relationship between the students’ school grades in English given atthe end of the autumn term before the study was made and the gradesassigned to their production was of interest in many respects. The Globalgrades assigned to the production of students who had the two top schoolgrades (i.e. 4 or 5) did not show any major differences, proportionallyspeaking. Consequently, the performance of students who had the top grade5 was not assigned remarkably higher grades than the performance of thosewho had grade 4 at school. This may be an indication that the teachers – ofcourse – had taken other factors into consideration when they gave thesestudents their school grades in English. These factors were, for instance,reading, writing, and the adequate use of grammar and vocabulary in writ-ing. Nor did the grades of the production of students who had the lowschool grade 2 differ, proportionally speaking, from the grades assigned tothe production of the students who had the average school grade 3. This

243
may perhaps indicate that low-achievers have their strength in oral profi-ciency but difficulties with other skills, such as writing or reading (cf. Table8.13.).
The comparison between the grades assigned and the students’ results inthe National Test of English given a little more than a year prior to the oralproficiency testing day supports the finding described above; students whohad low or fairly low grades on the National Test tended to do so well in theoral tests of the Gothenburg project that they were given higher grades forthese achievements (cf. Table 8.14.). This could be interpreted in the fol-lowing way: low-achievers are fairly good at communication in oral inter-views but often have difficulties with reading or writing. The students’ re-sults in the National Tests indicated that these students were rather weakand had obvious gaps in other skills needed to master the English lan-guage, whereas in the oral test of the Gothenburg project they were giventhe opportunity to show oral skills, something which was not included inthe National Test of 1992. These oral skills are aspects of interaction andcommunication which the students are not given the chance to show theircommand of in tests other than those similar to the ones used in the Gothen-burg project.
14.6. Concluding RemarksAs a whole, the interviewers assigned generally positive (i.e. on the upperhalf of the rating scale), but quite often differing grades to the students whotook part in the Gothenburg project. The students were often assigned dif-ferent grades for the Global evaluation of their three oral tests. This ten-dency could also be observed in the three separate grades awarded to Com-munication and Fluency, Grammar and Vocabulary, and Pronunciation.
The interviewers seem to have appreciated the students’ ability to com-municate and be fluent but, at least in the case of some of the students, alsowere influenced by their lack of vocabulary and the occurrence of grammat-ical errors in their performance. Many students were considered to haveacceptable intonation and rhythm, but still an evident Swedish accent. Allthree interviewers gave the same grades particularly when students wereawarded grades in the middle of the scale. The grades in the middle of thescale were also given to many students for their pronunciation, in particularwhen the performance was assessed by Native Speakers.
As regards the interviewer categories, the Native Speakers assignedhigher grades to the student production than did the other interviewers,while on an average the School Teachers assigned the lowest grades.
Differences in grades assigned within the interviewer categories could be

244
observed. The individual interviewer’s grades of the individual student’sperformance were of interest and the individual students’ production in thethree oral tests which were assigned highly different grades was worthwhileanalysing. These analyses form the basis of the following four suggestedinterpretations of the differences observed in the grades assigned.
– The order in which the interviews were done seems to have influencedthe student performance and thus the grades assigned so that it, in mostcases (but not all), became better and better.
– Student production which contained few words, due to factors such asstudents’ hesitant delivery and slow speech, seem to have been difficultfor the interviewers to match with the rating criteria.
– The students’ uses of various fillers seem to have worked in differentdirections, i.e. influenced the assessment – and thus also the grades as-signed – both some positively and some negatively.
– Whether the communication between the interviewer and the studentworked well or not may have influenced the grades awarded. In otherwords, the method used by the interviewer to make the student feel con-fident might be of importance for the grading.
The comparison between the students’ school results (school grades andresults in the National Test of English) and the grades awarded in the oraltest showed that it was obvious that oral proficiency interviews give valua-ble additional information on the students’ communicative skills, skillswhich were not tested in the National Test of English in 1992. This wasparticularly noticeable for students with low grades in the National Test.

245
CHAPTER 15
Swedish Students’ Oral Proficiency in English
In this chapter, the results presented in Chapters 9 to 13 will be interpretedregarding the students’ use of certain linguistic features. The linguistic fea-tures were selected to cover four aspects of student production, namelymorphology and syntax, vocabulary, discourse phenomena and aspects ofpronunciation (cf. 6.2. Linguistic Features). The present chapter is struc-tured with regard to these four aspects. Firstly, the students’ use of theverbal group will be discussed (the third person singular marker and theprogressive). Secondly, certain aspects of the students’ vocabulary will beconsidered (abstract nouns, modifiers of adjectives, lexical errors and com-pensatory strategies). Thirdly, the occurrence of two discourse markers inthe student production will be commented on (well and you know).Fourthly, the results from the investigations of the students’ pronunciationwill be elaborated on (intonation, stress and speech rate). Finally, the inter-ference from Swedish in student production will be discussed.
15.1. Verbal GroupIn this section the students’ mastery of the verbal group in English will bediscussed, first regarding their use of the third person singular marker andthen considering their use of the progressive.
The Third Person Singular Marker
The third person singular marker occurred frequently in all student produc-tion. The classification into standard English and non-standard English in-stances in relation to the grades assigned showed that it was a matter ofproportions: higher proportions of standard English instances in studentproduction yielded a higher grade (cf. Table 10.1. and 10.2.). A high pro-portion of non-standard English instances led to low grades whereas singlenon-standard English instances were not of major significance for the

246
grades assigned. The most common type of the non-standard English in-stances was Type 1 (*he take) (cf. Table 10.3., and the discussion of theredundancy of the third person singular marker in 1.3. Linguistic Analysesof Students’ Proficiency). The type of subject did not seem to account forthe distribution of the non-standard English instances in the production ofthe three test rating categories (cf. Table 10.4.). The analysis of verbs end-ing in sibilants showed that sibilant-final verbs were one of the explanationsof the students’ non-standard English uses of the third person singularmarker irrespective of test rating category (cf. Table 10.5.).
As for interviewer categories, assessors who were native speakers weremore tolerant towards non-standard English instances than other assessorsin a testing situation (cf. Table 10.6.). However, there were only thirteenoral tests assigned a Low grade altogether, and therefore only tendenciescan be observed and reliable conclusions are difficult to draw. Nonetheless,this finding could be accounted for by the focus of the interviewers’ assess-ment on the student production: focus on message (content) rather than onform (language).
The students’ standard English and non-standard English uses of thethird person singular marker tallied with their grades in English in school(cf. Table 10.8.). This could imply that the use of the third person singularmarker is an indicator of general grammatical inaccuracy of importance forthe students’ grades.
The Progressive
The mere number of instances of the progressive could not be expected todistinguish production of the three test rating categories High, Average andLow. The focus in the analysis was therefore on the types of instancesobserved. The high normalised figure of student production rated Low incomparison with student production assigned an Average grade might havebeen caused by the dominance of Task 1, relatively speaking, in the low-achievers’ production. Task 1 was expected to be the easiest task, and stu-dents with certain difficulties did not add very much to the action describedwith the help of some pictures. These pictures provided an evident contextfor using the progressive. The high normalised figure of the instances inproduction rated Low compared with production rated Average could thusbe explained by the topic in Task 1 (cf. Table 10.9. and 10.16.). Mere fre-quency of the progressive was thus not enough to characterise student pro-duction rated High, Average or Low.
The proportions of the instances of the progressive simple and the pro-gressive complex were not characteristic traits of any of the three test ratingcategories (cf. Table 10.10.). Not surprisingly, the difficulty in the use of theprogressive tended to lie in the semantic context area rather than in the

247
application of standard English uses of verb forms. A great majority of theinstances of the progressive were standard English instances, and no differ-ences in distribution could be observed as regards standard English andnon-standard English instances across the three test rating categories. Fur-ther conclusions are difficult to draw concerning the occurrence of the dif-ferent contexts of the non-standard English instances and the grades as-signed to the student production (cf. Table 10.13.).
In the individual student’s performance, there seemed to be a tolerancetowards non-standard English instances when there were standard Englishinstances in the same performance; there was a slight tendency that non-standard English instances in performance graded High more often occurredtogether with only standard English instances (cf. Table 10.14.). The resultsare in line with the tendencies found in the investigation of the third personsingular marker (cf. above). For the production of students assigned anAverage grade, the opposite tendency could be observed: a higher propor-tion of non-standard English instances occurred together with other non-standard English instances. The proportions of standard English and non-standard English instances in the individual student’s production seem to bea useful factor to include in the discussion of the relation between the stu-dents’ use of the progressive and the grades assigned. Furthermore, theresults suggest that when there were high frequencies of the progressive,which could be explained by the topics of the task, it seemed that the inter-viewers noticed and were influenced by, the occurring non-standard Englishinstances. As for interviewer categories, non-standard English instanceswere found in production rated High by School Teachers and UniversityTeachers but not in production rated High by Native Speakers. When thedistribution of the instances was compared with the students’ grades inschool we could observe that students with high and average grades inEnglish seemed to master the use of the progressive to the same extent.
Differences could be observed in the context of the instances of the pro-gressive across the three test rating categories, for instance, a higher propor-tion of the instances in student production assigned a Low rating describedthe pictures in Task 1 than in other production. Students whose performancewas rated High or Average used the progressive in other contexts.
We may conclude that the mere number of instances of the progressivecould not distinguish production of the three test rating categories. Nostrong evidence could be found to support the idea that there are generallyfewer non-standard English instances in production assigned a High gradecompared with production assigned an Average or Low grade. In this con-text, the difficulty in determining whether instances were of standard Eng-lish or non-standard English use should be mentioned. This fact may defi-nitely have played a role in the assessment.
248
15.2. VocabularyIn this section the students’ vocabulary will be discussed in two respects.Firstly the students’ use of two categories of vocabulary (abstract nounsand modifiers of adjectives) will be described. Secondly, the students’ lexi-cal errors and their strategic competence to cope with gaps in vocabularywill be discussed.
Abstract Nouns
The results showed that a high frequency of abstract nouns (types and to-kens) clearly distinguishes student production rated High or Average fromstudent production rated Low (cf. Tables 11.1. and 11.2.). The occurrenceof abstract nouns is thus a useful means of describing the difference be-tween the language produced by high-achievers and low-achievers in oralproficiency tests of English. It seems that the ability to discuss or describecomplicated matters with the help of items such as abstract nouns correlateswith High grades in oral proficiency tests. The content and the topic in theproduction are probably of significance for the assessment. The investiga-tion of types of abstract nouns across the test rating categories also revealedthat students in production rated High more often used nouns which werenot given in the instructions of the test. Furthermore, a majority of theinstances appeared in Task 3 (cf. Table 11.6.).
The non-standard English use of uncountable nouns has low prominencein the material and does not seem to be a linguistic factor that influences thegrades assigned to student production (cf. Table 11.4.). The students’ will-ingness to discuss and argue was probably of more significance than theproportion of standard English and non-standard English instances.
The results showed differences in boys’ and girls’ uses of abstract nouns.More types and tokens of abstract nouns were found in boys’ production(cf. Table 11.9.). This may indicate that the boys used a slightly differentstyle than the girls in their performance. The frequency of abstract nounscould be one indication of this difference.
The grades from the three interviewer categories correlate with the fre-quencies of abstract nouns in student production assigned a Low grade: fewinstances correlate with Low grades. The frequencies of abstract nouns inproduction assigned Average and High grades tally with the grades set byNative Speakers. School Teachers and University Teachers do not seem todistinguish between these two categories of student production in this re-spect. One interpretation of this difference may be that Native Speakerstended to focus more on the message than the form in the students’ produc-tion. It is then assumed that production with many instances of abstractnouns was characteristic of students who were willing to develop theirthoughts and attitudes. The idea that Native Speakers tended to focus more

249
on message than on form was pointed out by one of the interviewers in ananswer to a question of the questionnaire after the completion of the tests.This interviewer’s comment gives support to the discussion above.
“I very rarely noticed anything going wrong with grammar. Probably there were lotsof mistakes but they were simply …, since I am listening as a native speaker, listen-ing for the message, I didn’t notice them, I just once or twice noticed a don’t or adoesn’t which is trivial” (Native Speaker 3)1
The results of the investigation of the distribution of abstract nouns acrossthe three tasks suggest that students in production assigned a High gradewere more inclined to discuss issues related to abstract matters in Task 3than were the other students. Presumably, it was above all in Task 3 thathigh-achievers could show their knowledge of English abstract nouns. Fur-thermore, high frequencies of abstract nouns emerged in performance ofstudents who had the top grade of 5 in English in school (cf. Table 11.8.).We may conclude that many instances and types of abstract nouns charac-terised student production assigned a High or Average grade as opposed toa Low grade. Native Speakers tended to differ slightly from the other twointerviewer categories in their grades in that student production with manyinstances of abstract nouns was rated High.
Modifiers of Adjectives
The results showed that the frequent use of modifiers of adjectives wasslightly more common in production rated High than in production ratedAverage or Low (cf. Table 11.10.). Student production rated Low showedhigh figures regarding the types of modifiers used, which was quite unex-pected (Table 11.11.). In general, however, the frequency of modifiers ofadjectives showed a certain correlation with the Global grades assigned.The presentation of the distribution of the types of modifiers used revealedthat student production rated High contained modifiers such as pretty, reallyand rather as alternatives to the highly frequent very and also to the occur-rence of so (cf. Table 11.12.) One possible explanation for the many in-stances of so in student production rated Average or Low may lie in thesimilarity to the Swedish word så: students who used so frequently wereinfluenced by Swedish. When the three interviewer categories were takeninto account, we could conclude that high frequencies of types of modifiersof adjectives appeared in production assigned a High grade by the NativeSpeakers. This tendency is in line with the results regarding abstract nouns(cf. above). It seems that the Global grades assigned by the Native Speak-ers, at least partly, were influenced by the students’ range of vocabulary.
The analysis of the relationship between the occurrence of modifiers of
1 Native Speaker 3 answered the questions by way of tape-recording.

250
adjectives and the students’ sex revealed a tendency for girls to be moreinclined than boys to modify adjectives in their speech (cf. Table 11.15.).
We can conclude that mere frequency of modifiers of adjectives seemedto be insufficient to characterise student production rated High, Averageand Low but the distribution of the types provided evidence not only of arelationship between a number of types of modifiers and the Global gradesassigned, but also of differences across the interviewer categories.
Students’ Lexical Errors and Compensatory Strategies
As expected, more lexical errors of the types investigated appeared in stu-dent performance which were rated Low, whereas 50% of the productionrated High did not contain any instances. The same tendency was observedin the frequencies of types of erroneous words used. Obviously the resultsare in line with the interviewers’ comments regarding the possibility thatthe students’ incorrect use of common words, such as nature, was a disturb-ing factor. It is thus likely that the inappropriate use of certain commonwords had a negative effect on the grades assigned.
Regarding the students’ use of compensatory strategies, the resultsshowed that the performance assigned a Low grade contained considerablymore compensatory strategies than other performance did. This is also whatcould be expected. Students who were assigned Low grades more often hadto use compensatory strategies when they could not find an appropriateEnglish word to express what they wanted to say.
The investigation of the distribution of the twelve types of compensatorystrategies identified showed that, in general, the students used Strategies ofEnglish (for the categories of compensatory strategies, cf. 9.2.3. Students’Lexical Errors and Compensatory Strategies): 71% of the instances of strat-egies were of this category. The tendency to use strategies based on theEnglish language was stronger for students whose performance was as-signed a High grade. This would imply that students who could efficientlycompensate for vocabulary gaps, for instance by not switching to Swedishbut instead giving two alternative words when they were uncertain of theappropriate word, were given better grades.
The interaction between the students and the interviewers may, at leastpartly, explain the students’ use of compensatory strategies. Two tendenciescould be observed in the distribution of the strategies across the interviewercategories. Firstly, when the students were interviewed by the SchoolTeachers, they were more inclined to use Swedish. Secondly, in these inter-views the students more often asked for help (in Swedish or in English)from the interviewer to solve the difficulty. The fact that the students recog-nised the School Teachers from their own school probably explains thesedifferences.

251
15.3. Discourse MarkersIn the present section, the students’ use of two discourse markers will bediscussed. The two discourse markers investigated are well and you know.
Well
The occurrence of well tends to characterise student production rated Highrather than other student production. Students assigned a High grade thusused well more frequently than other students did and in this way they mayhave come closer to a native-like English style in their speech.
Obviously, it was not only a matter of frequency: well had importantfunctions to fulfil in the students’ production and the instances of well indi-cate similarities between the students’ use and the descriptions of nativeusage of well presented above (cf. 9.3. Discourse Markers). Generally, itseems that the use of well which was not directly elicited by the interview-ers characterises the language by the students assigned a High grade asopposed to well in answers, which was more frequent in performance ratedAverage or Low (cf. Table 12.3.). Students assigned a High Global gradeused well in conclusions and in contexts with reported speech whereas thestudents in production assigned an Average grade used well in answers,with repetitions and when they had difficulties with the English language.The high-achievers’ use of well may be evidence of initiatives in their per-formance and their ability to structure speech in an appropriate way.
The survey of the distribution of the instances of well in relation to inter-viewer categories showed that the interviewers seemed to have differentopinions about the positive effect of the students’ use of well. Two interpre-tations are possible. The first interpretation is that the non-native interview-ers did not take into account the distinction between inappropriate and ap-propriate uses of well, whereas the native speakers did so. The second inter-pretation is that the students’ frequent use of well influenced the School andUniversity Teachers to assign a positive grade whereas the students’ fre-quent use of well did not work in this direction with the Native Speakers.Since a frequent use of well characterises native spoken production, the firstinterpretation is more likely. The Native Speakers took into account fea-tures in the students’ use of well that may be difficult to observe for a non-native speaker. The students’ intonation and stress of well may be such afeature. Further research is needed to clarify the possible variation in thestudents’ use of well.
The investigation of student production that contained a remarkably highfrequency of well showed the same tendency: the Native Speakers tended tobe less positive in their grades of student production with many instances ofwell than were the other interviewers. Regarding the distribution across the

252
three tasks, the survey revealed that, as a whole, none of the three tasksmade the students use well more frequently. The fact that there were fewinstances of well in Task 1 in production assessed by Native Speakers incomparison with the other two interviewer categories could be interpretedin the following way. The nature of Task 1 in the Native Speakers’ assess-ment gave fewer opportunities for hesitation or interaction with the inter-viewers. Well used in contexts of interaction with the interviewers was com-mon since a high proportion of the instances of well emerged in answers tothe interviewers’ questions and requests (cf. Table 12.3.).
The finding that well was more frequent in boys’ than in girls’ productionsuggests that there are differences between boys’ and girls’ performance(cf. Table 12.6.). Regarding the distribution in relation to the students’grades in English in school, the results showed that although there may begreat intra-group variation, students with high grades in English in schooltended to use well more often than did the other students (cf. Table 12.7.).
We can conclude that well was more frequent in student production ratedHigh than in production rated Average or Low and in particular in produc-tion rated by the non-native interviewers. Tendencies of qualitative differ-ences in the uses of well in the three test rating categories could be distin-guished. The idea that well is an important feature of fluency in spokenEnglish is corroborated in the present investigation and of particular inter-est when focusing on differences in the assessments by native and non-native interviewers.
You know
Regarding the second discourse marker, the students’ uses of you knowtended to be a characteristic trait of production rated Average or Low ratherthan High (cf. Table 12.8.). One interpretation of the results is that youknow has meanings and functions in the students’ uses that made it inappro-priate in their performance. You know used in certain contexts could be oneof the features that contributed to a Low or Average grade.
The presentation of the collocations attested showed that the high-achievers, in particular, tended to link you know to the rest of their produc-tion with the help of and; and occurred together with you know in one thirdof the instances in production rated High.2 Concerning the position of youknow in the instances attested, the great majority of all the instances wereplaced according to native usage irrespective of Global grade assigned (cf.Table 12.9). This could mean that the students tended to place you knowidiomatically regardless of test rating category. As to the discoursal func-tions attested, the results revealed that in the majority of the instances, the
2 The raw figures were admittedly very low but nevertheless the tendency is of interest.

253
students used you know in a range of different contexts, and further study isnecessary to pinpoint these discoursal functions (cf. Table 12.10.). The in-stances that were possible to categorise, however, showed differences indistribution: you know emerged in contexts of vocabulary gaps and in repe-titions in student production assigned an Average or Low grade. Studentproduction assigned a High grade contained more instances in contextswhen the students expressed their own opinion. The results are not surpris-ing. Students with production assigned an Average grade could be expectedto have more difficulty in finding the appropriate words than studentswhose production was assigned a High grade. Instead of using you know inword searching, the high-achievers used it in contexts where they probablyfelt the need to soften their utterance.
The distribution of instances of you know across interviewer categoriesshowed that the Native Speakers seemed to be more negative to the stu-dents’ uses of you know than the other interviewers and in particular, theUniversity Teachers. It may be the case that you know was used in an unid-iomatic way by the students, which only the Native Speakers took intoaccount.
The results of the survey of the introduction of you know by students orby interviewers by test rating categories suggest that the students whoseproduction was assigned a High grade were more aware of the situationalimplications of you know and tended to use it more often in appropriatesituational contexts than were the other students (cf. Table 12.12.). Theinterviewers’ use of you know in interviews with students who were as-signed a High grade could be an indication of the situational appropriate-ness of the students’ use. The fact that the students used you know when theinterviewers also did so could be interpreted as evidence of the students’ability to use you know in what could be referred to as “stylistically appro-priate contexts”.
The results of the distribution of the instances of you know across thetasks are in line with the observations in Östman (1981: 16) describedabove (cf. 9.3. You know …). The instances clustered in Task 2 that con-tained a narrative topic. The presentation of the relationship to the students’sex showed that you know was more frequent in production by girls than byboys (cf. Table 12.15.). The results may suggest that the Swedish studentshad adopted certain linguistic features that distinguish between male andfemale native speakers of English (cf. 9.3. You know …). Even if similardifferences in language use could be found in Swedish and the studentssimply carry over their style from Swedish to English, it is neverthelessworthwhile highlighting that the English language produced by advancedSwedish students contained variation that is similar to that found in descrip-tions of native speakers’ production. One possible interpretation of the re-

254
sults is that you know is a marker of an interactive and intimate style, whichis more characteristic of girls’ than boys’ speech. As for the second studentparameter, the students’ school grades, the results indicated that frequentuse of you know tended to characterise the speech of students who did nothave the top grade 5 in English in school (cf. Table 12.16.).
15.4. Aspects of PronunciationIn this section the results from the investigations of the students’ pronunci-ation will be elaborated on with regard to their intonation, stress and speechrate.
Intonation
The findings summarised below are based on a small sample and with thehelp of three researchers’ impressionistic evaluation. They may still yieldsome useful information.
Intonation seems to vary in student production across the three test ratingcategories High, Average and Low. “Unidiomatic” intonation with rises instatement-final words and, in general, monotonous and flat intonation aremore characteristic of student production rated Average or Low than High.It is worth pointing out however, that other features than intonation, such asstress and rhythm, seem to be more significant for the assessment of Swed-ish students’ spoken production.
Stress
The findings suggest that “unidiomatic” stress of function words is a prom-inent feature in the distinction between the high-achievers and the low-achievers. Students whose production was assigned a High grade hadadopted an English-like stress pattern which they used in the extracts inves-tigated.
The results of the investigation of the students’ use of and so on showedthat the students rarely pronounced and so on in an “idiomatic” way, but the“idiomatic” instances that did occur were found in production rated High.
In general, the students’ stress patterns in their spoken English seem toplay an important role in distinguishing student production rated High fromstudent production rated Average or Low. High-achievers had adopted more“idiomatic” English stress patterns than other students.
Speech Rate
High speech rate characterises students who were assigned a High grade.No differences in distribution could be observed when the three interviewercategories were taken into account. Nor were clear tendencies found in the
255
distribution across girls’ and boys’ production. There was a relationshipbetween speech rate and the students’ grades in English in school, however.
We can conclude that speech rate was probably one of the features in thestudent production that contributed to the High Global grades assigned.
15.5. Interference from SwedishInterference from Swedish is of interest in the present study for at least fourreasons. Firstly, references to the students’ mother tongue were made in therating criteria, e.g. grade E of the Factorial rating 2a (Grammar and Vocab-ulary) had the wording: “Sometimes uses Swedish words”. The criteria ofthe same grade for Pronunciation, i.e. grade E of Factorial rating 2c, alsoreferred to the student’s mother tongue, to “first language intonation”.3 Sec-ondly, the assessors made remarks on the interference from Swedish intheir comments added to the grades. By way of examples, see the com-ments given below.
“Använder svenska ibland.” (= “Uses Swedish sometimes.” School Teacher 1, I 84)“Intonation patterns not very English.” (Native Speaker 1, YY 28)
Thirdly, in their answers to the question “What is particularly disturbing insome students’ production?” (cf. question 5, the Interviewers’ Question-naire in Appendix 6), the interviewers mentioned the interference fromSwedish as one of these disturbing features. Two answers are cited for illus-tration:
“Swenglish, svenska som bara direktöversätts och låter mycket oengelskt.” (=“Swenglish, Swedish which is just directly translated and sounds very un-English.”(School Teacher 3)“Svenismer som it is för there is.” (= “Swedish ways of saying things like it isinstead of there is.” University Teacher 2)
Fourthly, the investigation of the ten linguistic features revealed that partsof the students’ production showed evident interference from Swedish asregards grammar, vocabulary and/or pronunciation, e.g. the absence of thethird person singular marker, the choice of abstract nouns which are similarin Swedish and English, and the stress pattern of and so on.
Overall, the students’ production is characterized by little interferencefrom Swedish. However, if any interference is noticed, it pertains, in partic-ular, to the students’ grammar, vocabulary and intonation and less to theirpronunciation of individual sounds.
3 Cf. the Rating Criteria in Appendix 8.

256
Very few oral tests were assigned the grade E for Grammar and Vocabu-lary, and/or for Pronunciation. Among the grades assigned, only one stu-dent’s production was given a grade according to the criterion “Sometimesuses Swedish words” (cf. above). In grammar, the students’ difficultiesseem to lie in morphology and in the choice of words. In pronunciation, theassessors’ comments tend to describe interference in students’ intonation,whereas students’ pronunciation of individual sounds is regarded to be ac-curate. For illustration, Native Speaker 1 comments on four tests as follows:
“somewhat disturbing rhythm in speech but not obviously foreign” (Comment ontest YY 28)“intonation somewhat monotonous” (Comment on test B71)“individual sounds OK” (Comment on test X24)“intonation patterns not very English; individual sounds good” (Comment on testR18)
In this context, some remarks should be made concerning certain observa-tions of word order in the students’ production. Errors in word order maybe expected to occur together with errors of morphology or vocabulary, inparticular in student production assigned Low grades. These errors could beanticipated to occur in structures with syntactic differences between Swed-ish and English, for instance, regarding the position of adverbials and thesubject-verb order in certain contexts (Hargevik and Hargevik 1993: 3, 120;Ljung and Ohlander 1992: 291), but the students’ difficulties when theyspeak English in the oral interviews do not seem to concern word order.One evident explanation could be the fact that in many sentences, there aresimilarities between Swedish and English in this respect, and therefore stu-dents’ word order in English is the same as in Swedish. Another explana-tion could be that the students have mastered word order in English andthus have few errors even though there are differences between the twolanguages. There are structures in the material where errors could be antic-ipated because of differences in word order in Swedish and English. Inthese instances however, there is no interference from Swedish; the stu-dents’ use of English word order is correct. Six examples below illustratethis absence of interference in the students’ production. The contrastivestructure identified comprises the subject-verb word order. Furthermore,illustrative examples are given of appropriate use of the preposition fol-lowed by the present participle. (93) “… without clothes we almost look the same …” (YY 28)
(94) “… well usually they have a stronger message sometimes but it doesn’thave to be that either” (WW 30)
(95) “… well of course not but in many ways that isn’t the problem…” (Z26)

257
(96) “… well people could learn a lot from going back to school and do the thingsthey are interested in …” (Y51)
(97) “… I think you got the sort of prejudices from looking at people, their cloth-ing … there’s so many other things in life that you can spend your money onthan buying expensive new clothing all the time…” (YY 28)
These examples also show the absence of interference in two other re-spects: the choice of preposition (“they are interested in”, cf. Swedish: int-resserad av) and the use of there instead of it (“there’s so many things inlife”, cf. Swedish: det finns).
In conclusion, the interference from Swedish in the students’ productionwas evident as regards for instance vocabulary and intonation but does notseem to be significant for the Global grades assigned. Furthermore, inter-ference from Swedish was not emphasized by the interviewers. Generally,interference from Swedish was thus a less important factor for the assess-ments than one might have expected.
15.6. Concluding Remarks The students who participated in the Gothenburg project represented alimited sample of the students from Swedish upper secondary school sincethey were all theoretically oriented in their studies in the gymnasieskola (cf.7.2. Students). It could therefore, at least partly, be expected that thesestudents would not show variation in their proficiency in English. The anal-ysis of their performance showed evidence of interesting differences, how-ever, regarding their use of the verbal group, vocabulary, compensatorystrategies, the two discourse markers investigated as well as their pronunci-ation.
The student performance contained incorrect and correct instances ofdifferent kinds of the two features of the verbal group investigated. Exam-ples of incorrect use were the absence of the third person singular markerafter the pronouns he or she, and the use of the progressive with stativeverbs such as cost. Correct use of the verbal group was observed, for in-stance, in the students’ use of the progressive to describe action in progress.Generally, a high proportion of grammatically correct instances appeared ina student’s performance which was rated High.
Students’ vocabulary was commented on as being significant for theoverall impression of their production, in particular by the Native Speakers(cf. 9.2. Vocabulary). The results pointed at the significance of the fre-quency of abstract nouns, probably as an indication of abstract thinking,and the use of varied vocabulary, for instance by using different types of

258
modifiers throughout a performance. As expected, instances of lexical er-rors involving certain common words characterised student performancerated Low. Compensatory strategies were also more frequent in perform-ance rated Low.
Table 15.1. Rejected or confirmed sub-hypotheses as regards the ten lin-guistic features
Linguistic feature Sub-hypothesis
Verbal Group: The third person singular marker
There is a higher proportion of standard English in-stances in student production assigned a High grade than in other student production.
Confirmed
Verbal Group: The progressive
There are fewer non-standard English instances in stu-dent production assigned a High grade compared with student production assigned an Average or Low grade.
Rejected
Vocabulary: Abstract nouns
Abstract nouns characterise student production assigned a High grade. Frequent instances and types of abstract nouns, in particular nouns with no similar Swedish equivalent, are evidence of a more developed and ad-vanced argumentation.
Confirmed
Vocabulary: Modifiers of adjectives
More instances of modifiers of adjectives emerge in stu-dent production assigned a High grade than in other stu-dent production.
Rejected
Vocabulary: Students’ lexical lacunae and communication strategies
Lexical errors are more frequent in student production assigned an Average grade, and, in particular, a Low grade. Compensatory strategies are more frequent in student production rated Low. Differences in occur-rences of types of strategy can be observed across the test rating categories.
Partly confirmed
Discourse Marker: Well…
Well is more frequent and is more idiomatically used in student production assigned a High grade than in other student production.
Confirmed
Discourse Marker: You know
You know is more frequent in student production as-signed a High grade than in other student production. You know is used as a pause-filling device in the student production and as one of the means to establish interac-tion between the interviewers and the students.
Partly rejected
Aspects of Pronuncia-tion: Intonation
“Unidiomatic use” of intonation in declarative sentences is more frequent in student production assigned an Av-erage or Low grade than in student production assigned a High grade.
Confirmed
Aspects of Pronuncia-tion: Stress
Stress, both on functional as opposed to lexical words and on the phrase and so on, is more often found to be used according to English usage in student production assigned a High grade than in other student production.
Confirmed
Aspects of Pronuncia-tion: Speech rate
Student production assigned a High grade contains sam-ples with higher speech rate than the samples of the other student production.
Confirmed

259
The investigation of the students’ use of the two discourse markers pro-vided useful information regarding both frequencies and discoursal fea-tures. High frequencies of well emerged in student performance rated High,particularly when assessed by non-native speakers. You know appeared inother student performance and often when the production was assigned aLow grade. Discoursal factors, such as if you know was used in contextswhen the students were expressing their own opinions, seem to be related tothe Global grades assigned.
The students’ pronunciation had an evident Swedish accent and showeddifferences in quality both regarding intonation and stress. The students’speech rate during the first minute of their performance was another factor,besides stress and intonation, which seems to be related to the grades as-signed.
The results of the investigation can be summarised with the help of re-jecting or confirming the ten sub-hypotheses presented in Chapter 6 (cf.6.2. Linguistic Features). In Table 15.1, the ten sub-hypotheses are con-firmed or rejected.

260
Conclusion
In this final part of the study, the results will be summarised and conclu-sions will be drawn. Furthermore, some reflections will be provided on thetesting of oral proficiency in English at schools.
1. Summary and ConclusionsIn this section, conclusions will be drawn from the results presented inChapters 8 to 13 and the interpretations given in Chapters 14 and 15. Theaims of the study explained in Chapter 4 will provide the basis for thediscussion. The conclusions should be considered against the aims and con-text of the Gothenburg project.
This project was carried out in 1993 when compulsory oral proficiencytests were about to be introduced as a part of the National tests in Swedenand while a norm-referenced grading system was still in use in the Swedishschool system (cf. 1.1. Measuring Student Performance). The use and inter-pretation of rating criteria were not yet widely spread in assessments oflanguage proficiency. The nine interviewers of the Gothenburg project didnot study or discuss the rating criteria used during the sessions and given tothem when they arrived before the assessments were carried out, somethingthat has since of course become common practice together with the intro-duction of compulsory oral proficiency tests as part of the National tests inSweden shortly after the Gothenburg study was carried out. Furthermore,the experimental situation of the oral tests and the limited number of partic-ipating students and interviewers should be kept in mind in the discussionof the observations that follow, as should the fact that the study was under-taken not to make an evaluation of Swedish school-leaving students’ gen-eral oral proficiency in English but to study interrater-reliability, that is, thedegree to which different assessors tend to agree or disagree in their grad-ing of the same students. The results and tendencies observed in the presentstudy can nevertheless be of some interest.

261
As described in Chapter 4, the overall aim of the Gothenburg Project was
– to study to what extent different examiners tend to agree or disagree ingrading advanced Swedish students’ oral proficiency in English.
The material used in the present study was collected at the Foreign Lan-guage Teaching and Testing Research Unit of the Department of Educationand Educational Research, Gothenburg University. The results have beenpresented, discussed and interpreted in the present study. When the inter-viewers assigned Global and Factorial grades to all 29 students’ perform-ance and thus four different grades to each test, there was great variation inthe grades they awarded, both as far as grade levels in general were con-cerned and in the grades they awarded the same students; in the case of 11students the variation in opinion was remarkably great (e.g. three differentGlobal and Factorial grades were given by the three interviewers to thesame student). That there were great differences in the grades assigned bysuch experienced and qualified interviewers as those who took part in theGothenburg project is an important finding of the present study. Among thefactors that may explain these differences, the following have emergedfrom the analyses:
– the order of the interviews (lower grades were assigned to the students’first interviews),
– the length of the students’ production,– the interviewers’ different interpretations of the rating criteria,– their different views on the influence of Swedish on the students’ per-
formance in English, and– their slightly varying ability to make the students feel at ease and thus to
produce language at their true level of proficiency.
Concerning the Factorial grades, the results show that the interviewerstended to use a limited part of the rating scale for Pronunciation, in particu-lar the Native Speakers.
Furthermore, by way of specification of the aim above, the first aim ofthe analysis of the present study was two-fold:
– to study the relationships between the Global grades and the three Facto-rial grades given by each of the nine interviewers individually;
– to study the relationships between the Global grades and the three Facto-rial grades for each of the three interviewer categories.
The Global grades and the Factorial grades were closely related, that is, theinterviewers often assigned the same Global and Factorial grades to theindividual student’s production (cf. Table 8.5.). This tendency was particu-larly strong in the grades assigned by the Native Speakers (cf. Table 8.7.).

262
As regards the relationships between the Global grades and the Factorialgrades, the results indicated that the School Teachers’ and the NativeSpeakers’ grades for Grammar and Vocabulary showed the highest correla-tion with the Global grades assigned (ST: 0.77; NS: 0.89). As for the Uni-versity Teachers’ grades, the Factorial grades for Communication and Flu-ency showed the highest correlation with the Global grades (0.90). How-ever, on the whole and considering all the interviewers, no Factorial gradeseems to have been more influential than the others when the interviewersassigned Global grades to the student production. Furthermore, the resultsshowed that the Native Speakers generally gave slightly higher grades,whereas the School Teachers gave slightly lower grades than did the mem-bers of the two other interviewer categories. The Native Speakers and theSchool Teachers gave priority to different aspects in the student production.The Native Speakers seem to have paid more attention to the students’communicative skills in their assessment whereas the School Teachers weremore influenced by the students’ grammatical skills. In other words, thereis a different emphasis on fluency versus accuracy in the assessments by themembers of these two categories of interviewers.
The second aim formulated for the present study, was
– to investigate the students’ linguistic competence, and to some extenttheir strategic competence, in terms of their standard English or non-standard English use of certain “difficult features” in English, their vo-cabulary, their use of certain discourse markers, three aspects of theirpronunciation and their ability to use efficient strategies.
The analysis of the students’ performance yielded useful information ontheir mastery of the English language with respect to their oral proficiencyin an interview and as regards certain linguistic features investigated. Thestudents had no difficulty using English in the different tasks of the Gothen-burg project. Almost all students managed to speak about the three topicsselected.1 Their strength lay in their communicative skill; they were gener-ally good at getting the message across. Regarding vocabulary, most stu-dents showed a varied and appropriate use of abstract nouns and modifiersof adjectives. Furthermore, they had adopted discoursal patterns from Eng-lish usage in their use of the two discourse markers well and you know.These were employed in appropriate ways as hesitation devices or in con-texts where the students expressed their own opinions. Their pronunciationcould generally be considered to represent the middle of the rating scale:the students had good pronunciation of most of the individual sounds andacceptable intonation, but their foreign accent was evident. There was,
1 One student (Student ZZ in the interview with the Native Speaker 3) did not complete Task3 (argue a case).

263
however, variation in quality; there were also differences in speech rate andstress patterns.2 As regards syntax, it is worth special attention that no in-stances of non-standard English word order were observed. For the gram-matical inaccuracies observed, interference from Swedish seemed to be aninfluential factor, for instance the distinction between there and it as theequivalents of Swedish det, and the inappropriate use of the progressivedetermined by semantic criteria, that is, the progressive was used in inap-propriate contexts (cf. 10.2. The Progressive).
Finally, some interesting conclusions concerning two background varia-bles could be drawn, namely, the relationship between the grades awardedin the interviews and the students’ sex and their school grades respectively.
Sex. The analyses of the oral proficiency interviews indicated that therewere certain differences between boys and girls in their use of a number oflinguistic features. As for vocabulary, abstract nouns tended to be used moreby the boys, whereas modifiers of adjectives, for instance very, were morefrequently used by the girls. Regarding the two discourse markers investi-gated, the results showed that well was more frequently used by the boysthan by the girls. As to the use of you know, the girls used this discoursemarker more frequently than the boys did, and this phenomenon is, interest-ingly enough, also found in native speakers’ speech (cf. 9.3.2. You know…).
School Grades. As for the relationship between the students’ schoolgrades in English and their performance, two findings are of interest.Firstly, the students who had fairly low grades in English in school tendedto be quite strong in oral proficiency. These students were generally notassigned remarkably low grades in the interviews. Secondly, most of thestudents who had top grades in English in school showed very good profi-ciency in English during the interviews, but some of these students’ per-formance did not differ remarkably from the other students’ performance. Itseems reasonable to assume that there were “uneven profiles” among thesestudents who perhaps had their strength in, for instance, reading and writ-ing skills.
Finally, as a combination of the above first and second aims, the thirdaim of the present study was
– to investigate to what extent the students’ linguistic and strategic compe-tence is graded differently by the three categories of interviewers, andespecially to study the role played by the linguistic features in the Globalgrades assigned to the students by the three categories of interviewers.
The results of the linguistic analyses showed that five of the linguistic fea-tures seemed to have had different effects on the Global grades assigned by
2 This was observed, for instance, regarding their idiomatic or unidiomatic stress of and soon.
264
the members of the three interviewer categories. The five features are thethird person singular marker, abstract nouns, modifiers of adjectives, andthe discourse markers well and you know. The students’ use of the progres-sive (although a slight tendency could be observed, cf. 15.1. The Progres-sive), their speech rate and the occurrence of lexical errors did not show thistendency. It was not within the scope of the investigations of the students’intonation and stress to include the interviewer categories. In what followsthe tendencies of differences across the interviewer categories are furtherdiscussed regarding communication, grammatical accuracy, number of cer-tain categories of words, compensatory strategies, discourse phenomenaand pronunciation.
First of all, regarding communication, it seems that the students whowere assigned High grades tended to differ from the other students in theirwill to discuss abstract matters. The students who discussed abstract andmore demanding topics, and who spoke at length and probably with manyinitial turns (i.e. they took the initiative), were assigned High grades.Whether abstract nouns, for instance, uncountable nouns, were used ac-cording to grammatical rules or not, did not seem to disturb the communi-cation. This tendency was particularly obvious in the assessments by theNative Speakers.
Secondly, as for grammatical accuracy, the interviewers displayed atolerance towards occasional non-standard English instances if the samelinguistic features were also dealt with correctly in other parts of the samestudent’s performance. Non-standard English instances were more or lessoverlooked in student production assigned the highest grades as long asother instances of the same feature were grammatically correct. The follow-ing tendencies could be observed concerning the third person singularmarker and the progressive: non-standard English instances emerged in thestudent performance of all three test rating categories (High, Average andLow). When the interviewers assessed the student performance, grammati-cal accuracy was obviously a matter of proportions rather than one of occa-sional instances in the individual student’s production. As expected, how-ever, student production that was assigned High grades (i.e. the Globalgrades B/4 or A/5) generally contained a higher proportion of grammati-cally correct instances of the third person singular marker, for instance,than student production assigned Low grades (i.e. the Global grades E/1 orD/2). However, even though a student’s production was assigned the topGlobal grade, which had the rating criterion “A fluent and overall correctuse of English”, there could be non-standard English instances. As for theinterviewer categories, the results showed that non-standard English in-stances of the third person singular marker were more common in produc-tion assigned a Low grade than in production assigned a High grade by the

265
School Teachers and by the University Teachers. This tendency in distribu-tion was not seen in production assessed by the Native Speakers.
The progressive was the second linguistic feature of the verbal groupsubjected to a detailed study. The results showed that a great majority of theinstances were of standard English use and that there were no great differ-ences in the distribution of standard English and non-standard English in-stances when student production was analysed in relation to the three testrating categories. Nor were there differences in the types of non-standardEnglish instances attested. However, although few non-standard Englishwere found, three tendencies could be observed. Firstly, the non-standardEnglish instances in production rated High more often occurred togetherwith only standard English instances than production rated Average or Low(cf. Table 10.15.). Secondly, these non-standard English instances, that is,instances in production rated High compared with instances in productionrated Average or Low, were of a different type (not belonging to the cate-gory labelled Habit, but instead the category labelled Objective circum-stance, cf. Table 10.14.). Thirdly, no non-standard English instance of theprogressive was found in production rated High by the Native Speakers.
The Native Speakers seemed to be more tolerant of grammatical inaccu-racy, as regards the third person singular marker, for instance, in their over-all assessment of student performance than the School Teachers and theUniversity Teachers. These results together with the fact that abstract nounswere more frequent in student production assigned higher grades by NativeSpeakers than by the other interviewers could be interpreted in the follow-ing way: the Native Speakers focused on the students’ communicative skillsand the messages conveyed, while the School Teachers, in particular,tended to pay more attention to grammatical accuracy and the students’grammatical repertoire.
Thirdly, mere numbers of certain categories of words in the studentperformance were not determining factors in the assignment of grades. In-stead the different interviewers paid attention to types of words used andvarious discoursal factors. The types of modifiers of adjectives that the stu-dents employed (e.g. fairly instead of so), and in what discoursal contextsthey used well, are examples of features that seem to be of significance forthe assessment. The tasks and the topics of each task in the interviewsseemed to be of significance for the distribution of words and discoursemarkers and thereby for the grades assigned.
Fourthly, when the students did not know the English word or expressionthey obviously wanted to use, they resorted to various compensatory strat-egies. Their use of strategies which were based on the English language, forexample, paraphrase (as opposed to strategies involving Swedish, e.g. wordcoinage when the students translated Swedish expressions literally), was

266
considered to be a positive feature by the interviewers. In general, and notsurprisingly, compensatory strategies were more frequent in performanceassigned Low grades. The student performance which was assigned Highgrades showed a higher proportion of compensatory strategies involvingEnglish only. Efficient ways of solving gaps of vocabulary thus resulted ingood grades.
Fifthly, discourse phenomena, such as the students’ use of hesitationdevices, had different effects on the Global grades assigned. The discoursemarker well was apparently associated with good fluency in spoken Englishwhen the performance was assessed by non-native speakers (high frequen-cies of well were observed mainly in performance assigned High grades bynon-native speakers). The students’ use of you know, on the other hand,seemed to have had the opposite effect: frequent use occurred in productionassigned a Low grade, particularly when the performance was assessed byNative Speakers, something which is worth noticing. Students’ use of dis-course phenomena may thus influence assessors in different ways, and per-haps the Native Speakers could take into account unidiomatic use of dis-course markers which were hard to identify for the non-native speakers.
Finally, as regards the students’ pronunciation, the results from the in-terviewers’ comments and their answers in the questionnaires did not pro-vide evidence of the students’ Swedish accent being of significance for theassessment of their intonation in English (cf. 13.1. Intonation). It might beexpected that the majority of the students spoke Swedish with an accentcharacteristic of the west coast of Sweden since they were from this regionbut this was not discussed in the comments to the assessments by the inter-viewers or by the two experts consulted on the students’ intonation (cf.13.1.1. Results from the Observations of Students’ Intonation). The limitedinvestigation of the students’ intonation in declarative sentences, theirstress pattern and the survey of their speech rate the first minute of the oraltest showed differences in quality across the three test rating categories.Furthermore, the interviewers’ comments together with the Factorial gradesassigned for Pronunciation indicated that the students generally had a typi-cal Swedish accent, and that certain factors, such as rhythm and stress,seem to have been of importance for the grades assigned.
2. ReflectionsOn the basis of the results obtained in this study, some reflections will nowbe provided on the testing of oral proficiency in English in our schools. Itshould be emphasized that these reflections are given in the light of themethod used in the oral proficiency interviews of the Gothenburg project.
267
The method and the procedures in the testing and the assessment of stu-dents’ oral proficiency, which is now a compulsory part of the NationalTests both in the comprehensive schools and in the upper secondaryschools, are to some extent different from the one used in the small-scalestudy of 1993. These changes include, for instance, new interactive modelswith students responding in pairs or groups.3 As for the grading, factorialratings are not given but are commented on in the instructions for the as-sessment. The fact that a completely new criterion-referenced grading sys-tem was introduced in 1994 with sets of rating criteria for all school sub-jects (for instance for English, not for separate skills such as oral profi-ciency) has led to the fact that teachers now are used to assessments carriedout with the help of rating criteria. Finally, the instructions of the NationalTests of English used in schools now in 2003 give extensive support interms of recommendations, instructions and, as far as foreign languageslike English are concerned, commentated examples of student perform-ance.
It is my hope that the practical implications of the present study and thediscussion below may be of interest to headmasters and language teachers,in particular to teachers of English but also of other foreign languages, inupper secondary schools, and partly to teachers of the upper grades in com-pulsory schools, when they are planning and carrying out assessments oftheir students’ oral proficiency. The discussion focuses on the followingthree issues:
(1) the reasons for oral proficiency testing, (2) important factors in the construction of oral proficiency tests: the prep-
aration, the organisation and the assessment, and (3) in-service training for teachers.
(1) The results of the present study show that students with low grades inEnglish in school tend to have, relatively speaking, a greater command oforal proficiency than of other skills. Now, in 2003, when the oral test hasbeen made compulsory, these students, no doubt, have an opportunity todemonstrate their strengths. The students who participated in the Gothen-burg project were given the opportunity to show certain skills that would ofcourse not have been visible in written tests, for instance, skills in usingintonation, stress and the pronunciation of individual sounds, as well astheir competence in handling turn-taking and other discoursal features. Thefact that oral tests give students the opportunity to show skills not possibleto measure in other tests speaks in favour of compulsory testing of oralproficiency within the Swedish school system, as oral proficiency is one of
3 This model is found, for instance, in the oral part of the National Test of English A andEnglish B of upper secondary school of 2001 and 2002.

268
the four overall language competence goals of the syllabi. However, thishas not always been taken for granted. Before oral proficiency tests were inuse, it was assumed that teachers could evaluate their students’ oral profi-ciency in the course of regular classroom work. The finding that studentswhose school grades in English were low received relatively higher gradesin the oral testing than might have been expected gives further support tothe system of compulsory oral tests. Another reason that might be men-tioned in this context is the ‘washback effect’, i.e. the effect of testing onteaching (cf. Bachman 1990: 283 and Olsson 1996). What is tested is alsogiven priority by the students in the learning process. Oral proficiency tests,which have been used for the last ten years, are thus a necessary compul-sory part of the National Test of English.4
(2) An oral test needs to be of a certain length to provide enough materialfor the assessment. Students should be given a fair chance to show theircompetence, and, therefore, it is recommended that oral tests where studentsturn out to be hesitant and insecure should be lengthened in order to ensurereliable grades. One must be aware of the special needs of some students inoral proficiency tests; the lack of self-confidence and nervousness may con-tribute to a negative first impression of these students’ real competence. Toa certain extent, flexible length of oral proficiency interviews could be usedalthough it may complicate the organisation of the tests.
When the tasks for an oral proficiency tests are set up, there are severalaspects to be considered. Oral proficiency tests are to be designed to givestudents the opportunity to show their oral skill, in particular students whomay have a poor command of English. Oral proficiency, of course, com-prises more than pronunciation and intonation, for instance, pragmaticcompetence (e.g. the ability to use language appropriately according togiven contexts) and strategic competence (e.g. the ability to compensate forcommunication breakdown) (cf. 2.2. Oral Proficiency). The tasks musttherefore be varied and constructed in such a way that the focus is on thestudent’s overall oral proficiency and those aspects of his/her competencethat are not tested in the written tests. The tendency to overemphasizeaccuracy can also be compensated for. If, for example, the students areasked to tell a story about a person in the present tense, there may be a riskthat the interviewer pays too much attention to an easily recognisable gram-matical feature such as the third person singular marker. As a consequence,the student’s standard English or non-standard English use of this featuremay be given a degree of weight in the overall assessment of the her/hisperformance that it does not deserve. This could be avoided by having the
4 The oral test, as a part of the National Test of English A or of English B of Swedish uppersecondary schools, has been compulsory since 2000 (Erickson and Börjesson 2001).

269
student tell parts of the story in the past tense or by way of asking thestudent to act the role of the main character in the story. The inappropriateuse of certain words, such as “false friends”, which present problems forSwedish students, may also pull down grades in a disproportionate manner.In cases where such vocabulary problems can be anticipated, the correctwords could be supplied in the instructions.
The tasks should also offer opportunities both for simple storytelling andfor presenting arguments and ideas in different situational contexts, in bothformal and informal frameworks, for instance. A discussion of controver-sial topics such as those used in Task 3 in the tests of the Gothenburgproject (i.e. “to argue a case”) is interesting to every student in oral tests.The purpose should be to give all students, weak and strong, opportunitiesto show their competence in English as fully as possible. Discussions –both between a teacher and a student, or between students – may stimulatestudents to show their mastery and fluency, for instance, in their use oflinguistic flags characteristic of spoken English, such as hesitation devicesand discourse markers in answers to the interlocutor’s questions and re-quests, e.g. let’s see now, I can’t find the word, let me think for a while.What’s more, discussions regarding controversial issues (which may behighly demanding for some students) give the students the opportunity toshow their strategic competence, and ideally, give all students the opportu-nity to do their very best.
Regarding practical procedures and principles for grading students’ oralproficiency in oral tests, it is excellent that instructions accompanying oraltests, for instance, the oral part of the National Tests of English, give practi-cal recommendations on how to organise oral proficiency tests at schoolwell in advance so that students are familiar with what is expected of themand how they should go about showing their oral competence. Detailedguidelines on how to prepare and carry out assessments in order to makethe grades as reliable as possible and useful illustrative examples from test-ing procedures in use at various schools are also helpful and should consti-tute an obvious part of the test material. Preparations of various kinds, bothfor the interviewers and for the students, in all schools and especially inclasses facing organised oral proficiency testing in the near future are thusrecommended, as are well-known routines to ensure that previous knowl-edge of the student’s results does not influence the assessment (cf. 5.3.Sources of Variation). In order to reduce the influence of negative factors onthe assessment, such as the possibility that the students feel nervous duringthe exam, oral proficiency – even if it is of course continually practised5 –
5 For illustrative examples of material which learners may use to develop their oral profi-ciency in English, see for instance Gustafsson and Kinrade (2002), Isitt (1998), Aagard and St.John (2002) and Trollfjärden and Svedberg (forthcoming).

270
should also be tested in everyday classroom activities. In this way, students’lack of previous experience of oral tests will not affect the examinationexperience. Since the order of the interviews seems to have played an im-portant role for the grades assigned in the Gothenburg project, it is essentialthat students be given the opportunity to participate in oral proficiency test-ing and to gain experience from testing situations.6 Furthermore, assess-ment by two examiners is recommended and should be encouraged when-ever possible. Other ways of securing that the grades awarded to the stu-dents’ oral performance are as reliable as possible are, for instance, anexchange of examiners between schools and the recording of student per-formance.7
(3) The results of the present study pointed to the unavoidable fact that, inmany cases, different interviewers graded an individual student’s oral per-formance differently. It is reasonable to believe that similar results wouldbe obtained if groups of teachers from different schools in Sweden were totake part in an experiment like the one discussed in the present study. Toensure as reliable grades as possible in oral tests, assessment of oral profi-ciency is thus an in-service training matter of the greatest importance.8 Thedifferences observed in the grading by the three interviewer categories ofthe present study could be used as an interesting starting point in discus-sions of interpretations of rating criteria for the assessment of students’ oralperformance. Further training of English teachers could include three mainparts:
(1) to study developments in present-day spoken English, (2) to discuss cases on which assessors tend to disagree, and(3) to discuss recent methods in the testing and assessing of students’ spo-
ken English.
The first part could focus on various aspects and trends in present-day useof spoken English. It should be stressed that the Swedish students in thepresent study had reached such an advanced level that many factors such asmeta-talk (this word is hard to pronounce), or-tags (or something, or so),abbreviated clauses (don’t really know), self-corrections and other charac-
6 Students and teachers can be informed about test formats with the help of the examplesprovided of National Tests of English for their respective levels.
7 Assessment by more than one assessor and the recording of students’ performance arerecommended, for instance, in the instructions of the National Test of English of CompulsorySchools (ÄP 9). For a discussion of ways of preparing students for the tape-recording of oralproficiency tests, see Tornberg (2000: 157).
8 Another reason for an emphasis on oral proficiency in in-service training of English is thatteachers appear to have increased the amount of various oral exercises in their teaching. In astudy from 2001, teachers experience a movement towards more speech and oral presentationsin the teaching methods of English in Sweden (Apelgren 2001: 157).

271
teristics of spoken English may have contributed positively to the gradesassigned (for an introduction to spoken interaction, see for instance, Sten-ström 1994, and Aijmer and Olsson 1990). The students’ interactive skillscould have been of influence (for examples of interactive skills, see Aijmer2001). In-service training of teachers in modern developments in present-day English with regard to native versus non-native speakers’ mastery ofspoken English in different situational contexts would therefore be of greatvalue (for discussions of various aspects of present-day English, see forinstance Crystal 2000, Hargevik 2000, Svartvik 1999, and Brutt-Griffler2002).
The second part could focus on the following areas:
– defining students’ communicative competence, in particular oral compe-tence,
– examples of student performance in the middle of the rating scale,– the performance of “silent and passive” students, and – students with an “uneven profile” (e.g. easy to understand but grammati-
cally inaccurate), and students whose performance is of different qualityin the different parts of the interview (e.g. hesitancy and frequent gram-matical errors in the beginning of the interview and fluency and accuratestructures towards the end).
In order to be able to assess oral proficiency reliably, assessors need toagree on its most important characteristics. Discussions regarding oral pro-ficiency could include the significance of accuracy, compensatory strategiesand speech rate in assessment. As has been discussed, the results of thepresent study contain examples of student production which were givenvery different grades by the three interviewers. These examples of studentproduction were obviously difficult to grade according to the rating criteriaprovided perhaps because they were felt to contain elements that the inter-viewers considered to be of differing degrees of severity. Therefore, authen-tic tests with different profiles of student performance need to be used indiscussions and interpretations of rating criteria of oral proficiency in Eng-lish. 9 Bedömningsmaterial språk, Skolverket, 2001, can be used for thispurpose (= Material for the Assessment of Language, The National Agencyfor Education, 2001) as well as the National Tests of English since 1995,which contain useful discussions and valuable comments on examples ofstudent performance and which are free for schools and teachers to use.
The third part of the suggested further training of English teachers would
9 In the early 1990s, material for in-service training was provided by the Foreign LanguageTeaching and Testing Research Unit, Gothenburg University, both for compulsory schools andfor upper secondary schools. These video-tapes and the accompanying study material wereordered by many schools in Sweden.
272
include methods in carrying out oral proficiency tests. The students felt thatin the oral proficiency interviews carried out by the Native Speakers theywere, to some extent, more often given the opportunity to show their com-petence than in the other two interviews. It was certainly of importance thattwo of the three Native Speakers in the Gothenburg Project had been exam-iners for the Cambridge Examinations in Sweden for more than twentyyears. Very experienced and well-trained examiners can enable students toshow their oral competence in English better than other examiners can.Training of teachers in efficient ways of carrying out oral proficiency inter-views should therefore be of great importance for two reasons: firstly, stu-dents who are weak in written English should be given the opportunity toshow their oral competence and, secondly, school grades should not only bebased on the students’ written, but also on their oral proficiency.
It has been pointed out several times that the results of the Gothenburgproject gave evidence that even the nine very experienced examiners tendedto give different grades to individual students’ production. It was also inter-esting that some differences could be observed between the members of theinterviewer categories regarding the grades they assigned and the occur-rence of certain linguistic features. One such difference was betweenSchool Teachers and Native Speakers. The School Teachers seem to havepaid more attention to grammatical accuracy and the Native Speakers seemto have had a notion of communicative competence where accuracy plays aless important role. This finding should be a very fruitful starting point fora discussion of principles in the assessment of oral proficiency.
Evidently, many things have changed since 1993 when the material ofthe Gothenburg project was collected. Today, in 2003, this material never-theless provides useful information on the assessment of students’ oral per-formance in English. In the assessment of language proficiency, oral testingmay be more problematic than written testing but is by no means less im-portant. It is to be hoped that the present study will contribute to the devel-opment and discussion of useful techniques in oral proficiency testing andto the improvement of the methods used for assessing oral proficiency inschools.

273
Bibliography
Aagard, R. and O. St. John. 2002. Revving up speaking 2. Stockholm: Almqvist andWiksell.
Aijmer, K. 2001. Interaktivitet i samtal. Språkboken. Ed. by P. Malmberg and R.Ferm. Stockholm: Liber. 84–93.
Aijmer, K. and M. Olsson. 1990. Handbok i talad engelska. Lund: Studentlitteratur.Albrechtsen, D., B. Henriksen and C. Faerch. 1980. Native speaker reactions to
learners’ spoken interlanguage. Language Learning 30: 365–96.Alderson, C.J. 1993. The state of language testing in the 1990s. Language testing:
new openings. Ed. by A. Huhta, K. Sajavaara and S. Takala. Jyväskylä: Univer-sity of Jyväskylä. 1–19.
Alderson, C.J., C. Clapham and D. Wall. 1995. Language test construction andevaluation. Cambridge: Cambridge University Press.
Andered, B. 2001. Europarådets Framework – en inspirationskälla för de nya kur-splanerna. Språkboken. Ed. by P. Malmberg and R. Ferm. Stockholm: Liber. 26–37.
Apelgren, B-M. 2001. Foreign language teachers’ voices. Personal theories andexperiences of change in teaching English as a foreign language in Sweden.Göteborg Studies in Educational Sciences 155. Göteborg: Göteborg Studies inEducational Sciences.
Axelsson, M. Westergren. 1994. The sound of English – pronunciation for teachers.Lund: Studentlitteratur.
Axelsson, M. Westergren and A. Hahn. 2001. The use of the progressive in Swedishand German advanced learner English – a corpus-based study. ICAME Journal25: 5–30.
Bachman, L.F. 1990. Fundamental considerations in language testing. Oxford: Ox-ford University Press.
Bachman, L.F. and A.S. Palmer. 1981. The construct validity of the FSI oral inter-view. Language Learning 31/1: 67–86.
Bachman, L.F. and A.S. Palmer. 1982. The construct validation of some componentsof communicative proficiency. TESOL Quarterly 16/4: 449–65.
Ball, W.J. 1986. Dictionary of link words in English discourse. London: Macmillan.Bartning, I. and S. Schlyter. 1986. Oral proficiency tests in French. PU-rapport 5.
Stockholm: Stockholm University.Bialystok, E. 1983. Some factors in the selection and implementation of communi-
cation strategies. Strategies in interlanguage communication. Ed. by C. Faerchand G. Kasper. London: Longman. 100–118.
274
— 1990. Communication strategies – a psychological analysis of second-languageuse. Oxford: Basil Blackwell.
Biber, D. 1988. Variation across speech and writing. Cambridge: Cambridge Uni-versity Press.
Brindley, G. 1991. Defining language ability: the criteria for criteria. Current devel-opments in language testing. Ed. by S. Anivan. Singapore: SEAMEO RegionalLanguage Centre. 139–64.
Brown, G. 1977. Listening to spoken English. London: Longman.Brown, G. A. Anderson, R. Shillcock and G. Yule. 1984. Teaching talk. Strategies
for production and assessment. Cambridge: Cambridge University Press.Brutt-Griffler, J. 2002 World English. Clevedon: Multilingual Matters.Buck, K. (Ed.) 1989. The ACTFL oral proficiency interview. Tester training manual.
Yonkers, New York: The American Council on the Teaching of Foreign Lan-guages.
Bygate, M. 1987. Speaking. Oxford: Oxford University Press.Canale, M. 1983. On some dimensions of language proficiency. Issues in lan-
guage testing research. Ed. by J.W. Oller, Jr. Rowley; MA: Newbury House.333–42.
Canale, M. and M. Swain. 1980. Theoretical bases of communicative approaches tosecond language teaching and testing. Applied Linguistics 1/1: 1–47.
Carroll, B.J. 1985. Make your own language tests. Oxford: Pergamon.Carter, R. 1987. Vocabulary. London: Allen & Unwin.Catford, J.C. 1959. The teaching of English as a foreign language. The teaching of
English. Ed. by R. Quirk and A.H. Smith. London: Oxford University Press.137–59.
Chalhoub-Deville, M. 1995. Deriving oral assessment scales across different testsand rater groups. Language Testing 12: 16–33.
Cheepen, C. and I. Monaghan. 1990. Spoken English – a practical guide. London:Pinter.
Chomsky, N. 1965. Aspects of the theory of syntax. Cambridge, Mass.: MIT Press.Clark, J.L.D. 1975. Theoretical and technical considerations in oral proficiency test-
ing. Testing language proficiency. Ed. by R.L. Jones and B. Spolsky. Arlington,VA: Center for Applied Linguistics. 10–28.
— 1978. Interview testing research at Educational Testing Service. Direct testing ofspeaking proficiency: theory and application. Ed. by J.L.D. Clark. Princeton,NJ: Educational Testing Service. 211–28.
— 1979. Direct versus semi-direct tests of speaking ability. Concepts in languagetesting: some recent studies. Ed. by E.J. Brière and F.B. Hinofotis. WashingtonD.C.: Teachers of English to Speakers of Other Languages (TESOL). 35–49.
Clark J.L.D. and R.T. Clifford. 1988. The FSI/ILR/ACTFL proficiency scales andtesting techniques: development, current status and needed research. Studies inSecond Language Acquisition 10: 129–47.
Coates, J. 1993. Women, men and language. London: Longman.Collins Cobuild English dictionary. 1995. Ed. by John Sinclair. London: Harper
Collins Publishers Ltd.Collins, P. and C. Hollo. 2000. English grammar. An introduction. London: Macmil-
lan Press Ltd.Corder, P. 1981. Error analysis and interlanguage. Oxford: Oxford University
Press.Council of Europe. 2001. Common European framework of reference for lan-
guages: learning, teaching, assessment. Council for Cultural Co-operation, Ed-

275
ucation Committee, Modern Languages Division, Strasbourg. Cambridge:Cambridge University Press.
Crookes, G. 1989. Planning and interlanguage variability. Studies in Second Lan-guage Acquisition 13: 367–83.
Crystal, D. 2000. Who cares about English usage? London: Penguin.Crystal, D. and D. Davy. 1969. Investigating English style. London: Longman. Cummins, J. 1983. Language proficiency and academic achievement. Issues in lan-
guage testing research. Ed. by J. Oller. Rowley, Mass.: Newbury House. 108–26.Cummins, J. and M. Swain. 1986. Bilingualism in education. London: Longman.De Jong, J.H.A.L. and L.W. Van Ginkel. 1992. Dimensions in oral foreign language
proficiency. The construct of language proficiency. Ed. by L. Verhoeven andJ.H.A.L. de Jong. Amsterdam: John Benjamins. 187–205.
Douglas, D. and L. Selinker. 1992. Analyzing oral proficiency test performance ingeneral and specific purpose contexts. System 20/3: 317–27.
Ducroquet, L. 1986. Practical problems for communicative oral language testing.British Journal of Language Teaching 24: 147–151.
Dyson, A.P. 1972. Oral examining in French. London: The Modern Language Asso-ciation.
Edström, E. 1973. Tense, aspect and modality: problems in English for Swedishstudents. Errata. Ed. by J. Svartvik. Lund: Gleerup. 124–33.
Edwardsson, R. 1970. Språkdebatten 1969–1970. Stockholm: Utbildningsförlaget.von Elek, B. 1995. Muntlig prövning i engelska i gymnasieskolan. Språk – ut-
värdering – test. Rapport från ASLA:s höstsymposium Karlstad,10–12 novem-ber 1994. Ed. by Moira Linnarud. Uppsala: ASLA. 1–6.
Ellis, R. 1990. A response to Gregg. Applied Linguistics 11: 384–91.— 1994. The study of second language acquisition. Oxford: Oxford University
Press.van Ek, J.A. 1977. The threshold level for modern language learning in schools.
London: Longman.— 1986. Objectives for foreign language learning. Volume I: Scope. Strasbourg:
Council of Europe.van Els, T. and K. de Bot. 1987. The role of intonation in foreign accent. Modern
Language Journal 71: 147–55.Erickson, G. 1996. Lärare och elever tycker om standardprovet i engelska. Redo-
visning av två enkätundersökningar. Göteborg: Avdelningen för språkpeda-gogik, Institutionen för pedagogik, Göteborgs universitet.
— 1999. Från Sp 8 till Äp 9. Om utvecklingen av ett nytt nationellt prov i engelskai grundskolan. Papers on language learning teaching assessment. Festskrift tillTorsten Lindblad. IPD-rapporter Nr 1999:02. Göteborg: Göteborgs universitet.202–30.
Erickson, G. and L. Börjesson. 2001. Bedömning av språkfärdighet i nationella provoch bedömningsmaterial. Språkboken. Ed. by P. Malmberg and R. Ferm. Stock-holm: Liber. 254–69.
Ericsson, E. 1989. Undervisa i språk. Språkdidaktik och språkmetodik. Lund: Stu-dentlitteratur.
Erman, B. 1987. Pragmatic expressions in English. Stockholm: Almqvist & Wik-sell.
Faerch, C. and G. Kasper. 1980. Processes and strategies in foreign language learn-ing and communication. Interlanguage Studies Bulletin. 5/1: 47–118.
Farhady, H. 1982. Measures of language proficiency from the learner’s perspective.TESOL Quarterly 16/1: 43–59.

276
Fillmore, C.J. 1979. On fluency. Individual differences in language ability and lan-guage behavior. Ed. by C. Fillmore, D. Kempler and W. Wang. New York: Aca-demic Press. 85–101.
Fromkin, V. 1973. The non-anomalous nature of anomalous utterances. Speech er-rors as linguistic evidence. Ed. by V. Fromkin. The Hague: Mouton. 215–69.
Fulcher, G. 1987. Tests of oral performance: the need for data-based criteria. Eng-lish Language Teaching Journal 41: 287–91.
Galloway, V.B. 1980. Perceptions of the communicative efforts of American stu-dents of Spanish. Modern Language Journal 64: 428–33.
van Gelderen, A. 1994. Prediction of global ratings of fluency and delivery in narra-tive discourse by linguistic and phonetic measures – oral performances of stu-dents aged 11–12 years. Language Testing 11/3: 291–319.
Gordon, D. and G. Lakoff. 1971. Conversational postulates. Papers from the seventhregional meeting of the Chicago Linguistics Society. Chicago: Chicago Linguis-tics Society. 63–84.
Greenbaum, S. and R. Quirk. 1970. Elicitation experiments in English. Linguisticstudies in use and attitude. London: Longman.
Grice, H. P. 1968. Utterer’s meaning, sentence-meaning, and word-meaning. Foun-dations of Language 4: 1–18.
Gustafsson, J. and E. Kinrade. 2002. Improve your speaking. B-course. Stockholm:Bonniers.
Gutknecht, C. 1991. Intonation and language learning: the necessity for an integra-tive approach. Teaching English pronunciation. A book of readings. Ed. by A.Brown. London: Routledge. 259–69.
Haastrup, K. 1977. The assessment of oral proficiency. Papers on English languagetesting in Scandinavia. Ed. by A. Zettersten. Anglica et Americana 1. Copenha-gen: Department of English, University of Copenhagen. 59–66.
Hadden, B. 1991. Teacher and nonteacher perceptions of second-language commu-nication. Language Learning 41: 1–24.
Hargevik, S. 2000. Words 10. Göteborg: Utbildningsstaden.Hargevik C. and S. Hargevik. 1993. Hargeviks engelska grammatik. Stockholm:
Almqvist & Wiksell.Heaton, J.B. 1975. Writing English language tests. London: Longman.Henning, G. 1987. A guide to language testing. Cambridge, Mass.: Newbury
House.Higgs, T. V. and R. Clifford. 1982. The push toward communication. Curriculum,
competence and the foreign language teacher. Ed. by T. V. Higgs. Skokie, IL:National Textbook Company. 57–79.
Hildén, R. 2000. Att tala bra, bättre och bäst. Department of Teacher Education.Research Report 217. Helsinki: University of Helsinki.
Hitchman, P. J. 1965. The testing of spoken English: a review of research. TheJournal of the NFER (National Foundation for Educational Research in Englandand Wales). 7: 55–72.
Huhta, A., K. Sajavaara and S. Takala. 1993. Recent developments in National Ex-aminations in Finland. Language testing: new openings. Ed. by A. Huhta, K.Sajavaara and S. Takala. Jyväskylä: University of Jyväskylä. 136–59.
Hultfors, P. 1986. Reactions to non-native English. Part 1: Acceptability and intelli-gibility. Stockholm Studies in English 67. Stockholm: Almqvist & Wiksell In-ternational.
Hurley, D. S. 1992. Issues in teaching pragmatics, prosody and non-verbal commu-nication. Applied Linguistics 13/3: 259–81.

277
Hymes, D. 1972. On communicative competence. Sociolinguistics. Ed. by J.B.Pride and J. Holmes. Harmondsworth: Penguin. 269–93.
Ingram, D. E. 1984. Australian second language proficiency ratings. Canberra,NSW: Department of Immigration and Ethnic Affairs.
Ingram, D. E. and E. Wylie. 1993. Assessing speaking proficiency in the interna-tional English language testing system. A new decade of language testing re-search. Alexandria, Virginia: TESOL. 220–34.
Isitt, D. 1998. Förbättra ditt engelska uttal. Lund: Studentlitteratur.Jaatinen, S. and T. Mankkinen. 1993. The size of vocabulary of university students
of English. Finns as learners of English: three studies. Ed. by K. Sajavaara andS. Takala. Jyväskylä Cross-language Studies 16. Jyväskylä: Department of Eng-lish. University of Jyväskylä. 147–81.
Janicki, K. 1985. The foreigner’s language – a sociolinguistic perspective. Oxford:Pergamon Press.
Johansson, S. 1978. Studies of error gravity – native reactions to errors produced bySwedish learners of English. Gothenburg Studies in English 44. Gothenburg:University of Gothenburg.
Johansson, S. and P. Lysvåg. 1986. Understanding English grammar. Part I: Anoverview. Oslo: Universitetsforlaget.
Johansson, S. and G. Rönnerdal. 1993. English pronunciation – a handbook. Lund:Studentlitteratur.
Jones, R. L. 1985. Some basic considerations in testing oral proficiency. New direc-tions in language testing. Ed. by Y.P. Lee, A.C.Y. Fok, R. Lord and G. Low.Oxford: Pergamon Press. 77–84.
Kachru, B. B. 1992. World Englishes: approaches, issues and resources. State of theart article. Language Teaching 25: 1–14.
Khalil, A. 1985. Communicative error evaluations: native speakers’ evaluation andinterpretation of written errors of Arab EFL learners. TESOL Quarterly 19:225–351.
Köhlmyr, P. 2003. “To err is human …” An investigation of grammatical errors inSwedish 16-year-old learners’ written production in English. Acta UniversitatisGothoburgensis. Gothenburg Studies in English 83. Göteborg: Göteborg Uni-versity.
Labov, W. 1972. Language in the inner city. Studies in the black English vernacular.Philadelphia: University of Pennsylvania Press.
Lado, R. 1961. Language testing. The construction and use of foreign languagetests. London: Longman.
Lakoff, G. 1972. Hedges: a study in meaning criteria and the logic of fuzzy con-cepts. CLS 8: 183–228.
Läroplan för fackskolan. 1965. Skolöverstyrelsens skriftserie. Stockholm:Skolöverstyrelsen.
Läroplan för grundskolan (Lgr 62). 1962. Kungliga Skolöverstyrelsens skriftserie60. Stockholm: Kungliga Skolöverstyrelsen.
Läroplan för grundskolan. Lgr 69. Allmän del. 1969. Stockholm: Skolöverstyrelsen/ Utbildningsförlaget.
Läroplan för grundskolan. Lgr 80. Allmän del. 1980. Stockholm: Skolöverstyrelsenoch Utbildningsförlaget.
Läroplan för gymnasieskolan. Lgy 70. 1970. Stockholm: Utbildningsförlaget.Läroplan för gymnasiet. 1965. Skolöverstyrelsens skriftserie. Stockholm: Skolöver-
styrelsen.Läroplaner för det obligatoriska skolväsendet och de frivilliga skolformerna. Lpo
94, Lpf 94. 1994. Stockholm: Utbildningsdepartementet.

278
Larsen-Freeman, D. 1976. An explanation for the morpheme acquisition order ofsecond language learners. Language Learning 26: 125–34.
Lazaraton, A. 1996. Interlocutor support in oral proficiency interviews: the case ofCASE. Language Testing 13/2: 151–72.
Leech G. and J. Svartvik. 1975. A communicative grammar of English. London:Longman.
Lehtonen, J. 1977. Contrastive phonetics and the analysis of speechcommunication.Contrastive papers. Jyväskylä Contrastive Studies 4. Reports from the Depart-ment of English. Jyväskylä: University of Jyväskylä. 31–44.
Lehtonen, J., K. Sajavaara and A. May. 1977. Spoken English. The perception andproduction of English on a Finnish English contrastive basis. Jyväskylä: Gaud-eamus.
Lennon, P. 1990. Investigating fluency in EFL: a quantitative approach. LanguageLearning 40/3: 387–417.
Lindblad, T. 1982. Engelskämnet i den obligatoriska skolan. Engelska i grundsko-lan. Pedagogiska skrifter 264. Stockholm: Sveriges Lärarförbund. 9–47.
— 1990. Prov och bedömning i främmande språk. Kommentarmaterial Lgr 80.Undervisning i främmande språk. Stockholm: Skolöverstyrelsen och Utbildn-ingsförlaget. 274–98.
— 1991. Bedömningar, betyg och prov – några begreppsdefinitioner. ”Allt är rel-ativt.” Centralt utarbetade prov i svenska, matematik, engelska, franska,tyska, fysik och kemi – beskrivning, analys, förslag. Ed. by T. Lindblad. Rap-port nr 1991:03. Göteborg: Institutionen för pedagogik, Göteborgs universitet.17–43.
— 1992. Oral tests in Swedish schools: a five-year experiment. System 20/3: 279–92.
Linnarud, M. 1986. Lexis in composition – a performance analysis of Swedishlearners’ written English. Lund Studies in English 74. Lund: Liber.
Ljung, M. and S. Ohlander. 1992. Gleerups engelska grammatik. Malmö: Gleerups. Lowe, P. 1976. The oral language proficiency test: interagency language roundta-
ble. Washington D.C.: U.S. Government.Magnan, S.S. 1987. Rater reliability of the ACTFL oral proficiency interview. The
Canadian Modern Language Review 43: 525–37.Malmberg, P. 1985. 1985. Engelska. Stockholm: Liber Utbildningsförlaget.— 1990. Språksynen i grundskolans läroplaner. Kommentarmaterial Lgr 80.
Undervisning i främmande språk. Stockholm: Skolöverstyrelsen och Utbildn-ingsförlaget. 11–39.
— 2001. Språksynen i dagens kursplaner. Språkboken. Ed. by P. Malmberg and R.Ferm. Stockholm: Liber. 16–25.
Marklund, S. 1987. Skolsverige 1950–1975. Del 5. Läroplaner. Stockholm: Ut-bildningsförlaget.
Mays, D.V. 1982. Cross cultural social status perception in speech. Studies in Sec-ond Language Acquisition 5/1: 52–64.
McNamara, T. 1996. Measuring second language performance. London: Longman.— 2000. Language testing. Oxford: Oxford University Press.Minugh, D. 1991. On pronouncable English: a handbook of English pronunciation.
Stockholm Papers in English Language and Literature: Education Publication 6.Stockholm: University of Stockholm.
Morrow, K. 1979. Communicative language testing: revolution or evolution? Thecommunicative approach to language teaching. Ed. by C. Brumfit and K. John-son. London: Oxford University Press. 143–57.

279
Newbrook, M. 1991. Received pronunciation in Singapore: a sacred cow? TeachingEnglish pronunciation. A book of readings. Ed. by A. Brown. London: Routledge.72–86.
Oller, J.W. 1979. Language tests at school. London: Longman.Oller, J.W. and F.B. Hinofotis. 1980. Two mutually exclusive hypotheses about sec-
ond language ability: indivisible or partially divisible competence. Research inlanguage testing. Ed. by J.W. Oller and K. Perkins. Rowley, Mass.: NewburyHouse. 13–23.
Olsson, C. 1996. Missa inte att pröva eleverna muntligt! Lingua 1996/4. 19–23.Olsson, M. 1973. The effects of different types of errors in the communication
situation. Errata. Ed. by J. Svartvik. Lund: Gleerups. 153–60.— 1978. Intelligibility – an evaluation of some features of English produced by
Swedish 14-year-olds. Gothenburg Studies in English 40. Gothenburg: Univer-sity of Gothenburg.
Östman, J.-O. 1981. You know: a discourse functional approach. Amsterdam: JohnBenjamins B.V.
Oxford advanced learner’s dictionary. 1995. Ed. by A.S. Hornby. Oxford: OxfordUniversity Press.
Paradis, C. 1997. Degree modifiers of adjectives in spoken British English. LundStudies in English 92. Lund: Lund University Press.
Petti, V. 1979. Code of errors. An assessment of errors in English made by Swedishstudents. Stockholm: Akademilitteratur.
Phillipson, R. 1977. Diagnostic testing of spoken English. Papers on English lan-guage testing in Scandinavia. Ed. by A. Zettersten. Anglica et Americana 1.Copenhagen: Department of English. University of Copenhagen. 67–78.
Pietilä, P. 1999. L2 Speech: Oral proficiency of students of English at universitylevel. Anglicana Turkuensia 19. Turku: University of Turku.
Porter, D. 1991. Affective factors in language testing. Language testing in the1990s. Ed. by C. Alderson and B. North. London: Macmillan. 32–40.
Poulisse, N. 1989. The use of compensatory strategies by Dutch learners of English.Enschede: Sneldruk.
Quirk, R. and J. Svartvik. 1966. Investigating linguistic acceptability. The Hague:Mouton.
Quirk, R., S. Greenbaum, G. Leech and J. Svartvik. 1985. A comprehensive gram-mar of the English language. London: Longman.
Reed, D. J. 1992. The relationship between criterion-based levels of oral proficiencyand norm-referenced scores of general proficiency in English as a second lan-guage. System 20/3. 329–46.
Rende, C. G. and V. Petti. 1990. Engelska synonymordboken. Uppsala: Almqvist &Wiksell.
Richards, J.C. and R.W. Schmidt. 1983. Conversational analysis. Language andcommunication. Ed. by J.C. Richards and R.W. Schmidt. London: Longman.117–55.
Riggenbach, H. 1991. Toward an understanding of fluency: a microanalysis of non-native speaker conversations. Discourse Processes 14: 423–41.
Rydén, M. 1997. On the panchronic core meaning of the English progressive. Toexplain the present: studies in the changing English language in honour ofMatti Rissanen. Ed. by T. Nevalainen and L. Kahlas-Tarkka. Helsinki: SociétéNéophilologique. 419–29.
Sajavaara, K. and J. Lehtonen. 1978. Spoken language and the concept of fluency.Focus on spoken language. Language Centre News. Special Issue 1. Jyväskylä:University of Jyväskylä. Language Centre for Finnish Universities. 23–57.

280
Saleva, M. 1997. Now they’re talking. Testing oral proficiency in a language labora-tory. Studia Philologica Jyväskyläensia 43. Jyväskylä: University of Jyväskylä.
Sasaki, M. 1996. Second language proficiency, foreign language aptitude and intel-ligence. Quantitative and qualitative analyses. New York: Peter Lang.
Saunders, N. 1987. Morphophonemic variation in clusters in Japanese English. Lan-guage Learning 37: 247–72.
Schiffrin, D. 1985. Conversational coherence: the role of well. Language 61: 640–67.
— 1987. Discourse markers. Cambridge: Cambridge University Press.Schourup, L.C. 1985. Common discourse particles in English conversation. New
York: Garland.Scott, M.S. and G.R. Tucker. 1974. Error analysis and English language strategies
of Arab students. Language Learning 24: 69–97.Seliger, H.W. 1980. Utterance planning and correction behaviour: its function in the
grammar construction process for second language learners. Towards a cross-linguistic assessment of speech production. Ed. by H.W. Dechert and M.Raupach. Frankfurt: Verlag Lang. 87–100.
Selinker, L. 1972. Interlanguage. International Review of Applied Linguistics 10:209–30.
Shiels, J. 1988. Communication in the modern languages classroom. Strasbourg:Council of Europe.
Shohamy, E. 1982. Affective considerations in language testing. The Modern Lan-guage Journal 6: 13–17.
— 1988. A proposed framework for testing the oral language of second/foreignlanguage learners. Studies in Second Language Acquisition 10: 165–80.
Shohamy, E., T. Reves and Y. Bejarano. 1986. Introducing a new comprehensive testof oral proficiency. English Language Teaching Journal 40/3: 212–20.
Simensen, A.M. 1998. Teaching a foreign language. Principles and procedures.Bergen-Sandviken: Fagbokforlaget.
Skolverket. 1993. Engelska. Huvudrapport. Den nationella utvärderingen av gr-undskolan. Skolverkets rapport nr 16. Stockholm: Liber.
— 1999. Barnomsorg och skola. Jämförelsetal för huvudmän. Skolverkets rapportnr 165. Stockholm: Liber.
— 2001. Bedömningsmaterial språk. Muntlig och skriftlig produktion och interak-tion. Stockholm: Liber.
Snow, C.E. and M.E. Dolbear. 1989. The relation of conversational skill to languageproficiency in second language learners. Unpublished manuscript. HarvardUniversity, Graduate School of Education. Cambridge, Massachusetts.
Spolsky, B. 1976. Language testing: art or science? Proceedings of the Fourth Inter-national Congress of Applied Linguistics. Ed. by G. Nickel. Stuttgart: Hochs-chulverlag. Vol. 3: 9–28.
— 1985. What does it mean to know how to use a language? An essay on thetheoretical basis of language testing. Language Testing 2:180–91.
Stenström, A.-B. 1984. Questions and responses in English conversation. Lund:Liber.
— 1994. An introduction to spoken interaction. London: Longman.St. John, J. 1992. The Ontario test of ESL oral interaction. System 20/3: 305–16.Svartvik, J. 1980. Well in conversation. Studies in English linguistics for Randolph
Quirk. Ed. by S. Greenbaum, G. Leech and J. Svartvik. London: Longman.167–77.
— 1985. Den språkliga normen – finns den i engelska? Lingua 1/1985: 41–7.

281
— 1990. Spelar grammatiken någon roll i en kommunikativ språkundervisning?Kommentarmaterial Lgr 80. Undervisning i främmande språk. Stockholm:Skolöverstyrelsen och Utbildningsförlaget. 110–21.
— 1999. Engelska: öspråk, världsspråk, trendspråk. Stockholm: Norstedts.Svartvik, J. and O. Sager. 1971. Modern engelsk grammatik. Stockholm: Esselte
Studium.Takala, S. 1984. Evaluation of students’ knowledge of English vocabulary in the
Finnish comprehensive school. Jyväskylä: Institute for Educational Research.University of Jyväskylä.
Tarone, E. 1977. Conscious communication strategies in interlanguage: a progressreport. On TESOL ’77. Teaching and learning English as a second language.Ed. by H.D. Brown, C.A. Yorio and R.C. Crymes. Washington D.C.: TESOL.194–203.
— 1985. Variability in interlanguage use: a study of style-shifting in morphologyand syntax. Language Learning 35: 373–403.
Tarone, E. and G. Yule. 1989. Focus on the language learner. Oxford: Oxford Uni-versity Press.
Tauroza, S. and D. Allison. 1990. Speech rates in British English. Applied Linguis-tics 11/1: 90–105.
Taylor, D. 1988. The meaning and use of the term “competence” in linguistics andapplied linguistics. Applied Linguistics 9: 148–68.
Thagg-Fisher, U. 1986. The sweet sound of concord – a study of Swedish learners’concord problems in English. Lund Studies in English 73. Lund: Gleerups.
Thorén, B. 1957. Mål, medel och metoder vid skolans språkundervisning. Lund:Gleerups.
Tornberg, U. 2000. Språkdidaktik. Malmö: Gleerups.Trollfjärden, C. and M. Svedberg. (Forthcoming.) Speak up! Malmö: Gleerups.Trudgill, P. 1990. The dialects of England. Oxford: Basil Blackwell. Underhill, N. 1987. Testing spoken language. Cambridge: Cambridge University
Press.Valette, R.M. 1967. Modern language testing. New York: Harcourt Brace Jovanov-
ich. Váradi, T. 1983. Strategies of target language learner communication: message ad-
justment. Strategies in interlanguage communication. Ed. by C. Faerch and G.Kasper. London: Longman. 79–99.
Walker, C.R. 1981. Reliability and validity of global versus analytic mark schemesin oral proficiency testing. M.A. Dissertation. York: York University.
— 1983. The whole is more than the sum of the parts – evaluation criteria in oraltests. British Journal of Language Teaching. 21/1: 41–4.
Wardhaugh, R. 1985. How conversation works. Oxford: Blackwells.Washburn, L. 1997. English immersion in Sweden. Stockholm: Stockholm Univer-
sity.Weir, C. 1988. Communicative language testing. Exeter Linguistic Studies 11. Exe-
ter: University of Exeter.— 1990. Communicative language testing. Hampstead: Prentice Hall.Widdowson, H. 1983. Learning purpose and language use. Oxford: Oxford Univer-
sity Press.Wilds, C.P. 1975. The oral interview test. Testing language proficiency. Ed. by
R.L. Jones and B. Spolsky. Arlington, VA: Center for Applied Linguistics. 29–44.
Wood, R. 1991. Assessment and testing. Cambridge: Cambridge University Press.

282
Woods, A., P. Fletcher and A. Hughes. 1986. Statistics in language studies. Cam-bridge: Cambridge University Press.
Yorozuya, R. and J.W. Oller. 1980. Oral proficiency testing: construct validity andthe halo effect. Language Learning 30/1: 135–53.
Young, R. 1993. Functional constraints on variation in interlanguage morphology.Applied Linguistics 14: 76–97.
Young, R. and M. Milanovic. 1992. Discourse variation in oral proficiency inter-views. Studies in Second Language Acquisition 14/4: 403–24.

283
Appendix

284

285
APPENDIX 1
The Organisation of the Project: The Numbers Given to the Tests
(Red Test=School Teacher, Blue Test=University Teacher, Green Test=Na-tive Speaker).
Student Red Test Blue Test Green Test
A 76 31 70B 77 32 71C 78 33 72D 79 34 73E 80 35 74F 81 36 75G 82 37 68H 83 38 69I 84 39 67J 85 40 66K 86 41 65L 87 42 64M 88 43 63N 89 43 62O 90 45 61P 1 60 16Q 2 59 17R 3 58 18S 4 57 19T 5 56 20U 6 55 21V 7 54 22W 8 53 23X 9 52 24Y 10 51 25Z 11 50 26XX 12 49 27YY 13 48 28ZZ 14 47 29WW 15 46 30

286
APPENDIX 2
The Distribution of the Interviewers in the Tests on 8 May, 1993
(ST=School Teacher, UT=University Teacher, NS=Native Speaker).
Student Red Test Blue Test Green Test
A ST1 UT1 NS3B ST1 UT2 NS1C ST1 UT3 NS2D ST1 UT1 NS1E ST1 UT2 NS2F ST1 UT3 NS3G ST1 UT1 NS2H ST1 UT2 NS3I ST1 UT3 NS2J ST1 UT1 NS3K ST2 UT2 NS1L ST2 UT3 NS2M ST2 UT1 NS3N ST2 UT2 NS2O ST2 UT3 NS3P ST2 UT1 NS1Q ST2 UT2 NS2R ST2 UT3 NS1S ST2 UT1 NS2T ST2 UT2 NS3U ST3 UT3 NS2V ST3 UT1 NS3W ST3 UT2 NS1X ST3 UT3 NS1Y ST3 UT1 NS2Z ST3 UT2 NS2XX ST3 UT3 NS3YY ST3 UT1 NS1ZZ ST3 UT2 NS3WW ST3 UT3 NS1

287
APPENDIX 3
The Organisation of the Tests on 8 May, 1993
The tests are over at 13.40.
Tasks in the tests:Task 1 (to entertain): E1, E2, E3Task 2 (to inform): I1, I2, I3Task 3 (to argue a case): A1, A2, A3
Tasks in oral tests assessed by School Teachers (Red): E1, I1 and A1Tasks in oral tests assessed by University Teachers (Blue): E2, I2, A2Tasks in oral tests assessed by Native Speakers (Green):E3, I3, A3
Time Red1 Red2 Red3 Blue1 Blue2 Blue3 Green1 Green2 Green3
10.00 A K U Y Z C W E M10.20 B L V D N X WW S XX10.40 C M W A E U K Y T11.00 D N X V B L YY Q H11.20 E O Y G K R I C ZZ11.40 BREAK12.00 F P Z YY ZZ WW B L J12.20 G Q XX S T I D N V12.40 H R YY J W F P U O13.00 I S ZZ M Q XX X G A13.20 J T WW P H O R Z F

288
APPENDIX 4A
The Instructions and Tasks of the Students in Tests with School Teachers
INSTRUCTIONS FOR THE STUDENT
You are going to take part in a test in which you are expected to speakEnglish. The test has three parts. You have about ten minutes to prepare forwhat you are going to talk about in the first two parts.
Important! You should do most of the talking! Don’t wait for your teacher toask questions. What you say will be recorded on a cassette player.
Part 1 Look at the six pictures on the next page. You will be asked totell your teacher about the car mechanic, Mr Brown.– Describe what happened to Mr Brown last Friday.– How did he manage to get out of the cinema? Try to work out
a solution!
Part 2 You have been given three topics. Choose one! You will beasked to tell your teacher (who represents a person who doesnot know very much about the subject) as much as you canabout it. Try to make as interesting as possible!
Please also read the information below about Part 3.
Part 3 Your teacher will present three topics to you. You must chooseone and argue for it as best you can. Your teacher will play therole of a journalist. Remember that you should do most of thetalking.

289

290
UPPGIFT 2
1. Midsummer in Sweden
2. An important meeting in my life
3. A book I would like to read again
UPPGIFT 3
1. It’s necessary to have marks at school or
it’s not necessary to have marks at school
2. The age for getting a driving license should be lowered or The age for getting a driving license should be raised
3. Using animals in scientific experiments is necessary for progressor
Using animals in scientific experiments should be prohibited.

291
APPENDIX 4B
The Instructions and Tasks of the Students in Tests with University Teachers
INSTRUCTIONS FOR THE STUDENT
You are going to take part in a test in which you are expected to speakEnglish. The test has three parts. You have about ten minutes to prepare forwhat you are going to talk about in the first two parts.
Important! You should do most of the talking! Don’t wait for your teacher toask questions. What you say will be recorded on a cassette player.
Part 1 You have friends in England – a family of four - who havedecided to rent a furnished summer house in Sweden for twoweeks. You have promised to help them find a house and youhave two suggestions. You are expecting a phone call from oneof these friends who wants to learn about what you have found.
Your interviewer is acting as your Englishfriend. Your task is todescribe the two houses and the surroundings with the help ofthe drawings on the next page. You have been to see bothhouses.
– First you describe the modern house: the inside of the houseitself, the garden, the surroundings, the cost etc.
– Then you do the same thing with the old house.
When you have met the interviewer, the telephone conversation begins!You start the conversation. Part 2 You have been given three topics. Choose one! You will be
asked to tell your teacher (who represents a person who doesnot know very much about the subject) as much as you canabout it. Try to make as interesting as possible!
Please also read the information below about Part 3.
Part 3 Your teacher will present three topics to you. You must chooseone and argue for it as best you can. Your teacher will play therole of a journalist. Remember that you should do most of thetalking

292

293
UPPGIFT 2
1. New Year celebrations in Sweden/in my homeland
2. An elderly person that I like
3. A memorable journey
UPPGIFT 3
1. It is better to start a family early in lifeorIt is better to start a family when you are older
2. The lower age-limit for inter-railing should be twenty-one orThe lower age limit for inter-railing should be sixteen
3. Adults have the same ability to learn new things as young people haveor
Adults don’t have the same ability to learn new things as young people have
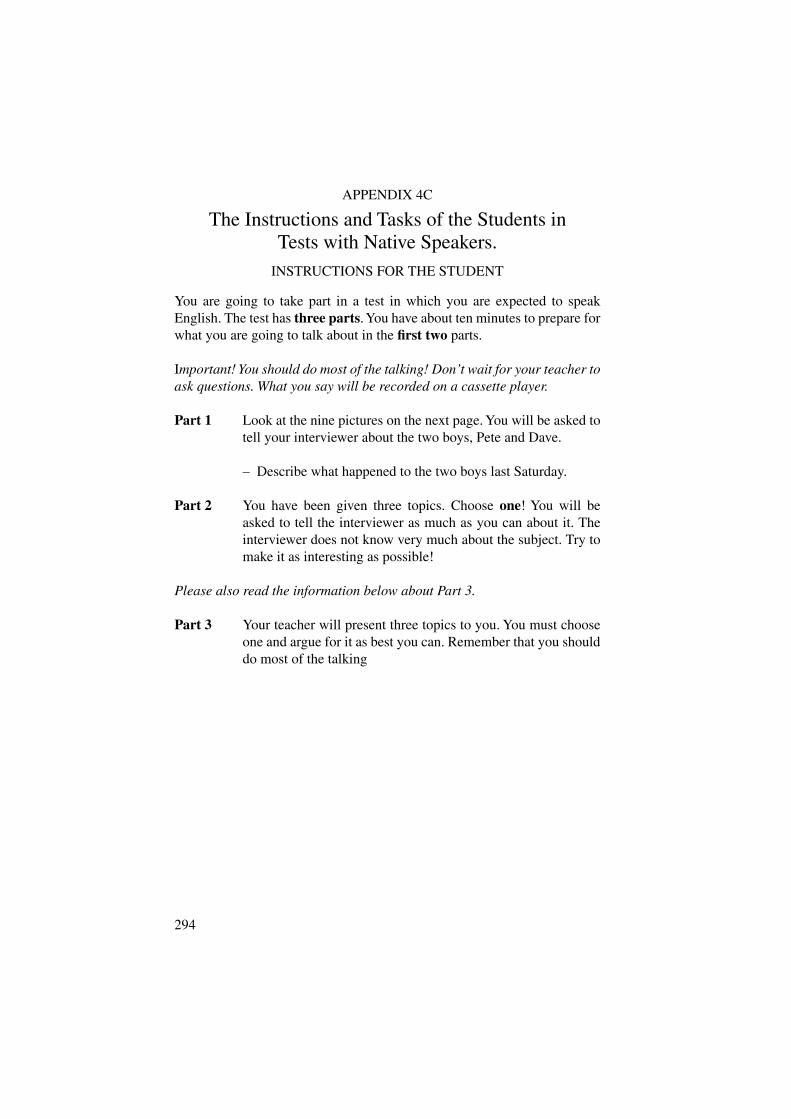
294
APPENDIX 4C
The Instructions and Tasks of the Students in Tests with Native Speakers.
INSTRUCTIONS FOR THE STUDENT
You are going to take part in a test in which you are expected to speakEnglish. The test has three parts. You have about ten minutes to prepare forwhat you are going to talk about in the first two parts.
Important! You should do most of the talking! Don’t wait for your teacher toask questions. What you say will be recorded on a cassette player.
Part 1 Look at the nine pictures on the next page. You will be asked totell your interviewer about the two boys, Pete and Dave.
– Describe what happened to the two boys last Saturday.
Part 2 You have been given three topics. Choose one! You will beasked to tell the interviewer as much as you can about it. Theinterviewer does not know very much about the subject. Try tomake it as interesting as possible!
Please also read the information below about Part 3.
Part 3 Your teacher will present three topics to you. You must chooseone and argue for it as best you can. Remember that you shoulddo most of the talking

295

296

297
UPPGIFT 2
1. The way we celebrate a wedding in Sweden/ my homeland
2. My hobby
3. What my home area has to offer a tourist
UPPGIFT 3
1. Keeping up with new trends in clothing styles is important or
Keeping up with new trends in clothing styles is not important
2. Equality between men and women has come a long way, especially inSwedenorEquality between men and women has not made very much progress atall, not even in Sweden
3. Sweden would gain a lot by being host to the Olympic GamesorSweden would not gain a lot by being host to the Olympic Games
298
APPENDIX 5
The Instructions for the InterviewersINSTRUCTIONS FOR THE INTERVIEWER
You are going to lead an exam of oral proficiency in English. The aim of theexam is to make the student speak as much as possible and speak more orless freely.
There are three parts in the exam:
Part 1 With the help of some pictures the student is to tell a story ortake part in a telephone conversation about two houses.
Part 2 The student is to inform about something you are supposed toknow very little about. The student chooses one out of threetopics.
Part 3 The student is to argue a case. The student chooses one out ofthree cases and you are to help the student by taking the otherstandpoint and have a discussion.
Try to make the student speak as much as possible so that you have enoughlanguage to be able to assess the student’s oral proficiency.
The exam should take approximately 10 minutes and not more than 15minutes.
Immediately after the exam you should make your assessment on the OralMark Sheet.

299
APPENDIX 6
The Questionnaire to the Interviewers 1. What is your opinion in general about the tasks the students were given
in this oral proficiency interview? Did they get the opportunity to show– for better or for worse – their proficiency in English?
2. Did one of the three tasks in the interview turn out to give more informa-tion for the assessment than the others? If so, which one? Do you thinkthat the tasks could have been changed to the better in some way? Couldone of the tasks have been left out?
3. What is your reaction to the rating criteria? Are they clear and useful?4. What aspects of the English language and what linguistic variables
played the most important role when you made your assessment of theoral proficiency interviews? What was of importance in the student’soral proficiency when you gave a good mark? Are there any cruciallinguistic variables that lead to a good assessment? Try to describe, forexample, five aspects that you noticed and that you think are important.
5. What is especially disturbing in some students’ spoken English? What isthere in particular in the language that makes you give a low rating? Arethere any strategies which are very characteristic of low-achievers? Arethere any linguistic errors that you noticed and that you think are signif-icant for the assessment?

300
APPENDIX 7
The Questionnaire to the Students(The questions were in Swedish in the hand-out to the students; my transla-tion.)
1. Name and class at your school?2. Boy or girl? What year were you born?3. Programme studied at gymnasieskolan?4. Your three test numbers during the day?5. Your grade in English at school?6. Your grades in Swedish at school?7. Other languages you study now? Grades?8. How many weeks/months have you been in English-speaking countries
(including holidays, language courses, school journeys)?9. How many weeks/months have you been in other countries abroad than
Denmark, Norway, Finland and Iceland?10. Have you participated in a summer language course arranged by for
instance EF, STS, SIS or other organisation?11. Have you ever read an English book in your spare time?12. Do you have the possibility to watch an English or American TV-chan-
nel such as CNN or BBC at home?13. How many times a month on average do you think that you have seen a
film (TV, video or cinema) in English the last year?14. Do you think that you were given the opportunity to show what you
know in the conversations today?15. In the conversations today there were three tasks, the first one was in-
tended to be the easiest one, the third task was intended to be the mostdifficult one. Was one of the tasks good or bad?
16. Was one of the interviewers “easy to talk to” and made you do justice toyourself? Was one of the interviewers “difficult to talk to” which madeyou say less that you had been able to do?
17. Other ideas and opinions on oral proficiency testing and the structure ofthe tests used today that you would like us to know?

301
APPENDIX 8
The Rating CriteriaRating criteria for oral tests of English
1. Global Evaluation:This is the first and overall impression of the language produced by the learner. The assessment is given on a five-step scale.A – Distinction: A fluent and overall correct use of English.B – Very Good: Very good production with minor inaccuracies.C – Pass: Acceptable language in spite of errors.D – Not enough: Not showing enough to be acceptable.E – Poor: Poor production of English in many respects.
2. Factorial Grading:Three different factors are to be considered in the assessment, namely2a Communication and Fluency2b Grammar and Vocabulary2c Pronunciation
2a Communication and Fluency
2b Grammar and Vocabulary
2c Pronunciation
A Comfortable and completely fluent. Performs with ease. Long and exhaustive an-swers. Takes frequent initia-tives.
Accurate use of a wide range of structures. Very good range of vocabulary. Errors never disturbing.
Correct pronunciation of individual sounds and very good intonation and rhythm. A foreign accent may be discernible.
B Extended contributions at nat-ural speed and tempo. Very easy to understand. Occa-sional hesitations and pauses for language searching. Takes initiatives.
Use of vocabulary and struc-tures appropriate in most contexts. Few errors when using complex structures. Basic errors very rare.
Very good pronunciation. Good intonation and rhythm. Some influence of native language clearly de-tectable.
C Easy to understand. Takes some initiatives. Sometimes produces longer and fairly coherent flow of language.
Some inaccuracies and a few noticeable basic errors but in general a good com-mand of structure and vo-cabulary. Range of vocabu-lary adequate.
Good pronunciation of most of the individual sounds and acceptable into-nation. Foreign accent evi-dent.
D Initiatives are rare and con-tributes little. Needs help.
Structures limited in range. Basic errors are noticeable. Dependent on paraphrase of simplification. Shows a lim-ited vocabulary resource.
Individual sounds poorly articulated. Some utter-ances difficult to under-stand, putting strain on the listener.
E Frequent hesitations disrupt the flow of language. Speech can be difficult to follow. Constantly needs help.
Makes many kind of mis-takes. Very limited range of vocabulary. Frequent basic errors. Sometimes uses Swedish words.
Difficult to understand due to pronunciation. First lan-guage intonation. Poor ar-ticulation of individual sounds.

302
APPENDIX 9
The Oral Mark SheetORAL MARK SHEET
Candidate’s name: ………………………………….Candidate’s number: .………………………………Marker’s name: …………………………………….
Do you know the candidate? Yes ….. No …..
1. Global Evaluation A B C D EA – DistinctionB – Very GoodC – PassD – Not EnoughE – Poor
This assessment is to be given during or directly after the oral examination.
………………………………………………………………………………
2. Factorial Evaluation
This assessment can be made during and/ or after the oral examinationaccording to the rating criteria given.
a) Communication and Fluency: A B C D E
b) Grammar and Vocabulary: A B C D E
c) Pronunciation: A B C D E
Comments: (e g body language):
………………………………………………………………………………
………………………………………………………………………………
………………………………………………………………………………
………………………………………………………………………………

303
APPENDIX 10
The Length of the Tests
* = The test was not recorded due to technical reasons.
Red tests Blue tests Green tests
Student Test Length Test Length Test Length
A 76 11.10 31 9.20 70 10.15B 77 13.55 32 * 71 10.00C 78 9.40 33 9.50 72 17.50D 79 11.45 34 9.30 73 11.10E 80 10.30 35 * 74 11.20F 81 8.45 36 11.55 75 12.50G 82 9.20 37 10.35 68 13.55H 83 10.25 38 16.00 69 10.00I 84 9.55 39 13.10 67 11.00J 85 18.00 40 10.15 66 11.35K 86 9.45 41 * 65 11.00L 87 9.50 42 11.00 64 13.00M 88 9.10 43 10.20 63 9.55N 89 11.40 44 * 62 16.00O 90 11.30 45 15.55 61 12.40Q 02 12.30 59 17.55 17 17.55R 03 10.25 58 10.50 18 10.55S 04 8.45 57 9.10 19 12.15T 05 14.55 56 12.15 20 12.20U 06 11.00 55 11.20 21 15.00V 07 12.10 54 11.55 22 12.25W 08 8.20 53 11.20 23 10.45X 09 11.15 52 9.35 24 12.15Y 10 12.45 51 9.57 25 18.00Z 11 10.35 50 * 26 13.00XX 12 12.10 49 11.55 27 10.30YY 13 12.00 48 11.00 28 10.50ZZ 14 11.50 47 20.25 29 11.00WW 15 11.50 46 13.30 30 9.45

304
APPENDIX 11
The Number of Students’ Words in the Tests
* = The test was not recorded due to technical reasons.All figures are rounded to tens.
Red tests Blue tests Green tests
Student Test Words Test Words Test Words
A 76 740 31 740 70 710B 77 860 32 * 71 800C 78 910 33 890 72 2010D 79 720 34 710 73 920E 80 970 35 * 74 990F 81 560 36 1060 75 1010G 82 830 37 730 68 1390H 83 700 38 910 69 590I 84 570 39 620 67 510J 85 1100 40 780 66 860K 86 970 41 * 65 1170L 87 790 42 690 64 1070M 88 1030 43 1080 63 870N 89 1040 44 * 62 1090O 90 1220 45 1330 61 1170Q 02 850 59 1200 17 1150R 03 790 58 680 18 640S 04 620 57 730 19 620T 05 1400 56 1130 20 1110U 06 910 55 770 21 1020V 07 1330 54 1180 22 1070W 08 840 53 790 23 810X 09 850 52 480 24 880Y 10 1600 51 1040 25 1920Z 11 1060 50 * 26 1080XX 12 930 49 670 27 570YY 13 1130 48 1060 28 910ZZ 14 650 47 1060 29 660WW 15 1090 46 1010 30 760
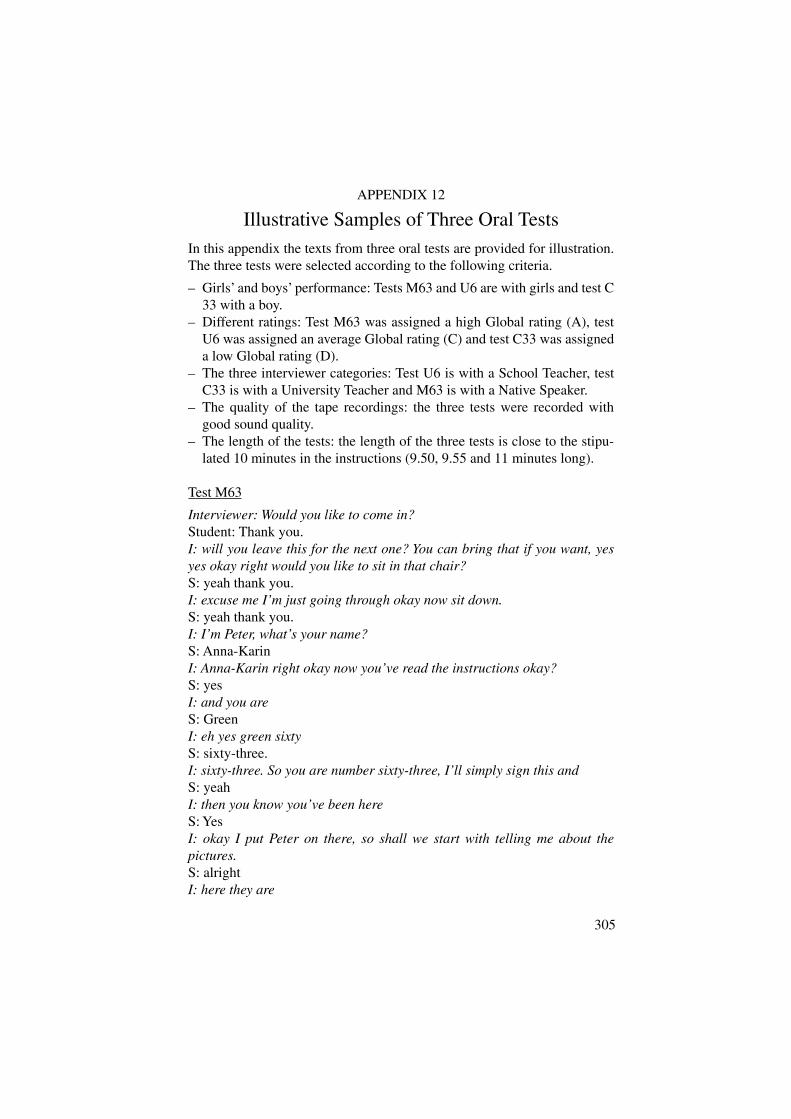
305
APPENDIX 12
Illustrative Samples of Three Oral TestsIn this appendix the texts from three oral tests are provided for illustration.The three tests were selected according to the following criteria.
– Girls’ and boys’ performance: Tests M63 and U6 are with girls and test C33 with a boy.
– Different ratings: Test M63 was assigned a high Global rating (A), testU6 was assigned an average Global rating (C) and test C33 was assigneda low Global rating (D).
– The three interviewer categories: Test U6 is with a School Teacher, testC33 is with a University Teacher and M63 is with a Native Speaker.
– The quality of the tape recordings: the three tests were recorded withgood sound quality.
– The length of the tests: the length of the three tests is close to the stipu-lated 10 minutes in the instructions (9.50, 9.55 and 11 minutes long).
Test M63
Interviewer: Would you like to come in?Student: Thank you.I: will you leave this for the next one? You can bring that if you want, yesyes okay right would you like to sit in that chair?S: yeah thank you.I: excuse me I’m just going through okay now sit down.S: yeah thank you.I: I’m Peter, what’s your name?S: Anna-KarinI: Anna-Karin right okay now you’ve read the instructions okay?S: yesI: and you areS: GreenI: eh yes green sixtyS: sixty-three.I: sixty-three. So you are number sixty-three, I’ll simply sign this andS: yeahI: then you know you’ve been hereS: YesI: okay I put Peter on there, so shall we start with telling me about thepictures.S: alrightI: here they are

306
S: yeah we have then Tom and PeteI: okayS: who were planning eh a day on the beach with picnicI: hmS: and they got to the beach and they sat down they ate eh had a lot of funand suddenly they saw this toy airplane aeroplane on a shelf on theI: ahaS: on a rock big rockI: yesS: and they thought well why don’t we go and get itI: MmS: so they climbed up and they got hold of the plane and then they realizedthat they weren’t able to get downI: ahaS: and this isn’t a good place to stayI: I seeS: So they screamed for help and eh there were some other people on thebeach and they saw them and a lady in aI: yeah turn overS: a fat lady (laughter) in a black swimsuit she saw them and she went to aphone and she called for help she called the probably police or coast guardI: yesS: somethingI: yesS: and they came with a helicopter and they eh took the boys down from theshelfI: ahaS: and then well so they are grateful says thanks a lot to the man whorescued them and to the lady who eh had put on a dress over herI: oh yesS: yeahI: good well I think you’ve told me everything that’s fine that’s right nowS: nowI: number two what are you going to tell me about itS: as wha what my home area has to offerI: okayS: a tourist at allI: yesS: yeah well my home area I see that as Gothenburg and the archipelagoI: archi yes yesS: and eh Gothenburg is the second largest city in Sweden so when it comesto stores and eh amusement all that entertainment

307
I: rightS: we’ve got quite a lot of thatI: mmS: quite a few theatres to go to and eh there are the big amusement parkLisebergI: ahaS: of course who’s quite famous in Europe it’s quite a big parkI: can you tell me a bit about itS: yes it’s a sort of like a Disney concept in a on small scaleI: yesS: we have these little green and pink rabbits insteadI: do you mean people walking aroundS: yeah people walk around as rabbits sort like they do it in Disney tooI: yesS: they have people dressed up as Mickey MouseI: YesS: sort like a logoI: ahaS: and there are of course roller-coaster ridesI: yesS: there are eh eh what can you see more you can eh fortune wheels you cansort of play betsI: oh I see rightS: and then you can see a number comes upI: rightS: win chocolate or little bunniesI: whatS: little bunnies or something like that and eh there are also a big stage therewhere usually eh it’s like groups comes music groups famous in SwedenI: yes pop groupsS: pop groups and eh also I think they usually have some paly for eh littleamusements eh for older people not just it’s not just pop acts it’sI: noS: they sort of like tend to try to get to something to suit everyoneI: yes yesS: and eh it’s quite beautiful you can walk in the park it’s not just amuse-ment they have sort like flowers and a gardenI: restaurant?S: a restaurant too yesI: yesS: so it’s a little bit for everyoneI: do you know what it costs to go in?

308
S: I don’tI: roughlyS: I think it is last year I think it is twenty-five Swedish crowns maybe theyraised it or it is thirty-five nowI: yeah if I just got one day in Gothenburg what would you say I really mustdo?S: eh I would take you to a big park of ours the only really big one calledSlottsskogenI: ahaS: and I think that’s a very beautiful place it’s eh for freeI: rightS: you can can the entrance is for free you could just walk around with eh alot of trees a lot of say animals you got animals too that’s fun for the kidsI: is a zoo is it?S: yeah it’s a zoo tooI: yeahS: it’s sort like a big park you can just walk around you could take a someplay baseballs with your friends or something and then they are this there isa zoo for children but I like to see it I’m not I’m not that young but I like tosee it too it’s the seals it is the main attraction thereI: (laughter) they are rather nice aren’t they?S: okay they are rather niceI: okay let’s leave a bit of timeS: yeahI: for you to eh do the last thing ah you don’t know what that’s it do youS: noI: let me see if I’ve got it here eh somewhere eh that’s number two here weare now you got to choose one of theseS: yeahI: and then we have a discussion about itS: alrightI: but you choose which one you want to doS: let’s see now I think I’ll take number eightI: you take number eightS: equaliI: equality between men and women are you going to say it has come a longway or it hasn’tS: I think I will say it hasn’t it hasn’t made very much progressI: okay okay you tell me a bit about itS: you are always told that it has made a big progressI: yeahS: and maybe in Sweden it’s bigger than in some other places but

309
I: bigger than England yeahS: yeah but still it’s quite a lot of difference between men and women theway they are treated in societyI: give me some examplesS: if you say school for example that’s a good oneI: oh yes that’s a good oneS: eh that’s the one I know about (laughter)I: rightS: and eh well boys boys and girls they are different from the start in a wayof acting girls is sort like theya re expected to be a bit more quiet andbehave themselves a bit more and that could be because girls eh they ma-ture a bit faster than boysI: do you think that’s trueS: yeah I think that that is trueI: yeah yeah okayS: I mean we all catch upI: yesS: but when we talk about like seven-year-olds and eight-year -olds I meanthen it’s it’s a quite a big differenceI: yes yeahS: and boys are allowed to be a bit more mischievous they can playaround they can eh scream a bit more without being treated as there areeh that as problem but if girls do that they are there are problem at onceyou knowI: I seeS: you are not supposed to behave like thatI: right yeah what do you think has still to be done then?S: I think ehI: from what you say this problem starts at homeS: yes it starts at home but it’s eh I think I think it’s not just at home it’s atthe school system too because they allow boys to be a bit more outspokenand eh a bit more loudI: they who is they you have two sorts of teachers men teachers and womenteachersS: no it’s it’s just theI: no differenceS: no it’s I don’t think it’s a difference at that age it’s everyone sort like saysit’s okay and that there is the problem later on when boys tend to continueto do thatI: mmS: and girls sort like have to they don’t get the same attentionI: no right

310
S: and and I think that’s why boys can eh advertise themselves more laterwhen it comes to jobs and they get a bigger they get paid more for the samework as theI: do they is that allowed?S: yesI: not in Sweden surelyS: no if you say it’s eh an what do you say a boss a big boss or a companyI: yeahS: eh if that is a man it tend to be the men who have more payI: I seeS: for that post and that that is either because they are regarded more highlybut that isn’t very likely because it’s almost the same job I: yesS: or they are better to advertise themselvesI: yesS: and then we have the problem with women they someone has to take careof the children when they get ill but that’s usually the womanI: it’s still the woman is it even in SwedenS: yes even in SwedenI: right I’m going to stop there because although it’s very interesting thankyou very much we’ve run out of timeS: yesI: right nice to talk to youS: yeahI: what was it Anna-Karin or?S: Anna-KarinI: Anna-Karin right thanks for comingS: thank youI: now then you are not taking you’re not taking anything which got to stayin here are youS: noI: no that’s okayS: not that oneI: good byeS: good bye
Test U6
Interviewer: hello NadjaStudent: helloI: this is student number six okay go aheadS: yes I should eh tell you about the pictures

311
I: yesS: well the first one is an Mrs eh Mr brown I think he is a car mechanicI: can you speak up a bit?S: he is a car mechanicI: yeahS: and he works eh with his partner Gary and this Friday there isn’t much todo so he fix an engine and eh then he goes home yesI: mmS: and eh picture number two is when Mr Brown is out running he likes tokeep in shape and eh it’s early and he goes out in the forest to run a bit andeh then Gary doesn’t really know what to do he goes out in the town andthere he he sees a poster eh which shows a film Al Capone II and he hasseen the first part of it so he likes he he he think that he should see thesecond one too eh picture number four is when he is in the saloon at thecinema and it’s very exciting but he is very tired because had worked lateall the week long and ja he he is a bit tired but he then he fell asleepI: that’s rightS: and eh yes the people the film finished and the people go home walk outand he doesn’t really see that so he continue to sleep and when he suddenlywakes up of a strange noise there is a eh cockroach at his eh doing somesound he wakes up he is terrified and when he sees that all the people hasgone he really gets scared and he had he noticed also that he is locked in eheh eh yesI: that’s right so what happensS: he eh screams really loud and there is a security guard that come alongand wonder what what’s that noise is and and a security guard enters thecinema saloon and eh he see the terrified Mr Brown on the floor crying andeh so he brings eh Mr Brown poorI: end of story?S: yesI: yeah we have a solution to this problem another solutionS: yesI: it’s gone in that he finds a cellular phone you know what that is?S: mmI: and he phones home or the police or whatever and that’s that’s is thesolution so what do you think about these solutions which one is the best?S: my solution of course (laughter)I: whyS: eh eh then he can that eh this shows how eh how nice people are aroundthat people help one another and eh that you can rely on a on every every-one around you and that’s a nice thought I thinkI: yeah okay let’s go into the next subject you have read it haven’t you

312
S: yesI: so you either are to talk about the Midsummer in Sweden or an importantmeeting in my life or a book I would like to red again which one do youchoose?S: I think I’ll choose number three a book I would like to read againI: mmS: eh it’s a book called Castaneda and Castaneda is the writer and he is a ehprofessor in social anthropology I think it’s called and he was in Mexico tostudy about eh eh magicians old Indian magicians magiciansI: mmS: and eh it isn’t just one book eh there are three three or four books I thinkI: mmS: or more I don’t really know and this is they are very exciting and you canfollow his eh ex experiences and adventure in all these books eh eh Cas-taneda meets magician called Don Juan it isn’t his real name but they callhim so in the book and he has a lot of power he eh knows how to become amagician and he takes Callows eh Castaneda as a pupil or whatever you cansay eh and Castaneda doesn’t know anything about this world about thismagic world that exists really and he learns very much but also loses verymuch because he he have to do many things that he isn’t used to and hisfamily also rejects him a bit because they don’t like thiskind of studies andeh eh it’s very eh interesting to read about this because I think it’s based ehon really happenings but eh but there I don’t think that it’s all reality in thebook it eh fantasy mixed with reality and yes so it isn’t a real story but eh itbecomes very real to you when you read it and there are many things eh ineh in the book that you can eh try that you can think of that exist in your reallifeI: mmS: and that touched many subjects and happenings you can find in your ownworld but not described that they are described differently in the bookI: mm yesS: mmI: yes I’ve never heard about it let’s have another subject somewhere youknow about the third subject that you are going to talk about?S: noI: eh what we are going to discuss now is this you can read it throughS: mmI: which one would you like to talk aboutS: the first oneI: the first one okayS: eh I don’t think it’s necessary to have marks in en school while eh it ehthey are not really justified

313
I: mmS: eh you can’t really note a person I think because give him a mark thatyou are you are like this you are or eh people are people are individuals andthey have many sides that that are good or bad or differentI: mmS: and you can’t say that you are you are this really you are four five ehI: but don’t you think people will work less do less if they don’tS: no I think you should have three marks eh qualified or not qualified orvery good qualifiedI: mmS: you can say and eh you do what you have to do in the school and thenyou get qualifiedI: mmS: and if not you don’t get qualified and you can’t continue and everyonehas to work for being qualifiedI: mmS: and when everyone are that it’s good there isn’t any bad about it and ehI: so you think that is enough? You don’t think that people will do less andthat they won’t do enough?S: no I think that everyone will do as much as they do nowI: you think so?S: yes and what what the good thing about it is that eh eh pupils maybepupils will be happier and not think about the grades so much and eh that ehthere won’t be anger and eh disappointment in in the school they see theyjust have to do they just have to do qualified and then they can do whateverthey want and eh I don’t mean that they won’t study they would of coursestudy it’s interesting to study for them and they can choose whatever theywant to give their energy to and put put energy toI: mmS: andI: yeah okay I think this enough NadjaS: mmI: ah thank you very much S: yes
Test C33
Student: sit down here orInterviewer: yes have a seat hereS: okay yes madam thank youI: right sit there no that seat there you mightS: okay
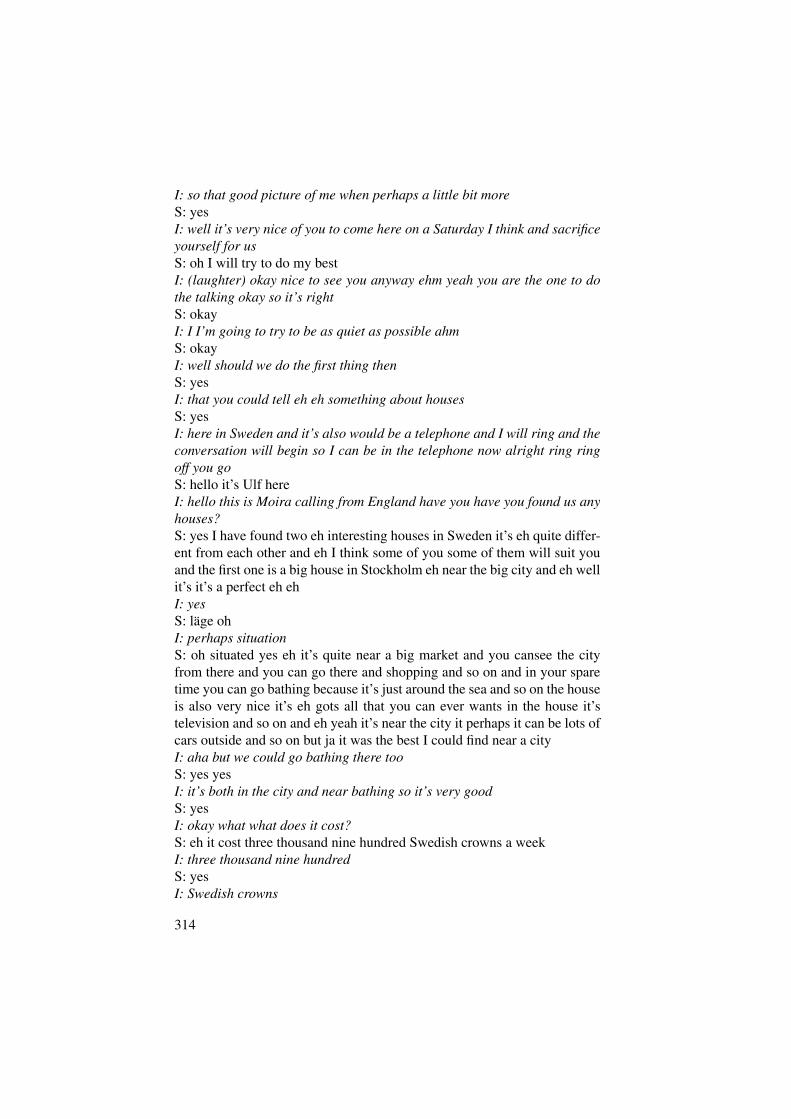
314
I: so that good picture of me when perhaps a little bit moreS: yesI: well it’s very nice of you to come here on a Saturday I think and sacrificeyourself for usS: oh I will try to do my bestI: (laughter) okay nice to see you anyway ehm yeah you are the one to dothe talking okay so it’s rightS: okayI: I I’m going to try to be as quiet as possible ahmS: okayI: well should we do the first thing thenS: yesI: that you could tell eh eh something about housesS: yesI: here in Sweden and it’s also would be a telephone and I will ring and theconversation will begin so I can be in the telephone now alright ring ringoff you goS: hello it’s Ulf hereI: hello this is Moira calling from England have you have you found us anyhouses?S: yes I have found two eh interesting houses in Sweden it’s eh quite differ-ent from each other and eh I think some of you some of them will suit youand the first one is a big house in Stockholm eh near the big city and eh wellit’s it’s a perfect eh ehI: yesS: läge ohI: perhaps situationS: oh situated yes eh it’s quite near a big market and you cansee the cityfrom there and you can go there and shopping and so on and in your sparetime you can go bathing because it’s just around the sea and so on the houseis also very nice it’s eh gots all that you can ever wants in the house it’stelevision and so on and eh yeah it’s near the city it perhaps it can be lots ofcars outside and so on but ja it was the best I could find near a cityI: aha but we could go bathing there tooS: yes yesI: it’s both in the city and near bathing so it’s very goodS: yesI: okay what what does it cost?S: eh it cost three thousand nine hundred Swedish crowns a weekI: three thousand nine hundredS: yesI: Swedish crowns

315
S: I found a lot cheaper oneI: oh I’m gladS: yes but his house is eh eh quite a bit far away from Stockholm if you cansay so it’s eh it’s in the middle of Sweden and it’s situated with with a lakeat eh a very typical lake for Sweden with a boat you eh you can have a boatand go out fishing and so on and it’s two houses one eh one small one and alittle bit biggerI: mmS: eh you have not eh the same eh so much things there you can have to goto take your own water and the bathroom is outside you can sayI: outsideS: yesI: thank God it’s no winter time when I’ll come thereS: no but it’s summer in Sweden it can be goodI: ahaS: and I think it’s in eh a good areaI: ahmS: with eh lots lots of woods around and so onI: aha right what did you say it costS: it cost one thousand six hundred Swedish crowns a weekI: well that sounds a lot more reasonable doesn’t it?S: yes can al… you can also take the car to Stockholm if you want that cartrip it will perhaps stay three four hours so you can se bothI: yeah okay I think the old house sounds pretty goodS: yeahI: it’s about what we can afford so thanks very much then for all your workon my behalf so if you can fix that one for us would make us happy thankyouS: yes I will try to do thatI: okay great oh thank you (laughter) for that part eh fine and the if we nowgo on to the next eh taskS: yes maybeI: it is for you to describe something to meS: yesI: what did youS: eh I have chosen number sixI: number six ehmS: and I will try to describe what I did last summer when I got on InterrailI: ahmS: and I travelled around Europe eh in a month time and I start to go by ifyou go by Interrail you eh buy a card in Sweden there you can go free in alltrain in all train ways trainways all over Sweden eller all over Europe

316
I: ahmS: free and eh I did it with my best friend and we were out to in a monthtime and first we went to Paris eh when we got on further down to RivieraFrance Riviera and where we stayed eh some days eh we eh visit eh eh visiteh eh Cha… the Chagall Museum this was very nice eh and we went on goto Venedig and stayed there some days and then we travelled all throughItaly and from Italy we took a boat over to Greece and in Greece we were inAthen at the first and we went doing everything a tourist should do in Athenthen we took a boat out far away out in the sea out to a little island called ehSantorini a very nice little island with not so much tourists and so on butvery niceI: ahmS: and this have taken approximately three weeks to get all the way throughEurope and eh we began to run out of money we have to began to travelback and eh we did so in a two days time eller or two and half day and nightjust going by train all the way homeI: ahmS: but that was one of the most lovely thing I’ve ever done in my whole lifeI: oh sounds absolutely marvellousS: yesI: did you bring enough of money with you so you could afford to eat as wellS: yes we we eat a lotI: sounds as if you ran out of money in southern Europe, you have starved(laughter)S: no that was eh not so difficult because when we ran out of money we hadokay lots so much money that we could get home alrightI: alright good yeah sounds like a marvellous tripS: yesI: very goodS: yesI: and in a way that connects to maybe one of the questions that you couldbe eh want to discuss eh in the third part of your task have youS: yesI: and which are we are going to argue or discuss rather not argue (laugh-ter)S: mmI: and eh it the questions suggested are here so either we could talk abouteh it’s better to start a family early in life or you know which one you preferup thereS: okayI: or the lower age limit for inter-railing should be twenty-one or the lowerage limit for inter-railing should be sixteen and with all your experience

317
you have something to say about that adults have the same ability to learnnew things as young people have or adults don’t have the same ability tolearn new things as young people have so what you have to do is to chooseone of theseS: I think I choose the first oneI: the first oneS: I prefer thatI: have you got lots of lots of about that okay you you think it’s better tostart a family early in lifeS: I think it’s best to do something in the middleI: ahS: eh because I I think it’s good when you are perhaps twenty-five not tooearly and not too lateI: mmS: when you are older you have to live your life and you travel a lot in thebeginning and then you can make your educationI: ahmS: and then I think it’s better to settle down and take it easy and get kids andso onI: I wonder if you are somewhere in between I wonder if that is early in lifeor later in life or in between eh you know in Britain they think if you if youare not finished with your qualifications in the university when you aretwenty-one then you are really pretty old the problem you think it’s better towait until you are a little bit older okayS: yeahI: eh on the other hand if you are waiting till you are a bit older thenperhaps you are older when your children eh you know sort of argueS: yeahI: wouldn’t you find that a bit tiring and so on so if you imagine when youare sort of about forty years old and you’ve got teenagers around the houseS: I don’t think that will be any troubleI: you don’t think soS: no I don’t think soI: you you think teenagers are are you know they are not so hard to dealwithS: yeah yes I think it’s hard to be with but I think it’s sort of fun and so onand can jaI: mm mmS: it’s cou… give you a kick I thinkI: ahm keep you young perhapsS: what?I: keep you young perhaps

318
S: yesI: when you are bit older (laughter) okay so what will be you think there aresome disadvantages of having a family too earlyS: ehI: in what wha… wha… what would that I mean if you had children abouttwenty, twenty-oneS: if I say for my sake I will first go on travel and then I will get on studyingan I think it’s will be hard to do both at the same timeI: ahmS: and yeah and get a family tooI: mmS: it would be a lot so I think it’s better for me and for the children I that Ihave a got a job a workI: mmS: something when I get children and so onI: mm right okay thanks very much I think perhaps I forgot to say that youare number 33S: okayI: right thank youS: mm thank you very much

319
Index
acceptability 65assessment 12– achievement 31– continuous 32– criterion-referenced 30– delayed 30– direct 30– factorial 32– fixed point 32– formal 30– guided 32– human 30– impression 32– indirect 30– informal 30– knowledge 32– mechanical 30– norm-referenced 30– objective 32– performance 32– proficiency 31– self-assessment 32– semi-direct 30– simultaneous 30– subjective 32background variables 101–103collocational factors 212–213communication, communicative phe-
nomena 264– communication strategy 48– communicative competence 21, 58– communicative language ability 59– communicative language tests 28compensatory strategy 48–51, 151–156,
201–204, 250
discoursal functions 51, 159–162, 163–164, 213
discourse markers 51, 157–158– well 51–53, 158–162, 205–211, 251–
252– you know, 53–54, 162–164, 211–218,
252–254discourse phenomena 266error evaluation 65evincives 52factorial grades 31fluency 33Gothenburg project 17, 18, 21–22, 99–
100grades– factorial 31– global 31grammatical accuracy 264halo-effect 83in-service training for teachers 267intelligibility 65interference 155interviewers’ methods 41–42, 140intonation 165–166, 219–221, 254language testing 27– history 27–29– oral testing 38–44, 68learner language 86lexical errors 47, 151–152, 199–201,
250literal translations 152oral testing, see ‘language testing’oral tests– length 43– tasks 38

320
proficiency 57progressive 46, 144–147, 175–182,
246–247pronunciation 54–56, 165–167, 219–
226, 254–255rating criteria 107reliability 61– inter-rater reliability 63– intra-rater reliability 63speech rate 55–56, 167, 224–226, 254–
255spoken language 51standard English 94stress 166, 221–223, 254students’ attitudes 43, 139–140
third person singular marker 44–46, 143–144, 168–175, 245–246
validity 63– concept validity 64– empirical validity 64– face validity 64– prognostic validity 64vocabulary 46–48, 147–148– abstract nouns 148–149, 184–194,
248–249– modifiers of adjectives 150–151,
194–199, 249–250 word coinage 155written language 51

ACTA UNIVERSITATIS UPSALIENSISStudia Anglistica Upsaliensia
Editores: Rolf Lundén, Merja Kytö & Monica Correa Fryckstedt
1. Stephen Crane: Uncollected Writings.Edited with an Introduction by Olov W.Fryckstedt. 1963.
2. Karl Inge Sandred: English Place-Namesin -stead. 1963.
3. Mats Rydén: Relative Constructions inEarly Sixteenth Century English. WithSpecial Reference to Sir Thomas Elyot.1966.
4. Gunnar Sorelius: “The Giant Race beforethe Flood”: Pre-Restoration Drama onthe Stage and in the Criticism of theRestoration. 1966.
5. Bertil Hedevind: The Dialect of Dentdalein the West Riding of Yorkshire. 1967.
6. Brita Lindberg-Seyersted: The Voice of thePoet: Aspects of Style in the Poetry ofEmily Dickinson. 1968.
7. Mats Rydén: Coordination of RelativeClauses in Sixteenth Century English.1970.
8. Karl Inge Sandred: A Middle English Ver-sion of the Gesta Romanorum edited fromGloucester Cathedral MS 22. 1971.
9. Eva Edgren: Temporal Clauses in Eng-lish. 1971.
10. Lorena Ross Holmin: The Dramatic Worksof Lillian Hellman. 1973.
11. Jessie Thomas Lokrantz: The Underside ofthe Weave: Some Stylistic Devices Usedby Vladimir Nabokov. 1973.
12. Berit Wik: English Nominalizations in-ing. Synchronic and Diachronic As-pects. 1973.
13. Ulf Bäcklund: The Collocation of Ad-verbs of Degree in English. 1973.
14. Ann-Mari Hedbäck: Sir William Dave-nant, The Siege of Rhodes. A Critical Edi-tion. 1973.
15. Sonja Lorichs: The Unwomanly Womanin Bernard Shaw’s Drama and Her So-cial and Political Background. 1973.
16. Rolf Lundén: The Inevitable Equation:The Antithetic Pattern of TheodoreDreiser’s Thought and Art. 1973.
17. Arne Axelsson: The Links in the Chain:Isolation and Interdependence in Nath-aniel Hawthorne’s Fictional Characters.1974.
18. Bengt Lindström: A Late Middle EnglishVersion of the Gospel of Nicodemus. Ed-ited from British Museum MS Harley149. 1974.
19. Alvar Nyqvist Goës: The Stress System ofEnglish. 1974.
20. Sven-Johan Spånberg: The Ordeal of Rich-ard Feverel and the Traditions of Real-ism. 1974.
21. Gunnar Persson: Repetition in English.Part 1. Sequential Repetition. 1974.
22. Mona Pers: Willa Cather’s Children.1975.
23. Wiktoria Dorosz: Subjective Vision andHuman Relationships in the Novels ofRosamond Lehmann. 1975.
24. Raoul Granqvist: The Reputation of JohnDonne 1779–1873. 1975.
25. Anne Walder: Swinburne’s Flowers ofEvil: Baudelaire’s Influence on Poemsand Ballads, First Series. 1976.
26. Mark L. Troy: Mummeries of Resurrec-tion: The Cycle of Osiris in FinnegansWake. 1976.
27. Kristofer Dorosz: Malcolm Lowry’s Infer-nal Paradise. 1976.
28. Helga Drougge: The Significance of Con-greve’s Incognita. 1976.
29. Margaret Omberg: Scandinavian Themesin English Poetry, 1760–1800. 1976.
30. Catarina Ericson-Roos: The Songs of Rob-ert Burns: A Study of the Unity of Poetryand Music. 1977.
31. Harald William Fawkner: Animation andReification in Dickens’s Vision of theLife-Denying Society. 1977.
32. Rolf Lundén: Dreiser Looks at Scandina-via. 1977.
33. Bharathi Krishnan: Aspects of Structure,Technique and Quest in Aldous Hux-ley’s Major Novels. 1977.
34. May Mattsson: Five Plays about KingJohn. 1977.
35. Ronald Dee Vaverka: Commitment as Art:A Marxist Critique of a Selection of AlanSillitoe’s Political Fiction. 1978.
36. Mongi Raddadi: Davenant’s Adaptationsof Shakespeare. 1979.
37. Barbro Ekman: The End of a Legend: El-

len Glasgow’s History of SouthernWomen. 1979.
38. Elisabeth Sahlin: Some and Any in Spokenand Written English. 1979.
39. Hermann J. Wüscher: Liberty, Equality,and Fraternity in Wordsworth, 1791–1800. 1980.
40. Kerstin Lund-Baer: The Orphan. TragicForm in Thomas Otway. 1980.
41. Claude Gayet: The Intellectual Develop-ment of Henry David Thoreau. 1981.
42. Bertil Sandahl: Middle English SeaTerms, Vol. III, Standing and RunningRigging. 1982.
43. Monica Correa Fryckstedt: ElizabethGaskell’s Mary Barton and Ruth: A Chal-lenge to Christian England. 1982.
44. Josef Bysveen: Epic Tradition and Innova-tion in James Macpherson’s Fingal.1982.
45. Erik Löfroth: A World Made Safe: Valuesin American Best Sellers, 1895–1920.1983.
46. John Driscoll: The China Cantos of EzraPound. 1983.
47. K. Gunnar Bergström: An Odyssey to Free-dom: Four Themes in Colin Wilson’sNovels. 1983.
48. Karl Inge Sandred: Good or Bad Scots?Attitudes to Optional Lexical and Gram-matical Usages in Edinburgh. 1983.
49. Thomas Nordanberg: Cataclysm as Cata-lyst. The Theme of War in WilliamFaulkner’s Fiction. 1983.
50. Ingegerd Bäcklund: Conjunction-HeadedAbbreviated Clauses in English. 1984.
51. Birgit Bramsbäck: Folklore and W. B.Yeats: The Function of Folklore Ele-ments in Three Early Plays. 1984.
52. Bo Gustavsson: The Soul under Stress: AStudy of the Poetics of John Berryman’sDream Songs. 1984.
53. Patricia Phillips: The Adventurous Muse:Theories of Originality in English Poet-ics 1650–1760. 1984.
54. Ann-Mari Fåhræus: Two Kinds of Syntac-tic–Semantic Value–Loading in English.1984.
55. Håkan Hollqvist: The Use of English inThree Large Swedish Companies. 1984.
56. Eva Wäppling: Four Irish Legendary Fig-ures in At Swim-Two-Birds. A Study ofFlann O’Brien’s Use of Finn, Suibhne,the Pooka and the Good Fairy. 1984.
57. Adrian Velicu: Unifying Strategies in Vir-ginia Woolf’s Experimental Fiction.1985.
58. Michael Srigley: Images of Regeneration:A Study of Shakespeare’s The Tempestand Its Cultural Background. 1985.
59. Victoria Maubrey-Rose: The Anti-Repre-sentational Response: Gertrude Stein’sLucy Church Amiably. 1985.
60. Gunnel Tottie and Ingegerd Bäcklund(eds.): English in Speech and Writing: ASymposium. 1986.
61. Monica Correa Fryckstedt: Geraldine Jews-bury’s Athenaeum Reviews: A Mirror ofMid-Victorian Attitudes to Fiction.1986.
62. Marko Modiano: Domestic Disharmonyand Industrialization in D. H. Law-rence’s Early Fiction. 1987.
63. Ingrid Hjertstedt: Middle English Nick-names in the Lay Subsidy Rolls for War-wickshire. 1987.
64. Birgit Bramsbäck/Martin Croghan (eds.):Anglo-Irish and Irish Literature: Aspectsof Language and Culture. An Interna-tional Congress. Volume I. 1988.
65. Birgit Bramsbäck/Martin Croghan (eds.):Anglo-Irish and Irish Literature: Aspectsof Language and Culture. An Interna-tionial Congress. Volume II. 1988.
66. Lennart Nyberg: The ShakespeareanIdeal: Shakespeare Production and theModern Theatre in Britain. 1988.
67. Lars Nordström: Theodore Roethke, Wil-liam Stafford, and Gary Snyder: The Ec-ological Metaphor as Transformed Re-gionalism. 1989.
68. Karin Linton: The Temporal Horizon: AStudy of the Theme of Time in AnneTyler’s Major Novels. 1989.
69. Monica Correa Fryckstedt: On the Brink.English Novels of 1866. 1989.
70. Åke Bergvall: The “Enabling of Judge-ment”: Sir Philip Sidney and the Educa-tion of the Reader. 1989.
71. Birgit Bramsbäck (ed.): Homage to Ire-land. Aspects of Culture, Literature andLanguage. 1990.
72. Sven-Johan Spånberg: George Meredith,The Adventures of Harry Richmond: TheUnpublished Parts. Edited with an In-troduction. 1990.
73. Kerstin Westerlund: Escaping the Castle ofPatriarchy: Patterns of Development inthe Novels of Gail Godwin. 1990.
74. Gabriella Åhmansson: A Life and Its Mir-rors. A Feminist Reading of L. M. Mont-gomery’s Fiction. Volume I. An Intro-duction to Lucy Maud MontgomeryAnne Shirley. 1991.
75. Gunnar Backman: Meaning by Metaphor.An Exploration of Metaphor with a Met-aphoric Reading of Two Short Stories byStephen Crane. 1991.
76. Birgit Bramsbäck (ed.): Societas Celtolog-ica Nordica. Proceedings of InauguralMeeting and First Symposium, 26 May1990. 1991.
77. Eldred D. Jones, Karl I. Sandred and NevilleShrimpton (eds.): Reading and WritingKrio. Proceedings of a Workshop, 29–31January 1990, Freetown, Sierra Leone.1992.
78. Margaret McKay: Peacock’s Progress: As-pects of Artistic Development in theNovels of Thomas Love Peacock. 1992.
79. Rolf Lundén and Erik Åsard (eds.): Net-works of Americanization. Aspects of theAmerican Influence in Sweden. 1992.
80. Barbro Almqvist Norbelie: “Oppressive Nar-rowness”: A Study of the Female Com-munity in George Eliot’s Early Writings.1992.
81. Øyunn Hestetun: A Prison-House ofMyth? Symptomal Readings in VirginLand, The Madwoman in the Attic, and ThePolitical Unconscious. 1993.
82. Alan Shima: Skirting the Subject: Pursu-ing Language in the Works of AdrienneRich, Susan Griffin, and Beverly Dahlen.1993.
83. Gunnar Sorelius: Shakespeare’s EarlyComedies. Myth, Metamorphosis, Man-nerism. 1993.
84. Ilva Beretta: “The World’s a Garden”:Garden Poetry of the English Renais-sance. 1993.
85. Christina Sjöholm: “The Vice of Wed-lock.” The Theme of Marriage inGeorge Gissing’s Novels. 1994.
86. Gunnar Sorelius and Michael Srigley (eds):Cultural Exchange between EuropeanNations during the Renaissance. 1994.
87. Michael Srigley: The Mighty Maze: AStudy of Pope’s An Essay on Man. 1994.
88. Rose Pettersson: Nadine Gordimer’s OneStory of a State Apart. 1995.
89. Bo G. Ekelund: In the Pathless Forest.John Gardner’s Literary Project. 1995.
90. Christine Johansson: The Relativizerswhose and of which in Present-day Eng-lish. Description and Theory. 1995.
91. Christer Geisler: Relative Infinitives inEnglish. 1995.
92. Elisabeth Herion-Sarafidis: A Mode of Mel-ancholy. A Study of William Styron’sNovels. 1995.
93. Bo H. T. Eriksson: The “StructuringForces” of Detection. The Cases of C. P.Snow and John Fowles. 1995.
94. Gerd Övergaard: The Mandative Subjunc-tive in American and British English inthe 20th Century. 1995.
95. Hedda Friberg: An Old Order and a New.The Split World of Liam O’Flaherty’sNovels. 1996.
96. Inger Ruin: Grammar and the AdvancedLearner. On Learning and Teaching aSecond Language. 1996.
97. Helena Eriksson: Husbands, Lovers, andDreamlovers: Masculinity and FemaleDesire in Women’s Novels of the 1970s.1997.
98. Mattias Jacobsson: Wells, Meres, andPools: Hydronymic Terms in the Anglo-Saxon Landscape. 1997.
99. Johan A. Höglund: Mobilising the Novel:The Literature of Imperialism and TheFirst World War. 1997.
100. Rune Forsberg: The Place-name Lewes: AStudy of Its Early Spellings and Etymol-ogy. 1997.
101. Danuta Fjellestad: Eros, Logos, and (Fic-tional) Masculinity. 1998.
102. Margareta Westergren Axelsson: Contrac-tion in British Newspapers in the Late20th Century. 1998.
103. Mikael Cederlöf: The Element -st«w in theHistory of English. 1998.
104. Maria Mårdberg: Envisioning AmericanWomen: The Roads to CommunalIdentity in Novels by Women of Color.1998.
105. Mats Tegmark: In the Shoes of a Soldier:Communication in Tim O’Brien’s Viet-nam Narratives. 1998.
106. Mattias Bolkéus Blom: Stories of Old: TheImagined West and the Crisis of Histori-cal Symbology in the 1970s. 1999.
107. Irene Gilsenan Nordin: Crediting Marvelsin Seamus Heaney’s Seeing Things.1999.
108. Maria Holmgren Troy: In the First Personand in the House: The House Chro-notope in Four Works by AmericanWomen Writers. 1999.
109. Elisabeth Michelsson: Appropriating KingArthur: The Arthurian Legend in Eng-lish Drama and Entertainments 1485–1625. 1999.
110. Elizabeth Kella: Beloved Communities:Solidarity and Difference in Fiction byMichael Ondaatje, Toni Morrison, andJoy Kogawa. 2000.

111. Anders Olsson: Managing Diversity: TheAnthologization of “American Litera-ture”. 2000.
112. Anna Uddén: Veils of Irony: The Devel-opment of Narrative Technique inWomen’s Novels of the 1790s. 2000.
113. Michael Srigley: The Probe of Doubt:Scepticism and Illusion in Shakespeare’sPlays. 2001.
114. Anna Odenbring Ehlert: “There’s a BadTime Coming”: Ecological Vision in theFiction of D. H. Lawrence. 2001.
115. Kristina Hildebrand: The Female Readerat the Round Table: Religion andWomen in Three Contemporary Arthu-rian Texts. 2001.
116. Christer Larsson: “The Relative Merits ofGoodness and Originality”: The Ethicsof Storytelling in Peter Carey’s Novels.2001.
117. Åke Bergvall: Augustinian Perspectives inthe Renaissance. 2001.
118. Katarina Leandoer: From Colonial Ex-pression to Export Commodity: English-Canadian Literature in Canada and Swe-den 1945–1999. 2002.
119. Åke Eriksson: The Tragedy of Liberty.Civic Concern and Disillusionment inJames Thomson’s Tragic Dramas. 2002.
120. Larisa Oldireva Gustafsson: Preterite andPast Participle Forms in English 1680–1790: Standardisation Processes in Pub-lic and Private Writing. 2002.
121. Karin Molander Danielsson: The DynamicDetective. Special Interest and Serialityin Contemporary Detective Series. 2002.
122. Åke Strandberg: The Orphic Voice. T. S.Eliot and the Mallarmean Quest forMeaning. 2002.
123. Stellan Sundh: Swedish School Leavers’Oral Proficiency in English. Grading ofProduction and Analysis of Perform-ance. 2003.