Characteristics of Stayers, Movers, and Leavers
59
NATIONAL CENTER FOR EDUCATION STATISTICS E.D. TABS June 1991 Characteristics of Stayers, Movers, and Leavers: Results from the Teacher Followup Survey, 1988-89 Data Series: DR-SAS-88/89-1.0 NCES 91-428 U.S. Department of Education Office of Educational Research and Improvement
-
Upload
khangminh22 -
Category
Documents
-
view
2 -
download
0
Transcript of Characteristics of Stayers, Movers, and Leavers
NATIONAL CENTER FOR EDUCATION STATISTICS
E.D. TABS June 1991
Characteristics of Stayers,Movers, and Leavers:Results from the TeacherFollowup Survey, 1988-89
Data Series:DR-SAS-88/89-1.0
NCES 91-428U.S. Department of EducationOffice of Educational Research and Improvement

NATIONAL CENTER FOR EDUCATION STATISTICS
E.D. TABS June 1991
Characteristics of Stayers,Movers, and beavers:Results from the TeacherFollowup Survey, 1988-89
Sharon A. BobbittElizabeth FaupelandShelley BumsElementary and Secondary Education Statistics Division
Data Series:DR-SAS-88/89-1 .0
NCES 91-128U.S. Department of EducationOffice of Educational Research and Improvement
U.S. Department of EducationLamar AlexanderSecretaryOff Ice of Educational Research and ImprovementBruno V. MannoActing Assistant SecretaryNational Center for Education StatisticsEmerson J. ElliottActing Commissioner
National Center for Education Statistics"The purpose of the Center shall be to collect, and analyze,and disseminate statistics and other data related toeducation in the United States and in othernations."-Section 406(b) of the General EducationProvisions Act, as amended (20 U.S.C. 1221 e-1).
June 1991
Contact:Sharon A. Bobbitt(202) 219-1461
Elizabeth Faupel(202) 219-1744
Shelley Burns(202) 219-1463

Highlights
* The attrition rate from the teaching profession between1987-88 and 1988-89 was 5.6 percent in public schools and12.7 percent in private schools.
* The rate at which public school teachers of generaleducation subjects left the profession varied little byfield. Science and math teachers, in particular, were nomore likely to leave the teaching profession than teachersof other general education subjects such as English,reading, and social studies.
* Teacher attrition varied by teacher's age. The rate forpublic school teachers in the 50 or more age category was9.8 percent; the rate in the less than 30 age category was 9percent. In the 40 to 49 age category, the attrition ratewas 2.3 percent.
* Almost all public school teachers who changed schoolsbetween school years 1987-88 and 1988-89 transferred toother public schools (92.6 percent), while only half (48percent) of the private school teachers in 1987-88 whochanged schools stayed in private schools (52 percenttransferred to public schools).
* Among former public school teachers, 27.2 percent citedhomemaking ayid/or child rearing as their primary occupationstatus in 1988-89. Another 24.8 percent said that they wereretired. About 35 percent of former private school teacherssaid that they were working in an occupation outside ofelementary or secondary education; another 30 percent saidthat they were engaged in homemaking and/or child rearing.
* About 18 percent of public school teachers who left theteaching profession between 1987-88 and 1988-89 and 12percent of private school teachers who left in the sameperiod expect to return to teaching in any of grades Kthrough 12 in school year 1989-90.
* About two-thirds of public and private school teachers whostayed in the same school between school years 1987-88 and1988-89 felt that "providing higher salaries or betterfringe benefits" is the most effective step that schoolsmight take to encourage teachers to remain in teaching.However, among former public school teachers who cited"dissatisfaction with the teaching as a career" as one oftheir main reasons for leaving the profession, 7.3 percentcited "poor salary" as their main area of dissatisfaction,while 26.4 percent cited "inadequate support from theadministration" as their main area of dissatisfaction.
iii

Table of Contents
Introduction ......................... 1
Tables Page1. Attrition rates from the teaching profession,
by main field of assignment: 1987-88 to 1988-89.. 3
2. Attrition rates from the teaching profession,by selected characteristics of teachers:1987-88. to 1988-89................. 4
3. Number and percentage of stayers, movers, and leaversby selected characteristics of teachers: 1988-89 . . 5
4. Number and percentage of stayers, movers, and leaversby selected characteristics of schools: 1988-89. 7
5. Characteristics of schools to which teachersmoved: 1988-89. .................. 9
6. Current primary occupational status of formerteachers: 1988-89. ............... 10
7. Current occupational status of former teachersworking in an occupation outside of elementaryor secondary education: 1988-89. ........ 11
8. Main reason why former teachers left the teachingprofession: 1988-89. .............. 12
9. What current and former teachers expect theirmain ac'tivity will be during the next schoolyear (1989-90): 1988-89. ............ 13
10. Percentage of former teachers who reported"dissatisfaction with teaching as a career"as one of three main reasons for leaving theprofession, by main area of dissatisfaction:1988-89. ..................... 14
11. Percentage of current teachers who reported"dissatisfied with previous school" as one ofthree main reasons for changing schools, bymain area of dissatisfaction: 1988-89. ..... 15
12. Percentage of teachers who think that each stepis the most effective step that schools mighttake to encourage teachers to remain inteaching: 1988-89. ............... 16
v

13. Standard errors for attrition rates from theteaching profession, by main field ofassignment: 1987-88 to 1988-89 (table 1). .... 17
14. Standard errors for attrition rates from theteaching profession, by selected characteristicsof teachers: 1987-88 to 1988-89 (table 2) . . . . 18
15. Standard errors for number of stayers, movers,and leavers by selected characteristics ofteachers: 1988-89 (table 3). .......... 19
16. Selected standard errors for characteristicsof schools to which teachers moved: 1988-89 (table 5)20
17. Selected standard errors for main reason whyformer teachers left the teaching profession:1988-89 (table 8). ................ 21
18. Selected standard errors for percentage of teacherswho think that each step is the most effectivestep that schools might take to encourage teachersto remain in teaching: 1988-89 (table 12) . . . . 21
Technical Notes Page
Sample selection. ................... 23Data collection procedures. .............. 25Survey response rates. ................ 26Item descriptions. .................. 26Item response rates. ................. 26Standard errors. ................... 27Definitions. ..................... 27
Acknowledgments. ...................... 28
For More Information. ................... 29
Appendices
A-i. Teacher Followup Survey--Questionnaire for CurrentTeachers. .................... 33
A-2. Teacher Followup Survey--Questionnaire for FormerTeachers. .................... 47
vi

Characteiistics of Stayers, Movers, and Leavers:Results from the Teacher Followup Survey, 1988-89
Introduction
These tabulations on characteristics of movers, leavers, andstayers present data from the 1988-89 Teacher Followup Survey(TFS), a followup of a sample of public arnd private schoolteachers who responded to the Teacher Survey component of the1987-88 Schools and Staff ing Survey (SASS). The data presentedinclude characteristics of teachers who left the teachingprofession between school years 1987-88 and 1988-89 (leavers),teachers who changed schools during that period (movers), andteachers who stayed in the same school (stayers). In addition tocharacteristics of stayers, movers, and leavers, the tabulationsinclude estimates of teacher attrition by field of assignment,reasons for leaving the teaching profession, and comparisons offormer teachers' current occupation with the teaching profession.This report provides national estimates for all data.
The Schools and Staff ing Survey and the Teacher FollowupSurvey-were developed by the U.S. Department of Education'sNational Center for Education Statistics, and were conducted bythe U.S. Bureau of the Census. The SASS was a mail survey whichcollected public and private sector data on the Nation'selementary and secondary teaching force, aspects of teachersupply and demand, teacher workplace conditions, characteristicsof school administrators, and school policies and practices. Theseven questionnaires of the SASS are as follows:
1. The Teacher Demand and Shortage Questionnaire for PublicSchool Districts (LEAs).
2. The Teacher Demand and Shortage Questionnaire forPrivate Schools.
3. The School Administrator Questionnaire.4. The Public School Questionnaire.5. The Private School Questionnaire.6. The Public School Teachers Questionnaire.7. The Private School Teachers Questionnaire.
The Teacher Followup Survey was also a mail questionnaire whichcollected followup information on a sample of public and privateschool teachers who had participated in the SASS. The purpose ofthe TFS was to determine the attrition rate for teachers, todetermine the cha~racteristics of those who stay in theteaching profession and those who leave, to obtain majoractivity/occupation data for those who leave the teachingprofession and career patterns for those who remain in theprofession, to obtain data on educational activities and futureplans, and to obtain data on attitudes about the teachingprofession and job satisfaction. The two questionnaires of theTFS are as follows:
I.

1. Questionnaire for Current Teachers.2. Questionnaire for Former Teachers.
The survey methodology is described in the Technical Notessection which follows presentation of the tables.
2

Table l.--Attrition rates from the teaching profession, by mainfield of assignment: 1987-88 to 1988-89
Public Private
in 1987-88 in 1987-88
Total 5.6 12.7
Kindergarten 3.1 10.5General elementary 5.6 11.9
Art/music 4.2 17.6
Bilingual/ESL 5.6 18.0
Business 5.9 -
English/Language arts 8.5 18.7Health 3.9 6.4
Home economics 6.6--
Industrial arts 3.7 -
Math 4.9 10.9
Reading 5.1 -
Social studies 5.0 8.4
Science total 5.4 9.2Biology 3.2 8.5
Chemistry/physics 4.1 7.0General science/earth science 7.1 10.9
Special education total 7.3 13.7Mentally retarded 12.6 -
Learning disabled 4.3 7.6
Other speciaL education 8.4 23.7
Vocational education 6.7 -
ALL others* 5.5 18.2
--Too few cases for a reliable estimate.*IncLudes computer science, remedial education, religion, gifted,
prekindergarten, foreign Language, and all others.
NOTE: The attrition rate is the percentage of teachers who left the
teaching profession between school years 1987-88 and 1988-89
(percent "leavers"l).
SOURCE: U.S. Department of Education, National Center for
Education Statistics, Teacher Followup Survey, 1988-89.
3

TabLe 2. --Attrition rates from the teaching profession, by seLected
characteristics of teachers: 1987-88 to 1988-89
1987-88 base year Public Private
characteristics in 1987-88 in 1987-88
Total 5.6 12.7
Sex
MatIe 5.1 10.2Female 5.8 13.4
Not reported- --
AgeLess than 30 9.0 17.6
30 to 39 5.0 11.840 to 49 2.3 10.950 or more 9.8 12.2
Not reported 12.9 -
Full-time teaching experience
1 year 8.9 15.82 years 12.2 15.03 years 8.8 18.14 to 9 years 4.9 12.910 to 20 years 4.2 10.7More than 20 years 5.7 11.0Not reported 12.3 29.3
Degree earnedLess than bacheLor's 3.2 26.5
Bachelor's 5.6 12.7
Master's 5.5 10.4
Education specialist 6.3 23.3
Doctorate or professionaL 4.3-
Race/ethnicityAm. Indian, ALeut, Eskimo 3.1 -
Asian or Pacific IsLander 4.2 -
Black, non-hispanic 5.1 34.9White, non-hispanic 5.7 12.1Hispanic 2.9 21.2
Not reported 6.1 -
Level taughtElementary 5.5 12.6
Secondary 5.6 12.9
--Too few cases for a reliable estimate.
SOURCE: U.S. Department of Education, National Center for EducationStatistics, Teacher FoLlowup Survey, 1988-89.
4

Table 3.--Number and percentage of stayers, movers, and Leavers by selected characteristics of
teachers: 1988-89
Public Privatein 1987-88 in 1987-88
1987-88 base year _ _ _ _ _ _ _ _ _ _ _ _ _ _ _ _ _ _ _ _ _ _ _ _ _ _ _ _
characteristics Stayers Movers Leavers Stayers Movers Leavers
Total 2,052,383 185,960 131,851 239,892 29,352 39,317
SexMate 608,663 49,885 35,284 54,020 3,920 6,606Female 1,437,351 135,242 96,007 185,872 25,300 32,711
Not reported-- ------ -- --
AgeLess than 30 242,789 49,358 28,977 41,685 10,689 11,158
30 to 39 688,013 69,979 40,084 87,300 9,497 12,981
40 to 49 747,714 48,326 19,057 68,568 6,301 9,161
50 or more 352,352 15,777 40,184 38,928 2,499 5,771
Not reported',
FuLL-time teaching experience1 year 42,564 7,580 4,876 8,862 2,017 2,041
2 years 36,480 6,266 5,928 10,583 1,990 2,227
3 years 38,846 7,482 4,462 8,700 1,523 2,2584 to 9 years 234,707 32,687 13,882 52,365 8,646 9,067
10 to 20 years 511,299 36,260 23,977 57,267 5,094 7,505More than 20 years 1,175,404 93,818 76,629 94,473 9,583 12,852
Not reported ---- 2,099 7,642 -- 3,367
Degree earned
Less than bachelor's ----- 8,375 -- 3,460
Bachelor's 1,053,848 107,044 68,421 142,611 19,490 23,533
Master's 853,664 67,813 53,992 77,072 7,744 9,895
Education specialist 107,824 9,463 7,927
Doctorate or professional-- ----- - -
Race/ethnicityAm. Indian, ALeut; Eskimo - --
Asian or Pacific Istander---- - ---
BLack, non-hispanic 150,410 15,147 8,827White, non-hispanic 1,765,706 158,171 116,336 226,162 26,328 34,773
Hispanic 54,430 4,961 1,776 - - -
Not reported 30,868------ ---
Level taught
ELementary 1,029,411 113,911 66,458 121,282 17,076 19,863
Secondary 1,022,972 72,049 65,393 118,609 12,276 19,454
5

Table 3. --Number and percentage of stayers, movers, and Leavers by selected characteristics ofteachers: 1988-89--continued
Public Private
in 1987-88 in 1987-881987-88 base year __ _ _ _ _ _ _ _ _ _ _ _ _ _ _ _ _ _ _ _ _ _ _ _ _ _ _ _
characteristics Stayers Movers Leavers Stayers Movers Leavers
Total 86.6% 7.9% 5.6%
Sex
MatLe
Female
Not reported
Age
Less than 30
30 to 39
40 to 49
50 or moreNot reported
Full-time teaching experience1 year2 years
3 years4 to 9 years
10 to 20 yearsMore than 20 yearsNot reported
Degree earned
Less than bachelor'sBachelor'sMaster'sEducation specialistDoctorate or professional
Race/ethnicityAm. Indian, Aleut, EskimoAsian or Pacific Islander
Black, non-hispanic
White, non-hispanic
Hispanic
Not reported
Level taughtElementary
Secondary
87.7
86.1
75.6
86.2
91.786.3
78.0
77.475.0
76.583.4
89.587.376.7
96.385.787.586.188.4
95.073.7
86.3
86.689.0
86.2
85.1
88.2
7.2
8.1
15.4
8.8
5.93.9
9.1
13.8
12.9
14.711.6
6.37.011.0
8.77.0
7.67.3
1.922.2
8.77.8
8.1
7.8
9.4
6.2
77.8% 9.5% 12.7%
5.1 83.7 6.1 10.2
5.8 76.2 10.4 13.4
9.0
5.0
2.39.8
12.9
8.9
12.2
8.84.9
4.25.712.3
3.25.65.56.34.3
65.6
79.5
81.682.5
68.6
71.5
69.774.7
82.080.8
66.4
64.176.881.466.5
3.1 -
4.2
5.1 29.7
5.7 78.72.9 68.6
6.1 67.4
16.8
8.7
7.55.3
15.613.5
12.212.3
7.38.24.3
9.410.58.2
10.2
35.4
9.210.2
14.2
17.6
11.8
10.912.2
15.815.1
18.112.910.711.029.3
26.5
12.710.523.3
34.912.1
21.2
18.5
5.5 76.7 10.8 12.6
5.6 78.9 8.2 12.9
--Too few cases for a reliable estimate. Caution should be
corresponding percentages.
used in interpreting
NOTE: Details may not add to totals due to rounding. The definitions of "1stayer,"1 "mover,"
and "Leaver" may be found in the technical notes.
SOURCE: U.S. Department of Education, National Center for Education Statistics, TeacherFottowup Survey, 1988-89.
6

Table 4. --Number and percentage of stayers, Movers, and Leavers by selected characteristics of
schools: 1988-89
Public in 1987-88 Private in 1987-88
1987-88 base year ______________
characteristics Stayers Movers Leavers Stayers Movers Leavers
Total 2,052,383 185,960 131,851 239,892 29,352 39,317
School levelElementary 1,098,970 111,616 66,072 112,170 15,879 17,602
Secondary 699,079 51,586 42,613 45,494 3,840 6,586
Combined 98,152 6,221 7,737 53,912 6,a36 11,068
Not reported 156,182 16,537 15,430 28,316 3,598 4,061
school size
Less than 150 77,744 8,895 4,106 36,320 9,145 10,924
150-299 200,608 23,424 12,763 73,043 7,701 11,081
300-499 507,185 43,330 32,622 42,289 5,007 5,368
500-749 488,663 41,802 32,086 30,723 2,143 3,306
750 or more 622,002 51,973 34,844 29,200 -- 4,578
Not reported 156,182 16,537 15,430 28,316 3,598 4,061
Minority status
Less than 5% 614,686 47,969 35,749 84,762 10,074 14,454
5 to 19% 481,906 42,138 32,158 80,739 7,306 10,162
20 to 49% 413,043 35,597 24,358 24,522 3,167 6,431
50% or more 386,566 43,719 24,157 21,552 5,207 4,209
Not reported 156,182 16,537 15,430 28,316 3,598 4,061
Commlunity type
Rural 1,004,375 86,606 63,217 56,352 9,187 11,693
Suburban 417,254 30,966 25,098 62,537 5,575 7,647
Urban 467,200 50,797 27,480 92,353 10,964 15,916Other-- -------
Not reported 156,182 16,537 15,430 28,316 3,598 4,061
Region
Northeast 408,976 24,892 17,224 63,798 9,293 8,598
Midwest 515,977 44,150 31,873 63,987 6,814 7,366
South 655,569 70,253 45,222 54,591 5,830 12,112
West 315,680 30,128 22,102 29,200 3,817 7,179
Not reported 156,182 16,537 15,430 28,316 3,598 4,061
7

Table 4. --Number and percentage of stayers, movers, and Leavers by selected characteristics ofschools: 1988-89--continued
Public in 1987-88 Private in 1987-881987-88 base year _ _ _ _ _ _ _ _ _ _ _ _ _ _ _ _ _ _ _ _ _ _ _ _ _ _ _
characteristics Stayers Movers Leavers Stayers Movers Leavers
TotaLI 86.6% 7.8% 5.6%
School level
Elementary
SecondaryCombinedNot reported
86.1
88.187.583.0
School sizeLess than 150
150- 299
300- 499
500-749
750 or more
Not reported
Minority status
Less than 5%
5 to 19%20 to 49%50% or moreNot reported
Coimmunity type
Rural.
SuburbanUrban
OtherNot reported
85.7
84.787.0
86.9
87.8
83.0
88.0
86.687.385.1
83.0
87.0
88.285.6
81.483.0
RegionNortheast
Midwest
SouthWestNot reported
90.787.285.0
85.883.0
8.7 5.26.5 5.45 .5 6.98.8 8.2
9.8 4.5
9.9 5.47.4 5.6
7.4 5.7
7.3 4.9
8.8 8.2
6.9 5.17.6 5.8
7.5 5.19.6 5.3
8.8 8.2
7.5
6.5
9.311.6
8.8
5.5
5.35.0
6.98.2
5.5 3.8
7.5 5.49.1 5.98.2 6.08.8 8.2
77.7% 9.5% 12.7%
77.081.475.9
78.7
64.4
79.5
80.3
84.9
86.4
78.7
77.6
82.271.9
69.678.7
73.082.5
77.592.178.7
78.181.975.372.678.7
10.96.98.510.0
16.2
8.4
9.5
5.90. 0
10.0
9.2
7.49.316.8
10.0
11.9
7.4
9.27.910.0
11.48.78.0
9.510.0
12.111.815.611.3
19.4
12.1
10.2
9.1
13.6
11.3
13.2
10.318.8
13.6
11.3
15.110.1
13.30.011.3
10.59.416.717.911.3
--Too few cases for a reLiabLe estimate. Caution shouldcorresponding percentages.NOTE: Details may not add to totaLs due to rounding.
be used in interpreting
Nonresponse in this table is due tototal survey nonresponse from some schooLs in the 1987-88 SASS.
SOURCE: U.S. Department of Education, National Center for Education Statistics, TeacherFoLlowup Survey, 1988-89.
8

Table 5. --Characteristics of schools to w~hich teachers moved: 198-89
Public in Private in
1987-88 1987-88TFS school _ _ _ _ _ _ _ _ _ _ _ _ _ _ _ _ _ _ _ _
characteristics Number Percent Number Percent
TotaL 185,960 100.0% 29,352 100.0%
SectorPublic 172,222 92.6 14,381 49.0
Private 4,853 2.6 14,091 48.0
Not reported -- 4.8 -- 3.0
Region
Northeast 28,578 15.4 10,389 35.4
Midwest 45,793 24.6 6,628 22.6
South 75,971 40.9 7,860 26.8
West 35,618 19.2 4,476 15.2
Connunity type
RuraL 82,740 44.5 10,274 35.0
Suburban 32,702 17.6 6,139 20.9Urban 68,645 36.9 12,386 42.2Other -- 0.1 -
Not reported -. 0.8 -- 1.9
--Too few cases for a reliable estimate. Caution shouLd be used in
interpreting the corresponding percentages.
NOTE: DetaiLs may not add to totaLs due to rounding.
SOURCE: U.S. Department of Education, NationaL Center for Education
Statistics, Teacher FoLLowup Survey, 1988-89.
9

Table 6. --Current primary occupational status of former teachers: 1988-89
Public in 1987-88 Private in 1987-88
Primary occupationaL status Number Percent Number Percent
Total 131,851 100.0% 39,317 100.0%
Working in an elementary or secondaryschool with an assignment other than
teaching 22,617 17.2 3,621 9.2
Working in an occupation outside of 23,522 17.8 13,853 35.2
elementary or secondary education
Attending a college or university 7,255 5.5 3,921 10.0
Homemaking and/or chikd rearing 35,877 27.2 11,632 29.6
Retired 32,700 24.8 2,228 5.7
Disabled -- 0.7 -- 0.4
other 8,935 6.8 3,927 10.0
--Too few cases for a reliable estimate. Caution shouLd be used in interpreting corresponding
percentages.NOTE: Details may not add to totals due to rounding.
SOURCE: U.S. Department of Education, National Center for Education Statistics,
Teacher Followup Survey, 1988-89.
10

Table 7. --Current occupational status of former teachers working in an occupation
outside of elementary or secondary education: 1988-89
Public in 1987-88 Private in 1987-88
Job Number Percent Number Percent
Total 23,522 100.0% 13,853 100.0%
Employee of a private company, business,
or individual for wages, salary, or
colmmission 14,046 59.7 10,040 72.5
Federal/State/Local government employee 4,563 19.4 1,593 11.5
Self-employed in own business,
professional practice, or farm 3,704 15.7 1,680 12.1
Working without pay in a family business
or farm
Working without pay in a volunteer job - -
--Too few cases for a reliable estimate.
NOTE: Details may not add to totals due to rounding.
SOURCE: U.S. Department of Education, National Center for Education Statistics,
Teacher FoLlowup Survey, 1988-89.
11

Table 8. --Main reason why former teachers Left the teaching profession: 1988-89
Public in 1987-88 Private in 1987-88
Reason Number Percent Number Percent
Total 131,851 100.0% 39,317 100.0%
Family or personal move 11,412 8.7 6,981 17.8
Pregnancy/child rearing 24,857 18.9 8,280 21.1
Health 2,879 2.2 -- 1.5
To retire 29,454 22.3 2,144 5.5
To pursue another career 17,644 13.4 4,182 10.6
For better salary or benefits 5,887 4.5 3,569 9.1
To take courses to improve careeropportunities in the field ofeducation 4,486 3.4 2,831 7.2
To take courses to improve careeropportunities outside the fieldof education -. 1.4 -- 1.8
School staffing action 7,558 5.7 2,744 7.0
To take a sabbatical or otherbreak from teaching 7,137 5.4 -- 4.5
Dissatisfied with teaching as acareer 11,731 8.9 2,597 6.6
Other family or personal reason 6,348 4.8 2,596 6.6
Not reported -- 0.5 -- 0.8
--Too few cases for a reLiable estimate. Caution should be used in interpreting correspondingpercentages.NOTE: Details may not add to totaLs due to rounding.
SOURCE: U.S. Department of Education, NationaL Center for EducationStatistics, Teacher FoLLowup Survey, 1988-89.
12

Table 9.--What current and former teachers expect their main activity wilt be duringthe next school year (1989-90): 1988-89
Current teachers Former teachers
Activity Number Percent Number Percent
Total public in 1987-88 2,238,343 100.0% 131,851 100.0%
Teaching any of grades K-12 2,099,421 93.8 23,388 17.7
Teaching at pre-K or post-sec Level -- 0.1 3,362 2.5
Attending a college or university -- 0.3 5,582 4.2
Working in non-tching occup. in education 19,694 0.9 23,373 17.7
Working outside the field of education 19,017 0.8 17,394 13.2
Homemaking and/or child rearing 11,441 0.5 20,131 15.3
Unemployed and seeking work -- 0.2 -- 1.0
Retired 29,882 1.3 27,011 20.5
Other 33,833 1.5 9,674 7.3
Not reported -- 0.5 -- 0.5
Total private in 1987-88 269,244 100.0% 39,317 100.0%
Teaching any of grades K-12 239,338 88.9 4,841 12.3
Teaching at pre-IC or post-sec level -- 0.4 -- 1.6
Attending a college or university -- 1.0 3,686 9.4
Working in non-tching occup. in education -- 1.4 3,221 8.2
Working outside the field of education -- 1.6 8,307 21.1
Homemaking and/or child rearing 6,991 2.6 10,234 26.0
Unemployed and seeking work -- 0.1 -- 1.7
Retired -- 0.6 1,965 5.0
Other 7,566 2.8 5,424 14.1
Not reported -- 0.7 -- 0.6
--Too few cases for a reliable estimate. Caution should be used in interpreting
corresponding percentages.NOTE: Details may not add to totals due to rounding.
SOURCE: U.S. Department of Education, National Center for Education Statistics,
Teacher FolLowup Survey, 1988-89.
13

Table 10. --Percentage of former teachers who reported "dissatisfied with teaching as a career"as one of three main reasons for Leaving the profession, by main area ofdissatisfaction: 1988-89
Publ ic PrivateArea of dissatisfaction in 1987-88 in 1987-88
Total 100.0% 100.0%
Poor opportunity for professionaladvancement 8.0 6.4
Inadequate support fromadministration 26.4 22.2
Unsafe working environment 0.9 0.0
Lack of influence over schoolpolicies and practices 7.6 3.2
Lack of control over own classrooms 2.2 -
Lack of professional competence ofcolleagues 1.3 2.8
Poor student motivation to Learn 17.7 12.0
Generally poor working conditions 3.6 7.7
Class sizes too Large 2.9 2.6
Student discipline problems 7.5 16.5
Poor salary 7.3 16.1
Not reported 14.8 9.7
--Too few cases for a reliable estimate.NOTE: Details may not add to totals due to rounding. This table is based upon those formerteachers (N=2,222) who reported that "dissatisfaction with teaching as a career" was one oftheir three main reasons for Leaving the teaching profession.
SOURCE: U.S. Department of Education, National Center for Education Statistics, TeacherFoLLowup Survey, 1988-89.
14

Table ll.--Percentage of movers who reported "dissatisfied with the previous school" as
one of three main reasons for changing schools, by main area of dissatisfaction:
1988- 89
Public Private
Area of dissatisfaction in 1987-88 in 1987-88
Total 100.0% 100.0%
Poor opportunity for professional
advancement 9.6 5.9
Inadequate support from
administration 38.0 42.7
Unsafe working environment 1.8 0.0
Lack of influence over school
policies and practices 4.8 2.2
Lack of control over own classrooms 1.7 0.0
Lack of professional competence of
colleagues 4.8 5.6
Poor student motivation to learn 5.6 -
Generally poor working conditions 5.3 3.7
Class sizes too large 5.1 -
Student discipline problems 2.1 1.7
Poor salary 2.3 22.3
Not reported 19.4 14.7
--Too few cases for a reliable estimate.
NOTE: Details may not add to totals due to rounding.
teachers (N=1,747) who reported that being "dissatisfied
their three main reasons for Leaving the school in which
This table is based upon those current
with the previous school" was one of
they had taught in 1987-88.
SOURCE: U.S. Department of Education, National Center for Education Statistics, Teacher
Followup Survey, 1988-89.
15

Table 12. --Percentage of teachers who think that each step is the most effective step that schoolsmight take to encourage teachers to remain in teaching: 1988-89
Step Stayers Movers Leavers
Total public in 1987-88 100.0% 100.0% 100.0%
Providing higher salaries or better fringe benefits 64.4 61.1 46.1
Improving opportunities for professional advancement 2.8 4.5 5.9
Dealing more effectively with student discipline andmaking schools safer 7.3 9.1 10.4
Giving teachers more authority in the school and in- their own classrooms 5.5 4.5 9.1
increasing standards for students' academic performance 1.3 1.6 2.8
Providing better resources and materials forclassroom use 1.4 1.2 2.2
Decreasing class size 5.5 5.6 6.4
Reducing the paperwork burden on teachers 3.3 2.5 5.0
Providing more support for new teachers(e.g., mentor teacher programs) 1.1 1.4 1.5
Increasing parent involvement in the schools 1.4 1.5 1.3
Reducing teacher workload 3.1 3.3 3.0
Providing merit pay or other pay incentivesto teachers 1.7 1.2 4.2
Providing teacher training in content areas andinstructional methods 0.5 0.3 1.0
Not reported 0.5 2.2 1.3
Total private in 1987-88 100.0% 100.0% 100.0%
Providing higher salaries or better fringe benefits 64.7 51.8 51.4
Improving opportunities for professional advancement 5.5 2.1 3.1
Dealing more effectively with student discipline andmaking schools safer 5.7 10.8 15.3
Giving teachers more authority in the school and intheir own classrooms 5.9 4.6 5.2
increasing standards for students, academic performance 2.0 1.0 2.7
Providing better resources and materials forclassroom use 1.7 1.0 0.9
Decreasing class size 3.3 6.9 2.4
Reducing the paperwork burden on teachers 2.6 5.4 2.6
Providing more support for new teachers(e.g., mentor teacher programs) 0.8 3.4 2.4
Increasing parent involvement in the schools 1.3 2.5 3.0
Reducing teacher workload 1.8 3.2 6.9
Providing merit pay or other pay incentivesto teachers 2.8 2.3 1.7
Providing teacher training in content areas andinstructional methods 0.8 0.6 1.4
Not reported 1.4 4.5 1.0
NOTE: Details may not add to totals due to rounding.
SOURCE: U.S. Department of Education, National Center for Education Statistics, TeacherFollowup Survey, 1988-89.
16

Table 13.--Standard errors for attrition rates from the teachingprofession, by main field of assignment: 1987-88 to
1988-89 (table 1)
Public Private
Total 0.30 0.85
Kindergarten 0.69 2.64General elementary 0.63 1.23
Art/music 0.78 4.40BitinguaL/ESL 1.26 5.17
Business 2.27 -
English/language arts 1.77 3.38Health 0.83 2.99Home economics 2.35Industrial arts 1.29
Math 0.74 2.63Reading 1.25 -
Social studies 1.67 2.87
Science total 1.22 2.26Biology 0.94 5.08Chemistry/physics 2.07 4.13
General science/earth science 2.10 3.76
Special education total 1.23 9.21Mentally retarded 4.27 -
Learning disabled 0.64 10.25Other special education 2.52 18.19
Vocational education 2.48
ALL others* 1.04 5.75
--Too few cqses for a reliable estimate.*IncLudes computer science, remedial education, religion, gifted,
prekindergarten, foreign Language, and all others.
SOURCE: U.S. Department of Education, National Center for
Education Statistics, Teacher FoLLowup Survey, 1988-89.
17
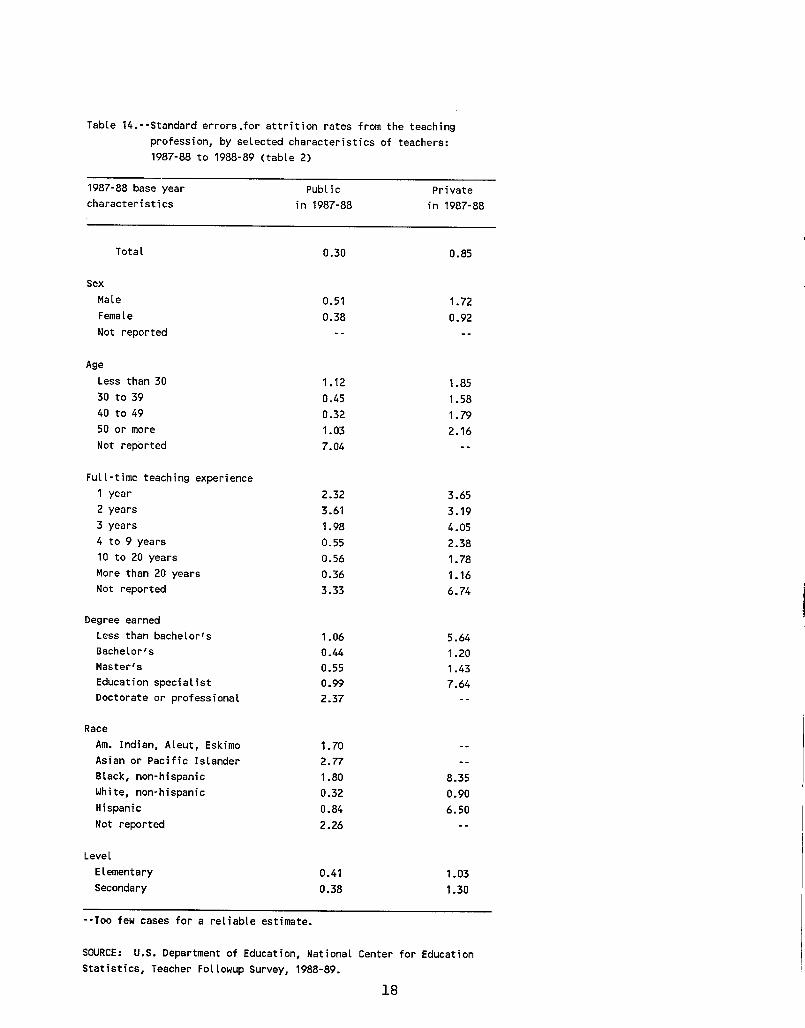
Table 14.--Standard errors .for attrition rates from the teaching.profession, by selected characteristics of teachers:1987-88 to 1988-89 (table 2)
1987-88 base year Public Privatecharacteristics in 1987-88 in 1987-88
Total 0.30 0.85
SexMale 0.51 1.72FemaLe 0.38 0.92Not reported----
Age
Less than 30 1.12 1.8530 to 39 0.45 1.5840 to 49 0.32 1.7950 or more 1.03 2.16Not reported 7.04 -
Full-time teaching experience1 year 2.32 3.652 years 3.61 3.193 years 1.98 4.054 to 9 years 0.55 2.3810 to 20 years 0.56 1.78More than 20 years 0.36 1.16Not reported 3.33 6.74
Degree earnedLess than bachelor's 1.06 5.64Bachelor's 0.44 1.20Master's 0.55 1.43Education specialist 0.99 7.64Doctorate or professional 2.37 -
RaceAm. Indian, Aleut, Eskimo 1.70Asian or Pacific Islander 2.77 -
Black, non-hispanic 1.80 8.35White, non-hispanic 0.32 0.90Hispanic 0.84 6.50Not reported 2.26 -
Level
Elementary 0.41 1.03Secondary 0.38 1.30
--Too few cases for a reliable estimate.
SOURCE: U.S. Department of Education, National Center for EducationStatistics, Teacher FoLLowup Survey, 1988-89.
18

Table 15.- -Selected standard errors for number and percentage of stayers, movers, and leavers by
selected characteristics of teachers: 1988-89 (table 3)
Public in 87-88 Private in 87-88
1987-88 base year _ _ _ _ _ _ _ _ _ _ _ _ _ _ _ _ _ _ _ _ _ _ _ _ _ _ _ _
characteristics Stayers Movers Leavers Stayers Movers Leavers
Total 55,476.6 9,780.0 6,907.5 12,667.3 1,975.2 2,533.8
SexMale 35,301.4 5,009.1 3,737.2 5,694.3 572.0 977.2Female 48,014.0 7,758.5 5,949.7 10,217.4 1,704.1 2,472.1Not reported- ----------
AgeLess than 30 11,472.3 3,227.8 3,674.8 4,678.8 920.2 1,096.2
30 to 39 34,711.5 6,382.4 3,780.8 8,033.5 1,047.0 1,660.6
40 to 49 38,014.5 5,597.4 2,837.8 6,086.2 1,152.3 1,544.250 or more 20,228.1 3,362.8 4,045.3 5,492.5 669.7 857.1Not reported -------
Degree earnedLess than bachelor's --- - 2,262.0 -- 660.4
Bachelor's 38,039.8 6,300.7 5,437.1 9,516.9 1,380.4 1,769.7Master's 38,393.6 7,521.9 4,996.3 7,462.9 1,030.9 1,623.9Education specialist 11,711.3 2,040.4 845.7 - .-
Doctorate or professional - --------
RaceAm. Indian, Aleut, Eskimi3- ---- --
Asian or Pacific Islander --- -- -
Black, non-hispanic 16,424.7 1,389.4 2,912.0 - --
White, non-hispanic 48,810.4 9,627.4 6,144.1 12,712.7 1,795.0 2,732.7Hispanic 10,648.7 1,155.2 358.9 - --
Not reported 8,258.1 - -- --
Level
Elementary 36,096.5 7,486.3 4,619.3 7,594.3 1,248.2 1,832.2
Secondary 39,606.1 5,509.3 5,187.3 9,369.1 1,549.6 1,800.8
-- Too few cases for a reliable estimate.
SOURCE: U.S. Department of Education, National Center for Education Statistics, Teacher
FoLLowup Survey, 1988-89.
19
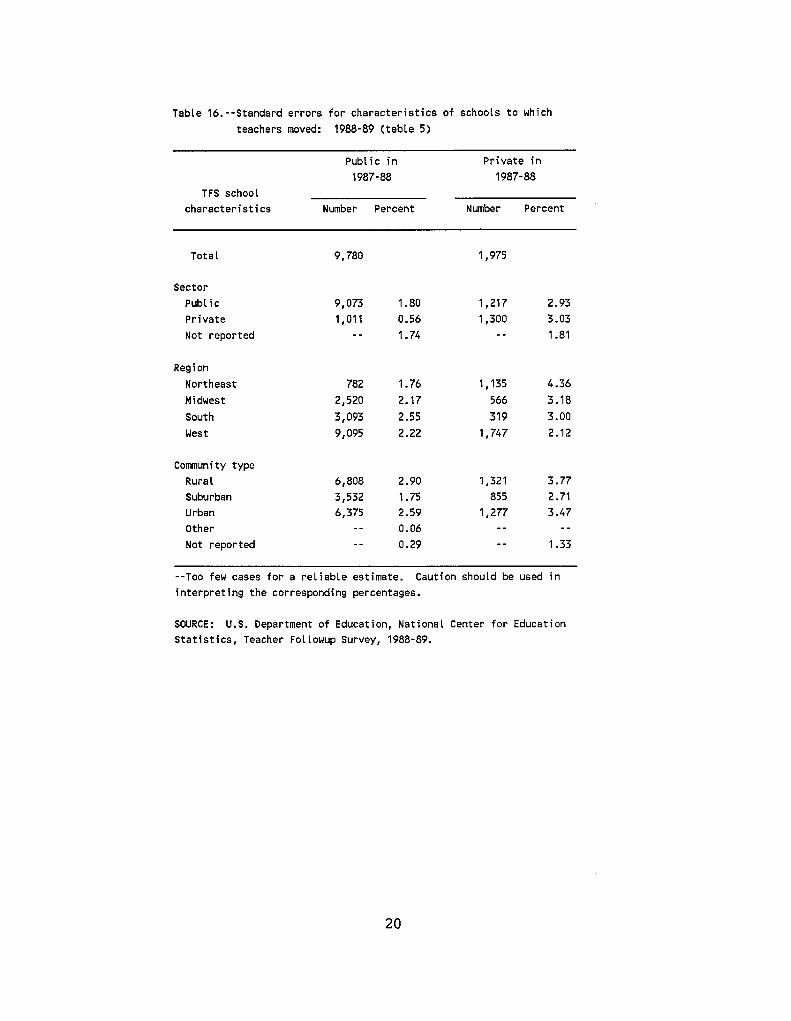
Table 16.- -Standard errors for characteristics of schools to which
teachers moved: 1988-89 (table 5)
Public in Private in
1987-88 1987-88TFS school _ _ _ _ _ _ _ _ _ _ _ _ _ _ _ _ _ _ _ _
characteristics Number Percent Number Percent
Total
Sector
Pub Lic
Private
Not reported
Region
Northeast
Midwest
South
West
9,780
9,073
1,011
782
2,520
3,093
9,095
1.80
0.56
1 .74
1 .76
2.17
2.55
2.22
1,975
1,217
1,300
1,135
566
319
1,747
2.93
3.03
1.81
4.36
3.18
3.00
2.12
Coimmunity typeRural
Suburban
Urban
Other
Not reported
--Too few cases for a reliable estimate. Caution
interpreting the corresponding percentages.
shouLd be used in
SOURCE: U.S. Department of Education, National Center for Education
Statistics, Teacher FoLLowup Survey, 1988-89.
20
6,808
3,5326,375
2.90
1.752.59
0.06
0.29
1,321
855
1,277
3.77
2.713.47
1.33

Table 17. --Selected standard errors for main reason why former teachers Left theteaching profession: 1988-89 (table 8)
PubLic in 1987-88 Private in 1987-88
Reason Number Percent Number Percent
Family or personal move 2,111.2 1.52 1,121.8 2.61
Pregnancy/chiLd rearing 4,073.4 2.84 1,536.4 3.34
To retire 3,482.2 2.39 55917 1.37
To pursue another career 3,318.0 2.40 738.4 1.78
To take courses to improvecareer opportunities outsidethe field of education -- 0.39 -- 0.89
--Too few cases for a reliable estimate.SOURCE: U.S. Department of Education, National Center for EducationStatistics, Teacher Fotlowup, Survey, 1988-89.
Table 18. --Selected standard errors for percentage of teachers who thinkthat each step is the most effective step that schools mighttake to encourage teachers to remain in teaching: 1988-89(table 12)
Step Stayers Movers Leavers
PubIi c
Providing highersalaries or betterfringe benefits 1.40 2.20 2.83
Decreasing class size 0.60 0.79 1.36
Increasing parentinvolvement in theschools 0.34 0.46 0.34
Private
Providing highersalaries or betterfringe benefits 2.35 4.02 2.84
Decreasing class size 0.66 1.81 0.61
Increasing parentinvolvement in theschools 0.51 0.91 1.48
SOURCE: U.S. Department of Education, National Center for Education Statistics,Teacher FbLLowup Survey, 1988-89.
21

Technical Notes
Sample Selection
Teachers were selected for the Teacher Followup Survey basedupon their participation in the 1987-88 Schools and StaffingSurvey. The following sections describe how schools and teacherswere selected for the 1987-88 SASS, and subsequently for theTeacher Followup Survey.
Selection of schools for SA1SS
The public school sample of 9,317 schools was selected fromthe Quality Education Data (QED) file of public schools. Allpublic schools in the file were stratified by the 50 States andthe District of Columbia, and then by three grade levels(elementary, secondary, and combined). For each stratum withineach state, sample schools were selected by systematic (interval)sampling with probability proportional to the square root of thenumber of teachers within a school.
All 3,513 private schools in the private school samplereceived both a Teacher Demand and Shortage Questionnaire and aPrivate School Questionnaire. The private school sample wasselected primarily from the QED file of private schools. Sincethis list of private schools did not fully cover all privateschools in the country, two additional steps were taken toimprove coverage. The first step was to update the QED file withcurrent lists of schools from 17 private school associations.All private schools on the QED file and the lists from theprivate associations were then stratified by state, grade level,and affiliation. Sample schools were then selected by systematic(interval) sampling within each stratum, with probabilityproportional to the square root of the number of teachers. Thesecond step was to include an area frame of schools, contained in75 probability selected Primary Sampling Units (PSUs), each PSUconsisting of a county or group of counties. The PSUs werestratified by Census geographic region: Northeast, West, South,and Midwest; Metropolitan Statistical Area (NSA) status (NSA ornon MSA); and private school enrollment (two groups). These PSUswere selected from the universe of 2,497 PSUs with probabilityproportional to the square root of the PSU population. Withineach of the 75 PSUs, a telephone search was made to find alleligible (in scope) private schools, using such sources as yellowpages, Non-Roman Catholic religious institutions, local educationagencies, chambers of commerce, local government offices,commercial milk companies, and commercial real estate offices.Roman Catholic religious institutions were not contacted becauseQED calls each Catholic diocese during its annual list update.All schools not on the QED file or the lists from the privateschool associations were eligible to be selected for the areasample. Mosit of these schools were selected with certainty.
23

However, when sampling was performed, schools in the area framethat could be contacted were sampled with probabilityproportional to the square root of the number of teachers, andthose that could not be contacted were selected using asystematic equal probability sampling procedure. A privateschool was declared out-of-scope and excluded from the sample ifit did not have any students in any of grades 1-12, if itoperated in a private home that was used as a family residence,or if it was undetermined whether it operated in a private homeand its enrollment was less than 10 students or it had only oneteacher.
Selection of teachers for SASS
All 56,242 public and 11,529 private school teachers in theteacher samples were selected from the 9,317 public and 3,513private sample schools. A list which included all full-time andpart-time teachers, itinerant teachers, and long-term substituteswas obtained from each sample school. Within each school,teachers were stratified by experience; one stratum included newteachers, and a second stratum included all other teachers. Newteachers were those who, counting the 1987-88 school year, werein the first, second, or third year of their teaching career ineither a public or private school system. Within each teacherstratum, elementary and secondary teachers were sorted bysubject. Elementary teachers were sorted by General ElementaryEducation, Special Education, and other; Secondary teachers weresorted by Mathematics, Science, English, Social Science,Vocational Education, and other.
The public and private school teacher samples were eachdesigned to include a basic sample and a Bilingual/ESL(English asa Second Language) supplement. The Bilingual/ESL supplementtreated as one group teachers who use a native language otherthan English to instruct students having limited Englishproficiency, and teachers who provide students having limitedEnglish proficiency with intensive instruction in English. Thesupplement was funded by the Department of Education's Office ofBilingual Education and Minority Language Affairs (OBEMLA) inorder to obtain more reliable estimates of Bilingual/ESLteachers.
The basic sample of teachers was allocated to the sampleschools in each stratum so that the teacher weights wereapproximately equal. The specified average teacher sample sizefor each sample school (4, 8, and 6 teachers for each publicelementary, secondary, and combined school, respectively, and 4,5, and 3 teachers for each private elementary, secondary, andcombined school, respectively) was then allocated to the twoteacher strata to obtain a 60 percent oversampling of new privateschool teachers. New teachers were not oversampled in the publicsector. Finally, an equal probability systematic sampling scheme
24

was applied to select the basic sample within each school. TheBilingual/ESL supplement was selected independently from thebasic sample, and was designed to provide estimates forCalifornia, Texas, Florida, Illinois, New York, and all otherStates comibined. Within a school containing Bilingual/ESLteachers, teachers were selected systematically with equalprobability.
The sample sizes were as follows:Basic samplesPublic 54,340Private 11,412
Bilingual/ESL supplement samplesPublic 2,258Private 183
Bilingual/ESL teachers selected in both the basic andsupplement samples were unduplicated so that each teacher appearsonly once in the 'combined sample of Bilingual/ESL and all otherteachers.
In the data collection phase of the survey, a subsample ofnonmail returns (57 percent of nonmail returns) was followed upby telephone during April, May, and June. This subsample hadtheir weights adjusted to reflect the subsampling.
More detailed information about the sampling will beavailable from a forthcoming technical report.
Selection of teachers for the Teacher Followup Survey
Within each public stratum, responding SASS teachers weresorted by Census Region by Urbanicity by Teacher Subject bySchool Enrollment. Within each private stratum, respondingteachers were sorted by Affiliation by Urbanicity by TeacherSubject by School Enrollment.
After the teachers were sorted, teachers were selectedwithin each stratum using a probability proportional to sizesampling procedure. The measure of size was the SASS basicweight (inverse of the probability of selecting a teacher in theSASS teacher sample). This sample allocation yielded a totalsample size of 7,172 teachers, 2,987 leavers and 4,185 stayersand movers.
Data Collection Procedures
The Census Bureau was the data collection agency for theTeacher Followup Survey, which took place during the 1988-89school year. The TFS was conducted in two phases. The firstphase consisted of contacting schools to determine present
25
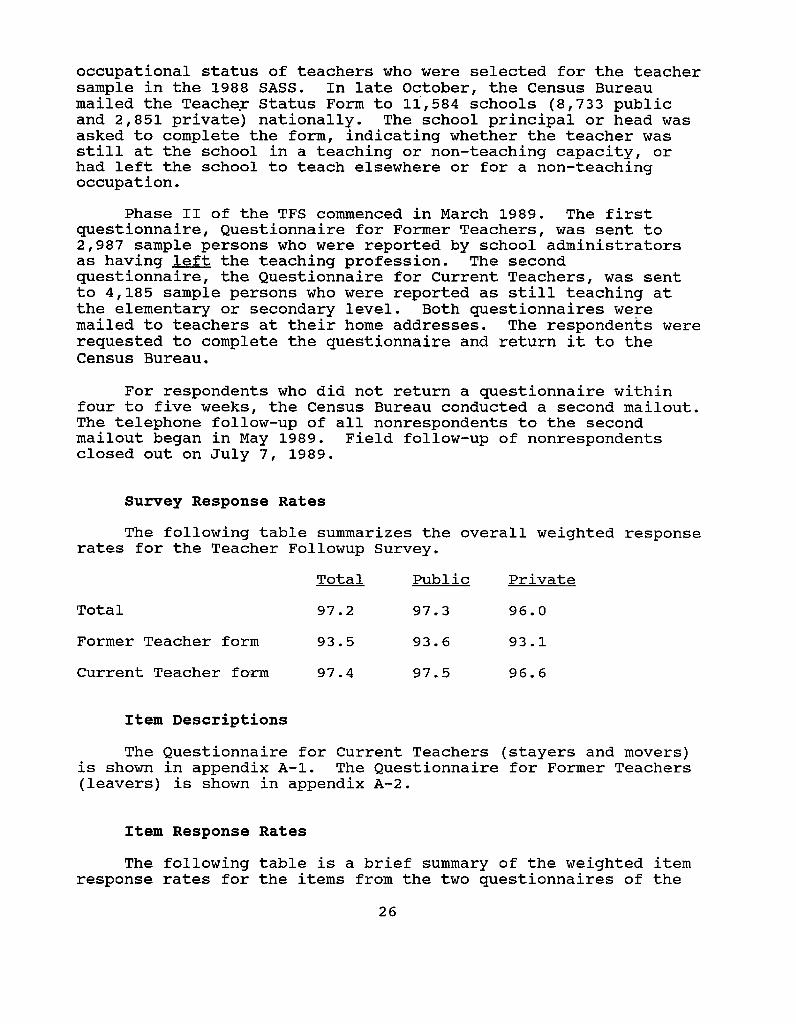
occupational status of teachers who were selected for the teachersample in the 1988 SASS. In late October, the Census Bureaumailed the Teache r Status Form to 11,584 schools (8,733 publicand 2,851 private) nationally. The school principal or head wasasked to complete the form, indicating whether the teacher wasstill at the school in a teaching or non-teaching capacity, orhad left the school to teach elsewhere or for a non-teachingoccupation.
Phase II of the TFS commenced in March 1989. The firstquestionnaire, Questionnaire for Former Teachers, was sent to2,987 sample persons who were reported by school administratorsas having left the teaching profession. The secondquestionnaire, the Questionnaire for Current Teachers, was sentto 4,185 sample persons who were reported as still teaching atthe elementary or secondary level. Both questionnaires weremailed to teachers at their home addresses. The respondents wererequested to complete the questionnaire and return it to theCensus Bureau.
For respondents who did not return a questionnaire withinfour to five weeks, the Census Bureau conducted a second mailout.The telephone follow-up of all nonrespondents to the secondmailout began in May 1989. Field follow-up of nonrespondentsclosed out on July 7, 1989.
Survey Response Rates
The following table summarizes the overall weighted responserates for the Teacher Followup Survey.
Total Public Private
Total 97.2 97.3 96.0
Former Teacher form 93.5 93.6 93.1
Current Teacher form 97.4 97.5 96.6
Item Descriptions
The Questionnaire for Current Teachers (stayers and movers)is shown in appendix A-1. The Questionnaire for Former Teachers(leavers) is shown in appendix A-2.
Item Response Rates
The following table is a brief summary of the weighted itemresponse rates for the items from the two questionnaires of the
2 6
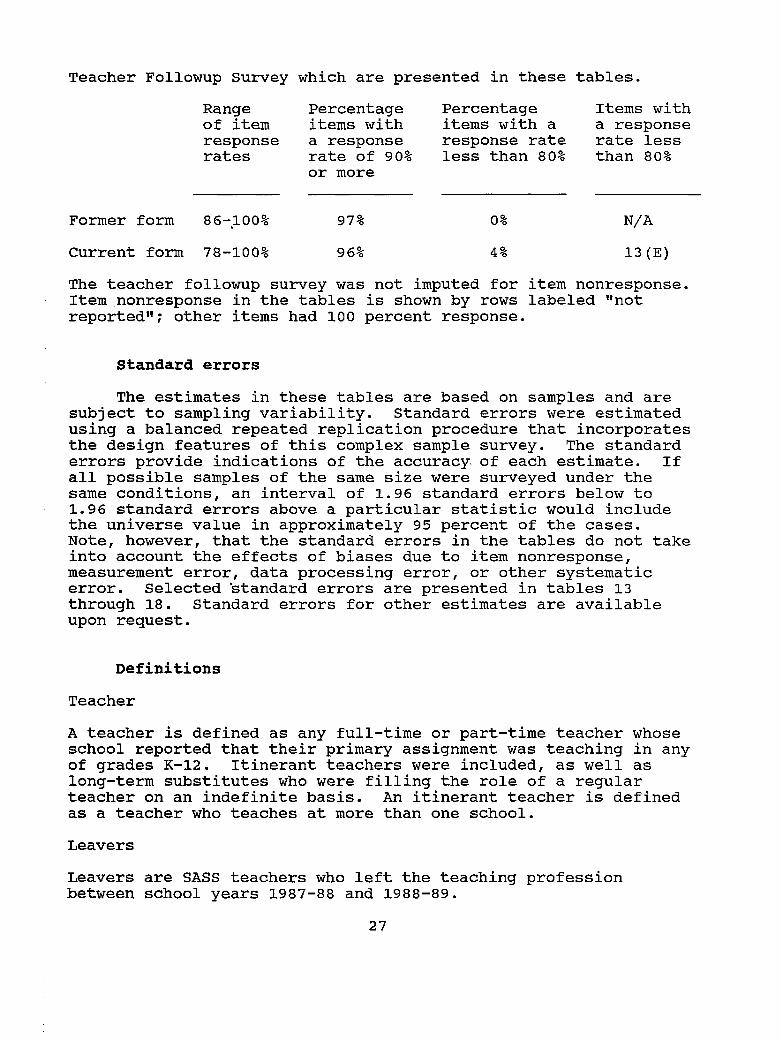
Teacher Followup Survey which are presented in these tables.
Range Percentage Percentage Items withof item items with items with a a responseresponse a response response rate rate lessrates rate of 90% less than 80% than 80%
or more
Former form 86-.100% 97% 0% N/A
Current form 78-100% 96% 4% 13(E)
The teacher followup survey was not imputed for item nonresponse.Item nonresponse in the tables is shown by rows labeled "notreported"; other items had 100 percent response.
Standard errors
The estimates in these tables are based on samples and aresubject to sampling variability. Standard errors were estimatedusing a balanced repeated replication procedure that incorporatesthe design features of this complex sample survey. The standarderrors provide indications of the accuracy- of each estimate. Ifall possible samples of the same size were surveyed under thesame conditions, an interval of 1.96 standard errors below to1.96 standard errors above a particular statistic would includethe universe value in approximately 95 percent of the cases.Note, however, that the standard errors in the tables do not takeinto account the effects of biases due to item nonresponse,measurement error, data processing error, or other systematicerror. Selected 'standard errors are presented in tables 13through 18. Standard errors for other estimates are availableupon request.
Definitions
Teacher
A teacher is defined as any full-time or part-time teacher whoseschool reported that their primary assignment was teaching in anyof grades K-12. Itinerant teachers were included, as well aslong-term substitutes who were filling the role of a regularteacher on an indefinite basis. An itinerant teacher is definedas a teacher who teaches at more than one school.
Leavers
Leavers are SASS teachers who left the teaching professionbetween school years 1987-88 and 1988-89.
27

Movers
Movers are SASS teachers who moved to a different school betweenschool years 1987-88 and 1988-89.
Stayers
Stayers are SASS teachers who stayed in the same school betweenschool years 1987-88 and 1988-89.
Public School
A public school is defined as an institution which provideseducational services, has one or more teachers to giveinstruction, is located in one or more buildings, receives publicfunds as primary support, and is operated by an education agency.Prison schools , schools operated by the Department of Defense andthe Bureau of Indian Affairs were included.
Private School
A private school is defined as a school not in the public systemthat provides instruction for any of grades 1-12 where theinstruction is not given exclusively in a private home. Schoolswhich provided instruction for grade K were included if they alsohad any of grades 1 through 12.
Elementary School
An elementary school is defined as a school which has no gradehigher than 8 and at least one grade of 6 or below.
Secondary School
A secondary school is defined as a school which has no grade lessthan 7.
Combined School
A combined school'is defined as a school which has at least one
grade of 6 or below and at least one grade of 9 or above.
Acknowledgments
The draft manuscript of this report was reviewed within theDepartment of Education by Debra Gerald, Statistical Standardsand Methodology Division, and John Grymes, Data DevelopmentDivision. Iris R. Weiss, Horizon Research, Inc., and F. HowardNelson, American Federation of Teachers served as externalreviewers. Carol L. Antishin of Pinkerton Computer Consultantsprepared the tables in final form. Marilyn Miles McMillen,
28
Elementary/Secondary Education Statistics Division, was themathematical-statistical consultant for the report.
information About Public Use Data Tape
The estimates presented in this publication may differ veryslightly from those produced from the public use data tape forthe Teacher Followup Survey due to a revision of the final weightin the fifth decimal place on the tape. These differences aresmall relative to the standard errors of the estimates whichreflect sampling variability. For example, a few of thepercentages listed in Table 1 of this publication may vary byone-tenth of one percent, but most of the percentages will notchange. In Table 4 of this publication, the total estimate of2,052,383 stayers will show up as 2,065,839 on the tape. Thisdifference of 13,456 stayers is small relative to the standarderror of 55,896.
For more Information
For more information about this report or the TeacherFollowup Survey, contact Sharon A. Bobbitt, Elementary/SecondaryEducation Statistics Division, National Center for EducationStatistics, U.S. Department of Education, 555 New Jersey Ave. NW,Washington, DC, 20208-5651, telephone (202) 219-1461.
29

Appendix A-i

TeacherFollowupSurveyQuestionnaire for Current Teachers
0MB No.1850-0621Approval Expires December 31, 1989
This report is authorized by the General EducationProvisions Act (20 USC122le-1). Your answers will be keptstrictly confidential. The release of information contained onthis form is restricted in conformance with Public Law100-297.
Are you currently teaching --
full-time, part-time, or as a long- termsubstitute-- in grades K through 12?
FITE2 DF1[A
Please continue with this survey.
Stop now and return this form tothe Census Bureau in theenclosed envelope. You will besent another form for teacherswho have left their teachingpositions.
/7
INSTRUCTIONSUnless otherwise indicated, all questionsrefer to the 1988-89 school year.If you are unsure about how to answer aquestion, please give the best answer youcan and make a comment in the "Remarks"section.Itfyou have any questions, call the Bureau ofthe Census collect at (301)763-2220.
Bureau of the CensusCurrent Projects Branch1201 East Tenth StreetJeffersonville, IN 47132
U
for taking part inthis survey.U.S. Department of CommerceBUREAU OF THE CENSUSActing as Collecting Agent forU.S. Department of EducationNATIONAL CENTER FOREDUCATION STATISTICS
EWiSMX OFFICE USE ONLYFORM TFS-3 ©~ (2-14-891
Please correct anyerror In name andaddress IncludingZIP Code
33
1

SECTION I - EMPLOYMENT AND TEACHING STATUS
Of the following, which is your current PRIMARYstatus and which, if any, is your currentSECONDARY status? Primary and secondarystatus is defined in terms of the amount of timeyou spend on each during the normal work week.If your time is equally divided between twooccupations or activities, e.g., you are retired buthave returned half time to teaching, list either oneas primary and the other as secondary.Select only one primary and one secondarystatus code.
1 Teaching in an elementary orsecondary school
2 Working in an elementary or secondaryschool with an assignment OTHERTHAN teaching
3 Working in an occupation outside ofelementary or secondary education
4 Attending a college or university5 Homemaking and/or child rearing6 Retired7 Other - Please specify
IIIIIIIIIIIIIIIIIIi
� 1 0=4 F]Primary status
I
1� 1 0=5 FISecondary statusI
1 El Check here if your time is equally1�1 0=6 divided between your primary
and secondary status
2. Which of the following categories describes 10j~7 ]1 Fl Full-time employeeyour position as a school EMPLOYEE? I 2 El% time or more, but less than full-time employee
Mark (X) only one box. 3 E '/2 time or more, but less than ¾ time employee1 4El '/4 time or more, but less than '/2 time employee
5 El Less than 'A4 time employee
3a. Which of the following categories describes El o8 F Full-time teacheryour position as a T EAC HE R at your school? 1 2 El 3/4 time or more, but less than full-time teacher
3 El /2 time or more, but less than 3h time teacherMark (X) only one box. i 4 El ' time or more, but less than '/2 time teacher
5 E Less than 'A4 time teacher
b. Which of the following categories best itE09 l1F Regular full-time or part-time teacherdescribes your teaching assignment? 2 E Itinerant teacher (i.e., your assignment requires
you to provide instruction at more than oneMark (X) only one box. Ischool)
30 E Long-term substitute (i.e., your assignmentIrequires that you fill the role of a regular
teacher on an indefinite basis, but you arestill considered a substitute)
4.If you are a full-time school or district111ElAmnsrtr(g.picpasitntrnia,employee with less than a full-time teaching 1FAdmiirec atorhead) piciaasitnricplassignment, which of the followingdietrha)categories best describes your other school 2 El Nonteaching specialist (e.g., counselor, librarian)assignment? 3 ~El Resource person for other teachers (e.g.,
department head, resource teacher, curriculumMark IX) only one box. Icoordinator, mentor teacher)
4 ~ El Support staff (e.g., secretary, aide)r, 1- Coach6 El Other - Specify
7 El1 Not applicable
FORM TFS-3 (2-15f-89(Page 2
34
1.

SECTION I - EMPLOYMENT AND TEACHING STATUS - Continued
TEACHING ASSIGNMENT FIELD CODE NUMBERS FOR QUESTIONS 5a AND b
01 Pre-kindergarten Special Areas (Continued) Science Special Education02 Gindergartleentay13 Health, physical education 21 Biology 26 Mentally retarded
03 General elementary 14 Home economics 22 Chemistry 27 Emotionally disturbedSpecial Areas 15 Industrial arts 23 Earth scienceigeology 28 Learning disabled04 Art 16 Mathematics 24 Physics 29 Speech and hearing impaired05 Basic skills and remedial education' 17 Music 25 General and all other science 30 Other special education06 Bilingual education' 18 Reading07 Busiess edcation19 Religion/philosophy 31 Vocational education07 Bomutiessedcaionc 20 Social studies/social scienceO9 English/language arts 32 ALL OTHERS10 English as a second language1 1 Foreign language1 2 Gifted'II If your primary or secondary assignment is BASIC SKILLS AND REMEDIAL EDUCATION, BILINGUAL EDUCATION, orGIFTED, and as part of that assignment you teach a specific subject area (e.g.. remedial math, bilingual social studies,or gifted science), record the code for Basic skills, Bilingual education, or Gifted as the assignment area.
58. What is your current primary teaching assignment -field at TH IS SCHOOL, that is, the fieold in whichliyou teach the most classes? IJ Primary assignment field code(Use the code numbers listed above to record your assignment field. If your teaching schedule is divided 112 1 E Teaching schedule equally dividedequally between two fields, record either field as your Iacross two fieldsprimary assignment for this question, mark box 1, Iand record the second field in question 5b.)
b. Do you have a secondary teaching assignment hT3i ElF Yes - In what field do you teach F1141field at THIS SCHOOL, that is, are some of your f the second most classes?classes in other fields? I(Use the assignment field
I 2ElN0 codes listed above.) - . - D6a. Do you have a teaching certificate in this I Ys nclm a
state in your -Cetfce
(1) Primary asignment fieldHave state Code for Cetfce(1) Primary assignment field? I ~~~~~Field certification? tpof granted
(2) Secondary assignment field, if any? tpof within thecertification last year
b. If you do, what type of certification do (a) lb) IC)you hold in each field? (Use the codes I15116 117below for type of certification.) 1
C. Was this certif icate granted within the last year? i(1) Primary 1 IYe
Codes for certification fed2l0[ EN1IRegular or standard state certification (the standard
certification offered in your state)2 Probationary certification (the initial certificate issued after 118 1 19 120
satisfying all requirements except the completion of aprobationary period) (2) Secondary YsiE e
3 Temporary, provisional, or emergency certification (requires I .Y1eE
additional coursework before regular certification can be I assignment 2 ElNo II2 El Noobtained) i field (if any) 1F e -
4 Full certification by accrediting or certifying body other than state
7.In what grade levels are the students inyour classes at this school? I121oi El Pre-kindergarten 123 F10E 8thMark (X) all that apply. * 02 El Kindergarten F124_- 1 El 9th
03 El 1st 125 12Ell 1Oth
I 04El 2nd 126 13 El 1 thI 5El13rd 1714E 1 2th
06 El14th F128] 15E 1 3th1227 07lFt 129 R 14th
I* Os El 6th 1_30 ]17 El UngradedI os Rl7th
FORM TFS-3 (2-15-Ba) Page 3
35

SECTION I - EMPLOYMENT AND TEACHING STATUS - Continued
8. Which Of the following best describes the 01 El1 A rural or farming communitycommunity in which your present school Is 02 El A small city or town of fewer than 50,000 peoplelocated? Ithat is not a suburb of a larger city
Mark (X) only one box. ~~~03 El A medium-sized city (50,000 to 1 00,000 people)Mark (X) only one box. ~~~~04 El1 A suburb of a medium-sized city
I 05 El A large city (1100,000 to 500,000 people)I 06 El1 A suburb of a large city
07 A very large city (over 500,000 people)o sel A suburb of a very large cityos El1 A military base or station
I 10 FE An Indian reservation
9. Are you currently teaching In the SAME school F~ 13 il El Yes -SKIP toquestion14 on page 6as you were last year when you completed the 2ElN-Cotnewtqeson1teacher survey? I o-Cniuewt usin1
10. Are you currently teaching In the same state as ,133 1 El Yesyou were last year when you completed the 2 El No - In which state or country areteacher survey? you teaching now?
~1 3 4 1 1 _ __ _ _ _ __ _ _ _ __ _ _ _ __ _ _ _
1,Which of the following best describes your ' i7 3 El1 Moved from one public schoolmove from last year's school to this year's Ito another public school in theschool? ISAME school district
2 El1 Moved from one public school SKIP toMark (X only one box. I district to another public question 13
I ~~school district3 E Moved from a private school
to a public schoolEl Moved from one private school to Continue
another private school wts ElMoved from a public school to qusith 1
a private schoolJqusin1
12. Is the private school in which you currently 1~ = Ell Religious - Roman Catholicteach affiliated with the Roman Catholic I 20E Religious - Non-Roman CatholicChurch or another religious organization, I 3 El Non-Religiousor is it non-religious? Mark (X) only one box.
Remarks
FORM TFS.3 12-i15-89)Page 4
36

SECTION I - EMPLOYMENT AND TEACHING STATUS - Continued
POSSIBLE REASONS FOR LEAVING PREVIOUS SCHOOL(Use codes in questions 1 3a, b, and c)
1 Family or personal move 4 School staffing action (e.g., reduction-in-force.2 For better salary or benefits lay-off, school closing, school reorganization,3 For a better teaching assignment (subject area reassignment)
or grade level) 5 Dissatisfied with the previous school
1 3a. What was your main reason for leaving the I 37 7school In which you taught last year? I LEJ Main reason - Enter code from above
b. Did you have a second reason for leaving? 1I-387 1 El Yes - What was your second reason? 1l397 7I ~~~(Enter code, then continue with 13c)_ -.. F- L
2 El No - SKIP to question 13d
C. Did you have a third reason for leaving? L 140 1 R Yes - What was your third F 2 o reason? (Enter code)
I 3d. Did you enter code 5 for one of your reasons 1~12 1 El Yes - Continue with question 13ein question 1 3a, b, or 0? 2 El No - SKIP to question 14
POSSIBLE AREAS OF DISSATISFACTION(Use codes in questions 1 3e, f, and g)
0 1 Poor opportunity for professional 0 6 Lack of professional competence ofadvancement colleagues
02 Inadequate support from administration 0 7 Poor student motivation to learn0 3 Unsafe working environment 0 8 Generally poor working conditions04 Lack of influence over school policies 09 Class sizes too large
and practices 10 Student discipline problems05 Lack of control over own classroom 11 Poor salary
I13e. What was your main area of dissatisfaction I,wihteaching in your previous school? ~ i W13 ]Mi istsato ne oefo bv
f. Did you have a second area of1 El Yes - What was your second area? FW14 7dissatisfaction? I(Enter code, then continue with 1 3 g)__-b.-oL
I 2 El No - SKIP to question 14
g. Did you have a third area of 46 1 Ys-What was your third F4dissatisfaction? ElYs-area? (Enter code)
Remarks
FORM TFS-3 12-1 5-89) Page 5
37

SECTION II - EDUCATIONAL ACTIVITIES AND FUTURE PLANS
14. Have you earned any newdegreessin the i E Yes - Continue with question 15
past year? 2 ElNo - SKIP to question 19
15. When did you earn this degree? 149 L111I1 150
IMonth Year
16. What type of degreeis it? 11 El1 Bachelor's
Mark (X) only one box. 2 ElMaster'sI 3 ElEducation specialist or professional diploma (at
least one year beyond master's level)4 El Doctorate (e.g., Ph.D., Ed.D.)5 El Professional (e.g., M.D., D.D.S., J.D., L.L.B.)
MAJOR FIELD CODE NUMBERS FOR QUESTIONS 17 AND 21
GENERAL EDUCATION
1 1 Agriculture and natural Physical sciences General education Special educationresources 33 Chemistry 51 Elementary education 70 Special education, general
12 Architecture and 34 Physics 52 Pre-elementary/early 71 Education of the emotionallyenvironmental design 35 Geology/earth science childhood education disturbed
13 Area and ethnic studies 36 Other physical sciences 53 Secondary education 72 Education of the mentally14 Biological/life science retarded15 Business and management ScasieesSubject area education 73 Education of the16 Communications Scasiees54 Agricultural education speech/hearing/vision impaired
17 Comuter ad infomation 37 Economics 55 Art education 74 Special learning disabilitiess7Cimuenes inorato 38 History 56 Bilingual education 75 Other special education
18Enieneern 39 Political science and 57 Business, commerce, and18 Engineering ~government distributive education
19 Fine and applied arts 40 Sociology 58 English as a second language20 Foreign languages41Ohrscascecs5Enlhedato21 Health professions41Ohrscascecs5Enlhedato22 Home economics 60 Foreign languages education Other education23 Law 42 Other 61 Home economics education 80 Curriculum and instruction24 Letters (English, literature, 62 Industrial arts, vocational and 81 Educational administration
speech, classics) technical education 82 Educational psychology25 Library science 63 Mathematics education 83 Student personnel and counseling26 Mathematics 64 Music education a te dcto27 Military science 65 Physical education/health 8 te dcto28 Multi/interdisciplinary education
studies 66 Reading education29 Philosophy and religion 67 Science education30 Psychology 68 Social studies/social sciences31 Public affairs and services education32 Theology
17. What is the major field of study for your NEWdegree ? (Use the field codes above in filling out this 52question.) rL IIMajor field
18. For what purpose did you earn this degree? 5 El1F To increase salary2 El For professional development in current field
Mark (X only one box. I 3El To teach in a different field than the oneItaught last year
4 El For a nonteaching position in elementary orIsecondary education
5 El For an occupation outside elementary orIsecondary education other than current job
6 El Other - Specify -
19. Are you currently enrolled in adegree program?15, ,4 1 El No - SKIP to question 23
Mark (X) only one box. I 2 El Yes, as a full-time studentt Continue with3 El Yes, as a part-time student question 20
Page 6 FORM TFS-3 (2-15-89)
38

SECTION II - EDUCATIONAL ACTIVITIES AND FUTURE PLANS - Continued
20. What type of degree are you pursuing? 15 El Bachelor'sMark (X) only one box. I 2 El Master's
3 El Education specialist or professional diploma4 El Doctorate (e.g., Ph.D., Ed.D.)5 El Professional (e.g., M.D., D.D.S., J.D., L.L.B.)
21. What is the major field of study for theIdegree you are pursuing? 156 7T(Please use the field codes on page 6 in filling jjMajor fieldout this question.)
22. For what purpose bro you pursuing this degree?I
Mark (X) only one box. 117 El0 To increase teacher salary2 El For professional development in
current teaching field3 El1 To teach in another field4 El For a nonteaching position in
elementary or secondary education5 El For an occupation outside elementary or
secondary education6 El Other - Specify
23. Hoaw long do you plan to remain in teaching? 18 1E sln sal otnewt
Mark (X only one box. 2 El Until eligible for retirement 5 question 24
3 El1 Plan to leave teaching assoon as possible SKIP to
4 El Undecided Jquestion 25
24. In how many years do you plan toretire from teaching?
1 169_ __ __ __ __ _Years
25. What do you expect your main activity will be during the next school year (11989 -90)?
1r60~ 01 El Teaching in this school15 El Teaching in another school
Mark (X) only one box. I i s El Teaching at the pre-kindergartenor post-secondary level
06 El Attending a college or university07 El Working in a nonteaching occupation
in the field of educationos El Working in an occupation outside the
field of educationo c El Homemaking and/or child rearing1o0 E Unemployed and seeking work
I 1 El Military servicei 12El RetiredI 13l IOther - Specify 1
rORM TFS-3 121 891 Page 7
39

SECTION III - YOUR OPINIONS
POSSIBLE STEPS SCHOOLS MIGHT TAKE TO ENCOURAGE TEACHERS(Use codes in questions 26a, b, and C)
0 1 Providing higher salaries or better fringe benefits 08 Reducing the paperwork burden on teachers02 Improving opportunities for professional advancement 09 Providing more support for new teachers (e.g., mentor03 Dealing more effectively with student discipline teacher programs)
and making schools safer io Increasing parent involvement in the schools04 Giving teachers more authority in the school I1I Reducing teacher workload
and in their own classrooms 12 Providing merit pay or other pay incentives to teachers05 Increasing standards for students' academic performance 13 Providing teacher training in content areas and06 Providing better resources and materials for classroom use instructional methods07 Decreasing class size
26a. What would be the most effective step thatschools might take to encourage teachers to L2~i 6= otefcivitp-Etrioefo bvremain in teaching?LL Motefciese-Enrcdermabv
b. What would be the second mosteffective step? 1-62 7 1
LJSecond step - Enter code from above
C. What would be the third most effective step? =
L JThird step - Enter code from above
Remarks
Page 8 FORM TFS-3 (2-1 5-89)
40
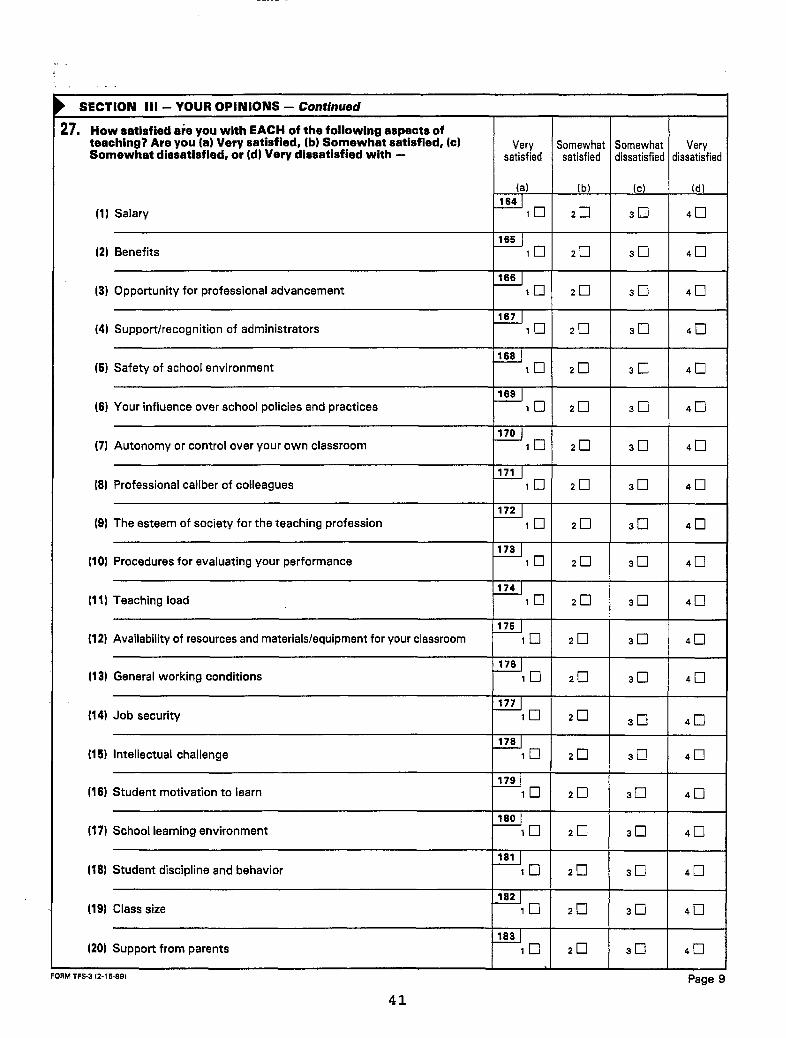
SECTION III - YOUR OPINIONS - Continued
27. How satisfied are you with EACH of the following aspects ofteaching? Are you (a) Very satisfied, (b) Somewhat satisfied, IC)Somewhat dissatisfiled, or (d) Very dissatisfied with -
(1)
(2)
(3) (
(4)
(5) 1
(6)
(7)
(81 F
(9)1
(1 0) F
(1 1)I
(12)
113)
114)
(I15) II
(18) "
(17) ,
(118)
(191 1
(201
Salary
Verysatisfied
(a)164 I
iEl
sSomewhatsaiflied
Somewhat I Verydissatisfied Idissatisfied
Wc
3 El
Benefits i Fl 2 Fl 3 0 4 M
Opportunity for professional advancement 1 El 2 El 3 El 4 El
Support/recognition of administrators 1 iDj1 2E s 3 4 El
168 Safety of school environment iFEl 2El 3 l 4 El
169Y'our influence over school policies and practices 1El 2 El 3 ElFE
Autonomy or control over your own classroom 17 Eli 2 El1 3 El 4 El1
Professional caliber of colleagues 171ElF- 2El- 3El 4 El
rhe esteem of society for the teaching profession 17 Eli 2 El 3 El 4 El
Procedures for evaluating your performance 17 El F1 2 El El 4 El
174 reaching load i7l 2El 3El 4El
Availability of resources and materials/equipment for your classroom El 2 El 3 El 4 El
General working conditions 16 iF-l 2E 3Eal 4 El
_177,- Job security i17l 2E sF E
Intellectual challenge i~ El 2 El 3El 4 El
Student motivation to learn 179j l- 2El- 3El7 4 El
School learning environment i El 2El1 3D1 4 El
Student discipline and behavior i 1- 2El 3D0 4El-
Class size 18 jl 2El aED 4El
Support from parents
:ORM TFS-3 (2-1 5-891
T18 3-i
i- 1 F l 4 M
Page 9
41
FC

SECTION IV - PERSONAL INFORMATION
28. What is your current marital status? IP84]1 l Married
2 El Widowed, divorced, or separated
3 El Never married
29. How many children do you have who aredependent on you (and your spouse) for more II8E 7 Number of children supported -than half of their financial support? I L1Continue with question 30
a E None - SKIP to question 31
30. What was the age of your youngest child on __
his/her last birthday? (if child is less than one year, 18 6please enter "0." I JAge of youngest child
31. Do you have persons other than your spouse orchildren who are dependent on you for more than i 188half of their financial support? i-- 8 E7 l Yes - How many persons? -. L
I 2 EDNo
32. The following questions refer to your before-taxearnings from teaching and other employment Ifrom mid-June 1988 to mid-June 1989. IInclude only YOUR earnings. Estimate to the nearest Ihundred dollars. If you do not receive income from aparticular source, mark the "None " box.
a. During the summer of 1988, how much didIyou earn in -
(1) Summer school salary from this or _ _ __$ 00any other school? o7Nn
(2) Other SCHOOL compensation for summerwork at this or any other school? 110 $ Fool______0
I o ENone
(3) Earnings from NONSCHOOL employment Iduring the summer of 1 988? $________9__
I o 7 None
b. What is your academic base year salary for 19 ________
teaching for the 1 988-89 school year? ___9__2____ Fool22I o El Position is unpaid
C. During the 1988-89 school year, how much willyou earn in additional compensation from your 197school(s) for extra curricular or additional I, $ .o W
activities such as coaching, student activity o zl Nonesponsorship, or evening classes?
d. During the 1988-89 school year, how much will 194. 1you earn from NONSCHOOL employment? I $ _________
I cR None
e. What is your total earned income from mid- Junel1988 to mid-Junel1989? 195 $______ _ 001
Your answer to this question should be equal to the a E Nonesum of your answers to questions 32a-d.
Page 1 0 FORM TFS-3 (2-15-89)
42

SECTION IV - PERSONAL INFORMATION - Continued
33. Which category represents the total combined 19 l0 FEl Less than $ 1 0,00(income of ALL FAM ILY M E MBE RS in your 02 $1000 - 19household during 1 988? This includes moneyfrom jobs, net business or farm income, pensions, i 03 l 15,000 - 1 9,9dividends, interest, rent, social security 04I2,00-2,payments, and any other income received by 0 E 000-2,family members in your household who are 14 i OEE 25,000 - 29,9years of ago or older. 06 El 30,000 - 34,9
Mark (X) only one box.I 07E 35,000 - 39,9I 08E 40,000 - 49,9
osl 50,000 - 59,9
I O0l 60,000 - 74,9I iil 75,000 - 99,9
I 12E 100, 000 or more
Remarks
FORM TFS-312-1 5-891 Page 1 1
43
10
39993999399939993999399939993999
39993999
I I

Appendix A-2

TeacherFollowupSurveyQuestionnaire for Former Teachers
0MB No.1850-0621Approval Expires December 31. 1989
This report is authorized by the General EducationProvisions Act (20 usc 1221le- 1). Your answers will be keptstrictly confidential. The release of information contained onthis form is restricted in conformance with Public Law100-297.
Are you currently teaching --full-time, part-time, or as a long- termsubstitute-- in grades K through 12?
Stop now and return this form tothe Census Bureau in theenclosed envelope. You will besent another form for teacherswho are still teaching.
2 Li ~~ Please continue with this survey.2 1 [NM~I
INSTRUCTIONSUnless otherwise indicated, all questionsrefer to the 1988-89 school year.If you are unsure about how to answer aquestion, please give the best answer youcan and make a comment in the "Remarks"section.If you have any questions, callithe Bureau ofthe Census collect at (301.)763-2220.
Bureau of the CensusCurrent Projects Branch1201 East Tenth StreetJeffersonville, IN 47132
for taking part inthis survey.U.S. Department of CommerceBUREAU OF THE CENSUSActing as collecting Agent forU.S. Department of EducationNATIONAL CENTER FOR EDUCATIONSTATISTICS
[~] 1 Xl OFFICE USE ONLY~:ORM TFS -2 (t~) (2-14-89)
Please correct anyerror in name andaddress including
47
1 D word

SECTION I - EMPLOYMENT STATUS
What is your PRIMARY OCCUPATIONAL status? IK4 DWokninaeemtryrscndy
Mark (X) only one-b~ox. school with an assignment OTHER THANteaching - Continue with question 2
2 El Working in an occupation outside of elementary orsecondary education - SKIP to question 3
3 El Attending a college or university
4 l- Homemaking and/or child rearing5 ~ Deisabed SKIP to
6 Disabled ~ ~ ~ ~ Iquestion 87 '7Other -Specify~
What is your main school assignment?
Mark (X) only one box.051 i IAdministrator (e.g., principal,
005 assistant principal, director, head)2 ElNonteaching specialist (e.g.,*counselor, librarian)3IE Resource person for other
teachers (e.g., department head~,resource teacher, curriculumcoordinator, mentor teacher)
4 E Support staff (e.g., secretary, aide)* c1lCoach
6 El Other - Specify -
Answer questions 3a-e ONLY if you marked box 2 inanswer to question 1 above.
3a. For whom do you work? (Record the name of thecompany, business, or ogranization. )
What kind of business or industry isthis__(For example, retail shoe store, State Labor oo Department, bicycle manufacturer, farm.) r
C. What kind of work do you do? (Please record yourjob title; for example, electrical engineer, cashier,
I typist, farmer, loan officer.)
d. What are your most important activities or duties at this job? (For example, typing, selling cars, driving delivery truck, caring for livestock.)I
e. How would you classify yourself on this job?
Mark (X only one box.
1 El An employee of a PRIVATE company,1 0 business, or individual for wages, salary,Ior commission
F 2 El A FEDERAL government employeeI 3 El A STATE government employee
4 E A LOCAL government employeeI E SELF-EMPLOYED in your own business,
Iprofessional practice, or farmI 6 El Working WITHOUT PAY in a family
Ibusiness or farm7 El Working WITHOUT PAY in a volunteer job
Page 2
48
FORM TFS-2 (2-15-89)
1.
2.
SKIP toquestion 41
b.

1I SECTION I - EMPLOYMENT STATUS - Continued4. Which of the following categories best00 ElFl-iempoe
describes your position as an EMPLOYEE? 009 El Fulltime ormrbtls hnfl-ieemployeeMark (X) only one box. I 3 El Y2 time or more, but less than % time employee
4 ElY4 time or more, but less than Ii time employeeC Less than 14 time employee
5.Altogether, how much do you usuallyIearn at this job before deductions? 00 $_______
01 ElHourI 2ElDay
3 aWeek4 ElBiweekly
I 5ElMonth. M Year
I 7 ElOther - Specify
6. How long do you plan to remainin this job? 01 EAslnasbe1CotnewhMark (X) only one box. 1 2 El Until eligible for retirement 5question 7
3 El Plan to leave as soon as possible ~SKIP to4 rEl Undecided } question 8
7. In how many years do you plan to retire?013 ~~~Years
8. What do you expect your main activity will be ____:4 14 ElTeaching any of grades K-i1 2during the next school year 11 989-90)? 1 6 ElTeaching at the pre-kindergarten or
Mark (X) only one box. ~~~~~post-secondary levelMark (X) only one box. I 08 ~El Attending a college or university
07 ElWorking In a nonteaching occupation inthe field of education
os E Working In an occupation outside the fieldof education
os E Homemaking and/or child rearinglo0 E Unemployed and seeking work1 i El Military service12E Retired13~ Other - Specltyy
Remarks
49
FORMTFS-IM-l"9) Page 3

SECTION II - EDUCATIONAL ACTIVITIES AND FUTURE PLANS
9. Have you earned any new degrees in the 1 0 Yes - Continue with question 10past year? PD 2 El No - SKIP to question 14
10. When did you earn this degree? 7~I16 DOj 017 11 IMonth Year
1.What type of degree is it? 01 El Bachelor's
Mark (X) only one box. 2 El Master's3 El Education specialist or professional diploma (atleast one year beyond master's level)
1 El Doctorate (e.g., Ph.D., Ed.D.)5 El Professional (e.g., M.D., D.D.S., J.D., L.L.B.)
MAJOR FIELD CODE NUMBERS FOR QUESTIONS 12 AND 16
GENERAL EDUCATION
I I Agriculture and natural Physical sciences General education Special educationresources 33 Chemistry 51 Elementary education 70 Special education, general
12 Architecture and 34 Physics 52 Pre-elementary/early 71 Education of the emotionallyenvironmental design 35 Geology/earth science childhood education disturbed
1 3 Area and ethnic studies 36 Other physical sciences 53 Secondary education 72 Education of the mentally14 Biological/life science retarded
15 Business an management Scial sciencesSubject area education 73 Education of the16 Comusnicsatins maaeet Scacecs54 Agricultural education speech/hearing/vision impaired17 Computer and information 37Eoois55 Arn education 74 Special learning disabilities
sciences ~~~~38 History 56 Bilingual education 75 Other special educations8Enieneern 39 Political science and 57 Business, commerce, and
IS Engineering ~government distributive educationIS9 Fine and applied arts 40 Sociology 58 English as a second language20 Foreign languages41Ohrscascecs5Enlhedato21 Health professions 41Ohrsoilsiecs5 Foeinglshneucationdcaio22 Home economics 42 Other 60Frinlnugseuain Other education23 Law 61 Home economics education 80 Curriculum and instruction24 Letters (English, literature, 62 Industrial arts, vocational and 81 Educational administration
sp~ech. classics) 63Mtehemaicsl education 82 Educational psychology25 Library science 63Mteaiseuain 83 Student personnel and counseling26 Mathematics 64 Music education 8 te dcto27 Military science 65 Physical education/health 8 te dcto28 Multi/interdisciplinary education
studies 66 Reading education29 Philosophy and religion 67 Science education30 Psychology 68 Social studies/social sciences31 Public affairs and services education32 Theology
12. What is the major field of study for your NEWdegree ? (Use the field codes above in filling out this 0 :19 L . Major fieldquestion.)
13. For what purpose did you earn this degree? '020 1 El To increase salaryMark (X) only one box. ~~~~2 El For professional development in current fieldMark (X) only one box. ~~~~~3El To teach in a different field than the one
taught last year4 E For a nonteaching position in elementary or
Elsecondary educationFor an occupation outside elementary orsecondary education other than current job
r, El Other - Specify j.
14. Are you currently enrolled ina degreesprogram? ElNI KPt usin1
Mark (X) only one box. 2 ElI Yes, as a full-time student Continue with3 El Yesr as a part-time studentJ question 15
Page 4
50
FORM TFS-212-1 5-89)

SECTION 1I - EDUCATIONAL ACTIVITIES AND FUTURE PLANS - Continued
15. What type of degreeare you pursuing? 102 1 El Bachelor's
Mark (X) only one box. 1 ~~2 El Master'sMark (X) only one box. I~ ~~ 3 E Education specialist or professional diploma
1 El Doctorate (e.g., Ph.D., Ed.D.)I 5 El Professional (e.g., M.D., D.D.s., J.D.. L.L.B.)
18. What is the major fieold of study for thedegree you are pursuing? .- 2 FF Major field(Please use the field codes on page 4 in fillingI
out this question.)
17. For what purpose are you pursuing this degree? 021ElTinraecrntsay
Mark (X) only one box. I 2 El For professional development inIcurrent field3 ElTo teach in a different field than the
Ione taught last year4 El For a nonteaching position in
Ielementary or secondary education5 ElFor an occupation outside elementary or
Isecondary education other than current jobr,~ El Other - Specify
18. Do you plan to return to teaching? 025 I1 El Yes - Continue with question 19
Mark (X) only one box. 2 El No - SKIP to question 2 la3 El Undecided - Continue with question 19
19. How soon might you return to teaching? 026IElLtrhiscolya
Mark (X) only one box. 2 ElNext year3 ElI Within five years4 ElMore than five years from now
I El Undecided
20. At which level would you teach? I 027~ i El Pre-kindergarten
Mark MX all that apply. I*2 El Elementary (including kindergarten)3 El Junior high/middle school4 El High schools El Post-secondary
21a. Do you have a "lifetime" teaching certificate? 19- 1 E e KI oqeto 32 ElNo - Continue with question 2 lb
b. Has there been a change in your teacher 091E ocagcertifiation satus sice lastyear?*2 El Yes - Certification has lapsed
Mark (X) all that apply. 3 aEl Yes - Certification has been upgraded fromItemporary or emergency to a regularIcertif icate4 ~El Yes - Certified in a different field50E Other change - Specify -
22. Do you plan to maintain or reinstate your 030 I1 El Yesteaching certificate? 2 El No
3 El Undecided
FORM TFS-2 (2-1 5-891 Page 5
51

SECTION III - YOUR OPINIONS
POSSIBLE REASONS FOR LEAVING THE TEACHING PROFESSION(Use codes in questions 23a, b, and ci
Family or personal movePregnancy/child rearingHealthTo retireTo pursue another careerFor better salary or benefitsTo take courses to improve career opportunitiesin the field of education
08 To take courses to improve career opportunitiesoutside the field of education
09 School staffing action (e.g., reduction-in-force,lay-off, school closing, school reorganization,reassignment)
1 0 To take a sabbatical or other break f romteaching
I1I Dissatisfied with teaching as a career1 2 Other family or personal reason
23ak. What was your main reason for leavingIthe teachingprofession? 031 II] ,iMain reason - Enter code from above
b. Did you have a second reason for leaving? 032 i El Yes - What warn your second
reason? (Enter code, then F033continue with 23c) z
2 E3 No - SKIP to question 23d
C. Did you have a third reason for leaving?_____1034 iEl Yes - What was your third 0O3 5
Ireason? (Enter code) ------1 20 No
23d. Did you enter code I1I for one of your reasons 031ElYs-Cniuwthqeio2eIn question 23a, b, or c?03 10Ys-Cniuwthqeio2e
2 El No - SKIP to question 24a
POSSIBLE AREAS OF DISSATISFACTION(Use codes in questions 23e, f, and g)
01 Poor opportunity for professional advancement 06 Lack of professional competence of colleagues02 Inadequate support from administration 07 Poor student motivation to learn03 Unsafe working environment 08 Generally poor working conditions04 Lack of influence ever school policies 09 Class sizes too large
and practices 1 0Student discipline problems05 Lack of control over own classroom I IPoor salary
23.. What was your main area of dissatisfaction wkthI
the tachin profssion 1iW:a7 d ins dssaisfaction -Enter code from above
C. Did you have a second area of dimstisfactlon? __
03 i El Yes - What was your second area? F0-39 (Enter code, then continue with 23g) L
2 El No - SKIP to question 24a
g. Did you have a third area of dissatisfaction? I-401iF1Ys- htwsyu hr
area? (Enter code) -F LI20 No
Page 6 FORM TFS-2 (2-15-B9)
52
01020304050607

SECTION III - YOUR OPINIONS - Continued
POSSIBLE STEPS SCHOOLS MIGHT TAKE TO ENCOURAGE TEACHERS(Use codes in questions 24a, b, and c)
0 1 Providing higher salaries or better fringe benefits 0S Reducing the paperwork burden on teachers02 Improving opportunities for professional advancement 09 Providing more support for new teachers (e.g., mentor03 Dealing more effectively with student discipline teacher programs)
and making schools safer 1 0 Increasing parent involvement in the schools04 Giving teachers more authority in the school I1I Reducing teacher workload
and in their own classrooms 1 2 Providing merit pay or other pay incentives to teachers05 increasing standards for students' academic performance 1 3 Providing teacher training in content areas and06 Providing better resources and materials for classroom use instructional methods07 Decreasing class size
24a. What would be the most effective step thatschools might take to encourage teachers to 04 F7remain in teaching? I L JMost effective step - Enter code from above
b. What would be the second most effective stop?
I LLJ ~Second step - Enter code from above
C. What would be the third most effective step?
LL44 Third step - Enter code from above
Remarks
FORM TFS-2 42-1 "-91 Page 7
53

SECTION 11111 - YOUR OPINIONS - Continued
25. is your primary occupational status "working" 0451 1 0E Yes - Continue with 26(i.e., box I or 2 marked In question 1)? 2 El No - SKIP to question 28
26. Howocculindiat1c) Ni
(1) S
(2) C
(3) F
(4)
(5) II
16)
(7) F
(8) E
19) F
(I10)P
(III)
112) (
(13) .
(14)1F
(1 5)1
(16)
rwould you rate teaching relative to your current PRIMARYipatlon In terms of EACH of the following aspects? Please-ate (a) Better in teaching, (b) Better In current position, oroc difference.
Salary
Better inteaching
(a)046
�El
Better incurrentposition
(b)
2 D
Nodifference
WC
047
Opportunities for professional advancement 1 El 2 El 3 E
048
Recognition and support from administrators/managers i Fl 2E F 3l
049
Safety of environment i F 2 D 3 F
050Influence over workplace policies and practices 1 El1 2 El 3 El
051
Autonomy or control over your own work il 2E 3El
052 Professional prestige IE 2E 3El
0~1533enefits il 2E 3E
054
Procedures for performance evaluation i l 2El 3E
055
Manageability of workload il2El 3E
056Availability of resources and materials for doing job 1 El 2 El 3 El
057
General work conditions i l 2 El 3El
058IJob security i Fl 2El 3 El
059
Professional caliber of colleagues El2E 3E
060
Intellectual challenge il2E 3E
Overall job satisfaction061 I
I l j. 2 El 3 l
FORM TFS-2 (2-15*89)
54
Page 8I
r-
L

kSECTION III - YOUR OPINIONS - Continued
27. How satisfied are you with EACH of the followingaspects of your CURRENT job? Are you la) Verysatisfied, 1bW Somewhat satisfied, (c) Somewhatdissatisfied, or (d) Very dissatisfied with -
()iI
(2)
(3 1
(4)
(5)
(6)
17)
18)I
(9)
(10)
(11)I
112)
(13)
114)
Salary
Very ISomewhat ISomewhat I Very Isatisfied I satisfied Idissatisfied IdissatisfiedI
Benefits 063] 2E 31: 4E
0641Opportunity for professional advancement El 2 El 4l~ E
0651Support/recognition of administrators/managers IEl 2 El 3ElFE
066 Safety of environment i R 2 El 3 El 4E
067]Your influence over work policies and practices 1 El 2 El 3 El 4 El
068IAntonomy or control over your own work 1 El 2 ElrEl~ E
069IProfessional caliber of colleagues 1~ 2El 3E 4E
0701The esteem of society for your profession 1 l 2 El 3 ElFE
071 1 4EProcedures for evaluating your performance El 2 El 3 ElFE
0721 1 3E1 4EWorkload i l 2E 3E E
0731Availability of resources and materials/equipment for doing job 1E 2 El 3 El 4 El
0741General working conditions 1El1 2E D 3 l 4 El
075 Job security iFl 2El 3E 4E
(15) Intellectual challenge
Remarks
FORM TFS-2 (2-1 5-9) P g
55
(a)062 I
iEl
(b)
2 D
(C)
3 El
(d)
4 El
0761 IEl 2!El 3 El
Page 9

SECTION IV - PERSONAL INFORMATION I28. What Is your current marital status? 077 1 El1 Married
I 2 El Widowed, divorced, or separated3 El Never married
29. How many children do you have who are 'Ii7idependent on you land your spouse) for more Number of children supported -than half of their financial support? LJContinue with question 30
o El None - SKIP to question 31
30. What was the age of your youngest child on 09 jhis/her last birthday? (if child is less than one year, Ag7fyonet9hlplease enter -0. Ag'fyonet hl
31. Do you have persons other than your spouse or IEI~children who are dependent on you for more than 08 1 es-Ho an erosIhalf of their financial support? .- 801E e o aypros
2 El No
32. Which category represents the total combined oio El oiLess than $1 0,000income of ALL FAMILY MEMBERS in your 1 02 El$10,000 - $14,999household during 19S88? This includes money 031: 15,000 - 19,999from jobs, net business or farm income, I 04 20,000 - 24,999pensions, dividends, interest, rent, social security payments, and any other income I 050E 25,000 - 29,999received by family members in your household 06 El 30,000 - 34,999who are 1 4 years of age or older. 07 El 35,000 - 39,999
Mark (X) only one box. Os El 40,000 - 49,99909 El 50,000 - 59,999ioRE 60,000 - 74,99911 El 75,000 - 99,99912El 1 00,000 or more
Remarks
Page 1 0 FORM TFS-2 (2-15-891
56

SECTION V - RESPONDENT INFORMATION
The stfivey you have completed may involve a brief followup at a later time in order to gain information on former teachers'movements in the labor force. The following information would assist us in contacting you if you move or change jobs.
33. Please PRINT your name, your spouse's name (if applicable), your home address,telephone numbei,, and most convenient time to reach you.
F083 i Q: Same as address label
Your name 104Spouse's full name
Street address
city State ZIP Code
Telephone number (include area code) In whose name is the telephone number listed? (Mark (X) only one)( ) ¶~~~~~~~~~~~~~ E No phone
Days/times convenient to reach you 2 0 My name3 F]'Other - Specify
34. What are the names end addresses of two other people who will know where to get In touch with youduring the coming years? List no more than one person who now lives with you. Remember to record therelationship of these persons to you (for example, parent, friend, sister, cousin, etc.)
Name 0851~r Relationship to YOU
Street address
city State ZIP Code
Telephone number (include area code) In whose name is the telephone number listed? (Mark (X) only one)( ) i~~~~~~~~~~~10No phone
mv ~ . 20 Name entered above
Name 06Relationship to you
Street address
city State ZIP Code
Telephone number (include area code) In whose name is the telephone number listed? (Mark (X only one)
( ) ~~~~~~~~~~~~i0No phone- ~~20 Name entered above
* ~~~~~~~R 3 0 Other - Specify
THIS COMPLETES THE GUESTIONNAIRE.THANK YOU FOR ASSISTING US IN THIS IMPORTANT RESEARCH.
YOUR TIME AND EFFORT ARE MUCH APPRECIATED.
FOMWS-2(2.1519) Page 1 1
57

United StatesDepartment of Education
Washington, D.C. 20208-5651
Official BusinessPenalty for Private Use, $300
[ Postage and Fees PaidU.S. Department of Education
Permit No. G-17
FOURTH CLASS BOOK RATE