Sustinere: Journal of Environment and Sustainability
15
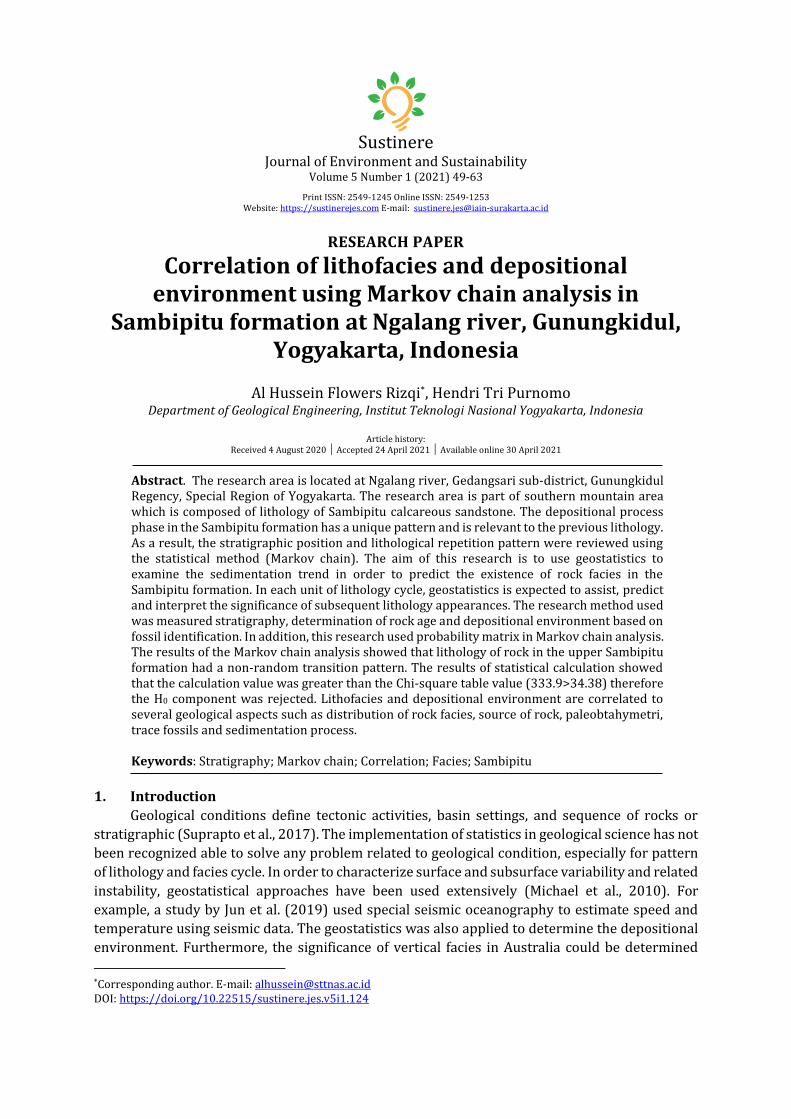
Sustinere Journal of Environment and Sustainability Volume 5 Number 1 (2021) 49-63 Print ISSN: 2549-1245 Online ISSN: 2549-1253 Website: https://sustinerejes.com E-mail: [email protected] RESEARCH PAPER Correlation of lithofacies and depositional environment using Markov chain analysis in Sambipitu formation at Ngalang river, Gunungkidul, Yogyakarta, Indonesia Al Hussein Flowers Rizqi * , Hendri Tri Purnomo Department of Geological Engineering, Institut Teknologi Nasional Yogyakarta, Indonesia Article history: Received 4 August 2020 │ Accepted 24 April 2021 │ Available online 30 April 2021 Abstract. The research area is located at Ngalang river, Gedangsari sub-district, Gunungkidul Regency, Special Region of Yogyakarta. The research area is part of southern mountain area which is composed of lithology of Sambipitu calcareous sandstone. The depositional process phase in the Sambipitu formation has a unique pattern and is relevant to the previous lithology. As a result, the stratigraphic position and lithological repetition pattern were reviewed using the statistical method (Markov chain). The aim of this research is to use geostatistics to examine the sedimentation trend in order to predict the existence of rock facies in the Sambipitu formation. In each unit of lithology cycle, geostatistics is expected to assist, predict and interpret the significance of subsequent lithology appearances. The research method used was measured stratigraphy, determination of rock age and depositional environment based on fossil identification. In addition, this research used probability matrix in Markov chain analysis. The results of the Markov chain analysis showed that lithology of rock in the upper Sambipitu formation had a non-random transition pattern. The results of statistical calculation showed that the calculation value was greater than the Chi-square table value (333.9>34.38) therefore the H0 component was rejected. Lithofacies and depositional environment are correlated to several geological aspects such as distribution of rock facies, source of rock, paleobtahymetri, trace fossils and sedimentation process. Keywords: Stratigraphy; Markov chain; Correlation; Facies; Sambipitu 1. Introduction Geological conditions define tectonic activities, basin settings, and sequence of rocks or stratigraphic (Suprapto et al., 2017). The implementation of statistics in geological science has not been recognized able to solve any problem related to geological condition, especially for pattern of lithology and facies cycle. In order to characterize surface and subsurface variability and related instability, geostatistical approaches have been used extensively (Michael et al., 2010). For example, a study by Jun et al. (2019) used special seismic oceanography to estimate speed and temperature using seismic data. The geostatistics was also applied to determine the depositional environment. Furthermore, the significance of vertical facies in Australia could be determined * Corresponding author. E-mail: [email protected] DOI: https://doi.org/10.22515/sustinere.jes.v5i1.124
-
Upload
khangminh22 -
Category
Documents
-
view
7 -
download
0
Transcript of Sustinere: Journal of Environment and Sustainability
Sustinere Journal of Environment and Sustainability
Volume 5 Number 1 (2021) 49-63
Print ISSN: 2549-1245 Online ISSN: 2549-1253 Website: https://sustinerejes.com E-mail: [email protected]
RESEARCH PAPER
Correlation of lithofacies and depositional environment using Markov chain analysis in
Sambipitu formation at Ngalang river, Gunungkidul, Yogyakarta, Indonesia
Al Hussein Flowers Rizqi*, Hendri Tri Purnomo Department of Geological Engineering, Institut Teknologi Nasional Yogyakarta, Indonesia
Article history:
Received 4 August 2020 │ Accepted 24 April 2021 │ Available online 30 April 2021
Abstract. The research area is located at Ngalang river, Gedangsari sub-district, Gunungkidul Regency, Special Region of Yogyakarta. The research area is part of southern mountain area which is composed of lithology of Sambipitu calcareous sandstone. The depositional process phase in the Sambipitu formation has a unique pattern and is relevant to the previous lithology. As a result, the stratigraphic position and lithological repetition pattern were reviewed using the statistical method (Markov chain). The aim of this research is to use geostatistics to examine the sedimentation trend in order to predict the existence of rock facies in the Sambipitu formation. In each unit of lithology cycle, geostatistics is expected to assist, predict and interpret the significance of subsequent lithology appearances. The research method used was measured stratigraphy, determination of rock age and depositional environment based on fossil identification. In addition, this research used probability matrix in Markov chain analysis. The results of the Markov chain analysis showed that lithology of rock in the upper Sambipitu formation had a non-random transition pattern. The results of statistical calculation showed that the calculation value was greater than the Chi-square table value (333.9>34.38) therefore the H0 component was rejected. Lithofacies and depositional environment are correlated to several geological aspects such as distribution of rock facies, source of rock, paleobtahymetri, trace fossils and sedimentation process. Keywords: Stratigraphy; Markov chain; Correlation; Facies; Sambipitu
1. Introduction
Geological conditions define tectonic activities, basin settings, and sequence of rocks or
stratigraphic (Suprapto et al., 2017). The implementation of statistics in geological science has not
been recognized able to solve any problem related to geological condition, especially for pattern
of lithology and facies cycle. In order to characterize surface and subsurface variability and related
instability, geostatistical approaches have been used extensively (Michael et al., 2010). For
example, a study by Jun et al. (2019) used special seismic oceanography to estimate speed and
temperature using seismic data. The geostatistics was also applied to determine the depositional
environment. Furthermore, the significance of vertical facies in Australia could be determined
*Corresponding author. E-mail: [email protected] DOI: https://doi.org/10.22515/sustinere.jes.v5i1.124

50 SUSTINERE: Journal of Environment & Sustainability, Vol. 5 No. 1 (2021), 49-63
with Markov chain analysis as well (He et al., 2019). Another study by Apriani (2016) used Markov
chain analysis to estimate the developed lithology and depositional environment in West Sumatra.
The Sambipitu formation is part of southern mountain zone (van Bemmelen, 1949), which
has been studied by numerous researchers. The presence of Sambipitu formation has an
important aspect for stratigraphy analysis due to the stratigraphic position of Sambipitu, which is
located between the volcanism period and post volcanism period (Surono et al., 1992). Bothe
(1929) and Pandita (2008) reviewed about geological aspect specifically in stratigraphy. The
research area of this study is located in the southern mountain zone, specifically at the Ngalang
River, Gedangsari Sub-district, Gunungkidul Regency, Indonesia. The geological data were
collected by observing the outcrop along the Ngalang river. The upper part of rock distribution in
the Ngalang river is dominated by calcareous rock composition with several trace fossils (Rizqi &
Purnomo, 2019). Pramunita & Pandita (2020) reported that the trace fossils consisted of several
ichnofacies that were successfully identified as scoyenia, skolithos, cruziana, and zoophycos.
There have been several geological qualitative studies conducted in the Ngalang River. However,
the geostatistics researches that are related to depositional environment specifically in
quantitative analysis (Markov chain) have never been done before.
This research used a quantitative descriptive method with Markov chain analysis. Markov
chain analysis combines the geological data (qualitative data) and statistics data (quantitative
data). The purpose of this research is to identify lithofacies and facies model and also to determine
the correlation of Markov analysis and depositional environment. The rock lithology of the
Sambipitu formation is made up of clastic and carbonate rocks. The Markov chain method was
used to analyze a sequence of lithology and facies from Sambipitu formation in this study. The
sedimentation pattern could be interpreted from the result of the repetition of lithology, especially
in the Sambipitu formation at the Ngalang River. The repetition of lithology could determine the
lithofacies that represent the depositional environment of sedimentation process. Using Markov
chain analysis, the prediction of lithology or sedimentation process was determined by probability
or quantitative number that must be tested in Chi-square analysis. The Markov chain analysis also
implicates the recent sedimentary rocks product such as alluvial sediment or tsunami sediment
are deposited.
2. Methodology
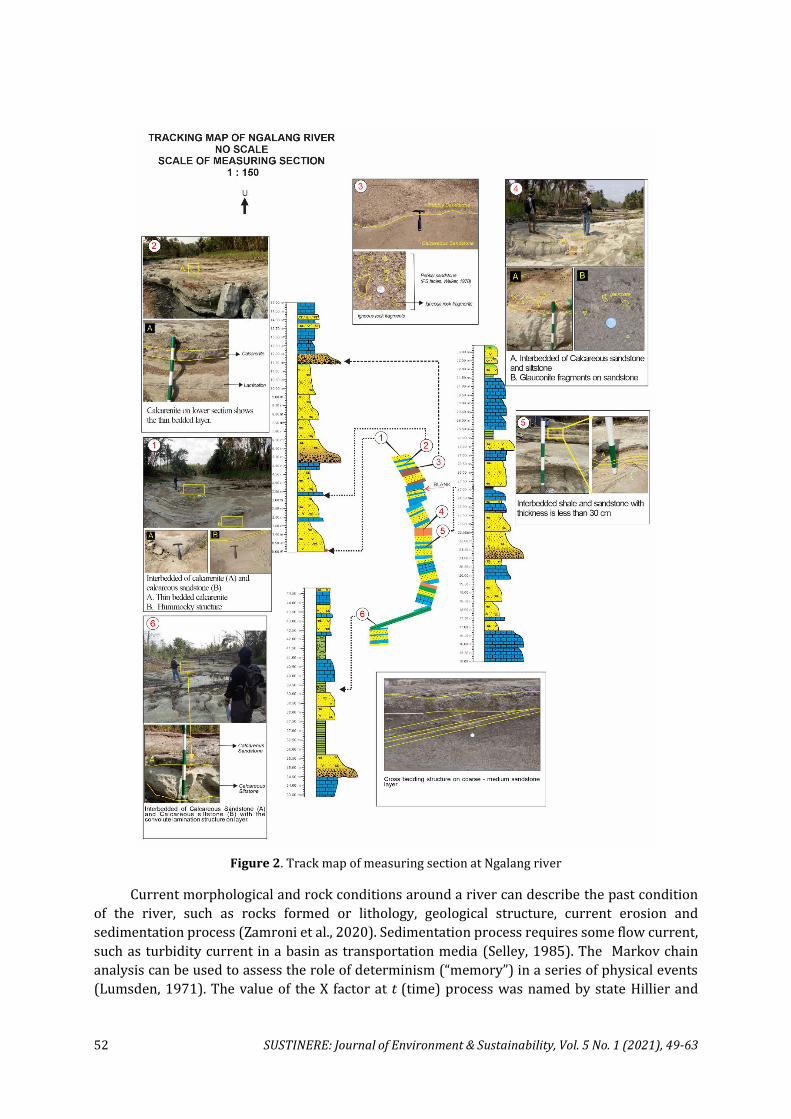
Research in this study was divided into three steps. The first step was fieldwork, followed
by data analysis and report preparations, respectively (Figure 1). Primary data which was used
for analysis was obtained from stratigraphic data. The stratigraphic data was collected from the
Ngalang river, using a stratigraphy section measurement with a thickness of 55.9 meters. The data
was gathered from observation point 1 to 6 located on the upper part of the Sambipitu formation
(Figure 2). Every observation point represented different rock types or lithology variation.
However, before the primary data was obtained, a preliminary analysis was conducted to collect
secondary data and to produce a topography map. The fieldwork was conducted to identify the
lithological properties such as colour, sedimentary structure, texture, rock composition, and
fossils content.
During the second step, fossil analysis was conducted to identify planktonic and benthonic
foraminifera. The analysis was carried out to determine the age and depositional environment in
the research area. The determination of age was done by observing the abundance of foraminifera
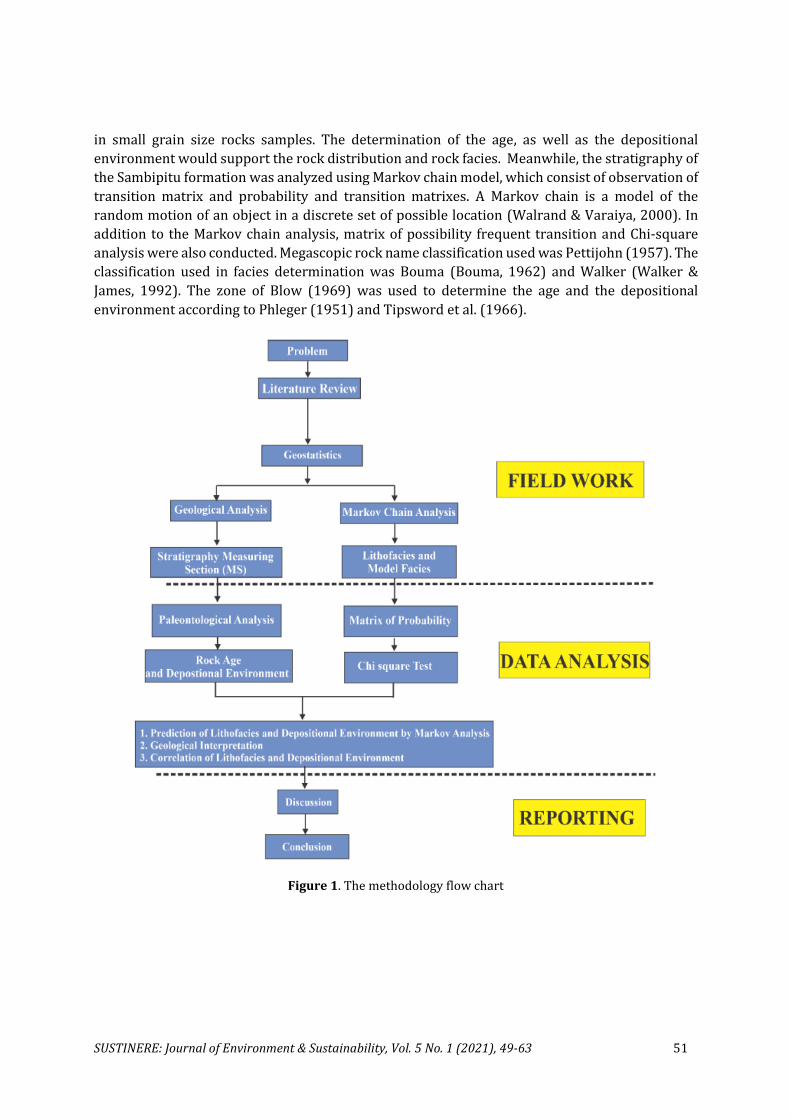
SUSTINERE: Journal of Environment & Sustainability, Vol. 5 No. 1 (2021), 49-63 51
in small grain size rocks samples. The determination of the age, as well as the depositional
environment would support the rock distribution and rock facies. Meanwhile, the stratigraphy of
the Sambipitu formation was analyzed using Markov chain model, which consist of observation of
transition matrix and probability and transition matrixes. A Markov chain is a model of the
random motion of an object in a discrete set of possible location (Walrand & Varaiya, 2000). In
addition to the Markov chain analysis, matrix of possibility frequent transition and Chi-square
analysis were also conducted. Megascopic rock name classification used was Pettijohn (1957). The
classification used in facies determination was Bouma (Bouma, 1962) and Walker (Walker &
James, 1992). The zone of Blow (1969) was used to determine the age and the depositional
environment according to Phleger (1951) and Tipsword et al. (1966).
Figure 1. The methodology flow chart
52 SUSTINERE: Journal of Environment & Sustainability, Vol. 5 No. 1 (2021), 49-63
Figure 2. Track map of measuring section at Ngalang river
Current morphological and rock conditions around a river can describe the past condition
of the river, such as rocks formed or lithology, geological structure, current erosion and
sedimentation process (Zamroni et al., 2020). Sedimentation process requires some flow current,
such as turbidity current in a basin as transportation media (Selley, 1985). The Markov chain
analysis can be used to assess the role of determinism (“memory”) in a series of physical events
(Lumsden, 1971). The value of the X factor at 𝑡 (time) process was named by state Hillier and
SUSTINERE: Journal of Environment & Sustainability, Vol. 5 No. 1 (2021), 49-63 53
Lieberman (1995). If this system moves from state 𝑖 in interval time to state 𝑗, the system can be
determined as a transition from 𝑖 to 𝑗. The possibility of transition in a step of state 𝑖 heading to
state 𝑗 could be determined in a formula:
𝑃𝑖𝑗 = 𝑃{𝑋𝑡𝑘= 𝑗|𝑋𝑡𝑘−1
= 𝑖} (1)
3. Result and Discussion
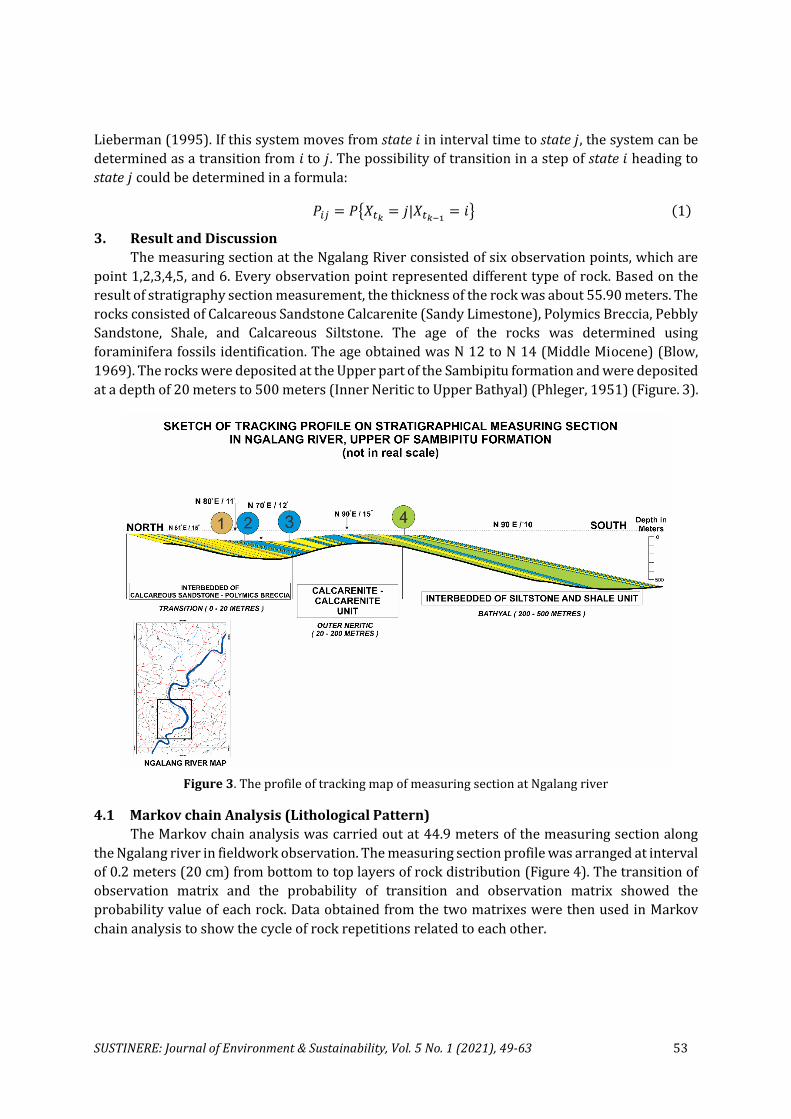
The measuring section at the Ngalang River consisted of six observation points, which are
point 1,2,3,4,5, and 6. Every observation point represented different type of rock. Based on the
result of stratigraphy section measurement, the thickness of the rock was about 55.90 meters. The
rocks consisted of Calcareous Sandstone Calcarenite (Sandy Limestone), Polymics Breccia, Pebbly
Sandstone, Shale, and Calcareous Siltstone. The age of the rocks was determined using
foraminifera fossils identification. The age obtained was N 12 to N 14 (Middle Miocene) (Blow,
1969). The rocks were deposited at the Upper part of the Sambipitu formation and were deposited
at a depth of 20 meters to 500 meters (Inner Neritic to Upper Bathyal) (Phleger, 1951) (Figure. 3).
Figure 3. The profile of tracking map of measuring section at Ngalang river
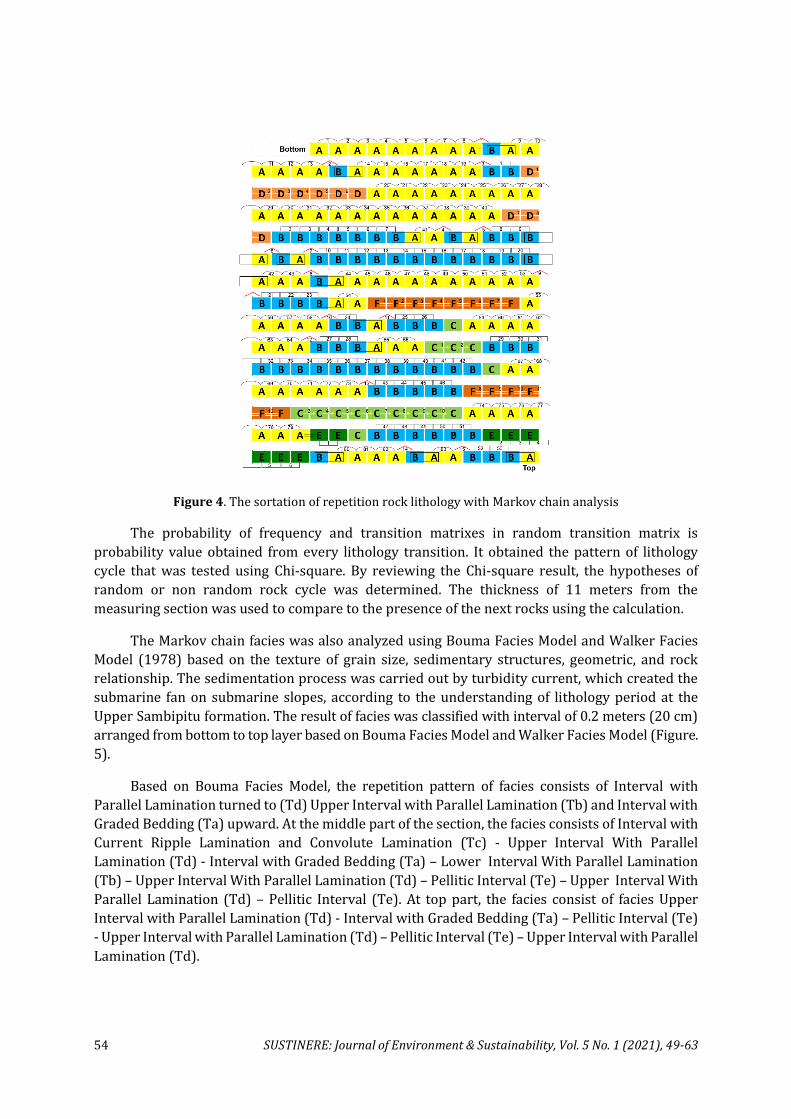
4.1 Markov chain Analysis (Lithological Pattern)
The Markov chain analysis was carried out at 44.9 meters of the measuring section along
the Ngalang river in fieldwork observation. The measuring section profile was arranged at interval
of 0.2 meters (20 cm) from bottom to top layers of rock distribution (Figure 4). The transition of
observation matrix and the probability of transition and observation matrix showed the
probability value of each rock. Data obtained from the two matrixes were then used in Markov
chain analysis to show the cycle of rock repetitions related to each other.
54 SUSTINERE: Journal of Environment & Sustainability, Vol. 5 No. 1 (2021), 49-63
Figure 4. The sortation of repetition rock lithology with Markov chain analysis
The probability of frequency and transition matrixes in random transition matrix is
probability value obtained from every lithology transition. It obtained the pattern of lithology
cycle that was tested using Chi-square. By reviewing the Chi-square result, the hypotheses of
random or non random rock cycle was determined. The thickness of 11 meters from the
measuring section was used to compare to the presence of the next rocks using the calculation.
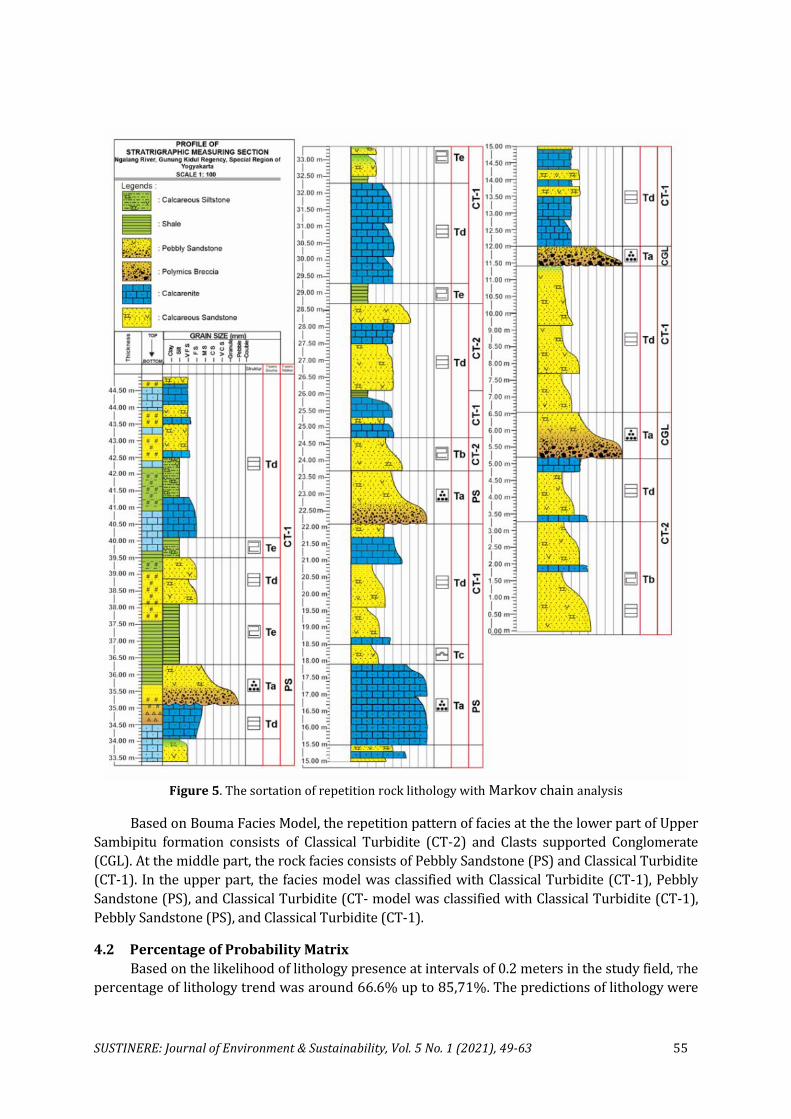
The Markov chain facies was also analyzed using Bouma Facies Model and Walker Facies
Model (1978) based on the texture of grain size, sedimentary structures, geometric, and rock
relationship. The sedimentation process was carried out by turbidity current, which created the
submarine fan on submarine slopes, according to the understanding of lithology period at the
Upper Sambipitu formation. The result of facies was classified with interval of 0.2 meters (20 cm)
arranged from bottom to top layer based on Bouma Facies Model and Walker Facies Model (Figure.
5).
Based on Bouma Facies Model, the repetition pattern of facies consists of Interval with
Parallel Lamination turned to (Td) Upper Interval with Parallel Lamination (Tb) and Interval with
Graded Bedding (Ta) upward. At the middle part of the section, the facies consists of Interval with
Current Ripple Lamination and Convolute Lamination (Tc) - Upper Interval With Parallel
Lamination (Td) - Interval with Graded Bedding (Ta) – Lower Interval With Parallel Lamination
(Tb) – Upper Interval With Parallel Lamination (Td) – Pellitic Interval (Te) – Upper Interval With
Parallel Lamination (Td) – Pellitic Interval (Te). At top part, the facies consist of facies Upper
Interval with Parallel Lamination (Td) - Interval with Graded Bedding (Ta) – Pellitic Interval (Te)
- Upper Interval with Parallel Lamination (Td) – Pellitic Interval (Te) – Upper Interval with Parallel
Lamination (Td).
SUSTINERE: Journal of Environment & Sustainability, Vol. 5 No. 1 (2021), 49-63 55
Figure 5. The sortation of repetition rock lithology with Markov chain analysis
Based on Bouma Facies Model, the repetition pattern of facies at the the lower part of Upper
Sambipitu formation consists of Classical Turbidite (CT-2) and Clasts supported Conglomerate
(CGL). At the middle part, the rock facies consists of Pebbly Sandstone (PS) and Classical Turbidite
(CT-1). In the upper part, the facies model was classified with Classical Turbidite (CT-1), Pebbly
Sandstone (PS), and Classical Turbidite (CT- model was classified with Classical Turbidite (CT-1),
Pebbly Sandstone (PS), and Classical Turbidite (CT-1).
4.2 Percentage of Probability Matrix
Based on the likelihood of lithology presence at intervals of 0.2 meters in the study field, The
percentage of lithology trend was around 66.6% up to 85,71%. The predictions of lithology were

56 SUSTINERE: Journal of Environment & Sustainability, Vol. 5 No. 1 (2021), 49-63
Calcareous Sandstone (A) to Calcareous Sandstone (A) (81,37%), Calcarenite (B) to Calcarenite (B)
(73.61%), Shale (C) to shale (C) (66.67%), Polymics Breccia (D) to Polymics Breccia (D) (80.00%),
Calcareous Siltstone (E) to Calcareous Siltstone (E) (75.00%), Pebble Sandstone (F) to Pebble
Sandstone (F) (85.71%). These are the percentages of lithology presence predicted for the next 0.2
meters at a depth of 11 meters (Figure 6). Based on Markov chain, the cycles of sedimentation
process are presented in Table 1.
Figure 6. Markov chain of rock lithology of sedimentation pattern at Ngalang river
Table 1. Cycle of Markov chain
Cycle Legend (Rock Formation)
Cycle 1 A (Calcareous Sandstone) – B (Calcarenite) – C (Shale) – A (Calcareous
Sandstone)
Cycle 2 A (Calcareous Sandstone) – B (Calcarenite) – D (Polimic Breccia) - A
(Calcareous Sandstone)
Cycle 3 A (Calcareous Sandstone) – B (Calcarenite) – F (Pebble Sandstone) – C
(Shale) - A (Calcareous Sandstone)
Cycle 4 A (Calcareous Sandstone) – B (Calcarenite) – E (Calcareous Siltstone) – C
(Shale) - A (Calcareous Sandstone)
Cycle 5 A (Calcareous Sandstone) – C (Shale) – B (Calcarenite) - D (Polimic
Breccia) - A (Calcareous Sandstone)
Cycle 6 A (Calcareous Sandstone) - D (Polimic Breccia) – B (Calcarenite) – E
(Calcareous Siltstone) – C (Shale) - A (Calcareous Sandstone)
Cycle 7 A (Calcareous Sandstone) - D (Polimic Breccia) – B (Calcarenite) – F
(Pebble Sandstone) – C (Shale) - A (Calcareous Sandstone)
Cycle 8 A (Calcareous Sandstone) - E (Calcareous Siltstone) – C (Shale) – B
(Calcarenite) - D (Polimic Breccia) - A (Calcareous Sandstone)
Cycle 9 A (Calcareous Sandstone) - E (Calcareous Siltstone) - B (Calcarenite) – F
(Pebble Sandstone) – C (Shale) - A (Calcareous Sandstone)
Calcareous sandstone was predicted as the type of rock that has the highest distribution
percentage, which occurs at the start or end of the Markov chain cycle. The thickness of rock

SUSTINERE: Journal of Environment & Sustainability, Vol. 5 No. 1 (2021), 49-63 57
distribution is also dominated by calcareous sandstone. Some variations of rock distribution show
the product of sedimentation process.
4.3 Geological Interpretation
Geological interpretation of depositional environment in research area was determined based
on the sedimentary structures, traces of fossil, benthonic foraminifera, and facies analysis model.
Hummocky Cross Stratification (HCS), for example, is a sedimentary structure that can be linked to
the depositional climate (HCS). Paleocurrent Analysis of HCS was obtained from the general trend
of Northwest – Southeast (NW-SE). It means that the source of sedimentation comes from northwest
part of the research area because the dip of a sedimentary layer is in the south direction.
Several fossils trace were found in the research area, such as chondrites (zoophycos),
rhizocorallium (cruziana facies), and thalasinoides (skolithos) (Collinson & Thompson, 1982). By
identifying the fossils trace, the depositional environments were able to be determined. The bottom
part of the section was deposited on continental shelf (tidal). The middle part of the section was
deposited in neritic (sub littoral), and the top part of section was deposited in upper bathyal.
Benthonic foraminifera fossils were discovered in three parts of measuring section. The
bottom and the middle part of the section were identified at inner (shelf) neritic (depth of 0- 20
meters) and the top part of the section was identified at upper slope bathyal (depth of 200 – 500
meters) (Table 2).
Table 2. Comparison and correlation of depositional environment
Comparison and
correlation of
environment
depositional data
before Chi-
square Test
Depositional environment based on
Bethonic Foraminifera
Depositional environment based on
Facies
Top Upper (Slope) Bathyal
(depth of 200 - 500 m) Top Lower Fan
Middle
Middle (shelf) Neritic
(depth of 20 - 100
meters)
Middle
Mid fan
Bottom Inner (Shelf) Neritic
(depth of 0 - 20 meters) Bottom
Upper - Mid Fan
Comparison and
correlation of
environment
depositional data
after Chi-square
Test
Depositional environment based on
Bethonic Foraminifera
Depositional environment based
on Facies
Upper (Slope) Bathyal
(depth of 200 - 500 meters) Lower Fan
4.4 Calculation of Chi-square Test
After obtaining the values of observation and expectation probability, the values were
compared to the Chi-square table (Table 3) to determine the acceptance of hypotheses. Degree of
freedom is V= {total of facies - 1}2 = {4-1}2 = 9. This research took a value of alpha (A) 5% with
accuration rate of 5% = 0,05, so the critical value such as 𝜒0.05;92 = 16.92.
The calculation value of Chi-square distribution was 2409.86. It is higher than 16.92. It
means that the null hypothesis is rejected. The null hypothesis (HO) is the data derived from
random transition population, the sortation of facies does not depend on previous facies.
Meanwhile, the alternative hypothesis (H1) is the data derived from random transition population,

58 SUSTINERE: Journal of Environment & Sustainability, Vol. 5 No. 1 (2021), 49-63
the sortation of facies depends on previous facies. Based on this calculation, this implies that the
significance of facies present depends on previous facies. The sortation of facies was not random
and had some patterns.
Table 3. Chi-square calculation
Class Observation (OJ) Expectation (EJ) (OJ-EJ)''/EJ
CT-1 - CT-1 136 90.24 23.20
CT-1 - CT-2 1 28.20 26.24
CT-1 - PS 3 16.92 11.45
CT-1 - CGL 1 7.05 5.19
CT-2 - CT-1 2 13.20 9.50
CT-2 - CT-2 41 4.40 304.45
CT-2 - PS 0 0.44 0.44
CT-2 - CGL 1 21.12 19.17
PS - CT-1 2 7.80 4.31
PS - CT-2 1 2.60 0.98
PS - PS 23 0.26 1988.88
PS - CGL 0 12.48 12.48
CGL - CT-1 2 3.00 0.33
CGL - CT-2 0 1.00 1.00
CGL - PS 0 0.10 0.10
CGL - CGL 8 4.80 2.13
Total 2,409.86
4.5 Discussion
There were some discussions in research area related to the stratigraphy of the Sambipitu
formation. The discussions will be presented in the following paragraphs.
There were some equality of probability lithology data and facies based on comparison data
of lithology facies and depositional environment (Bouma facies and Walker facies). Both lithology
probabilities were appropriated with facies probabilities on a thickness of 44.90 meters, but the
total percentage of those probabilities was not suitable, despite the interval of Markov chain
analysis being performed every 20 cm in lithology or facies.
Table 5. The comparison and correlation of facies probability data before Chi-square test on Sambipitu
formation Stratigraphy with percentage of > 50 %
Lithology Bouma Facies Walker Facies
Calcareous Sandstone -
Calcareous Sandstone 81.37% Tb-Tb 90.48 %
CT2 - CT2 93.18 %
Calcarenite – Calcarenite 73.61% Tc-Tc 66.67 %
Shale – Shale 66.67% Td-Td 94.16 %
CT1 - CT1 96.45 % Calcareous Siltstone -
Calcareous Siltstone 75.00% Te-Te 83.33 %
Polymic Breccia - Polymic
Breccia 80.00%
Ta-Ta 86.11 %
CGL – CGL 80 %
Pebble Sandstone - Pebble
Sandstone 85.71% PS – PS 88.46
SUSTINERE: Journal of Environment & Sustainability, Vol. 5 No. 1 (2021), 49-63 59
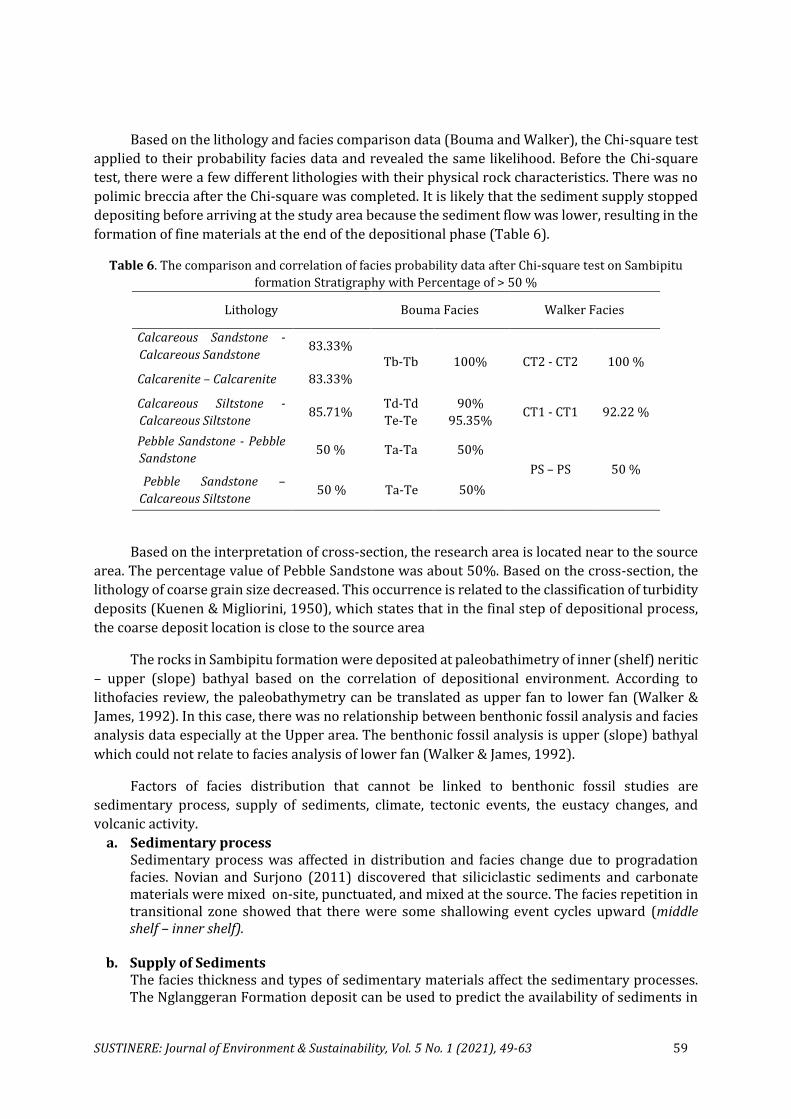
Based on the lithology and facies comparison data (Bouma and Walker), the Chi-square test
applied to their probability facies data and revealed the same likelihood. Before the Chi-square
test, there were a few different lithologies with their physical rock characteristics. There was no
polimic breccia after the Chi-square was completed. It is likely that the sediment supply stopped
depositing before arriving at the study area because the sediment flow was lower, resulting in the
formation of fine materials at the end of the depositional phase (Table 6).
Table 6. The comparison and correlation of facies probability data after Chi-square test on Sambipitu
formation Stratigraphy with Percentage of > 50 %
Lithology Bouma Facies Walker Facies
Calcareous Sandstone -
Calcareous Sandstone 83.33%
Tb-Tb 100% CT2 - CT2 100 %
Calcarenite – Calcarenite 83.33%
Calcareous Siltstone -
Calcareous Siltstone 85.71%
Td-Td 90% CT1 - CT1 92.22 %
Te-Te 95.35%
Pebble Sandstone - Pebble
Sandstone 50 % Ta-Ta 50%
PS – PS 50 % Pebble Sandstone –
Calcareous Siltstone 50 % Ta-Te 50%
Based on the interpretation of cross-section, the research area is located near to the source
area. The percentage value of Pebble Sandstone was about 50%. Based on the cross-section, the
lithology of coarse grain size decreased. This occurrence is related to the classification of turbidity
deposits (Kuenen & Migliorini, 1950), which states that in the final step of depositional process,
the coarse deposit location is close to the source area
The rocks in Sambipitu formation were deposited at paleobathimetry of inner (shelf) neritic
– upper (slope) bathyal based on the correlation of depositional environment. According to
lithofacies review, the paleobathymetry can be translated as upper fan to lower fan (Walker &
James, 1992). In this case, there was no relationship between benthonic fossil analysis and facies
analysis data especially at the Upper area. The benthonic fossil analysis is upper (slope) bathyal
which could not relate to facies analysis of lower fan (Walker & James, 1992).
Factors of facies distribution that cannot be linked to benthonic fossil studies are
sedimentary process, supply of sediments, climate, tectonic events, the eustacy changes, and
volcanic activity.
a. Sedimentary process Sedimentary process was affected in distribution and facies change due to progradation facies. Novian and Surjono (2011) discovered that siliciclastic sediments and carbonate materials were mixed on-site, punctuated, and mixed at the source. The facies repetition in transitional zone showed that there were some shallowing event cycles upward (middle shelf – inner shelf).
b. Supply of Sediments The facies thickness and types of sedimentary materials affect the sedimentary processes. The Nglanggeran Formation deposit can be used to predict the availability of sediments in
60 SUSTINERE: Journal of Environment & Sustainability, Vol. 5 No. 1 (2021), 49-63
the research area. The rock product of Nglanggeran formation is the result of sedimentation, which is deposited on land and in underwater (sea). It positions a large portion of southern part of Nglanggeran Mountain in an east – west direction (Haris, 2012). Semilir Formation rocks are older than Nglanggeran Formation rocks at N4-N5 (Early Miocene) and may support the sedimentation phase in the research area (Rizqi, 2019).
c. Climate The warm climate affects carbonates development. The benthonic fossils develop at the top part of stratigraphic measuring section where some fossils in Bathyal paleobathymetric are found. The warm climate makes a good condition of carbonate development. The presence of carbonate cement has become an indication of shallow marine with a depth of fewer than 200 meters (Donovan, 2017).
d. Tectonic events The tectonism is a facies shift element change that is locally triggered by vertical movements and dip of a fault block. The fault in this research area, specifically located in upper part of Sambipitu formation, is controlled by sinistral fault (Putra & Pandita, 2017).
e. The eustacy (sea level) changes The eustasy (sea level changes) caused the sea level depth to change, resulting in different sedimentary depositional products. The rocks of Sambipitu formation were deposited in intra arc basin with a shallow marine facies in the proximal facies region (Ongki et al, 2017). It was supported by the presence of andesitic lava on lower part of Sambipitu formation. The source of Sambipitu rock formation is derived from the deposition of Nglanggeran Formation, which is a part of volcanic body located under seawater. Volcanism influenced the rocks facies shift in Sambipitu and eustasy affected the upper part of Sambipitu formation (due to the sea level change).
f. Volcanism activity Volcanism activity is caused locally by material volcanic of the Nglanggeran Formation. The presence of volcanoes and islands were the environmental factor that directly affected the depth of seawater. At the research area, the volcanic products were deposited in northern area that was included in proximal facies (Bogie, 1998).
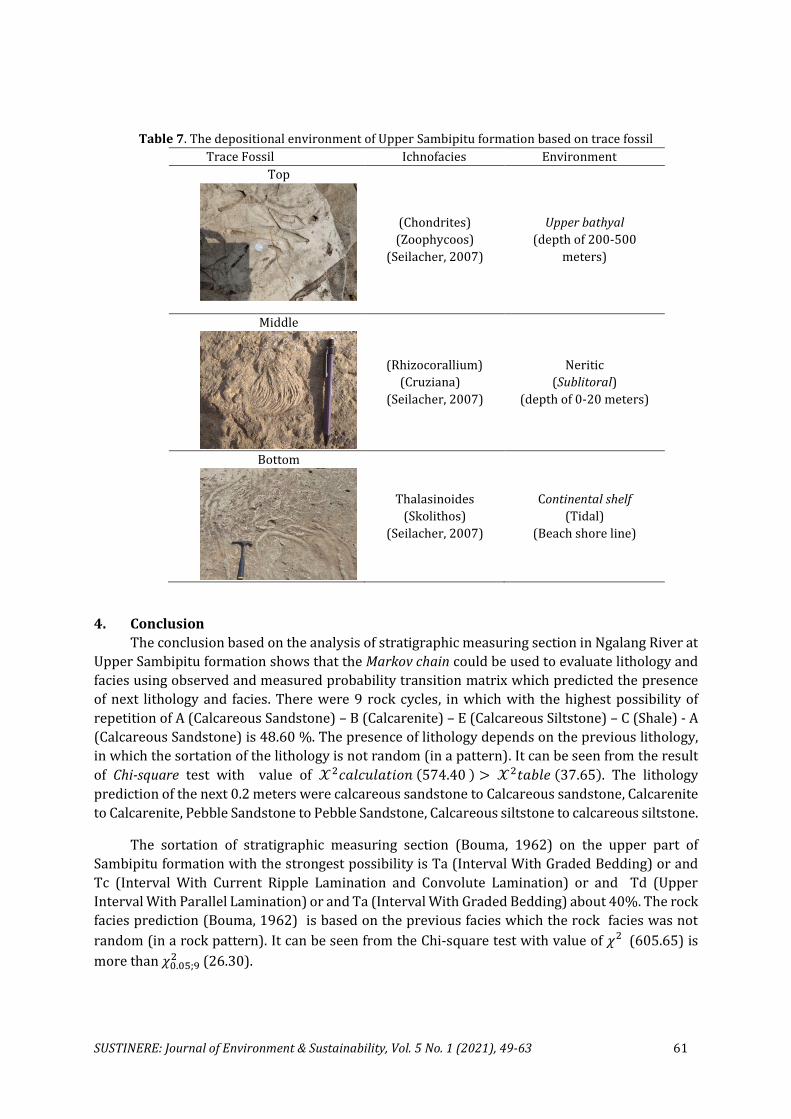
Trace fossils presence at Ngalang River could support the interpretation of paleobathymetry
or the depositional environment. Based on interpretation of the depositional environment by
trace fossil identification (Seilacher, 2007), the depositional environment at bottom, middle, and
top of Upper Sambipitu formation at Ngalang River is presented in Table 7. The sedimentation
process occurred from continental shelf (0-20 meters) to neritic (20-100 meters). At the top part
of Sambipitu formation, the sedimentation process occurred at Upper Bathyal (200 – 500 meters).
It showed that the depositional environment developed from shallow marine to deeper marine
related to facies model Bouma (Bouma, 1962) and Walker (Walker & James, 1992) from upper fan
to lower fan (deepening upward). Purbantoro et al. (2020) who studied for detailed stratigraphy
in Sambipitu revealed that Sambipitu formation deposited at Outer Neritic (20 – 100 meters) to
Upper Bathyal (200-500 meters). In addition, Aprilita et al. (2020) showed the depositional
system of Sambipitu formation in open circulation shallow marine based on microfacies analysis.
SUSTINERE: Journal of Environment & Sustainability, Vol. 5 No. 1 (2021), 49-63 61
Table 7. The depositional environment of Upper Sambipitu formation based on trace fossil
Trace Fossil Ichnofacies Environment
Top
(Chondrites)
(Zoophycoos)
(Seilacher, 2007)
Upper bathyal
(depth of 200-500
meters)
Middle
(Rhizocorallium)
(Cruziana)
(Seilacher, 2007)
Neritic
(Sublitoral)
(depth of 0-20 meters)
Bottom
Thalasinoides
(Skolithos)
(Seilacher, 2007)
Continental shelf
(Tidal)
(Beach shore line)
4. Conclusion
The conclusion based on the analysis of stratigraphic measuring section in Ngalang River at
Upper Sambipitu formation shows that the Markov chain could be used to evaluate lithology and
facies using observed and measured probability transition matrix which predicted the presence
of next lithology and facies. There were 9 rock cycles, in which with the highest possibility of
repetition of A (Calcareous Sandstone) – B (Calcarenite) – E (Calcareous Siltstone) – C (Shale) - A
(Calcareous Sandstone) is 48.60 %. The presence of lithology depends on the previous lithology,
in which the sortation of the lithology is not random (in a pattern). It can be seen from the result
of Chi-square test with value of 𝒳2𝑐𝑎𝑙𝑐𝑢𝑙𝑎𝑡𝑖𝑜𝑛 (574.40 ) > 𝒳2𝑡𝑎𝑏𝑙𝑒 (37.65). The lithology
prediction of the next 0.2 meters were calcareous sandstone to Calcareous sandstone, Calcarenite
to Calcarenite, Pebble Sandstone to Pebble Sandstone, Calcareous siltstone to calcareous siltstone.
The sortation of stratigraphic measuring section (Bouma, 1962) on the upper part of
Sambipitu formation with the strongest possibility is Ta (Interval With Graded Bedding) or and
Tc (Interval With Current Ripple Lamination and Convolute Lamination) or and Td (Upper
Interval With Parallel Lamination) or and Ta (Interval With Graded Bedding) about 40%. The rock
facies prediction (Bouma, 1962) is based on the previous facies which the rock facies was not
random (in a rock pattern). It can be seen from the Chi-square test with value of 𝜒2 (605.65) is
more than 𝜒0.05;92 (26.30).
62 SUSTINERE: Journal of Environment & Sustainability, Vol. 5 No. 1 (2021), 49-63
The prediction of facies that will be found (Bouma,1962) of the next 0.2 meters are (Tb)
Lower Interval with Parallel Lamination to (Tb) Lower Interval with Parallel Lamination, (Td)
Upper Interval with Parallel Lamination to (Td) Upper Interval with Parallel Lamination, (Te)
Pellitic Interval to (Te) Pellitic Interval. The facies sortation (Walker & James, 1992) on the upper
part of Sambipitu formation showed that the biggest possibility of repetition pattern is (CT-1
Classical Turbidite) to (PS Pebbly Sandstone) to (CT-2 Classical Turbidite) to (CGL Clast Supported
Conglomerate) to (CT-1 Classical Turbidite) about 28.25%. The presence of rock facies (Walker &
James, 1992) depend on the previous facies which the sortation of facies is not random. This can
be seen from the Chi-square test result with value of 𝜒2 (2409.86) is more than 𝜒0.05;92 (16.92).
The prediction of facies presence (Walker & James, 1992) of the next 0.2 meters are (CT-1 Classical
Turbidite) to (CT-1 Classical Turbidite), (CT-2 Classical Turbidite) to (CT-2 Classical Turbidite),
and (PS Pebbly Sandstone) to (PS Pebbly Sandstone).
The next or future research could be done on rock contact formation in between Sambipitu
and Oyo Formation by using Markov chain analysis. Sedimentary structure analysis is required to
make a comprehensive interpretation of geological data.
Acknowledgement
This research is highly dedicated to Institut Teknologi Nasional Yogyakarta which has funded and
supported. We would like to thank some anonymous reviewers whose comments improved
the early version of this manuscript's quality.
References Apriani, A. (2016). Metode Markov chains Untuk Analisa Perulangan Fasies Di Sub Basin Kiliran Jao Sumatra
Barat. Angkasa: Jurnal Ilmiah Bidang Teknologi, VIII(1), 1–16. https://doi.org/10.28989/angkasa.v8i1.128
Aprilita, L., Pandita, H., & Nuraini, S. (2020). Analisis Fasies pada kontak antar formasi Sambipitu dan formasi Oyo di lintasan kali Ngalang, Gunungkidul. Geoda2, 1(2), 43–52.
Blow, W. H. (1969). Late Middle Eocene to Recent planktonic foraminiferal biostratigraphy. In E. Brill (Ed.), Proceedings of the First International Conference Planktonic Microfossils 1967 (Vol. 1, pp. 199-242).
Bogie, I. (1998). The application of a volcanic facies model to an andesitic stratovolcano hosted geothermal system at Wayang Windu, Java, Indonesia. Proceedings of 20th NZ Geothermal Workshop.
Bothe, A. C. D. (1929). The Geology of the Hills Near Djiwo and Southern Range. 4th PacificScience Congress.
Bouma, A. H. (1962). Sedimentology of Some Flysch Deposits: A Graphic Approach to Facies Interpretation. Elsevier.
Collinson, J. D., & Thompson, D. B. (1982). Sedimentary Structures. Allen at Unwin Publishers Ltd.
Dicky Candrawan Putra, & Pandita, H. (2017). Identification of Kali Ngalang fault in Karanganyar village, Ngalang, Gedang Sari Sub district, Gunungkidul Regency, Special Regency of Yogyakarta. Prosiding Nasional Rekayasa Teknologi Industri Dan Informasi XIV Tahun 2019 (ReTII), 1–11.
Donovan, S. K. (2017). Trace fossils and tropical karst. Geological Magazine, 154(1), 166–168. https://doi.org/https://doi.org/10.1017/S0016756815000965
Haris, F. (2012). Geoologi dan studi Formasi Nglanggeran Daerah Patuk dan sekitarnya, Kecamatan Patuk, Kabupaten Gunungkidul, Provinsi D.I. Yogyakarta. UPN Veteran.
He, J., La Croix, A. D., Wang, J., Ding, W., & Underschultz, J. R. (2019). Using neural networks and the Markov chain approach for facies analysis and prediction from well logs in the Precipice Sandstone and Evergreen Formation, Surat Basin, Australia. Marine and Petroleum Geology, 101, 410–427. https://doi.org/https://doi.org/10.1016/j.marpetgeo.2018.12.022
Hillier, F. S., & Lieberman, G. J. (1995). Introduction to Operations Research, Sixth Edition. McGraw-Hill.
Jun, H., Cho, Y., & Noh, J. (2019). Trans-dimensional Markov chain Monte Carlo inversion of sound speed and
SUSTINERE: Journal of Environment & Sustainability, Vol. 5 No. 1 (2021), 49-63 63
temperature: Application to Yellow Sea multichannel seismic data. Journal of Marine Systems, 197, 103180. https://doi.org/https://doi.org/10.1016/j.jmarsys.2019.05.006
Kuenen, P. H., & Migliorini, C. I. (1950). Turbidity Currents as a Cause of Graded Bedding. The Journal of Geology, 58(2), 91–127. https://doi.org/https://doi.org/10.1086/625710
Lumsden, D. N. (1971). Markov chain analysis of carbonate rocks: applications, limitations, and implications as exemplified by the Pennsylvanian system in southern Nevada. Geological Society of America Bulletin, 82(2), 447–462. https://doi.org/https://doi.org/10.1130/0016-7606(1971)82[447:MCAOCR]2.0.CO;2
Michael, H. A., Li, H., Boucher, A., Sun, T., Caers, J., & Gorelick, S. M. (2010). Combining geologic‐process models and geostatistics for conditional simulation of 3‐D subsurface heterogeneity. Water Resources Research, 46(5), W0552. https://doi.org/https://doi.org/10.1029/2009WR008414
Novian, M. I., & Surjono, S. S. (2011). Stratigrafi dan sedimentasi zona transisi formasi Sambipitu: Formasi Oyo jalur Kali Widoro, Ngalang dan Kedungdowo, Kecamatan Nglipar, Kabupaten Gunungkidul, Daerah Istimewa Yogyakarta. Universitas Gadjah Mada.
Pandita, H. (2008). Depositional environment of Sambipitu formation Based on Trace Fossil in Nglipar Area. JTM, Institut Teknologi Bandung, XV(2), 85–94.
Pettijohn, F. J. (1957). Sedimentary Rocks. Herper.
Phleger, F. B. (1951). Ecology of Foraminifera, Northwest Gulf of Mexico. The Geological Society of America.
Pramunita, S. W., & Pandita, H. (2020). Analisis kepadatan fosil jejak sebagai parameter tingkat kandungan oksigen dan perubabahan lingkungan pengendapan di Kali Ngalang, Gedangsari, Gunungkidul, DIY. Geoda, 1(2), 1–18.
Purbantoro, R., Rizqi, A. H. F., & Nuraini, S. (2020). Konfigurasi stratigrafi batas formasi Sambipitu dan oyo di Jalan Ngalang –Gading, Kecamatan Gedangsari–Playen, Gunungkidul. Geoda, 1(2), 81–94.
Rizqi, A. H. F., & Purnomo, H. T. (2019). Analisis Siklus Perulangan Litologi pada Formasi Sambipitu. Prosiding Nasional Rekayasa Teknologi Industri Dan Informasi XIV Tahun 2019 (ReTII), November, 359–375.
Seilacher, A. (2007). Trace Fossil Analysis. Springer-Verlag Berlin Heidelberg.
Selley, R. C. (1985). Ancient Sedimentary Environments, 3rd edition. Cornell University Press.
Suprapto, N., Zamroni, A., & Yudianto, E. A. (2017). One Decade of the “LUSI” Mud Volcano: Physical, Chemical, and Geological Dimensions. Chemistry, 26(4), 615–629.
Surono, Toha, B., Sudarno, I., & Wiryosujono, S. (1992). Stratigraphy of Southern Mountain, Central Java. P3G-Ditjen GSM Dept. Pertamben.
Tipsword, H. L., Setzer, F. M., & Smith Jr, F. L. (1966). Interpretation of Depositional Environment in Gulf Coast Petroleum Exploration from Paleoecology and Related Stratigraphy. Gulf Coast Association of Geological Societies Transactions, 16, 119–130.
van Bemmelen, R. W. (1949). General Geology of Indonesia and adjacent archipelagoes. In The geology of Indonesia. The Hague, Martinus Nijhoff.
Walker, R. G., & James, N. P. (1992). Facies Models: Response to sea Level Change. Geological Association of Canada.
Walrand, J., & Varaiya, P. P. (2000). High-performance Communication Networks (Second Edi). Morgan Kauffman Publishers.
Zamroni, A., Putra, B. P., & Prasetya, H. N. E. (2020). Anthropogenic influences on morphological changes in the Progo River, Daerah Istimewa Yogyakarta Province, Indonesia. Sustinere: Journal of Environment and Sustainability, 4(3), 205–223. https://doi.org/https://doi.org/10.22515/sustinere.jes.v4i3.119