Sustainable tourism marketing - econstor
207
econstor Make Your Publications Visible. A Service of zbw Leibniz-Informationszentrum Wirtschaft Leibniz Information Centre for Economics Cristobal-Fransi, Eduard (Ed.); Daries, Natalia (Ed.); Ferrer-Rosell, Berta (Ed.); Marine-Roig, Estela (Ed.); Martin-Fuentes, Eva (Ed.) Book — Published Version Sustainable tourism marketing Provided in Cooperation with: MDPI – Multidisciplinary Digital Publishing Institute, Basel Suggested Citation: Cristobal-Fransi, Eduard (Ed.); Daries, Natalia (Ed.); Ferrer-Rosell, Berta (Ed.); Marine-Roig, Estela (Ed.); Martin-Fuentes, Eva (Ed.) (2020) : Sustainable tourism marketing, ISBN 978-3-03928-683-6, MDPI, Basel, http://dx.doi.org/10.3390/books978-3-03928-683-6 This Version is available at: http://hdl.handle.net/10419/230557 Standard-Nutzungsbedingungen: Die Dokumente auf EconStor dürfen zu eigenen wissenschaftlichen Zwecken und zum Privatgebrauch gespeichert und kopiert werden. Sie dürfen die Dokumente nicht für öffentliche oder kommerzielle Zwecke vervielfältigen, öffentlich ausstellen, öffentlich zugänglich machen, vertreiben oder anderweitig nutzen. Sofern die Verfasser die Dokumente unter Open-Content-Lizenzen (insbesondere CC-Lizenzen) zur Verfügung gestellt haben sollten, gelten abweichend von diesen Nutzungsbedingungen die in der dort genannten Lizenz gewährten Nutzungsrechte. Terms of use: Documents in EconStor may be saved and copied for your personal and scholarly purposes. You are not to copy documents for public or commercial purposes, to exhibit the documents publicly, to make them publicly available on the internet, or to distribute or otherwise use the documents in public. If the documents have been made available under an Open Content Licence (especially Creative Commons Licences), you may exercise further usage rights as specified in the indicated licence. https://creativecommons.org/licenses/by/4.0/ www.econstor.eu
-
Upload
khangminh22 -
Category
Documents
-
view
2 -
download
0
Transcript of Sustainable tourism marketing - econstor
econstorMake Your Publications Visible.
A Service of
zbwLeibniz-InformationszentrumWirtschaftLeibniz Information Centrefor Economics
Cristobal-Fransi, Eduard (Ed.); Daries, Natalia (Ed.); Ferrer-Rosell, Berta (Ed.);Marine-Roig, Estela (Ed.); Martin-Fuentes, Eva (Ed.)
Book — Published Version
Sustainable tourism marketing
Provided in Cooperation with:MDPI – Multidisciplinary Digital Publishing Institute, Basel
Suggested Citation: Cristobal-Fransi, Eduard (Ed.); Daries, Natalia (Ed.); Ferrer-Rosell, Berta(Ed.); Marine-Roig, Estela (Ed.); Martin-Fuentes, Eva (Ed.) (2020) : Sustainable tourismmarketing, ISBN 978-3-03928-683-6, MDPI, Basel,http://dx.doi.org/10.3390/books978-3-03928-683-6
This Version is available at:http://hdl.handle.net/10419/230557
Standard-Nutzungsbedingungen:
Die Dokumente auf EconStor dürfen zu eigenen wissenschaftlichenZwecken und zum Privatgebrauch gespeichert und kopiert werden.
Sie dürfen die Dokumente nicht für öffentliche oder kommerzielleZwecke vervielfältigen, öffentlich ausstellen, öffentlich zugänglichmachen, vertreiben oder anderweitig nutzen.
Sofern die Verfasser die Dokumente unter Open-Content-Lizenzen(insbesondere CC-Lizenzen) zur Verfügung gestellt haben sollten,gelten abweichend von diesen Nutzungsbedingungen die in der dortgenannten Lizenz gewährten Nutzungsrechte.
Terms of use:
Documents in EconStor may be saved and copied for yourpersonal and scholarly purposes.
You are not to copy documents for public or commercialpurposes, to exhibit the documents publicly, to make thempublicly available on the internet, or to distribute or otherwiseuse the documents in public.
If the documents have been made available under an OpenContent Licence (especially Creative Commons Licences), youmay exercise further usage rights as specified in the indicatedlicence.
https://creativecommons.org/licenses/by/4.0/
www.econstor.eu

Sustainable Tourism M
arketing Eduard Cristobal-Fransi, N
atalia Daries Ramón, Berta Ferrer-Rosell, Estela M
arine-Roig and Eva Martin-Fuentes
Sustainable Tourism Marketing
Printed Edition of the Special Issue Published in Sustainability
www.mdpi.com/journal/sustainability
Eduard Cristobal-Fransi, Natalia Daries Ramón, Berta Ferrer-Rosell, Estela Marine-Roig and Eva Martin-Fuentes
Edited by

Sustainable Tourism Marketing


Sustainable Tourism Marketing
Special Issue Editors
Eduard Cristobal-Fransi
Natalia Daries
Berta Ferrer-Rosell
Estela Marine-Roig
Eva Martin-Fuentes
MDPI • Basel • Beijing • Wuhan • Barcelona • Belgrade • Manchester • Tokyo • Cluj • Tianjin

Special Issue Editors
Eduard Cristobal-Fransi
Department of Business
Management,
University of Lleida
Spain
Berta Ferrer-Rosell
Department of Business
Management,
University of Lleida
Spain
Estela Marine-Roig
Department of Business
Management,
University of Lleida
Spain
Natalia Daries Department of Business Management, University of Lleida Spain
Eva Martin-Fuentes Department of Business Management, University of Lleida Spain
Editorial Office
MDPI
St. Alban-Anlage 66
4052 Basel, Switzerland
This is a reprint of articles from the Special Issue published online in the open access journal
Sustainability (ISSN 2071-1050) (available at: https://www.mdpi.com/journal/sustainability/
special issues/marketing tourism).
For citation purposes, cite each article independently as indicated on the article page online and as
indicated below:
LastName, A.A.; LastName, B.B.; LastName, C.C. Article Title. Journal Name Year, Article Number,
Page Range.
ISBN 978-3-03928-682-9 (Pbk)
ISBN 978-3-03928-683-6 (PDF)
c© 2020 by the authors. Articles in this book are Open Access and distributed under the Creative
Commons Attribution (CC BY) license, which allows users to download, copy and build upon
published articles, as long as the author and publisher are properly credited, which ensures maximum
dissemination and a wider impact of our publications.
The book as a whole is distributed by MDPI under the terms and conditions of the Creative Commons
license CC BY-NC-ND.

Contents
About the Special Issue Editors . . . . . . . . . . . . . . . . . . . . . . . . . . . . . . . . . . . . . vii
Preface to “Sustainable Tourism Marketing” . . . . . . . . . . . . . . . . . . . . . . . . . . . . . . ix
Eduard Cristobal-Fransi, Natalia Daries, Berta Ferrer-Rosell, Estela Marine-Roig and Eva
Martin-Fuentes
Sustainable Tourism MarketingReprinted from: Sustainability 2020, 12, 1865, doi:10.3390/su12051865 . . . . . . . . . . . . . . . . 1
Qihang Qiu, Tianxiang Zheng, Zheng Xiang and Mu Zhang
Visiting Intangible Cultural Heritage Tourism Sites: From Value Cognition to Attitudeand IntentionReprinted from: Sustainability 2020, 12, 132, doi:10.3390/su12010132 . . . . . . . . . . . . . . . . . 5
Anna Krizanova, George Lazaroiu, Lubica Gajanova, Jana Kliestikova, Margareta
Nadanyiova and Dominika Moravcikova
The Effectiveness of Marketing Communication and Importance of Its Evaluation inan Online EnvironmentReprinted from: Sustainability 2019, 11, 7016, doi:10.3390/su11247016 . . . . . . . . . . . . . . . . 25
Nuria Huete-Alcocer, Vıctor Raul Lopez-Ruiz and Adriana Grigorescu
Measurement of Satisfaction in Sustainable Tourism: A Cultural Heritage Site in SpainReprinted from: Sustainability 2019, 11, 6774, doi:10.3390/su11236774 . . . . . . . . . . . . . . . . 45
Maria Genoveva Millan Vazquez de la Torre, Salud Millan Lara and Juan Manuel
Arjona-Fuentes
Flamenco Tourism from the Viewpoint of Its Protagonists: A Sustainable Vision Using LeanStartup MethodologyReprinted from: Sustainability 2019, 11, 6047, doi:10.3390/su11216047 . . . . . . . . . . . . . . . . 61
Heesup Han, Amr Al-Ansi and Hyeon-Cheol Kim
Perceived Inconveniences and Muslim Travelers’ Loyalty to Non-Muslim DestinationsReprinted from: Sustainability 2019, 11, 4600, doi:10.3390/su11174600 . . . . . . . . . . . . . . . . 79
Tiantian (Tiana) Shi, Biao He and Jun (Justin) Li
Exotic or Home? Tourists’ Perception of Guest Houses, Guest Houses Loyalty, and DestinationLoyalty in Remote Tourist DestinationsReprinted from: Sustainability 2019, 11, 3835, doi:10.3390/su11143835 . . . . . . . . . . . . . . . . 93
M. Belen Prados-Pena, M. Lourdes Gutierrez-Carrillo and Salvador Del Barrio-Garcıa
The Development of Loyalty to Earthen Defensive Heritage as a Key Factor in SustainablePreventive ConservationReprinted from: Sustainability 2019, 11, 3516, doi:10.3390/su11133516 . . . . . . . . . . . . . . . . 109
Jaffar Aman, Jaffar Abbas, Shahid Mahmood, Mohammad Nurunnabi and Shaher Bano
The Influence of Islamic Religiosity on the Perceived Socio-Cultural Impact of SustainableTourism Development in Pakistan: A Structural Equation Modeling ApproachReprinted from: Sustainability 2019, 11, 3039, doi:10.3390/su11113039 . . . . . . . . . . . . . . . . 129
v

Jianjun Liu, Haili Pan and Shiyong Zheng
Tourism Development, Environment and Policies: Differences between Domestic andInternational TouristsReprinted from: Sustainability 2019, 11, 1390, doi:10.3390/su11051390 . . . . . . . . . . . . . . . . 157
Ting Fan, Bo Pu, Samart Powpaka and Liaogang Hao
The Impact of Disaster of a National Airline on the Nation’s Tourism: AnEmpirical InvestigationReprinted from: Sustainability 2019, 11, 1233, doi:10.3390/su11051233 . . . . . . . . . . . . . . . . 173
vi

About the Special Issue Editors
Eduard Cristobal-Fransi holds a PhD in economics and a degree in business administration.
He is currently the Dean of the Faculty of Law, Economics and Tourism at the University of Lleida
(Spain). His research focuses on e-commerce, social economy, and marketing management, mainly
in tourism and quality and services companies. His work has been presented at national and
international research conferences and has been published in several prestigious journals.
Natalia Daries-Ramon holds a PhD in business administration, an MSc in information and
knowledge society, a BA in business administration; a BA in market research and techniques, and
a BA in tourism. Currently, she is the Degree Coordinator for Tourism at the University of Lleida,
Spain, and Assistant Professor of Hospitality and Gastronomy at the Open University of Catalonia.
Her research focuses on the impact of new technologies in tourism. She has published several papers
in prestigious journals and presented, at international research conferences, the contribution and
impact of new technologies and social networking in tourism.
Berta Ferrer-Rosell holds an international PhD in tourism, an MSc in tourism management and
planning and a BA in tourism. She is currently a Serra Hunter Fellow and an Academic Coordinator
of the joint degree Business Management and Tourism at the University of Lleida. Her research
interest is in e-marketing, social economy, gastronomy and air transportation. She has published
in Tourism Management, the Journal of Destination Marketing & Management and the International
Journal of Hospitality Management, among others. She is an Associate Editor of the European Journal of
Tourism Research.
Estela Marine-Roig is a Senior Lecturer in tourism marketing at the University of Lleida (UdL),
Catalonia, an Assistant Professor of Social Media and Smart Tourism (MSc) at the Open University
of Catalonia (UOC), a post-doctoral researcher in the research group (UdL) on Tourism and Social
Knowledge Economy (TURESCO), and an Associate Editor of the European Journal of Tourism Research.
She holds a European PhD in tourism and leisure, an MSc in tourism management and planning, a
BA in humanities, and a BA in tourism. The Catalan Government awarded her the 2018 Medal of
Tourism for the best knowledge and research project. Her research interests include the analysis of
tourist destination images through online sources, especially traveler-generated content.
Eva Martin-Fuentes holds an international PhD in engineering and information technologies,
along with the Thesis Excellence Award for a Doctoral Thesis awarded by the International Federation
of IT & Tourism (IFITT). She is an Assistant Professor for the Department of Business Management
at the University of Lleida (Spain), where she has been recognized with the Teaching Excellence
Award for the areas of tourism management and social media. She was the Coordinator of Social
Media Marketing (MSc) and, currently, is the Vice-Dean of Institutional Relations and Employability
of the Faculty of Law, Economics and Tourism. Her research interests focus on e-tourism, especially
in the hospitality industry, and she has published articles in the International Journal of Hospitality
Management, Tourism Review, and the Journal of Hospitality and Tourism Management.
vii


Preface to “Sustainable Tourism Marketing”
Research on tourism marketing tends to place a greater focus on consumer behavior and its
impact on destinations, as well as on the use of tourism services or products, than on sustainability.
However, this field has a long tradition of research in aspects related to promoting tourism products
and services that, from the perspective of both supply and demand, respect the environment and
local communities. Sustainable tourism is a concept that demands more concreteness and action. It
takes into account the economic, social, and environmental impacts of satisfying the current needs of
visitors, the industry, the environment, and host communities without compromising the ability to
meet the needs of future generations. Raising consciousness, on the part of society in general and the
tourist in particular, about respectful consumption in regard to the environment is affecting the tourist
industry. This situation is triggering changes in tourism activity programs that, in turn, imply changes
in the ways both companies and tourist destinations are managed. Moreover, it has generated
marketing management committed to themes of sustainability and consumer behavior, marketing
of sustainable products, product design and green brands, labeling, and advertising. The objective of
this book is to analyze the main contributions made as a result of research related to sustainable
tourism–marketing management and current trends in this field. Therefore, the book collects
contributions about the marketing of destinations and the marketing management of companies
and tourism organizations from a sustainable tourism perspective. The studies highlighted analyze
the marketing strategies adopted by tourism companies and institutions or tourist destinations
in order to manage visitors in a sustainable manner, promote the destination in marginal areas,
promote territorial balance, or analyze the effect of tourism on the consumption of local products
and the economic development of host communities. We consider this book to contribute to better
management and the dissemination of sustainable tourism, thus helping destinations and the tourism
industry commercialize products or services that respect the environment.
Eduard Cristobal-Fransi, Natalia Daries, Berta Ferrer-Rosell, Estela Marine-Roig,
Eva Martin-Fuentes
Special Issue Editors
ix


sustainability
Editorial
Sustainable Tourism Marketing
Eduard Cristobal-Fransi *, Natalia Daries, Berta Ferrer-Rosell, Estela Marine-Roig
and Eva Martin-Fuentes
Department of Business Management, University of Lleida, 25001 Lleida, Catalonia, Spain;[email protected] (N.D.); [email protected] (B.F.-R.); [email protected] (E.M.-R.);[email protected] (E.M.-F.)* Correspondence: [email protected]; Tel.: +34-97-370-3253
Received: 18 February 2020; Accepted: 25 February 2020; Published: 2 March 2020���������������
Abstract: In this article, we introduce the themes and approaches covered in this special issue onSustainable Tourism Marketing. Its objective has been to analyze the main contributions made asa result of research related to sustainable tourism-marketing management and current trends in thisfield. This issue has gathered articles about the marketing of destinations and the marketing andcommunication management of companies and tourism organizations from a sustainable tourismperspective. This editorial piece provides a useful introduction to the relationship between tourismand sustainable marketing management that can be used by researchers and practitioners to developtourism marketing strategies from a sustainable perspective.
Keywords: sustainable tourism; tourism marketing; destination management; destination marketingorganization; tourist behavior
1. Introduction
Due to the great importance and influence of tourism in society, public institutions and companieshave proposed to emphasize the positive impacts of tourism and reduce its negative impacts at theeconomic, social, and environmental levels [1]. Therefore, it is necessary to reach a balance betweensustainability and tourism development of the destination. The sustainability of the tourist destinationhas become, in fact, a key element of differentiation to increase its competitiveness [2].
For the tourism industry, the environment and its conservation are vital aspects. Initiatives andproposals have emerged aimed at implementing a new concept related to tourism, called ‘sustainabletourism’. This concept has been defined by the UNWTO [3] as ‘Tourism that takes full account ofits current and future economic, social and environmental impacts, addressing the needs of visitors,the industry, the environment and host communities’ (p. 12). Tourist activity is inseparable fromthe surrounding environment; thereby, it necessary to raise awareness among tourists, residents,and managers of tourist establishments of making the tourism industry sustainable by adoptingsustainable practices [4]. To do this, marketing management is essential.
Initially, it may seem that the concepts of marketing and sustainability are incompatible [5].Marketing, in general, and advertising, in particular, have been criticized for spreading fraudulentmessages in the promotion of sustainable products or services, personified in the practice of ‘greenwashing’, which involves deceiving consumers about a company’s environmental performance inorder to make a commercial profit [6,7]. However, marketing is essential for businesses and sustainabletourist destinations. Good marketing management is responsible for the numbers and types of touristswho visit a destination and for guaranteeing viable destinations that provide valuable contributionsto economic development and growth [8]. While the roles of public administration and tourismbusinesses are key in the design and development of sustainable destinations, marketing has an
Sustainability 2020, 12, 1865; doi:10.3390/su12051865 www.mdpi.com/journal/sustainability1

Sustainability 2020, 12, 1865
important function in determining how successfully destinations achieve their goals and objectives,in both the short and medium term [9].
2. Structure and Contents of the Thematic Issue
The aim of this special issue is to add new and diverse knowledge to the existing body of literatureon the relationship between marketing and sustainability in the specific field of tourism. All of thearticles take different perspectives. Ten articles in the special issue, written by accredited researchersfrom various countries, present original studies that explore the implications of applying sustainablepractices to tourism marketing.
The first of the articles is titled ‘Visiting intangible cultural heritage tourism sites: From valuecognition to attitude and intention’, and is written by Qiu et al. The authors took TFTLC (thetraditional firing technology of Longquan celadon) as a study case, investigating residents’ valuecognition and emotional attitudes in regard to a heritage site and nearby city in Zhejiang Province,China, and analyzing the formation path of tourism intention. Their research clarifies how intangiblecultural heritage (ICH) tourism products can promote the sustainability of ICH in environmental,economic, and social aspects, and the authors confirm the potential to predict tourists’ motivationsand intentions by studying their value cognition and emotions, thus providing valuable insight intoproduct development, marketing, and post-development evaluations of ICH tourism.
The second article is titled ‘The effectiveness of marketing communication and importance ofits evaluation in online environment’, and is written by Krizanova et al. The article focuses ononline marketing communication undertaken by hotels, and how to measure its effectiveness, which,according to authors, continues to be a challenge due to its complexity. Thus, in this article, the authorspropose a methodology for implementing a suitable indicator for the evaluation of the effectivenessof online communication tools. They based their research on Slovakia’s hotel industry, and on thecurrent marketing communication activities hotels undertake by conducting a survey among themanagers of Slovakian hotels. Their results suggest that hotels prefer financial metrics, because theyrepresent a traditional approach towards investment evaluation. That is, return on investment (ROI) isthe most common metric for assessing investments in online communication, and thus, the authorsproposed ROI as the most-appropriate metric for evaluating the effectiveness of online marketingcommunication activities.
The third article, ‘Measurement of satisfaction in sustainable tourism: a cultural heritage sitein Spain’ by Huete-Alcocer et al., analyzes sustainable tourism in a cultural context. The authorsaffirm that there are many factors that can influence the success of this type of tourism, but anyaction developed should be related to the satisfaction of the tourist. The work focuses on a heritagedestination of an archaeological nature. The researchers studied the profile of the cultural tourist andhis or her level of satisfaction after visiting the site. On one hand, the results show that tourists whovisit heritage sites or archaeological parks seek a deeper cultural experience. Furthermore, they arewell-informed and have planned their visit. On the other hand, they show that cultural tourism isbased on a visitor profile that demands good infrastructure, informed guides, and clear informationabout the park or site, in addition to mid-level accommodation and catering services.
The fourth article also addresses an intangible cultural heritage, but in this case, in the south ofSpain. The article is titled ‘Flamenco tourism from the viewpoint of its protagonists: a sustainable visionusing Lean Startup methodology’, and was written by Millán Vázquez de la Torre et al. The authorsexplain the transition and evolution of flamenco from a form of popular music to an intangiblecultural heritage of humanity. Using the Lean Canvas model combined with a survey of a panel offlamenco experts, the necessity to retain their place-based identity is pointed out, as well as the need,as a regional culture, to establish links to export markets for their survival, emphasizing the importanceof high-quality communication and promotion, considering that the respect and maintenance offlamenco’s essence are fundamental for the creation of a sustainable tourism product of quality in themedium and long terms.
2

Sustainability 2020, 12, 1865
The fifth article, ‘Perceived inconveniences and Muslim travelers’ loyalty to non-Muslimdestinations’ by Han et al., identifies the process of generating loyalty for international Muslimtravelers to non-Muslim destinations, taking into consideration the disadvantages these travelers mayencounter when visiting a non-Muslim destination. Through qualitative interviews of Muslim travelersvisiting South Korea and an analysis of the structural equation model, the results reveal that image,emotional experiences, and emotional desire play an important role in the loyalty of Muslim travelers.This research has several implications for non-Muslim destination management organizations (DMOs)aiming to attract and retain international Muslim travelers.
The sixth article is titled ‘Exotic or home? Tourists’ perception of guest houses, guest housesloyalty, and destination loyalty in remote tourist destinations’, and was written by Shi et al. The articleanalyzes guest houses, a sustainable means of accommodation, and presents as a case study Kanas,a remote tourist destination in the autonomous region of Xinjiang, China. The conceptual modelexamines the cultural distance between residents and visitors in regard to the perceptions and loyaltyof the guests. The results show that a large cultural distance increases the perception of an exoticculture and decreases the perception of a sense of home, as well as that both the perception of anexotic local culture and the sense of home have a positive effect on loyalty to the guest houses in thisremote destination.
The seventh article, ‘The development of loyalty to earthen defensive heritage as a key factor insustainable preventive conservation’ by Prados-Peña et al., examines whether the loyalty to a heritagesite in Granada, Spain, emerges as a consequence of the perceived image visitors have of it and thelevel at which place attachment mediates the relationship between the effect of image and loyalty.Through a survey of 200 randomly selected respondents, the analyses confirm that the antecedentfactors that determine loyalty are place attachment and its perceived image, which make it more likelythat the site will be visited and recommended.
In the eighth article, ‘The influence of Islamic religiosity on the perceived socio-cultural impact ofsustainable tourism development in Pakistan: a Structural Equation Modeling approach’, written byAman et al., the authors analyze the influence of religion on the perception of the impact of thedevelopment of sustainable tourism based on the results of a survey of more than 500 residents ofPakistan. The findings show that respondents with a high level of Islamic religiosity have a positiveattitude towards the development of sustainable tourism, as well as perceptions of communities,behaviors, and cultural aspects that affect sustainable tourism.
The ninth article of this special issue dedicated to sustainable tourism marketing is titled ‘Tourismdevelopment, environment and policies: Differences between domestic and international tourists’,and was written by Liu et al. The authors reveal that domestic and international visitors react differentlyto the air (environmental) quality of the destination. The authors used panel data (2005–2015) from17 underdeveloped provinces in China, as well as an econometric model analysis, to explore thedifferences in the impact of air quality between domestic and international visitors, and how thesedifferences may help local governments to establish tourism development policies.
The final article, ‘The impact of disaster of a national airline on the nation’s tourism: An empiricalinvestigation’ by Fan et al., addresses the issue of sustainable tourism marketing from a totally differentperspective, analyzing the impact of an air disaster on travelers’ attitudes and intentions to travel toa specific country. The authors apply authors apply this concept to Chinese tourists’ intention to travelto Malaysia after the Malaysia Airlines disaster. To do so, they use a hybrid methodology using bothquantitative and qualitative methods. The results show that intention to visit is positively affected byintention to fly on the specific airline and attitude toward visiting Malaysia. However, the effect of theperceived risk of flying this airline on attitudes about visiting the country is mediated by the perceivedrisk of visiting Malaysia and attitudes towards visiting it. The research concludes that knowledgeabout a country significantly reduces perceived risks about visiting it. Finally, public opinion reducesthe perceived risk of using this airline.
3

Sustainability 2020, 12, 1865
Author Contributions: All authors collaborated equally to this editorial. All authors have read and agree to thepublished version of the manuscript.
Funding: This research received no external funding.
Conflicts of Interest: The authors declare no conflict of interest.
References
1. Wu, T.-P.; Wu, H.-C.; Liu, S.-B.; Hsueh, S.-J. The relationship between international tourism activities andeconomic growth: Evidence from China’s economy. Tour. Plan. Dev. 2018, 15, 365–381. [CrossRef]
2. Moral Moral, M.; Fernández Alles, M.T.; Sánchez Franco, M.J. Attitudes of rural accommodation managerstowards the development of sustainable tourism. Cuad. Tur. 2018, 41, 707–711.
3. UNEP. Making Tourism More Sustainable: a Guide for Policy Makers; UNEP, UNWTO, Eds.; United NationsEnvironment Programme: Paris, France, 2005.
4. Sanagustín Fons, M.V.; Fierro, J.A.M.; y Patiño, M.G. Rural tourism: a sustainable alternative. Appl. Energy2011, 88, 551–557. [CrossRef]
5. Jones, P.; Clarke-Hill, C.; Comfort, D.; Hillier, D. Marketing and sustainability. Mark. Intell. Plan. 2008, 26, 123–130.[CrossRef]
6. Delmas, M.A.; Burbano, V.C. The drivers of greenwashing. Calif. Manag. Rev. 2011, 54, 64–87. [CrossRef]7. Wu, Y.; Zhang, K.; Xie, J. Bad greenwashing, good greenwashing: Corporate social responsibility and
information transparency. Manag. Sci. 2020. [CrossRef]8. Hudson, S.; Fung So, K.K.; Li, J.; Meng, F.; Cárdenas, D. Persuading tourists to stay–Forever! a destination
marketing perspective. J. Destin. Mark. Manag. 2019, 12, 105–113. [CrossRef]9. Font, X.; McCabe, S. Sustainability and marketing in tourism: Its contexts, paradoxes, approaches,
challenges and potential. J. Sustain. Tour. 2017, 25, 869–883. [CrossRef]
© 2020 by the authors. Licensee MDPI, Basel, Switzerland. This article is an open accessarticle distributed under the terms and conditions of the Creative Commons Attribution(CC BY) license (http://creativecommons.org/licenses/by/4.0/).
4

sustainability
Article
Visiting Intangible Cultural Heritage Tourism Sites:From Value Cognition to Attitude and Intention
Qihang Qiu 1,2, Tianxiang Zheng 1,2, Zheng Xiang 3 and Mu Zhang 1,2,*
1 Shenzhen Tourism College, Jinan University, Shenzhen 518053, China; [email protected] (Q.Q.);[email protected] (T.Z.)
2 JNU-UF International Joint Laboratory on IT & T, Shenzhen 518053, China3 Howard Feiertag Department of Hospitality and Tourism Management, Pamplin College of Business,
Virginia Tech, Blacksburg, VA, USA; [email protected]* Correspondence: [email protected]; Tel: +86-755-26931865
Received: 4 November 2019; Accepted: 18 December 2019; Published: 23 December 2019 ���������������
Abstract: Intangible cultural heritage (ICH) has recently become an important area of tourismdevelopment for many countries that are home to such cultural resources. Within this context,the value of an ICH site has often been used to guide tourism development and policy making.In addition, community residents’ attitude and perception of ICH contribute to tourism development.In this study, we used the traditional firing technology of Longquan celadon in Zhejiang Province,China, as a case study to understand the relationships between value recognition and attitude alongwith the intention to visit the heritage site. We surveyed 368 residents and conducted path analysisto test such relationships. Findings revealed significant positive correlations between residents’cognition of ICH value, their attitudes and travel intentions. Among them, attitudes played amediating role in the formation of value cognition to travel intention. These findings offer insightsinto ICH-related tourism development, particularly regarding tourism product design, marketingand post-development evaluation, as well as the conservation of ICH sites.
Keywords: intangible cultural heritage; value cognition; attitude; tourism intention; path analysis
1. Introduction
An enduring lack of social exposure and scholarly attention to intangible cultural heritage (ICH)has resulted in losses of government and community property due to ICH destruction. However,the inclusion of cultural practices and expressions of intangible heritage on the United NationsEducational, Scientific and Cultural Organization’s (UNESCO’s) Convention’s Lists has recentlydrastically improved the survival status of ICH, and associated tourism has begun to attract researchers’interest [1–10]. Tourism development has promoted the safeguarding and development of ICH to acertain extent, with some governments beginning to turn to ICH as a steady source of income. Manyheritage sites have created tourism products in the name of restoring ICH, which may violate theauthenticity of heritage itself, and poses a risk of over-commercialization. Academics are currently mostinterested in the preservation and safeguarding of ICH craftsmanship and aesthetics. Therefore, thequestion of how to vitalize ICH tourism warrants discussion. In terms of the sustainable developmentof ICH tourism, it is necessary to find a balance between ICH and non-heritage tourism development,where related tourism products reflect value while meeting tourists’ emotional needs. ICH value canthus become a focus of product development [11]. Meanwhile, residents—who play essential rolesin ICH promotion—can improve the quality of ICH products through their cognition, attitudes andtourism intentions.
Sustainability 2020, 12, 132; doi:10.3390/su12010132 www.mdpi.com/journal/sustainability5

Sustainability 2020, 12, 132
Under this background, this paper examines the relationship between residents’ value cognitionaround ICH tourism, and the formation of tourism intentions to promote sustainable ICH tourismdevelopment. Most research on tourist destinations has naturally focused on tourists; however,the invisibility, portability and complexity of ICH require visitors to spend more energy, money andtime on understanding the connotations of ICH. Accordingly, to improve the accuracy of relevantresearch, residents from a local heritage city and neighboring areas with the same type of ICH wereselected as respondents. This research project consists of two main steps: First, we reconstruct the ICHvalue system to study residents’ ICH-related value cognition; and second, we delineate the formationmechanism behind residents’ tourism intentions within a value cognition–emotional attitude–tourismintentional framework. Our findings contribute to tourism theory and practice. Theoretically, thisstudy redefines the value cognition system and integrates it with tourism intention, offering a newstarting point for the study of tourism behavior. Additionally, by applying problem-solving strategieson the basis of cognition [12] and the value–attitude–behavior model [13] to ICH tourism, the processesunderlying tourism intention are clarified using established theories. From a practical standpoint,ICH tourism products based upon residents’ value judgments are more connotative and aligned withresidents’ preferences. Combining such products with residents’ attitudes and behavioral intentionscan better promote the sustainable development of ICH tourism. Furthermore, ICH research canprovide useful insight for tourism and other economic fields; such knowledge can then be translatedinto popular educational tools for residents, thus providing spiritual inspiration. We chose a form ofceramic art, namely the traditional firing technology of Longquan celadon (TFTLC), as our researchobject, and used questionnaires to gather relevant information from residents of the local city and aneighboring city that shared the same type of ICH.
2. Literature Review
The first ICH-related document was drafted in 1971, followed by the establishment of the firstinternational normative instrument on the safeguarding of traditional culture and folklore in 1989,and a new program on ’Intangible Cultural Heritage’. UNESCO finally adopted the InternationalConvention for the Safeguarding of Intangible Cultural Heritage (i.e., the Convention) in 2003 [14].UNESCO offers a comprehensive definition of ICH that encompasses oral traditions, performingarts, social practices, rituals and festival events, knowledge and practices concerning nature and theuniverse, or knowledge and skills to produce traditional crafts inherited from one’s ancestors andpassed on to one’s descendants. Consensus around the safeguarding of ICH has led to many studiesregarding its identification, protection and inheritance [1–3,7–9]. Scholars have recently integratedICH protection with the development of digital communications in an attempt to present ICH viasocial media or other network practices [6,10,15]. The sustainable development of ICH tourism hasalso gradually captured scholars’ attention [4,5].
In the context of ICH tourism development, value can serve as a focal point in guiding decisionmaking [11]. The World Tourism Organization’s (UNWTO’s) first study on tourism and ICH proposedthat ICH assets can be developed as tourism products using several approaches. Examples include:Creating cultural spaces or purpose-built facilities as venues to exhibit cultural heritage, merging orbundling tourist attractions to create themed sets to enhance appeal, developing new tourism routes orheritage networks, using existing circuits or reviving heritage networks, such as pilgrimage routes,and/or using or reviving festivals and events [16]. These products imbue tangible objects with corecultural values, therefore benefiting host communities and meeting tourists’ needs while offeringeducation and entertainment. Some researchers have suggested that the outstanding universal valueof heritage should be maintained in world heritage conservation planning [17]. Understanding thevalue of ICH in tourism development requires urgent attention, and inspired this study.
Much of the research on ICH tourism has taken community residents in heritage sites as theprimary subjects [4,5]. Besides ICH, many scholars have emphasized interactions between localcommunities and heritage sites. According to these studies, residents’ attitudes and perceptions are
6

Sustainability 2020, 12, 132
important for the sustainable development of heritage tourism; structural equation modeling (SEM)has often been adopted to identify correlations between these factors [18–22]. In terms of tourismdevelopment in heritage sites, residents seem to offer greater contributions than tourists. Communityparticipation in heritage site governance can increase trust and public consensus, reveal tourismstrategies to meet local needs, and contribute to destination sustainability [18]. Our study thus has arobust theoretical basis for taking residents as the research object.
In accordance with most ICH research, our literature review begins by exploring residents’cognition of ICH value, and next considers the relationship between ICH value and tourismintention, the impacts of emotional attitudes on behavior and the path of value cognition–emotionalattitude–tourism intention. We then put forth our research hypotheses and design questionnaires topresent a systematic study of the sustainable development of ICH tourism.
2.1. ICH Value and Tourism Intention
As ICH relies on tangible carriers to transform tourism resources into products, most scholarshave focused on tangible places (e.g., heritage sites and museums) when studying heritage tourism.Similarly, products are closely related to ‘places’. Existential tourism has made it possible to unveilidentity sources dissociated with local places, which can link authenticity with the original spirit of aplace [23]. Therefore it is logical to study tourism development by discussing the value of ICH.
Some scholars consider value the most abstract social cognition, which spurs attitude and behavior.Homer and Kahle [13] proposed the value–attitude–behavior (VAB) hierarchy and applied it to thestudy of natural foods’ consumption. The value scale associated with the VAB hierarchy is dividedinto extrinsic and intrinsic value, derived from two schools of axiological thought in philosophy, whichare, objectivity doctrines and subjectivity doctrines. Objectivity doctrines posit that the world exists initself. Conversely, subjective theories hold that reality exists in knowers’ perceptions and intellections,such that reality is relative rather than absolute. External values are hence based on the knowledgeof an object, such as a goal experience or situation; internal values refer to expectation-orientedintentions that are internally directed. Internal and external values both exert significant positiveeffects on tourism intention [24]. Although VAB and corresponding value dimension theories havebeen widely used in research on behavioral patterns in ecological behavior, tourism destinations andother areas [25,26], the value of tourism products cannot be described solely on the basis of internaland external value.
Williams and Soutar’s [27] view differs from the belief that value is analogous to social cognitionin the VAB hierarchy; they contended that value is a personal perception, and perceived value has asignificant positive influence on behavioral intention. According to Williams and Soutar’s [27] studyof value, satisfaction and behavioral intentions in an adventure tourism context, identified valuedimensions include functional value, value for money, emotional value, social value and novelty value.These propositions are more in line with the times than prior value dimensions, and hence moresuitable for tourism research. Other scholars also agreed that value is based on personal perceptionsunder the influence of culture. Therefore, Williams and Soutar’s [27] designed scales were also used inother research. Some scholars [28–30] continue to support the view that “value is social cognition”,and their scales are more specific. For example, Kim and Thapa [29] incorporated quality, emotional,price and social value in a study of nature-based tourism. Hapsari [30] believed that value can explainconsumer behavior such as purchase intention, and thus employed educational value to explore touristloyalty in educational theme parks.
Conceptually, cognition refers to an information-processing view of an individual’s psychologicalfunctions, of which perception is a part [31]. However, in research involving the ‘value perception’perspective, the dimensions used to assess value are more specific than in work that focuses on ‘valuecognition’.
Overall, tourism researchers should consider value in a broader sense [27], and more accurateterms should be applied when discussing heritage-related values (e.g., beliefs and interests, ideas and
7

Sustainability 2020, 12, 132
ideologies) [9]. In this paper, we take tourists’ cognition of the value of ICH as a starting point, andthen summarize historical, social, economic, aesthetic, educational and other values of TFTLC basedon a review of the literature to build a foundation for ongoing tourism development.
2.2. Effects of Emotion on Behavior
Many studies have confirmed that emotional experiences influence tourists’ decisions in variousways [32,33]. For example, emotions can shape individuals’ tourism motivations and chosendestinations or tourism products [34,35]. In the consumption stage, tourists’ emotions often change overthe course of a trip [36]. In later stages of consumption, visitors’ emotions and affect can influence theirtourism consumption satisfaction, destination attachment and loyalty [37–39]. Scholars have discusseddiverse ways to evaluate emotions. For example, Prayag and et al. [40] noted that the psychologyliterature tends to espouse two main theoretical approaches: dimensional (valence-based) andcategorical (emotion-specificity). The dimensional approach applies labels such as positive–negativeand pleasure–awakening to conceptualize emotions, whereas the categorical approach frames emotionsusing various states, such as pleasure, happiness and excitement or fear, regret and disappointment.In a study of tourists’ emotional experiences, Rahmani and colleagues [41] applied Plutchik’s [42] theoryof psychoevolutionary synthesis wherein emotions are divided into eight categories: anticipation, joy,sadness, anger, fear, trust, disgust and surprise. The concept of place attachment has also been used toexamine how positive emotions and cognitive connections inform travelers’ destination loyalty [39].
Attitude is generally understood as an evaluative judgment about a given object, which can befavorable, unfavorable, or neutral [43]. Judgments can change following an exposure to informationand serve as a determinant of intention [44]. Scholars have also used numerous scales to measureattitudes. For example, Manca and Fornara [45] employed bipolar scales to measure respondents’attitudes based on the following adjectives: good–bad, appropriate–inappropriate, right–wrong,pleasant–unpleasant, boring–funny, harmful–beneficial and useful–useless. Prajitmutita and hisco-authors [46] used satisfaction to measure customers’ attitudes towards a product or service basedon their degree of pleasure and fulfilment.
Although emotion and attitude have been defined uniquely in various studies, the correlationbetween these constructs is complex; no uniform classification or indicators thereof have been proposedto determine these constructs’ influences upon tourists’ behavior. Some authors [47] have foundthat people with greater emotional well-being are more likely to express positive attitudes towardspurchasing sustainable products. Other researchers [48] have found that emotion has a positiveinfluence on tourism attitude, whereas attitude has a partial mediating effect on emotion. Respondentsmay use a series of positive, negative, or mixed emotional words to express their attitudes towardsvalue perceptions of tourism products during interviews [49]. Therefore, in this study, we combinedemotion with attitude to create the notion of ‘emotional attitude’, which represents residents’ attitudestowards ICH with respect to emotions. ‘Emotional attitude’ is measured using ‘Unpleasant–Pleasant’and ‘Boring–Arousing’ as indicators, echoing the anchors used in previous studies to measure emotionand attitude.
2.3. The Path of Value Cognition–Emotional Attitude–Tourism Intention
The concept of cognition, as used in tourism research, refers to tourists’ responses to massinformation in the external tourism environment, and alludes to their future expectations to acertain extent [50]. Before Homer and Kahle [13] proposed the VAB hierarchy, Newell and Simon [12]characterized cognition in information processing in terms of how the human brain handles information,laying the foundation for the cognition–attitude–behavior model (CAB). Mehrabian and Russell [51]proposed the stimulus–organism–response (SOR) model shortly thereafter, in which S denotesenvironmental stimuli, O denotes the emotional responses of arousal, pleasure and dominance and Rdenotes consumer behavior.
8
Sustainability 2020, 12, 132
Later, Donovan and Rossiter [52] further validated and modified the SOR model, contendingthat consumers exhibit two primary emotional states (i.e., pleasure and arousal), which are significantmediators of intended shopping behaviors within a store.
Since then, many studies have confirmed the relationships between cognition, emotion andbehavior, or between cognition, attitude and behavior. For instance, Smith and Sherman [53] conducteda study on store image and mood using the SOR framework, and identified associations betweencustomers’ cognition, attitudes and behavior. Eroglu, Machleit and Davis [54] identified atmosphericcues in online stores that can influence shoppers’ emotions, cognitive states and ultimate shoppingoutcomes. Billiot and Rodriguez [55] noted that cognitive flexibility theory explained how, afterconsumers have acquired and transferred knowledge, they are inspired to put such knowledge intopractice. The authors also used cognitive flexibility theory to study parents’ cognition, attitudes andbehavior under the influence of hypermedia and hypertext when allowing their children to participatein football games [55]. Kaplan and Prato [56] reviewed cognition, emotions and overt behaviorassociated with cyclists and motorists sharing the road. Given the similarity between emotion andattitude, in this study, we use the term ‘emotional attitude’ to represent residents’ pleasure and arousal.The cognition–emotion–behavior hierarchy and CAB model have been widely applied in consumerbehavior research, and are feasible for studies of tourism intention as well.
A discussion of the relationship between ICH value and tourism intention, the effects of emotionalattitudes on behavior, and the path of value cognition–emotional attitude–tourism, ground our researchframework. The preceding literature review confirms the potential of assessing ICH tourism intentionby taking residents’ value cognition as the starting point, and their attitudes as a supplement.
3. Research Design
3.1. Study Case and Research Object
Among the heritage domains defined by the Convention in 2003, performing arts, festival eventsand traditional craftsmanship possess high displayability and experiential value, showing promise tobe developed into ICH tourism products. These ICH domains also comprise a large proportion of theConvention’s “List of Intangible Cultural Heritage in Need of Urgent Safeguarding”. Therefore, it is ofpractical significance to promote such domains via sustainable tourism development. In terms of ICHcase selection, TFTLC is the only ceramic project included in UNESCO’s “Representative List of theIntangible Cultural Heritage of Humanity”, representative of a traditional form of ICH craftsmanship.The long history of TFTLC has resulted in valuable heritage sites and cultural relics. The practicalityand artistic expression inherent to this craft demonstrate historical value, social and economic valueand aesthetic value; TFTLC combines local cultural characteristics and national value cognition witheducational and spiritual values. TFTLC also has high tourism development value. Under the backdropof sustainable tourism development, this craft is therefore applicable to safeguarding ICH in thesame domain.
TFTLC refers to the entire celadon production process, including all related tools (e.g., kilns),and a series of complex procedures such as clay mining, crushing, panning, wedging, shaping, casting,decorating, firing and glazing. Each stage requires precise control, and the unique color of theglaze reveals the ceramic’s intricate craftsmanship. This complex production process exemplifiesthe challenges related to the cultural inheritance of celadon. The history and production of TFTLCalso requires foreign tourists to devote great energy, money and time to understand its connotations.Because residents are already impressed by and familiar with this ICH, studying their reactions caninform ICH-related tourism development. The intangibility and portability of ICH can also reveal moreabout the social value, education and spiritual value of tourism development than simple measures ofeconomic growth. A higher tourism conversion rate makes a study of the formation mechanism behindresidents’ and surrounding inhabitants’ cognitive paths more realistic. Therefore, this study focuses on
9

Sustainability 2020, 12, 132
residents of Lishui, where the heritage site is located, and residents of Wenzhou, a neighboring citywith the same type of ICH.
3.2. Questionnaire Design
A two-part questionnaire was designed to gather tourists’ thoughts on TFTLC. The first sectionconsisted of respondents’ demographic characteristics (e.g., gender, age, education level, occupation,monthly income and place of residence). In the second section, three types of measurement indicators(i.e., value cognition, emotional attitude and tourism intention) were constructed, as shown in Table 1.The questionnaire was mainly structured on the path of value cognition–emotional attitude–tourismintention, beginning with ICH values and then exploring the formation mechanism of ICH tourismintention on the basis of respondents’ rational cognition and perceptions. When establishing thecognitive dimension, we refined multiple value cognition dimensions based on the value characteristicsof TFTLC, adding emotional attitude as a mediator variable. Items were scored on a 5-point Likert-typescale (1 = strongly disagree; 3 = generally agree; 5 = strongly agree).
Table 1. Measurement indicators for elements of traditional firing technique for Longquan celadon.
Level 1 Indicator Level 2 Indicator Level 3 Indicator
Value cognition
Aesthetic valueArtistic appeal; regional uniqueness; art element integration;aesthetic characteristics; artistic authenticity; completeness of
artistic forms
Educational andspiritual value
Triggers spiritual resonance; reflects community or nationalspirit; offers inspirational and practical value; serves as political,
cultural, and/or social institutional symbol
Social andeconomic value
Employment opportunities; participation of communityresidents; commodity’s added value; service value
Historical value Ruins and historical relics; historical reputation; particularity;historical heritage
Emotional attitude Emotional attitude Unpleasant–Pleasant; Boring–Arousing
Tourism intention Tourism intention Tourism intention
TFTLC is a well-known tourist brand in Longquan. Tourist destination brands have been foundto follow an attributes–interests–value path [57], such that tourists are ‘value-driven’ as they seekexperiences that can meet their needs, which are based on what they value and how they experiencedsuch value before [58]. The value assessment system used in this study partially refers to Ji’s [59]ICH scale. We labeled ‘value cognition’ as a Level 1 indicator, which included four Level 2 indicators:‘aesthetic value’, ‘educational and spiritual value’, ‘social and economic value’, ‘historical value’, and18 Level 3 indicators (e.g., ‘artistic appeal’). We also labeled ‘emotional attitude’ and ‘tourism intention’as Level 1 indicators, using the dimensions of Unpleasant–Pleasant and Boring–Arousing to measure‘emotional attitude’ (Table 1). Indicator definitions are provided in Appendix A (Table A1).
3.3. Research Hypotheses
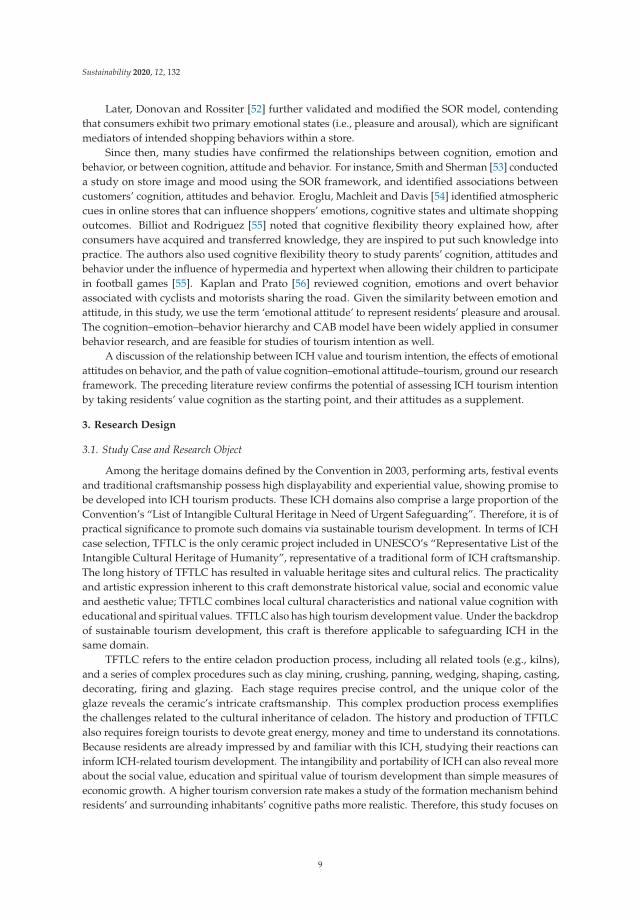
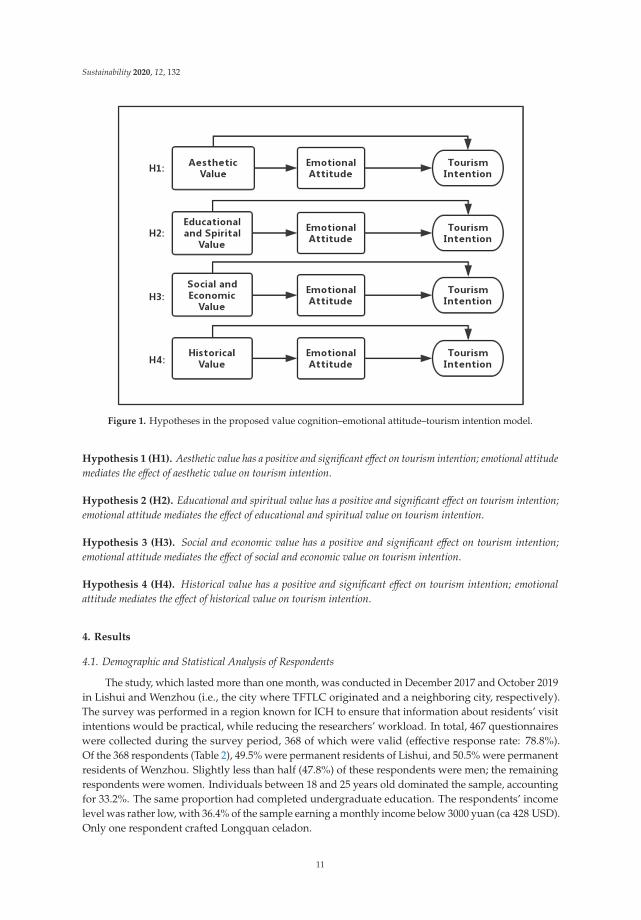
According to the literature review and research design, we postulated that residents’ valuecognition around TFTLC would positively influence their tourism intentions. Specifically, emotionalattitude was expected to play a mediating role in the relationship between the four value cognitionindicators and tourism intention. Hypotheses H1, H2, H3 and H4 are proposed as follows, and depictedin Figure 1:
10
Sustainability 2020, 12, 132
Figure 1. Hypotheses in the proposed value cognition–emotional attitude–tourism intention model.
Hypothesis 1 (H1). Aesthetic value has a positive and significant effect on tourism intention; emotional attitudemediates the effect of aesthetic value on tourism intention.
Hypothesis 2 (H2). Educational and spiritual value has a positive and significant effect on tourism intention;emotional attitude mediates the effect of educational and spiritual value on tourism intention.
Hypothesis 3 (H3). Social and economic value has a positive and significant effect on tourism intention;emotional attitude mediates the effect of social and economic value on tourism intention.
Hypothesis 4 (H4). Historical value has a positive and significant effect on tourism intention; emotionalattitude mediates the effect of historical value on tourism intention.
4. Results
4.1. Demographic and Statistical Analysis of Respondents
The study, which lasted more than one month, was conducted in December 2017 and October 2019in Lishui and Wenzhou (i.e., the city where TFTLC originated and a neighboring city, respectively).The survey was performed in a region known for ICH to ensure that information about residents’ visitintentions would be practical, while reducing the researchers’ workload. In total, 467 questionnaireswere collected during the survey period, 368 of which were valid (effective response rate: 78.8%).Of the 368 respondents (Table 2), 49.5% were permanent residents of Lishui, and 50.5% were permanentresidents of Wenzhou. Slightly less than half (47.8%) of these respondents were men; the remainingrespondents were women. Individuals between 18 and 25 years old dominated the sample, accountingfor 33.2%. The same proportion had completed undergraduate education. The respondents’ incomelevel was rather low, with 36.4% of the sample earning a monthly income below 3000 yuan (ca 428 USD).Only one respondent crafted Longquan celadon.
11

Sustainability 2020, 12, 132
Table 2. Respondents’ demographic profile.
Item DemographicsNumber of
RespondentsPercentage
(%)Item Demographics
Number ofRespondents
Percentage( % )
GenderMale 176 47.8
Age
<18 59 16.0
Female 192 52.2 18–25 122 33.2
Educationallevel
<Collegediploma 122 33.2 26–30 104 28.3
College diploma 81 22.0 31–40 53 14.4
bachelor degree 152 41.3 41–50 20 5.4
≥Master degree 13 3.5 >50 10 2.7
MonthlyIncome (¥)
<3000 134 36.4 City Lishui 182 49.5
3000–5000 101 27.4 Wenzhou 186 50.5
5001–10,000 93 25.3 OccupationCraftsman of
Longquan celadon 5 1.4
>10,000 40 10.9 Other 363 98.6
4.2. Data Processing and Analysis
4.2.1. Item Analysis
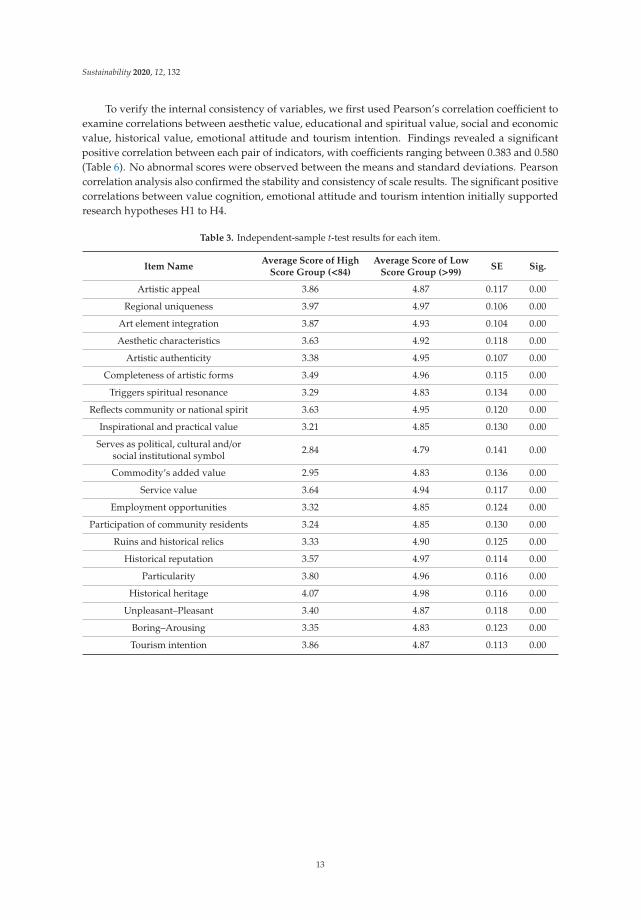
We used IBM SPSS Statistics 25 to perform item analysis and test whether our proposed scale couldbe effective in distinguishing residents’ extent of value cognition, emotional attitudes and tourismintentions around TFTLC. We chose two samples from 368 valid data points, classifying the highest27% of scores as the high group, and the lowest 27% of scores as the low group. Within these groups,27% of respondents scored below 84 points, and 27% scored above 99 points. Independent-sample t-testresults showed that the distribution of average scores among the high and low groups was significantlydifferent, with significance values at 0.00 (<0.05) (Table 3). Therefore, our scale was sufficiently valid indistinguishing differences in respondents’ value cognition, emotional attitudes and tourism intentions.Our findings from item analysis were thus appropriate for subsequent investigation.
4.2.2. General Description and Factor Analysis
We also used SPSS 25 to measure scale reliability and validity. The total Cronbach’s alpha valuewas 0.911, indicating high stability and internal consistency along with a small standard error. AmongCronbach’s alpha values for each subscale, the score which was related to emotional attitude was only0.639; this result may be due to a low number of questions [60], but it is acceptable for a subscale [61].The Kaiser-Meyer-Olkin (KMO) score of the cognition scale was 0.903, indicating a level of samplingadequacy suitable for factor analysis.
We next used principal component analysis (PCA) and the maximum variance method to extractfour common factors from the 18 value items: aesthetic value, educational and spiritual value, socialand economic value and historical value. The total factor loading was 60.376%, being within anacceptable range and close to ideal. The results of factor analysis revealed that the factor loading ofeach item was above 0.5, meeting the initial research thresholds (see Tables 4 and 5).
4.2.3. Data Processing and Correlation Analysis
After examining the reliability and validity of the scale, to prepare for the correlation test andpath analysis, six Level 3 indicators of aesthetic value (e.g., artistic appeal), four Level 3 indicators ofeducational and spiritual value (e.g., inspirational and practical value), four Level 3 indicators of socialand economic value (e.g., added value of the commodity) and four Level 3 indicators of historical value(e.g., historical heritage) were averaged to serve as the scores for four Level 2 indicators. Respondents’scores on Unpleasant–Pleasant and Boring–Arousing were averaged to indicate emotional attitude.
12
Sustainability 2020, 12, 132
To verify the internal consistency of variables, we first used Pearson’s correlation coefficient toexamine correlations between aesthetic value, educational and spiritual value, social and economicvalue, historical value, emotional attitude and tourism intention. Findings revealed a significantpositive correlation between each pair of indicators, with coefficients ranging between 0.383 and 0.580(Table 6). No abnormal scores were observed between the means and standard deviations. Pearsoncorrelation analysis also confirmed the stability and consistency of scale results. The significant positivecorrelations between value cognition, emotional attitude and tourism intention initially supportedresearch hypotheses H1 to H4.
Table 3. Independent-sample t-test results for each item.
Item NameAverage Score of High
Score Group (<84)Average Score of Low
Score Group (>99)SE Sig.
Artistic appeal 3.86 4.87 0.117 0.00
Regional uniqueness 3.97 4.97 0.106 0.00
Art element integration 3.87 4.93 0.104 0.00
Aesthetic characteristics 3.63 4.92 0.118 0.00
Artistic authenticity 3.38 4.95 0.107 0.00
Completeness of artistic forms 3.49 4.96 0.115 0.00
Triggers spiritual resonance 3.29 4.83 0.134 0.00
Reflects community or national spirit 3.63 4.95 0.120 0.00
Inspirational and practical value 3.21 4.85 0.130 0.00
Serves as political, cultural and/orsocial institutional symbol 2.84 4.79 0.141 0.00
Commodity’s added value 2.95 4.83 0.136 0.00
Service value 3.64 4.94 0.117 0.00
Employment opportunities 3.32 4.85 0.124 0.00
Participation of community residents 3.24 4.85 0.130 0.00
Ruins and historical relics 3.33 4.90 0.125 0.00
Historical reputation 3.57 4.97 0.114 0.00
Particularity 3.80 4.96 0.116 0.00
Historical heritage 4.07 4.98 0.116 0.00
Unpleasant–Pleasant 3.40 4.87 0.118 0.00
Boring–Arousing 3.35 4.83 0.123 0.00
Tourism intention 3.86 4.87 0.113 0.00
13

Sustainability 2020, 12, 132
Ta
ble
4.
Val
idit
yan
dre
liabi
lity
ofre
flect
ive
cons
truc
ts.
Le
ve
l2
ind
ica
tor
Le
ve
l3
Ind
ica
tor
Va
ria
nce
(%)
Acc
um
ula
tio
n(%
)K
MO
Cro
nb
ach
’sA
lph
aT
ota
lC
ron
ba
ch’s
Alp
ha
Aes
thet
icva
lue
Art
isti
cap
peal
18.2
8418
.284
0.90
3
0.84
8
0.91
1
Reg
iona
luni
quen
ess
Art
elem
enti
nteg
rati
on
Aes
thet
icch
arac
teri
stic
s
Art
isti
cau
then
tici
ty
Com
plet
enes
sof
arti
stic
form
s
Educ
atio
nala
ndsp
irit
ualv
alue
Refl
ects
com
mun
ity
orna
tion
alsp
irit
15.1
4033
.423
0.80
1Off
ers
insp
irat
iona
land
prac
tica
lva
lue
Serv
esas
polit
ical
,cul
tura
lan
d/or
soci
alin
stitu
tiona
lsym
bol
Trig
gers
spir
itua
lres
onan
ce
Soci
alan
dec
onom
icva
lue
Com
mod
ity’
sad
ded
valu
e
13.9
1547
.338
0.73
8Se
rvic
eva
lue
Empl
oym
ento
ppor
tuni
ties
Part
icip
atio
nof
com
mun
ity
resi
dent
s
His
tori
calv
alue
Part
icul
arit
y
13.0
3860
.376
0.78
2H
isto
rica
lher
itag
e
His
tori
calr
eput
atio
n
Rui
nsan
dhi
stor
ical
relic
s
Emot
iona
latt
itude
Unp
leas
ant–
Plea
sant
0.63
9Bo
ring
–Aro
usin
g
Tour
ism
inte
ntio
nTo
uris
min
tent
ion
14

Sustainability 2020, 12, 132
Ta
ble
5.
Rot
ated
fact
orlo
adin
gm
atri
x.
Le
ve
l3
Ind
ica
tor
Fa
cto
rlo
ad
ing
(Ae
sth
eti
cv
alu
e)
Fa
cto
rlo
ad
ing
(Ed
uca
tio
na
la
nd
spir
itu
al
va
lue
)F
act
or
loa
din
g(S
oci
al
an
de
con
om
icv
alu
e)
Fa
cto
rlo
ad
ing
(His
tori
cal
va
lue
)
Art
isti
cap
peal
0.71
9
Reg
iona
luni
quen
ess
0.70
3
Art
elem
enti
nteg
rati
on0.
714
Aes
thet
icch
arac
teri
stic
s0.
770
Art
isti
cau
then
tici
ty0.
641
Com
plet
enes
sof
arti
stic
form
s0.
513
Trig
gers
spir
itua
lres
onan
ce0.
663
Refl
ects
com
mun
ity
orna
tion
alsp
irit
0.71
6
Insp
irat
iona
land
prac
tica
lval
ue0.
772
Serv
esas
polit
ical
,cul
tura
land/o
rso
cial
inst
itut
iona
lsym
bol
0.73
5
Com
mod
ity’
sad
ded
valu
e0.
713
Serv
ice
valu
e0.
604
Empl
oym
ento
ppor
tuni
ties
0.67
3
Part
icip
atio
nof
com
mun
ity
resi
dent
s0.
689
Rui
nsan
dhi
stor
ical
relic
s0.
611
His
tori
calr
eput
atio
n0.
725
Part
icul
arit
y0.
736
His
tori
calh
erit
age
0.76
1
Extr
acti
onm
etho
d:M
ain
com
pone
nt.R
otat
ion
met
hod:
Ort
hogo
nalr
otat
ion
wit
hK
aise
rst
anda
rdiz
atio
n.
15

Sustainability 2020, 12, 132
Ta
ble
6.
Mea
ns,s
tand
ard
devi
atio
nsan
dco
rrel
atio
nsbe
twee
nty
pes
ofva
lue.
Ind
ica
tor
Me
an
SD
Ae
sth
eti
cV
alu
eE
du
cati
on
al
an
dsp
irit
ua
lv
alu
eS
oci
al
an
dE
con
om
icV
alu
eH
isto
rica
lV
alu
eE
mo
tio
na
la
ttit
ud
eT
ou
rism
inte
nti
on
Aes
thet
icva
lue
4.40
60.
667
1
Educ
atio
nala
ndsp
iritu
alva
lue
4.11
60.
855
0.58
0**
1
Soci
alan
dec
onom
icva
lue
4.16
50.
804
0.49
9**
0.54
3**
1
His
tori
calv
alue
4.42
30.
718
0.51
4**
0.45
5**
0.52
9**
1
Emot
iona
latt
itud
e4.
366
0.88
150.
549*
*0.
509*
*0.
483*
*0.
452*
*1
Tour
ism
inte
ntio
n4.
150.
982
0.40
6**
0.47
4**
0.47
1**
0.38
3**
0.49
5**
1
Sign
ifica
nce
test
:Tw
o-ta
iled;
**Si
gnifi
cant
lyco
rrel
ated
atth
e0.
01le
vel(
both
side
s).
16

Sustainability 2020, 12, 132
4.3. Exploring the Mediating Role of Emotional Attitude
After completing the data processing and verification, we used Preacher and Hayes’ Bootstrapplug-in to test the mediation effect. Following Wen and Ye’s [62] method and mediation effect model,we used a sample size of 5000 with a 95% confidence interval (CI). If the CI of the mediation resultsdid not contain 0, then emotional attitude could be said to mediate the effect of value cognition ontourism intention.
The score interval for the path of ‘aesthetic value–emotional attitude–tourism intention’ didnot include 0 (CI: [0.21,0.43]), and emotional attitude significantly mediated the effect of aestheticvalue on tourism intention, with a mediating effect score of 0.31. After controlling for emotionalattitude, the influence of aesthetic value on tourism intention was also significant (CI: [0.13,0.44]), anddemonstrated a direct effect score of 0.28. For the path of ‘educational and spiritual value–emotionalattitude–tourism intention’, the score interval did not include 0 (CI: [0.12,0.29]), and emotional attitudesignificantly mediated the effect of educational and spiritual value on tourism intention with amediating effect score of 0.20. After controlling for emotional attitude, the influence of educationaland spiritual value on tourism intention was likewise significant (CI: [0.23,0.46]), with a direct effectwhose value was 0.34. The score interval of ‘social and economic value–emotional attitude–tourismintention’ did not include 0 (CI: [0.13,0.30]), and emotional attitude significantly mediated the effect ofsocial and economic value on tourism intention (mediating effect score: 0.21). After controlling foremotional attitude, the influence of social and economic value on tourism intention was significant(CI: [0.25,0.49]), with the direct effect of 0.37.
For the path of ‘historical value–emotional attitude–tourism intention’, the score interval did notinclude 0 (CI: [0.15,0.37]), and emotional attitude significantly mediated the effect of historical valueon tourism intention with a mediating effect score of 0.25. After controlling for emotional attitude,the influence of historical value on tourism intention was significant (CI: [0.14,0.41]) with a direct effectof 0.27 (Table 7). Hypotheses H1 through H4 were thus supported; however, emotional attitude onlyplayed a partial mediating role in each path, and other mediator variables existed.
Table 7. Indirect effects of value cognition on intention.
Path Effect Boot SE Boot 95% CI Supported Hypothesis
Direct effect of aesthetic value ontourism intention 0.28 0.08 [0.13,0.44]
√H1
Aesthetic value→emotionalattitude→tourism intention 0.31 0.06 [0.21,0.43]
√
Direct effect of educational and spiritualvalue on tourism intention 0.34 0.06 [0.23,0.46]
√H2
Educational and spiritual value→emotionalattitude→tourism intention 0.20 0.04 [0.12,0.29]
√
Direct effect of social and economic valueon tourism intention 0.37 0.06 [0.25,0.49]
√H3
Social and economic value→emotionalattitude→tourism intention 0.21 0.04 [0.13,0.30]
√
Direct effect of historical on tourismintention 0.27 0.07 [0.14,0.41]
√H4
Historical value→emotionalattitude→tourism intention 0.25 0.05 [0.15,0.37]
√
5. Discussion and Implications
Tourism development is an essential means of vitalizing ICH. Although such developmentcan improve the living status of ICH, many ICHs suffer from over-commercialization, which cancompromise their authenticity and shift them away from their intended value. The design, marketing
17
Sustainability 2020, 12, 132
and evaluation of ICH products are essential to ICH sustainability. Therefore, TFTLC was taken as thefocal ICH in this research, given its potential to be developed into popular tourism products, similar toother forms of traditional craftsmanship.
Value and value orientation are frequently mentioned in relation to sustainability. Understandingpeople’s value orientations is crucial when organizing sustainable activities. Value orientation is alsorelated to attitudes, describing dispositional weights and predicting behavioral intention [47,63,64].Among value orientations, a set of linked propositions including value and existential elementscan influence individuals’ general patterns, decisions and belief intensity about outdoor recreationactivities [65]. In particular, value cognition is an essential component of value orientation thatevokes tourism intention. Heritage undoubtedly offers extensive value, and the development ofheritage tourism holds great promise. However, preservation (i.e., non-use) values and use values [65],internal and external values [24,66], utilitarian and hedonic values [67] and experiential values [66] areinsufficient in truly capturing the value of cultural heritage. It is more practical to consider residents’value cognition when seeking to develop corresponding tourism products that will meet tourists’expectations. As noted in the literature review, cognition includes perception, and value perceptionfalls under the scope of value cognition. This conceptualization eliminates any potential redundancyof cognition and perception in our research framework.
We recruited residents from the TFTLC heritage site and a neighboring city as respondents toensure a higher level of ICH value cognition and a more manageable workload. Residents’ cognitionof the ICH value was highly objective, thereby improving the accuracy of scale analysis. Our findingsfrom residents can also be applied to tourists, because ICH tourism differs from other types ofplace-specific tourism. An intangible culture can be associated with numerous places, includingmuseums, exhibitions, or heritage sites. With regard to ICH, residents offer greater contributionsthan tourists, but may also become tourists visiting local heritage sites. Our findings demonstrateda significant moderate correlation between aesthetic value, educational and spiritual value, socialand economic value and historical value cognition, which should be helpful in translating our resultsin practice.
For example, celadon is renowned for its aesthetic value, long history, creation of economicvalue, spiritual sustenance and use as an educational tool. Four types of value cognition are closelyrelated and indispensable in the ICH system. In terms of structure, the ICH tourism decision-makingsystem based on the ‘value cognition–emotional attitude–tourism intention’ path is uniquely suited toICH tourism intention research, representing an expansion on the ‘cognition–emotion–behavior’ and‘value–attitude–behavior’ models. In addition to four value cognitions, we redefined the meaning ofemotional attitude, which was found to partially mediate the influence of value cognition on tourismintention. In these paths, aesthetic value, educational and spiritual value, social and economic value andhistorical value appeared to directly affect residents’ willingness to travel and indirectly influence theformation of tourism intention via emotional attitudes. These influences were positively correlated: anincrease in value cognition evoked more positive emotions and thus strengthened residents’ willingnessto travel, consistent with our assumptions. Also, the mediation effect of emotional attitude was evenlarger than the direct effect of aesthetic value on tourism intention. Accordingly, emotional attitudeappears to be an indispensable aspect of research on ICH tourism intention.
From a sustainability perspective, tourism development can provide an environment and livingspace for ICH, generate protection funds while improving national awareness and offer a foundationfor ICH inheritance. At heritage sites, ICH tourism development can propagandize local brands, enrichthe content of tourism products and improve the quality of such products. However, unsustainableICH tourism development may destroy brand effects, eliciting fierce competition and potentiallycompromising the business environment. These activities also fail to emphasize value, lessening theeducational significance for residents and tourists. The tourism industry has become increasinglycompetitive, and operators need functional strategies to sustain ICH tourism development andsafeguard existing sites. It is therefore necessary to carefully consider residents’ value cognition
18

Sustainability 2020, 12, 132
regarding ICH along with their emotional attitudes; doing so can promote a thorough evaluation ofICH resource endowments in terms of product design, marketing and tourism experience assessment.Based on our findings, we offer several recommendations to government agencies and relevant scenicareas and attractions.
ICH tourism products should be offered in a way that will satisfy visitors’ desires, namely byconsidering heritage characteristics along with customers’ value cognition and emotional experiences.Before creating relevant tourism products, decision makers should combine the aesthetic, historicaland educational and spiritual value of ICH to construct exciting travel experiences for tourists. Touristsmay express positive emotional attitudes towards value symbols and interactive areas that can inspiretheir imaginations around ICH, inspiring them to participate in ICH tourism. For example, whendeveloping celadon tourism products, designers should seek to strengthen the emotional impact andintegrate scientific and educational content into static and dynamic tourism products. Designers shouldalso combine successor performance, teaching, live-action song and dance performances and museumexplanations to enhance tourists’ value cognition. Offering a variety of activities could improvetourists’ perceived experiential value, boosting tourists’ intentions to return to and recommend anICH destination [68]. Therefore, it is essential to improve the construction of scenic spots, includingphysical products such as relics, sites and souvenirs to create a complete, diversified and accessibleboutique ICH tourism route.
In terms of ICH tourism marketing, practitioners should highlight the spiritual connotations andinheritance-based significance of ICH. According to the tourism intention model, value is indispensablein the formation path of visitors’ willingness to travel. Therefore, in the process of ICH image creationand brand propaganda, underscoring ICH value and fostering relevant value cognition are pivotal.For example, when promoting TFTLC, a museum could display pictures and posters of celadonembryos and decorations to convey profound information about celadon craftsmanship and inheritorsto visitors, thus promoting the product’s connotations. With respect to advertising design and targetmarket research, practitioners should consider different groups’ emotional responses and cognition tocreate pleasing, exciting advertisements [49].
These strategies should include factors that tourists care about, consider whether such factors canmeet tourists’ emotional needs, focus on core elements of ICH tourism products, and raise tourists’awareness of values.
As intangible assets, ICH tourism products should be evaluated after bringing them to market.Since related sites and cultural relics are nonreplicable, more empirical research is needed to improvethe research model and propose suggestions to promote the sustainable development of ICH tourism.This assessment should include factors such as stakeholders, ICH value, carrying capacity, ecologicalsensitivity, economic transformation and tourist cognition. Tourists’ needs and the protection ofICH should also be considered in sustainable tourism development. Most importantly, operatorsand managers should recognize that a good ICH tourism product must be closely tied to visitors’preferences, specifically their value cognition and emotional attitudes; doing so will help ICH tourismoperators address related dilemmas by aligning relevant experiences with tourists’ needs.
6. Conclusions and Future Research
Taking TFTLC as a study case, we investigated residents’ value cognition and emotionalattitudes in a heritage site and nearby city and analyzed the formation path of tourism intention.The significant effects of value cognition on ICH tourism intention forms the theoretical basis of the‘value cognition–attitude–tourism intention’ framework in this study, which can be used to forecastresidents’ and tourists’ behavior. Our research elaborates on how ICH tourism products can promote thesustainability of ICH in environmental, economic and social aspects. Our results confirm the potentialto predict tourists’ motivations and intentions by studying their value cognition and emotions. We alsoprovide valuable insight into product development, marketing and post-development evaluations ofICH tourism.
19

Sustainability 2020, 12, 132
Despite its revelations, our study has several limitations that may encourage future research.Theoretically, the lack of an existing theory related to value cognition did preclude a confirmatory factoranalysis. In the mediation effect exploration step, emotional attitudes were found to partially mediatethe effect of value cognition on tourism intention, implying that other factors could also play mediatingroles. Additionally, from data analysis not included in this paper, emotional attitudes were found tomoderate the effect of historical value on tourism intention; subsequent studies could thus seek toidentify such factors. In terms of the study sample, we focused on residents rather than tourists inlight of our preliminary research. Tourists from other provinces expressed poor understanding of ICHor had difficulty completing the questionnaire. We compiled a sample of completed questionnairesbased on quality, and only about 368 were valid. In a follow-up study, we will survey various groupsof people on a larger scale who exhibit diverse demographics. We also plan to further test our valuecognition scale and unveil additional mediating factors to render the ‘value cognition–attitude–tourismintention’ framework more feasible for ICH tourism research.
Author Contributions: Conceptualization, Z.X.; Funding Acquisition, M.Z.; Investigation, Q.Q.; Writing—OriginalDraft, Q.Q.; Writing—Review & Editing, Q.Q., T.Z., Z.X. and M.Z. All authors have read and agreed to thepublished version of the manuscript.
Funding: This research was funded by the National Social Science Foundation of China, grant number 16 AZD055.
Conflicts of Interest: The authors declare no conflict of interest.
Appendix A
Table A1. Definitions of value cognition and emotional attitude indicators of traditional firing techniquefor Longquan celadon.
Level 2 Indicator Level 3 Indicator Definition of Level 3 Indicator
Aesthetic value
Artistic appeal Celadon produced using this technique has artistic appeal
Regional uniqueness Celadon produced using this technique has unique Longquancharacteristics and style
Art element integration Celadon produced using this technique perfectly blends artisticelements such as color and ornamentation
Aesthetic characteristics Celadon produced using this technique is elegant and smooth,with aesthetic features that are pleasing to the eye
Artistic authenticity Celadon produced using this technique satisfies social reality,aesthetic standards, and emotional impact
Completeness of artisticforms
Celadon produced using this technique incorporates features ofart, merchandise, and symbols, reflecting a complete concept
Educational andspiritual value
Triggering spiritualresonance The technique can trigger spiritual resonance
Reflecting community ornational spirit
The technique reflects the traditional spirit of Longquan or theChinese national spirit
Inspirational andpractical value
The technique encourages people to think critically and treatproblems rationally, and inspires thinking and values
Serving as political,cultural and social
institutional symbols
The technique symbolizes the cultural, political, and socialsystems of Confucianism and Buddhism, such as Zhongyong,
Zhonghe, and Renhou
20

Sustainability 2020, 12, 132
Table A1. Cont.
Level 2 Indicator Level 3 Indicator Definition of Level 3 Indicator
Social andeconomic value
Service value The local community can use this technique to operate servicessuch as tourism and sightseeing, folk experiences, and so on
Commodity’s added value The technique has trademark or brand value
Current employmentopportunities The technique has created many job opportunities
Current communityresidents’ participation
The technique is conducive to depicting local residents’ personalvalues
Historical value
Ruins and historical relics The technique can produce ruins and artifacts
Historical reputation The technique is well known in history
Particularity The technique is an ICH unique to China
Historical heritage This technique is protected as an inheritance of historyand culture
Emotionalattitude
Unpleasant–Pleasant People’s feelings when learning about TFTLC, ranging fromunpleasant to pleasant
Boring–Arousing People’s feelings when learning about TFTLC, ranging fromboring to arousing
References
1. Aykan, B. ‘Patenting’ Karagöz: UNESCO, Nationalism and Multinational Intangible Heritage. Int. J. Herit.Stud. 2015, 21, 949–961. [CrossRef]
2. Cheung, S.C.H. From Foodways to Intangible Heritage: A Case Study of Chinese Culinary Resource, Retailand Recipe in Hong Kong. Int. J. Herit. Stud. 2013, 19, 353–364. [CrossRef]
3. Chocano, R. Producing African-descent: Afro-peruvian Music, Intangible Heritage, Authenticity andBureaucracy in a Latin American Music Compilation. Int. J. Herit. Stud. 2019, 25, 763–779. [CrossRef]
4. Foo, R.; Krishnapillai, G. Preserving the Intangible Living Heritage in the George Town World Heritage Site,Malaysia. J. Herit. Tour. 2019, 14, 358–370. [CrossRef]
5. Halamy, S.; Kibat, S.A. Reconnecting the Past Through Oral History: An Effort in Preserving Malaysians’Intangible Cultural Heritage. In Balancing Development and Sustainability in Tourism Destinations; Springer:Berlin/Heidelberg, Germany, 2017; pp. 31–38. [CrossRef]
6. Hoeven, A.V.D. Networked Practices of Intangible Urban Heritage: The Changing Public Role of DutchHeritage Professionals. Int. J. Cult. Policy 2019, 25, 232–245. [CrossRef]
7. Loiacono, V.; Fallon, J.M. Intangible Cultural Heritage Beyond Borders: Egyptian Bellydance (Raqs Sharqi)as a Form of Transcultural Heritage. J. Intercult. Stud. 2018, 39, 286–304. [CrossRef]
8. Sidi, A.O. Maintaining Timbuktu’s Unique Tangible and Intangible Heritage. Int. J. Herit. Stud. 2012, 18,324–331. [CrossRef]
9. Smith, L.; Campbell, G. The Tautology of “Intangible Values” and the Misrecognition of Intangible CulturalHeritage. Herit. Soc. 2017, 10, 26–44. [CrossRef]
10. Khalid, M.S.; Chowdhury, M.S.A. Representation of Intangible Cultural Heritage of Bangladesh throughSocial Media. Anatolia 2018, 29, 194–203. [CrossRef]
11. Keeney, R.L. Creativity in Decision Making with Value-Focused Thinking. Sloan Manag. Rev. 1994, 35, 33–41.12. Newell, A.; Simon, H.A. Human Problem Solving; Prentice-Hall: Englewood Cliffs, NJ, USA, 1972.13. Homer, P.M.; Kahle, L.R. A Structural Equation Test of the Value-Attitude-Behavior Hierarchy. J. Personal.
Soc. Psychol. 1988, 54, 638–646. [CrossRef]14. Aikawa, N. An Historical Overview of the Preparation of the UNESCO International Convention for the
Safeguarding of the Intangible Cultural Heritage. Mus. Int. 2004, 56, 137–149. [CrossRef]15. Pietrobruno, S. Between Narratives and Lists: Performing Digital Intangible Heritage Through Global Media.
Int. J. Herit. Stud. 2014, 20, 742–759. [CrossRef]16. WTO. Tourism and Intangible Cultural Heritage; UNWTO: Madrid, Spain, 2012. [CrossRef]
21

Sustainability 2020, 12, 132
17. Deacon, H.; Smeets, R. Authenticity, Value and Community Involvement in Heritage Management under theWorld Heritage and Intangible Heritage Conventions. Herit. Soc. 2013, 6, 129–143. [CrossRef]
18. Dragouni, M.; Fouseki, K.; Georgantzis, N. Community Participation in Heritage Tourism Planning: Is It TooMuch to Ask? J. Sustain. Tour. 2018, 26, 759–781. [CrossRef]
19. Olya, H.G.T.; Alipour, H.; Gavilyan, Y. Different Voices from Community Groups to Support SustainableTourism Development at Iranian World Heritage Sites: Evidence from Bisotun. J. Sustain. Tour. 2018, 26,1728–1748. [CrossRef]
20. Rasoolimanesh, S.M.; Jaafar, M.; Kock, N.; Ahmad, A.G. The Effects of Community Factors on Residents’Perceptions toward World Heritage Site Inscription and Sustainable Tourism Development. J. Sustain. Tour.2017, 25, 198–216. [CrossRef]
21. Turner, M.; Tomer, T. Community Participation and the Tangible and Intangible Values of Urban Heritage.Herit. Soc. 2013, 6, 185–198. [CrossRef]
22. Rasoolimanesh, S.M.; Taheri, B.; Gannon, M.; Vafaei-Zadeh, A.; Hanifah, H. Does Living in the Vicinity ofHeritage Tourism Sites Influence Residents’ Perceptions and Attitudes? J. Sustain. Tour. 2019, 27, 1295–1317.[CrossRef]
23. González, M.V. Intangible Heritage Tourism and Identity. Tour. Manag. 2008, 29, 807–810. [CrossRef]24. Li, M.; Cai, L.A. The Effects of Personal Values on Travel Motivation and Behavioral Intention. J. Travel Res.
2012, 51, 473–487. [CrossRef]25. Kiatkawsin, K.; Han, H. An Alternative Interpretation of Attitude and Extension of the Value–attitude–
behavior Hierarchy: The Destination Attributes of Chiang Mai, Thailand. Asia Pac. J. Tour. Res. 2017, 22,481–500. [CrossRef]
26. Milfont, T.L.; Duckitt, J.; Wagner, C. A Cross-Cultural Test of the Value–Attitude–Behavior Hierarchy. J. Appl.Soc. Psychol. 2010, 40, 2791–2813. [CrossRef]
27. Williams, P.; Soutar, G.N. Value, Satisfaction and Behavioral Intentions in an Adventure Tourism Context.Ann. Tour. Res. 2009, 36, 413–438. [CrossRef]
28. Wang, W.; Chen, J.S.; Prebensen, N.K. Market Analysis of Value-minded Tourists: Nature-based Tourism inthe Arctic. J. Destin. Mark. Manag. 2018, 8, 82–89. [CrossRef]
29. Kim, M.; Thapa, B. Perceived Value and Flow Experience: Application in a Nature-based Tourism Context.J. Destin. Mark. Manag. 2017, 8, 373–384. [CrossRef]
30. Hapsari, R. Creating Educational Theme Park Visitor Loyalty: The Role of Experience-based Satisfaction,Image and Value. Tour. Hosp. Manag. 2018, 24, 359–374. [CrossRef]
31. Lee, Y.-J. The Relationships Amongst Emotional Experience, Cognition, and Behavioural Intention inBattlefield Tourism. Asia Pac. J. Tour. Res. 2016, 21, 697–715. [CrossRef]
32. Ene, D.; Schofield, P. An Integrated Approach to Consumer Decision Making for Budget City Breaks: TheRole of Emotion. Int. J. Tour. Res. 2011, 13, 368–383. [CrossRef]
33. Prayag, G.; Hosany, S.; Odeh, K. The Role of Tourists’ Emotional Experiences and Satisfaction in UnderstandingBehavioral Intentions. J. Destin. Mark. Manag. 2013, 2, 118–127. [CrossRef]
34. Chuang, S.-C. The Effects of Emotions on the Purchase of Tour Commodities. J. Travel Tour. Mark. 2007, 22,1–13. [CrossRef]
35. Goossens, C. Tourism Information and Pleasure Motivation. Ann. Tour. Res. 2000, 27, 301–321. [CrossRef]36. Nawijn, J.; Mitas, O.; Lin, Y.; Kerstetter, D. How Do We Feel on Vacation? A Closer Look at How Emotions
Change over the Course of a Trip. J. Travel Res. 2013, 52, 265–274. [CrossRef]37. Faullant, R.; Matzler, K.; Mooradian, T.A. Personality, Basic Emotions, and Satisfaction: Primary Emotions in
the Mountaineering Experience. Tour. Manag. 2011, 32, 1423–1430. [CrossRef]38. Yüksel, A.; Yuksel, F. Shopping Risk Perceptions: Effects on Tourists’ Emotions, Satisfaction and Expressed
Loyalty Intentions. Tour. Manag. 2007, 28, 703–713. [CrossRef]39. Yuksel, A.; Yuksel, F.; Bilim, Y. Destination Attachment: Effects on Customer Satisfaction and Cognitive,
Affective and Conative Loyalty. Tour. Manag. 2010, 31, 274–284. [CrossRef]40. Prayag, G.; Hosany, S.; Muskat, B.; Del Chiappa, G. Understanding the Relationships Between Tourists’
Emotional Experiences, Perceived Overall Image, Satisfaction, and Intention to Recommend. J. Travel Res.2017, 56, 41–54. [CrossRef]
22
Sustainability 2020, 12, 132
41. Rahmani, K.; Gnoth, J.; Mather, D. A Psycholinguistic View of Tourists’ Emotional Experiences. J. Travel Res.2019, 58, 192–206. [CrossRef]
42. Plutchik, R. Emotion: A Psychoevolutionary Synthesis; Harper and Row: New York, NY, USA, 1980.43. Kim, H.; Stepchenkova, S. Effect of Tourist Photographs on Attitudes towards Destination: Manifest and
Latent Content. Tour. Manag. 2015, 49, 29–41. [CrossRef]44. Olson, J.M.; Zanna, M.P. Attitudes and Attitude Change. Annu. Rev. Psychol. 1993, 44, 117–154. [CrossRef]45. Manca, S.; Fornara, F. Attitude Toward Sustainable Transport as a Function of Source and Argument
Reliability and Anticipated Emotions. Sustainability 2019, 11, 3288. [CrossRef]46. Prajitmutita, L.M.; Perényi, Á.; Prentice, C. Quality, Value?—Insights intoMedicalTourists’ Attitudesand
Behaviors. J. Retail. Consum. Serv. 2016, 31, 207–216. [CrossRef]47. Vinzenz, F.; Priskin, J.; Wirth, W.; Ponnapureddy, S.; Ohnmacht, T. Marketing Sustainable Tourism: The Role
of Value Orientation, Well-being and Credibility. J. Sustain. Tour. 2019, 27, 1663–1685. [CrossRef]48. Zhang, Y.; Wang, L. Influence of Sustainable Development by Tourists’ Place Emotion: Analysis of the
Multiply Mediating Effect of Attitude. Sustainability 2019, 11, 1384. [CrossRef]49. McCabe, S.; Illodo, I.B. Thrilled to Have “Bagged a Bargain” or “Bitter” and “Very Frustrating”? Exploring
Consumer Attitudes to Value and Deals in Tourism. J. Travel Res. 2018, 58, 945–960. [CrossRef]50. Bai, K.; Ma, Y.; Li, T.; Sun, T. An Association Study on Tourists’ Cognition, Perceived Value and Behavior
Intention Based on Structural Equation Model (SEM): A Case Study of Inbound Tourists in Xi’an City.Acta Geogr. Sin. 2010, 65, 244–255.
51. Mehrabian, A.; Russell, J.A. An Approach to Environmental Psychology; MIT Press: Cambridge, MA, USA, 1974.52. Donovan, R.J.; Rossiter, J.R. Store Atmosphere: An Environmental Psychology Approach. J. Retail. 1982, 58,
34–57.53. Smith, R.B.; Sherman, E. Effects of Store Image and Mood on Consumer Behavior: A Theoretic and Empirical
Analysis. Adv. Consum. Res. 1993, 20, 631.54. Eroglu, S.A.; Machleit, K.A.; Davis, L.M. Empirical Testing of a Model of Online Store Atmospherics and
Shopper Responses. Psychol. Mark. 2003, 20, 139–150. [CrossRef]55. Billiot, T.; Rodriguez, A. Cultivating Consumer Relationships Through Hypertext and Hypermedia Websites.
J. Relatsh. Mark. 2012, 11, 72–90. [CrossRef]56. Kaplan, S.; Prato, C.G. “Them or Us”: Perceptions, Cognitions, Emotions and Overt Behavior Associated
with Cyclists and Motorists Sharing the Road. Int. J. Sustain. Transp. 2016, 10, 193–200. [CrossRef]57. Shan, L.; Zheng, W. Tourism Image and Tourism Slogan Based on Destination Branding. Hum. Geogr. 2006,
21, 5–11. [CrossRef]58. Malone, S.; Mckechnie, S.; Tynan, C. Tourists’ Emotions as a Resource for Customer Value Creation, Cocreation,
and Destruction: A Customer-Grounded Understanding. J. Travel Res. 2017, 57, 843–855. [CrossRef]59. Ji, X. Study on the Value Assessment System of Intangible Cultural Heritage. Master’s Thesis, Shandong
University, Jinan, China, 2014.60. Tavakol, M.; Dennick, R. Making Sense of Cronbach’s Alpha. Int. J. Med. Educ. 2011, 2, 53–55. [CrossRef]
[PubMed]61. Wu, M. Questionnaire Statistical Analysis Practice—SPSS Operation and Application; Chongqing University
Press: Chongqing, China, 2010.62. Wen, Z.; Ye, B. Different Methods for Testing Moderated Mediation Models: Competitors or Backups?
Acta Psychol. Sin. 2014, 46, 714–726. [CrossRef]63. Pletzer, J.L.; Balliet, D.; Joireman, J.; Kuhkman, D.M.; Voelpel, S.C.; Lange, P.A.M.V. Social Value Orientation,
Expectations, and Cooperation in Social Dilemmas: A Meta-analysis. Eur. J. Personal. 2018, 32, 62–83.[CrossRef]
64. Han, J.H.; Choi, A.S.; Oh, C.-O. The Effects of Environmental Value Orientations and Experience-Use Historyon the Conservation Value of a National Park. Sustainability 2018, 10, 3372. [CrossRef]
65. Alazaizeh, M.M.; Hallo, J.C.; Backman, S.J.; Norman, W.C.; Vogel, M.A. Value Orientations and HeritageTourism Management at Petra Archaeological Park, Jordan. Tour. Manag. 2016, 57, 149–158. [CrossRef]
66. Choi, H.; Choi, H.C. Investigating Tourists’ Fun-Eliciting Process toward Tourism Destination Sites:An Application of Cognitive Appraisal Theory. J. Travel Res. 2018, 58, 732–744. [CrossRef]
23

Sustainability 2020, 12, 132
67. Hanzaee, K.H.; Javanbakht, A. The Effects of Shopping Environment on Consumption Emotions, PerceivedValues and Behavioral Intentions. Manag. Sci. Lett. 2013, 3, 2501–2512. [CrossRef]
68. Antón, C.; Camarero, C.; Laguna-García, M. Experience Value or Satiety? The Effects of the Amount andVariety of Tourists’ Activities on Perceived Experience. Empir. Res. Artic. 2018, 57, 920–935. [CrossRef]
© 2019 by the authors. Licensee MDPI, Basel, Switzerland. This article is an open accessarticle distributed under the terms and conditions of the Creative Commons Attribution(CC BY) license (http://creativecommons.org/licenses/by/4.0/).
24

sustainability
Article
The Effectiveness of Marketing Communicationand Importance of Its Evaluation inan Online Environment
Anna Krizanova 1, George Lăzăroiu 2, Lubica Gajanova 1,*, Jana Kliestikova 1,
Margareta Nadanyiova 1 and Dominika Moravcikova 1
1 Department of Economics, The Faculty of Operation and Economics of Transport and Communications,University of Zilina, Univerzitna 1, 010 26 Zilina, Slovakia; [email protected] (A.K.);[email protected] (J.K.); [email protected] (M.N.);[email protected] (D.M.)
2 Department of Economic Sciences, Spiru Haret University, Bucharest 030045, Romania;[email protected]
* Correspondence: [email protected]; Tel.: +421-41-513-3237
Received: 31 October 2019; Accepted: 30 November 2019; Published: 9 December 2019���������������
Abstract: Online marketing communication covers a wide area and thus promotes an extensive reachof advertising to a broad audience. Hotels can achieve certain goals through online communication,mainly an increase of hotel awareness; an improvement of their image; and an increase in the level ofcustomer satisfaction and trust, or brand loyalty. Measurement of the effectiveness of communicationtools in the online environment is still a challenge, whether in the academic world or in the businessworld, mainly due to the complexity of this process. The main objective of this paper is to proposea methodology for implementing an indicator suitable for the evaluation of the effectiveness of onlinecommunication activities in the Slovak hotel industry. It uses analysis of the current usage of onlinemarketing communication activities from the perspective of hotel service providers. The methodologyshould be applicable to support decision-making and actively support the sustainable developmentof hotels. In order to achieve the objective of the paper, the authors conducted a marketing surveyfocused on online marketing communication by Slovakian hotels to determine their use and to map thecurrent state or methods of evaluating their effectiveness. Results of the research suggest that hotelsin Slovakia perceive evaluating marketing communications online as being important, regardless ofthe size, length of operation, budget, and class of the hotel. They prefer financial metrics because theyare a de facto manifestation of the traditional approach towards investment evaluation. The resultsalso showed that return on investment is the most common metric for evaluating the investments ofonline communication activities, and that respondents expressed the highest level of confidence inthis metric as well. In line with the results, we have proposed return on investment (ROI) as the mostappropriate metric applicable in evaluation of the effectiveness of online communication tools.
Keywords: online marketing; effectiveness; return on investments; hotel industry; Slovakia
1. Introduction
Competitive pressures on hotels and additional problems caused by the slow pace of economicgrowth are triggering a push for greater efficiency and effectiveness. As a result, marketing activitieshave become an integral part of business operations, as they have an impact on the current andfuture success of hotels. Their use is a continuous process in which the key task is to follow newtrends and respond flexibly to surrounding changes [1]. This also applies to marketing communication,
Sustainability 2019, 11, 7016; doi:10.3390/su11247016 www.mdpi.com/journal/sustainability25
Sustainability 2019, 11, 7016
in which using an adequately selected combination of communication tools leads to long-term customerrelationships and the sustainable development of hotels.
The unprecedented growth of online marketing has not only changed the way people interact,it has also changed the way in which businesses attract and retain their consumers. The Internet hasbecome an innovative marketing tool by providing travel information and a place to conduct onlinetransactions [2]. The informational nature of tourism products means that the Internet, which offersa global reach and multimedia capabilities, is an increasingly important tool for promoting anddistributing tourism services [3]. The increasing number of new communication channels has increasedthe need for hotels to pay attention to the effectiveness of these activities. Therefore, they mustdetermine whether they wish to use communication tools efficiently or to merely take advantage oftheir benefits [4].
Classic forms of marketing media are becoming a thing of the past [5]. Online marketingcommunication and its new forms provide a wider coverage area that promotes a better reach ofadvertising to a wider audience. The forms of marketing communication available online are muchfaster to use than offline communication tools, as the advertiser has more space online to provide moreinformation to a potential customer at a relatively low cost. The effectiveness of new forms of onlinemarketing communication is enhanced by the continuous development of ads in the online environment,which can be created using the many analytic tools available [6]. Therefore, measuring the effectivenessof these communication tools in an online environment is a very complex process, especially ina constantly changing environment where new marketing resources are being developed every day.However, determining the effectiveness of different forms of online marketing communication isstill a major challenge for the academic and business worlds. Since online marketing is completelydifferent from traditional marketing approaches, traditional marketing theories and practices may notbe applicable to these types of communication tools.
Based on the aforementioned discussion, we have analysed the current usage of online marketingcommunication activities by hotel service providers. Based on the results, the main objective was toidentify or propose a suitable methodology for evaluating the effectiveness of online communicationactivities that would be specific to the Slovak hotel industry and would be useful to supportdecision-making relating to the sustainable development of hotels.
2. The Current State of the Slovak Hotel Industry
Despite minor oscillations, European and global tourism have been experiencing significantgrowth overall. European tourists currently have high purchasing power, as well as a tendency totravel frequently, which is why Europe continues to be the leader in global tourism flows [7]. The hotelindustry in Central and Eastern Europe has been registering growth in all key indicators. The numberof tourists as well as the occupancy rates have returned to pre-global financial crisis conditions or haveeven surpassed them [8].
Slovakia has all of the necessary prerequisites for the development of tourism—naturalenvironments, a convenient geographical location, historical monuments, a strong cultural heritage, etc.However, it currently does not make sufficient use of these assets. The trend towards the developmentof active tourism and the need for a hotel industry catering for it has been a challenge for Slovakia.Slovakia in recent years has been receiving a lower share of tourists from Western European countriesand an increasing share of visitors from former socialist countries. Most tourists come to Slovakiafrom the Czech Republic, Hungary, Poland, Germany, Austria, the Netherlands, and Ukraine. In termsof visitor composition, tourists visiting Slovakia are most commonly 35–45 years of age and havea lower middle class income. The most common reasons to visit Slovakia are transit, business or studytrips, visits to family, shopping tourism, vacation stays, cultural/sightseeing trips, skiing and spa trips.The average number of overnight stays is three nights [9]. The share of tourism in the Slovak GDPis approx. 2.5% and does not reach the EU countries average (more than 5%). The low percentage isthe result of several factors such as incomplete and unrelated services, unsatisfactory infrastructure
26

Sustainability 2019, 11, 7016
(mainly transport), lack of qualified staff in services (insufficient level of foreign language skills), a lowlevel of services that is inconsistent with price levels, and low awareness and promotion [10].
A positive phenomenon in the context of tourism and hotel industry promotion in Slovakia isthe adoption of the official logo “Good Idea Slovakia” in 2016, which is focused not only on representSlovakia but also on supporting domestic tourism, accommodation facilities, restaurants, organizations,and providers of tourism services. The Act No. 415/2013 Coll. on Promotion of Tourism as amendmentis also considered a challenge to support Slovak tourism, as well as new forms of online marketingstrategies [11]. It aims to motivate tourism entities to ensure the coordination of activities, i.e., destinationmanagement in regions and areas of tourism, in other words, a system element that is significantlyabsent in Slovakia.
In Slovakia, 38 tourism organizations have been established since 1 January 2011. The aim ofthese organizations is to create and implement the concept of tourism development; to create andimplement marketing and promotion of tourism for the members at home and abroad; to promotethe common interests of the members; to promote cultural, social, and sporting life; and to preservenatural and cultural heritage [10]. A major challenge in the field of marketing communication for thedevelopment of domestic tourism and hotel industry is the financial contribution to the recreation ofemployees. Employers have provided contributions to employees since 01/2019, in accordance withthe Article 152a of the Act No. 311/2001 Coll. on Labour Code as amendment [12].
As the primary role of marketing communication is to influence the consumer to purchasea product or service, this marketing mix tool is under considerable pressure to achieve demonstrablebusiness results in forms such as influencing sales of products and services, increasing brand awareness,or getting customer information. In order to reduce this pressure, hotels are looking for new solutions.Marketing communication is a tool of marketing mix, which is characterized by constantly emerging newtrends. The enormous boom of the online environment gives hotels multiple options to communicatewith existing or potential customers [13]. Because of a large number of communication tools availablein the online environment, hotel managers need to find the most effective ones.
3. Literature Review
Businesses in all sectors pay close attention to the concept of effectiveness. The evaluation ofeffectiveness in the field of Slovak and foreign literature is being scientifically researched from severalpoints of view depending on the scientific focus of authors. The advancement and importance ofcommunication technologies in recent decades have led to the growth and development of the businessenvironment and intensified competition [14–16]. Businesses have been forced to seek new ways tomeet customer demands. As a result, there is a growing awareness among businesses about the need foreffectiveness of heterogeneous business activities [17]. To explain this, a marketing perspective is takento explain the fact that companies achieve their objectives by satisfying their customers with greatereffectiveness than their competitors [4]. Consequently, measures designed to assess the effectiveness ofbusiness activities should reflect the specific activities and types of products and services offered [18].It is also important to determine theoretical knowledge of effectiveness and its evaluation, whichwould be most suitable for its implementation in marketing communication.
In economic theory, it is possible to determine two basic terms in connection with any investmentappraisal—effectiveness and efficiency. These terms have a semantic base, mainly in English scientificsources. Efficiency is defined as the ratio between input and output, or between the achieved results andthe incurred costs [19]. It follows that the efficiency refers to the economic aspect of heterogeneous meansinvested in business activities, i.e., is interpreted as economy. Economy for marketing communicationis defined as the minimization of costs incurred in order to achieve the stated communication goal,i.e., efficiency is the degree of achievement of the relevant goal of marketing communication activity [20].In terms of the number of input and output variables, efficiency is expressed as the ratio of inputsand outputs that are achieved in a conversion per production unit with a result equal to or greaterthan one [21].
27

Sustainability 2019, 11, 7016
The definitions of effectiveness are determined differently. The concept of effectiveness is basedon the word effect, that is, the effect of providing outputs in the form of products and services resultingfrom the consumption of production factors (inputs) to the target audience [22]. It can be stated that itis the ability to produce the desired outputs with a rational usage of available inputs. The importanceof effectiveness in terms of the number of input and output variables lies in a production system basedon either maximizing outputs (output-oriented effectiveness) or minimizing inputs (input-orientedeffectiveness) [21]. In the marketing and communication field, the interpretations of this meaning couldinclude the relationship between the given communication goals and real impacts on business results,i.e., the ratio of desired and achieved.
In connection with the issue of marketing communication, it is also necessary to define itsmodern forms—creative, emotional, innovative, and integrated communication [23]. This means thateffectiveness is an intellectual effort, as well as an attitude based on that effort, which must be constantlymeasured to ensure commercial success [24]. However, it is important to note that effectiveness isnot only a measure of market success, but also a measure of operational excellence or productivity.This involves minimizing costs and improving operating margins. On the other hand, effectivenessis linked to the ability of a company to design a unique model of accepting business opportunitiesthrough the exchange of relationships. Focusing on efficiency and neglecting effectiveness can leadto a temporary profitability. Otherwise, focusing on effectiveness and lack of efficiency can lead tounprofitable growth [25–27]. The company should therefore maintain an optimal level of efficiencyand effectiveness (the indicators that will lead to sustainable profitability and business growth [28,29]).
3.1. Marketing Effectiveness and Importance of Its Evaluation
The essence of marketing effectiveness is particularly useful in any business, as it assumes betterbusiness stability, long-term profit growth, increased customer satisfaction, competitive advantage,and business sustainability [21,30–35]. A study on the evaluation of marketing effectiveness hasshown that businesses with higher marketing effectiveness also achieve higher overall businesseffectiveness compared to competitors in the market where marketing effectiveness is not a priority [36].The assessment of marketing effectiveness is an integral part of a comprehensive business performanceevaluation that helps companies to implement a marketing strategy by providing a general viewof business performance [37,38]. The aim of evaluating marketing effectiveness is to analyse theinterrelationships between marketing activities and overall business performance [39]. It is veryimportant that the concept of marketing and its effectiveness contribute to the overall functioning ofthe business and are not an isolated function. This means that the objectives of evaluating marketingeffectiveness and business objectives should be mutually supportive, especially in the areas of meetingcustomer needs; stimulating, developing, and increasing sales; and assessing the impact on overallbusiness effectiveness.
There are several conceptual measures defining marketing effectiveness that are based on academicresearch. Drucker, as the first author dealing with the issue of marketing effectiveness, states thatthe basis for the success of marketing activities and processes is to do the right things, which means,to do things in an effective way [40]. Marketing effectiveness, as reported by Walker and Ruekert,refers to the results of business programs in relation to the resources used to implement them [41].More specifically, Clark states this. According to him, effectiveness refers to the relationship betweenmarketing results (marketing outcomes) and efforts or means introduced into marketing (marketinginputs) [42]. Measuring effectiveness is a matter of increasing importance in developing strategic plans,evaluating the achievement of marketing goals, and rewarding managers [43–45].
Other authors also discussed the issue of marketing effectiveness. According to them,the effectiveness in terms of marketing represents a comparison of marketing outputs and marketinginputs, i.e., efforts in relation to the outcomes of business programs and the resources used,i.e., the suitability of marketing communication programs with existing business structures. This meansthat they have investigated the extent to which marketing activities can meet the business goals [46].
28

Sustainability 2019, 11, 7016
This scientific study was extended by Mavondo, who examined marketing effectiveness only in theshort term. He presented the positive impact of marketing effectiveness on the financial performanceof a company, which resulted in increased market share, sales, gross margin, and even successfullaunch of new products on the market [34].
Other authors have built on previous studies and even expanded them and presented marketingeffectiveness as a measure of how a company can gain a higher market share over competitionin advertising and promotion field. They dilated their research to optimize marketing spendingthrough marketing effectiveness to achieve even better results for both short- and long-term goals [31].Gao’s study was based on the basic formulation of effectiveness, doing the right thing by comparingmarketing effectiveness with the goals formulated in the market strategy of the business [47]. Anotherstudy also examined marketing efficiency, but the outcome was to define marketing effectiveness asa long-term process that was aiming to create value based on business resources for marketing activitiesand competitive advantage [32]. In Slovakia, the authors, who addressed the issue of marketingeffectiveness, defined in their studies the concept of marketing effectiveness as the quality with whichmanagers optimize expenditures in order to achieve better results for companies in the short- andlong-term, i.e., optimize the quality of marketing spending so that businesses achieve their goals inany time period analysed [33].
There are various reasons to carry out regular measurements of the effectiveness of a business.These reasons may include, especially in the marketing environment, as follows:
• If something cannot be changed, it cannot be understood;• If something cannot be understood, it cannot be checked;• If something cannot be checked, it cannot be improved;• If results cannot be measured, success cannot be distinguished from failure;• If success cannot be seen, it cannot be evaluated;• If success cannot be evaluated, failure is likely to be evaluated;• If failures are not recognized, old errors will be repeated and resources wasted [48].
3.2. Effectiveness and Evaluation of Marketing Communication in the Online Environment
The use of Internet technologies in marketing communication is gaining in importance [49].It is also a fact that the most revenues are generated through online marketing communications byusing personalization, multimedia integration, and real-time interactions [50–52].
The importance of effectiveness of marketing communication in the online environment is alsomultiplied by the number of scientific publications dealing with this issue in the renowned databases,namely, Web of Science (1990) and Scopus (2059), for the period from 2004 to 2018 (Figure 1). However,it should be noted that the number of scientific articles and studies includes all synonyms of onlinemarketing, i.e., digital marketing, internet marketing, and e-marketing.
The effectiveness of the evaluation of any marketing tools is also assumed by the fact that onlya comprehensive evaluation can move companies into further development of marketing activities [53].Thus, the effectiveness of marketing tools becomes the basic dimension of a company’s performanceand the basic pillar for its sustainable development [30].
29

Sustainability 2019, 11, 7016
3461 57
39
86 94
125 119 127144
178 182
227240
277
139122
72 69 77 83 73
132147 143
190 195 189 199
229
0
50
100
150
200
250
300
2002 2004 2006 2008 2010 2012 2014 2016 2018 2020
Web of Science Scopus
Figure 1. Number of scientific articles and studies from the Web of Science and Scopus databases onthe effectiveness of online marketing communication.
4. Materials and Methods
Demonstrating effectiveness in marketing has never been so difficult. There are many factors toconsider: pressure on marketing budgets, transforming media environments and channels, the impactof technology, changing consumer behavior, and so on. Such a dynamic environment is both a challengeand an opportunity. Demonstrating the tangible effectiveness of communication campaigns is becomingincreasingly important for marketers. Measuring of effectiveness has become a key issue in the marketingdepartments of many companies over the last decade [54]. In his study, IBM identified the measurabilityof marketing activities as one of the three key areas for future development. The findings of the studyshow that the ability to evaluate marketing investments could be one of the main ways to restorecredibility to the marketing department [55].
Another report showed that the evaluation of the effectiveness of communication activities isperceived as significant by the contracting authorities. However, it was surprising to find that 43% ofmarketers do not measure the return on investment in their communication activities. Rather, the resultsof the study confirmed the use of standard evaluation methods. More than 90% of respondents evaluatethe effectiveness of communication campaigns, and 53% of respondents usually use the return oninvestment (ROI) indicator for evaluation. So, most marketing professionals track campaign results,but only half of them in financial terms. The 47% of marketers do not monitor the financial impactof their campaigns. The study showed that typically large companies with long-term existence andhigher budgets for communication activity of the company implement the evaluation of effectiveness.Only 41% of respondents are evaluating all campaigns, more than half of the respondents focus oncriteria of effectiveness for selected campaigns only, and 7% of respondents report that they evaluatetheir campaigns only exceptionally [56].
IBM study also identified increasing pressure on marketing departments based on qualitativeresearch. IBM considers the ability to quantify and analyse the financial results of marketing investmentsand, above all, to present the conclusions of marketing department activities throughout the organizationas a key task [55]. The measuring of effectiveness is also expected to be a challenge in studies ofReglix [57,58].
Another survey also revealed a significant need for improving data use, measuring onlinemarketing, and evaluating marketing return on investment. In addition, the survey also focused onthe degree of business satisfaction regarding ability to measure return on marketing investments.Up to 41% of businesses in the US are satisfied with their ability to measure marketing ROI through
30
Sustainability 2019, 11, 7016
proper leadership and perseverance. Their knowledge of their marketing return on investment allowsthem to manage marketing spending decisions. Only 43% of organizations make their marketingbudgets based on an analysis of marketing return on investment. In contrast, 68% of businesses basetheir marketing budgets partly on historical spending and 28% on their own instincts. When makingdecisions about specific marketing expenses, up to 21% of businesses make all or most of those spendingdecisions without metrics. Instead of marketing return on investment, executives continue to use manytraditional metrics, such as brand preference, shopping intent, and willingness to recommend [59].
These facts together with the theoretical background form the basis of our research. We assumedthat hotel management feels pressure in the form of the ability to quantify the return on investmentspent on the online form of communication even in the conditions of the Slovak Republic. That iswhy we asked in the realized research whether hotels evaluate the effectiveness of all forms of onlinemarketing communication used. Additionally, we asked whether there is a certain type of hotel(based on size, life time, budget size, and hotel class) that would perform that assessment to a greaterextent. Another focus of the research was on the benefits and metrics of evaluating the effectiveness ofonline marketing communications. In the end, we asked whether hotels were generating an interest innew methodology to assess the effectiveness of online marketing activities, the creation of which is themain objective of this paper.
Based on the theoretical research and analysis of secondary data and with a view to achieving theobjective of the paper, following research questions and hypotheses were formulated:
• Research question 1: Do hotels assess the effectiveness of all forms of online marketing communicationthat they apply?
Hypothesis 1a. The effectiveness of the applied forms of online marketing communication is insufficientlymonitored by lower-class hotels.
Hypothesis 1b. The effectiveness of the applied forms of online marketing communication is insufficientlymonitored by hotels with a lower budget in this field.
Hypothesis 1c. The effectiveness of the applied forms of online marketing communication is insufficientlymonitored by hotels with a shorter existing (lifetime).
Hypothesis 1d. The effectiveness of the applied forms of online marketing communication is insufficientlymonitored by hotels of a smaller size.
• Research question 2: Do hotels perceive the benefits of evaluating the effectiveness of onlinemarketing communication?
Hypothesis 2. There is no statistical dependence between the perception of the benefits of evaluating theeffectiveness of online marketing communication and the evaluation itself.
• Research question 3: What metrics do hotels use to evaluate the effectiveness of onlinemarketing activities?
• Research question 4: Is the level of metrics used to assess the effectiveness of online hotel marketingactivities sufficient?
Hypothesis 3. There is no statistical dependence between the types of metrics for assessing the effectiveness ofonline hotel marketing activities and their sufficient level.
• Research question 5: Are hotels interested in implementing a new methodology to assess theeffectiveness of online marketing activities?
31

Sustainability 2019, 11, 7016
In order to meet the main objective of the paper, the conceptual scheme of research elaborationshown in Figure 2 was used. The scheme is based on theoretical knowledge from secondary researchand data obtained from primary research, and illustrates the connection of the research questions andhypotheses to individual factors.
Figure 2. Conceptual scheme of research elaboration.
In order to meet the objective of the paper, the authors conducted a marketing survey focused ononline hotel marketing communication in the conditions of Slovakia to determine the level of its usein the practice and to map the current state or methods of evaluating of its effectiveness. Accordingthe results, the authors proposed ROI as the most appropriate metric applicable in the evaluation ofeffectiveness of online communication tools.
In the survey, the size of the population was determined based on data obtained from theorganizational statistics of the Statistical Office of the Slovak Republic. The population consists ofeconomic units classified according to their primary economic activity—based on the SK NACE, group“55.10.0 Hotels and Similar Accommodation”. For the purposes of the paper, we dealt with accommodationfacilities of a hotel type, as these facilities are divided into classes according to the quality of servicesand technical equipment. Pursuant to Decree of the Ministry of Economy of the Slovak Republic no.277/2008, a class is determined as meeting the minimum requirements for accommodation facilities,quality, and scope of services adequate to the class, which is marked with stars from the lowest class(*) to the highest class (*****). The size of the base population is 803 economic units, respectively,hotels (December 2017). As 313 hotels participated in the marketing survey, the minimum sample size(260 hotels) was met. The answers of respondents to the questions based on the determined confidencelevel (95%) and confidence interval (5%) can be considered as relevant. In the case of a marketingsurvey, the questionnaire method was chosen; the questionnaires were distributed by e-mail.
The questionnaire consists of three parts. The first part is focused on the importance, benefits,and use of online marketing communication. The second part deals with the investments into onlinemarketing communication and perception of the effectiveness of online marketing communication.The objective was to find out whether hotels were evaluating the effectiveness of online marketingcommunication tools, and whether they would be interested in the proposed methodology ofeffectiveness evaluation. The last part concerns the general profile of the respondent, i.e., class of thehotel, its size, lifetime, annual turnover, etc.
The method of statistical hypothesis testing was chosen for the research. It is one of the mostimportant statistical inference procedures. The role of statistical inference is to decide on the basisof information on the available choices whether to accept or reject certain hypotheses with respect
32

Sustainability 2019, 11, 7016
to the basic sample set. In order to do so, we proceeded in accordance with the methodology ofstatistical hypothesis testing [60]. Because the primary data in this research is of a nominal nature, thetest statistic is the Chi-square test of independence. To calculate the test statistic for the hypothesis,IBM SPSS Statistics software was used. This software also calculates the correlation coefficient. In thiscase, because the nominal variables are being examined in the number of 3+ × 2+, it was appropriateto investigate the strength of the dependence between the variables using the Cramer’s V measure ofassociation [51,60,61].
The correspondence analysis is a multivariate graphical technique designed to explore relationshipsamong categorical variables. When the study variables of interest are categorical, correspondenceanalysis is an appropriate technique to explore the relationships amongst variable response categoriesand can play a complementary role in data analysis [62]. The use of correspondence analysis musttherefore be preceded by the testing of hypotheses on the independence of observed characters [63].Correspondence analysis is conducted using the IBM SPSS Statistics software, too. The essence of thisanalysis is the transformation of points of the multidimensional space, which represent the examinedcategories, into a space of lower dimension, most often in the plane (2 dimensions). This transformationis unambiguous and allows us to focus on revealing a certain type of relationship between categories(variables). We evaluate the transformation quality based on the rates derived from the total inertia.
5. Results
Mostly small businesses (74.4%) were involved in the survey to determine the level of use ofonline marketing communication activities and to map the level of the evaluation of the effectivenessof these activities. In addition, 21.1% of medium-sized enterprises, 4.2% of micro-enterprises, and0.3% of large enterprises participated in the survey. In terms of classifying the hotel, four-star hotelsformed the largest group (44.1%), followed by three-star hotels and motels (39%), two-star hotels andmotels (10.9%), and five-star hotels (4.4%). Hotels and motels with one star (1.6%) had the smallestrepresentation (1.6%). In terms of the period of existence of hotels, most hotels and motels exist from11–15 years (46%) and 16–20 years (39%).
To answer the first research question, we asked the respondents whether they evaluated theeffectiveness of all forms of online marketing communication, which they used in the practice.The effectiveness of all online forms is regularly evaluated by 17.3% of hotels, often in 27.1%, sometimes20.8%, and rarely 4.1%. Up to 30.7% of hotels do not evaluate the effectiveness at all.
The subject of research was also the reason for not monitoring performance and evaluating theeffectiveness. Respondents stated reasons as high evaluation costs, current situation is sufficient,lack of resources (employees, funds, and process data), and evaluation of effectiveness only in someforms of online marketing communication. Subsequently, we used the primary data from this questionto test the statistical hypotheses H1a to H1d. The results are shown in Table 1.
Table 1. Chi-square test of independence of hypotheses 1a–1d.
Hypothesis p-Value Significance Level Reliability Interval Acceptance/Rejection of the Hypothesis
H1a 0.34560.01 99% Rejection0.05 95% Rejection0.10 90% Rejection
H1b 0.11720.01 99% Rejection0.05 95% Rejection0.10 90% Rejection
H1c 0.17660.01 99% Rejection0.05 95% Rejection0.10 90% Rejection
H1d 0.07930.01 99% Rejection0.05 95% Rejection0.10 90% Acceptance
33

Sustainability 2019, 11, 7016
The test proved there is no significant variable that would reveal the descriptive factor of thehotel, which more often performs an evaluation of the effectiveness of all forms of online marketingcommunication used. Only in the case of the size factor was the existence of the dependence of theexamined variables confirmed, but only at a low level of reliability interval, which indicates a verylow dependence.
Another explored aspect of the survey was to point out the benefits of evaluating the effectivenessof online marketing communication. Respondets perceive monitoring of effectiveness positively,as 59.1% of respondents perceive the significance of this activity, 24.3% are in favour of the fact thatmonitoring of the performance and effectiveness is rather meaningless, and only 16.6% do not see itas meaningful.
The resulting further aspect of the research was to find out the existence/absence of statisticaldependence between the perception of the benefits of evaluating the effectiveness of online marketingcommunication and the evaluation itself. The test statistics are presented in Tables 2 and 3.
Table 2. Chi-Square Tests—Hypothesis 2.
Value df Asymptotic Significance
Pearson Chi-Square 177.391a 12 0.000
Likelihood Ratio 201.996 12 0.000
N of Valid Cases 313
Table 3. Symmetric Measures—Hypothesis 2.
Value Approximate Significance
Nominal by Nominal Phi 0.753 0.000Cramer’s V 0.435 0.000
N of Valid Cases 313
A significance level was determined at 0.05 and corresponded to a 95% confidence interval.Based on the comparison of the significance level with the p-value (Asymptotic Significance), the nullhypothesis was rejected and the alternative hypothesis confirmed, i.e., there is a statistically significantrelationship between the variables examined. The intensity of the dependence of the variables accordingto Cramer’s V (0.435) indicates a moderate dependency. Therefore, we can say that hotels that evaluatethe effectiveness of online marketing communication have proven to be more aware of the benefitsof doing so.
To answer other research questions, respondents were asked for information on their ownevaluation method. Only those who stated that they were using a metric responded to the level ofadequacy of its results. The most commonly used metric is ROI 26.2%. Other metrics are GoogleAnalytics (20.1%), customer satisfaction survey (8.9%), monitoring statistics (8.6%), and an analysis ofdemand for tourism products (6.7%). Up to 23.3% of hotels reported missing the form (procedure) toassess the effectiveness of online marketing communications, and 6.2% did not monitor the effectivenessof any online communication form. Subsequently, we used the primary data from these questions totest statistical hypothesis 3. The calculated test statistics are presented in Tables 4 and 5.
Table 4. Chi-Square Tests—Hypothesis 3.
Value Df Asymptotic Significance
Pearson Chi-Square 44.014a 12 0.000
Likelihood Ratio 42.837 12 0.000
N of Valid Cases 217
34

Sustainability 2019, 11, 7016
Table 5. Symmetric Measures—Hypothesis 3.
Value Approximate Significance
Nominal by Nominal Phi 0.450 0.000Cramer’s V 0.260 0.000
N of Valid Cases 217
A significance level was determined at 0.05 and corresponded to a 95% confidence interval.Based on the comparison of the significance level with the P-value (Asymptotic Significance), the nullhypothesis was rejected and we can confirm an alternative hypothesis, so there is a statisticaldependence between the variables examined (types of metrics to assess the effectiveness of onlinemarketing activities of hotels and their sufficient level). The intensity of the interdependence of variablesby the Cramer’s V measure of association (0.260) indicates low dependence. Based on the existence ofdependence between the variables, it makes sense to examine the internal structure of the contingencytable by the correspondence analysis. The results are shown in Figure 3.
Figure 3. Correspondence map.
To visualize the correspondence map, it is necessary to reduce the extracted dimensions to onlytwo, so that the map can be displayed in a two-dimensional view. Interpretation of the correspondencemap that we have obtained in this way is relatively simple. The position of the line and columncategories indicates which categories are related (corresponding) to each other. The metrics, namely,the Questionnaire Survey of Customer Satisfaction, Monitoring of Statistical Data, and Analysisof Demand for Tourism Products are very similar in terms of satisfaction assessment. The metricsROI and Google analytics are specific in this case. They are sufficiently distant from other metrics,so they do not show common characteristics in terms of satisfaction. As for the individual levels ofsatisfaction, only two of them are similar (Yes and Rather Yes), as they are in a common quadrant of themap. Google analytics is captured on the map closest to the satisfaction category Rather No StronglyDisagree. The ROI is assigned to the category of satisfaction assessment at the level Yes. The vertical
35
Sustainability 2019, 11, 7016
axis shows the distinction between the ROI and Google analytics from other metrics. This axiscaptures the distinction of expressing total dissatisfaction with metrics from other levels of satisfaction.The most important result of the correspondence map is that the ROI metric clearly shows the highestsatisfaction rate.
In another question, respondents were asked whether they could imagine applying a particularprocedure or form to assess the effectiveness of online marketing communication in their activities if itexisted. Up to 89.8% expressed interest.
6. Discussion
In evaluating the effectiveness of online marketing communication, hotels identify and thenexamine results and explore opportunities for improving and modifying this effectiveness.
6.1. Benefits of Evaluating the Effectiveness of Online Marketing Communication
Observing and evaluating the effectiveness of online communication tools leads to identificationof how well hotels are implementing communication tools, and if something is wrong, it determinesthe barriers and possibilities to overcome this deficiency in the future [64].
Such information helps any hotel to understand whether online marketing communication isachieving its goals and whether the implementation of online communication strategy is moving in theright direction. The goals that a hotel can achieve through its online communication, e.g., are increasinghotel awareness; improving its image, awareness, and trust; increasing the level of customersatisfaction and loyalty; and differentiating itself from the competition or increasing the numberof hotel guests [65–67].
Many hotels consider forms of online marketing communication only as a pro-forma promotionwithout a return on funds. The survey conducted in conditions of Slovakia has showed that up to30.7% of hotels do not evaluate the effectiveness of all used forms of online communication at all.This is contrary to studies and surveys that have showed that a thoroughly refined marketing strategyand an interest in innovations in marketing communications can bring hotels and other businessesa favourable financial outcome, long-term growth, and a stable position in the hotel product market.
Most (59.1%) of the hotels surveyed are aware of the benefits of evaluating the effectiveness ofonline marketing communication, namely,
• It contributes to a more exhaustive redesign of the marketing communication strategy and leadsto increased trust among marketing staff;
• It leads to the integration of communication between a hotel and its customers (since elaboratedeffectiveness assessment procedures lead to easier communication and create a clearer picture ofa business strategy), more effective communication with customers, and better targeting of onlinecommunication tools;
• It increases alignment with not only marketing goals but also business goals, marketing strategy,and employee loyalty;
• It increases the share of successfully implemented changes—revised feedback will not only increasethe likelihood of success, but will also speed up the process of making the necessary changes;
• It leads to better problem prediction and optimization of online communication portfolios;• It makes it easier for marketing staff to continuously perceive the impact of introduced changes
on individual marketing processes, increasing the effectiveness of processes and working time.
Based on the results of the survey, it can even be argued that hotels that evaluate the effectivenessof online marketing communication are demonstrably more aware of the benefits of doing so.The objective of the contribution was justified by the demonstration of these benefits. The hotels alsoshowed an enormous interest (89.8%) in implementing this kind of methodology in their activities.
36

Sustainability 2019, 11, 7016
6.2. Identifying the Most Appropriate Metric for the Effectiveness Evaluation
Return on investment can be used as the most appropriate metric to measure the effectivenessof marketing activities, because it simply refers to the idea that something of value has resultedfrom an investment of time, energy, or money [68]. In the financial approach, ROI is usually reducedto a formula, which is calculated simply by subtracting the cost of an investment from the incomereceived from the investment, divided by the same investment cost. ROI as a return on fundsinvested in marketing activities can be considered as one of the most important methods of measuringmarketing effectiveness. It can be assumed that businesses still prefer financial appreciation of returnto non-financial appreciation [53,69]. Justifying the value of the intervention of companies in onlineenvironment and knowing what the usefulness or benefits are of marketing in this area have beenpriorities over the years [70]. As this trend has increased, sellers have had to make the right decisionsabout key aspects of new forms of online marketing communication and determine how to measuretheir effectiveness through return on investment [71,72]. Due to the particularities of the tourism sector,ROI is constituted as suitable for the measurement of the effectiveness of online marketing actions, sincethe subjectivity that runs through the entire tourism process encourages the inclusion of measurementtools that take this fact into account [73].
We have identified ROI as the most appropriate metric for developing a methodology based on theattitude of several authors dealing with this issue [49,52,56,59,74,75], as this method is the most suitablefor measuring the success of communication activities. ROI should also be used as an optimizationmethod [52]. Based on the survey, we have found that the most frequent response of respondentsregarding the choice of method by which they assess the success and subsequent optimization of formsof online marketing communication is ROI (26.2%). Moreover, the assumption that the use of ROIclearly shows the highest hotel satisfaction is also confirmed.
6.3. Methodology of Implementing ROI for the Effectiveness Evaluation
The proposed methodology uses the basic functions of Microsoft Excel to eliminate barriers toperformance monitoring and evaluation of the effectiveness of online marketing activities reportedby hotels in the Slovak Republic, namely, high evaluation costs, lack of resources (employees,funds, and process data), and evaluation of effectiveness only in some forms of online marketingcommunication. Based on the non-confirmed hypotheses 1a–1d, this methodology is generallyapplicable in all hotels in Slovakia. The methodology is able to track all hotel-determined onlinemarketing communication metrics and other data points in one visual, central location—dashboard.In this way, it provides a high-level view of working in the online environment, helping the hotelmanagement to make quick decisions and keep up-to-date information on all online forms ofcommunication used.
The visual nature of the dashboard simplifies work and complicated data. It provides an immediateview of current status or performance in real time, as it is made up of tables, metrics, and numbers.Using a dashboard, hotel management can understand what works and what does not work, andproactively seeks to optimize every form of online marketing communications. The calculation modelhas a relatively simple structure (see Figure 4), as it consists of only one sheet. This sheet titled“ROI Calculation” includes not only a partial return on investment of each online form of marketingcommunication, but also an overall return on investment for a hotel online marketing campaign.In addition, this sheet is the only sheet in which hotel management can make changes and adjustmentsto the inputs and calculation items used in each form of online marketing communication. Dashboardis divided into three parts: basic information; data about forms of online marketing communication;and input and output characteristics, including numeric data.
37

Sustainability 2019, 11, 7016
Figure 4. Methodology of implementing return on investment (ROI) for the effectiveness evaluation.
The first part of the ROI calculation of the online marketing campaign contains information aboutthe name of the online marketing campaign, respectively, about the goal that the evaluated forms ofonline marketing communication should achieve. In addition, the hotel management needs to fill in thedata about the total budget for the online marketing campaign (cell C2), the average order value (AOV)(average amount of value generated by each online activity by an average customer (cell C3)), andthe profit margin expressed as a percentage of a hotel´s profit from sales of its products and services(cell C4). Among other things, hotels can insert their own logo in this calculation, which will be placedto the left of the wording “Travel in Slovakia Good Idea” (a project funded by the European Union forthe promotion of tourism in the Slovak Republic and the brand Slovakia). The second part of the ROIcalculation concerns the determination of the various forms of online marketing communication thatare identified by a hotel´s management (line 9, columns C to L). In line 10, management will indicatethe specific goal of each form of online marketing communication used. Inserting the input and outputcharacteristics of selected forms of online marketing communication, including their numerical data,relates to the calculation of ROI for individual selected forms of online marketing communicationoverall. Column A (ROI calculation) lists the names of input and output characteristics, which wereselected on the basis of several professional foreign studies dealing with the issue of online marketingcommunication effectiveness [30,43,46,47,50,56,59,76]. In addition, in the column B, the user can identifythe specific input and output characteristics of the forms of online marketing communication. Thecolumns C to L (quantity depends on the number of the forms of online marketing communicationused) contain numerical values of each input and output characteristic, including the relationshipsneeded to quantify the ROI of these communication tools and overall.
7. Conclusions
During the 21st century, the issue of measuring and evaluating the effectiveness of online marketingcommunication has become very topical and significant. Indeed, the harsh competitive environmentof the hotel industry tends to influence hotels to use redundant marketing communication tools.It is increasingly necessary to reassess their effectiveness. The evaluation of marketing communicationtools, especially their online forms, is no longer an option but a necessity. Since the phenomenon ofthe effectiveness of marketing communication tools is undoubtedly considered as a ratio of return onmarketing revenues to marketing costs, the guidelines for their measurement are insufficient and fallshort of the requirements of the modern hotel industry.
38
Sustainability 2019, 11, 7016
In the light of the above, the main objective of the contribution was to propose a methodologysuitable for evaluating the effectiveness of online communication activities in the Slovak hotel industrythat would be a sufficient element supporting the decision-making process in the context of thesustainable development of hotels. In order to meet the objective of the paper, a marketing surveywas conducted in which hotels in the Slovak Republic were the object of research, and its purposewas to determine the level of use of online marketing communication activities and to map the statusof evaluating their effectiveness. Results of the research suggest that hotels in Slovakia perceive theimportance of evaluating marketing communications in the online environment, regardless of hotelsize, lifetime, budget, and class. They prefer financial metrics de facto, as they are a manifestation of thetraditional approach to investment evaluation. The results also showed that ROI is the most commonmetric for evaluating investments of online communication activities, and respondents expressedthe greatest confidence in this metric as well. The results thus confirm that theories that emphasizefinancial appreciation and rank ROI as the most appropriate metric to measure the effectiveness ofmarketing activities are also applicable in the Slovak Republic. Additionally, from the perspective ofthe particularities of the tourism sector, ROI is constituted as suitable for measuring the effectiveness ofonline marketing actions, since the subjectivity that runs through the entire tourism process encouragesthe inclusion of measurement tools that take this fact into account.
According to the above, the suggested methodology takes a form of the proposed Excel dashboard,and as the most appropriate metric, ROI was identified. The performance of ROI calculation in the fieldof online marketing communications is beneficial not only for hotels but also for other business entitiesfor two primary reasons. Firstly, ROI is very well known among the management staff of variouscompanies; secondly, the assessment of ROI in online marketing communication helps to determinenot only partial returns but also overall marketing returns. ROI ensures the measurement of the resultsof online communication activities in a participatory way, thus extending the goals of hotel marketingcommunication. It is calculated in a way that includes heterogeneous types of data, depending on thespecific form of online marketing communication. It helps to increase the relevance and effectiveness ofthe work of any hotel management, as it allows one to consider how particular online communicationactivities contribute to achieving communication goals of hotels.
Time and geographical constraints can be considered as the main limits of the suggestedmethodology. These restrictions were especially reflected in the selection of respondents—onlyenterprises operating in Slovakia were chosen in the statistical sample. This limitation can be removedif the results of the research are considered as a relevant solution and the results achieved are subject tosubsequent verification in the international environment. If these barriers were removed, results thatare more accurate could be achieved. Another limitation of the research is the established scale in someissues. There may be some distortions in the responses to whether they are using defined financial andnon-financial metrics. Therefore, it could be appropriate to apply the Likert scale. Other research inthe field of measuring the effectiveness of marketing activities would be interesting to compare therelevance of solutions and the verification of the results achieved in the international environment.In addition to the international comparison, further research could be focused on another sectorindustry and thus find out information on evaluating the effectiveness of marketing communication inother industries in Slovakia as well.
Author Contributions: Conceptualization, A.K.; Formal analysis, G.L. and A.K.; Investigation, D.M.; Methodology,L.G.; Project administration, A.K. and J.K.; Software, L.G. and M.N.; Supervision, G.L. and J.K.; Writing—originaldraft, L.G. and D.M.; Writing—review and editing, M.N.
Funding: This contribution is a partial output of the project APVV-15-0505: Integrated Model of ManagementSupport for Building and Managing the Brand Value in the Specific Conditions of the Slovak Republic.
Conflicts of Interest: The authors declare no conflict of interest.
39
Sustainability 2019, 11, 7016
References
1. Drugău-Constantin, A. Emotional and Cognitive Reactions to Marketing Stimuli: Mechanisms UnderlyingJudgments and Decision Making in Behavioral and Consumer Neuroscience. Econ. Manag. Financ. Mark.2018, 13, 46–50. [CrossRef]
2. McMahan, C.; Hovland, R.; McMillan, S. Online Marketing communications: Exploring online consumerbehavior by examining gender differences and interactivity within internet advertising. J. Interact. Advert.2009, 10, 61–76. [CrossRef]
3. Mikiashvili, N.; Lobzhanidze, N. Green innovations and economic policy in small economies. Forum Sci.Oeconomia 2017, 5, 29–40. [CrossRef]
4. Kotler, P.; Wong, V.; Saunders, J.; Armstrong, G. Moderní Marketing, 4th ed.; Grada Publishing: Praha,Czech Republic, 2007; ISBN 978-80-247-1545-2.
5. Danaher, P.J.; Rossiter, J.R. Comparing perceptions of marketing communication channels. Eur. J. Mark. 2011,45, 6–42. [CrossRef]
6. Ližbetinová, L.; Štarchon, P.; Lorincová, S.; Weberová, D.; Pruša, P. Application of cluster analysis inmarketing communications in small and medium-sized enterprises: An empirical study in the SlovakRepublic. Sustainability 2019, 11, 2302. [CrossRef]
7. Ivanovic, S.; Milenovsky, A.; Milojica, V. Croatian Tourism and Hospitality Industry: Current State andFuture Developmental prespectives. UTMS J. Econ. 2015, 6, 293–305.
8. Gurová, Z. Investori Sa Spoliehajú Na Výkonnost’ Stredoeurópskych Hotelov. Available online: http://www.cushmanwakefield.sk/sk-sk/news/2017/03/cee-hosipitality (accessed on 15 November 2019).
9. Križek, F.; Neufus, J. Moderní Hotelový Management; Grada: Praha, Czech Republic, 2014; ISBN 8024748355.10. Ministry of Transport and Construction of the Slovak Republic. Stratégia Rozvoja Cestovného Ruchu
do Roku 2020. Available online: https://www.mindop.sk/ministerstvo-1/cestovny-ruch-7/legislativa-a-koncepcne-dokumenty/koncepcne-dokumenty/strategia-rozvoja-cestovneho-ruchu-do-roku-2020 (accessedon 15 November 2019).
11. Travel in Slovakia Good Idea. Available online: https://slovakia.travel/ (accessed on 15 November 2019).12. Act No. 311/2001 Coll. on Labour Code as Amendment. Available online: https://zakony.judikaty.info/
predpis/zakon-311/2001 (accessed on 8 December 2019).13. Kramarova, K. Integrovaná Marketingová Komunikácia a Model Hodnotového Spektra. In Proceedings
of the International Scientific Conference on Globalization and its Socio-Economic Consequences, RajeckeTeplice, Slovakia, 30 September–2 October 2008.
14. Oláh, J.; Karmazin, G.; Peto, K.; Popp, J. Information technology developments of logistics service providersin Hungary. Int. J. Logist. Res. Appl. 2018, 21, 332–344. [CrossRef]
15. Zapletalová, Š. Competitive strategies of the SMEs: Empirical evidence from the Czech Republic. Forum Sci.Oeconomia 2017, 5, 9–26. [CrossRef]
16. Shpak, N.; Odrekhivskyi, M.; Doroshkevych, K.; Sroka, W. Simulation of Innovative Systems under Industry4.0 Conditions. Soc. Sci. 2019, 8, 202. [CrossRef]
17. Nagy, J.; Oláh, J.; Erdei, E.; Máté, D.; Popp, J. The Role and Impact of Industry 4.0 and the Internet of Thingson the Business Strategy of the Value Chain-The Case of Hungary. Sustainability 2018, 10, 3491. [CrossRef]
18. Mala, D.; Bencikova, D. Innovations of a green product. Ekon. Spektrum 2018, 12, 64–74. [CrossRef]19. Samuelson, P.A.; Nordhaus, W.D. Ekonomie; Nakladatelství Svoboda: Praha, Czech Republic, 2008;
ISBN 978-80-205-0590-3.20. Paulík, D. Základy Financií a Meny; Inštitút aplikovaného manažmentu: Trencín, Slovakia, 2012;
ISBN 978-80-896-0006-9.21. Stavarek, D.; Šulganová, J. Analýza efektívnosti slovenských bánk s využitím Stochastic Frontier Approach.
Ekon. Rev. 2009, 12, 27–34. [CrossRef]22. Synek, M. Manažérska Ekonomika; Grada Publishing: Praha, Czech Republic, 2003; ISBN 80-247-0515-X.23. Šindler, P. Event Marketing: Jak Využít Emoce v Marketingové Komunikaci; Grada Publishing: Praha,
Czech Republic, 2003; ISBN 978-80-2476-371-2.24. Molnár, Z. Efektivnost Informcních Systému; Grada: Praha, Czech Republic, 2000; ISBN 80-7169-410-X.25. Valaskova, K.; Kliestik, T.; Kovacova, M. Management of financial risks in Slovak enterprises using regression
analysis. Oecon. Copernic. 2018, 9, 105–121. [CrossRef]
40

Sustainability 2019, 11, 7016
26. Weissova, I.; Kollar, B.; Siekelova, A. Rating as a Useful Tool for Credit Risk Measurement. In Proceedings ofthe 4th World Conference on Business, Economics and Management (WCBEM), Ephesus, Turkey, 30 April–2May 2015.
27. Oláh, J.; Kovács, S.; Virglerova, Z.; Kovacova, M.; Popp, J. Analysis and comparison of economic and financialrisk sources in SMEs of the Visegrad Group and Serbia. Sustainability 2019, 11, 1853. [CrossRef]
28. Zerihun, T.B.; Shekhar, V. The effect of marketing effectiveness and efficiency on the marketing performanceof medium and large financial service enterprises in Ethiopia. International J. Multidiscip. Manag. Stud. 2011,1, 29–46.
29. Sroka, W.; Szanto, R. Corporate Social Responsibility and Business Ethics in Controversial Sectors: Analysisof Research Results. J. Entrep. Manag. Innov. 2018, 14, 111–126. [CrossRef]
30. Daukševiciuté, I.; Valainis, A.; Vilkaite, N. Conceptualization of the effectiveness of marketing tools.Intelekt. Ekon. 2011, 5, 200–211.
31. Nwokah, G.; Ahiauzu, A.I. Managerial competency and marketing effectiveness in corporate organizationsin Nigeria. J. Manag. Dev. 2008, 27, 858–878. [CrossRef]
32. Žostautiené, D.; Vaiciulenaité, I. Coherence model between marketing culture and marketing effectiveness.Econ. Manag. 2010, 15, 874–879.
33. Solcanský, M.; Šimberová, I. Measurement of marketing effectiveness. Econ. Manag. 2010, 15, 755–759.34. Mavondo, F.T.; Chimhanzi, J.; Stewart, J. Learning orientation and market orientation. Eur. J. Mark. 2004, 39,
1235–1263. [CrossRef]35. Pramanik, R.; Prakash, G. Marketable surplus and marketing efficiency of vegetables in Indore district.
J. Agric. Econ. 2010, 7, 84–93.36. Kožená, M.; Chládek, T. Company competitiveness measurement depending on its size and field of activities.
Procedia Soc. Behav. Sci. 2012, 58, 1085–1090. [CrossRef]37. Bartáková, G.; Gubíniová, P. Udržatel’ný Marketingový Manažment; IAM Press: Trencín, Slovakia, 2015;
ISBN 978-80-89600-08-3.38. Stonkute, E.; Vveinhardt, J.; Sroka, W. Training the CSR Sensitive Mind-Set: The Integration of CSR into the
Training of Business Administration Professionals. Sustainability 2018, 10, 754. [CrossRef]39. Andrijauskiene, M.; Dumciuviene, D. National culture as a determinant of firms’ innovative performance.
Forum Sci. Oeconomia 2018, 6, 47–67. [CrossRef]40. Drucker, P. Management: Tasks, Responsibilities, Practices; Harper Row: Michigan, MI, USA, 1974;
ISBN 978-00-6011-092-5.41. Ruekert, R.W.; Walker, O.C. Marketing´s interactions with other functional units: A conceptual framework
and empirical evidence. J. Mark. 1987, 51, 1–19. [CrossRef]42. Clark, B.H. Marketing Performance Measures: History and Interrelationships. J. Mark. Manag. 1999, 15,
711–732. [CrossRef]43. Ittner, C.D.; Larcker, D.F. Are nonfinancial measures leading indicators of financial performance? An analysis
of customer satisfaction. J. Account. Res. 1998, 36, 1–35. [CrossRef]44. Kmecova, I. The processes of managing human resources and using management methods and techniques
in management practice. Ekon. Spektrum. 2018, 12, 44–54. [CrossRef]45. Mura, L.; Haviernikova, K.; Machova, R. Empirical results of entrepreneurs’ network: Case study of Slovakia.
Serb. J. Manag. 2017, 12, 121–131. [CrossRef]46. Ambler, T.; Kokkinaki, F.; Puntoni, S.; Riley, D. Assessing market performance: The Current State of Metrics.
Available online: http://facultyresearch.london.edu/docs/01-903.pdf (accessed on 25 October 2019).47. Gao, Y. Measuring marketing performance: A review and a framework. Mark. Rev. 2010, 10, 25–40. [CrossRef]48. Halachmi, A. Performance measurement in only one way of managing performance. Int J. Product. Perform.
Manag. 2005, 54, 502–516. [CrossRef]49. Meilă, A.D. Regulating the Sharing Economy at the Local Level: How the Technology of Online Labor
Platforms Can Shape the Dynamics of Urban Environments. Geopolit. Hist. Int. Relat. 2018, 10, 181–187.[CrossRef]
41

Sustainability 2019, 11, 7016
50. Fahmy, M.M.; Ghoneim, A.I. The impact of interactivity on advertising effectiveness of corporate websites:A mediated moderation model. Int. J. Mark. Res. 2016, 8, 41–55. [CrossRef]
51. Durica, M.; Svabova, L. Improvement of company marketing strategy based on Google search results analysis.Proc. Econ. Financ. 2015, 26, 454–460. [CrossRef]
52. Hoffman, D.; Fodor, M. Can you measure the ROI of your social media marketing? MIT Sloan. Manag. Rev.2010, 52, 41–49.
53. Valaskova, K.; Kramarova, K. Analysis of a market performance in the European Union and Slovakia.In Proceedings of the 15th International Scientific Conference on Globalization and its Socio-EconomicConsequences, Rajecke Teplice, Slovakia, 7–8 October 2015.
54. Da Gama, A.P. An Expanded Model of Marketing Performance. Mark. Intell. Plan. 2011, 29, 643–661. [CrossRef]55. IBM. Od rozšírení vlivu po jeho posílení. Available online: https://docplayer.cz/3746558-Poznatky-z-globalni-
studie-marketingovych-reditelu-rozsireni-vlivu-po-jeho-posileni-shrnuti-pro-vedouci-pracovniky.html(accessed on 17 November 2019).
56. Obluk, O. Hodnocení Efektivitykomunikacních Kampaní. Available online: https://docplayer.cz/2180743-Hodnoceni-efektivity.html (accessed on 17 November 2019).
57. Regalix. TOP B2B Marketing Channels and Tactics. Available online: http://www.marketingprofs.com/charts/2015/26985/top-b2b-marketing-channels-and-tactics (accessed on 17 November 2019).
58. Regalix. State of B2B Social Media Marketing. Available online: http://www.regalix.com/wp-content/uploads/2016/10/State-of-B2B-Social-Media-Marketing-2016.pdf (accessed on 17 November 2019).
59. NYAMA. Marketing ROI in the Era of Big Data. Available online: https://www.iab.com/wp-content/uploads/2015/05/2012-BRITE-NYAMA-Marketing-ROI-Study.pdf (accessed on 17 November 2019).
60. Rimarcík, M. Štatistika Pre Prax; Marián Rimarcík, 2007; ISBN 978-80-969813-1-1.61. McHugh, M.L. The Chi-square test of independence. Biochem. Med. 2013, 23, 143–149. [CrossRef]62. Sourial, N.; Wolfson, C.; Zhu, B.; Quail, J.; Fletcher, J.; Karunananthan, S.; Bandeen-Roche, K.; Béland, F.;
Bergman, H. Correspondence analysis is a useful tool to uncover the relationships among categoricalvariables. J. Clin. Epidemiol. 2010, 63, 638–646. [CrossRef]
63. Král’, P. Viacrozmerné Štatistické Metódy So Zameraním Na Riešenie Problémov Ekonomickej Praxe; UniverzitaMatej Bela: Banská Bystrica, Slovakia, 2019; ISBN 978-80-8083-840-9.
64. Gúcik, M. Marketing Cestovného Ruchu; Dali BB, s. r. o.: Banská Bystrica, Slovakia, 2011; ISBN 978-80-89090-85-3.65. Maráková, V. Marketingová Komunikácie v Cestovnom Ruchu; Wolters Kluwer: Bratislava, Slovakia, 2016;
ISBN 978-80-8168-394-7.66. Rădulescu, A. Users’ Social Trust of Sharing Data with Companies: Online Privacy Protection Behavior,
Customer Perceived Value, and Continuous Usage Intention. Contemp. Read. Law Soc. Justice 2018, 10,137–143. [CrossRef]
67. Stuchlý, J.; Jambal, T.; Ližbetinová, L. Loyalty programs and customer preferences. In Proceedings of the32nd International Business Information Management Association Conference, IBIMA 2018-Vision 2020:Sustainable Economic Development and Application of Innovation Management from Regional Expansionto Global Growth, Seville, Spain, 15–16 November 2018.
68. Jiménez, M.A.S.; Correia, M.B.; de Matos, N. Analysis of social networks as an instrument of communicationin the tourist destinations of Algarve. Rev. GEINTEC 2018, 8, 4476–4494. [CrossRef]
69. Bragg, S.M. Business Ratios and Formulas: A Comprehensive Guide; John Wiley Sons: New York, NY, USA, 2012;ISBN 978-1118169964.
70. Haddow, G. Academic library use and student retention: A quantitative analysis. Libr. Inf. Sci. Res. 2013, 35,127–136. [CrossRef]
71. Kingma, B.; Mcclure, K. Lib-value: Values, outcomes, and return on investment of academic libraries,phase III: ROI of the Syracuse University Library. Coll. Res. Libr. 2015, 76, 63–80. [CrossRef]
72. McMullen, A. The value of values. Bottom Line 2013, 26, 4–6. [CrossRef]73. Bonilla, J. Nuevas tendencias del turismo y las tecnologías de información y las comunicaciones. Tur. Y Soc.
2013, 14, 33–45.
42

Sustainability 2019, 11, 7016
74. Wu, J. Calculating the ROI for Business Intelligence Projects. Available online: http://www.information-management.com/news/2487-1.html (accessed on 29 November 2019).
75. Buhalis, D.; Mamalakis, E. Social media return on investment and performance evaluation in the hotelindustry context. In Proceedings of the International Conference, Lugano, Switzerland, 3–6 February 2015;Tussyadiah, I., Inversini, A., Eds.; Springer: Cham, Switzerland, 2015.
76. Rust, T.R.; Lemon, K.N.; Zeithaml, V.A. Return on Marketing: Using Customer Equity to Focus MarketingStrategy. J. Mark. 2004, 68, 109–127. [CrossRef]
© 2019 by the authors. Licensee MDPI, Basel, Switzerland. This article is an open accessarticle distributed under the terms and conditions of the Creative Commons Attribution(CC BY) license (http://creativecommons.org/licenses/by/4.0/).
43

sustainability
Article
Measurement of Satisfaction in Sustainable Tourism:A Cultural Heritage Site in Spain
Nuria Huete-Alcocer 1, Víctor Raúl López-Ruiz 1 and Adriana Grigorescu 2,*
1 Faculty of Economics and Business, Plaza de la Universidad Nº 1, University of Castilla-La Mancha,02071 Albacete, Spain; [email protected] (N.H.-A.); [email protected] (V.R.L.-R.)
2 Valahia University from Targoviste, Institute of Economic Forecasting—Romanian Academy, 012244Bucharest, Romania
* Correspondence: [email protected]
Received: 8 November 2019; Accepted: 28 November 2019; Published: 29 November 2019 ���������������
Abstract: Sustainable tourism, in the cultural context, is a fundamental element for the economicdevelopment of some local communities. There are many factors that can influence the success ofthis type of tourism, but any action or strategy adopted should be closely related to the satisfactionof the tourist. This research focuses on a heritage destination of an archaeological nature, and isaimed at analyzing the profile of the cultural tourist and his/her level of satisfaction after visitingthe site. Information was collected using a closed questionnaire given to tourists. An ANOVAanalysis has been used to determine the relationship between sociodemographic characteristics andsatisfaction, with significant results found in relation to gender and income level. This study hashelped to highlight what underlies the differences in tourists’ post-visit satisfaction. These analyseshave provided information that can be used in the planning of future sustainable tourism marketingstrategies; thus, this study provides some recommendations on how to improve the provision ofservices and the management of these types of heritage elements.
Keywords: cultural tourism; cultural tourist; cultural heritage; satisfaction
1. Introduction
The importance of tourism in Spain is reflected in the number of tourist arrivals to this countryin 2018. According to data collected from [1], the number of foreign visitor arrivals in 2018 was over82.6 million, which represents an increase of 1.1% over the previous year. As a result, Spain hasbecome the second-ranked country in the world in terms of foreign visitor arrivals [2,3]. However, theinflux of tourists is not only due to traditional sun and beach tourism offers, but other types such ascultural tourism.
Nowadays, this type of heritage tourism, which is viewed as sustainable, is being very successfullydeveloped in this country [4]. In this regard, the United Nations Organization for Education, Scienceand Culture (UNESCO) reports that tourism focusing on natural and cultural heritage is the area thathas experienced the greatest growth in the tourism industry [5]. Moreover, heritage tourism has beenlargely considered as a form of experiential consumption in recent years [6].
An essential element that can be enjoyed as part of a tourist activity is the experiences that resultfrom the tourist coming into contact with the culture of a specific place, more specifically with the localheritage [7]; in many cases, this refers to the local archeology [8]. To a great extent, the success of atourist destination depends on the interactions between visitors and local residents [9]. In this sense,an especially important contribution of local residents is when they offer a cultural interchange withvisitors who are eager to learn about the heritage of the place. This has been shown in a number ofstudies [10] that suggest support should be provided to help tourists develop emotional bonds with
Sustainability 2019, 11, 6774; doi:10.3390/su11236774 www.mdpi.com/journal/sustainability45

Sustainability 2019, 11, 6774
places, and connections with those residing in the destination. These ties to places and the feelingof solidarity with local residents can positively influence visitors’ sense of loyalty to the destination.Thus, such connections can be considered a way of ensuring the sustainability of tourism within aparticular community [11].
Since the end of the 20th century, heritage destinations have been receiving substantial numbers ofvisitors, as the cultural heritage of a place is a large part of what attracts tourists to a particular location,as well as being representative of the identity of the local society [12]. Currently, the consumptionof cultural products, such as historical and artistic heritage and monuments, is attracting growingattention from academics and researchers due to the complexity of this type of tourism [13]. Indeed,the demand for cultural products is continuously evolving in terms of tourists’ consumption habits,sociodemographic characteristics, motivations and expectations, among other aspects [14,15]. In thisregard, cultural tourism can be understood as the “visits by persons from outside the host communitymotivated wholly or in part by interest in the historical, artistic, scientific or lifestyle/heritage offeringsof a community, region or institution” [16].
As a model of cultural tourism, the city of Segóbriga is the focus of analysis in this research.Located in the province of Cuenca (Spain), it is a Roman site listed as an archaeological park. This studyfocuses on sustainable tourism, in the cultural context, with the main objective being to determine howelements of the visitor profile affect the satisfaction of the tourist who visits the archaeological park ofSegóbriga. The results reveal the relationships between certain sociodemographic variables that definethe profile of the visitor to this site—namely, age, gender, income level, educational level, employmentstatus—and the degree of tourist satisfaction. The sample consists of 408 tourists visiting the park inthe spring of 2017. For the data collection, a questionnaire was used that included satisfaction scalespreviously used by several authors in their research (e.g., [17–20]).
This study helps to determine what kind of tourists visit this archaeological site, what their profilelooks like and how best to reach them. The results of the study also offer information that may behelpful when it comes to improving the tourism product or designing better marketing, which in turnwill support the socioeconomic development of the local area.
Regarding tourist satisfaction, the literature on this subject highlights the importance of thisvariable as a strong indicator of tourists’ intentions to come back to visit a destination or recommendit [21,22].
2. Literature Review
2.1. Cultural Tourism and Sustainable Development
The strong growth of the tourism sector in recent years has led to the sustainability of thisindustry being widely addressed in the literature [23–25]. Some authors [26,27] consider sustainabledevelopment in tourism to be closely related to environmentally-responsible tourism. In this sense, itis clear that ensuring the sustainability of tourism can be considered as one of the most effective waysto achieve the development of communities in tourist destinations, with local populations playinga key role in this regard. Local residents may even be able to bring about changes in the pattern ofvisitor arrivals, or foster innovations by taking advantage of the natural and cultural resources of thearea [28]. In this way, it is not only the culture itself that is important, but also the local residents whocan offer a cultural exchange with tourists interested in learning about the heritage of the place [10].
Cultural curiosity has traditionally been the basis for tourism development and the increase inmobility among tourist consumers [13]. In recent years, this type of sustainable tourism has becomeone of the largest segments of the tourism market, reflecting the notable growth in the level of demandfor tourism products centering on cultural values [29]. Therefore, today heritage is considered asan economic resource and is valued as a key development factor in the context of a new approachto tourism.
46

Sustainability 2019, 11, 6774
The complexity of the concept of cultural tourism has led to multiple definitions and perspectives,depending on the author or researcher [30]. Some of them (e.g., [31]) describe it as people traveling toplaces of cultural interest, with the aim of obtaining information and new experiences to meet theircultural needs. More generally, [32] defines it as a type of trip for personal enrichment. However, otherresearchers opt for a much tighter concept and focus on cultural services or products consumed bythe tourist, regardless of the motivation for the trip [33,34]. Others such as [30] claim that a touristwho consumes a cultural product is a cultural tourist by definition. This product thus incorporates thecomponents that attract tourists of a particular nature and with specific personal characteristics (eachof them comprises a different subgroup with different needs in terms of experiencing the culture). This‘also allows for the satisfaction of needs related to traveling to and staying in a certain place, that is, theset of goods and services that enable trips made for cultural purposes.
A common aspect stands out in all these definitions: the cultural tourist’s interest in findingout about diverse cultural elements; that is, elements of cultural heritage [35], understood as the setof tangible elements such as museums and historical and archaeological sites, as well as intangibleelements such as traditions, ways of life, and language, which constitute the identity of a place [36].This gives rise to the interest in studying the profile of the cultural tourist seeking to learn about theculture of a place.
2.2. The Profile of the Cultural Tourist
A review of the related literature shows a great variety of characteristics that can be identifiedwithin the profile of the cultural tourist [12]. Some studies (e.g., [37,38]) suggest that some tourists maybe more motivated than others to engage in a cultural experience, and their degree of involvementin the historical-cultural experience may vary. As such, [34] identify five types of cultural tourists,classified according to their motivation for travel (Table 1):
Table 1. Types of cultural tourists.
Type of Tourist Definition
Complete cultural tourist One who seeks a much deeper cultural experience, with cultural tourism being the mainmotivation for the visit.
Cultural visitor Although the main motive for visiting a destination is cultural tourism, they are not seekingsuch a profound experience.
Cultural discoverer This tourist does not travel for cultural reasons but ends up having a deepcultural experience.
Cultural casual Seeks some cultural activity on their trip, although this is not the main reason for it
Cultural accidentally This tourist’s main motive for travel is not cultural, but by chance they end up participatingin this activity, albeit not in a profound way.
Source: own elaboration based on [34].
From the above, it can be seen that there are two main types of cultural tourists in terms ofmotivation: those motivated by culture and those motivated by leisure. One type of cultural touristis motivated by culture; that is, they view the trip as an opportunity for personal development andexperiences that allow the achievement of that objective. Conversely, occasional cultural tourists,or cultural tourists by chance, are not motivated by culture, but rather see the trip as a leisureexperience [37]. Other authors (e.g., [39]) have also analyzed tourists’ motivations for making a culturalvisit, contributing to a profile of this type of visitor characterized by high income level and motivatedby other cultural initiatives such as attending a festival, visiting monuments or meeting people fromcultures and places, with determining factors including origin, age or educational level. Other relevantfeatures of the cultural tourist include his/her openness to encounters with local residents [10], higherlevel of education [40], higher income level [30], as well as certain sociodemographic characteristicsthat are the subject of this research. Some authors claim that the profile of the cultural tourist in Spainis of average age (between 25 and 44 years old), without a significant difference between the sexes, anddemanding very short stays [35]. The main objective of this research is to determine the profile of the
47

Sustainability 2019, 11, 6774
tourist that travels to these areas of heritage interest in terms of their sociodemographic characteristics,but regardless of the reason for the trip.
2.3. Tourist Satisfaction and Sociodemographic Characteristics of Cultural Tourists
Cultural tourism is a popular target of tourism policymakers because it supposedly attractshigh-quality, high-value tourists while providing economic support for the local culture. This growinginterest in tourists visiting cultural attractions is partly out of necessity, and also due to the fact thatcultural tourism is seen as an important growing market [41]. The positive trends observed in theincrease in cultural tourism together with the profile of tourists interested in cultural heritage arelinked to a need to revitalize the cultural heritage sector [42]. In this sense, it is important to take intoaccount the profile of the tourist, as it has been shown that their sociodemographic characteristicscan define not only cognitive and affective responses, but also behavioral responses [9]. For example,gender is known to influence information processing strategies [43], while the image of the destinationis influenced by age, income, gender, race, nationality and education [44–47]. Another example is thestudy by [48], who finds gender differences in expectations regarding sustainable practices, while in asubsequent study [49] she reports similar differences in consumer-based brand equity.
On the other hand, the review of the relevant literature shows that tourism researchers have carriedout extensive studies to analyze the dependence of tourist satisfaction on their sociodemographiccharacteristics [50]. It has been assumed that culture influences tourism behavior, but due to thedifficulty of measuring cultural values directly at the individual level, the relationship between thetourist’s cultural profile, taking into account some sociodemographic variables, and their satisfactionafter the visit has not yet been tested empirically.
The concept of satisfaction in tourism, or tourist satisfaction can be understood as the differencederived from the comparison between the individual’s expectations and his/her actual touristexperience [22,51,52]. In this study, satisfaction is defined as the overall satisfaction of a touristwith the visit experience in a cultural heritage site [6]. Furthermore, satisfaction positively affectsbehavioral intentions. This can be interpreted as satisfied tourists being more likely to have behavioralintentions to make a return visit or return to the heritage site. However, some studies (e.g., [53]) havesuggested that not all the attributes of the products or services are equally relevant when it comesto interpreting customer satisfaction. Other authors (e.g., [18]) conclude that the level of satisfactiondepends on the human factor and the assessment of the accessibility of the services provided, withthe former being where satisfaction is most evident. Therefore, in cultural tourism, quality andthe provision of resources plays an extremely important role in determining tourist satisfaction.Previous studies show how the level of satisfaction with visiting a place is the result of different factorsevaluated by the comparison between the tourist’s perceptions of the product or service receivedduring the visit and their expectations prior to the visit, and influenced by their sociodemographiccharacteristics [54,55]. In short, the tourist can have different levels of satisfaction [22], depending inpart on the characteristics of the visitor; hence the interest in this study in analyzing this relationship.
Having theoretically analyzed satisfaction as a dependent variable in this research, thesociodemographic factors of tourists that can influence their level of satisfaction are examined,and specifically the items used to measure each factor. To this end, a total of five hypotheses areproposed, based on the theoretical framework detailed below.
Gender, employment status, level of education, income and age are individual-level variables thatplay a specific role in the perception of tourist destinations [45,56–58]. Numerous studies (e.g., [46,58])have suggested how these variables significantly influence tourists’ perceptions and can be considereda filter, such that the perception varies according to the person or tourist [58]. For example, someauthors, such as [59], have found significant differences in tourist satisfaction with respect to gender.Others such as [39] argue that women are more attracted to tourism resources than men, which is whythey tend to have a higher level of satisfaction [21]. Regarding age, tourists’ degree of satisfaction alsodiffers in relation to this characteristic. For example, [21] suggest that older people have a higher level
48

Sustainability 2019, 11, 6774
of satisfaction than younger people. Others such as [20] reach the conclusion that age has an influenceon certain variables relating to satisfaction, especially in tourists aged over 45. In general, numerousresearchers (e.g., [57]) have shown that the age of the tourist affects their perception of a destinationand their post-visit satisfaction. Nevertheless, others, such as [44], confirmed that the characteristics ofthe gender and income level have no such influence. Conversely, [58] show that tourists’ income leveland employment status are the factors that can most influence perceptions of a place, which may inturn be reflected in tourists’ level of satisfaction.
Regarding the latter arguments, the literature review reveals that there has been little tourismresearch to date that demonstrates how other sociodemographic characteristics influence touristsatisfaction. Some of the few examples include the study by [20], investigating the influence of gender,age and nationality on satisfaction; or that of [19], who examine the role played by age, gender, incomelevel of or salary, origin and employment status of the visitor in their degree of satisfaction. Apart fromage and gender, this study analyzes educational level, employment status and income level. Thus, inlight of the above, this research proposes the following hypotheses aimed at testing whether the profileof the tourist makes a difference to the satisfaction of their visit:
Hypothesis 1. There are differences in the satisfaction of the cultural tourist with respect to gender.
Hypothesis 2. There are differences in the satisfaction of the cultural tourist with respect to age.
Hypothesis 3. There are differences in the satisfaction of the cultural tourist with respect to the highest levelof education.
Hypothesis 4. There are differences in the satisfaction of the cultural tourist with respect to employment status.
Hypothesis 5. There are differences in the satisfaction of the cultural tourist with respect to income level.
3. Materials and Methods
3.1. Description of the Site
The city of Segóbriga is the most important archaeological site on the southern plateau in Spain,and one of the best preserved Roman cities from the western Roman Empire. This archaeologicalpark is highly appreciated as a sustainable tourist destination. There are also many other attractionslocated not only in the Cuenca capital, but also in the surrounding area (Uclés, Ercávica, Valeria, etc.).The findings of the archaeological excavations that have been carried out over time have helped toillustrate the history of this site. The enclave stands out not only due to its archaeological interest butalso the surrounding landscape, because the landscape physiognomy remains essentially the same asit was in Roman times. Visitors can thus enjoy the walk through the archaeological remains and at thesame time admire a natural environment of remarkable beauty.
3.2. Research Instrument and Data Collection
The review of the literature on satisfaction has provided theoretical guidance on how to measurethis variable, and this study has subsequently used indicators and factors drawn from previous research(e.g., [17–20]. The measurement of this variable is based on a number of factors, which in turn are madeup of several items. The first factor, overall satisfaction (factor 1), was taken from the study by [60],where tourists had to “indicate their overall satisfaction with the experience in this archaeologicaldestination”. This factor could be considered the most relevant. Together with the assessment ofoverall satisfaction, a more specific, individual scale was constructed to analyze visitor satisfactionwith all the services provided by the park, such that the tourist evaluated their experience by indicatingtheir degree of satisfaction or dissatisfaction with 24 items, giving rise to a total of five more factors:(2) road infrastructure, (3) the hotel infrastructure, (4) restoration infrastructure, (5) conservation of
49

Sustainability 2019, 11, 6774
the site and (6) the information received and the treatment from the staff. This scale was constructedby selecting some of the items used by [17,18] in their research. To measure both overall satisfactionand these last five factors, a five-point scale was used, ranging from 1 for “very unsatisfied” to 5 for“very satisfied”.
All the questions that were used to measure these factors were included in a questionnaire writtenbased on an exhaustive review of the literature and the specific characteristics of the destination understudy. The questionnaire was used to gather information from site visitors after their visit. The datawas collected over four consecutive weekends during the months of April and May 2017. A total of408 questionnaires were given out to tourists aged 18 and over, Previously, a pilot test was conductedin order to refine the questionnaire and make the necessary changes.
3.3. Data Analysis
The analyses in this research were carried out with SPSS Statistics 24.0 software. First, exploratoryfactor analysis (EFA) was carried out using the Varimax rotation method, the aim of which was tovalidate the scale for each variable or factor that measures satisfaction.
After validating these scales, a univariate analysis of variance (ANOVA) was performed,which reveals the differences between the means of a continuous dependent variable andcategorical independent variables. In this case, the sociodemographic variables have been takenas independent variables, while the dependent variables are each of the items comprising thefactors that measure satisfaction; that is, the dependent variable is the tourist’s post-visit satisfaction.See supplementary materials.
4. Empirical Results
Based on the results obtained from the EFA (through Varimax rotation), the scale for each variableor factor measuring satisfaction can be validated. Of the six factors mentioned above, this analysisvalidated only three (Table 2): (1) the overall satisfaction with the visit (measured with only oneitem), (2) satisfaction with the road, hospitality, restoration and conservation infrastructure (measuredwith 12 items) and (3) satisfaction with the accessibility of tourist information and treatment received(measured with 12 items).
The analysis of the data obtained through the questionnaires answered by the 408 tourists surveyedafter their visit to Segóbriga, revealed that 55.4% were women and 44.6% were men. As for the mostcommon place of origin of the respondents, 50.7% were from the Madrid region, 15% from Castilla-LaMancha and 13.5% from the Valencian Community. Most visitors were aged between 40 and 59 years,67.9% of the total sample, with the youngest age range—between 18 and 25 years old— accounting for3.4% of the total. Regarding respondents’ level of education, most had higher education, with morethan half of the sample, 63%, holding a university degree and 5.1% also holding a doctorate. Touristswho do not have any type of studies represents only 0.5%. These figures confirm that almost all visitorshave the highest level of education. Regarding the employment status of visitors, salaried workers arein first place (32.6%), followed by the group of public officials (18.6%), workers with titling (15.7%) andself-employed workers (11%). Of all the respondents, 29.2% have a gross annual income in the rangeof €15,000 to €30,000, while 56.4% exceed €30,000 per year. Those that report an annual income of lessthan € 15,000 represent 14.5% of the total. In conclusion, the profile of the tourist visiting Segóbriga canbe described as usually a female, between 40 and 59 years old, who works, with a fairly high incomeand highest level of education.
The ANOVA analysis has been used to accept or reject the null hypothesis (H0) of independencebetween the variables. In parallel, the Chi-square test was also performed (bilateral asymptoticsignificance) to corroborate the differences between the mean scores of these factors.
50

Sustainability 2019, 11, 6774
Table 2. Factors for measuring satisfaction and individual items.
Factors Item Loadings Variance % Cronbach α 1 KMO 2 Sig.(Significance)
Overall satisfaction Overall visit satisfaction 1.000 100 N/A N/A N/A
Satisfaction with road,hotel, restoration andconservationinfrastructure.
Area where it is located 0.320
40.75 0.710 0.714 0.00
Public transport 0.506
Private transport 0.712
Internal Accesses 0.387
Restaurants 0.814
Accommodation and hotels 0.781
Structures of the site 0.639
Museum 0.657
Historical buildings 0.595
Maintenance 0.712
Cleanliness 0.759
Security service of the site 0.442
Satisfaction with accessto tourist informationtourist and treatmentreceived
Park information 0.625
74.73 0.829 0.838 0.00
Information on leisureactivities in the area 0.485
Information on local customs 0.409
Information aboutlocal cuisine 0.658
Festival Information 0.794
Concert Information 0.850
Information on crafts 0.707
Folklore information 0.795
Guided tours 0.564
Personal treatment received 0.707
Quality of life in the area 0.696
Park access price 0.563
Source: authors’ own elaboration.
Table 3 shows the results of the ANOVA analysis of the independence of the satisfaction variable,measured through three factors composed of a total of 25 items regarding the sociodemographiccharacteristics under study. These results also allow an evaluation of tourists’ average overallsatisfaction with their experience of visiting the archaeological park, which is 4.4 out of 5.
51

Sustainability 2019, 11, 6774
Ta
ble
3.
Res
ults
ofth
eA
NO
VAan
alys
is:s
ocio
dem
ogra
phic
char
acte
rist
ics—
sati
sfac
tion
.
Fa
cto
rsIt
em
Ge
nd
er
Ag
eS
tud
ies
Em
plo
ym
en
tIn
com
e
FS
ig.
FS
ig.
FS
ig.
FS
ig.
FS
ig.
(1)O
vera
llsa
tisf
acti
onO
vera
llsa
tisf
acti
onw
ith
the
visi
t3.
130.
077
0.59
80.
616
0.55
70.
764
0.98
40.
453
0.55
40.
696
(2)S
atis
fact
ion
wit
hro
ad,h
otel
,res
tora
tion
and
cons
erva
tion
infr
astr
uctu
re.
Are
aw
here
itis
loca
ted
2.51
0.11
30.
422
0.73
71.
720.
113
0.84
20.
578
1.83
0.12
1
Publ
ictr
ansp
ort
0.79
90.
372
0.53
90.
656
1.06
0.38
10.
729
0.68
21.
010.
402
Priv
ate
tran
spor
t0.
279
0.59
81.
260.
286
3.49
0.0
02
2.48
0.0
09
3.02
0.0
18
Inte
rnal
acce
sses
0.20
10.
654
1.74
0.15
61.
520.
170
1.23
0.27
00.
598
0.66
4
Res
taur
ants
0.07
20.
789
1.71
0.16
31.
150.
329
1.96
0.0
42
2.67
0.0
32
Acc
omm
odat
ion
and
hote
ls0.
085
0.77
13.
480
.01
61.
880.
083
1.81
0.06
42.
390
.05
0
Stru
ctur
esof
the
site
0.35
70.
551
2.24
0.08
30.
670.
999
1.28
0.24
20.
431
0.78
6
Mus
eum
2.36
0.12
50.
492
0.68
80.
167
0.98
50.
774
0.64
12.
320.
056
His
tori
calb
uild
ings
1.49
0.22
22.
370.
070
1.19
0.30
81.
930
.04
60.
645
0.63
1
Mai
nten
ance
3.42
0.06
51.
720.
162
0.36
00.
904
0.60
70.
791
0.41
90.
795
Cle
anlin
ess
2.06
0.15
10.
249
0.86
20.
927
0.47
51.
190.
296
5.78
0.0
00
Site
secu
rity
serv
ice
0.00
10.
976
0.56
90.
636
1.58
0.15
01.
720.
081
1.33
0.25
6
(3)S
atis
fact
ion
wit
hac
cess
toto
uris
tin
form
atio
nto
uris
tand
trea
tmen
trec
eive
d.
Park
info
rmat
ion
1.20
0.27
30.
938
0.42
21.
370.
225
1.34
0.21
23.
550
.00
7
Info
rmat
ion
onle
isur
eac
tivi
ties
inth
ear
ea1.
930.
165
3.80
0.0
10
0.71
20.
640
0.75
10.
662
0.58
30.
675
Info
rmat
ion
onlo
calc
usto
ms
2.45
0.11
80.
737
0.53
11.
230.
287
1.84
0.05
91.
590.
175
Info
rmat
ion
abou
tloc
alcu
isin
e0.
077
0.78
13.
230
.02
22.
330
.03
22.
450
.01
08.
310
.00
0
Fest
ival
Info
rmat
ion
2.02
0.15
63.
570
.01
42.
270
.03
61.
640.
098
8.13
0.0
00
Con
cert
Info
rmat
ion
3.35
0.06
82.
650
.04
81.
020.
410
0.81
60.
602
5.31
0.0
00
Info
rmat
ion
oncr
afts
0.26
60.
607
0.84
40.
471
0.29
30.
940
0.91
50.
512
3.00
0.0
18
Folk
lore
info
rmat
ion
6.83
0.0
09
1.16
0.32
22.
520.
958
0.97
80.
461
3.07
0.0
16
Gui
ded
tour
s0.
050.
822
0.93
90.
422
0.38
20.
890
0.81
60.
601
0.99
80.
409
Pers
onal
trea
tmen
trec
eive
d0.
000
0.98
61.
820.
142
0.96
90.
446
0.84
60.
574
0.16
30.
957
Qua
lity
oflif
ein
the
area
1.80
0.18
01.
670.
172
1.29
0.26
01.
310.
230
2.37
0.0
51
Park
acce
sspr
ice
0.80
00.
371
4.81
0.0
03
0.83
70.
542
3.75
0.0
00
5.81
0.0
00
Sour
ce:a
utho
rs’o
wn
elab
orat
ion.
Bold
valu
esar
esh
owin
gsi
gnifi
cant
diff
eren
ces.
52

Sustainability 2019, 11, 6774
On the other hand, the Chi-square test reveals the following points in relation to the results of theANOVA analysis presented in Table 3:
(a) Gender: of all the tourists surveyed in the archaeological park, women report a greaterdegree of satisfaction than men. The results of the ANOVA show that there are significant differencesbetween men and women for only a single item of the 25 considered to assess satisfaction; namely, thesatisfaction of the tourist regarding access to information on local folklore (an item corresponding tofactor 3). Therefore, said analysis reveals that the rest of the factors of satisfaction (road, hospitality,restoration and conservation infrastructure and overall satisfaction) do not present differences withrespect to gender. However, the results of the Chi-square statistic show significant differences withrespect to gender for two of the items corresponding to factor 3. These are access to information ontheater festivals (sig 0.02) and the concerts held in the park (sig 0.05). This finding partly coincides withthe study by [20] on the city of Madrid as a tourist destination, where the only significant differencesfound between men and women were in the satisfaction in the access to tourist information about saiddestination. Regarding the tourists’ overall satisfaction (factor 1), this statistic does show differenceswith respect to gender (sig 0.025). Therefore, it can be confirmed that research hypothesis H1 isaccepted; even though it is measured with only one factor, it refers to the overall satisfaction with thevisit to the park, and so it can be confirmed that gender influences the satisfaction of the tourist.
(b) Age: the analysis of the influence of age on satisfaction reveals significant differences in thefollowing items: accommodation and hotels (items corresponding to factor 2), access to information oncuisine, leisure activities in the area, concerts, festivals and the price of the entrance to the park (itemscorresponding to factor 3). These results were also checked with the Chi-square test, corroboratingthat all of these are dependent on age. The latter test also adds others not identified by the ANOVAanalysis: accommodations and hotels (sig 0.003) site structures (sig 0.001) and historical buildings (sig0.001) (corresponding with factor 2); and access to information on local customs (sig 0.02), cuisine (sig0.002), festivals (sig 0.004), concerts (0.019), crafts (sig 0.008), guided tours through the park (sig 0.029),personal treatment received (sig 0.000) and the price of access to the site (sig 0.005) (all correspondingto factor 3). Regarding factor 1, the overall satisfaction of the tourist, the ANOVA analysis did notfind a substantial difference. The latter finding was also corroborated with the Chi-square statistic(sig 0.673). Based on these results, research hypothesis H2 cannot be accepted. Therefore, age doesnot influence the degree of satisfaction. The results were similar in the related study by [20], as theseauthors came to the conclusion that the degree of satisfaction with access to tourism information andaccessibility does not present differences in relation to age. This result was also confirmed by the studyby [19], who indicate that the tourist’s age does not affect their level of satisfaction.
(c) The highest level of education (studies): as shown in the ANOVA results in Table 3, thischaracteristic of tourists has an influence on three elements used to measure satisfaction with the visitto the archaeological park of Segóbriga. These items are the access to the site via private transport(item corresponding to factor 2 of satisfaction), access to information on local cuisine and on festivals(factor 3). Regarding factor 1, overall satisfaction, this analysis does not confirm a relationship betweenthis variable and the tourist’s educational level. This finding is corroborated by the Chi-square statistic(sig 0.212). After applying the Chi-square test to check the ANOVA for factors 2 and 3 according tothe tourist’s level of education, the results confirmed a relationship between this sociodemographiccharacteristic and the following items: internal access (sig 0.000) and cleanliness (sig 0.024) (factor 2);and access to park information (sig 0.44), cuisine (sig 003), festivals (sig. 0.003), crafts (sig 0.04) andquality of life in the area (sig 0.02) (factor 3). Based on these results, H3 is not accepted. The findingsrelated to this hypothesis could not be compared with other studies, since to date there have been nosuch studies; namely, analyzing whether the tourist having the highest level of education influencestheir level of satisfaction.
(d) Employment status: Regarding factor 1, the overall satisfaction of the tourist, the ANOVAanalysis does not present independence regarding the work situation of the tourist. This was verifiedwith the Chi-square test, which corroborated that there are no significant differences (sig 0.422). As for
53

Sustainability 2019, 11, 6774
the other two factors that measure satisfaction, of the 24 items used, the ANOVA finds significantdifferences for only for 5 items with respect to the employment status of the tourist. Regarding factor2, differences are found regarding access to the park via private transport, restaurants and historicalbuildings. Regarding factor 3, there are differences in the access to information on local cuisine and theprice of the entrance. These findings were checked with the Chi-square test, which ultimately onlycorroborated the access to the park by private transport (sig 0.00), historical buildings (sig 0.48), thesecurity service (0.028) and the accesses inside the park (sig 0.002) (factor 2); access to informationon local cuisine (sig 0.000), access to information on local customs (sig 0.028), festival information(sig 0.013), and the quality of life in the area (sig 0.004) (factor 3). In view of the results, it can be saidthat H4 is not accepted; that is, the tourist’s employment status does not influence their satisfaction.These are quite the opposite of the results obtained by [58], who showed that the tourist’s level ofincome and employment status are the factors that most influence their perception of a place, whichin turn could be reflected in the level of tourist satisfaction. Others such as [19], showed that thetourist’s employment status or job situation can have a negative impact on their level of satisfaction;for example, if they are a student or unemployed.
(e) Income level: unlike the characteristics addressed above, the ANOVA analysis finds thatthe tourist’s level of income has the greatest influence on their degree of satisfaction with the itemsmeasured in factors 2 and 3; indeed, the ANOVA does not find any dependence between the overallsatisfaction of the tourist (factor 1) and level of income. The relevant items in factor 2 are: access tothe park via private transport, restaurants, accommodation and hotels and cleanliness of the facilities.The items in factor 3 are: access to park information, access to information on local cuisine, concerts,festivals, folklore, craftsmanship, the quality of the area in which it is located and the price of admissionto the enclosure. These results were corroborated with the Chi-square test, which confirmed thatfactor 1 does not show a significant difference with respect to the level of income (sig 0.323), but doeswith respect to some items of factors 2 and 3. This test confirmed that there is dependence betweenincome level and the following items corresponding to factor 2: accesses inside the park (sig 0.019),structures of the site (sig 0.000), museum (sig 0.000), historical buildings (sig 0.000), maintenance(0.049), cleanliness (sig 0.000) and the security service on the premises (sig 0.019). The Chi-square testalso showed dependence between income level and the following items from factor 3: the access toinformation on the park (sig 0.025), local customs (sig 0.000), cuisine (sig 0.000), theater festivals (sig0.000), concerts (sig 0.001), crafts (sig 0.013), folklore (sig 0.003), guided tours of the site (sig 0.000); aswell as the personal treatment received (sig 0.000), the quality of life in the area (sig 0.000) and the priceof the entrance to the site (sig 0.000). In view of these results, that is, since most of the items are foundto be dependent on this variable—although it is not the case regarding the overall satisfaction of thetourist (factor 1)—it could be claimed that tourists’ income level influences their level of satisfaction;thus, H5 can be accepted.
5. Discussion
The results obtained indicate which sociodemographic variables affect the satisfaction of thecultural tourist, and contradict some of the research carried out so far. The results on gender obtainedin this study are contrary to those of [19], who reported that gender has no effect on tourists’ level ofsatisfaction. However, the results obtained regarding age confirmed the study by [19], who indicatedthat the tourist’s age does not have any effect on their level of satisfaction.
On the other hand, it was found that having the highest level of education does not influencetourists’ level of satisfaction. However, this finding could not be compared with other studies, since noother analyses to date have focused on this element.
Regarding the results obtained on employment status, they contradict the study by [58], whoshowed that tourists’ level of income and employment status are the factors that most influence theperception of a place, which in turn may be reflected in the level of tourist satisfaction. Others such
54

Sustainability 2019, 11, 6774
as [19] showed that the tourist’s employment status or job situation of the tourist can have a negativeimpact on their level of satisfaction, for example, in the case of being a student or being unemployed.
Likewise it was found that tourists’ income level influences their level of satisfaction. The samefinding was reported in the investigation carried out by [19], where the level of income was foundto have a positive influence on tourist satisfaction. This could confirm the hypothesis that a morepositive degree of satisfaction is associated with a higher salary. As commented above, the studyby [58] showed that income level and employment status are the characteristics of the tourist that canmost influence their level of satisfaction.
Finally, the results show a relationship between certain variables (sociodemographiccharacteristics-satisfaction), in line with those reported in other studies (e.g., [22,61]). In this case,important differences in overall satisfaction (factor 1) are only found with respect to gender (H1):women are more satisfied with the visit than men. On the other hand, the level of income is thevariable that most influences satisfaction with the items corresponding to the other two factors used tomeasure satisfaction (H5): (2) satisfaction with road, hotel, restaurant and restoration infrastructure;and (3) satisfaction with information accessibility tourist and received treatment). Very different andcontrary results have been obtained with the rest of the sociodemographic characteristics, such asage, employment status and the highest level of education, which have hardly influenced any item.Therefore, are not accepted of H2, H3 and H4.
At the same time, the investigation also identified the Segóbriga tourist (complete cultural tourist)as a middle-aged person (between 40 and 59 years), usually a woman, with higher education, a fairlyhigh income level and a salaried employee. Thus, the results from this study enable a definition ofthe tourist who visits Segóbriga, the profile coincides with the first type of cultural tourist in theclassification proposed by [34].
6. Conclusions
The data obtained on tourism in Spain reflects the fundamental role played by cultural tourismin the attractiveness of tourist destinations. Therefore, an important part of the tourism product isculture, which can increase the competitiveness of a destination. Culture should thus be appreciatedas an element of major importance when creating a tourism product that reinforces sustainabletourism development.
The review of the literature provided some theoretical inferences about the places that have arich heritage and cultural wealth, and how these become sustainable tourist resources for the areain which they are located. Cultural tourism offers an alternative to the traditional “sun and sand”tourism, which has been hugely popular but is currently losing ground to other types of travel activitythat address other interests. The need thus arose to study a heritage site such as the archaeologicalpark of Segóbriga.
The objective was to analyze tourists’ satisfaction with the services provided in the park, assessingthe degree to which sociodemographic characteristics influence that satisfaction. That is, the objectivewas to identify the relationships between tourist satisfaction and sociodemographic variables, inparticular age, gender, level of education, employment status and income level.
The results show that profile of the typical tourist visiting Segóbriga is a complete cultural tourist.Thus, it can be seen that the tourist who visits this archeological park is one who seeks a much deepercultural experience, with culture being the main reason for his/her visit. Indeed, the location ofSegóbriga means that it is a place where tourists would only visit if they had specifically plannedto go there; that is, the tourist knows perfectly well what they are looking for with a visit to thispark—culture. On the other hand, the results shown that cultural tourism rests on a visitor profilethat demands good infrastructure, a good provision of guides and information (panels, reenactments,museums) on the park, and mid-level accommodation and catering services. It is worth taking allthese characteristics of the tourist profile into account, in order to ensure the loyalty and satisfaction oftourists to the archaeological park, and thus support the sustainable economic development of the area.
55

Sustainability 2019, 11, 6774
Some practical implications can thus be offered. Tourists are becoming increasingly well-informed,more demanding and with a more multimotivational profile. Their loyalty is not guaranteed and thereis growing competition aimed at capturing that loyalty; as such, the management of any destinationshould strive to meet the multiple motivations and interests of tourists. The cultural tourist may havea special responsiveness to the place he/she visits, however the underlying motivation is driven byleisure or free time. Thus, as far as services are concerned, the implementation of more completeinterpretation centers along with the application of new technologies would be a worthwhile initiativefor these types of cultural destinations.
Based on the results obtained, a revitalization plan can be proposed for the Segóbriga archaeologicalpark, involving specific action plans for improvement, both in the services offered and in the image,and aimed at the creation of a high-quality sustainable tourism product. In short, in order to positivelyinfluence the tourists’ behavioral intentions, heritage managers should make it a priority to ensurehigh experiential quality that creates satisfactory experiences for tourists, meaning that they perceivethe visit as good value and leave with a good impression of the cultural heritage site.
Regarding future lines of research, this research is only a first step towards a complete analysis ofsociodemographic factors and satisfaction. Future research should develop complementary indicators toanalyze the effects of different socioeconomic and demographic factors of the tourist on their satisfaction,as well as other variables such as the motivation for their visit. Regarding the socioeconomic anddemographic variables, studies could examine the tourist’s culture, place of origin, whether they are aresident in the areas near the site, whether they are staying overnight in the area, etc. In this way, amore complete profile of the cultural tourist could be defined. Such a study could also shed new lighton problems to be addressed in order to improve tourism in the area where this archaeological park islocated. It could also be worth studying other archaeological sites with the same characteristics locatedin different countries, thus enabling a comparison between them, and providing valuable informationon the competitiveness of heritage sites. Another interesting aspect is the analysis of the role that localresidents play in the satisfaction of visitors to Segóbriga.
The limitations of this study relate to the selection of variables; it would have been interesting tostudy the role of the cultural tourist’s motivations and emotions that set them apart from other typesof tourist. There are many such variables, as well as the relationships between them, which have notbeen included in this study; some of these may represent future lines of research.
Supplementary Materials: The following are available online at http://www.mdpi.com/2071-1050/11/23/6774/s1,questionnaire, exploratory factor analysis (EFA) and univariate analysis of variance (ANOVA). Table 1. Types ofcultural tourists, Table 2. Factors for measuring satisfaction and individual items, Table 3. Results of the ANOVAanalysis: sociodemographic characteristics—satisfaction.
Author Contributions: All authors contributed equally to the research.
Funding: This research received no external funding.
Conflicts of Interest: The authors declare no conflicts of interest.
References
1. Ministry of Energy and Tourism. Consultada el 15 de Enero de 2019. Available online:http://www.minetad.gob.es/es-ES/GabinetePrensa/NotasPrensa/2019/Paginas/Espa%C3%B1alograunr%C3%A9corddellegadasen2017con82millonesdeturistasinternacionales.aspx (accessed on 15 January 2019).
2. García, R.M.R.; Espinosa, E.O.C.; Ruiz, J.A.C. Propuesta de las competencias profesionales en turismo desdeel enfoque del empleador/Proposal of Professional Competencies in Tourism from the employer’s approach.RIDE Rev. Iberoam. Investig. Desarro. Educ. 2019, 9, 195–214.
3. Gómez, M.; Imhoff, B.; Martín-Consuegra, D.; Molina, A.; Santos-Vijande, M.L. Language tourism: Thedrivers that determine destination choice intention among US students. Tour. Manag. Perspect. 2018, 27,125–135. [CrossRef]
4. Radosavljevic, U.; Kuletin Culafic, I. Use of Cultural Heritage for Place Branding in Educational Projects:The Case of Smederevo and Golubac Fortresses on the Danube. Sustainability 2019, 11, 5234. [CrossRef]
56

Sustainability 2019, 11, 6774
5. UNESCO. International Conference “Innovative Policies for Heritage Safeguarding and CulturalTourism Development”. 2005. Available online: https://whc.unesco.org/en/events/258/ (accessed on15 November 2019).
6. Chen, C.F.; Chen, F.S. Experience quality, perceived value, satisfaction and behavioral intentions for heritagetourists. Tour. Manag. 2010, 31, 29–35. [CrossRef]
7. Brida, J.G.; Monterubbianesi, P.D.; Zapata-Aguirre, S. Determinantes del grado de satisfacción en la visita aun atractivo cultural: El Caso del Museo de Antioquia-Colombia. Estud. Perspect. Tur. 2013, 22, 729–744.
8. Moualla, Y.; McPherson, G. Making Change towards Inclusive Societies: The Soft Power of CommunityArchaeology in Building Cultural Heritage in Mozan, Syria. Sustainability 2019, 11, 4670. [CrossRef]
9. Aleshinloye, K.D.; Fu, X.; Ribeiro, M.A.; Woosnam, K.M.; Tasci, A.D. The Influence of Place Attachmenton Social Distance: Examining Mediating Effects of Emotional Solidarity and the Moderating Roleof Interaction. 2019. Available online: https://journals.sagepub.com/doi/abs/10.1177/0047287519863883(accessed on 15 November 2019).
10. Patwardhan, V.; Ribeiro, M.A.; Payini, V.; Woosnam, K.M.; Mallya, J.; Gopalakrishnan, P. Visitors’ PlaceAttachment and Destination Loyalty: Examining the Roles of Emotional Solidarity and Perceived Safety.2019. Available online: https://journals.sagepub.com/doi/abs/10.1177/0047287518824157 (accessed on16 November 2019).
11. Tasci, A.D.; Severt, D. A triple lens measurement of host–guest perceptions for sustainable gaze in tourism.J. Sustain. Tour. 2017, 25, 711–731. [CrossRef]
12. Torralba, L.T. La dimensión turística del patrimonio cultural de la ciudad de Lorca (Murcia, España). Cuad.Tur. 2015, 36, 389–414. [CrossRef]
13. Folgado Fernández, J.A.; Di Clemente, E.; Hernández Mogollón, J.M.; Campón Cerro, A.M. Influencia de laimagen del destino en el comportamiento del turista cultural. Un estudio empírico en la ciudad de Plasenciacomo destino de turismo cultural. Rev. Estud. Econ. Empres. 2013, 25, 91–114.
14. Van der Ark, L.A.; Richards, G. Attractiveness of cultural activities in European cities: A latent class approach.Tour. Manag. 2006, 27, 1408–1413. [CrossRef]
15. Pulido-Fernández, J.I.; Sánchez-Rivero, M. Attitudes of the cultural tourist: A latent segmentation approach.J. Cult. Econ. 2010, 34, 111–129. [CrossRef]
16. Silberberg, T. Cultural tourism and business opportunities for museums and heritage sites. Tour. Manag.1995, 16, 361–365. [CrossRef]
17. Devesa Fernández, M.; Laguna García, M.; Palacios Picos, A. Un modelo estructural sobre la influencia delas motivaciones de ocio en la satisfacción de la visita turística. Rev. Psicol. Trab. Organ. 2008, 24, 253–268.[CrossRef]
18. Devesa Fernández, M.; Laguna García, M.; Palacios Picos, A. Motivación, satisfacción y lealtad en el turismo:El caso de un destino de interior. 2010. Available online: http://reme.uji.es/articulos/numero35/article9/article9.pdf (accessed on 15 January 2019).
19. Perovic, Đ.; Stanovcic, T.; Moric, I.; Pekovic, S. What socio-demographic characteristics do influence the levelof tourist’s satisfaction in Montenegro? Empirical analysis. Rev. Tur. Stud. Cercet. Tur. 2012, 14, 5–10.
20. Cordero, V.B.; Duque, C.M.; Muñoz, J.J.F.; Pocinho, R.F.D.S. Relaciones entre factoressociodemográficos-género-edad, nacionalidad, motivación y satisfacción turística: Análisis exploratorio enuna muestra de turistas de la ciudad de Madrid. Rev. Anál. Tur. 2015, 20, 39–45.
21. Assaker, G.; Hallak, R.; Assaf, A.G.; y Assad, T. Validating a Structural Model of Destination Image,Satisfaction, and Loyalty Across Gender and Age: Multigroup Analysis with PLS-SEM. Tour. Anal. 2015, 20,577–591. [CrossRef]
22. Yoon, Y.; Uysal, M. An examination of the effects of motivation and satisfaction on destination loyalty: Astructural model. Tour. Manag. 2005, 26, 45–56. [CrossRef]
23. Hunter, C. Sustainable tourism as an adaptive paradigm. Ann. Tour. Res. 1997, 24, 850–867. [CrossRef]24. Saarinen, J. Traditions of sustainability in tourism studies. Ann. Tour. Res. 2006, 33, 1121–1140. [CrossRef]25. Sharpley, R. Tourism Development and the Environment: Beyond Sustainability? Routledge: Abingdon, UK, 2009;
pp. 1–241.26. Lu, J.; Nepal, S.K. Sustainable tourism research: An analysis of papers published in the Journal of Sustainable
Tourism. J. Sustain. Tour. 2009, 17, 5–16. [CrossRef]
57

Sustainability 2019, 11, 6774
27. Weaver, D.B. Asymmetrical dialectics of sustainable tourism: Toward enlightened mass tourism. J. Travel Res.2014, 53, 131–140. [CrossRef]
28. Bunakov, O.A.; Zaitseva, N.A.; Larionova, A.A.; Chudnovskiy, A.D.; Zhukova, M.A.; Zhukov, V.A. Researchon the evolution of management concepts of sustainable tourism and hospitality development in the regions.J. Sustain. Dev. 2015, 8, 39. [CrossRef]
29. Niemczyk, A. Cultural tourists: “An attempt to classify them”. Tour. Manag. Perspect. 2013, 5, 24–30.[CrossRef]
30. Altunel, M.C.; Erkut, B. Cultural tourism in Istanbul: The mediation effect of tourist experience andsatisfaction on the relationship between involvement and recommendation intention. J. Destin. Mark. Manag.2015, 4, 213–221.
31. Richards, G. (Ed.) Cultural Attractions and European Tourism; CAB International: Wallingford, UK, 2001.32. Adams, G.D. Cultural tourism: The arrival of the intelligent traveler. Mus. News 1995, 74, 32–37.33. Hughes, H.L. Culture and tourism: A framework for further analysis. Manag. Leisure 2002, 7, 164–175.
[CrossRef]34. McKercher, B.; Du Cros, H. Cultural Tourism: The Partnership between Tourism and Cultural Heritage Management;
Routledge: Abingdon, UK, 2002.35. Caro, J.L.; Luque, A.; Zayas, B. Nuevas tecnologías para la interpretación y promoción de los recursos
turísticos culturales. Pasos Rev. Tur. Y Patrim. Cult. 2015, 13, 931–945.36. Hierro, J.A. Activos culturales y desarrollo sostenible: La importancia económica del Patrimonio Cultural.
Política Soc. 2013, 50, 1133–1148.37. Mckercher, B.; Du Cros, H. Testing a cultural tourism typology. Int. J. Tour. Res. 2003, 5, 45–58. [CrossRef]38. Mckercher, B.; Ho, P.; Du Cros, H. Relationship between tourism and cultural heritage management: Evidence
from Hong Kong. Tour. Manag. 2005, 26, 539–548. [CrossRef]39. Kim, S.S.; Lee, C.K.; y Klenosky, D.B. The influence of push and pull factors at Korean national parks. Tour.
Manag. 2003, 24, 169–180. [CrossRef]40. Gregori PE, M.; Jarauta, N.G. Perfil del turista cultural en ciudades patrimoniales: Los casos de San Cristóbal
de La Laguna y Córdoba (España). Int. J. Sci. Manag. Tour. 2015, 1, 217–229.41. Richards, G. Cultural tourism. In Archaeological Displays and the Public; Routledge: Abingdon, UK, 2016;
pp. 1–11.42. Jelincic, D.A.; Mansfeld, Y. Applying Cultural Tourism in the Revitalisation and Enhancement of Cultural
Heritage: An Integrative Approach. In Cultural Urban Heritage; Springer: Cham, Switzerland, 2019; pp. 35–43.43. Wolin, L.D.; Korgaonkar, P. Web advertising: Gender differences in beliefs, attitudes and behavior. Internet
Res. 2003, 13, 375–385. [CrossRef]44. Baloglu, S. A path analytic model of visitation intention involving information sources, socio-psychological
motivations, and destination image. J. Travel Tour. Mark. 2000, 8, 81–90. [CrossRef]45. MacKay, K.J.; y Fesenmaier, D.R. Pictorial element of destination in image formation. Ann. Tour. Res. 1997,
24, 537–565. [CrossRef]46. Tasci, A.D.A. Assessment of Destination Image Determinants Using a Multiple Regression Model. Tour. Rev.
2007, 62, 23–30. [CrossRef]47. Tasci, A.D.A.; Khalilzadeh, J.; Uysal, M. Network Analysis of the Caucasus’ Image. Curr. Issues Tour. 2017,
22, 827–852. [CrossRef]48. Tasci, A.D.A. Consumer demand for sustainability benchmarks in tourism and hospitality. Tour. Rev. 2017,
72, 375–391. [CrossRef]49. Tasci, A.D.A. Testing the cross-brand and cross-market validity of a consumer-based brand equity (CBBE)
model for destination brands. Tour. Manag. 2018, 65, 143–159. [CrossRef]50. Esu, B.B.; Arrey, V.M.E. Tourists’ satisfaction with cultural tourism festival: A case study of Calabar Carnival
Festival, Nigeria. Int. J. Bus. Manag. 2009, 4, 116. [CrossRef]51. Chon, K.S. The role of destination image in tourism: A review and discussion. Tour. Rev. 1990, 45, 2–9.
[CrossRef]52. Echtner, C.M.; Y Ritchie, J.R.B. The meaning and measurement of destination image. J. Tour. Stud. 1991, 2,
2–12.53. Varela Mallou, J.; Prat Santolària, R.; Voces López, C.; Rial Boubeta, A. Una nueva escala para la evaluación
de la calidad de los servicios de hostelería. Psicothema 2006, 18, 135–142. [PubMed]
58

Sustainability 2019, 11, 6774
54. Chon, K.S.; Olsen, M.D. Functional and symbolic congruity approaches to consumersatisfaction/dissatisfaction in tourism. J. Int. Acad. Hosp. Res. 1991, 3, 2–22.
55. Bigné, J.E.; Andreu, L. Modelo cognitivo-afectivo de la satisfacción en servicios de ocio y turismo. Cuad.Econ. Dir. Empresa 2004, 21, 84–120.
56. Ahmed, Z.U. The influence of the components of a state’s tourist image on product positioning strategy.Tour. Manag. 1991, 12, 331–340. [CrossRef]
57. Baloglu, S.; y McCleary, K.W. A model of destination image formation. Ann. Tour. Res. 1999, 26, 868–897.[CrossRef]
58. Beerli, A.; y Martin, J.D. Tourists characteristics and the perceived image of tourist destinations: A quantitativeanalysis—A case study of Lanzarote, Spain. Tour. Manag. 2004, 25, 623–636. [CrossRef]
59. Huh, J. Tourist Satisfaction with Cultural/Heritage Sites: The Virginia Historic Triangle. Ph.D. Thesis, VirginiaPolytechnic Institute and State University, Blacksburg, VA, USA, 2002.
60. Faullant, R.; Matzler, K.; Mooradian, T.A. Personality, basic emotions, and satisfaction: Primary emotions inthe mountaineering experience. Tour. Manag. 2011, 32, 1423–1430. [CrossRef]
61. Del Bosque, I.A.R.; San Martín, H.; Collado, J. The role of expectations in the consumer satisfaction formationprocess: Empirical evidence in the travel agency sector. Tour. Manag. 2006, 27, 410–419. [CrossRef]
© 2019 by the authors. Licensee MDPI, Basel, Switzerland. This article is an open accessarticle distributed under the terms and conditions of the Creative Commons Attribution(CC BY) license (http://creativecommons.org/licenses/by/4.0/).
59

sustainability
Article
Flamenco Tourism from the Viewpoint of ItsProtagonists: A Sustainable Vision Using LeanStartup Methodology
Maria Genoveva Millán Vázquez de la Torre 1,*, Salud Millán Lara 2 and
Juan Manuel Arjona-Fuentes 1
1 Department of Quantitative Methods, Faculty of Economics and Business Sciences, Universidad LoyolaAndalucía, Escritor Castilla Aguayo 4, 14004 Córdoba, Spain; [email protected]
2 Department of Economic, Faculty of Economics and Business Sciences, Universidad Loyola Andalucía,Escritor Castilla Aguayo 4, 14004 Córdoba, Spain; [email protected]
* Correspondence: [email protected]; Tel.: +34957222155; Fax: +34 957222100
Received: 18 September 2019; Accepted: 29 October 2019; Published: 31 October 2019���������������
Abstract: Flamenco is an art born in and inextricably associated with Andalusia in the south ofSpain. The purity, the feelings it transmits, and the originality of its expression have made it knownworldwide and it has been declared an Intangible Cultural Heritage by the UNESCO. This declaration,combined with the Spain’s tourist boom in the last years, has transformed this exclusive art into animportant tourist industry with all the entailing perils for its survival. By means of the Lean Canvasmodel, combined with a survey of a panel of flamenco experts (especially artists), this study analyzedthe fundamental factors that are key to developing a tourism product that, while respectful of itsessence, offers tourists a genuine and quality product.
Keywords: Flamenco art; Cultural tourism; flamenco tourism; lean canvas; lean startup
JEL Classification: A12; D19; O01; R10
1. Introduction
The public interest in art, history, and culture in general has led the tourism industry to recognizethe potential market niche of cultural tourism. However, cultural tourism cannot compete with Spain’ssun and beach tourism. In 2016, for instance, 64.5 million of Spain’s 75 million foreign tourists wereattracted by the sun and beach, while 9 million were drawn by cultural tourism [1]. Spain, nevertheless,offers varied cultural tourism of quantity and quality, with tangible and intangible resources includinghistorical, artistic and architectural heritage, museums, gastronomy, handicrafts, folklore, etc. Moreover,cultural tourism also fosters encounters between different customs and populations, giving rise tocultural contact [2].
Tourism is an essential industry for certain countries [3]. In Spain alone, it generates 11.4% of alljobs and 11% of the gross domestic product [1]. Spain’s expected growth for tourism in 2019 is 1.2%,higher than the average of other sectors. Hence, cultural tourism in recent years has tended towards amore selective tourism that, properly managed, avoids damaging the environment or the image ofthe destination.
The greatest growth in cultural tourism derives from new market niches. Its expansion resultsin a differentiation of submarkets that develop articulated and sustainable offerings, generatingbenefits for local communities while driving the market as a whole. The offers relate to architecture [4],gastronomy [5], literature [6], creativity [7], film [8], wine [9], industry [10], urbanism [11], shopping [12],
Sustainability 2019, 11, 6047; doi:10.3390/su11216047 www.mdpi.com/journal/sustainability61

Sustainability 2019, 11, 6047
science [13], language [14], religion [15], and flamenco [16]. All of these categories have been the objectof research by different authors [17].
The development of Spanish cultural tourism dates to the late 1990s when the Secretary of Statefor Tourism proposed the incorporation of cultural resources to diversify and deseasonalize tourism.Although Spain’s cultural wealth places it at the global forefront, it only captures a small share ofthe market and does not enjoy an image in accordance with its reality in foreign countries [18]. Abasic factor explaining this weakness is the lack of conversion of its cultural resources into products fitfor consumption, and it is affected by complications in cultural management, accessibility, advanceplanning, promotion, and lack of introduction into commercial channels.
New cultural tourism focuses on integrating production and consumption and increasing linksbetween suppliers and consumers. Instead of passive consumption, cultural tourists demonstratea proactive approach by actively participating in creating travel experiences. On the other hand,suppliers focus on close interaction with consumers and the co-creation of high-quality experiences [19],with flamenco as one of the segments where the international tourist is not merely a passive consumer,but an active player in Spanish culture in general, and in Andalusia in particular [20].
Our work aimed principally to obtain the opinion of a group of experts from the world of flamencoon the current situation of this art and on how to achieve sustainable development of flamenco tourismthat reconciles the essence of the art form and the necessary economic development. The opinions ofthese experts are not usually heard by the public institutions responsible for the promotion of flamencotourism. We sought to compile their improvement proposals and apply the Lean Canvas tool based onthe Lean Startup methodology. The Lean Canvas divides its modules into two clearly differentiatedblocks: one focused on the client, which in this particular case would be both national and internationalflamenco recipients, and another one focused on the product, where characteristics of the productas well as logistical requirements of its management, creation, and communication are incorporated,which in this case is about defining the requirements that flamenco art must meet in order to reachpotential customers, as well as management requirements to achieve the greatest success.
2. Popular Musical Expressions as Modes of Cultural Tourism
There are many definitions of cultural tourism, yet a review of the many studies defining it andits significance is not the objective of this paper. We simply based this study of tourism and flamencoon the definition of cultural tourism by Richards and Munsters [21]:
“All movements of persons to specific cultural attractions, such as heritage sites, artistic and culturalmanifestations, arts and drama outside their normal place of residence”.
Broadening this definition, the European Centre for Traditional and Regional Cultures (ECTARC)offers eight potential focal points of cultural tourism [22]:
(a) archaeological sites and museums;(b) architecture (ruins, famous buildings, whole towns);(c) art, sculpture, crafts, galleries, festivals, events;(d) music and dance (classical, folk, contemporary);(e) drama (theatre, films, dramatists);(f) language and literature, tours, events;(g) religious festivals, pilgrimages;(h) complete (folk or primitive) cultures and sub-cultures.
As noted in Point (d), music and dance, in their classical or contemporary form in popular folklore,are elements available for tourists as fundamental elements of the local heritage [23,24]. Hence, certaindestinations are unequivocally associated with popular music and dance (e.g., Cuba with salsa, BuenosAires with tango, Bali with Balinese dance, and Rio de Janeiro with samba) [25]. However, unlikeother cultural assets, music and dance are not mere elements of contemplation but are first-level
62

Sustainability 2019, 11, 6047
resources that arouse emotions, allowing the tourist to actively and inclusively experience the localculture [24,26].
Additionally, in an era where the internet allows immediate worldwide access to music and dance,the offer of live music emotion is an important resource for managers of tourist heritage, as well as forprivate promoters of festivals, performances, hotels, etc. [26,27].
A broad debate, therefore, ensues regarding the authenticity of the tourist offerings and theirrepresentativeness of the local musical culture. This issue takes on more weight as folklore representsthe patrimony and cultural heritage of a people where idiosyncratic historical, religious, and socialelements of the culture are arcane to foreigners. Tourists will, therefore, hardly be able to feel emotionswhen partaking something for which they are not prepared [28]. This leads to suspicion as tothe product’s authenticity, and to what degree the performance is adulterated and geared towardtourism [27–29].
The ability of the visitor to distinguish the authentic from the adulterated product designedspecifically for the unwitting depends basically on the motivation leading to attendance. This paperbased its classification of this type of motivation according to Bywater [29] and McKercher and DuCros [30] as follows:
1. Intentional Musical Tourist: deliberately attends a specific event and is usually knowledgeable ofthe culture from previous visits.
2. Cultural–Musical Tourist: motivated to learn about a local culture through music and dance.Attendance probably is based on previously acquired information.
3. Casual Musical Tourist: motivated in the broad sense, open to music and dance but lackinginformation or prior knowledge of events.
4. Accidental Musical Tourist: motivation is not cultural and event attendance, often organized by atour operator, takes place in hotels or restaurants.
Hence, the degree of emotional implication, understanding of the event, and appreciation of theproduct will vary greatly as a function of the tourist type. Many innovative offers exist, as can be seenin Figure 1.
The debate of authenticity has also been addressed from the perspective of the artists andresearchers who report that economic dependence by local artists on tourism provokes a loss of the art’sessence. Moreover, it is obvious that offering an artistic style geared toward the uninitiated perverts itsnatural evolution, resulting in a less “pure” style driven by marketing [28]. Furthermore, initiatives ofpreservation, such as that of UNESCO declaring the dance Intangible Cultural Heritage, involve twoserious dangers. The first is declaring a set of binding typological rules following criteria derivingfrom tangible cultural heritage [23,31]. The second is assigning responsibility for its protection to local,regional, or national authorities, following political criteria and not the needs of artists and promotingculture from marketing criteria instead of its intrinsic growth [27].
63

Sustainability 2019, 11, 6047
Figure 1. Avant-garde offer of flamenco. Source: Desirée Rodríguez, promoter.
3. Flamenco: From Popular Music to Intangible Cultural Heritage of Humanity
Although the origins of flamenco are obscure, there is a consensus that its source is in Andalusia, aland that for centuries was a crossroads of Christian, Muslim, and Jewish faiths and different ethnicities,in particular the gypsy Stating that flamenco has an exclusively gypsy source is risky, especiallyconsidering that gypsies elsewhere did not develop this expression. Thus, interpreting flamenco as anexpression of the cultural fusion in Andalusia is closer to reality [32].
Flamenco is a music and dance form transmitting emotions of love and heartbreak, joy and sorrow,struggle, reproach, vindication, and many others. It hails from farms, sierras, the countryside and sea,from miners and blacksmiths, and many other groups and places. It did not emerge to spawn a way oflife, and much less to attract visitors. Hence, tourism has no link to its origins.
Its first artists date to the 18th century, with performances limited to private fiestas orcelebrations [33]. “Cafés cantantes” where local artists sang, danced, and played the guitar emergedin the second half of the 19th century and ushered flamenco out of its isolation toward the masses.Artists dedicated themselves exclusively to their art for the first time without needing to practice otherprofessions, and entrepreneurs beginning to focus on the flamenco.
The first years of the 20th century saw this art cross borders and reach a worldwide audience [34].However, its real international emergence occurred in the 1960s, when tourists attracted to Spain’s sunand beaches (Andalusia, in particular), enthusiastically attended flamenco venues offering an authentic
64

Sustainability 2019, 11, 6047
neo-romantic view of gypsies [35]. It must be noted that flamenco, at that time, was considered amarginal “low-life” art for a large sector of Spanish society.
It is not until the 1980s that the form was professionalized. An important factor was the creationof autonomous communities throughout Spain seeking to mark their own territorial identity after thefall of the Franco dictatorship [36].
Flamenco in Andalusia was institutionalized by Article 68 of its statutes:
“The Autonomous Community has the exclusive competence in the field of knowledge, conservation,research, instruction, promotion and diffusion of flamenco as a singular element of the Andalusiancultural heritage.”
This guaranteed its protection as any other tangible cultural asset, but also launched a debate asto the criteria defining it [37,38].
Within the 2004 strategy to institutionalize flamenco, Andalusian authorities presented severalnominations to UNESCO, culminating in its being awarded in 2010 as Oral and Intangible Heritage ofHumanity. Reception of this award, nevertheless, brought to light two serious problems. The first isthe authority’s arrogation as its guarantor, as well as its means of preservation and diffusion [39]. Thisled to a struggle for hegemony between national and Andalusian authorities, as well as between artistsand representatives of private companies [40].
Secondly, its award placed an even stronger international focus on the art, resulting in theemergence of public–private interests developing a distinctive flamenco brand as a symbol of tourismin both inside and outside Andalusia, where a link can be justified between the art and territory andculture [40].
Flamenco is an exponent of Andalusia’s cultural and historical essence, and has a strong appeal tothe cultural tourist seeking a genuine emotional experience [20,41–43].
A tourist product is, in fact, an economic product, implying that a specific patrimonial or artisticresource is promoted to generate economic benefits for the local population and, potentially, for thecountry. There have been, however, few studies of the economic effects of flamenco tourism. The onlyinstitutional report carried out so far is that of the Junta de Andalucía in 2004, prior to the UNESCOaward. Even so, that study evidenced impressive numbers: 625,000 flamenco tourists generating542.96 million Euros. The growth in Andalusia, bolstered by the UNESCO award, likely led to amultiplication of these figures in recent years.
A great debate arises as to the negative effects that massive tourism has on an attraction and itsenvironment, whether they be material (natural or architectural) or immaterial (like music), where themain risk when converted into tourist product is adulteration. This has led to concept of viable tourism.
This study intended to develop a business model through the Lean startup methodology toadminister the marketing, logistics, costs, income, and contribution of value, and simultaneouslybalance the natural desire of promoters (public administrations, private promoters, artists, etc.) todevelop flamenco tourism without distorting its purity. In this case, we aimed for the development ofa product supported by the opinions of experts of the flamenco world, especially artists, with a finalproduct aligned with the characteristics of sustainable tourism.
4. Materials and Methods
Osterwalder in The Business Model Generation [44], put forward the Business Model C anvas forstartups as a means to outline hypotheses to initiate new enterprises or projects in the framework of anexisting business. However, some experts have argued that the BMC fails to take into account certaincritical aspects. Eric Ries [45] followed with the Lean Startup methodology for rapidly identifyingconditions and attaining solutions with a minimized reaction time.
The Lean Startup methodology is based on the “build–measure–learn” or“action–reaction–adjustment” cycle, which eliminates all accessory elements from the process
65

Sustainability 2019, 11, 6047
to quickly detect if the path is correct and, if not, to rectify it. In light of this methodology, and inresponse to this need, Ash Maurya [46] proposed the Lean Canvas tool.
Figure 2; Figure 3 reveal the similarities and contrasts between the two canvases. The first, andmost important, is that the BMC focuses on the market and business, while the Lean Canvas focuseson the market and the product.
Figure 2. Business model canvas. Source: Javier Megias [47].
Figure 3. Lean Canvas. Source: Javier Megias [48].
The modules common to both canvases are:
• the value proposition, indicating what is provided to the consumer;• the customer, i.e., the segment to which the value is allocated;• channels allowing communication with the customer;• definition of revenues and cost structure.
The contrasting modules of the Lean Canvas are:
• in the market block, channels and customer relations are merged and a module is opened to definethe advantages that are different from those of the competition;
66

Sustainability 2019, 11, 6047
• in the product block, the following modules are observed:
� problems that the client presents replace the key alliances that are irrelevant in most startups,� solutions to the problems replace key activities,� metrics that validate hypotheses and eliminates key resources.
In order to minimize the build–measure–learn cycle, it is possible to dispense with the identificationof key activities and resources, even if at a certain time it will be necessary to return to these tasks.
The current study was the first attempt to determine the perspectives of flamenco practitioners onthe effects, benefits, and harms of its tourist value, especially since its Intangible Heritage of Humanityaward, in order to develop a tourist product directed to public or private managers that is respectful ofthe art’s essence through a Lean Canvas model.
The genuine characteristics of the flamenco world and its practitioners, as well as the type ofinformation obtained, indicated that a qualitative methodology was the most suitable means by whichto attain the objectives of this research.
This therefore led to the choice of a survey of experts from the flamenco world. After selection,personalized interviews were carried out with a defined script open to non-directed comments. Theinterviews, most often face-to-face, were conducted by the researchers themselves. Some were alsoconducted via telephone or online questionnaire. The interviews were halted when the samplingattained 30, the saturation point of the data.
The experts were from different spheres of flamenco: public and private entrepreneurs, managers,writers, and artists. Some, such as the guitarist Vicente Amigo or the bailaora (dancer)/businesswomanBlanca del Rey, were recognized artists, while others were influential personalities.
The majority of respondents were men. It is certainly true that in the area of flamenco, men’sperformance still predominates over that women. We might add that the association network itself,the flamenco rocks, were originally restricted-access and only men could enter.
Some of the interviewees belonged to several of the fields under study; for example, it is verycommon to find artists who in turn are entrepreneurs or representatives of other artists. With thispremise in mind, we disaggregated the sample’s composition: the largest number of respondentswere researchers, writers, or journalists, followed by artists; an important response was obtainedfrom flamenco managers in public administration, located mainly in the Andalusian Institute ofFlamenco; and finally, presidents of clubs, private entrepreneurs, and representatives of artists werealso interviewed.
In general, data were obtained through a face-to-face interview, although some respondents werereached by telephone or through a survey via the Internet. However, live conversation had taken placepreviously with each of them.
The questionnaire consisted of 34 questions grouped into five blocks. Block 1: the respondentsociological profile; Block 2: personal opinions of flamenco and venues in general; Block 3: assessmentsof flamenco; Block 4: opinions on flamenco and tourism; Block 5: open questions regarding the keyfactors of the development of flamenco and flamenco tourism.
5. Results and Fashioning the Lean Canvas Tool
Flamenco, despite its relevance in cultural tourism, has not been scrutinized by the scientificcommunity. Few researchers in Spain—or in Andalusia, defender of the art as its own—considerflamenco to be a dynamic element of cultural tourism [36,42]. The few existing studies have examinedit from a panoramic perspective or from the point of view of the tourist [20,35,37,41,49]. Furthermore,the authors of the current paper did not identify any study that addressed the question of the vision,the positioning, and the propositions of action of flamenco as a phenomenon of cultural tourism fromthe art’s practitioners: artists and representatives who live from or for flamenco.
67

Sustainability 2019, 11, 6047
The sample comprised 30 participants, mostly men (76%), broken down into artists (23%), mediaprofessionals (13%), and peña (club) managers (40%) (about half from the public sector). The remaining23% were researchers, scholars, and writers. Age ranged from 26 to 73 (average about 30), with about30% between 40 and 49 and the same proportion older than 60. Participants up to 40 represented 20%,and the same proportion was between 50 and 59. Finally, 77% held university qualifications.
Applying the Lean Canvas Tool to Flamenco and Tourism
The product was flamenco and the customer was the tourist. The particularity is that the productis managed by both public and private institutions with the common goal of promoting flamenco.However, the means and channels are very different, and the product sometimes does not respond towhat is really expected.
In the following section, we present the more outstanding elements of this business model in eachof the Lean Canvas modules following the opinions of the experts. Given that the value proposition isin line with the market and the product, we first present the market values.
1. Value PropositionsFlamenco is an exclusive form of artistic expression involving the spectator through positive and
negative passion.The intentional musical tourist will gain more in-depth knowledge of the flamenco culture and
instruction, and will develop a capacity of criticism.The cultural musical tourist will learn about flamenco and differentiate it from other musical styles.The casual musical tourist, although interested in culture in general, is not necessarily attracted to
music and dance. Flamenco to these tourists can be a pleasant surprise, and witnessing an event canprovoke emotions and development of a future bond with the art.
Finally, the accidental musical tourist will not particularly seek out culture, but will aspire toamusement through flamenco. Strategies targeted at this group require refinement due to the potentialof capturing a new flamenco tourist.
2. MarketThe clients defined above are:
- intentional musical tourist,- cultural musical tourist,- casual musical tourist,- accidental musical tourist.
3. ChannelsThe tourist should receive quality information at the source/destination, along with an affordable
and quality product from the standpoint of entertainment and instruction.The Barometer of the Image of Spain by the Elcano Royal Institute [49] indicated that many
countries, especially Japan, identify flamenco as a cultural image of Spain. In fact, when foreigners areasked to state a word evoking Spain, one of the most common is flamenco, preceded, generally, bybulls, sun, cities, and football. Hence, since foreigners possess an idea of flamenco, it is convenient todefine the effective channels of communication.
Almost all collaborators, barring two, agreed on flamenco’s great presence on the Internet andespecially in social networks. This is a fundamental factor for its diffusion among tourists for tworeasons: First, because it allows an initial contact with the art without having to leave their country,and, secondly, once at the tourist destination, it allows them to identify where flamenco events arecommonly offered and to have access to criticism of the events.
Communication with tourists, interested in flamenco or not, can therefore take place throughthe Internet. However, in the case of the uninterested tourist, it is essential to reinforce a personalrelationship through agencies, hotels, and tourist offices that facilitate, encourage motivation, andpromote the art in their own country.
68

Sustainability 2019, 11, 6047
Communication channels are fundamental to defining strategies that allow increasing tourism. Itis thus necessary to contemplate, on one hand, the channels of diffusion, and on the other, the channelsof supply.
It is also fundamental for the channels to define a joint marketing plan across all entities, followingcertain guidelines. There are, for example, private websites with agendas of flamenco events, websitesoften fed by the occasional arrival of information, or websites of clubs promoting their own shows.
Some interesting websites include the ones presented below, noting that none covers all of theflamenco experiences on offer, that the information largely comes from particular initiatives that wantto publicize their events, and that shows in which the publishing institution is involved are included.
Junta de Andalucía website: this access does not include flamenco events in general, but doesmention specific events [50].
Andalusian Institute of Flamenco website: this link leads to the website belonging to the Junta deAndalucía, mainly focused on events in which the institution itself participates [51].
Deflamenco website: open nationally and internationally, including large events that occur inmain locations [52].
Guiaflama website: shows most representative national events and some from France [53].Cordobaflamenca website: website that collects all the flamenco events that are communicated to
it, focusing mainly on local events [54].Large events of great prestige usually, in turn, have their own wide-ranging marketing plans. In
the dissemination of flamenco events, the following channels are used, but it is important to make acoordination effort and, in all of them, the entire offer appears regardless of whether it is a public orprivate offer:
- social networks,- specialized websites,- travel agencies (essential to planning a flamenco trip),- hotels (very important for making contact with undecided tourists),- tourist offices.
The events are mainly located in theatres, prestigious cultural public spaces such as courtyards inCórdoba, flamenco clubs, and private premises.
4. AdvantagesFlamenco tourism offers the following advantages:
a) Regarding the general tourism on offer in Spain:
- Flamenco has a competitive advantage over the classic bull and sun offers, as it is notlinked to any particular season.
- Tourism marketing for representative cities can combine with flamenco. This notion isbolstered by the fact that many tourist cities are in Andalusia, and that most Spanishcapitals maintain an outstanding flamenco culture.
b) Regarding the tourist experience:
- Flamenco is an unlimited experience—the more one delves into this world, the more onebecomes involved.
- Flamenco exists in harmony with other tourist attractions such as gastronomy and wine.Flamenco events can even take place at emblematic sites.
5. RevenueTheir main drawback regarding revenue is that many events are not advertised along rigorous
lines. In private premises, entrance fees are collected, and are often linked to a minimal consumption.Venues can also be organized free of charge, in pre-paid venues or in theatres after purchasing a ticket.
69

Sustainability 2019, 11, 6047
However, given the lack of regulations and accreditation certificates, how can a venue’s quality beconfirmed? Is it based on whether there is an entrance fee or not? Given to the general consensus thata venue’s value is measured according to the curriculum or trajectory of the artist, just under half ofthe respondents believed that purchasing a ticket is not a guarantee of quality. There are, in fact, manyhigh-level venues free of charge organized by peñas and public entities. However, 41% indicated thatthere is a link between an entrance fee and the value of the event.
At times, tourists cannot be certain of the quality of a performance. In these cases, it is advisableto establish quality certificates offering information as to whether the artists are new or experienced,and whether they are relevant or not in the artistic world. Moreover, the experts concurred that “freeflamenco” venues are counterproductive and depreciate the art.
On other occasions, flamenco is offered as a complementary service without an entrance fee orother cost (Figure 4). This has given rise, in certain hotels, to events of unacceptable quality targetinguninitiated tourists. These “flamenco” events that are in fact not flamenco, but another dance genrepresent the unwitting tourist with an erroneous notion of the art.
Figure 4. Flamenco in a restaurant. Source: Francisco de Dios, promoter.
On many occasions, a tourist’s first flamenco contact will be through shows offered by hotels.Currently there is also a proliferation of pubs offering small flamenco samples and traditional tablaosthat attract larger scale tourism.
There is a wide range of opinion among experts over whether flamenco in hotels promotesflamenco and flamenco tourism. The opinion of its inclusion in pubs is even more negative. Theexpression "el flamenquito" has emerged in reference to a low-quality flamenco designed to entertain
70

Sustainability 2019, 11, 6047
tourists. Promoters, obviously, are not in favor of lowering the quality of the form, which is not atodds with offering a show capable of reaching people with little expertise.
Nevertheless, 45% defended flamenco in hotels, whereas the same proportion were against itin pubs. These views reflect an eagerness to care for the quality of the art, as well as using hotelsas a bridge to raise the level of demand for the aficionados. Along this line, 62% of the sample (vs.almost 30%) considered that the same rigor should be applied to free hotel venues as to those with anentrance fee.
In the case of theatres, the prices are set according to the level of the event.Another obstacle is that artist earnings are often within the submerged economy, where it is much
more difficult to control quality. These cases also reduce flamenco’s impact on economic statistics. Theparticipants in general noted that this is detrimental to the sector. The artists themselves, nonetheless,differed in opinion, as working illegally leads to greater earnings.
There are also free venues organized by public entities that do not directly affect the income of thearea, but indirectly attract tourism by increasing revenues of restaurants, shops, and hotels.
There are also subsidies explicitly earmarked for flamenco activities.The fact that tax deductions have recently been changed to favor patronage has facilitated access
to funding from both private and business patrons.The global flamenco industry is made up of a wide, complex, and interrelated range of goods and
services from different sectors (textiles, footwear, accessories, musical instruments, magazines andbooks, venues, instruction, and tourism) [55]. Flamenco, therefore, represents an important economicasset in terms of both industry and services. In the tourist sector, it attracts many tourists every yearlooking for exclusive venues and instruction (mainly dance and guitar), while others, although it is nottheir main target, desire to experience flamenco first-hand.
This paper therefore examined the opinions of experts on these subjects. Apart from three, allagreed that tourism is a pillar of flamenco’s economic development—even more so in Andalusia,flamenco’s source, and from where it has transcended internationally.
After describing the Lean Canvas modules associated with the market, the study completed theproduct’s modules.
6. ProblemsIf there is not a problem to solve or a necessity being met, a product has no use. Many businesses
start by creating a product, and only when it is on the market do they detect that its demand is notwhat was expected. The product is then initiates its own end. So, why offer flamenco if no one needs it?
The Lean Startup methodology strives to avoid the fall of a project and accelerates recognition ofthe need to change course or swing the project’s initial idea.
The flamenco aficionado needs to increase his/her flamenco instruction and experience it in itsplace of origin.
The aficionado of music recognizes flamenco and has the need to distinguish its different styles.The tourist who attends a venue feels the need to increase knowledge of everything typical of
the area.The debate of flamenco’s purity and authenticity is wide and not exclusively linked to tourist
venues. Some experts favor preservation, while others back evolution and fusion with other styles.Around 70%, in fact, defended that its assimilation of elements of other cultures opens doors promotingflamenco tourism, yet there are still those that reject fusion and insist on protecting a pure line atall costs.
The tourist presents his/her problem or need, and the product has to respect the art, while itsorigin is not at odds with evolution and fusion.
7. SolutionsAccording to the experts, the following actions promote flamenco tourism while simultaneously
attending to its needs:a) Offering a closed program from the country of origin.
71

Sustainability 2019, 11, 6047
Tourists should only travel after contracting a closed flamenco program.The debate is how to assure sufficient quality so as to dissipate the debate of authenticity.Therefore, a need exists to regulate the use of the expression “espectáculo flamenco” and limit it
exclusively to quality venues. Although most experts favored this notion, about a third objected to it.If this regulation were implemented, it is essential to determine the entity responsible for definingflamenco. An alternative is a quality certificate serving as a guarantee, especially for the uninitiated, ofan unadulterated event offered by professionals. However, among the survey’s artists there was noclear consensus as to the method and the entity that should be responsible for managing the certificate.
Public managers, on the other hand, tended to favor adopting quality certificates. Their supportand the diffusion of flamenco at an international level could encourage future visitors to experience theart and lead private institutions to sign contracts in the country of origin. Along these lines, Andalucia’sgoverning body created the Andalusian Institute of Flamenco, dedicated exclusively to this art and itsdissemination, and to publicly and privately promoting it beyond Spanish borders. Examples are thefestivals of Nîmes, Mont-de-Marsan, St. Petersburg, and Berlin, the "Viva España" festival in Moscow,and others in London, Miami, and New York.
b) Offering theoretical and/or practical instruction to bolster the experience.In order for the flamenco on offer to be of lasting quality, it is fundamental that the young engage
with this art through three of its aspects: song, dance, and guitar. The schools of dance and guitarhave a youthful following, but cante (singing) is particular, as it is generally considered to be a gift atbirth. However, more and more cante teachers are emerging, albeit most often devoid of a teachingmethodology. Sixty-six percent of the respondents believed that young people today are less fond offlamenco than older generations. Opposing this notion is the resurgence of peñas and gatherings ledby young people, whose events attract the 20 to 40 age range.
Music instruction with flamenco for children would bolster the permanence of this art. Trustingthat flamenco will survive simply by transmission from parent to child is very optimistic. Flamenco asa base of Andalusian culture, as an expression of a way of life, and even as a literary culture, deservesto be part of the music curriculum of the educational system. It is logical that pupils learn theirregional music, and the recognition by UNESCO of flamenco as Intangible Cultural Heritage since2010 supports this notion. Although flamenco possesses many peculiarities and many areas of study,Andalusians should at least recognize its different styles. However, although about 50% of the surveybelieved that flamenco should be a school requirement, 38% said it should be a complementary course.
What cannot be denied is that flamenco serves as a gateway to tourism—could an increase ininstruction in schools directly influence an increase in tourism? In principle, it would only affect theinhabitants of the zone. Nevertheless, 80% of those interviewed considered that its effects on tourism,although not short-term, would have direct and long-term repercussions. Every flamenco aficionadoof an area would be versed in the standard of this art.
c) Offering routes linked to emblematic sites and gastronomy.As indicated in the first pages of this paper, musical expression is one of many elements of culture.
Although musical expression is valued per se, there is no doubt that music reaches its full meaningwhen framed within its own cultural environment. In this sense, offering a show in a hotel is not thesame as one in the courtyard of an emblematic building or in a historical tablao. Gastronomy fallsinto the same line as flamenco, and has always been associated, among others, with Jerez or Montillawines and tapas. Consuming such products in the correct environment generates a life experiencecompletely different from witnessing an isolated venue [56].
This cultural symbiosis allows the defense of the flamenco brand from Andalusia, its place oforigin, where all the above elements make real sense. Given the importance of this art today beyondAndalusia, and even beyond Spain, it was compelling to examine whether experts perceived a dangerof Andalusia losing its place in the defense of this part of its own culture. The opinion was dividedas to whether flamenco can be used outside its origin, as well as the risk that the form be used forpurposes of tourism beyond its origin without concern for quality.
72

Sustainability 2019, 11, 6047
d) Offering flamenco in peñas open to tourism.Peñas or clubs are cultural associations whose members maintain and promote flamenco’s three
features. They organize scantly advertised periodical celebrations inviting a guest artist (singer, dancer,or guitarist) to events witnessed solely by the club’s partners.
Although some, at times, offer special events to a greater public accompanied by lectures and/ortraining workshops, most simply focus on the local public. It is also customary for these events to befinanced in part by local municipalities or by larger public institutions such as the Junta de Andalucía.
These type of venues, in fact, would benefit from greater advertising and openness to tourismthat could serve to finance the association/club. However, peña members are usually purists that feartourism as intrusive with negative repercussions. This attitude, however, is annulled as the greatflamenco events are attracting more and more tourists who respect, learn, and admire the art.
e) Offering great events with intensive periodic presence (e.g., festivals of “La Noche Blanca deFlamenco” of Córdoba, “La Bienal” of Seville, etc.)
This type of offer is already taking place, with a great tourist presence echoed even by the media.Great events are an offer well known to the intentional musical tourist, as this group, as seen from
statistics, returns year to year. Informing the other types of tourists identified in this article will requiremore effort through advertising.
There are also prestigious events with a long tradition such as the National Contest of FlamencoArt of Córdoba, the prize-winners of which received top-ratings. However, the managers of this eventhave not relaunched it wholeheartedly, so it currently does not have the bearing it deserves.
When the Córdoba contest was initiated, flamenco artists were still considered “low-life”.Fortunately, this tag no longer remains, as 62% of those surveyed disagreed with it. Professionalflamenco artists are in fact resentful of the wealthy class, which throughout history abused theirservices for their private parties.
All major flamenco events must have an impact proportional to what they offer, as it is a greatopportunity for the art and, consequently, for the host area.
8. MetricsMetrics allow the extent to which tourists are attracted to flamenco and what they pay for it to
be determined. Megías [57] defined 10 fundamental metrics applicable to both private and publicprojects that ultimately serve to estimate flamenco’s macroeconomic level—that is, its total impact onthe country’s economy.
The metrics are as follows:
1. AQUISITION BY SOURCE: identifies the origin of potential tourists;2. ACTIVATION: measures the number of tourists interested in flamenco through a web that makes
an offer compared to the number of tourists actually registered;3. RETENTION/ENGAGEMENT: quantifies how many times a tourist asks for a flamenco product;4. CHURN: measures the percentage of tourists interested in a flamenco offer that ultimately did
not contract it (lost customers / initial customers) × 100;5. CONVERSION measures the percentage of potential flamenco clients (ACQUISITION) that
purchased the product (MONETISATION);6. CUSTOMER ACQUISITION COST (CAC): relationship between the cost of acquiring, which
includes all the expenses associated with making the product and reaching the client, and thenumber of tourists who purchased the offer;
7. CUSTOMER LIFETIME VALUE (CLTV): gross benefit obtained from tourists during the time ofconsuming the product;
8. QUOTIENT OF PROFITABILITY CAPTURE: CLTV (customer life cycle) / CAC (customeracquisition cost);
9. CASH BURN RATE (CBR) refers to fixed monthly costs;
73

Sustainability 2019, 11, 6047
10. REFERENCE: measures the relationship between the number of flamenco tourists attracted byother flamenco tourists and the number of new flamenco tourists.
9. The main costs are the following:The cost of artists: it would be positive to clearly define artist earnings according to categories and
avoid the current situation where some are paid undeclared gratifications well below a standard value,or, by contrast, paid from public resources amounts far beyond what certain artists routinely receive.
- The cost of setting up the venue,- The cost of advertising,- Taxes.
Both artists and venues are subject to the general tax rate. Natural and juridical persons are levied atax rate similar to that of any professional or profession. The increase of the value added tax (VAT)from 10 to 21% had a negative influence on all cultural activities. Fortunately, this tax returned to 10%in the 2017 budget.
It is clear that flamenco promotion requires quality control not only of the venues, but of instructionfrom infancy. It is also essential to encourage flamenco among young people, as well as to eliminateits links to the submerged economy. Granting tax benefits to entrepreneurs and companies financingflamenco is also essential. Around 50% of the experts responded negatively to this issue, while only40% agreed.
Each of the modules cited above requires more detailed future study.
6. Conclusions
Cultural tourism is probably the oldest and most established form of tourism. Furthermore, it isso extensive that it continues to develop new niches. Musical tourism in the form of folklore is oneof its most attractive forms, as it allows the tourist to take part in a culture that, until recently, wasrestricted to a small segment and inaccessible to tourists. Globalization has, in most cases, brokenthese barriers with a 180◦ shift, and this expression of folklore is now another element of the touristattraction, which yields an increase of revenue for the local economy and artists.
As a result of this new dynamic, a wide debate has emerged regarding the authenticity of theflamenco venues offered to tourists, and the question of the adulteration the essence of the art for anuninitiated audience.
Flamenco has no clear origin. There is, however, no doubt of its roots in Andalusia, a regionin southern Spain with a history of different cultures and ethnicities. As in the case of other arts,flamenco’s development as a tourist product was late and strongly linked to Spain’s tourist boom. Adebate has nonetheless emerged questioning whether everything that is offered as flamenco is trulyflamenco art, in particular when the venues are offered in hotels or pubs.
It is clear, therefore, that since the conversion of flamenco into a tourism product is unstoppable,the design of its offer must be sustainable: that is, driven by its artists as well as by those who live byand safeguard it, and that its future not remain exclusively in the hands of public or private managersguided exclusively by economic factors.
Since flamenco is a product with very particular characteristics and a great part of its demandcomes from tourism, it is possible to frame it under a Lean Startup methodology which implies thelaunching of this product with a practical approach so as to detect errors that can serve to improvenew releases. This ambitious approach requires sharing and coordination on the part of public andprivate organizers, striving toward a joint strategic plan.
From the public point of view, the most representative institution is the Andalusian Institute ofFlamenco; therefore, it is considered that this body should lead the coordination and empowerment ofall events and initiatives. We would recommend the existence of a strategic planning commission, inwhich the councilors of culture of the capitals of the Andalusian province, and the departments of
74

Sustainability 2019, 11, 6047
culture of the most active Spanish towns in this area, Madrid, and Barcelona, as well as representativesof the following private groups: flamenco clubs, associations of flamenco artists, flamenco events withthe greatest impact in each area, and the tourism sector.
Following consultations with experts, 250 suggestions for improvement were received, which,grouped and summarized according to Lean Canvas modules, could be classified as customer- orproduct-oriented improvements. On one hand, proposals were made for the improvement of flamencoas an artistic product in general, and on the other hand, suggestions were made for the improvementof flamenco as a tourist product.
The following is the plan based on the proposals that, according to the group of experts, shouldbe coordinated by the strategic planning commission:
1. Proposals by experts regarding flamenco as an artistic product:
a. Customer-oriented (according to Lean Canvas)
- Support of public administrations;- Development of the strategic plan and marketing plan of flamenco, online, offline, and
presence in social networks;- Professional management in the planning and execution of shows;- Rewarding private initiatives to support flamenco;- External projection, internationalization.
b. Product-oriented (according to Lean Canvas)
- Promotion of the flamenco brand. Presence in artistic entities (conservatories, RoyalAcademy of Fine Arts, Instituto Cervantes, etc.);
- Promotion of study and research;- Quality control;- Systematic training in all aspects of the form;- Support for flamenco clubs and artists’ associations; support for young flamenco artists.
Following the modules of the Lean Canvas and the opinions of flamenco experts, we concludethat it is essential to segment flamenco tourism to adjust to its needs, that communication using onlinechannels is fundamental for attracting tourism, that it is important to offer packages including otherregional cultural aspects, and that flamenco promotion must be of a high quality that will, in turn,progress as the instruction of those who offer and receive it improves.
If artists, public and private managers, journalists, and researchers participate in promotingflamenco, they will best be served by jointly developing a project based on a strategy from theperspective of collaboration, and the creation of a sustainable tourism product of quality in the mediumand long term.
Author Contributions: M.G.M.V.d.l.T., S.M.L., J.M.A.-F. conceptualized the work and ideated the structure. Theyanalyzed the literature, interpreted and curated the data, and wrote the manuscript. The authors read and revisedthe manuscript.
Funding: This research received no external funding.
Conflicts of Interest: The authors declare no conflicts of interest.
References
1. Instituto Nacional de Estadística. Available online: http://www.ine.es (accessed on 3 May 2017).2. Lage, B.; Milone, P.C. Cultura, Lazer e Turismo. In Turismo em Análise; Universidade de São Paulo: Sao Paulo,
Brazil, 1995.3. Torre, A.; Scarborough, H. Reconsidering the estimation of the economic impact of cultural tourism. Tour.
Manag. 2017, 59, 621–629. [CrossRef]
75

Sustainability 2019, 11, 6047
4. Feio, A.; Guedes, M.C. Architecture, tourism and sustainable development for the Douro region. Renew.Energy 2013, 49, 72–76. [CrossRef]
5. Cunha, S. Gastronomic tourism, a differential factor. Millenium-J. Educ. Technol. Health 2018, 2, 93–98.[CrossRef]
6. Robinson, M.; Andersen, H.C. (Eds.) Literature and Tourism; Cengage Learning EMEA: Bonston, MA,USA, 2002.
7. Ali, F.; Ryu, K.; Hussain, K. Influence of experiences on memories, satisfaction and behavioral intentions: Astudy of creative tourism. J. Travel Tour. Mark. 2016, 33, 85–100. [CrossRef]
8. Bolan, P.; Kearney, M. Exploring film tourism potential in Ireland: From Game of Thrones to Star Wars. Rev.Tur. Desenvolv. 2018, 1, 2149–2156.
9. Bruwer, J.; Rueger-Muck, E. Wine tourism and hedonic experience: A motivation-based experiential view.Tour. Hosp. Res. 2018, 19, 488–502. [CrossRef]
10. Chen, J.S.; Kerr, D.; Chou, C.Y.; Ang, C. Business co-creation for service innovation in the hospitality andtourism industry. Int. J. Contemp. Hosp. Manag. 2017, 29, 1522–1540. [CrossRef]
11. Torres, J.A. New urbanism, tourism and urban regeneration in Eastern Lisbon, Portugal. J. Urban Regen.Renew. 2016, 9, 283–294.
12. Bar-Kołelis, D.; Wendt, J.A. Comparison of cross-border shopping tourism activities at the Polish andRomanian external borders of European Union. Geogr. Pol. 2018, 91, 113–125. [CrossRef]
13. García, M.R.; Martines, O. Scientific tourism and future cities. Int. J. Sci. Manag. Tour. 2017, 3, 123–130.14. Redondo-Carretero, M.; Camarero-Izquierdo, C.; Gutiérrez-Arranz, A.; Rodríguez-Pinto, J. Language tourism
destinations: A case study of motivations, perceived value and tourists’ expenditure. J. Cult. Econ. 2017, 41,155–172. [CrossRef]
15. Mohd, S. Possibilties of Pilgrimage Tourism–A Study of Popular Shrines of Pargana Kuthar in South Kashmir,Anantnag. Asian J. Res. Soc. Sci. Humanit. 2018, 8, 167–180. [CrossRef]
16. Rodríguez, L.; Fraiz, J.A.; Alén, E. El turismo cinematográfico como tipología emergente del turismo cultural.Pasos Revista de Turismo y Patrimonio Cultural 2014, 12, 159–171. [CrossRef]
17. Nguyen, T.T.; Camacho, D.; Jung, J.E. Identifying and ranking cultural heritage resources on geotaggedsocial media for smart cultural tourism services. Pers. Ubiquitous Comput. 2017, 21, 267–279. [CrossRef]
18. Jimeno, M. El turismo cultural en la gestión de la marca España. Boletín Elcano 2005, 20, 41.19. Jovicic, D. Cultural tourism in the context of relations between mass and alternative tourism. Curr. Issues
Tour. 2016, 19, 605–612. [CrossRef]20. Aoyama, Y. The role of consumption and globalization in a cultural industry: The case of flamenco. Geoforum
2007, 38, 103–113. [CrossRef]21. Richards, G.; Munsters, W. Cultural Tourism Research Methods, 2nd ed.; CAB International: Oxfordshire, UK,
2010.22. ECTARC. Contribution to the Drafting of a Charter for Cultural Tourism; European Centre for Traditional and
Regional Cultures: Llangollen, Wales, 1989.23. Brandellero, A.; Janssen, S. Popular music as cultural heritage: Scoping out the field of practice. Int. J. Herit.
Stud. 2014, 20, 224–240. [CrossRef]24. Lashua, B.; Spracklen, K.; Long, P. Introduction to the special issue: Music and Tourism. Tour. Stud. 2014, 14,
3–9. [CrossRef]25. Daniel, P. Tourism dance performances: Authenticity and creativity. Ann. Tour. Res. 1996, 23, 780–797.
[CrossRef]26. Gibson, C.; Connell, J. Music and Tourism: On the Road Again; Channel View Publications: Clevedon, UK, 2005.27. Stokes, M. Music, travel and tourism: An afterword. World Music 1999, 41, 141–155.28. Dunbar-Hall, P. Culture, Tourism and Cultural Tourism: Boundaries and frontiers in performances of
Balinese music and dance. J. Intercult. Stud. 2001, 22, 173–187. [CrossRef]29. Bywater, M. The market for cultural tourism in Europe. Travel Tour. Anal. 1993, 6, 30–46.30. McKercher, B.; Du Cros, H. Cultural Tourism: The Partnership between Tourism and Cultural Heritage Management;
Routledge: London, UK, 2002.31. Vecco, M. A definition of cultural heritage: From the tangible to the intangible. J. Cult. Herit. 2010, 11,
321–324. [CrossRef]32. Cruces, C. Historia del Flamenco: Siglo XXI; Tartessos: Sevilla, Spain, 2002.
76

Sustainability 2019, 11, 6047
33. Vergillos, J. Conocer el Flamenco: Sus Estilos, Su Historia; Signatura Ediciones: Sevilla, Spain, 2002.34. Millán, G.; Millán, S.; Arjona, J.M. Análisis estratégico del flamenco como recurso turístico en Andalucía.
Cuad. De Tur. 2016, 38, 297–321.35. Aoyama, Y. Artists, tourists, and the state: Cultural tourism and the Flamenco industry in Andalusia, Spain.
Int. J. Urban Reg. Res. 2009, 33, 80–104. [CrossRef]36. Ortega, C. El Impacto del Flamenco en Las Industrias Culturales Andaluzas; Universidad Complutense de Madrid:
Madrid, Spain, 2006.37. Machin-Autenrieth, M. Flamenco ¿Algo Nuestro? (Something of ours?): Music, Regionalism and Political
Geography in Andalusia, Spain. Ethnomusicol. Forum 2015, 24, 4–27. [CrossRef]38. Washabaugh, W. Flamenco Music and National Identity in Spain; Ashgate Publishing Limited: Surrey, UK, 2012.39. Bortolotto, C. La problemática del patrimonio cultural inmaterial. Cult. Rev. De Gestión Cult. 2014, 1, 1–22.
[CrossRef]40. Cruces, C. El flamenco como constructo patrimonial: Representaciones sociales y aproximaciones
metodológicas. PASOS Revista de Turismo y Patrimonio Cultural 2014, 12, 819–835. [CrossRef]41. Matteucci, X.; Filep, S. Eudaimonic tourist experiences: The case of flamenco. Leis. Stuidies 2017, 36, 39–52.
[CrossRef]42. Thimm, T. The Flamenco Factor in Destination Marketing: Interdependencies of Creative Industries and
Tourism-The case of Seville. J. Travel Tour. Mark. 2014, 31, 576–588. [CrossRef]43. Vidal, M. Intangible heritage tourism and identity. Tour. Manag. 2008, 29, 807–810. [CrossRef]44. Osterwalde, A.; Pigneur, Y. Generación de Modelos de Negocio; Deusto S. A. Ediciones: Bilbao, Spain, 2011.45. Ries, E. The Lean Startup; Deusto S. A. Ediciones: Bilbao, Spain, 2011.46. Megías, J. Las 10 Métricas Claves de Una Startup. Available online: http://javiermegias.com/blog/2013/05/
metricas-startup-indicadores/ (accessed on 5 May 2017).47. Megías, J. Business Model Canvas. Available online: https://www.strategyzer.com/canvas/business-model-
canvas (accessed on 5 May 2017).48. Megías, J. Lean Canvas. Available online: http://javiermegias.com/blog/2012/10/lean-canvas-lienzo-de-
modelos-de-negocio-para-startups-emprendedores/ (accessed on 5 May 2017).49. Real Instituto Elcano (RIC). Barómetro de la imagen de España (BIE) 7ª Oleada, Resultados Febrero y Marzo; Elcano:
Madrid, Spain, 2017.50. Junta de Andalucía. Agenda cultural de Andalucía. Available online: https://www.juntadeandalucia.es/
cultura/agendaculturaldeandalucia/eventos/todos/todos/Andaluc%C3%ADa%20Flamenca (accessed on 10October 2019).
51. Junta de Andalucía. Programas de Flamenco. Available online: https://https://www.juntadeandalucia.es/organismos/culturaypatrimoniohistorico/areas/flamenco.html (accessed on 10 October 2019).
52. Deflamenco. Agenda. Available online: https://www.deflamenco.com/ (accessed on 10 October 2019).53. Flama. Agenda. Available online: https://www.guiaflama.com/ (accessed on 10 October 2019).54. Guía Cultural del Flamenco de Córdoba. Agenda. Available online: https://cordobaflamenca.com/agenda/
(accessed on 10 October 2019).55. Molina, J.A. Relación entre el Turismo y el Crecimiento Económico en España. La Economía del Flamenco; Universidad
de Sevilla: Sevilla, Spain, 2014.56. Matteucci, X. Experiencing flamenco: An examination of a spiritual journey. In Tourist Experience and
Fulfliment: Insights form Positive Psycology; Filep, S., Pearce, P., Eds.; Routledge: New York, NY, USA, 2013.57. Megías, J. Available online: http://javiermegias.com/blog/2012/09/entrevista-ash-maurya-running-lean-
interview/ (accessed on 5 May 2017).
© 2019 by the authors. Licensee MDPI, Basel, Switzerland. This article is an open accessarticle distributed under the terms and conditions of the Creative Commons Attribution(CC BY) license (http://creativecommons.org/licenses/by/4.0/).
77


sustainability
Article
Perceived Inconveniences and Muslim Travelers’Loyalty to Non-Muslim Destinations
Heesup Han 1, Amr Al-Ansi 1 and Hyeon-Cheol Kim 2,*
1 College of Hospitality and Tourism Management, Sejong University, 98 Gunja-Dong, Gwangjin-Gu,Seoul 143–747, Korea
2 School of Business Administration, Chung-Ang University, 84 HeukSeok-Ro, DongJak-Gu, Seoul 06974, Korea* Correspondence: [email protected]
Received: 30 July 2019; Accepted: 19 August 2019; Published: 24 August 2019���������������
Abstract: Muslim travelers’ growth is an emerging sector of the global tourism industry. Yet, little hasbeen discovered about their behaviors and perceived inconveniences in a non-Muslim destination.The present research was an attempt to identify international Muslim travelers’ loyalty generationprocess for the non-Muslim destination by considering the effect of inconveniences that they possiblyperceive while traveling to the non-Muslim destination. An empirical approach comprising a fieldsurvey method was used to collect the Muslim travelers’ views in a non-Muslim destination (Korea).Our result revealed that halal-friendly image, emotional experiences, and desire played a significantrole in building Muslim travelers’ loyalty. In addition, a moderator test result of Muslim travelers’perceived inconveniences at the non-Muslim destination significantly weakened the effect of desireand halal-friendly image on loyalty. The comparative importance of emotional experiences at adestination was identified. Our findings help non-Muslim destination marketers to develop effectiveattraction and retention strategies for international Muslim travelers.
Keywords: Muslim tourism; perceived inconveniences; halal-friendly image; emotional experiences;loyalty; non-Muslim destination
1. Introduction
Global tourism growth has proven the large-scale development of its exclusive services andproducts to cover a wide range of global markets during the past decade [1]. An emerging Muslimmarket that outstrips the present advancement of halal tourism in certain global destinationssubstantiated its high profitability and accessibility to several sub-Muslim markets (i.e., South EastAsian, Middle Eastern) [2]. Halal tourism or Islamic hospitality notions established the basis of thisniche market for previous scholars [1,2]. Several studies have deeply described such principles of Islamto be practiced by Muslims as their daily guides and instructions extracted from Islamic sources (i.e.,Holy Qur’an), classified in two main terms: halal (permitted) and haram (prohibited). For example,Islamic teachings prohibiting the consumption of haram foods (e.g., pork), gambling activities, drinkingor selling alcoholic beverages, having any physical contact (i.e., shaking hands) with individuals ofthe opposite sex, dressing inadequately, sharing lodgings and private rooms by unmarried couples,showing affection in public, adultery, and breaking fast during the holy month of Ramadan daylight(Sharia principles) are recognized to evaluate the value of hospitality and tourism products/servicesfor international Muslim tourists [1–4]. In a similar vein, Islamic teachings instruct consuming onlyhalal meals, which include a wide range of foods and beverages (i.e., fruits, vegetables, seafood, grains,beans, etc.) or meats/poultry strictly slaughtered according to Islamic principles [1,2]. These practicesstrongly explain the important interests and needs of Muslim markets globally, which are required tobe considered by tourism destination developers and policy makers. Since Muslim travelers’ decisions
Sustainability 2019, 11, 4600; doi:10.3390/su11174600 www.mdpi.com/journal/sustainability79

Sustainability 2019, 11, 4600
and behaviors are based on these principles (Sharia principles) [3], providing tourism environmentsby minimizing the Muslim unfriendly aspects of any tourism product is fundamental to boost theirfavorable experiences in any destination [2,5].
According to many recent studies, Muslim travelers strongly prefer to choose a tourism destinationwhere Islamic attributes are highly available, which allow for tourism activities that fall within theirreligious norms and practices comprising facilities for prayer and worship, no liquor, Halal foods,and Islamic dress codes [6–8]. The availability of these Islamic attributes is part of Muslim tourists’strong traveling needs, which directly and indirectly attract their attention to visiting such developeddestinations [2,5]. Hence, Islamic attributes are regarded to be major motivators of Muslim tourists’selection of a tourist destination [3]. If such Islamic attributes are not available, Muslim travelers oftenexperience and perceive inconveniences while traveling to the tourist destination [8,9].
A fast increase in the Muslim global population, such as Southeast Asian and Middle-Eastern, isevident, and the total population is expected to grow even more [2,5,10]. Despite this rapid growth,the diverse inconveniences that international Muslim travelers are likely to experience and perceivewhen traveling to non-Muslim destinations known as non-OIC (Organization of Islamic Cooperation)(e.g., foods, transportation, lodging accommodations, social environment) have been rarely examinedand uncovered. The possible negative influence of Muslim travelers’ perceived inconveniences whiletraveling on their loyalty formation for non-OIC tourist destinations has also hardly been researched.In addition, while the importance of cognitive, emotional, and motivational processes in explicatingtraveler post-purchase behaviors has long been identified [11–14], how the halal-friendly image of thenon-Muslim (OIC) destination, emotional experiences, and desire toward a destination contribute togenerating Muslim travelers’ loyalty has not been unearthed.
The present research was designed to fill these gaps. In particular, the objectives of this study were:
(1) To uncover international Muslim travelers’ loyalty formation for non-Muslim (OIC) destinationsby taking the impact of their perceived inconveniences at diverse tourist places of a destination(e.g., restaurants, hotels, hospitals, resorts, shopping places, cultural sites) into account;
(2) To examine the role of halal-friendly image of non-Muslim destinations, emotional destinationexperiences, and desire to travel to a destination in building loyalty;
(3) To unearth the relative cruciality of these indicators in predicting loyalty;(4) To test the mediating effect role of study constructs.
The research conducted a thorough review of the previous related literature, which is presented inthe following section. The research methodology procedures and outcomes are then provided. Finally,a discussion of the findings is conducted, and the implications of the research are addressed.
2. Literature Review
2.1. Image of a Destination and Its Role
The image of a place/product/brand is undoubtedly a key variable in explaining travelers’post-purchase decision formation and behaviors [14,15]. In tourism and destination studies, overallimage is often described as the sum of tourists’ belief/impression about a destination and itsattributes [8,16]. This description of the overall image is in line with Kotler’s [17] definition that imageis the total set of patrons’ thoughts/ideas toward a particular product/brand. In line with these studies,in the current research, image refers to international Muslim tourists’ overall perceptions/impressionstoward a specific non-Muslim destination and its halal-friendly attributes/performances. A limitednumber of previous scholars have discussed the role of a halal-friendly destination image on Muslimtourist’s decision making. In this sense, A study by Al-Ansi and Han [1] identified how Muslimtravelers’ behaviors and loyalty were affected by such a concept pertaining to their necessary interestsand beliefs. They also provided empirical evidence on halal-friendly destination image functionalityin drawing more Muslim tourists toward non-Muslim destinations. Muslim customers, they found,
80

Sustainability 2019, 11, 4600
would perceive high emotional experiences while visiting such destinations if it was possible forhalal tourism practices to be properly performed in all the necessary dimensions [8]. For successfulcustomer retention management, a company (i.e., hotel, travel services, restaurant) must create andkeep a favorable image of its brand/product [15,18]. Likewise, to be competitive, it is undeniable thattourism practitioners should generate a positive image of a destination and its attributes [11,16].
As the impact of image on customer behaviors is considerable, image has long been an essentialagenda in the extant tourism and marketing literature [11,18,19]. Specifically, in the tourism sector,the favorable image generation for a company/destination is broadly considered to be a vital driverof tourists/travelers’ decision-making process and post-purchase behaviors [11,14,16]. For instance,Lee et al. [19] found that image is a critical trigger of travelers’ emotional experiences and intentionsto be loyal to a tourism product. In their investigation of the destination loyalty generation process,Kim et al. [11] uncovered that image played a significant role in generating travelers’ attachment tothe festival destination and loyalty to a destination. In the casino tourism sector, Hwang and Park [14]examined travelers’ evaluation process and consumption behaviors. Their empirical finding indicatedthat casino travelers’ overall image about the firm exerts a critical impact on affective experiencesand loyalty intentions. In their research, travelers’ willingness/intentions to revisit and recommendwere critical constituents of loyalty. The evidence of these studies supported the notion that positivedestination image enhances tourists’ emotional experiences with a destination and loyalty to it. Hence,we constructed the following research hypotheses:
Hypothesis 1. A halal-friendly image has a significant impact on emotional destination experiences.
Hypothesis 2. A halal-friendly image has a significant impact on loyalty.
2.2. Emotional Destination Experiences and Its Role
Consumers’ emotional experiences, which are not often processed in a conscious manner, areassociated with affective responses/reactions to a place/product/service and its attributes [18,20].Emotional experiences in consumer behavior and marketing are therefore distinct from cognitiveexperiences. In tourism, travelers’ emotional experiences comprise applying their affective feelingswhen appraising their perceptions of a destination and its diverse attributes [8,21,22]. Due to itscriticality, the use of this concept in explicating the formation of travelers’ destination loyalty andpost-purchase decision is prevalent in tourism and hospitality studies [1,10]. Oliver [18] and Peruginiand Bagozzi [23] indicated that the emotional dimension of customers’ decision-making process islikely to increase desire toward a certain behavior and behavioral intention for the behavior. Similarly,Jani and Han [21] demonstrated that patrons’ emotional experiences trigger overall satisfaction, desire,and loyalty in the hospitality context. In tourism, Chiu et al. [24] consistently verified that travelers’emotion is a significant and important contributor to eliciting post-purchase behaviors that are positivefor a destination. Recently, Han et al. [8] explored the role of emotional experiences for Muslimtravelers while visiting tourist attractions in South Korea. The study highly indicated the significantrole between Muslim travelers’ behaviors and emotional experiences in constructing their futuredesires and loyalty. Based on this evidence discussed above, in this research, it can be assumed thatMuslim visitors’ emotional experiences at non-Muslim destinations significantly influence their desireto travel to a destination and loyalty to a destination.
Hypothesis 3. Emotional destination experiences have a significant impact on desire.
Hypothesis 4. Emotional destination experiences have a significant impact on loyalty.
81
Sustainability 2019, 11, 4600
2.3. Desire to Travel to a Destination and Its Role
The term “desire toward the behavior” indicates the motivational status of an individual’s mindwhere a reason for the action is transformed into the motivation to practice it [23]. While intentionis now-oriented in terms of time frame, desire toward the behavior is time-indefinite [25,26]. Hence,desire toward the behavior has a conceptual difference from behavioral intention [23,27]. In the presentresearch, desire indicates Muslim tourists’ sturdy motivational state of mind in which their reason totravel to non-Muslims destination is converted into motivation to do so. Hunter [27] and Perugini andBagozzi [23,26] asserted that individuals’ desire can be a motivational force of their decision/behavior,mediating the influence of its predictors on such a decision/behavior. That is, individuals’ desireapparently triggers their particular intention/action [26].
Due to the criticality of this concept, many empirical studies in different disciplines such aspsychology, marketing, consumer behavior, and tourism have examined the role of desire andsupported the positive desire–intention/loyalty relationship [12,27,28]. For instance, in the shoppingcontext, Hunter [27] identified that desire, which is a positive function of shopping mall image,significantly increased patrons’ loyalty intention. Perugini and Bagozzi’s [23,26] robust findings in thesociopsychology field consistently demonstrated that one’s desire toward the behavior is the mostproximal trigger of their intention for the particular behavior, and this relationship is significant andpositive. In hospitality studies, Han and Yoon [12] also empirically addressed that desire toward thebehavior leads to customers’ increased intention to repurchase the product, which is a significant loyaltyconstituent. However, Muslim tourists’ future intention was discussed in some earlier literatures,while their desire to visit non-Muslim destination has still not widely been discovered [1–3]. Given thisevidence, it can be posited that Muslim travelers’ strong desire to travel to a destination is likely toresult in loyalty enhancement for a destination.
Hypothesis 5. Desire has a significant impact on loyalty.
2.4. Loyalty to non-Muslim (OIC) Destinations
Increasing international travelers’ level of loyalty is of utmost criticality for every destinationresearcher and practitioner [11,29–31]. Due to its substantial positive impact, traveler loyalty to a specificdestination is regarded to be one of the most crucial constructs in destination studies [32,33]. Accordingto Oliver [20], loyalty is a strong level of commitment to repeatedly patronize/consume the particularproduct that a patron prefers, regardless of situational effects and marketing efforts of rival competitors.This definition of loyalty is in widespread use in various contexts (e.g., destination research, consumerbehavior study, and marketing research). According to Wu [33] and Olya and Al-Ansi [2], along withrepeat patronage, travelers’ willingness to visit a destination, recommend it, choose it over alternatives,and engage in positive word-of-mouth behaviors is all important in composing destination loyalty.Similarly, Sirakaya-Turk et al. [34] utilized destination repatronage intention and word-of-mouthintention to evaluate shopping travelers’ loyalty to a destination. Accordingly, loyalty in the presentstudy encompasses international Muslim tourists’ deeply held commitment to revisit a non-Muslimdestination willingly and to engage in word-of-mouth behaviors consistently as its constituents.
2.5. Muslim Travelers’ Perceived Inconveniences at Non-Muslim (OIC) Destinations and Their Role
Although it has not sufficiently and completely been discussed in the extant research andliterature, individuals’ perceived inconveniences when using a particular tourism/hospitality productare important in their decision-making process and their post-purchase behaviors [25]. Perceptionof inconveniences is regarded to be a cognitive process in consumer behavior [18]. In tourism,travelers’ perceived inconveniences can be described as individuals’ cognitive assessment about theharshness of the possible difficulties that have arisen while traveling to a particular destination orwhen consuming a specific tourism product [25]. In the tourism sector, Han and Hwang [35] indicatedthat international travelers possibly experience diverse benefits from the tourism product and its
82
Sustainability 2019, 11, 4600
features, and in turn, they also experience many types of difficulties when consuming the product,which deteriorate their pleasant tourism experiences. Such difficulties are the main aspect of travelers’perceived inconveniences [25].
The importance of travelers’ perceived level of inconveniences and its significant impact ontheir decision formation are evident in tourism [2,35]. The degree of the inconveniences that Muslimtravelers possibly experience, particularly in non-Muslim countries, is even greater than that of othertypes of traveler groups [9,36]. Mostly, a non-Islamic country/destination is not well prepared forinternational Muslim tourists [1,9]. It is therefore likely that Muslim tourists’ perceived level ofinconveniences while traveling to diverse places in a non-Muslim destination (e.g., restaurants, hotels,shopping places, tourist sites) is severe, negatively influencing their overall tourist experiences in adestination [2].
According to Jung et al. [37] and Oliver [18], customers’ cognitive evaluation regardingthe conveniences/inconveniences of a specific product/service use affects their post-purchasedecision-making process for the product/service. That is, customers’ post-purchase decision formationis under the significant influence of cognitive perception of conveniences/inconveniences. In themedical tourism context, Han and Hwang [35] examined international tourists’ loyalty intentionformation process. Their results demonstrated that the relationships among international travelers’attitude toward behavior, desire, and loyalty intentions are significantly affected by their perceivedinconveniences. Consistently, Jung et al. [37] developed the push–pull–mooring framework in thetourism sector. Their findings revealed that perceived inconveniences as a component of a mooringcharacteristic moderates the push/pull factor associations with behavioral intentions. Olya andAl-Ansi [2] investigated Muslim travelers’ risks and consumption behaviors. They result showed thatthe inconveniences that Muslim travelers possibly perceive while consuming a product is a criticalfacet of tourism risk, which affects the travelers’ recommendation and repurchase intention formation.The evidence described above indicated the important role of perceived inconveniences as a moderator.Given this, in the present research, it was assumed that international Muslim travelers’ perceivedinconveniences exert a significant impact on the associations among study variables.
Hypothesis 6a. Perceived inconveniences significantly moderate the effect of image on loyalty.
Hypothesis 6b. Perceived inconveniences significantly moderate the effect of emotional destination experienceson loyalty.
Hypothesis 6c. Perceived inconveniences significantly moderate the effect of desire on loyalty.
3. Research Methods
3.1. Qualitative Process for Uncovering the Measurement Items of Perceived Inconveniences
Numerous qualitative interviews with Muslim travelers managed to uncover the measurementitems for Muslim travelers’ perceived inconveniences at non-Muslim destinations. The intervieweeswere Muslim visitors traveling to Korea for diverse purposes (e.g., cultural/Hallyu tourism, educationtourism, medical tourism, convention/event tourism). In addition, we also conducted a relevantliterature search [2,8,9,36]. This process contributed to identifying seven major items of possibleinconveniences that Muslim tourists are likely to experience when traveling to non-Muslim countries(i.e., (a) halal foods, (b) halal-friendly accommodations, (c) halal facilities, (d) halal services/information,(e) halal-friendly attire, (f) halal-friendly locals and social environment, and (g) halal-friendly staff).These items were used to measure Muslim travelers’ perceived inconveniences at non-Muslimdestinations (e.g., “My overall experiences with halal foods offered in tourist places are uncomfortable”).
83

Sustainability 2019, 11, 4600
3.2. Measures for Other Study Constructs
The measurement items for the image of a destination, emotional destination experiences, desire,and loyalty to a destination were drawn from previous research in the extant tourism and destinationliterature [18,19,23,38,39]. Specifically, the halal-friendly image of a non-Muslim destination wasmeasured with three items (e.g., “My overall image of Korea as a halal-friendly tourist destination is positive”).Emotional destination experiences were evaluated with three items (e.g., “My overall experiences whiletraveling to Korea are enjoyable”). Desire to travel to a destination was measured with three items (e.g.,“My desire for traveling to Korea in the future is high”). In addition, loyalty to a non-Muslim destinationwas evaluated with three items (e.g., “I will make an effort to travel to Korea again in the future”). Multipleitems and a seven-point scale for the assessment of all research constructs were used.
3.3. Survey Questionnaire Development and Data Collection
The survey questionnaire included the measures described above, introductory letter, andquestions for Muslim respondents’ sociodemographic background. The initial survey questionnaireversion was pretested with academics whose major is international tourism. A minor improvement ofthe questionnaire items’ concepts and terms was made based on their feedback. A visitor’s survey wasconducted. Well-trained surveyors (i.e., graduate students) were educated to conduct proper datacollection with random Muslim travelers. The trained surveyors distributed the developed surveyquestionnaires to Muslim travelers while visiting various tourist places in metropolitan cities in Korea.The surveyors approached Muslim tourists and inquired about their willingness to participate andanswer the survey questionnaire. A brief explanation of the survey objectives and its purpose wasgiven to those who agreed to survey participation. The respondents were then invited to fully readand answer the questions. The filled questionnaire was returned to the surveyors onsite. Throughthis process, we collected 305 usable responses. These responses were then used for the process ofdata analysis.
3.4. Sample Characteristics
Of 305 respondents, 53.4% (n = 163) were female Muslim travelers, and 46.6% (n = 142) weremale Muslim travelers. The participants’ average age was 31.7 years old. Regarding the purpose oftravel, about 70.2% reported pleasure, followed by education (25.6%), business (1.0%), and other (3.3%).When the participants’ education level was asked, about 39.1% reported that they had a 4-year collegedegree, followed by graduate degree holders (30.1%), high-school graduates or less (25.4%), and 2-yearcollege graduates (5.4%). Regarding the visit frequency, the majority of the participants reported that itwas their first time visiting Korea (78.4%), followed by 2–3 times (15.1%), 4–5 times (3.0%), 10 times ormore (2.3%), and 6–9 times (1.3%).
4. Results
4.1. Assessment of Measurement Quality (Reliability and Validity)
A confirmatory factor analysis was conducted using Amos 22. As reported in Table 1, themodel included a satisfactory level of goodness-of-fit statistics (χ2 = 366.171, df = 140, χ2/df = 2.616,p < 0.001, RMSEA = 0.073, CFI = 0.955, IFI = 0.955, TLI = 0.945). All observed items were significantlyloaded to their relevant latent factors (p < 0.01). The results of the composite reliability calculationrevealed that all values (halal-friendly image of a non-Muslim destination = 0.938, emotionaldestination experience = 0.948, desire to travel to a destination = 0.951, Muslim travelers’ perceivedinconveniences = 0.903, and loyalty to a non-Muslim destination = 0.857) were greater than the cutoffof 0.70 suggested by Hair et al. [40]. In addition, our assessment of AVE values revealed that all valueswere greater than Hair et al.’s [40] recommend threshold of 0.50 (halal-friendly image of a non-Muslimdestination = 0.834, emotional destination experience = 0.859, desire to travel to a destination = 0.867,Muslim travelers’ perceived inconveniences = 0.571, and loyalty to a non-Muslim destination = 0.670).
84

Sustainability 2019, 11, 4600
As shown in Table 1, these AVE values were also greater than the between-construct correlations(squared). Hence, convergent and discriminant validity of the construct measures were evident.
Table 1. Measurement model assessment results.
(1) (2) (3) (4) (5) Mean SD CR
(1) Halal-friendly image of anon-Muslim destination 1.000 4.292 1.425 0.938
(2) Emotional destination experiences 0.302 a
(0.308) b 1.000 5.425 1.179 0.948
(3) Desire to travel to a destination 0.320(0.102)
0.606(0.367) 1.000 5.379 1.293 0.951
(4) Muslim travelers’ perceivedinconveniences
0.012(0.001)
−0.270(0.073)
−0.291(0.085) 1.000 3.619 1.256 0.903
(5) Loyalty to a non-Muslimdestination
0.448(0.201)
0.632(0.399)
0.717(0.514)
−0.128(0.016) 1.000 1.256 1.217 0.857
AVE 0.834 0.859 0.867 0.571 0.670
Note: Goodness-of-fit statistics for the measurement model: χ2 = 366.171, df = 140, χ2/df = 2.616, p < 0.001,RMSEA = 0.073, CFI = 0.955, IFI = 0.955, TLI = 0.945. a Correlations between variables. b Squared correlations.
4.2. Assessment of the Proposed Theoretical Framework
In order to test the proposed developed theoretical framework, structural equation modeling(SEM) was estimated. Amos 22 was utilized as an analysis tool. SEM is an effective analyticalapproach widely used in business and management studies to predict multivariate and complexmodels. Our result showed that the model contained an adequate level of goodness-of-fit statistics(χ2 = 144.016, df = 48, p < 0.001, χ2/df = 3.000, RMSEA = 0.080, CFI = 0.974, IFI = 0.974, TLI = 0.964).Overall, the model included a sufficient level of demonstrating power for loyalty in that it justifiedabout 72.8% of loyalty total variance in the non-Muslim destination. The model also explained about41.1% of the total variance in desire to travel to a destination, and 10.9% of the variance in emotionaldestination experiences. The details regarding the structural equation modeling results are exhibitedin Table 2 and Figure 1.
Figure 1. Results of the structural equation modeling (n = 305).
85

Sustainability 2019, 11, 4600
The hypothesized effect of a halal-friendly image on emotional destination experiences andloyalty was tested. Our result showed that the halal-friendly image of a non-Muslim destinationexerted a significant influence on emotional destination experiences (β = 0.330, p < 0.01) and loyaltyto the non-Muslim destination (β = 0.139, p < 0.01). Therefore, Hypotheses 1 and 2 were supported.The proposed impact of emotional destination experiences on its outcome variables was assessed.Our findings indicated that emotional destination experiences had a significant influence on desireto travel to a destination (β = 0.641, p < 0.01) and loyalty to the non-Muslim destination (β = 0.296,p < 0.01). Thus, Hypotheses 3 and 4 were supported. The hypothesized effect of desire on loyalty wastested. Our result indicated that desire to travel to a destination included a significant influence onloyalty to the non-Muslim destination (β = 0.582, p < 0.01). Hence, Hypothesis 5 was supported.
Subsequently, the assessment of the indirect effect of the research variables showed that ahalal-friendly image included a significant indirect influence on desire (β image− emotional experiences− desire = 0.212, p < 0.01) and loyalty (image − emotional experiences − desire − loyalty = 0.221,p < 0.01). In addition, emotional destination experiences contained a significant indirect effect onloyalty (β emotional destination experiences − desire − loyalty = 0.373, p < 0.01). This result indicatedthat desire along with emotional destination experiences played a significant mediating role within thedeveloped theoretical framework. The total effect of research factors was estimated. Our result showedthat emotional destination experiences had the greatest total effect on loyalty (β = 0.669, p < 0.01),followed by desire (β = 0.582, p < 0.01), and a halal-friendly image (β = 0.360, p < 0.01). The detailsabout the indirect and total impact assessment results are exhibited in Figure 2.
Figure 2. Total and indirect effect (n = 305).
4.3. Assessment of the Baseline Model and Test for Metric Invariance
In order to test the moderating influence of Muslim travelers’ perceived inconveniences at anon-Muslim destination, a comprehensive evaluation for metric invariance was utilized. All completedresponses were categorized into high and low groups of perceived inconveniences. The high groupincluded total of 134 valid responses, and the low group included total of 171 valid responses. A baselinemodel comprising these two groups (high and low) was generated. All loadings were constrained tobe equivalent across groups within this model. As shown in Table 3 and Figure 1, our results showedthat the model included an adequate level of goodness-of-fit statistics (χ2 = 262.669, df = 104, p < 0.001,χ2/df = 2.526, RMSEA = 0.071, CFI = 0.958, IFI = 0.958, TLI = 0.946). The model was then completelycompared with nested models. In every nested model, one specific path is equally restricted.
86

Sustainability 2019, 11, 4600
Ta
ble
2.
Stru
ctur
aleq
uati
onm
odel
ing
resu
lts
(n=
305)
.
Pro
po
sed
Pa
ths
Co
effi
cie
nts
t-V
alu
es
H1
Hal
al-f
rien
dly
imag
eof
ano
n-M
uslim
dest
inat
ion
→Em
otio
nald
esti
nati
onex
peri
ence
s0.
330
5.64
2**
H2
Hal
al-f
rien
dly
imag
eof
ano
n-M
uslim
dest
inat
ion
→Lo
yalt
yto
ano
n-M
uslim
dest
inat
ion
0.13
92.
842
**H
3Em
otio
nald
esti
nati
onex
peri
ence
s→
Des
ire
totr
avel
toa
dest
inat
ion
0.64
112
.203
**H
4Em
otio
nald
esti
nati
onex
peri
ence
s→
Loya
lty
toa
non-
Mus
limde
stin
atio
n0.
296
5.18
9**
H5
Des
ire
totr
avel
toa
dest
inat
ion
→Lo
yalt
yto
ano
n-M
uslim
dest
inat
ion
0.58
28.
747
**To
talv
aria
nce
expl
aine
d:R
2fo
rlo
yalt
yto
ano
n-M
uslim
dest
inat
ion=
0.72
8R
2fo
rde
sire
totr
avel
toa
dest
inat
ion=
0.41
1R
2fo
rem
otio
nald
esti
nati
onex
peri
ence
s=
0.10
9
Tota
lim
pact
onlo
yalt
y:β
Hal
al-f
rien
dly
imag
eof
ano
n-M
uslim
dest
inat
ion=
0.36
0**
βem
otio
nald
esti
nati
onex
peri
ence
s=
0.66
9**
βde
sire
totr
avel
toa
dest
inat
ion=
0.58
2**
Goo
dnes
s-of
-fits
tati
stic
sfo
rth
est
ruct
ural
mod
el:χ
2=
144.
016,
df=
48,p<
0.00
1,χ
2 /df=
3.00
0,R
MSE
A=
0.08
0,C
FI=
0.97
4,IF
I=0.
974,
TLI=
0.96
4*
p<
0.05
,**
p<
0.01
Indi
rect
impa
ct:
βim
age−e
mot
iona
lexp
erie
nces−d
esir
e−l
oyal
ty=
0.22
1**
βim
age−e
mot
iona
lexp
erie
nces−d
esir
e=
0.21
2**
βem
otio
nald
esti
nati
onex
peri
ence
s−d
esir
e−l
oyal
ty=
0.37
3**
Ta
ble
3.
Stru
ctur
alin
vari
ance
mod
elre
sult
s.
Pa
ths
Hig
hG
rou
po
fP
erc
eiv
ed
Inco
nv
en
ien
ces
(n=
13
4)
Lo
wG
rou
po
fP
erc
eiv
ed
Inco
nv
en
ien
ces
(n=
17
1)
Ba
seli
ne
Mo
de
l(F
ree
lyE
stim
ate
d)
Ne
ste
dM
od
el
(Eq
ua
lly
Co
nst
rain
ed
)β
t-V
alu
es
βt-
Va
lue
s
Hal
al-f
rien
dly
Imag
e→
Loya
lty
0.10
81.
847
0.14
41.
970
*χ
2(1
04)=
262.
669
χ2
(105
)=26
2.67
9a
Emot
iona
ldes
tina
tion
expe
rien
ces→
Loya
lty
0.33
74.
251
**0.
303
4.05
4**
χ2
(104
)=26
2.66
9χ
2(1
05)=
263.
400
b
Des
ire
totr
avel
toa
dest
inat
ion→
Loya
lty
0.47
57.
280
**0.
674
8.74
3**
χ2
(104
)=26
2.66
9χ
2(1
05)=
266.
982
c
Chi
-squ
are
diff
eren
cete
st:
aΔχ
2(1
)=0.
001,
p>
0.05
(H6a
—N
otsu
ppor
ted)
�
bΔχ
2(1
)=0.
731,
p>
0.05
(H6b
—N
otsu
ppor
ted)
cΔχ
2(1
)=4.
313,
p<
0.05
(H6c
—Su
ppor
ted)
Goo
dnes
s-of
-fits
tati
stic
sfo
rth
eba
selin
em
odel
:χ
2=
262.
669,
df=
104,
p<
0.00
1,χ
2 /df=
2.52
6,R
MSE
A=
0.07
1,C
FI=
0.95
8,IF
I=0.
958,
TLI=
0.94
6*p<
0.05
,**p<
0.01
�W
hile
the
link
for
the
low
grou
pof
perc
eive
din
conv
enie
nce
was
sign
ifica
nt,t
hepa
thfo
rth
ehi
ghgr
oup
was
nots
igni
fican
t.Th
us,a
lthou
ghth
ech
i-squ
are
diff
eren
ceac
ross
grou
psw
asno
tsig
nific
ant,
the
grou
pdiff
eren
ceon
the
linka
gesh
ould
bem
eani
ngfu
llyin
terp
rete
d.
87

Sustainability 2019, 11, 4600
Our empirical comparison revealed that the link from halal-friendly image to loyalty to thenon-Muslim destination was totally insignificant difference between both groups (high and low)(Δχ2 [1] = 0.001, p > 0.05). Therefore, Hypothesis 6a was not supported. While the linkage for the lowgroup was significant, the link for the high group was not significant. Our result also showed thatthe relationship between emotional destination experiences and loyalty to a non-Muslim destinationwas not significantly different (Δχ2 [1] = 0.731, p > 0.05). Thus, Hypothesis 6b was not supported.However, our findings indicated that the path from desire to loyalty to the non-Muslim destinationwas significantly different between high and low groups. Accordingly, Hypothesis 6c was supported.
5. Discussion and Implications
This research provided the sturdy theorization related to international Muslim tourists’ perceivedinconveniences in elucidating their post-purchase decision-making process and behavior. To thebest of our knowledge, the present study is the first to develop a research framework by involvingMuslim travelers’ perceived inconveniences as a key moderator variable and considering its roles inthe formation of their loyalty to a non-Muslim destination. In addition, the conceptual frameworkcomprising s halal-friendly destination image, emotional experiences, and desire to travel to adestination was wholly supported as it satisfactorily accounted for the total variance in Muslim travelerloyalty to a non-Muslim destination. Overall, our results will contribute to moving one further steptoward (1) comprehending the role of inconvenience factors regarding how badly such inconveniencesweaken Muslim tourists’ loyalty formation better, (2) understanding the role of a halal-friendlydestination image in driving emotional experiences, desire, and loyalty, and (3) recognizing the role ofemotional experiences and desire in maximizing the influence of a halal-friendly destination image onloyalty. These results are significant in that such findings help non-Muslim destination practitioners(e.g., destination marketers, hospitality/tourism operators, tourism policy makers) to reduce Muslimvisitors’ difficulties while traveling as well as develop ways to increase their emotional experiences,desire, and loyalty/attachment to a non-Muslim tourism destination.
The present study illustrated the comparative importance of emotional destination experiences inboosting international Muslim travelers’ destination loyalty. Results of the Fisher Z-test clarified thatthe total effect of this variable on loyalty was significant and higher than other study variables (p < 0.01).Our finding supported tourism (or consumer behavior) researchers’ previous assertion regardingthe salient role of patrons’ emotional/affective experiences in their post-purchase decision-makingprocess [18,21,22]. In addition, the findings of this study inform researchers that the concept ofemotional experiences should be included in building any theoretical framework explicating Muslimtravelers’ destination loyalty generation process and tourism behaviors at a destination in an activemanner. Our findings also inform destination practitioners that efficiently managing and enhancinginternational Muslim travelers’ emotional experiences is the key constituent of eliciting their positivepost-purchase behaviors for a destination. Han et al. [8] have reported similar findings on howemotional experiences (i.e., affective) play a significant role in building Muslim travelers’ intentionsand loyalty in a non-Muslim destination. To do so, as our result indicated, increasing the overallhalal-friendly image of a non-Muslim destination is of utmost importance. Making a destination’simage and social environment friendly for Muslim travelers would help their tourist experiences to bepleasant, enjoyable, and interesting, which eventually leads to increased loyalty to a destination.
Results from the test for the metric invariance demonstrated that the linkage from desire toloyalty was significantly moderated by Muslim travelers’ perceived inconveniences at a non-Muslimdestination. The strength of the relationship was significantly greater for the low group of perceivedinconveniences (β = 0.674, p < 0.01) than the high group (β = 0.475, p < 0.01). This result impliesthat at a similar level of desire to travel to a destination, international Muslim tourists who perceivea low level of inconveniences while traveling build a more robust level of loyalty to a non-Muslimdestination than those who perceive high inconveniences. From a theoretical perspective, our findinginforms that the concept of desire to travel to a destination is more evocative in destination loyalty
88

Sustainability 2019, 11, 4600
formation for Muslim tourists who perceive low inconveniences at a destination. Thus, this findingis highly in line with earlier scholars’ discussions who confirm that poor management of halaltourism infrastructure in non-Islamic destinations leads to a decrease in Muslim visitors’ satisfactionand future intention to revisit a destination [1,36]. The utilization of the perceived inconveniencesconcept as a moderator seems to be crucial in explaining international Muslim travelers’ post-purchasedecision-making process.
From a practical point of view, the final outcomes of this study also provided useful insights.Despite a fast increase in the Muslim population in the world, which has reached around thirtypercent [9], the proportion of Muslim travelers in many non-Muslim destinations, such as Korea, isrelatively low. An increase in this proportion is highly in need for the enhancement of competitivenessin terms of inbound tourism of such destinations. Our findings provided important information thatminimizing Muslim tourists’ inconveniences is one of the strong approaches to making the desire andloyalty relationship stronger. This result notifies that destination practitioners need to make everyendeavor in reducing any inconvenience/difficulty possibly experienced by international Muslimtourists in various places in a non-Muslim destination (e.g., restaurants, hotels, hospitals, resorts,shopping places, cultural sites, transportation (airplane, taxi, subway, KTX, and bus), museums, parks)for the maximum increase of loyalty.
In the present research, our proposition regarding the dissimilarity of the associations betweenthe halal-friendly image of a non-Muslim destination and loyalty to a destination was not supported.Nonetheless, the finding from the metric invariance test revealed that the association was interestinglyonly significant in the low group of perceived inconveniences (β = 0.144, p < 0.05) but not in the highgroup (β = 0.108, p > 0.05). Thus, despite the insignificant chi-square difference, the dissimilarity onthis linkage across groups can be interpreted meaningfully. Our findings offer destination practitionersand researchers critical knowledge that the halal-friendly image that international Muslim touristshave about a non-Muslim destination triggers their loyalty only when these tourists barely perceiveinconveniences while traveling to a destination. This result partially supports an earlier study byAl-Ansi and Han [1], who emphasized the essential role of a halal-friendly destination image ingenerating loyalty in a non-Islamic destination, which required high concern by tourism developersto mitigate the poor and low halal-friendly service practices. In closing, future tourism planning isfocused on sustainability to achieve a high level of economic growth and nature conservation, and thus,the global Muslim segment is a future market to be leveraged by tourism destinations and developers,which they should carefully consider. To do so, sustainable marketing strategies must be enforcedbased on deeply understanding Muslim behaviors and inconvenience experiences perceived whiletraveling abroad, as discussed in the present study.
6. Conclusions
Our study provided the underlying procedure of generating a halal-friendly image of a non-Muslimdestination, emotional destination experiences, desire to travel to a destination, and destination loyalty.The findings of the present research demonstrated the vital mediating role of emotional experiencesand desire within the hypothesized conceptual framework. This research theorized these constructsas a bridge mediating the relationship between a halal-friendly destination image and loyalty in asuccessful manner. Researchers in tourism and destination management need to recognize that theassociations between Muslim traveler loyalty and its predictors are hardly significant when emotionalexperiences and desire are not involved. While emotional experiences and desire toward the behaviorare regarded as crucial concepts in consumer behavior [41,42], the integrative role of these factors asvital mediators is rarely unearthed in destination management literature. Our finding, which offereda clear view concerning the obvious mediation function of emotional experiences and desire in theloyalty generation process, thus has a critical theoretical and practical meaning.
89

Sustainability 2019, 11, 4600
Despite its theoretically and practically meaningful implications, this study contained a fewlimitations. The first limitation is about the generalizability of the findings. The proposed frameworkwas evaluated in the Muslim tourism setting. Hence, generalizing our results to other types oftourism/consumption contexts should be done cautiously. The applicability of the hypothesizedframework in other sectors is recommended for future research. Additionally, this study was focusedon general financial budgeting of Muslim travelers, which highly recommends that future scholarsspecify different aspects of Muslim travelers’ financial segment, including luxury or low budget.The second limitation is related to high correlation. While the measures for research variables in thepresent study included an acceptable level of discriminant validity and internal consistency, somecorrelations (e.g., 0.717) were fairly high. The correlation did not exceed the problematic level of0.800 [40]. Yet, our results are not totally free from the issue of multicollinearity. A stronger and moresufficient measurement design is highly recommended for future research.
Author Contributions: Funding acquisition: H.H. and H.K.; Resources, H.-C.K.; Supervision, H.-C.K.;Visualization, A.A.-A.; Writing—original draft, H.H.; Writing—review and editing, A.A.-A.
Funding: This work was supported by the Ministry of Education of the Republic of Korea and the NationalResearch Foundation of Korea (NRF-2017S1A5A2A01023429).
Conflicts of Interest: The authors declare no conflicts of interest.
References
1. Al-Ansi, A.; Han, H. Role of halal-friendly destination performances, value, satisfaction, and trust ingenerating destination image and loyalty. J. Destin. Mark. Manag. 2019, 13, 51–60. [CrossRef]
2. Olya, H.G.T.; Al-Ansi, A. Risk assessment of halal products and services: Implications for tourism industry.Tour. Manag. 2018, 65, 279–291. [CrossRef]
3. Shafaei, F.; Mohamed, B. Involvement and brand equity: A conceptual model for Muslim tourists. Int. J.Cult. Tour. Hosp. Res. 2015, 9, 54–67. [CrossRef]
4. Zamani-Farahani, H.; Henderson, J.C. Islamic tourism and managing tourism development in Islamicsocieties: The cases of Iran and Saudi Arabia. Int. J. Tour. Res. 2010, 12, 79–89. [CrossRef]
5. Kim, S.; Im, H.H.; King, B.E.M. Muslim travelers in Asia: The destination preferences and brand perceptionsof Malaysian tourists. J. Vac. Mark. 2015, 21, 3–21. [CrossRef]
6. Battour, M.; Battor, M.; Bhatti, M.A. Islamic attributes of destination: Construct development andmeasurement validation, and their impact on tourist satisfaction. Int. J. Tour. Res. 2013, 62, 556–564.[CrossRef]
7. Eid, R. Integrating Muslim customer perceived value, satisfaction, loyalty and retention in the tourismindustry: An empirical study. Int. J. Tour. Res. 2013, 30, 249–260. [CrossRef]
8. Han, H.; Al-Ansi, A.; Olya, H.G.T.; Kim, W. Exploring halal-friendly destination attributes in South Korea:Perceptions and behaviors of Muslim travelers toward a non-Muslim destination. Tour. Manag. 2019, 71,151–164. [CrossRef]
9. Al-Ansi, A.; Olya, H.G.T.; Han, H. Effect of general risk on trust, satisfaction, and recommendation intentionfor halal food. Int. J. Hosp. Manag. 2018. [CrossRef]
10. Battour, M.; Ismail, M.N. Halal tourism: Concepts, practices, challenges and future. Tour. Manag. Perspect.2016, 19, 150–154. [CrossRef]
11. Kim, S.; Choe, J.Y.; Petrick, J.F. The effect of celebrity on brand awareness, perceived quality, brand image,brand loyalty, and destination attachment to a literary festival. J. Destin. Mark. Manag. 2018, 9, 320–329.[CrossRef]
12. Han, H.; Yoon, H. Hotel customers’ environmentally responsible behavioral intention: Impact of keyconstructs on decision in green consumerism. Int. J. Hosp. Manag. 2015, 45, 22–33. [CrossRef]
13. Hwang, J.; Choi, J.K. An investigation of passengers’ psychological benefits from green brands in anenvironmentally friendly airline context: The moderating role of gender. Sustainability 2018, 10, 80.[CrossRef]
90

Sustainability 2019, 11, 4600
14. Hwang, J.; Park, S. An exploratory study of how casino dealer communication styles lead to player satisfaction.J. Travel. Tour. Mark. 2018, 35, 1246–1260. [CrossRef]
15. Keller, K.L. Conceptualizing, measuring, and managing customer-based brand equity. J. Mark. 1993, 57,1–22. [CrossRef]
16. Baloglu, S.; McCleary, K.W. A model of destination image formation. Ann. Tour. Res. 1999, 26, 868–897.[CrossRef]
17. Kotler, P.; Haider, D.H.; Rein, I. Marketing places: Attracting Investment, Industry, and Tourism to Cities, States,and Nations; The Free Press: New York, NY, USA, 1993.
18. Oliver, R.L. Satisfaction: A Behavioral Perspective on the Consumer, 2nd ed.; Routledge: New York, NY, USA, 2010.19. Lee, J.S.; Hsu, L.T.; Han, H.; Kim, Y. Understanding how consumers view green hotels: How a hotel’s green
image can influence behavioral intentions. J. Sustain. Tour. 2010, 18, 901–914. [CrossRef]20. Oliver, R.L. Whence consumer loyalty? J. Mark. 1999, 63, 33–44. [CrossRef]21. Jani, D.; Han, H. Influence of environmental stimuli on hotel customer emotional loyalty response: Testing
the moderating effect of big five personality factors. Int. J. Hosp. Manag. 2015, 44, 48–57. [CrossRef]22. Lin, C.; Morais, D.B.; Kerstetter, D.L.; Hou, J. Examining the role of cognitive and affective image in predicting
choice across natural, developed, and theme-park destinations. J. Travel. Res. 2007, 46, 183–194. [CrossRef]23. Perugini, M.; Bagozzi, R.P. The role of desires and anticipated emotions in goal-directed behaviors: Broadening
and deepening the theory of planned behavior. Br. J. Soc. Psychol. 2001, 40, 79–98. [CrossRef]24. Chiu, C.; Hsu, M.; Lai, H.; Chang, C. Re-examining the influence of trust on online repeat purchase intention:
The moderating role of habit and its antecedents. Decis. Support. Syst. 2012, 53, 835–845. [CrossRef]25. Han, H.; Kim, Y.; Kim, C.; Ham, S. Medical hotels in the growing healthcare business industry: Impact of
international travelers’ perceived outcomes. J. Bus. Res. 2015, 68, 1869–1877. [CrossRef]26. Perugini, M.; Bagozzi, R.P. The distinction between desires and intentions. Eur. J. Soc. Psychol. 2004, 34,
69–84. [CrossRef]27. Hunter, G.L. The role of anticipated emotion, desire, and intention in the relationship between image and
shopping center visits. Int. J. Retail. Distrib. Manag. 2006, 34, 709–721. [CrossRef]28. Carrus, G.; Passafaro, P.; Bonnes, M. Emotions, habits and rational choices in ecological behaviours: The case
of recycling and use of public transportation. J. Environ. Psychol. 2008, 28, 51–62. [CrossRef]29. Byun, J.; Jang, S. “To compare or not to compare?”: Comparative appeals in destination advertising of ski
resorts. J. Destin. Mark. Manag. 2018, 10, 143–151. [CrossRef]30. Hwang, J.; Lee, J. Relationships among senior tourists’ perceptions of tour guides’ professional competencies,
rapport, satisfaction with the guide service, tour satisfaction, and word of mouth. J. Travel. Res. 2018.[CrossRef]
31. Hwang, J.; Lyu, S.O.; Cho, S.B. In-flight casinos, Is it really a nonsensical idea? An exploratory approachusing different choice experiments. Sustainability 2019, 11, 3038. [CrossRef]
32. Tasci, A.D.A. A quest for destination loyalty by profiling loyal travelers. J. Destin. Mark. Manag. 2017, 6,207–220. [CrossRef]
33. Wu, C. Destination loyalty modeling of the global tourism. J. Bus. Res. 2016, 69, 2213–2219. [CrossRef]34. Sirakaya-Turk, E.; Ekinci, Y.; Martin, D. The efficacy of shopping value in predicting destination loyalty.
J. Bus. Res. 2015, 68, 1878–1885. [CrossRef]35. Han, H.; Hwang, J. Multi-dimensions of the perceived benefits in a medical hotel and their roles in
international travelers’ decision-making process. Int. J. Hosp. Manag. 2013, 35, 100–108. [CrossRef]36. Jeaheng, Y.; Al-Ansi, A.; Han, H. Halal-friendly hotels: Impact of halal-friendly attributes on guest purchase
behaviors in the Thailand hotel industry. J. Travel. Tour. Mark. 2019, 36, 730–747. [CrossRef]37. Jung, J.; Han, H.; Oh, M. Travelers’ switching behavior in the airline industry from the perspective of the
push-pull-mooring framework. Tour. Manag. 2017, 59, 139–153. [CrossRef]38. Hennig-Thurau, T. Customer orientation of service employees: Its impact on customer satisfaction,
commitment, and retention. Int. J. Serv. Ind. Manag. 2004, 15, 460–478. [CrossRef]39. Sirgy, M.J.; Su, C. Destination image, self-congruity, and travel behavior: Toward an integrative model.
J. Travel. Res. 2000, 38, 340–352. [CrossRef]40. Hair, J.F.; Black, W.C.; Babin, B.J.; Anderson, R.E. Multivariate Data Analysis; Prentice-Hall: Upper Saddle River,
NJ, USA, 2010.
91

Sustainability 2019, 11, 4600
41. El-Adly, M.I.; Eid, R. An empirical study of the relationship between shopping environment, customerperceived value, satisfaction, and loyalty in the UAE malls context. J. Retailing. Consum. Serv. 2016, 31,217–227. [CrossRef]
42. Vega-Vázquez, M.; Castellanos-Verdugo, M.; Oviedo-García, M.Á. Shopping value, tourist satisfaction andpositive word of mouth: The mediating role of souvenir shopping satisfaction. Curr. Issuse Tour. 2017, 20,1413–1430. [CrossRef]
© 2019 by the authors. Licensee MDPI, Basel, Switzerland. This article is an open accessarticle distributed under the terms and conditions of the Creative Commons Attribution(CC BY) license (http://creativecommons.org/licenses/by/4.0/).
92

sustainability
Article
Exotic or Home? Tourists’ Perception of GuestHouses, Guest Houses Loyalty, and DestinationLoyalty in Remote Tourist Destinations
Tiantian (Tiana) Shi 1, Biao He 2 and Jun (Justin) Li 1,*
1 School of Tourism Management, South China Normal University, Higher Education Mega Center,Guangzhou 510006, China
2 School of Tourism, Hainan University, Haikou 570228, China* Correspondence: [email protected]
Received: 18 June 2019; Accepted: 11 July 2019; Published: 13 July 2019���������������
Abstract: Guest houses offer an environmentally sustainable way to travel. The guest house servesnot only to accommodate but also attract tourists to experience local culture when they visit remotedestinations. This study was designed to explore how tourists’ multiple perceptions of guesthouses in remote destinations affect their behavioral intention toward guest houses and destinations.Results demonstrated that both tourists’ perception of exotic local culture and sense of home hada significant positive effect on tourists’ loyalty to guest houses in remote destinations. In addition,tourists with high cultural distance staying in guest houses perceived a higher level of exotic localculture but lower level of sense of home compared with those with lower cultural distance. Managerialimplications, limitations, and recommendations for future studies are also provided.
Keywords: guest house; sense of home; exotic local culture; cultural distance
1. Introduction
The binary structure of “home” and “away” has a long history in tourism research [1].However, the boundary between the two sides of the structure is blurring [2,3]. Tourists not only leaveand return home but seek the sense of home on the move, as well as otherness [4]. Thus, the consumptionand embracing of home exists along with tourists’ pursuit of exotic and extraordinary experiences intourist destinations [5]. Guest houses in remote destinations (GHRDs) around the world are a typicalspace to fulfill tourists’ ambivalent pursuits of both exotic local culture and a home-like shelter similarto home when they visit remote places [6]. GHRDs across different countries are usually convertedfrom original, local, traditional residences, providing tourists a space for temporary accommodationduring their visit to remote tourist destinations. Staying in guest houses provides tourists not onlya chance to experience the exotic culture but also seek a place of comfort, privacy, and homeliness.To sustain the success of GHRDs, it is important to assess how tourists’ perceptions of the exotic localculture and sense of home influence their visitor loyalty. To the best of our knowledge, limited attentionhas been paid to these issues. Thus, the first objective of this study was to investigate how tourists’perceptions of two vital and ambivalent dimensions (local culture and sense of home) of the guesthouse affect their loyalty to guest houses in remote tourist destinations.
A steady flow of tourists is important for the sustainable development of remote touristdestinations [7–10]. Identifying the factors that significantly influence destination loyalty in remoteareas will assist remote destinations in obtaining regular tourists and sustainability. Recently, the crucialrole of destination loyalty in remote areas has been scrutinized. Tourists’ perception of memorableexperiences tends to have a positive effect on their destination loyalty [11]. GHRDs are usually
Sustainability 2019, 11, 3835; doi:10.3390/su11143835 www.mdpi.com/journal/sustainability93

Sustainability 2019, 11, 3835
recognized as a place for tourists to gain memorable experiences [12], not only for exotic localculture [13] but also for a sense of home [2]. Thus, tourists’ perception of the exotic local culture andsense of home in guest houses may have further effects on their loyalty to the destination. Based onthe above-mentioned factors, the second objective of this study was to examine the effect of tourists’perception of the guest house on their loyalty to the remote destination.
Cultural distance has received increasing attention from scholars, as cultural differences usuallycause different outcomes in tourists’ perceptions, preferences, and behaviors [14]. Various theories havebeen proposed to explain the complex phenomenon of cultural distance. For example, social identitytheory provides a perspective for explaining the cultural distance or cultural diversity. Social identitytheory posits that people are pleased when they attach themselves to groups that have positivestandings, since the belonging helps reinforce their self-concept with regards to their association withthe group. Social identity theory is an important theory in understanding diversity and it provides acultural perspective on intergroup relations. Existing research on cultural distance in tourism studyhas mainly focused on the cultural distance between the origin and destination countries and its effecton destination selections [15]. However, few studies have paid attention to the cultural distance ofdifferent areas within one country and its effect on tourist perceptions and experience. For example,for countries with a large size and multiple ethnic groups, such as China, the cultural distance betweendifferent areas can be significant. Groups in different areas are usually different in language (or dialect),food, architecture, and clothing styles, among other aspects. Tourists visiting the same destination areusually from different areas with different cultural distances, and this may affect their perception ofexotic local culture or sense of home in guest houses. Base on the above mentioned, the third objectiveof the study was to explore whether the effect of tourists’ perception of exotic local culture and sense ofhome on tourist behavioral intentions regarding guest houses would be significantly different betweentourists with a different cultural distance from remote destinations.
2. Literature Review
2.1. Guest House in Remote Tourist Destination
The guest house is a space where local residents share rooms of their private houses with tourists fortemporary lodging [16]. It is normally recognized as a type of small-scale or specialist accommodationthat is different from standard hotels [17,18]. Guest houses have been extended to all small-scaleaccommodation offered by hosts to provide tourists a chance to experience local cultures and lifestyles.Bed and breakfasts (B&Bs), homestay inns, and Airbnb, which provides local accommodation servicesthrough an emerging online system, are prominent guest house platforms. Differing from regularhotels, guest houses offer tourists not only food and services but also a place for additional experiences,such as interaction with local people [19,20], experience of local culture [21], and a sense of home [2,18].For example, GHRDs are a typical space for tourists experiencing the exotic local culture of remotedestinations, in which remote destinations are usually linked with descriptions of “wildness” or ofbeing “exotic” and have consumption value for tourists owing to their geographical and culturaldistance from tourists’ areas of origin [22–24].
2.2. Relationship between Tourist Perception of Exotic Local Culture, Sense of Home, and Loyalty in Guest Houses
Guest houses present an alternative to the traditional hotels and are gaining increasing attentionin tourism studies. Existing literature has identified some main characteristics of guest houses,focused on two types: the first type is on the traditional salient attributes, including comfort of bed,privacy, cleanliness [20], economic value [25], location [18], efficiency [26], facilities, and employees’empathy [13,26]; the second type contains items concerned with tourists’ engagement with remotedestinations, such as the unique characteristics of guest houses compared with regular hotels(e.g., the sense of home and exotic local culture) [20].
94

Sustainability 2019, 11, 3835
Exotic local culture is one significant indicator affecting tourists’ pursuit and experience in guesthouses in remote destinations [21]. GHRDs are mainly converted from local traditional houses,and thus they are a part of local heritage, as well as a place for tourists to experience local exotic culture.Existing empirical studies on heritage destinations have identified the positive relation between tourists’perception of authentic culture of heritage and behavioral intention [11]. Thus, tourists’ perception oflocal exotic culture in guest houses might have a positive influence on their loyalty to the guest house.
Sense of home has been identified as one of the most distinctive factors of guest houses in contrastwith regular hotels [18]. The sense of home is the feeling of home, which is an intangible quality of aplace with a strong, invisible, attractive pull for consumers in the service industry. Sense of home isnot only about the physical environment but also related with human interactions. In societies markedwith increasing mobility, sense of home is constructed and perceived not only in their own homesbut also during the trip and in remote destinations [2]. A positive relation has been found betweentourists’ perception of sense of home and their behavioral intentions in their utilization of guest housesin remote destinations [18]. Based on the above argument, the following hypotheses were formulated:
H1. Perceptions of exotic local culture has a positive relation with tourist loyalty to guest houses in remote destinations.
H2. Perceptions of sense of home has a positive relation with tourist loyalty to guest houses in remote destinations.
2.3. Relationship between Tourists’ Perception of Exotic Local Culture, Sense of Home, Loyalty to Guest House,and Loyalty of Tourist Destinations
Destination loyalty is one of the central issues for academics and professionals in tourismdestination marketing and management [27], as it affects tourists’ tendency to revisit or recommenddestinations [28] and further affects the profit generation in those destinations. Antecedents of tourists’destination loyalty have been identified, including not only the traditional salient attributes, such asservice quality, but also new emerging items, such as perception of culture [11] and sense of home [2].
Experiencing exotic local culture is a main motivation for tourists staying in guest houses inremote destinations [21]. Indeed, tourists’ perception of authentic culture has a positive effect ontourist behavioral intentions regarding the destination [11]. Thus, tourists’ perception of exotic localculture may have a positive effect on tourist loyalty to remote destinations. Sense of home is anotherunique trait of guest houses that could affect tourist behavioral intentions for remote destinations [18].Thus, tourists’ perception of sense of home in guest houses may have a positive influence on destinationloyalty. In addition, staying in a guest house is an important component for a memorable experience inremote destinations, as the guest house is considered a place for tourists to gain cultural experience anda sense of home [13]. Thus, tourists’ perception of staying in guest houses may have an effect on theirfurther consumption intention regarding the overall tourism product, or the entire experience of thetourist in the destination. Therefore, tourist behavioral intention regarding guest houses may affect theirbehavioral intention toward the overall destination. Thus, the following hypotheses were proposed:
H3. Perceptions of exotic local culture in guest houses has a positive relation with tourist loyalty to remote destination.
H4. Perceptions of sense of home in guest houses has a positive relation with tourist loyalty to remote destination.
H5. Guest house loyalty has a positive relation with destination loyalty.
2.4. Moderating Effect of Cultural Distance
Cultural distance is recognized as the cultural difference between the areas of origin and touristdestinations. For tourists coming from areas far from their destinations, the remote destinationrepresents a large distance, not only geographically but also culturally. Pursuing exotic culture isone of the main motivations for tourists visiting remote destinations [21,23]. Exotic local culture in
95

Sustainability 2019, 11, 3835
remote tourist destinations usually means the difference between the destination and the tourists’area of origin [24]. Cultural difference is considered an important attraction for tourists to visitdestinations [21]. Larger cultural distance means higher level of being “different” and “exotic,” andmight be an attractive element for tourists. Guest houses in remote tourist destinations of one countryserve a place that provides exoticism and uniqueness with respect to the areas of origin of touriststhat are far from the destinations [21]; the larger the cultural distance between the origin and theremote destination, the more attractiveness to tourists. Thus, the cultural distance between the remotedestination and the areas of origin may have a positive effect on tourist preference of the destination.This effect may not only occur during destination selection but continue during tourist experiences inremote destinations.
Existing research has focused on cultural distance between countries and its effect on internationaltourist destination selection [29,30]. However, cultural distance within one country can be significant,especially for countries with a large size and multiple ethnic groups. Tourists visiting remote touristdestination and staying in guest houses are usually from different areas of origin in one country,which means they usually have varied geographical and cultural distances from the remote destinations.Thus, the cultural distance between different areas within the same country may have an effect ontourists’ preferences and attitudes toward the tourism product. For example, tourists from areas oforigin with higher cultural distances from the remote destination may be more attracted by the exoticlocal culture of the guest house. In contrast, tourists from areas of origin with lower cultural distancesfrom the remote destination are more familiar with the culture, and thus, the exotic local culture ofthe guest house seems not so attractive for these tourists. Therefore, tourists from different culturalbackgrounds may gain different perceptions of the exotic local culture of the guest house, which mayfurther lead to varied behavioral intentions to guest houses in remote destinations. Based on these,the following hypothesis was proposed:
H6. The effect of tourists’ perception of exotic local culture in guest houses on tourist behavioral intentionsregarding guest houses in remote destinations would be significantly different between tourists with a differentcultural distance from the remote destinations.
Sense of home is the feeling of home, and usually encompasses the feeling of warmth andsafety [31,32]. Tourists from different origins with varied cultural distances from remote destinationsmay form different perceptions of the sense of home. Cultural distance is also regarded as barriers fortourists visiting destinations with different cultures, religions, customs, or languages [29], and differentcultural distances lead to varied perceptions of risk and safety by tourists [33]. This tendency hasa further influence on the perception of sense of home. For instance, tourists with lower culturaldistance are usually more familiar with the languages, diet, customs, and habits of their destination [34].They perceive fewer barriers and risks, and thus, they feel safer and more familiar, which contributesto a higher perception of sense of home in guest house [21]. In contrast, tourists with higher culturaldistance usually perceive more barriers and risks and feel unsafe in a guest house in a remote destination,which may further influence their perception of sense of home in the guest house. Therefore, touristsoriginating from different cultural distances in the remote destination may hold varied perceptions ofsense of home of the guest house, which may further lead to verified behavioral intentions towardspecific guest houses in the remote destinations. Based on the rationale provided above, this studyproposed the following hypotheses (see Figure 1):
H7. The effect of tourists’ perception of sense of home in guest houses on tourist behavioral intentions regardingguest houses in remote destinations would be significantly different between tourists with different culturaldistances from the remote destinations.
96
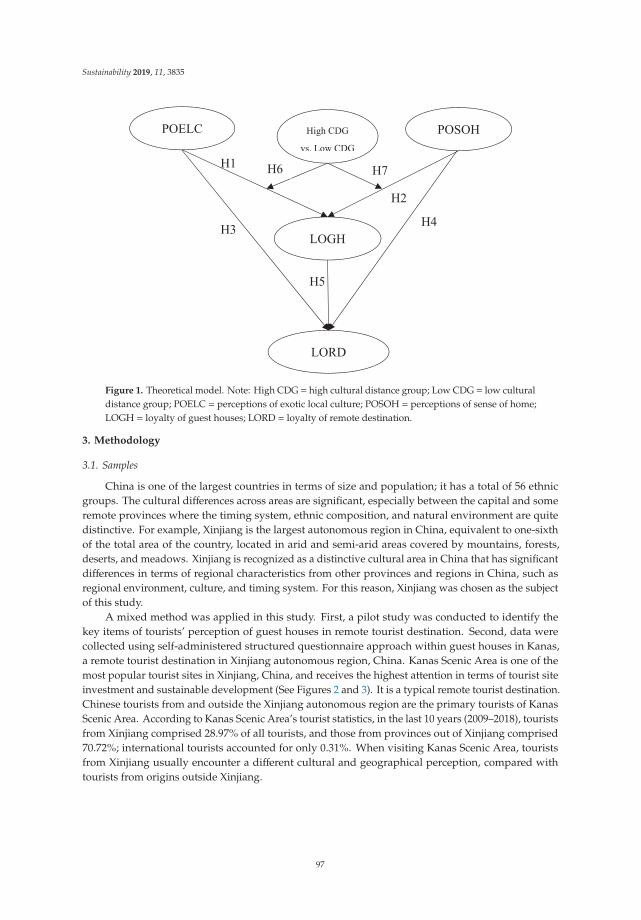
Sustainability 2019, 11, 3835
Figure 1. Theoretical model. Note: High CDG = high cultural distance group; Low CDG = low culturaldistance group; POELC = perceptions of exotic local culture; POSOH = perceptions of sense of home;LOGH = loyalty of guest houses; LORD = loyalty of remote destination.
3. Methodology
3.1. Samples
China is one of the largest countries in terms of size and population; it has a total of 56 ethnicgroups. The cultural differences across areas are significant, especially between the capital and someremote provinces where the timing system, ethnic composition, and natural environment are quitedistinctive. For example, Xinjiang is the largest autonomous region in China, equivalent to one-sixthof the total area of the country, located in arid and semi-arid areas covered by mountains, forests,deserts, and meadows. Xinjiang is recognized as a distinctive cultural area in China that has significantdifferences in terms of regional characteristics from other provinces and regions in China, such asregional environment, culture, and timing system. For this reason, Xinjiang was chosen as the subjectof this study.
A mixed method was applied in this study. First, a pilot study was conducted to identify thekey items of tourists’ perception of guest houses in remote tourist destination. Second, data werecollected using self-administered structured questionnaire approach within guest houses in Kanas,a remote tourist destination in Xinjiang autonomous region, China. Kanas Scenic Area is one of themost popular tourist sites in Xinjiang, China, and receives the highest attention in terms of tourist siteinvestment and sustainable development (See Figures 2 and 3). It is a typical remote tourist destination.Chinese tourists from and outside the Xinjiang autonomous region are the primary tourists of KanasScenic Area. According to Kanas Scenic Area’s tourist statistics, in the last 10 years (2009–2018), touristsfrom Xinjiang comprised 28.97% of all tourists, and those from provinces out of Xinjiang comprised70.72%; international tourists accounted for only 0.31%. When visiting Kanas Scenic Area, touristsfrom Xinjiang usually encounter a different cultural and geographical perception, compared withtourists from origins outside Xinjiang.
97

Sustainability 2019, 11, 3835
Figure 2. Location of remote destination of Kanas in Xinjiang, China.
Figure 3. Location of guest houses in Kanas.
The primary data was obtained by face-to-face interviews by using a self-administeredquestionnaire with a convenience sampling procedure. Questionnaires were distributed by a researchteam to two groups of tourists from origins with different cultural distances from the remote destinationof Kanas: tourists from Xinjiang, and from outside of Xinjiang. Most of the questionnaires were
98

Sustainability 2019, 11, 3835
completed in public spaces at the guest houses, such as the yard and dining room. A total of 288respondents were retained for research after removing cases that had missing values—139 respondentswere from Xinjiang (48%), and 149 respondents were from areas outside Xinjiang (52%). Xinjiang isconsidered as one of the most diverse linguistic and cultural communities in China, with a number ofethnic groups. Natural scenery and ethnic culture attract numerous domestic tourists to Xinjiang.
3.2. Measures
Direct measures were used in the assessment of these five latent constructs: perception onexotic local culture in guest houses, perception on sense of home in guest houses, loyalty to guesthouses, destination loyalty, and demographic profile (including items of gender, age, education level,past experience, and length of stay in the guest house).
Perception on exotic local culture in guest houses. Four items were drawn from relevant prior researchto better fit it within the context of guest house in remote destinations. These four items were assessedusing a seven-point Likert scale, where 1 = strongly disagree, and 7 = strongly agree. Items included thefollowing: “I perceived the exotic local culture in the guest house from its local exterior architecture,”“I perceived the exotic local culture in the guest house from its local interior decorations,” “I perceivedthe exotic local culture in the guest house from the clothing of its reception staff,” and “I perceived theexotic local culture in the guest house from the accents of its reception staff.”
Perception on sense of home in guest houses. Four items were modified from prior relevant research tomake the questionnaire fit the context of guest houses in remote destinations. Tourists’ perceptions ofsense of home was assessed using seven-point response scales. The scales used anchors of 1 = stronglydisagree, and 7 = strongly agree. Items included the following: “I perceived the sense of home in theguest house from the time spent eating,” “I perceived the sense of home in the guest house from timespent chatting with other tourists in the guest house,” “I perceived the sense of home in the guesthouse from the familiar environment,” and “I perceived the sense of home in the guest house from myfeeling of being safe while staying there.”
Loyalty of guest house. Four items were taken from prior studies. Respondents were asked torespond to each statement in terms of their own degree of agreement or disagreement based on aseven-point Likert scale (i.e.., 1 = strongly disagree, and 7 = strongly agree). Items included thefollowing: “I will stay in this guest house again next time when visiting this destination,” “I will speakpositively about the guest house,” “I will recommend this guest house to my friends and relatives,”and “I am satisfied with my stay in this guest house.”
Loyalty of the remote destination. Four items were taken from prior studies. A seven-point Likert scaleranging from strongly disagree (1) to strongly agree (7) was used to indicate responses. Items includedthe following: “I will visit this destination again next time,” “I will speak positively about thedestination,” “I will recommend this tourist destination to my friends and relatives,” and “I am satisfiedwith my visit to this destination.”
4. Results
4.1. Comparison the Profile Distribution of High and Low Cultural Distance Tourists
Table 1 presents the basic information of the respondents. Apart from sex, a significant differencewas observed between the two types of cultural distance tourists in terms of demographic characteristics.Low cultural distance tourists’ age was concentrated in the 19–29 years range (37.1%), whereas highcultural distance tourists’ age was in the range of 30–39 years (29.5%). Most of the high culturaldistance tourists had a college or higher education. For almost all of the high cultural distance tourists,it was their first time to travel in Kanas area (90.7%), compared with the low cultural distance tourists(62.9%). In terms of the length of stay, 80% of low cultural distance tourists’ visits lasted for less thanone night or one night, whereas 20% of them stayed for two nights. For high cultural distance tourists,68.1% stayed less than one night or for a one night stay, and 19.6% of them stayed for two night stays.
99

Sustainability 2019, 11, 3835
Table 1. Demographic profile of respondents.
Low Distance Cultural Tourist(N = 139)
High Distance Cultural Tourist(N = 149)
Frequencies % Frequencies %
GenderMale 67 48.4 72 48.2
Female 72 51.6 77 51.8Age<19 7 4.8 17 11.6
19–29 52 37.1 35 23.730–39 29 21 44 29.540–49 40 29 38 25.450–59 7 4.8 13 8.9
60 or over 4 3.2 1 0.9Education levelPre-high school 11 8.1 7 4.9
High school 25 17.7 15 10.2Vocational training 38 27.4 29 19.6
University 60 43.5 74 49.8Postgraduate or over 4 3.2 23 15.6
Past experienceFirst-time visit 87 62.9 135 90.7Repeated visit 52 37.1 14 9.3
Length of stay (nights)Less than 1 night or 1 night 111 80 101 68.1
2 Nights 28 20 29 19.63–4 Nights 0 0 16 10.6
5 Nights or over 0 0 3 1.7
4.2. Confirmatory Factor Analysis
A confirmatory factor analysis (CFA) was implemented to validate the internal and externalconsistency of the study’s constructs. Four competing measurement models were directly comparedto estimate the appropriate model. The results of the four model comparison are given in Table 2.The proposed measurement model with a four-dimensional structure was first specified (Model 1:χ2 = 129.05; df = 98; GFI = 0.95; RMSEA = 0.03; CFI = 0.99) and compared with alternative models.Incorporating POELC and POSOH into one single factor, a three-factor model was specified (Model 2:χ2 = 1232.70; df = 101; GFI =0.62; RMSEA = 0.20; CFI = 0.81). A two-factor model, where POELC,POSOH, and LOGH statements were constrained on a single construct was then specified (Model 3:χ2 = 2333.55; df = 103; RMSEA = 0.27; CFI = 0.46; GFI = 0.63). The four-factor model with a one-factormodel, in which all attributes were joined together (Model 4: χ2 = 3285.99; df = 104; GFI = 0.48; RMSEA= 0.33; CFI = 0.38), was finally identified. Compared with the other competing models, the proposedfour-factor model provided a good fit to the given data and indicated clear superiority.
The results of the measurement model are shown in detail in Table 3. The model provided anadequate fit to the data (χ2 = 129.05, df = 98, CFI = 0.99, GFI = 0.95, NFI = 0.98). Root mean squareerror of approximation (RMSEA) = 0.03, less than the recommended 0.08 threshold. The item loadingswere also examined to estimate convergent validity. The item loadings in our proposed model weresignificant and surpassed 0.50. Discriminant validity was further validated as the average varianceextracted (AVE) for each factor exceeded the squared correlation between any pair of factors (e.g.,ranging from 0.83 to 0.92).
100

Sustainability 2019, 11, 3835
Ta
ble
2.
Mod
elco
mpa
riso
ns.
Mo
dels
Fact
ors
χ2
df
CF
IG
FI
RM
SE
AC
om
pari
son
Δ2
Δd
f
Mod
el1
Four
fact
ors
129.
0598
0.99
0.95
0.03
Mod
el2
Thr
eefa
ctor
s,ba
sed
onM
odel
1,PO
ELC
.and
POSO
H,
wer
eco
mbi
ned
into
one
fact
or12
32.7
010
10.
810.
620.
201
vs.2
1103
.65
**3
Mod
el3
Two
fact
ors,
base
don
mod
el1,
POEL
C,P
OSO
H,a
ndLO
GH
,wer
eco
mbi
ned
into
one
fact
or23
33.5
510
30.
460.
630.
271
vs.3
1100
.85
**2
Mod
el4
One
fact
or;a
llfo
urfa
ctor
sw
ere
com
bine
din
toon
efa
ctor
.32
85.9
910
40.
380.
480.
331
vs.4
952.
44**
1
Not
e:**
p<
0.01
.
Ta
ble
3.
Mea
sure
men
tmod
el.
Path
sL
oad
ing
s(t
-Valu
e)
Reli
ab
ilit
yS
kew
ness
;K
urt
osi
sE
rro
rV
ari
an
ceIt
em
R-S
qu
are
loya
lty
ofgu
esth
ouse
sC
R=
0.98
,AV
E=
0.92
LOG
H→
LOG
H1
0.98
***
−0.5
8;−0
.48
0.04
0.96
LOG
H→
LOG
H2
0.98
***(
56.4
0)−0
.64;−0
.30
0.04
0.96
LOG
H→
LOG
H3
0.97
***(
51.9
6)−0
.64;−0
.43
0.06
0.94
LOG
H→
LOG
H4
0.90
***(
32.3
5)−0
.67;−0
.35
0.19
0.82
perc
epti
ons
ofse
nse
ofho
me
CR=
0.96
,AV
E=
0.86
POSO
H→
POSO
H1
0.89
***
−0.4
6;−0
.53
0.21
0.79
POSO
H→
POSO
H2
0.97
***(
28.3
2)−0
.57;−0
.32
0.07
0.94
POSO
H→
POSO
H3
0.93
***(
25.2
0)−0
.68;−0
.27
0.14
0.86
POSO
H→
POSO
H4
0.93
***(
25.7
5)−0
.45;−0
.54
0.13
0.87
perc
epti
ons
ofex
otic
loca
lcul
ture
CR=
0.95
,AV
E=
0.84
POEL
C→
POEL
C1
0.90
***
−0.4
7;−0
.64
0.20
0.80
POEL
C→
POEL
C2
0.90
***(
23.9
2)−0
.38;−0
.46
0.19
0.81
POEL
C→
POEL
C3
0.89
***(
23.1
2)−0
.40;−0
.46
0.21
0.79
POEL
C→
POEL
C4
0.98
***(
29.5
4)−0
.41;−0
.53
0.05
0.95
loya
lty
ofre
mot
ede
stin
atio
nC
R=
0.95
,AV
E=
0.83
LOR
D→
LOR
D1
0.90
***
−0.5
6;−0
.33
0.19
0.81
LOR
D→
LOR
D2
0.90
***(
24.1
9)−0
.43;−0
.42
0.19
0.81
LOR
D→
LOR
D3
0.89
***(
23.0
9)−0
.49;−0
.39
0.22
0.78
LOR
D→
LOR
D4
0.96
***(
28.7
7)−0
.59;−0
.25
0.08
0.93
Fiti
ndic
esof
the
refle
ctiv
em
easu
rem
entm
odel
:χ2(
d.f.)=
129.
05(9
8),p<
0.00
(χ2/
d.f.=
1.32
);C
FI=
0.99
;GFI=
0.95
;NFI=
0.98
;RM
SEA=
0.03
;SR
MR=
0.03
Not
e.**
*p<
0.00
.The
aver
age
vari
ance
extr
acte
d(A
VE)
and
the
com
posi
tere
liabi
lity
(CR
)app
ear
inth
ere
flect
ive
scal
esto
evid
ence
relia
bilit
y.
101

Sustainability 2019, 11, 3835
4.3. Hypothesis Testing
Maximum likelihood estimation of the structural equation model (SEM) was adopted to test theproposed conceptual model in Figure 1. SEM provides appropriate measures that allow the statisticalevaluation of overall model fit. The model indicated acceptable fit, except for the chi-square values,owing to the sample size. Other fit indices for the proposed model were above the criterion levels.Tourists’ perceptions of exotic local culture and sense of home significantly influenced tourists’ loyaltyto guest houses in remote tourist destinations (γ = 0.25, p < 0.01; γ = 0.46, p < 0.01, respectively),thus supporting H1 and H2. The results indicated that tourists’ perceptions of exotic local culturewould have a significantly positive effect on their loyalty to the remote destination (γ = 0.22, p < 0.01),thus supporting H3. However, tourists’ perceptions of sense of home did not have a significantrelation with loyalty to remote destination (γ = 0.07, p > 0.05); H4 was not supported. Intuitively,if a place invokes a sense of belonging to a home, tourists could derive more loyalty from that travelexperience. However, additional factors, such as overall satisfaction, place attachment, and personalitytraits, may intervene in this path, providing an adequate explanation for this non-significant finding.Finally, tourist’s loyalty to guest houses was also positively correlated with loyalty to remote destinations,and H5 was significantly supported (γ = 0.51, p < 0.01) (See Figure 4).
p
p
p
p
p
Figure 4. Results of SEM.
4.4. Invariance Test of Measurement Model
The respondents were divided into two groups according to cultural distance. The high and lowcultural distance groups included 149 and 139 participants, respectively. The equality constraints foritem loadings across two groups were examined (see Table 4). The unconstrained model was identifiedby conducting CFA for these two groups without loadings. A full metric invariance model wasthen specified by conducting CFA for the two groups with fixed loadings. The unconstrained modeland full-metric invariance model were subsequently compared. The results showed no statisticallysignificant difference between the two models (χ2 (12) = 12.98, p = 0.370). Thus, the measurementstructure was unaffected by changes in different cultural distance groups.
102

Sustainability 2019, 11, 3835
Table 4. Measurement invariance test.
Group Models χ2 df RMSEA CFI NFI Δχ2Full-MetricInvariance
CulturalNon-restricted
mode 147.04 102 0.04 0.99 0.97 Δχ2 (12) = 12.98p = 0.370
(insignificant)
Supported
Full-metricinvariance 160.02 114 0.04 0.99 0.97
4.5. Invariance Test of Structural Model
Table 5 shows the results of the invariance test. The baseline models for the two cultural distancegroups were consistent with the data (χ2 = 147.0, CFI = 0.991; GFI = 0.922, IFI = 0.991, RMSEA = 0.039).Parameters were estimated as sequentially equal to evaluate the equality of the specific paths of thesetwo groups. The baseline and other nested models were compared by a chi-square difference test.A certain parameter constraint in the different cultural distance groups was first specified. The resultsindicated statistically significant differences between the two groups. The relation between perceptionsof exotic local culture and tourists’ loyalty to guest houses was significantly affected by cultural distance(χ2 (1) = 9.8; p = 0.0017). Perceptions of exotic local culture had a larger impact on high cultural distancetourists’ loyalty to guest houses (γ = 0.45, p < 0.01) compared with low cultural distance tourists(γ = 0.19, p > 0.05); thus, H6 was supported. Regarding the relation between tourists’ perceptions ofsense of home and their loyalty to guest houses, the relations in the high and low cultural distancegroups were significantly different (χ2 (1) = 5.4, p = 0.0201) for low cultural distance tourists; theirperceptions of sense of home had a greater impact on their loyalty to guest houses (γ = 0.54, p < 0.01)compared with high cultural distance tourists (γ = 0.33, p < 0.01). Thus, H7 was supported.
Table 5. Invariance tests of the structural models for cultural distance groups.
Paths Low CDG High CDG Baseline Model(Freely Estimated)
Nested Model(Constrained to Be Equal)
Coefficients t Value Coefficients t Value
POELC→LOGH 0.19 2.12 0.45 5.76 Δχ2 (102) = 147.0 Δχ2 (103) = 156.8 a
POSOH→LOGH 0.54 6.47 0.33 4.38 Δχ2 (102) = 147.0 Δχ2 (103) = 152.4 b
Baseline model fit: χ2(102) = 147.037 (p < 0.01); CFI = 0.991; GFI = 0.922, IFI = 0.991, RMSEA = 0.039
a: Δχ2 (1) = 9.8; p = 0.0017 < 0.01(significant); b: Δχ2 (1) = 5.4; p = 0.0201 < 0.05(significant).
5. Discussion
Guest houses receive increasing attention both in the academe and industry. Although tourists’complicated demands for both exotic culture and sense of home in tourist destinations have beenreported by prior research, there is limited research on tourists’ perception of exotic local culture andsense of home in guest houses. Using guest houses as the research context, this study attemptedto develop and test empirically an integrated model of the relation among tourists’ perception ofexotic local culture, tourists’ perception of sense of home, guest house loyalty, and destination loyalty.Results demonstrated that both tourists’ perception of exotic local culture and sense of home had asignificant positive effect on tourists’ loyalty to guest houses in remote destinations. The current studyalso aimed to contribute to and extend prior research by conceptualizing and empirically testing themoderating effect of cultural distance between tourists’ perceptions of exotic local culture, sense ofhome, and guest house loyalty. Results indicated that tourists with high cultural distance staying inguest houses perceived a higher level of exotic local culture but lower level of sense of home comparedwith those with lower cultural distance (See Table 6).
103

Sustainability 2019, 11, 3835
Table 6. The results of hypothesis testing.
Paths Proposed Direction Results
Exotic local culture → Loyalty to guest houses + SupportedSense of home → Loyalty to guest houses + SupportedExotic local culture → Loyalty to remote destinations + Supported
Sense of home → Loyalty to remote destinations +Not
supportedExotic local culture → Loyalty to remote destinations + SupportedExotic local culture → Loyalty to guest houses (High vs. Low) n.a. SupportedSense of home → Loyalty to guest houses (High vs. Low) n.a. Supported
5.1. Theoretical Contributions
The current research makes three major contributions to the body of research in tourism.First, our results documented that tourists’ perception of exotic local culture and sense of homeduring their stay in guest houses in remote destinations have a significant positive effect on theirguest house loyalty. Although research has identified tourists’ demand and motivation for culturalexperience in guest houses and their pursuit of sense of home, which are important attributes for thesuccessful operation of guest houses, few efforts have been directed toward measuring the effect ofcultural experience and sense of home in guest houses on willingness to re-consume the experienceoffered at guest houses in remote destinations. This study contributes to this gap by measuring touristperception of exotic local culture and sense of home in guest houses and examining their relation toloyalty to guest houses. This study confirmed that experiences of exotic local culture and sense ofhome are important attributes for guest houses to attract tourists to re-consume the guest house orrecommend it to others. In addition, this study also contributes to existing literature for advancingthe understanding of the ambivalence of modernity in tourism by conducting empirical studies oftourist behaviors in guest houses in remote destinations. Although research has suggested that tourists’imagination of remote destination as “exotic” is an advantage for remote tourist destinations [35],and the positive effect of tourist perception of exotic local culture on guest house loyalty echoes this,the current study also revealed the positive effect of tourist perception of sense of home on guest houseloyalty. This other side sheds light on tourists’ preference of sense of home also existing during theirstay in guest houses in remote destinations. The results of this study implied that “home” and “away”are not strictly two separate sides; tourists staying in guest houses in remote destinations pursue bothsense of “home” and the “destination far away”.
Second, this study reported that tourists’ perception of exotic local culture in guest houseshas a significant positive effect on their behavioral intention with respect to the remote destination.Destination loyalty is an important issue for tourism destination marketing and management. Researchhas identified the positive effects of tourists’ cultural experience and perception of cultural items ondestination loyalty. Although the guest house is identified as a place to experience local culture, andthus, the guest house in a remote destination provides tourist cultural experience, to our knowledge,very few studies have paid attention to the relation between tourists’ perception of cultural experiencesin guest houses and their loyalty to the destination. This study has been one of the first attempts tothoroughly examine the relation between tourists’ perception of exotic local culture in guest housesin remote destinations and destination loyalty. The results showed the positive effect of tourists’perception of exotic local culture of guest houses on their loyalty to the remote destination. The resultsalso demonstrated that tourists’ loyalty to guest houses significantly and positively affect their loyaltyto the destination. These results imply the role of guest houses as a cultural attraction to remotedestinations. Based on the outcomes, tourism and destination administration institutions should paymore attention to the regulation and sustainable development of guest houses in remote destinations.Besides, this finding also underlines the importance of tourists’ perception of “exotic” culture in remotetourist destinations, which is in line with the previous literature’s position that tourists visiting remotedestinations are motivated by the pursuit of the “unfamiliar” and “exotic.”
104

Sustainability 2019, 11, 3835
Third, this study investigated the moderating effect of culture distance on the relation betweentourist perception of exotic local culture or sense of home and loyalty to guest houses in remotedestinations. This study extended the theories of social identity in a tourism context. Cultural distancehas been reported to affect micro tourist international destination selection behaviors and macrointernational tourist flows. The present study contributes to knowledge of cultural distance byinvestigating the effect of cultural distance between tourists from areas within the same country.Indeed, cultural distance affects tourist behavior not only during transnational travel but also indomestic travel. Our results documented that domestic tourists’ cultural distance has a moderatingeffect on both the relation of tourists’ perception of exotic local culture, sense of home, and loyaltyto guest houses in remote destinations. For example, for tourists with higher cultural distance froma remote destination, their perception of exotic local culture would have a greater impact on theirloyalty to guest houses. For tourists originating from lower cultural distance from the destination,their perception of sense of home would have a greater effect on their loyalty to guest houses.The current work also advances our understanding of cultural distance by examining its effect onbroader tourist behaviors, extending beyond destination selection, given that it moderates the relationbetween tourist perception and loyalty to guest houses in remote destinations.
5.2. Managerial Implications
As guest houses are becoming hot spots for investment, competition is becoming increasinglyfierce, especially after the boom of various online reservation platforms for guest houses, such asAirbnb and Booking.com. The findings of the current study offer three suggestions for destinationmarketers and operators to develop properly effective promotion and operation strategies.
First, according to the finding on the positive effect of tourist perception of exotic local cultureand sense of home on loyalty to guest houses in remote destinations, many interesting and managerialimplications of high utility can be derived. For example, guest house operators should reproducethe space of the guest house to maintain the exotic local culture through various methods, such asmaintaining exotic local-style architecture, embedding more local symbols in decorations, inspiring thewearing of local traditional dress or hair, making local food, and living the local life style in guest houses.Guest house operators should construct an environment with a sense of home through providingmore home-like interactions, comforts, relaxation, and convenience to tourists. For instance, operatorsshould provide various food and rooms for different tourists, such as providing local snacks or roomswith local-style decorations of the remote destination, food with similar flavors from origin home,and room decorations and facilities that provide a sense of modern similarity to home (e.g., sheetswith popular drawings and design). Further, the complementary toiletries should be replaced byreusable items with more modern design, similar to those used at home, which also embraces the ideaof environmental protection in many tourists’ ordinary lives.
Second, this study found that tourists’ perceptions of local exotic culture has a positive effect onloyalty to the destination where the guest house is located. This finding confirmed that staying in guesthouses is an important component of the tourism product of remote destinations; thus, tourism anddestination administration institutions should pay more attention to the regulation and sustainabledevelopment of guest houses in remote destinations. Our finding also underlines the importanceof tourists’ perception of the “exotic” culture in remote tourist destinations. These findings providenotable information for tourist administrations in remote destinations, highlighting the significance oftourists’ experience and perception of the local exotic culture in guest houses. For instance, picturesand positive comments of the guest houses with local-style decorations should be added in touristdestination marketing materials; more pictures of destinations could be hung in the sitting room orreception of guest houses to strengthen ties between the guest house and the destination.
Third, this study identified the moderating role of cultural distance in the relation betweentourists’ perception of exotic culture, sense of home, and loyalty to guest houses in remote destinations.According to these findings, several important implications are provided, both for the marketing and
105
Sustainability 2019, 11, 3835
operation of guest houses in remote destinations. For instance, customized marketing materials ofguest houses in remote destinations should be made according to the groups’ cultural distance fromthe destination. Marketing materials distributed to potential tourists with higher cultural distancefrom the destination (such as provinces out of Xinjiang in this study) should leave more space for theintroduction of the exotic local culture of guest houses, such as the local building, local food, and localattire. Meanwhile, the marketing materials distributed to tourists with lower cultural distances fromthe destination should pay more attention to the narration of the guest houses’ sense of home, such asproviding more pictures to demonstrate the comfort, decorations, and environment of the guesthouse resembling a home. Guest house can also provide alternative types of rooms according totourists with different cultural distances. Higher cultural distance tourists can be allocated roomswith more sense of home, in terms of decorations and facilities that may be similar to their ordinarylifestyle. Lower cultural distance tourists may appreciate rooms with more decoration and furniturethat represent the exotic local culture of remote destinations.
6. Limitations and Suggestions for Future Studies
Several limitations to this study need to be recognized, as they point to future research directions.First, the targeted respondents of this study were Chinese tourists. Tourists from different countriesmay have different behaviors, characteristics, and preferences. For instance, tourists from the UnitedStates, who would have cultural practices or values different to those in China, may behave in differentways and have varied preferences and perception of exotic local culture and sense of home whenstaying in guest houses in remote destinations. The moderating effect of cultural distance for touristsfrom other countries staying in guest houses may evoke a different result if studied in the context ofother countries. Future studies could include Westerners and explore the potential difference of theirperceptions on guest houses in remote destinations.
Second, there is a lack of generalizability in the sample of this study. The data were collectedfrom only one typical remote tourist area in northwest China during summer, which may have led tonon-response bias and posed a potential risk to the interpretation of study outcomes. For instance,there are more cultural festivals in winter, which may attract tourists with more sensibility to exoticcultures and those who are from areas with low and high cultural distances. Therefore, participantsmay have reported different attitudes if the research was conducted in a different season. Future studiescould take into consideration the seasonal changes and collect more reliable data across different timeperiods to further validate the current conclusive model.
Third, we only included cultural distance as the moderating variable. However, there are numerousvariables, such as age, education, and sex, which might also affect the relation between tourists’ perceptionof exotic local culture, sense of home, and loyalty to guest houses. Future studies could use them tovalidate further the relation between tourists’ perception of exotic local culture, sense of home, and guesthouse loyalty.
Author Contributions: The three authors made substantial contributions to conception and design and participatedin drafting the article or revising it critically for important intellectual content. They made the broadest rangeof different contributions. For example, T.(T.)S. developed the theoretical framework and quantitative researchdesign. As the principal investigator, T.(T.)S. provided conceptual and technical guidance for aspects of the project.B.H. provided a critical revision of the manuscript. J.(J.)L. performed and analyzed the data. These three authorsgave final approval of the version to be submitted.
Funding: This work was supported by the National Natural Science Foundation of China [grant number 41501158].
Conflicts of Interest: The authors declare no conflict of interest.
References
1. Franklin, A. Tourism as an ordering: Towards a new ontology of tourism. Tour. Stud. 2004, 4, 277–301.[CrossRef]
106

Sustainability 2019, 11, 3835
2. Su, X. Tourism, modernity and the consumption of home in China. Trans. Inst. Br. Geogr. 2014, 39, 50–61.[CrossRef]
3. Willis, C.; Ladkin, A.; Jain, J.; Clayton, W. Present whilst absent: Home and the business tourist gaze.Ann. Tour. Res. 2017, 63, 48–59. [CrossRef]
4. Pearce, P.L. The experience of visiting home and familiar places. Ann. Tour. Res. 2012, 39, 1024–1047.[CrossRef]
5. Wildish, B.; Kearns, R.; Collins, D. At home away from home: Visitor accommodation and place attachment.Ann. Leis. Res. 2016, 19, 117–133. [CrossRef]
6. Wu, X.; Shen, J. A study on airbnb’s trust mechanism and the effects of cultural values—Based on a survey ofChinese consumers. Sustainability 2018, 10, 3041. [CrossRef]
7. Gutiérrez-Taño, D.; Garau-Vadell, J.B.; Díaz-Armas, R.J. The Influence of Knowledge on Residents’ Perceptionsof the Impacts of Overtourism in P2P Accommodation Rental. Sustainability 2019, 11, 1043. [CrossRef]
8. Jia, S.S. Leisure Motivation and Satisfaction: A Text Mining of Yoga Centres, Yoga Consumers, and TheirInteractions. Sustainability 2018, 10, 4458. [CrossRef]
9. Muresan, I.C.; Harun, R.; Arion, F.H.; Oroian, C.F.; Dumitras, D.E.; Mihai, V.C.; Chiciudean, G.O. Residents’Perception of Destination Quality: Key Factors for Sustainable Rural Development. Sustainability 2019, 11, 2594.[CrossRef]
10. Schmallegger, D.; Carson, D. Is tourism just another staple? A new perspective on tourism in remote regions.Curr. Issues Tour. 2010, 13, 201–221. [CrossRef]
11. Yi, X.; Fu, X.; Yu, L.; Jiang, L. Authenticity and loyalty at heritage sites: The moderation effect of postmodernauthenticity. Tour. Manag. 2018, 67, 411–424. [CrossRef]
12. Chen, J. The Impact of Bed and Breakfast Atmosphere, Customer Experience, and Customer Value onCustomer Voluntary Performance: A Survey in Taiwan. Asia Pac. J. Tour. Res. 2015, 20, 541–562. [CrossRef]
13. Tichaawa, T.; Mhlanga, O. Guest Experiences of Service Quality in Bed and Breakfast Establishments in EastLondon, South Africa. J. Hum. Ecol. 2015, 50, 93–101. [CrossRef]
14. Whang, H.; Yong, S.; Ko, E. Pop culture, destination images, and visit intentions: Theory and research ontravel motivations of Chinese and Russian tourists. J. Bus. Res. 2016, 69, 631–641. [CrossRef]
15. Yang, Y.; Wong, K.F. The influence of cultural distance on China inbound tourism flows: A panel data gravitymodel approach. Asian Geogr. 2012, 29, 21–37. [CrossRef]
16. Kuo, F.; Kuo, C. Integrated Bed and Breakfast into Eco-tourism in Guan Ziling areas in Taiwan. Soc. Behav.Sci. 2012, 57, 503–510. [CrossRef]
17. Sung, E.; Kim, H.; Lee, D. Why Do People Consume and Provide Sharing Economy Accommodation?—ASustainability Perspective. Sustainability 2018, 10, 2072. [CrossRef]
18. Wang, S.; Hung, K. Customer perceptions of critical success factors for guest houses. Int. J. Hosp. Manag.2015, 48, 92–101. [CrossRef]
19. Malazizi, N.; Alipour, H.; Olya, H. Risk perceptions of airbnb hosts: Evidence from a mediterranean island.Sustainability 2018, 10, 1349. [CrossRef]
20. Wang, S.; Hung, K.; Li, M. Development of measurement scale for functional congruity in guest houses.Tour. Manag. 2018, 68, 23–31. [CrossRef]
21. Wang, Y. Customized authenticity begins at home. Ann. Tour. Res. 2007, 34, 789–804. [CrossRef]22. Anderson, A.R. Paradox in the periphery and entrepreneurial reconstruction? Entrep. Reg. Dev. 2000, 12, 91–109.
[CrossRef]23. Brown, F.; Hall, D. Introduction: The Paradox of Periphery. In Tourism in Peripheral Areas: Case Studies;
Channel View Publications: Bristol, UK, 2000; pp. 1–7.24. Irvine, W.; Anderson, A.R. The Vulnerability of Peripheral Tourism: The Rapid Disenchantment of Peripheral
Attraction. In Tourism in Peripheries: Perspectives from Far North and South; CABI: Wallingford, UK, 2007;pp. 109–123.
25. Amoah, F.; Radder, L.; van Eyk, M. Perceived experience value, satisfaction and behavioural intentions:A guest house experience. Afr. J. Econ. Manag. Stud. 2016, 7, 419–433.
26. Wu, W.; Yang, C. An empirical study on the impact of differences in bed and breakfast service qualityattributes on customers’ revisiting desires. Int. J. Organ. Innov. 2010, 2, 223–240.
27. Baloglu, S. Image variations of Turkey by familiarity index: Informational and experiential dimensions.Tour. Manag. 2001, 22, 127–134. [CrossRef]
107

Sustainability 2019, 11, 3835
28. Yoon, Y.; Uysal, M.S. An examination of the effects of motivation and satisfaction on destination loyalty:A structural model. Tour. Manag. 2005, 26, 45–56. [CrossRef]
29. Basala, S.L.; Klenosky, D.B. Travel style preferences for visiting a novel destination: A conjoint investigationacross the novelty-familiarity continuum. J. Travel Res. 2001, 40, 172–182. [CrossRef]
30. Ng, S.I.; Lee, J.A.; Soutar, G.N. Tourists’ intention to visit a country: The impact of cultural distance.Tour. Manag. 2007, 28, 1497–1506. [CrossRef]
31. Dyuvendak, J.W. The Politics of Home; Palgrave Macmillan: New York, NY, USA, 2011.32. Smith, S.G. The essential qualities of a home. J. Environ. Psychol. 1994, 14, 31–46. [CrossRef]33. Reisinger, Y.; Mavondo, F. Cultural differences in travel risk perception. J. Travel Tour. Mark. 2006, 20, 13–31.
[CrossRef]34. Cheng, C.Y.; Leung, A.K. Revisiting the Multicultural Experience-Creativity Link the Effects of Perceived
Cultural Distance and Comparison Mind-Set. Soc. Psychol. Personal. Sci. 2012, 4, 475–482. [CrossRef]35. Correia, A.; Oom do Valle, P.; Moço, C. Why people travel to exotic places. Int. J. Cult. Tour. Hosp. Res.
2007, 1, 45–61. [CrossRef]
© 2019 by the authors. Licensee MDPI, Basel, Switzerland. This article is an open accessarticle distributed under the terms and conditions of the Creative Commons Attribution(CC BY) license (http://creativecommons.org/licenses/by/4.0/).
108
sustainability
Article
The Development of Loyalty to Earthen DefensiveHeritage as a Key Factor in SustainablePreventive Conservation
M. Belén Prados-Peña 1,*, M. Lourdes Gutiérrez-Carrillo 2 and Salvador Del Barrio-García 1
1 Marketing and Market Research, University of Granada, 18071 Granada, Spain2 Architectural Constructions, University of Granada, 18071 Granada, Spain* Correspondence: [email protected]; Tel.: +34958240666
Received: 17 May 2019; Accepted: 20 June 2019; Published: 27 June 2019���������������
Abstract: One of the main risks to the preservation of Spanish defensive heritage is anthropic inorigin and is associated with local society’s lack of cultural identification with these cultural assets.Consequently, there is a dearth of conservation strategies. In this paper, the current situation isexamined, then a management model is proposed, with the Torre de Romilla in the Granada province(Spain) as its focus. The model is constructed on the basis of research regarding the antecedents toloyalty towards this heritage landmark, in order to enhance its value. To accomplish this, surveydata from 200 randomly selected subjects was collected and analysed. The results indicate that theantecedent factors which determine loyalty are place attachment and its perceived image, which leadto an increased probability that the site will be visited and recommended. The direct consequence ofthis is that contributions to the economy from tourism would allow for the sustainable conservationof these assets.
Keywords: sustainable tourism; preventive conservation; cultural heritage; brand loyalty; brandimage; attachment to place
1. Introduction
The earthen defensive heritage of southeast Spain is recognised for its heritage value. As a result,it has been granted the maximum level of protection available under national legislation. However,the fact that these assets are currently in a poor state of conservation is incoherent with this position.The methodological approaches currently being researched centre on proposals for the sustainablepreventive conservation of these structures. As part of this approach, and in order to enhance the valueof this Cultural Heritage, different perspectives should be considered and how these positions interactshould be examined. Specifically, aspects relating to preventive conservation and those associated withthe socioeconomic management of the heritage asset need to be considered. Sustainable preventiveconservation means that the heritage landmark becomes viewed as a resource which contributes to thesocioeconomic growth of the surrounding area. It could be used and developed, it would undoubtedlyact as an agent of economic growth, wealth, and employment but it might also be the key factor in thesocial and economic development of an area (quality of life, feeling of belonging, identity, etc.), whichwould be of particular importance to areas with limited economic activity. By combining adequateeconomic management with sustainable management, a portion of the profits generated by the assetcould be reinvested into preventive conservation activities.
The design of heritage conservation strategies considers heritage as a resource for economicdevelopment, but when it does not receive this attention, the corollary is that it becomes marginalisedand destroyed [1].
Sustainability 2019, 11, 3516; doi:10.3390/su11133516 www.mdpi.com/journal/sustainability109
Sustainability 2019, 11, 3516
According to [2], public interest or lack of interest in heritage sites is greatly dependent on theirstate of conservation. It is scientifically accepted that Cultural Heritage assets can contribute ascapital goods to socioeconomic development [3], as they have the inherent potential to become touristattractions, thus contributing to local development [4].
Therefore, leveraging these heritage resources in a sustainable and responsible manner presentsan excellent opportunity to improve people´s lives, both in terms of material gain (wealth, employment,innovation, entrepreneurship) as well as in nonmaterial ways (identity, participation, training,satisfaction, enjoyment, etc.) [3].
In order to achieve this, most modern societies are committed to and concerned with their heritageworth [2]; as a result, there has been an increase in research in the last few years which approachesheritage appraisal from different perspectives and using different methods [2,5–10]. One perspectivethat has gained particular attention and relevance is that of consumer-based brand equity, that is, theconsumer’s appraisal of the brand heritage as regards heritage landmarks.
The American Marketing Association defines a brand as the “name, term, sign, symbol or design,or a combination of them intended to identify the goods and services of one seller or group of sellers anddifferentiate them from those of other sellers.” Brand management is the consequent effort “to create,maintain, protect and improve” [11] a specific brand to ensure a sustainable competitive advantage.As with any brand, those responsible for managing it have an inherent obligation to preserve andimprove its reputation and prestige.
In the field of heritage tourism, this translates as guaranteeing the authenticity, integrity, andpreservation of the sites and making them available for tourists to visit and enjoy [12], whilstsimultaneously taking into account the sustainable development agenda outlined by the WorldTourism Organization in 2017 [13]. In fact, the United Nations declared 2017 as the InternationalYear of Sustainable Tourism for Development due to its potential for development worldwide. In thecontext of brand strategy, heritage landmark, brand management could contribute to tourism growthin a sustainable manner, yet also guarantee conservation of the asset and the best possible outcomesfor the local community [13].
Although “brand” has become a buzzword in academia as well as in commercial settings in thelast few years, knowledge has concentrated on assets and commercial services and less so on locationsand specific tourist destinations [14]. However, in recent years, the strategic needs of destinationmanagers as well as the need to broaden knowledge about the brand´s effects have led to the emergenceof research on the destination as a brand [15,16].
In the context of tourist destinations, visitor loyalty is considered to be an important factor in thesuccessful development of a destination. Numerous studies carried out in different settings (country,states, city) examine the antecedents to tourist loyalty, including motivation, destination image, qualityof travel, perceived value, and satisfaction [17–20]. Place attachment and tourist engagement have alsobeen considered to be predictors of loyalty to the destination [21–23]. More specifically, these predictorshave been widely examined in the contexts of leisure and recreational destinations [24] and heritagesites which are established and well-known tourist destinations [25]. According to [4], such heritageresources have the potential to become attractions and contribute to the sustainable development ofthe area. However, to date, and as far as we know, no studies have been carried out which examine theantecedents of loyalty to heritage sites which are not already established destinations.
Therefore, the main objective of this article is to examine if loyalty to a heritage site arises as a resultof the perceived image that individuals have of it, as well as to what degree place attachment mediatesthe relationship between the effect of image and loyalty. This main objective is supplemented by ananalysis of the moderating effect of knowledge about how the heritage site affects these associations.
By so doing, this paper seeks to contribute to the literature on heritage landmark (Goods ofCultural Interest) brand management in several ways. Firstly, further what is currently known aboutwhich factors determine loyalty to heritage sites. Secondly, assess the role that perceived image andplace attachment plays in developing loyalty to this brand type. Thirdly, examine the degree of
110
Sustainability 2019, 11, 3516
knowledge about the heritage site as a moderating factor associated with the antecedents to loyalty.As proper management of the brand leads to increased loyalty to the heritage site, it becomes morelikely that it will be visited and recommended. The resultant increased income to local communities,especially those with scarce economic resources, in turn facilitates the sustainable management ofthe heritage asset. All of these factors in turn help to protect and preserve the heritage landmark forfuture generations.
2. Background
2.1. Heritage Value and Sustainability
As indicated in [9], cultural economy is being consolidated as a significant discipline withineconomic analysis, due to both its rich theoretical offering and because it provides an opportunityto gather empirical evidence regarding people´s and institutions´ behaviour towards modern andaccumulated culture. Within the broad analytic spectrum of this new discipline, one aspect makingsignificant contributions to the theory and catalysing its application is the appraisal of cultural assets ingeneral and, in particular, those which are also historical heritage. These authors [9] argue that culturalheritage assets are difficult to appraise for diverse reasons: they are unique and nonreproducible; theyare usually public or quasi-public assets; thus, they do not adhere to preconceptions of consumercompetition or exclusive offers; finally, the consumer believes that culture is comprised of a collectionof necessary assets which the state should maintain, independent of any voluntary contributions.
Along the same lines, the number of studies that estimate the economic value of heritage sites isgrowing [26]. These authors identify a need for additional academic studies which approach heritageappraisal from an interdisciplinary position, the purpose being to increase what is known about itscomposition and about the factors which enhance heritage value.
The seminal work of [27] was fundamental in arguing for the importance of cultural heritage dueto its effects on employment and productivity. Subsequently, several authors writing in the academicliterature have demonstrated that cultural heritage has the capacity to act as a development tool, anengine of economic growth, and to create jobs [2,9,10,28–31], with the caveat that the public´s interestin the heritage landmark will depend on its state of conservation [2].
However, recent academic studies suggest that cultural value cannot be solely expressed in termsof economic value, although they are closely correlated [32,33]. The difference is that economic valueis commonly defined as individuals´ willingness to pay, whereas cultural value refers to additionaldimensions such as social value or other nonquantifiable values, such as spiritual, historical, orsymbolic. In this sense, the seminal work of [34] provide a novel perspective on cultural heritage ascultural capital, considering it as a vehicle for cultural and economic values. Taking as a premise thatcultural heritage can boost development in an area, these authors identify and assess the tools used bythe local governments to regulate and support the use of cultural heritage in local development.
According to [35], local communities often conflict over the preservation of tangible and intangiblecultural values versus the commercialising of heritage in order to meet consumer demand; consequently,there is no unanimous position on how to strengthen development via cultural heritage preservation.These differences can become polemical if the economic benefits of preserving them are not wellunderstood [26]. In order to avoid these situations, these authors suggest that cultural heritagemanagement is a transversal subject, which should seek a balance between environmental and landscapeprotection, the marketing of social and cultural elements, and local, sustainable economic development.
It has been argued that tourism has significantly increased economic and social activity andaffected the geography of many cities. It provides an opportunity to improve employment and thequality of life in the local community [13]. The International Year of Sustainable Tourism agendaclearly demonstrates its importance to the international community. This agenda has concentrated onfive areas: (1) Inclusive and sustainable economic growth; (2) Social inclusiveness, employment, andpoverty reduction; (3) Resource efficiency, environmental protection, and climate change; (4) Cultural
111

Sustainability 2019, 11, 3516
values, diversity, and heritage; (5) Mutual understanding, peace, and security. Within this framework,the following aspects should be highlighted: the need to develop a relationship between tourismand cultural interests which conserves both tangible and intangible cultural heritage; cultural values;pursuing creativity; the provision of social, educational, and economic opportunities. Also importantis the development of innovative business models which guarantee sustainable growth in line withmarket forces.
Therefore, a transversal examination of cultural heritage management requires that heritagemanagers consider consumer behaviour towards the heritage asset [36]. According to this author,knowing what the client wants and delivering it lies at the core of the cultural heritage marketingprocess, although prevailing restrictions may need to be taken into account, such as the need to protectparts of a cultural heritage site due to increased wear from higher numbers of visitors respondingto marketing promotions. The visitor needs to be satisfied, but not to the detriment of the heritageasset. This must be preserved for future generations, so it is incumbent on heritage managers to seek abalance between commercialising cultural heritage, tourist management, and sustainable practices thatwill allow heritage to be cared for and conserved [36].
2.2. Loyalty to the Cultural Heritage
Brand loyalty can be defined as a client´s attachment or commitment to the brand [37]. Theacademic literature highlights two basic ways to understand consumer loyalty: As an attitude and asa behaviour [38–41]. As an attitude, loyalty is a subjective dimension with cognitive, affective, andconative aspects, since it is these aspects which comprise attitudes [39,40]. As a behaviour, loyalty canbe understood as a concrete behaviour which is the repeated purchase of the same product or brand orfrom the same provider, irrespective of whether the consumer has declared any intention to purchasein the future [42–44].
These two approaches therefore consider loyalty to contain two aspects; the consumer´scommitment to the brand and repeated brand purchasing behaviour. These approaches are distinct yetcompatible, as loyalty is not formed of only either repeat purchase behaviour or commitment, but both,given that loyalty transmutes into a psychological commitment demonstrated by a positive attitudeand a genuine intention to purchase again [39,45].
According to [40], loyalty progresses through different stages. These stages are (1) preference(belief) for one brand over another, (2) affective preference (attitude) towards the product, and (3) anincreased intention (conation) to purchase one product rather than the competing one. In other words,this progression consists of consumers first becoming loyal in a cognitive manner, with the affective “Ilike” or “I don’t like” coming second, before reaching the final conative stage [46,47].
Loyalty to tourist destinations has been widely studied in the contexts of the aforementionedperspectives. Although [48] has argued that in the context of tourism, studies into loyalty should placea stronger emphasis on behaviour, it has also been argued that researchers in this field have in factmostly used this approach [49]. Ultimately, however, the benefits that a tourist brings to the touristdestination are simply associated with their return visit behaviour [50]. Their loyalty to the destinationis demonstrated as their intention to visit and how likely they are to recommend it [19,48,51–56].
2.3. Place Attachment
Research into place attachment across various disciplines has resulted in considerable developmentof the theory and empirical inquiry. Most conceptualizations of the construct have described it asthe range of feelings that individuals associate with specific places [57–59]. Although various termshave been employed to describe it (for example, sense of place, rootedness), most conceptualizationsposit affect, emotion, and feeling as fundamental to the concept [60]. However, these authors indicatethat emotional aspects are additionally attended by cognitive (thought, knowledge, and belief) andconative (action and behaviour) aspects. Therefore, place attachment implies an interaction betweenaffect and emotion, knowledge and belief, and action and behaviour [57].
112

Sustainability 2019, 11, 3516
Aligning with this notion, according to [23], place attachment as a process by which people formemotional bonds with certain sites or places. So, the sense of being physically present and “in place”could be indicative that an individual has formed an emotional bond to a place [23].
Tourism research has extensively addressed the significance and the effect of place attachment [61].The concept is linked to the process by which an individual´s experience of both the physical andsocial characteristics of a place leads to strong emotional attachments to that place [62] and, as such,is analysed as a multidimensional construct which incorporates two or more dimensions [62–64].According to [61], the first dimension, place identity, refers to the cognitive link between oneself and aplace, reflected as the tourist´s identification with a specific place or its symbolic value. The second,place dependence, relates to the functional aspects of place attachment and refers to how a particularplace provides for the specific needs and activities of tourists. The third, affective attachment, refers totourists’ feelings about a place. The fourth, social attachment, refers to the social ties reinforced by aspecific place. However, for [65], the question of whether place attachment is better described by twoor by more components remains to be resolved.
According to [21–23,66–70], place attachment is a significant predictor of tourist loyalty, assertinga direct and positive relationship between attachment to a destination and loyalty towards it.
2.4. Image of the Cultural Heritage as a Destination
According to [71] brand image as being the consumer´s brand perception, which is held as amemory association. The destination image is widely acknowledged for playing a significant role intourist behaviour towards it, in particular, when it comes to evaluating, selecting [72–74], deciding toreturn in future [75,76], thus linking motivation to destination selection [77]. According to [78], touristperception is of crucial importance as they often select destinations which have the most positiveimage. If the tourist has constructed a positive image of the destination in their mind, it is likely thatthey will want to visit [79,80]). The seminal work of [81,82] suggest that the perceived image of thedestination is the main predictor of the intention to choose a destination. Destination image is definedas the mental representation of knowledge (belief), feelings, and overall perception that an individualhas regarding a specific destination [83].
Various researchers [83,84] suggest that any particular destination can be thought of in terms ofthree image types: organic image, induced image, and complex image. These three image types arebased on individuals´ experience of a specific destination. An organic image evolves out of nontouristinformation sources, such as geography books, television reports, or magazine articles. An inducedimage arises from destination-specific tourist information, such as a brochure or a website; ultimately,it is due to marketing of the destination. The main difference between the organic image and theinduced image is in the intention or the motivation to visit. In other words, anyone can have an organicimage of a particular destination without intending to visit, whereas those who intentionally seek outinformation from marketing materials thereby acquire an induced image [84] and do have an intentionto visit. Complex image could be the result of the direct experience of a destination [83]. Other authors,such as [85], suggest that destination image developed out of various fields and disciplines concernedwith economic, social, or psychological factors, and is a combination of the perceptions or impressionsof a tourist destination.
2.5. Proposed Hypotheses
Of the different antecedents to the development of loyalty to a destination which are consideredby the academic literature, one´s own image of the destination should be highlighted. Many studieshave found this to be relevant [17,49,55,86–88]. The destination image has two significant functions intourist behaviour: (1) it influences the decision-making process regarding the destination and (2) itconditions subsequent behaviour, including tourists´ experience of the place, their assessment of it, andtheir future behaviour (intention to return and how likely they are to recommend) [17,81]. Accordingto [81], a positive destination image leads to greater satisfaction, an increased intention to return, and
113

Sustainability 2019, 11, 3516
greater likelihood to recommend. As indicate by [49], the effect that destination image has on touristloyalty is significant to varying degrees. Specifically, these authors state that the overall image exerts agreater effect on tourist loyalty, followed by affective image and cognitive image.
Taking this into consideration, we propose the following hypothesis:
H1. The greater the perceived image of the heritage site, the greater its loyalty.
On the other hand, place attachment or destination attachment is linked to visitors´ loyalty tothe place [23] and to their behavioural intent [89]. In the field of tourism study, place attachment isoften described as “destination attachment” [23,63]. In the context of rural tourism specifically [89], asignificant relationship is found between the tourist’s experience, place attachment, and the intentionto revisit and recommend. According to [90] individuals´ specific place attachment generally begins todevelop following one or more visits, although it is possible to develop a strong feeling towards placesthat they have never visited [91]. In the study of [92], she argues that even tourists who are visiting aplace for the first time may already have an attachment to it. This place attachment could possibly bedue to having heard stories about the place from friends, family or in the media.
As a result, we propose the following hypothesis:
H2. The greater the degree of place attachment to the heritage site, the greater its loyalty.
The seminal work of [93] underscore the importance of attachment to the destination and thedestination image in order to predict tourists´ future intentions and behaviour. According to [69], theacademic literature suggests that the conceptual bases for place attachment and destination image aresimilar, since both are constructs with cognitive and affective components that influence behaviour. Forthese authors, place attachment is an emotional reaction to a physical and social environment, whereasdestination image represents the cognitive and affective components connected to a place. On the basisof these assertions, these authors suggest and argue for the idea that destination image is antecedent toplace attachment. [94] citing [56] argue that, given that the destination image is a determining factor intourist attitudes towards the destination, the destination image is antecedent to destination attachment.As show by [94], a more favourable destination image leads to greater attachment to a destination.Consequently, we propose the following hypothesis:
H3. The greater the perceived image of the heritage site, the greater the place attachment to a heritage site.
Alternatively, as defined by [95], consumers´ brand knowledge is all the descriptive and evaluativeinformation associated with the brand, as recorded in the consumer´s memory. A consumer´sknowledge about a product has been considered to be an element that influences all stages of thedecision-making process [96], and the academic literature shows that it is considered to have a significantmoderating effect on the subject’s response [97,98]. Consumers with different levels of knowledgeabout a product also differ in their perceptions of the product [98,99]. Consumers who know moreabout a product have more developed and complex schemas, with well-developed decision-makingcriteria [100]. In this instance, when consumers process information, it requires less cognitive effort astheir knowledge structures are automatically activated and can process more information [101].
In the field of tourism, knowledge about a destination is understood as it being present in people´sminds when they are considering it as a travel destination [102]. Assessing awareness of a destinationbrand is done in terms of examining the selection process by which a specific image is created, andits quality assumed [103,104]. On the basis of antecedent theories regarding the consumer purchaseprocess, including those regarding knowledge about a product, the seminal work of [105] demonstratesthat the degree of consumer knowledge about a holiday destination affects the consumer’s image ofthe destination and the probability that they will visit. Similarly, according to [106], by consideringfamiliarity with a destination as much as the degree of knowledge that the tourist has about a destinationdemonstrates that, in line with [107] and [105], the degree of knowledge influences tourists’ perceptionsof how attractive the destination is, resulting in a positive effect on place image as well as influencingtheir level of interest and likelihood of visiting again.
114

Sustainability 2019, 11, 3516
As a result, we propose the following hypothesis:
H4. Prior knowledge of the heritage site will positively moderate the associations between the antecedents toloyalty.
The proposed hypotheses are summarised in Figure 1.
Figure 1. Model for developing loyalty towards the heritage site.
3. Methodology
3.1. Context of Study
The Torre de Roma heritage site has been chosen for the purposes of this study. This is a towerin a farmstead dating from the Nazari period (fifteenth century), located in the Vega de Granada onirrigated lands, 500 m from the left bank of the Genil River and next to the town of Romilla in theChauchina (Granada) municipality.
Its typology is that of a rectangular tower, with base dimensions of 9.45 m × 7.10 m, whichgradually narrow as it increases to its current height of 14 m. Currently, access is via the east side,although it is considerably damaged. It has an underground cistern beneath the lower level, which canbe accessed via a gap in the northeast corner; however, due to the accumulation of rubble, its depth isnot known. It is covered by a half-barrel vault [108] (p. 376).
The lower level was made up of a rectangular room which would have been covered by a barrelvault, of which only the innermost backfill remains. The stairs, no longer present, were located atthe north corner and would have provided access to the upper levels. The first floor was made upof a square room next to a corridor and the stairs. The room was covered by a cloister vault. It hadloophole windows on the east, west, and south sides, with the main access being on the north side. Thelast floor contained a rectangular room and a stairwell and was covered by a vaulted ceiling similar tothe other rooms. There are also significant openings on the east, west, and southern faces. The towerhad a terraced roof on top of the upper vaulted ceiling. Although none remain, the tower might havehad a coat of arms and battlements [109].
115

Sustainability 2019, 11, 3516
The building technique was lime rammed-earth using formwork boxes with a total height of 82cm. The building technique for the cistern vault and the bottom level were made without formwork,by plastering the rowlock bricks one on top of the other. This vault building technique required plasterto hold the bricks in place [110].
Its state of conservation is being affected by significant structural damage, which is in turn riskingits stability, such as vertical cracks, volumetric loss, and internal stressors, causing a loss of cohesion. Itsconservation has also been affected by humidity, occurring as a result of filtration and capillarity in itsbase. Rainwater splashes have caused significant erosion. On the interior, damage due to decohesion,loss of plastering, sanding, and impairments to supports are notable. Damage to the vaults, flooring,and coverings are also worth mentioning. Other than that which has already been mentioned, there isalso damage resulting from inadequate conservation of the cultural asset.
3.2. Data Collection
Data was obtained from a survey which was given to a randomly selected sample by thegovernmental organization responsible for local development in the area where the Torre de Romillais located. Fieldwork was carried out during January and February of 2018. The final sample wascomprised of 200 subjects, with 103 men and 97 women (see Table 1). The age distribution is shown inTable 2.
Table 1. Sample distribution by sex.
Frequency Percentage
Male 103 51.5Female 97 48.5
Total 200 100
Table 2. Sample distribution by age.
Frequency Percentage
Under 25 years 50 25.0Between 25 and 40 years 66 33.0Between 41 and 55 years 62 31.0
More than 55 years 55 11.0
Total 112 100
3.3. Measures
The measures used to analyse the constructs have been adapted from existing validated scales(see Table 3). The perceived brand image was measured using a Likert scale with 5 points for 3 items(1, totally disagree; 5, totally agree) and adapted from other studies such as [111]: (1) My image of theTorre de Romilla is good; (2) My image of the Torre de Romilla is positive; (3) My image of the Torre deRomilla is favourable.
116

Sustainability 2019, 11, 3516
Table 3. Analysis of the psychometric properties of the multi-item scales.
Construct. ItemsStandardisedCoefficients
R2 CR AVE
Perceivedimage
My image of the Torre de Romillais positive. 0.87 *** 0.75
0.94 0.85My image of the Torre de Romillais favourable. 0.95 *** 0.90
Perceivedloyalty
I intend to visit the Torre deRomilla again if I can. 0.92 *** 0.85
0.95 0.86I will recommend that friends andfamily visit the Torre de Romilla. 0.93 *** 0.87
They would be very likely to visit. 0.94 *** 0.87
Placeattachment
It is something that matters to mea lot. 0.86 *** 0.74
0.97 0.80
It is of great relevance to me. 0.91 *** 0.82It is of great value to me. 0.93 *** 0.87It means a lot to me. 0.91 *** 0.82It is very necessary for me. 0.85 *** 0.73It is of great interest to me. 0.90 *** 0.82It is something that attracts me alot. 0.89 *** 0.79
Priorknowledge
How knowledgeable do youconsider yourself? 0.88 *** 0.77
0.89 0.74Compared to most people, howknowledgeable do you consideryourself?
0.87 *** 0.76
How much do you know aboutthe cultural value of the asset? 0.82 *** 0.68
Note: *** p < 0.01. CR: composite reliability; AVE: average variance extracted.
Loyalty was measured using a Likert scale with 5 points for 3 items (1, totally disagree; 5, totallyagree) and adapted from the suggestion originally made by [112], and then used by other authorsas [103,113]): (1) I intend to visit the Torre de Romilla again if I can; (2) I will recommend that friendsand family visit the Torre de Romilla; (3) They would be very likely to visit.
For place attachment, a Likert scale of 5 points (1, totally disagree; 5, totally agree) was used for7 items adapted from [59,114]: (1) It is something that matters to me a lot; (2) It is of great relevance tome; (3) It is of great value to me; (4) It means a lot to me; (5) It is very necessary for me; (6) It is of greatinterest to me; (7) It is something that attracts me a lot.
Finally, knowledge was measured using a Likert scale of 5 points (1, nothing; 5, a lot) for 3 itemsadapted from [115]: (1) How knowledgeable do you consider yourself? (2) Compared to most people,how knowledgeable do you consider yourself? (3) How much do you know about the cultural value ofthe asset? In both cases, the items were measured using the Likert scale of 5 points in which 1 indicates“Disagree strongly” and 5 indicates “Agree strongly.”
4. Results
4.1. Analysis of the Psychometric Properties of the Scales
Prior to testing the hypotheses by analysing the data, the psychometric properties of the multi-itemscales were examined in order to test for reliability and validity for the constructs they intend tomeasure. A confirmatory factor analysis (CFA) was carried out using LISREL 8.8 software, the resultsof which can be seen in Table 3. The overall goodness-of-fit indices were all within the recommendedlimits (S-B Chi-Square: 148.83; p-value: 0.00; RMSEA: 0.05; CFI: 0.99), all the loadings were significant(p < 0.01) with a high magnitude (>0.70), and the values for the individual reliability for each indicator
117
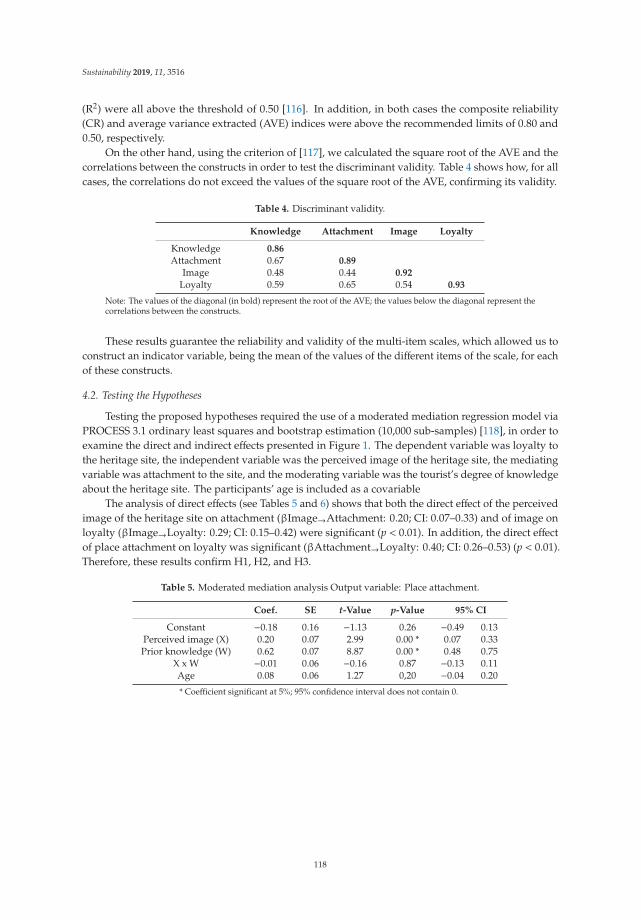
Sustainability 2019, 11, 3516
(R2) were all above the threshold of 0.50 [116]. In addition, in both cases the composite reliability(CR) and average variance extracted (AVE) indices were above the recommended limits of 0.80 and0.50, respectively.
On the other hand, using the criterion of [117], we calculated the square root of the AVE and thecorrelations between the constructs in order to test the discriminant validity. Table 4 shows how, for allcases, the correlations do not exceed the values of the square root of the AVE, confirming its validity.
Table 4. Discriminant validity.
Knowledge Attachment Image Loyalty
Knowledge 0.86
Attachment 0.67 0.89
Image 0.48 0.44 0.92
Loyalty 0.59 0.65 0.54 0.93
Note: The values of the diagonal (in bold) represent the root of the AVE; the values below the diagonal represent thecorrelations between the constructs.
These results guarantee the reliability and validity of the multi-item scales, which allowed us toconstruct an indicator variable, being the mean of the values of the different items of the scale, for eachof these constructs.
4.2. Testing the Hypotheses
Testing the proposed hypotheses required the use of a moderated mediation regression model viaPROCESS 3.1 ordinary least squares and bootstrap estimation (10,000 sub-samples) [118], in order toexamine the direct and indirect effects presented in Figure 1. The dependent variable was loyalty tothe heritage site, the independent variable was the perceived image of the heritage site, the mediatingvariable was attachment to the site, and the moderating variable was the tourist’s degree of knowledgeabout the heritage site. The participants’ age is included as a covariable
The analysis of direct effects (see Tables 5 and 6) shows that both the direct effect of the perceivedimage of the heritage site on attachment (βImage→Attachment: 0.20; CI: 0.07–0.33) and of image onloyalty (βImage→Loyalty: 0.29; CI: 0.15–0.42) were significant (p < 0.01). In addition, the direct effectof place attachment on loyalty was significant (βAttachment→Loyalty: 0.40; CI: 0.26–0.53) (p < 0.01).Therefore, these results confirm H1, H2, and H3.
Table 5. Moderated mediation analysis Output variable: Place attachment.
Coef. SE t-Value p-Value 95% CI
Constant −0.18 0.16 −1.13 0.26 −0.49 0.13Perceived image (X) 0.20 0.07 2.99 0.00 * 0.07 0.33Prior knowledge (W) 0.62 0.07 8.87 0.00 * 0.48 0.75
X x W −0.01 0.06 −0.16 0.87 −0.13 0.11Age 0.08 0.06 1.27 0,20 −0.04 0.20
* Coefficient significant at 5%; 95% confidence interval does not contain 0.
118

Sustainability 2019, 11, 3516
Table 6. Moderated mediation analysis Output variable: Perceived loyalty.
Coef. SE t-Value p-Value 95% CI
Constant 3.00 0.15 19,6 0.00 * 2.70 3.30Perceived image (X) 0.29 0.07 4.38 0.00 * 0.15 0.42
Place attachment (M) 0.40 0.07 5.73 0.00 * 0.26 0.53Prior knowledge (W) 0.22 0.08 2.63 0.00 * 0.06 0.38
X x W −0.17 0.07 −2.63 0.01* −0.30 −0.04M x W 0.02 0.06 0.32 0.75 −0.10 0.13
Age 0.18 0.06 3.12 0.02* 0.07 0.31
* Coefficient significant at 5%; 95% confidence interval does not contain 0.
H4 proposes a moderating effect of the tourist’s degree of knowledge about the heritage site onthe associations between the antecedents to loyalty. To test this, the corresponding interactions needto be examined (see Tables 5 and 6). The results show that, of the three possible interactions, onlyone is significant, the effect of knowledge on the association between image and loyalty (βImage ×Knowledge→Loyalty: −0.17; CI: −0.30–0.04) (p = 0.01). Figure 2 illustrates the significant effect ofthis interaction. In this figure, it can be seen that as the subjects’ perceived image of the heritagelandmark improves, so their loyalty increases, although this effect is reduced as the subjects’ degreeof knowledge regarding it increases. When the degree of knowledge is small, the effect of image onloyalty is greatly amplified (steep curve), whereas when knowledge regarding the heritage is large,the curve is much flatter. These results only partially confirm H4 as only the moderating effect wasobserved to be significant.
Figure 2. Image on loyalty by knowledge.
PROCESS allows for calculating the conditional indirect effects of the independent variable (image)on the dependent one (loyalty) through the mediating variable (attachment to the heritage site), takinginto account the different levels of the moderating variable (knowledge) (see Table 7). The results are ofinterest as the direct effect of image on loyalty was found to be significant in terms of the conditioningmediating variable but, for the moderating variable, the effect decreases as the degree of knowledge
119

Sustainability 2019, 11, 3516
about the heritage landmark increases, to the point that when the degree of knowledge is large thiseffect disappears, becoming nonsignificant (p > 0.05).
Table 7. Conditional direct and indirect effects of Image on Loyalty.
Conditional Direct Effects
Knowledge Effect SE 95% CI
Low 0.44 *** 0.09 0.27 0.61
Medium 0.26 *** 0.07 0.13 0.40
High 0.08 0.10 −0.11 0.29
Conditional Indirect Effects
Knowledge Effect SE 95% CI
Low 0.08 ** 0.04 0.02 0.17
Medium 0.08 ** 0.03 0.02 0.15
High 0.08 ** 0.05 0.00 0.20
* Non-significant coefficient. 95% confidence interval includes 0 ** Significant coefficient at 5%; 95% confidenceinterval does not contain 0. *** Significant coefficient at 1%; 95% confidence interval does not contain 0.
On the other hand, the conditional indirect effects of the image on loyalty mediated by attachmentto the patrimonial good are significant (p < 0.05) and positive regardless of the degree of knowledge.
5. Conclusions
The purpose of this paper is to assess a theoretical model of the development of loyalty to aheritage landmark, on the basis of the perceived image of the heritage site and place attachmentto the heritage site. Loyalty to a tourist destination is key to how the tourist behaves with regardsto that destination, demonstrated as their intention to visit and how likely they are to recommendit [48,51,54,55]. Of the factors which contribute to the development of loyalty to the destination,destination image should be noted [17,23,49,55,86,88,89].
This paper contributes to current understandings of the factors which determine how loyalty to aheritage site is developed and the role played by the degree of knowledge.
In the first place, our findings show that the heritage landmark image has a direct, positive effecton the development of loyalty, and as such, is an antecedent to loyalty towards the destination, in linewith the academic literature [49,55,81]. In addition, place attachment to the heritage site has a direct,positive effect on the development of loyalty, as has been found by other authors [23,66–70], beingantecedent to loyalty. Therefore, increased loyalty is found where there is greater place attachmentto the heritage site. Likewise, findings show that image has a direct and positive effect on placeattachment to the heritage site, as has previously been asserted [69,94]; therefore, as the image ofthe heritage asset improves, so place attachment to it increases. An additional conclusion derivedfrom these results and of equal relevance, the association between the perceived image of the Torre deRomilla and place attachment does not appear to be affected by the degree of subjects’ prior knowledgeabout the heritage landmark, counter to what would be expected according to [97]. These results seemto indicate that the link between the heritage landmark and attachment is strong regardless of thedegree of knowledge about the heritage site.
In the second place, our findings show that the degree of knowledge regarding the heritage sitedoes in fact moderate the existing direct relationship between the perceived image and loyalty. Thisis demonstrated by the fact that when there is a small degree of knowledge about the heritage site,the image perceived to it is a greater determinant of loyalty towards it; in this case, loyalty increasesas the perceived image of the asset improves. However, in the case of a large degree of knowledgeabout the heritage site, image is not the determining factor in the development of loyalty to it. The
120

Sustainability 2019, 11, 3516
results indicate that those who know the Torre de Romilla (either because they have visited or fromother sources of information) had a more positive image of the heritage site and were more likely tovisit and/or recommend it, in line with [105]. However, counter to the predictions, the effect of placeattachment on the association between the asset’s perceived image and interest in or likelihood to visitthe Torre de Romilla is influenced by the degree of knowledge, contrary to prediction.
6. Implications for Management
Our findings also have considerable implications for tourist destination heritage site managers.On the one hand, we have found that a positive perceived image of the heritage site can lead to strongattachment, which paves the way for greater loyalty [23,63]. On the other hand, the findings alsosuggest that, in order to maximally affect loyalty (intention to visit and recommend), managers shouldtake proactive action to increase knowledge about a site, make investments to improve its conservation,and promote the site to a target audience.
Heritage managers should consider all aspects related to such heritage in an integrated manner.As note by [36] citing [119] notes that successful heritage tourism threatens the very heritage resourcesthat are the basis of such tourism. Consequently, these managers’ current task is to identify andappropriately respond to strategic opportunities to develop these sites. In line with [120,121], theparticipation and support of key stakeholders is recommended. Developing practices based on insight,and which are in line with the remit of those responsible for heritage conservation and protection,marketing, and administration, will simultaneously achieve a balance in communication directedtowards cultural tourism and tourism in general. Applying marketing techniques and increasingknowledge about the visitors’ profiles are essential components of this communication process and gotowards ensuring that heritage is accessible and significant for both cultural and general tourism, inline with [120]. Along the same lines, and as is demonstrated by the results, knowledge regardingheritage assets also needs to be increased. As has been shown, greater knowledge leads to greaterattachment, which increases the latter’s effect on loyalty. These measures would allow the protectionand appraisal of cultural heritage to act as a strategic engine for local development [122], withoutcompromising the site’s authenticity, as posited by [120].
Therefore, tourist destination planning and management should ensure that special considerationis given to the maintenance and conservation of the natural resources which the tourist offeringrepresents [123]. Improved conservation of the heritage asset will improve its image, which in turnwill lead to increased loyalty. This loyalty is demonstrated by the intention to visit and recommend.
This kind of initiative facilitates citizen awareness in a process of cultural identity, as a feelingof esteem for the site patrimonial that promotes its protection and appreciation, by both the localpopulation and the occasional visitor; participants in the defense and maintenance of sites, as well asin compliance with the elementary principles of their conservation [124].
7. Limitations and Future Lines of Research
As is the case for any scientific research, the present study presents some limitations worthy ofmention. Firstly, this study focuses on presenting a model of the development of loyalty to a specificheritage landmark with the particular characteristics of the “Torre de la Romilla”: A heritage sitelocated in the south of Spain, in the Vega de Granada region and not recognized as a tourist destination,but which is nevertheless a resource which has the potential to become one and contribute to localdevelopment, as indicated by [4].
The question of whether future studies could replicate the findings of this study for cultural assetswith similar characteristics is an interesting one. The findings of this study could be extrapolatedfor analysis and would potentially have repercussions for assets of a similar nature, characterizedby a defensive architecture, located in areas with a population of less than 10,000 inhabitants anddisadvantaged from the perspective of the availability of human or material resources. If the potentialbenefits identified by the present study are taken into account, these considerations taken together
121

Sustainability 2019, 11, 3516
could lead to improvements in cultural tourism management, general tourism, and the basic socialeconomy of the municipalities and regions in which these heritage landmarks are found
Secondly, a larger simple size would have been preferable; therefore, it is recommended thatfuture studies attempting to replicate this study use larger simple sizes with greater heterogeneity.
Thirdly, future studies should account for other moderating variables such as the subjects’ usualresidence, their degree of cultural tourism experience, the frequency of visits to these types of culturallandmarks or, as cultural values could be associated with a destination choice or with attachment [125],the visitors’ nationality or culture in the case of using samples from other countries.
Author Contributions: Conceptualization, M.B.P.-P. and M.L.G.-C.; methodology, M.B.P.-P.; software, M.B.P.-P.;validation, M.B.P.-P., M.L.G.-C., and S.D.B.-G.; formal analysis, M.B.P.-P.; investigation, M.B.P.-P. and M.L.G.-C.;resources, M.B.P.-P. and M.L.G.-C.; data curation, M.B.P.-P. and M.L.G.-C.; writing—original draft preparation,M.B.P.-P. and M.L.G.-C.; writing—review and editing, M.B.P.-P., M.L.G.-C., and S.D.B.-G.; visualization, M.B.P.-P.and M.L.G.-C.; supervision, S.D.B.-G.; project administration, M.L.G.-C.; funding acquisition, M.L.G.-C.
Funding: This study is part of the project entitled (BIA2015 69938-R) “Sustainable methodology for the Conservationand Maintenance of medieval rammed-earth fortifications in the South-East of the Iberian Peninsula” financed bythe State Research Agency (SRA) and European Regional Development Fund (ERDF).
Acknowledgments: The authors thank the Sierra Elvira Vega Consortium for their collaboration in carrying outthe surveys.
Conflicts of Interest: The authors declare no conflict of interest.
References
1. Malaro, M.C. Museum Governance: Mission, Ethics, Policy; Smithsonian Institution Press: Washington, DC,USA, 1994.
2. Greffe, X. Is heritage an asset or a liability? J. Cult. Herit. 2004, 5, 301–309. [CrossRef]3. Domínguez-Pérez, M.; Martín-Fernández, J. El patrimonio cultural, recurso estratégico para el
enriquecimiento económico y social. Ejemplos desde el patrimonio mundial en España. In Personasy comunidades: Actas del Segundo Congreso Internacional de Buenas Prácticas en Patrimonio Mundial: (29–30 deabril, 1 y 2 de mayo de 2015); Universidad Complutense: Madrid, Spain, 2015; pp. 777–792.
4. Carbone, F. An insight into cultural heritage management of tourism destinations. Eur. J. Tour. Res. 2016, 14,75–91.
5. Caldwell, N.G. The emergence of museum brands. Int. J. Arts Manag. 2000, 2, 28–34.6. Camarero, C.; Garrido-Samaniego, M.J.; Vicente, E. Determinants of brand equity in cultural organizations:
The case of an art exhibition. Serv. Ind. J. 2012, 32, 1527–1549. [CrossRef]7. Liu, C.R.; Liu, H.K.; Lin, W.R. Constructing customer-based museums brand equity model: The mediating
role of brand value. Int. J. Tour. Res. 2015, 17, 229–238. [CrossRef]8. Kim, H.; Stepchenkova, S.; Yilmaz, S. Destination Extension: A Faster Route to Fame for the Emerging
Destination Brands? J. Travel Res. 2019, 58, 440–458. [CrossRef]9. Sanz, J.A.; Herrero, L.C. Valoración de bienes públicos relativos al patrimonio cultural. Aplicación comparada
de métodos de estimación y análisis de segmentación de demanda. Hacienda Pública Española/Rev. De Econ.Pública 2006, 178, 113–133.
10. Tuan, T.H.; Navrud, S. Capturing the benefits of preserving cultural heritage. J. Cult. Herit. 2008, 9, 326–337.[CrossRef]
11. Kotler, P.; Armstrong, G.; Saunders, J.; Wong, V. Principles of Marketing; Prentice Hall. Inc.: Upper SaddleRiver, NJ, USA, 2001.
12. Ryan, J.; Silvanto, S. The World Heritage List: The making and management of a brand. Place Branding PublicDipl. 2009, 5, 290–300. [CrossRef]
13. UNWTO. Annual Report, 2017. Available online: https://www2.unwto.org/publication/unwto-annual-report-2017 (accessed on 30 March 2019).
14. Li, X.; Petrick, J.F.; Zhou, Y. Towards a conceptual framework of tourists’ destination knowledge and loyalty.J. Qual. Assur. Hosp. Tour. 2008, 8, 79–96. [CrossRef]
15. Cai, L.A. Cooperative branding for rural destinations. Ann. Tour. Res. 2002, 29, 720–742. [CrossRef]16. Morgan, N.; Pritchard, A.; Pride, R. Destination Branding; Routledge: London, UK, 2007.
122

Sustainability 2019, 11, 3516
17. Bigné, J.E.; Sanchez, M.I.; Sanchez, J. Tourism image, evaluation variables and after purchase behaviour:Inter-relationship. Tour. Manag. 2001, 22, 607–616. [CrossRef]
18. Chen, C.F.; Tsai, D. How destination image and evaluative factors affect behavioral intentions? Tour. Manag.2007, 28, 1115–1122. [CrossRef]
19. Chi, C.G.Q.; Qu, H. Examining the structural relationships of destination image, tourist satisfaction anddestination loyalty: An integrated approach. Tour. Manag. 2008, 29, 624–636. [CrossRef]
20. Huang, S.; Hsu, C.H. Effects of travel motivation, past experience, perceived constraint, and attitude onrevisit intention. J. Travel Res. 2009, 48, 29–44. [CrossRef]
21. Alexandris, K.; Kouthouris, C.; Meligdis, A. Increasing customers’ loyalty in a skiing resort: The contributionof place attachment and service quality. Int. J. Contemp. Hosp. Manag. 2006, 18, 414–425. [CrossRef]
22. Hwang, S.N.; Lee, C.; Chen, H.J. The relationship among tourists’ involvement, place attachment andinterpretation satisfaction in Taiwan’s national parks. Tour. Manag. 2005, 26, 143–156. [CrossRef]
23. Yuksel, A.; Fisun, Y.; Yasin, B. Destination attachment: Effects on customer satisfaction and cognitive, affectiveand conative loyalty. Tour. Manag. 2010, 31, 274–284. [CrossRef]
24. Kyle, G.; Graefe, A.; Manning, R.; Bacon, J. Effect of activity involvement and place attachment onrecreationists’ perceptions of setting density. J. Leis. Res. 2004, 36, 209–231. [CrossRef]
25. Poria, Y.; Butler, R.; Airey, D. Links between tourists, heritage, and reasons for visiting heritage sites. J. TravelRes. 2004, 43, 19–28. [CrossRef]
26. Wright, W.C.; Eppink, F.V. Drivers of heritage value: A meta-analysis of monetary valuation studies ofcultural heritage. Ecol. Econ. 2016, 130, 277–284. [CrossRef]
27. Cwi, D.; Lydall, K. Economic Impact of the Arts and Cultural Institutions: A Model for Assessment and a CaseStudy in Baltimore; National Endowment for the Arts, Research Division: Washington, DC, USA, 1977.
28. Backman, M.; Nilsson, P. The role of cultural heritage in attracting skilled individuals. J. Cult. Econ. 2016, 42,111–138. [CrossRef]
29. Bowitz, E.; Ibenholt, K. Economic impacts of cultural heritage. Research and perspectives. J. Cult. Herit.2008, 10, 1–8. [CrossRef]
30. Llop, M.; Arauzo-Carod, J.M. Economic impact of a new museum on the local economy: “The Gaudí Centre”.Lett. Spat. Resour. Sci. 2012, 5, 17–23. [CrossRef]
31. Plaza, B. The return on investment of the Guggenheim Museum Bilbao. Int. J. Urban Reg. Res. 2006, 30,452–467. [CrossRef]
32. Hutter, M.; Throsby, D. Beyond Price: Value in Culture, Economics, and the Arts; Cambridge University Press:Cambridge, UK, 2008.
33. Throsby, D.; Zednik, A. The economic and cultural value of paintings: Some empirical evidence. In Handbookof the Economics of Art and Culture; Elsevier: Amsterdam, The Netherlands, 2014; Volume 2, pp. 81–99.
34. Kalamarova, M.; Loucanova, E.; Parobek, J.; Supin, M. The support of the cultural heritage utilization inhistorical town reserves. Procedia Econ. Financ. 2015, 26, 914–919. [CrossRef]
35. Oppio, A.; Bottero, M.; Ferretti, V.; Fratesi, U.; Ponzini, D.; Pracchi, V. Giving space to multicriteria analysisfor complex cultural heritage systems: The case of the castles in Valle D’Aosta Region, Italy. J. Cult. Herit.2015, 16, 779–789. [CrossRef]
36. Misiura, S. Heritage Marketing; Butterworth-Heinemann: Burlington, MA, USA, 2006.37. Aaker, D.A. Managing Brand Equity Capitalizing on the Value of Brand Name; The Free Press: New York, NY,
USA, 1991.38. Andreassen, T.; Lindestad, B. Customer loyalty and complex services: The impact of corporate image on
quality, customer satisfaction and loyalty for customers with varying degrees of service expertise. Int. J. Serv.Ind. Manag. 1998, 9, 7–23. [CrossRef]
39. Dick, A.S.; Basu, K. Customer loyalty: Toward an integrated conceptual framework. J. Acad. Mark. Sci. 1994,22, 99–113. [CrossRef]
40. Oliver, R.L. Whence consumer loyalty? J. Mark. 1999, 3, 33–44. [CrossRef]41. Richards, T. Buying loyalty versus building commitment-Developing the optimum retention strategy. Mark.
Res. Today 1998, 26, 43–52.42. Colmenares, O.A.; Saavedra, J.L. Aproximación teórica de la lealtad de marca: Enfoques y valoraciones.
Cuad. De Gestión 2007, 7, 69–81.
123

Sustainability 2019, 11, 3516
43. Delgado-Ballester, M.E. Estado actual de la investigación sobre la lealtad a la marca: Una revisión teórica.Dir. Y Organ. 2004, 30, 16–24.
44. Rodríguez, S.; Camarero, C.; Gutiérrez, J. Lealtad y valor en la relación del consumidor. Una aplicación alcaso de los servicios financieros. In Proceedings of the XIV Encuentros Profr. Univ. Mark., Granada, Spain,9–12 September 2002; pp. 429–443.
45. Vázquez, C.R.; Álvarez, B.Á. Consumers’ characteristics and brand choice behaviour: Loyalty andconsumption. J. Target. Meas. Anal. Mark. 2007, 15, 121–131. [CrossRef]
46. Back, K.-J. The effects of image congruence on customers’ brand loyalty in the upper middle-class hotelindustry. J. Hosp. Tour. Res. 2005, 29, 448–467. [CrossRef]
47. Oliver, R.L. Satisfaction: A behavioral Perspective on the Consumer; Routledge: London, UK, 2014.48. Oppermann, M. Tourism destination loyalty. J. Travel Res. 2000, 39, 78–84. [CrossRef]49. Zhang, H.; Fu, X.; Cai, L.A.; Lu, L. Destination image and tourist loyalty: A meta-analysis. Tour. Manag.
2014, 40, 213–223. [CrossRef]50. Almeida-Santana, A.; Moreno-Gil, S. Understanding tourism loyalty: Horizontal vs. destination loyalty.
Tour. Manag. 2018, 65, 245–255. [CrossRef]51. Castro, C.B.; Armario, E.M.; Ruiz, D.M. The influence of market heterogeneity on the relationship between a
destination’s image and tourists’ future behaviour. Tour. Manag. 2007, 28, 175–187. [CrossRef]52. Chi, C.G.Q. Destination loyalty formation and travelers’ demographic characteristics: A multiple group
analysis approach. J. Hosp. Tour. Res. 2011, 35, 191–212. [CrossRef]53. Mohamad, M.; Ali, A.M.; Ab Ghani, N.I. A structural model of destination image, tourists’ satisfaction and
destination loyalty. Int. J. Bus. Manag. Stud. 2011, 3, 167–177.54. Pike, S. Destination branding case study: Tracking brand equity for an emerging destination between 2003
and 2007. J. Hosp. Tour. Res. 2010, 34, 124–139. [CrossRef]55. Polo-Peña, A.I.; Frías-Jamilena, D.M.; Rodríguez-Molina, M.Á. Antecedents of loyalty toward rural hospitality
enterprises: The moderating effect of the customer’s previous experience. Int. J. Hosp. Manag. 2013, 34,127–137. [CrossRef]
56. Yoon, Y.; Uysal, M. An examination of the effects of motivation and satisfaction on destination loyalty: Astructural model. Tour. Manag. 2005, 26, 45–56. [CrossRef]
57. Kyle, G.; Graefe, A.; Manning, R. Spatial Variation in Level and Type of Place Attachment. In Proceedings ofthe Northeastern Recreation Research Symposium, EEUU, New York, NY, USA, 28–30 March 2004; pp. 28–30.
58. Hidalgo, M.C.; Hernandez, B. Place attachment: Conceptual and empirical questions. J. Environ. Psychol.2001, 21, 273–281. [CrossRef]
59. Williams, D.R.; Patterson, M.E.; Roggenbuck, J.W.; Watson, A.E. Beyond the commodity metaphor: Examiningemotional and symbolic attachment to place. Leis. Sci. 1992, 4, 29–46. [CrossRef]
60. Low, S.M.; Altman, I. Place attachment: A conceptual inquiry. In Place Attachment. Colección Human Behaviorand Environment: Advances in Theory and Research; Altman, I., Low, S.M., Eds.; Plenum Press: New York, NY,USA, 1992; Volume 12, pp. 1–12.
61. Buonincontri, P.; Marasco, A.; Ramkissoon, H. Visitors’ experience, place attachment and sustainablebehaviour at cultural heritage sites: A conceptual framework. Sustainability 2017, 9, 1112. [CrossRef]
62. Chen, C.F.; Leask, A.; Phou, S. Symbolic, experiential and functional consumptions of heritage tourismdestinations: The case of angkor world heritage site, cambodia. Int. J. Tour. Res. 2016, 18, 602–611. [CrossRef]
63. Ramkissoon, H.; Mavondo, F.T. Proenvironmental behavior: Critical link between satisfaction and placeattachment in Australia and Canada. Tour. Anal. 2017, 22, 59–73. [CrossRef]
64. Ramkissoon, H.; Weiler, B.; Smith, L.D.G. Place attachment and pro-environmental behaviour in nationalparks: The development of a conceptual framework. J. Sustain. Tour. 2012, 20, 257–276. [CrossRef]
65. Ram, Y.; Björk, P.; Weidenfeld, A. Authenticity and place attachment of major visitor attractions. Tour. Manag.2016, 52, 110–122. [CrossRef]
66. Brocato, E.D. Place attachment: An Investigation of Environments and Outcomes in Service Context. Ph.D.Thesis, The University of Texas at Arlington, Arlington, TX, USA, 2006.
67. George, B.P.; George, B.P. Past visits and the intention to revisit a destination: Place attachment as themediator and novelty seeking as the moderator. J. Tour. Stud. 2004, 15, 51–66.
68. Kim, S.; Schuckert, M.; Im, H.H.; Elliot, S. An interregional extension of destination brand equity: FromHong Kong to Europe. J. Vacat. Mark. 2017, 23, 277–294. [CrossRef]
124
Sustainability 2019, 11, 3516
69. Prayag, G.; Ryan, C. Antecedents of tourists’ loyalty to Mauritius: The role and influence of destinationimage, place attachment, personal involvement, and satisfaction. J. Travel Res. 2012, 51, 342–356. [CrossRef]
70. Simpson, P.M.; Siguaw, J.A. Perceived travel risks: The traveller perspective and manageability. Int. J. Tour.Res. 2008, 10, 315–327. [CrossRef]
71. Keller, K.L. Conceptualizing, measuring, and managing customer-based brand equity. J. Mark. 1993, 57,1–22. [CrossRef]
72. Echtner, C.M.; Ritchie, J.R. The meaning and measurement of destination image. J. Tour. Stud. 2003, 14,37–48.
73. Gallarza, M.G.; Saura, I.G.; García, H.C. Destination image: Towards a conceptual framework. Ann. Tour.Res. 2002, 29, 56–78. [CrossRef]
74. Hunt, J.D. Image as a factor in tourism development. J. Travel Res. 1975, 13, 1–7. [CrossRef]75. Hosany, S.; Prayag, G. Patterns of tourists’ emotional responses, satisfaction, and intention to recommend. J.
Bus. Res. 2013, 66, 730–737. [CrossRef]76. Zeugner-Roth, K.P.; Vesna, Ž. Bridging the gap between country and destination image: Assessing common
facets and their predictive validity. J. Bus. Res. 2015, 68, 1844–1853. [CrossRef]77. O’Leary, S.; Deegan, J. Ireland’s image as a tourism destination in France: Attribute importance and
performance. J. Travel Res. 2005, 43, 247–256. [CrossRef]78. Kim, S.S.; Morrsion, A.M. Change of images of South Korea among foreign tourists after the 2002 FIFA World
Cup. Tour. Manag. 2005, 26, 233–247. [CrossRef]79. Beerli, A.; Martin, J.D. Factors influencing destination image. Ann. Tour. Res. 2004, 31, 657–681. [CrossRef]80. Bonn, M.A.; Sacha, M.J.; Mo, D. International versus domestic visitors: An examination of destination image
perceptions. J. Travel Res. 2005, 43, 294–301. [CrossRef]81. Lee, T.H. A structural model to examine how destination image, attitude, and motivation affect the future
behavior of tourists. Leis. Sci. 2009, 31, 215–236. [CrossRef]82. Phau, I.; Shanka, T.; Dhayan, N. Destination image and choice intention of university student travellers to
Mauritius. Int. J. Contemp. Hosp. Manag. 2010, 22, 758–764. [CrossRef]83. Fakeye, P.C.; Crompton, J.L. Image differences between prospective, first-time, and repeat visitors to the
Lower Rio Grande Valley. J. Travel Res. 1991, 30, 10–16. [CrossRef]84. Gunn, C.A. Vacationscape: Designing Tourist Regions; Taylor and Francis/University of Texas: Washington DC,
USA, 1972.85. Baloglu, S.; McCleary, K.W. A model of destination image formation. Ann. Tour. Res. 1999, 26, 868–897.
[CrossRef]86. Chi, C.G. An examination of destination loyalty: Differences between first-time and repeat visitors. J. Hosp.
Tour. Res. 2012, 36, 3–24. [CrossRef]87. Martins, M. The tourist imagery, the destination image and the brand image. J. Tour. Hosp. Manag. 2015, 3,
1–14. [CrossRef]88. Ramseook-Munhurrun, P.; Seebaluck, V.N.; Naidoo, P. Examining the structural relationships of destination
image, perceived value, tourist satisfaction and loyalty: Case of Mauritius. Procedia-Soc. Behav. Sci. 2015,175, 252–259. [CrossRef]
89. Loureiro, S.M.C. The role of the rural tourism experience economy in place attachment and behavioralintentions. Int. J. Hosp. Manag. 2014, 40, 1–9. [CrossRef]
90. Moore, R.L.; Graefe, A.R. Attachments to recreation settings: The case of rail-trail users. Leis. Sci. 1994, 16,17–31. [CrossRef]
91. Chen, C.F.; Phou, S. A closer look at destination: Image, personality, relationship and loyalty. Tour. Manag.2013, 36, 269–278. [CrossRef]
92. Halpenny, E.A. Environmental Behaviour, Place Attachment and Park Visitation: A Case Study of Visitors toPoint Pele National Park. Ph.D. Thesis, University of Waterloo, Waterloo, ON, Canada, 2006.
93. Morais, D.B.; Lin, C.H. Why do first-time and repeat visitors patronize a destination? J. Travel Tour. Mark.2010, 27, 193–210. [CrossRef]
94. Veasna, S.; Wu, W.Y.; Huang, C.H. The impact of destination source credibility on destination satisfaction:The mediating effects of destination attachment and destination image. Tour. Manag. 2013, 36, 511–526.[CrossRef]
95. Keller, K.L. Understanding brands, branding and brand equity. Interact. Mark. 2003, 5, 7–20. [CrossRef]
125

Sustainability 2019, 11, 3516
96. Bettman, J.R.; Park, C.W. Effects of prior knowledge and experience and phase of the choice process onconsumer decision processes: A protocol analysis. J. Consum. Res. 1980, 7, 234–248. [CrossRef]
97. Alba, J.W.; Hutchinson, J.W. Knowledge calibration: What consumers know and what they think they know.J. Consum. Res. 2000, 27, 123–156. [CrossRef]
98. Baker, T.L.; Hunt, J.B.; Scribner, L.L. The effect of introducing a new brand on consumer perceptions ofcurrent brand similarity: The roles of product knowledge and involvement. J. Mark. Theory Pract. 2002, 10,45–57. [CrossRef]
99. Laroche, M.; Cleveland, M.; Bergeron, J.; Goutaland, C. The Knowledge-Experience-Evaluation Relationship:A Structural Equations Modeling Test of Gender Differences. Can. J. Adm. Sci./Rev. Can. Sci. L’administration2003, 20, 246–259. [CrossRef]
100. Marks, L.J.; Olson, J.C. Toward a cognitive structure conceptualization of product familiarity. In NA-Advancesin Consumer Research; Monroe, K.B., Ed.; Association for Consumer Research: Ann Arbor, MI, USA, 1981;Volume 8, pp. 145–150.
101. Alba, J.W.; Hutchinson, J.W. Dimensions of consumer expertise. J. Consum. Res. 1987, 13, 411–454. [CrossRef]102. Gartner, W.C. Image formation process. J. Travel Tour. Mark. 1994, 2, 191–216. [CrossRef]103. Boo, S.; Busser, J.; Baloglu, S. A model of customer-based brand equity and its application to multiple
destinations. Tour. Manag. 2009, 30, 219–231. [CrossRef]104. Yoo, B.; Donthu, N.; Lee, S. An examination of selected marketing mix elements and brand equity. J. Acad.
Mark. Sci. 2000, 28, 195–211. [CrossRef]105. Milman, A.; Pizam, A. The role of awareness and familiarity with a destination: The central Florida case.
J. Travel Res. 1995, 33, 21–27. [CrossRef]106. Mechinda, P.; Serirat, S.; Gulid, N. An examination of tourists’ attitudinal and behavioral loyalty: Comparison
between domestic and international tourists. J. Vacat. Mark. 2009, 15, 129–148. [CrossRef]107. Hammitt, W.E.; Backlund, E.A.; Bixler, R.D. Place bonding for recreation places: Conceptual and empirical
development. Leis. Stud. 2006, 25, 17–41. [CrossRef]108. López Guzmán, R. Arquitectura de Al-Andalus (Almería, Granada, Jaén, Málaga); Junta Andalucía/Legado
Andalusí/Comares/Fundación Euroarabe: Granada, Spain, 2002.109. Martín García, M.; Bleda Portero, J.; Martín Civantos, J.M. Inventario de Arquitectura Militar de la Provincia de
Granada (S. VIII al XVIII); Diputación: Granada, Spain, 1999; pp. 141–143.110. Almagro Gorbea, A. La torre de Romilla. Una torre nazarí en la Vega de Granada. Ai-Qantara 1991, XII,
225–250.111. García, J.A.; Gómez, M.; Molina, A. A destination-branding model: An empirical analysis based on
stakeholders. Tour. Manag. 2012, 33, 646–661. [CrossRef]112. Zeithaml, V.A.; Berry, L.L.; Parasuraman, A. The behavioral consequences of service quality. J. Mark. 1996,
60, 31–46. [CrossRef]113. Im, H.H.; Kim, S.S.; Elliot, S.; Han, H. Conceptualizing Destination Brand Equity Dimensions from a
Consumer-Based Brand Equity Perspective. J. Travel Tour. Mark. 2012, 29, 385–403. [CrossRef]114. Kyle, G.T.; Absher, J.D.; Graefe, A.R. The moderating role of place attachment on the relationship between
attitudes toward fees and spending preferences. Leis. Sci. 2003, 25, 33–50. [CrossRef]115. Muehling, D.D.; Stoltman, J.J.; Grossbart, S. The impact of comparative advertising on levels of message
involvement. J. Advert. 1990, 19, 41–50. [CrossRef]116. Del Barrio, S.; Luque, T. Análisis de Ecuaciones Estructurales. In Técnicas de Análisis de Datos en Investigación
de Mercados; Luque, T., Ed.; Pirámide: Madrid, Spain, 2012.117. Fornell, C.; Larcker, D.F. Structural equation models with unobservable variables and measurement error:
Algebra and statistics. J. Mark. Res. 1981, 18, 382–388. [CrossRef]118. Hayes, A.F. Introduction to Mediation, Moderation, and Conditional Process Analysis Second Edition:
A Regression-Based Approac; The Guilfor Press: New York, NY, USA; London, UK, 2017.119. Drummond, S.; Yeoman, I. Quality Issues in Heritage Visitor Attractions; Butterworth-Heinemann: Oxford,
UK, 2001.120. Fullerton, L.; McGettigan, K.; Stephens, S. Integrating management and marketing strategies at heritage sites.
Int. J. Cult. Tour. Hosp. Res. 2010, 4, 108–117. [CrossRef]121. Pedersen, A. Managing tourism at world heritage sites. In A Practical Manual for World Heritage Site Managers;
ICOMOS: Paris, France, 2002.
126

Sustainability 2019, 11, 3516
122. Guzmán, P.C.; Roders, A.P.; Colenbrander, B.J.F. Measuring links between cultural heritage management andsustainable urban development: An overview of global monitoring tools. Cities 2017, 60, 192–201. [CrossRef]
123. Bonilla, J.M.L.; Bonilla, L.M.L. Diferencias territoriales en la planificación y la gestión del destino turístico.Cuad. De Tur. 2007, 19, 71–90.
124. Ministry of Education, Culture and Sports. National Plan of Defensive Architecture; General Technical Secretariat:Madrid, Spain, 2015; p. 42.
125. Erdem, T.; Swait, J.; Valenzuela, A. Brands as signals: A cross-country validation study. J. Mark. 2006, 70,34–49. [CrossRef]
© 2019 by the authors. Licensee MDPI, Basel, Switzerland. This article is an open accessarticle distributed under the terms and conditions of the Creative Commons Attribution(CC BY) license (http://creativecommons.org/licenses/by/4.0/).
127


sustainability
Article
The Influence of Islamic Religiosity on the PerceivedSocio-Cultural Impact of Sustainable TourismDevelopment in Pakistan: A Structural EquationModeling Approach
Jaffar Aman 1,2,†, Jaffar Abbas 1,2,†,*, Shahid Mahmood 3,*, Mohammad Nurunnabi 4,5 and
Shaher Bano 2
1 School of Media and Communication (SMC), Antai College of Economics and Management (ACEM),Shanghai Jiao Tong University (SJTU), No. 800 Dongchuan Road Minhang District, Shanghai 200240, China
2 School of Sociology and Political Science, Shanghai University, No. 99 Shangda Road, Baoshan,Shanghai 200444, China; [email protected] (J.A.); [email protected] (S.B.)
3 College of Management, Shenzhen University, No. 3688 Nanhai Avenue, Nanshan District,Shenzhen 518060, China
4 Department of Accounting, Prince Sultan University, P.O. Box 66833, Riyadh 11586, Saudi Arabia;[email protected]
5 St Antony’s College, University of Oxford, 62 Woodstock Road, Oxford OX2 6JF, UK* Correspondence: [email protected] (J.A.); [email protected] (S.M.)† Jaffar Abbas and Jaffar Aman equally contributed as a first author to this work.
Received: 17 March 2019; Accepted: 16 May 2019; Published: 29 May 2019���������������
Abstract: Typically, residents play a role in developing strategies and innovations in tourism. However,few studies have sought to understand the role of Islamic religiosity on the perceived socio-culturalimpacts of sustainable tourism development in Pakistan. Previous studies focusing on socio-culturalimpacts as perceived by local communities have applied various techniques to explain the relationshipsbetween selected variables. Circumstantially, the structural equation modeling (SEM) technique hasgained little attention for measuring the religiosity factors affecting the perceived socio-cultural impactsof sustainable tourism. This investigation aims to address such limitations in this area of scientificknowledge by applying Smart PLS-SEM, developing an empirical approach, and implementingSmart-PLS software V-3.2.8. The proposed tourism model predicts the effects of the religiosity level onthe perceived socio-cultural impacts of sustainable tourism development. In this study, we examinethe relationships among religious commitments, religious practice, and religious belief and thesocio-cultural effects of sustainable tourism. Our research identifies influential factors through anextensive literature review on communities’ religiosity and the socio-cultural impacts of developingsustainable tourism. We examine and analyze data based on 508 residents’ responses. The findingsreveal an R2 value of 0.841, suggesting three exogenous latent constructs, which collectively elucidate84.10% of the variance in the perceived socio-cultural impact of sustainable tourism. The findingsreveal that religious respondents with a higher religiosity level have a positive attitude towardsdeveloping sustainable tourism. These findings are helpful to understand the dynamics of communities’perceptions, behaviors, quality of life, cultural aspects, and religiosity factors affecting sustainabletourism in Pakistan. This study is novel in the context of Pakistani cultural and social norms, andthis study’s implications may provide further direction for researching and developing sustainabletourism in the northern regions of Pakistan.
Keywords: sustainable tourism; socio-cultural factors; Islamic religiosity; social problems; Pakistan
Sustainability 2019, 11, 3039; doi:10.3390/su11113039 www.mdpi.com/journal/sustainability129

Sustainability 2019, 11, 3039
1. Introduction
In recent years, tourism has gained increasing popularity, and currently it is one of the mostimportant industries in several developing countries [1–4]. Many scholars have investigated andpublished relevant literature on the subject of sustainable tourism developments and host residents’behaviors and supportive attitudes in developing tourism in the modern era [2,5,6]. Moreover, severalauthors have investigated this subject, and a considerable number of studies have examined, modeled,and measured the effect of sustainable tourism development on the host residents’ perceived impacts,perceptions, attitude, and behavior in supporting further sustainable tourism development [3,7,8].Butler (2006) described the indispensable role that residents and their perceptions play in understandingthe development mechanism and process of sustainable tourism [9,10]. Residents mostly point tothe influence of sustainable tourism on their individual and communal living conditions [10,11].Though sustainable tourism development appears to be profitable, its environmental impact and thesocio-cultural perceptions of local inhabitants may refocus judgments on other issues [12]. Butler andvarious scholars have evaluated the relationship between the various processes of sustainable tourismdevelopment. Residents’ reactions from different perspectives and these assessments emphasizeadverse impacts, such as cultural corruption and capacity problems derived from cross-bordermovements [13–16]. Tourism development is considered to be a rural development mechanismconcerning culture, communities’ attitude, and socioeconomic contributions, generating rural incomeand employment opportunities, contributing to residents’ services and amenities, and supporting theconservation of cultural resources [17].
All over the world, local societies, villages, and rural economies, whether in developing countriesor the First World, have faced significant challenges and changes [18]. Sustainable incomes empowercommunity development and culture and support community development at the grassroots levelrather than just focusing on policy. New approaches to community development began between1950 and 1970; however, there was no actual transfer of powers or resources [19]. Nevertheless,Phillips and Pittman (2014) remained focused on the economic development of communities andsupported communities in innovative and new ways [20,21]. Tourism helps communities to generateeconomic opportunities, and it encourages progress and growth in these areas. Concerns associatedwith local knowledge have increased recently, leading to empowerment, local community participation,and participatory learning, and various approaches and methods have become grassroots-oriented,improving the confidence and skills available to upgrade communities starting at the local level [22,23].Since the 1990s, scholars have made a determined effort to understand the income opportunities of ruralcommunities more precisely as they relate to aspirations for rural development; as such, developmentattracts tourism to these sites. Typically, tourism development influences rural communities, andit makes a positive impact on their livelihoods. Thus, for some researchers, social constructionismtheories present culture by reflecting rustic studies as far removed from the core concern of change in thesocioeconomic situation of these communities. By focusing on cultural values and developments in thelocal community, this study adopts a perspective of livelihood based on cultural knowledge, traditions,culture, and sustainable livelihoods of the rural communities as a pragmatic approach. The hostcommunities want to make tourists happy to generate an advantageous image of the destination,which ultimately creates a positive reputation.
The hosts/local communities ultimately affect visitor satisfaction, which encourages tourists torevisit [24]. Therefore, measuring the community’s perception of the host society is very importantfor tourism sustainability in the northern regions of Pakistan. Local community attitudes towardssustainable tourism development vary in developed and underdeveloped countries. In some Islamiccountries, the host residents of rural communities display a welcoming approach to domestic andinternational tourists, and their opinion is more favorable to Muslim tourists as they share similarcultural values. Understanding such perspectives supports sustainable tourism and helps to createpositive impacts on local communities. Figure 1 below of the study area presents tourism sites.
130

Sustainability 2019, 11, 3039
(a). Map of Pakistan showing study area (b). Study Area, showing Northern areas of Pakistan
Figure 1. Study area showing Northern areas of Pakistan. K2 is the world’s second highest mountain.
We have enriched the study area by incorporating the geographical identification of the studyarea Tourism locations by using ArcGIS software (Esri, Redland, CA, USA) to show sample study areapoints on the map, as shown in Figure 1 above [25,26].
In the context of Pakistani rural areas, host communities’ residents have observed that touristsconsume products and services, which creates income opportunities. Tourists in Islamic countries oftenpractice similar religious traditions and share similar views of Islamic philosophy. Therefore, the responseof local community residents and the intervention of their local government are different. Sustainabletourism is most likely to be achieved in an environment of natural beauty, where the communityresidents have a positive reputation, i.e., where both the natural environment and the social climate areperceived to be worthwhile. The natural environment includes animals, plants, and the inhabitantsof these areas. The social climate includes social, cultural, and socioeconomic factors. However, it isnotable that the human and the natural environments are connected or interlinked, and human activitiesinfluence the natural environment by affecting the sustainability of the environment [27,28]. Therefore,sustainable tourism may have a positive social impact as a human activity, as its effects are evidentin the destination areas, and tourists often come into contact with the local environment, culture, andsociety [29]. This paradigm is reflected on an international and domestic level in the study area—abeautiful, little-explored valley in Pakistan—where sustainable tourism development policies andimplementation need the attention of the government to consider such factors [30–32], particularly inthe context of the rural areas of northern Pakistan [33–35]. The study area includes important mountainranges that have received attention from domestic and international travelers, who often choose torevisit the destination. Table 1 presents an overview of the sites included in the study area. Figure 2below shows the study area.
The study area commands a spectacular view of the Karakoram mountain range, including K2,which is the second highest peak in the world. The natural beauty of the region appeals to manyresidents and international tourists each year, bringing a considerable amount of foreign currency intothe country. Traditional communities are active in the promotion of cultural tourism, which improveseconomic growth, helps communities to create income opportunities, and provides an increase inlocal businesses.
131

Sustainability 2019, 11, 3039
Table 1. Mountain peaks in the northern areas of Pakistan (height in meters).
Sr. # Peak Name Altitude (Meters) Range Name World Ranking
1 K-2 8611 Karakoram 2nd2 Nanga Parbat 8126 Himalayas 9th3 Gasherbrum I 8068 Karakoram 11th4 Broad Peak 8047 Karakoram 12th5 Gasherbrum II 8035 Karakoram 14th6 Gasherbrum III 7952 Karakoram 15th7 Gasherbrum IV 7925 Karakoram 17th8 Distaghil Sar 7885 Karakoram 20th9 Kunyang Chhish 7852 Karakoram 24th10 Gasherbrum NE 7821 Karakoram 25th11 Rakaposhi 7788 Karakoram 27th12 Batura 7785 Karakoram 28th13 Kanjut Sar 7760 Karakoram 29th14 Saltoro Kangri 7742 Karakoram 33th15 Trivor 7720 Karakoram 36th
Figure 2. The study area presents Northern areas of Pakistan. K2 is the world’s second highest mountain(Source: Wikipedia).
Similarly, cultural tourism helps to identify avenues of alternative tourism development that canhelp to maintain a genuinely enriching environment. Since the first Western tourist group visited thisregion at the end of the 19th century, more international tourists have begun to travel to the study areaevery year. The opening of the Karakorum (KKH) Expressway in 1978 promoted the developmentof new wave tourism. At present, the modern tourism industry in the northern region of Pakistan is
132

Sustainability 2019, 11, 3039
now able to entertain four categories of tourists: (1) group tourists (using international travel services);(2) individual tourists (using temporary services); (3) high-altitude climbers and expeditions; and (4)domestic tourism services. Over the past two decades, tourism development has attracted visitors tothe beautiful natural valleys of Gilgit-Baltistan, and local communities have supported and encouragedtourists to visit these natural sites and places. The focus of the Pakistani government has been topromote climbing and hiking in the highlands, encouraging foreign exchange trading. Domesticvisitors traveling to these areas have increased tremendously in number, including noninstitutionalgroups and families, especially in the summer. Several Arab tourists are regular travelers to thesenatural places, enjoying the supportive attitude of the local communities: the cultural and socialexperiences are remarkable and relatively cheap compared with European trips.
In this study, we focused on the northern part of Pakistan, named Gilgit-Baltistan, and investigatedcontemporary perspectives on local attitudes [36], culture, sustainable tourism development, and thereligiosity effect as a conceptual framework for examining the rural tourism development processin the valleys of Gilgit-Baltistan [37]. Here, we propose a collaborative approach that emphasizesthe role of social attitudes and the impact of religiosity, cultural, and other socioeconomic factors ondeveloping sustainable tourism that benefits both tourists and local communities collectively [38]. Weexamined the residents’ religious practices and their effect on the perceived socio-cultural impact ofsustainable tourism. The residents’ religious beliefs have a positive and significant relationship withthe socio-cultural impacts on sustainable tourism.
2. Literature Review
2.1. Cultural and Social Impacts of Tourism
Previous studies investigating local communities’ support for sustainable tourism developmenttypically relied on sociological and psychological perspectives and assumed that the communities’residents are not homogeneous individuals, who may or may not be willing to support tourismdevelopment [39]. Moreover, various studies debated the relationships between community residents’and the socio-cultural impacts of sustainable tourism [40]. Earlier studies documented the ongoingphenomena in the countryside, showing declining employment opportunities and local populations, aswell as a deterioration of infrastructure and amenities [33,41–44]. In this context, scholars recognizedsustainable tourism as an advantageous mechanism contributing to local communities [45–47].Sustainable tourism creates opportunities for small, family-oriented businesses [48,49], which offertourists cultural experiences and an enjoyable local environment that contributes to local communitydevelopment [5,42,50]. More precisely and concretely, developing sustainable tourism contributesto rural areas by providing pleasant socioeconomic, cultural, and environmental experiences; it alsocreates employment and income, adds to local community amenities, and aids in the conservationof cultural resources [31,34]. This paradigm might depend upon the coexistence of a governanceapproach, feasibility, a community attitude, cultural enrichment, and an enjoyable environment fortourists in the northern areas of Pakistan [11,51]. Thus, sustainable tourism development in countrysidelocalities relies upon encouraging policies, governmental and non-governmental collaboration, andstreamlining the development practices that could promote local communities’ attitudes, socioeconomiccontribution, culture, and the effect of religiosity [52,53]. The socio-cultural impacts are affected byhow local inhabitants perceive sustainable tourism [54,55]. Local culture also impacts tourism andattracts tourists, and innovations in sustainable tourism, tourists’ cross-cultural vision, virtual visitors,museum and heritage management in the recent digital age, policy on digital tourism and culture,governance and tourism marketing, social media, e-tourism, and emerging technologies are alsocrucial in developing tourism [56]. Gursoy (2017) noted that the socio-cultural and socioeconomicimpacts of sustainable tourism on local communities are typically not easy to assess, and quantifyingtourism development is slow and unglamorous. Swarbrooke (1999) argued that sustainable tourism
133

Sustainability 2019, 11, 3039
development has attracted enormous attention recently in countries of the developed and developingworld [57,58].
Tourists’ exposure to local communities’ indigenous cultures, normally disparaged asperformances and events, and the tour packages offered should be commercially feasible, attractive,and comprehensible for sustainable tourism to flourish [57,59]. Prior research suggests that the socialand cultural phenomena of sustainable tourism do not present a clear picture, and it is not easy todraw a line between cultural or social marvels or events; various theorists categorize sociocultural andsocioeconomic impacts of sustainable tourism in broader context [60]. Thus, different perceptions ofthe impact of tourism from various types of inhabitants may provide insight into these natural sitesand the degree to which sustainable tourism affects tourists’ destinations. As a result, it is unsurprisingthat research on local inhabitants’ attitudes towards sustainable tourism development continues tobe an exciting topic of substantial interest. Further, Hashimoto argued that the culture and mindsetof host communities and their perception of sustainable tourism development and travelers varyunceasingly between positive and negative [61–64]. Specht (2014) wrote that the narrative on tourismdemonstrates how various inhabitants might not only have different cultures and attitudes, but alsothat they might have ambivalent or dissimilar attitudes towards sustainable tourism [63,65]. Tourismdevelopment has several socio-cultural benefits and advantages, for instance, the host community’scultural development, cultural exchange, an improved image for host communities, social change,social amenity improvements, and better public health, education, attitudes, and conservation [66,67].Many prior studies inspecting the socio-cultural impact of tourism development have listed severalprobable positive effects of the tourism industry. Prior studies extensively observed the perception ofsocio-cultural impact on geographic or socio-demographic influences. However, as stated above, thereare no prior studies in the literature that have investigated the effect of residents’ religiosity level onthe perceived socio-cultural impacts of tourism development. Table 2 presents some previous studiesas given below;
Table 2. The sustainable management of natural resources.
Studies Impacts
Smith (2012) Deteriorating the cumulative impacts of host residents’ attitudes towardtourists [68]
Chon, Pizam, & Mansfeld (2012),and Peter Gray & Peter Gray (1981)
Tourists’ interaction may determine attitudes, values, and behaviorstowards sustainable tourism. Type of contact with tourists mightinfluence behavior and values towards sustainable tourism [69,70]
Newsome, (2017), G. Richards &Hall, (2003), Sroypetch (2016)
Tourism provides a revenue source for a church, perceived security, andsafety might be affected [71–73]
Bricker, Black, & Cottrell (2013) Tourist–host interaction seldom produce real communication orunderstanding [40]
Reisinger & Turner (2012) Cross-cultural behaviors of hosts and residents coping strategies forinteraction with tourists [74]
Sharpley & Telfer (2002) In destination localities, tourism is a potential contributor tosocioeconomic development [75]
Zamani-Farahani & Musa (2012) Residents religiosity level and socio-cultural impacts contribute tosustainable tourism development [76]
Horner & Swarbrooke (2016) Tourism nature and contemporary tourists behaviors in social, political,and socioeconomic context [77,78]
Smith (2012) deteriorating the cumulative impacts of host residents’ attitudes towardtourists [68]
The natural resources of the country are an essential aspect of development, as they provide rawmaterials for industry and have become a symbol of national pride. Managing sustainable natural
134

Sustainability 2019, 11, 3039
resources refers to long-term land, water, environment, animal, and vegetation management. Figure 3below of the study area presents tourist destinations.
Figure 3. Natural sites in northern areas. Note: Figure 2 & Figure 3 presents the study area. Naturaltourists sites in northern areas (Source: Wikipedia).
2.2. The Dimension of Islamic Religiosity: Host Community Perception of the Socio-Cultural Impact ofSustainable Tourism
Tourism development affects communities in many urban destinations, as well as in coastal andrural areas. The socio-cultural implications in these destinations, however, are less well-documented inthe literature concerning developing countries [79]. The development of world civilizations and humanhistory is intertwined with religion, which is one of the main pillars of human societies worldwide [80].Faith is a binding force in many human communities, and it describes a code of human ethics that isapparent in culture, societal setup, attitudes, and personal values [81]. These social values, beliefs,and religious norms determine institutional practices, as well as human behavior. In several Westernsocieties and Asian countries, religion is not only a system of belief; it is also individuals’ recognizedfaith in all aspects of human life. Religion has a social impact on consumer products and servicesin various industries, including hospitality and travel. Sociologists view religion as an ideologythat applies to humans and members of a community bonded in a harmonious relationship [82,83].Religion is among the most critical social and cultural forces and has a significant impact on humanbehavior [84]. Religion affects the interaction of people, and it helps individuals of different mindsetsto create a better understanding. Social distance theory claims that people with similar social, cultural,and religious values are more vulnerable than other individuals [85]. Social distance determines thedistance or gap between different people, groups, and social systems in human society, and the notionof this distance rests on social class, race, ethnic group, gender, and sexuality. However, it is a factthat social range is higher among dissimilar people or groups, while people with different mindsetsmix more efficiently in social gatherings as the degree of intimacy or understanding is more elevatedin their personal and social relations. Several earlier studies support social exchange theory, and the
135

Sustainability 2019, 11, 3039
literature has suggested that the exchange system helps in evaluating sustainable tourism impacts.However, rare studies have considered host residents’ cultural background.
Other studies focusing on residents’ attitudes, behaviors, and perceptions of the socio-culturalimpact of sustainable tourism identified various relationships. Accordingly, the proposition of researchfocusing on Islamic religiosity by covering religious belief, practice, and commitment has shown anegative association with socio-cultural impacts. Typically, researchers have assessed religious beliefsby adopting a multidimensional approach. In the literature, Batson, Schoenrade, and Ventis (1993)applied a two-dimensional technique to calculate religious beliefs [86]. Chang and Downey (2011) alsoused a two-dimensional method to measure the effects of religiosity, considering individuals beliefsand practices [87]. One of the two dimensions includes internal and external religious practices, andthe second is a visible expression of religious faith, for instance, the study of the Holy Quran, dailyprayers, traditions, and rituals. Allport (1951) introduced a theological, ethical position named SCALAby narrating external and internal religious practices as the critical aspects of religious beliefs, andthese two dimensions present different motives of religious believers [88]. Typically, individuals dividetheir religious structures via a two-dimensional approach to practicing religion: individually andcollectively in groups [88,89]. Scholars have also considered a three-dimensional religious approachthat is more appropriate for measuring religiosity among people [90–95]. These scholars have agreedthat previous studies discussed only two dimensions of religiosity: one dimension is a religious beliefand the other is an individual’s spiritual practice [96,97]. The third dimension of religiosity is differentfrom those as mentioned earlier in the literature, and it denotes an inverse relationship. The thirddimension is ‘community’, ‘organization’, ‘experience’, ‘spirituality’, and ‘experimental’ [98–100].In 2009, Tailoring and Begloomed attempted to assess the breadth of the Islamic religion, consideringvital Islamic elements such as Islamic texts, the Holy Quran, and the Hadith (the actions and speechesof the Holy Prophet PBUH). They declared that there are four primary dimensions of Islam outof 60, namely religious beliefs, spiritual friendships, religious ceremonies (be kind to others), andspiritual enrichment (womb-to-tomb learning). The most common assessments of religion are thetwo-dimensional and three-dimensional methods, and there are many differences in the factors definingthe dimensions as the elements used in the analyses are also different. Allport (1951) measured anindividual’s religiousness based on their motivation [88,101]. Scholars including Abdullah (2010) haveclaimed that the Quran and Hadith of the Holy Prophet (PBUH) are crucial elements in measuringIslamic beliefs (faith) and individuals’ Islamic practice [102–104].
Figure 4 here outlines the conceptual framework of the tourism model used in this research, whichpresents the effects of Islamic religiosity on the perceived socio-cultural impacts of sustainable tourism.Since the 1990s, scholars have focused on this area and have made a determined effort to understandwhether the financial advantages of rural communities specifically were in line with aspirations forrural development as they attracted sustainable tourism development to such natural places. Thus,tourism development influenced rural communities’ attitudes, which had a positive impact on theirlivelihoods. Therefore, their approach to a sustainable livelihood has revealed individual skills and theactions required to generate livelihoods. Such livelihoods are sustainable if residents can cope withand recuperate from stresses [105], shocks, and pressure and still maintain or enhance their assetsand capabilities, balancing a sustainable livelihood (SL) environment, tradition, and the socio-cultureimpacts of tourism.
2.3. Conceptual Framework
This study designed a conceptual model and applied Partial Least Square Structural PartialEquation Modeling (PLS-SEM), structural equation modeling, to evaluate the effect of residents’religiosity level on the socio-cultural impact of sustainable tourism. The PLS-SEM approach is theconventional method for conducting causal predictive analysis to examine both formative and reflectivemodels, and it calculates the relationship among selected variables [106]; it is a nonparametric techniqueand it does not require any supposition regarding data distribution. The PLS-SEM is the commonly
136

Sustainability 2019, 11, 3039
used technique for multivariate analysis to measure variance-based structural equation models inthe fields of social sciences [49]. In this study, the model contains three groups of exogenous latentconstructs, namely factors of religious commitment, religious belief, and religious practice, and oneendogenous latent variable, called socio-cultural impacts, with eight observed variables. Figure 4below displays the conceptual model of this study, and it shows the relationships among the selectedvariables (endogenous latent constructs and exogenous latent constructs).
Figure 4. It demonstrates the conceptual framework of the proposed study.
2.4. Hypotheses of the Study
Hypothesis 1. A community’s religious commitment positively affects sustainable tourism development.
Hypothesis 2. A community’s religious practices positively affect sustainable tourism development.
Hypothesis 3. A community’s religious beliefs form a positively significant relationship with sustainabletourism development.
3. Methods
Researchers typically use the smart PLS-SEM technique for developing a theory in exploratoryresearch [49]. The smart PLS-SEM critical applications include confirmatory factor analysis, pathanalysis, regression models, factor analysis, covariance structure models, and correlation structuremodels [5]. Additionally, structural equation modeling (SEM) permits linear relationships analysisbetween manifest variables and latent constructs. Partial least squares SEM (PLS-SEM) refers to amultivariate statistical technique for evaluating the measurement model simultaneously, such as therelationship between the study constructs and its conforming indicators with a structural model toindicate relationships between the constructs [107]. It also can produce available parameter estimatesto assess the associations between unobserved variables. Typically, the SEM method allows manyrelationships to be calculated and tested at once in the single proposed model with many links instead ofinvestigating each relationship individually. This study has analyzed the hypothesized structural modelof Figure 4 by using a smart PLS-SEM approach, and it is advantageous over other regression-basedmethods to evaluate different latent constructs with several manifest variables [5]. The PLS-SEMresearch approach is a robust, flexible, and superior tool to build an adequate statistical model, whilethe PLS-SEM feature helps in achieving the predicted objective [108–110]. Wan Afthanorhan [111],and Astrachan et al. [112] stress that reliable and valid confirmatory factor analysis is well achievedby using PLS-SEM path modeling. Consistent with the above arguments, PLS-SEM is a statisticaltool that has been used by several researchers in various research areas in social sciences, including
137

Sustainability 2019, 11, 3039
business research [108]. Moreover, PLS-SEM specifically permits the testing of complex models havingmultilevel effects; for instance, a mediating role and other complex models’ variables relationships [110].This study applied smart PLS -SEM V-3.2.8 for data analysis and to calculate loadings, path coefficients,and weights; the study incorporated the bootstrapping technique to determine significance levels [107].
Figure 5 displays the three steps of the data collection procedures. In the first phase, we selected thepreliminary Islamic religiosity variables influencing the perceived socio-cultural impact of sustainabletourism development. In the second phase, we designed a pilot study to test and obtain a clearunderstanding of questionnaire items’ reliability and modified it accordingly. In the third and finalstep, we executed the survey and received feedback from the respondents.
Figure 5. The procedure of data collection.
3.1. Preliminary List of Factors
Primarily, we identified over 30 influential factors affecting local perceptions of tourismdevelopment; we tested a pilot study by engaging 15 experts in the relevant field whose recommendationswere incorporated into the questionnaire before starting the final phase by removing some unsuitablefactors concerning the local conditions and the design of this single study. Factors affecting tourismdevelopment are shown in Table 3 below;
3.2. Designing a Questionnaire
We developed and distributed the revised version of the selected factors of the self-structuredsurvey among the targeted population to receive the required data using a random sampling approach.We informed and trained the respondents about the purpose of this research, and we assured therespondents that all the data elicited is strictly confidential. The questionnaire had two sections on therespondents’ perceptions of tourism development. The survey also obtained the respondents’ generalinformation, such as gender, age, education, profession, and location in the questionnaire’s first section,while its second section addressed the critical and influencing religiosity factors. The study invitedrespondents from the rural communities of the selected study areas to answer questions on the impactof sustainable tourism on their daily lives. The questionnaire utilized a five-point Likert-scale requiringindividuals to rate their agreement levels from strongly disagree = 1 to strongly agree = 5 (stronglydisagree = 1, disagree = 2, agree = 3, neither agree nor disagree = 4, and strongly agree = 5).
138

Sustainability 2019, 11, 3039
Table 3. List of identified influencing factors for sustainable tourism development.
Code Influencing Factors
Items Factors of Socio-Cultural impact
SCF_1 Drugs Addictions [113]SCF_2 Social Crime [114,115]SCF_3 Community Image [116]SCF_4 Infrastructure Development [116,117]SCF_5 Cultural Activities [118]SCF_6 Recreational opportunity [118,119]SCF_7 Business opportunities [120]SCF_8 Environmental damage or destruction [121,122]
Factors of Religious commitment [123,124]
RCF_1 I financially contribute to religious organizationsRCF_2 I usually spend more time trying to understand my faithRCF_3 Religious beliefs are my whole approach to a meaningful lifeRCF_4 I enjoy spending time with people with the same religious affiliation as I haveRCF_5 Religious beliefs impact all dealings of my lifeRCF_6 I enjoy working on my religious affiliation activities
Factors of Religious Practices [123–125]
RPF_1 Performing Hajj is my priority to fulfill my necessary conditionRPF_2 I firmly believe that Allah always helps meRPF_3 I always offer/make my prayer on timeRPF_4 I usually spend more time and try to understand my faith
Factors of Religious beliefs [124–126]
RBF_1 Religious belief helps me to protect sustainable tourism developmentRBF_2 Islam is a perfect code of life to lead a better lifeRBF_3 I frequently read books/magazines on my faithRBF_4 Religion Belief helps me to perform my social responsibilities well.
3.3. Size of the Targeted Population Sample
The sample size of the population comprised of 508 valid responses and focused strictly on ruralcommunities in the area of Gilgit-Baltistan, Pakistan. The respondents were required to be educated atleast to a degree level. The researchers omitted uneducated people as they were hesitant to answerquestions during the pilot test, and they were unaware of the survey’s importance. We educated andtrained the respondents about the survey’s purpose, and the researchers gave the respondents 14 daysto understand and fill out the survey.
3.4. Data Processing of the Questionnaire’s Feedback
After receiving the input from the targeted respondents, the researchers checked and screenedall the questionnaires. Based on the completed and accurate responses, the researchers collected 508adequately filled out surveys and scrutinized them to confirm the data accuracy. This study processedthe data received and analyzed it by applying the analytical tool Smart PLS 3.2.8. In the final step,the statistical analysis provided the interpreted results as a useful insight and valuable evidence forthe evaluation of the underlying factors. Additionally, 15 experts on rural development who alreadycontributed to the pilot study during screening the crucial elements were invited again to offer theirvaluable expertise and provide their opinion on the data results.
4. Results
This study measured mean scores (M), standard deviation, excess kurtosis, and skewness, andall items of the scale showed consistent reliability and satisfactory results. Table 4 below showsdemographic analysis of the respondents.
139

Sustainability 2019, 11, 3039
Table 4. Demographic analysis of the respondents.
Demographic Analysis
Gender of respondents No. of Respondents Percentage
Male 291 57.28%Female 217 42.72%
Area of Respondents
Gilgit 130 25.29%Hunza 74 14.56%Nagar 110 21.56
Baltistan 100 19.68Astore 54 10.62
Age of Respondents
20–24 260 51.18%25–29 200 39.37%30–34 23 4.25%35–40 25 4.92%
Educational Background
Intermediate 110 21.65%Bachelor 290 57.08%Masters 108 21.25%
In Table 4, demographic analysis of the respondents showed that male participants (291) werein the majority (57.28%), while the number of female respondents was 217 (42.72%). The majorityof participants (23.43%) came from Gilgit city, and a lower number was from Baltistan (17.91%).The majority of the respondents (51.18%) were within the 20 to 24 age range, whereas the 30 to 34 yearsage range showed the lowest participation.
Table 5 presents a comprehensive description of the descriptive statistical analysis showing themean (M), standard deviation (SD) scores, and skewness and kurtosis values. The values of Table 5revealed that the data presented satisfactory results and showed normal distribution.
Table 5. Mean (M), std. deviation (SD), kurtosis, and skewness values.
Items Mean Std. Deviation Excess Kurtosis Skewness
SCF_1 3.346 1.420 −1.262 −0.276SCF_2 3.504 1.509 −1.195 −0.533SCF_3 3.557 1.443 −1.177 −0.525SCF_4 3.386 1.478 −1.385 −0.298SCF_5 3.616 1.470 −1.148 −0.566SCF_6 3.427 1.438 −1.295 −0.33SCF_7 3.185 1.473 −1.367 −0.126SCF_8 3.331 1.544 −1.451 −0.278RCF_1 3.484 1.426 −1.216 −0.383RCF_2 3.482 1.302 −0.998 −0.356RCF_3 3.388 1.392 −1.260 −0.228RCF_4 3.309 1.426 −1.339 −0.167RCF_5 3.472 1.361 −1.164 −0.297RCF_6 3.360 1.351 −1.203 −0.19RBF_1 3.431 1.850 −1.595 6.388RBF_2 3.476 1.433 −1.160 −0.432RBF_3 3.341 1.712 −1.506 2.798RBF_4 3.567 1.389 −1.088 −0.483RPF-1 3.612 1.433 −1.077 −0.583RPF-2 3.537 1.880 −1.940 6.616RPF-3 3.354 1.477 −1.405 −0.25RPF-4 3.433 1.441 −1.197 −0.386
140

Sustainability 2019, 11, 3039
4.1. Evaluation of Outer Measurement Model
This study evaluated the quality and merit of measurement goodness to confirm the validity andreliability of the analysis process output by using the PLS-SEM technique. Based on Hair et al. [107],this study assessed individual item reliability, discriminant validity, and the concurrent validitybefore test hypotheses of the designed model. This study used the smart PLS algorithm to ascertaineach item’s reliability and the model’s measurement assessment as indicated in Figure 4. Hence,the indicator reliability examined the outer loadings of each measurement intended to measure aconstruct [107]. Composite reliability (CR) is the most common indicator to check the reliability of theinternal consistency in the field of social sciences, and we applied this technique in this study [127].Here, the composite reliability indicator showed that it was suitable to use PLS-SEM in this study [107].Convergent validity presents the validity of constructs that measure how a specific measurement trulymeasures the construct that was intended to assess/measure, and it displays a positive correlationwith other alternative measurements of the same construct. Hence, it shows the degree of correlationamong the identical construct measures [107]. Hair et al. [128] recommended a comprehensive researchmethod of average variance extracted (AVE) for verifying the convergent validity for construct levels.The loading values were set to 0.4 according to the recommendations of Hair et al. The AVE value wasset to 0.5, whereas the composite reliability must display a value of 0.7 [107]. Accordingly, in this study,we followed the recommended PLS-SEM method based on the previous literature, which suggestedthe approach of using repeated indicators of the model. Table 6 below shows that the measurementmodel’s results are exceeding the recommended values, which indicates that convergence validity issufficient as presented in Table 6 below (see Figure 6).
Table 6. The measurement model displays a convergent validity, alpha (α), and reliability.
Constructs Items Loadings Cronbach’s Alpha (α) CR AVE
Socio-Cultural Factors SCF_1 0.786 0.880 0.905 0.546SCF_2 0.785SCF_3 0.718SCF_4 0.809SCF_5 0.668SCF_6 0.637SCF_7 0.715SCF_8 0.775
Religious Commitment Factors RCF_1 0.837 0.861 0.896 0.590RCF_2 0.705RCF_3 0.781RCF_4 0.746RCF_5 0.779RCF_6 0.755
Religious Belief Factors RBF_1 0.666 0.755 0.845 0.579RBF_2 0.793RBF_3 0.720RBF_4 0.853
Religious Practice Factors RPF_1 0.846 0.835 0.890 0.672RPF_2 0.688RPF_3 0.873RPF_4 0.858
141

Sustainability 2019, 11, 3039
Figure 6. Measurement model (PLS-SEM algorithm). Note: Estimations of structural equations model.
4.2. Graphical Representation of Construct Validity and Reliability
Table 7 shows Fornell–Larcker criterion test as given below:
Table 7. Fornell–Larcker criterion test.
Factors RBF_1 RCF_2 RPF_3 SCF_4
Religious Beliefs 0.770
Religious Commitment 0.550 0.768
Religious Practice 0.488 0.581 0.750
Socio-Cultural 0.384 0.455 0.545 0.740
4.3. Inner Structural Model’s Evaluation through Smart PLS
In this study, we evaluated and confirmed the validity and reliability of the measurement model.The next step in the evaluation process describes how to calculate inner structural model outcomes.
4.4. Calculating (R2) Value
Coefficients of determination calculate the variance and overall effect size illustrated in theendogenous constructs for the structural tourism model by calculating the predictive accuracy of themodel. The inner path model value was 0.841 for the Islamic religiosity endogenous latent construct.It indicates that the model’s independent constructs significantly explained 84.10% of the varianceregarding the perceived socio-cultural impact. The results reveal that the model’s three independentvariables caused 84.10% of the change in the perceived socio-cultural impacts of sustainable tourism.Hair et al. [108] and Henseler et al. [129] explained that R2 is considered to be substantial at a value of0.75, moderate at 0.50, and weak at 0.26, respectively. In this study, a significant value of R2 at 0.841was obtained.
142

Sustainability 2019, 11, 3039
4.5. Path Coefficients and t-Value Estimation
We tested the significance of the proposed hypothesis by calculating the standardized beta (β)value. The value of beta (β) denoted the probable variation of the dependent construct in the studyfor the unit variation in independent constructs. We calculated the beta (β) value for each path inthis hypothesized model. There will be greater and significant substantial effects on the endogenouslatent construct if the beta (β) value is also higher and significant. The t-test is a technique to verify thesignificance level of the beta (β) value. In this study, we used a bootstrapping method to evaluate andassess the significance of the proposed hypothesis as shown in Table 8 [107] (see Figure 7).
Table 8. Results of Hypotheses Testing.
Hypothesis Path Standard Beta (β) t-Values p-Values Decision
RCF -> SCIF 0.436 11.651 0.000 SupportedRPF -> SCIF 0.286 6.811 0.000 SupportedRBF -> SCIF 0.284 5.193 0.000 Supported
Figure 7. Structural model (PLS-SEM bootstrapping analysis).
Table 8 reveals the analysis of the structural model. The results reveal that the H1 outcomedepicting religious commitment factors showed a positive impact on the overall socio-cultural impactof sustainable tourism development as perceived by local communities and was statically significant atthe 5% level (β = 0.436; t = 11.651; p = 0.000). Thus the results supported Hypothesis 1, which stated,“The community’s religious commitment positively affects the perceived socio-cultural impact ofsustainable tourism development.” Hypothesis 2 stated, “A community’s religious practices positivelyaffect the perceived socio-cultural impact of sustainable tourism development.” The finding of Table 8endorsed positive relationships (β = 0.286, t = 6.811, p < 0.000) and confirmed H2. Finally, Hypothesis3 stated, “A community’s religious beliefs form a positive relationship with the perceived socio-culturalimpacts of sustainable tourism development.” Religious belief factors positively and significantlyinfluence the perceived socio-cultural impact of sustainable tourism development, and the results
143

Sustainability 2019, 11, 3039
of this study support H3 as shown Table 8 (β = 0.284, t = 5.193, p < 0.000). Figure 7 below presentsthe results.
According to Cohen, the (ƒ2) value has a strong effect at 0.35, a moderate effect at 0.15, and a weakeffect at 0.02 [130]. Table 9 presents the values of (ƒ2) calculated through the PLS-SEM technique [131].The results, as shown in Table 9, reveal the effect size and the satisfactory relationships betweenreligious commitment (high effect 0.486), religious practice, and religious belief and the socio-culturalimpact of sustainable tourism development as perceived by the local communities.
Table 9. Effect size: Measuring the effect size (ƒ2).
Exogenous Latent Variables (ƒ2) Effect Size
Religious Commitment related factors 0.486 High effectReligious Practice related factors 0.164 Moderate effectReligious Belief related factors 0.189 Moderate effect
4.6. Model’s Predictive Relevance (Q2)
The predictive relevance (Q2) technique measures the smart PLS path model’s quality, and it isestimated by using the procedure of blindfolding [132]. In this study, we performed the cross-validatedredundancy. The predictive relevance model (Q2) suggests that the proposed model might predict thestudy’s endogenous latent constructs. The predictive relevance (Q2) values calculated in the smartPLS-SEM must be (>0) greater than zero for the specific endogenous latent construct.
Figure 8 demonstrates the predictive relevance (Q2) for this particular model and shows its valueat 0.427, which is higher than its threshold limit. These results support the predictive relevance of thepath model, which is suitable for the endogenous constructs.
Figure 8. The model’s predictive relevance (Q2).
144
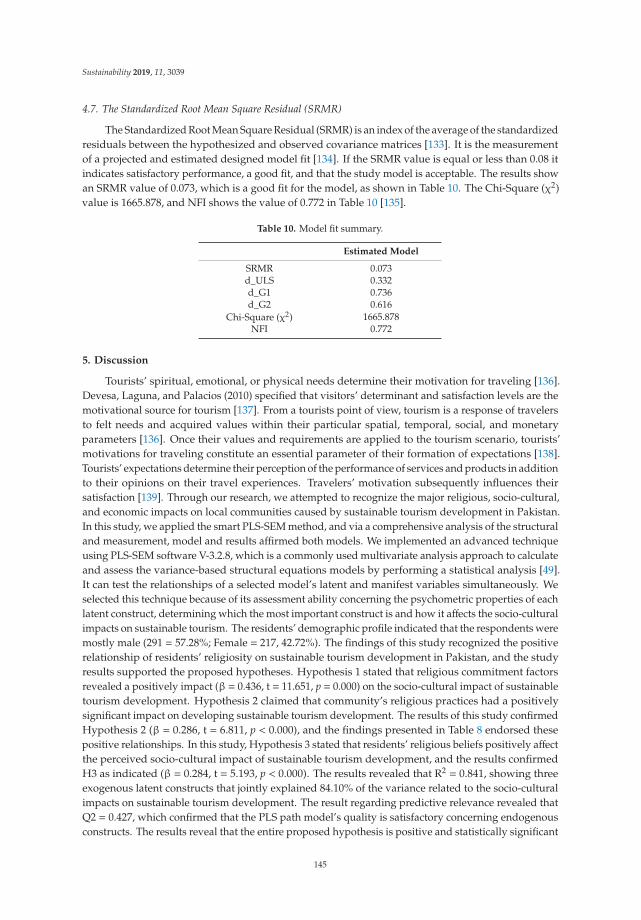
Sustainability 2019, 11, 3039
4.7. The Standardized Root Mean Square Residual (SRMR)
The Standardized Root Mean Square Residual (SRMR) is an index of the average of the standardizedresiduals between the hypothesized and observed covariance matrices [133]. It is the measurementof a projected and estimated designed model fit [134]. If the SRMR value is equal or less than 0.08 itindicates satisfactory performance, a good fit, and that the study model is acceptable. The results showan SRMR value of 0.073, which is a good fit for the model, as shown in Table 10. The Chi-Square (χ2)value is 1665.878, and NFI shows the value of 0.772 in Table 10 [135].
Table 10. Model fit summary.
Estimated Model
SRMR 0.073d_ULS 0.332d_G1 0.736d_G2 0.616
Chi-Square (χ2) 1665.878NFI 0.772
5. Discussion
Tourists’ spiritual, emotional, or physical needs determine their motivation for traveling [136].Devesa, Laguna, and Palacios (2010) specified that visitors’ determinant and satisfaction levels are themotivational source for tourism [137]. From a tourists point of view, tourism is a response of travelersto felt needs and acquired values within their particular spatial, temporal, social, and monetaryparameters [136]. Once their values and requirements are applied to the tourism scenario, tourists’motivations for traveling constitute an essential parameter of their formation of expectations [138].Tourists’ expectations determine their perception of the performance of services and products in additionto their opinions on their travel experiences. Travelers’ motivation subsequently influences theirsatisfaction [139]. Through our research, we attempted to recognize the major religious, socio-cultural,and economic impacts on local communities caused by sustainable tourism development in Pakistan.In this study, we applied the smart PLS-SEM method, and via a comprehensive analysis of the structuraland measurement, model and results affirmed both models. We implemented an advanced techniqueusing PLS-SEM software V-3.2.8, which is a commonly used multivariate analysis approach to calculateand assess the variance-based structural equations models by performing a statistical analysis [49].It can test the relationships of a selected model’s latent and manifest variables simultaneously. Weselected this technique because of its assessment ability concerning the psychometric properties of eachlatent construct, determining which the most important construct is and how it affects the socio-culturalimpacts on sustainable tourism. The residents’ demographic profile indicated that the respondents weremostly male (291 = 57.28%; Female = 217, 42.72%). The findings of this study recognized the positiverelationship of residents’ religiosity on sustainable tourism development in Pakistan, and the studyresults supported the proposed hypotheses. Hypothesis 1 stated that religious commitment factorsrevealed a positively impact (β = 0.436, t = 11.651, p = 0.000) on the socio-cultural impact of sustainabletourism development. Hypothesis 2 claimed that community’s religious practices had a positivelysignificant impact on developing sustainable tourism development. The results of this study confirmedHypothesis 2 (β = 0.286, t = 6.811, p < 0.000), and the findings presented in Table 8 endorsed thesepositive relationships. In this study, Hypothesis 3 stated that residents’ religious beliefs positively affectthe perceived socio-cultural impact of sustainable tourism development, and the results confirmedH3 as indicated (β = 0.284, t = 5.193, p < 0.000). The results revealed that R2 = 0.841, showing threeexogenous latent constructs that jointly explained 84.10% of the variance related to the socio-culturalimpacts on sustainable tourism development. The result regarding predictive relevance revealed thatQ2 = 0.427, which confirmed that the PLS path model’s quality is satisfactory concerning endogenousconstructs. The results reveal that the entire proposed hypothesis is positive and statistically significant
145

Sustainability 2019, 11, 3039
regarding acceptance. The findings show that the residents’ religiosity level (religious commitment,practices, and beliefs) affected the socio-cultural impact of sustainable tourism development. Thisstudy establishes new empirical findings on sustainable tourism development. In this study, weexamined the implications of local culture, heritage, and socioeconomic and socio-cultural effects onlocal inhabitants. Tourism destinations can promote marketing campaigns to attract religious tourists,and these such strategies can improve sustainable tourism development. Sustainable tourism can alsocreate opportunities for small, family-oriented businesses [48,49].
Typically, Gilgit-Baltistan’s tumultuous past faces the left traces and enriches the domesticsocio-cultural impacts, the gastronomy, and architecture; all these aspects are relevant factors thatencourage the global tourists to visit these areas physically. However, previous studies evidencethat heritage prevails in the rural northern regions as it usually better preserves heritages againstexternal impacts, and the global tourists might avail the probable opportunity to experience the scenicbeauty and original heritage time to time [140]. Scholars have highlighted the essential featuresthat residents and their perceptions play to understand the development mechanism and process ofsustainable tourism development [9,10]. Typically, residents influence sustainable tourism on theirindividual and collective living conditions [10,11]. Tourism development characteristically is perceivedas an indispensable development opening for the local community in the view of the Governmentof Pakistan and the regional Government of Gilgit-Baltistan. The previous literature supports theprimary purpose of this work as tourism destinations have become indispensable elements, and it hasbecome increasingly essential in developing both economic and cultural factors to attract global tourists.Usually, tourism development is the source of development openings for the host communities becauseof its associated vital advantages such as building new parks, recreational opportunities in the areas,job opportunities, better health facilities, education, improved infrastructure, and residents’ betterliving standard. The results of this specific research also confirmed the findings of earlier surveysshowing that developing sustainable tourism leads to cultural and natural environment protection andit increases the economic prosperity and job opportunities [141–146].
Sustainable tourism development in the destination typically generates an additional incomefor local administration budgets that utilized and invests for developing future tourism marketingstrategies and conservation of the sustainable tourism attractions by guaranteeing the sustainability oftourist areas. The findings of this proposed research are consistent and in line with earlier researchstudies [145,147,148]. According to the factual reality of residents, they perceive tourism developmentas playing an indispensable role credibly for social and economic benefits, and it is the commonfinding in the geographical areas. Because the host communities feel very proud to preserve theircultural heritage as it is amongst one of the global oldest civilizations. Concerning social problems,factors reporting the dimensions revealed positive feedback from the local communities, showingthat residents with stronger religious beliefs perceived no damage: sustainable tourism developmentwould not cause social problems in their regions. The results showed that more religiosity among localcommunities led to the perception that sustainable tourism development would be beneficial. Thefindings are similar to the results Harrill, (2004), Cavus and Tanrisevdi research [149–151].
The results supported the many researchers who support three main aspects of religiosity. It wasinterestingly essential to note that scholars have stated that Islamic religiosity for believers based on theQuran and Hadith (belief and practice) [152]. The results showed that religious beliefs and religiouscommitment were very high among local people, and this religiosity showed association with thewelcoming behavior of local people [153–156]. This finding of the present study is consistent with theprevious finding of Hassan (2007), who found the same result in his research [157,158]. Richerson andChristiansen (2013, p. 23) and Lewens (2015, p. 147) claimed that past regional culture acclaims religionand explains the observations [159,160]. There are several natural sites, vibrant local cultures andUNESCO World Heritage Sites and Pakistan hope to develop sustainable tourism [161]. In this study,we identified three key dimensions of religiosity: religious belief, religious commitment, religiouspractice, and these findings are consistent with those of preceding studies, suggesting the existence of
146

Sustainability 2019, 11, 3039
these two fundamental dimensions of individuals’ religiosity [88,89]. This study is novel and valuable,and it addresses monitoring and managing culturally, socially, and economically improved livelihoodsand better health services, resulting from religiosity and socio-cultural impacts on sustainable tourismdevelopment, and it delivers original insights on the interaction between the religiosity of residentsand tourism development.
6. Conclusions
This study was designed to examine the effect of Islamic religiosity of local Pakistani residentson socio-cultural impacts on sustainable tourism development in the northern regions of Pakistan,and it offers an insight into the local communities’ support for sustainable tourism development. Inthis study, we summarized some critical investigations in the literature (Table 2). These studies usedvarious methodologies to examine the effects of different factors on the socio-cultural impacts onsustainable tourism. This study proposed an original method to explore and analyze the selected keyconstructs of religiosity on socio-cultural implications for sustainable tourism. The main contributionof this research, from a theoretical perspective, is the analysis of the residents’ socio-cultural impactssupporting tourism development, especially religiosity-related factors. Overall, northern Pakistaniresidents’ perceived socio-cultural impacts positively affect sustainable tourism development, andthey showed their support and inclination for future sustainable tourism development in their regions.Among the socio-cultural impacts, the analysis of the residents’ religiosity revealed that tourismdevelopment leads to a greater acceptance of sustainable tourism in these areas. Moreover, this is thefirst study to investigate the effects of such religiosity-related factors on the perceived socio-culturalimpact of tourism development in the Pakistani cultural context. The proposed tourism model ofthis research offers the most effective determinant of perceived socio-cultural benefits. The resultsof this study reveal that religious belief, religious commitment, and the spiritual practices of localcommunities show a significant and positive effect on the perceived socio-cultural impact of sustainabletourism by Pakistani residents. It indicates that the residents’ greater religiosity level showed a positiverelationship with socio-cultural and economic effects.
Thus, Islamic religiosity influences the perception of residents regarding tourism development,and local communities understand that sustainable tourism development, infrastructure factors, andcultural activities play significant roles in community development. Tourism improves the communityimage and brings better facilities, health services, quality of life, education, improved infrastructure, andeconomic growth. This result confirms the statements of Butler and Suntikul (2017) and Raj and Griffin(2017), which explain that Islamic religiosity supports the development of the tourism industry [12,162].The findings revealed that independent constructs of this tourism model explained 84.10% of thevariance regarding the perceived socio-cultural impact and showed that three independent variables ofthe model caused 84.10% of the change in the socio-cultural effects caused by sustainable tourism. Thefindings indicate that residents’ communities are not merely limited to economic advantages; however,it also proved the non-monetary advantages of sustainable tourism development. The residents ofthese northern Pakistani areas are Muslims, and the findings were consistent with the those of priorstudies and in line with the study of Hassan [157], and in terms religiosity level, the residents have afirm commitment to their religion. By providing training and educating host communities residentswith required skills, knowledge, and information, these residents can be trained and prepared tounderstand the advantages of tourism development. In response, they will actively be involved intourism development and support the tourism industry naturally [163].
Most foreign tourists come from Muslim countries and they share similar religious values andculture. Social exchange theory may also explain observations that residents accept or tolerate peoplewho are closer to their social standing and resemble them culturally. Additionally, local communities’have a positive perception of developing sustainable tourism in these rural areas with beautiful naturalsites in Pakistan. Several scholars have conducted numerous studies on socio-cultural impacts, andsocial exchange theory has also explained this life cycle concept in tourism areas [10,12,164]. As for the
147

Sustainability 2019, 11, 3039
contextual and theoretical contribution of this innovative work to scientific knowledge, it is the firstsuch work to be conducted in the context of Pakistan, examining residents’ religiosity level and theeffect of religiosity on the perceived socio-cultural impact of tourism development. In this study, weexplored the effects of residents’ religiosity and their perceptions related to the socio-cultural impactof sustainable tourism development [165–167], as well as social distance theory [1,2,168], and havesupported sustainable tourism development since its earliest stages [12,169,170].
6.1. Limitations and Recommendation
Concerning the empirical and hypothesized constraints of this study, we have presented theoriessupporting tourism development solely from the perspective of socio-cultural impacts. This tourismmodel’s findings were not identified and determined in the literature, and the results of this case studycannot be generalized to other Pakistani areas or other Muslim societies. This research study expandsthe body of knowledge regarding the residents’ religiosity level, and understanding socio-culturalimpacts are vital for sustainable tourism development. The findings of this research might be ofconsiderable interest to sustainable tourism development policy-makers, the tourism industry, andthe developers to influence more sustainable policies and strategies in line with the preferences oflocal communities. This study recommends that future research studies should attempt to assess therelationship between individuals’ religiosity and the socio-cultural impacts on sustainable tourismdevelopment with large sample sizes in other regions of Pakistan. Ultimately, other Muslims societies,such as Turkey, Saudi Arabia, Malaysia, Iran, and Indonesia, are also sites of significant ethnic andcultural importance, historically significant and natural beauty, and improving our understanding ofreligiosity and socio-cultural impacts in developing sustainable tourism in these areas is important.
6.2. Implications
The results of this research have refined the theoretical basis to explain the interplay of socio-culturalfactors that influence the host residents’ reaction to supporting tourism development. Additionally,these results have contributed to the existing body of scientific knowledge by developing, testing, andrefining a tourism model that explained 84.10% of the variance in the host communities’ residents’support for sustainable tourism development. Overall, this research expanded the existing bodyof scientific knowledge from a socio-cultural point of view to include the perspective of residents’religiosity level as a factor supporting sustainable tourism development. The proposed tourism model,constructs, and measurement approach might be applicable in different regions of Pakistan and othertourism destinations, particularly in other Islamic countries and community-based sustainable tourismdevelopment projects. In this research, we utilized several underpinning theories, such as socialexchange theory, self-determination theory, attachment theory, social representation theory, and socialdistance theory. Accordingly, the results of this research could support the suitability of the use of suchtheories. The tested tourism model showed that residents’ religiosity, community attachment, andknowledge on sustainable tourism development affects the local community’s support for sustainabletourism development. Considering this context, tourism policy-makers, practitioners, and developersmight examine the behavior of residents to support tourism development in certain destinations [118].The implications of these findings may provide significant advantages not only to academic researchers,but they might also provide benefits to other industries, such as service practitioners, tourism planners,and managers.
Planning a sustainable tourism destination, it requires a deep understanding of all involvedstakeholders preferences, and the host communities [171]. The support of host residents is necessaryas the hospitable, friendly host residents play the leading role in tourists’ destination satisfaction andit imrpoves the success of tourism development projects [163]. In the same context, findings showedthat residents’ support for sustainable tourism development projects have parallel relationships withresidents’ religiosity level and perceived socio-cultural impacts. Residents’ higher positive perceptions ofthe socio-cultural impact of sustainable tourism development support in their living areas. The findings
148

Sustainability 2019, 11, 3039
of this study might assist policy-makers and practitioners in predicting host communities attitude,and preferences toward tourism development [121]. Policy makers, tourism developers, and tourismplanners should pay attention to have the actual knowledge as well as an understanding of localcommunities, the dynamics of the influential factors, and how local communities residents perceive itbefore launching new tourism projects [39]. Having proper information about the tourism destinations,specific preferences, and the demographic profiles of destination residents is exceptionally beneficialfor future planning, particularly in the destination places that are new for tourism developmentprojects [163,172,173].
Author Contributions: J.A. (Jaffar Abbas) has conceptualized the idea, completed Introduction, Literature,Discussion, Conclusion and edited the original manuscript, J.A. (Jaffar Aman) conceptualized the idea, draftedmethodology and analysis section, S.B. collected data, S.M. provided resource, and helped resource. M.N. hasreviewed the edited manuscript and provided resource.
Funding: The authors acknowledge the support for APC from College of Management, Shenzhen University,Nanshan District, Shenzhen, Guangdong, China.
Acknowledgments: Special thanks to MDPI professional language editing services to ensure that English grammaris free of mistakes for this manuscript. Jinzu Ling and Li Ben-qian supervised the project.
Conflicts of Interest: The authors are well informed about the study’s objectives, provided consent, and havedeclared that they have no competing interest.
References
1. Thyne, M.; Watkins, L.; Yoshida, M. Resident perceptions of tourism: The role of social distance. Int. J.Tour. Res. 2018, 20, 256–266. [CrossRef]
2. Joo, D.; Tasci, A.D.; Woosnam, K.M.; Maruyama, N.U.; Hollas, C.R.; Aleshinloye, K.D. Residents’ attitudetowards domestic tourists explained by contact, emotional solidarity and social distance. Tour. Manag. 2018,64, 245–257. [CrossRef]
3. Sirakaya, E.; Teye, V.; Sönmez, S. Understanding Residents’ Support for Tourism Development in the CentralRegion of Ghana. J. Travel Res. 2002, 41, 57–67. [CrossRef]
4. Lee, T.H. Influence analysis of community resident support for sustainable tourism development. Tour. Manag.2013, 34, 37–46. [CrossRef]
5. Hall, C.M.; Müller, D.K.; Saarinen, J. Nordic Tourism: Issues and Cases; Channel View Publications: Bristol,UK, 2008.
6. Woo, E.; Kim, H.; Uysal, M. Life satisfaction and support for tourism development. Ann. Tour. Res. 2015, 50,84–97. [CrossRef]
7. McGehee, N.G.; Andereck, K.L. Factors Predicting Rural Residents’ Support of Tourism. J. Travel Res. 2004,43, 131–140. [CrossRef]
8. Yoon, Y.; Gursoy, D.; Chen, J.S. Validating a tourism development theory with structural equation modeling.Tour. Manag. 2001, 22, 363–372. [CrossRef]
9. Camilleri, M.A. Strategic Perspectives in Destination Marketing; IGI Global: Hershey, PA, USA, 2018.10. Butler, R. The Tourism Area Life Cycle; Channel View Publications: Bristol, UK, 2006.11. Butler, R.W.; Hall, C.M.; Jenkins, J. Tourism and Recreation in Rural Areas; Wiley: Hoboken, NJ, USA, 1998.12. Butler, R.; Suntikul, W. Tourism and Political Change; Goodfellow Publishers Limited: Oxford, UK, 2017.13. Tzfadia, E. Abusing Multiculturalism: The Politics of Recognition and Land Allocation in Israel. Environ. Plan.
D Soc. Space 2008, 26, 1115–1130. [CrossRef]14. Radzi, S.M.; Mohd, R.S.; Zurinawati, M.; Sukyadi, D.; Mohd, H.M.H.; Suryadi, K.; Purnawarman, P. Heritage,
Culture and Society: Research Agenda and Best Practices in the Hospitality and Tourism Industry; CRC Press:Boca Raton, FL, USA, 2016.
15. Almuhrzi, H.; Alriyami, H.; Scott, N. Tourism in the Arab World: An Industry Perspective; Channel ViewPublications: Bristol, UK, 2017.
16. Scott, N.; Jafari, J.; Cai, L.A. Tourism in the Muslim World; Emerald Group Publishing Limited: Bingley,UK, 2010.
17. Bell, S.; Simpson, M.; Tyrväinen, L.; Sievänen, T.; Pröbstl, U. European Forest Recreation and Tourism: AHandbook; Taylor & Francis: Abingdon, UK, 2009.
149

Sustainability 2019, 11, 3039
18. Kock, F.; Josiassen, A.; Assaf, A.G.; Karpen, I.; Farrelly, F. Tourism Ethnocentrism and Its Effects on Touristand Resident Behavior. J. Travel Res. 2019, 58, 427–439. [CrossRef]
19. Chambers, E.T. Roots for Radicals: Organizing for Power, Action, and Justice; Bloomsbury Publishing: New York,NY, USA, 2018.
20. Phillips, R.; Pittman, R. An Introduction to Community Development; Taylor & Francis: Abingdon, UK, 2014.21. Kenny, S.; McGrath, B.; Phillips, R. The Routledge Handbook of Community Development: Perspectives from
Around the Globe; Taylor & Francis: Abingdon, UK, 2017.22. Rogers, A.T. Human Behavior in the Social Environment: Mezzo and Macro Contexts; Taylor & Francis: Abingdon,
UK, 2016.23. Castelloe, P.; Watson, T.; White, C. Participatory Change. J. Community Pract. 2002, 10, 7–31. [CrossRef]24. Aquino, R.S.; Lück, M.; Schänzel, H.A. A conceptual framework of tourism social entrepreneurship for
sustainable community development. J. Hosp. Tour. Manag. 2018, 37, 23–32. [CrossRef]25. Irwansyah, E. Geographic Information System (GIS) Using IDRISI Software: Application in Coastal Management;
Geoinforma: Depok, Indonesia, 2012.26. Asghari, F.B.; Mohammadi, A.A.; Dehghani, M.H.; Yousefi, M. Data on assessment of groundwater quality
with application of ArcGIS in Zanjan, Iran. Data Brief 2018, 18, 375–379. [CrossRef]27. Sangchumnong, A. Development of a sustainable tourist destination based on the creative economy: A case
study of Klong Kone Mangrove Community, Thailand. Kasetsart J. Soc. Sci. 2018. [CrossRef]28. Zakariya, K.; Harun, N.Z.; Mansor, M. Place Meaning of the Historic Square as Tourism Attraction and
Community Leisure Space. Procedia Soc. Behav. Sci. 2015, 202, 477–486. [CrossRef]29. Qian, C.; Sasaki, N.; Jourdain, D.; Kim, S.M.; Shivakoti, P.G. Local livelihood under different governances of
tourism development in China—A case study of Huangshan mountain area. Tour. Manag. 2017, 61, 221–233.[CrossRef]
30. Bramwell, B.; Lane, B. Critical research on the governance of tourism and sustainability. J. Sustain. Tour.2011, 19, 411–421. [CrossRef]
31. Lee, T.H.; Jan, F.-H. Can community-based tourism contribute to sustainable development? Evidence fromresidents’ perceptions of the sustainability. Tour. Manag. 2019, 70, 368–380. [CrossRef]
32. Li, Y. Exploring Community Tourism in China: The Case of Nanshan Cultural Tourism Zone. J. Sustain. Tour.2004, 12, 175–193. [CrossRef]
33. Keyim, P. Tourism Collaborative Governance and Rural Community Development in Finland: The Case ofVuonislahti. J. Travel Res. 2017, 57, 483–494. [CrossRef]
34. Cooper, M.J.M.; Aslam, M.; Othman, N. Sustainable Tourism in the Global South: Communities, Environmentsand Management; Cambridge Scholars Publishing: Newcastle, UK, 2016.
35. Haralambides, T.H. COMMUNITY DEVELOPMENT IN GREECE: The Royal National Foundation and theActivities of its Central Committee for Community Development. Community Dev. J. 1966, 1, 19–22. [CrossRef]
36. Westoby, P.; Kaplan, A. Foregrounding practice—Reaching for a responsive and ecological approach tocommunity development: A conversational inquiry into the dialogical and developmental frameworks ofcommunity development. Community Dev. J. 2014, 49, 214–227. [CrossRef]
37. Lane, B. Will sustainable tourism research be sustainable in the future? An opinion piece. Tour. Manag. Perspect.2018, 25, 161–164. [CrossRef]
38. Blancas, F.J.; Lozano-Oyola, M.; González, M.; Caballero, R. A dynamic sustainable tourism evaluation usingmultiple benchmarks. J. Clean. Prod. 2018, 174, 1190–1203. [CrossRef]
39. Sinclair-Maragh, G.; Gursoy, D.; Vieregge, M. Residents’ perceptions toward tourism development: Afactor-cluster approach. J. Destin. Mark. Manag. 2015, 4, 36–45. [CrossRef]
40. Bricker, K.S.; Black, R.; Cottrell, S. Sustainable Tourism and the Millennium Development Goals; Jones & BartlettLearning: Burlington, MA, USA, 2013.
41. OECD. OECD Rural Policy Reviews The New Rural Paradigm Policies and Governance: Policies and Governance;OECD Publishing: Paris, France, 2006.
42. Saarinen, J. Contradictions of Rural Tourism Initiatives in Rural Development Contexts: Finnish RuralTourism Strategy Case Study. Curr. Issues Tour. 2007, 10, 96–105. [CrossRef]
43. Keyim, P. Tourism and rural development in western China: A case from Turpan. Community Dev. J. 2016,51, 534–551. [CrossRef]
150

Sustainability 2019, 11, 3039
44. Sharpley, R. Tourism and Sustainable Development: Exploring the Theoretical Divide. J. Sustain. Tour. 2000,8, 1–19. [CrossRef]
45. Gao, S.; Huang, S.; Huang, Y. Rural tourism development in China. Int. J. Tour. Res. 2009, 11, 439–450.[CrossRef]
46. De Beer, F.; Marais, M. Rural communities, the natural environment and development—Some challenges,some successes. Community Dev. J. 2005, 40, 50–61. [CrossRef]
47. Dodds, R.; Graci, S. Sustainable Tourism in Island Destinations; Taylor & Francis: Abingdon, UK, 2012.48. Getz, D.; Carlsen, J. Family business in tourism: State of the Art. Ann. Tour. Res. 2005, 32, 237–258. [CrossRef]49. Fursova, J. The ‘business of community development’ and the right to the city: Reflections on the
neoliberalization processes in urban community development. Community Dev. J. 2016, 53, 119–135. [CrossRef]50. Olsen, D.H. Nordic tourism: Issues and cases. Curr. Issues Tour. 2010, 13, 297–298. [CrossRef]51. Higgins-Desbiolles, F. Sustainable tourism: Sustaining tourism or something more? Tour. Manag. Perspect.
2018, 25, 157–160. [CrossRef]52. Bramwell, B. Governance, the state and sustainable tourism: A political economy approach. J. Sustain. Tour.
2011, 19, 459–477. [CrossRef]53. Shtudiner, Z.E.; Klein, G.; Kantor, J. How religiosity affects the attitudes of communities towards tourism in
a sacred city: The case of Jerusalem. Tour. Manag. 2018, 69, 167–179. [CrossRef]54. Ap, J.; Crompton, J.L. Developing and Testing a Tourism Impact Scale. J. Travel Res. 1998, 37, 120–130. [CrossRef]55. Kozak, M.; Andreu, L.; Gnoth, J. Tourism Marketing: On Both Sides of the Counter; Cambridge Scholars
Publishing: Newcastle, UK, 2013.56. Katsoni, V.; Stratigea, A. Tourism and Culture in the Age of Innovation: Second International Conference IACuDiT,
Athens 2015; Springer International Publishing: Cham, Switzerland, 2016.57. Gursoy, D. Routledge Handbook of Hospitality Marketing; Taylor & Francis: Abingdon, UK, 2017.58. Swarbrooke, J. Sustainable Tourism Management; CABI Publishing: Wallingford, UK, 1999.59. Richards, D.L.S.G.; Richards, G. Cultural Tourism: Global and Local Perspectives; Taylor & Francis: Abingdon,
UK, 2013; p. 378.60. Mowforth, M.; Munt, I. Tourism and Sustainability: Development, Globalisation and New Tourism in the Third
World; Taylor & Francis: Abingdon, UK, 2015.61. Hashimoto, A. Being Ourselves to You: The Global Display of Cultures: By Nick Stanley. Middlesex University
Press (Central Books, 99 Wallis Road, London, E9 5LN, UK) 1998, 211 pp (figures, photos, references, index)£14.95 Pbk. ISBN: 1-898253-16-1. Ann. Tour. Res. 2000, 27, 246–248. [CrossRef]
62. Sharpley, R.; Telfer, D.J. Tourism and Development: Concepts and Issues; Channel View Publications: Bristol,UK, 2014.
63. Specht, J. Architectural Tourism: Building for Urban Travel Destinations; Springer Fachmedien Wiesbaden:Wiesbaden, Germany, 2014.
64. Murphy, P.P.E.; Murphy, A.E. Strategic Management for Tourism Communities: Bridging the Gaps; Channel ViewPublications: Bristol, UK, 2004.
65. Kim, K.; Uysal, M.; Sirgy, M.J. How does tourism in a community impact the quality of life of communityresidents? Tour. Manag. 2013, 36, 527–540. [CrossRef]
66. Telfer, D.J.; Hashimoto, A. Chapter 9—Food tourism in the Niagara Region: The development of a nouvellecuisine. In Food Tourism Around The World; Hall, C.M., Sharples, L., Mitchell, R., Macionis, N., Cambourne, B.,Eds.; Butterworth-Heinemann: Oxford, UK, 2003; pp. 158–177.
67. Hashimoto, A. Tea and Tourism: Tourists, Traditions, and Transformations. Ann. Tour. Res. 2008, 35, 1088–1090.[CrossRef]
68. Smith, V.L. Hosts and Guests: The Anthropology of Tourism; University of Pennsylvania Press, Incorporated:Philadelphia, PA, USA, 2012.
69. Gray, H.P. The economic significance of tourism within the European community. Ann. Tour. Res. 1981, 8,291–292. [CrossRef]
70. Chon, K.S.; Pizam, A.; Mansfeld, Y. Consumer Behavior in Travel and Tourism; Taylor & Francis: Abingdon,UK, 2012.
71. Richards, G.; Hall, D. Tourism and Sustainable Community Development; Routledge: Abingdon, UK, 2003.72. Newsome, D. Natural Area Tourism; Channel View Publications: Bristol, UK, 2017.
151

Sustainability 2019, 11, 3039
73. Sroypetch, S. The mutual gaze: Host and guest perceptions of socio-cultural impacts of backpacker tourism:A case study of the Yasawa Islands, Fiji. J. Mar. Isl. Cult. 2016, 5, 133–144. [CrossRef]
74. Reisinger, Y.; Turner, L. Cross-Cultural Behaviour in Tourism; Taylor & Francis: Abingdon, UK, 2012.75. Sharpley, R.; Telfer, D.J. Tourism and Development: Concepts and Issues; Channel View Publications: Bristol,
UK, 2002.76. Zamani-Farahani, H.; Musa, G. The relationship between Islamic religiosity and residents’ perceptions of
socio-cultural impacts of tourism in Iran: Case studies of Sare’in and Masooleh. Tour. Manag. 2012, 33, 802–814.[CrossRef]
77. Horner, S.; Swarbrooke, J. Consumer Behaviour in Tourism; Taylor & Francis: Abingdon, UK, 2016.78. Abbas, J.; Aman, J.; Nurunnabi, M.; Bano, S. The Impact of Social Media on Learning Behavior for Sustainable
Education: Evidence of Students from Selected Universities in Pakistan. Sustainability 2019, 11, 1683. [CrossRef]79. Brunt, P.; Courtney, P. Host perceptions of sociocultural impacts. Ann. Tour. Res. 1999, 26, 493–515. [CrossRef]80. Hordern, J. Religion and culture. Medicine 2016, 44, 589–592. [CrossRef]81. Schnabel, L. More religious, less dogmatic: Toward a general framework for gender differences in religion.
Soc. Sci. Res. 2018, 75, 58–72. [CrossRef] [PubMed]82. Cruz, A.G.B.; Seo, Y.; Buchanan-Oliver, M. Religion as a field of transcultural practices in multicultural
marketplaces. J. Bus. Res. 2018, 91, 317–325. [CrossRef]83. Robbins, T.; Robertson, R. Studying religion today: Controversiality and ‘objectivity’ in the sociology of
religion. Religion 1991, 21, 319–337. [CrossRef]84. Stone, D. The uses and abuses of ‘secular religion’: Jules Monnerot’s path from communism to fascism.
Hist. Eur. Ideas 2011, 37, 466–474. [CrossRef]85. Gursoy, D.; Altinay, L.; Kenebayeva, A. Religiosity and entrepreneurship behaviours. Int. J. Hosp. Manag.
2017, 67, 87–94. [CrossRef]86. Batson, C.D.; Schoenrade, P.; Ventis, W.L. Religion and the Individual: A Social-Psychological Perspective; Oxford
University Press: Oxford, UK, 1993.87. Chang, E.; Downey, C.A. Handbook of Race and Development in Mental Health; Springer: New York, NY, USA, 2011.88. Allport, G.W. The Individual and His Religion, a Psychology Interpretation; Constable: London, UK, 1951.89. Helm, H.M.; Hays, J.C.; Flint, E.P.; Koenig, H.G.; Blazer, D.G. Does private religious activity prolong survival?
A six-year follow-up study of 3,851 older adults. J. Gerontol. A Biol. Sci. Med. Sci. 2000, 55, M400–M405.[CrossRef]
90. Nelson, J.M. Psychology, Religion, and Spirituality; Springer: New York, NY, USA, 2009.91. Taylor, R.J.; Chatters, L.M.; Levin, J. Religion in the Lives of African Americans: Social, Psychological, and Health
Perspectives; SAGE Publications: Thousand Oaks, CA, USA, 2004.92. Bilekli, I.; Inozu, M. Mental contamination: The effects of religiosity. J. Behav. Ther. Exper. Psychiatry 2018, 58,
43–50. [CrossRef]93. Koenig, H.G. Religion and Mental Health: Research and Clinical Applications; Elsevier Science: Amsterdam,
The Netherlands, 2018.94. Pollack, D.; Rosta, G. Religion and Modernity: An International Comparison; OUP: Oxford, UK, 2017.95. Rosmarin, D.H.; Koenig, H.G. Handbook of Religion and Mental Health; Elsevier Science: Amsterdam,
The Netherlands, 1998.96. Mcfadden, S.H.; Brennan, M. New Directions in the Study of Late Life Religiousness and Spirituality; Taylor &
Francis: Abingdon, UK, 2014.97. Beit-Hallahmi, B. Psychological Perspectives on Religion and Religiosity; Taylor & Francis: Abingdon, UK, 2014.98. Turner, B. The Statesman’s Yearbook 2006: The Politics, Cultures and Economies of the World; Palgrave Macmillan:
London, UK, 2017.99. Arjomand, S.A. The Political Dimensions of Religion; State University of New York Press: Albany, NY, USA, 1993.100. Leganger-Krogstad, H. The Religious Dimension of Intercultural Education: Contributions to a Contextual
Understanding; Lit: Münster, Germany, 2011.101. Walker, A.G.; Smither, J.W.; DeBode, J. The Effects of Religiosity on Ethical Judgments. J. Bus. Ethics 2012,
106, 437–452. [CrossRef]102. Abdullah, Z. Black Mecca: The African Muslims of Harlem; Oxford University Press: Oxford, UK, 2010.
152

Sustainability 2019, 11, 3039
103. Putra, I.E.; Sukabdi, Z.A. Is there peace within Islamic fundamentalists? When Islamic fundamentalismmoderates the effect of meta-belief of friendship on positive perceptions and trust toward outgroup. KasetsartJ. Soc. Sci. 2018, in press. [CrossRef]
104. Khan, M.A.Z.; Konje, J.C. Ethical and religious dilemmas of modern reproductive choices and the Islamicperspective. Eur. J. Obstet. Gynecol. Reprod. Biol. 2019, 232, 5–9. [CrossRef]
105. Abbas, J.; Aqeel, M.; Abbas, J.; Shaher, B.; Jaffar, A.; Sundas, J.; Zhang, W. The moderating role of socialsupport for marital adjustment, depression, anxiety, and stress: Evidence from Pakistani working andnonworking women. J. Affect. Disord. 2019, 244, 231–238. [CrossRef]
106. Calvo-mora, A.; Leal, A.; Roldán, J.L. Relationships between the EFQM model criteria: A study in Spanishuniversities. Total Qual. Manag. Bus. Excell. 2005, 16, 741–770. [CrossRef]
107. Hair, J.F.; Hult, G.T.M.; Ringle, C.; Sarstedt, M. A Primer on Partial Least Squares Structural Equation Modeling(PLS-SEM); SAGE Publications: Thousand Oaks, CA, USA, 2013.
108. Hair, J.F.; Sarstedt, M.; Ringle, C.M.; Gudergan, S.P. Advanced Issues in Partial Least Squares Structural EquationModeling; SAGE Publications: Thousand Oaks, CA, USA, 2017.
109. Wise, K.A.G.D.S. ICIE 2016 Proceedings of the 4th International Conference on Innovation and Entrepreneurship:ICIE2016; Academic Conferences and Publishing International Limited: England, UK, 2016.
110. Lowry, P.B.; Gaskin, J. Partial Least Squares (PLS) Structural Equation Modeling (SEM) for Building andTesting Behavioral Causal Theory: When to Choose It and How to Use It. IEEE Trans. Prof. Commun. 2014,57, 123–146. [CrossRef]
111. Wan Afthanorhan, W.M.A.B. A Comparison Of Partial Least Square Structural Equation Modeling (PLS-SEM)and Covariance Based Structural Equation Modeling (CB-SEM) for Confirmatory Factor Analysis. Int. J. Eng.Sci. Innov. Technol. 2013, 2, 198–205.
112. Astrachan, C.B.; Patel, V.K.; Wanzenried, G. A comparative study of CB-SEM and PLS-SEM for theorydevelopment in family firm research. J. Fam. Bus. Strategy 2014, 5, 116–128. [CrossRef]
113. Uriely, N.; Belhassen, Y. Drugs and risk-taking in tourism. Ann. Tour. Res. 2006, 33, 339–359. [CrossRef]114. Wilks, J.; Pendergast, D.; Leggat, P. Tourism in Turbulent Times; Taylor & Francis: Abingdon, UK, 2006.115. Andrews, H. Tourism and Violence; Taylor & Francis: Abingdon, UK, 2016.116. Imbaya, B.O.; Nthiga, R.W.; Sitati, N.W.; Lenaiyasa, P. Capacity building for inclusive growth in
community-based tourism initiatives in Kenya. Tour. Manag. Perspect. 2019, 30, 11–18. [CrossRef]117. Ray, N. Strategic Infrastructure Development for Economic Growth and Social Change; IGI Global: Hershey, PA,
USA, 2015.118. Chen, H.; Rahman, I. Cultural tourism: An analysis of engagement, cultural contact, memorable tourism
experience and destination loyalty. Tour. Manag. Perspect. 2018, 26, 153–163. [CrossRef]119. Pueyo-Ros, J.; Garcia, X.; Ribas, A.; Fraguell, R.M. Ecological Restoration of a Coastal Wetland at a Mass
Tourism Destination. Will the Recreational Value Increase or Decrease? Ecol. Econ. 2018, 148, 1–14. [CrossRef]120. Michael, N.; Reisinger, Y.; Hayes, J.P. The UAE’s tourism competitiveness: A business perspective.
Tour. Manag. Perspect. 2019, 30, 53–64. [CrossRef]121. Malviya, S. Tourism: Tourism, Environment and the Society; Gyan Publishing House: New Delhi, India, 2005.122. Canteiro, M.; Córdova-Tapia, F.; Brazeiro, A. Tourism impact assessment: A tool to evaluate the environmental
impacts of touristic activities in Natural Protected Areas. Tour. Manag. Perspect. 2018, 28, 220–227. [CrossRef]123. Worthington, E.L., Jr.; Wade, N.G.; Hight, T.L.; Ripley, J.S.; McCullough, M.E.; Berry, J.W.; Schmitt, M.M.;
Berry, J.T.; Bursley, K.H.; O’connor, L. The Religious Commitment Inventory—10: Development, refinement,and validation of a brief scale for research and counseling. J. Couns. Psychol. 2003, 50, 84–96. [CrossRef]
124. Loue, S. Handbook of Religion and Spirituality in Social Work Practice and Research; Springer: New York, NY,USA, 2018.
125. Doreen, A.W. Spirituality in Nursing Practice: The Basics and Beyond; Springer Publishing Company: New York,NY, USA, 2016.
126. Chiang, Y.-C.; Lee, H.C.; Chu, T.L.; Han, C.Y.; Hsiao, Y.C. Psychometric Testing of a Religious Belief Scale.J. Nurs. Res. 2017, 25, 419–428. [CrossRef]
127. Peterson, R.; Kim, Y. On the Relationship Between Coefficient Alpha and Composite Reliability. J. Appl. Psychol.2013, 98, 194. [CrossRef]
128. Bartholomew, D.J.; Knott, M.; Moustaki, I. Latent Variable Models and Factor Analysis: A Unified Approach;Wiley: Hoboken, NJ, USA, 2011.
153

Sustainability 2019, 11, 3039
129. Henseler, J.; Ringle, C.M.; Sarstedt, M. A new criterion for assessing discriminant validity in variance-basedstructural equation modeling. J. Acad. Mark. Sci. 2015, 43, 115–135. [CrossRef]
130. Cohen, J. Statistical Power Analysis for the Behavioral Sciences; Taylor & Francis: Abingdon, UK, 2013.131. Aberson, C.L. Applied Power Analysis for the Behavioral Sciences, 2nd ed.; Taylor & Francis: Abingdon, UK,
2019.132. Tenenhaus, M.; Vinzi, V.E.; Chatelin, Y.M.; Lauro, C. PLS path modeling. Comput. Stat. Data Anal. 2005, 48,
159–205. [CrossRef]133. Chen, F.F. Sensitivity of Goodness of Fit Indexes to Lack of Measurement Invariance. Struct. Equ. Model.
Multidiscip. J. 2007, 14, 464–504. [CrossRef]134. Brown, T.A. Confirmatory Factor Analysis for Applied Research; Guilford Publications: New York, NY, USA, 2006.135. Durdyev, S.; Ismail, S.; Ihtiyar, A.; Bakar, N.F.S.A.; Darko, A. A partial least squares structural equation
modeling (PLS-SEM) of barriers to sustainable construction in Malaysia. J. Clean. Prod. 2018, 204, 564–572.[CrossRef]
136. Wall, G.; Mathieson, A. Tourism: Change, Impacts, and Opportunities; Pearson Prentice Hall: Upper Saddle River,NJ, USA, 2006.
137. Devesa, M.; Laguna, M.; Palacios, A. The role of motivation in visitor satisfaction: Empirical evidence inrural tourism. Tour. Manag. 2010, 31, 547–552. [CrossRef]
138. Gnoth, J. Tourism motivation and expectation formation. Ann. Tour. Res. 1997, 24, 283–304. [CrossRef]139. Sukiman, M.F.; Omar, S.I.; Muhibudin, M.; Yussof, I.; Mohamed, B. Tourist Satisfaction as the Key to
Destination Survival in Pahang. Procedia Soc. Behav. Sci. 2013, 91, 78–87. [CrossRef]140. Kotoua, S.; Ilkan, M. Tourism destination marketing and information technology in Ghana. J. Destin.
Mark. Manag. 2017, 6, 127–135. [CrossRef]141. Khizindar, T.M. Effects of Tourism on Residents’ Quality of Life in Saudi Arabia: An Empirical Study. J. Hosp.
Mark. Manag. 2012, 21, 617–637. [CrossRef]142. Proikaki, M.; Nikolaou, I.; Jones, N.; Malesios, C.; Dimitrakopoulos, P.G.; Evangelinos, K. Community
perceptions of local enterprises in environmentally degraded areas. J. Behav. Exp. Econ. 2018, 73, 116–124.[CrossRef]
143. Jones, N.; Malesios, C.; Ioannidou, E.; Kanakaraki, R.; Kazoli, F.; Dimitrakopoulos, P.G. Understandingperceptions of the social impacts of protected areas: Evidence from three NATURA 2000 sites in Greece.Environ. Impact Assess. Rev. 2018, 73, 80–89. [CrossRef]
144. Boley, B.B.; McGehee, N.G.; Perdue, R.R.; Long, P. Empowerment and resident attitudes toward tourism:Strengthening the theoretical foundation through a Weberian lens. Ann. Tour. Res. 2014, 49, 33–50. [CrossRef]
145. Almeida García, F.; Balbuena Vázquez, A.; Cortés Macías, R. Resident’s attitudes towards the impacts oftourism. Tour. Manag. Perspect. 2015, 13, 33–40. [CrossRef]
146. Zamani-Farahani, H.; Musa, G. Residents’ attitudes and perception towards tourism development: A casestudy of Masooleh, Iran. Tour. Manag. 2008, 29, 1233–1236. [CrossRef]
147. Andriotis, K. Community Groups’ Perceptions of and Preferences for Tourism Development: Evidence fromCrete. J. Hosp. Tour. Res. 2005, 29, 67–90. [CrossRef]
148. Kuvan, Y.; Akan, P. Residents’ attitudes toward general and forest-related impacts of tourism: The case ofBelek, Antalya. Tour. Manag. 2005, 26, 691–706. [CrossRef]
149. Harrill, R. Residents’ Attitudes toward Tourism Development: A Literature Review with Implications forTourism Planning. J. Plan. Lit. 2004, 18, 251–266. [CrossRef]
150. Vargas-Sánchez, A.; Porras-Bueno, N.; de los Ángeles Plaza-Mejía, M. Explaining the Residents’ AttitudesTowards Tourism Development in the Spanish Province of Huelva. In Tourism Economics; Physica-Verlag HD:Berlin, Germany, 2011; pp. 247–259.
151. Cavus, S.; Tanrisevdi, A. Residents’Attitudes Toward Tourism Development: A Case Study in Kusadasi,Turkey. Tour. Anal. 2003, 7, 259–269. [CrossRef]
152. Liow, J.C. Religion and Nationalism in Southeast Asia; Cambridge University Press: Cambridge, UK, 2016.153. Rysbekova, S.; Duissenbayeva, A.; Izmailov, I. Religious Tourism as a Sociocultural Phenomenon of the
Present “The Unique Sense Today is a Universal Value Tomorrow. This is the Way Religions are Created andValues are Made.”. Procedia Soc. Behav. Sci. 2014, 143, 958–963.
154. Ghaderi, Z.; Henderson, J.C. Sustainable rural tourism in Iran: A perspective from Hawraman Village.Tour. Manag. Perspect. 2012, 2–3, 47–54. [CrossRef]
154
Sustainability 2019, 11, 3039
155. Šegota, T.; Mihalic, T.; Kušcer, K. The impact of residents’ informedness and involvement on their perceptionsof tourism impacts: The case of Bled. J. Destin. Mark. Manag. 2017, 6, 196–206. [CrossRef]
156. Stylidis, D.; Biran, A.; Sit, J.; Szivas, E.M. Residents’ support for tourism development: The role of residents’place image and perceived tourism impacts. Tour. Manag. 2014, 45, 260–274. [CrossRef]
157. Hassan, R. On Being Religious: Patterns of Religious Commitment in Muslim Societies1. Muslim World 2007,97, 437–478. [CrossRef]
158. Zulfikar, T. Indonesian Muslims in a Global World: Identity Narratives of Young Muslims in Australian Society;Cambridge Scholars Publishing: Newcastle, UK, 2017.
159. Richerson, P.J.; Christiansen, M.H. Cultural Evolution: Society, Technology, Language, and Religion; MIT Press:Cambridge, MA, USA, 2013.
160. Lewens, T. Cultural Evolution: Conceptual Challenges; Oxford University Press: Oxford, UK, 2015.161. Bhandari, K. Tourism and the geopolitics of Buddhist heritage in Nepal. Ann. Tour. Res. 2019, 75, 58–69.
[CrossRef]162. Raj, R.; Griffin, K.A. Conflicts, Religion and Culture in Tourism; CABI Publishing: Wallingford, UK, 2017.163. Andriotis, K.; Stylidis, D.; Weidenfeld, A. Tourism Policy and Planning Implementation: Issues and Challenges;
Taylor & Francis: Abingdon, UK, 2018.164. Omar, S.I.; Othman, A.G.; Mohamed, B. The Tourism Life Cycle: An Overview of Langkawi Island, Malaysia;
Emerald: Bingley, UK, 2014.165. Leigh, J.; Webster, C.; Ivanov, S. Future Tourism: Political, Social and Economic Challenges; Routledge: Abingdon,
UK, 2013.166. Shakeela, A.; Weaver, D. “Managed evils” of hedonistic tourism in the Maldives: Islamic social representations
and their mediation of local social exchange. Ann. Tour. Res. 2018, 71, 13–24. [CrossRef]167. Kang, S.K.; Lee, J. Support of marijuana tourism in Colorado: A residents’ perspective using social exchange
theory. J. Destin. Mark. Manag. 2018, 9, 310–319. [CrossRef]168. Lohmann, G.; Netto, A.P. Tourism Theory: Concepts, Models and Systems; CABI Publishing: Wallingford, UK, 2016.169. Nunkoo, R. Toward a More Comprehensive Use of Social Exchange Theory to Study Residents’ Attitudes to
Tourism. Procedia Econ. Financ. 2016, 39, 588–596. [CrossRef]170. Trivellas, P.; Kakkos, N.; Vasiliadis, L.; Belias, D. Residents’ Perceptions Toward Cultural, Social and Economic
Benefits and Costs of Tourism Industry: An Empirical Survey. In Tourism and Culture in the Age of Innovation;Springer International Publishing: Cham, Switzerland, 2016.
171. Morpeth, N.D.; Yan, H. Planning for Tourism: Towards a Sustainable Future; CABI Publishing: Wallingford, UK, 2015.172. Hussain, T.; Abbas, J.; Wei, Z.; Nurunnabi, M. The Effect of Sustainable Urban Planning and Slum Disamenity
on The Value of Neighboring Residential Property: Application of The Hedonic Pricing Model in Rent PriceAppraisal. Sustainability 2019, 11, 1144. [CrossRef]
173. Abbas, J.; Aqeel, M.; Wenhong, Z.; Aman, J.; Zahra, F. The moderating role of gender inequality and ageamong emotional intelligence, homesickness and development of mood swings in university students. Int. J.Hum. Rights Healthc. 2018, 11, 356–367. [CrossRef]
© 2019 by the authors. Licensee MDPI, Basel, Switzerland. This article is an open accessarticle distributed under the terms and conditions of the Creative Commons Attribution(CC BY) license (http://creativecommons.org/licenses/by/4.0/).
155


sustainability
Article
Tourism Development, Environment and Policies:Differences between Domestic andInternational Tourists
Jianjun Liu 1, Haili Pan 2,3,* and Shiyong Zheng 1
1 Economics and Management School, Wuhan University, Wuhan 430072, China; [email protected] (J.L.);[email protected] (S.Z.)
2 Business School, Guilin University of Technology, Guilin 541004, China3 Research Institute of Modern Enterprise Management, Guilin University of Technology, Guilin 541004, China* Correspondence: [email protected]
Received: 9 February 2019; Accepted: 2 March 2019; Published: 6 March 2019���������������
Abstract: Using panel data from the 17 underdeveloped provinces of China for 2005–2015, the authorexplored the differential impact of air (environment) quality and government policies on domestic andinternational visitors. Through econometric model analysis, the authors corroborated that domesticand international visitors react differently to air (environment) quality. In addition, domestic andinternational tourists have different responses to urbanization and transportation. Marketizationis conducive to the development of tourism. Moreover, foreign trade has a positive impact oninternational tourists. These findings aid local governments to provide additional appropriatetourism development policies.
Keywords: tourism; sustainability; marketization; urbanization; environment
1. Introduction
In recent years, local governments in China have regarded the development of tourism as apowerful economic policy to promote the sustainable development of the local economy and ecologicalenvironment. Tourism can not only bring considerable growth to the economy, but also play an activerole in environmental protection. The development of tourism has great potential to improve theeconomic and environmental sustainability of various provinces [1]. Tourism is a promoter of changeand an important economic development choice which makes narrowing the gap between the richand poor possible [2]. Numerous studies have assessed the economic impact of tourism at the overall(national or regional) level [3,4]. These studies have corroborated that tourism growth led to growthin output and input from tourism-related industries [3]. Currently, many cities in the world attachimportance to their tourism strategy [5]. For instance, China has successively promulgated a series oflaws and policies to promote the accelerated development of tourism in recent years. The vigorousdevelopment of tourism has become a national will and strategy. We affirm that the local and centralgovernments regard development tourism as an important strategy.
The academia has produced considerable research on tourism. However, the majority of thesestudies independently analyzed domestic and international tourists and found few differences in thenatural environment, local government policies, and other factors that affect domestic and internationaltourists [6–14]. This paper argues that tourists are mainly categorized into two major groups, namely,domestic and international. From the perspective of globalization of the world economy, exchangesbetween tourists from various countries have become more frequent and numerous, and attractinginternational tourists is an important means of developing local tourism [10,15]. Compared with localtourists, international tourists come from countries and regions with different cultural backgrounds and
Sustainability 2019, 11, 1390; doi:10.3390/su11051390 www.mdpi.com/journal/sustainability157

Sustainability 2019, 11, 1390
economic development levels. These background differences may cause local tourists and internationaltourists to react differently to the perceptions and actions of tourism. Then, the background differencebetween domestic tourists and international tourists may have different attitudes towards some factorsaffecting tourism, which in turn will affect their willingness to travel and behavior. In this study,we mainly consider two major categories of factors, namely air (environment) quality factors such ascarbon dioxide (CO2) emissions and PM 2.5 concentrations; and government economic policies suchas market-oriented, urbanization, foreign trade, and transportation construction policies. Research hasbeen previously conducted on these factors [7–9,12–14,16]. Although these studies provide a basis forus to understand the impact of these factors on tourism, we aim to investigate whether these effectsdiffer across domestic and foreign visitors. In the case of differences, what are the main differences?For example, air (environment) quality will affect travel for domestic or international tourists. Is itreally like this? In addition, should the impact of government policies on domestic and internationalvisitors differ? What factors reflect the difference in impact? To address these questions, we exploreimpact patterns through analysis of real-time data. This paper uses the macro data at the national levelto construct an econometric model to explore the differential impact of the environment and policieson domestic and international tourists. The econometric model combines theory with observationaldata to provide a robust test for exploring the impact of environmental and policy factors on tourism.We hope that the results of this paper will provide a meaningful reference for local governments andenterprises to implement appropriate tourism policies or marketing strategies.
2. Theoretical Hypothesis
Local government economic policies have far-reaching effects on the development of tourism,where certain policies may be beneficial, whereas others may not. This paper mainly discusses theimpact of urbanization, marketization, foreign trade, transportation construction, and other policies ondomestic and international tourists. Additionally, we explore natural environmental factors, such asthe impact of air (environment) quality on domestic and foreign tourists.
Air (environment) quality. The World Tourism Organization recognizes the two-way relationshipbetween tourism and climate change; on the one hand, climate change exerts its impact on tourismdestinations and flows. On the other hand, tourism is the main cause of climate change mainly dueto the use of fossil fuels that cause greenhouse gas emissions [17–22]. Future tourism growth willincrease carbon dioxide emissions, and the increase in carbon dioxide emissions in turn will havea lagging and negative impact on tourism development [6]. The empirical results reveal that as airquality deteriorates, the demand for local outbound tourism increases [10]. Hence, the deterioration ofair (environment) quality has weakened people’s desire to travel. Zhou et al. (2018) confirmed that airpollution has an adverse impact on the demand for inbound tourism, but this adverse effect varieswith the degree of air pollution [14]. Chen et al. (2017) corroborated that during the peak period oftourism, the impact of air pollution on the number of visitors to scenic spots was pronounced [23].Becken et al. (2017) analyzed self-reported views on the effect of Chinese air quality on tourism byquestionnaires. Furthermore, they affirmed that potential travelers expressed negative views on thetourism risks of China, especially air quality. Importantly, the perception of air quality risks had asignificant negative impact on the destination’s image and intentions to visit China [15]. On the basisof previous research findings and general knowledge, we also argue that air (environment) pollutionwill have a negative impact on domestic or international visitors.
Urbanization. A country’s level of urbanization is related to its level of economic development.Therefore, the higher the level of urbanization, the higher the economic level. Therefore, individualshave more money and ability to pay for travel. Mullins (1991) proposed the concept of tourismurbanization, which was the first study on tourism and urbanization. He believed that the coordinateddevelopment of urbanization and tourism could create consumption [24]. In the case of Digha in WestBengal, India, Manojit and Dandapath (2013) corroborated that the increase in road connectivity andtransportation services led to the influx of tourists, which led to the development of hotels, holiday
158
Sustainability 2019, 11, 1390
homes, and private hotels [12]. In addition, Palamalai and Kalaivani (2016) found a causal relationshipbetween urbanization and tourism expansion in India [25]. Similarly, Shinde (2017) used Shirdi in Indiaas an example to examine the urbanization process of religious tourism destinations. Although Shindediscussed tourism as promoting urbanization, Shinde also believed that if urbanization planningcannot be effectively implemented, then it will have an impact on the sustainable development oftourism [26]. Furthermore, Ashworth and Page (2011) affirmed that the global urbanization processwill promote the development of leisure service industries including tourism [27]. Naidu (2017) used30-year (1985–2015) time series data to examine the relationship between urbanization and tourismoutput. Moreover, he contended that an urbanization growth of 1% would increase tourism productionby 132.87%in the long run [28]. Although urbanization in a few regions has had different effects ontourism, urbanization has promoted the development of tourism in general [29]. After examining thehistorical process of urbanization and tourism development, Luo et al. (2016) asserted that urbanizationhas improved the development of tourism based on a systematic analysis of the relationship betweentourism development and urbanization [16]. Thus, this paper posits that urbanization can promote thedevelopment of tourism; however, distinguishing the impact of domestic and international tourismis necessary. For domestic tourists, the higher the urbanization, the higher the income level, whichincreases the possibility of tourism. However, increased urbanization for international tourists meansthat the locals lose a sense of the original city, culture, and lifestyle and will be inclined to experiencethe traditional, original style of tourism. Meanwhile, Cuadrado-Ciuraneta et al. (2017) contendedthat in the Catalonia region of Spain, where the level of urbanization is developed, a phenomenonof tourism suburbanization has emerged in recent years. Moreover, they also confirmed that futureresearch should “ . . . shed light on latent suburbanization processes involving marginal Europeanregions” [30]. Does this mean that tourists from some developed countries or regions in the world tendto return to quiet and leisure suburban life, but the preference for the prosperous areas with higherurbanization level is not so high?Therefore, this study puts forward that urbanization has a positiveimpact on domestic tourism but a negative impact on international tourism.
Marketization. The marketization process is the core of the functioning of markets [31].Podedworna (2010) studied the marketization of the Polish economy. Marketization has led toa good development of the Polish economy, especially the rural economy. Further, Podedwornaclaimed that the third wave of global marketization has promoted the marketization of the naturalenvironment, the commercialization of public goods, and even the marketization of the humanbody [32]. Marketization is valued by countries, especially those in planned economies. W.Belkand Güliz (1994) studied the marketization and consumer markets of Romania and Turkey in the1990s. Although differences in culture and development levels exist between the two countries,the marketization process has made both countries show high consumption desires [33]. In thepost-industrial era, the consumption symbolism, together with the marketization of the culturalsector, has become increasingly prominent in the service industry [34]. Similar to privatization andcommodification, marketization reflects the new characteristics of ecotourism development under theneoliberal mechanism [35]. Andersson and Getz (2009) asserted that tourism is a “mixed industry”where private companies, public institutions, and non-profit associations create tourism products incompetition and cooperation [6]. This open tourism development model is the product of the waveof marketization and promotes the development of tourism. One of the most striking changes in theeconomic reform of China is the non-nationalization of the economy. The increase in the employmentshare of non-state-owned units is caused by the non-nationalization of state-owned enterprises inurban areas and development of township enterprises in rural areas [36]. The development of townshipand village enterprises has effectively absorbed the surplus labor of agriculture, which is conducive toincreasing the income of rural residents. The resource allocation efficiency of the urban labor markethas improved in the process of employment reconstruction. This increase in competitive pressure in thelabor market is also conducive to improving organizational efficiency, increasing the wage level of theurban labor market, and increasing the income of residents. Wang et al. (2018) claimed that institutional
159

Sustainability 2019, 11, 1390
factors have a significant positive impact on the geographical diversity of tourism companies, such asthe overall degree of marketization, relationship between local government and market, and degree ofproduct and market development [37]. Therefore, we also agree that marketization can optimize theallocation of tourism resources and improve the efficiency of tourism operations, thereby promotingdomestic and international tourism.
Foreign trade. Foreign trade is mainly characterized by frequent international exchanges. The tradestructure of China has undergone major changes from its period of reform and opening up. The Chineseeconomy has become integrated into the international market mainly to promote the developmentof the manufacturing industry and trade-related financial trade and service industries of China.We validated that foreign trade has enhanced the exchanges between China and the internationalmarket, which is conducive for the promotion of the understanding international tourists of Chinaor desires to travel. Hoa et al. (2018) verified that foreign trade and foreign direct investment have apositive impact on tourism [38]. Moreover, Tsui et al. (2018) deduced that bilateral trade volume haspositive statistical significance in explaining certain changes in business travel flows [39]. Furthermore,Liu et al. (2018) obtained similar results after studying the tourism market in Thailand, that is, bilateraltrade has become an important factor in the inbound tourism flow of the country [10]. Foreign tradeis a bilateral development process. In addition to promoting economic interaction between foreigncountries and host countries, it can also promote the income and economic development of its residentsand may also promote the willingness of domestic residents to travel. However, this effect is morelikely to be indirect. Therefore, this article mainly wants to explore the impact of foreign trade onthe travel of international tourists to the host country because this impact may be direct. Therefore,we believe that foreign trade has a positive impact on international tourists.
Transportation. Transportation plays an important role in each experience component of travel [40].As an important part of tourism travel, traffic construction at tourist destinations may have animportant impact on tourism. For instance, a strong relationship was found between the developmentof rail transport and tourism. Railways are associated not only with services, such as hotels andreservations, but also with promoters of tourist destinations [9]. After studying the economic impact ofthe high-speed railway construction of China, Chang et al. (2018) inferred that railway construction hasachieved positive results in terms of economic benefits, social impact, and development sustainability.Railways will bring long-term benefits in the fields of tourism, economy, and transportation [41].However, Aratuo and Etienne (2019) found a relationship between US economic growth and sixtourism-related sub-sectors(i.e., accommodation, air transportation, shopping, food and beverage,other transportation, entertainment, and entertainment).In addition to the accommodation and foodand beverage industries, no long-term relationship was found between other tourism sub-sectors andeconomic growth [7]. We argue that, in contrast to developed countries, China as a developing countryis relatively backward in terms of economic level and transportation facilities. Thus, improvement intransportation facilities will contribute to the development of the economy and tourism. In addition,with the development of the economy, the number of private cars owned by Chinese families isincreasing. Coupled with the development of the highway, this greatly promotes domestic tourists totravel by car. For international tourists, they usually arrive at the first-tier cities and then transfer tovarious provincial and city destinations. This long-distance transfer to the railway is still a stable andsafe way to travel. Therefore, we believe that transportation can promote the development of tourism.Particularly, compared with railways, highways have a greater impact on domestic tourists; comparedwith highways, railways have a greater impact on international tourists.
Time trend. In addition to the abovementioned factors, this study uses time trend items to controlthe possible trend changes in the process of tourism development.
160

Sustainability 2019, 11, 1390
3. Models, Methods and Data
3.1. Model Building
This paper takes the economic division of China as an example. The country is divided intoNortheast, Central, Eastern, and Western regions according to regional economic development.Relatively speaking, the level of economic development in the eastern region is ahead of the threeother regions, where tourism revenue in these regions is a minor component of economic income.Therefore, this study excluded the eastern region from the analysis. The remaining three regionshave relatively weak economic levels (economically underdeveloped regions), and the economiclevels between regions are only slightly different and rich in tourism resources. Data are lacking inthese four regions (Jiangxi, Chongqing, Tibet, Ningxia).Therefore, this paper also excludes the fourprovinces and cities and the remaining 17 provinces (Northeast: Liaoning, Jilin, and Heilongjiang;Central Region: Shanxi, Anhui, Henan, Hubei, and Hunan; Western Region: Inner Mongolia, Guangxi,Sichuan, Guizhou, Yunnan, Shaanxi, Gansu, Qinghai, and Xinjiang) as the research objects of this paper.The National Bureau of Statistics separately counts tourist arrivals into domestic and internationaltourists. Therefore, we divide tourists into two groups, namely, domestic and international. On thebasis of the panel data of the 17 regions, we construct the following measurement models to explorethe effects of air (environment) quality and other government policies on tourism:
Vsit = β0 + β1Eit + αGit + γt + εit
Where Vsit is the total number of domestic (s = 0) or international (s = 1) tourists of the i-th provincein the t-th year. β0 is a constant term and β1 is a regression coefficient of air (environment). α is aregression coefficient of policy variables. Moreover, γt is a time-fixed effect, and εit is a disturbanceterm. Eit is an air (environment) explanatory variable that includes CO2 emission and PM2.5 averageconcentration. Further, Git refers to policy variables such as urbanization, marketization, foreign trade,highway mileage, and railway mileage.
3.2. Data, Variables, and Descriptive Statistics
This study focuses on the impact of air (environment) quality and other government policies onvisitors and explores the differential impact of these factors or policies on domestic and internationalvisitors in detail. Table 1 provides the detailed variable settings.
Table 1. Main variables and calculation methods.
Variables Variable Connotation Calculation Methods
lnDT Domestic tourists. Domestic tourists take logarithmlnIT International tourists. International tourists take logarithmlnCO2 Carbon dioxide emissions Carbon dioxide emissions take logarithmlnPM PM 2.5 average concentration PM 2.5 average concentration take logarithmlnUrb urbanization level urbanization level take logarithmlnMark marketization index marketization index take logarithmlnFT foreign trade foreign trade take logarithmlnRW railway mileage railway mileage take logarithmlnHW highway mileage highway mileage take logarithm
Dependent variable. This study uses the number of tourists to measure the level of regional tourismdevelopment and is divided into domestic tourists and international visitors. This distinction helps inbetter understanding how regional government policies affect domestic and foreign tourists. We arguethat domestic and foreign tourists may have different behavioral preferences or responses to tourism.In this study, the number of domestic tourists is denoted as log lnDT and the log for international
161

Sustainability 2019, 11, 1390
tourists is denoted as log lnIT as explanatory variables. All data are derived from the China TourismStatistics Yearbook.
Independent variable (environment). We measure air (environment) quality by CO2 emissions andPM 2.5 concentrations. The higher the value of these two indicators, the worse the air (environment)quality. In the model, we use logarithm lnCO2 to represent CO2 emissions. The data on CO2 emissionsare derived from China Emission Accounts and Datasets. In addition, we use the logarithm lnPM torepresent PM 2.5 concentration, which is derived from the Columbia University Socioeconomic Dataand Applications Center [42].
Other independent variables (policies). We examine the impact of other factors on tourism.Urbanization. The level of urbanization has a positive impact on the economic development of
China. This study uses the proportion of the non-agricultural population to measure the level ofurbanization. We use logarithm lnUrb to represent the level of urbanization. The data on urbanizationlevel are derived the China Statistical Yearbook.
Marketization. Marketization can bring increased vitality to tourism and improve the efficiencyof the industry. In the model, we use the logarithm lnMark to represent the level of marketization.These data are derived from Wang et al.’s (2016) marketization index report, namely, China’s ProvincialMarketization Index Report (2016) [43].
Foreign trade. This study believes that foreign trade emphasizes the economic exchanges betweendomestic and foreign companies. This type of economic exchange is conducive to promotingcooperation among parties in various fields, such as encouraging foreign tourists to travel to China.In this study, the total import and export volumes are used as a measure of total foreign trade.The model uses logarithm lnFT to represent total foreign trade. The data were derived from the ChinaStatistical Yearbook.
Transportation mileage. Transportation is an important factor in the consideration of travelingbecause convenience during transportation is an important indicator of the level of developmentof tourism. Therefore, this study incorporates traffic into the model to test its impact on tourism.However, according to the actual situation, the National Bureau of Statistics data does not have specificstatistics on the flight route mileage; hence, we do not include the flight mileage into the transportationmileage. The measurement of transportation mileage includes two aspects, namely, highway andrailway mileage. In the model, we use the logarithms lnHW and lnRW to represent highway andrailway mileages, respectively. Transportation mileage data are derived from the China RegionalEconomic Statistics Yearbook.
To understand the characteristics of the data, we conduct a descriptive statistical analysis of thevarious characteristics of the main variables of this study. The sample data for this paper includeobservations from 2005 to 2015 in 17 western provinces of China, with a total sample size of 187.The descriptive statistics in Table 2 shows a large variation between the observed values of thevariables, which provides the possibility of the following econometric estimation.
Table 2. Descriptive statistics of variables.
Variable Mean Std. Dev. Min Max Observations
lnDT 9.278493 1.020568 6.45047 10.97679 n = 187lnIT 4.555244 1.160149 1.098612 6.345636 n = 187
lnCO2 5.385871 0.637381 2.99072 6.432297 n = 187lnPM 3.100933 0.661995 1.568501 4.113909 n = 187lnUrb 3.789561 0.246742 3.030823 4.209903 n = 187
lnMark 1.65028 0.258334 0.928219 2.075685 n = 187lnFT 14.11975 1.083563 10.62936 16.25331 n = 187lnRW 8.169016 0.391511 6.995766 9.400465 n = 187lnHW 11.83169 0.440624 10.29958 12.66217 n = 187
162

Sustainability 2019, 11, 1390
Figure 1 illustrates the regional distribution of all variables. Domestic tourists are mainlyconcentrated in the central part of China, especially in the Yangtze River, whereas internationaltourists are distributed in various parts of China and are relatively scattered. The carbon dioxideemissions of the country mainly occur in the northeast, whereas high PM 2.5 concentrations mainlyoccur in the eastern and central regions. The marketization index of China mainly ranges between4 and 8, and the marketization level in the central and eastern regions is relatively high, followedby the northern and southern regions. The level of foreign trade in the eastern region is relativelyhigh, with little differences in other regions. In terms of internal transportation, the mileage of variousexpressways in the country is relatively high. That is, the expressway has been well developed, andthe total mileage of most of the shares has reached more than 100,000 km. The average mileage ofeach railway mainly spans between 1500 and 4500 km, and the level of each development is even.The current level of urbanization in China generally ranges between 40% and 60%, with a relativelylarge space for the improvement of the development of urbanization.
Figure 1. Cont.
163

Sustainability 2019, 11, 1390
Figure 1. Spatial distribution of indicators.
In addition, from the perspective of growth rate trends (Figure 2), domestic tourists have displayeda positive growth trend, whereas the opposite is true for foreign tourists, which is basically a horizontalstable trend. In terms of air (environment), carbon dioxide emissions have decreased since 2011,and PM 2.5 concentrations generally have a downward trend. However, the decline is relative withsignificant increases in 2013 and 2015. We also depict a trend chart of tourism development in Figure 3.Figure 3a,b depicts that the vertical axis is the number of tourists. Moreover, the figures affirm that thenumber of tourists in almost all provinces shows a steady development trend regardless of the numberof domestic tourists or the number of international tourists. However, we are unable to include thetrend graphs of other indicators for brevity.
Figure 2. Change in the growth rate of each variable.
164

Sustainability 2019, 11, 1390
(a)
(b)
Figure 3. (a) Tourism development trend; (b) tourism development trend.
The scatter plot in Figure 4 reveals that CO2/PM 2.5 and domestic/international tourists show anevident linear correlation. Support for statistical data was provided by the linear regression analysis inthe next step of the study. We omit the individual relationship between other indicators and tourismfor brevity. However, we will conduct an in-depth discussion in the following model test.
165

Sustainability 2019, 11, 1390
Figure 4. Linear fit of each variable.
4. Empirical Analysis
We analyze data from 17 of China’s underdeveloped regions. The panel data model is typicallyestimated using a random or fixed effects model. The difference between the two methods is that therandom effects model is relatively more efficient but requires that exogenous variables be unrelated toindividual effects. However, although the fixed effects model has no requirements between exogenousvariables and individual effects, it consumes more degrees of freedom; hence, both have advantagesand disadvantages [44]. To this end, the study selects between the two estimation methods using theHausman test. Through the model selection test, we corroborate that the random effects model (LMtest: chibar2(01) = 375.02, p = 0.0000) and fixed effect model (F test that all u_i = 0: F(16, 154) = 49.63,Prob > F = 0.0000) are superior to the mixed effects model for the domestic tourist group. Thereafter,we perform the Hausmantest (chi2(16) = 83.03, p = 0.000) on the random and fixed effect models.Results affirm that the fixed effects model is better than the random effects model. Therefore, wemainly adopt the test results of the fixed effects model for the domestic group. For the internationalvisitor group, the random effects model (LM test: chibar2(01) = 395.51, p = 0.0000) and fixed effectsmodel (F test that all u_i = 0: F(16, 153) = 30.10, Prob > F = 0.0000) are superior to the mixed effectsmodel. Thereafter, we perform the Hausmantest (chi2(17) = 9.00, p = 0.9403) on the random and fixedeffects models. Results reveal that the random effects model is better than the fixed effects model.Therefore, we adopt the test results of the random effects model for the international group.
When using the above variables for estimation, all variables take the natural logarithm,such that the estimated coefficient of the variable can also be regarded as the elastic coefficient.The estimation results affirm that our previous theoretical judgments are supported by the data ingeneral. For domestic tourism, we adopt a fixed effects estimate because the Hausman test rejects therandom effects model. For international tourism, we adopt the estimation of random effects because theHausman test cannot reject the random effects model. Table 3 illustrates the following estimation results.First, the impact of carbon dioxide (CO2) on tourism is negative (β = −0.234, ns) for domestic tourism,
166

Sustainability 2019, 11, 1390
but the significance level has not passed the test. The PM 2.5 concentration (β = −0.383, p < 0.01)significantly negatively affects domestic tourism. Urbanization (β = 0.780, p < 0.05) significantlypromotes domestic tourism, which indicates that the level of urbanization is effective in promotingthe travel of domestic residents. The level of marketization (β = 0.334, p < 0.05) also has a positiveimpact on domestic tourism. In terms of transportation, highway construction (β = 0.492, p < 0.01) hasa significant effect on domestic tourism, and the impact of the railway on domestic travel is positive(β = 0.204, ns), but non-significant. This finding implies that the manner in which domestic residentstravel to domestic tourism may be biased by road transportation (such as self-driving tour).Second,no significant effect was observed for carbon dioxide (β = −0.156, ns) or PM 2.5 (β = 0.289, ns) oninternational tourists. However, urbanization (β = −1.664, p < 0.01) displays a significant negativeimpact on international tourism, which indicates that international travelers are likely to travel to lessurbanized areas due to the primitive and natural scenery. The level of marketization (β = 0.627, p < 0.05)also has a positive impact on international tourists. In terms of transportation, findings suggest thatthe impact of expressway construction (β = −0.222, ns) on international tourism is non-significantand that the impact of railways on international tourists is positive (β = 0.775, p < 0.01). This resultconfirms that the railways of China, especially the development of its high-speed railways in recentyears, have made remarkable achievements internationally. International tourists are further inclinedto ride and experience the high-speed rail travel of the country. Furthermore, the level of foreign trade(β = 0.775, p < 0.01) also has a significant positive impact on international tourism. As such, foreigntrade promotes domestic and foreign exchanges and attracts more international travelers to China.
Table 3. Estimation results of econometric models.
DV: lnDT DV: lnIT
IVRandom Effects
ModelFixed Effects
ModelRandom Effects
ModelFixed Effects
Model
lnCO2 0.0130 −0.234 −0.156 −0.367(0.14) (0.14) (0.23) (0.27)
lnPM 0.181 −0.383 *** 0.289 0.185(0.12) (0.14) (0.19) (0.27)
lnMark 0.532 *** 0.334 ** 0.627 ** 0.460(0.16) (0.15) (0.28) (0.30)
lnFT 0.687 *** 0.668 ***(0.11) (0.13)
lnUrb 0.662 ** 0.780 ** −1.664 *** −1.853 ***(0.28) (0.34) (0.48) (0.69)
lnRW 0.144 0.204 0.775 *** 0.746 **(0.18) (0.17) (0.29) (0.33)
lnHW 0.751 *** 0.492 *** −0.222 −0.429(0.14) (0.14) (0.24) (0.28)
Time effect controlled controlled controlled controlledcons −5.084 ** 0.205 −3.819 1.297
(2.26) (2.61) (3.64) (5.10)
Hausman test (p) chi2(16) = 83.03(0.000) chi2(17) = 9.00(0.9403)
N 187 187 187 187r2 0.943 0.554r2 a 0.931 0.457F 158.308 11.159Wald chi2(16) = 1974.40 chi2(17) = 231.72
Standard errors in parentheses. * p < 0.1, ** p < 0.05, *** p < 0.01.
We summarize the results of the hypothesis testing to help us more intuitively compare thedifferences in the impact of various factors on domestic and international visitors (see Table 4).We prove that government policies and basic transportation construction play a positive role inpromoting domestic and international tourism for economically underdeveloped provinces. In sum,the impact of carbon dioxide on tourism is non-significant among the air (environment) quality
167

Sustainability 2019, 11, 1390
factors whether for domestic or international tourists. However, PM 2.5 concentration has variedinfluences on domestic and international tourists. Domestic tourists are sensitive to changes in PM2.5 concentration, whereas international tourists are less sensitive. Particularly, the PM 2.5 indicatorhas a strong inhibitory effect on the travel of domestic tourists. In addition, although the impactof CO2 is non-significant, it remains negative. The reason for this result may be that the effect ofPM 2.5 on air is intuitive. Thus, a high concentration of PM 2.5 indicates poor air quality. Peoplecan perceive the negative air quality through personal experience or observation, thereby directlyaffecting the travel plans of people. Although CO2 negatively influences the air and environment, thiseffect is not intuitive. Therefore, materializing the impact of CO2 on the air or environment throughpersonal experience or observation is difficult. Hence, the impact of CO2 emissions on tourists isrelatively limited. Surprisingly, the simultaneous impact of CO2 emissions and PM 2.5 concentrationson international visitors is non-significant. The reason for this finding may be that internationalpassengers do not observe the air (environment) situation of China or have little or no informationabout this condition before traveling to the country. In other cases, they may not pay attention to thisinformation. Therefore, the impact of CO2 emissions or PM 2.5 concentration on international touristsis non-significant or fails to be an important consideration before tourists decide to travel to China.Another possible explanation is that the subjects we study in this paper are mainly the provinceswith less developed economies in Western China. The air (environment) quality of these areas isnot very bad compared with other regions; Figure 1 exhibits such differences. Therefore, whetherit is from the air (environment) quality perceived by tourists or from the perspective of data modelanalysis, the overall air (environment) quality has no significant impact on tourists. Of course, thisdoes not mean that the quality of air (environment) has little effect on tourism, but it just infers thatthe air (environment) quality of these areas is well controlled and that no serious impact on tourismdevelopment has emerged. The impact of marketization on domestic and international tourism ispositive and significant, which also reveals that the degree of the openness of the government to themarket has a positive impact on tourism and may even affect the entire economy. In addition, theimpact of urbanization on domestic and international tourists differs. Specific performance suggeststhat urbanization has a significant positive impact on domestic tourists, whereas this impact is negativeon international tourists. That is, the higher the level of urbanization, the weaker the ability to attractinternational tourists. In addition, foreign trade can further promote international travelers to travel toChina. The impact of traffic construction on domestic and international tourists also differs. Specifically,the increase in highway mileage has a positive effect on the promotion of domestic tourism, whereasthis impact is non-significant on international tourists. Conversely, the increase in railway mileage hasno significant impact on domestic tourists, whereas this impact is positive on international tourists.Finally, the increase in railway mileage has a positive effect on the impact of international tourism.
Table 4. Summary of Research Hypothesis Test Results.
Hypothesis Description IndependentsComparison
Domestic Set International Set
Air (environment) pollution will have a negative impact on domesticand international visitors.
CO2 Not supported Not supported
PM 2.5 Supported (−) Not supported
Urbanization has a positive impact on domestic tourism but anegative impact on international tourism. Urbanization Supported (+) Supported (−)
Marketization promoting domestic and international tourism. Marketization Supported (+) Supported (+)
Foreign trade has a positive impact on international tourists. Foreign trade —— Supported
Transportation can promote the development of tourism. Inparticular, compared with railways, highways have a greater impacton domestic tourists; compared with highways, railways have agreater impact on international tourists.
Highway Supported (+) Not supported
Railway Not supported Supported (+)
Note: The symbols in parentheses represent the potency of the influence. For example, (−) represents a negativeinfluence, (+) represents a positive influence.
168

Sustainability 2019, 11, 1390
5. Implications and Limitations
The results provide certain considerations and challenges for the sustainable development oftourism in underdeveloped areas in China. First, pursuing tourism development while paying attentionto the negative impact of air (environment) quality should be prioritized. Particularly, we emphasizethe notable impact of the PM 2.5 concentration on tourism because its impact on tourists is direct.Although, from the statistical point of view (Figure 2), the PM 2.5 concentration of these parts shows adownward trend annually. However, this decline is still relatively slow. Therefore, the governmentshould continue or increase environmental protection policies, such as energy conservation andemission reduction. Otherwise, the sustainable development of tourism will become a big challenge.Second, the local government’s economic policies have played an extremely positive role in promotingthe development of tourism. Local governments should be further open to economic development.The analysis results reveal that local governments should implement open economic policies. That is,marketization has a positive impact on domestic and foreign tourists. In addition, the increase inforeign trade plays a positive role in promoting tourism. Specifically, we add foreign trade variables tothe international tourism model and corroborate that its impact on the travel of international tourists toChina remains largely significant. Therefore, in addition to the open domestic economic developmentpolicy for local governments, the more open foreign trade has played a positive role in promotinginternational tourists. After the reform and opening up, economic openness and non-nationalizationhave become the trends of the times. As such, reducing participation in economic activities andmobilizing the power of the market to bring vitality to the tourism market are necessary for localgovernments. Third, urban construction and basic transportation construction policies also have apositive impact on tourism. The improvement of the level of urbanization is conducive to promotingthe income level of the entire population and narrowing the income gap between urban and ruralareas. Currently, the urbanization level of China ranges between 40% and 60% (Figure 1). Hence, thelevel of urbanization still has a relatively large room for improvement. For the tourism industry, ruralresidents with increasing incomes are an attractive market. In addition, local governments shouldalso consider the impact of urbanization on international tourists. For regions that rely on naturalscenery as their main destination, maintaining a comprehensive and original social outlook may beattractive. In this respect, excessive urbanization may weaken the attractiveness of local attractions tointernational tourists.
One limitation of this study is that our results are based on the data analysis of Chinese singlesubjects. The results may only adapt to the Chinese context, but we also believe that some developingcountries similar to China can learn from the experience of China and the results of this study to adjusttheir tourism development strategies. Future researchers can incorporate the situation of each countryinto a comparative model from a more macro perspective and explore whether the development ofother countries is consistent with the results of this study or have different or even opposite trends.In addition, this study only analyzes the differences between domestic and international touriststhrough macro data. We cannot fundamentally understand why they have this difference. For instance,knowing precisely the difference in the impact of air (environment) quality factors on domestic andinternational visitors is difficult. We only know that such a difference exists. Therefore, future researchcan further explore the mechanisms behind these differences by combining some micro data such asinterviews and questionnaires. In short, distinguishing domestic tourists from international tourists isreasonable because they should have different responses to tourism policies and corporate marketingstrategies. Therefore, future research can comprehensively compare and analyze the differencesbetween the two types of tourists from different angles, not just the factors mentioned in this paper.
Author Contributions: J.L. performed the conceptualization for the first manuscript; H.P. was the major writer ofthe original draft and performed the review & editing of the manuscript; S.Z. performed data collection.
Funding: This work was supported by the National Natural Science Foundation of China (Grant No.91746206),the Key Research Institute of Philosophies and Social Sciences in Guangxi Universities (Grant No.17YB001), andthe Scientific Research Foundation of Guilin University of Technology (Grant No. GLUTQD2018054).
169
Sustainability 2019, 11, 1390
Conflicts of Interest: The authors declare no conflict of interest.
References
1. Ahmad, F.; Draz, M.U.; Su, L.; Ozturk, I.; Rauf, A. Tourism and Environmental Pollution: Evidence from theOne Belt One Road Provinces of Western China. Sustainability 2018, 10, 3520. [CrossRef]
2. Wu, M.-Y.; Pearce, P.L. Tourists to Lhasa, Tibet: How Local Youth Classify, Understand and Respond toDifferent Types of Travelers. Asia Pac. J. Tour. Res. 2013, 18, 549–572. [CrossRef]
3. Kadiyali, V.; Kosová, R. Inter-industry employment spillovers from tourism inflows. Reg. Sci. Urban Econ.2013, 43, 272–281. [CrossRef]
4. Njoya, E.T.; Seetaram, N. Tourism Contribution to Poverty Alleviation in Kenya: A Dynamic ComputableGeneral Equilibrium Analysis. J. Travel Res. 2018, 57, 513–524. [CrossRef] [PubMed]
5. Crouch, G.I.; Del Chiappa, G.; Perdue, R.R. International convention tourism: A choice modelling experimentof host city competition. Tour. Manag. 2019, 71, 530–542. [CrossRef]
6. Andersson, T.D.; Getz, D. Tourism as a mixed industry: Differences between private, public and not-for-profitfestivals. Tour. Manag. 2009, 30, 847–856. [CrossRef]
7. Aratuo, D.N.; Etienne, X.L. Industry level analysis of tourism-economic growth in the United States.Tour. Manag. 2019, 70, 333–340. [CrossRef]
8. Cohen, E. Globalization, global crises and tourism. Tour. Recreat. Res. 2012, 37, 103–111. [CrossRef]9. Frossard, M.S.; Fraga, C. Tourism, railway and advertising: the construction of feelings and meanings in the
posters of railroads in the United Kingdom (1890–1970). Anais Brasileiros De Estudos Turisticos-AbeT 2018,8, 43–55.
10. Liu, Y.; Li, Y.; Parkpian, P. Inbound tourism in Thailand: Market form and scale differentiation in ASEANsource countries. Tour. Manag. 2018, 64, 22–36. [CrossRef]
11. Luo, J.M.; Qiu, H.; Goh, C.; Wang, D. An Analysis of TOURISM Development in China From UrbanizationPerspective. J. Qual. Assur. Hosp. Tour. 2016, 17, 24–44. [CrossRef]
12. Mondal, M.; Dandapath, P.K. Urbanization and its impact on coastal eco-tourism in West Bengal. Int. J.Sci. Res. 2013, 2, 114–119.
13. Yorucu, V. Growth impact of CO2 emissions caused by tourist arrivals in Turkey An econometric approach.Int. J. Clim. Chang. Strateg. Manag. 2016, 8, 19–37. [CrossRef]
14. Zhou, B.; Qu, H.; Du, X.; Yang, B.; Liu, F. Air quality and inbound tourism in China. Tour. Anal. 2018,23, 159–164. [CrossRef]
15. Becken, S.; Jin, X.; Zhang, C.; Gao, J. Urban air pollution in China: Destination image and risk perceptions.J. Sustain. Tour. 2017, 25, 130–147. [CrossRef]
16. Luo, J.M.; Qiu, H.; Lam, C.F. Urbanization impacts on regional tourism development: A case study in China.Curr. Issues Tour. 2016, 19, 282–295. [CrossRef]
17. Paramati, S.R.; Alam, M.S.; Chen, C.-F. The Effects of Tourism on Economic Growth and CO2 Emissions: AComparison between Developed and Developing Economies. J. Travel Res. 2017, 56, 712–724. [CrossRef]
18. Raza, S.A.; Sharif, A.; Wong, W.K.; Abd Karim, M.Z. Tourism development and environmental degradationin the United States: Evidence from wavelet-based analysis. Curr. Issues Tour. 2017, 20, 1768–1790. [CrossRef]
19. Shakouri, B.; Yazdi, S.K.; Ghorchebigi, E. Does tourism development promote CO2 emissions? Anatolia-Int. J.Tour. Hosp. Res. 2017, 28, 444–452. [CrossRef]
20. Wang, L.; Fang, B.; Law, R. Effect of air quality in the place of origin on outbound tourism demand:Disposable income as a moderator. Tour. Manag. 2018, 68, 152–161. [CrossRef]
21. Wang, M.-C.; Wang, C.-S. Tourism, the environment, and energy policies. Tour. Econ. 2018, 24, 821–838.[CrossRef]
22. Zaman, K.; Shahbaz, M.; Loganathan, N.; Raza, S.A. Tourism development, energy consumption andEnvironmental Kuznets Curve: Trivariate analysis in the panel of developed and developing countries.Tour. Manag. 2016, 54, 275–283. [CrossRef]
23. Chen, L.; Thapa, B.; Yan, W. The Relationship between Tourism, Carbon Dioxide Emissions, and EconomicGrowth in the Yangtze River Delta, China. Sustainability 2018, 10, 2118. [CrossRef]
24. Mullins, P. Tourism Urbanization. Int. J. Urban Reg. Res. 1991, 15, 326–342. [CrossRef]
170
Sustainability 2019, 11, 1390
25. Palamalai, S.; Kalaivani, M. Tourism Expansion, Urbanization and Economic Growth in India: An EmpiricalAnalysis. IUP J. Bus. Strategy 2016, 13, 135–151.
26. Shinde, K.A. Planning for urbanization in religious tourism destinations: Insights from Shirdi, India.Plan. Pract. Res. 2017, 32, 132–151. [CrossRef]
27. Ashworth, G.; Page, S.J. Urban tourism research: Recent progress and current paradoxes. Tour. Manag. 2011,32, 1–15. [CrossRef]
28. Naidu, S. Exploring the dynamic effects of urbanization and real effective exchange rate on tourism outputof singapore. Tour. Anal. 2017, 22, 185–200. [CrossRef]
29. Munari, A.B.; de Assuncao, V.K.; de Menezes, C.T. Socio-Environmental Problems Arising from Urbanizationand Tourism: Lagoa das Capivaras, Garopaba (SC), Brazil Case Study. Desenvolv. E Meio Ambiente 2018,44, 242–266. [CrossRef]
30. Cuadrado-Ciuraneta, S.; Durà-Guimerà, A.; Salvati, L. Not only tourism: Unravelling suburbanization,second-home expansion and “rural” sprawl in Catalonia, Spain. Urban Geogr. 2017, 38, 66–89. [CrossRef]
31. Callon, M. Revisiting marketization: From interface-markets to market-agencements. Consum. Mark. Cult.2016, 19, 17–37. [CrossRef]
32. Podedworna, H. Marketization of rural resources in Poland. Sociol. Rev. 2010, 2, 127–145.33. Belk, R.W. Güliz Ger Problems of Marketization in Romania and Turkey. Res. Consum. Behav. 1994, 7, 123–155.34. Bianchi, R. The political economy of tourism development: A critical review. Ann. Tour. Res. 2018, 70, 88–102.
[CrossRef]35. Fletcher, R. Sustaining tourism, sustaining capitalism? The tourism industry’s role in global capitalist
expansion. Tour. Geogr. 2011, 13, 443–461. [CrossRef]36. Yu, L. On Enhancing Tour. Manag. Quality in Scenic Spots. In Proceedings of the 2013 Fourth
International Conference on Education and Sports Education (ESE 2013), Hong Kong, China, 11–12 April2013; Volume 12, pp. 189–193.
37. Wang, C.; Dai, S.; Xu, H.; Li, X. The Impact of the Institutional Environment on the Geographic Diversificationof Chinese Tourism Firms. J. China Tour. Res. 2018, 14, 334–353. [CrossRef]
38. Van Hoa, T.; Turner, L.; Vu, J. Economic impact of Chinese tourism on Australia: A new approach. Tour. Econ.2018, 24, 677–689.
39. Tsui, W.H.K.; Balli, F.; Tan, D.T.W.; Lau, O.; Hasan, M. New Zealand business tourism: Exploring the impactof economic policy uncertainties. Tour. Econ. 2018, 24, 386–417. [CrossRef]
40. Quan, S.; Wang, N. Towards a structural model of the tourist experience: An illustration from foodexperiences in tourism. Tour. Manag. 2004, 25, 297–305. [CrossRef]
41. Chang, Y.; Yang, Y.; Dong, S. sustainability evaluation of high-speed railway (HSR) construction projectsbased on unascertained measure and analytic hierarchy process. Sustainability (Switzerland) 2018, 10, 408.[CrossRef]
42. van Donkelaar, A.; Martin, R. V.; Brauer, M.; Hsu, N.C.; Kahn, R.A.; Levy, R.C.; Lyapustin, A.; Sayer, A.M.;Winker, D.M. Global Estimates of Fine Particulate Matter using a Combined Geophysical-Statistical Methodwith Information from Satellites, Models, and Monitors. Environ. Sci. Technol. 2016, 50, 3762–3772. [CrossRef][PubMed]
43. Wang, X.; Fan, G.; Yu, J. Marketization Index of China’s Provinces: Neri Report 2016; Social Sciences AcademicPress(China): Beijing, China, 2017.
44. Baltagi, B.H. Solutions to Problems Posed in Volume 20(1) and 20(2): 04.1.1. A Hausman Test Based onthe Difference between Fixed Effects Two-Stage Least Squares and Error Components Two-Stage LeastSquares—Solution. Econom. Theory 2005, 21, 483–484. [CrossRef]
© 2019 by the authors. Licensee MDPI, Basel, Switzerland. This article is an open accessarticle distributed under the terms and conditions of the Creative Commons Attribution(CC BY) license (http://creativecommons.org/licenses/by/4.0/).
171


sustainability
Article
The Impact of Disaster of a National Airline on theNation’s Tourism: An Empirical Investigation
Ting Fan 1,*, Bo Pu 2 , Samart Powpaka 3,* and Liaogang Hao 1
1 School of Economics and Management, Southwest Jiaotong University, Chengdu 610031, China;[email protected]
2 College of Tourism, Sichuan Agricultural University, Chengdu 611830, China; [email protected] School of Management and Economics, The Chinese University of Hong Kong, Shenzhen 518172, China* Correspondence: [email protected] (T.F.); [email protected] (S.P.)
Received: 25 January 2019; Accepted: 20 February 2019; Published: 26 February 2019���������������
Abstract: This study contributes to the area of tourism research by investigating the process bywhich the air disaster of a national airline affects tourists’ attitude and intention to fly the airlineas well as attitude and intention to visit the country. A survey with potential Chinese tourists onvisiting Malaysia and flying Malaysia Airlines was conducted. Results show that intention to visitMalaysia is positively affected by attitude toward visiting Malaysia and intention to fly MalaysiaAirlines. Attitude toward visiting Malaysia is positively affected by attitude toward flying MalaysiaAirlines and negatively by perceived risk of visiting Malaysia. Perceived risk of visiting Malaysiais, in turn, negatively affected by subjective knowledge about Malaysia and attitude toward flyingMalaysia Airlines, and positively by perceived risk of flying Malaysia Airlines. Intention to flyMalaysia Airlines, on the other hand, is positively affected by attitude toward flying MalaysiaAirlines. Attitude toward flying Malaysia Airlines is negatively affected by perceived risk of flyingMalaysia Airlines, which is, in turn, positively affected by usefulness of (negative) public opinion.The theoretical contribution, managerial implications, limitations, and future research direction arealso discussed.
Keywords: air disaster; subjective knowledge; usefulness of public opinion; perceived risk; attitude;purchase intention; Malaysia Airlines; Malaysia
1. Introduction
According to Aviation Benefits beyond Borders [1], tourism makes a significant contribution tothe global economy. According to the article, tourism contributed almost 10% to the world GDP (US$2.2 trillion) in 2015 and provided over 108 million jobs globally. It is estimated that by 2024, the directemployment in the tourism industry will reach more than 126 million globally. In Malaysia, tourismhas become the country’s 6th largest economic pillar, and attracting tourists from the Chinese marketis one of the country’s key focus [2].
Air travel plays a critical role in supporting tourism. It has become an integral part of internationaltourism. The connectivity provided by international air transport facilitates the fast-growing globaltourism industry. Aviation Benefits beyond Borders [1] estimates that over half of international touriststravel to their destination by air.
When visiting a foreign tourist destination, consumers are likely to consider the national airline ofthe country of destination because of the likely shorter travel time and more convenience in connectingflights. An important issue is whether or not problems with the national airline, especially airlinedisasters, negatively affect the foreign tourists’ intention to use the airline as well as intention to visit
Sustainability 2019, 11, 1233; doi:10.3390/su11051233 www.mdpi.com/journal/sustainability173

Sustainability 2019, 11, 1233
the country. Although this kind of incident is rare, the tremendous negative impact of such an incidenton the airline and the country [3] warrants an investigation of this type of incident.
Malaysia Airlines is such a national airline that experienced air disasters. The mysteriousdisappearance of Malaysia Airlines Flight MH370 (from Kuala Lumpur to Beijing on March 8, 2014)and the crash of Malaysia Airlines Flight MH317 (from Amsterdam to Kuala Lumpur on July 17,2014) significantly affected the perceived risks in flying the airline among Chinese passengers as wellas many other passengers making bookings in Europe, and as such significantly affected MalaysiaAirlines’ business [4]. Malaysia, which was ranked the 9th most-visited country in the world in 2010,slid to 12th in 2016 [3].
It has been four years since the two Malaysian Airlines’ disasters in 2014. The effect of MalaysiaAirlines Flight MH370 still seems to linger in Chinse people’s mind. An interesting question is whetheror not this air disaster still affects Chinese tourists’ willingness to visit Malaysia by Malaysia Airlines,and if yes, how visiting Malaysia and flying Malaysia Airlines relate to each other.
The objective of this study is to investigated the process by which the air disaster of a nationalairline (i.e., Malaysia Airlines) affects tourists’ attitude and intention to fly the airline as well as attitudeand intention to visit the country (i.e., Malaysia). Specifically, this study proposed and empiricallytested factors affecting the attitude and intention toward flying Malaysia Airlines, and factors affectingattitude and intention toward visiting Malaysia. To achieve this objective, a qualitative research withpotential Chinese passengers augmented by literature review was conducted to come up with theconceptual model for this study.
The next section discussed the conceptualization of the conceptual model and hypothesis.This is followed by research methodology. Section 4 discusses the results of the study. The finalconclusion section discusses theoretical contribution, managerial implications, limitations, and futureresearch direction.
2. Conceptual Model and Hypotheses
Review of literature reveals that, surprisingly, there is no study that directly addresses the issueof air disasters and their impacts on the willing to fly the airlines and visiting the countries of originof the airlines. As such, a model conceptualization approach used by Zeithaml [5] was adopted toconceptualize the conceptual model for this study. The steps in the model conceptualization processare discussed in the next section.
2.1. Model Conceptualization Process
As suggested Zeithaml [5], insights from an exploratory study with potential Chinese touristsand review of relevant literature were combined into a conceptual model that conceptualizes theperceptions, attitudes, and intentions toward flying Malaysia Airlines and toward visiting Malaysia.Specifically, a focus group interview was conducted to generate qualitative data that served as thebasis for model conceptualization and research hypothesis formulation. Based on the concepts andtheir relationships identified in the qualitative research, literature review was conducted to identifyappropriate conceptual frameworks to conceptualize the phenomenon, and then to find literature tosupport the relationships among the constructs. The model conceptualization process is discussed indetail below.
2.1.1. The Exploratory Study
The focus group interview was based on an interview guideline, and the questions weresemi-structured to allow additional insights. To guarantee the validity of the interview, the selection ofinterviewees was concentrated on candidates who have certain knowledge about aviation disaster,for example know or at least heard about the MH370 accident, fly often for business or vacation,and have the possibility to fly international airlines. In addition, the participants should be able toclearly and fluently express their opinions. Thus, a focus group interview of eight Chinese tourists
174

Sustainability 2019, 11, 1233
with an education level of undergraduates and above who plan to visit foreign tourist destinationswas conducted. The participants included four males and four females between the age of 25 and55 and all had visited foreign tourist destination on individual visas. To control the process of thefocus group interview, the location was situated in a place with minimum distraction (the office ofthe moderator or participant) to secure the continuity and fluency of the focus group interview. Thediscussion centered on Malaysia as the tourist destination and then Malaysia Airlines as the airlinefor visiting Malaysia. The moderator first expressed his gratitude for the interviewers to take partin the focus group interview, and then presented a brief introduction of the MH370 air disaster andthe purpose of the interview. Questions covering such topics as the advantages and disadvantagesof visiting Malaysia and flying Malaysia Airlines, the perceived risked of choosing airplanes as thetransportation for business or vacation, and factors affecting the interviewers’ choice of transportationand vacation destination were then discussed along the process.
The focus group interview revealed following findings:
• There was a perceived risk (i.e., physical risk) in visiting Malaysia because of news about aChinese tourist being kidnapped in Sabah, Malaysia. This perceived risk negatively the subjects’affected attitude toward visiting Malaysia and intention to visit Malaysia.
• There was still a perceived risk (i.e., physical risk) in flying Malaysia Airlines because of theMH370 incident. This perceived risk negatively affected the subjects’ attitude toward flyingMalaysia Airlines to Malaysia and intention to fly Malaysia Airlines.
• Favorable attitude toward flying Malaysia Airlines seems to reduce perceived risk in visitingMalaysia and increase the subjects’ positive attitude toward visiting Malaysia.
• The subjects’ subjective knowledge about the aviation/airlines and subjective knowledge aboutMalaysia seem to reduce perceived risk in flying Malaysia Airlines and perceived risk in visitingMalaysia, respectively.
• Perceived usefulness of (negative) public opinions about the Malaysia Airlines seems to affectand increase perceived risk in flying Malaysia Airlines and perceived risk in visiting Malaysia.
Based on the findings from the focus group interview, a literature review was conducted toidentify an appropriate conceptual framework as well as to find empirical support for the relationshipamong the constructs.
2.1.2. The Conceptual Frameworks
Based on the findings from the focus group interview, a conceptual framework is needed to linkall the concepts/constructs identified from the focus interview together into a coherent scheme ofrelationships. Since beliefs and attitudes were identified in the focus group interview, attitudinalmodels were reviewed to identify the appropriate framework for conceptualizing the conceptualmodel for this study. The literature review identified the dual mediation model [6] as the appropriateconceptual framework to conceptualize the conceptual model for this study.
2.1.3. The Dual Mediation Model
MacKenzie, Lutz, and Belch [6] derived the dual mediation model from the joint cognitivestructure of communication effects [7] and the elaboration likelihood model [8] to explain the roleof attitude toward the ad as the mediator of advertising effectiveness in their empirical study [9].The dual mediation model posits that an attitude toward an attitudinal object can affect the cognitionas well as the attitude of another attitudinal object [6,8]. Figure 1 shows the overview of the dualmediation model.
175

Sustainability 2019, 11, 1233
Figure 1. Dual mediation model.
The dual mediation hypothesis has been used as the conceptual framework in several empiricalstudies. These studies mainly concern the role of attitude toward the ad as the mediator between adcognitions and brand cognitions and attitude toward the brand in the context of advertising. Someof the exemplar applications of the dual mediation model include the comparison of four competingmodels explaining the mediating role of attitude toward the ad [6], the replication and extension ofMacKenzie, Lutz, and Belch’s [6] four competing models [10], the reexamination and extension ofMacKenzie, Lutz, and Belch’s [6] four competing models in online advertising context [11], websiteeffectiveness [12], and the impact of corporate credibility and celebrity credibility on consumer reactionto advertisements and brands [13].
2.2. Conceptual Model
Based on the findings from the focus interview and the conceptual framework (i.e., the dualmediation model), the conceptual model for this study is shown in Figure 2. According to theconceptual model, intention to fly Malaysia Airlines to Malaysia is positive affected by attitude towardflying Malaysia Airlines. Attitude toward flying Malaysia Airlines is negatively affected by perceivedrisk of flying Malaysia Airline, which is, in turn, negatively affected by subjective knowledge aboutaviation and positively by usefulness of (negative) public opinion. Intention to visit Malaysia ispositively affected by intention to fly Malaysia Airlines and attitude toward visiting Malaysia. Attitudetoward visiting Malaysia is, in turn, negatively affected by perceived risk of visiting Malaysia andpositively by attitude toward flying Malaysia Airlines. Finally, perceived risk of visiting Malaysiais negatively affected by subjective knowledge about Malaysia and attitude toward flying MalaysiaAirlines, and positively by perceived usefulness of (negative) public opinion about Malaysia Airlinesand perceived risk of flying Malaysia Airlines. Each of the proposed relationships is discussed below:
176
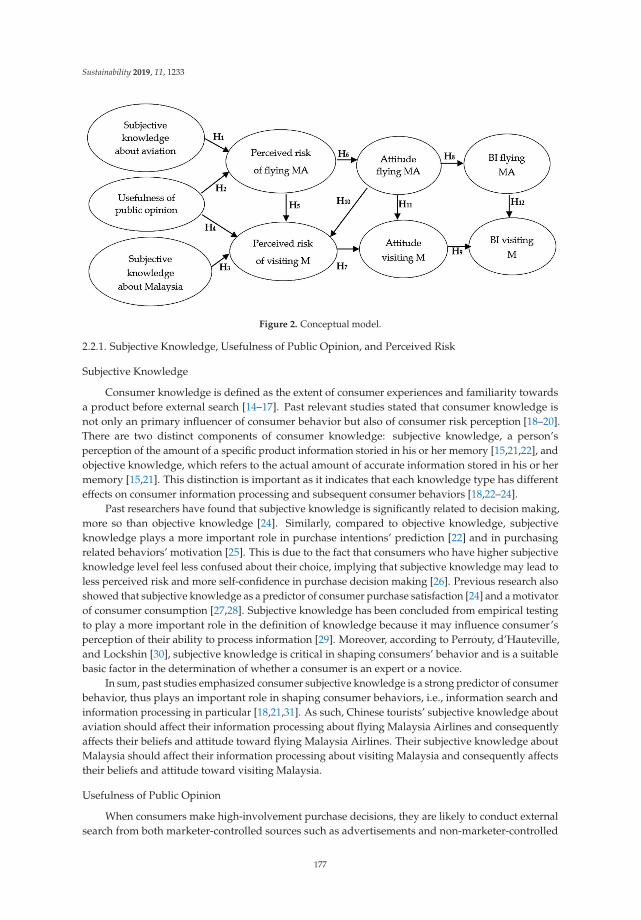
Sustainability 2019, 11, 1233
Figure 2. Conceptual model.
2.2.1. Subjective Knowledge, Usefulness of Public Opinion, and Perceived Risk
Subjective Knowledge
Consumer knowledge is defined as the extent of consumer experiences and familiarity towardsa product before external search [14–17]. Past relevant studies stated that consumer knowledge isnot only an primary influencer of consumer behavior but also of consumer risk perception [18–20].There are two distinct components of consumer knowledge: subjective knowledge, a person’sperception of the amount of a specific product information storied in his or her memory [15,21,22], andobjective knowledge, which refers to the actual amount of accurate information stored in his or hermemory [15,21]. This distinction is important as it indicates that each knowledge type has differenteffects on consumer information processing and subsequent consumer behaviors [18,22–24].
Past researchers have found that subjective knowledge is significantly related to decision making,more so than objective knowledge [24]. Similarly, compared to objective knowledge, subjectiveknowledge plays a more important role in purchase intentions’ prediction [22] and in purchasingrelated behaviors’ motivation [25]. This is due to the fact that consumers who have higher subjectiveknowledge level feel less confused about their choice, implying that subjective knowledge may lead toless perceived risk and more self-confidence in purchase decision making [26]. Previous research alsoshowed that subjective knowledge as a predictor of consumer purchase satisfaction [24] and a motivatorof consumer consumption [27,28]. Subjective knowledge has been concluded from empirical testingto play a more important role in the definition of knowledge because it may influence consumer’sperception of their ability to process information [29]. Moreover, according to Perrouty, d’Hauteville,and Lockshin [30], subjective knowledge is critical in shaping consumers’ behavior and is a suitablebasic factor in the determination of whether a consumer is an expert or a novice.
In sum, past studies emphasized consumer subjective knowledge is a strong predictor of consumerbehavior, thus plays an important role in shaping consumer behaviors, i.e., information search andinformation processing in particular [18,21,31]. As such, Chinese tourists’ subjective knowledge aboutaviation should affect their information processing about flying Malaysia Airlines and consequentlyaffects their beliefs and attitude toward flying Malaysia Airlines. Their subjective knowledge aboutMalaysia should affect their information processing about visiting Malaysia and consequently affectstheir beliefs and attitude toward visiting Malaysia.
Usefulness of Public Opinion
When consumers make high-involvement purchase decisions, they are likely to conduct externalsearch from both marketer-controlled sources such as advertisements and non-marketer-controlled
177

Sustainability 2019, 11, 1233
sources such as word of mouth and public opinion [32]. The additional information obtained fromexternal search generally enables consumers to make purchase decisions easier.
Public opinion is a complex but common phenomenon. With the rapid development ofinformation and communication technology, public opinion has become more active than ever, andthe resultant upheavals of public opinion has become acknowledged and studied in the area ofmarketing [33,34]. It is reasonable to contend that consumers can find public opinions from the Internetin any issue or topic. The extent to which the consumers evaluate online review’s helpfulness in thepurchase decision process is defined as the usefulness of online review or public opinion [35]. Herreroet al. [36] proposed that review information generated by users is able to affect other users' behavior ifthe information is considered useful and the source is credible. Past studies stated perceived usefulnessof public opinion as a key element in the use of technology, and the strength of belief in the usefulnessleads to higher frequency of online communication [37–39].
From the focus group, a decision to choose a foreign tourist destination for vacation and an airlinefor the destination is likely to be a high-involvement decision making for Chinese. Chinese touristsgenerally consult their friends and relatives about the destination they plan to visit. They also browsefor public opinion on the websites about the tourist destination. They tend to incorporate word ofmouth and public opinion that they deem to be credible and as such useful in their decision making.
Browsing of public websites for Malaysia Airlines showed that public opinions about MalaysiaAirlines are still mostly negative. Previous studies suggest that compared to positive online reviewsnegative ones have greater influence on consumer purchase decision making [35,40], and according toDavis et al. [37] perceived usefulness is likely to affect consumer purchase decision, potential travelersfind negative online reviews to be more useful than positive ones [41]. As such, the extent or degree towhich Chinese tourists believe that the (negative) public opinion about Malaysia Airlines is usefulshould significantly shapes their attitude and purchase decisions.
Perceived Risk
Perceived risk is brought in to the consumer behavior context in the 1960s [42].The literature defines perceived risk as a two-dimensional construct, i.e., uncertainty and negativeconsequences [42,43]. In other words, due to the unknown degree of accuracy in the consequences ofuse and probability of the consequences actually occurring, the concept of perceived risk in marketing(i.e., purchasing and consumption) correlates closely with partial ignorance [18,42].
Consumers normally decide to make their purchase after seeing, touching or trying out theproduct, but this is not be the case for tourism industry products due to the intangibility of theproduct characteristics, as a result, perceived risk is found to significantly affect consumer purchasedecisions [44,45]. In marketing, several distinctive types of perceived risk associated with theacquisition and use of products have been identified, including financial risk, performance risk,physical (or safety) risk, psychological risk, and social risk [46]. Review of past literature shows thatperceived risk does not have explanatory power in low-involvement purchases [32]. However, it islikely to be a key factor that determines consumer decisions in high-involvement purchases [18].Since decisions to choose a tourist destination and an airline to the destination are likely to behigh-involvement decisions for Chinese tourists, it is very likely that perceived risks regarding flyingMalaysia Airlines and perceived risk regarding visiting Malaysia should affect their purchase decisions.
Results from the focus group interview indicated that subjective knowledge is likely to havenegative on perceived risks while usefulness of public opinion is likely to have positive impact onperceived risks. Past studies supports the focus group result, Jin and Han [26] pointed out thatconsumers with higher subjective knowledge level usually feel less confused about their choice ofproduct, which implies that higher subjective knowledge lead to less perceived risk. Casaló, et al. [41]suggests that potential travelers find negative online reviews to be more useful, which implies negativeconsumer perception may lead to doubt more about their choice. Based on the above discussion, thefollowing hypotheses are proposed:
178

Sustainability 2019, 11, 1233
H1: Subjective knowledge about aviation negatively affects perceived risk of flying Malaysia Airlines.
H2: Usefulness of (negative) public opinion about Malaysia Airlines positively affects perceived risk of flyingMalaysia Airlines.
H3: Subjective knowledge about Malaysia negatively affects perceived risk of visiting Malaysia.
H4: Usefulness of (negative) public opinion positively affects perceived risk of visiting Malaysia.
H5: Perceived risk of flying Malaysia Airlines positively affects perceived risk of visiting Malaysia.
2.2.2. Perceived Risk, Attitude, and Purchase Intention
Attitude
Attitude is consumer’s overall evaluate of an object [47]. Attitude toward an attitudinal objectis defined as the overall evaluation, in a favorable or unfavorable way, toward the attitudinalobjective [48,49]. According to Ajzen and Fishbein [48] and Fishbein and Ajzen [49], attitude towardan attitudinal object is a function of cognitive beliefs about the attitudinal object. Perceived risk of anattitudinal objective is a perception or belief about the attitudinal object, and as such, should shapeattitude toward the attitudinal object.
Previous studies also suggest a positive attitude lead to consumer’s continuous preference towardsa brand, and significantly influences consumer’s purchase intention and willingness to pay a premiumprice [50–52]. Based on the theory of reasoned action, Summers et al. [53] proposed attitude is one ofthe dominant predictors of consumer purchase intention, and the purchase intention is high whenattitude is favorable. The above discussions show that attitude is the primary determinant of consumerpurchase intention [54].
Purchase intention
Purchase intention is the propensity or likelihood to buy the product. Consumer’s purchaseintention is a primary factor in forecasting consumer behavior [55]. In marketing studies, attitude andpurchase intention exhibit an inseparable relationship [56]. Shen [57] argues that a set of determinants,for example attitudes, subjective norms, and perceived behavioral control tend to influence thepurchase intention of customer. Duart and Amaro [58] also found that intention to purchase travelproducts is determined by attitude and percieved risk. According to Ajzen and Fishbein [48] andFishbein and Ajzen [49], behavioral intention is a function of attitude toward the behavior. In marketingcontext, intention to buy a product or brand is a function of attitude toward the product or brand.
Since perceived risk is a belief held by consumers, the following hypotheses regarding therelationship between perceived risk of flying Malaysia Airlines and attitude toward flying MalaysiaAirlines and that between perceived risk of visiting Malaysia and attitude toward visiting Malaysiaare proposed:
H6: Perceived risk of flying Malaysia Airlines negatively affects attitude toward flying Malaysia Airlines.
H7: Perceived risk of visiting Malaysia negatively affects attitude toward visiting Malaysia.
The following hypotheses are proposed for the relationship between attitude toward flyingMalaysia Airlines and intention to fly Malaysia Airlines and that between attitude toward visitingMalaysia and intention to visit Malaysia:
H8: Attitude toward flying Malaysia Airlines positively affects intention to fly Malaysia Airlines.
H9: Attitude toward visiting Malaysia positively affects intention to visit Malaysia.
The focus group interview revealed that attitude toward flying Malaysia Airlines seems to haveimpact on perceived risk of visiting Malaysia and attitude toward visiting Malaysia. Using the dual
179

Sustainability 2019, 11, 1233
mediation model (i.e., an attitude toward an attitudinal object can affect the cognition as well as theattitude of another attitudinal object) as framework, the following hypotheses are proposed:
H10: Attitude toward flying Malaysia Airlines negatively affects perceived risk of visiting Malaysia.
H11: Attitude toward flying Malaysia Airlines positively affects attitude toward visiting Malaysia.
Finally, extending on the dual mediation model, the following hypothesis regarding therelationship between intention to fly Malaysia Airlines and intention to visit Malaysia is proposed:
H12: Intention to fly Malaysia Airlines positively affects intention to visit Malaysia.
3. Methodology
3.1. Research Design
The research design used in this study is sample survey. The rationale for choosing sample surveyas the research design, which is a correlational study, is based on the fact that all the constructs in theconceptual model are measurable and the hypothesized relationships among these constructs are to betested. The study utilized a self-administered online survey to collect data. A professional internetresearch website (http://www.wjx.cn) is used for the data collection, the website randomly selectsparticipants from its online panel to complete the questionnaire during the first two-year search forFlight MH370.
3.2. Sample and Data Collection
Data were collected from Chinese subjects who were planning vacation overseas viaself-administered questionnaire. According to Leohlin [59], the number of survey subject for thestructural equation modeling approach should be no less than 200, thus a total of 313 useablequestionnaires were obtained. In terms of gender, there were 170 males (54.3%) are 143 females(45.7%). In terms of age, 227 of them were 19-29 years old (72.5%), 71 were 30–39 years old (22.7%),11 of them were 40–49 years old (3.5), and 3 of them were 50–59 years old (1.0%). In terms of maritalstatus, 189 of them were single (60.4%), 95 of them were married (30.4%), and 29 of them were cohabitor other (9.3%). In terms of education, 2 of them were secondary school graduates (0.6%), 48 of themwere currently college/university students (15.3%), 76 of them were college/university graduates(24.3%), and 187 of them were postgraduate or higher (59.7%). In terms of annual income, 131 of themearn below RMB 20,000 (41.9%), 20 of them earn between RMB 20,000 and 39,999 (6.4%), 20 of themearn between RMB 40,000 and 59,999 (6.4%), 34 of them earn between RMB 60,000 and 79,999 (10.9%),29 of them earn between RMB 80,000 and 99,999 (9.3%), 79 of them earn over RMB 100,000 (25.2%).In terms of occupation, 134 of them were college and postgraduate students (42.8%), 51 of them weremanagers (16.3%), 37 of them were in education (11.8%), and the rest of them were professionals suchas engineers, physicians, information technologists (29.1%). See Table 1 for demographic profile ofthe subjects.
180

Sustainability 2019, 11, 1233
Table 1. Demographic profile of respondents.
Demographic Categories Frequency %
GenderMale 170 54.3Female 143 45.7
AgeUnder 18 or 18 1 0.319-29 227 72.530-39 71 22.740-49 11 3.550-59 3 1.0
Marital statusSingle 189 60.4Cohabit 25 8.0Married 95 30.4Other 4 1.3
Educational levelSecondary school 2 0.6College or university 48 15.3University graduate 76 24.3Postgraduate and above 187 59.7
Annual income (RMB)Under 20,000 131 41.920,000–39,999 20 6.440,000–59,999 20 6.460,000–79,999 34 10.980,000–99,999 29 9.3100,000 or more 79 25.2
OccupationStudent 134 42.8Engineer 19 6.1Business 51 16.3Education 37 11.8Medicine 10 3.2Information technology 17 5.4Design 4 1.3Scientist 8 2.6Executive 18 5.8Self-employed 6 1.9Other 9 2.9
3.3. Operationalization/Measures
There were nine constructs in the conceptual model and, as such, there were nine scales in thequestionnaire: subjective knowledge about aviation, subjective knowledge about Malaysia, perceivedusefulness of (negative) public opinion about Malaysia Airlines and Malaysia, perceived risk of flyingMalaysia Airlines, perceived risk of visiting Malaysia, attitude toward flying Malaysia Airlines, attitudetoward visiting Malaysia, intention to fly Malaysia Airlines, and intention to visit Malaysia. Some ofthese scales were derived from the focus group interview while others were derived from past studies.Each of the scales is discussed below.
3.3.1. Subjective Knowledge about Aviation
Subjective knowledge about aviation is defined in this study as a person’s perception of theamount of information regarding aviation stored in his or her memory. The scale is derived fromFlynn and Goldsmith’s [22] scale. Subjective knowledge about aviation is measured by a three-item,seven-point Likert scale. The example sample items are “I know pretty much about aviation ”and” Ido not feel very knowledgeable about aviation (reverse score)”.
181

Sustainability 2019, 11, 1233
3.3.2. Subjective Knowledge about Malaysia
Subjective knowledge about Malaysia is defined in this study as a person’s perception of theamount of information regarding Malaysia stored in his or her memory. The scale is derived fromFlynn and Goldsmith’s [22] scale. Subjective knowledge about Malaysia is measured by a three-item,seven-point Likert scale. The example sample items are “I know pretty much about Malaysia ”and” Ido not feel very knowledgeable about Malaysia (reverse score)”.
3.3.3. Usefulness of Public Opinion about Malaysia Airlines
Usefulness of public opinion about Malaysia Airlines is defined in this study as the extent thata person perceives the public opinion about Malaysia Airlines to be useful for his or her decision.The scale is derived from Davis’s [37] perceived usefulness scale. Usefulness of public opinion aboutMalaysia Airlines is measured by a four-item, seven-point Likert scale. The example sample itemsare “I think the public opinion about Malaysia Airlines is very useful” and “Public opinions aboutMalaysia Airlines can help me save time effectively in finding information”.
3.3.4. Perceived Risk of Flying Malaysia Airlines
Perceived risk of flying Malaysia Airlines is defined in this study as a person’s perception of theextent of risk incurred from flying Malaysia Airlines. The scale is derived from Forsythe and Shi’s [60]scale. Perceived risk of flying Malaysia Airlines is measured by a two-item, seven-point Likert scale.The example sample items are “I do not trust that Malaysia Airlines will be safe” and “I do not trustthat Malaysian airlines will provide me with a safe flight”.
3.3.5. Perceived Risk of Visiting Malaysia
Perceived risk of visiting Malaysia Airlines is defined in this study as a person’s perception ofthe extent of risk incurred from visiting Malaysia. The scale is derived from Forsythe and Shi’s [60]scale. Perceived risk of visiting Malaysia is measured by a two-item, seven-point Likert scale. Theexample sample items are “I do not trust that Malaysia will be safe” and “I do not trust that Malaysiawill provide me with a safe tourism environment”.
3.3.6. Attitude toward Flying Malaysia Airlines
Attitude toward flying Malaysia Airlines is defined in this study as a person’s overall favorabilitytoward flying Malaysia Airlines. The scale is derived from Jang and Namkung’s [61] emotionalresponse scale. Attitude toward flying Malaysia Airlines is measured by a three-item, seven-pointLikert scale. The example sample items are “My emotion toward Malaysia Airline is anger” (reversedscale) and “My overall feeling toward flying Malaysia Airlines is distress” (reversed scale).
3.3.7. Attitude toward Visiting Malaysia
Attitude toward visiting Malaysia is defined in this study as a person’s overall favorability towardvisiting Malaysia Airlines. The scale is derived from Jang and Namkung’s [61] emotional response scale.Attitude toward visiting Malaysia is measured by a three-item, seven-point Likert scale. The examplesample items are “My emotion toward visiting Malaysia is anger” (reversed scale) and “My overallfeeling toward visiting Malaysia is distress” (reversed scale).
3.3.8. Intention to Fly Malaysia Airlines
Intention to fly Malaysia Airlines is defined in this study as a person’s propensity to fly toMalaysia by Malaysia Airlines. The scale is derived from Jalilvand et al.’s [62] scale. Intention to flyMalaysia Airlines is measured by a three-item, seven-point Likert scale. The example sample items are“I predict I will fly Malaysia Airlines in the future” and “I would fly Malaysia Airlines rather than anyother airline”.
182

Sustainability 2019, 11, 1233
3.3.9. Intention to Visit Malaysia
Intention to visit Malaysia is defined in this study as a person’s propensity to visit Malaysia forvacation. The scale is derived from Jalilvand et al.’s [62] scale. Intention to visit Malaysia for vacationis measured by a three-item, seven-point Likert scale. The example sample items are “I predict I willvisit Malaysia in the future” and “I would visit Malaysia rather than any other tourism destination”.
For the complete measures, please see Appendix A.
3.4. Data Analysis
To test the hypothesized relationships between the constructs specified in the conceptual model,a structural equation modeling approach was employed. The data were input into PRELIS 2 [63],which generated the covariance matrix for the structural equation analysis. The matrix was then inputinto LISREL 8 [64] to examine the fitness of the model and to test the causal relationships specified inthe conceptual model [65]. The structural equation model is shown in Figure 3.
Figure 3. Structural equation model.
4. Results and Discussion
This section first reports the measurement model results. This is followed by the structural modelresults. Finally, the findings and unsupported hypotheses are discussed.
4.1. Measurement Model Results
The measurement model specifies how the latent variables are measured in terms of the observedvariables. It also describes the measurement properties (reliabilities and validities) of the scalesused. A good measurement model should have high reliabilities, high and statistically significantindicator coefficients (i.e., λxs and λys), and high construct validities (i.e., convergent validity anddiscriminant validity). Note that the construct validities are assessed by the methods suggestedby Fornell and Larcker [66]. Table 2 shows the standardized indicator coefficients, reliabilities, andproportion-of-variance extracted of the constructs in the conceptual model. Each of the measurementproperties is discussed in the following sections.
183

Sustainability 2019, 11, 1233
Table 2. Measurement model results.
Constructs and Indicators Standardized Factor Loadings Reliability/Item R2 Proportion of Variance Extracted
Subjective Knowledge-Aviation (ξ1) 0.815 0.6000X1 (SUBJKNOWL-AVIATION 1) 0.71 a,b 0.51X2 (SUBJKNOWL-AVIATION 2) 0.83 b 0.69X3 (SUBJKNOWL-AVIATION 3) 0.77 b 0.60
Usefulness of Public Opinion (ξ2) 0.875 0.6375X4 (USEFULNESS 1) 0.82 a,b 0.67X5 (USEFULNESS 2) 0.81 b 0.66X6 (USEFULNESS 3) 0.82 b 0.67X7 (USEFULNESS 4) 0.74 b 0.55
Subjective Knowledge-Malaysia (ξ3) 0.887 0.7333X8 (SUBJKNOWL-MALAYSIA 1) 0.80 a,b 0.64X9 (SUBJKNOWL-MALAYSIA 2) 0.90 b 0.82X10 (SUBJKNOWL-MALAYSIA 3) 0.86 b 0.74
Perceived Risk-Flying Malaysia Airlines (η1) 0.899 0.8200Y1 (RISK-FLYING MS 1) 0.86 a,b 0.74Y2 (RISK-FLYING MS 2) 0.95 b 0.90
Perceived Risk-Visiting Malaysia (η2) 0.851 0.7450Y3 (RISK-VISTING MALAYSIA 1) 0.83 a,b 0.69Y4 (RISK-VISTING MALAYSIA 2) 0.89 b 0.80
Attitude toward Flying Malaysia Airlines (η3) 0.774 0.5500Y5 (ATTITUDE-FLYING MS 1) 0.67 a,b 0.45Y6 (ATTITUDE-FLYING MS 2) 0.89 b 0.79Y7 (ATTITUDE-FLYING MS 3) 0.64 b 0.41
Attitude toward Visiting Malaysia (η4) 0.903 0.7533Y8 (ATTIUTDE-VIST MALAYSIA 1) 0.83 a,b 0.68Y9 (ATTIUTDE-VIST MALAYSIA 2) 0.88 b 0.82Y10 (ATTIUTDE-VIST MALAYSIA 3) 0.89 b 0.78
Intention-Flying Malaysia Airlines (η5) 0.896 0.7400Y11 (INTENTION-FLYING MS 1) 0.85 a,b 0.73Y12 (INTENTION-FLYING MS 2) 0.82 b 0.67Y13 (INTENTION-FLYING MS 3) 0.92 b 0.85
Intention-Visiting Malaysia (η6) 0.897 0.7633Y14 (INTENTION-VISIT MALAYSIA 1) 0.90 a,b 0.83Y15 (INTENTION-VISIT MALAYSIA 2) 0.77 b 0.60Y16 (INTENTION-VISIT MALAYSIA 3) 0.93 b 0.87
a Fixed at 1.00 in the non-standardized solution; b p < 0.001, 1-tailed t-test.
4.1.1. Reliability Analysis
The reliability (i.e., Cronbach Alpha) of all the constructs exceeded 0.7, which is the thresholdthat was recommended by Nunnally [67] for exploratory research. Specifically, the reliabilities ofsubjective knowledge about aviation, subjective knowledge about Malaysia, usefulness of publicopinion, perceived risk of flying Malaysia Airlines, perceived risk of visiting Malaysia, attitude towardflying Malaysia Airlines, attitude toward visiting Malaysia, intention to fly Malaysia Airlines, andintention to visit Malaysia are 0.815, 0.887, 0.875, 0.899, 0.851, 0.774, 0.903, 0.896, and 0.897, respectively.
4.1.2. Validity Analysis
All of the constructs have acceptable convergent validity as all of the standardized indicatorcoefficients except two (λy1,3 = 0.67 and λy3,3= 0.64) exceeded the minimum level of 0.7, the thresholdrecommended by Fornell and Lacker [66]. The more conservative proportion-of-variance-extractedindex [66], which indicated that the amount of variance that is captured by a construct in relation tothe amount of variance that is caused by the measurement error, also showed that all of the constructshad a high convergent validity (ranging from 0.5500 to 0.8200). All of the indices exceeded the minimalstandard of 0.50 [66], which indicated that the variance captured by the construct exceeded the variancethat was caused by the measurement error.
The discriminant validity among the nine scales was assessed by comparing theproportion-of-variance-extracted indices of the two constructs in each pair of constructs withthe square of the correlation coefficient between the two constructs [66]. The result of thisassessment supported the discriminant validity of all of the constructs in the conceptual model.Specifically, the proportion-of-variance-extracted indices of any pair of constructs were higher
184

Sustainability 2019, 11, 1233
than the square of the correlation coefficient between the two constructs for every possible pair.The proportion-of-variance-extracted indices of the nine constructs and the correlation matrix of thenine constructs are shown in Table 3.
Table 3. Correlation matrix of the latent variables.
Latent Variables POVEI RISK-A RISK-M A-FM A-VM BI-FM BI-VM SK-A SK-M U-PO
RISK-A 0.8200 1.00RISK-M 0.7450 0.58 1.00A-FM 0.5500 −0.69 −0.58 1.00A-VM 0.7533 −0.40 −0.55 0.47 1.00BI-FM 0.7400 −0.38 −0.32 0.55 0.25 1.00BI-VM 0.7633 −0.30 −0.32 0.40 0.43 0.54 1.00SK-A 0.6000 0.01 −0.09 −0.01 0.04 0.00 0.01 1.00SK-M 0.7333 0.00 −0.14 0.00 0.06 0.00 0.02 0.67 1.00U-PO 0.6375 0.28 0.21 −0.19 −0.13 −0.11 −0.09 0.00 −0.04 1.00
Note:
• RISK-A is Perceived Risk of Flying Malaysia Airlines• RISK-M is Perceived Risk of Visiting Malaysia• A-FM is Attitude towards Flying Malaysia Airlines• A-VM is Attitude towards Visiting Malaysia• BI-FM is Intention to Fly Malaysia Airlines• BI-VM is Intention to Visit Malaysia• SK-A is Subjective Knowledge about Aviation• SK-M is Subjective Knowledge about Malaysia• U-Op is Usefulness of Public Opinion
Based on the above results, it is reasonable to conclude that the measurement model is acceptable.The structural model results are discussed in the next part.
4.2. Structural Model Results
The structural model specifies the causal relations among the latent variables, and describes thecausal effects and the amount of unexplained variance. The initial matter, however, is whether or notthe maximum likelihood estimates for the conceptual model provide a satisfactory fit to the data.
4.2.1. Model Fit
The chi-square value (χ2284 = 723.55, p = 0.0) indicated that the conceptual model did notadequately account for the relationship between the observed sample covariance and the hypotheticalpopulation covariance. Since it is generally agreed that χ2 should be used as a guide rather than anabsolute index of fit [66,68,69], other diagnostics are examined. Bentler and Bonett’s [70] normed fitindex (NFI), Bentler’s [71] comparative fit index (CFI), and Bollen’s [72] incremental fit index (IFI),which are fit indices measuring how much better the model fits compared to a baseline model, wereused to assess the model fit.
According to Bentler and Bonett’s [70] normed fit index, Bentler’s [71] comparative fit index, andBollen’s [49] incremental fit index, the model had marginally acceptable fit. Specifically, the NFI, CFI,and IFI were 0.92, 0.95, and 0.95, respectively. Since the model fit can be considered as marginallyadequate, the structural parameter estimates are discussed next.
4.2.2. Hypothesis Testing
The following hypotheses were proposed in this study: intention to visit Malaysia is positivelyaffected by intention to fly Malaysia Airlines (H12) and attitude toward visiting Malaysia (H9), whichis, in turn, negatively affected by perceived risk of visiting Malaysia (H7) and positively affected byattitude toward flying Malaysia Airlines (H11). Intention to fly Malaysia Airlines is positively affectedby attitude toward flying Malaysia Airlines (H8), which is in turn, negatively affected by perceivedrisk of flying Malaysia Airlines (H6). Perceived risk of flying Malaysia Airlines is negatively affected
185

Sustainability 2019, 11, 1233
by subjective knowledge about aviation (H1) and positively affected by usefulness of public opinion(H2). Finally, perceived risk of visiting Malaysia is negatively affected by subjective knowledge aboutMalaysia (H3) and attitude toward flying Malaysia Airlines (H10), and positively by usefulness ofpublic opinion (H4) and perceived risk of flying Malaysia Airlines (H5).
Results show that all of the hypotheses except H1 (γ1,1 = 0.015, p > 0.10) and H4 (γ2,3 = 0.038,p > 0.10) were supported. Specifically, it is found that Intention to visit Malaysia is positively affectedby intention to fly Malaysia Airlines (β6,5 = 0.48, p = 0.00) and attitude toward visiting Malaysia(β6,4 = 0.43, p = 0.00), which is, in turn, negatively affected by perceived risk of visiting Malaysia(β4,2 = -0.41, p = 0.00) and positively affected by attitude toward flying Malaysia Airlines (β4,3 = 0.25,p = 0.00). Perceived risk of visiting Malaysia is negatively affected by subjective knowledge aboutMalaysia (γ2,2 = -0.12, p < 0.05) and attitude toward flying Malaysia Airlines (β2,3 = -0.43, p = 0.00),and positively by perceived risk of flying Malaysia Airlines (β2,1 = 0.28, p = 0.00). Intention to flyMalaysia Airlines, on the other hand, is positively affected by attitude toward flying Malaysia Airlines(β5,3 = 0.85, p = 0.00), which is in turn, negatively affected by perceived risk of flying Malaysia Airlines(β3,1 = -0.49, p = 0.00). Finally, perceived risk of flying Malaysia Airlines is positively affected byusefulness of public opinion (γ1,3 = 0.34, p = 0.0). Table 4 shows the structural model results.
Table 4. Structural model results.
Independent ConstructDependent Construct
Perceived Risk ofFlying Malaysia
Airlines
Perceived Risk ofVisiting Malaysia
Attitude towardFlying Malaysia
Airlines
Attitude towardVisiting Malaysia
Intention to FlyMalaysiaAirlines
Intention toVisit Malaysia
Subjective Knowledge about Aviation 0.015n.s. - - - - -Subjective Knowledge about Malaysia - −0.12b - - - -
Usefulness of Public Opinion 0.34a 0.052n.s. - - - -Perceived Risk of Flying Malaysia Airlines - 0.28a −0.49a - - -
Perceived Risk of Visiting Malaysia - - - −0.41a - -Attitude toward Flying Malaysia Airlines - −0.43a - 0.25b 0.85a -
Attitude toward Visiting Malaysia - - - - - 0.43a
Intention to Fly Malaysia Airlines - - - - - 0.48a
R2 0.079 0.42 0.48 0.34 0.3 0.38
Chi-square 723.55Degree of freedom 284
p-value 0NFI 0.92CFI 0.95IFI 0.95
a p = 0.0, one-tailed t-test; b p < 0.01, one tailed t-test.
5. Conclusions and Implications
This study is an attempt to investigate the process by which the air disaster of a national airlineaffects tourists’ attitude and intention to fly the airline as well as attitude and intention to visit thecountry by proposing and empirically testing factors affecting the attitude and intention toward flyingthe national airline that experienced air disaster as well as attitude and intention to visit the countryof origin for vacation. The theoretical contribution and managerial implications, limitations, andconcluding summary are discussed below.
5.1. Theoretical Contribution and Managerial Implications
This study contributes to the body of knowledge by demonstrating the process by whichconsumers use to determine if they would fly the airline in question to the country of origin. Specifically,intention to visit the country is positively affect by intention to fly the airline and attitude towardvisiting the country. The effect of perceived risk of flying the airline on attitude toward visiting thecountry is mediated by perceived risk of visiting the country and attitude toward visiting the country.Subjective knowledge about the country significantly reduces perceived risk about visiting the country.Finally, usefulness of public opinion significantly reduces perceived risk of flying the airline.
Although the empirical findings in this study might be or might not be able to generalize toexplain the effect of other types of disaster (e.g., earthquake, kidnapping of tourists) on tourists’
186

Sustainability 2019, 11, 1233
willingness to visit a country, the conceptual framework used in this study (i.e., dual mediation model)might be useful in conceptualizing the effect of the disaster on tourists’ willingness to visit countryin question.
From this study, there are insights for managerial implications for both the airline with airdisaster(s) and the country of origin. For the airline, attitude toward flying the airline is negativelyaffected by perceived risk of flying the airline, which is, in turn, positively affected by perceivedusefulness of public opinion. Since most published public opinions on Malaysia Airline after theair disaster are negative, perceived usefulness of public opinion increases perceived risk of flyingMalaysia Airlines. As such, the airline should try to create positive public opinions about the airlines,for example, by releasing public relations regarding the improved safety and other aspects of theairline to the public on a regular basis.
For the country, perceived risk of flying the airline indirectly affects attitude toward visiting thecountry via attitude toward flying the airline. In other words, higher perceived risk of flying the airlinereduce attitude toward flying the airline, which in turn, reduce attitude toward visiting the country. Assuch, the tourism authority of the company may try to disengage itself from the airline. For example,Malaysia’s Tourism Authority may form strategic partnership with Chinese airlines such as SouthernAirlines for trips to Malaysia. Furthermore, subjective knowledge about the country significantlyreduces perceived risk of visiting the country. As such, the tourism authority of the county may focuson improving the target customers’ knowledge about the country. For example, Malaysia’s TourismAuthority may produce and launch TV programs and publications in both traditional and social mediaabout Malaysia country and culture.
5.2. Limitations
The contributions of this study must be viewed with light of its limitations. There are a fewlimitations in this study. First of all, the research design of this study is sample survey, which is acorrelational study. Although this research design can establish if there are significant relationshipsamong the constructs, it cannot actually establish the causal relationship among them. The directionsin the hypotheses are presumed causes and presumed effects.
Second, perceived risks were the only determinant of attitudes in this study. There can be,however, several other potential determinants of attitude toward the airline (e.g., benefits of the airline,air travel experience) and attitude toward the country (e.g., benefits of visiting the country, touristexperience, country’s frequency of natural disasters) that should be added into the model in thefuture research.
Third, although the subjects in this study seemed to fit the profile of the target customer forvacation overseas, the sampling method was essentially judgmental sampling (i.e., the exploratorystudy data were collected from subjects in a city in China, and survey data were collected from subjectsin China). It is likely that the findings may not be able to generalize to the whole population of potentialcustomers. As such, the findings from this study should be applied with care. Future research may usemore representative subjects (i.e., from more cities in China or from different countries where touristsdid not go through such a serious air disaster as MH370).
Finally, this study is a cross-sectional study. Purchase intention was used as the surrogate variablefor future behavior. Purchase intention may or may not become purchase behavior. Future researchshould consider the use of longitudinal study to test if purchase intention is a good predictor ofpurchase behavior.
5.3. Summary
Results show that all except two hypotheses were supported. The lack of significant negativeeffect of subjective knowledge about aviation on perceived risk of flying Malaysia Airlines may bedue to the fact that most Chinese consumers do not perceive themselves to have any knowledge aboutaviation. The lack of significant positive impact of usefulness of (negative) public opinion on perceived
187

Sustainability 2019, 11, 1233
risk of visiting Malaysia may be due to the fact that most published public opinions are about MalaysiaAirlines rather than Malaysia.
This study is an attempt to understand a rare but significant phenomenon of air disasters byinvesting the process by which the air disaster of a national airline affects foreign tourists’ attitudeand intention to fly the airline as well as their attitude and intention to visit the country. Data fromChinese potential tourists were used to empirically test a conceptual model derived from a qualitativeresearch and literature review. Malaysia Airlines and Malaysia were used as the case for studyingthe phenomenon. Although there are limitations, this study offers some theoretical contribution andmanagerial implications to the area of the impact of air disasters on tourism.
Author Contributions: Conceptualization, T.F., B.P., and S.P.; Formal analysis, T.F. and S.P.; Investigation, T.F.,B.P., and S.P.; Writing—original draft preparation, T.F.; Writing—review and editing, T.F., B.P., S.P., and L.H.;Supervision, S.P. and L.H.; Funding acquisition, B.P.
Funding: This research was funded by “The National Natural Science Foundation of China Youth Program”,grant number 71804119.
Conflicts of Interest: The authors declare no conflict of interest.
Appendix A
Table A1. Adapted scale of construct.
Construct Adapted Scale Scale Reference
Subjective knowledge about aviation
1. I know pretty much about aviation knowledge.2. I do not feel very knowledgeable about aviation. *3. Among my circle of friends, I’m one of the
“experts” on aviation knowledge.
Flynn and Goldsmith (1999)
Subjective knowledge about Malaysia
1. I know pretty much about Malaysia.2. I do not feel very knowledgeable about Malaysia. *3. Among my circle of friends, I’m one of the
“experts” on Malaysia.
Flynn and Goldsmith (1999)
Usefulness of public opinion
1. I think public opinion about Malaysia Airlinesis useful.
2. Public opinions about Malaysia Airlines can helpme save time effectively in finding information.
3. Public opinions about Malaysia Airlines can helpme get useful information.
4. Public opinions about Malaysia Airlines can helpme get information quickly.
Davis (1989)
Perceived risk of flying Malaysian airlines
1. I do not trust that Malaysian airlines will be secure.2. I do not trust that Malaysian airlines will provide
me with a safe flight.Forsythe and Shi (2003)
Perceived risk of visiting Malaysia
1. I do not trust that Malaysia will be secure.2. I do not trust that Malaysia will provide me with a
safe tourism environment.Forsythe and Shi (2003)
Attitude toward flying Malaysian Airlines
1. My overall feeling toward flying Malaysia Airlinesis anger.*
2. My overall feeling toward flying Malaysia Airlinesis distress.*
3. My overall feeling toward flying Malaysia Airlinesis fear.*
Jang and Namkung (2009)
Attitude toward visiting Malaysia
1. My overall feeling toward visiting Malaysia isanger.*
2. My overall feeling toward visiting Malaysia isdistress.*
3. My overall feeling toward visiting Malaysia isfear.*
Jang and Namkung (2009)
188

Sustainability 2019, 11, 1233
Table A1. Cont.
Construct Adapted Scale Scale Reference
Intention to fly Malaysian Airlines
1. I predict I will fly Malaysia Airlines in the future.2. I would fly Malaysia Airlines rather than any
other airline.3. If everything goes as I think, I will plan to fly
Malaysia Airlines in the future.
Jalilvand et al. (2012)
Intention to visit Malaysia
1. I predict I will visit Malaysia in the future.2. I would visit Malaysia rather than any other
tourism destination.3. If everything goes as I think, I will plan to visit
Malaysia in the future.
Jalilvand et al. (2012)
Note: * is reversed score.
References
1. Aviation benefits beyond border (n.d.). Available online: https://aviationbenefits.org/social-development/tourism/ (accessed on 24 November 2018).
2. Lu, H. Interview: Malaysia ramps up efforts to attract Chinese tourists. Xinhuanet. 2017. Available online:http://www.xinhuanet.com/english/2017-10/13/c_136676857.htm (accessed on 13 October 2017).
3. Toursim becomes Malaysia’s sixth economic pillar. 2015. Available online: http://my.xinhuanet.com/2015-08/04/c_128090838.htm (accessed on 12 February 2019).
4. Jang, B. After two aviation disasters, Malaysia Airlines will struggle to survive. The Globe and Mail. 2014.Available online: https://www.theglobeandmail.com/news/world/after-two-aviation-disasters-malaysia-airlines-will-struggle-to-survive/article19669404/ (accessed on 17 July 2018).
5. Zeithaml, V.A. Consumer perceptions of price, quality, and value: A means-end model and synthesis ofevidence. J. Mark. 1988, 52, 2–22. [CrossRef]
6. MacKenzie, S.B.; Lutz, R.J.; Belch, G.E. The role of attitude toward the ad as a mediator of advertisingeffectiveness: A test of competing explanations. J. Mark. Res. 1986, 23, 130–143. [CrossRef]
7. Lutz, R.J.; Swasy, J.L. Integrating cognitive structure and cognitive response approaches to monitoringcommunications effects. Adv. Consum. Res. 1977, 4, 363–371.
8. Petty, R.E.; Cacioppo, J.T. The elaboration likelihood model of persuasion. Adv. Exp. Soc. Psychol. 1986, 19,123–205. [CrossRef]
9. Wongpitch, S.; Minakan, N.; Powpaka, S.; Laohavichien, T. Effect of corporate social responsibility motiveson purchase intention model: An extension. Kasetsart J. Soc. Sci. 2016, 37, 30–37. [CrossRef]
10. Homer, P.M. The mediating role of attitude toward the ad: Some additional evidence. J. Mark. Res. 1990, 27,78–86. [CrossRef]
11. Karson, E.J.; Fisher, R.J. Predicting intentions to return to the Web site: Extending the dual mediationhypothesis. J. Interact. Mark. 2005, 19, 2–14. [CrossRef]
12. López, I.; Ruiz, S. Explaining website effectiveness: The hedonic–utilitarian dual mediation hypothesis.Electron. Commer. Res. Appl. 2011, 10, 49–58. [CrossRef]
13. Goldsmith, R.E.; Lafferty, B.A.; Newell, S.J. The impact of corporate credibility and celebrity on consumerreaction to advertisements and brands. J. Advert. 2000, 29, 43–54. [CrossRef]
14. Alba, J.W. The effects of product knowledge on the comprehension, retention, and evaluation of productinformation. Adv. Consum. Res. 1983, 10, 577–580. [CrossRef]
15. Brucks, M. The effects of product class knowledge on information search behavior. J. Consum. Res.1985, 12, 1–16. [CrossRef]
16. Sujan, M. Consumer knowledge: Effects on evaluation strategies mediating consumer judgments. J. Consum.Res. 1985, 12, 31–46. [CrossRef]
17. Rao, A.R.; Monroe, K.B. The moderating effect of prior knowledge on cue utilization in product evaluations.J. Consum. Res. 1988, 15, 253–264. [CrossRef]
18. Klerck, D.; Sweeney, J.C. The effect of knowledge type on consumer perceived risk and adoption of geneticallymodified foods. Psychol. Mark. 2007, 24, 171–193. [CrossRef]
189

Sustainability 2019, 11, 1233
19. Hadar, L.; Sood, S.; Fox, C.R. Subjective knowledge in consumer financial decisions. J. Mark. Res. 2013, 50,303–316. [CrossRef]
20. Oh, K.; Abraham, L. Effect of knowledge on decision making in the context of organic cotton clothing. Int. J.Consum. Stud. 2016, 40, 66–74. [CrossRef]
21. Park, C.W.; Mothersbaugh, D.L.; Feick, L. Consumer knowledge assessment. J. Consum. Res. 1994, 21, 71–82.[CrossRef]
22. Flynn, L.R.; Goldsmith, R.E. A short, reliable measure of subjective knowledge. J. Bus. Res. 1999, 46, 57–66.[CrossRef]
23. Cole, C.; Gaeth, G.; Chakraborty, G.; Levin, I. Exploring the relationships among self-reported knowledge,objective knowledge, product usage, and consumer decision making. In Advances in Consumer Research;Sherry, J.F., Sternthal, B., Eds.; Association for Consumer Research: Provo, UT, USA, 1992; p. 191, ISBN00989258.
24. Raju, P.S.; Lonial, S.C.; Mangold, W.G. Differential effects of subjective knowledge, objective knowledge, andusage experience on decision making: An exploratory investigation. J. Consum. Psychol. 1995, 4, 153–180.[CrossRef]
25. Selnes, F.; Gronhaug, K. Subjective and objective measures of product knowledge contrasted. Adv. Consum.Res. 1986, 13, 67–71.
26. Jin, H.J.; Han, D.H. Interaction between message framing and consumers’ prior subjective knowledgeregarding food safety issues. Food Policy 2014, 44, 95–102. [CrossRef]
27. Fiske, C.A.; Luebbehusen, L.A.; Miyazaki, A.D.; Urbany, J.E. The relationship between knowledge andsearch: It depends. In Advances in Consumer Research; Allen, C.T., John, D.R., Eds.; Association for ConsumerResearch: Provo, UT, USA, 1994; Volume 21, pp. 43–50, ISBN 17444798.
28. Zhang, L.; Chen, L.; Wu, Z.; Zhang, S.; Song, H. Investigating young consumers’ purchasing intention ofgreen housing in China. Sustainability 2018, 10, 1044. [CrossRef]
29. Moorman, C.; Diehl, K.; Brinberg, D.; Kidwell, B. Subjective knowledge, search locations, and consumerchoice. J. Consum. Res. 2004, 31, 673–680. [CrossRef]
30. Perrouty, J.F.; d’Hauteville, F.; Lockshin, L.S. The influence of wine attributes on region of origin equity:An analysis of the moderating effect of consumer’s perceived expertise. Agribusiness 2006, 22, 323–341.[CrossRef]
31. Rodrigues, J.F.; Pereira, R.C.; Silva, A.A.; Mendes, A.O.; Carneiro, J.S. Sodium content in foods: Brazilianconsumers’ opinions, subjective knowledge and purchase intent. Int. J. Consum. Stud. 2017, 41, 735–744.[CrossRef]
32. Blackwell, R.D.; Miniard, P.W.; Engel, J.F. Consumer Behavior, 9th ed.; Harcourt College Publishers: FortWorth, TX, USA, 2001; ISBN 9780324271973.
33. East, R.; Hammond, K.; Lomax, W. Measuring the impact of positive and negative word of mouth on brandpurchase probability. Int. J. Res. Mark. 2008, 25, 215–224. [CrossRef]
34. Paswan, A.K.; Kantamneni, S.P. Public opinion and franchising in an emerging market. Asia Pac. J.Mark. Logist. 2004, 16, 46–61. [CrossRef]
35. Sparks, B.A.; Browning, V. The impact of online reviews on hotel booking intentions and perception of trust.Tour. Manag. 2011, 32, 1310–1323. [CrossRef]
36. Herrero, A.; Martín, H.S.; Hernández, J.M. How online search behavior is influenced by user-generatedcontent on review websites and hotel interactive websites. Int. J. Contemp. Hosp. Manag. 2015, 27, 1573–1597.[CrossRef]
37. Davis, F.D. Perceived usefulness, perceived ease of use, and user acceptance of information technology.MIS Quarterly 1989, 13, 319–340. [CrossRef]
38. Davis, F.D. User acceptance of information technology: System characteristics, user perception, andbehavioral impacts. Int. J. Man–Mach. Stud. 1993, 38, 475–487. [CrossRef]
39. Valkenburg, P.M.; Peter, J. Preadolescents’ and adolescents’ online communication and their closeness tofriends. Dev. Psychol. 2007, 43, 267–277. [CrossRef] [PubMed]
40. Pthanasthassis, A.; Knolle, F. Exploring the adoption and processing of online holiday reviews: A groundedtheory approach. Tour. Manag. 2011, 32, 215–224. [CrossRef]
41. Casaló, L.V.; Flavián, C.; Guinalíu, M.; Ekinci, Y. Avoiding the dark side of positive online consumer reviews:Enhancing its usefulness for high risk-averse travelers. J. Bus. Res. 2015, 68, 1829–1835. [CrossRef]
190

Sustainability 2019, 11, 1233
42. Bauer, R.A. Consumer behavior as risk taking. In Proceedings of the 43rd National Conference of theAmerican Marketing Association, Chicago, IL, USA, June 1960; pp. 389–398.
43. Mitchell, V.W. Consumer perceived risk: Conceptualisations and models. Eur. J. Mark. 1999, 33, 163–195.[CrossRef]
44. Antony, S.; Lin, Z.; Xu, B. Determinants of escrow service adoption in consumer-to-consumer online auctionmarket: An experimental study. Decis. Support Syst. 2006, 42, 1889–1900. [CrossRef]
45. Pappas, N. Marketing strategies, perceived risks, and consumer trust in online buying behaviour. J. Retail.Consum. Serv. 2016, 29, 92–103. [CrossRef]
46. Jacoby, J.; Kaplan, L.B. The Components of perceived risk. In Proceedings of the Third Annual Conference ofthe Association for Consumer Research, Chicago, IL, USA, November 1972; pp. 382–393.
47. Mitchell, A.A.; Olson, J.C. Are product attribute beliefs the only mediator of advertising effects on brandattitude? J. Mark. Res. 1981, 18, 318–332. [CrossRef]
48. Ajzen, I.; Fishbein, M. Understanding Attitudes and Predicting Social Behavior; Prentice-Hall: Englewood Cliffs,NJ, USA, 1980; ISBN 9780139364358.
49. Fishbein, M.; Ajzen, I. Belief, Attitude, Intention, and Behavior; Addison-Wesley: Reading, MA, USA, 1975;ISBN 0201020890.
50. Wu, P.C.; Wang, Y.C. The influences of electronic word-of-mouth message appeal and message sourcecredibility on brand attitude. Asia Pac. J. Mark. Logist. 2011, 23, 448–472. [CrossRef]
51. Keller, K.L.; Lehmann, D.R. Brands and branding: Research findings and future priorities. Mark. Sci. 2006, 25,740–759. [CrossRef]
52. Kudeshia, C.; Kumar, A. Social eWOM: Does it affect the brand attitude and purchase intention of brands?Manag. Res. Rev. 2017, 40, 310–330. [CrossRef]
53. Summers, T.A.; Belleau, B.D.; Xu, Y. Predicting purchase intention of a controversial luxury apparel product.J. Fash. Mark. Manag. 2006, 10, 405–419. [CrossRef]
54. Abzari, M.; Ghassemi, R.A.; Vosta, L.N. Analysing the effect of social media on brand attitude and purchaseintention: The case of Iran Khodro company. Procedia-Soc. Behav. Sci. 2014, 143, 822–826. [CrossRef]
55. Ariffin, S.K.; Mohan, T.; Goh, Y.N. Influence of consumers’ perceived risk on consumers’ online purchaseintention. J. Res. Interact. Mark. 2018, 12, 309–327. [CrossRef]
56. Ting, H.; de Run, E.C. Attitude towards advertising: A young generation cohort’s perspective. Asian J.Bus. Res. 2015, 5, 69–82. [CrossRef]
57. Shen, G.C.C. Users’ adoption of mobile applications: Product type and message framing’s moderating effect.J. Bus. Res. 2015, 68, 2317–2321. [CrossRef]
58. Duarte, P.; Amaro, S. An integrative model of consumers’ intentions to purchase travel online. Tour. Manag.2015, 46, 64–79. [CrossRef]
59. Loehlin, J.C. Latent Variable Models: An Introduction to Factor, Path, and Structural Equation Analysis; Routledge:New York, NY, USA, 2004; ISBN 9780805849103.
60. Forsythe, S.M.; Shi, B. Consumer patronage and risk perceptions in Internet shopping. J. Bus. Res. 2003, 56,867–875. [CrossRef]
61. Jang, S.; Namkung, Y. Perceived quality, emotions, and behavior Intentions: Application of an extendedMehrabian-Russell model to restaurants. J. Bus. Res. 2009, 62, 451–460. [CrossRef]
62. Jalilvand, M.R.; Samiei, N.; Dini, B.; Manzari, P.Y. Examining the structural relationships of electronic word ofmouth, destination image, tourist attitude toward destination and travel intention: An integrated approach.J. Destin. Mark. Manag. 2012, 1, 134–143. [CrossRef]
63. Jöreskog, K.G.; Sörbom, D. PRELIS: A Program for Multivariate Data Screening and Data Summarization, 2nd ed.;Scientific Software, Inc.: Chicago, IL, USA, 1988; ISBN 1563211858.
64. Jöreskog, K.G.; Sörbom, D. Lisrel 8: Structural Equation Modeling with the SIMPLIS Command Language;Scientific Software, Inc.: Chicago, IL, USA, 1993; ISBN 0805814418.
65. Powpaka, S. How market orientation affects female service employees in Thailand. J. Bus. Res. 2006, 59,54–61. [CrossRef]
66. Fornell, C.; Larcker, D.F. Evaluating structural equation models with unobservable variables andmeasurement error. J. Mark. Res. 1981, 18, 39–50. [CrossRef]
67. Nunnally, J.C. Psychometric Theory; McGraw-Hill: New York, NY, USA, 1978; ISBN 9781441910059.
191

Sustainability 2019, 11, 1233
68. Bagozzi, R. Attitudes, intentions, and behavior: A test of some key hypotheses. J. Personal. Soc. Psychol.1981, 41, 607–627. [CrossRef]
69. Bearden, W.O.; Sharma, S.; Teel, J.E. Sample size effects upon Chi-Square and other statistics used inevaluating causal models. J. Mark. Res. 1982, 19, 425–430. [CrossRef]
70. Bentler, P.M.; Bonett, D.G. Significance tests and goodness of fit in the analysis of covariance structures.Psychol. Bull. 1980, 88, 588–606. [CrossRef]
71. Bentler, P.M. Comparative fit indexes in structural models. Psychol. Bull. 1990, 107, 238–246. [CrossRef][PubMed]
72. Bollen, K.A. A new incremental fit index for general structural equation models. Sociol. Methods Res. 1989, 17,303–316. [CrossRef]
© 2019 by the authors. Licensee MDPI, Basel, Switzerland. This article is an open accessarticle distributed under the terms and conditions of the Creative Commons Attribution(CC BY) license (http://creativecommons.org/licenses/by/4.0/).
192

MDPISt. Alban-Anlage 66
4052 BaselSwitzerland
Tel. +41 61 683 77 34Fax +41 61 302 89 18
www.mdpi.com
Sustainability Editorial OfficeE-mail: [email protected]
www.mdpi.com/journal/sustainability


MDPI St. Alban-Anlage 66 4052 Basel Switzerland
Tel: +41 61 683 77 34 Fax: +41 61 302 89 18
www.mdpi.com ISBN 978-3-03928-683-6