Developing Identities and Branding Elements in Romanian Tourism
Upload
khangminh22Category
view
1download
0
I
Effective Elements on E-Marketing strategy in Tourism Industry
(Case study Germany and Iran Airlines, Tour Operator and Chain Hotels)
By:
Seyed Siamak Mousavi
Dissertation A dissertation submitted in partial fulfillment of the requirements for the degree of
Doctor Phil. of Tourism Focus on Tourism Development and Destination Management
University Trier
Faculty VI
Department of Geography and Tourism
Supervisor: Ao. Univ. Prof. Dr. Andreas Kagermeier Trier, July 2012

II
Acknowledgment
I would like to express my deep and sincere gratitude to my supervisor, Professor.
Dr. Andreas kagermeier for converting me into a potential tourism and for his guidance. I am deeply grateful to him. His valuable insight and guidance through various drafts of the thesis helped me to keep focused. Her wide knowledge and her logical way of thinking have been of great value for me. Her understanding, encouraging and personal guidance have provided a good basis for the present thesis.
I wish to express my warm and sincere thanks to Head of the Department and faculty in Trier University. I am grateful to my committee members, who gave me excellent suggestions and constructive criticisms. I also wish to thank all the people who work in the Trier University as secretariat, international student center and PhD student center.
My warm and sincere thanks are due to all the experts and Delphi groups' member In Germany and Iran who without their professional views and opinions during interviews and three surveys, this research could not be done and had any value. More than I am Thanks to all my friends and colleagues for their support.
I wish to thank my parents and family, my brother (Jahangir). but Special thanks to my mother (Roghayeh Bakhtiari) who was not here but all the time with me and supported me financial and … and without her support and persuasion during my difficult moments, I couldn't finish it and undergo a lot of problem in abroad. I gift and donate it to my mother and I tried to set an example for you. I love you.

III
Table of Contents List of Tables... ...................................................................................................................................... IX
List of Figure ... ..................................................................................................................................... XII
Abstract ... .............................................................................................................................................. XVI
1-First chapter: Literature of Research... ............................................................................................... 0 1-1-Introduction ... ................................................................................................................................. 1
1-2-Tourism ... ....................................................................................................................................... 1
1-2-1- Word tourism statistic………………………………………………………………….5 1-2-2- Tourism developing..……………………………………………………………...…...8 1-2-3- Tourism sustainable development strategy………………………………………..…..10
1-3- Strategy... ....................................................................................................................................... 12
1-3-1- Strategy and Structure………………………………………………………………..13 1-3-2- Tourism Strategy……………………………………………………………………..15 1-3-3- Marketing Strategy…………………………………………………………………..17
1-4-E-Marketing ... ................................................................................................................................ 18
1-4-1- Marketing mix and internet…………………………………………………………..20 1-4-2- Influence the E-systems in marketing……………………………………………….. 24 1-4-3- E-Marketing strategy……………………………………………….………………...25 1-4-4- Synergy in tourism with E-Marketing strategy………………….…………………... 28 1-4-5- E-marketing and knowledge management……………………….………………….. 30 1-4-6- E-Marketing security…………………………………….………………………….. 31
1-5-Tourism E-Marketing ... ................................................................................................................. 32
1-5-1- E-Tourism…………………………………………………………………………....33 1-5-2- E-Booking system…………………………………………………………...……… 35 1-5-3- Geographical Information System (GIS)……………………………………………. 35 1-5-4- Tourism integration with e-marketing………………………………………………. 35 1-5-5- The CRM and E-Tourism …………………………………………………….……..39 1-5-6- E-Marketing challenges ……………………………………………………….……..41
1-6-Tourism E-Marketing Strategy ... ................................................................................................... 44

IV
1-6-1- Strategy Important for tourism e-marketing………………………………………….46 1-6-2- Web-CRM Strategy………………………………………………………………….48
1-6-2-1- Web Customer Analysis…………………………….……………………..48 1-6-2-2- Web-Design………………………………………………………………. 49 1-6-2-3- Web-Promotion……………………………………………………………49 1-6-2-4- Web Customer Communications…………………………………………..49 1-6-2-5- Web-Price……………………………………………...………………….50 1-6-2-6- Web-CRM……………………………………………...…………….……50
1-6-3- Customer Centric Strategy……………………………………...………….………..51 1-6-4- Relationship marketing strategy …………………………………...………….……..55 1-6-5- Database marketing strategy ……………………………………..………….………58 1-6-6- Competitive marketing strategy……………………………..……...………………..60
1‐6‐6‐1‐ Product Strategy……….………………………………..………………..62 1‐6‐6‐2‐ Price Strategy……………..……………………………..………………..63 1‐6‐6‐3‐ Promotion Strategy……………………………………..………...……...63 1‐6‐6‐4‐ Place Strategy…..……………......................................................................63
1-7- E-M-S in different segmentation of tourism industry... ............................................................... 65
1-7-1- E-Marketing Strategy in tour operators……………………………………………..65 1-7-2- Chain Hotels E-Marketing strategy…………………………………………………69 1-7-3- Airlines E-Marketing strategy………………………………………………………73
1-7-3-1- Easy Jet………………………………………………………………….77 1-7-3-2- Ryan air…………………………………………………...…………….78
1-8- Analysis, formulation, Implementation ... .................................................................................... 80
1-8-1- Analyze……………………………………………………………………………...81 1-8-1-1- Internal Forces …………………………………………………………….82 1-8-1-2- External Forces…………………………………………………………….84 1-8-1-3- Customers…………………………………………………………………..85 1-8-1-4- Employees……………………………………………………………….....86 1-8-1-5- Web site…………………………………………………………………….87 1-8-1-6- Competitive advantage……………………………………………………..88
1-8-2- Formulation…………………………………………………………………………89 1-8-3- Implementation…………………………………………………………….………..91 1-8-4- Effective Elements…………………………………………………………….…….97
1-9- Criteria of the research... ............................................................................................................... 102
2- Second chapter: Iran and Germany... ................................................................................................. 107
2-1- Introduction... ................................................................................................................................. 108
2-2- Tourism in Germany... .............................................................................................................................. 108
2-2-1- History …………………………………………………………………………….110 2-2-2- German Government Tourism Policy……………………………………………..111 2-2-3- Tourism value crating network in Germany………………………………………114 2-2-4- Different tourism booking channels in Germany………………...……………….115 2-2-5- Chain hotels and E-Marketing in Germany……………………………………….116
2-2-5-1- Steigenboger hotels……………………………………...……………117

V
2-2-5-2- Accor hotels…………………………………………………...……...120 2-2-5-3- NH hotels……………………………………………………...……...127 2-2-5-4- HRS hotel …………………………………………………………….128 2-2-5-5- Hilton hotel……………………………………………………………129
2-2-6- Tour Operator and E-Marketing in Germany……………………………...……...134 2-2-6-1- TUI………………………………………………………………...…..135 2-2-6-2- Fox tours……………………………………………………………….141 2-2-6-3- DERTOUR……………………………………………………………..144 2-2-6-4- Berge und Meer…………………………………………………...…..147 2-2-6-5- FTI tour ………………………………………………………………..148 2-2-6-6- Thomas cook…………………………………………………………..149
2-2-7- Air Lines and E-Marketing in Germany…………………………………………..154 2-2-7-1- Lufthansa………………………………………………………...…...154 2-2-7-2- Air Berlin……………………………………………………………...158
2-3- Tourism in Iran... ....................................................................................................................................... 160
2-3-1- Geography and nature……………………………………………………...……..161 2-3-2- History…………………………………………………………………………….162 2-3-3- Attractions…………………………………………………………………………164 2-3-4- E-Marketing strategy in Iran Tourism Industry…………………………………...167 2-3-5- E-Marketing barriers in Iran tourism industry………………………………...….168 2-3-6- Chain Hotels and E-Marketing in Iran…………………………………………….170
2-3-6-1- Hotel Homa……………….…………………………………...……….172 2-3-6-2- Hotel Persian…………………………………………………...………173 2-3-6-3- Hotel kosar……………………………………………………...……...175 2-3-6-4- Hotel lale group………………………………………………………...175 2-3-6-5- Pars Hotels Group………………………………………………...……176 2-3-6-6- Hotel Mehr………………………………………………………...…...179
2-3-7- Tour Operator and E-Marketing in Iran in the Iran…………………………...…..180 2-3-7-1- Sand bad………………………………………………………...……...180 2-3-7-2- Ghoghnos………………………………………………………...…….181 2-3-7-3- Marko polo………………………………………………………...…...182 2-3-7-4- Ely Gasht………………………………………………………...……..183 2-3-7-5- Ghasre shirin……………………………………………………………185 2-3-7-6- Sahel Gasht……………………………………………………………..185 2-3-7-7- Persepolis……………………………………………………………….186
2-3-8- Airline and E-Marketing in Iran………………….………………………………..187 2-3-8-1- Iran air…………………………………………………………………..187 2-3-8-2- Aseman (sky) Airline…………………………………………………...192 2-3-8-3- Mahan Air ……………………………………………………………...194
2-3-9- Tourism and internet situation in Germany and Iran……………………………...194
3- Third chapter: Research Methods... .................................................................................................... 197
3-1- Introduction... ................................................................................................................................. 198
3-2- Aims & Objectives (Research Purpose)... .................................................................................... 200

VI
3-3- Research Strategy ......................................................................................................................... 200
3-4- Case study ... .................................................................................................................................. 201
3-5- Research method... ......................................................................................................................... 203
3-5-1- Sample Selection …………………………………………………………...…….206 3-5-2- Data collecting methods…………………………………………………………..207 3-5-3- Secondary Research ……………………………………………………………...207 3-5-4- Primary Research …………………………………………………………...……208 3-5-5- Data Analyzing Techniques ………………………………………………...…...208 3-5-6- Data Reduction …………………………………………………………………...209 3-5-7- Data Display ………………………………………………………………...……209 3-5-8- Conclusion Drawing and Verification …………………………………...……...209
3-6- Delphi method... ............................................................................................................................ 210
3-6-1- History of the Method…………………………………………………………….213 3-6-2- Delphi Process ………………………………………………………………........213 3-6-3- Difficulty of Research ……………………………………………………………218 3-6-4- Number of Participants …………………………………………………………..218 3-6-5- Design the Questionnaires and Question……………………………………...…219 3-6-6- Questions……………………………………………………………………...…..221 3-6-7- Number of Rounds ……………………………………………………………….223 3-6-8- Discussion …...……………………………………………………………………...223 3-6-9- Mode of Interaction……………………………………………………………….224 3-6-10- Strengths and Weaknesses……………………………………………………….. 224 3-6-11- Delphi method critics …………………………………………………………….226
3-7-Data Analysis ... .............................................................................................................................. 226 3-7-1- Quality Standards…………………………………………………………………227
3‐7‐1‐1‐ Validity………………………………………...…………………...……228
3‐7‐1‐2‐ Reliability …………………..……………………………………...…….228 3-7-2- Others characteristics………………………………………………………...…...230
3-7-2-1- Friedman Test (Ranking)…………………………………………...…..230 3-7-2-2- Independent samples T-test………………………………………...…..231 3-7-2-3- Tests of Normality ………………………………………………...…...233
3-8-The AHP Method ... ....................................................................................................................... 235
VII
3-8-1- AHP analytic hierarchy process…………………………………………...……..237 3-8-2- Processes……………………………………………………………………...…..238
3-8-2-1- Step 1 ……………………………………………………………...……239 3-8-2-2- Step 2 ……………………………………………………………...……239 3-8-2-3- Step 3………………………………………………………………...….241 3-8-2-4- Step 4 ………………………………………………………………...…241
3-8-3- AHP functions………………………………………………………………...…..242 3-8-4- Axioms and basic principles of the AHP …………………………………….....243 3-8-5- Advantages, disadvantages and criticism of AHP……………………………….244 3-8-6- Judgment in AHP method ………………………………………………………..246
3-9- Comparing the elements and their priorities ............................................................................... 247 3-10- online survey ............................................................................................................................. 249 3-11- Problems and bottlenecks of the research. .................................................................................. 251
4- Fourth chapter: Data Finding and Analyze ... ................................................................................... 253 4-1- Introduction... ................................................................................................................................. 254 4-2- Research method and process description. ................................................................................... 255
4-2-1- Delphi method………………………………………………………………………...256 4-2-2- Delphi Studies in the Tourism Research ……………………………………………..256 4-2-3- Panel members individual characteristic and Selection………………………………258
4-3- Detail of Delphi group ................................................................................................................. 260 4-4- Web based Surveys. ....................................................................................................................... 263 4-5- Round One .................................................................................................................................... 265
4-5-1- First questionnaire (open Questionnaire) …………………………………………….266 4-5-2- Round one results …………………………………………………………………….266 4-5-3- Round Two …………………………………………………………………………...272 4-5-4- Round Two Results…………………………………………………………………...273
4-5-4-1- Question two and three……………………………………………………..273 4-5-4-2- Ranking Elements…………………………………………………………..277 4-5-4-3- Question four……………………………………………………………….277
4-5-4-3-1- Cronbach Reliability Test………………………………………278 4-5-4-3-2- T-Test compare ………………………………………………...281 4-5-4-3-3- Friedman ranking Test………………………………………….284 4-5-4-3-4- Test of normality …………………………………………...…286
4-5-4-4- Question five ……………………………………………………………….288 4-5-4-4-1- Cronbach Reliability Test ……………………………………...288 4-5-4-4-2- T Test Motivation Factors………………………………………290 4-5-4-4-3- Friedman Test (Ranking) ……………………………………...293 4-5-4-4-4- Test of normality ………………………………………………295
4-5-4-5- Question six………………………………………………………………...297 4-5-4-5-1- Cronbach Reliability Test ……………………………………...298 4-5-4-5-2- T Test Motivation Factors…………………………………...…300 4-5-4-5-3- Friedman Test (Ranking)……………………………………….302 4-5-4-5-4- Test of normality …………………………………………...….304
4-5-4-6- Question seven ………………………………………………………...…..306 4-5-4-6-1- Environmental Effective Elements …………………………….306
4-5-4-6-1-1- Cronbach Reliability Test ………………………..307 4-5-4-6-1-2- T Test Motivation Factors ………………………..309 4-5-4-6-1-3- Friedman Test (Ranking)…………………...…….312

VIII
4-5-4-6-1-4- Test of normality……………………...…………. 314 4-5-4-6-2- Company Effective Elements…………………………………..316
4-5-4-6-2-1- Cronbach Reliability Test ………………………..317 4-5-4-6-2-2- T Test Motivation Factors ………………...…….319 4-5-4-6-2-3- Friedman Test (Ranking) ……………...…………322 4-5-4-6-2-4- Test of normality …………………………………324
4-5-4-6-3- Customers'' Effective Elements ………………………………..326 4-5-4-6-3-1- Test of normality………………………………...326 4-5-4-6-3-2- T Test Motivation Factors. ……………...……...329 4-5-4-6-3-3- Friedman Test (Ranking) ……………………….332 4-5-4-6-3-4- Test of normality ………………………………..334
4-5-4-7- Question eight ……………………………………………………………...336 4-5-4-7-1- Test of normality ……………………………………...………337 4-5-4-7-2- T Test Motivation Factors ……………………………………..339 4-5-4-7-3- Friedman Test (Ranking) ……………………………………...341 4-5-4-7-4- Test of normality ……………………………………...………343
4-5-4-8- The effective elements groups label ranking ………………………………344 4-6- Round Three ................................................................................................................................. 347
4-6-1- AHP method ………………………………………………………………………..347 4-6-1-1- The process of AHP method …………………………………………….348 4-6-1-2- Group decision making …………………………………………………..348 4-6-1-3- Group taking pair’s comparison ………………………………………….348 4-6-1-4- Developing hierarchy……………………………………………...……..349 4-6-1-5- Explanation of taking pairs comparison operation………………...……..350 4-6-1-6- Determination of final scores ……………………………………...…….351
4-6-2- Online survey for AHP questionnaire ……………………………………...………352 4-6-3- AHP Results analyze ……………………………………………………………….352
4-6-3-1- Consistency of Judgments for Germany and Iran ………………..…….. 353 4-6-3-2- Research hypothesis test in Germany and Iran …………………..….….358 4-6-3-3- Elements Important Priority in Iran ………………………………...……359
4-6-3-3-1- Environmental Effective Elements priorities in Iran …….…..359 4-6-3-3-2- Firms' Elements priorities in Iran ……………………...…….360 4-6-3-3-3- Customers Satisfaction Elements priorities in Iran ……...…..362 4-6-3-3-4- Criterions priorities with AHP in Iran ………………...……..363 4-6-3-3-5- Tourism Activities priorities in Iran ……………………..…..364
4-6-3-4- Elements Important Priority with AHP in Germany …………………….366 4-6-3-4-1- Environmental Elements priorities in Germany ……………366 4-6-3-4-2- Firms' Elements priorities in Germany …………………….367 4-6-3-4-3- Customers Satisfaction Elements priorities in Germany ......369 4-6-3-4-4- Criterions priorities with AHP in Germany …………..…....371 4-6-3-4-5- Tourism Activities priorities in I Germany …………..….…372
5. Conclusion and Recommendations ... ........................................................................................................ .374 5-1- Introduction... .................................................................................................................................... ..375 5-2- Finding Summery ... ........................................................................................................................ ..376 5-3- conclusion ... ..................................................................................................................................... ..379 5-4- Recommendation ... .......................................................................................................................... ..381 Bibliography ... ......................................................................................................................................... ..384
Appendix ... ................................................................................................................................................ . 395

IX
List of Tables Table 1.1: Types of tourism ……………………………………………………………………………...4
Table 1-2: Word arrival tourism in 2010 and its forecasting……………………………………………...7
Table 1-3: 10 top tourism arrivals centauries in 2009 ……………………………………………………7
Table 1-4: Main differences between the old media channels and the Internet…………………………...20
Table 1-5: E-tourism marketing process………………………………………………………………….39
Table 1-6: CRM system requires changes………………………………………………………………...41
Table 1-7: main customer-oriented strategies based on CLV analysis……………………………………54
Table 1-8: different strategy according of Availability and Strategic value………………………………60
Table 1-9: E-Business Strategies for Competitive Advantage ……………………………………………64
Table 1-10: Technological advantage of E-Marketing……………………………………………………89
Table 2-1: number of overnight stays at hotels in European………………………………………………111
Table 2-2: top ten international tourism countries ………………………………………………………..194
Table 2-3: Iran ranking in international tourism ………………………………………………………….195
Table 2-4: Middle East internet usage and population statistic……………………………………………196
Table 3-1: The common Saaty Rating Scale in AHP……………………………………………………..243
Table 3-2: Comparison of Mail, Fax and Email/Web-based Surveys ……………………………………249
Table 4-1: Iran and Germany Experts' cooperation’s rate ……………………………………………….. 261
Table 4-2: Germany and Iran Experts' cooperation’s rate ………………………………………………..263
Table 4-3: characteristic of Delphi group members according to education ……………………………...263
Table 4-4: Expert's forecasting of e-marketing share of the whole market in tourism industry ………….274
Table 4-5: Experts views about the e-marketing growth pattern …………………………………………275
Table 4-6: Tourism e-marketing systems Reliability Statistics (Cronbach's alpha)……………………….278
Table 4-7: Tourism e-systems Inter-Item Correlation Matrix (Cronbach's alpha)………………………...279
Table 4-8: Tourism e-systems Item-Total Statistics (Cronbach's alpha test)……………………………...280
Table 4-9: Iran and Germany e-systems Group Statistics description…………………………………….281
Table 4-10: T Test results for e-systems in Iran and Germany …………………………………………...283

X
Table 4-11: Iran and Germany Tourism e-systems Friedman test Descriptive Statistics …………………284
Table 4-12: Iran and Germany Tourism e-systems Friedman Test Statisticsa ……………………………285
Table 4-13: Iran and Germany Tourism E-systems Ranks with Friedman test …………………………..285
Table 4-14: Iran and Germany e-systems test of normality ………………………………………………286
Table 4-15: motivation factors Reliability Statistics (Cronbach's alpha test) …………………………….288
Table 4-16: motivation factors Inter-Item Correlation Matrix (Cronbach's alpha test) …………………...289
Table 4-17: motivation factors Item-Total Statistics (Cronbach's alpha test) …………………………….290
Table 4-18: Iran and Germany Motivation Factors Group Statistics description …………………………291
Table 4-19: Iran and Germany Motivation Factors T-test description ……………………………………292
Table 4-20: Tourism motivation factors Friedman test Descriptive Statistics …………………………...293
Table 4-21: Tourism motivation factors Friedman test Statistics ………………………………………...294
Table 4-22: Tourism motivation factors Friedman test Ranks ……………………………………………295
Table 4-23: tourism motivation factors mean skewness and kurtosis in Germany and Iran ……………...296
Table 4-24: touristic organization's activities Reliability (Cronbach's alpha test) ………………………..298
Table4-25: touristic organization's activities Inter-Item Correlation Matrix (Cronbach's alpha) …………299
Table 4-26: touristic organization's activities Item-Total Statistics (Cronbach's alpha test) ……………...299
Table 4-27: Iran and Germany Tourism activities Group Statistics description ………………………….301
Table 4-28: Iran and Germany Tourism activities T-test description …………………………………….302
Table 4-29: Descriptive Statistics of tourism activities in Germany and Iran ……………………………303
Table 4-30: Friedman Test Statisticsa of tourism activities in Germany and Iran ………………………..303
Table 4-31: Ranks of tourism activities in Germany and Iran ……………………………………………304
Table 4-32: tourism activities mean median mode, skewness and kurtosis in Germany and Iran ………..305
Table 4-33: Tourism environmental effective elements Reliability Statistics (Cronbach's Alpha) ………307
Table 4-34: Tourism environmental elements Reliability Correlation Matrix Germany and Iran ………..308
Table4-35: Tourism environmental effective elements Item-Total Statistics about Germany and Iran…..308
Table 4-36: Iran and Germany Tourism environmental effective elements Group Statistics description...310
Table 4-37: Iran and Germany Tourism environmental effective elements T-test description……………311

XI
Table 4-38: Tourism environmental effective elements important Friedman test Descriptive Statistics….312
Table 4-39: Tourism environmental effective elements important Ranks with Friedman test……………313
Table 4-40: environmental effective elements important Friedman Test Statistics ………………………314
Table 4-41: Environmental effective elements mean, skewness and kurtosis in Germany and Iran ……...315
Table 4-42: Companies' Elements Reliability Statistics ………………………………………………….317
Table 4-43: Companies' Elements Inter-Item Correlation Matrix ………………………………………..318
Table 4-44: Companies' Elements Item-Total Statistics ………………………………………………….319
Table 4-45: Iran and Germany Company's effective elements Group Statistics description ……………..320
Table 4-46: Iran and Germany Company's effective elements T-test description ………………………..321
Table 4-47: company's effective elements important Friedman Test Descriptive Statistics ……………...322
Table 4-48: company's effective elements important Friedman Test Statistics …………………………..323
Table4-49: Ranks of company's effective elements important Friedman Test …………………………...323
Table 4-50: Firms' effective elements mean, skewness and kurtosis in Germany and Iran ………………325
Table 4-51: Customers (Tourists) Satisfaction Effective Elements Reliability Statistics …………………327
Table 4-52: Customers (Tourists) Satisfaction Effective Elements Inter-Item Correlation Matrix ………328
Table 4-53: Customers (Tourists) Satisfaction Effective Elements Item-Total Statistics ………………...328
Table 4-54: Iran and Germany Customers Satisfaction Elements Group Statistics description ………….330
Table 4-55: Iran and Germany Customers Satisfaction Effective Elements T-test description …………..331
Table 4-56: Customers Satisfaction Elements Group Friedman Test Descriptive Statistics ……………..332
Table 4-57: Ranks Customers Satisfaction Elements important with Friedman Test …………………….332
Table 4-58: Customers Satisfaction Effective Elements Friedman Test Statistics ……………………….334
Table 4-59: customers' effective elements mean, skewness and kurtosis in Germany and Iran ………….335
Table 4-60: Tourism e-marketing strategy criterion Reliability Statistics ………………………………..337
Table 4-61: Tourism e-marketing strategy criterion Inter-Item Correlation Matrix ……………………...338
Table 4-62: Tourism e-marketing strategy criterion Item-Total Statistics ………………………………..338
Table 4-63: T Test results for Criterion in Iran and Germany ……………………………………………339
Table 4-64: T Test results for Criterion in Iran and Germany ……………………………………………340

XII
Table 4-65: Tourism e-marketing Criterions Friedman Test Descriptive Statistics ………………………341
Table 4-66: Tourism e-marketing Criterions Friedman Test Statistics …………………………………...342
Table 4-67: Ranks of Tourism e-marketing Criterions important with Friedman Test …………………..342
Table 4-68: Criterions mean, mode skew and kurtosis value bar chart in Germany and Iran ……………343
Table 4-69: Environmental Effective Elements in AHP survey ………………………………………….359
Table 4-70: Firms' effective elements list in AHP survey ………………………………………………..361
Table 4-71: Customers (Tourists) Satisfaction Effective Elements in AHP survey ……………………...362
Table 4-72: Criterions list in AHP survey ………………………………………………………………..364
Table 4-73: Tourism Activities in AHP survey …………………………………………………………..365
Table 4-74: Environmental effective elements list in AHP Germany ……………………………………366
Table 4-75: Firms effective elements list in AHP Germany ……………………………………………...368
Table 4-76: Customers effective elements list in AHP Germany ………………………………………...370
Table 4-77: effective Criterions list in AHP Germany …………………………………………………...371
Table 4-78: Tourism Activities list in AHP Germany ……………………………………………………372

XIII
List of Figures Figure 1-1: Tourism industry segmentations ……………………………………………………………2 Figure 1-2: world International tourism arrivals 2008 …………………………………………………..6 Figure 1-3: Word Tourism 2009 ………………………………………………………………………...6 Figure 1-4: foundation for Organization Design ………………………………………………………...13 Figure 1-5: Main Stages in the Mountain Region Planning ……………………………………………..15 Figure 1-6: e-business strategy cycle ……………………………………………………………………26 Figure1-7: Marketing strategy aiming process ………………………………………………………….26 Figure 1-8: integrated system for E-Marketing ………………………………………………………….36 Figure 1-9: relationship of e-tourism and E-Marketing …………………………………………………38 Figure 1-10: online leisure and travel market in European ……………………………………………..42 Figure 1-11: E-commerce and E-marketing challenges …………………………………………………44 Figure 1-12: levels of strategy …………………………………………………………………………...48 Figure1-13: “Wired” core business units as a support to improve customer service in E-Marketing …...53 Figure 1-14: The relationship between manufacturer, reseller and consumer …………………………..56 Figure 1-15: Strategic networks in the tourism e-mediary competitive environment …………………...66 Figure 1-16: XYKAs offering service platform for E-market …………………………………………..67 Figure 1-17: Global distribution systems ………………………………………………………………..68 Figure 1-18: Technological solution in Canadian accommodations sector for E-Marketing strategy …...70 Figure1-19: Hotel Property Management System ……………………………………………………….71 Figure1-20: Sources of Competitive Advantage ………………………………………………………...76 Figure 1-21: Easy jet Homepage first page picture ……………………………………………………...77 Figure 1-22: Ryan air Homepage first page picture ……………………………………………………..79 Figure 1-23: Ryan airs' business model …………………………………………………………………79 Figure 1-24: BCG model ………………………………………………………………………………..85 Figure 1-25: E-Tourism Evolution & the Hyperactive Connectivity Hypothesis ……………………….93 Figure 1-26: e-marketing Software integration ………………………………………………………….94 Figure 1-27: deferent areas in e-tourism ………………………………………………………………...95 Figure1-28: Ohmae 3c model strategy …………………………………………………………………..98 Figure 1-29: A framework of the relationship between e-marketing strategy and performance ………...100 Figure 1-30: Criteria of the research …………………………………………………………………….104 Figure 1-31: research decision tree of research ………………………………………………………….106 Figure 2-1: a platform for Germany e-tourism …………………………………………………………..115 Figure 2-2: share each of distributions channels in Germany tourism industry in 2010 ………………...116 Figure 2-3: picture of first Steigenberger hotel in 1930 …………………………………………………117 Figure 2-4: picture of a room in first Steigenberger hotel in 1930 ………………………………………117 Figure 2-5: picture of Steigenberger hotel in Switzerland ………………………………………………118 Figure 2-6: Accor chain Hotels revenue in 2010………………………………………………………...123

XIV
Figure 2-7: Number of employees in Accor hotels at 2010 ……………………………………………..123 Figure 2-8: Accor group different brand categories ……………………………………………………..124 Figure 2-9: A picture of Accor hotel Face book ………………………………………………………...126 Figure 2-10: A picture of NH Almenara Golf-Spa ……………………………………………………...127 Figure 2-11: A picture of NH hotel Face book ………………………………………………………….128 Figure 2-12: A picture of HRS company's headquarters in Cologne ……………………………………128 Figure 2-13: The former Hilton Hotels Corporation headquarters in Beverly Hills …………………….130 Figure 2-14: vision and strategy model in TUI …………………………………………………………138 Figure 2-15: TUI sub-companies and different brands ………………………………………………….138 Figure 2-16: TUI claimed the system ……………………………………………………………………139 Figure 1-17: TUI facebook picture ………………………………………………………………………140 Figure 2-18: Fox tour homepage picture ………………………………………………………………..141 Figure 2-19: DERTOUR homepage picture …………………………………………………………….145 Figure 2-20: Berg und Meer homepage picture …………………………………………………………147 Figure 2-21: FTI homepage picture ……………………………………………………………………..149 Figure 2-22: two old picture from Thomas Cook homepage …………………………………………...150 Figure 2-23: Thomas-Cook facebook picture ……………………………………………………………151 Figure 2-24: Thomas-Cook strategy home model ……………………………………………………….152 Figure 2-25: Thomas-Cook Germany statistic 2010 …………………………………………………….153 Figure 2-26: Lufthansa strategy process for e-marketing ………………………………………………..156 Figure 2-27: picture of Lufthansa Twitter Page ………………………………………………………...157 Figure 2-28: Air Berlins' growth path …………………………………………………………………...158 Figure 2-29: Persepolis ………………………………………………………………………………….163 Figure 2-30: Dizin-Ski-Resort …………………………………………………………………………..164 Figure 2-31: Kandovan village (a village in mountain) in East Azerbaijan ……………………………..166 Figure 2-32: Iran tourism e-marketing barriers ………………………………………………………….169 Figure 2-33: Iran tourism e-marketing strategy analyze model …………………………………………170 Figure 2-34: Homa Hotel Group Website picture………………………………………………………..172 Figure 2-35: Persian international hotels Group Website picture ………………………………………..173 Figure 2-36: Kosar hotel Group Website picture ………………………………………………………..175 Figure 2-37: Pars hotel Group Website picture ………………………………………………………….177 Figure 2-38: Hotel Mehr Yazd picture …………………………………………………………………..179 Figure 2-39: Sand bad Travel Group Website picture …………………………………………………..181 Figure 2-40: Ghoghnos Tour Group Website picture …………………………………………………...182 Figure 2-41: Persepolis tourism services company Website picture …………………………………….186 Figure 2-42: Iran Air …………………………………………………………………………………….189 Figure 2-43: Iran Air reservation page picture …………………………………………………………..191 Figure 2-44: picture of Iran air facebook ………………………………………………………………..192 Figure 2-45: Sky website picture ………………………………………………………………………..193

XV
Figure 2-46: internet top 10 countries in European bar chart ……………………………………………195 Figure 2-47: Middle East countries internet statistic in bar chart………………………………………...196 Figure 3-1: Three Round Delphi Process ………………………………………………………………..214 Figure 3-2: Acceptable area of T-test ……………………………………………………………………232 Figure 3-3: Normal distribution format and area …………………………………………………….…..233 Figure 3-4: hierarchy structure from the rating mode …………………………………………………...240 Figure 3-5: Research process in whole view …………………………………………………………….248 Figure 4-1: Finding effective elements of first Questionnaire …………………………………………..267 Figure 4-2: Effective elements groups finding of first Questionnaire …………………………………..268 Figure 4-3: Other elements and factors groups finding of first Questionnaire ………………………….269 Figure 4-4: Experts forecasting of e-marketing share of the whole market bar-chart …………………..274 Figure 4-5: experts' forecasting of e-marketing share of the whole market pie-chart …………………..275 Figure 4-6: e-marketing growth pattern bar-chart ……………………………………………………….276 Figure 4-7: e-marketing growth pattern pie-chart ………………………………………………………276 Figure 4-8: Bar-chart of e-systems average value in Iran and Germany ………………………………...287 Figure 4-9: tourism motivation factors average value bar chart in Germany and Iran …………………..297 Figure 4-10: tourism activities average value chart bar in Germany and Iran …………………………..306 Figure 4-11: Environmental effective elements average value bar chart in Germany and Iran ………….316 Figure 4-12: Firms' effective elements average value bar chart in Germany and Iran …………………..326 Figure 4-13: customers' effective elements average value bar chart in Germany and Iran ………………336 Figure 4-14: Criterion average value bar chart in Germany and Iran ……………………………………344 Figure 4-15: T.E-M.S effective elements group average value bar-chart in Germany & Iran …………..345 Figure 4-16: T.E-M.S effective elements group average value pie-chart in Germany and Iran …………345 Figure 4-17: T.E-M.S effective factors group average value bar-chart (Germany and Iran) …………….346 Figure 4-18: T.E-M.S effective factors group average value pie-chart (Germany and Iran) …………….346 Figure 4-19: Effective elements AHP decision Tree …………………………………………………….349 figure 4-20: Efective elements AHP tree ………………………………………………………………..352 Figure 4-21: analyzing the rate of inconsistency in Iran and Germany ………………………………….353 Figure 4-22: analyzing the rate of Environmental Elements' inconsistency in Iran and Germany ………354 Figure 4-23: analyzing the rate of Firms elements' inconsistency in Iran and Germany ………………...355 Figure 4-24: Analyzing the rate of Customers Elements' inconsistency in Iran & Germany ……………356 Figure 4-25: analyzing the rate of Criterions' inconsistency in Iran and Germany ……………………...357 Figure 4-26: analyzing the rate of Tourism activities and organization segment's inconsistency ……….358 Figure 4-27: priorities with respect to overall weaknesses and threats Iran and Germany ………………359 Figure: 4-28: Environmental Effective Elements final important priorities in Iran ……………………...360 Figure 4-29: Firms' effective elements final priorities in Iran …………………………………………...361 Figure 4-30: Customers (Tourists) Satisfaction Effective Elements final priorities in Iran ……………...363 Figure 4-31: Criterions final priorities in Iran …………………………………………………………...364 Figure 4-32: Tourism Activities Final priorities in Iran …………………………………………………365

XVI
Figure 4-33: Environmental effective elements priorities with AHP in Germany ………………………367 Figure 4-34: Firm's effective elements priorities with AHP in Germany ………………………………..368 Figure 4-35: Customers effective elements in AHP questionnaire in Germany …………………………370 Figure 4-36: priority of effective Criterions in tourism e-marketing with AHP in Germany ……………371 Figure 4-37: priorities of Tourism Activities in Germany ……………………………………………….372 Figure 5-1: area of research study ……………………………………………………………………….376 Figure 5-2: Tourism E-marketing Strategy different effective elements group in research ……………..378 Figure 5-3: Tourism E-marketing development cycle …………………………………………………..380 Figure 5-4: Recommended model for Tourism e-marketing strategy by researcher …………………….381

XVII
Abstract This dissertation focuses on e‐marketing strategy's effective elements in tourism
industry, from theoretical factual and practical perspective. On the case study,
research focus is on Airlines, tour operator, chain hotels, and Iran and Germany. It
aims to show various possibilities to enhance the company’s e‐marketing strategy
and successfully performance e‐marketing strategies with recognition effective
elements and their important during the strategy designing and implementation
process. online marketing and advertising tools is new phenomenon in marketing
and tourism industry which it is young subject and has a lot of unfamiliar Area and
potential to study and research about them. In One hands it depend to
communication theology, which changes continually, and includes new area every
days. Therefore, there is always new subject and area to study and research about
them. E‐marketing theologies such as hardware and software are very transitory and
changeable how every year, every month appear new version and make last version
unprofitable ad it make the research in this subject defaulter than man thinks.
In other hand, this research focuses on tourism industry, which is in close
relationship with people and their needs and expects, which continuously are
changing and evolution. The Tourism industry is the most competitive business in the
world. The hospitality industry primarily consists of businesses that provide
accommodation, food and beverage or some combination of these activities." Travel
and Tourism" is broad term used to captures a variety of interrelated businesses that
provide services to travelers, so Tourism is the largest industry worldwide.
Strategy is other aspect of our study in this dissertation. A strategic marketing
process involves matching a company’s internal resources, capabilities and external
environmental opportunities for company’s long term development. The important
key for companies to be successful is getting competitive advantage from
implementing strategies. To maintain its competitive advantage, a company needs
to deliver to customers values that can be clearly differentiated from those of its
competitors. According the Jain (2004), A marketing strategy can be defined as a
plan by a company to differentiate from its competitors, using its relative strengths
to better satisfying customer needs in given environment.

XVIII
The research principal focus is on tourism e‐marketing strategy and related
effective elements. Whereas this subject is very widespread (need a lot of time,
finance and assistant); is out of a dissertation limitations, researcher and research
had selected Iran and Germany as case study in this research. More than after
consult with supervisor and his advice, researcher has focused on three main part of
tourism industry which are chain hotels, tour operator and Airlines.
The purpose of this research was to find e‐marketing strategy effective elements
in for the tourism industry in Iran and Germany by specifically using Delphi method.
In this research, the author considered the environmental, organizational (company),
customer satisfaction elements which affect e‐marketing strategies and e‐tourism
strategies that can influence the generic e‐marketing strategies and successfully
performance, which affect industry structures.
First and second chapter of this research form literature of this dissertation. First
chapter offers a theoretical and factual view about e‐marketing strategy in tourism
industry. In second chapter researcher has considered tourism, internet and e‐
marketing condition and situation in Iran and Germany. More than in this chapter
have been considered the companies situation, which are our case in this
dissertation, have mentioned some example, and explained their history, situation
and either some about their e‐marketing and strategies as well as it was possible and
they allow to researcher to access their information.
Based on the characteristics of the study, the research was conducting by using
both qualitative and quantitative perspectives. This research used case study
strategy, semi structured interviews and questionnaire. Throughout the study, data is
collected by using different methods, which reflects that triangulation was largely
utilized in research. A thematic approach was used to analyze the result from
structured interviews and structured questionnaires. It is because as researcher
believed that it is only the best way to analyzing qualitative information.
Qualitative and quantitative methods, as two paradigms, are not simply different
ways of doing the same thing. According to Yin (1994) the best approach to use for a
study depends on the purpose of the study and the accompanying research

XIX
questions. The nature of the problem is an important factor to decide on better‐
suited approach.
For the purpose of this research due to the nature of the research, which is
Explanatory ‐exploratory‐applicable; after studying and consulting, Delphi technique
has been chosen as the best technique for introducing the effective elements on
E.M.S.T. Delphi’s aim is to illustrate real understanding of the subject. The researcher
would select the Delphi method when he wants to collect the judgments of experts
in a group decision‐making setting. Both qualitative and quantitative methods can be
used in the Delphi process. Moreover, for ranking the element, researcher uses AHP.
Data analysis consists of examining, categorizing, tabulating, or otherwise
recombining the evidence, to address the initial propositions of a study. In this
research, for second survey and questionnaire analyze have been used different test
and technique such as; Test of normality, T Test Motivation Factors, Friedman Test
(Ranking) and Test of normality. For this stage have been used SPSS and Excel soft
wars. For third survey and questionnaire we had a AHP questionnaire which is based
on pair‐wise comparing and for analyze data in this stage more than Excel for design
tables and some mathematic calculation; according AHP method have been used
Expert chose software for provisional and especial calculation and computation.
This research has been focused on identify tourism e‐marketing strategies' effective elements and their important of an e‐marketing‐based strategy for the improvement of retaining knowledge within the study three main tourism industry players Airline, chain Hotels and Tour operator) in Iran and Germany. In results, we have some effective elements and their important according the Delphi and AHP method. For example between elements "Tourists Needs, Experience and Expects in Market" with the importance coefficient of %204 is the most remarkable elements and "Customer satisfactions' elements group" with average value 5.54 according the research results have more important than other groups.

First chapter
Literature Of
Research
١
1‐1‐ Introduction
The Tourism and Hospitality industry is the most competitive business in the world. The hospitality industry primarily consists of businesses that provide accommodation, transport, food and beverage, and some combination of these activities." Travel and Tourism" is broad term used to captures a variety of interrelates businesses that provide services to travelers. Tourism, as defined by Goeldner and Ritchie (2006), is "the processes, ac vi es and outcomes arising from the relationships and the interactions among tourists, tourism suppliers, host governments, host communities, and surrounding environments that involve the attrac ng and hos ng of visitors (Cathy&others,2008,5). In other word, the Tourism industry involves the activities, services and industries that deliver a travel experience, including transportation, accommodation, eating and drinking, shopping, entertainment and other hospitality service available for individuals and groups traveling people away from home (Hus & etc, 2008, 5). Morrison (1998); introduced a tourism system model, which consists from four parts: demand, travel, marketing and destination (supply).
1‐2‐ Tourism
Tourism is the largest industry worldwide. Besides the traditional tourism and businesses includes broad range of businesses like transports firms, entertainment firms, destinations organizations, recreational enterprises, hotel, restaurants and accommodations and etc. Each of these parts is composed from different subparts. For example transport sector include the airlines, railways, bus, car rent, cruise line and so. In addition, in tourism industry there are many other players. Some of them work direct in related the tourism industry, such as hotels, tour operators, government (travel and tourism administration) and others. Some others, such as internet and telecommunication companies, marketing companies, work indirect in tourism industry. It means that they work in other industry but their services and products are using by tourists. There are same independent companies in a tourism destination that their service or products is for by the resident people and company, but they affect on tourism industry and developing the tourism industry and touristy companies and tourists use their service and product too but indirect, such as food industry, car factories, house building companies and so many others.

٢
In flowed diagram, you can see Tourism different sectors and players according UNWTO:
Figure 1‐1: Tourism different sectors and players
Resource: UNWTO, 1999
The tourist is the most important and complicated part and player in tourism industry and stays in the core the all the activities. Because tourism’s services and products are in correlation the tourist’s feels and Perception of service and products received by tourists (offered by companies and destination); it is very difficult to determine their real needs and offer the suitable service (Inskeep, 1984). On other hands, the tourism industry is related with very different industries and organizations and has interaction with them. It means that, tourism is affected by them and affect on them (other companies and suppliers activity, products, policy and effect on tourism splendor and vice versa). Therefore, it needs to design integration strategy and much‐scrutinized plan for all the activities, certainly including marketing and E‐Marketing.
There are variety differences between service and products in tourism industry and others industry. The clearest difference between the tourism industry and others industries is that the nature of goods and services in Tourism industry in compare to the other goods is different. Vallas and Béchamel (1999; 6) explained
Tour operator Tour agency Internet
Intermediates And …
Intermediates
Air line Rail way Bus
Rent car agency Cruise line And …
Transport
Hotel Motel Bed and breakfast And ….
Accommodation
Restaurants Bars Café Wags
restaurants And ….
Food and beverage
Museums Historical attraction Culture
Festivals and events And …
Attractions
Adventure Culture
Ecotourism And ...
Tourists
Tourism industry
Government and other types Organization (Tourism ministry, SMEs …)

٣
some of the goods and services' characteristics in the Tourism industry as have mentioned as below:
• Intangibility
• Perishable ability
• Heterogeneity
• Inseparability
• Inelasticity of supply
• Complementarily
• High fixed costs
• Labor intensity
• Elasticity of demand for tourism products
Today, tourism industry has become more complex and sophisticated with a movement away from the "mine host" and cost control framework of past to a more strategically view of business, in both investment and operations domains. Many countries and regions of the countries have tourism strategies and prepared plan to develop the tourism infrastructures and their market and brand. The tourism potentials for the developing countries has identified by Bruner (2007) as bellow:
Transfers capital, technology, organizational expertise, and institutions to developing countries;
A major export earner for many developing countries and an important source of foreign exchange;
An export sector not affected by trade barriers and opportunities for local linkages;
Depends on natural resources (wildlife & scenery) and culture; and A labor‐intensive industry with opportunities for marginalized labor
The tourism companies increase their application from internet and investment in e‐systems with emergence of the internet and the development its facilities and increase the users. For development tourism and customers satisfaction, it is necessary to specify, which elements are important and play key roll.
Customers (Tourists) in the Tourism industry include people with very different needs, style, behavior, expectations’ and positions. Therefore, studying tourists in separate category and classification help companies to focus on customers’ variety

٤
needs and expectations in their target markets. The tourism category and select the one or some groups of tourist kinds as target market help to better understanding the customers’ needs and wants; and companies can focus on distinct group of tourisms or offer the distinct and specific services and products for each group. Finally, focus on the target market by companies will lead to customer satisfaction. Different tourism classifications had offered by different researchers. The summary of them showed in flowing chart:
Table 1.1: Types of tourism
TourismTypes Accessible tourism ∙ Adventure travel ∙ Agric tourism ∙ Archaeological tourism ∙ Birth
tourism ∙ Bookstore tourism ∙ Christian tourism ∙ Culinary tourism ∙ Cultural tourism ∙ Dark tourism ∙ Dental tourism ∙ Disaster tourism ∙ Drug tourism ∙ Ecotourism ∙ Extreme tourism ∙ Female sex tourism ∙ Garden tourism ∙ Ecotourism ∙ Ghetto tourism ∙ Hallal tourism(of meat); ∙ Heritage tourism ∙ LGBT tourism ∙ Lists of named passenger trains ∙ Literary tourism ∙ Medical tourism ∙ Music tourism ∙ Nautical tourism ∙ Pop‐culture tourism ∙ Poverty tourism ∙ Religious tourism ∙ Rural tourism ∙ Sacred travel ∙ Safaris ∙ Sex tourism ∙ Space tourism ∙ Sports tourism ∙ Sustainable tourism ∙ Township tourism ∙ Volunteer travel ∙ Water tourism ∙ Wildlife tourism ∙ Wine tourism ∙ List of adjectival tourisms
Hospitality Hospitality industry ∙ Hospitality management studies ∙ Hospitality services ∙ General manager ∙ Bed and breakfast ∙ Destination hotel ∙ Destination spa ∙ Front desk ∙ Hostel ∙ Hotel ∙ Restaurant ∙ Hotel manager ∙ Motel ∙ Resort
Miscellaneous Campus tour ∙ Gift shop ∙ Grand Tour ∙ Holiday (vacation) ∙ Package holiday ∙ Passport ∙ Perpetual traveler ∙ Resort town ∙ Roadside attraction ∙ Seaside resort ∙ Ski resort ∙ Souvenir ∙ Satiation ∙ Sunday drive ∙ Tour guide ∙ Tour operator ∙ Tourism geography ∙ Tourism region ∙ Tourism Radio ∙ Tourism technology ∙ Tourist attraction ∙ Tourist destination ∙ Tourist trap ∙ Transport ∙ Travel agency ∙ Travel document ∙ Travel journal ∙ Travel literature ∙ Travel website
Industry organizations and rankings
Caribbean Tourism Organization ∙ Convention and visitor bureau ∙ Destination marketing organization ∙ European Travel Commission ∙ South‐East Asian Tourism Organization ∙ Tourism in present‐day nations and states ∙ Tourist information ∙ Travel and Tourism Competitiveness Report ∙ Visitor center ∙ World Tourism Day ∙ World Tourism Organization ∙ World Tourism rankings ∙ World Travel and Tourism Council ∙ BEST Education Network
Resource: WTO (World Travel Monitor Report 2002)
All those, the tourists (tourism customers) want, may be the experience of process‐the feeling, views and psychological and physical transformation that cannot be obtained without ac ve involvement. Beeho and pren ce (1997) argue that the nature of tourism product offerings is experiential consumption; and facilitate an experiential product and tourist attraction should appeal to emotions, in participial feeling (Hus & etc, 2008, 4).
Tourism activities are crucial to produce direct and indirect effects the countries' whole economy and while they involve a set of important sectors and activities

٥
that still depend on employment, able to absorb an important share of the industrial unemployment in declining regions. This means that countries and regions should look at tourist destinies as a composite product enabling regional and urban development and thus, requiring efficient differentiation strategies. As a whole, this economic activity raises a new special attraction for local political parties (Carvalho, 2006).
1‐2‐1‐ Word tourism statistic
In 2007, interna onal tourist arrivals grew by 6.6% to reach a new record figure with over 900 million – an extraordinary achievement given that the 800 million mark was only reached two years earlier. This represented 56 million more arrivals than in 2006, well over the total count for either the Middle East or Africa. In fact, world tourism enjoyed its fourth consecutive year of growth in 2007 above the long‐term forecast of 4.1% and, surprisingly, it even exceeded the 5.5% increases recorded in 2005 and 2006. All regions registered increases above their long‐term average, with the Middle East leading the growth ranking, with an es mated 16% rise to nearly 48 million interna onal tourist arrivals. In second place came Asia and the Pacific (184 million) with +10% over 2006. Europe, the world’s largest des na on region, with a share of 54% of all interna onal tourist arrivals, grew by 5% to reach 484 million. Simultaneously, interna onal tourism receipts grew to US$ 856 billion (625 billion Euros) in 2007, corresponding to an increase in real terms of 5.6% over 2006. Receipts from interna onal passenger transport are estimated at US$ 165 billion, bringing the total interna onal tourism receipts including interna onal passenger transport (i.e. visitor exports) to over US$ 1 trillion, corresponding to almost US$ 3 billion a day (UNWTO, 2008).
In 2008, interna onal tourist arrivals grew by 1.8% to reach a new record figure of over 924 million – an extraordinary achievement given that the 800 million mark was only reached two years earlier. This represented 24 million more arrivals than in 2007, and the Middle East with +11.3 % and Africa+4.6 % are in first and second place. Europe with 1% of increase rate is at last place but with 488.5 million tourist of the number of tourists stands in first place.

٦
Figure 1‐2: world Interna onal tourism arrivals 2008
Resource: UNWTO (2009)
The business travel and Tourism markets have been particularly badly hit by the crisis in 2009. The development of these two tradi onally very strong segments is closely linked to economic growth. As a result, figure for arrival tourists in the welt and continent, which have enjoyed a real boom in recent years, will stagnate or even fall slightly in 2009. For first me since 2003 because of the economic crisis in 2009, the interna onal tourist arrivals decrease by 4% decline to 880 million but it again in 2010 had +4% increases.(UNWTO, 2010)
Figure 1‐3: Word Tourism 2009
Reference: UNWTO (2010)
The forecast of tourism according past grow process of number of tourists in the welt and different region shows that the experts and countries expect to this incasing processes will be continue in future. Next figure shows this expect according the UNWTO:

٧
Table 1‐2: Word arrival tourism in 2010 and its forecas ng
Resource: UNWTO, 2010
Tourism is one of the global growth industries of the future, with 3 % forecast growth per annum to Europe that its effects are big and important in the welt and countries economy.(UNWTO, 2010) The Travel & Tourism Economy have identified by the broad impact of travel demand as it flows the economy. It consists of goods and services produced for visitors and other activities strongly dependent on Travel & Tourism spending, such as retailing and construction, which would decline if travel demand reduced. Next table shows the Direct and indirect effects of tourism in the word about 10 top countries by Dollars and you can see Germany stays in the fifth state:
Table 1‐3: 10 top tourism arrivals centauries in 2009
Source: TSA / WTTC 2010
Scanning the tourism and internet statistics concerning Germany shows that Germany is one of the most advantageous countries in tourism and E‐Marketing. On the other hand, Iran has also many attractions for tourism and travelers but tourism statistics have not good station, so the research can be helpful to develop tourism industry in both countries as well as in other countries of the world.

٨
In this sense, innovators will be those members trying to convert preferable alternatives into the captive alternative (adopted automatically, parsimoniously, with no special effort), which is an asset either positive or negative. It depending on the way it will be used to create motivation and organization of innovation spread to access to tourism aims. Harrisons (2007; 23); emphasized that E‐Marketing is more useful and help to development tourism and customers satisfaction in the tourism industry. And also E‐Marketing helps to improve this feeling and increase customer satisfaction with different methods and tools such as increase information, support and etc. (Buhalis, 2004).
In one study, Inskeep (1994, 5) have considered the effects of demand and supply factors in tourism developing. Demand factors include International tourist markets, domestic tourist markets, resident’s use of tourist attractions, facilities, services; and supply factors involved attractions, accommodation, tourism facilities and services companies, transportation, institutional elements and other infrastructures and related activities. Demand and Supply are two important concepts in economy and marketing subjects, which they must have attended in studies related to tourism subjects and planning for developing tourism. In planning for E‐Marketing and design the E‐Marketing strategy, analyze the Demand and Supply factors is very important, because E‐Marketing development (internet software and site development) is applying by both of demand and supply sides to use and developing. More than, they are the common point and lade to synergy in the E‐Marketing development.
Planning tourism at all levels is essential for archiving successful tourism development and management. Long term planning (strategy) can bring benefits without significant problems, helping to developing tourism and maintain satisfied tourist markets. Without planning and strategy, it may create unexpected and unwanted impacts. However, the E‐Marketing strategy in tourism industry should emphasis on the given formulating and tourism‐developing plan; must be flexible to allow to changing circumstances; because internet technology and related software and method are developing and progress very rapidly.
1‐2‐2‐ Tourism developing
In simple word, a strategy is a plan, that companies with it integrate their major goals, policies, decisions and sequences of action in to achieve whole(tony

٩
Proctor,2008,1). It may be applied at all levels in organization or tourism destinations and pertain to any of functional areas of management. Thus, there may be production, financial, marketing, personnel and corporate strategies, just to name a few. Also in marketing strategy, its focus on pricing, product, promotion, distribution, marketing research, sales, advertising, merchandising and etc.
Organizations employ a wide variety of tactics to implement their strategies. "Travel and Tourism" is a broad term used to capture a variety of interrelated businesses that provide services to travelers. Tourism is the largest industry worldwide. Today, the tourism industry has become more complex and sophisticated with a movement away from the "mine host" and cost control framework of the past to a strategic view of business, in both investment and operations domains.
One of the most important activities associated with strategy implementation is designing a strategy‐supportive structure or designing a strategy pass to company structure. Several principles or dimensions maybe used to characterize a company's structure. Hierarchy of authority, degree of centralization, complexity, specialization, formalization and professionalism are some of them. The tourism and internet special characterizes in an E‐Marketing strategy make it more complex a difficult to this important (Jeffrey, 2007).
The definition of company strategy and implementation should help the company to improve position within the market, e.g., by increasing its competitive ability. The strategic planning requires effective communication and clear thinking (smart, 2009, 1). Gathering and analyzing data from inside and outside of an organization or destination ‐and subsequently turning that data’s into information‐ requires clear and concise communication between all of the involved parts. In order to planning a good strategy, company must know the strategy planning process. There is different method and processes but in all of them strategy planning involves defining a mission, establishing goals and objectives in support of that mission and creating strategy to attain established goals and objectives.
As have mentioned before; "tourism and travel" is a broad term has been used to capture a variety of interrelated business that provides service to travelers; and is the largest industry worldwide (Harrison &Enzi, 2007, 23). Tourism and travel (particularly hotels and restaurant sectors) are among the most competitive business in the world. The tourism industry generally consists of businesses that

١٠
provide accommodation, food and beverage (restaurant), tour operators and agencies, transport (airline, railway, car rent, ship and curse line, and bus) local and national organizations, attraction and destination.
Planning process for tourism at different levels has several steps. For example, in model for Insskipe (1999), the first step is careful prepara on of study, which involves formulating the terms of reference, selecting technical team, appointing a steering committee and organizing the study activities. The special considerations to be made in planning – such as economical, environmental, technological or social issues and critical institutional elements‐ should be specified. The second step is the determining and developing the objectives. Surveying of all elements, analyzing and synthesis, strategy and plan formulation, formulation of other recommendations and implementation and monitoring are next steps; but there are not stable and irremovable for all companies or organization. Sometimes add others steps and sometimes remove some of them.
Tourism companies must have what kind of strategy but the marketing strategy have more importance, because the last aim for all the companies is sell their services and products and earn forecasted benefit; and it result good marketing strategy and program performance. Therefore, the marketing and marketing strategy as last step for each company, even uneconomical companies and organization, has very importance. On the other hand; because it is in related to customers and company without their customers cannot continue their life and activities, must pay enough attention to it.
For the practical strategy for tourism, destinations and companies must see which tools have to use them for success and rich to their aims. According the Buhallis; Tourism Offering/Product, Corporate Strategies, Image, Promotion and Communications, and Dynamics and Interdependence are four Marketing Playground and Strategic Tools for tourism destinations and companies.
1‐2‐3‐ Tourism sustainable development strategy
In recent decades, the world economy has experienced from the primary (agrarian) and secondary (industrial) sectors to the tertiary (service) sector. While developed countries have seen an overwhelming portion of their economic activities contributed by service sector, some developing countries such as Iran is

١١
also experiencing a fast‐growing service sector as their economic progress (Cathy, 2008).
To achieve sustainable tourism, it is essential to implement an integrated and preventive strategy for the tourism sector. The tourism sector can therefore grow while taking into consideration the environmental carrying capacity and its main economic, social and cultural assets. The analysis of alternative scenarios and the evaluation of the most sustainable tourism development scenario will be used to develop a Strategic Plan for Sustainable Tourism based on several indicators. According Proctor (2008), the process for the implementation of an integrated sustainable tourism strategy includes the following steps:
• Decision to begin a sustainable tourism process
• Develop aims and objectives
• Integrated analysis and assessment of tourism destination sustainability
• Stakeholders’ Involvement
• Strategy formulation
• Implementation of activity
• Monitoring
While the steps appear sequential, the process is an iterative one, with feedback loops connecting the various stages. Data and information about the state‐of‐the‐art of the environment, the socio‐economic trend and the impacts of tourism development in the destination will be collected. The analysis of alternative scenarios and the evaluation of the most sustainable tourism development scenario will be used to develop a Strategic Plan for Sustainable Tourism based on several indicators. Apart from enhancing the image of certified companies, with the commercial benefits that such enhancement brings, E‐Marketing strategies are useful to promote higher levels of sustainability and quality throughout the tourism sector. As declared by the WTO, suitable strategy for tourism development and E‐Marketing can benefit the society as a whole, the environment, governments, private companies and consumers as well.
Johnson and Scholes (2006) define strategy as follows: "Strategy is the direction and scope of an organization over the long‐term: which achieves advantage for the organization through its configuration of resources within a challenging environment, to meet the needs of markets and to fulfill stakeholder expectations". In other words, strategy is about:

١٢
* Where is the business trying to get to in the long‐term? (Direction)
* Which markets should a business compete in and what kind of activities is involved in such markets? (Markets; scope)
* How can the business perform better than the competition in those markets? (Advantage)
* What resources (skills, assets, finance, relationships, technical competence, and facilities) are required in order to be able to compete? (Resources)
* What external, environmental factors affect the businesses' ability to compete? (Environment)
* What are the values and expectations of those who have power in and around the business? (Stakeholders)
We now tourism is much more than this: “The visitor is recognized as the basic unit, which undertakes a tourism activity. This activity occurs mainly during trips, but it might also have effects before and after (purchases before and after a trip)” o en done in the tourist residence area, as stated in WTO (2001). Hence, one need to approach tourism strategies in lagged regions as a cluster activity requiring excellence in networking and complementarily planning among local/regional stakeholders. S ll according to Keeney (1992), we knew the focus for any economic strategy is the combination of the two sides of the market (supply‐demand); in tourism strategies people got used to leave infrastructural provision to the public sector. Even then, local resident behavior is definitely decisive in order to work together, sustaining the environmental and empathy conditions needed to behave like a sincere and pure host destiny (Carvalho, 2006).
1‐3‐ Strategy “The Outline forces a strategic approach in that it calls for considering the
industry outlook and the company’s competitive position before considering anything specific to the organization. It also forces an orderly approach by requiring examination of the elements of managing, in an undeviating sequence: goals, strategy, policy, organization structure, facilities, procedures and personnel ‐ in that order.” (Bhide, 1992).
١٣
This situation changed after World War II. Companies began to grow and follow strategies of diversification. These strategies required new organization structures. The companies struggled to transition from single business, functional organizations to diversified multi‐divisional profit centers. They began to acquire the knowledge of diversification strategies and to understand the working of the multi‐divisional structure. The new strategy expansion required help from consultants on international strategy and structures (Jayr, 2003).
On the one hand, Organization Design was a reaction to the fragmentation and on the other hand, it was an articulation of a framework based on an accumulating base of empirical evidence. That is, in order to make a successful change and solve the manager’s problem, structures, planning processes, information systems and interpersonal relations all had to be changed.
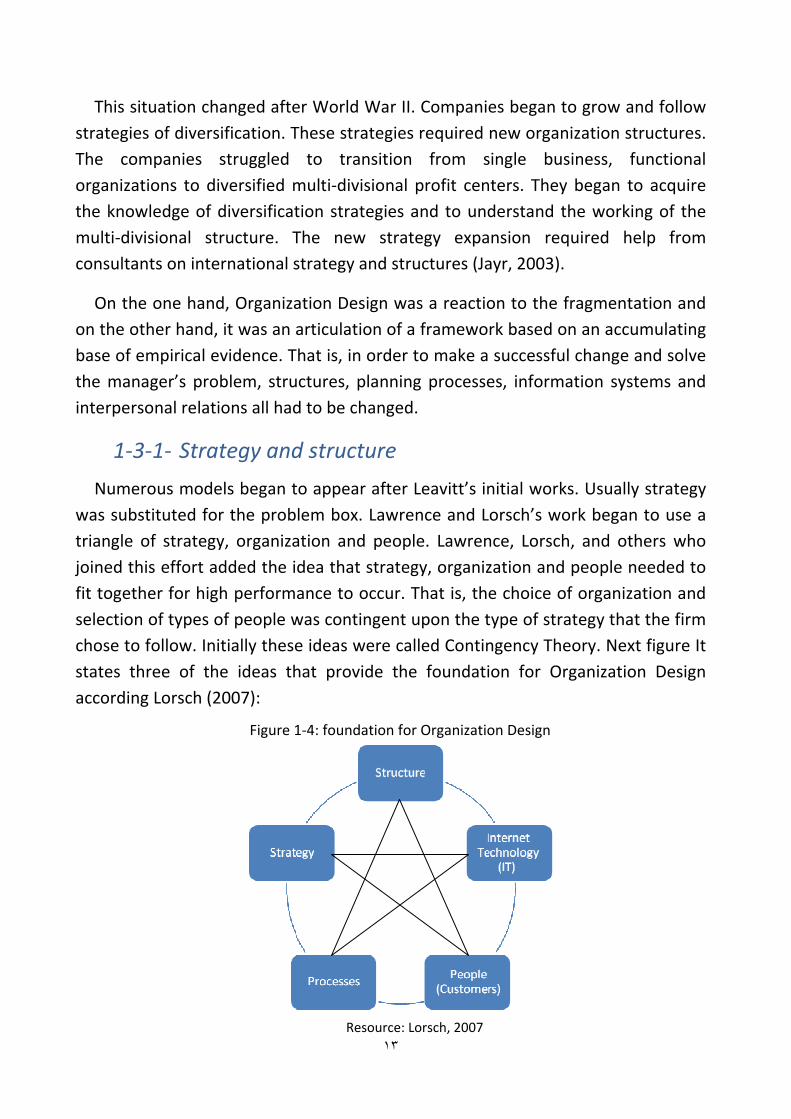
1‐3‐1‐ Strategy and structure Numerous models began to appear after Leavitt’s initial works. Usually strategy
was substituted for the problem box. Lawrence and Lorsch’s work began to use a triangle of strategy, organization and people. Lawrence, Lorsch, and others who joined this effort added the idea that strategy, organization and people needed to fit together for high performance to occur. That is, the choice of organization and selection of types of people was contingent upon the type of strategy that the firm chose to follow. Initially these ideas were called Contingency Theory. Next figure It states three of the ideas that provide the foundation for Organization Design according Lorsch (2007):
Figure 1‐4: foundation for Organization Design
Resource: Lorsch, 2007

١٤
The Star Model is based on the five Organizational Design ideas. These models are one of the bases of the integration of the specialties for the general manager. First, different strategies require different organizations. Second, organization consists of business and management processes, reward systems and people practices in addition to structure. A firm cannot successfully execute a strategic change without making compatible changes to structure, processes and human resource practices to maintain alignment. In order to integrate the specialties, the consulting firms have adopted their own versions. Another factor favoring integration is the decreasing life cycle of a competitive advantage (Evans, 2000).
Integrating the efforts of these different specialists is as difficult as integrating the different knowledge bases around the clients’ issues. The firms choosing a strategy of delivering an integrated solution to the general manager needs to follow its own integrated model. They also need to create their own knowledge package of integrated specialties so that teams can work from a common model and use a common language.
The information technology firms pay less and use an advantage model of about twenty associates per partner. If an information technology (IT) firm hires strategy people at IT rates, they will not attract the top people. Clients may then prefer to hire the first tier strategy firm and then hire the IT firm for the IT system development only. But there may be some clients that prefer one stop shopping. Another approach is to follow the integration strategy but partner with other specialist firms. Sun Microsystems follow this strategy in delivering IT solutions to customers (Galbraith, 2002).
They combine the “best of breed” among hardware, software, service and consulting firms for the customer. Usually the client hires the specialist firms sequentially. First, they hire the best strategy firm. Then they hire their preferred organization design firm, then the IT firm, the compensation firm and the executive recruiter of their choice. Therefore, one of the biggest criticisms is that the recommendations were rarely implemented.
The next new thing was originally to be E‐Marketing in the 1990s. The consultants rushed to learn and to publish. The Boston Consulting Group produced Blown to Bits, which was representative of the published works. Of course, these efforts and the hype surrounding them crashed along with the dotcoms. The economic slowdown further hampered the implementation of E‐Marketing. But E‐

١٥
Marketing and the move to Enterprise Systems (the integration of Customer Relationship Management (CRM), Supply Chain Management (SCM) and Enterprise Resource Management (ERP) Systems) continue to challenge management. New IT systems are driving new forms of organization (Jayr, 2003). New IT systems are therefore driving the development of consulting practices and the underlying knowledge bases. So the next step being pursued is to use the Internet to involve more people and to react more quickly to business changes.
1‐3‐2‐ Tourism Strategy
The main problem with this process is that the “environment” in which businesses operate is constantly changing. So a business must adapt to reflect changes in the environment and make decisions about how to change the marketing mix in order to succeed. This process of adapting and decision‐making is known as marke ng planning. D.G.T. (2006); Gaspar (2001); Mattsson et al. (2005)and some others authors, with an added effort reinforcing the ini a ves to promote stakeholder participation (great number of local visits, workshops, direct inquiries and interviews in order to find the main conflict aspects among different agent Utility functions) resisting to captive behavior of innovation diffusion. That is summarized for descriptive purpose in next Figure:
Figure 1‐5: Main Stages in the Mountain Region Planning
Resource: Mattsson et al. (2005)

١٦
In tourism economy, we know the benefits are never distributed according to any administrative design of the territory; in fact, to raise tourism receipts you just need to make tourists stay and spend longer within the whole region. This requires a cluster approach, where every agent must develop the business according to his or her competitive advantages (Carvalho, 2006). Summing up, we cannot have the willingness to build a mountain tourism destiny, if we are not emotionally and affectively involved with the place and the tourism imaginary; thus, one cannot see the uniqueness of the place for people who never visited similar sites.
Businesses that succeed do so by creating and keeping customers. They do this by providing better value for the customer than the competition. Marketing management constantly have to assess which customers they are trying to reach and how they can design products and services that provide better value (“competitive advantage”). A business must adapt to reflect changes in the environment and make decisions about how to change the marketing mix in order to succeed. This process of adapting and decision‐making is known as marketing planning. Strategic planning is concerned about the overall direction of the business. It is concerned with marketing, of course. Nevertheless, it also involves decision‐making about production and operations, finance, human resource management and other business issues.
Without a strategic marketing plan, a company could waste resources or miss an opportunity. Marketing has a key role to play in strategic planning, because it is the job of marketing management to understand and manage the links between the business and the “environment”. Sometimes this is quite a straightforward task. For example, in many small businesses there is only one geographical market and a limited number of products (perhaps only one product!).
Developing a marketing strategy is vital for any business. Without one, your efforts to attract customers are likely to be haphazard and inefficient. The focus of your strategy should be to make sure that your products and services meet customer needs and that you develop long‐term and profitable relationships with those customers. To achieve this, you will need to create a flexible strategy that can respond to changes in customer perceptions and demand. It may also help you identify whole new markets that you can successfully target (IBM, 2009).

١٧
1-3-3- Marketing Strategy
The plan of action that prescribes resource allocation and other activities for dealing with the environment, achieving a competitive advantage, that help the organization attain its goals. In general, Strategies focus on Core competencies, developing synergy and creating value for customers; and more than with attend to level of extent of company activity, there are four Global Strategies (Kotler, 2009):
Globalization: product design and advertising strategies are standardized around the world
Multi‐domestic: adapt product and promotion for each country.
Transnational: combine global coordination with flexibility to meet specific needs in a various Competitive Edge, through Competitive Strategies.
Differentiation: distinguish products or services from competitors.
Cost leadership: aggressively seeks efficient facilities, pursues cost reductions, and uses tight cost controls to produce products more efficiently than competitors
Focus: the concentration on a specific regional market or buyer group
Vellas (1999) argue that Marketing strategy and strategic marketing are two concepts with strong dependence to each other. A strategic marketing process involves matching a company’s internal resources, capabilities and external environmental opportunities for company’s long‐term development. A marketing plan (STRATEGY) is useful to companies in the Tourism business. It can help to:
• Identify sources of competitive advantage
• Gain commitment to a strategy
• Get resources needed to invest in and build the business
• Inform stakeholders in the business
• Set objectives and strategies
• Measure performance
The important key for companies to be successful is getting competitive advantage from implementing strategies. To maintain its competitive advantage, a company needs to deliver to customers values that can be clearly differentiated

١٨
from those of its competitors. A marketing strategy can be defined, as a plan by a company to differentiate from its competitors, using its relative strengths to better satisfying customer needs in given environment. Also, Jain (2004) explain that in an effective and appropriate strategy it's important that, the following elements should be considered:
1. organizational strategy domain 2. total and operational goals 3. resources' allocation 4. searching for resistance competitive advantages 5. Synergy
The central goal of strategy is to achieve sustainable competitive advantage over rivals and thereby to ensure lasting profitability. Strategy concerned with long‐term direction and deals with the overall plan for deploying the resources that a firm possesses. More than, strategy is about achieving unique positioning vis‐à‐vis competitors and it entails the willingness to make trade‐offs, to choose between different directions and between different way of deploying resources. Marketing strategy is a strategy for marketing activities to get better results and arriving to their Long terms aims. There are different strategies and different methods for design the strategy for company and marketing activities. Different strategies are suitable for different companies with different qualifications. More than companies with attention to their qualification and capacity, aims, resources or manager decision use different method.
1‐4‐ E‐Marketing During last decade, we have seen Marketing and technologies move from
traditional forms to digital form. With these changes, the companies, which could not coordinate and harmonized their activities whit change process and new market and technology procedure, had to leave market and have to give their market share to new or flexible companies. In other word, the methods of marketing have changed and improved, and we have become a lot more efficient at telling our stories and getting our marketing messages out there. E‐Marketing is the product of the meeting between modern communication technologies and the age‐old marketing principles that humans have always applied. Unique characteristic of using internet can be studied as below (Evans, 2000):

١٩
1. 24 hours access 2. Innovation 3. Possibility of joining to globalization process 4. Possibility of joining to local marketing 5. Access to multimedia 6. Possibility of more understandable making relationship between people
and stakeholders 7. Possibility of customizing products 8. Possibility of useable for all people 9. Easy use
Very simply put, E‐Marketing or electronic marketing refers to the application of marketing principles and techniques via electronic media and more specifically the Internet. The terms E‐Marketing, Internet marketing and online marketing, are frequently interchanged, and can often be considered synonymous. The Internet has changed this in three important marketing ways in related whit customers. If want to explain that why consumers prefer to use internet to buy the tourism services and products, can flowing reasons mention:
First, the Internet allows consumers to talk to consumers. The Internet allows many‐to‐many communication flows. Consumer information sites such as The Consumer Democracy (www.consumerdemocracy.com) "is for information on products: quality, praise, complaints, ratings, features, descriptions, reviews, comparisons, discussion, problem reports, information, statistics, rankings, prices, rip‐offs, bargains and shady affairs". EComplaints.com and planetfeedback.com offer similar forums and services.
Second, consumers can find and access information much easier than before. For the first time businesses must deal with a basic tenet of pure competition, a totally informed consumer. In a world where information is power, this can make sellers uncomfortable. Imagine the poor automobile salesperson, who is greeted on the lot by a customer with a dealer invoice that shows the price the dealer paid for the car, easily available from automobile information's such as Auto‐by‐Tel. These buyers will not let dealers make big markups anymore.
Third, and most significantly, the Internet enables the information flow to be reversed so customer‐centric companies can pull information from consumers to improve and customize products. Compare this with the product‐centric company

٢٠
that pushes products to consumers. Companies that recognize this power shift to the customer will create a customer‐centric strategy (Viehland, 2000).
1‐4‐1‐ Marketing mix and internet
The growth of internet and the World Wide Web presents opportunities for marketers to reach customers with new products. Successful online marketers exploit the interactive capabilities of the WWW for the benefit of their customers. The web pages they create become communities where people swap information and buy regularly. More and more companies are recognizing the value of www to provide "infotainment" which can foster brand identity and loyalty and develop long‐term relationship with customers. Marketers and firms are also advertising their products and service on websites of other companies. This is found in the form of banner ads, which are small, static or animated rectangular ads that typically appear at the top of a page.
Finally, sponsorship or co‐branded ads integrate companies' brands and products with the editorial content of certain websites. Their role is to link the advertiser with the website's mission in the user mind. Consumers can gain ready access to prices. This helps customers in comparative shopping and gives manufactures that want to make price a key element in their marketing mix another opportunity to get pricing information to customers. Many organizations implement low‐price policies through the internet (Proctor, 2008).
Table 1‐4: Main differences between the old media channels and the Internet Old media Internet Comment
One-to-many communication model
One-to-one or many-to-many communication model
Theoretically the Internet is a many-to-many medium, but for company-to-customers communication it is best considered as one-to-one
Mass marketing Individualized marketing or
Personalization possible because of technology to monitor preferences and tailor content
Monologue Dialog Indicates the interactive nature of the World Wide Web, with the facility for feed-back
Branding Communication Increased involvement of customer in defining brand characteristics. Opportunities for adding value to brand
Supply-side thinking Demand-side thinking Customer pull becomes more important Customer as a target Customer as a partner Customer provides more input into products and
services required Segmentation Communities Aggregation of like-minded consumers rather
than arbitrarily defined target markets
Resource: (Gurau, 2003)

٢١
The Internet empowers the customer (Ian, 2001).The Internet represents a new media, with specific characteris cs. Table 1‐4 shows the main differences between the old media channels and the Internet (Gurau, 2003).
However, the low entry barriers, the market size and the relatively low costs of online business activities have created a situation of intense competition; the only answer to this situation is to build a strong brand name and to enhance customers’ long‐ term loyalty (Cote, 2005). The Internet empowers the customer. Before the strategic planning process can be applied to customer centric procedures, the firm needs to put in place the tools and procedures to collect relevant information about its customers, process efficiently this information, and segment the market. The implementation of customer‐centric systems comprises a number of essential stages:
• collect information about customers;
• calculate the customer lifetime value;
• segment the customers in terms of value (profitability) and establish the priority segments .
E‐Marketing is the process of marketing a brand with using the Internet. It includes both direct response marketing and indirect marketing elements and uses a range of technologies to help connect businesses to their customers. Moreover, if want to explain that why companies ‐specialty in tourism industry‐increase the using internet in their marketing activities, can refer that flowing reasons mention by Jing; Holden, Belew and Elad (2009):
F1.Online/immediate/24‐hour availability, directly connect buyers and sellers: This creates time independence and enables customer service to be decoupled from supplier availability. Such 24‐hour availability is a strong facilitator of a global presence, overcoming time differences. As the customer, is in the first instance interacting with an automated system, there is a set of service requests that can become 'self‐service'
F2.Ubiquity: Global information networks (fixed and mobile, satellite) promise to offer worldwide, large‐scale and low‐cost, access to electronic commerce.
F3.Global: It is often claimed that one of the largest changes brought about by the Internet is that it is global: companies get access to customers globally, customers get access to suppliers globally.

٢٢
F4.Digi za on: The Internet and the communication and computer systems connected to it are all processing digital and digitized information. Digital information can be easily stored, transmitted, processed, mixed, transformed, and in short manipulated in many ways, independent of its source or carrier.
F5.Mul media: closely related to digitization is the aspect of multimedia, referring to the capability to deal with and deliver information in several ways: text, graphics, sounds, and video, eventually tactile.
F6.Interac vity: As opposed to EDI, which is for application‐to‐application data exchange, the Internet offers person‐to‐person and person‐to‐application interactivity. Even if one side of the interaction is automated, through a Web‐server program, the interaction possibilities are wide ranging and can be extremely varied and engaging.
F7.One‐to‐one: The Internet makes customer profiling fairly easy by capturing and analyzing customer characteristics. Technically, this can consist of storing some information about the customer on the customer's computer (e.g. a 'cookie'), which is retrieved when the customer returns to the site. Many sites encourage potential customers to provide an e‐mail address; personal data etc. 'intelligent agents' that assist in the sales process can complement customers' profiling technology.
F8.Integra on: Customer service is greatly enhanced by integrating the functionalities of the transaction parties on the basis of standardized information flows. One‐stop integration of functions‐that is, integrating all the necessary functions for a transaction at a single point of access and with seamless flow of information between them, as illustrated by this example is, however, only one aspect of integration. Information integration is another opportunity to extract additional value by analyzing data from various steps of the transaction or across transactions.
F9.Can is updated in real‐time, therefore always up‐to‐date
F10. Reduce costs: fixed cost, variable cost, caring cost, contact and post,…
F11.Increase produc vity: Tourism companies, specialty Airlines can gain significant productivity improvements by using business‐to‐business e‐commerce to streamline and improve its supply chain processes. They can save time and money by purchasing supplies via the Web. Similarly, they also can use e‐

٢٣
commerce to communicate and transact with distributors and customers in a more cost‐effective and timely manner than through traditional channels.
F12.Improve level of customer service: Tourism companies can improve its level of customer service by allowing customers to access "help" information, complete application forms, pay invoices, or change their account details via its Web site, at their own convenience.
F13. Strengthen customer relationships: Tourism companies can strengthen relationships with existing customers by allowing them to access ‐ via its Web site ‐ previously inaccessible decision‐support information, such as detailed research reports, product specifications and price comparisons.
F14. Enhance business intelligence: Tourism industry can use its Web site to collect valuable intelligence about customer needs, buying habits and preferences. This intelligence can be a valuable input to the development of new, profit‐enhancing processes, products and services. Similarly, they can use the Web to research new markets and to gather valuable intelligence about its competitors.
F15. Increase direct sales of products or services: The Web enables businesses to reach customers all over the world, 24‐hours per day, and 7‐days per week. Companies in tourism industry can use the Web to create a "self‐service" environment that allows them to offer lower prices and provide more detailed product information than that which Airline can offer in the real world.
F16. Generate adver sing, sponsorship or brokerage revenue: Many "content" and "intermediary" sites generate revenue through advertising or sponsorship arrangements with other sites. Intermediary sites provide useful information and act as springboard to sponsoring Web sites. Intermediary sites offer earn brokerage fees on transactions that result from the information or service they provide.
Due to high degree of uncertainty regarding future developments, especially in the E‐Marketing environment where technologies and business models change rapidly, making long‐term commitments to a strategy is difficult challenge. Furthermore, there are usually numerous, different and frequently contradicting decision criteria that need to be evaluated during strategy analysis and formulation.

٢٤
1‐4‐2‐ Influence the e‐systems in marketing
Synergies emerging from use of IT and ICTs systems effectively mean that information will be widely available and accessible through a variety of media and location. As result of IT development, various systems and tools gradually became available to support business management and enable firms to enhance their efficiency and productivity. Users are able to use mobile devices such as portable computers and mobile phones as well as digital television and self service terminals/kiosks to interact and perform several functions (Buhalis, 2003, 9). In first era, data processing, the main objective was to improve operational efficiency by automating information‐ based processes. Others are mentioned in following (Buhalis, 2003, 9‐12):
Information Systems (IS): are defined as the interrelated components working together to collect process, store and disseminate information to support decision making coordination, control, analysis and visualization in organization
Management Information Systems (MIS): The principle aim of this era was to increase management effectiveness and efficiency by satisfying organization information requirements. In continue with add clerical and especial functions it used for support decision making for management and create added‐value for customers.
Decision Support Systems (DSS): they are the natural progression form MISs and transaction processing systems. They can develop and test scenarios for different developments environment and assess the risk of decision alternatives.
Strategic Information Systems (SIS): These enable companies to use all data and processes available to define their strategic objective in order to improve their competitiveness. SISs are often instrumental in changing the nature of firms in restructuring all business processes.
Executive Information Systems (EIS): EISs use aggregate data and easy‐to‐read graphs to demonstrate the current status of an organization and projected trends for key factors selected by executives.
Expert Systems: exert systems consist of a specialized knowledge base and software to perform human‐like inferences on knowledge and thus answer specific questions, they can explain the reasoning process and conclusions. They often use
٢٥
artificial intelligence, which ultimately aim to imitate human functions such as thinking, seeing, hearing, tasting, smelling and feeling.
OPERA Hotel Property Management System: it is designed to scale according to requirements of any size hotel or hotel chain. Its back office is powerful financial software suite that provides hotels with a fully integrated, flexible financial and e‐business solution. OPERA is full‐service hotel systems with Sales&Marketing, Catering, Revenue Management, and Quality Management, Back Office, and Material management. In addition, OPERA Enterprise Solution offers products for hotel chain's corporate office that includes a central reservations system(CRS)for both centralized guestroom and function‐space sales, and enterprise information system, the customer relationship management(CRM) package specifically designed for hotel industry.
1‐4‐3‐ E‐Marketing strategy
Information and communication technologies enhance the ability of organization to manage their resources, increase their productivity, communicate their policies and market their offering and partnerships with all their stakeholders, namely consumers, suppliers, public sector organizations, interest groups, etc. ICTs include not only the hardware and software required but also the groupware and Netware as well as intellectual capacity (human ware) to develop, program and maintain the equipment (buhalis, 2003, 6).
Explore strategies and techniques that you can use on the Internet that will enhance and support your business's overall marketing objectives. Internet marketing can attract more people to your website, increase customers for your business, and enhance branding of your company and products. The E‐Marketing Strategy is normally based and built upon the principles that govern the traditional, offline Marketing ‐ the well‐known 4 P's (Product ‐ Price ‐ Promotion ‐ Positioning) that form the classic Marketing mix.
According to Porter's overall approach, Harmon extends and gives a new sense of dynamics. Flowing Figure illustrates an e‐business strategy process that is conceptualized as continues cycle. In effect, the strategy team never completes its task; it simply works to develop a temporary understanding, makes commitments, and then evaluates the results as it cycles through a subsequent cycle in order to arrive at a new understanding (Harmon,2001).
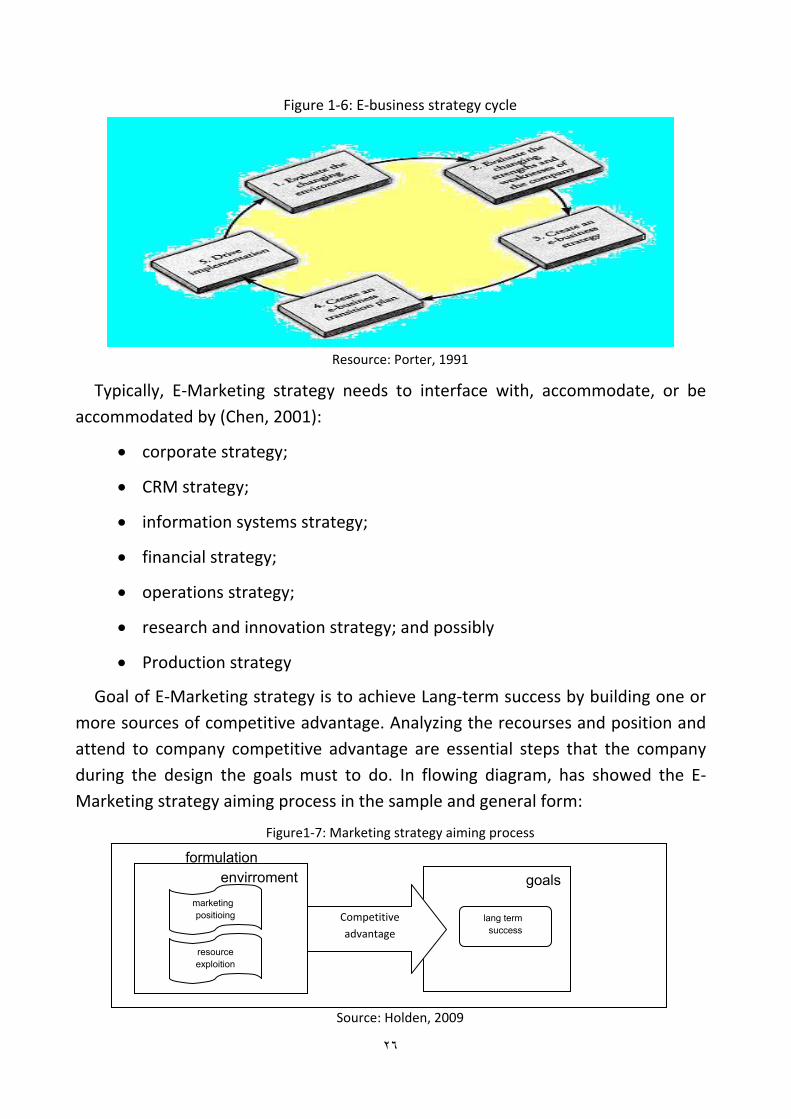
٢٦
Figure 1‐6: E‐business strategy cycle
Resource: Porter, 1991
Typically, E‐Marketing strategy needs to interface with, accommodate, or be accommodated by (Chen, 2001):
• corporate strategy;
• CRM strategy;
• information systems strategy;
• financial strategy;
• operations strategy;
• research and innovation strategy; and possibly
• Production strategy
Goal of E‐Marketing strategy is to achieve Lang‐term success by building one or more sources of competitive advantage. Analyzing the recourses and position and attend to company competitive advantage are essential steps that the company during the design the goals must to do. In flowing diagram, has showed the E‐Marketing strategy aiming process in the sample and general form:
Figure1‐7: Marketing strategy aiming process
Source: Holden, 2009
formulation
envirroment
goals
Competitive advantage
resource exploition
marketing positioing lang term
success

٢٧
Designers must decide about different matters. There are many issues to cover, so without more ado, let us examine the eight e‐strategy decisions (Buhalis, 2004):
‐ Decision 1: Target market strategies
‐ Decision 2: Positioning and differentiation strategies
‐ Decision 3: Renouncing ‐ Internet marketing priorities
‐ Decision 4: CRM focus and financial control
‐ Decision 5: Market and product development strategies
‐ Decision 6: Business and revenue models including the marketing mix
‐ Decision 7 Organiza onal restructuring required.
‐ Decision 8: Channel structure modifications
Strategy formulation will involve defining a company’s commitment to the Internet; setting an appropriate value proposition for customers of the web site; and identifying the role of the Internet in exploiting new markets, marketplaces and distribution channels and in delivering new products and services.
E‐environment: Introduction, Social factors, Taxation, Economics and competitive factors, globalization, Political factors, Internet governance, E‐governance, Technological innovation and technology assessment;
Management of mobile commerce services: Content development and distribution to hand‐held devices, content caching, and pricing of mobile commerce services The emerging issues in mobile commerce: The role of emerging wireless LANs and 3G/4G wireless networks, personalized content management, implementation challenges in m‐commerce, futuristic m‐Marketing services;
Analysis and design: process modeling, Data modeling, Design for E‐Marketing, security design for E‐Marketing Analysis;
E‐Marketing: E‐Marketing planning, Situation analysis, Objective setting, Strategy, characteristics of new‐media marketing communications, Tactics, online branding, Actions, Control
E‐procurement: Drivers of e procurement, estimating e‐procurement cost savings, Risks and impacts of e‐procurement, implementing e‐procurement, electronics B2B marketplaces;
٢٨
E‐Marketing strategy: E‐Marketing strategy, Strategic analysis, Strategic objectives, Strategy definition, Strategy implementation, information systems strategy and E‐Marketing strategy.
E‐Marketing infrastructure: Internet standards, Managing E‐Marketing infrastructure, web service and service‐oriented, new access devices, E‐Marketing fundamentals: Introduction, E‐Marketing environment, E‐Marketing marketplace, portals, Location of trading in the marketplace, Commercial arrangement for transactions, Revenue models, internet start‐up companies‐the dot‐com (Xiaoming, 2009).
1‐4‐4‐ Synergy in tourism with E‐Marketing strategy
This has led many major tourism firms to reengineer their business processes towards a multi‐channel focus to compete effectively against a set of new players; for example, lastminute.com, e‐Bookers and expedia.com(Wober, 2002). The notion of strategic advantage has often been discussed in terms of industry structure25 or from the perspec ve of an organiza on's resources and capabilities (Crispin, 2002). According to Gulati et al., strategic networks are stable inter organizational ties which are strategically important to participating firms. They may take the form of strategic alliances, joint ventures, long‐term buyer‐supplier partnerships, and other ties ( Gula , 2000). Strategic alliances and networks in the tourism industry have often been characterized by vertical, horizontal and diagonal relationships.
How Internet presence can contribute to the achievement of corporate objectives, and the issues of integration and synergy of strategies and activities between e‐business channels and other channels assume significance? The impact of e‐channels is most significant in the information‐based sectors, such as publishing, media, travel agency, consultancy, education and training and financial services, but no business can afford to be complacent. E‐Marketing strategy needs to be integrated with corporate and functional area strategies. Another dimension of synergy arises in the context of the supply chain. The central role of alliances in E‐Marketing is such that businesses need to consider the concept of the virtual organization, and the implications of strategy formulation and delivery not only within an organization, but also across the alliances that make the virtual organization. Rowley (2002) believe that Integration is best when:

٢٩
• there is no meaningful way to separate digital and physical operations without confusing customers;
• senior management is committed to re‐define the entire Marketing value proposition; and
• The entire organization can be mobilized to migrate to an E‐Marketing channel.
Strategy formulation for E‐Marketing has much in common with strategy formulation for other sections contexts or functions in tourism industry. On the other hand, there are number of factors that are unique to E‐Marketing strategy formulation for tourism industry:
• The interactive nature of the channel means that the tourism business has a direct connection with each and every tourist (customer), and not only knows who the customer is, but can collect significant profiles of tourist purchasing activities and other customer characteristics;
• New marketing models and new revenue generating streams that arise from E‐Marketing;
Sawtrey and Perith (2001) argue that The need to accommodate rapid change the business world has become much more complicated, such that the ability to adapt and respond is now as important as the ability to anticipate and act; andMultiple, new and evolving alliances, which on some occasions amount to a virtual organization
The biggest danger of integrated strategies is that the E‐Marketing strategy may be incompletely articulated; inconsistencies between aspects of E‐Marketing in other strategies may not be tested out. A separate E‐Marketing strategy is appropriate when one or more of the following applies:
• It is necessary to manage significant innovation in the development of E‐Marketing activity in a way that cannot be replicated in other arenas.
• E‐Marketing has a significant impact on market operations, customer relations, and competitive market position.
• E‐Marketing is developed as a separate business function.
The key for create synergy in E‐Marketing strategy is that, must will created integration between the E‐Marketing strategy and other strategy and activities and

٣٠
players such as suppliers, stockholders and distributions canals. De Kare Silver (1998) suggests that there are a number of strategic op ons for companies in relation to the importance of the Internet as a channel:
• Use the Internet channel for information provision only.
• Use the Internet channel primarily for export markets.
• Subsume the Internet channel as another channel in the existing business.
• View the Internet channel as another channel.
• Set up the Internet channel as a separate business.
• Develop a mixed system, using a number of parallel channels, with clear objectives for the contribution from the different channels,
• Switch fully to the Internet channel, taking out retail outlets.
The steps in the value chain, supply, production, marketing, delivery and support are the areas in which E‐Marketing has the potential to impact on tourism industry value. To gain a competitive advantage, a company in tourism industry needs to be able to perform some function in its value chain better than its competitors. The E‐Marketing value chain is concerned with the way in which information technology can be harnessed by businesses to generate competitive advantage (Rowley, 2002). Information technology is allowing businesses in tourism industry to become more efficient through decreased costs in sales and marketing, and cost savings in more efficient manufacturing, research and development, and purchasing. A business can gain cost advantages through the use of extranets, enterprise resource planning software and E‐Marketing. Long‐term competitive advantage is usually associated with customer value and customer satisfaction. The use of information technology in order to enhance the relationship with the customer may be achieved within marketing and sales, or through customer support.
1‐4‐5‐ E‐marketing and knowledge management
E‐Marketing doesn't mean only advertising and selling through the internet, it also includes other process such as serving customers and suppliers and managing their relationships, managing all supply activities till delivering products and services to customer, internal communication between employees and external collaboration with other players and partners. Obviously, those activities need to

٣١
collect very information about customers, analyze them and use in time. In addition the tourism industry is depended to information and knowledge resulting from analyzing the collected in formations about customer, market, industry, competitors, suppliers, government, destinations, employees, environment and etc (Alhawamdeh, 2007).
If companies have good information and knowledge, they can build suitable and useful strategies and change the weaknesses and treats to strengths and opportunities. Knowledge management (KM) tools are all technologies and resources that enable the date and knowledge transfer, generation and codification. It does not mean that all KM tools are computer‐based applications; knowledge can be transformed via phone calls and mobile. KM can help to better organizing and evaluation of customers and suppliers' requirements and relationship (customer‐suppliers oriented trends). Also, with select appropriate E‐Marketing model (initiate step for E‐Marketing strategy), can allow you to predict the size of the competition; support the decision making process in E‐Marketing and design the strategy for it in tourism industry. They show KM value chain components begin from creation to storage and distribution of knowledge.
1‐4‐6‐ E‐Marketing security
Electronic marketing is selling of goods and services across the internet. Commercial activities over the internet have been growing in an exponential manner over the last few years. In cyberspace, both the customer and the vendor have difficulty in proving their identity to each other with certainty, particularly during a first transaction. When it comes to payment, one needs to establish a sense of security. Customers must be able to select a mode of payment and the software must verify their ability to pay (Nada, 2008). This can involve credit cards, electronic cash, encryption, and/or purchase orders. The more of these techniques are supported by an E‐Marketing package, the more secure the system can be, and therefore the more customers are benefits from E‐Marketing abilities (Olkowski, 2001).
1‐ The success or failure of an E‐commerce operations hinges on myriad factors, including but not limited to the business model, the team, the customers, the investors, the product, and the security of data transmissions and storage. There are different policies used to ensure and measure security in E‐commerce

٣٢
environment, we shall explain some of them in the following sections, which are (Michall, 2003):
• Privacy policy
• Cryptography [1‐ Secrete key cipher system; 2‐ Public‐key cipher system]
• Certificate
• Pretty Good Privacy (PGP): [Confidentiality and Authentication].
Public Key Infrastructure (PKI) refers to the notion that the best way to establish a system of secure communications over networks is to establish an infrastructure that will support public key encryption. The PKI would create an environment where any Internet user could "carry" certificates around that identify them in a variety of ways. Authentication of parties could become very cheap and easy. E‐Marketing software packages should also work with secure electronic transfer (SET) or secure socket layer (SSL) technologies for encryption of data transmissions.(SSL) protocols, which allow for the transmission of encrypted data across the Internet by running above the traditional TCP/IP protocols (Mark, 2006).
1‐5‐ Tourism E‐Marketing
Tourism marketing can be regarded as a process of creating and developing combination of tourism offering to deliver to tourists’ memorable and satisfying experience and at the same time fulfill the social, economic and ecological development goals of the host community (Hus&etc, 2008, 6). The internet can be considered as last revolution in distribution of tourism information and sales. Internet is even becoming the primary channel for b2b and b2c communica on. It offers the suppliers the potential to by‐pass intermediaries in the value chain and increases their revenue base.
Tourism and technology are going hand in hand together. The availability of time and disposable income propelled the industrialization of tourism as new phenomenon, allowing working‐class people to include travel and holidays in their annual activities and budget. IT and ICTs are now a key determinant of organizational competitiveness as result of several major developments, by Cunninham (2002) opinion, they are including:
Massive enhancements in processing capability; Increase of computing speed;

٣٣
Decrease of equipment size; Reduction of hardware and software costs; globalization of demand and supply, particularly in tourism Evolution of business models to collaborative models; and Improvement of reliability, compatibility and interconnectivity of terminals and applications
These developments have a great effect on the operation, structure and strategy of innovative and technological advanced organizations. For example, on the one hand IT and E‐marketing allow people to increase, via higher productivity, their disposable income and leisure time and thus enjoy their recreational activities. On other hand, they provide the info‐structure for the development and operation of tourism suppliers who can attract and serve consumers from all over the world.
Executing marketing program can be done with the help of E‐Marketing via electronic devices such as telephone and internet. Previously Electronic devices and internet were used as a device to increase the variety marketing activity as well as its speed. Mid the developing Electronic, devices and increasing related knowledge’s and users, new ways with huge advantages, opportunities, techniques and tools were introduced. Through research by lary Dotson (2002, 35), tactics in E‐Marketing were introduced, some of which are as followed: News group, E‐Marketing via chatting, e‐mail, web sites, e‐sales, offline marketing and so on.
Today using E‐Marketing for companies have become a priority. As time passes and E‐Marketing increases, the need of E‐Marketing for Tourism Industry (T.I) is also becoming vital. It is a necessity for this section (T.I) to survive and compete in the tourism market (Buhalis, 2003).
1‐5‐1‐ E‐Tourism
Tourism is a very information intensive activity. A total system made of Electronic devices is influencing the Tourism industry. In recent years there have been many used of Information and Communication Technology (ICT) in tourist industries. Some authors have given the term ‘E‐tourism’ for the use of ICT to tourist industries. This mainly includes the e‐commerce applications for managing tourism business with the help of information systems. No one can ignore this influence. Since people are getting use to new electronic devices, they are after new e‐channels, get in touch with T.I. “The interesting point is that, most of the technologies have been demanded by people but it has been introduced by few

٣٤
tourism companies” (Buhalis, 2004). Electronic devices can be used for advertisement, direct marketing, public relationship, CRM and establishing database bank.
Keeping up with world trends of e‐tourism and implementing information communication technologies, improving the relationships with the current customers, new and potential customers are a necessity in order to raise a profitable on line tourism portal.
Considering the so‐called globalization of the knowledge‐based information structure of the economy, information and communication technologies are tightly linked with tourism. In fact, since the implementations of the first computerized reserva on systems (early 1960’s), the tourism sector is one of the most extensive “user” of the information and communication technologies (ICTs).The gathering, processing and communication of information are the key to sector (kotker, 2009).
It can also provide priority, constant competitive advantages for companies. Improving the system of distribution, eliminating unnecessary dealers and its costs and establishing online fairs can be another benefit of e‐devices. In general, the importance and necessity of ICT (International and Communication Technology) and E‐Marketing are clear in the following (Marr n 2005):
1. A tool to increase consumer satisfaction via customizing and being consumer oriented
2. Reduction in cost of collecting information and marketing 3. Establishing direct relationship between consumers and distributors 4. Using of multimedia for advertisement, distributions and better sale. 5. A tool for developing useful and up‐to‐date information 6. Assisting to developing and improving direct marketing
International companies, hotels, agencies, airlines, different places for visiting, tours and other relative active organizations in the said industry can apply electronic devices to develop their activities and increase their share in the market, and their revenue in return (Peschike, 2001). The more influence of IT and tourism E‐Marketing, cause reengineering of process, innovation in marketing strategies and macro strategies of companies as well. Regarding advantages of E‐Marketing and its application in tourism industry, using tourism E‐Marketing seems very necessary.
٣٥
1‐5‐2‐ E‐Booking system
An e‐Booking system is an online web‐based booking service that is provided directly through the Web. At the same time, it enables hotels and other tourism service‐providers to accept instant and real‐time reservations. The system can be designed in order to manage all type of bookings, whether made directly by tourists or through travel agents, tour operators, hotels or other tourism service‐providers (ΓΝΟΡΑ, 2005). Hence, e‐devices will be able to act as an intermediary between tourists, who would like to make on‐line travel reservations and any tourism service‐provider who would like to promote its services/products. In this framework, Tourism’s e‐Booking system either can be seamlessly integrated into the existing tourism’s website or will function as a separate but dynamically driven website using a model. Another option for E‐tourism is to become an affiliate member with existing online travel service‐providers without having to proceed with the implementation of a separate or integrated e‐Booking system.
1‐5‐3‐ Geographical Information System (GIS)
The use of Geographical Information Systems (GIS) and the Internet has changed the way organizations use geographic information, the processes of accessing, sharing disseminating and analyzing data. The proposed GIS should be a visual and analytical tool that will help tourism companies to understand, visualize and export its geographic information in interactive web‐based maps via the Portal, information kiosks, mobile devices etc. They enable tourists to manage this information interactively and analytically in order to plan and undertake a trip or to make a potential decision (ΓΝΟΡΑ, 2005). Using the system, Tourism industry will be also able to integrate tourism information, visualize complex scenarios, present powerful ideas and derive effective solutions, which would otherwise be impossible to achieve.
1‐5‐4‐ Tourism integration with e‐marketing
E‐Marketing is the integral part of e‐tourism, and e‐tourism includes E‐Marketing. Therefore, the E‐Marketing is as a method of the enterprise management to realize commodity exchange, obviously, it is the very important and basic internet business activities of enterprise e‐tourism activities. We can say that E‐Marketing is an important means of implementing e‐commerce, and the e‐tourism is the advanced stage of E‐Marketing developing, so carrying out

٣٦
marketing e‐tourism can't separate from the E‐Marketing, but the E‐Marketing does not equal to the e‐tourism. Next figure gives out relationship of e‐tourism and E‐Marketing (Fangpin, 2005).
As tourism and ITC developments are closely interrelated, it is often difficult to identify whether generate or simply facilitate the change for another. Nevertheless, all the sections in tourism industry have influenced by ICT, with create integrated system for E‐Marketing. Flowed diagram help to better understanding this integrated system and the sections have influenced by it.
Figure 1‐8: Integrated system for E‐Marketing
Resource: Buhalis; 2003
According to Sheldon 1997, informa on is the vital blood for Tourism and Travel industry. Therefore, effective use of electronic marketing (creating data information, advertisement and distribution of information, CRM, customizing, decrease in cost and time and so on) for making tourism industry competitive and successful is necessary. The IT and E‐Marketing standards in different countries (Iran and Germany) are not same but a mentioned, the most important task of internet in E‐tourism is:
Searching information

٣٧
Consumers Data Base
Analyze dates
Video and pictures
CRM
Booking
E‐tourism offers the to easily information accessible and booking opportunities to customers. Also, it make available for companies to book to large numbers of consumers information at relatively lower cost and with offer a good opportunity to create database from customers information and offer the others facilities, help to easy and effective their relationship management as before whit traditional methods and devices. It enables the tourism sector to make large‐scale savings on the production and distribution of print and other traditional activities such as call centers and information centers. It also provides a tool for communication and relationship development with the end‐customers as well as tourism suppliers and market intermediaries (pulevska, 2009).
The E‐Marketing unit will operate as an e‐channel provider that will support the other units of touristic firms and organizations (Marketing department, Tourist Services Department, Tourist Planning Department, Administration Department), in order to provide their services and products via e‐channels (portal, info kiosk, PDAs, etc). The E‐Marketing unit will need to play a major role in developing the e‐tools capabilities and will need to enhance their current capability most significantly. It is important that E‐Marketing strategy has a liaison between Marketing, Channels, E‐Marketing unit and others crucial tourism companies’ departments. Its main role will be to organize and co‐ordinate actions and resolve practical implementation problems in order to develop its marketing strategy.
In order to realize productivity gains, the tourism organizations have to increase the efficiency level of their back office operations. As a matter of fact, the value of CRM initiatives depends on back office processes and the flow of information containing important customer data between the front and back offices of a company (Cunninham, 2002). For the tourism industry, the E‐Marketing methods help to transpose the existing techniques on to cheaper distribution channels and thus developing sales potential.

٣٨
Sophisticated software applications are available, they are called: CRM (customer relationship management); SCM (supply chain management), ERP (enterprise resource planning), and KM (knowledge management). CRM seems to be the most important software application to be used in the tourism sector. In combination with business intelligence software, CRM software helps firms to use more efficiently the information gathered about their customers (pulevska, 2009). The analysis of transaction data, website visits, and destination information usage allow revealing behavioral patterns of tourists.
Figure 1‐9: Relationship of e‐tourism and E‐Marketing
Resource: Fangpin, 2005
E‐tourism marketing is different from a single e‐tourism or E‐Marketing, but it is an integrated E‐Marketing method by integrating online business managing and transactions activities. It not only has the functions of general E‐Marketing, but also should have the full functions of e‐tourism (Hsu, 2008). E‐tourism marketing is the E‐Marketing in the tourism area, its' smooth developing requires supporting by e‐tourism platforms, and requires supporting by external basic environment such as banks, trading centers, laws and regulations, policies relating to e‐commerce, the necessary internet resources etc. It requires too to supporting by the internal basic conditions such as the concepts and strategies of operating and managing, information technology etc.
However, an enterprise wants to carry out e‐tourism marketing, in addition to build e‐tourism platform firstly, but also needs to make a series of analysis and comparison, and needs to make E‐Marketing programs according to the enterprise demands and internal conditions. Generally, there are four programs on building e‐tourism platforms to be adopted by enterprises, and the workflow of e‐commerce E‐Marketing can be divided into three main stages (Xiaoming, 2009).
E‐Tourism

٣٩
Table 1‐5: E‐tourism marketing process Three stages Market analysis and research Constructing e‐tourism platform Implementing e‐tourism marketing
Content (work steps)
Content of analysis and research: 1. Product characteristics 2. Competing environment 3. Financial condition 4. Human resources
Four plans to constructing e‐tourism platform: 1. E‐tourism platform wend by the
enterprise 2. Third‐party e‐tourism platform 3. Collaborative e‐tourism platform 4. International e‐tourism platform
Steps to implement e‐tourism marketing: 1. Information collecting 2. Information publishing 3. Web promoting 4. Online negating and signing of contact 5. Online transacting and paying 6. Commodities transporting and after sales
service
Resource: Xiaoming, 2009
E‐Marketing module should have functions such as search engine marketing, online advertising and other "wired" E‐Marketing, as well as short message marketing and other "wireless" E‐Marketing methods (Fangpin, 2005). At last, this subject can say that E‐tourism marketing module should have functions that meet customization needs of customers, industry negotiating, online signing, online payment and settlement, commodities distributing and logistics services, after‐sale service etc.
1‐5‐5‐ CRM1 and E‐Tourism
Companies that are working in tourism industry, now realize that data capturing, storing and analyzing customer data can provide them with competitive strategic advantage. This database technology is fuelling the growth of new marketing paradigms, variously referred to as, “one to one marketing, relationship marketing or micro marketing” (Vallas& Becherel, 1999, 116). The database can also be used to test the development of new products. The most common usage of customer’s database is the management the relationship between customers and company as is new paradigm in E‐Marketing in order to increase the customer satisfaction and sales.
The tourism organizations culture and organizational structure are two main barriers to the adoption of e‐CRM solutions. The complexity of travel products and the periodic changes in consumer tastes and behaviors are considered as additional barriers to the adoption of e‐business methods in CRM. according Pulevska (2007) viewpoint E‐CRM features are classified in three groups:
• Contact and information, general e‐CRM features (e.g., site customization, site search engine, mailing lists, prominently displayed mailing address and company profile, chat, bulletin board);
1 Customer Relationship Management

٤٠
• E‐commerce features (e.g., online shopping, online product information, product preview, links);
• Post‐sales support features (e.g., complaining ability, extra parts)
Firms are continually seeking new ways to forge close relationship with their most valuable customer. With relationship marketing proposing that keeping existing customers is cheaper than acquiring new ones, a need for better understanding of existing customers was developed; making relationship marketing depended on rich up‐to‐date information and database about customers and other players. IT and E‐Marketing have great potential and set the way and a ground for the development of customer relationship management (CRM) system (Willcocks, 2007, 2‐4).
The Internet can be considered as the last revolution in the distribution of tourism information and sales. Internet is even becoming the primary channel for business‐to‐business communication. E‐CRM can be defined as the translation of existing techniques for finding customers in the electronic environment. It provides products and services customized to the needs of the customers. It helps to retain customers’ loyalty and attend the needs for information and support in the use of the tourism products. CRM will increase the manager effectiveness and help the overall planning process. Benefits like these can be provided (Pulevska, 2007):
Automated ticket support.
Forming printed documentation on different languages.
Quick tour cost calculation.
Registering and storing visa applications.
Creating statistical and analytical reports on the company sales
Control over the agents work.
Document visa
Managing business processes.
A good CRM system focus and supports all the marketing activities, building good customer relations, providing higher ROI2 over time for tourism industry
2 Return on investment

٤١
through well organized and targeted marketing. As organizations (in tourism industry) work hard to develop and apply IT in new ways, the need to identify and implement an IS3 and E‐Marketing strategic plan are continued. (Cocks, 2007, 12).
The implementation of a CRM system requires changes at organizational, managerial, marketing, sales and technical levels (next table). As it can be seen in next table, the strategic planning process is one of the major elements of the organizational change:
Table 1‐6: CRM system requires changes Organizational Managing change Sales and marketing Technical
Incorporating ‘customer’ into the business planning cycle
Changing the bound- arise of marketing sales and communication channels
Incorporating ‘customer’ into marketing decision and sales operations
Providing an evolving, user friendly CRM-system
Setting customer-related objectives
Changing the customer culture to be customer-oriented rather than product-focused
Centralizing control of the sales and marketing process
Building the CRM database from the operational or ‘legacy’ systems
Multi-function teams required to implement customer relationship programs
Implementing a process of ‘Continuous change’
Learning the new skills of CRM-based marketing
Providing a cost effective environment with good performance
Resource: Gurau, 2003
Ultimately, the organizations’ success in CRM will involve creating an appropriate strategic vision of the future, making the appropriate choice of applications, creatively using appropriate analytical techniques to exploit the data, and finally, incorporating the customer‐centric procedures into a flexible strategic planning process.
1‐5‐6‐ E‐Marketing challenges
Companies in tourism industry in order to implementation E‐Marketing and design a suitable strategy encounter different challenges. In other word Performance an E‐Marketing strategy and E‐CRM strategy there is different problem. Some of them related to the E‐Marketing nature and some of them depend to environment and strategy nature. More than there are some problems, they comeback to tourism industry
3 Information system

٤٢
Defining a customer first of them. Define the customer unit is the first challenge. [66] The company’s knowledge about its customers is often vague and general. A second challenge is linking customer information into a single customer record when they leave and return multiple times during their lifetime. The answer to these questions is industry specific (Gurau, 2003). Customers’ segmentation is another problem. Customers’ segmentation is not very precise, the company taking advantage of the low cost of Internet communication to publish the offer online or to send promotional messages to all its existing customers. The strategic objectives of the firm are also vague, since the company cannot accurately predict customer behaviors.
With study of online leisure market statistics, we can see, mid outspread internet and development related technology and software, the online leisure and travel market and business are increasing speedily. The chart shows online leisure and travel market share from total leisure and travel market in European.
Figure 1‐10: online leisure and travel market in European
Resource: phoCuswright's European Online Travel Overview Third Edi on 2009
Selecting a quality Search Engines for their E‐Marketing activities and an Independent Websites establishing are two most vital effective elements in successfully the E‐Marketing strategy and e‐strategy. Companies, which are active in virtual market and use E‐Marketing, must have a strategy. E‐strategy has differences from traditional strategy and companies must attend to these differences. In addition, they must some do of activities to make attractive E‐

٤٣
Marketing. In flowing men oned 10 Top E‐Marketing musts, which are useful to define Online Marketing Strategy (Ellsworth, 1995):
1. Identify your target market by researching what people are searching for in your area on the internet.
2. Content is King: Create content, which addresses the needs of your customer.
3. Make link building an integral part of your online marketing efforts 4. You will increase online conversions by offering convenience and value. 5. Lowest Rates Guaranteed 6. Develop a well‐defined and ongoing email‐marketing plan inside E‐Marketing. 7. Participate In Distribution Channels! 8. Return on Investment 9. Online Tracking 10. Build A Good Online Reputation
According the Jeffry (2004), most important elements in the broad environment, as it relates to a business organization and its operating environment, are economic, technological influences and political influences. So in an E‐Marketing strategy are changes for companies. Also more than, Total quality management in E‐Marketing strategy is big challenge for tourism companies. It includes Design and organization, General, operations, Human Resource Development, Quality and Process Improvement, Marketing and Sales, Accounting and Control; and capacity.
Trust is very importance factor in E‐Marketing and for both of the tourists and companies in Tourism industry. The nature of trust within the network is thus imperative. Gulati et al. (2006) note that trust is generated through the ability of partners to gain greater knowledge of each other’s resources and capabilities thus leading to referrals. Technologies also become obsolete very quickly and the responsibility of maintaining systems is thus devolved to the network of partners. However, trust between partners is imperative if the network is to be successful. Partners should be selected wisely, ultimately to enhance the competitive position of the tourism e‐mediary and gain a network advantage(Crispin, 2002). From a theoretical perspective, the strategic management literature should take a more holistic approach to the strategic ad‐vantages of the entire network of partners as opposed to merely the sole firm. The critical success factors of a tourism e‐mediary network also need to be further explored.

٤٤
Using E‐Marketing makes marketing easier than as ever before for companies and has brought many advantages for them. Beside advantages, it has made new challenges for their e‐commerce and E‐Marketing activities. There are varieties of challenges, which make E‐Marketing complicated. In flow diagram have showed five major e‐commerce and E‐Marketing challenges, which are the results of consider companies’ documents in Iran and Germany tourism industry and related articles; and they can be common in all situations:
Figure 1‐11: E-commerce and E-marketing challenges
Resource: G albraith, 2002
Theses mentioned, create challenges for both the customers and companies. Nevertheless, the kind and mass of the challenges is different in different countries with different level of technology, companies with different kind of produces and customers with different lifestyle.
16 Tourism EMarketing Strategy It is obvious that all companies which work in tourism industry for achieving
their goals and success; need to design a suitable strategy, specifically for E‐Marketing activities. A strategy is a fundamental pattern of present‐programmed goal, productive activities, allocation of resources and interaction between an organization and its customers, markets, competitor, other environments elements (I.Jay and P.Rajon, 1999). As has been said, the success of a company, in increasingly competitive environment, is dependent on the strategies, which will
Uncertain board for commerce and companies
Digital and e- product trade
Appearing the e-organization and e-agency
The trade time and process decreasing
Change the trade models
E-commerce and E-marketing challenges

٤٥
differential the company from the competition. The challenge is not to have the best strategy, but an effective strategy, which can be implemented in company's qualifications.
Results from study in Canada tourism show, some 51% of small establishments have an E‐Marketing strategy compared 69% of large establishments; globally 58% of establishments as a whole have an E‐Marketing strategy (Cote& others, 2009). The tourism and hospitality business and industry is fiercely competitive. As using internet and number of internet users have increased and insides' it, the trend to travel, specialty international travel growth began to level off, the companies increased its investments in E‐Marketing activities. Internet and electronic devices have had great effect on marketing and have brought great change to marketing strategy and also to companies in tourism industry.
The virtual tourism market space is becoming increasingly competitive, as online players vie for the attention of consumers who have the opportunity to access and purchase from multiple channels. According to Amit and Zott(2001), virtual markets refer to ‘settings in which business transactions are conducted via open networks based on the fixed and wireless Internet infrastructure’. They argue that there are a number of characteristics that can be associated with virtual markets; high connectivity, transaction focus, the importance of information goods, networks, and high reach and richness of information. Amit and Zott also note the influence virtual markets are having upon business structures, including disintermediation and reinter mediation, and the restructuring of industry boundaries as businesses collaborate and outsource. This is particularly relevant within the tourism industry, which has been characterized by changing distribution networks3, 4 and the forma on of disparate tourism collaborations across industries.
E‐Marketing has been created plenty of advantages for supplier as well as consumers. Among those advantages some are more remarkable such as: easy access, high speed, increasing revenue, decrease in cost due to ignoring dealers (intermediate), decrease in number and cost of human resources, improving of distribution, on‐time information producing and saving time (Galbraith, 2002). Attending to the strategy designing stage with focus on tourism E‐Marketing subject can answer to some of the important questions in designing tourism E‐Marketing strategy. In flowing mentioned some of them by Jendricke(2010):

٤٦
:
1. Analyze the external and internal environments: this answer to
What are the main barriers to E‐Marketing?
What are the conditions that enable E‐Marketing?
2. Select the business strategy: this answer to
How can E‐Marketing create economic value and competition advantages?
How can they position themselves in tourism market and industry?
3. Impalement the strategy: this answer to
What are the most suitable technological solutions?
What mode of E‐Marketing procurement should be chosen?
4. Evaluate the success of the strategy: Financial indicators, internal processes indicators, customer indicators, and learning and growth indicators.
Why are some companies in their marketing activities (E‐Marketing) in virtual market (e‐market) successful, while so many other businesses fail? Some organization may just be lucky, but its' only in short term will happened. The most companies that are highly successful over the Long term effectively acquire, develop and manage resources and capabilities that provide competitive advantage. In last decade, E‐Marketing was an advantage for company to sales, and catches and keep customer and increase their satisfaction (Harrison&Enz,2007,3). But with beginning the new century and develop the internet, computer, software, decrease the cost for company and people and access many of the people to internet, all the company, especially in tourism industry, are indispensable to use E‐Marketing for keep their customer and continue their commerce life in competitive market.
1‐6‐1‐ strategy Important for tourism e‐marketing
The growth in E‐commerce and E‐Marketing occurred when businesspersons realized that people were using internet. Travel and tourism is often singled out as one of the fastest growth areas of e‐commerce and E‐Marketing (vallas&Becherel, 1999, 6). E‐Marketing creates an added value for tourism products and tourists.

٤٧
The added value is the value a player brings to game, for example booking service is added value for accommodations in tourism industry. Nalebuff and Brandenburg (1997) propose a framework to analyze the elements of the PARTS of strategy that are, players, added value, rules, tactics and scope. Each of them is a strategic level that can change the game, E‐Marketing plan and strategy.
Appropriate strategies make goals accessible. This means improvement of process, suitable status, and better share in market and increase in consumer satisfaction. General strategies may be applicable in all markets, but in e‐markets and E‐Marketing some strategies have been introduced. These strategies are called as transaction strategies, database‐marketing strategies, communication marketing strategy, knowledge oriented marketing strategy. However, what is important here is to illustrate the effective elements, which are vital for the success of these strategies.
Very simply put, E‐Marketing or electronic marketing refers to the application of marketing principles and techniques via electronic media and more specifically the Internet. The terms E‐Marketing, Internet marketing and online marketing, are frequently interchanged, and can often be considered synonymous. E‐Marketing is the process of marketing a brand using the Internet. It includes both direct response marketing and indirect marketing elements and uses a range of technologies to help connect businesses to their customers.
According the Tony Proctor (2008, 1) "a strategy is plan that integrates an organizations major goal, policies, decisions and sequences of action into a cohesive whole. It can apply at all levels and pertain to any of the functional areas of management". With good strategy, company answers' to the very vital questions and problems as: Who, Where, which, when, what and so on. Strategy has different levels such as; corporate, business, department and functional. Companies have to analyze and attend to factors in each level and integration between them. The next figure shows this level according to Yaroslavl (2008):

٤٨
Figure 1‐12: levels of strategy
Reference: Yaroslavl (2008) [6]
E‐market and E‐Marketing brought very beneficial advantage for companies and consumers but it changes the markets environment and relationship, than create new challenge for them. Today's, tourism industry and the companies work in this industry have been must use E‐Marketing to can continue their live and activities. More than, for successfully in the competitive market and attract more customer and satisfaction their consumers need to design the suitable strategy.
1‐6‐2‐ Web‐CRM Strategy
The Web can be used to establish direct marketing channels between firms and consumers (Lau et al., 2001). Through data mining tools, it is possible to make use of the personal information on a visitor’s web site and identify his or her interests and needs. Based on such understanding, firms can send e‐mail messages and offer service packages especially designed for a potential customer, based on the marketer’s assessment of the individual’s interests. Because of increased competition among producers offering their products and services on the Internet, generating revisits to companies’ web sites has become a major challenge for many companies. In order to generate revisits, substantial amounts of resources are used in efforts to develop superior web sites that attract customers (Supphellen&Nysveen, 2001). Tourism industry could be the biggest user and winner of the E‐Marketing (internet and e‐commerce) in the world businesses. This is due to the nature of tourism services and products and its structure.
٤٩
The strategic orientation, performance in specific dimensions and marketing activities have a contingent relationship: the companies choose a type of strategy to obtain excellence in particular dimensions of performance, and execute each strategy by choosing marketing activities.
1‐6‐2‐1‐ Web Customer Analysis: This is a major role within E‐Marketing and should have the responsibility of understanding web user behavior and implementing web customer contact in campaigns. The principle activities to be undertaken are the development of various measures of user behavior and value, particularly (Jeffrey, 2007):
• Web Customer segmentation
• Propensity models (i.e. the probability of a customer selecting a particular tourist product/service)
• Web Customer and web product profitability measures
• Data mining activities
• Campaign performance assessment
1‐6‐2‐2‐ Web-Design: Entertainment, in formativeness and organization profiles of web sites are useful descriptive dimensions, which in their study have correlated with attitude towards the site.
1‐6‐2‐3‐ Web-Promotion: This section refers to the development and maintenance of a competitive set of e‐products, the build‐up of strategic partnerships and co‐operations and the participation in online promotions. Marketing and tourism knowledge is required (Kotler, 2006). The advertising hierarchy of effects as measured by several common attitude measures, namely attitude towards the ad, attitude towards the brand, attention to the commercial, purchase intention, and its antecedents in the context of the web.
1-6-2-4- Web Customer Communications: Web customer communications, through portal, belong to a third section proposed for the E‐Marketing unit. Under the tourism E‐Marketing strategic action plan, there would be different activities involved in:
• E‐Marketing campaign design
• E‐Marketing campaign planning
• E‐Marketing campaign execution

٥٠
1‐6‐2‐5‐ Web-Price: On the one hand, there are Internet dynamics that flatten the customer value pyramid and On the other hand, firms may create customer‐switching barriers, differentiate on other dimensions of the purchase decision and reduce transaction costs. The fundamental value of the Internet lies not in lowering prices or making them consistent but in optimizing them in three ways. First, the Net allows companies to set and announce prices with greater precision since different prices can be tested easily, and customers´ responses can be collected instantly. Second, as it is so easy to change prices on the Internet, companies can adjust prices in response to even small fluctuations in market conditions, customer demand, or competitors´ behavior. Third, companies can use the click stream data and purchase histories that they collect through the Internet to segment customers quickly and offer segment‐specific prices or promotions immediately (Lages, 2004).
1‐6‐2‐6‐ Web-CRM: Through data mining tools, it is possible to make use of the personal information on a visitor’s web site and identify his or her interests and needs. In order to generate revisits, substantial amounts of resources are used in efforts to develop superior web sites that attract customers.
During the last decade (2000‐2010) of web presence the portal exploringmacedonia.com successfully managed to incorporate several e‐CRM features in order to track and retain e‐customers such as multimedia, reservation, product customization, and support (Lages, 2004):
Site customization (news, destination offerings and other information customized according to the customer’s interest); Multimedia (information about the destination presented through moving pictures, sound and graphics, e.g., Flash animation or a streaming video); Product customization (customized trip according to the customer’s needs, e.g., ordering of a king‐size bed, non‐smoking room, special food or different events); Support (interaction with customer support personnel, e.g., the ability to submit complaints, ask questions and receive help, either directly via chat or later via telephone or e‐mail).
A data warehousing system straitened with data mining software is providing the needed data about customers needs and wants versus suppliers offers. That database could be used to retrieve information about the past preferences

٥١
(climate, season, age, income) of each individual customer in order to improve the relationship with the current customer and provide better service for the next visiting. The customer loyalty could be increased by:
Customer segmentation and focused marketing campaigns.
Bulk email sending of the company news and promotions
Automated envelope printing
The development of the database in order to implement e‐CRM stores all the information regarding the customers, and services suppliers. A linkage exists between different databases in order to automatically pass the information to the others whenever the customer’s record is updated in one system.
The E‐Marketing unit would need to take the leading role in defining the user (web customer) strategy development and how this is to be applied to the customer base. In addition, it is proposed for an E‐Marketing unit to have a section for E‐Marketing channels and tools, such as portal, e‐CRM, Database Marketing system, GIS, online booking, namely “E‐Marketing channels and tools operations”. (Jeffrey, 2007) This section should have the responsibility of designing the processes for each E‐Marketing channel and tool (system) and supporting functions such as portal content, content compilation, designing and publishing of web content.
1‐6‐3‐ Customer Centric Strategy
Electronic marketing the use Internet‐based computing and communications to execute business processes is the fuel for the growth engine of high productivity and prosperity (Saha, 2000). Global online consumer and corporate purchases are growing tremendously. The e‐business infrastructure must, also link the core business functions of the firm through the Internet channels to maintain a constant interaction with customers and provide support. The Call Centre module is a simple desktop application that will enable your business to manage bookings with confidence. Its feature‐rich functionality makes it easy to manage all your call centre enquiries within a single user‐friendly environment. Every aspect has been designed with the Call Centre User in mind.
The online booking system has been optimized to speed both trade and public customers through every step of the booking process. The Call Centre module is

٥٢
quick, efficient and easy to use. An intuitive system has been logically designed to help your Call Centre Staff record bookings and manage transactions with speed and ease. The Call Centre module integrates directly with tourism’s Reservation System and the rest of Travel IT Now “Enterprise” suite. The above general idea is integrated to develop a customer‐centric e‐business model and Nintendo (2002) describes the basic building blocks of this model:
Electronic store: An electronic store (e‐Store) is a virtual realization of a bricks and mortar establishment. An e‐Store offers online customers flexible merchandising capabilities for business transactions. Thus, an e‐Store helps customers’ browsing and searching the Web and select products to buy using an online order management system.
An Automatic Order Management System: The customer selection is processed through an automatic order management and information delivery system. The automatic order management system replaces the error‐prone traditional communication tools like telephones and faxes by online electronic media to improve the accuracy of orders and reduce delivery cycle time.
The ordering steps consist of bill collection and shipping information, calculation of prices and taxes, calculation of shipping and handling charges, determination of payment method, authorization of payment, generation of orders, and acknowledgement of orders. The system supports purchase order payment as well as credit card and debit card payments.
An Automatic Scheduling System: The customer order is processed through an automatic scheduling system. The system checks product specifications and inventory status for standard products while directs product line and customer support team for the customization of non‐standard products.
An Integrated Supply‐chain Management System: The automatic scheduling system links to an integrated and automatic supply‐chain management system. Supply‐chain management system is a critical part of an effective e‐business model (Lee & Whang, 2001). The system automatically links to suppliers, orders supplies, updates information and informs suppliers to allocate resources.
A Networked Customer Support Team: In e‐business process, the Internet capabilities are integrated to have constant interaction with customers, network

٥٣
core business units for customer support, and establish a link to the external environment for competitive analysis as shown in next Figure:
Figure1-13: “Wired” core business units as a support to improve customer service in E-Marketing
Resource: Nintendo, 2002
A Product Customization Infrastructure: Online customers are the ultimate designers of products, therefore, the customization of products and technology is critical to meet customer demands and improve CRM. In order to offer customization, the automatic scheduling system checks the specifications of customer order and links to the product line for the customization of non‐standard products.
The flexibility and interactive are nature of the Internet and allow the possibility of collecting a vast amount of data about online customers and their interaction with the company. Processing this data provides a good basis to segment the market precisely, to predict the behavior of customers, and to implement one‐to‐one marketing campaigns. On the other hand, the volatility of online markets requires an increased focus on customer relationship and customer loyalty. Research shows that a 5% increase in customer reten on can increase company profits by 20‐100% (Bruner, 2008). The loyalty‐based model effectively explains success and failure in the digital business world.
E‐Centric Solutions is a global IT solutions provider focused on delivering customer value through high Quality Processes and Cost‐efficient solutions. E‐Centric has been one of the trendsetters in global delivery practices with our Client‐Centric Model for customer management and delivery (Chaffey, 2002).

٥٤
Before the strategic planning process can be applied to customer centric procedures in order to process efficiently this information and to segment the market, a firm in tourism industry needs to put in place the tools and procedures to collect relevant information about its customers. The implementation of customer‐centric systems comprises a number of essential stages which has shown by Gurau (2003):
collect information about customers;
calculate the customer lifetime value;
Segment the customers in terms of value (profitability) and establish the priority segments.
The Customer Lifetime Value (CLV) consists in taking into account the total financial contribution ‐ i.e., revenues minus costs ‐ of a customer over his or her entire life of a business relationship with the company. Considering the procedure of CLV calculation, in any business according Novo (2001) view, there are essentially five levers of customer value creation: (1) Conquer, (2) Increase revenues, (3) Retain, (4) Reduce recurring costs and (5) Reduce acquisi on costs
Table 1‐7: Main customer‐oriented strategies based on CLV analysis Strategy Tactics Operation
Conquer – increase the number of customers
- improve the existing offer in order to at tract the potential customers close to the existing customer segments - diversify the offer in order to attract new segments of customers
- improve: - product - price - distribution - promotion - increase the product/service Portfolio
Increase recurring revenues
- increase the volume of sales- increase the value of sales – increase both the volume and the value of sales
- diversification - stimulate the demand - upgrade the offer - diversification - stimulate the demand - upgrade the offer
Reduce recurring costs - reduce general costs (administration,maintenance, etc.) – reduce cost of: - product/service - distribution - communication
- increased efficiency - cheaper supplies -cheaper outsourcing - increased efficiency
Retain - increase lifetime
- increase customers’ loyalty maintaining and/or increasing customer satisfaction
-improve present offer -better targeting - score better than competition
Reduce - acquisition costs
- better targeting of potential customers - improve offer - improve targeting - use the same resources more efficiently
Resource: Gurău, 2002

٥٥
Segmentation is the key to understand the lifetime value of a specific customer, and to apply the most appropriate customer management strategy (Bacuvier, 2001). The segmentation is performed creating customer profiles. Profiles can be demographically or behaviorally, and both these types of profile are important in their own ways (Novo, 2001). The identification and definition of customers’ profiles is important not only for the existing market of the firm, but also for its future clients. Once the main customers segments have been identified and their behavioral profile defined, the online behavior of any new customer can be compared with the existing profiles.
In the light of their professional experience, the marketing managers will delegate to operational managers the responsibility for implementing and coordinating the marketing strategies on a day‐to‐day basis. In order to satisfy customers’ demands, the operational manager will get involved in the resource management process. The necessary resources can be very varied, including core products and services as well as supporting operations such as logistics, distribution, and payment processing, and servicing (UNCTAD, 2004).
1‐6‐4‐ Relationship marketing strategy
At the core of relationship, marketing is exchange, which is profitable to parties involved in the exchange. The concept of exchanges as it applies to relationship marketing can be viewed at from either a transaction cost analysis approach or a social exchange theory approach. Relationship marketing refers to a wide range of ‘relationship type strategies’ that have developed over the past few decades in product as well as service markets and in consumer as well as business to business sectors (Lee, 2001). Many global packaged goods manufacturers regard resellers (wholesalers, retailers) as their customers.
In industrial marketing, relationship marketing is referred to as marketing oriented towards strong, lasting relationships with individual accounts (Jackson, 1985). From a sales management perspec ve, the term rela onship marke ng is applied to a number of different marketing activities ranging from consumer frequency marketing programs to selling activities directed towards building partnerships with key business‐to‐business customers (Weitz and Bradford, 1999). They also state that channel rela onships are dependent on (1) con nuity of rela onship (2) trust and (3) communica ons (Kanagal, 2008). Consequently developing relationships with resellers is also an important part of RM effort in
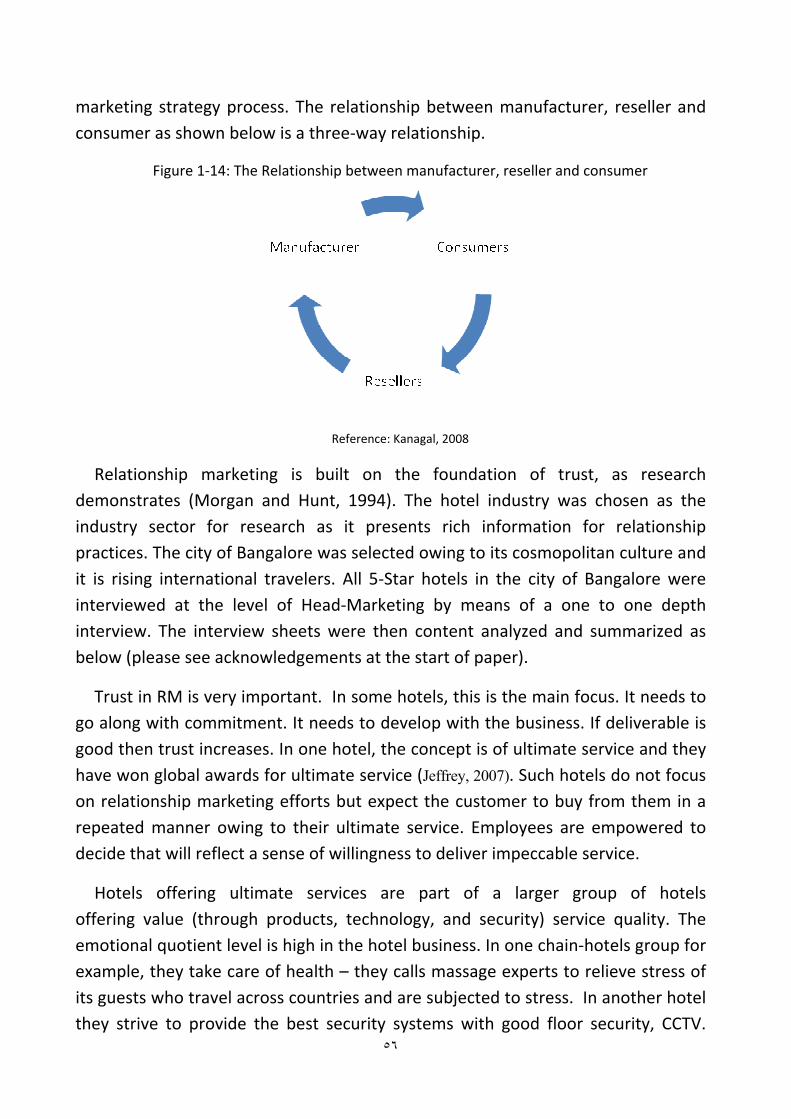
٥٦
marketing strategy process. The relationship between manufacturer, reseller and consumer as shown below is a three‐way relationship.
Figure 1‐14: The Relationship between manufacturer, reseller and consumer
Reference: Kanagal, 2008
Relationship marketing is built on the foundation of trust, as research demonstrates (Morgan and Hunt, 1994). The hotel industry was chosen as the industry sector for research as it presents rich information for relationship practices. The city of Bangalore was selected owing to its cosmopolitan culture and it is rising international travelers. All 5‐Star hotels in the city of Bangalore were interviewed at the level of Head‐Marketing by means of a one to one depth interview. The interview sheets were then content analyzed and summarized as below (please see acknowledgements at the start of paper).
Trust in RM is very important. In some hotels, this is the main focus. It needs to go along with commitment. It needs to develop with the business. If deliverable is good then trust increases. In one hotel, the concept is of ultimate service and they have won global awards for ultimate service (Jeffrey, 2007). Such hotels do not focus on relationship marketing efforts but expect the customer to buy from them in a repeated manner owing to their ultimate service. Employees are empowered to decide that will reflect a sense of willingness to deliver impeccable service.
Hotels offering ultimate services are part of a larger group of hotels offering value (through products, technology, and security) service quality. The emotional quotient level is high in the hotel business. In one chain‐hotels group for example, they take care of health – they calls massage experts to relieve stress of its guests who travel across countries and are subjected to stress. In another hotel they strive to provide the best security systems with good floor security, CCTV.

٥٧
There are also periodic reports on food tests on whatever is eaten to say that they care for the customer. Another hotel went all the way with police procedures to retrieve a stolen/misplaced item of a client who held a wedding party in a hotel (Fletcher, 1992).
Relationships with the government lead to important information, which can lead to advantages. One example is of a hotel that got advance information through a relationship of the location of an international airport and bought land at a low price. Apart from relationships with government, external partnerships with vendors, food sampling and testing through microbiology sections, employee satisfaction, senior citizen package etc help improve company image in the market.
RM programs in hotels include loyalty programs (dedicated loyalty programs are sometimes included), frequency marketing, tie‐up with credit card companies, database marketing (local and central databases, segment focus), direct marketing, guest relationship program, preferred partner programs (one hotel had 350 preferred partners in city), direct email, newsletter, food festivals. Relationships are also driven by rate fixing for room rent, which goes on a variable rate depending on the business. A Customer management practices in one hotel includes:
(a) communication starting with RM manager (b) broadband facilities (c) complementary cocktail hour (d) complementary boardroom facility (e) international newspaper (f) Japanese breakfast (g) capture of customer profile and appropriate reactions. One hotel gave a helping hand to customers who stayed with them a long time for settling in a new home. Relationship marketing efforts give feedback for strategic decisions such as (1) opening up of new hotel, (2) start of new adver sing campaign, (3) compe on ac on / reac ons to be made (Kanagal, 2008).
For RM to lead to competitive advantage the product has to be good operations should support the RM efforts and service delivery has to be excellent. RM is bad when the customer backfires; in this sense, it is a high risk, high return process. Long‐term relationships are beneficial as long as it is professional; there is a thin line between the client and the provider, which has to be maintained. The providers have to continuously demonstrate that these long‐term relationships are win‐ win (Ebrahimy, 2005).

٥٨
1‐6‐5‐ Database marketing strategy
One of the major objectives of competitive marketing strategy is to improve the long‐term financial performance. Relationship marketing by working towards improving profitability based on exploiting its relationships serves this financial performance objective of marketing strategy. Information technology helps store and manipulate extensive information about the customer. This information about the customer is used in marketing called CRM‐customer relationship management. The key analytical CRM applications include (Kelly, 2000): (a) Sales analysis (b) customer profile analysis (c) campaign analysis (d) loyalty analysis (e) customer contact analysis, (f) profitability analysis.
Database marketing is a critical subject for many businesses especially for tourism. However, the principles underlying it are not new. The idea of using information about customers to drive a marketing program is as old as business itself. The tailor who recorded all his customers’ measurements on index cards and then added more personal information created a database. If he used this information to promote his services, that was database marketing. In this situation, the database is central to the company’s marketing activity and, we argue, can fit only with a corporate strategy embracing “customization” (Cooke, 1994). Thus, customer service, customer‐oriented quality, and customer focus are elements of a business strategy with the database at its core.
The alternative is to see the database as a tactical tool. More than in such a context, the database is a tool of marketing efficiency rather than a vital strategic investment. By maximizing customer knowledge, we maximize the penetration of existing products into existing markets and can use the data to assist in identifying and targeting new markets (Fletcher, 1992).
Database Marketing uses databases to hold and analyze customer information thereby helping creating strategies for marketing. DBM usually uses personalized communications. Data mining refers to uncovering relationships about customers from customer data. Advanced software and hardware have made it possible to extract consumer insights that might not have been possible otherwise. Apart from Database marketing (DBM) and CRM, Relationship technology also includes direct marketing (DM) (Holden, 2009).

٥٩
Database marketing (DBM) is often viewed as a tactical marketing tool rather than a strategic one, and as a capability that is easily developed (James, 2009). In fact, DBM is a sophisticated process that requires a systemic approach that integrates a number of organizational departments. Without a systemic approach to DBM, the marketing capability of an organization may be underdeveloped.
The term ‘database marketing’ will be used in this paper to include business‐to‐consumer applications of direct marketing, where direct contact is made with a customer. DBM is an interactive approach to marketing using individually addressable media and channels (Shaw, 1993). The terms ‘data mining’ and ‘predictive modeling’ are used interchangeably to mean the process of analyzing customer data to produce models that predict the behavior of the population in question.
The successful use of DBM as a strategic tool can give competitive advantage to an organization. The benefits of DBM include:
the improvements in the ability to control costs, plan budgets and measure marketing plan performance, the identification of strategic advantage through better use of customer and market information, the facilitation of long‐term customer relationships that increase lifetime value and loyalty, improved accuracy in customer segmentation, and the ability to relate customer characteristics to behavior (Desai et al., 2001).
Advantages accrue to the firm over competition due to process of customization, even if competitor were to offer same level of customization. There are four steps to a one‐to‐one marketing program (a) identifying your customers’ (b) differentiating among customers’ (c) interacting with customers’ (d)customizing your product/service (Chen, 2001). One‐to‐One marketing results in reduced customer attrition and higher levels of customer satisfaction due to improved customer understanding. This improved customer understanding can be used in formulation of effective marketing strategy. Both Database marketing and direct marketing use a database of customer data. In database marketing, database is analyzed to create strategies for marketing while if communication with customers is envisaged to elicit direct response then the concept of direct marketing comes into play. This enables the company to also function as a brand specialist.

٦٠
1‐6‐6‐ Competitive marketing strategy
To be successful, a company must consider its competitors as well as its actual and potential customers. In the process of performing a competitor analysis, the company carefully analyzes and gathers information on competitors’ strategies and programs. A competitive intelligence system helps the company to acquire and manage competitive information. The company must then choose a competitive marketing strategy of its own. The strategy chosen depends on the company’s industry position and its objectives, opportunities, and resources. Several basic competitive strategies are outlined in this chapter (Kotler, 2006). Some of these are time‐tested and some are relatively new. The company must design a broad competitive strategy by which to gain competitive advantage.
Porter (2003) described how the economic power of customers and suppliers influences the ability of a firm to archive economic success and he reviewed factors that lade to high level of competition among direct competitors.
Because Companies cannot offers, all the services alien they need to contact and cooperate with suppliers and others companies. Internet and E‐Marketing meanwhile help to company to better relationship with consumers. Those are practical canals for contact with suppliers and others companies. Nevertheless, companies for gain to maximum benefit of using the E‐Marketing must have observed strategy. According to Mark; with attend to level of Availability and Strategic value; companies can select four different strategies. Next table shows these strategies:
Table 1‐8: Different strategy according of Availability and Strategic value Availability
Low High
Strategic value
High
Partnership Join forces whit an external partner(a consultant or service provider) having the expertise to develop an information system
Preservation Developing an information system entirely in house(revue gestation ‐development, impression paragraph, Calibri tours, moulds industrials, …)
Low
Outsourcing Have an outside supplier develop system(or use the system of an outside supplier)
Recovery Develop an information system jointly with competitors or by marketing an application developed
Resource: mark 2003; porter 2003

٦١
Also noted they can decrease the level of competition. Therefore, they are the most important challenges in an E‐Marketing system. These five factors are potential entrants, suppliers, customers, industry environment and substitutes. Basic competitive positioning winning strategies include (as suggested by Michael Porter, 2003): 1). Overall cost‐leadership; 2). Differen a on; 3). Focus Firms competing in a given target market, at any point in time, differ in their objectives and resources. These firms might take four different forms:
• Market leader—the firm with the largest market shares.
• Market challenger—the runner‐up firm, fighting to overtake the leader Market follower—the firm that also has runner‐up status but seeks to maintain share and not rock the boat
• Market niche—the firm that serves small segments that the other firms overlook or ignore.
One of the major objectives of marketing strategy is to enhance the long‐term financial performance of a firm. In this way attend to market trend and competitive strategy and actions can help to company to have good view about market and their future. Therefore, they can whit select real aims and technique is success. Formulating competitive marketing strategies also involves, recognizing relationships between elements of the marketing mix as well as assessing the impact of competitive and market conditions on marketing mix formulation. Compe ve advantage is realized based on three factors (Sudarshan D, 1995): (1) the firm’s marke ng strategy, (2) implementa on of this strategy and (3) the industry context (Porter’s model).
The electronic revolution has proven to be a powerful stimulus for change in business practice. As a business tool however, the Internet must endure the same scrutiny under which other business activities are placed. If the use of the Internet in business is a sound strategy, then it must contribute toward competitive advantage. The tourism business industry has been isolated from the vagaries of Internet applications. Moreover, as the industry has become more competitive, forcing tourism organizations towards unprecedented levels of accountability and business practice, the Internet has been increasingly seen as a potential 'E‐Marketing' for tourism organizations struggling for revenue (Stewart & Smith, 1999).

٦٢
The Internet changes the basis of competition by radically altering product/service offerings and the cost structure of firms (e.g., cost reductions in production, distribution, and transaction). By reducing customers' search costs, the Internet makes price comparison easy for customers, and thus increases price compe on (Bakos 1998). The price compe on resul ng from lowered customer search costs increases rivalry among existing competitors, reduces switching costs of customers, and thereby shifts bargaining power to customers.
On the other hand, IT reduces menu cost—the cost of administering multiple prices for a number of different products or services—and, in part, facilitates price discrimina on (Bakos and Brynjolfsson, 1997). The Internet creates new substitution threats by enabling new approaches to meeting customer needs and performing business func ons (Porter 2001). World Wide Web (WWW) technology itself has produced new promotion venues. The Internet also facilitates an electronic integration of the supply chain activities, achieving efficient distribution and delivery. It also facilitates partnerships or strategic alliances by networking partners or allies. Some of the useful strategies are:
1‐6‐6‐1‐ Product Strategy: On the Internet, consumers can easily collect information about products or services without traveling to stores to inspect products and compare prices.
An alternative is for companies to make consumers' product comparison more difficult by differentiating their products from others. One possible competitive strategy is product bundling. Product bundling promotes the benefits of the whole package, thus keeping buyers from comparing individual items. For instance, Gateway started bundling its Internet services and computers in response to plunging computer prices (Sinha 2000). Another strategy is innovation or the introduction of niche products, which also counteracts the threat of product substitutes, new entrants into the market, and competition among existing firms. By using the direct access to consumers enabled by the Internet, companies can collect information, identify target consumers, and better introduce products or services to meet consumers' needs (Kotler, 2009).
Companies can collect information on new products desired by small segments of the market. By creating products that meet the needs of consumers in these niche markets, companies can command higher prices (Sinha 2000). Companies can also protect profits by achieving cost leadership in a particular market or

٦٣
industry. If sellers cannot price discriminate, the lowest price sellers can charge is the marginal cost of production. As competition intensifies, companies may have to lower their production costs to protect profits.
1‐6‐6‐2‐ Price Strategy: The Internet enables consumers to compare prices, products, and services across suppliers. For example, by logging onto price‐comparison sites like Pricescan.com and shopping agents like Bottomdollar.com, consumers can readily compare the prices and features of more than 10,000 products available on the Web (Sinha 2000). This leads to increased price competition and lowers the prices of products or services.
To overcome these threats, companies have to employ appropriate pricing strategies for selling products over the Internet. Sellers can employ a price discrimination strategy that makes it difficult for buyers to compare the prices of alterna ve product offerings (Bakos 1998). By collec ng informa on about buyers, companies can perform more effective price discrimination.
1‐6‐6‐3‐ Promotion Strategy: To manage e‐brands effectively and efficiently, companies have to employ promotion strategies different from those used by traditional marketing. One tactic is to build a direct link with consumers and enter into a dialogue with them about products (dialogue‐based marketing or one‐to‐one marketing). This allows companies to provide customers with information about their products, collect information about their customers, and engage in data mining. They can then customize products to meet customer needs and offer promotions tailored to specific customer groups. This process helps build a base of loyal and profitable customers (Kotler, 2006).
According to Sealey (2000), the Internet also provides customers with an unprecedented degree of control over the entire marketing process. As consumers become proficient at using the Internet, they will only buy products that precisely match their needs. Another promotion strategy for gaining competitive advantage is revenue‐sharing marke ng strategy (Hoffman and Novak 2000). A revenue‐sharing marketing strategy is an affiliated marketing program with partners based on commissions.
1‐6‐6‐4‐ Place Strategy: For most companies, place refers to the supply chain (or value chain). The place aspects of the marketing mix are closely related to the distribution and delivery of products or services. The Internet and its associated application software have significantly changed the way companies’ products or

٦٤
services are delivered by reducing transaction and distribution costs (Kotler, 2009). One way for companies to differentiate their products from rival companies is faster and more efficient delivery of products to their customers. The Internet allows companies to jump over parts of the traditional supply channel.
Table 1‐9: E‐Business Strategies for Competitive Advantage Product Price Promotion Place Threat of New Entrants
Product Differentiation (e.g., Bundling) Niche Products or Innovation Customer-Centric Strategy Expansion into a Related Product Line
Price Discrimination (e.g., Price Lining and Smart Pricing)Cost Leadership Value-added Products or Services
Customer-Centric Promotion Strategy (One-to-One Marketing or Relationship Strategy Marketing) Brand Appeal Based on Experiences and Beliefs Revenue-Sharing Marketing (Many- to-Many Marketing or Performance- based Marketing)
Outsourcing or Strategic Alliances Clicks-and-Mortar Strategy(Integration of Online and Offline Businesses)
Rivalries among Existing Firms
Product Differentiation(e.g., Bundling) Niche Products or Innovation Customer-Centric Strategy Expansion into a Related Product Line
Price Discrimination(e.g., Price Lining and Smart Pricing) Cost Leadership Value-added Products or Services
Customer-Centric Promotion Strategy Brand Appeal Based on Experiences and Beliefs Revenue-Sharing Marketing
Outsourcing or Strategic Alliances (e.g., Bundling) and Smart Pricing) Clicks-and-Mortar Strategy
Threat of Substitutes
Product Differentiation(e.g., Bundling) Niche Products or Innovation Customer-Centric Strategy
Price Discrimination(e.g., Price Lining and Smart Pricing) Cost Leadership Value-added Products or Services
Clicks-and-Mortar strategy
Bargaining Power of Suppliers
Value-added Products or Services
Revenue-Sharing Marketing Outsourcing or Strategic Alliances
Bargaining Power of Buyers
Value-added Products or Services
Customer-Centric Strategy Brand Appeal Based on Experiences and Beliefs Revenue-Sharing Marketing
Outsourcing or Strategic Alliances
Resource: Raggad, 2010
The Internet can dramatically lower entry barriers for new competitors. Companies can enter into E‐Marketing easily because they do not need sales forces and huge capital investments as they do in offline markets (Porter 2001). As the number of people with Internet access increases, the competition for online marketing in many industries will also increase. The Internet also brings many more companies into competition with one another by expanding geographic markets.
Another strategy related to faster and more efficient delivery is integration of online and bricks‐and‐mortar businesses (clicks‐and‐mortar strategy). E‐businesses (particularly e‐tailers) need fully automated distribution warehouses to meet demand from shoppers on the Internet.

٦٥
1‐7‐ E‐M‐S in different segmentation of tourism industry
E‐Marketing Strategy is roadmap to guide the companies and organizations to correct select of both tools and solution to achieve the goals and context of applications on internet and vital market. Building E‐Marketing strategy is an information technology (IT) project. The primary goal of building E‐Marketing strategy is to define best way to support the organization and companies marketing activities; and give competitive advantages through the of its available resources to meet the needs of market and customers by internet technology as well as possible; and support the customer relationship management (CRM) and supply chain management (SCM) (Alhawamdeh,2007). He also Well orchestrated E‐Marketing strategy, can accomplish several objectives, including any or all of the Following:
• Build your brand
• Establish your company as a leader in your industry
• Build a broader base of customers
• Keep current customers engaged on a regular basis with your company
• Move prospects through your selling cycle quicker
• Up‐ and cross‐sell your current customers’ use of your services and Products
• Become more meaningful to customers and prospects by providing them with information that helps them do their jobs better
Buhalis and Licata (2001) have attempted to do this by adopting a tourism systems approach to identifying the relationships between tourism industry different players.
1‐7‐1‐ E‐Marketing Strategy in tour operators
E‐Marketing can enable one e‐mediary to access the channels of another and thus facilitate increased efficiency in the distribution of an e‐mediary’s goods and service (Elmu , 2001). It can also enable partners to exchange strategic resources and capabilities that may be scarce or lacking in either one or both of the firms.
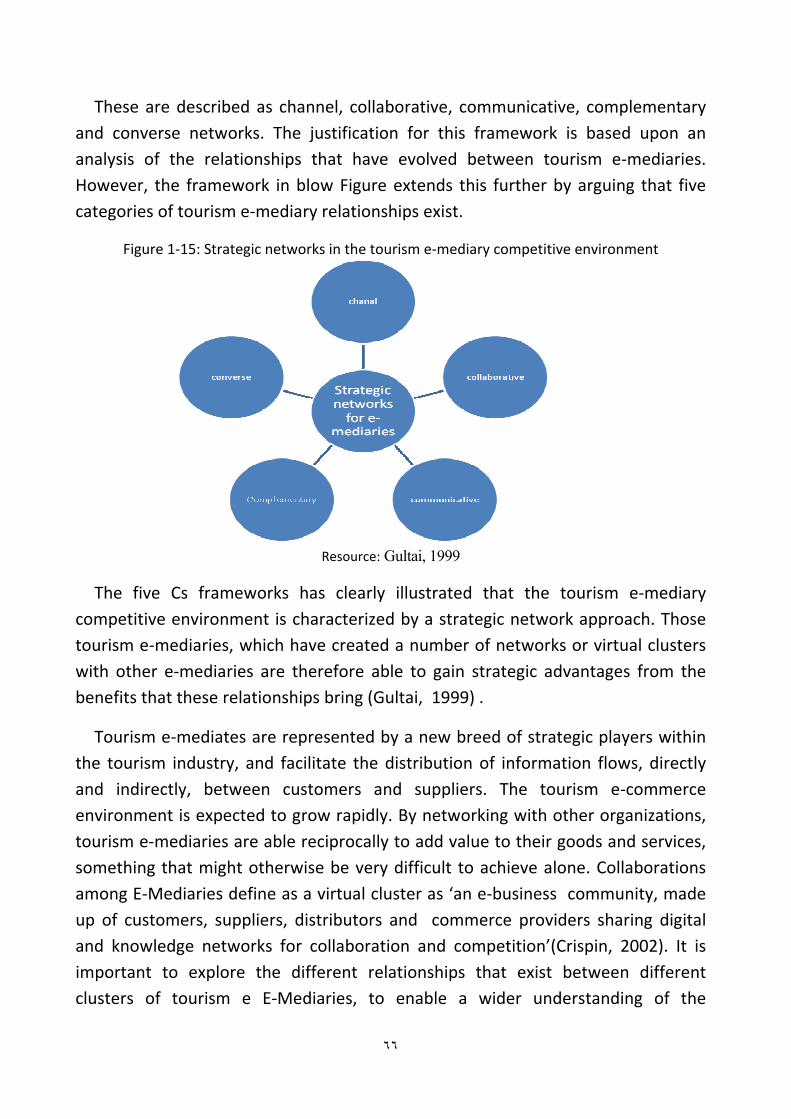
٦٦
These are described as channel, collaborative, communicative, complementary and converse networks. The justification for this framework is based upon an analysis of the relationships that have evolved between tourism e‐mediaries. However, the framework in blow Figure extends this further by arguing that five categories of tourism e‐mediary relationships exist.
Figure 1‐15: Strategic networks in the tourism e‐mediary competitive environment
Resource: Gultai, 1999
The five Cs frameworks has clearly illustrated that the tourism e‐mediary competitive environment is characterized by a strategic network approach. Those tourism e‐mediaries, which have created a number of networks or virtual clusters with other e‐mediaries are therefore able to gain strategic advantages from the benefits that these relationships bring (Gultai, 1999) .
Tourism e‐mediates are represented by a new breed of strategic players within the tourism industry, and facilitate the distribution of information flows, directly and indirectly, between customers and suppliers. The tourism e‐commerce environment is expected to grow rapidly. By networking with other organizations, tourism e‐mediaries are able reciprocally to add value to their goods and services, something that might otherwise be very difficult to achieve alone. Collaborations among E‐Mediaries define as a virtual cluster as ‘an e‐business community, made up of customers, suppliers, distributors and commerce providers sharing digital and knowledge networks for collaboration and competition’(Crispin, 2002). It is important to explore the different relationships that exist between different clusters of tourism e E‐Mediaries, to enable a wider understanding of the

٦٧
motivations and strategic direction of tourism E‐Mediaries engaging in alliance formation.
The tour operators and tour agency constitute the distribution channel for tourism industry. Contemporary appearance internet as new distribution channel, this role became a little inconspicuous. Same companies in distribution channel to offer better service use another hand internet as dives. Nevertheless, the most significant contribution of tour operators in the distribution channel is the package tour. Packages are per‐arranged combinations of transport, accommodation and others tourist services, sold or offered for sale at an inclusive price (EC, 1990). Buhalis(2003) argued using of E‐Marketing has introduced a wide range of great opportunities and perhaps threats to tour operators.
Tour operators are very important part of tourism industry. They package the tours and distribute them themselves or through the travel agencies. Despite has been foreseen that, with appearance and developing the internet and E‐Marketing in tourism, the tour operators would be out gone. However, owing to the character traits of tour packaging, tourism industry needs to them and they quickly have adapted them with new conditions in virtual market. For this mater a good and practice, strategy is vital and it helps to the tour operators to implement this way speedy and keep their role and share in tourism industry's future. Next schema shows the XYKAs offering service platform after adapting with E‐market in virtual space, as example:
Figure 1‐16: XYKAs offering service platform for E‐market
Resource: XYKA Inc, 2010

٦٨
XYKA is a technology solution provider & business process‐consulting firm for the travel industry. We provide innovative technology products and services for travel suppliers, travel agencies and tour operators. It make the company collaborates with its customers to solve business problems and bring solutions to market quickly. Using XYKA Travel Pla orm’s B2B Supplier Gateway and XYKA is a liate of partners; tour operators also have access to a whole range of ancillary travel products that can be used to complement their existing negotiated product oerings. These include airfares, hotels, activities, insurance and package tours that can be sold online. Tour operators can actively load and manage their negotiated supplier contracts using the XYKA Travel Platform (XYKA Inc, 2010). Contracts can be managed for airfares, hotels, cars, transfers, activities and insurance.
Tour operators, hotels and airlines use the different global system for distribution their service and products. But four very current and development Global distribution system (GDS) are:
• Amadeus: Instant Preference
• Galileo: Featured Property
• Sabre: Spotlight
Figure 1‐17: Global distribution systems
Resource: Monika, 2008
E‐Marketing and global distribution systems have facilitated the distribution of electronic brochures and booking form to both travel trade partners and consumers taking advantage of multimedia presentations about tourism destinations and packages. Above graph shows the share of apiece of global
٦٩
distribution systems in total market. The Amadeus with 51% has biggest share and Galileo with 20% stay in second posi on
1‐7‐2‐ Chain Hotels E‐Marketing strategy
Accommodation sector sits at the center of tourism industry and involves different kinds of accommoda ons such as Hotels (1, 2…stars, 1,2,.. diamond, casino hotel,..) motels, bed and breakfasts, housekeeping cottages gust house, camping, and other forms of lodging. Historically, tourism and specially accommodation sector, try to have direct access to travelers and consumers. Internet and E‐Marketing has changed the way to direct access to customers and firms can do what easier as before. In fact, groups in hotel sector had developed communications networks designed to compete with Global Destination systems (GDS). Travel agencies and airlines use this system and it is important for formatting management in the tourism industry. With this technology offers the opportunity to set up a direct reservation central. There are four large reservations central: Words pan, Sabre, Galileo and Amadeus.
As it's clear that the creating the enough traffic for company website, especially for hotels; it is one of the very important elements in successfully E‐Marketing. It is possible with different strategy and activities and according Stadler (2008) are :
• Search engine marketing:
• Search engine optimization:
• Cooperation and affiliation
• Online marketing: using banner (advertising) in different websites and liking it to company site and lading customers to the site
"Surveys show that up to 84% of travel research and planning in the U.S. is conducted via the Web (E‐Marketer/TIA). The Internet has become the single most important travel planning and distribu on channel in hospitality. In 2009, over 40% of all revenues in hospitality will be generated by the Internet, and another third of hotel bookings will be influenced by the Internet but done offline. Over the past 5‐6 years, most of the leading hotel brands have become proficient na onal and international E‐Marketers, and have learned how to build brand equity on the Web. Each year since 2004, Internet hotel bookings have surpassed GDS hotel bookings (Starkov, 2010).

٧٠
Also most of the consumers in tourism industry use internet web sites to obtain information. The main product of accommodation networks is the packaging tours. Airlines and tourism attractions are the two main competitors in tourism industry for accommodation. The next diagram shows a technological solution arising from the business model in Canadian hotels and accommodations sector for E‐Marketing strategy:
Figure 1‐18: Technological solution in Canadian accommodations sector for E‐Marketing strategy
Resource: Canadian accommoda ons sector, 2007
The aforementioned diagram shows technological solutions arising from this business model with put a few examples of firms or websites thriving in the tourism accommodation sector. The third party or electronic marketplaces, virtual or electronic shops, virtual shopping center and e‐mail are key e‐business model in the accommodation sector. As seen, distribution portals play a very important role in this model and insuring the survival of SMEs on the internet. Whereas independent web sites generate little consumer traffic, access to distribution channels becomes an important consideration. Also, E‐Marketing offers companies in hotels sector the chance to establishments personalized package tour.
Usually accommodation and hospitality place are small and have employee and monetary restriction to do all of their E‐Marketing alone and therefore E‐Marketing activities consult outside companies. In addition they use tour operators, tour agencies, airlines or another companies and websites ‐which don’t

٧١
work expertly in tourism yea sale different kind's products in internet‐ to reservation and sale their services and products.
The internet has improved hotel representation and reservation processes dramatically. Hotels are able to develop their own presence and to collaborate with distributors in order to present multimedia information on their properties, facilities and services. Booking through internet and web is particularly convenient for customers who frequent the hotel as it provides an efficient and effective communication mechanism (Buhalis,2004: p220). But in a strategic point, expensive technology and large amounts of time are top of the list of challenge holding up the E‐Marketing process specialty in Iran.
Results of a research show that more than 84% of travel and planning in the U.S.A is conducted via the web (e‐market) the internet has become the single most important travel planning and distribu on channel in hospitality. In 2009, over 40% of all revenues in hospitality will be generated by E‐Marketing, and the other third hotel bookings will be influenced by the internet (hospitality upgrade, 2003). Due to the nature of online travel consumers purchasing habits and the way search engines index and present content on the web, there are many opportunities at the property‐level. For hotels brand is very important and is the most factor helpful to a hotel in its E‐Marketing activity successfully. Before one must to know, how works the system of reserving a room in hotels. There are different models but one of the usual models is shown in the next Photo:
Figure1‐19: Hotel Property Management System
Resource: hospitality upgrade, 2003
٧٢
Hotels as others companies and industry use two ways for their E‐Marketing activities, direct channel and indirect distribution. Direct way include the Hotel websites and indirect E‐Marketing involved of different ways such as use of business travel Agencies, consor a and airlines, GDS, 3party websites (online& offline sale partner) and etc. In indirect web distribution, focus on target markets, packaging and only room offering, but in indirect way they treaty with other companies, which can help to hotels to implementation the E‐Marketing. A websites in direct marketing must have some especial successfully trait such as easy to use, flexibility, up to date, direct contact, language facilities, etc (stadler, 2008). In general, the hospitality industry in comparison whit others, has been reluctant to use ICT (Buhalis, 2005, 221), and Expensive technology and large amount of time lade them to do their E‐Marketing activity by other company and prefer to use internet intermediate.
There is no doubt that chain or franchised hotels have to proactively support their hotel chain’s regional, national, and international E‐Marketing initiatives. However, hoteliers have to clearly understand that the hotel brand cannot possibly cover all the bases and that they must take full advantage of the myriad of local online revenue opportunities available to the property. In order to build and take full advantage of a Local Internet Marketing Strategy, Sinko (2011) suggest that chain hoteliers have to:
Analyze the hotel brand’s guidelines and policies for property‐level Internet marketing activities
Understand best practices and latest trends in Direct Online Distribution. complement the brand efforts with a Local Internet Marketing Strategy grow direct market share online by taking advantage of sleepy competition
generate incremental revenues and take advantage of local opportunities via the Internet
Identify and collaborate with an Internet marketing company experienced with franchised hotel marketing on the Web.
Over the past several years, a handful of hotel chains have done a good job in presenting their franchised hotels on the brand website‐both for humans and search engine bots alike. But even in these cases there is always room for improvement: local events and happenings that may generate overnight stays at

٧٣
the property are usually not featured; services and amenities may change; photos become dated over time; feeder market focus changes (e.g. from fly‐in to drive‐in markets in this economic environment); search engines tweak their search algorithms, etc (Viehland,2000).
Many hotel chains allow and even encourage their chain hotel to launch property stand‐alone (independent) websites. Almost all hotel chains have specific guidelines regarding these external property websites. Many hotel chains offer either direct CMS (Content Management System) access to the property pages or a special form to propose content and visual changes. In the following sections, i will discuss about some Keyes elements of the Local Internet Marketing Strategy for Franchised Hoteliers:
website optimizations, local search marketing, local strategic link building, property‐level email marketing, and online initiatives to target your hotel’s most important customer segments Hotel chains are spending a great deal on paid search marke ng with all of the major search engines: Google (60% of the search market), Yahoo (20%) and MSN (10%) (Starkov, 2010). These national campaigns play an important role in achieving brand recognition and capturing brand name‐related searches, but they leave out tremendous revenue opportunities from local search initiatives.
Email marketing to the hotel’s own opt‐in list is one of the most popular Internet marketing formats used by hoteliers today. Today’s online travelers subscribe to multiple travel e‐Newsletters and love receiving relevant email promotions, events and happenings. In a recent survey by Y partnership, 46% of online travelers mention email notifications promoting special fares and rates to be a feature of greatest interest (Starkov, 2010).
1‐7‐3‐ Airlines E‐Marketing strategy
Airlines could be the biggest part of tourism industry winner of the E‐Marketing and that come back to airline service and cost structure. The airline's usually consist of two parts: direct operating costs‐such as aircraft, fuel and salaries‐ make u about 60% of total cost, and indirect costs‐such as distributions costs‐ about 40%. Direct operating costs are more or less "fixed" and there is not much airline can do to cut them down. A major part of airlines indirect cost is its distribution cost, and it has following component: Revelation system cost, sales offices(station)cost,

٧٤
Advertising and sales promotion cost, agent fees and commissions, ticketing fees; that in this aspect, E‐Marketing could potentially play an important role (Siliang yang,2001).
Many e‐commerce principles were pioneered by the airline industry. These include the first business‐to‐business electronic information exchange and industry‐wide electronic marketplace. This environment provided unprecedented opportunity for operations research (OR) modeling. Airlines continue to derive billions of dollars annually from these and derivative models. The availability of reliable, low‐cost communications via the Internet is not only providing new modeling challenges within the airline industry, but it is also providing similar opportunities in other industries.
Any size companies can have an E‐Marketing strategy; from a sports club selling T‐shirts with their name on, to a medium‐sized business selling widgets, through to a traditional retail behemoth like Wal‐Mart (Matthew,2000). Nowadays some tourism companies sell only over the Internet; others sell both over the Internet and in standard brick‐and‐mortar distribution channels (Afuah,2001). Most airline managers realize that a major business transition is taking place. Some believe the various processes by which marketing strategies are developed will need to change. New value propositions are being promoted by E‐Marketing, and it is being used to give airlines competitive advantage (Jiang,2009).
One other main profit of using E‐Marketing is that, E‐Marketing and internet as distribution canal can increase access to more customer and the sales. At the result for increase sales and incomes, they can cover more of their fix & total costs and s the discount the finally cost for each ticket and increase the net revenue and benefit (Yang, 2001). Nevertheless, in analyze the benefit of E‐Marketing, using new, development system, and technology through the E‐Marketing; must attend to this subject that using the new technology requires huge investments. Admittedly, E‐Marketing has the potential to change consumer behavior or customer culture, and to bring about a commercial revolution at least in the airline industry. But at the moment, e‐devices bring greater benefits to the consumers than to the airlines, which explain why many airlines are reluctant to take their business on‐line.
Airlines are the earliest practitioners of E‐Marketing and airline ticket sales now consists the largest portion of all product sales made online. Online sales bring

٧٥
greater benefits to airlines than to any others industry but in order to reap the benefits of the E‐Marketing and avoid the potential damages, airlines have to use other tools such as computerized revenue management system and e‐distribution system, design the strategy and so on. The initial adventures of the airlines industry prove that although high technology‐including E‐Marketing‐ could bring tremendous benefits, it also carries potential risks. They can with good and suitable strategy control its' risk or decrease its effects. This matter needs to carefully considering and controlled them.
In another side, airlines have realized the importance of having happy customers and there are for focusing on customer relationship management (CRM) as tool for managing customer relationship. Unfortunately, in many cases, they have failed to recognize CRM as a holistic strategy, instead viewing it as synonymous with their frequent flyer programs (Kotler, 2009). In order to management the customer more effectively across all lines of service, airlines must adapt their approach to CRM in a number of ways, customer segmentation, CRM initiative development or organization design and management.
IBM research confirms that customer experience management (CEM) is the key for companies hoping to maintain if not improve relationship with their customers: successful CEM initiatives have demonstrated significant customer impact according to 68% per cent of respondent and quan fiable revenue in 50 per cent of case. In order to help airlines operationally their objectives for transformation into a customer focused enterprise IBM advantages its CRM Done Reith customer experience framework. The methodology for implementing a successful CRM ini a ve (IBM, 2009):
a) CRM value case for change
b) CRM value proposition
c) CRM operating model
d) Multi‐Generation roadmap
e) Sponsorship, change management and governance
Airline industry is one of the most competitive industries within the economic environment. Within industry's boundaries, actors have more or less recently and with significantly different patterns of action‐undertaken efforts to achieve an

٧٦
integration of the internet platform and its applications. In this section, we explore the effects of electronic commerce and its potential for competitive advantage for airline industry by using Michael Porter's seminal work on industry analysis as a framework.
Figure1‐20: Sources of Competitive Advantage
Resource: Porter, 1980
Because the airline nature it is the best case for implementation E‐Marketing and an E‐CRM system, and analyze its effect and results. According the IBM (2009) finding in one research about CRM in airlines, The Methodology, as illustrated below, focuses on five key interlinked elements for implementing a successful CRM initiative:
A. CRM Value Case for Change: It develops a metric based approach, which becomes critical to tracing strategy through to implementation and back again.
B. CRM Value Proposition: it helps in defining the specific strategies around the initiatives, also considers the imperatives, which are important for business success such as competitive threats, financial pressures or new opportunities.
C. CRM Operating Model: This includes determining what will be the specific passenger experiences, how an airline will deploy resources, how new technologies and infrastructure will be built, how new processes will be designed and creating a comprehensive strategy for managing a change.
D. Multi‐Generation Roadmap: This defines customer initiatives into projects that contribute value and ROI on their own as well as build long‐term vision.

٧٧
E. Sponsorship, Change Management and Governance: it is an ongoing process of managing the program and seeks to build support for CRM initiatives to ensure that projects and transformations are measured and directed towards their goals.
Different Airlines select the one of the three major strategies conform with which Porter describes: Cost Leadership, Differentiation and Focus. The proposition is that airlines that can successfully work in one of these areas will be able to establish and sustain a competitive advantage. The success of application of E‐Marketing strategy to airline industry depends on the value added of E‐Marketing to airlines. Currently, many airlines are looking at e‐business to protect their assets and to secure customer's loyalty, and to be successful in today's competitive environment (Jiang, 2009). In continue, some of the airlines, what working in the Iran or Germany market, will be considered to more identify the different aspects of airline market and E‐Marketing characteristics:
1‐7‐3‐1‐ Easy Jet
Stelios Haji‐Ioannou had his airlines' ac vity with two Boeing 737‐200 at 1995 begun and have called it Easy Jet. Easy Jet marketing strategy was based on “making flying as affordable as an air of jeans” and urged travelers to “cut out the travel agent. Paul Simmons, head of brand marketing at easy jet, says: „signing up with epsilon international has made an incredible difference to our email marketing business. The epsilon international full service teams give us expert strategic and enable us to enjoy seamless use of email delivery and tracking technology. DREAM mail has given us a complete management view of our email marketing communication, which allows us to make smarter and more profitable business decisions"(Easy jet, 2005).
Figure 1‐21: Easy jet Homepage first page picture
Source: Easy jet Homepage

٧٨
Easy jet like Ryan air, borrows its business model from United States carrier Southwest airlines. Both airlines have adapted this model for European market through further cost‐cutting measures such as not selling connecting flights or providing complimentary snacks on board. The key points of this business model are high aircraft utilization, quick turnaround times, charging for extras(such as priority boarding hold baggage and food) and keeping operating cost low.
The different between Easy Jet and Ryan air is that, Easy Jet flies mainly to primary airport in the cities that it serves, while Ryan air often chooses secondary airport to reduce costs. Also, one main difference Easy Jet and Ryan air from Southwest is they both fly a young fleet of aircraft. Southwest have fleet age of 14.1 years where as easy jet fleet age is just 3.4 years. Easy Jet's early marke ng strategy was based on "making flying as affordable as pair of jeans" and urged travelers to "cut out the travel agent". Its early advertising consisted of little more than the airline's telephone booking number painted in bright orange on the side of its aircraft. In consider this subject that, Easy Jet strategy is reduces the cost by the deleting the intermediates and tor agency, E‐Marketing and sales through the internet is their first property.
1‐7‐3‐2‐ Ryan air
Ryan air had established in 1985 by Tony Ryan. It has transferred about 57, 7 million passengers in 2008 to 150 des na on in 26 countries in this year. More than 7000 employers work by this company. Cost‐leadership "No‐Frills", basically is concept and strategy for its activities and business in air line market. There for, it based their basically focused on sales by internet and E‐Marketing in its specific website ((www.ryanair.com)) and remove the intermediates and direct contact to customers through this website. For this maters, company try to offer good service in its web site such as booking of only point to point connecting, online check‐in, ski resorts information, booking holiday homes and Ryan air credit card. In addition, it offers third party services such as car rental, hotel/hostel/campsite reservation, insurance and airport transfer in its website (Kmieciak, 2009).

٧٩
Figure 1‐22: Ryan air Homepage first page picture
Source: www.ryanair.com
Ryan air Business model for E‐Marketing: The Ryan airs' special marketing strategy had based on low price, marketing instrument and aggressive. In this way, using E‐Marketing is the most important. Fly to secondary air ports, low personal costs, no frills include minimum comfort, no rebooking and only one class; and general principle are others Ryan airs' devices to achieve that aim. The Ryan airs' business model showed that its main activities and strategy (Kmieciak, 2009).
Figure 1‐23: Ryan airs' business model
Resource: Kmieciak, 2009
As said before, Ryan airs special marketing strategies are low price and aggressive marketing by design emphasizes low‐price image and special offers and banners promotion low price, through the internet. In this way its web site is base and the most importance. Also advertising on the aircraft, in flight radio, link to
Customers
Ayanair.com
Fly cheaper
+-
Advertisements
Partners (Vodafone
, Hertz, AXA)
Revenue Cost-reduction
+
٨٠
third party service and flashing banner advertisements is its other marketing activities. In attention to this subject that Ryan air does not want you to find the cheap flights, uses Page complicates price comparison and sales promotions without direct link to achieve its goals. Ryan airs' additional costs structure is not clear(Kmieciak, 2009). Also it uses synthetic cost deviation to keep net rice down and tricked consumer into optional costs. Quick and simple booking are Ryan airs website and E‐Marketing activities advantages for customer.
1‐8‐ Analysis, formulation, Implementation
Tourism is a service‐oriented industry, which is offered by enterprises with help from government and the international community (UNCTAD, 2004). E‐tourism development depends on the availability of the investment funding. Tourism authorities or tourist management sectors always face problems of allocating fund from the limited recourses to different aspect of e‐tourism sectors. These sectors include development tourism e‐commerce sites, technical human resources, ICT infrastructure, information management system etc, which require different level of investment. In the most of developing country such as Germany ICTs are used for providing tourist information rather than e‐tourism development (Paudel, 2005). Many developing countries mainly developed simple e‐tourism websites offering information that could satisfy consumer expectation in travel planning but do not offer secure booking or payment facilities.
Tourism industry is an information core industry, which is affected by both supply and demand. Industry of tourism is interrelated to IT as well as E‐Marketing. This means that tourism industry in one hand cause development and demand increase in electronic innovation and electronic marketing and on the other hand electronic marketing cause development of tourism industry. So tourism can be a suitable and attractive industry for study of new patterns in E‐Marketing strategy.
This raises the question of how to go, in a systematic way, about E‐Marketing strategy development. According the Professional researches there are three arts E‐Marketing strategy framework that consists of: (1) strategic analysis; (2) strategy formula on; and (3) strategy implementa on. The first part of this framework entails the strategic analysis, which consists of two different perspec ves: (1) the external analysis and (2) the internal analysis (Allen, 2001).

٨١
The goal of the external analysis is to gain an understanding of the external developments that might have an impact on the E‐Marketing strategy of your company. On an aggregate level, the external analysis refers to developments in the broad macro‐environment, which includes topics such as technological changes, overall economic developments or societal changes. On a more detailed level, it also entails an analysis of the different players within an industry, including competitors, suppliers or substitutes. The outcome of this analysis should help you gain an improved understanding of the opportunities and threats that your company might face in the future.
1‐8‐1‐ Analysis
An E‐Marketing strategy is needed to provide consistent direction for organizations E‐Marketing activities that integrates with its other marketing activities and supports the overall objectives of the business. There is no evidence to suggest that the approach to developing and implementing a strategy should be significantly different for E‐Marketing. However, with E‐Marketing there is an even greater need for a highly responsive strategy process model where rapid reaction can occur to events in the marketplace. The use of Soviet‐style 5 year planning does not seem appropriate; a preferable approach is an emergent E‐Marketing strategy process that is part of a continuous improvement. Continuous scanning of the micro and macro‐environment of an organization are required with particular emphasis on the changing needs of customers, actions and business models of competitor and opportunities afforded by new technologies. Techniques include resource analysis, demand analysis and competitor analysis, applications portfolio analysis, SWOT analysis and competitive environment analysis (Samar, 2004). For analyzing conditions, there are not only different models but also a wide variety of factors and forces to be considered. Examples of analytical methods used in strategic analysis include:
SWOT analysis PEST analysis Porter’s five forces analysis four corner’s analysis value chain analysis early warning scans War gaming

٨٢
1‐8‐1‐1‐ Internal Forces Today’s intensification of competition and of environmental uncertainty gives
innovation an increasingly important role not only for growth but also for survival. Administrative innovations involve organizational structure and administrative process; they are indirectly related to the basic work activities of an organization. Technical innovations "pertain to products, services and production process technology" they are related to basic work activities and can concern either product or process” (Lages, 2004).
Organizational bureaucratization: Either way, it seems reasonable to expect that the degree of bureaucratization of an organization developing E‐Marketing strategy is related with performance.
Centralization: From this perspective, centralization imposes time limits to decision making, which consequently give less emphasis to situation analysis and comprehensive development of e‐strategy making (Adersberger, 2005).
Market orientation: market orientation consists of three behavioral components, each involved in collecting, disseminating and responding to information: customer orientation, competitor orientation and interfunctional coordination, that constitute the activities of market information acquisition and dissemination and the coordinated creation of customer value.
Customer orientation: the customer knowledge process as consisting of three sequential aspects: customer information acquisition, interpretation and integration (Koyler, 2005).
Competitor and ICT technology orientation: A competitor‐oriented company seeks to evaluate its strengths and weaknesses in relation to its main competitors, with the objective of maintaining or gaining advantage. Competitor knowledge process is the process of information collection about the strengths and weaknesses of the competition, analysis and integration in decision‐making. Like customer knowledge process, this process involves three behavioral aspects: competitor information acquisition, interpretation and integration.
Inter‐functional coordination: Communication among the various functions of the company helps in responding to the client, which is harder to achieve if the various departments work within their routines without a common objective
٨٣
Availability of resources: As increasing levels of resources are committed to the E‐Marketing activity, the firm will be better able to improve its planning procedures, implement more adaptive e‐strategies and achieve its goals. It is clear that understanding the impact of resource availability on the development of E‐Marketing strategies can yield valuable insights into improving performance (Kotler, 2009).
Leadership and management: Every successful business requires effective leadership to fully utilize the skills of staff in order to achieve the aims of the business and that has an extra and vital importance in E‐Marketing. This is not just a matter for larger businesses like Tourism‐ even if you only employ one or two people you still need to make sure that you make the most of their abilities and aptitudes. This requires a distinct set of management skills and the confidence to carry them out. A tourism company to be able to motivate and develop its team, to communicate well with them and to build a business strategy that allows each individual to perform to the best of their abilities.
Employers: in tourism industry staff play very important role in tourists (customers) satisfaction. More than E‐Marketing installation and management need to experts staff in IT and marketing. Developing the skills of people working in tourism industry in related to E‐Marketing is an important way of doing this–new skills can improve productivity, competitiveness and profitability. In tourism industry comparing the skills a company has with the skills it needs to achieve, its e‐business and E‐Marketing goals are an important step towards improving its performance. This guide explains how to assess a tourism company E‐Marketing program performance, how to identify skills gaps that might be holding that back and where to begin to try to fill these gaps.
Structure: The information systems literature has taken little recognition of developments in the areas of organization structure and design. The concentration of professional practice has been on management information systems for ‘big business’ and ‘book‐keeping’ systems for smaller businesses. This is a very limited view of the overall needs for information in organizations. Organizations may take many forms, and the nature of information systems that are needed will vary depending upon the particular form taken. This paper works from the organization structure literature towards a theory of information systems structure and strategy. Illustrative cases that support the hypotheses are described.

٨٤
In other research, Nagasimha argued that internal analysis includes strengths, weaknesses, core competencies, resource constraint analysis. This includes the decisions on the 4Ps (Product, Price, Promotion, and Place) (Kotler, 2009). The marketing strategy developed is so implemented and any deviations from the plan are feedback to the marketing objectives and the development of marketing strategies. (Nagasimha, 2006)
1‐8‐1‐2‐ External Forces External Forces or environmental factors (Social, Legal, Economic, Political and
Technological) are some of the more important factors that affect the company, but within these environmental factors, companies are not able to change them. In other word, External Forces or environmental factors are a wider environment (macro‐environment) in which a company operates including the social, legal, economic, political and technological factors. It is imaginable that there is a difference between the importance of these factors in tourism and in the internet. Therefore, for E‐Marketing strategy both of these dimensions must be considered. The macro environment includes Social, Legal (law) and Government, Economic, Political, and Technological elements. Moreover, below states some of these:
Market Turbulence: Market turbulence is the degree of change in the client composition and client preferences. The findings suggest the presence of seven motivations and concerns regarding web use: social escapism, transaction‐based security and privacy, information, interactive control, socialization, no transactional privacy, and economic motivation (Ebrahimi, 2006).
Technological Turbulence: Technological turbulence is the degree of change associated with new product technologies (Ellsworth, 1995). On one hand, when technologies change quickly, it is imperative to the companies to interact with clients, because client preferences and needs can provide directions in a product market. On the other hand, the importance of information from the client is lower because the client knows little about the emergent technologies.
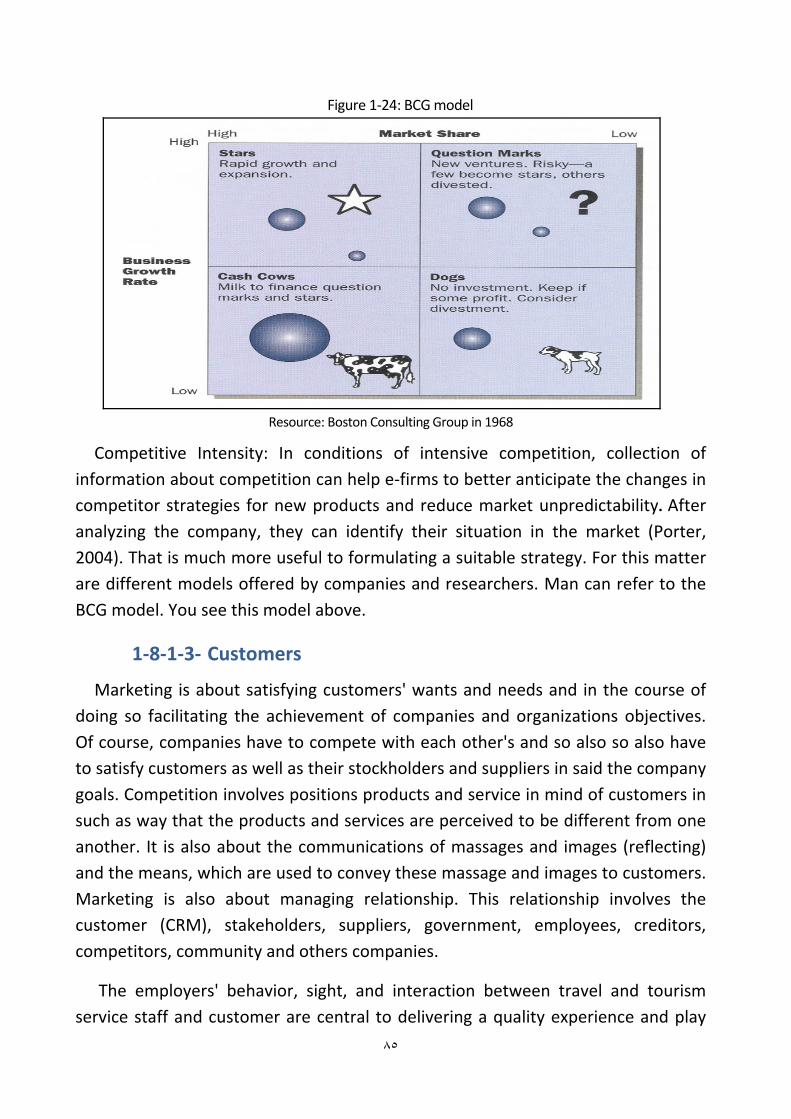
٨٥
Figure 1‐24: BCG model
Resource: Boston Consulting Group in 1968
Competitive Intensity: In conditions of intensive competition, collection of information about competition can help e‐firms to better anticipate the changes in competitor strategies for new products and reduce market unpredictability. After analyzing the company, they can identify their situation in the market (Porter, 2004). That is much more useful to formulating a suitable strategy. For this matter are different models offered by companies and researchers. Man can refer to the BCG model. You see this model above.
1‐8‐1‐3‐ Customers
Marketing is about satisfying customers' wants and needs and in the course of doing so facilitating the achievement of companies and organizations objectives. Of course, companies have to compete with each other's and so also so also have to satisfy customers as well as their stockholders and suppliers in said the company goals. Competition involves positions products and service in mind of customers in such as way that the products and services are perceived to be different from one another. It is also about the communications of massages and images (reflecting) and the means, which are used to convey these massage and images to customers. Marketing is also about managing relationship. This relationship involves the customer (CRM), stakeholders, suppliers, government, employees, creditors, competitors, community and others companies.
The employers' behavior, sight, and interaction between travel and tourism service staff and customer are central to delivering a quality experience and play

٨٦
important role in their satisfaction. The quality of the interactions depends on the rapport established between the two parties (Harrison, 2004). The customer behaviors are usually the results of their experience and expectations. Different customer have different experience and expectations of tourism service, also they can be regarded as resources and assets. In addition, in tourism industry customer‐to‐customer interaction, guest compatibility is particularly important.
Consumer education, live stile, income, age, training company and many others factors affect the tourism understanding of offered service quality and their satisfaction. For example, airline passengers can be guided through the self check‐in process at the airport using check kiosks. In other example, low cost carriers operating domestically and internationally, made many people to fly. These people need to be informed of appropriate behaviors on an aero plane for the safety of all passengers, including themselves for the comfort of their fellow passenger, and informed about fly times and qualification; and destination such as cultural background, custom and legal system of host country (Cathy&others, 2008, 164).
1‐8‐1‐4‐ Employees
In tourism industry, services involve person‐to‐person encounters, and include both employee to customer and it play a key role in quality of services provided in employee‐to‐customer services encounters in tourism industry. Since most travel services are highly personal and experience oriented, one customer may have different understanding and experience with frontline staff. The differences may be the results from employees' skills and attitudes courtesy and attentiveness that can turn an ordinary service occasion into one that is special and memorable. On the other hand, an indifferent or unfriendly frontline employee can detract from experience, despite a superior environment and facility.
In E‐Marketing employees are very effective on tourism satisfaction and understanding from afforded services in the virtual market. Using the expertise of the employees, for the E‐Marketing sector in tourism industry is very vital. More than, the expert employee are responsible for the supported technology and service in e‐market (Inskeep, 1994).
Also, contact with customers in the virtual market and internet is the task for theses employee, that is important for E‐Marketing programs successfully and customer satisfaction, because customer in tourism industry evaluation all service
٨٧
and products in a package and they see all of them a product, so their satisfaction depend good quality and experience from every of them. Service delivery involves the offers of both frontline and support staff, service quality can only be ensured if both parties work together as team (Cunninham, 2002). Therefore, companies in tourism industry need to Employees with two main kinds of proficiency [IT and communication with people (marketing)] or two kinds of experts Employees.
1‐8‐1‐5‐ Web site
For ranking the web site, there is a different method and measurable factors. In one of the categories, the factors, which measure for ranking, consist of:
• Conversion rate: with how many clicks customer bye or reserve
• Rang the cooperation • Price • Hotel evaluation and value • Price parity and comparison
• Accessibility • Cost • Stornorate (monika, 2008)
Pertinent factors for the Internet include demand analysis, competitor analysis intermediary analysis and channel structure. Porter (2001) has written extensively about how the Internet has changed the dynamics of the marketplace and has reinterpreted his often‐quoted three forces model in the Internet area:
• Demand analysis or online customer activity is a key factor driving E‐Marketing and e‐business strategy objectives. It assesses the current level and future projections of customer demand for e‐commerce services in different market segments.
• Competitor analysis or the monitoring of competitor use of e‐commerce to acquire and retain customers is especially important in the e‐marketplace due to the dynamic nature of the Internet medium.
• Macro‐environment in which a company operates including the social, legal, economic, political and technological factors.
Chaffey (2002) suggests comparing the activity of an organization and its competitors for their different channels by trying to discuss the following contexts:

٨٨
1. Business contribution 2. Marketing outcomes 3. Customer satisfaction 4. Customer behavior (Web analytics) 5. Site promotion
Past performances can be a critical variable in the determination of E‐Marketing strategy and the evaluation of current period performance. When firms experience poor performance, they are more likely to search broadly for information and conduct in‐depth analyses of their surrounding environments. In contrast, a good performance might promote more relaxed and effortless strategic decisions (Dutton & Duncan 1987; Lages & Montgomery 2001).
1‐8‐1‐6‐ Competitive advantage
The most important factor that must be considered in each strategy, especially E‐Marketing strategy, is the achievement of competitive advantage. All the factors which are effective in achieving the appropriate share of e‐market for companies and active organizations in tourism industry should be analyzed (Tony proctor, 2008, 1). On the other hand, marketing is about activities which lade to satisfying customer wants and needs, and in the course of doing so facilitating the achievement of organizations' objectives.
The Internet is assumed to be an important channel for marketing and distribution of products and services. The Internet provides an opportunity for market testing and optimization. Increasing digitalization will make it progressively easier to experimentally alter particular aspects of a business and quickly observe how customers respond (Wyner 2000).The organization must encourage the consumer's potential to use the Web site for two purposes; an information tool and a purchase option. When consumers are more involved in the buying process (product complexity), it significantly improves brand recognition and recall. In next table, you see some of the competitive advantages of E‐Marketing and internet:

٨٩
Table 1‐10: Technological advantage of E‐Marketing
Technological advantage of E‐Marketing and internet Cases
e‐shop: information or request for it, sales and distribution company's products and services
collbrt tours
e‐auction: electronic auction sites e‐mail: several sellers on one site 3rd party marketplace: transaction support for sellers Virtual communities: enhance communications among members of same community.
Value chain service provider: supports the value chain(supplies and payments)
Value chain integrator: creates value by integrating the components of the value chain
Collaboration platform: provides tools and information to enhance collaboration between companies(e.g., co‐design)
Resource: Kiang 1999
Any marketing strategy has to have marketing objectives and prepare method, tactics and requirements to achieve these objectives. One of the most important and General objective of an E‐Marketing strategy is obtain competitive advantage in market and between the other competitors. Based on the marketing objective, flows two types of analysis: strategic market analysis and internal analysis (Cunninham, 2002). Strategic market analysis involves customer management and analysis, market management and analysis, environmental scanning and future building or scenario planning. Management of relationships with customers and important external bodies in the market such as dealers, suppliers and the government is an important part of marketing strategy formulation and management.
1‐8‐2‐ Formulation
The drivers for electronic marketing are both technological (under the tremendous pressure of innovation) and business oriented. Executives of successful E‐Marketing companies need to be strategic thinkers focusing on customers, markets, and competitive positioning, as well as on internal operations. Determination of a suitable E‐Marketing strategy begins with identification of the opportunities and risks (Kotler, 2006). The task of tracking the changing environments, understanding customer groups, requires formulating strategies and planning their implementation but the first step to becoming an E‐Marketing or e‐business is to define a dynamic strategy based on opportunities to provide

٩٠
value. Developing that strategy requires a revaluation of the existing model and identifying internal issues.
Many companies approach E‐Marketing with no clear idea of where they are going, often they view the industry leaders’ accomplishments superficially and try to imitate the front‐runners. What they fail to consider is the level of commitment and organizational redefinition that must occur behind the scenes. Currently fewer than 15% of the Iran top 100 companies have a formal E‐Marketing strategy in place for 2005 (Rowley, 2002). Many Iran manufacturers lack an E‐Marketing strategy or are investing in e‐marketing without having a strategy in place, according to an E‐Manufacturing survey by Benchmark Research (Jendricke,2010). Of the 700 Iran senior‐manufacturing executives, 42% did not have an e‐ marketing strategy and 13% have or intend to invest without a strategy in place. These statistics about Germany are better (UNWTO, 2010).
Different guideline models for companies to provide or develop their E‐Marketing strategy have been suggested, which are same in tourism industry. For example, Dawson and shah in their article have suggested a model with six steps as flowed (Chen, 2001):
Step 1: Making the Ini al Decision to Offer E‐ Marketing
Step 2: Iden fying the Business Aims for E‐ Marketing
Step 3: Analyzing the Feasibility of the E‐ Marketing Initiative
Step 4: Planning and Design of E‐ Marketing
Step 5: Implementa on
Step 6: Strategy Assessment
In designing a strategy companies following different aims .The aims behind an E‐ strategy should include some or all of the following (Cunninham, 2002);
• To sell more goods and services by using the web
• To improve customer service and interaction
• To increase brand awareness and awareness of the company
• To expand geographic reach
• To expand into new markets
• To increase revenue and market share
• To reduced operating costs
٩١
• To be seen as an innovative and progressive
• To compete with bigger rivals on more even terms
• To provide customer “e‐care”, i.e. online support
• To support its business partners over the web: e‐care for partners
• To improve communication within the company: e‐care for employees
To work more closely with customers and suppliers the goal is to identify the critical factors that will determine the success of the E‐Marketing in the competitive marketplace. Different subjects and issues which must to analyze in design a strategy Industry and competitive analysis for E‐Marketing involves monitoring, evaluate. Some others must be analyze are Aims, Timing, SWOT, Cost benefit analyze and the role of the company web site in E‐Marketing include role, external viewpoint, traffic analyze (Dawson, 2009).
After identifying the opportunities, the next objective is identifying the costs of introducing and operating an e‐commerce project. Strategy formulation should depend on the development of strengths and opportunities. It includes examining the corporate or project mission by specifying achievable objectives. A longer‐term E‐commerce strategy must then be put in place based on the business aims and objectives within the constraints of feasibility. The changes need to be seen as part of the company development and not as an add‐on extra.
To take advantage of the on‐line customer community a web centric marketing strategy needs to develop alongside the technical developments. Even if the current marketing strategy has taken the Internet into account, it is necessary to develop a marketing strategy that clearly targets the Internet as a primary marketing channel. The relationship with partner companies will need to be continually reviewed, as other companies make and follow their own initiatives and if a company already has a good distribution network this may be the foundation for developing the e‐commerce distribution (Chaffy, 2009). To take advantage of the on‐line customer community a web centric marketing strategy needs to develop alongside the technical developments and it is necessary to develop a marketing strategy that clearly targets the Internet as a primary marketing channel.
1‐8‐3‐ Implementation
The implementation of E‐Marketing strategies is essential in complexity with increased internationalization of organizations (Sheth& Sharma, 2005). Research

٩٢
should consider two sets of relationships: Performance → E‐Marketing effects and E‐Marketing →Performance effects. The importance of developing an effective E‐Marketing strategy, is indicated by Porter (2001), who has said: ‘‘the key question is not whether to deploy Internet technology – companies have no choice if they want to stay competitive – but how to deploy it.’’
An E‐Marketing strategy is needed to provide consistent direction for an organization's E‐Marketing activities that integrates with its other marketing activities and supports the overall objec ves of the business. Chaffey (2002) notes that E‐business or E‐Marketing strategy process models tend to share the following characteristics:
• Continuous internal and external environment scanning or analysis is required.
• Clear statement of vision and objectives is required.
• Strategy development can be broken down into formulation and selection.
• After strategy development, enactment of the strategy occurs as strategy implementation.
• Control is required to detect problems and adjust the strategy accordingly.
• They must be responsive to changes in the marketplace.
The companies in tourism industry can use a four‐stage model for E‐Marketing strategy development. The four stages are:
1. Strategic analysis: Continuous scanning of the micro and macro‐environment of an organization are required with particular emphasis on the changing needs of customers, actions and business models of competitors and opportunities afforded by new technologies. Techniques include resource analysis, demand analysis and competitor analysis, applications portfolio analysis, SWOT analysis and competitive environment analysis.
As stated before, to success an E‐Marketing strategy, companies in tourism industry analyze the variety rank of related areas. Papathanassis explains an Evolution & the Hyper Connectivity Hypothesis for e‐tourism. In this hypothesis, he argued some elements, which must be analyzed. In the below figure have showed this hypothesis in a schematic model:

٩٣
Figure 1‐25: E‐Tourism Evolution & the Hyperactive Connectivity Hypothesis
Resource: (Papathanassis, 2009)
2. Strategy implementation: Strategy implementation includes devising and executing the tactics needed to achieve strategic objectives. This includes launching a web site, campaigns associated with promoting the site and monitoring the effectiveness of the site. These issues will be discussed in the research.
As you know, for performance a marketing program in virtual market, we need the Net infrastructures, hardware and software. Without the software, there is no e‐market and E‐Marketing and it is like the nerve system in virtual space. There are varieties kinds of software; companies have used them in E‐Marketing. As connectivity requirements, increase in the meaning of Integration surpasses the notion of software integration, including additional business system components and extending beyond organizational boundaries. As you see in the above model, software plays main role in the e‐system integration based on internet and E‐Marketing strategy. Flowing figure shows the different levels of software integration in tourism industry according the Papathanassis (Papathanassis, 2009):

٩٤
Figure 1‐26: E‐marketing Software integration
Resource: Papathanassis 2007
3. Strategic objectives: Organizations must have a clear vision on whether digital media will complement or replace other media and their capacity for change. Clear objectives must be defined and in particular, goals for the online revenue contribution should be set. Also must be integration between the vision, mission, long‐term objective, short‐term objective and the objective of different departments in a tourism company.

٩٥
Figure 1‐27: Deferent areas in e‐tourism
Resource: Papathanassis, 2009
More than the integration between different parts of a section of company and also different sections of a company in tourism industry to e‐tourism marketing it's very vital. Next model shows the deferent areas in e‐tourism that companies must take more serious:
4. Strategy definition: Can discuss about strategy definition by asking eight decisions:
Decision 1: Target market strategy Decision 2: Posi oning and differen a on strategy Decision3:Sourcing‐Internet marketing priorities–significant to
organization. Decision 4: CRM focus and financial control Decision 5: Market and product develop strategies. Decision 6: Business and revenue model include product development
and pricing. Decision 7: Organizational restructuring required. Decision 8: Channel structure modifica ons.
Formation an E‐Marketing strategy is not an end state. A new platform will grow and evolve. To sustainable E‐Marketing success is to think and plan not just in terms of overall architecture, but act in incremental steps. For example, to manage risk, a company's very first E‐Marketing initiative might well be a simple "paper replacement" project to demonstrate the proof‐of‐concept in a well‐controlled, internal environment. In later increments, the scope of the project can be expanded to include easily managed process changes.

٩٦
In order to have a successful E‐Marketing strategy it is necessary to have board level commitment, and support from all departments, people involved and stakeholders. Projects have been known to fail without such commitment. To put this “e‐commerce culture” in place some education and training will need to be implemented before any further development is attempted (Dawson, 2009). No one person can do everything, separate training will be required for the different disciplines of hardware, software, networks, marketing, finance, human resources and process reengineering in order to build the necessary competence team.
It is necessary to identify and understand what your customers and partners expect from the Internet and from E‐Marketing. It is necessary to know how many customers are able and willing to interface over the electronic networks and conduct electronic transactions. Once the customer base is identified, the company can build a close‐knit community with its customers, encouraging customers to find out more about their products and services through message boards and emails. This builds the company’s image.
The technical issues of E‐Marketing implementation will also need to be continually reviewed throughout the system life cycle. The technology is moving at such a pace that it is likely that advantage can be taken of developments worldwide of technology and standards that were not available at the start of the project. It is advisable to build scalability and flexibility into the solution and to standardize wherever possible. Security is a particular areas of concern it is critical to ensure that the company’s systems keep up to date with expected standards of security, both within the organization and across all trading partners. In implementation E‐Marketing strategy there are two dimensions, which companies must attend to and performance them (Lages, 2004):
a‐ Firm Performance: Firm performance is a well‐established measure in the marketing literature. We will measure it through sales volume, profitability and market share for the current period (current firm performance), and perceived satisfaction with these measures when considering the previous.
b‐ Web‐Performance: The identification of current market position in the web is an essential issue. Most measures of web‐performance track variations in traffic‐page views, advertising impressions served, unique users, and so on. Nevertheless, the foundation of long‐term performance is lifetime customer

٩٧
value: the revenue customers generate over their lives, less the cost of acquiring, converting, and retaining them.
1‐8‐4‐ Effective Elements
The goals of the internal and external environments analysis are to understand the key resources and capabilities that a firm possesses to implement or sustain a specific E‐Marketing strategy and identification the effective elements. Resources might, for instance, refer to a large installed user base (as in the case of eBay), deep financial pockets to make targeted acquisitions (as is the case with Google), or a strong brand (as in the case of Tesco.com). E‐Capabilities refer to a firm’s ability through IT and the Internet to turn resources into valuable products or services. Based on the insights gained from the internal and external analyses, tourism companies should be able to gain an understanding of the strengths and weaknesses that possesses vis‐à‐vis competitors (Arabi, 2009).
In one hand Globalization, exchange rate fluctuations, changes in visa regulation, manmade and natural disasters are the factors that influence the tourism development (UNCTAD, 1998). Also, Policy implication, public private partnership and the creation of value are the key elements of e‐ tourism strategy (Paudel, 2005). In other hand internet change environments mixture, marketing methods, customer shaping culture and expects; and tourism industry players rolls. The overall insights from these two analyses can then be integrated into a SWOT matrix (Strengths–Weaknesses–Opportunities–Threats matrix).
Amit and Zott2 argue there are a number of characteristics that can be associated with virtual markets: high connectivity, transaction focus, the importance of information goods, networks, and high reach and richness of information. They also note the influence virtual markets are having upon business structures, including disintermediation and reinter mediation and the restructuring of industry boundaries as businesses collaborate and outsource. This is particularly relevant within the tourism industry, which has been characterized by changing distribution networks3, 4 and the forma on of disparate tourism collabora ons across industries (B.A.C , 1990).
After having gained a clear understanding of a company’s characteristics and the key environmental and industry developments, we come to the crucial decision of choosing a strategic direc on. The primary choices are: (1) a cost leadership posi on where a company competes primarily on the basis of low prices, and (2) a
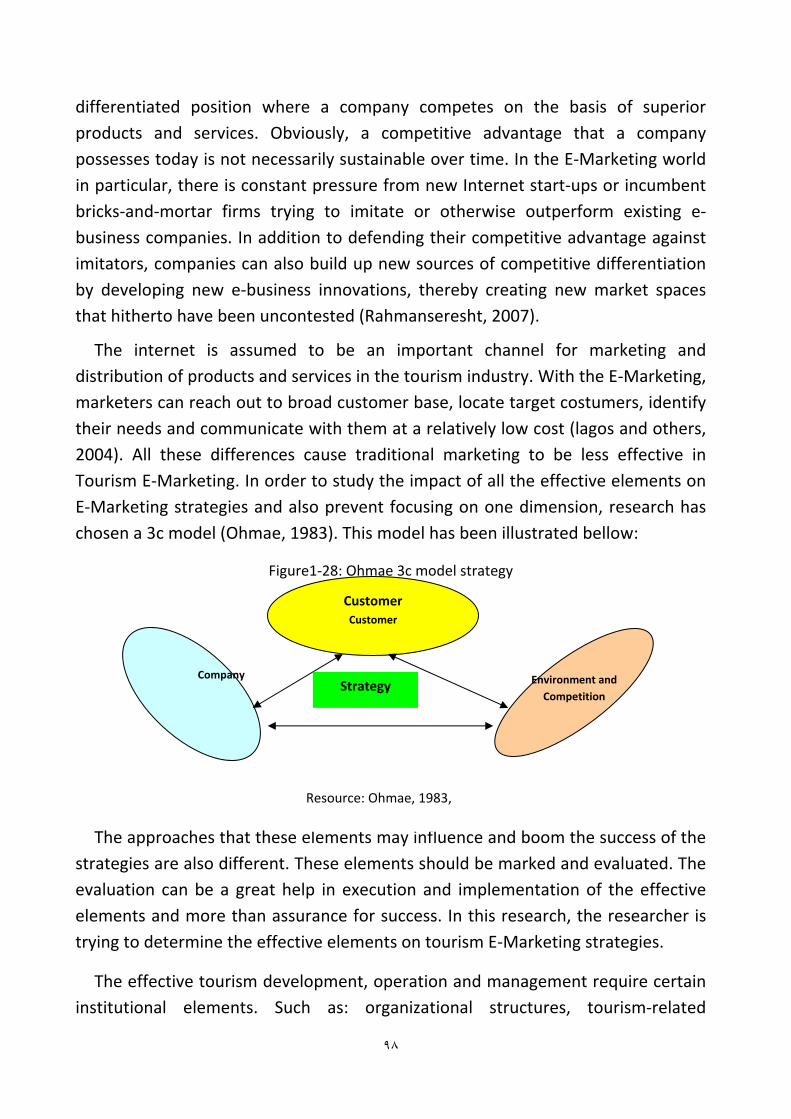
٩٨
differentiated position where a company competes on the basis of superior products and services. Obviously, a competitive advantage that a company possesses today is not necessarily sustainable over time. In the E‐Marketing world in particular, there is constant pressure from new Internet start‐ups or incumbent bricks‐and‐mortar firms trying to imitate or otherwise outperform existing e‐business companies. In addition to defending their competitive advantage against imitators, companies can also build up new sources of competitive differentiation by developing new e‐business innovations, thereby creating new market spaces that hitherto have been uncontested (Rahmanseresht, 2007).
The internet is assumed to be an important channel for marketing and distribution of products and services in the tourism industry. With the E‐Marketing, marketers can reach out to broad customer base, locate target costumers, identify their needs and communicate with them at a relatively low cost (lagos and others, 2004). All these differences cause traditional marketing to be less effective in Tourism E‐Marketing. In order to study the impact of all the effective elements on E‐Marketing strategies and also prevent focusing on one dimension, research has chosen a 3c model (Ohmae, 1983). This model has been illustrated bellow:
Figure1‐28: Ohmae 3c model strategy
The approaches that these elements may influence and boom the success of the strategies are also different. These elements should be marked and evaluated. The evaluation can be a great help in execution and implementation of the effective elements and more than assurance for success. In this research, the researcher is trying to determine the effective elements on tourism E‐Marketing strategies.
The effective tourism development, operation and management require certain institutional elements. Such as: organizational structures, tourism‐related
Customer Customer
Company
Environment and Competition
Strategy
Resource: Ohmae, 1983,

٩٩
legislation, regulations, education and training programs, availability of financial capital to develop tourist attractions, facilities, service, marketing strategy, promotion programs and travel facilities immigration. In addition, electronic devices have been influenced in all stages of tourism marketing activities. So in order to program tourism‐marketing, evolution of strategies marketing management is essential. Five main types of actors intervene in the traditional value chain of the travel and tourism industry (Constantelou, 2002):
The suppliers including airlines, transportation companies and accommodation service providers;
The tour operators, whose role is to pack the offerings of the suppliers;
The Global Distribution Systems (GDS) which are used by other actors to manage prices and inventories in real‐time;
The Travel agents who are playing the role of intermediaries
The final customer or the traveler
Nowadays the E‐Marketing strategies importance is clear for organizations and companies to acquire their goals. Marketing strategies are the main core for organization and companies to interact with environment and customer. Organizations and companies should plan their marketing strategies in such a form that could be able to achieve the most possible benefit from E‐Marketing and IT. So it is obvious that for having a useful and effective E‐Marketing which leads a company to achieve its defined goals, many effective elements should work. These elements should be studied and evaluated. In the previous sections of this research most of the elements and factors have been mentioned, which a company in design and implementation an E‐Marketing strategy must attend and analyze. In following explained some others to complete and more emphases implicate
The effective elements contain different internal and external items (macro or micro controllable or uncontrollable). For studying these items we may use different analysis including; SWOT4 (Strengths, Weaknesses, Opportunities and Threats). While building on the contingency theory, this part proposes a conceptual framework that links five factors (Lages, 2004):
4 Strengths, Weaknesses, Opportunities and Threats

١٠٠
a) internal forces, b) external forces, c) past web and firm performance, d) current web and firm performance, and e) E‐Marketing strategy in terms of the strategy defined for the 4Ws (Web‐Design, Web‐Promotion, Web‐Price, and Web‐CRM). Figure 1 presents the conceptual framework that incorporates past performance, internal and external forces of the firm, E‐Marketing strategy and current performance.
Figure 1‐29: A framework of the relationship between e‐marketing strategy and performance
Resource: Lages, 2004: 5
We will now examine specific issues of strategic analysis and objective (goal) settings that are related to E‐Marketing. In common with traditional marketing strategy, strategic analysis or situation analysis for E‐Marketing involves review of the (Chakraborty, 2002):
‐ Portfolio analysis and stage models ‐ E‐Marketing effectiveness ‐ Financial resources and cost/benefit ‐ Service quality ‐ Technology infrastructure resources ‐ Structure ‐ Customer demand and behavior ‐ Competitor activity ‐ Marketplace structure and relationships with suppliers and partners ‐ Competitive Intensity ‐ Organizational Innovation

١٠١
‐ Dichotomy ‐ Centralization ‐ Market orientation ‐ Competitors orientation ‐ Market Turbulence ‐ Technological Turbulence
It can be suggested that out of the different Social, Legal, Economic, Political and Technological characteristics of the macro‐environment. Three most significant factors which can be described in more depth, are the legal limitations to online promotion and trade such as; data protection and taxation, ethical constraints such as; privacy and technological constraints, the current availability and usage of technology to access the Internet and offering of distinctive services. Strategy is concerned with effectiveness rather than efficiency and is the process of analyzing the environment and designing the fit between the organization, its resources and objectives and the environment. Nevertheless, every of them have various kind and effect size in different industries. (Proctor, 2008, 1).
Thorough performance in an E‐Marketing strategy forces wide variety of factors with competitive power and advantage. These forces must be considered with their relative elements. This consideration can be a big help to select effective and powerful tools for putting E‐Marketing strategy into Action (Wyner, 2000):
Leadership: a) Persuasion b) Motivation c) Culture/values Human Resources: a) Recruitment/selection b) Transfers/promotions c) Training d) Layoffs/recalls
Structural Design: a) Organization Chart b)Decentralization c) Centralization d) Teams, e) Facilities and task des
Information and Control Systems: a) Pay, reward system b) Budget allocations c) Information systems d) Rules/procedures
Having access to web and E‐Marketing is essential for companies and specifically in tourism industry as owning a fax machine, telephone and internet. The companies in tourism industry are usually small (SME) such as tour operators and hotels, so they have limited material and human resources at their disposal. And there for they must adopt them with market and technologic condition; and often make significant change in their marketing strategy and processes which they interact with customers and suppliers. Therefore internet and the usage of E‐

١٠٢
Marketing gives them the opportunity to cover their weaknesses and by improve the method and usage better software to get competitive advantages in compare with their competitors in market.
To analyze the decisive factors that are determining the given market, can use the Porters five‐factor model of competitive environment, that contains the analyze of the following five factors: bargaining power of buyers, bargaining power of suppliers, threat of entry of new competitive, threat of substitutes and competitive rivalry (Porter,1985). In the internal environment, the 4p has been identified and analyzed (Yaroslavl, 2008).
In addition, accordance with the report issued by UNCTAD in relation to development of e‐commerce and E‐Marketing strategies; some key elements such as awareness, access infrastructure, legal, financial, electronic, logistic issues, trade facilitation, stimulating policies, and e‐government have been identified as the common elements in most countries that they affect an the E‐Marketing strategy. It also helps to companies to earn competitive advantage in e‐market in tourism industry (Cunninham, 2002). These strategies have been supported along with stimulating activities such as e‐business, e‐government, standardization, trade facilitation, and research & development in Information Technology (IT).
1‐9‐ Criteria of the research E‐Marketing was as to a developing product of network technology, it had
become a major marketing tool in information economical era, and it had been widely used in every field. I think that the definition of E‐Marketing should emphasize three points (Chen, 2001). The first is that e‐commerce has business background because it is a business model. The second is that e‐commerce has internet characters because it is based on network background, especially internet to realize business activities. The third is that the e‐commerce has electronic (numerical) character because that the information in the e‐commerce is transmitted by electronic form (Yongjun, 2008). In continue will be focus on analyzing the common characteristics and the inherent relationship of E‐Marketing strategy in Iran and Germany tourism industry.
The success of an organization in tourism industry, the increase of competitive environment and changing the tourisms expect and satisfaction level is dependent on the strategy, which will differentiate the organization from the competitions. In this research, we try to find the most important elements that effect on the

١٠٣
Tourism E‐Marketing Strategy (in different steps such as design, performance and development) and make formula and theory for strategy making and successful performance in tourism industry. In flowing, have been explained some Imperatives for an effective strategy according CEDAR research results (2009):
• Understand customer needs and demands across multiple segments across all market segments in order to tailor the product and service offering
• Understand the shareholders/owners expectations from the company
• Create a clearly defined vision, to serve well‐defined customer segments
• Maximize customer acquisition and retention through relationship management and customer service processes
• Optimize the utilization of the resources and identify areas of cost reduction
• Proactively focus on the customer in new product and service development
• Align the organization's service delivery around the customer service
• Identify the organization's capabilities and need for development, to deliver the strategy
E‐Marketing is not only including the professional works that the marketing department deal with in marketing operating. more than, it needs the cooperation by the relation business department such as procurement departments, producing department, financial department, Human Resource department, Quality supervision management department, product developing and designing department etc (Yingjian,2005). According to the demand of marketing to redesign and recreate the enterprise business standard by using computer network, so as to adapt to the demand of digital management and business in the network knowledge economy.
Therefore, E‐Marketing is the strategy that the agency or organization uses the modern communication technology methods to exchange the potential market into reality market. It is an important part of the completely marketing strategy, and it is a kind of marketing tactics to realize the marketing goals based on Internet (Yang,2001). The network marketing is that we can use Internet making continuously services in the every step of products pre‐selling, products selling and products after‐selling. It runs in the whole process of business operations and includes the search for new customers, service for old customers (Xiaoming, 2009).

١٠٤
Identifying the effective elements in E‐Marketing strategy is purpose of this research. E‐Marketing (marketing& electronic devices), strategy and tourism industry are there main dimensions of this research. The comparison between Germany and Iran is the others dimensions of this research.
Figure 1‐30: Criteria of the research
Source: Research subject
There are not many different methods in considering the strategy (design, implement evolution and evaluation) between the traditional marketing strategy and E‐Marketing strategy.
Mixing the three complete different objects, Tourism, Strategy and E‐Marketing have laded to the area of this research. It is clear that, finance support is very big and difficult and need mach time (impassible to do it in limitations of a dissertation's study). Other hand, Tourism industry includes different. The tourism industry main segmentations according Inskeep () are:
(1)Transport (Airline, railway, bus, rent car, curse line and ship);
(2) Accommodation (Hotel, camping, gust house and so on);
(3)Food and Beverage (fast food, restaurant, local foods; and potable);
(4)Des na on (attraction, culture, carnival, environment, ceremony celebration, museum, climate and so on);
Effective Element Analyze
GermanyIran

١٠٥
(5) Organizations (Government, WTO, UNWTO, local and so on) and
(6) Intermediate (tour operator, agency, marketing companies and so on).
As it is clear, study and consider all the segmentation in a dissertation is not possible and need a lot of time, assistant and finance. Therefore, according the supervisor advice, researcher has decided to consider only Airlines, tour operators and chain hotels in Iran and Germany, and select the Delphi group experts from these segmentations.
The balance scorecard is one of them. The balanced scorecard helps companies to effective formulation and implementation business and marketing strategies. The balance scorecard is a framework that focuses on shareholder, customer, internal processes and the organization development requirements of a business in order to create a system of linked objectives, measures targets and initiatives, which collectively describe the strategy of an organization and how that strategy can be achieved :
1. Environmental perspective: enhancing, resource, competitive, revenues and profits, cost, risk management;
2. Customer perspective: identify customer requirements, delivering and satisfying customer needs, addressing customer requirement in each segment, whit respect to product& service attributes, customer relationship, and image of company;
3. Organization perspective: development of products/service; employee skill development and proper career plans, innovative training, performance measurement and relevant compensation.
In following researcher has derived the decision tree of research, which includes only effective elements and they have identified by researcher during the research and first survey (which includes a pen questionnaire and have been disturbed between Delphi panel expert members in Iran and Germany).
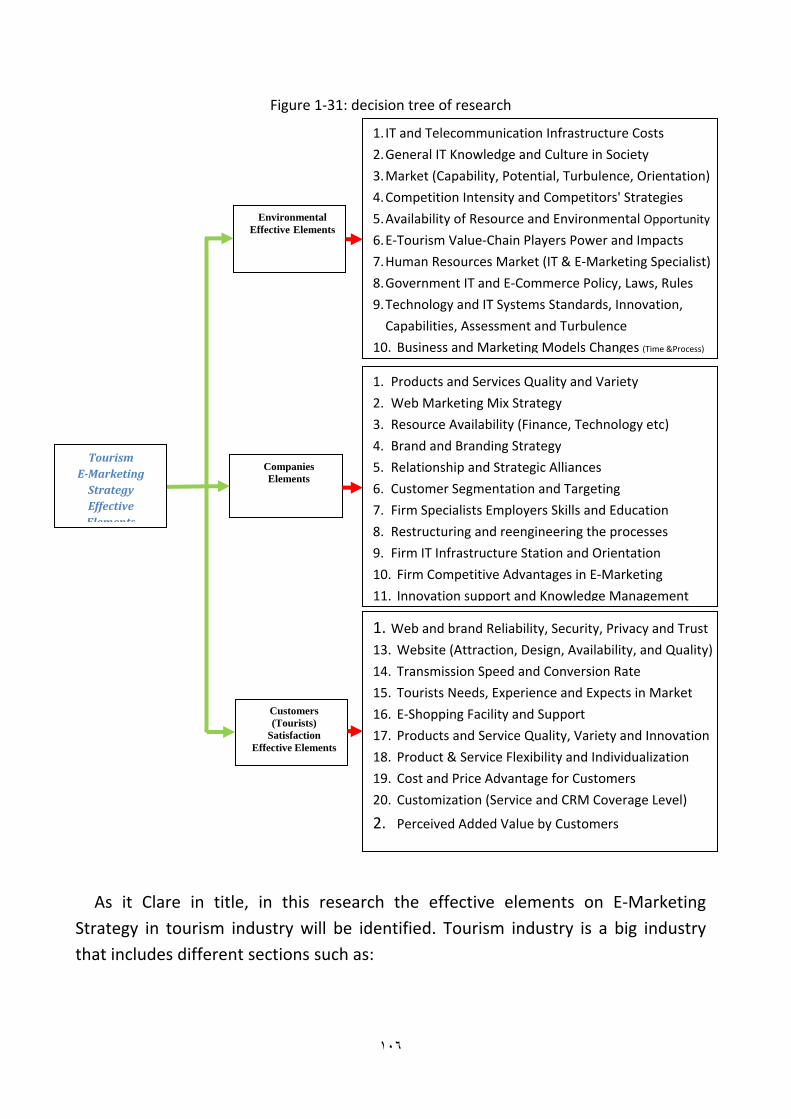
١٠٦
Figure 1‐31: decision tree of research
As it Clare in title, in this research the effective elements on E‐Marketing Strategy in tourism industry will be identified. Tourism industry is a big industry that includes different sections such as:
1. Products and Services Quality and Variety 2. Web Marketing Mix Strategy
3. Resource Availability (Finance, Technology etc) 4. Brand and Branding Strategy 5. Relationship and Strategic Alliances 6. Customer Segmentation and Targeting
7. Firm Specialists Employers Skills and Education
8. Restructuring and reengineering the processes 9. Firm IT Infrastructure Station and Orientation
10. Firm Competitive Advantages in E‐Marketing
11. Innovation support and Knowledge Management
1. Web and brand Reliability, Security, Privacy and Trust
13. Website (Attraction, Design, Availability, and Quality)
14. Transmission Speed and Conversion Rate
15. Tourists Needs, Experience and Expects in Market
16. E‐Shopping Facility and Support 17. Products and Service Quality, Variety and Innovation18. Product & Service Flexibility and Individualization 19. Cost and Price Advantage for Customers
20. Customization (Service and CRM Coverage Level)
2. Perceived Added Value by Customers
Tourism EMarketing Strategy Effective Elements
Customers (Tourists)
Satisfaction Effective Elements
Companies Elements
Environmental Effective Elements
1. IT and Telecommunication Infrastructure Costs
2. General IT Knowledge and Culture in Society 3. Market (Capability, Potential, Turbulence, Orientation)
4. Competition Intensity and Competitors' Strategies
5. Availability of Resource and Environmental Opportunity
6. E‐Tourism Value‐Chain Players Power and Impacts
7. Human Resources Market (IT & E‐Marketing Specialist)
8. Government IT and E‐Commerce Policy, Laws, Rules
9. Technology and IT Systems Standards, Innovation,
Capabilities, Assessment and Turbulence
10. Business and Marketing Models Changes (Time &Process)

Second chapter
Iran and Germany

١٠٨
2-1- Introduction The tourism industry has specific features that explain its importance for
economic (regional) development and its inclination toward IT systems and E‐Marketing technology. In addition, tourism greatly influences regional development, social, economic and demographic environment and with major changes taking place in international tourism, with tourist/customer behavior changing continuously as the type and duration of holiday‐taking changes, competition is growing faster than the pool of tourists (ΓΝΟΡΑ, 2005).
should be taken into consideration in order to meet the challenges and explore the opportunities as well as to improve E‐Marketability and capture the clear benefits of E‐Marketing, such as, overall customer‐lifetime value orientation, customer dictates, selling process customization, interactive/information‐enriched solutions, continuous customer interaction and customer expectations set by customer’s experience across the market.
2-2- Tourism in Germany Germany With more than 24.2 million foreign visitors in 2008 is ranked as the
eighth most visited travel des na on in worldwide. A total of 27.2 billion Euros is spent on travel and tourism; this is equivalent to 3.2% of Germany's GNP. The capital city of Berlin is currently ranked as the 8th most visited city worldwide. (UNCTAD; 2004) Including camping sites and accommoda on with 9 or more beds, a total of 369.6 million overnights were spent in Germany during 2008, this includes 56.5 million nights by foreign visitors. Because of Germany's cool climate, German travelers early on developed a preference for warm and sunny holiday des na ons. More than 30% of Germans spend their holiday in their own country, which shows that Germans enjoy (GNTB, 2009):
• Bavaria with 76.91 million nights, followed by
• Baden‐Württemberg 43.62 million nights and
• Lower‐Saxony with 41.52 million nights
The majority of foreign tourists came from the Netherlands with 9.69 million nights, the United States 4.45 million nights and the UK with 4.22 million nights. Also, one research in 2007 shows that Popular percep ons and reasons for

١٠٩
holidaying in Germany are: culture (75%), outdoors/countryside (59%), cities (59%), cleanliness (47%), security (41%), modernity (36%), good hotels (35%), good gastronomy/cuisine (34%), good accessibility (30%), cosmopolitanism/hospitality (27%), good shopping opportuni es (21%), exci ng nightlife (17%) and good price/performance ra o (10%) (Mul ple answers were possible) (Rowley, 2002).
According to the EU Commission report (2003), most of those regions should look to the structure and performance of entrepreneurial activities in the sector; in so doing, small municipalities start thinking to order several sector or territorial strategic plans to develop their territories, even if they had not a leading viewpoint (Carvalho, 2006). In fact, Gollub et al (2003) referred the major importance one should give to tourism destiny as a local multi‐product allowing qualified initiatives to develop other sectors and small activities, considering the agents will be able to (net) work together. The German Federal Government is heavily engaged in promoting the interests of the tourism industry and consumers at international level. At EU level, it advocates the removal of current obstacles to the international exchange of services (Gollub, 2003).
Tourism provides local jobs and training places and enhances the recognition factors for towns and regions and with that for Germany as a location for business and industry. It also benefits a variety of allied economic sectors. Tourism is of special economic significance for the new federal states. Positive developments in tourism make a substantial contribution to the eastern German labor market, especially also in structurally weaker regions. However, Eastern Germany’s tourist regions are not enough well known and they need specific marketing strategies to give them a more distinctive profile.
The German Government is always looking to strengthen the economic capabilities of the small, medium‐sized and large‐scale enterprises in the tourist industry. They are flowing the aim of raising tourist arrivals from home and abroad and increasing the number of jobs in the sector (Hinsken, 2009). History contents, verbal tradition and GIS were also important resources the German government used to undertake the diagnosis stage, and provided very helpful, new and valuable information to the whole set of stakeholders (Carvalho, 2006). German National Tourist Board argued that Tourism is one of the six key location factors for a country’s Image. Exports, People, Governance, Cultural and Heritage, Investment

١١٠
and Immigration are others factors, they most consider to Justifying about the country's image (GNTB, 2010).
2-2-1- History The history of tourism in Germany traces back to cities and landscapes being
visited for educa on and recrea on. From the late 18th century onwards, ci es like Dresden, Munich, Weimar and Berlin were major stops of a European Grand Tour. Spas and resorts on North and Baltic Sea, as well as along the Rhine valley par cularly developed during the 19th and early 20th century and since the end of World War II tourism has expanded greatly as many tourists visit Germany to experience a sense of European history. The countryside exudes a pastoral aura, while its cities exhibit both a modern and classical feel. Some tourist towns in Germany include: Bamberg, Berlin, Hamburg, Rothenburg ob der Tauber, Heidelberg, Würzburg, Munich, Tübingen, Trier, Goslar, Lübeck, Aachen, Schwangau, Dresden and Quedlinburg.
Forthcoming highlights for Germany are 20 Years since the fall of the Berlin Wall, the Passion Plays in Oberammergau (Bavaria) in 2010, Ruhr 2010 European capital of culture and the 2010 Men's World Ice Hockey Championships. The official body for tourism in Germany is The German National Tourist Board, represented worldwide by local Na onal Tourist Offices in 29 countries. In recent decades, the world of economy has experienced a shift from the primary (agrarian) and secondary (industrial) sectors to the tertiary (service) sector. While developed countries (such as Germany), have got an overwhelming portion of their economic activities contributed by service sector (Hus&etc.2008, 2). Germany is the country where has more tourism and visitors every year from different countries of the world travel there. In order to save its market and revenues in the shifting tourism market, Germany must have efficacious strategies for E‐Marketing to create added‐value and competitive advantage.
The German Government is committed to social responsibility in tourism, which is why its tourism policy abides by the guiding principle of sustainable development. The aim is for tourism to meet social, cultural, environmental and ethical standards and achieve commercial success at the same time. This way, it can contribute to reducing poverty, conserving biodiversity and protecting the environment and climate. German Government also applies to the whole tourist industry of course. Germany sets high standards here and the public is well aware

١١١
of environmental issues. Tourists are also taking increasing note of environmental problems and these are beginning to affect decisions on destinations (Hinsken, 2009). Germany will continue to position itself as a holiday destination with high environmental standards offering excellent recreational facilities.
Overall, the German National Tourist Board (GNTB) expects overnight figures to fall in Germany by around 2 per cent in 2010. Absolutely, regions and products that offer particularly good value for money will have a strong opportunity to generate further growth, even in 2010 (GNTB, 2009). In below table man can sees Germany is in third place by European comparison in terms of the number of overnight stays at hotels (GNTB, 2010).
Table 2‐1: number of overnight stays at hotels in European
Resource: GNTB, 2010)
This sales argument, coupled with a modified marketing strategy based on a worldwide price offensive for “Destination Germany”, will be at the centre of the GNTB's campaigns in 2009.
2-2-2- German Government Tourism Policy A seminal principle of tourism‐policy activities at EU level is subsidiary. At a
multinational level outside the EU, Germany is involved in the World Tourism Organization (UNWTO), the Organization for Economic Cooperation and Development (OECD) and in specialist United Nations conferences that deal with issues influencing tourism policy and the tourist industry worldwide. The German Government is committed to social responsibility in tourism, which is why its tourism policy abides by the guiding principle of sustainable development. This is why it sup‐ports the ongoing implementation of an international code of conduct
١١٢
for obliging tourist enterprises to inform and instruct personnel on protective measures in outbound and inbound countries. According the German Government guidelines policy on tourism industry (2009), the main tle of German Government Policy contains the flowing items:
Sustainability: Germany stands for sustainable tourism. In tourism, it is vital for destinations to maintain a more or less intact environment. Germany sets high standards here and the public is well aware of environmental issues. Tourists are taking increasing note of environmental problems. Sustainability and resource conservation will also gain importance as issues in tourism. In the long run, a sustainable tourism policy will afford competitive advantages because environmental awareness among tourists is bound to grow.
Quality: Germany must stand for top‐quality tourism services. The enlargement of the EU eastwards has extended the European travel market, which means new competition but also new opportunities for the German tourism industry. The same applies to travel markets, such as China, India or the Middle East. As destinations vie more for visitors, quality improvements in products and services will afford a competitive edge. Transparent standards and inter‐national quality assurance provide guidelines for clients. Quality in tourism has many sides to it. Accessibility is also gaining importance as a quality benchmark. Germany has made strides in hospitality, service, family friendliness and flexibility in dealing with guests but there is stillroom for improvement. Genuine hospitality is what really makes a holiday unforgettable and persuades tourists to come back for more than one season.
Demographic change: Tourism must take full advantage of the opportunities afforded by demographic change. Tourism infrastructure needs adapting to harness the opportunities offered by the growth market in senior tourists: easy‐to‐reach destinations and the customized development of accessible transport facilities, leisure amenities, restaurants and hotels.
Qualification: We need better‐qualified personnel in the tourism sector. Germany is looking to retain and extend its international lead as the preferred location for fairs, conventions and conferences. The only way to do this is with capable and motivated personnel. We need to mobilize the large training potential in the tourist industry.

١١٣
Destination Germany: Germany needs better destination branding. As a brand destination, Germany offers a great variety of amenities for tourists. Its special strengths include the segments cultural and city trips, business journeys and recreational tourism. Developing and modernizing infrastructure is the way to make sure that tourist destinations are easy to reach. Germany wants to remain a cosmopolitan and tolerant country, so it must be adamant in opposing any animosity towards foreigners.
Cooperation: needs to be improved between tourism policymakers and the industry. Tourism policy in Germany is also organized along federal lines. The German tourist industry is largely made up of small and medium‐sized enterprises. At the same time, Germany must develop and market destinations in global competition. There must be a greater shared awareness of the need to cooperate in a major global growth industry and contribute to developing and communicating Germany as a holiday destination at home and abroad. Cooperation ought to be stepped up between the German National Tourist Board and German representatives abroad.
Participation: Germany wants to involve everyone in tourism. To enable everyone to avail themselves of tourist products and services, the ideal of barrier‐free travel needs to be mainstreamed in the whole tourist supply chain. Access to railway stations, airports, means of transport and to cultural and leisure facilities, restaurant ants and hotels must be barrier‐free.
According the GNTB (2007), marketing of Germany is based on detailed studies of international markets using relevant statistics and data, which collated by the Federal Statistical Office on numbers of overnight stays by visitors from Germany and abroad. (the World and German Travel Monitors, the World Tourism Organization (UNWTO), the World Travel & Tourism Council (WTTC) and the analysis of travel patterns conducted by the research organization holydays and travel (FUR5). Germany continues to be the most popular holiday destination for Germans and with around 300 million overnight stays a year; domes c tourists remain the linchpin of tourism in Germany. International travel to Germany is becoming increasingly popular, with Germany‘s market share expanding steadily.
5 Forschung Urlaub und Reisen

١١٤
On the demand side, Germany is in third place of 50 countries worldwide ‐ enduring success since the 2006 World Cup. Tourism is one of the six key loca on factors for a country’s Image Countries have distinct strategies for their tourism industry to develop it and improve their share in the tourism market. Also according the GNTB (2009) 10 strategic spheres of ac vity for Germany’s Incoming Tourism include followings strategies:
1. Strengthen the image of Germany as a travel destination
2. Generate tourism growth at the global level
3. Expand and integrate air, rail and road infrastructure for tourism
4. Secure position as premier business travel destination in Europe
5. Rise to the challenge of global socio‐demographic change
6. Develop and exploit the cultural attractions of Germany for tourism purposes
7. Develop health‐related tourism, particularly in the domestic market
8. Develop products and scenarios to cope with climate change
9. Promote greater internationalization of cities and regions
10. Adopt multi‐channeling strategy for global sales and marketing
2-2-3- Tourism value crating network in Germany Electronic Commerce is defined as "buying and selling of goods and services
through electronic technology utilizing on line services such as Internet, interactive television, commercial online services and screen telephones so that an organization's objective can be achieved”(Arthur, 2002). In the 21st century, digital technologies will push beyond the existing boundaries in all these spheres of our lives. The transition from brick‐and‐mortar business to "clicks" business is happening in all sectors of the economy (Deitel, 2001). Same patterns can help to companies and organizations to better understanding the e‐tourism and programming for develop the practical E‐Marketing strategy in tourism industry. Adersberger (2005) had offered a platform for Germany e‐tourism. It has showed in nether diagram.

١١٥
Figure 2‐1: a pla orm for Germany e‐tourism
Resource: Adersberger, 2005
This platform has five main part; packaging, information, marketing, transaction and travel. Every of them include some activities and contents. For example, travel section contains the ticketing, mobile service during the travel and feedback and so on. If a little more attend to these parts, can find that all of them are part of the Marketing program and strategy. For example, the services, which have been offered in travel section, are part of the marketing and transaction is the aim and last part of marketing plans. Therefore, in design the E‐Marketing strategy most will pay enough attention to them.
2-2-4- Different tourism booking channels in Germany Statistics show that the internet state in first place between the distributions
channels in tourism industry in Germany and euro and it continue its increase. But Germany must adopt a multi‐channeling strategy in order to succeed against international competition. Blow diagram shows the share each of distributions channels in tourism industry in Germany in 2010:
Multi canals (TV, SMS, and WWW) Integrated canals
Mobil service Ticketing Feedback
Dynamic packaging

١١٦
Figure 2‐2: share each of distribu ons channels in Germany tourism industry in 2010
Resource :(82)
Above figure (2‐2) shows, that in 2010 internet (e‐marketing) with 65 percent of whole the reservation and distribution have became the main distribution channel in Germany tourism industry.
2-2-5- Chain hotels and E-Marketing in Germany Expert at knowing what the customer wants, chain hotels can offer a whole
range of different advantages, usually and including competitive rates, a central reservation number, a standard level of quality and most importantly a high level of professionalism. In Germany, competition for business and leisure travel is incredibly fierce, resulting in a superb buyer's market. With so much competition, well‐established hotel chains usually are keen to build a high level of service and reputation.
Chain hotels in Germany ended the 2008‐year far better than in most European countries, but as the economic downturn begins to take its toll, the country will also suffer from less trade fairs being organized this year. The German chain hotel market ended the year with a 1.8% increase in Revenue per Available Room (RevPAR), making it one of the best‐performing European countries in 2008. In following researcher has explained some about main chain hotels in Germany:

١١٧
2-2-5-1- Steigenboger hotels The Steigenberger name had stood for top‐class European hospitality for more
than eight decades now. Albert Steigenberger founded the family‐run business in 1930 and it turned into a public limited company in 1985. Up un l 2009, the Steigenberger family owned 99.6% of the shares. Today, the economic owner of the company is Mr Hamed El Chiaty.
Figure 2‐3: picture of first Steigenberger hotel in 1930
In 1930 had Albert Steigenberger, a businessman from Lower Bavaria, buys his first hotel, the "Europäischer Hof" in Baden‐Baden. And in 1940, he had acquires the "Hotel Frankfurter Hof" in Frankfurt am Main. Just four years later, the hotel is completely destroyed by bombing during the Second World War. It is re‐opened with a con ngent of 20 beds in 1948. Five years later, the completely rebuilt Frankfurter Hof is re‐opened as the city's top hotel.
Figure 2‐4: picture of a room in first Steigenberger hotel in 1930
" The company had continues to expand: over the years, the company acquires "Palasthotel Mannheimer Hof" in Mannheim (1956), "Grand hotel Axelmannstein" in Bad Reichenhall (1956), (1957) and "Duisburger Hof" in Duisburg (1958). In 1958 Company founder Albert Steigenberger died. His son, Egon has taked over the running of the family business. He prepared the company for the challenges of the future, such as air travel, leisure tourism and globaliza on. Between the 1958 and

١١٨
1970, the Company has continued to expand and developed new holiday hotels and holiday concepts with entertainment, sports, cultural and health & fitness offerings. The prototypes are created in the Bavarian Forest: in Lam and in Grafenau. By the end of the 1970s, they have been joined by a number of renowned hotels: in well‐known health resorts, such as Bad Kissingen and Bad Neuenahr, as well as at Europe's new aviation hub, Frankfurt International Airport.
In 1980s: Steigenberger celebrated 50 years in business. Further hotels are acquired for the Group: for example, hotels in Berlin, Baden‐Baden and Bonn, as well as in Saanen‐Gstaad and Davos in Switzerland. The 1990s sees the most growth‐intensive years in the company's history: more than 40 new hotels are opened or acquired. Steigenberger enters the Austrian market with five hotels. The number of Intercity Hotels grows to 16, and in North Germany, the company's first holiday hotels open their doors for holidaymakers on the Baltic Sea.
Figure 2‐5: picture of Steigenberger hotel in Switzerland
In 2003it had 5,446 employees and they have generated an annual turnover of €441.3 million for hotel. And in 2005 it celebrates its 75th anniversary. No other hotel company in Germany can look back on such a long history as a family‐run business. The Steigenberger Hotel Group presented its 2013+ corporate strategy in 2008. Quality leadership, expansion and increased profitability are the key issues. Mr Hamed El Chiaty becomes the economic owner of Steigenberger Hotels AG in 2009.
The Steigenberger Intercity Hotels team was to be seen on the winners' rostrum no less than three mes at the 28th HSMA Marke ng Awards ("SAM") on 11 May 2006 in Rust. Steigenberger took first place in the categories "Communica on" and "Distribution" for its "Heart of Dresden" and "Best Available Rate/Best Price Guarantee" campaigns. When it finally came to the "Big SAM", the Steigenberger team, under Marcus Bernhardt, Head of the City Hotels Division, took second place for its "Certified Conference" campaign.

١١٩
Friendly, timesaving, comfortable and innovative Intercity Hotel brand fulfils every possible expectation of the price‐conscious business and city traveler in our sophisticated city hotels. Their perfect locations at major traffic hubs, such as mainline train stations and airports, make Intercity Hotels the perfect base for your business meeting or a city break. One of the key elements of the Intercity Hotel philosophy is its clearly defined location strategy. All hotels are within walking distance of major traffic hubs, such as mainline train stations and airports. Steigenberger hotels offer all guests a "Free City Ticket" as a special bonus, which allows them to travel on local public transport free of charge. These areas offer fax, telephone and internet connections as a matter of course. All hotel areas offer Wi‐Fi access as a matter of course. Stylish lighting and decor create just the right ambiance in which to sit back and relax.
Their corporate strategy is geared towards the development of sustainable competitive advantages. That is how we succeed in winning over our guests and keep them coming back to us. Also, it is based on three basic principles:
Company vision: there is base on believe in consistent quality and heartfelt hospitality, which we deliver with enthusiasm and courtesy. Their expansion efforts are focused on popular destinations around the world, in addition to major European cities and airports. Increased profitability through consolidation, leveraging of synergies and Best Practice processes and ideas –all based on clearly defined quality standards. And also, their strategy is based on three basic principles:
• Quality leadership of the Steigenberger Hotels and Resorts and Intercity Hotel brands through a constant increase in brand awareness: The two brands Steigenberger Hotels and Resorts and Intercity Hotel continue to expand their leading position in terms of performance and customer satisfaction and, at the same time, to boost their competitiveness by optimizing their profiles.
• Increased profitability through consolidation, leveraging of synergies and Best Practice processes and ideas –all based on clearly defined quality standards.
Quality leadership of the Steigenberger Hotels and Resorts and Intercity Hotel brands through a constant increase in brand awareness: The two brands Steigenberger Hotels and Resorts and Intercity Hotel continue to expand their

١٢٠
leading position in terms of performance and customer satisfaction and, at the same time, to boost their competitiveness by optimizing their profiles.
2-2-5-2- Accor hotels In 1967, Gérard Pelisson and Paul Dubrule opened their first Novotel hotel on a
roadside near Lille in northern France. Travel was booming in France in the 1960s and the hotel industry had not yet expanded to meet the demand. French hotels, in general, were either rural inns or luxury hotels in city centers. Dubrule decided to build American‐style highway hotels in the medium price range and collaborated with Pelisson, a former head of market research at IBM‐Europe. In 1973, Sphere S.A. was created as a holding company for a new chain of two‐star, no‐frills hotels, called Ibis; the first Ibis was opened the following year. During this time, the company also acquired Courte Paille, a chain of roadside steakhouses founded in 1961, which reflected many of the same priori es as Novotel: prac cality, easy parking, consistent quality, and quick service.
The acquisi on of the Mercure hotel chain in 1975 pushed the company into metropolitan areas and the business traveler market, and these hotels varied according to regional demands in style, character, and restaurant offerings. By the end of the 1970s Novotel had become the premier hotel chain in Europe with 240 establishments in Europe, Africa, South America, and the Far East.
In 1980, Novotel invested in Jacques Borel Interna onal, which owned restaurants and the luxury Sofitel hotel chain. Jacques Borel had begun his career with the establishment of one restaurant in 1957 and by 1975, when he took over Belgium's Sofitel chain; he was Europe's top restaurateur. Sofitel's luxury services aimed at business and holiday travelers and located in the center of international cities, near airports, and in prestigious tourist areas, introduced Accor to the higher‐priced end of the hospitality industry.
Accor also entered the travel industry during this time, buying into Africa tours, the largest tour operator to Africa, which became the third of its major investments, along with hotels and restaurants. The company expanded its tour operations to North and South America, Asia, and the South Pacific through the purchases of America tours, Asia tours, and Ted Cook's Islands in the Sun. In an effort to attract weekend clientele in Europe, Accor developed Épisodes, an agency

١٢١
specializing in weekend rates for rooms usually occupied by business travelers during the week.
In 1985 Hotec, a subsidiary of Accor brought forth a completely new idea in the hotel industry with the crea on of Formula 1, a one‐star budget hotel chain with no reception staff, no restaurant, and no private bathrooms. Travelers simply inserted a credit card at the entrance to gain access to the rooms, which were plain yet prac cal and cost $15 a night. Formula one hotel appealed to vaca oning young people and families with limited financial resources.
Accor overhauled the company's communications and management systems and restored its market presence through a new sales drive. By 1987, Accor was the world leader in restaurant vouchers for employees and was exploring. Accor used a radio ad campaign and transatlantic marketing to lure Europeans to Motel 6. Although Accor agreed not to overhaul the management of Motel 6's parent company, Motel 6 G.P. Inc., it did sell a 60 percent stake in the budget chain to French investors.
At the end of the 1992, Accor became the world leader in its industry with 2,100 hotels, 6,000 restaurants, and 1,000 travel agencies. Accor began a hotel‐rebranding strategy in June 1993 to eliminate the Pullman Hotels Interna onal chain, acquired in 1991, while expanding its Sofitel and Mercure brands. Through renovations, the company transformed 27 Pullman hotels into Sofitels, while another 25 Pullman hotels became Mercure hotels.
In the car rental business, the company shared control of Europcar Interrent Interna onal with Volkswagen AG in 89 countries in Europe, Africa, and the Middle East. One of the first signs its steamrolling expansion would not continue was the loss of Accor's 1994 bid for a majority stake in the four‐star Meridien hotel chain. Europcar, Accor's joint venture with Volkswagen, had become Europe's largest car rental company; in addi on to its car rental fleet, by 1995 the company had 3.2 million leased vehicles. By 1997, Accor con nued to open new hotels, especially internationally. Its Asia‐Pacific subsidiary, which the company had launched in 1993, controlled 144 hotels in 18 countries by 1996. With 56 more projects in the works, Accor Asia‐Pacific had become that region's leading hotel group; its Africa/Middle East group operated 99 hotels by 1997, and its La n America group, 89 units.

١٢٢
The company also launched its first web site, Accorhotels.com, offering informa on and online booking services that received some 12 million hits during the year. In addi on, Accor finished 2000 with revenues of 7.01 billion EUR, with hotels bringing in 4.74 billion Euros, services E 437 million Euros, and its travel agencies, casinos, restaurants, and onboard rail services the remaining 1.83 billion Euro. The company, which had seen its online reservations, grows at breakneck speed, teamed with rivals Hilton International and Six Continents to launch a new reservations service called WorldRes. Europe. The new site, cleared by the European Commission in 2003, allowed travel agencies, hotel personnel, and travel sites to reserve and hold bookings for each hospitality giant in real‐time. While hopes were high for the new web site, Accor and competitors were hurt by a sharp downturn in travel and tourism in Europe and Asia
In 2006 Accor Services introduced the Ticket CESU® human services voucher in France and the Ticket Service® voucher in Turkey and Sofitel opened a new flagship hotel on the US West Coast: the Sofitel Los Angeles. In this year, also a major hotel expansion program is rolled out in India, with the goal of opening more than 5,000 Sofitel, Novotel, Mercure, ibis and Formule1 rooms within 5 years. Accor had Launch of the Plant for the Planet project, which aims to plant 3 million trees by 2012 using the savings generated by towel reuse by guests in the 2008. The 2009 have launched by the Novotel brand of an e‐learning training unit focused on sustainable development for its employees.
In 2010 Accor Thalassa, the Group’s well‐being brand, is renamed Thalassa Sea & spa. Accor bondholders approve the proposed demerger of the two businesses. The new genera on of Suite hotel is Suite Novotel: created in 1998, the Suitehotel brand now joined the Novotel family, boasting a new name, Suite Novotel. Accor will have 100 hotels opera ng in Greater China: This milestone achievement comes after operating in China for 25 years. Accor intended to bolster its presence in the leisure market, while con nuing its plans of opening a total of about 200 hotels annually for the next several years, especially in Asia.

١٢٣
Figure 2‐6: Accor chain Hotels revenue in 2010
Source: Accor hotel 2011
Hotel Portfolio 4,229 hotels / 507,306 rooms
Consolidated revenue € 5,948 million
2010 Net profit, Group share € 3,600 million
Operating profit before tax and non‐recurring items € 334 million
Market capitaliza on (as of December 31, 2010) € 7,6 billion
Figure 2‐7: Number of employees in Accor hotels at 2010
Source: Accor hotel 2011

١٢٤
They explain that they become to one of the world's three leading hotel operators, while respecting the values that have always informed the Accor spirit‐a pioneering spirit of conquest shaped by a commitment to high performance and a constant concern for people‐customers, employees and host communities‐and for their environments. For this importance, they emphasize on:
‐ provide travelers with the solution best adapted to their needs and a guarantee of the highest quality of service,
‐ create services for corporate clients and public institutions that support their development,
‐ enhance their performance and simplify the daily lives of employees and constituents.
What distinguished Accor from its rivals, however, was its broad coverage of the hospitality and leisure market with establishments for all budgets, from one‐ to five‐star properties and about 15 complementary brands that are recognized and appreciated around the world for their service quality to the specific needs of each business and leisure customer. Accor, the world’s leading hotel operator and market leader in Europe, is present in 90 countries with 4,200 hotels and more than 500,000 rooms. Its broad portfolio of hotel brands – Sofitel, Pullman, MGallery, Novotel, Suite Novotel, Mercure, Adagio, ibis, All seasons, Etap Hotel, HotelF1 and Motel 6, Studio 6 and related activities, Thalassa Sea & Spa and Lenôtre – provide an extensive offering, from luxury to budget. With 145,000 employees worldwide, the Group offers its clients and partners nearly 45 years of know‐how and expertise.
Figure 2‐8: Accor group different brand categories
Source: Accor hotel 2011

١٢٥
Since the opening of the first Novotel in Lille in 1967, team members have been driven by a pioneering spirit of conquest. A key to Accor’s success, this attitude has over the years shaped the Group’s culture, which is the cement that binds our team members while respecting difference in their ages, cultures and positions within the organization. Managers leverage these values to provide support for team members as part of the Group’s ongoing transformation and development.
• Innovation is our trademark
• The spirit of conquest is our growth engine
• Performance is the key to our continued success
• Respect is basis of all our relationships
Accor believes it is essential to contribute to their development and well‐being, which includes employment and training, contributing to health, local purchasing and, in general, any measure that contributes to local social and economic development. In order to organize and systematize these processes, Accor founded "the Earth Guest" Program in 2006.
Accor’s strategic vision: In 2010, Accor opened a new chapter in its history when it became a pure‐player in the hotel business. Having demerged from its Services business since the General Mee ng on June 29, 2010, Accor intends to capitalize on its strengths to step up the implementation of its strategy and accelerate its growth. Refocused on its core business as a hotel operator, Accor is now ready to step up implementation of its strategy by leveraging four competitive strengths:
• A comprehensive brand portfolio aligned with our strategic vision: Backed by a portfolio of brands ranging from budget to luxury, Accor is currently the only hotel group operating in every market segment. This broad range of products enables us to respond to demand for segmentation from both customers and hotel owners looking for multi‐brand, multi‐segment solutions.
• Unique expertise as the world is leading hotel operator: Accor is deeply committed to satisfying its guests and employees, by deploying expertise acquired over more than 40 years. Today, we manage more than 387,000 rooms in hotels that are owned, leased or operated under management contracts that together account for nearly 80% of the total network.

١٢٦
• Leadership positions on four continents: Accor is the market leader in Europe, Africa and the Middle East, Latin America and the Asia‐Pacific region, in either the number of hotels or the number of rooms. Accor dense global coverage is a major strategic advantage in moving into new markets, particularly in the emerging economies.
• A business model built on solid fundamentals: In 2010, Accor exceeded the financial objectives set before the demerger.
When Accor’s 2010 results were released on February 23, 2011, Denis Hennequin, Chairman and Chief Executive Officer, noted that: “Accor’s performance in 2010 attests to the effectiveness of its business model and has laid a firm foundation for the future. Strengthened by a new Executive Committee and a robust financial position, our objective will be to accelerate the execution of our strategy, with three priorities: to be more ambitious for our brands, to promote our services and expertise more effectively, and to step up implementation of our expansion plan in both mature economies and emerging markets. This strategy will be supported by our dynamic asset management strategy which will give us additional flexibility to fulfill our ambitions.”
Figure 2‐9: A picture of Accor hotel Face book

١٢٧
2-2-5-3- NH hotels NH Hotels (officially NH Hotels SA, BMAD: NHH) is a Spanish‐based hotel chain
headquartered in Madrid. NH offers moderately priced and modernly‐furnished hotel rooms and lobbies, located primarily in Europe, Latin America, and Africa. NH Hotels is listed on the Madrid Stock Exchange, where it is a member of the Madrid Stock Exchange General Index, and is also quoted on the New York Stock Exchange (OTC Market)
NH Hotels (www.nh‐hotels.com) ranks third among European business hotels. NH Hotels currently has 394 hotels with 58,844 rooms in 22 countries in Europe, America and Africa. NH Hotels has at present 54 new projects for hotels under construc on, which will provide more than 8,000 new rooms. NH Hotels stands out in quality both as regards services and facilities, with very carefully thought out decoration, intended to please all tastes and making the guest feel comfortable. NH Hotels' establishments offer the most advanced technologies designed to facilitate the guest's communication as well as his work and leisure.
Figure 2‐10: A picture of NH Almenara Golf‐Spa
The restaurants are another priority for hotels in the Chain, offering guests first‐rate cuisine. Furthermore, the prestigious restaurateur Ferran Adrià, creator of El Bulli restaurant, has entered into an association with NH Hotels, launching new concepts such as "nhube" and "Fast Good", pioneering spaces in the hotel sector. NH Hotels is a responsible company in the Tourism industry. The Chain offers hotel services, which anticipate present and future needs of both our internal and external stakeholders (Employees, Clients, Shareholders, Suppliers, Environment, etc.), the communities where we operate and future generations with maximum attention to detail and efficient and sustainable solutions.

١٢٨
Figure 2‐11: A picture of NH hotel Face book
2-2-5-4- HRS hotel HRS operates a global electronic hotel reservation system for business and leisure
travelers based on a database of (claims to) over 250,000 hotels in all price categories in Germany, Europe and worldwide. The system allows free direct booking with instant confirmation at continually updated prices. The prices quoted for chosen hotels room rates are guaranteed for the booking. Bookings are non‐binding standard, that is, at no cost and no‐show, the booking is canceled arise at six clock on arrival. These bookings can also be canceled at no charge. Founder and sole owner is Robert Ragge. The company, with headquarters in Cologne employs approximately 500 people History.
Figure 2‐12: A picture of HRS company's headquarters in Cologne
١٢٩
The company was founded in 1972 ini ally as a travel agency founded that focuses on the accommodation agency specializing in trade shows. In 1977 the company became a limited company. Today HRS maintains offices in Shanghai, London, Paris, Warsaw, Istanbul and Rome. March 2008, the Company announced the acquisi on of the Tyrolean tourism portal Tiscover.at. Since 1996, the HRS homepage is accessible on the Internet. The reservation software offers hoteliers the opportunity to offer including special offers, weekend rates and fair prices. It is also possible to completely block a hotel booking in peak times in order to avoid overbooking.
The company receives from the hotel company for the jobs nights, a commission and has indicated an over 50‐percent market share in the booking agency. According to a survey, the company CHD Expert (Germany) GmbH was HRS for 59% of Germany in 2008, the most important hotels booking portal. Other channels such as booking by e‐mail, telemetric systems in cars, on mobile short codes from mobile operators or mobile phone via WAP and i‐mode will keep this market share. HRS refers to himself as a European leader in global hotel reservations.
HRS operates a partner program , which is a rewarded partner site for the mediation of bookings with a commission. The so‐called affiliates have, in addition to a normal link to hrs.de, different ways of integration. HRS thus offers a white label access to for example bahn.de. Another type of integration is to show the hotel list in one frame.
Industrial companies are connected free of charge using encrypted Internet partner access to the Hotel Reservation System: Integration of company rates, best‐buy function, statistics, and adjustments to the company's look and feel. They also have access to special HRS corporate rates with up to 30 percent discount. Trade fair reservations: From their own quotas on all trade fair locations worldwide with special rates for construction and mining personnel. Special departments for conventions, conferences, seminars, events of all kinds, group bookings and incentives. "Meetings Online" / "Groups online": Two tools for direct online processing of appropriate requests in suitable hotels of all categories from the global HRS system. Online direct booking of 10‐20 rooms with suitable mee ng room in hotels of all categories.
2-2-5-5- Hilton hotel Hilton Worldwide (formerly, Hilton Hotels Corporation) is a global hospitality
company. It is owned by the Blackstone Group, a private equity firm. As of July 2011 Hilton brands encompass 3,750 hotels with over 600,000 rooms in 84 countries. Hilton

١٣٠
is ranked as the 36th largest private company in the United States by Forbes. The company owns, manages, and/or franchises a portfolio of brands which includes Waldorf Astoria Hotels and Resorts, Conrad Hotels & Resorts, Hilton Hotels & Resorts, Doubletree (DoubleTree by Hilton), Embassy Suites Hotels, Hilton Garden Inn, Hampton Inn and Hampton Inn & Suites, Homewood Suites by Hilton, Home2 Suites by Hilton and Hilton Grand Vacations.
It was founded by Conrad Hilton in Cisco, Texas and was headquartered in Beverly Hills, California from 1969 un l 2009. The company moved to Tysons Corner, unincorporated Fairfax County, Virginia, near McLean in August 2009. Conrad Hilton founded the original company in 1919 with one hotel in Cisco, Texas. The Hotel's name is Mobley Hotel. The Hotels Statler Company was acquired in 1954 for $111,000,000 in what was then the world's most expensive real estate transaction.
The company separated its international operations into a separate traded company on December 1, 1964, known as Hilton Interna onal Co. . In 1967 Trans World Corp., the holding company for Trans World Airlines, acquired the separated company. In 1986 it was sold to UAL Corp., the holding company for United Airlines, who became Allegis Corp. in an attempt to re‐incarnate itself as a full service travel company encompassing Westin Hotels and Hertz rental cars in addition to Hilton International and United Airlines. In 1987 a er a corporate putsch, the renamed UAL Corp. sold Hilton International to Ladbroke Group plc, a British leisure and gambling company, which in May 1999 adopted the name Hilton Group plc.
Figure 2‐13: The former Hilton Hotels Corporation headquarters in Beverly Hills
As a result, there were two separate, fully independent companies operating hotels under the Hilton name. Those Hilton Hotels outside the US were, until recently, styled as Hilton International hotels. In addition, for many years hotels run by the Hilton Group in the US were called Vista International Hotels, while hotels operated by the American arm of Hilton outside the US were named Conrad Hotels. The Vista chain

١٣١
has been phased out, while Conrad is now restyled as one of the luxury brands of Hilton (along with The Waldorf‐Astoria Collection) and operates hotels within the US, as well as abroad. To minimize consumer confusion, the American and British Hilton companies, from the 1990s onwards, had a joint marketing agreement under which they shared the same logos, promoted each other's brands and maintained joint reservation systems.
In 1971, Hilton acquired Interna onal Leisure Company, including the Las Vegas Hilton and Flamingo Hilton. In 1998, Hilton spun off its gaming opera ons into a separate, publicly held company called Caesars Entertainment (formerly Park Place Entertainment).In 1999, Hilton acquired Promus Hotel Corporation, which included the Doubletree, Red Lion, Embassy Suites, Hampton Inn, & Homewood Suites brands. In 2001, Hilton agreed to sell Red Lion to West Coast Hospitality. HHC was granted the naming rights to the George R. Brown Convention Center in late 2003. The Hilton Americas in Downtown Houston, Texas, is connected to the convention center.
On December 29, 2005, Hilton Hotels Corpora on agreed to re‐acquire the Hilton International chain from its British owner, Hilton Group plc, for GBP 3.3 billion (or $5.71 billion). As well as bringing the two Hilton companies back together as a single entity, this deal also included Hilton plc properties operating as Conrad Hotels, Scandic Hotels and Living Well Health Clubs. On February 23, 2006, the deal closed, making Hilton Hotels the world's fifth largest hotel operator in number of rooms. Hilton Group PLC (headquartered in the UK) then renamed itself Ladbrokes plc. On March 1, 2007, Scandic Hotels was sold to EQT V Group.
On July 3, 2007, Hilton Hotels Corp. agreed to an all‐cash buyout from The Blackstone Group LP in a $26 billion (including debt) deal that would make Blackstone the world's largest hotel owner. In February 2009, Hilton Hotels Corp., announced that its headquarters were moving from its three buildings on Civic Center Drive in Beverly Hills to the lower cost Fairfax County, Virginia, located between Washington, D.C. and Dulles International Airport. In April 2010, Hilton and Blackstone restructured the debt. Blackstone invested a further $800 million of equity and the debt was reduced to $16 billion.
The practice of franchising is popular within the Hospitality industry among most major hotel chains, especially among smaller brands with a lare amount of locations that are not feasible to be each corporate owned and managed by the company. Competitor companies such as Marriott International and Starwood follow a similar

١٣٢
business model that focuses on franchising as a rapid expansion method. Also most of Hilton's flagship properties, airport properties, and largest resorts however are corporate managed.
Hilton Honors is Hilton's guest loyalty program in which frequent guests can accumulate points and airline miles by staying with the various Hilton families of brands. The Hilton Honors program is one of the largest programs of its type and has partnerships with most major airlines where guests can "Double Dip" and accumulate both points and airlines miles simultaneously with their hotel stay. Similar to frequent flyer programs there are various tiers of membership, which guests can reach depending on the amount of stays, and points accumulated annually, the higher the tier the more benefits members receive. The membership tiers are as follows: Blue, Silver VIP, Gold VIP and Diamond VIP.
Hilton Worldwide offers business and leisure travelers the finest in accommodations, service, amenities and value. Since Conrad Hilton bought his first hotel in 1919 in Cisco, Texas, we have expanded geographically, produced original hotel and travel concepts, and developed innovative technologies to enhance the guest experience. Today Hilton Worldwide is the leading global hospitality company, spanning the lodging sector from luxurious full‐service hotels and resorts to extended‐stay suites and mid‐priced hotels.
Since Hilton founding 92 years ago, Hilton Worldwide commitment to crea ng excep onal guest experiences remains unchanged, and our more than 130,000 team members continue to bring the highest quality of service to the world's visitors. With more than 3,750 hotels in 84 countries, our trusted por olio of hotel brands includes Waldorf Astoria Hotels & Resorts, Conrad Hotels & Resorts, Hilton Hotels & Resorts, Doubletree by Hilton, Embassy Suites Hotels, Hilton Garden Inn, Hampton Hotels, Homewood Suites by Hilton, Home2 Suites by Hilton and Hilton Grand Vaca ons.
Vision: ((To fill the earth with the light and warmth of hospitality))
Mission: We will be the preeminent global hospitality company – the first choice of guests, team members and owners alike. The combined company will have 1,700 hotels, 290,000 rooms and 85,000 employees.
Values:
Hospitality – passionately about delivering exceptional guest experiences
١٣٣
Integrity –do the right thing, all the time
Leadership –be leaders in Hotel and hospitality industry and in our communities
Teamwork –team players in everything have to do
Ownership – We are the owners of our actions and decisions
Now – operate with a sense of urgency and discipline
Sheraton
For more than 70 years, Sheraton has enjoyed a history as vibrant and spirited as the travelers we welcome. The world has changed, but one thing has not ‐ travel is about bringing people together. Sheraton boasts a portfolio of more than 400 hotels in 70 countries, including a stellar por olio of more than 60 resorts in stunning destinations worldwide. Bringing together the world's best names in hotels and resorts, Starwood's family of hotels includes Sheraton, Le Méridien, Four Points by Sheraton, Westin, The Luxury Collection, aloft, Element, St. Regis and W Hotels ‐ more than 1000 par cipa ng hotels in over 93 countries.
The origins of Sheraton date back to 1937 when the company's founders, Ernest Henderson and Robert Moore, acquired their first hotel in Springfield, Massachusetts. Within two years, they purchased three hotels in Boston and soon expanded their holdings to include properties from Maine to Florida. Sheraton Corporation of America became the first hotel chain to be listed on the New York Stock Exchange in 1947 and in 1949; with the purchase of two Canadian hotel chains Sheraton expands internationally and grows rapidly around the world.
The first Sheraton in the Middle East debuted in 1961 with the opening of the Tel Aviv Sheraton in Israel and in 1963; The Macuto Sheraton Hotel has opened in Venezuela, becoming the first Sheraton hotel in Latin America. The company became the first hotel chain with a toll‐free 800‐number for direct guest access (1‐800‐325‐3535) in 1970 which is s ll in use today and achieved an important milestone becoming the first international hotel chain to operate a hotel in the People's Republic of China in 1985.
In order to develop the electronic marke ng in 1958; the company launched "Reservation," the industry's first automatic electronic reservations system. Sheraton has introduced the Sweet Sleeper TM Bed in 2004. The Link@SheratonSM experienced with Microsoft debuts at five hotels around the world in 2006 by

١٣٤
Sheraton hotel. The Link@Sheraton is the connectivity hub of Sheraton lobby experience, allowing guests to work, relax, socialize or grab a snack.
Sheraton Club offers guests the chance to upgrade to a higher level of comfort and convenience. When they step up to the Club, they discover their own place to be more productive, catch up with friends, enjoy complimentary breakfast or help themselves to a snack throughout the day. As tourists search for accommodation at Sheraton hotels they will notice that we offer different room types, Clubrooms are often listed as one of the available room types. They can also be sure to look for "Club Floor" in the Room Features description to book a Club level room.
As the connectivity hub of their lobby, guests can surf the Web, watch a game with friends, borrow a magazine or newspaper, or even send a video postcard to friends and family. Sheraton created opportunities to connect ‐ to home, to colleagues, and to friends, both old and new. Recognizing that travel brings people together, their mission based on to bring conversation back to the travel experience. They also have web base fitness program about their new fitness service in hotels for their guests and tourists can take part in state‐of‐the‐art fitness centers, specialized in‐room and restaurant dining options, a custom website with online fitness programs and more. Staying fit has never been easier.
2-2-6- Tour Operator in the Germany For most of the 1990s, the travel agent and tour opera ng sectors were dominated
by the strategies of the four leading companies — which are the same in both sectors — vying to increase market share through acquisition and organic growth. By the beginning of 2000, the same level of compe on was s ll in evidence but the strategic focus of the main companies moved towards overseas expansion. This was also a focus of major competitors in Germany, the largest tour operating market in Europe. In 2000, Preussag AG, the largest leisure travel company in Germany, acquired Thomson Holidays Ltd, the largest UK leisure travel group. At the time, Thomson had market leadership in retail travel agencies, tour operators and charter airlines. In 2001, the second‐largest leisure travel group in Germany (C&N Touristic AG) acquired Thomas Cook UK Ltd, the third‐largest leisure travel group in the UK at the time (key Net, 2002).
The development of low‐cost routes to Europe encouraged a faster rate of growth of independent over inclusive outbound trips. Despite the increasing use of the Internet, teletext and television channels to investigate travel and accommodation

١٣٥
arrangements, travel agents and tour operators have continued to hold a high market share of outbound arrangements.
2-2-6-1- TUI Today TUI is one of the world's largest tourist firms with interests across Europe. It
owns travel agencies, hotels, airlines, cruise ships and retail stores. Major subsidiaries include TUI AG Airlines, the largest holiday fleet in Europe as well as UK‐based tour operators Thomson and First Choice. Its common brand TUIfly encompasses 7 airlines.
TUI Group GmbH, based in Germany, is Europe's largest tourism conglomerate. TUI Group unites over 3,600 travel agencies under one umbrella. Mainly located in Germany, the United Kingdom, the Netherlands, and Belgium, 39 tour operators belong to TUI Group, including the major brands TUI Schöne Ferien!, 1‐2‐FLY, Arke Reizen, Holland International and JMC, as well as many smaller tour operators specializing in narrower target markets. Besides its own 18 incoming agencies, TUI Group offers tour guide services in 69 countries. The company controls over 185 hotels in 19 countries, including the RIU, Grecotel, Iberotel, Grupotel, Dorfhotel, ROBINSON, and the Swiss Inn chains. Most of TUI Group's hotels are located in Spain and other Mediterranean countries. With a major focus on holiday travel, TUI Group is also active in the business travel market.
On December 1, 1968, four German tour operators signed the shareholder agreement for a new enterprise in Hannover, Germany: Touristic Union International, in short TUI. The companies that they formed TUI included Touropa, Scharnow‐Reisen, Hummel‐Reisen, and Dr.Tigges‐Fahrten. The latter was a company with roots reaching back before World War II, founded in 1928 by husband and wife Hubert and Maria Tigges in Wuppertal. Deeply influenced by the misery of the two World Wars, Tigges and Fischer developed a new vision for a tour operator that was rather unusual at the time.
In 1970, another company joined TUI: air tours interna onal, Germany's biggest tour operator that offered customized air travel with scheduled carriers for educated upscale holiday vacationers and too to first class and deluxe hotels around the world. To be able to deliver adequate service to its well‐to‐do clientele, the company invested in the travel agencies that carried their catalogue by sending a thousand travel agents a year on "educational trips

١٣٦
In 1970, the company created its travel service division TUI Service. The variety of services offered by the tour operators that comprised TUI was also greatly expanded. In 1971, TUI together with German airline Lu hansa and the government‐owned rail company Bundesbahn founded Studiengesellschaft zur Automatisierung für Reise und Touristik, in short START, a joint venture to develop an electronic booking system‐‐a revolu onary idea for the me. By 1979, START GmbH, in which all three shareholders had equal shares, had a working system. In the same year the first TUI trip was booked through a computer, setting off a new age in Europe's travel industry. By 1993, about 90 percent of TUI's bookings, represen ng approximately 22 million trips, were booked electronically through the START booking system. In 1989, the company launched its own franchise system TUI UrlaubCenter.
By 1990, TUI had grown significantly. In fact, the company had become Europe's largest tour operator. Losses resulting from the Gulf War and violent conflict in Yugoslavia were balanced out by gains from the about 16 million new customers from the reunited eastern part of Germany. Serving more than 3 million guests in business year 1990‐91, the company had generated over 5 billion DM in sales. In order to stay on top of things, TUI enacted its first restructuring program. All tour operators were integrated into the TUI holding company, all of which carried the TUI brand in their names, and separate profit centers were established. The offers of the different tour operators were organized and marketed by country under the TUI brand.
In 1997, TUI again restructured its organiza on to make its management more efficient. The company was divided into five business divisions. The first one included tour operators in Central Europe; the second one united tour operators in Western Europe; the third one managed the incoming agencies and guest services and purchasing of hotel capacities at the travel destinations. The new IT division offered central services such as accounting, personnel management, and legal services to all other TUI divisions. The fifth division bundled TUI's own hotel subsidiaries and shareholdings, which numbered more than 120 and which were a main focus of the company's growth strategy.
In 1997, Karstadt‐‐which meanwhile was partly owned by the Schickedanz group‐‐started talking with Lufthansa about a liaison between the department store's tourism arm NUR Touristic, Germany's number two tour operator, and the airline's charter subsidiary Condor. In 1999, Preussag acquired Deutsche Bahn's TUI share. One year later, the TUI shareholdings were taken out of the temporary Hapag Lloyd holding company and Preussag formed a new holding, TUI Group GmbH, while TUI became

١٣٧
Preussag's new tourism brand. The 2000 was renamed year the company to TUI Group. Seventh of April 2005, was a historic day for the Indian Travel and Tourism industry when a joint venture was signed between the world’s largest travel group, TUI AG and LPTI. TUI AG tourism 2007 division merges with First Choice Holidays PLC to form TUI Travel PLC. In 2008 TUI Cruises was formed, paving the way for TUI AG to set its mark in the German volume market for premium cruises.
Principal Competitors: LTU Group Holding GmbH; Thomas Cook AG; REWE Tourism Group; alltours flugreisen GmbH
The three sectors TUI (tour operating, online sales, high street outlets, airlines and incoming agencies), TUI Hotels & Resorts and the cruise ship business form the World of TUI. TUI holds, in addition, a financial investment in the container shipping industry.In the financial year 2009/10 TUI returned revenue of €16, 35 billion with total earnings (underlying EBITA) in the tourism sector of €589 million. On 30 September 2010, the headcount totaled 71,000 employees. Its business is divided into the four sectors Mainstream, Specialist & Activity, Emerging Markets and Accommodation & Destinations. TUI Travel offers a broad choice of leisure travel ranging from package tours to individual niche products.
TUI Hotels & Resorts, is one of the largest holiday hotel companies in Europe, is responsible for managing the hotel subsidiaries of the group. The TUI Hotels & Resorts por olio covers 261 hotels and 170,000 beds in 27 countries around the world and includes such famous hotel brands as robinson, Riu, Grecotel, Grupotel, Iberotel and Dorfhotel. The hotels of the various brands are situated at premium locations in attractive holiday regions and offer guests a diverse range of hotel concepts with the highest levels of service and quality, and with exceptional environmental standards.
TUI Travel’s strategic goal is to create superior shareholder value by being the leading global leisure travel group providing customers with the widest choice of differentiated and flexible travel experiences to meet their changing needs. they are focusing on strategic initiatives for profitable growth. These include targeted development of our business model, continuous efficiency improvements and development of growth opportunities.
They also continue to improve those areas of the business that are underperforming, increasing our differentiated and exclusive product and getting the right controlled mix of distribution across the whole of our Mainstream Sector. They

١٣٨
try to expand into new source markets with specialist products, as we have with Le Boat in the German market.
Figure 2‐14: vision and strategy model in TUI
Resource: TUI, 2011
The Group is focused on providing customers with a wide choice of differentiated and flexible travel experiences to meet their changing needs. Human rights groups for helping to fund the Burmese regime have criticized the TUI AG.
TUI is the world’s leading leisure travel company opera ng in over 180 countries with more than 30 million customers in 27 key source markets. TUI Travel has over 200 brands, which are comprised of market‐leading mainstream brands and specialist travel businesses.
Figure 2‐15: TUI sub‐companies and different brands
Resource: TUI, 2011
The company is attempting to achieve greater integration between its above‐ and below‐the‐line marketing functions by doing so. The previous marketing structure had

١٣٩
been in place only since June last year. The function was divided into two teams, one covering brand strategy and the other CRM and innovation. TUI claimed the system would enable it to respond more quickly to customer needs. The previous set‐up also allowed the brand and CRM teams to independently hire direct marketing agencies on a project basis. Williamson said that flexibility will remain, despite the teams merging.
Figure 2‐16: TUI claimed the system
Resource: TUI, 2011
TUI operates 155 aircra and 3500 retail outlets in Europe and employs 50,000 people worldwide. The company mainly serves the leisure travel customer and is organized and managed through into four sectors:
1. Mainstream: The sector has 89 brands including Thomson and First Choice, serves 24m customers a year and is split into two subsec ons (sales of complete travel packages and sales of components such as flights) and three geographical areas (Central Europe: (covering Germany, Switzerland, Austria and Eastern Europe). Northern Europe: (UK, Ireland and Canada, and the Nordic countries), Western Europe: (France, the Netherlands and Belgium)).
2. Specialist and Emerging Markets: This sector is split into three divisions (Destination, Premium and Life stages). Destination is the company's portfolio of local market leaders; Premium is five UK‐based brands offering 'premium leisure travel experiences' in Europe, Asia and the Caribbean. A life stage is the demographic specialist arm, aiming at groups such as older people and students.

١٤٠
3. Online Des na on Services: This sector has 39 brands, serves 15 million customers and has 4,400 employees covering direct sale of holidays and components and including LateRooms.com, Asiarooms.com and Hotelopia.
4. Ac vity: This sector has 39 brands, serves 400,000 customers and has 3,300 employees, divided into six sub‐sectors (Marine, Adventure, Polar, Sports, Ski & Lakes and Schools). The Ski business includes the brands Crystal Ski, First Choice Ski and Thomson Ski. Lakes include Thomson Lakes & Mountains and Crystal Summer. Marine comprises Moorings, Footloose & Sun sail Yachts, Sun sail Club's water sports holidays and Le Boat (formerly Inland Waterways). Adventure includes trekking and expedition cruising companies such as Trek America, Exodus, Imaginative Traveler and the Adventure Company. IExplore.com is their one‐stop portal website for this sector.
Figure 1‐17: TUI facebook picture

١٤١
2-2-6-2- Fox tours FOX‐TOURS is a service provider in the classical sense; this means we work with
foresight, flexible, reliable and fair. It is a specialist in innovative group and special travel within the World of TUI and offers a customer‐oriented service and the safety of the largest tourism ‐ the business world. A worldwide network of travel partners, tested and proven is because during the entire trip for you and help you in an emergency more quickly.
Figure 2-18: Fox tour homepage picture
Source: fox tour
The tours have offered through their own distribution channels and additive (travel agencies, readers travel, and tours for companies, associations and organizations). Thier focus is on a wide range of products beyond the traditional beach holidays with lofty quality standards. A very large number of thier flights conducted with Deutsche Lufthansa or its tochter/ Vertragsgesellschaften. By bundling volumes, man can offer attractive prices that can withstand any comparison. A professional editing and a competent, friendly service are a matter of course.
The tour operator is entitled to change from an organizational need and individual performances unpredictable reasons. Of the power to change, the tour operator will inform the traveler immediately and provide him with an explana on within 10 days of free transfer or alternatively free resignation, unless the changes are only minor. A right of termination by the traveler remains unaffected. If the content of the confirmation of the contents of the application, it is a new range of tour operator. The travel agreement is concluded on the basis of this new offer if the tour participant agrees. Consent can be express or implied declaration, as done, for example the payment of the price, the deposit or the date of travel.
١٤٢
The scope of contractual services is mandatory in the specification of the travel brochure for the travel period and from referring to these specifications in the travel confirmation / invoice. Other hotel‐own brochures or performance‐makers are not decisive. To oral side agreements, the employees of FOX‐TOURS Reisen GmbH are not authorized.
Registration in a tour by fox tour, can be made in writing, orally, by telephone or through on‐screen systems. The travel contract is concluded with the receipt of the written confirmation of the tour participants. The data are provided to us in the context of the purpose of the contract by electronic data processed, stored and distributed. Personal data is protected according to the Federal Data Protection Act. Obvious typographical and calculation errors entitle FOX‐TOURS Reisen GmbH to challenge the travel contract. Information is also available through central reservation or visit www.foxtours.de. Specifically in the prospectus as described in the name conveys external services of other travel companies not subject to the liability of FOX‐TOURS Reisen GmbH as a tour operator. In the event of such a travel agency's liability for intermediaries error is excluded, unless intent or gross negligence.
One of their strategies is appreciating tourists' interests in thier trips and for visiting website. The protection and security of visitors data is thier highest priority. For this reason, the protection of your personal data very seriously. Collection and processing of personal data: To handle the booking of visitors' trip, they need tourists' personal information, such as first and last name, telephone number, fax number, email address or postal address. Visitors' personal data will be other people or companies (airlines, hotels) only to process thier booking made available.
Company use tourists' personal information only to send their customers thier newsletter if tourists have to subscribe. Tourists can tell company thier request via e‐mail or phone call. Security in data transmission: company assures that they protect customer's information from unauthorized access by third parties. A cookie is a small packet of information transmitted between customers' browser and a Web site such as FOX‐TOURS. In the "Cookies", can store information such as the user ID (user ID). Furthermore, an assignment made of the customer data, which means greater comfort for the user. In addition, some technical data such as browser type or status JavaScript stored so that access to site is always ideal. They store in thier cookies but no personal information like visitors address or name. In order to make a booking FOX‐TOURS, cookies must be allowed.

١٤٣
Here are a couple of interes ng facts about them; (The ONLY 8‐time Apple Vacations Crystal Award Winner, Annual American Express Representative Excellence Award Winner, The Official Travel Agency of the NBA's Milwaukee Bucks, Top 20 Business Travel Management Company, Annual member of the Travel Weekly Top 50 Power List).
According to Business Travel News, Fox tour is ranked 16th of the top 100 travel companies. Since we began opera ons in 1960, we have grown to over 200 employees with clients nationwide. Thier business customers work directly with dedicated corporate offices and on‐site travel departments. Business travel comprises over 65% of our business mix; they have developed many specialized products and services to help business control costs and make their travel planning more efficient. Thier award‐winning service yields a client reten on rate of 98%. Company mission is to:
((‐ Build long‐lasting relationships with customers through exceptional service, ‐ Create a great work experience for associates, ‐Deliver cost‐effective, quality travel and incentive solutions, ‐Join with vendor partners in mutually beneficial relationships and ‐Exhibit our passion, integrity and pursuit of perfection in everything we do)).
Travel Technology: At Fox tour, managers believe that technology promotes efficiency. Efficiency saves time. Moreover, time is money! Over the past several years, we have invested heavily in technology. They try to work hard to find the right solution for your company by combining both proprietary and third party products. Our efforts are both aggressive and progressive. Our methodology goes beyond delivering a ticket for travel. They have instituted cost‐conscious applications that ensure the best prices in travel ‐ and logical solutions that monitor every mode of your travel.
Contribute to the advancement of Fox tour Online Technology Systems and Services to include maintenance, development and customer support of all online systems. Essential Duties:
‐ Develop and maintain knowledge and application of Online and related technology product
‐ Provide technical and navigational support for Online Technology Systems ‐ Conduct research and facilitate problem resolution for service issues across Fox
World Travel Online Technology Systems ‐ Online System Administration to include maintenance of existing and new
١٤٤
‐ Develop and maintain knowledge of travel vendor practices, programs and operations
‐ Identify online automation requirements, develop solutions and assist ‐ Ability to relate to internal, external clients and vendors at various levels ‐Ability to perform in a team environment ‐ Consistent application of Fox World Travel practices and programs ‐ Develop
knowledge and practice of security requirements ‐ Maintain a favorable working relationship with co‐workers in all departments to
foster an environment of trust and mutual respect ‐ Ability to effectively multi‐task while maintaining professional rapport with clients
‐ Process standard online technology duties and tasks ‐ Coordinate with management on staffing and training for support desk and special
projects related to Online Systems ‐ Develop and conduct regularly scheduled web‐ex training for Online Technology
Products ‐ Strive for continual improvement through training and constructive feedback ‐ Ability to work flexible hours/shifts as determined by business need ‐ Ability to conduct support training of customers via WebEx or in person
Finding a travel agent has never been easier! For over 50 years, Fox tour has built a reputation for quality travel services and outstanding customer relationships. Company tries to develop and manages full service incentive programs, special events and strategic meeting management programs on a global scale.
2-2-6-3- DERTOUR DERTOUR is one of the largest tour operators in Germany and Austria. DERTOUR
belongs to the group of German travel agency (founded 1917 in Berlin) is a 100 percent subsidiary of REWE Group in Cologne. DER and Atlas travel agencies with over 2,400 employees in Germany offer expert advice and sale of travel services. Together with the offices of franchise organizations Derpart, Atlas Travel, for collaborating partners who are members of the RSG Travel Agency GmbH, the Group's own sales is represented throughout Germany.
Rates for every holiday wish its products range from complete vacation travel, flight, and ship and train tickets through individually tailored trips to tickets and travel insurance. While the Atlas travel agency mainly in western, northern and eastern Germany is represented, with his concept of individual travel components to be
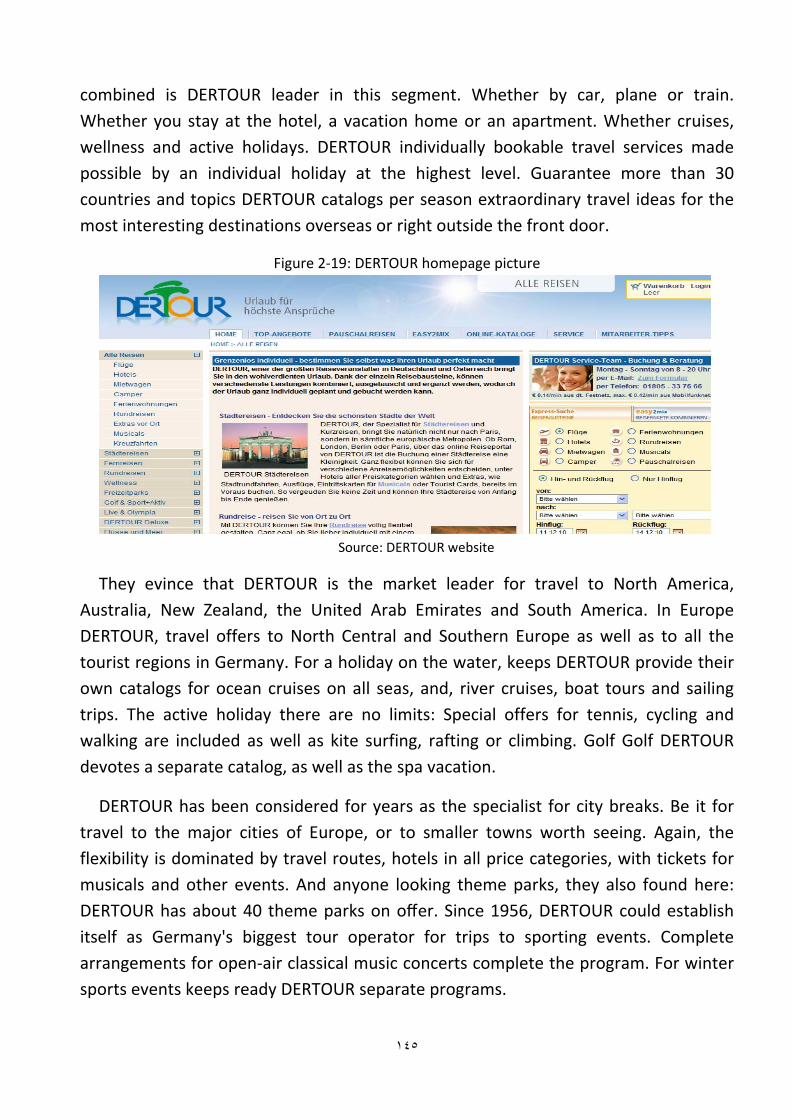
١٤٥
combined is DERTOUR leader in this segment. Whether by car, plane or train. Whether you stay at the hotel, a vacation home or an apartment. Whether cruises, wellness and active holidays. DERTOUR individually bookable travel services made possible by an individual holiday at the highest level. Guarantee more than 30 countries and topics DERTOUR catalogs per season extraordinary travel ideas for the most interesting destinations overseas or right outside the front door.
Figure 2‐19: DERTOUR homepage picture
Source: DERTOUR website
They evince that DERTOUR is the market leader for travel to North America, Australia, New Zealand, the United Arab Emirates and South America. In Europe DERTOUR, travel offers to North Central and Southern Europe as well as to all the tourist regions in Germany. For a holiday on the water, keeps DERTOUR provide their own catalogs for ocean cruises on all seas, and, river cruises, boat tours and sailing trips. The active holiday there are no limits: Special offers for tennis, cycling and walking are included as well as kite surfing, rafting or climbing. Golf Golf DERTOUR devotes a separate catalog, as well as the spa vacation.
DERTOUR has been considered for years as the specialist for city breaks. Be it for travel to the major cities of Europe, or to smaller towns worth seeing. Again, the flexibility is dominated by travel routes, hotels in all price categories, with tickets for musicals and other events. And anyone looking theme parks, they also found here: DERTOUR has about 40 theme parks on offer. Since 1956, DERTOUR could establish itself as Germany's biggest tour operator for trips to sporting events. Complete arrangements for open‐air classical music concerts complete the program. For winter sports events keeps ready DERTOUR separate programs.

١٤٦
For 50 years, DERTOUR is a partner of the German Olympic Sports Federa on (DSB) is responsible for the exclusive sale of ckets. This applies to the 2008 Summer Games in Beijing as well as for the Winter Games in Vancouver in 2010. Around the globe, mobile around the globe, in over 60 countries, offers DERTOUR car from local and international companies and therefore granted the highest mobility at the destination. Dertour has joined forces with sister operators in the Environment Committee of the German Travel Association (DRV). The tourism of the Rewe Group has for many years its own environmental officers in the company who takes care of his team to address various aspects.
Dertour United Kingdom in Salzburg has worked as a sales and call center for Dertour and Meier's world travels in Austria and neighboring Eastern European countries. Dertour Romania in Bucharest is active as a sales organization for the German organizers block. In Italy, with Dertour THE Viaggi in Rome as an incoming agency for German and foreign travel agencies and tour operators active and has offices in Florence and Milan. Is the DER Travel Service in London as incoming collaborates travel agencies, organizers of tours to Germany and Austria and also involved in business travel and for travel fair. Galway takes care of billing services to the DER Group and International Business Travel Center.
Market leader in many segments: The brand Dertour enjoys a high reputation in the market. With about 30 catalogs, Dertour is one of the largest tour operators in Germany. The Dertour range includes roughly the following categories: long‐distance travel, Europe, and special tours and city tours and events. In the areas of long‐distance travel, particularly North America and Ireland, Great Britain, city and short trips and events Dertour is the market leader in Germany. 2006 Dertour one rises to the catalog Dertour Deluxe, where only 5 in the premium segment ‐ will be offered and 6‐star spa resorts in the most beautiful beaches in the world. The Dertour‐component system allows for a completely customized itinerary in terms of arrival, length of stay and choice of airline, hotels and rental cars.
Dertour "adventure travel" offers group and reader travel by bus, train and plane in the world. Dertour since 1999 as a rental broker operates. Dertour "Holiday Cars" offers local and interna onal car Rental Company in more than 60 countries. Since 2002 can be booked from the Dertour offer "holiday campers" Camp Mobile in Germany for a holiday in Europe. Flight consolidator offers cheap flights around the world to date prices, supplement under the brand Dertour Dercongress and benefits.

١٤٧
Dercongress takes over the planning and organizing events such as conferences, symposia, seminars and conferences.
Largest ferry operator in Europe: Dertraffic is a good example of Europe‐wide cooperation with carriers. Here is the company in the coordination and communica on partner of over 50 shipping lines to more than 200 European ferry routes and thus the largest ferry operator in Europe. Via the online portal Ocean24.de Dertraffic since 2002, offers the opportunity to compare routes and prices for European ferry companies and book online. Dertraffic is also general agent for the German Touring Coaches, the European insurance and travel insurance provider of tickets for the Euro Tunnel.
2-2-6-4- Berge und Meer "More surprisingly affordable vaca on". This claim Founded in 1978, mountains
and sea. Many millions of visitors, have since been with us the best weeks of the year, were their holidays, spending. They claim that they are Germany's No. 1 direct travel operators About 400 employees are in Rengsdorf constantly on the lookout for new and diverse travel ideas so they can always again with more vacation at surprisingly low Prices can convince.
Figure 2‐20: Berg und Meer homepage picture
Source: Berg und Meer website
Founder Klaus Scheyer in 1968 provides the first Group and package tours. In 1985, the brand was with sea & mountains the sale of travel known. Reiner Meutsch increases in the company in 1089. They have Successful started for the first German tour operators Travel with Turkey in winter and they launched the in‐house call center in 1997and started in 2000 Online GmbH. For online distribu on of their own travel,
١٤٨
company is founded the mountains and sea Online Ltd. TUI Germany GmbH is a partner for 11/01/2001 the parent company of mountains and sea. Berge & Meer got in 2004a new design. The new company building in the is inaugurated. The mountains and sea travel shop launched the first in June on the channel ntv in 2005 and in 2008 a er 30 years, leaving Klaus Scheyer.Berge & Meer. Ralf Horter is the successor of Meutsch Reiner, who is leaving the company a er 20 years in 2009. The Board is now composed of Ralf Horter and Thomas Klein.
2-2-6-5- FTI tour FTI Touristic GmbH is the fifth‐largest tour operator in Germany and number nine in
Europe. The company, headquartered in Munich, employs around 1,500 staff and has a subsidiary in Austria, and represented a subsidiary in Switzerland. In fiscal year 2009/2010, the Group recorded a turnover of 1.066 billion Euros.
The tour operator FTI Touristic offers a comprehensive range of holiday packages and travel module. Also supplement the short period organizers 5vorFlug , the car rental brokers drive FTI , the online portal fly.de and the largest German language tour LAL Language courses to the portfolio. Germany wide partner agencies distribute around 10,000 RTI products. Under the umbrella of the wholly owned subsidiary tourism mbH (TVG) FTI has combined sales of the franchisees. Another important distribution channel is the travel shopping channel sonnenklar.TV .
FTI Touristic GmbH (FTI) is established as Frosch Touristic GmbH in 1983. FTI took in 1987 over the shares in 1980 founded the LAL Language Travel Ltd. in 1989 FTI took over the remote CA Touris c GmbH, one of the then leading German long‐haul operator. The Frog Software GmbH, a provider of specialized software for tourism, as well as the USA Touristic GmbH, a specialist tour operator for UK and Ireland will be established in 1990. FTI has in 1995 acquired AIR‐MARITIME Cruises Ltd., a specialist provider of river and ocean cruises. RTI starts in Linz, the organizer activities in Austria. The brand FTI Touris c is introduced in 1996. FTI Touris c GmbH TVG founded the distribu on company. The company takes over the exclusive distributor for the Italian club Valtur travel provider in Germany and Austria. Air tours plc acquired the remaining shares in July 2000. The founder and CEO Dietmar Gunz are leaving the company in late August. They have founded their online portal for flight and travel search fly.de in 2005. In 2009 The FTI Group, under which all the brands and companies are combined achieved a sales increase of eleven percent, closing the fiscal year with a turnover of

١٤٩
1.093 billion Euros. Moreover, FTI have continuing to grow the product portfolio and complements the brand new luxury gold by FTI in 2010. In early April 2010, the trades for FTI Frosch Touristic GmbH in order Touristic GmbH and moves into a new corporate headquarters at Landsberger Strasse 88 in Munich.
Figure 2‐21: FTI homepage picture
Source: FTI website
These range from a relaxing beach holiday on diverse cultural and city tours to study abroad in destinations around the world. In addition, individual vacation ideas can be realized with FTI flexible. Whether long‐haul flights, tours, car rental, accommodations, tours and wedding packages ‐ which Guests can make their travel to, suit their personal preferences.
2-2-6-6- Thomas cook Prior to its acquisi on by the American Express Company in 1994, Thomas Cook
Travel Inc. was the third‐largest travel agency in the United States. At the time of the takeover, Thomas Cook operated 500 offices across the country and sold one out of every 50 airline ckets in the United States. Staffed by more than 3,000 employees, the company had an impressive roster of business clients including Ford Motor Co., AT & T, and John Hancock Financial Services. Independently owned by Linda and David Paresky, Thomas Cook Travel licensed its name from the oldest travel agency in the world, The Thomas Cook Group Ltd., based in the United Kingdom.
The Thomas Cook Group Ltd. was the eponymous creation of an industrious English entrepreneur. From a humble beginning chartering a train to a temperance rally in 1841, Cook expanded his business into one of the world's first full‐service travel firms.

١٥٠
After the resounding success of his first venture, Cook quickly expanded his operations, providing rail trips and making hotel reservations for customers for journeys all over the Bri sh Isles. In 1855, Thomas Cook's first con nental tour. He personally conducts two parties from Harwich to Antwerp, then on to Brussels, Cologne, Frankfurt, Heidelberg, and Strasbourg and, finally, to Paris for the International Exhibition. The company also had a long history in the American market. Cook's excursions proved so popular that he began offering trips to Europe, North America, and‐‐beginning in 1871&mdashound the world. Buoyed Thomas Cook Ltd. began offering cruise trips as early as the mid‐1870s, pioneered an early form of travelers' check, and it was booking air travel by 1911.
Figure 2‐22: two old picture from Thomas Cook homepage
Source: Thomas Cook website
Just months a er the Civil War ended in 1865, Cook's ran its first U.S. tour, which included stops at various battlefields. Thomas Cook organizes and leads the first round‐the‐world tour. He is away from home for 222 days and covers more than 25,000 miles between the 1872/73. In 1873, Cook's Con nental Time Tables & Tourist's Handbook (today known as the European Rail Timetable) is published for the first me. Thomas Cook in 1878 establishes a dis nct "Foreign Banking and Money Exchange" department.
In 1988, Dun & Bradstreet put Thomas Cook up for sale in order to concentrate on its core marketing, credit risk, finance, and directory information divisions. and in 1919 Thomas Cook & Son is the first travel agent to adver se pleasure trips by air. In 1939, Holidays by air on specially chartered aircra to the French Riviera are included in Cook's summer brochure for the first me. Thomas Cook in 1972 is priva zed and bought by a consortium of Midland Bank, Trust House Forte and the Automobile Association.
While the ownership of Thomas Cook changed hands in the United States, the keeper of the coveted license‐‐The Thomas Cook Group Ltd.‐‐went through its own

١٥١
shi s. In 1992 Midland sold its subsidiary to LTU Group, one of Germany's largest tour operators, and Westdeutsche Landesbanke, a German bank. Westdeutsche Landesbanke purchased 90 percent of The Thomas Cook Group Ltd.'s shares, while LTU Group controlled the remaining ten. In 1994 the company won three more substantial accounts‐‐the British Embassy, Walsh America, and Pharmaceutical Marketing Services Inc. Despite their success, the Pareskys approached archrival American Express about selling Thomas Cook. In 1997, Thomas Cook On‐Line is launched, making Thomas Cook the first UK retail travel agency to offer customers a way to buy holidays, foreign currency, traveler's cheques and guidebooks over the Internet.
Arcandor AG, part owner of C&N Touris c AG, retains 52.8% of the shares. In 2008 Thomas Cook Group acquires 74.9% of the issued share capital in Thomas Cook India Limited and 100% of Thomas Cook branded businesses in Egypt, as well as licenses for the Thomas Cook brand in a total of 15 Middle East countries. Thomas Cook Group in 2010 acquires 100% of Think W3, owner of Essen al Travel, one of the leading online providers of travel‐related products. In addi on, the Group agreed to acquire 100% of Öger Tours, a leading German tour operator specializing in package holidays to Turkey.
Figure 2‐23: Thomas‐Cook facebook picture
Source: Thomas Cook facebook
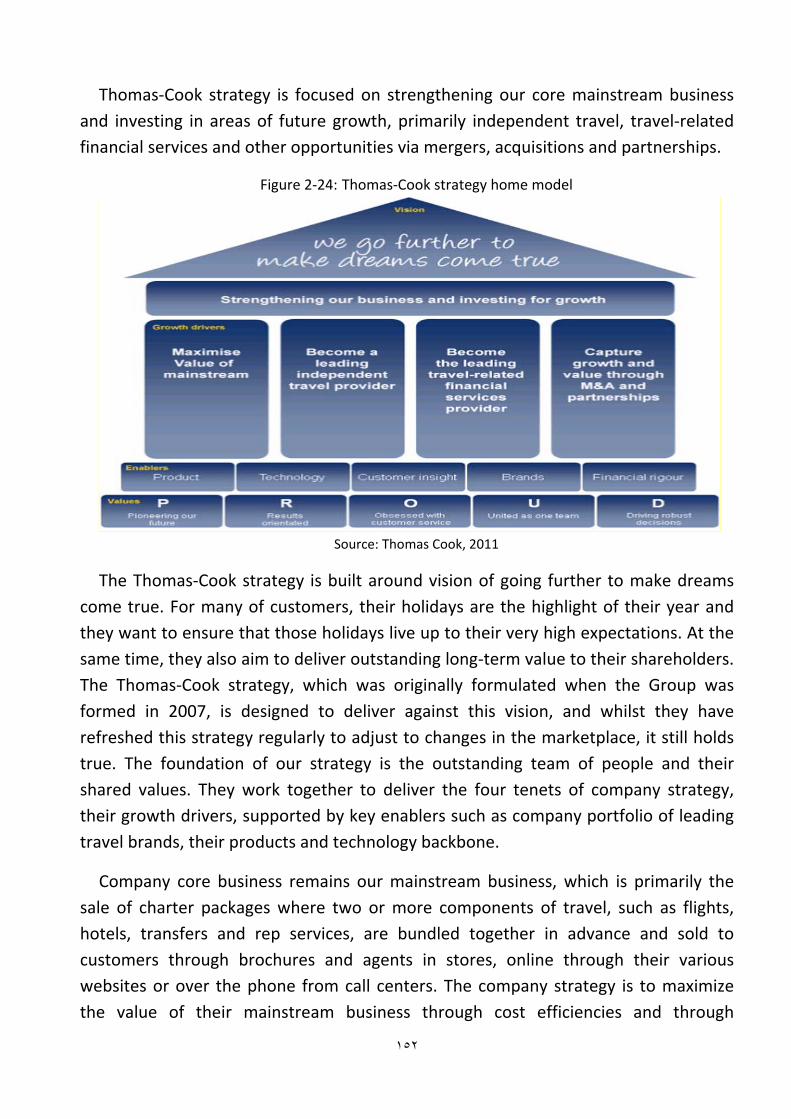
١٥٢
Thomas‐Cook strategy is focused on strengthening our core mainstream business and investing in areas of future growth, primarily independent travel, travel‐related financial services and other opportunities via mergers, acquisitions and partnerships.
Figure 2‐24: Thomas‐Cook strategy home model
Source: Thomas Cook, 2011
The Thomas‐Cook strategy is built around vision of going further to make dreams come true. For many of customers, their holidays are the highlight of their year and they want to ensure that those holidays live up to their very high expectations. At the same time, they also aim to deliver outstanding long‐term value to their shareholders. The Thomas‐Cook strategy, which was originally formulated when the Group was formed in 2007, is designed to deliver against this vision, and whilst they have refreshed this strategy regularly to adjust to changes in the marketplace, it still holds true. The foundation of our strategy is the outstanding team of people and their shared values. They work together to deliver the four tenets of company strategy, their growth drivers, supported by key enablers such as company portfolio of leading travel brands, their products and technology backbone.
Company core business remains our mainstream business, which is primarily the sale of charter packages where two or more components of travel, such as flights, hotels, transfers and rep services, are bundled together in advance and sold to customers through brochures and agents in stores, online through their various websites or over the phone from call centers. The company strategy is to maximize the value of their mainstream business through cost efficiencies and through

١٥٣
increasing the proportion of higher value product such as all inclusive board basis, four and five star properties and medium haul destinations
Independent travel, where consumers build their own trip either on their own or with the help of an agent, has gained in popularity boosted by greater online penetration and new technologies that allow consumers to create their own packages (dynamic packaging). This area of travel also includes scheduled tours where consumers tailor either make their trips or buy pre‐packaged itineraries. It also includes wholesale business, where company operate as an intermediary between suppliers and other agents providing them with the ability to build holidays for their customers. In independent travel, company plans to make further changes and investments in e‐commerce capabilities to strengthen their position as an online travel agent.
Travel‐related financial services broadly fall into the categories of travel money, which are products that help customers pay for goods and services whilst travelling such as pre‐paid foreign exchange; travel assurance, which are products that cover the various risks associated with travel such as insurance for accidents and thefts. It also includes the travel finance, which are products that allow customers to finance their travel, such as credit cards. These are typically high margin products, and are naturally sold alongside other holiday components. Our strategy is to make the most of our brands and distribution capabilities to continue to grow this important part of our business
Thomas Cook Group plc is one of the world's leading leisure travel groups with sales of £8.9 billion and 22.5 million customers in 2010. They operate under six geographic segments in 21 countries, and are number one or number two in our core markets.
Figure 2‐25: Thomas‐Cook Germany sta s c 2010
Source: Thomas Cook, 2011

١٥٤
As developed markets mature, they explain that they are focused on the one hand on ways to consolidate these markets and maximize the value from them, and on the other on the new growth areas of emerging markets.
2-2-7- Germany Air Line and E-Marketing While revolutionary at that time, we argue that this ultra‐complex pricing strategy
has spectacularly failed the test of time. While many of the traditional airlines, on both sides of the Atlantic, are now on the brink of collapse, a new breed of airlines ‐ the so‐called low‐cost carriers ‐ is growing fast. What is more, the most successful among these low‐cost carriers ‐ Southwest Airlines (USA), Ryanair (Ireland), easyJet (UK) as well as GEXX, Germanwings, and Air Berlin (all based in Germany) ‐ are much more, and more consistently, profitable than their traditional rivals have ever been. In this paper we will show that one of their crucial success factors is an innovative, and extremely simple, pricing strategy ‐ em‐bedded, however, in a much more coherent overall corporate strategy than the traditional airlines have managed to implement. While many of the traditional airlinesLike Luftansa are now on the brink of collapse, a new breed of airlines ‐ the so‐called low‐cost carriers such as Airberlin and Germanweg‐ is growing fast.
2-2-7-1- Lufthansa The company was founded on January 6, 1926 in Berlin, following a merger
between "Deutsche Aero Lloyd" (DAL) and "Junkers Luftverkehr". The company's original name was Deutsche Lufthansa Aktiengesellschaft. Lufthansa, as one word, has been used since 1933. On December 9, 1927, Deutsche Lu hansa, on behalf of the German government, established an agreement with the Spanish government authorizing an air service between the two countries. This included a capital investment to establish an airline that would eventually become Iberia.
Lufthansa's corporate headquarters are located in Cologne. In 1971 Lawrence Fellows of The New York Times described the then‐new headquarters building that Lu hansa occupied in Cologne as "gleaming." In 1986, terrorists bombed the headquarters of Lufthansa. No people received injuries as a result of the bombing. In 2006, the builders laid the first stone to the new Lu hansa headquarters in Deutz, Cologne. By the end of 2007, Lu hansa planned to move 800 employees, including the company's finance department, to the new building. Several Lufthansa

١٥٥
departments are not located in the headquarters; instead, they are located in the Lufthansa Aviation Center at Frankfurt International Airport. The departments include Corporate Communications, Investor Relations, and Media Relations (http://en.wikipedia.org/wiki/Lufthansa)
The purpose of strategy is position airlines, airports and their associated infrastructure so that they achieve a sustainable competitive advantage within their specific operating environment. However, as the business environment is never stable, but constantly at the mercy of market forces, increasing customer demands, competitor activity and ever‐new technology, Lufthansa Consulting provides aviation clients with a clear and precise strategy. This is based on a thorough understanding of potential customer values, how markets will develop, how the competition is evolving and how these elements will affect the future. In today’s world, an airline’s sales and distribution strategy is an increasingly crucial factor in ensuring long‐term competitiveness and profitability. Lufthansa Consulting adopts a holistic approach to airline market and sales development in evaluating all distribution‐related areas, including distribution channel management, e‐commerce, revenue management, airline pricing policy and performance measurement systems (http://www.lhconsulting.com/).
Airport economics and strategy comprises a variety of services and competencies that are always tailored to the clients requirements. Their services are based on expertise and are designed to enhance customers and market orientation. Their market research provides detailed information about the current trend in market. Also they with analyzing the market try to detecting the most profitable and fast growing market segments‐customers, pinpoints strengths and weaknesses, identify current and future competitors, and improve and support marketing activities. Identify the growth potential for segments, markets and service, creates a focused and customer‐driven market mix and appropriate, and traffic crating and forecasting in site are their aim strategy in E‐Marketing planning. Access to current passenger and cargo flow data, utilize state‐of‐the art tools, design traffic development concepts that succeed and others online service are the Lufthansa extra facilities in E‐Marketing for customers.
A successful strategy for developing markets and sales activities relies strongly on the strategic orientation of an airport as well as the relevant market and customer needs. That is why Lufthansa Consulting services are always based on a thorough assessment of your markets, customer base and potential and existing processes. Lufthansa Consulting experts help you to find and maintain the optimum distribution

١٥٦
channel mix that will not only secure and increase your airline’s revenue but also reduce costs, thereby ensuring an optimum cost‐ratio performance.
Our services include a systematic evaluation of existing direct and indirect sales activities, taking cost, efficiency and revenue generation into account. We identify the business processes that need to be altered in order to enhance your airline’s competitiveness. We also develop a detailed implementation road map to enable you to make necessary changes. Lufthansa Consulting weighs up the pros and cons of applying new compensation schemes and evaluates the feasibility of new distribution opportunities for your airline. By introducing key performance indicators and processes to ensure the ongoing monitoring of your sales activities, Lufthansa Consulting enables you to adapt quickly to new market requirements and achieve long‐term success.
Figure 2‐26: Lufthansa strategy process for e‐marketing
Source: Lufthansa, 2011
The major importance of the Internet as an information and sales platform makes it essential for airlines to establish an e‐commerce strategy that meets the requirements of their markets. Lufthansa Consulting selects the best approach for a carrier and helps you to choose the tools you need to implement successfully e‐commerce strategy. Our consulting services include developing or reviewing the content of your website, strengthening its sales function and defining the appropriate marketing tools and partners as well as the e‐commerce‐related pricing policy and promotion activities.
Distribution policy Distribution cost Steering of channels Effectiveness
Lowering of GDS costs Increase of direct bookings Alternative distribution channels
Adequacy for target market Improvement cost-performance ratio Steering enhancement
Action plan development Process description Control mechanisms implementation Adoption procedures definition

١٥٧
The success of an airline’s revenue management and pricing policy depends largely on the optimum coordination of yield management, pricing, marketing and sales. In order to generate the highest revenue possible, neither the load factor nor the yield must be jeopardized in favors of the other. Lufthansa Consulting assists airlines to optimize the interaction between all relevant departments. By taking account of all the information relating to airline revenue management and pricing decisions, then implementing the necessary control mechanisms, we can give you a major competitive advantage. This will enable you to increase your revenues, win market share and guarantee the profitability of your network
Lufthansa Consulting expertise allows airlines and airports to identify and introduce the appropriate performance measurement systems so that management can take short, mid and long‐term decisions at a justifiable cost. Taking strategic orientation into account, Lufthansa Consulting experts help you to choose and implement the appropriate tools and to establish control mechanisms that will ensure your long‐term competitiveness. Measuring the effectiveness and success of sales activities has become increasingly crucial in today’s business environment. It requires rapid responses to changing market demands, and remains a major challenge for the airline industry.
Figure 2‐27: picture of Lufthansa Twitter Page
Source: Lufthansa Twitter
Also in corporation with March First Company, Lufthansa has embraced the new business paradigm, which demands that companies achieve a greater level of integration and imagination. By spinning off an e‐Commerce business and expanding its travel portal, Lufthansa can preserve customer loyalty while creating entirely new, innovative revenue opportunities. ’’With our unmatched combination of skill disciplines and global scale, March FIRST is uniquely positioned to help Lufthansa take

١٥٨
advantage of these opportunities worldwide" Said Robert Bernard, march FIRST President, Chairman and CEO. March FIRST is a leading global Internet professional services firm that creates winners in the new digital economy by helping companies builds visionary business models, brands, systems and processes. This multidisciplinary approach empowers companies to fundamentally transform their business, drive innovation and become market leaders (marchFIRST, 2010)
2-2-7-2- Berlin air In 1978, former Pan Am pilot Kim Lundgren and former Modern Air Transport
general manager John D. MacDonald formed Air Berlin as a US supplemental carrier and incorporated it under the name Air Berlin. Air Berlin's first revenue flight (from Berlin to Palma de Mallorca) took place on 28 April 1979, with its first aircra being a Boeing 707–320 (Berlin Airport Company, 1990).
In the spring of 1981, Air Berlin's original two Boeing 707 aircraft were replaced by the more modern Boeing 737–200 Adv type, which was more appropriate for the airline's IT operations from Berlin to the Mediterranean region, especially to Majorca (where it is now the largest airline operating there)( Berlin Airport Company, 1990). Air Berlin joined IATA, the company also moved away from charters and towards scheduled flights, including important European business centers (which had been served since 1997). In blow figure showed the Air Berlins' growth path:
Figure 2‐28: Air Berlins' growth path
Source: Airberlin, 2011

١٥٩
Air Berlin is the second largest German airline after Lufthansa. In terms of European air travel, air Berlin's acquisition of the holiday carrier LTU made it the sixth largest airline in Europe. Air Berlin has been a member of IATA (International Air Transport Associa on) since 1999, which makes it a scheduled airline. Air Berlin is expected to become a full member of one world », the leading global alliance of quality airlines, in early 2012. The main strategies of air Berlin are:
• Perfect service at competitive prices: The air Berlin group’s strong "airberlin" brand is well known throughout Europe. With its unique price‐performance ratio, it sets new standards in air travel, in an industry that is marked by intense competition. The airline try to offers high product quality combined with above‐average service, while still keeping prices low.
• Global route network focusing on sustainability: air Berlin operates a global route network with a strong base in Germany and other European countries, particularly in Spain, Italy and Austria.
• "Air Berlin: Your Airline": Stable, long‐term customer loyalty combined with appealing to new, attractive target groups are key features of the much redesigned branding of Air Berlin that was unveiled in 2008.
Internet commerce: On Airberlin website www.airberlin.com, It allow to customers to can select different options to protect credit card details, name, address, e‐mail and other information provided by you. Air Berlin try to take the utmost care to ensure that customer data are stored securely. Air Berlin uses SSL encryption as part of its standard browser security measures. If customers do not wish to enter your credit card details when booking a flight, they can call AirBerlin Service Centre to make a telephone booking. They use customers information to support and extend its business relations with them, e.g. to process your flight booking and to offer you additional services or to send they special offers and information about products, services or the company. For this major they need customers' information. Air Berlin use different E‐Ways to collect the customers' information; as summery, it records data relating to the following processes:
Logging in to www.airberlin.com Booking a flight Registering for top bonus, air Berlin's customer loyalty scheme Requesting a quote for products and/or services Booking/purchasing products and/or services
١٦٠
Sending to air Berlin an e‐mail message Asking for help from air Berlin's service team or air Berlin's webmaster etc Completing an enquiry on a web page or by telephone Submitting customers feedback as part of an online survey Taking up special offers Subscribing to its Newsletter with e‐mail address
New technologies allow us to personalize air Berlin's website for every customer. Air Berlin uses cookies to find out which services and information might be of interest to customers and improve the user‐friendliness in its website. Data is collected and stored on this website with using technologies supplied by e‐tracker GmbH (www.etracker.com). Usage profiles can be created from these data under a pseudonym. Cookies may be used for this purpose. Cookies are small text files that are stored locally in the cache of the website visitor’s internet browser. Cookies allow the internet browser to be recognized. More than air Berlin's sits, other websites, including those that can be accessed via our site, e.g. by hyperlink, may also record personal data. Our data protection policy does not cover the data protection practice of these external websites linked to www.airberlin.com or other websites.
2-3- Tourism in Iran Iran is located in the center of Middle East (southwestern Asia) and links the
Caspian Sea, the largest land‐locked of the water in the word, to the Persian Gulf, as bridge. It bordered to the north by Armenia, Azerbaijan, Turkmenistan and the Caspian Sea, to the east by Afghanistan and Pakistan; to the south by Oman Sea and Persian Gulf and to the west by Iraq and turkey. Total terrestrial borders of the country are 6,032km and total water borders are 2700km. Area of Iran is about 1,648,195 km and its popula on is currently circa 70 million. Tehran is the largest and capital city of Iran with the popula on of almost 12 million.
Iran unique landscape such as thermal springs, orchards, pistachio gardens, rows of Lombardy poplars, nomad decampments in different seasons, satellite rouse nights, and extinct snow‐clad volcanoes, dense forests of the Alborz and Zagros Mountains Range, and coastlines of the Caspian Sea, the Persian Gulf and the sea of Oman are all eye‐catching and memorable. Iran landscapes are remarkably varied at different seasons. They are at times full of floodwater, sometimes covered by snow or lush vegetation. Iranian also has traditionally valued water as symbol of life and

١٦١
development. Nature and its diversity in Iran are valued paramount for development of the tourism industry.
Despite this, politicians were not aware of this very sharp difference between tourism and other sector regional planning; therefore, their preferable alternatives were based on their own individual choices unlike based on a participative and learning self‐organization process Carvalho, 2006).
231 Geography and nature Iran is situated in the global arid zone and the plateau of Iran enjoys a relatively dry
climate. Alborz and Zagross Mountain chains trap the humidity and air currents of Caspian Sea and the Mediterranean climate preventing them from penetration to the inner regions, due to its loca on between 25 and 40 degrees latitude as well as its mountains, Iran enjoys considerably variable climates. The northern and southern shores of Iran have diverse climate conditions compared with the central and mountainous regions and difference of average annual rainfall is also very high in different parts of the country varying from 2000 mm in Gilan to the less than 100 mm in the central parts of Iran.
Among significant characteristics of western Iran is existence of high mountains as well as flat plains, desert areas, rivers and lakes contributing to unique geographical conditions in which, at any time of year, and in each section of country, one of the four seasons is visible. Thus, in winter, swimming and water skiing are possible in the warm waters of Persian Gulf, and at same time winter sports, like skiing are possible in the northern and western mountains of the country, while one can enjoy the pleasant spring weather along the shores of the Caspian Sea; at the same time of the year.
Complexity and diversity of geological and calcareous structures have contributed to the formation of many caves in different provinces, especially in Azerbaijan, Kurdistan and Hamadan, which are attractive to numerous tourists. Visiting some of these caves is highly recommended and they are amongst important tourism attraction. The mountains of Iran belong to the folding of the Cenozoic Period and some of them, with Volcanic Origins; have brought about the means of formation of thermal springs. They have created suitable conditions for winter and mountain sports. The two well‐know desert of Iran, Dasht‐e‐Lout and Dasht‐e‐Kavir, covering an area of over 360000 square kilometers, are amongst the most interes ng yet unknown places. With more than 500 known mineral water and thermal springs used

١٦٢
for different purposes, Iran has an important potential in this regard. The thermal springs of Sarain(Ardabil), Larijan( Alborz) and Mahallat attract many people all around the year for recreation and therapeutic purposes.
232 History The plateau of Iran is among the oldest civilization centers in the history of
humanity cititionand has an important place in archeological studies. The history of settlement in the plateau of Iran, from the new Stone Age till the migration of Aryans to this region, is not yet very clear; but there is reliable evidence indicating that Iran has been inhabited since a when exactly. Tappeh‐e (hill)Sialk in Kashan, Tappeh Hesar in Damghan, Torang Tappeh in Gorgan, Tappeh Hekmataneh in Hamedan, Tappeh Hassanloo in Azzarbaijan, Tappeh Marlik in Rodbar Susa(shoosh) in Khozistan.
The migra on of Aryan tribes to the plateau of Iran began in the 2nd millennium BC. Out of these tribes, the Parthian dwelled in Khorassan, the Medes in the West and parses resided in the southern Iran. The median Empire Rose in Hekmataneh (Ecbatana), the present Hamedan. An Achaemenidae established the first great Persian Empire after defeating the Medes and conquest of their Capital. The limits of the Achaemenid (Persian) Empire, which reached from the Indus to the Nile at its zenith extended from the Plain of Sand River in the east to borders of Greece in the west and the Persian king Cyrus the Great overthrew the Medes and became ruler of the Achaemenian territory during the reign of Dariush (I) (522‐485 BC). Passargard and Persepolis are among the vestige of this period and as important historical sites, are visited by significant number of foreign tourists annually. Around the year 250 BC, the Parthian, who were an Aryan tribe towards the west and south‐west and founded their empire over Iran plateau in Teesfoon. This empire survived un l the 224 AD. The Sassanid's, a er defea ng the last Parthian king in 225 AD, founded a new empire which lasted un l mid 7th century AD with respect to its poli cal, social and cultural characteristics, was one of the most magnificent epochs of Iranian history. Out of this era, so many cultural and historical monument have remained in Persepolis, Pasargadae, Shoosh, Shoshtar, Hamedan, Marv dasht(Naghshe‐e‐Rostam), Tagh‐e Bostan and Nayshabor, which are worth seeing. The influence of Islam in Iran began in the early 7th century AD a er the decline of the Sassanid Empire.

١٦٣
Figure 2‐29: Persepolis
The Medes and the Persians occupied the region now called Iran, in the 1500s B.C., until the Persian king Cyrus the Great overthrew the Medes and became ruler of the Achaemenid (Persian) Empire, which reached from the Indus to the Nile at its zenith in 525 B.C. Persia fell to Alexander in 331–330 B.C. and a succession of other rulers: the Seleucids (312–302 B.C. ), the Greek‐speaking Parthian (247 B.C. – A.D. 226), the Sasanians (224–c. 640), and the Arab Muslims (in 641). By the mid‐800s, Persia had become an interna onal scien fic and cultural center. In the 12th century, the Mongols invaded it. The Safavid dynasty (1501–1722), under whom the dominant religion became Shiite Islam, followed, and was then replaced by the Qajar dynasty (1794–1925).
However, Iranian never covered up their opposition against dominance and tyranny of the Omayyad and Abbasid caliphs and founded many autonomous movements to confront them. In return, the Umayyad and the Abbasid caliphs, tried to neutralize and suppress these movements, which were based on partisanship of the prophet of Islam family and establishment of a government on the basis of Imamat, by supporting non‐Iranian forces. Continuity of wars of attrition among local governors weakened the overall power of the country and favored conditions for invasion by foreign tribes of central Asia, like the Mongols. In the Safavid time, another great Empire was founded and the Shiite sect of Islam, disciples of which were seriously limited till then, was formalized. With the decline of Safavid, Afsharieh and later the Zandieh took the throne.
After the Zandieh rule, the Ghajars took power. At this time, the influence of foreign powers such as Britain and Russia in the internal affairs of Iran significantly increased. Meanwhile, social movement of Tobacco, constitutional revolution, forest

١٦٤
uprising and sheikh Mahamad Khiabani s revolt took place. In the Pahlavi period, oil industry na onaliza on movement incited the uprising of June 5th 1953, and other autonomous movements resulting in the Islamic revolution under the leadership of Khomeini in 1979.
233 Attractions Surely, Iran has a great tourism potential because as a very small country in Middle
East context it has a great geographical and landscape diversity within a very short path. This characteristic means a very high strength to develop sustainable tourism destinies from different boarders, as far as they complement each other. Turkey and UAE6 have powerful regions mediating central and local powers, whereas Iran does not have intermediate level administration. On one side, this is one main reason to explain higher divergence among countries/ regions: all the relevant EU information on regional funds flows asymmetrically through economic agents; in the lagged regions, where public sector plays a very important role among institutions Carvalho (2002), individual personalities networked within their political parties are dominant.
Iran tourism players know they cannot develop the whole without social cohesion and as explained before, Iran central tourism organization easily tends to fall in national contradictory policy:
Figure 2‐30: Dizin‐Ski‐Resort
First, rushing to prepare the whole country for international competitive markets (lower than 35% of the popula on and GDP located in the Atlan c coast); second, to guarantee social cohesion in the whole country. This twofold pressure‐economic theory ordering to invest in the places most likely to perform and institutional historical/cultural path requiring subsidies to bridge the divergence gap ‐implies
6 United Arab Emirates

١٦٥
consumption sacrifice for all and budget leftovers for some. The consequence is an excellent opening field to increase the worst of predator competition among those small counties, restricting innovative visions they should promote. Therefore, without working together, networking and complementing investment efforts to really levering infrastructure quality, efficiency and location decisions, adding the citizen “still remaining” traditional knowledge, will difficult to build possible regional competitive advantages (Sheykhi, M. T. 2003).
Iran with much different type of attractions is one of the most beautiful des na on and its one of the 10 top countries of tourism attrac on. Iran includes the many Variety destination and they too have more attraction and potential for attract the tourists from all over the word. Esfahan, Taabryz, Shiraz, Kashan, Kish, Mashhad…are cities that have different and beautiful attraction for tourists. The Persepolis, 33 pol, shah Goli, Kandovn, Takhte Jamshi and Pasargad are some of the very famous attractions in Iran. In Iran there are variety natural and of different type historical and cultural attractions for tourists and visiting. Some of them in some state of Iran has mentioned as follow (IranAtlas, 2010):
1. Shiraz: Fars province with the area about 121,825 square km2 locates in the south of Iran and its capital city is Shiraz. Some of the famous attractions are Pasargadae, Persepolis, Nagshe‐Rajab, Nagsh‐e Rostam, Arge‐e KarimKhan, Hafez Tomb and so on. In addition, its handcrafts, local pastry and specially culture of the people are very interested for tourists who visit Shiraz.
2. Isfahan: Isfahan province with the area about 107,027 square km2 is located in the center of Iran and its capital city is Isfahan. Some of the famous attractions are 33pol, Chehel soton Palace, Nagshe‐jahan squer, Menare jonban, Emarate Aligapo, Vank church and so on. In addition, its Jajim, Roz water, handcrafts are very famous and interested for tourists who pay visit to this province.
3. East Azerbaijan: East Azerbaijan an area of 452, square m2 has about 3.5 million popula ons. Tabriz is the capital of the province. Tabriz consists of 18 towns. It is covered partly by famous mountains like Sahand, and partly by plain and cultivable land. The majority of population of Azerbaijan speaks Turkish language. Old name of this state was Azar Abad Egan. Its history according to the recent discoveries, belong to 3500 years ago. Some of the famous attrac ons are Bazar ( biggest up closed bazaar in the world), Giz Galase (girl castle) Arke Alishah, Shah Goli, Zohak castle, Saat square, handcrafts, cultural etiquette and its nature.

١٦٦
Figure 2‐31: Kandovan village (a village in mountain) in East Azerbaijan
4. Mashhad: Khorasan and its capital, which called Mashhad, are one of the famous
destinations for religious tourists among the Muslims people of Iran, because the imam Reza shrine is located there. In addition, there are many interesting and cultural attractions in Khorasan like Ferdosi Tomb, Khosrogerd Minaret&Mill, Maad castle, khorshid place, Kalat‐e Naderi and so on.
The companies working in tourism industry in Iran, recently have began to use E‐commerce and E‐Marketing in their business and marketing activities in order to develop their market and sale. Nevertheless, they have many problems and have to struggle beneficially. Use of an appropriate strategy can be useful and necessary for the success of E‐Marketing and development the tourism industry in Iran (Asia‐Pasfuc Conference, 2002).
Though Iran has a lot of attraction and good potential to develop the tourism industry but as someone commented, there is a huge problem of accessibilities (physical and informational) in the Iran tourism industry. The answer is not ready. How do we intend to compete with similar mountain regions with greater traditions in Iran? How are we going to bring people here?
I think that these weaknesses can be overcome, looking them as new challenges and new business flourishing opportunities. I do not think so if we learn how to use internet, with who should we make joint ventures adding value to traditional chain productions, using clean transport facilities and marketing it through the right channels (Carvalho, 2006).

١٦٧
Of course, one need to internationalize the activities through new homework tasks7is using the internet and clearly identifying the demanders for this type of tourism, organizing events and scientific meetings, thinking on the new century issues.
Facilities for disabled persons, activities especially designed for new pensioners, sport and cultural events, using environmental and natural facilities and requiring a new type of experts in human performance behavior and total quality of life management. Nothing will be done without effort, but tourism is a cluster activity and will not solve the divergence if resident people will not think large and open minded (Cuhls, 2007).
234 EMarketing strategy in Iran Tourism Industry The primary tool of growth and profitability for the tourism industry in Iran will be
the effectiveness of the marketing system puts into place to support E‐Marketing and existing channels. In order to determine Iran E‐Marketing strategy effective's elements framework, Researcher firstly reviewed Iran Tourism Industry’s Vision and Strategic Plan, and then examined and analyzed from an E‐Marketing perspective its strategic objectives. The Consultant then proceeded to the examination and evaluation of internal and external environment in order to analyze and compare the competitive environment with a clear focus in the E‐Marketing related critical areas of: website, intranet, e‐Branding, e‐Trading; politic; economic; consumers and culture.
Tourists have greater influence in the market than ever before. Building and maintaining close relationships with tourists, has become an issue of great importance for tourism organizations. Each tourist interaction constitutes an opportunity for an organization to collect valuable information and provide better and innovative services.
The E‐Marketing Strategic process should be dynamic taking place at the pace of the market and enabling to monitor and review its strategic goals and objectives. Iran Tourism Industry as a broader cross‐channel organization, aiming in combining a
7 In one of the mountain lover meetings, someone told the story that transformed his life. He announced in an
international site fly-fishing tournaments (trout) in a very small river up in the mountain and a relevant number of Japanese and Finnish fishermen came because it was coincident with their forbidden period to fish in their countries. It happens they stayed for a two week period and start to marketing it “mouth to mouth”. He left the public job he has and runs a new business now!

١٦٨
strong Internet presence with existing offline channels’ activities will need to execute the following (IΝΟΡΑ, 2005):
• Address a full range of existing and latent tourist needs to promote/provide a unique tourist experience.
• Rapidly build a brand strategy eliminating existing brands and/or introduce new one(s) that will be used throughout the organization, independently from the channel, for all kind of communications with tourists.
• Extend the emerged brand(s) on the internet.
• Use on‐ and offline tourists information to win the battle for valuable tourist profiles.
• Develop and implement “product” strategies that are unique to the e‐environment.
• Deploy channels that integrate the internet with exis ng B2C & B2B networks.
235 EMarketing barriers in Iran tourism industry Although per‐capita Iran Internet usage rates still pale by comparison to those of
Germany, the number of customers signing on to the World Wide Web is growing at an exponential rate. This is impart what the region's airlines are hoping to profit from as they take to the net in the same way as have their more advanced North American and European counterparts. Finally, they hope to move forward with concrete online strategies. Airlines are seeing the benefits of not just selling online, but buying. In Iran, Iran Air line has led the way in terms of online services through travel site.
Once the mission and goals to be pursued have been determined, it is time to look at what is happening in the world outside of the company and determine how, if at all, specific events might affect the company in the long run. These analyses of the external environment include broad, global (macro) issues like social changes, new technologies and the economic, political and regulatory environments. A frequently used chart for analyzing the macro external environment is the PEST chart. PEST is an acronym for the Political, Economic, Social and Technological analyses that encompass the process. I have explained that, because in E‐Marketing, technology play basic roll and it's include the two importance part, software and hardware; it's very useful that they consider separately, as show in next diagram:
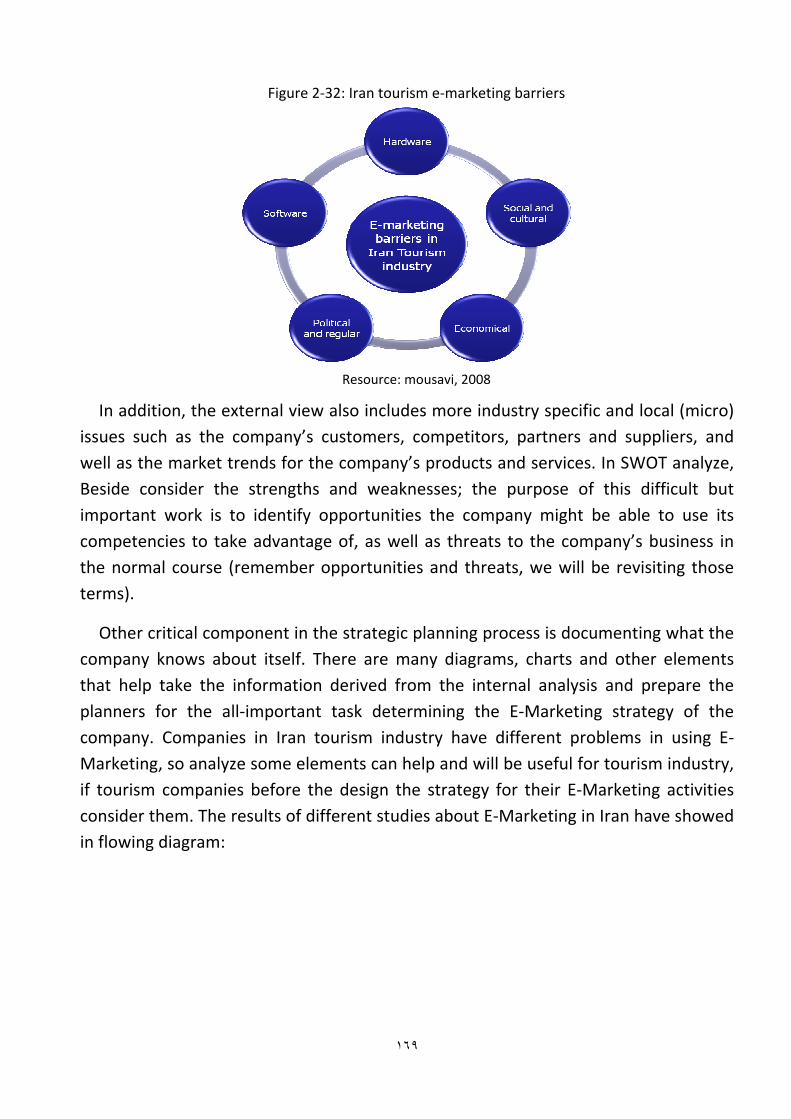
١٦٩
Figure 2‐32: Iran tourism e‐marketing barriers
Resource: mousavi, 2008
In addition, the external view also includes more industry specific and local (micro) issues such as the company’s customers, competitors, partners and suppliers, and well as the market trends for the company’s products and services. In SWOT analyze, Beside consider the strengths and weaknesses; the purpose of this difficult but important work is to identify opportunities the company might be able to use its competencies to take advantage of, as well as threats to the company’s business in the normal course (remember opportunities and threats, we will be revisiting those terms).
Other critical component in the strategic planning process is documenting what the company knows about itself. There are many diagrams, charts and other elements that help take the information derived from the internal analysis and prepare the planners for the all‐important task determining the E‐Marketing strategy of the company. Companies in Iran tourism industry have different problems in using E‐Marketing, so analyze some elements can help and will be useful for tourism industry, if tourism companies before the design the strategy for their E‐Marketing activities consider them. The results of different studies about E‐Marketing in Iran have showed in flowing diagram:

١٧٠
Figure 2‐33: Iran tourism e‐marketing strategy analyze model
Resource:
This diagram tries to answer different questions related internal company in designing the E‐Marketing strategy in tourism industry. What defines the corporate culture of the company? What is its image in the eyes of its stakeholders and others? Who are the key employees and stakeholders in the organization? How is the firm organized, and how much experience does it have relative to its competitors? Is the firm efficient with its resources? Does it have the capacity to grow? Is there an awareness of the company’s brand in its markets? What market share does the firm enjoy? Are there sufficient financial resources to meet its short‐term needs? What exclusivity in customers and/or contracts does the firm enjoy relative to its competitors? Does the firm have intellectual property it can leverage? This barrage of questions begins the process of a company looking internally at itself, and determining the answers will enable it to develop an understanding of its strengths and its weaknesses relative to those of the other participants in the markets it serves.
236 Iran chain Hotels Unfortunately, for a number of hotels in Iran, including franchised properties, many
visits to the property website turn out to be the “last point of contact” with the customer. For this reason, enhancing and optimizing the hotel website should be the first step in developing the Local Internet Marketing Strategy for the franchised property. Strategic Linking at the property level is the business strategy that
Internal analyze in E‐Marketing strategy
Stakeholder
Organized and structure
Financial resources
Company Corporate culture
E‐marketing knowledge
Others Data base and CRM
Employees and their expert
Capacity and Market share
Technology and software in company
١٧١
establishes links from highly relevant and authoritative websites to the franchised hotel website (i.e. to build the "Link Popularity" of hotel website). (72)
Here is a sample of local condition and directories that should be considered by the franchised hotel in Iran. These locally based sites can boost the Link Popularity of the property website and generate highly relevant traffic and incremental leads and revenues the Iran Franchised Hotels (I.T.O, 2007):
Local content portals and radio station Local destination and city State, county, and city Chamber of Commerce Local family travel sites Local event and meeting planner Local wedding planning
It is up to franchised hoteliers to inform the customers about their services and offerings, area or at‐property events, and to establish and maintain interactive relationships with potential internet audiences and markets that can generate incremental revenues (Starkov, 2010).
Not only does researcher find the chain hotels to be very compelling and there are numerous of players in that field, but also many hotels have applied similar Internet technology, such as interface of supporting business activities. As a matter of fact, that is the industry researcher are looking for and can help us to find out how they differentiate themselves from competitors with Internet technology. Iranian Chain Hotels Characteristics (I.T.O, 2007):
The hotel must be domestic and possessed by Iranian owner. The multinational hotel corporations will be ruled out as potential samples, because researcher would like to interview the higher level of management who is supposed to be able to answer our questions, and often the head office is located somewhere else than in Iran.
The hotel is expected to fully perform the functions of value chain, and Internet technology has been applied to its business.
The hotels show some kind of differentiation.
Though many hotel chains have become good e‐Marketers on the national and international level, they do not have the bandwidth to cover local, property‐level

١٧٢
online revenue opportunities such as event and attraction‐based promotions, resident‐only specials, local key market segment initiatives, etc. It is up to franchised hoteliers to inform locals about their services and offerings for area or at‐property events, and to establish and maintain interactive relationships with local audiences and markets that can generate incremental revenues.
Chain Hoteliers can boost revenues in these difficult economic times, generate incremental online bookings and business opportunities, improve occupancy, and “steal” market share from the competition by launching a comprehensive Local Internet Marketing Strategy. Such a ROI‐centric local strategy includes property website optimizations (mini‐site on brand website and independent property website); local search marketing; local strategic link building, property‐level email marketing, key customer segment online initiatives, and local online sponsorships.
2‐3‐6‐1‐ Hotel Homa
Affiliated to the Airline of the Islamic Republic of Iran, Homa Hotel Group has the honor of having served the country's tourist industry for many years now. Each of Homa Hotel's 912 fully equipped and modern guestrooms and suites in Tehran, Shiraz, Bandar Abbas and Mashhad (tow Hotels), provide comfort and convenience in a contemporary setting. Homa Hotel Group is popular for the superb sport and service facilities it offers to its local and foreign guests. This hotel group includes hotels in different big cities in Iran and includes the Tehran, Mashhad, Shiraz and Bandar Abbas.
Figure 2‐34: Homa Hotel Group Website picture
Source: Homa Hotel Group Website

١٧٣
Quality, initiation and communication are values that are shared by staff in order to adapt to new situations. The reservation centers at each of our Homa Hotels in Tehran, Shiraz, Bandar Abbas and Mashhad cities as well as tourist and travel agencies representing Homa Hotel Group, are enthusiastically prepared to offer customers reservation services. Five star Homa Hotel Group, well known for its hospitality and welcoming atmosphere, with more than 40 years of successful experience in Iran’s hotel industry. The Hotel Group try to provide for guests the best facilities, comfort & new technology you want, the best & deserve the best. All the kind & professional hotel staff will do their best to provide them with an enjoyable, unforgettable & memorable stay in Iran‐the land of wonders. Because the relationship with Iran Air Airline, they are one of the first hotels that they are using internet and E‐Marketing in their hotels. They mission and strategy is too in relationship‐ with Iran Air Company (Homa).
2‐3‐6‐2‐ Hotel Persian
The company is the first hotel chain and good distribution in major cities, tourism, pilgrimage, trade, such as Tehran, Isfahan, Shiraz, Yazd, Bam, Branch, Ramsar is required. Parisian Hotel Company with international distribution is commensurate with the demands of the tourism, business trips and service quality standards with regard to political and decisive role in the hotel industry will do. The company in recent years with the emphasis and focus to the training of human resources, innovation, creativity and scientific management, in the privileged position of the hotel market and has achieved its goal. The name of the company's hotels in 1374 called Azadi Interna onal Hotel and in 1378 founded the company and in 1380, International Hotel Company is registered with the Persians.
Figure 2‐35: Persian international hotels Group Website picture
Source: Persian international hotels Group Website
١٧٤
The company has been working as a leading regional chain, and tourism in the countries where their target market, Iran has made its way to be.
1) Promo on and marke ng research services through standardiza on in accordance with attend to market needs and actively participate in the hotel and tourism fairs in countries that they send tourists to Iran, along with the organization's major tourism and recreational centers in the hotels subset Persians. They also communicate directly with the target market and the rational and effective marketing and sales offices in France and Spain is established.
2) Some of the strategic policy is promoting the service through training, young human resources, application of modern hotel facilities, renovation of the hotel (the hotel's East Tower, and Ali Qapu Kosar Isfahan, Azadi Khazar, Sfayyh Yazd, Abadan) and finally added value by using the most modern technology achievements in the field of hotel management.
"The best belongs to the customer". All the employees from senior managers and staff at headquarters and other partners in the hotels, are in believe the Loyal services and subsidiaries, the "best customers to" have faith and believe in heart and all the customers efforts and tried to employ the best Services and sweetest memories for
guests of hotel services company. They will create the best belongs to the customer
is not a slogan, but believes the culture of Iranian Friendship Hello. The international hotel company's own Network is always knows best and the services provided to their customers.
((Esteghlal Persian Hotel, Tehran Azadi Persian Hotel , Khazar Azadi Persian Hotel, Bam Azadi Persian Hotel, Ramsar Azadi Persian Hotel, Hamedan Azadi Persian Hotel, Shahre Kord Azadi Persian Hotel , Kermanshah Persian Hotel, Shiraz Persian Hotel, Esfahan Kosar Persian Hotel, Tehran Kosar Persian Hotel, Safaiye Persian Hotel, Enghelab Persian Hotel, Evin Persian Hotel, Ali ghapo Persian Hotel, Bo alli Persian Hotel))
Customer orientation
Depth of organizational identity
Increase the customers' satisfaction
Continuous improvement of services in hotels
Develop the internet marketing
Loyal customers to the brand name and Persians

١٧٥
Prepare the customer club conditions
The depth and spread of the Parsians hotel's name and brand in the Iran Hospitality and Hotel industry
2‐3‐6‐3‐ Hotel kosar
Kosar Hotel Group is the most important residentional & two cultural & residentional complexes. Hotel Kosar‐e‐tehran with half of its traditional architecture
is one of the most attrac ve 4‐star Hotels Tehran. The hotel is located in the heart of Tehran and near field, Vali‐Asr is located in the beautiful lobby and traditional building with the appropriate welfare facilities, will offer unique hospitality.
Figure 2‐36: Kosar hotel Group Website picture
Source: Kosar hotels Group Website
Rate a hotel near the center of Tehran and one of the great advantages of this hotel, Kosar hotel Vmyhmanan with Tehran to ease the various sightseeing spots, museums, commercial centers, administrative and recreational access will. Also, it equipped with a wedding forum and an exhibition of handicrafts Information desk.
2‐3‐6‐4‐ Hotel lale group
Lale(Tulip) Group hotels include Hotel Laleh Yazd, Tehran and hydrotherapy Sabalan Sarein and the highest price offered to the Iranian capital was sold. However, the advertising sales Tulip hotels were published in recent months and capitalists from
different countries such as Turkey, Malaysia and ... . Interested in buying the group's hotels and Lale(Tulip) hotels were sold to an Iranian capitalist.
However, government officials still did not name the investor, but some experts say that Iran Hossein Sabet, the owner of Hotel Dariush Hotel Kish buyer has Lale(Tulip). A few years proved that Iran has a name familiar to the tourist circles. His investments, though the tourism industry is not a way out from under the oil itself,

١٧٦
but democracy has been able to work here, a fairly prestigious hotels for the tourist economy of Iran put in place. In this regard, he recently paid 120 million dollars has been able to name your foot to get buildings Tulip Hotel.
Tourism is probably right with this group of activists, because it seems possible to improve the situation of the hotel, Laleh hotel, the activists, the private sector or government facilities there, but now the Lale(Tulip) Hotel as one of the top hotels in Iran, is standing where some of the crew of the hotel as a dilapidated ruin tourism. Laleh Hotel is one of the interactional hotel chains. The intercontinental Company intercon nental hotels in 1946, the airline Pan American Interna onal, the U.S. government's request to add passengers to the South American countries, help to strengthen the economies of these countries. Intercon nental Company now has 68 hotels across five continents.
Company Hotels intercon nental In 1946, the airline's interna onal Pan, at the request of the United States was held up, the way for travelers to countries in South America, helping to boost the economy of these countries. The company intercon nenta 68 hotels across five con nents Yes.Hotel Lale(Tulip) chains of hotels that Ayntrkntynntal, after the Islamic Revolution in Iran, the U.S. Company to purchase its own shares. Laleh Hotel, with an area of over 16,000 square meters, has 13 floors and 400 rooms Single, Double, Suite and Royal Suite are normal. This hotel in 1971, and in 1997, has been restored. Tulip is a five star hotel and the location is suitable for internal and external tourists, because it is located in the city center and guests can easily access sites are needed. The hotel's four restaurants, includes Chinese, Europeans and Iranians, pool and sauna, conference room and various shops. The hotel's 470 staff are employed. Lale trehran and Lale Kandowan are two more beautiful and well know of this hotels group hotels.
2‐3‐6‐5‐ Pars Hotels Group
This group include different rang of hotels in Iran. Because different system in this group and the reason that the company bought the hotels in different times and the hotels before belonged to different companies and persons, In this part, will present some of the hotels, they belong to group:

١٧٧
Figure 2‐37: Pars hotel Group Website picture
Source: Pars hotels Group Website
Pars kish: Pars Hotel in Kish worth of land 55,000 square meters with a 195 room 5 star hotel as one of the largest and best known island. This hotel is located in the island region, which sets it apart from many important commercial and tourist attractions of the island is very close. Island's largest amusement pier in front of the hotel is worth. It added to Pars Hotel Group hotels in 2009. The hotel has about 195 residential spaces, which are as follows:
Rooms facing the sea and the island Standard Suite 4 boards Royal Suite One Bedroom 120 meters Royal Two Bedroom Duplex Suite 220 meters Luxury Dvblks∙hay Beach Suites 2,3 and 4 boards Pars kerman: Kerman Pars Interna onal Hotel in 1381 and the land of 32,000
sqm and 24,000 sqm infrastructure established and that includes parking and eight floors including the pilot.
The hotel has about 197 residen al spaces that include: Double room 164 24 three‐person suites 8 suites, 2 single An apartment Pars Ahwaz: Kerman Pars Interna onal Hotel too in 2002 and the land of 32,000
sqm and 24,000 sqm established:
The hotel has about 197 residen al spaces that include: Double room 164
24 three‐person suites 8 suites, 2 single An apartment

١٧٨
Pars Tabriz: In the years 1992 ‐ 1990 Consul ng Engineers Group 4 design Pars Hotel Tabriz Elgoli started its opera on in early 1995 and a land area of 37,000 square meters and 28,000 square meter building began. A er a six‐year period that ended the Persian date Shahrivar 2000 building and 29 Persian date Esfand 2000 his work began accep ng passengers. The main hotel tower with 17 floors and is a revolving restaurant. Other feature of this hotel is as follows:
Chapter 20 Single rooms 60 BOB Double room attached Double rooms from about 79 Chapter 20 140‐meter Royal Suites Revolving restaurant with 350 square meters and a unique perspec ve on the roof
of Tabriz
Pars Mashhad: Hotel Pars Mashhad on 5 hectares of land in the West and the city is located on the edge of Vakil Abad Blvd. This hotel started in 1995 and 1999 related to two residential units with a central building that contains the reception, restaurants, conference halls, banquet halls, and sports complex was designed and implemented.
Building construc on was completed on February 79 from opera on in 82 hotels and 84 years were also developed. In 2010 to create prosperity and Mjavryn guests and pilgrims of Imam Reza (AS) along the lake, children's play park and a restaurant offering traditional Iranian Shrbtkhanh and within a short time was put into operation. The resort hotel with 228 to follow Bob's is ready to serve pilgrims and travelers.
16 Standard Double Suites 22 two‐person suites 6 apartments with all ameni es
Pars Shiraz: The Pars international Hotel was established by AssadAllah Bakhshi , one of the people interested in the tourism industry , to attract tourist and provide services to the internal and foreign passengers who are interested in ancient culture of this land . This Hotel is located in the C.B.D of Shiraz. This Hotel was built by Iranian experts and engineers in two 13‐storey towers on Sep 2002(a er Hegira) and was officially opened the officials of tourist industry and high‐ranking officials.
The Pars International Hotels have designed two saloons, Morvarid and Zomorod, to hold conferences and conventions in the best possible way. These saloons are equipped with the best audio‐visual equipment and can accommodate 250 people.

١٧٩
2‐3‐6‐6‐ Hotel Mehr
Mehr traditionals hotel also known as historical house and its recognizable by the people who love the traditional architecture of Iran. This group belongs to Bank Mehr that belongs to Bassij and Sepah. Because the company bought the hotels in different times from different owners, and later named them with Mehr chain hotel group, I present here only one of them:
An example of this group is the "Hotel Mehr Yazd". This hotel has served for 200 years traditional history and architecturally. Also, it facilitated with all welfare equipments located in the historical place of Zargar_e_Yazdi at the center of the traditional texture of Yazd city. it has also water pool, colored glass, huge wind catchers , wooden doors, hall, rooms with 3 and 5 doors, tradi onal shoe holders, Hashti, Kariyas, alcove, Qanats, refrigerators and Narengestan with having all these facilities reminds them of the past sweet memory. Single bedrooms, double bed rooms, three bedrooms and suite with all services, blow dryers, sauna and Jacques, refrigerator with mini bar, T.V, heating and cooling system provided in traditional and modern style.
Figure 2‐38: Hotel Mehr Yazd picture
Source: Mehr hotels Group Website
Hotel is close related to the old market place of Shazdeh Fazel and Bazzar_ e _ Zargarha and Bazzar _e_Khan and also close to Arg complex and Masjid _ e _ Jame and Alexander prison and other sightseeing of Yazd. With customers presence in the elegant restaurant and its coffee shop in the open and closed space and on the roof along Iranian and continental food in the form of traditional service will be served as a memorable moments for our guest in the hotel. Facilities services, which are available, are:
Internet café, satellite with central system giving service to rooms and common spaces, taxi service , service for airline and railway ticketing, visa service , Yazd sightseeing tour along with a guide (camel and horse riding, desert adventure, etc ),

١٨٠
doctor, complete insurance facility to our guest from the time they arrive till the date of departure from the hotel, billiard and table tennis rooms, chess, cashmere exhibition and Yazd handicraft , lockers .
237 Tour Operator in the Iran These days, many of the industrialized countries are mentioned as leading the
tourism and travel industry in Iran during the past years, but without offering, the industry has been lost. This course is higher compared to neighboring countries. The position of tourism in the countries where they are standing down of the Iranian tourism industry in the state of Iran is far better to have portrayed.
At first glance out of the government tourism body part can be useful, but there are still challenges in the next step in Iran's tourism industry bodies locked in a time of such investments on the shoulders of the tourism industry is . It seems that the story still stands on the place. The same look with relying on ideological definitions has hampered the productivity of the tourism industry. This is just part of the story of Iran's tourism economy. Even with a group of experts had doubts about the alliance of private capitalists and government bodies are looking at tourism in Iran.
2‐3‐7‐1‐ Sand bad
Sand bad Travel and tourism enterprises in the Official Gazette of sep 2003 was published in Tehran has attracted the attention of the audience and the audience's participation in official newspapers, newsletters, magazines , city boards, manuals and websites have been observed. The company first started its activities in order to serve passengers on domestic and international tickets and tours in Asia are limited by other design companies were launched with little time now Altaf on the benefit of divine and committed and competent personnel, review.
They identify intelligent tourism market, the opportunities come, and eventually its wisdom has managed the company's management as a powerful wholesaler designer and planner, and now introduced in the Tourism Service of such as Asian and European tours, domestic and foreign Airline tickets, hotel reservations and travel agency partners, offers. Management believes the company with the slogan "Quality is our path, not the destination" their lines to ensure customer satisfaction through quality services and the appropriate base for these purposes and consider the following macro is placed:
١٨١
Figure 2‐39: Sand bad Travel Group Website picture
Source: Sand bad Travel group website
‐ Respect to clients and customers and meet their needs and demands in terms of na onal requirements and interna onal standard ISO 10002
‐ Increase and maintain constant quality of service using valuable feedback from customers, raising the quality of service, and modern convenience.
‐ Continuous improvement processes based on identified Dominic cycle (PDCA) in company with the aim to increase process performance indicators to better define
Establishing strong relationships with national and international brokers, suppliers, tips, airlines, and select strictly within them to corporation.
‐ Identify new areas of tourism, with tourist facilities and ancillary services in order to increase customer satisfaction.
‐ Effort to attract and recruit much discerning staff, efficient, professional level associated with knowledge and skills with the belief that "the best investment any company is its employees."
‐ Establish the appropriate environment for attracting and using innovation, creativity, intellectual and strategic staff feedback on the company's lofty goals.
2‐3‐7‐2‐ Ghoghnos
When we started Ghoghnos Tour and Travel Agency 30 years ago, we dreamed of being able to offer the most inspiring experiences inside Iran and all around the world. We understood that travel should be amazing, exciting, intriguing, full of discovery and memorable. During their 30 years ac vity in the tourism of Iran, they reached the official title of the Leaders for providing the whole range of tourism related services including domestic and outbound ticketing. They work very powerful and comprehensive in outgoing tour opera on board with more than 60 des na ons

١٨٢
around the globe and incoming ground handler in the fields of historical attractions, eco‐cultural and nature‐based tour operation.
Figure 2‐40: Ghoghnos Tour Group Website picture
Source: Ghoghnos tour group website
Decades of experience as well as having superior and qualified staff are key factors for the success of tourism bodies affiliated to Ghoghnos Tour operator. Many tourists do not really see the country they visit, but with local guides on the ground, Ghoghnos try to provide experiences that are unique in Iran. They try to introduce customers to the 'real' country and its people, to whom hospitality is legendarily in their blood and is considered the prime virtues, that is why they treat you as an individual not just one member of a group. At Ghoghnos Tour and Travel Agency, they have understood that the difference between a tour and an experience is the quality, enthusiasm and knowledge of the guide. Well‐educated guides have a wide range of backgrounds, interests and specialties. They might be teachers or professors, photographers, botanists, zoologists, engineers or historians, but what they all have in common is a commitment to delivering a unique and memorable experience. They also claimed that their combination of expertise and discoveries create truly inspiring travel experiences – something they like to call the Ghoghnos difference.
2‐3‐7‐3‐ Marko polo
Marco Polo group of founders and managers of the group founders, pioneers and practitioners of tourism and travel services companies are active in the country, mostly in their records for more than thirty years and qualified to serve domestic and foreign tourists have the records. Establishment and operation of corporate travel services, holidays, Galiwer, Kian, planet, Galitour, Island Tours, Duration of residence and establishment of cooperation in tourism services and the pioneer tour operating
١٨٣
groups, leading tours and Torres and the formation of the Royal travels of Marco Polo in 2003, a large part of the opera onal ac vi es of the founders. Marco Polo in 2004 as the first major company selling tour in Iran with successful and unique services in the field of mass tour operating entry found.
The company with an extensive sales network covering more than 300 offices throughout Iran in the name of Marco Polo Travel Service as an introduction to tourism in the area of brand and service standards and high quality with leading tour in the field of professional to tourists provide. In 2006, Marco Polo with the permission of specialized training, education and research activities with professional quality and distinctive and complementary services, Marco Polo was launched. Studies designed to create the holding with the holding of successful countries in the field of tourism in 2007 was on the agenda.
Public company holding the development of tourism as Marco Polo traveled from the administrative and legal procedures and official opening ceremony in September 2009 in order to achieve company objec ves and prospects for sustainable tourism development in compliance with professional standards in the industry. The main objectives of the company:
• The field of public participation and public investors in the tourism • Focus on capital management and financial resources • Integrated and coordinated system of services in tourism • Active, effective and targeted on global markets • Develop educational and research services • Mass and sustainable development in Iran tour operating • Sustainable development and international mass tour operating • Electronic and information technology services to develop tourism • Development of air transportation and rail capacity • Development of tourism areas and areas
2‐3‐7‐4‐ Ely Gasht
Ely Gasht Travel and Tourism Company has found in 0ct 2000 in Tehran. The company started first its activities in order to serve passengers on domestic and international tickets and tours in Asia are limited by other design companies were launched. Company managers try to use the benefit of competent personnel and try to review and identify tourism market potential and be as a powerful wholesaler designer and planner, and now introduced in the Tourism Service of such as Asian and
١٨٤
European tours, domestic and foreign Airline tickets, hotel reservations and travel agency partners, offers. Management believes the company with the slogan "Quality is our path, not the destination" their lines to ensure customer satisfaction through quality services, meet the appropriate basis for these purposes, and consider the following macro is placed:
1. To respect the needs and demands of clients and customers and meet their requirements in terms of national and interna onal standard ISO 10002 (the system to address customer demands)
2. To increase and maintain constant quality of service using valuable feedback from customers, raising the quality of service, to maintain bridges and modern convenience for customers to receive constructive comments Vpaskhgvyy fast.
3. Con nuous improvement processes have been iden fied based Dymyng cycle (PDCA) in company with the aim to increase process performance indicators to better define
4. Establish strong rela onships with national and international brokers, suppliers, and airlines
5. Iden fy new places with tourist facili es and ancillary services in the promo on of tourism in order to increase customer satisfaction.
6. Discerning effort to attract and recruit more staff, an efficient level of experts with scientific knowledge and skills with continuing education classes with the belief that "the best investment any company is its personnel."
7. Establish the appropriate environment for attrac ng and using innovation, creativity, employee feedback and strategic thinking in the company's lofty goals.
Tour Organizer Tours & Travel tour and ticket sales to domestic and overseas to investigate complaints and respond quickly, and offered constructive comments which led to increased customer satisfaction and loyalty, and the company's survival, the customers of the inves ga on According to the standard ISO 10002:2004 has been established as follows.
1. Comply with the requirements of na onal and interna onal tourism tour services. 2. Create a customer‐centric environment with the necessary resources in order to get customer feedback.
3. Crea ng the effec vely and easy to use process.

١٨٥
4. Promote the knowledge and responsiveness to customer rela onship management in their personnel continuing education.
5. Gravamen of security and ensure the confiden ality and iden ty of customers. 6. Maintain bridges and modern convenience for the customer complaints.
2‐3‐7‐5‐ Ghasre shirin
Ghasre shirin tour operator started its ac vity since 1986 in Tehran. The travel agency in selling airline tickets to destinations within the country, international ticketing, visa, hotel booking, individual and group tour travel out of Iran (Europe, Middle East, Far East, Africa and ... .), is active. Sweet Palace Tours Travel Agency is trying to hold internal and external customers to become familiar with the culture of different countries and provide an opportunity for everyone to enjoy the journey and add to their experiences.
The company, with its brilliant record in 2002 received the cer fica on in paragraph (a), and in 2004 was one of the four services was promoted separated from each other. Travel Zhans Qasr‐e Shirin, in selling airline tickets to destinations within the country, international ticketing, visa, hotel reservation, tour individually and in groups outside of Iran (Europe, Middle East, Far East, Africa, etc.) , is active.
Company, an company active in providing visa from the embassy, school and group visits, tours Holding foreign, domestic and foreign ticket sales, charter flights in Iran. Ghasre Shirin Company to provide ancillary services to customers was to create entertainment, food supply, demand and changing views on the possible return on their tours has. Other services the agency can be as follows. The agency several years in order to facilitate the service have to offer tourists.
* Implementation of direct tourism abroad
* Sale the foreign tours and Domestic
Corporate with foreign and domestic airline such as Lufthansa & Iran Air
* International hotel reservations with different degrees of quality
* Business and tourist visa for most countries
2‐3‐7‐6‐ Sahel Gasht
The beach was prac cally part of his career began in 1997, the company founded by two brothers named Mansour, Majid Soltani, and continues to work as tour operator of the Civil Aviation Organization and the cultural heritage and tourism. The

١٨٦
company's three‐story commercial building with infrastructure in the 525 meters on the street doctor Beheshti (Abbas Abad) is proud that more than 700 travel agencies in Tehran and city partners are working with the beach patrol.
Sahel Gasht on major routes and Tours Company specialized output ‐ Dubai ‐ Nkarast Thailand. Sahel Gasht is proud that despite the high volume of passengers whose travel 85% of them is old and repe ve, this is a sign of quality and durability. Sahel Gasht in its record of more than 345 full‐charter routes in Sharjah ‐ Dubai and Sri Lanka has, while a member of IATA and the stock is full, with 45 people, trained and competent personnel are in the UAE (Dubai) ‐ Thailand ‐ Turkey (Ankara) ‐ and California is a representative office. Sahel Gasht in history and a considerable volume of inbound and Central European countries in its repertoire, and this is a special code from the State Department.
2‐3‐7‐7‐ Persepolis
Air travel and tourism services company Persepolis (Pvt.) on February 1961 with the aim of providing services to tourists and foreign tourist was established and its activities from the beginning in the current No. began. In 2006 and a er 45 years of continuous activity, the exclusive representative of the hotel reservation Parsian Interna onal as the largest collec on of 3 to 5 star hotels to country and awarded the company the same year in summer obtained tablets enforcement Powered by a broad national plan trips Cultural Heritage, Handicrafts and Tourism was.
Figure 2‐41: Persepolis tourism services company Website picture
Source: Persepolis tourism services company Website
Parent company News Corp tourism and entertainment centers under the Foundation of Islamic Revolution of Iran is in corporate with the country's largest chain hotels and recreation centers, sports, tourism and tourism related training. It active in the Worldwide markets, official meetings, exhibitions and membership of the World Tourism Organization and enjoys international recognition as a leading tourism activities, creative activities and will take effect.
١٨٧
Persian date may 2009 the company staff to new ac vi es in six areas Tours, Tours, incoming tours, pilgrimage tours, hotel reservations and issue tickets began domestic and foreign. Managers referred to units with an average of 10 years experience in their management plans have provided a wide range. It has more than 50 years of successful experience in tourism industry. It has the following facilities for incoming tours from all walks of life:
• Being a reserva on center for the biggest hotel complexes ranging from 3 to 5 star hotels and especially Parsian Hotel Complex in the country
• Holding international seminars and gatherings
• Providing VIP services for domestic or foreign guests
• Holding Exhibition Tours in and outside the country
• Holding Iran Tourism Tour for foreign guests at competitive prices
238 Airline and EMarketing in Iran Historically, the airline industry has been one of the most heavily regulated and
protected sectors. Aside from the fact that ‐ with the US being the notable exception to the rule most carriers were state‐owned and enjoyed a legal a monopoly over most domestic traffic, governments strictly controlled entry to international routes by means of restrictive bilateral air service agreements (ASA). Essentially, only carriers regis‐tered in either signatory state were allowed to operate commercial services between the two countries ‐ but more often than not, each country would designate only its re‐spective (state‐owned) “flag carrier” for cross‐border flights. Airline industry is very young in Iran and nowly because some polotice boycottes cannt revenue by them. In Iran, one big and international Airline and four local ailines are flying only in internal distination and som near countries. Finding E‐marketing development and strategies effective elements can help them better exploit their customers’ in commetitive market.
2‐3‐8‐1‐ Iran air
In 1946, a group of businessmen founded Iran's first flag carrier under the name of Iranian Airways. Operations covered domestic and regional passenger and freight services plus a weekly freight service to Europe. The fleet consisted of Douglas DC‐3s initially, supplemented by Douglas DC‐4 and Vickers Viscount aircraft, later on. In 1954, the privately owned airline Persian Air Services (PAS) was established, which initially operated only freight services, followed by passenger operations between Tehran and other major ci es in Iran. In 1960, PAS ini ated service to several

١٨٨
European destinations, including Geneva, Paris, Brussels and London, using Douglas DC‐7C aircraft, leased from Sabena.
On 24 February 1962, Iranian Airways and PAS merged to form the Iran Na onal Airlines Corporation, known as Iran Air. It was a public sector venture that combined the assets and liabilities of the two predecessor air carriers. Among the aircraft used were Avro York, Douglas DC‐3, Douglas DC‐6 and Vickers Viscount. The carrier became a full member of IATA in 1964.
"Iranian Airways" was established in May 1944 and flew its first passenger flight after World War II from Tehran to the holy city of Mashhad. Within a period of 17 years, from 1945 to 1962, the airline developed into a major domes c carrier with a few international flights per week.
The board of ministers ra fied a proposal to establish a na onal airline on 10 February 1961. Following this decision, on 24 February 1961, "Iranian Airways" and "Pars Airways", a private airline established in 1954, merged to form the new airline "Iran Air", using the "HOMA" bird as a symbol.
Air jet in 1965 with the first flight using a Boeing 727‐100 on the route Tehran ‐ Beirut was done. The company decided to convert all of its fleet of jet aircraft. Starting with the 1970s golden age began in the Air. In 1971 a number of Boeing 200‐737 Boeing ‐737‐100, and in 1974 became the company's fleet. Delivery of Boeing 747 aircra also expensive 100 and S. 200, began in the wake of 1975.
In the mid‐seventies, Air non‐stop flights daily to many of Europe did, in this way only in Tehran Iran's national airline ‐ a weekly flight to London was over thirty. Tehran airline to JFK airport in 1975, using Boeing 707 and a stop at London's Heathrow Airport began. Following the purchase of Boeing's 747 free, long‐range aircraft in the direction of the Homa ‐ Tehran to New York and to the world's longest non‐stop airline launches. Homa at the end of this year to over 31 des na ons in and outside of Iran, Beijing and Tokyo to New York and daily flights would launch a new airline to the destination was Los Angeles and Sydney.
I By the late 1970s, Iran Air was the fastest growing airline in the world and one of the most profitable. By 1976, Iran Air was ranked second only to Qantas, as the world’s safest airline, having been accident free for at least ten consecutive years. Although both airlines were accident free, Iran Air came second only because of fewer operational hours flown compared to Qantas. Prior to this ranking, a fatal accident
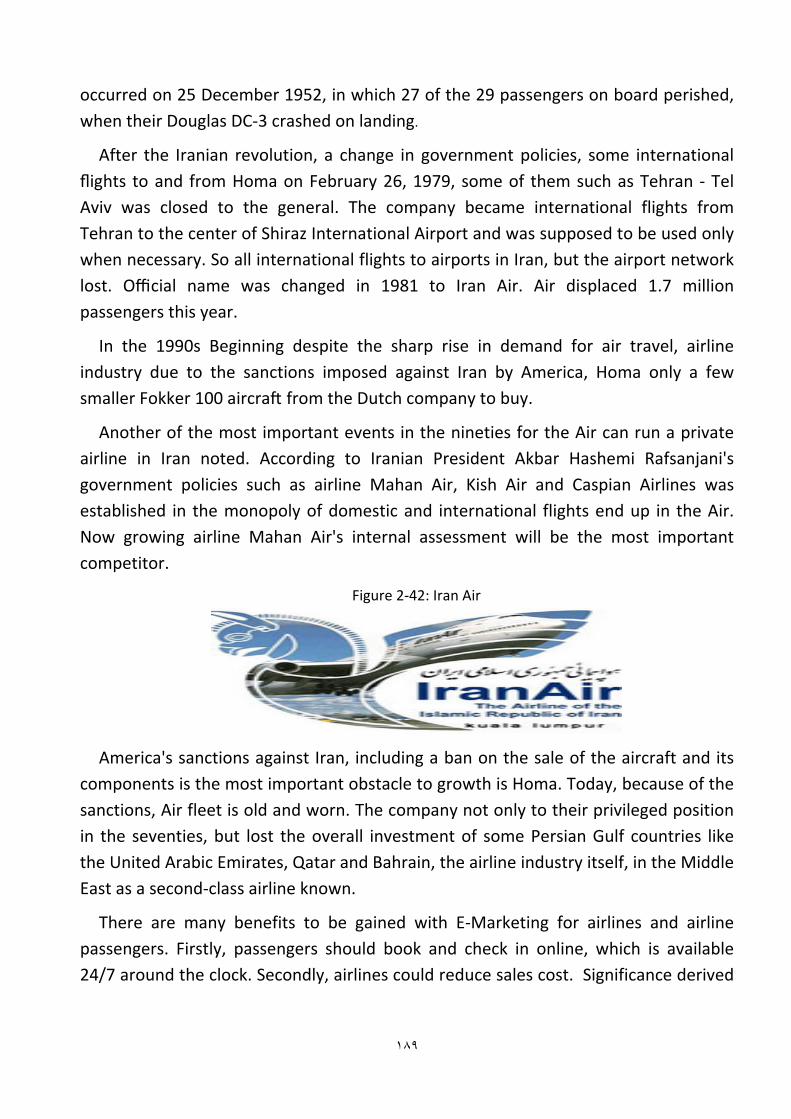
١٨٩
occurred on 25 December 1952, in which 27 of the 29 passengers on board perished, when their Douglas DC‐3 crashed on landing.
After the Iranian revolution, a change in government policies, some international flights to and from Homa on February 26, 1979, some of them such as Tehran ‐ Tel Aviv was closed to the general. The company became international flights from Tehran to the center of Shiraz International Airport and was supposed to be used only when necessary. So all international flights to airports in Iran, but the airport network lost. Official name was changed in 1981 to Iran Air. Air displaced 1.7 million passengers this year.
In the 1990s Beginning despite the sharp rise in demand for air travel, airline industry due to the sanctions imposed against Iran by America, Homa only a few smaller Fokker 100 aircra from the Dutch company to buy.
Another of the most important events in the nineties for the Air can run a private airline in Iran noted. According to Iranian President Akbar Hashemi Rafsanjani's government policies such as airline Mahan Air, Kish Air and Caspian Airlines was established in the monopoly of domestic and international flights end up in the Air. Now growing airline Mahan Air's internal assessment will be the most important competitor.
Figure 2‐42: Iran Air
America's sanctions against Iran, including a ban on the sale of the aircraft and its components is the most important obstacle to growth is Homa. Today, because of the sanctions, Air fleet is old and worn. The company not only to their privileged position in the seventies, but lost the overall investment of some Persian Gulf countries like the United Arabic Emirates, Qatar and Bahrain, the airline industry itself, in the Middle East as a second‐class airline known.
There are many benefits to be gained with E‐Marketing for airlines and airline passengers. Firstly, passengers should book and check in online, which is available 24/7 around the clock. Secondly, airlines could reduce sales cost. Significance derived

١٩٠
from E‐Marketing implementation will allow for new business model, based on the wide availability of information and its direct distribution to end‐customers.
• Directly connect airlines and passengers.
• Support full digital information exchange between airlines and customers, reduced cost of a customer contact.
• Suppress time and place limits.
• Support interactivity and therefore can dynamically adapt to customer behavior.
• To be able to satisfy customers' need, build customer confidence and retention.
• Can be updated in real‐time, therefore always up‐to‐date.
• Enhance airlines competitive advantages over its rivals
• Profitable and sustainable revenue growth
It is hoped that this search will provide information to assist Civil Aviation Authority of Iran Airlines manager and other airlines in Iran to make an informed decision when they consider the application and development of e‐business to airlines industry. On studying the current E‐Marke ng models shown in Figures 1, 2, and 5, and through the literature review, most of the current researches about airline e‐business have the following limitations:
• E‐Marketing strategies are not widely adopted by most airlines.
• Customer' need in today's fast growing e‐business environment are not properly addressed.
• Almost all current models are customer data rich and information poor.
• Severe limitations and weakness in dealing with the challenge for most airlines to sustain and create profits in the face of heavier competition and product homogenization
• Most airlines focus on CSC (Customer Service Centre), but neglect the Customer‐Centric requirements.
It is obvious that it is an urgent need for further research in the application and development of E‐Marketing models to airlines. Iran Air Tour has got appropriate situation between low cost airlines in Iran and customers in international flights. But that doesn’t mean that Iran Air Tours will be a successful company in the future, because by changing the political situation and other threats will be examined for
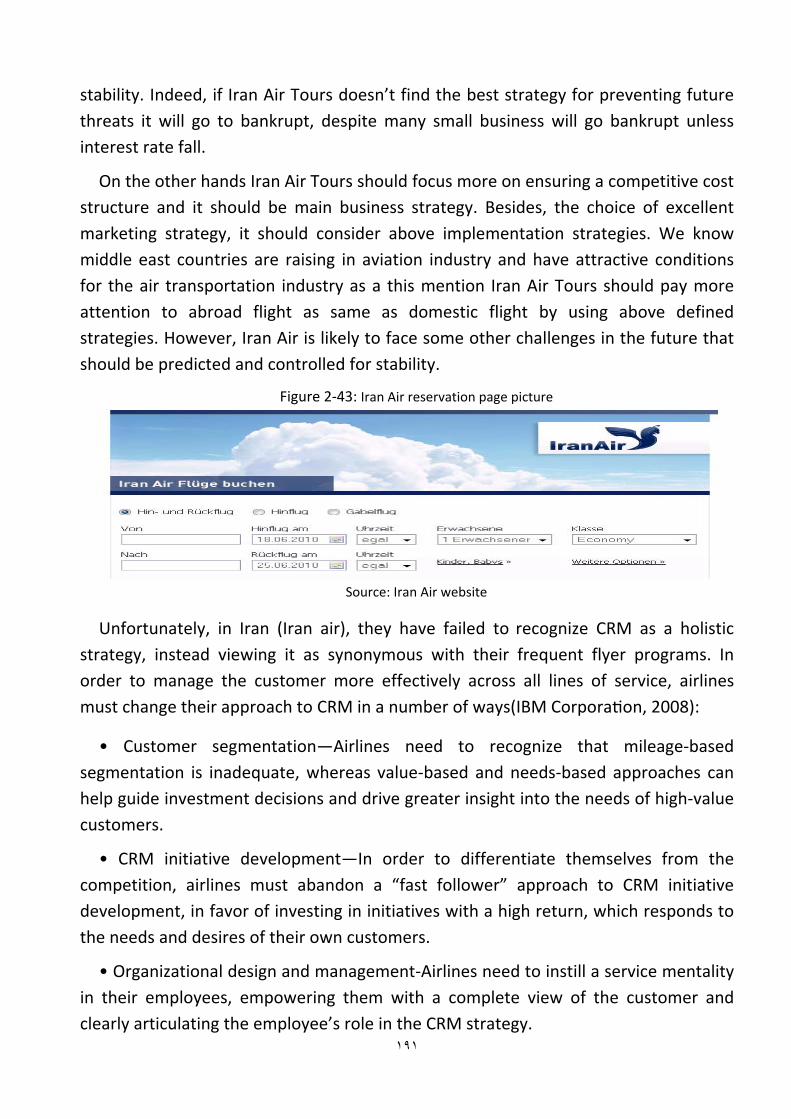
١٩١
stability. Indeed, if Iran Air Tours doesn’t find the best strategy for preventing future threats it will go to bankrupt, despite many small business will go bankrupt unless interest rate fall.
On the other hands Iran Air Tours should focus more on ensuring a competitive cost structure and it should be main business strategy. Besides, the choice of excellent marketing strategy, it should consider above implementation strategies. We know middle east countries are raising in aviation industry and have attractive conditions for the air transportation industry as a this mention Iran Air Tours should pay more attention to abroad flight as same as domestic flight by using above defined strategies. However, Iran Air is likely to face some other challenges in the future that should be predicted and controlled for stability.
Figure 2‐43: Iran Air reservation page picture
Source: Iran Air website
Unfortunately, in Iran (Iran air), they have failed to recognize CRM as a holistic strategy, instead viewing it as synonymous with their frequent flyer programs. In order to manage the customer more effectively across all lines of service, airlines must change their approach to CRM in a number of ways(IBM Corpora on, 2008):
• Customer segmentation—Airlines need to recognize that mileage‐based segmentation is inadequate, whereas value‐based and needs‐based approaches can help guide investment decisions and drive greater insight into the needs of high‐value customers.
• CRM initiative development—In order to differentiate themselves from the competition, airlines must abandon a “fast follower” approach to CRM initiative development, in favor of investing in initiatives with a high return, which responds to the needs and desires of their own customers.
• Organizational design and management‐Airlines need to instill a service mentality in their employees, empowering them with a complete view of the customer and clearly articulating the employee’s role in the CRM strategy.

١٩٢
Figure 2‐44: picture of Iran air facebook
Source: Iran Air facebook
There are two reasons behind low factors of airlines in Iran: one is the fewer application of Information Technology; the other is outdated marketing strategies. For example: there are advanced aircrafts in Iran Air lines such as A‐340, the flight size is same as Iran air in 1999. Passenger transport quan ty is approximately the same, but the revenue per year, revenue per employee is just a fraction of Cathay Pacific's. Comparing IT employees between Iran air and Homa, there are 450 employees in Iran air, only 80 in Homa Airlines.
2‐3‐8‐2‐ Aseman (sky) Airline
Sky in 1980 from the merger of four airlines airline air taxis, Pars Air, Air Service, and Hur went up the sky. Sky Aviation is now the most extensive flight network with emphasis on domestic destination and flights to cities in the country's areas. The sky for better network coverage of their flight, three flights, respectively, in Tehran, Shiraz and Mashhad has been established. Each of the three centers mentioned above, flight crews and maintenance of nests to attract and educate through the power of local professionals, the independence of the daily flights are adequate. Air in 2002 was transferred to the State Pension Fund. This led to the growth and development Frvny the sky than before.
The company's operations consider the important results achieved in this way that it can, including membership in associations such as IATA's prestigious air, ascending rate Passenger, expanding flight network, recruiting and training specialist, nest building and engineering maintenance workshop and received numerous certifications from internationally recognized aviation organizations pointed out. Last Certification obtained in the IOSA IATA, which called for the sky has been. Sky as airlines and other airline's flights to safety before any attention is another indicator,

١٩٣
thus creating a safety management system in free expression. Airline now in heaven with 29 aircra to 45 domes c and 9 foreign countries is a program of regular flights.
Figure 2‐45: Sky website picture
Source: Sky website
Sky Airlines purposes and to serve underserved areas of the country's first attempt to establish a base outside the center (Tehran) and Lhza the position of social and political climate and its relationship with the province and Persian Gulf countries , the southern city of Shiraz, the center was chosen as the base. According to the existing facilities and airports in the province of Fars Province, the construction of four aircraft in America, Canada, France and Italy (Airbus Plant), the world's most modern aircraft and advanced engine Mjhr Jet Prop (with jet propellers) is the selection and purchase of six aircraft and its deployment in Shiraz, which officially began in 1993.
Company credit union employees with the aim of establishing an airline in the sky for small credit institutions and financial services in the form of loans granted to members was formed. In line with the strategic plans of sky airlines, to qualitative and quantitative development of the aviation industry to take action, because there are currently several large banking and monetary systems, the balance of the first companies worldwide to establish companies and financial institutions and their credit has to focus its capital resources and other assets, and attracted dynamic organization.
Also, alongside its main activities in the service and more staff support and development of aviation activities on the welfare of employees such as health care, leisure and travel services, insurance services, installment sales of automobiles and household appliances and computers, as well as education and culture Investment activity in the capital markets has put on its agenda.

١٩٤
2‐3‐8‐3‐ Mahan Air
Mahan Air is one of the private Iranian airline has its main office in Tehran is. The company in 1992 in Kerman , was established. The Charity Molal Mowahedin company is the major shareholder the Mahan Air. Mahan Air flight operations in May 1993 with two aircra and two Topolov 154 Il 76 cargo planes began. Flight routes in the first year of Kerman and Mashhad, Mashhad to Damascus in the internal network and the network was limited to international flights.
The number of passengers transported in 1993 on Route 142 Mahan was a thousand, while the figure in 2005 to 5 / 1 million increase. Currently, on flights to 11 cities within which the flight plan. Mahan Air flights now with plans to establish a third country in Europe has been able successfully to Tehran as a transit point to the international traveler. It Flights to the Far East and Middle East, and exploitation of the potential transfer of transit passengers from Dubai to India and from Europe to the Far East and Indian subcontinent, including the airline's actions.
Mahan Air is considering the future of passenger and cargo transit operations to expand. They added places like Singapore and Manila (Philippines) to the airline's flight network, Mahan Air is now a member of the International Organization for IATA.
2‐4‐ Tourism and internet situation in Germany and Iran
In 2008, there were over 922 million interna onal tourist arrivals, with a growth of 1.9% as compared to 2007. In 2009, interna onal tourists' arrivals fell to 880 million, represen ng a worldwide decline of 4% as compared to 2008. The region most affected was Europe with a 6% decline. The table shows the top 10 most visited countries.
Table 2‐2: top ten international tourism countries
Reference: "UNTWO, 2011
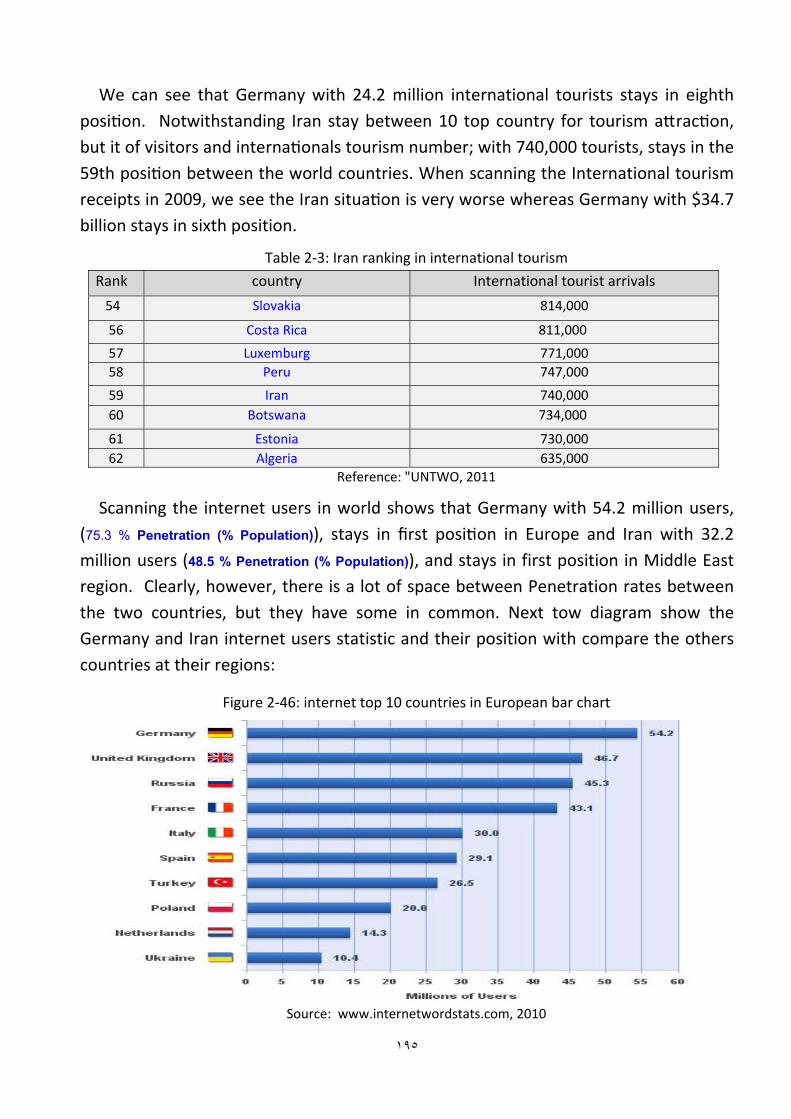
١٩٥
We can see that Germany with 24.2 million international tourists stays in eighth posi on. Notwithstanding Iran stay between 10 top country for tourism attrac on, but it of visitors and interna onals tourism number; with 740,000 tourists, stays in the 59th posi on between the world countries. When scanning the International tourism receipts in 2009, we see the Iran situa on is very worse whereas Germany with $34.7 billion stays in sixth position.
Table 2‐3: Iran ranking in international tourism
Rank country International tourist arrivals
54 Slovakia 814,000
56 Costa Rica 811,000
57 Luxemburg 771,000 58 Peru 747,000
59 Iran 740,000 60 Botswana 734,000
61 Estonia 730,000 62 Algeria 635,000
Reference: "UNTWO, 2011
Scanning the internet users in world shows that Germany with 54.2 million users, (75.3 % Penetration (% Population)), stays in first posi on in Europe and Iran with 32.2 million users (48.5 % Penetration (% Population)), and stays in first position in Middle East region. Clearly, however, there is a lot of space between Penetration rates between the two countries, but they have some in common. Next tow diagram show the Germany and Iran internet users statistic and their position with compare the others countries at their regions:
Figure 2‐46: internet top 10 countries in European bar chart
Source: www.internetwordstats.com, 2010

١٩٦
Figure 2‐47: Middle East countries internet statistic in bar chart
Source: www.internetwordstats.com, 2010
Table 2‐4: Middle East internet usage and population statistic
Source: www.internetwordstats.com, 2010
Of course, there is different in the internet Penetration (% Population) between Iran and Germany. But these difference isn’t deep and they have some in common of application technologies and software's, so study the tourism E‐Marketing strategy in these two countries, can help to understand that “there are same elements and methods for successfully E‐Marketing strategy in tourism industry in different situation or not?”.
Third Chapter
Research Methodology
١٩٨
3‐1‐ Introduction
This chapter outlines the methods used to achieve the aims and objectives of this work. The data collection methods which can be divided into secondary and primary research will be discussed. Afterwards the techniques of analysis will be explained as well as the limitations of the methods used. A method is a tool, a way to solve a problem and reach new knowledge (Holme and Solvang, 1997). Once researcher is comfortable proceeding with a specific focus, the next decision involves selecting overall methodological choices. The methodological choices reported in this study gave researcher guidelines for how researcher should gather needed information for research and work with it. This increased the possibility to receive appropriate answers to research questions and make valuable conclusions.
According to Tull and Hawkins (1984), a number of researchers have found it useful to consider three general categories of research based on the type of information required. These three categories are exploratory, descriptive, and explanatory (causal) research.
Exploratory studies aim for basic knowledge within the problem area. These studies are suitable when a problem is difficult to demarcate and when relevant theory is unclear. Exploratory studies are a valuable means of finding our “what is happening; to seek new insights; to ask questions and to assess phenomena in a new light.” It is a particularly useful approach if the researcher wishes to clarify his/her understanding of a problem. (Saunders and Thornhill, 2000) Exploratory studies are done to better comprehend the nature of the problem since very few studies might have been conducted regarding the phenomena needed to be understood. Thus, exploratory studies are important for obtaining a good grasp of the phenomena of interest and for advancing knowledge through good theory building.
Descriptive research is undertaken in order to ascertain and to be able to describe the characteristics of variables in a situation. For instance, describing a class in terms of percentage of age, sex composition, and age groupings, number of business course taken. The goal of a descriptive study is to describe relevant aspect of the phenomena of interest to the researcher from an individual, organizational, industry, or other perspective. Descriptive studies that present data in a meaningful form thus help to (Sekaran, 1992):

١٩٩
(1) understand the characteris cs of a group in a situa on of interest, (2) aid in thinking systema cally about aspects in a given situa on, (3) offer ideas for further probing and research, and/or (4) help make certain simple decisions (such as how many and what kinds of individuals should be transferred from one department to another). This may be an extension of, or a forerunner to, a piece of exploratory research. It is necessary to have a clear picture of the phenomena on which the researcher wishes to collect data prior to the collection of the data.
Explanatory research emphasizes on studying a situation or a problem in order to explain the relationships between variables. It is useful for studying relations between causes and symptoms. The researcher tries to identify the factors, which together cause a certain phenomena (Li Shi, 2004).
This research is an Applicable‐Exploratory‐ Explanatory research. In fact, we want to gain a deeper understanding of e‐marketing strategy in tourism industry and in this research try to identify (Exploratory) the effective elements to design a Tourism E‐Marketing strategy and categorize (Explanatory) the increasing reach and range of computers into society and tourism industry has both positive and negative effects. However, there are many emerging and effective elements can to address and there are different method to identification and category them, in this research after consider a lot of techniques and methods; the researcher with consultant with the different expert and the supervisor have diced the Delphi method pass better to this research and research's aims and researcher can reach with this method to following adjectives. Moreover, as we stated earlier, the researches on this are scant.
While the Delphi is typically used as a quantitative technique (Rowe & Wright, 1999), a researcher can use qualitative techniques with the Delphi method. Qualitative research is interpretive in the sense that the researcher is interested in how the social world is interpreted, understood and experienced; the researcher is flexible and sensitive to the social context within which the data was collected; and qualitative research is about producing holistic understandings of rich, contextual and detailed data (Mason, 1996). The Delphi method is well suited to rigorously capture qualitative data. It may be seen as a structured process within which one uses qualitative, quantitative or mixed research methods (Hartman, 2009).

٢٠٠
3‐2‐ Aims & Objectives (Research Purpose)
The aim of this paper is to investigate, what the impacts of new technologies, especially of the Internet, are on business travel. It is argued by many authors that it causes dramatic changes in the distribution chain of the tourism sector, leading to a phenomenon called disintermediation of the travel agents. It will be analyzed, if this situation is also applicable to the business in tourism area. This research also seek to identify elements which effect tourism e‐marketing strategy to react and more attend on these elements in order to design a applicable strategy about e‐marketing remain in the competitive market. So the main question of this work is “What are the effective elements on E‐marketing Strategy in tourism industry in Germany and Iran?” In other word “Which elements affect the e‐marketing strategy in tourism industry?” and we can reformulate it in other ways like: “Which elements playing key role in successfully an e‐marketing strategy in tourism industry have to consider during the design a strategy?” For this important, researcher considers three importance part of tourism industry; Airlines, Tour Operators and chain Hotels. To find an answer to this question, the following sub‐questions will be treated:
• What are the Environmental effective elements on Tourism E‐Marketing Strategy in Germany and Iran?
• What are the Companies elements (structure, management, employer, Software …) on T.E.M.S in Iran and Germany?
• What are the Effective elements from Customers (tourists) satisfaction on T.E.M.S in Iran and Germany?
• What is the important of each of the elements in each category and in whole?
3‐3‐ Research Strategy We now turn to the research strategies we may employ. As Yin states, there are a
number of approaches for a researcher to conduct social science research. What matters are not the label that is attached to a particular strategy, but whether it is appropriate for our particular research questions and objectives (Saunders and Thornhill, 2000). Depending on the character of research questions, to which extent the researcher has control over actual behavioral events and to what degree the focus is on contemporary events, the researcher can choose between an experiment, a survey, history, an analysis of archival records and a case study.

٢٠١
When we are looking to study about futures or specialty subjects, the collecting and considering experts views and opinions is one of the best strategies. For this research purpose, this strategy is ruled out. History is also ruled out, as the lack of focus on contemporary events with this method of data collection is not how this study is designed. This strategy is favored when the research goal is to describe the incidence or prevalence of a phenomenon as well as when the goal is to predict certain outcomes. This leaves us one better‐suited strategy for this research—case study. Yin (1994) states that a case study approach is best used as a method for gathering data when a “What” or “How” question is being asked about a contemporary set of events over which the researchers has little if any control.
Yin continues that a case study approach helps investigators to refine their data collection plans with respect to both the contents of the data and the procedures to be followed (in collecting that data). As concluded by Yin, a qualitative, case study approach has a distinct advantage when a how or what question is being asked about a feature set of events over which the investigator has little or no control (Li Shi, 2004). Researcher thought that adopting case studies would be the best way to conduct our research and select Germany and Iran as case study. In addition, research focuses on three important part of tourism industry (Airlines, Tour Operators and Chain Hotels) not all the tourism industry.
Multiple‐case choice: According to Yin (1989), a primary distinction in designing case studies is between single‐and multiple‐case designs. This means the need for a decision, prior to any data collection, on whether a single‐case study or multiple cases are going to be used to address the research questions. When making a single case study the investigators have no possibilities to make comparisons or generalize. Multiple case studies on the other hand give the researchers the opportunity to compare. The evidence from multiple cases is often considered more compelling, and the overall study is therefore regarded as being more robust. For our research, researcher selected multiple case studies not only for adding to the confidence and validity of the findings, but also for finding out possible similarities and dissimilarities between cases.
3‐4‐ Case study According to Lumpkin et al. (2002), Internet technology is changing the way many
firms do business. The most profound changes are not being seen at dot‐com start‐ups, but at incumbent firms that are being transformed into e‐businesses. These

٢٠٢
changes are forcing them to craft new strategies to sustain their competitive advantages. Furthermore, Porter claims that established companies will be the most successful when they deploy Internet technology to reconfigure traditional activities (Porter, 2001). Moreover, as matter of fact, researcher believes that three segment of tourism industry (Airlines, Tour Operators and Chain Hotels) study can be enough and useful. Because study and consider all the tourism industry needs a lot of time, finance capital and expert employer that is out of the ability a PhD research and researcher; these three segments are also the targets for this research purpose.
Many companies have used E‐Marketing as the interface to streamline their business process with their business partners. Internet has made conducting business over the Internet much more popular, since it is low cost and ease to apply. Besides these reasons, the strong impact on tourists interacting with companies is also the main reason for the popularity of Internet. Therefore, those companies, who have applied Internet technology in their value chain activities, and enhanced interface of interacting with their customers. As researcher has found that many touristic companies in Germany and Iran have monopoly situation in tourist industry market, and there are only very few bigger players in the same tourism industry section category. However, by looking at Airlines, tour operator and chain hotels industry, in fact, there is more competition among them.
Payne speaks out in 1993 that, during the 1980s, the strategic relevance of positioning started to become recognized amongst leading service organizations. Service companies are now identifying their key market segments and then determining how they wish consumers to perceive their company and its products and services. Although it has broad applicability to services, it is more useful to develop value chains that specifically reflect the tasks within a particular service sector. A further question researcher encounter has to do with the number of cases deemed necessary or sufficient for our study. Instead, the researcher should think of this decision as a reflection of the number of case replications‐both literal and theoretical‐that he/she would like to have in the study.
In addition, the purpose of our study is to get understanding of the research problem researcher proposed; the analytical generalization is not our intention for this study. Moreover, the practical issue must be taken into account‐time limitation. Therefore, researcher selected two Airlines, four chain hotels, four tour operators and four university professors from each of two countries (Germany and Iran). It was the aim of this research to find out the experts point of view about Internet effective
٢٠٣
elements for tourism e‐marketing strategy. In total, a number four tourism e‐marketing or e‐Tourism Professor, 2 Airlines, four Tour Operators and four Chain Hotels (their e‐marketing or e‐commerce manager or experts) in each country of Germany and Iran will be consider. The reasons of the selection these three segments of tourism industry are that:
• Airlines;
• Tour Operators,
• Chain Hotels
According to the convenience principle of sample selection and research aims, the cases will be drawn within Germany and Iran. The reason why researcher is concentrating on tourism Industry in Germany and Iran is that both them have good potential for tourism and E‐Marketing. Germany is a popular travel destination and among the Top three in this segment in most European countries. Germany as development country In It and e‐device with and with more than 24.2 million foreign visitors and 54.2 million‐internet user is one of the top destinations in Europe of Touris c and ICTs development view. In Other site, Iran with 32.2 million internet users is first country in Middle East and it's also one of top 10 touris c destinations of touristic attraction. Therefore study this two countries can give good view about research subject and also, the result can be useful for both country, especial for Iran and Germany.
3‐5‐ Research method
Qualitative and quantitative methods, as two paradigms, are not simply different ways of doing the same thing. Instead, they have different strengths and logics and are often best used to address different questions and purposes. Both qualitative and quantitative approaches are aimed at creating a better understanding of the society and to comprehend how individuals, groups and institutions act and have an influence on each other. According to Yin (1994) the best approach to use for a study depends on the purpose of the study and the accompanying research questions.
A qualitative study is designed to be consistent with the assumptions of a qualitative paradigm. The qualitative study is defined as an inquiry process of understanding a social or human problem, based on building a complex, holistic picture, formed with words, reporting detailed views of informants, and conducted in a natural setting (Creswell, 1994). The qualitative studies tend to be more flexible,

٢٠٤
while the quantitative ones are more structured. For qualitative studies the research problem needs to be explored because little information exists on the topic. The variables are largely known, and the researcher wants to focus on the context that may shape the understanding of the phenomenon being studied. In many qualitative studies, a theory base does not guide the study because those available are inadequate, incomplete, or simply missing (Creswell, 1994).
A quantitative study, consistent with the quantitative paradigm, is an inquiry into a social or human problem, based on testing a theory composed of variables, measured with numbers, and analyzed with statistical procedures, in order to determine whether the predictive generalizations of the theory hold true (Creswell, 1994). Quan ta ve research is most o en used in studies with clearly stated hypotheses that can be tested. This deductive path makes a distinction between science and personal experience and tends to concentrate more on description, explanation, generalization, and abstraction. It focuses on well‐defined, narrow studies. Quantitative research strives to use a consistent and logical approach toward what is being investigated and uses statistical inferences and mathematical techniques for processing the data (Foster, 1998).
The nature of the problem is an important factor to decide on better‐suited approach. Based on our purpose and research questions, as well as the above discussion, the procedure we have chosen is of a qualitative nature, and we consider qualitative approach can help us gain a deeper understanding of how the value chain can be described in a company pursuing a differentiation strategy under the influence of the Internet.
As explained before, the research purpose is exploratory and also explanatory. In fact, we want to gain a deeper understanding of e‐marketing strategy effective elements in tourism industry, special in Airlines, Tour operators and Chain Hotels in Iran and Germany. Moreover, as we stated earlier, the researches on this are scant. For the purpose of this research due to the nature of the research, which is Explanatory ‐exploratory‐applicable; after studying and consulting, Delphi technique has been chosen as the best technique for introducing the effective elements on E.M.S.T. Delphi’s aim is to illustrate real understanding of the subject. And for ranking the element, researcher uses the AHP. In these researches like many other researches, in pursuant to the research stages, different techniques may use for collecting data, such as below:

٢٠٥
1. library source 2. Interviewing: 3. Observations: 4. Questionnaire:
Library source contains the study of books, papers, scientific research, models of researches, historical background of tourism, marketing, tourism statistics and e‐marketing infrastructure conditions in Germany and Iran. In order to study strategies document related to marketing and e‐marketing, executive programming for marketing and e‐marketing strategies, hotels and agencies of tourism, tourism institutions and marketing and official document in Germany and Iran, library source has been used. Furthermore, an interview was conducted with one of the major business travel organizers in order to find out their point of view with respect to the Internet ‐ if it was seen more as a threat or more as an opportunity for the future and if they had already realized some changes in the tourist's behavior.
The original objectives and design of the case study presumably were based on
such propositions, which in turn reflected a set of research questions, reviews of the
literature, and new insights. Developing a case description is the second general
analytic strategy. The strategy is less preferable than the use of theoretical
propositions but serves as an alternative when theoretical propositions are absent.
Typically, researcher reviewed different research methods (both qualitative and
quantitative) and after considering the pros and cons of each, we select the most
promising method(s) to help answer research question. The researcher would select
the Delphi method when he wants to collect the judgments of experts in a group
decision making setting. Both qualitative and quantitative methods can be used in
the Delphi process.
The analysis will conduct in several stages pursuant to the research stages. In
stage one, researcher, after study the library documents, get the important scientific
points and experience to procurement the research literature. In third stage for
introducing the effective elements on E.M.S.T in Germany and Iran and analysis
those, researcher will use Delphi method and expert views. In stage five, for the
Characterize identified elements Priority, will use AHP.

٢٠٦
3‐5‐1‐ Sample Selection
To answer our research problem, which is how the value chain can be described in a company pursuing a differentiation strategy under the influence of the Internet, researcher has drawn our cases according to the following frame. There are four requirements for “expertise” (Adler & Ziglio, 1996):
i) Knowledge and experience with the issues under investigation;
ii) Capacity and willingness to participate;
iii) Sufficient time to participate in the Delphi; and,
iv) Effective communication skills
Since expert opinion is sought, a purposive sample is necessary where people are selected not to represent the general population, rather their expert ability to answer the research questions (Fink & Kosecoff, 1985).
In this research each case have carefully selected so that it either predicts similar results (literal replication) or produces contrary results but for predictable reasons and the can be good sample of tourism industry in Germany and Iran. Germany as development country and Iran as developing country with many touristic attraction are good case for study e‐marketing More than, with analyze them; researcher can reach to research objectives. They also have to be good sample for companies that they use e‐marketing. According mentioned reasons, research consider e‐marketing strategy in three section of tourism industry in Iran and Germany as; Airlines, Tour operators and Chain Hotels; and researcher narrow down the study based on three factors:
1. environmental opportunities and threat (Economical; Political & Legal; Social & Cultural; Technological & Hardware)
2. Companies strengths and weaknesses (Scientifically & Software, structure, management, employer…)
3. Customers (tourists) satisfaction and expects views (price, accessibility, easy use and booking, ay system…)
As this research is according the Delphi method, the research sample is include experts, which identified with researcher. The experts have to have special characters such as:

٢٠٧
1. Who has Studied Tourism Marketing or E‐Tourism, 2. Who are working in Tourism Marketing or E‐Tourism field, 3. Have experience or studied in Tourism E‐Commerce area, 4. Have experience and knowledge about Strategy design or is one of strategy
design committee in company which he works, 5. Who Has Professor or PhD degree and teach in university in tourism
marketing or e‐tourism area, 6. Who Works in one of the following tourism sectors
More than, they have selected according research method and cases from marketing managers in three tourism value chain main players (Airlines, Tour Operators and Chain Hotels) from Germany and Iran.
3‐5‐2‐ Data collecting methods
Seven sources of evidence can be the focus of data collection for case studies: documentation, archival records, interviews, direct observations, participant‐observation, physical artifacts and Questionnaire.
3‐5‐3‐ Secondary Research Secondary data are “data which already exist and which were collected for some
other (primary) purpose but which can be used a second time in the current project” [Veal 1997]. In order to review all literature and data found, an exploratory approach was used. This approach is more concentrated and tries to find existing research which could throw light on particular research issues. The libraries of Trier University of Germany, libraries of Universities of Iran and Germany and related companies web pages and brushers were used as well as the internet such as ….and related journals.
For this research the following sources of secondary data were used:
• Statistical data from the UNWTO and other research centers.
• Other surveys from different organizations in the tourism industry.
• Articles and publications on the topic of the impact of IT on tourism.
• Proceedings of Conferences on information technology.
It was tried to find as much literature as possible about the Internet and its impact on the travel e‐marketing strategy and tourisms' sectors. This made it possible to get

٢٠٨
an overview on the important impact of the Internet on travel and tourism. The result was that quite a lot of literature exists about the impact of Internet, or effective elements, on tourism, but there is less information, and hence clarity about its special impacts on business travels' Strategies. For this reason, it was decided to first find out the major elements of IT on Airlines, tour operators and chain hotels in general and then, to apply these facts to business travel and compare this result with what has already been written about it.
3‐5‐4‐ Primary Research
For the primary research a qualitative method was used which is an “unstructured form of data collection by both interviewing and observation, and employing verbal descriptions and explanations rather than quantitative measurement and statistical analysis” [Johns & Lee‐Ross, 1998]. It can be used in situations where formal quantitative research is not necessary or possible, but normally qualitative methods are used as a theoretical ground. A lot of qualitative research is based on the idea that it is better that people describe and analyze their own experiences and feelings, than if they only answer questions the researcher thinks are important [Veal, 1997].
Therefore, and in order to add to the little information found in the literature about the effective elements on tourism e‐marketing strategy, it was decided to conduct several interviews with randomly selected companies undertaking business trips. These semi‐structured interviews were held with the person responsible for the organization of e‐marketing strategy, which in most of the cases was a marketing manager or management.
3‐5‐5‐ Data Analyzing Techniques Data analysis consists of examining, categorizing, tabulating, or otherwise
recombining the evidence, to address the initial propositions of a study. Yin (1989) states that there are two general strategies that help an investigator to choose among different techniques and to complete the analytic phase of the research successfully, i.e. relying on theoretical propositions and developing a case description. The former is the first and more preferred strategy, and it follows the theoretical proposition that led to the case study.
Within such a strategy, three dominant analytic techniques should be used: pattern‐matching, explanation‐building, and time‐series analysis. Yin addresses in his book (1989) that, for a case‐study analysis, one of the most desirable strategies is
٢٠٩
the use of a pattern‐matching logic. Such logic compares an empirically based pattern with a predicted one. If the patterns coincide, the results can help a case study to strengthen its internal validity. In writing about qualitative data analysis, Miles and Huberman (1994) define that analysis is consisting of three concurrent flows of activity: data reduction, data display, and conclusion drawing/verification.
3‐5‐6‐ Data Reduction It refers to the process of Selecting, Focusing, Simplifying, Abstracting, and
Transforming the data that appear in written‐up field notes or transcriptions. As data collection proceeds, further episodes of data reduction occur (writing summaries, coding, teasing out themes, making clusters, making partitions, writing memos). Data reduction is a form of analysis that sharpens sorts, focuses, discards, and organizes data in such a way that “final” conclusions can be drawn and verified.
3‐5‐7‐ Data Display Data display is the second major flow of analysis. Miles and Huber man (1994)
explain that, generically, a display is an organized, compressed assembly of information that permits conclusion drawing and action. The better displays are a major avenue to valid qualitative analysis. The displays include many types of matrices, graphs, charts, and networks. Looking at displays helps us to understand what is happening and to do something—either analyze further or take action—based on that understanding.
3‐5‐8‐ Conclusion Drawing and Verification The third steam of analysis activity is conclusion drawing and verification. From
the start of data collection, the qualitative analyst is beginning to decide what things mean—is noting regularities, patterns, explanations, possible configurations, causal flows, and propositions. The competent researcher holds these conclusions lightly, maintaining openness and skepticism (Miles and Huber man, 1994).
Researcher in this study follows these three steps in order to analyze the empirical data. Researcher uses the case analysis. The empirical data will be reduced through a case analysis. Further, the data will be displayed through a case analysis where the cases will be compared against one another. Researcher believes that aforementioned strategy and flows of data analysis will guide us through the

٢١٠
empirical study for this research. Consequently, our conclusion can be drawn on basis of data analysis.
3‐6‐ The Delphi method
In order to deal with the complexity of decision making problems with many criteria, some methods to support it can be used. These methods aim to clarify the decision‐making process, assisting and guiding the decision maker (or makers) regarding structure, evaluation and alternatives of the problem (Gomes, Gomes and Almeida, 2006). Tourism and IT researchers have also used the Delphi method. For example, the Delphi method has been used to select IS projects (Peffers & Tuunanen, 2005), specify IS project requirements (Perez & Schueler, 1982), to determine the criteria and effective elements for IS prototyping decisions (Doke & Swanson, 1995), rank technology management issues in new product development projects (Scott, 2000), and to develop a descrip ve framework of knowledge manipula on ac vi es (Holsapple & Joshi, 2002). The Delphi method was used at the In SITE 2005 conference to iden fy topics that should be in an IT curriculum (Lunt et al., 2005).
Selecting, implementing and using an E‐Marketing infrastructure are a critical process for organizations to achieve their organizational goals. This task is complicated when goals and priorities change. A flexible E‐Marketing infrastructure is therefore desirable. One researcher used the Delphi method to identify the characteristics and metrics of a flexible IT infrastructure.
Researchers have used the Delphi to identify E‐marketing strategy effective elements in tourism industry in Iran and Germany. In the first study, the focus was on developing a list of common effective elements in three settings: Airlines, Tour operators and the Chain Hotels. In the second section, the researchers investigated the differences of opinion regarding Iran and Germany Tourism development Strategy design and implementation. In the Schmidt study, participants from all three tourism segments to identify effective elements. In the subsequent rounds, they were divided according to their country. In the second round, they pared down the list, and in the final round, they ranked the elements. This study was extended by using the Delphi method (three rounds) and analysis.
The Delphi method has been used on different occasions in Tourism research. There is also wide variance in the sample size. Both heterogeneous and

٢١١
homogeneous samples were used. The degree of expertise of the sample also varied. Some studies began with a predetermined list to rank and rate, while others generated the initial list through brainstorming. However, three round Delphi's appear to be favored. While it is a flexible method, it has not seen the degree of use as the survey method. Delphi can be an effective and efficient method appropriate for some Tourism research if rigorous design considerations are followed and implemented (Hartman, 2009).
We see similar flexibility in the way the Delphi method was used in doctoral and masters research projects as before. Oddly, however, there are few research projects that have used the Delphi method identified in the literature review. There are notable recent exceptions including:
• Identifying the critical success factors for ERP implementation projects (Carson, 2005); • Developing a model of how technologies are developing and how they may fit
with an organiza onal strategy (Gerdsri, 2005); • Identifying the criteria for measuring knowledge management efforts
(Anantatmula, 2004); and, • Identifying why the strategies for a Defense Department IT project succeeded or
failed (Birdsall, 2004).
The Delphi method was originally developed in the 50s by the RAND Corpora on in Santa Monica, California. This approach consists of a survey conducted in two or more rounds and provides the participants in the second round with the results of the first so that they can alter the original assessments if they want to ‐ or stick to their previous opinion. Nobody ‘looses face’ because the survey is done anonymously using a questionnaire (the first Delphi's were panels). It is commonly assumed that the method makes better use of group interac on (Rowe et al. 1991, Hkder/Hkder 1995) whereby the questionnaire is the medium of interaction (Mar no 1983). The Delphi method is especially useful for long‐range forecasting (20‐30 years), as expert opinions are the only source of informa on available. Meanwhile, the communication effect of Delphi studies and therefore the value of the process as such are also acknowledged (Gordon, 2004).
During the last ten years, the Delphi method was used more often especially for national science and technology foresight. Some modifications and methodological improvements' have been made, meanwhile. Nevertheless, one has to be aware of the strengths and weaknesses of the method so that it cannot be applied in every
٢١٢
case. Thus, Delphi studies were mainly applied in science, technology and education contexts, but one can think of different occasions. Rowe and Wright (1999) characterize the classical Delphi method by four key features:
1. Anonymity of Delphi par cipants: allows the par cipants to freely express their opinions without undue social pressures to conform from others in the group. Decisions are evaluated on their merit, rather than who has proposed the idea.
2. Itera on: allows the par cipants to refine their views in light of the progress of the group’s work from round to round.
3. Controlled feedback: informs the participants of the other participant’s perspectives, and pro‐vides the opportunity for Delphi participants to clarify or change their views.
4. Sta s cal aggrega on of group response: allows for a quan ta ve analysis and interpretation of data.
The Delphi method is an iterative process used to collect and distill the judgments of experts using a series of questionnaires interspersed with feedback. The questionnaires are designed to focus on problems, opportunities, solutions, or forecasts. Each subsequent questionnaire is developed based on the results of the previous questionnaire. The process stops when the research question is answered: for example, when consensus is reached, theoretical saturation is achieved, or when sufficient information has been exchanged (Hartmann, 2009). The Delphi method has its origins in the American business community, and it has since been widely accepted throughout the world in many industry sectors including health care, defense, business, Tourism, education, information technology, transportation and engineering.
The Delphi method’s flexibility is evident in how it has been used. It is a method for structuring a group communication process to facilitate group problem solving and to structure models (Linstone & Turloff, 1975). The method can also be used as a judgment, decision‐aiding or fore‐casting tool (Rowe & Wright, 1999), and can be applied to program planning and administration (Delbeq, Van de Ven, & Gustafson, 1975). The Delphi method can be used when there is incomplete knowledge about a problem or phenomena (Delbeq et al., 1975). The method can be applied to problems that do not lend themselves to precise analytical techniques but rather could benefit from the subjective judgments of individuals on a collective basis

٢١٣
(Adler & Ziglio, 1996) and to focus their collective human intelligence on the problem at hand (Linstone & Turloff, 1975). Also, the Delphi is used to investigate what does not yet exist (Czinkota & Ronkainen, 1997; Halal, Kull, & Leffmann, 1997; Skulmoski & Hartman 2002). The Delphi method is a mature and a very adaptable research method used in many research arenas by researchers across the globe.
3‐6‐1‐ History of the Method
The modern renaissance of futures research began with the Delphi technique at
RAND, the Santa Monica, California, "think tank" in the early 1960s. The ques ons of
RAND thinkers, at the time, primarily dealt with the military potential of future
technology and potential political issues and their resolution. The forecasting
approaches that could be used in such applications were quite limited and included
simulation gaming (individuals acting out the parts of nations or political factions)
and genius forecasting. Quantitative simulation modeling was quite primitive, and
computers that would ultimately make such quantitative techniques practical, were
not yet capable enough (Gordon, 2004).
This general approach has been used thousands of times since the first published
Delphi study, Report on a Long‐Range Forecast by Gordon and Helmer. This RAND
"best seller," published in 1964, contained forecasts of scien fic and technological
breakthroughs through 2000 and beyond; the 82 panelists who contributed included
Isaac Asimov, Arthur Clarke, Bertrand de Jouvenel, Ithiel de Sola Pool, Dennis Gabor,
Peter Goldmark, Harold Guetzkow, and William Pickering, to name a few (Helmer
and Gordon, 1964) .
The method con nues to be used extensively. In September of 2008, a review was
made of the Scopus data base (which includes ar cles from 15,000 peer‐reviewed
professional journals from 4,000 publishers, proceedings papers, and trade
publica ons) and 105 publica ons were iden fied in response to the search terms
“Delphi study” (Gordon, 2004). By far, the largest field of study which employed the
method was health sciences.
3‐6‐2‐ Delphi Process Prescott & Soeken (1989) argue that A review of the literature is also conducted,
among other things, to determine if a theoretical gap exists. Often pilot studies are undertaken for numerous reasons:

٢١٤
i. Identify the problem, ii. Conceptualize the study, iii. Design the study, iv. Develop the sample, v. Refine the research instrument, and, vi. Develop and test data analysis techniques ().
Since the aim of this research is Identification the e‐marketing Strategy effective elements as problem; is that the reason the Delphi method can suitable method for this importance be. The Delphi process has been comprehensively reviewed elsewhere (Adler & Ziglio, 1996; Delbeq et al., 1975; Linstone & Turloff, 1975), and so researcher present only a brief overview of how can use the Delphi in research projects (Figure 3‐1).
Figure 3‐1: Three Round Delphi Process
Resource: Adler & Ziglio, 1996
1) Develop the Research Ques on ‐ The research question is derived by a number of ways. For example, it might be co‐developed by the student with the help of the supervisor, or the researcher’s own industry experience often contributes to his interest in the research area.
2) Design the Research ‐ After developing a feasible research question, have to begin designing the research from a macro to a micro perspective.
3) Research Sample ‐ Selecting research participants is a critical component of Delphi research since it is their expert opinions upon which the output of the Delphi is based (Ashton 1986; Bolger & Wright 1994).
The process for each type of Delphi is essentially the same; however, the purpose of a study determines the type of Delphi used. The Delphi's process is similar to the nominal group technique (NGT), except Delphi does not require the physical

٢١٥
presence of group members. An interaction process still takes place between the members of the group (Delphi panel) and the researcher, with the researcher acting as a facilitator. Scheele (1975) illustrated a process where the opinions and judgments of people familiar with or associated with a subject and they listed a typical sequence of events in the Delphi process in six steps. According to Issac and Michael (1981, p.115) the Delphi process has six steps:
1. Identify the group members whose consensus opinions are sought. If the study goes beyond an intact group such that representatives must be selected, care must be taken to insure that all the various publics or positions are proportionately sampled. 2. Questionnaire One: Have each member generate a list of goals, concerns, or
issues toward which consensus opinions are desired. Edit the results to a manageable summary of items presented in random order. Prepare the Second questionnaire in an appropriate format for rating or ranking (Note: If an established or acceptable listing of such items already exists, this first step can be bypassed.). 3. Questionnaire Two: Have each member rate or rank the resulting items. 4. Questionnaire Three: Present the results of Questionnaire Two in the form of
Questionnaire Three, showing the preliminary level of group consensus to each item. Where the individual differs substantially from the group, and chooses to remain so on Questionnaire Three, the respondent should provide a brief reason or explanation.
In this research, as mentioned before, due to pursuant nature of the research,
after considering all necessary point, researcher constitute two Delphi groups
separately in Iran and Germany from Tourism e‐marketing strategy expert. In this
research it will be trying that the members of Delphi group in Iran and Germany to
be chosen from related experts and stakeholders (related specialist), so their views
about e‐marketing in tourism and also effective Elements can be studied accurately
and therefore research and researcher will achieve the view from the entire tourism
industry main player.
Approximately 20 disserta ons and twelve theses that used the Delphi method
were examined (See Appendix). Beginning with the initial Delphi question(s) in round
1, they can be either broad or narrow. Many (Alexander, 2004; Chris an, 2003;
Good, 1998) began with open ques ons in round 1 while some (Ayers, 1985; Friend,

٢١٦
2001; Menix, 1997) used narrow questions that focused on literature derived
content.
Regarding the subject, aims and the method of research (Delphi), in order to study
all aspects and to prevent the effective elements on E.M.S.T not be hidden, the
population will be chosen among experienced expert in E.M.S.T. This population who
can be the members of Delphi group will be introducing between different kinds of
experts as follow:
a) Airline Managers or Marketing managers in Iran and Germany.
b) Change hotels managers or marketing managers in Iran and Germany
c) Tour Operator managers or marketing managers in Iran and Germany
d) Tourism professor or Doctors who are teaching in the University in tourism in
Iran and Germany
In this research, it has been trying to choose successful companies in E‐Marketing
and tourism industry in Germany and Iran. People from each group will be chosen as
a Delphi member from Germany and Iran. At least 3 members from each group will
be asked to collect information and views.
If the number of experts, relative to the subject be less than the expectation, then
the whole population will be considered. On the other hand, according to the
literature of the Delphi method and AHP technique, experts' view would be enough.
So in this case statistical sample and statistical decision theory may not be applicable
(Lia & Yoon, 1981). Since in this research the number of experts in the field of e‐
marketing strategies may be less, so studying all views may be happen, then the size
of sample will be considered equal to the size of population.
4) Develop Delphi Rounds Ques onnaires and the effective elements on E.M.S.T
in Germany and Iran ‐ According to (Blind & Cuhls 59:2001) nobody knows how will
be the future. But it is possible to determine some of the possibilities for growth;
discuss about them and think about remedies that change them in to truth or if
necessary stop them to emerge.
Care and attention needs to be devoted to developing the initial broad question which is the focus of the Delphi because if respondents do not understand the question, they may provide inappropriate answers and/or become frustrated (Delbeq et al., 1975). Sometimes, the purpose of the first round Delphi is to

٢١٧
brainstorm (R. Schmidt, 1997). This research will contain 5 Ques oners. The first is open Questioner and others are closed. In This stage, with the views of experts (members of two Delphi groups) effective elements on tourism e‐marketing strategy would be identified in four different categories as below:
A. Introducing Customers (tourists) satisfaction and expects views (price, accessibility, easy use and booking, ay system…) and effective elements of E‐Marketing strategy in tourism industry for Iran and Germany (customers analyze).
B. Introducing Companies strengths and weaknesses (Scientifically & Software, structure, management, employer…) effective elements (Competition analyze), of E‐Marketing strategy in tourism industry for Iran and Germany.
C. Introducing Special Effective elements in your section (chain hotel, tour operator or airline), of tourism E‐Marketing strategy in Germany and Iran.
D. Introducing environmental opportunities and threat (Economical; Political & Legal; Social & Cultural; Technological & Hardware) of E‐Marketing strategy in tourism industry for Iran and Germany.
In this stage, in order to identify effective elements on T.E.M.S in each four bunch,
the responsible person who is the researcher too, will send the open questionnaire
for both the knowledgeable people of Delphi group in Iran and Germany. Questions
should be completely relative to the effective elements in tourism e‐marketing
strategy.
5) Delphi Pilot Study ‐ A pilot study is sometimes conducted with the goals of testing and adjusting the Delphi questionnaire to improve comprehension, and to work out any procedural problems. The researcher may also pre‐test each subsequent questionnaire.
6) Release and Analyze Rounds Questionnaires‐ The questionnaires are distributed to the Delphi participants, who complete and return them to the researcher. The results of Rounds are then analyzed according to the research paradigm (e.g. qualitative coding or statistical summarizing into medians plus upper and lower quartiles). Reality Maps can also be developed and shared with the Delphi participants. Reality Maps are graphical representations of the key constructs under investigation. They depict reality from the participant’s perspective and often illustrate interactions, causes and effects, process flow, and other aspects of their reality. Reality Maps can greatly improve understanding and facilitate the

٢١٨
emergence of collective intelligence in subsequent rounds about the topic under investigation (Lindstone & Turloff, 1975).
7) Verify, Generalize and Document Research Results ‐ The Delphi results are verified (usually continuously through the Delphi) and the extent the results can be generalized are also investigated. For this PhD research conducted in our program, the Delphi results are often extended with a subsequent research phase such as interviews or surveys.
3‐6‐3‐ Difficulty of Research A team of researchers to identify the principle legal issues facing the computer
forensics discipline within the Australian context (Brungs & Jamieson, 2005) used the Delphi method. A difficulty with this type of research is that there so few recognized experts in this field.
As with any research, methodological rigor is a cornerstone of “good” research: sloppy research produces sloppy results. Rigor is critical to both quantitative (Creswell, 1994; Fowler, 1993) and qualita ve research. Rigor is improved when the researcher leaves an audit trail (Sadleowski, 1986). This is a clear decision trail of all key theoretical, methodological and analytical decisions made in the research from beginning to end (Koch, 1994).
3‐6‐4‐ Number of Participants
A crucial aspect of conducting a successful Delphi study is the selection of the
respondents. Most studies use panels of 15 to 35 people, although in some
applications hundreds, even thousands of respondents have been involved. The
length of the invitation list should anticipate an acceptance rate of between 35 and
75 percent. Dalkey, Rourke, Lewis & Snyder (1972) reported a definite and
monolithic increase in the reliability of group responses with increasing group size.
Reliability, with a correla on coefficient approaching .9, was found with a group size
of 13. Van de Ven & Gustafson (1975) suggest using the minimally sufficient number
of respondents. Following these recommendations, a panel of 15 experts from each
of the Germany and Iran countries were selected for the Delphi study conducted in
the research project. A practical consideration facing the researcher is the sample
size. While there are no hard and fast rules, a number of factors should be
considered:
٢١٩
• Heterogeneous or homogeneous sample: where the group is homogeneous, then a smaller sample of between ten to fifteen people may yield sufficient results. However, if disparate groups are involved (e.g. an international study), then a larger sample will likely be required and several hundred people might participate (Delbeq et al., 1975). Heterogeneous groups can greatly increase the complexity and difficulty of collecting data, reaching consensus, conducting analysis, and verifying results.
• Internal or external verification: the larger the group, the more convincingly the results can be said to be verified. However, a smaller sample might be used, with results verification con‐ducted with follow‐up research. For master theses, often a single Delphi study will often suffice; however, for a PhD dissertation, the Delphi is usually verified with a follow up study (e.g. interviews or survey).
There is a wide range in the sample size in these Delphi studies Only three Delphi participants formed the homogeneous sample to develop rules for ceramic casting process, presumably because such expertise is limited (Lam et al., 2000). Potential sample size is positively related to the number of experts. One also needs to be cognizant that the views of the sample participants may not be representative of a wider population (Brancheau et al., 1996) which impinges upon results generalization. Cautious interpretation of results is recommended if the sample is small (Nambisan et al., 1999; Wynekoop & Walz, 2000) and/or if the participants' expertise is suspect (Wynekoop & Walz, 2000).
The experts for this study were selected with care with the specific goal in mind to
ensure heterogeneity in terms of the role they play in the Germany and Iran tourism
industry. Experts were thus selected to be representative of the four Germany and
Iran tourism industry performing sectors (airlines, chain Hotels, tour operator and
universities professors). Selection also took place on the basis of the different role
their organizations play within the four sectors. Care was taken to include experts
from first three of sectors in the Germany and Iran tourism industry.
3‐6‐5‐ Design the Questionnaires and Question The next step is to formulate the questions. The questions must be sharp and
answerable. A small panel might be used to help formulate the questions. The
ques on would be sent to a small expert panel (10 persons or so) working with the
research team. Essay‐type answers would be permitted at this stage. The research

٢٢٠
staff would collate the answers and form a non‐essay questionnaire. This non‐essay
question would serve as the basis for the first questionnaire. The questionnaire first
would be tested, perhaps using the small advisory panel. The testing would include
actually filling in the questionnaire.
Once qualified in this way, the questionnaire would be sent to the participants.
The cover letter would remind the participants about the objectives of the study,
establish the schedule for the response, and include the return address (Cuhls,2007).
The media that are practical for transmitting the questionnaires and responses are
postal mail, fax, and e‐mail. Delphi rounds of questionnaires continue until a
predetermined level of consensus is reached or no new information is gained. This
study was undertaken in 3 rounds. This approach was judged to be the correct
balance between striving for a useful consensus and ensuring that a significant
proportion of participants completed the study.
In this research, respondents would provide two numbers for each option, the
first depicting their judgments about effectiveness and the second, and practicality
of the actions suggested. They would be asked to provide reasons for their
judgments and to suggest means for improving effectiveness and practicality as well
as to state other alternatives they might have in mind. The research researcher
would collate the results. A feedback round would be used to present the results,
the reasons for the extreme positions, and a call for reassessment. The reasons, in
Delphi style, would be placed in front of the participants who answered the first
round.
In fact, in one application, the questionnaire itself was on a spreadsheet
transmitted by e‐mail, and responses were entered directly on the spreadsheet,
which was returned to the research team as a e‐mail attachment. However, it is not
always possible to use this approach or desirable to ask questions in this form. In
addition, even when quantitative rather than narrative answers are called for, notes
from the panelists may contain the most valuable information: references to other
people, past experiences, uncertainty, pointing to data, etc. For this reason, all
questionnaires must be read and digested by senior members of the study.
Phrasing of questions is important. A common mistake is to include two events in
the same question. Differences in the way people answer to questions may stem not
only from their perceptions about future uses of Phrases, but also from differences
in their beliefs about when it will be used. Even subtle changes in wording may affect

٢٢١
answers (Gordon, 2004). For this reason, it is desirable to conduct a test of the
instrument, not only by obtaining answers from a test group, but also by discussing
with that group their interpretations of the questions.
3‐6‐6‐ Questions Questions included in a Delphi may be of any sorts that involve judgment,
including, for example, the size of a future market, whether or not the CEO should
receive a raise, or the proper policy to achieve a goal. In planning applications, the
questions generally are of three types. Questions dealing with desirability ask for
judgments about whether an event ought to occur, the basis for the
recommendation, and the means for achieving or avoiding a future state. Questions
dealing with policy involve the traditional reporter's questions about
implementation: who, what, when, where, and how much? But to this set we must
add: to what end. In other words, questions about policy ought to be linked closely
to the objectives sought and the likelihood that any policy will, in fact, accomplish its
intended goals.
These three types of questions may require different kinds of experts. The
likelihood questions may involve hands‐on experience and intimate knowledge of
the frontiers of research. The desirability questions may involve a moral, political, or
social dimension quite distinct from the disciplinary expertise involved in judging
likelihood. The policy question may involve knowledge of the art of the possible.
Gordon (2004) believes that in some modern applications of Delphi:
1. The ques ons relate to the value of independent variables that are used in
quantitative simulation models. In this application, a consensus is not required;
rather, if disagreement exists about the value of any variable, the extremes can be
tested in quantitative models to determine whether or not the difference has any
important significance.
2. In‐depth interviews with experts have been used with great success as an
alternative to questionnaires. In this approach, first the same kinds of experts have
identified and invited to participate. After that have assured of their anonymity, and
in most instances, promised a report based on the interview sequence. An
advantage of one‐on‐one interviews is that they provide flexibility, which is absent in
questionnaires.

٢٢٢
3. For some applica ons, group mee ngs among experts have now become
practical. Delphi had its birth in concern about spurious factors that intrude in face‐
to‐face meetings among experts. New technology can minimize these factors. Some
Delphi‐like studies have been performed on‐line or with early computer‐based
communications to link experts together in networks. (Turoff, 1972) In the PC Voter,
each small terminal has two knobs. The first knob allows the user to provide
quantitative judgments about a question posed by the meeting's moderator. The
computer's software integrates the answers of the experts at the meeting,
discounting those who have low confidence in their answers, and provides on a
display screen a histogram showing the distribution of the group's opinions.
4. Several recent studies have placed their ques onnaires on‐line to reduce the
communications delays and burdens. These studies have substituted the
communications tools available via Internet for the old paper forms that were
transmitted by fax, postal mail, or more recently e‐mail, Nevertheless, the studies
still employed sequential questionnaires and preserved the Delphi principles of
anonymity and feedback,
5. Recently, the Millennium Project of the World Federation of United Nations
Associations has developed “Real Time Delphi” a method described in detail
elsewhere on this CD ROM. Briefly, in this approach a Delphi‐like questionnaire is
accessed by respondents from an on‐line Internet web site. The answers are typed in
and on submittal are fed to a database on the server. The average response is
computed and fed back to the participants who are also asked for the reasons
behind their answers. Each respondent can see the reasons given by all respondents
and may at any time change their answers. There is no explicit second round.
The data from a Delphi can be displayed in several ways. The group judgment
should be based on the median rather than the mean, since single extreme answers
can "pull" the mean unrealistically. Furthermore, it is incumbent on the analyst to
show the spread of opinion, which can be done graphically or numerically by
showing a range of responses, often the inter quartile range (the range that contains
the answers of the middle 50 percent of the respondents).

٢٢٣
3‐6‐7‐ Number of Rounds
The number of rounds again is variable and dependent upon the purpose of the research. Delbecq, Van de Ven and Gustafson (1975) suggest that a two or three iteration Delphi is sufficient for most research. If group consensus is desirable and the sample is heterogeneous, then three or more rounds may be required. However, if the goal is to understand nuances (a goal in qualitative research) and the sample is homogeneous, than fewer than three rounds may be sufficient to reach consensus, theoretical saturation, or uncover sufficient information. Finally, as the number of rounds increases and the effort required by Delphi participants, one often sees a fall in the response rate (Alexander, 2004; Rosenbaum, 1985; Thomson, 1985).
3‐6‐8‐ Discussin
The Delphi method has got criticism as well as support. It is very important to ensure understanding of the aim of the Delphi exercise by all the participants. Otherwise the panelists may answer inappropriately or become frustrated and lose interest. The respondents to the questionnaire should be well informed in the appropriate area yet some literature suggests that a high degree of expertise is not necessary. The minimum number of participant to ensure a good performance is somewhat dependant on the study design.
The panel viewpoint is summarized statistically rather than in terms of a majority vote. The extensive critiques of the Delphi method were:
(a) being unscientific; (b) having a low level reliability of judgments among experts and therefore dependency of forecasts on the particular judges selected; (c) the sensitivity of results to ambiguity in the questionnaire that is used for data collection in each round; and (d) the difficulty in assessing the degree of expertise incorporated into the forecast. Sometimes reliance on intuitive judgment is not just a temporary expedient but in fact a mandatory requirement.
The essence of the technique is fairly straightforward. The main point behind the Delphi method is to overcome the disadvantages of conventional committee action. The group interaction in Delphi is anonymous, in the sense that comments, forecasts, and the like are not identified as to their originator but are presented to the group in such a way as to suppress any identification. The convenience of electronic communication has steered the evolution of the Delphi toward computer‐mediated studies.
٢٢٤
3‐6‐9‐ Mode of Interaction
There are different modes of Delphi interaction available to the researcher. Initially, the Delphi surveys were pen and paper‐based, and often returned through the mail to the researcher (Cramer, 1990; Lecklitner, 1984; Silverman, 1981). This is still an option to the researcher. However, with the advent of electronic mail and personal networked computers, pen and paper‐based Delphi’s are less common. Electronic mail affords many advantages to both researcher and Delphi participant alike. Increasingly, experts have access to electronic mail. Perhaps the most significant benefit of electronic mail is the expediency provided by this mode of interaction. Quick turnaround times help to keep enthusiasm alive and participation high. Another benefit of electronic mail is that the raw data is already in a digital format which eliminates the tedious task of transcription. Hartman harnessed group networking technology to complete a one‐round Delphi (Hartman & Baldwin, 1995). Finally, the internet allows new ways of group interaction which can be incorporated into the Delphi process (Keil et al., 2002).
The method of data analysis and results reporting are directly related to the type of questions used in the Delphi instrument. Therefore, researchers need to apply appropriate analysis techniques. The presentation of Delphi results has been more fully discussed elsewhere (Dietz, 1987; Linstone & Turloff, 1975; R. Schmidt, 1997).
3‐6‐10‐ Strengths and Weaknesses
Delphi studies are difficult to perform well. A great deal of attention must be given
to the choice of participants; the questionnaires must be meticulously prepared and
tested to avoid ambiguity. Multi‐round studies require a great deal of time;
inevitably, some participants will drop out during the process.
The primary strength of Delphi is its ability to explore, coolly and objectively,
issues that require judgment; a weakness of Delphi is the ease with which questions
can be asked for which better techniques exist. At one extreme are questions about
the future for which factual answers exist and thus require minimal judgment
(Gordon, 2004). The judgments' made in a Delphi study allows for analyses, rankings
and priority‐settings. It provides participants with the opportunity to think in greater
depth and to gather further information between the rounds (Cuhls, 2007).
In short, Delphi is a powerful technique when used to seek answers to appropriate
questions. Suppose, for example, that we want to forecast the future size of the

٢٢٥
market for a given product. Delphi study in this research involves sales and E‐
marketing managers in tourism industry, Tourism Marketing Professors, and experts
in consumer preferences (Gordon, 2004). These people might be asked for a direct
estimate; to do so would require that they somehow integrate all factors affecting
the market, such as pricing, changing fashion, competition, consumer spending, etc.
Participants might focus on different factors and account for them differently;
without a direct question about the market determinants, the size‐determining
factors would remain hidden. Therefore, a better technique would be to ask for the
respondents to identify the factors important to future market Strategy and to
estimate probabilities and consequent effect were they to occur.
Delphi studies are difficult to perform well. They are both fairly time‐consuming
as well as labor intensive and require external expert preparation. Delphi studies can
therefore prove expensive. Care has to be taken over group effects. As in all panels
or expert groups, the opinions will reflect the set of participants involve. A narrow
set of criteria for these may thus lead to unrepresentative views or miss out
important sources of knowledge (Cuhls, 2007).
Some participants drop out during the process, especially after the first round. In
addition, although further qualitative assessment of Delphi inquiry may produce
useful information, this step is often not carried out due to lack of time. Because a
topic generation procedure is needed, a Delphi survey is in essence always a mix of
methods. Because the group never meets, there is also a degree of difficulty in
assessing and utilizing the expertise of the group fully (Murry and Hammons, 1995).
The danger also exists that greater reliance will be placed on the results. It is thus
important to note that a consensus does not necessarily mean that the correct
answer, opinion or judgment has been found.
Finally, a weakness of the Delphi method is the time that it takes. A single round
can easily require three weeks; a three‐round Delphi is at least a three‐ to four‐
month affair, including preparation and analysis time (Gordon, 2004).
The formalization of the methodology, the amount of data, and the number of
experts involved and the fact that diverging opinions are partially hidden behind the
main converging one, are all factors that contribute to the Delphi method being
considered a popular and credible approach for policy makers. Delphi surveys
employ group decision‐making techniques by involving experts in the field. Group
decisions carry greater validity than those made by an individual (Brooks, 1979). It

٢٢٦
may also be very difficult to bring a group of people together. Opinions and
contributions can consequently be received from a group of experts who may be
geographically separated from one another.
3‐6‐11‐ Delphi method critics
True, the Delphi method makes participants with extreme opinions work harder
than others. If opinions are not strongly held, participants may switch positions
rather than write reasons for their estimates. On the other hand, those with strong
opinions state why. Today, consensus is less important for many investigators than
previously; now a useful product of the Delphi method is crystallization of reasons
for disagreement. Furthermore, Delphi is now seen more no more or less than a
systematic means of synthesizing the judgments of experts the aggregate judgment
representing a kind of composite expert composed, in the domain of interest, of the
expertise of all participants.
The method is based on the premise that well‐informed individuals, drawing on
their insights and on prior experience, are better equipped to predict the future than
theoretical approaches or extrapolation of trends (Cuhls, 2003). The responses to a
series of questionnaires are anonymous. Participants are also provided with a
summary of opinions from a previous round before answering the next
questionnaire. The chief users of the Delphi technique are companies, particularly
strategy departments. The method has been used in a vast number of technology
forecasting a study, government foresight programmers, such as the Iran Tourism
Department of Trade and Industry’s Foresight Program (Department of Trade and
Industry, 2000) and a study on German S&T policy issues (Cuhls, 2001).
3‐7‐ Data Analysis Regarding data analysis, decision rules must be established to assemble and
organize the judgments and insights provided by Delphi subjects. However, the kind
and type of criteria to use to both define and determine consensus in a Delphi study
is subject to interpretation. Basically, consensus on a topic can be decided if a certain
percentage of the votes falls within a prescribed range (Miller, 2006). One criterion
recommends that consensus is achieved by having 80 percent of subjects’ votes fall
within two categories on a seven‐point scale (Ulschak, 1983). Green (1982) suggests

٢٢٧
that at least 70 percent of Delphi subjects need to rate three or higher on a four
point Likert‐type scale and the median has to be at 3.25 or higher.
In the Delphi process, data analysis can involve both qualitative and quantitative
data. Investigators need to deal with qualitative data if classic Delphi studies, which
use open‐ended questions to solicit subjects’ opinions, are conducted in the initial
iteration. Subsequent iterations are to identify and hopefully achieve the desired
level of consensus as well as any changes of judgments among panelists. The major
statistics used in Delphi studies are measures of central tendency (means, median,
and mode) and level of dispersion (standard deviation and inter‐quartile range) in
order to present information concerning the collective judgments of respondents
(Hasson, Keeney, & McKenna, 2000). Generally, the uses of median and mode are
favored. However, in some cases, as manifested by Murray and Jarman (1987), the
mean is also workable.
In the literature, the use of median score, based on Likert‐type scale, is strongly
favored (Eckman, 1983; Jacobs, 1996). As Jacobs (1996) states, “considering the
anticipated consensus of opinion and the skewed expectation of responses as they
were compiled, the median would inherently appear best suited to reflect the
resultant convergence of opinion” (p. 57). The use of mode is also suitable when
reporting data in the Delphi process. Ludwig (1994) specifically addressed that “the
Delphi process has a tendency to create convergence, and though this was usually to
a single point, there was the possibility of polarization or clustering of the results
around two or more points. In these instances, the mean or median could be
misleading”. In this research Likert‐type scale will be used. However, researcher in
some questions use seven‐point scale and some others used five‐point scale. More
than will use the mean, median, mode and other score to more explain.
3‐7‐1‐ Quality Standards For determining the trustworthiness and the quality of the gathered data, there
are two factors to consider, reliability and validity. Due to the fact that a research design is supposed to represent a logical set of statements, the quality of the study can also be judged by four tests. According to Yin (1994) these tests for qualitative case study research are: construct validity, internal validity, external validity and reliability.

٢٢٨
3‐7‐1‐1‐ Validity Yin defines also construct validity as the establishment of correct operational
measures for the concepts being studied. Yin presents three tactics in increasing construct validity. First, one is to use multiple sources of evidence during the data collection. The second tactic is to establish a chain of evidence, which should also be done during the data collection. The last tactic is to construct a draft case study report, which is reviewed by the key informants (Li Shi, 2004).
Internal validity is related to the establishment of a causal relationship whereby certain conditions are shown to lead to other conditions, as distinguished from fake relationships. Since the purpose of our study is exploratory and descriptive; and to increase external validity, Yin emphasizes the importance of using replication logic in multiple‐case studies. For this study researcher used tree type of touristic companies in Germany and Iran, which provide us with a better base of understanding than a single case study.
3‐7‐1‐2‐ Reliability Reliability is, according to Yin (1994), concerned with how reliable and accurate
the research methods and techniques for collecting data are. Reliability is a way of measuring how well a method provides a researcher with the same results, if the method was to be conducted again by another person but with the exact same conditions.
In order to reach a high degree of reliability, researcher put much effort on finding the right persons in the company for the first questionnaire. This way researcher can be sure that the information researcher get from the questionnaires is as accurate as possible. In the first questionnaire situation researcher recorded the discussion and the answers with a tape recorder in order to minimize the risk of failing in getting the right answers. Afterwards researcher also sent the printed version of the answers back to the persons according the Delphi method so that they can later check that there have not been any misunderstandings with their answers.
Cronbach's alpha is the most common form of internal consistency reliability coefficient. Alpha equals zero when the true score is not measured at all and there is only an error component. Alpha equals 1.0 when all items measure only the true score and there is no error component. Cronbach's alpha can be interpreted as the percent of variance the observed scale would explain in the hypothetical true scale
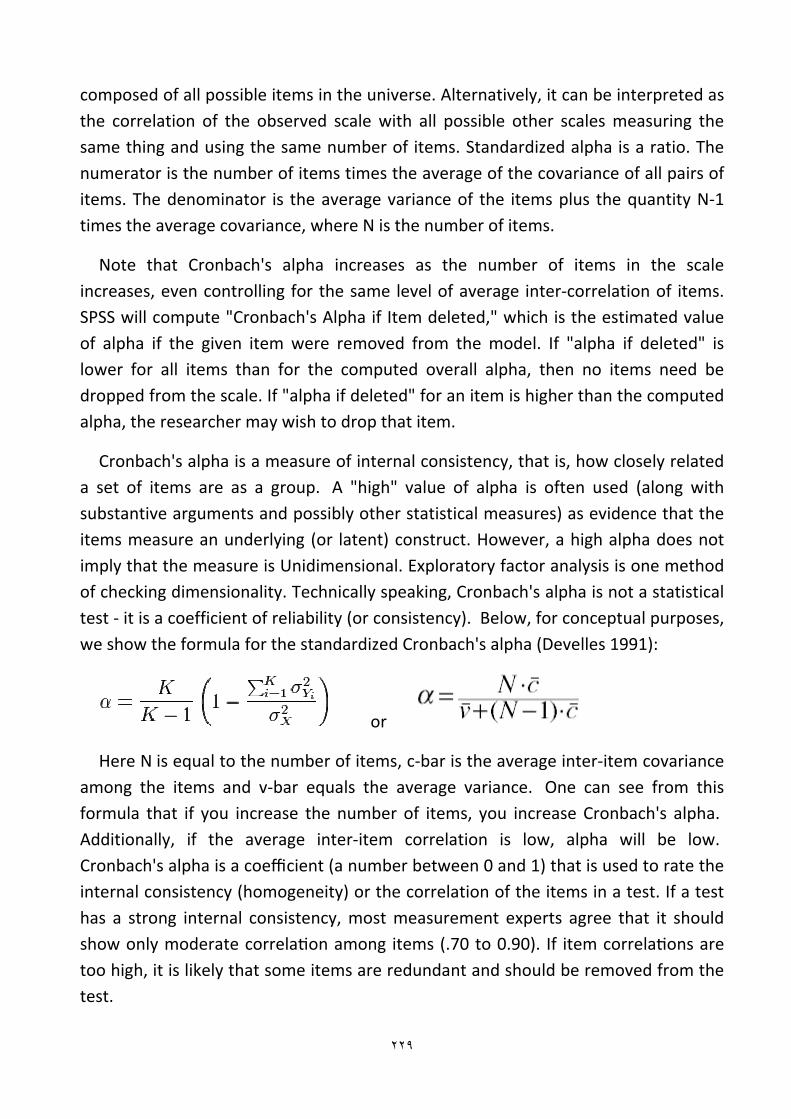
٢٢٩
composed of all possible items in the universe. Alternatively, it can be interpreted as the correlation of the observed scale with all possible other scales measuring the same thing and using the same number of items. Standardized alpha is a ratio. The numerator is the number of items times the average of the covariance of all pairs of items. The denominator is the average variance of the items plus the quantity N‐1 times the average covariance, where N is the number of items.
Note that Cronbach's alpha increases as the number of items in the scale increases, even controlling for the same level of average inter‐correlation of items. SPSS will compute "Cronbach's Alpha if Item deleted," which is the estimated value of alpha if the given item were removed from the model. If "alpha if deleted" is lower for all items than for the computed overall alpha, then no items need be dropped from the scale. If "alpha if deleted" for an item is higher than the computed alpha, the researcher may wish to drop that item.
Cronbach's alpha is a measure of internal consistency, that is, how closely related a set of items are as a group. A "high" value of alpha is often used (along with substantive arguments and possibly other statistical measures) as evidence that the items measure an underlying (or latent) construct. However, a high alpha does not imply that the measure is Unidimensional. Exploratory factor analysis is one method of checking dimensionality. Technically speaking, Cronbach's alpha is not a statistical test ‐ it is a coefficient of reliability (or consistency). Below, for conceptual purposes, we show the formula for the standardized Cronbach's alpha (Develles 1991):
or
Here N is equal to the number of items, c‐bar is the average inter‐item covariance among the items and v‐bar equals the average variance. One can see from this formula that if you increase the number of items, you increase Cronbach's alpha. Additionally, if the average inter‐item correlation is low, alpha will be low. Cronbach's alpha is a coefficient (a number between 0 and 1) that is used to rate the internal consistency (homogeneity) or the correlation of the items in a test. If a test has a strong internal consistency, most measurement experts agree that it should show only moderate correla on among items (.70 to 0.90). If item correla ons are too high, it is likely that some items are redundant and should be removed from the test.

٢٣٠
Cronbach's alpha is the most common measure of internal consistency ("reliability"). It is most commonly used when you have multiple Likert questions in a survey/questionnaire that form a scale and you wish to determine if the scale is reliable. Cronbach's α (alpha) is a coefficient of reliability. This has resulted in a wide variance of test reliability. In the case of psychometric tests, most fall within the range of 0.75 to 0.83 with at least one claiming a Cronbach alpha above 0.90 (Nunnally 1978, page 245‐246).
3‐7‐2‐ others characteristics More than mentioned subjects, this research has to have some other
characteristics. As this research considers two centuries and work with two experts groups in Germany and Iran, we need do some others Tests as following:
3‐7‐2‐1‐ Friedman Test (Ranking)
The Friedman Test is the non‐parametric alternative to the one‐way ANOVA with repeated measures. A non‐parametric test (distribution‐free) used to compare observations repeated on the same subjects. This is also called a non‐parametric randomized black analysis of variance. It is used to test for differences between groups when the dependent variable being measured is ordinal. It can also be used for continuous data that has violated the assumptions necessary to run the one‐way ANOVA with repeated measures; for example, marked deviations from normality (Swi , 2005).
Assumptions
• One group that is measured on three or more different occasions.
• Group is a random sample from the population.
• One dependent variable that is either ordinal, interval or ratio (see our Types of Variable guide).
• Samples do NOT need to be normally distributed.
This test is an alternative to the repeated measures ANOVA, when the assumption of normality or equality of variance is not met. This, like many non‐parametric tests, uses the ranks of the data rather than their raw values to calculate the statistic. Since

٢٣١
this test does not make a distribution assumption, it is not as powerful as the ANOVA. If there are only two measures for this test, it is equivalent to the sign test.
Test: The hypotheses for the comparison across repeated measures are:
Ho: The distributions are the same across repeated measures.
Ha: The distributions across repeated measures are different
Notice that the hypothesis makes no assumptions about the distribution of the populations. These hypotheses could also be expressed as comparing mean ranks across measures. The test statistic for the Friedman's test is a Chi‐square with a‐1 degrees of freedom, where is the number of repeated measures. When the p‐value for this test is small (usually <0.05) you have evidence to reject the null hypothesis (Target, 2009).
The null hypothesis in this test is that the distribution of the ranks of each type of score (i.e., reading, writing and math) are the same. To conduct a Friedman test, the data need to be in a long format. Researcher has handles this with SPSS, but in other statistical packages has to reshape the data before conduct this test.
3‐7‐2‐2‐ Independent samples T‐test
Any statistical test that uses two samples drawn independently of each other and using t‐distribution can be called a 'two‐sample t‐test'. An independent samples t‐test is used when you want to compare the means of a normally distributed interval dependent variable for two independent groups. For example, in this case, say we wish to test whether the mean for write is the same for Iran and Germany .
This analysis tool and its formula perform a paired two‐sample student's t‐test to determine whether observations taken before a treatment and observations taken after a treatment are likely to have come from distributions with equal population means. This t‐test form does not assume that the variances of both populations are equal. Paired Two Sample for Means man can use a paired test when there is a natural pairing of observations in the samples, such as when a sample group is tested twice — before and after an experiment (Adel azar, 2006).
The t‐test is designed to compare means of same variable between two groups. In our example, we compare the mean writing score between the Iran and Germany.

٢٣٢
The test assumes that variances for the two populations are the same. The interpretation for p‐value is the same as in other type of t‐tests (Target, 2009).
Particular hypothesis tested by the t‐test:
H0: μA = μB (null hypothesis)
HA: μA ≠ μB (alternative hypothesis)
Note: μ is the parameter called the mean, the location parameter of the normal distribution. For a symmetric distribution like the normal distribution, it can be found in the center, where the peak (or mode) is.
Figure 3‐2: Acceptable area of T‐test
The Two‐Sample t‐Test analysis tools test for equality of the population means underlying each sample. The three tools employ different assumptions: that the population variances are equal, that the population variances are not equal, and that the two samples represent before treatment and after treatment observations on the same subjects. The following formula is used to determine the statistic value t (Swi , 2005).
The following formula is used to calculate the degrees of freedom, df. Because the result of the calculation is usually not an integer, the value of df is rounded to the

٢٣٣
nearest integer to obtain a critical value from the t table. Where s is the sample deviation of the observations and N is the number of valid observations. The t‐value in the formula can be computed or found in any statistics book with the degrees of freedom being N‐1 and the p‐value being 1‐alpha/2, where alpha is the confidence level and by default is .95 (Macmillan, 2010).
3‐7‐2‐3‐ Tests of Normality
A lot of statistical tests (e.g. t‐test) require that our data are normally distributed and therefore we should always check if this assumption is violated. The normal distribution is bell shaped and symmetrical as in following Figure. It is also continuous. The distribution met up to now have been discrete. A distribution is discrete if the variable takes dis nct values such as 1, 2, 3, … but not those in between. In Skewness and Kurtosis there are very important and useful information which have different usage such test of normality (Sadaghiani, 2007). According the Delphi method mean median and mode are most common and usage measure and meter in selecting and ranking the items and elements and reduce them for next surveys. The normal distribution also has important attributes with respect to the standard deviation (see figure 3‐3)
68% areas (68% of readings) lie within ±1 standard devia on of mean
95% areas (95% of readings) lie within ±2 standard devia ons of mean
99.7% area (99.7% of readings) lies within ±3 standard devia ons of mean
Figure 3-3: Normal distribution format and area
Source: (Swi , 2005)

٢٣٤
Skewness: The question arises in statistical analysis of deciding how skewed a distribution can be before it is considered a problem. One way of determining if the degree of skewness is "significantly skewed" is to compare the numerical value for "Skewness" with thrice the "Standard Error of Skewness" and include the range from minus thrice the Std. Error of Skewness to plus thrice the Std. Error of Skewness. If the value for Skewness falls within this range, the skewness is considered not seriously violated. Definition of Skewness For univariate data Y1, Y2, ..., YN, the formula for skewness is:
Kurtosis: Kurtosis is a measure of whether the data are peaked or flat relative to a normal distribution. That is, data sets with high kurtosis tend to have a distinct peak near the mean, decline rather rapidly, and have heavy tails. Data sets with low kurtosis tend to have a flat top near the mean rather than a sharp peak. A uniform distribu on would be the extreme case. Defini on of Kurtosis For univariate data Y1, Y2, ..., YN, the formula for kurtosis is:
Skewness and Kurtosis a fundamental task in many statistical analyses is to characterize the location and variability of a data set. A further characterization of the data includes skewness and kurtosis. Skewness is a measure of symmetry, or more precisely, the lack of symmetry. A distribution, or data set, is symmetric if it looks the same to the left and right of the center point.
For test of normality the skewness more than above proviso has to has value between ±3× Std.error of Skewness (‐3×Std.error of Skewness < Skewness <3×Std.error of Skewness). Kurtosis images that how flat or how pike are the distribution and have same rule as skeweness which means that the Kurtosis value has to be between ±1 and for decide about normality it has to be between ±3×Std.error of Kurtosis.
Sample Skew and Kurtosis for a calculated skew number (average cubed deviations divided by the cubed standard deviation), look at the sign to evaluate whether a return is posi vely skewed (skew > 0), nega vely skewed (skew < 0) or symmetric (skew = 0). A kurtosis number (average devia ons to the fourth power

٢٣٥
divided by the standard deviation to the fourth power) is evaluated in relation to the normal distribu on, on which kurtosis = 3. Since excess kurtosis = kurtosis ‐ 3, any positive number for excess kurtosis would mean the distribution is leptokurtic (meaning fatter tails and greater risk of extreme outcomes).
3‐8‐ The AHP Method
After identifying the effective elements of E‐Marketing strategy in tourism
industry in each batch for Iran and Germany; regarding the research method, data
analysis will be done according to the AHP (Analytic Hierarchy Process) and software
of expert choice. In this research with the use of Analytic Hierarchy Process (AHP),
the preventions will be categorized. AHP is a simple, strong and elastic method, used
for decision making in the condition when the decision maker face problems due to
the opposi on of the choices, and researcher use AHP; in con nuing for every 5
group of third stage. After finishing each step, in order to categorize elements
identified, the SOWT analysis will be used. AHP was introduced by Dr. Thomas Saati
in early 1970's with the basic concepts of:
• Decompose problem and structure hierarchy
• Establish priorities
• Synthesis of judgments
• Evaluate inconsistency
The fundament of AHP is basis pair wise comparison of criteria and alternatives.
AHP model asks about preference of the criteria that are either quantitative or
qualitative and then compares the alternatives respect to the criteria (Grimm,
2002).This work aimed to apply the Analytic Hierarchy Process (AHP) method with
ratings to select effective elements in Iran and Germany Tourism industry to design
E‐Marketing Strategy.
Thomas Al‐saaty suggested this method for the first me in 1980. This method has
been applied in different sciences. In this research, the categories of the effective
elements on E.M.S.T have been also introduced via Delphi techniques. In this
research, we may also use factor analysis, regression and correlation method if
necessary. In addition, Statistic test and other statistics (average, variance) and also
diagrams will be used to elaborate the case. For the better expression of the size and

٢٣٦
intensity of the impact of different element on strategy, correlation analysis and
regression may use if necessary.
Since factors of a decision are usually interrelated, it is necessary to establish a
measuring scheme that allows each factor to influence the goal in proportion to its
importance relative to all other factors. This poses the question for each comparison
factor: How strongly do the factors at the lowest level of the hierarchy influence the
top factor (goal)? In most cases, the answer to this is that each has a non‐uniform
influence, which necessitates use of an intensity measure ‐ one that not only defines
the most influential factors, but also yields relative measures of influence
differentials (Bruce, 2003). When an interrelated diagram of comparisons represents
the process, we have a decision tree or hierarchy of comparisons that helps name
the process.
AHP uses simple pair‐wise comparison of components of a decision to produce
intensity measures. As a level of the decision hierarchy is addressed through a
sequence of pair‐wise comparisons, an overall intensity emerges for each level.
Fuzzy differentiation is the foundation for pair‐wise assessment of AHP (Bruce,
2003). Almost anyone can compare two objects against some number related
criterion, but to effectively compare many objects in a pair‐wise fashion against
multiple criteria, it is important that priority and its measurement be understood.
Priority is reflected in the weight assigned to factors of a decision or to
alternatives of a course of action. Both the priorities and the weights depend upon
goals. Measurement of priorities is the relative difference between alternative or
factor weights. The absolute value of any weight is not critical even though the
level/hierarchy/goal may be an effective single weight (measure). Saaty (2004)
proposes an Eigen value approach as the best way for calibrating a numerical scale
resulting from pair wise comparison. The eigenvector provides the priority ordering
and the Eigen value provides a measure of judgment consistency in pair‐wise
comparisons.
A hierarchy represents a system of organizing and ranging phenomena, people,
things, ideas, etc. Each element of the system, except the highest one, is subordinate
to another element in the system. Hierarchical diagrams are therefore most
commonly shaped as pyramids, because of the fact that at the top of the structure
there is only one element, even though in practice it does not have to be the case.
٢٣٧
Taking into consideration specific qualities has also a preventive character,
particularly in eliminating in a plan possible gaps and mistakes, dilemmas and
vagueness, and it also gives the possibility for decision‐making in a situation of a
multiple choice (Bruce, 2003).
A plan must have a purpose. In a specific business system, planning has
management function. In a business environment, a plan implies achieving
implementation conditions of a business system. In the context of globalization, two
important goals could be found in literature lately:
• constant business importance
• Maximum competitiveness on the market
Planning is therefore a consequence of changed circumstances in which business
system exists. A specific plan must be based on detailed and comprehensive
research and analysis of these circumstances. In that way we determine their
importance. It is common for a decision‐maker, a person who is an expert in a given
field, to decide about the level of weight. There are various methods and techniques
of decision‐making, simple and more complex ones. Analytic hierarchy process
(further in the text AHP) according to the classification is a method for multi criteria
decision‐making.[1] The concept of AHP, as well as some other theories have been
developed by Thomas Saaty, American mathematician from the University of
Pittsburgh [2]. The author of AHP Thomas L. Saaty called this method a process, and
not a method probably because of the process character of its elements.
3‐8‐1‐ AHP analytic hierarchy process
A hierarchy represents a system of organizing and ranging phenomena, people,
things, ideas, etc. Each element of the system, except the highest one, is subordinate
to another element in the system. Hierarchical diagrams are therefore most
commonly shaped as pyramids, because of the fact that at the top of the structure
there is only one element, even though in practice it does not have to be the case.
Elements of such a structure can be put into relationship with different aspects of
solution to a problem whether they are tangible i.e. more or less obvious, carefully
measured or roughly estimated, understood a bit better or worse ‐ which means that
it is useful everything that can be used in given circumstances (Pogarčić, 2008). The
key assumption of this method is human power and ability of judgment against exact

٢٣٨
information. Although this method can be used in individual processes of decision‐
making, it is most useful in situations where teams of experts cooperate in solving
complex problems, especially those that involve a high level of risk, and are based on
human judgment and perception, with far‐reaching effects.
It is important to stress also unique advantages of AHP method when, for
example, decisive elements for making decisions are difficult to compare and to
quality or in the circumstances where there are communication problems between
members of a team as a consequence of different profiles of experts, differences in
terminology, points of view etc.
Analytic hierarchy process (AHP) is a methodological approach which implies
structuring criteria of multiple options and elements into a system hierarchy,
including relative values of all criteria and elements, comparing alternatives for each
particular criterion and defining average importance of alternatives (Pogarčić, 2008).
In that way a basis is created to make appropriate decisions. AHP is a structured
technique which is used with complex decision‐making. The goal is to single out and
offer one out of several possible decisions. AHP method offers meaningful and
rational framework for structuring problems, presentation and qualification of
elements that make a problem or are important (Jendricke, 2010). Techniques of
putting together these elements and techniques of evaluating alternative solutions
enable directing towards a final solution. Since the method of AHP decision‐making
can be combined with various methods of development planning applicable in every
situation, when a decision should be made choosing between alternative solutions,
this approach is used in solving various different situations where the goal is to make
decisions in areas like government administration, economy, health, education etc.
3‐8‐2‐ Processes According to Saaty (2008), to make a decision in a structured way and generate
priorities, we need to decompose the decision into the following steps:
1) Define the problem and determine the kind of knowledge sought. 2) Structure
the decision hierarchy starting from the top with the goal of the decision, and of the
objectives from a broad perspective, through the intermediate levels (criteria on
which subsequent elements depend) to the lowest level (which usually is a set of the
alternatives). 3) Construct a set of pair‐wise comparison matrices. Each element in

٢٣٩
upper levels is used to compare the elements of the immediately lower level with
respect to it and, 4) use of priori es obtained from the comparisons to weigh the
priorities in the immediately lower level. This must be performed for each element.
Then for each element in the lower level, the weighed values are added and the
overall or global priority is obtained. Continue this process of weighing and adding
until the final priorities of the alternatives in the bottom levels are obtained. The
AHP method will not be detailed.
3‐8‐2‐1‐ Step 1:
Define the problem, Structuring a decision problem and selection of criteria
The first step is to decompose a decision problem into its constituent parts. In its
simplest form, this structure comprises a goal or focus at the topmost level, criteria
(and subcriteria) at the intermediate levels, while the lowest level contains the
options (Amanda, 2010). In this step the goal of the decision process is decided, the
criteria and sub‐criteria are identified based on the decision maker’s values and
beliefs, as well as the alternatives of decision to solve the problem.
Several RP processes are able to produce not only conceptual models, but also
functional & semi functional models for direct applications or for making patterns in
cas ng and molding (RT2) (Alireza Mokhtar, 2003). Arranging all the components in a
hierarchy provides an overall view of the complex relationships and helps the
decision maker to assess whether the elements in each level are of the same
magnitude so that they can be compared accurately. An element in a given level
does not have to function as a criterion for all the elements in the level below. Each
level may represent a different cut at the problem so the hierarchy does not need to
be complete (Saaty, 1990).
3‐8‐2‐2‐ Step 2:
Structure the decision hierarchy by pair wise comparison (weighing)
The hierarchy structure is build aiming at the top decision, followed by
intermediate levels (the criteria on which the posterior elements depend) to the
inferior level (which is usually a set of alternatives). Based on a representation of a
decision problem in a hierarchic structure, the decision maker builds the pair‐wise
matrix of the elements (Pogarčić, 2008).

٢٤٠
The categories that form the ratings must be clearly defined, in the less
ambiguous way as possible, to adequately describe the criterion/sub‐criteria. The
rating is considered suitable as the decision makers consider it an appropriate tool to
evaluate alternatives (Alireza Mokhtar, 2003). Figure 3‐5 shows the hierarchy
structure from the rating mode. The hierarchy begins with the global objective. The
criteria are at the second level. The categories associated to the sub‐criteria are at
the last level.
Figure 3‐4: hierarchy structure from the rating mode
Source: Alireza Mokhtar, 2003
The structure with ratings differs from the traditional AHP (relative measurement),
because in the last level the alternatives are not found. The evaluation is performed
by intensity levels (categories) attributed to each sub criteria related to each
alternative, instead of evaluating the alternatives by pair‐wise comparisons.
For each pair of criteria, the decision maker is required to respond to a question
such as “How important is criterion a relative to criterion B?” Rating the relative
“priority" of the criteria is done by assigning a weight between 1 (equal importance)
and 9 (extreme importance) to the more important criterion, whereas the reciprocal
of this value is assigned to the other criterion in the pair. In order to obtain an
average weight for each criterion then the weighing are normalized and averaged.
Saaty (1987, 2006, 2008) suggests that when working with ratings the priority
vectors obtained are idealized, that is, the best category receives the value 1 and the
others must be proportionally smaller.
The software Expert Choice and Super‐Decisions include, besides the traditional
AHP, the AHP with ratings (absolute measurement). In this paper, a brief description
of AHP with ratings is presented and the application exercise used the software
Super‐Decisions, developed by Creative Decisions Foundation.
٢٤١
3‐8‐2‐3‐ Step 3: Construct a set of pair‐wise comparison matrices
Pair‐wise comparison matrices are built from results between elements,
considering the Saaty Fundamental Each element in the upper level is used to
compare the elements of an immediate inferior level with respect to the former
level. In this step, the verification of the pair comparison judgments consistency is
also made (Amanda, 2010). For each pairing within each criterion the better option is
awarded a score, again, on a scale between 1 (equally good) and 9 (absolutely
better), whilst the other option in the pairing is assigned a rating equal to the
reciprocal of this value. Each score records how well option “x” meets criterion “Y”.
Afterwards, the ratings are normalized and averaged (Grimm, 2002).
Comparisons of elements in pairs require that they are homogeneous or close
with respect to the common attribute; otherwise significant errors may be
introduced into the process of measurement (Saaty, 1990). Expert Choice software,
introduced by Expert Choice Inc. (1982‐2003), is an efficient solver for the multi
criteria decision making problem based on AHP methodology.
3‐8‐2‐4‐ Step 4:
Obtaining an overall relative score for each option and Analysis results from the
comparisons to weigh the priorities in the immediately lower level
The last step refers to the obtainment of elements priorities (called eigenvector or
priority vectors) to generate the final values of the alternative priorities. The local
priorities obtained from the comparisons are used to ponder the priorities of the
immediately lower level for each element. Thus, pondered values are added for each
element in lower levels, and the total or global priority is obtained. The total
priorities of the alternatives are found by multiplying their local priorities by the
global alternatives of all criteria and respective sub‐criteria, resulting in the addition
of the results to all alternatives. Therefore, we obtain the priority ranking of
alternatives and also of the criteria and sub‐criteria (Amanda, 2010).
In a final step the option scores are combined with the criterion weights to
produce an overall score for each option. The extent to which the options satisfy the
criteria is weighed according to the relative importance of the criteria. This is done
by simple weighted summation (see the previous chapter).
Finally, after judgments have been made on the impact of all the elements and
priorities have been computed for the hierarchy as a whole, sometimes and with

٢٤٢
care, the less important elements can be dropped from further consideration
because of their relatively small impact on the overall objective. The priorities can
then be recomputed throughout, either with or without changing the judgments
(Saaty, 1990). The idea of 'musts' and 'wants' initially developed by Kepner and
Tregoe (1965) is a possibility to 'weaken' the compensatory nature of AHP (or other
MCA methods), if necessary. An option that does not satisfy one or more 'musts' is
considered infeasible and is eliminated from further consideration (Kepner, 1965).
3‐8‐3‐ AHP functions Following the hierarchy from the top to the bottom, with AHP goals are gradually
singled out, semantic branching and defining modules is done. Criteria are set ‐
testing parameters and evaluating alternatives ‐ measuring the level of success of a
certain solution according to a given criterion. The hierarchy does not have to be
complete, i.e. one element does not have to be a criterion for all subordinate
elements. Each branch is divided into appropriate rational level for working out
details (Pogarčić, 2008). At the end of this phase, the iteration process transforms
non‐structural problem into a hierarchy defined by criteria, which can then be easily
manipulated in vertical and horizontal directions. Increasing the number of criteria,
their importance decreases and they become equal which eventually is solved by
assigning values to each criterion.
It is important for a criterion to meet the requirements for independence of
alternatives and to meet expectations including all important alternatives and
criteria. Assigning relative values to each criterion is based on the importance of the
module content to which the criterion belongs. Next activity is evaluating or
assessing all alternative solutions and their mutual comparison. The matrix of these
desired solutions is estimated and the so‐called coefficient of consistency is added to
it where value 1 means that all the desired solu ons internally for this module are
consistent. On the other hand, there can be internal inconsistency when we say that
X is more desirable than Y, and Y is more desirable solution than Z, and Z is more
desirable than X and then this coefficient will acquire lower value (Pogarčić, 2008).
According to many, the quality of this step of AHP process represents key
importance supporting the opinion that AHP is theoretically well organized.
According to AHP assessment is done in the way that a relative assessment is
assigned to the most specific decisions within hierarchy, then to a wider context and

٢٤٣
so on up to the top where the total assessment is calculated. Synthesizing ‐ Because
complex, crucial decision situations often involve too many dimensions for humans
to synthesize intuitively, we need a way to synthesize over many dimensions.
3‐8‐4‐ Axioms and basic principles of the AHP
The mathematics of the AHP and the calculation techniques are briefly explained
in Annex A but its essence is to construct a matrix expressing the relative values of a
set of attributes. For example, what is the relative importance to the E‐Marketing
Strategy of Tourism firms of the cost of equipment as opposed to its ease of
operation? They are asked to choose whether cost is very much more important,
rather more important, and as important, and so on down to very much less
important, than operability. Each of these judgments is assigned a number on a
scale. One common scale (adapted from Saaty) is: Table 3‐1: The common Saaty Ra ng Scale in AHP
The fundamental scale for pair-wise comparisons Intensity of importance Definition Explanation
1 Equal importance Two elements contribute equally to the objective
2 Equally to moderately ******
3 Moderate importance Experience and judgment slightly favor one element over another
4 Moderately to strongly ******
5 Strong importance Experience and judgment strongly favour one element over another
6 Strongly to very strongly ******
7 Very strong importance One element is favored very strongly over another; its dominance is demonstrated in practice
8 Very strongly to extremely ******
9 Extreme importance The evidence favoring one element over another is of the highest possible order of affirmation
Resource: Saaty 1990
A basic, but very reasonable, assumption is that if attribute A is absolutely more
important than attribute B and is rated at 9, then B must be absolutely less
important than A and is valued at 1/9. These pair‐wise comparisons are carried out
for all factors to be considered, usually not more than 7, and the matrix is
completed. The matrix is of a very particular form, which neatly supports the
calculations which then ensue (Saaty, 1980).
Each theory is based on axioms, some basic and implied facts that make it
applicable. AHP is based on three relatively simple axioms. The first axiom, the

٢٤٤
reciprocal axiom, requires that, if PC(EA,EB) is a paired comparison of elements A
and B with respect to their parent, element C, representing how many times more
the element A possesses a property than does element B, then PC(EB,EA) =
1/PC(EA,EB) (Pogarčić, 2008). The second, or homogeneity axiom, states that the
elements being compared should not differ by too much, else there will tend to be
larger errors in judgment. When constructing a hierarchy of objectives, one should
attempt to arrange elements.
A fourth axiom, introduced later by Saaty (1980), says that individuals who have
reasons for their beliefs should make sure that their ideas are adequately
represented for the outcome to match these expectations. While this axiom might
sound a bit vague, it is important because the generality of AHP makes it possible to
apply AHP in a variety of ways and adherence to this axiom prevents applying AHP in
inappropriate ways.
The next step is the calculation of a list of the relative weights, importance, or
value, of the factors, such as cost and operability, which are relevant to the problem
in question (technically, this list is called an eigenvector). If, perhaps, cost is very
much more important than operability, then, on a simple interpretation, the cheap
equipment is called for though, as we shall see, matters are not so straightforward.
The final stage is to calculate a Consistency Ratio (CR) to measure how consistent the
judgments have been relative to large samples of purely random judgments.
3‐8‐5‐ Advantages, disadvantages and criticism of AHP
Like all modeling methods, the AHP has strengths and weaknesses. The main
advantage of the AHP is its ability to rank choices in the order of their effectiveness
in meeting conflicting objectives. If the judgments made about the relative
importance of, in this example, the objectives of expense, operability, reliability and
flexibility, and those about the competing machines’ ability to satisfy those
objectives, have been made in good faith, then the AHP calculations lead inexorably
to the logical consequence of those judgments. It is quite hard ‐ but not impossible ‐
to ‘fiddle’ the judgments to get some predetermined result. (In MOA, it is impossible
to do that.) The further strength of the AHP is its ability to detect inconsistent
judgments.
The advantages of AHP over other multi criteria methods are its flexibility,
intuitive appeal to the decision makers and its ability to check inconsistencies

٢٤٥
(Ramanathan 2001). Generally, users find the pair‐wise comparison form of data
input straightforward and convenient. Additionally, the AHP method decomposes a
decision problem into its constituent parts and builds hierarchies of criteria. Here,
the importance of each element (criterion) becomes clear (Macharis et al. 2004).
AHP helps to capture both subjective and objective evaluation measures. The AHP
method supports group decision−making through consensus by calculating the
geometric mean of the individual pair‐wise comparisons (Zahir 1999). AHP is
uniquely positioned to help model situations of uncertainty and risk since it is
capable of deriving scales where measures ordinarily do not exist (Millet & Wedley 2002).
The limitations of the AHP are that it only works because the matrices are all of
the same mathematical form ‐ known as a positive reciprocal matrix. The reasons for
this are explained in Saaty’s book, which is not for the mathematically daunted, so
we will simply state that point. To create such a matrix requires that, if we use the
number 9 to represent ‘A is absolutely more important than B’, then we have to use
1/9 to define the rela ve importance of B with respect to A. Some people regard
that as reasonable; others are less happy about it (Geoff, 2004).
The AHP−method can be considered as a complete aggregation method of the
additive type. The problem with such aggregation is that compensation between
good scores on some criteria and bad scores on other criteria can occur. Detailed,
and often important, information can be lost by such aggregation.( Alireza Mokhtar,
2003). With AHP the decision problem is decomposed into a number of subsystems,
within which and between which a substantial number of pair‐wise comparisons
need to be completed. This approach has the disadvantage that the number of pair‐
wise comparisons to be made, may become very large (n (n−1)/2), and thus become
a lengthy task (Macharis et al. 2004).
The other seeming drawback is that if the scale is changed from 1 to 9 to, say, 1 to
29, the numbers in the end result, which we called the Value for Money Vector, will
also change. In many ways, that does not matter as the VFM (not to be confused
with the Viable Final Matrix) simply says that something is relatively better than
another at meeting some objective (Saaty, 1980). In the first example, the VFM was
(0.392, 0.406, and 0.204) but that only means that machines A and B are about
equally good at 0.4, while C is worse at 0.2. It does not mean that A and B are twice
as good as C. In short, the AHP is a useful technique for discriminating between
competing options in the light of a range of objectives to be met. The calculations

٢٤٦
are not complex and, while the AHP relies on what might be seen as a mathematical
trick (Miller, 1998).
On other hands, the limita on of the use of the 9−point scale is that, the decision−
maker might find difficult sometimes to distinguish among them and tell for example
whether one alterna ve is 6 or 7 mes more important than another. In addition,
the AHP method cannot cope with the fact that alterna ve A is 25 mes more
important than alternative C (Alireza Mokhtar, 2003).
3‐8‐6‐ Judgments in the AHP
The four factors used here, E, O, R and F was, of course, purely to demonstrate a
calculation, but how might factors be determined in a real case? They could be an ex
cathedra statement from someone in authority, but a more rational approach might
be discussion with a small group, first in Focus Group mode to identify factors and
then as a simple Delphi to obtain the Overall Preference Matrix (Geoff, 2004). Delphi
is a controlled debate and the reasons for extreme values are debated, not to force
consensus, but to improve understanding (Coyle, 1989).
Under some circumstances, ranking irregularities can occur when AHP or some of
its variants are used. But sensitivity analysis allows the decision maker to assess how
alternative ratings would change if criteria weights were changed. The range of
reported practical applications is extensive and includes Resource Allocation,
Strategic Planning and Project/Risk Management. Raman than et al. (2001) proposes
namely the AHP to address the need for considering multiple criteria and multiple
stakeholders in Environmental Impact Assessment (EIA).
Although AHP is a decision−making methodology in itself, its ability to elicit
accurate ratio scale measurements and combine them across multiple criteria has
led to AHP, applications in conjunction with many other decisions support tool and
methodologies. AHP has been used in combination with, linear programming,
integer programming, goal programming, data envelope analysis, balanced score
cards, genetic algorithms, and neural networks (Millet and Wedley, 2003). A SWOT
analyze is an example of a combination specially developed for the purposes of
practical strategic planning. The approach in which the SWOT (Strengths,
Weaknesses, Opportunities and Threats) forms the general framework and the AHP
is applied within this framework in order to bring quantitative analysis capacity into
the planning process (Grimm, 2002).

٢٤٧
3‐9‐ Comparing the elements and their priorities
In this research after identify effective element on Tourism e‐marketing in Iran
and Germany, Characterize the priority finding elements separately; researcher will
compare those elements in three parts and categorize it, as follow:
1. Characterize common effective elements in each group
2. Characterizing effective elements in each country
3. Selecting common effective elements in both countries
In the last part of the research with reconsideration the results of comparing the
effective elements, their priorities, and the stage fives of the result, after empirical
job, researcher hope to present suitable conclusion about effective elements in
tourism e‐marketing strategy of Iran and Germany. We hope after getting result, be
able to propose some solution for improving strategy design Process for Tourism e‐
marking and successful implementation.

Figure 3‐5: Research process in whole view
Identify effective elements
Identifying effective elements
Characterized elements Priority
Characterize elements Priority
Selecting Delphi group in Iran
Study about Tourism e‐marketing strategy in IranStudy about Tourism e‐marketing strategy in Germany
Selecting Delph
i group
in Germany
Characterize identified elements Priority by AHP
Competition analysis and identifying effective elements in Iran
Tourism Markets and industry analysis and identifying effective elements in Iran
Customer and CRM elements analysis and
identifying effective elements in Iran
Characterize identified elements Priority by AHP
Characterize identified elements Priority by AHP
Tourism Markets and industry analysis and identifying effective elements in Germany
Characterize identified elements Priority by AHP
Characterize identified elements Priority by AHP
Characterize identified elements Priority by AHP
Competition analysis and identifying effective
elements in
Customer and CRM
elements analysis and identifying effective elements in Germany
Characterize common effective elements in each part and each country, and Select common effective elements in both countries
7. Result
Analyze and
comparing

3‐10‐ Online Surveys The use of electronic device and internet means to conduct surveys has
increased with the popularity of the World Wide Web (Web) as a mass
communication medium. Electronic versions of surveys come in three forms,
namely, fax‐based, email‐based and Web‐based. Fax‐based surveys are
administered via fax, and are manually completed and faxed back to the
researcher. Email‐based surveys are embedded in an email sent to participants,
who click on the ‘reply’ button, fill out the survey and then click on the ‘send’
button. On the other hand, Web‐based surveys require the instrument to be
accessible through a Web site, and respondents are solicited (either by traditional
mail, email, telephone, or via other Web sites) to participate in the survey.
In addition, respondents are also required to have access to the Internet. For
this matter, researcher have been used the "Unipark" web site (www.unipark.de).
This website have allowed to researcher to design the online version of
questionnaires and give ability to experts and Delphi group members to fill out it
online.
A study by Cobanoglu, Warde and Moreo (2001) compared mail, fax and Web‐
based surveys in terms of a range of factors (see Table …, and revealed the
differences between the three ways of administering the survey. Web‐based
surveys compare favorably with other types of surveys on a number of levels and
for a number of reasons. Email/Web‐based surveys also compared favorably in
terms of lower costs.
Table 3‐2: Comparison of Mail, Fax and Email/Web‐based Surveys
Source: Cobanoglu, Warde and Moreo, 2001: p. 444

٢٥٠
Nonetheless, there appeared to be disadvantages associated with using Web‐
based surveys, namely, low coverage, high chances of wrong address and the high
level of expertise needed to construct the survey instruments. These are offset by
the advantages such as speed and quality of response, low cost, and low labor
needed. In addition, email/Web‐based surveys provide a way to conduct studies
where it is impractical or financially unfeasible to access certain populations.
Despite the increased use of the Web in terms of the distribution of travel services,
there appears to be few tourism studies that have used Web‐based surveys. Two
examples of tourism‐related Web‐based studies were conducted by Peter
Sherwood (2007) and Jeong, Oh and Gregoire (2003). In both instances, Web sites
were constructed for the survey instrument and were hosted by third parties.
In contrast to the number of Web‐based surveys and Delphi studies, there
appear to be considerably fewer studies that have used a Web‐based Delphi
survey. This should not be that surprising given the relatively recent phenomena of
the Web. The field of education research has so far appeared to be the most
popular area for Web‐based Delphi studies. In addition, researchers in the field of
tourism have also used Web‐based Delphi studies, whilst studies have also been
published in the field of IT (Keil et al. 2002; Scott & Walter 2003), marketing
(Richards & Curran, 2002), and ethnographic research (Edwards 2003). In the
tourism field, one of the few relevant studies was that by Cunliffe (2002), which
examined the risks and impacts of natural and anthropogenic catastrophic events
on the future of the tourism industry.
Therefore, it would appear that Web‐based Delphi surveys are an emerging
research method and has been used to harness expert opinion in a number of
disciplines. In general, the method has been utilized in developing indicators;
however, in the area of tourism e‐marketing strategy effective elements research,
the use of a Web‐based survey to administer a Delphi study appears to be an
under‐utilized method. Accordingly, one of the important contributions of this
study was to employ this method in order to utilize the opinions of event experts
to suggest indicators for measuring the key elements that were identified in the
previous chapter and first questionnaire. The next section discusses how the Web‐
based Delphi survey was developed and administered for this study.

٢٥١
In this research for second and third surveys with recommend the supervisor
had decided to use online survey and "Unipark" Homepage. This homepage let to
student and academic researcher to design and install their questionnaires online
and offline. This webpage usage made it easy to collect and calculate. More than
transfer the data and input them in related software are easy than traditional
methods. It makes also process's time shorter than other method.
3‐11‐ Problems and bottlenecks of the research
Problems and bottlenecks of the research cover a vast criteria in this research,
which involve time limitation, high cost, distance of two countries (Germany and
Iran), lack of professionals and accessibility, lack of scientific information related to
the matter of E.M.S.T, unknown dimension of the research because of being new.
Cultural differences and differences in developed technologies can be considered
the most important problems in this research.
A number of limitations were unfortunately found for this research. Some of
them that have to be mentioned refer to the topic of this paper and its focus on
business travel and their strategy: There are two major problems, Firstly, the lack
of literature and reliable up‐to‐date statistics about tourism and tourism in
Germany and Iran. This lack includes: the lack of detailed reliable data on key
markets; the dearth of data on how buyers make their purchase decisions so,
which marketers can know how to influence them the lack of longitudinal research
to help in identifying effective elements in the e‐market. The absence of
comprehensive data on cross cultural and national differences in the demand side
of business travel and the underdevelopment of economic impact studies, which
monitor the costs and benefits of tourism e‐marketing.
There it was stated that there is a lack of research into customer attitudes
towards electronic travel booking, not to mention a shortage of reliable data on
the actual market. Even the size of the market was defined as “elusive”. Most
companies would have absolutely no idea how many potential online consumers
they would have.
The second problem is the problem of strategy. Because the strategy is the
successfully key for every company and it is most secret information in any
company, direct accessibility to these parts of information in companies is very

٢٥٢
difficult and for researcher impassible. Therefore researcher tried and found
necessary information from second hand document such as other dissertation,
companies' brushers and reports, their WebPages and related articles.
Other problem is the problem of strategy terminology. There are national and
cultural differences in the terms used within the business travel industry. But some
aspects could not be considered in this paper, as for example the problem of
overlapping: Business travel makes use of many of the same supply‐side elements,
although it sometimes needs additional services. Moreover, the major aspect is
where business travel really starts and where it ends. Research tried to used
UNWTO statistics, definition and terminology as common rules but here are just a
few facts to make this point clear (Guthan, 2002):
• Business travel becomes leisure travel, once the working day is over.
• Conferences often include programs of leisure activities in between conference sessions for delegates.
• Incentive travel includes offering leisure travel as a reward for good performance at work.
The next point that has to be mentioned is that just a few numbers of
companies were willing to cooperate. Most of them were not interested in
cooperating, mostly because of a lack of time, because in summer many colleagues
are on vacation which means more work for those who stay there. Additionally,
the regional limitation of the primary research has to be considered, because
personal immobility made it impossible to conduct interviews throughout the
whole of mentioned companies' e‐marketing mangers in Iran and Germany.
Of course, there is more secondary data, than the ones used in this research. As
it has been said at the beginning of this research, all possible research centers
were visited and relevant literature was analyzed. The major problem was to find
reliable statistical and data on business travel e‐marketing and companies'
strategy. Lots of research was available on the Internet, but due to insufficient
financial funds, they could not be obtained.

٢٥٣
Fourth Chapter
Data finding and analyze

٢٥٤
4‐1‐ Introduction Decision making is the main task of the managers because they should
continuously make decision about what should be done, how it should be done, through whom it should be done, where and when it should be done (Dellavar, 2004: 171). In this part of the research, I par cularly spend on analyzing data (about tourism e‐marketing strategy's effective elements in Germany and Iran). In general, organizations were required to be more accountable for their e‐marketing actions and more transparent in their disclosure. In regard to e‐marketing, it was argued that the strategy would be an appropriate framework for the development tourism and e‐marketing. Chapter one presented a discussion and highlighted the need for a set of standardized measures for e‐marketing strategy's effective elements in tourism industry and enabling a comparison to be made of the performance of a range of different strategies. A comprehensive analysis of a large body of special e‐marketing and e‐tourism literature and actual elements assessments was undertaken in order to understand which elements have been affected in tourism e‐marke ng and related strategies. A list of 20 key impacts was derived from the analysis.
In second Chapter have introduced research's two case countries and the selected tourism companies and thereafter presented the empirical data gathered from these case countries. Research has first shortly presented the selected segments of tourism industry in Germany and Iran. Presentation of both the case countries included the general background information about that countries' History, tourists' statistic, internet users' statistic and e‐marketing conditions explain and its e‐tourism products and markets Status, which presented in first and second chapters.
As it has mentioned in third chapter, the type of this research is Applicable‐Exploratory‐ Explanatory research and it is explanatory in its nature and method. It is to be mentioned that this research is considered field research. In this chapter will present the data collected from case countries' companies according to research questions. This data will be presented in different parts; first we will present the results of first (open) and second Questionnaires concerning the tourism e‐marketing applications strategy in Iran and Germany. Then, with respect to our two research questionnaires, it will present the data about effective elements compare by AHP method.

٢٥٥
4‐2‐ Research method and process description For reach to research aims and objective there is different way for different
research. In this research as explained and mentioned in early chapter, this part of the research contains of three stages:
a) First stage – study theories and study those related work in order to Indentify effective elements and factors in T.E.M.S
b) Second stage – collecting views of professionals with using Delphi methods to identify the base e‐marketing strategy effective elements in tourism industry in Germany and Iran separated. In continue the finding data will Analyze with SPSS and will compare them
c) Fourth stage –classifying the Identified elements with using AHP Technique and Compare the results and Concluding.
Researcher use Delphi method in this research to achieve to research aims. In order to explain the characteristic of different samples researcher has used frequency tables and cross tables. Then with the help of Delphi method, collecting and analyzing views of Delphi members, the Tourism Industry e‐marketing strategy effective elements of Iran and Germany have been identified. At the end of this part for marketing priority with respect to all those identification in group criterion and sub criterion, decision tree has been drawn and the final question are prepared. At last the result of analyzing those effective elements via AHP8 has been presented to the group members.
This aim of this chapter is to consult with a panel of e‐marketing strategy and e‐tourism experts to develop indicators to measure the key effective elements. This will be achieved through a modified, three‐stage Web‐based Delphi survey. This step recommends that a consultative network be established as part of the development process. The first section of the chapter presents the justification for using the research approach, and discusses the Delphi method, Web‐based surveys and Web‐based Delphi surveys, with reference to studies conducted in tourism research. The next section outlines the development of the survey instrument and the administration of the survey. The third section presents the results of each of the three rounds of the survey, whilst the final section draws the results together
8 Analytical Hierarchy process

٢٥٦
in the presentation of the suite of indicators that were derived from the expert panel.
4‐2‐1‐ Delphi method
The Delphi method is a technique for structuring a group communication process in order to effectively allow a group of individuals, as a whole, to consider a complex issue (Linstone & Turoff 1975). The technique usually involves the administration of three or four rounds of questionnaires involving the same panel of experts for each round. The aim is for a consensus to be reached amongst the experts over the various rounds of the survey (Robinson 1991). The process is structured as after each successive round, feedback is provided to the group that summarizes the group judgments. As such, it provides opportunity for individuals to revise their views with some degree of anonymity.
One of the major advantages of the Delphi method over the other group techniques is that the Delphi process is anonymous. As a result, this allows the group members the greatest degree of freedom from restrictions on their expression. The anonymity gives the Delphi method an advantage over other methods, which can be influenced by opinion leaders, or those with strong personalities or higher status. In addition, the method allows for ‘increased attention to each idea and increased opportunity for each individual to assure that his or her ideas are part of the group’s frame of reference’ (Delbecq et al. 1975, p. 9). Another advantage of the Delphi method is that members of the panel can be located in widespread geographical locations, as the questionnaires can be mailed, faxed or emailed to them. As discussed below, the Delphi method has been applied to research issues in a range of fields including tourism and e‐marketing and strategy.
4‐2‐2‐ Delphi Studies in the Tourism Research
Delphi studies have been used widely in tourism research by a number of authors. These studies have fallen into three key areas, namely, forecasting future scenarios (See, for example, Lee & Kim 1998; Liu 1988; Lloyd, La Lopa & Braunlich 2000; Tideswell, Mules & Faulkner 2001), exploring tourism management issues (See, for example, Garrod & Fyall 2000; Kaynak & Macaulay 1984; Weber & Ladkin 2003) and developing sets of impacts and indicators (See, for example, Carlsen et al. 2001; Green, Hunter & Moore 1990; Miller 2001; Runyan & Wu 1979). The two

٢٥٧
studies that are most relevant to the current research are those by Miller (2001) and Carlsen, et al. (2001).
The aim of the study by Miller (2001) was to consult with a panel of tourism experts in order to identify what they believed constituted sustainable tourism, what criteria are necessary for successful indicators and which indicators can promote a more sustainable form of tourism. Miller (2001) noted that the development of a thorough list of impacts or issues prior to the first round of a Delphi study increases the efficacy of the method as well as reduces the number of rounds that need to be completed, without reducing the value of the comments received (Miller 2001). A previous study by Green, et al. (1990) had been criticized for its lack of depth in the preliminary literature search, and Miller (2001) sought to address this by conducting an extensive pre‐study development of a list of elements. As outlined in the previous chapter, the present study also undertook an extensive pre‐study review of event evaluation literature and actual effective elements assessments.
In summary, the Delphi method can be applied when the consensus of experts on an uncertain and complex and often intangible issue is desired (Linstone & Turoff 1975). Moreover, it is an appropriate method to use in order to communicate with respondents who are situated in widespread geographical locations, as it would be extremely difficult and expensive to bring these people together for any other group technique. In this research, researcher study and consider Iran and Germany and also in three different categories of tourism companies (airlines, tour operators and chain hotels) in each of them. Under these circumstances, it is therefore appropriate to adopt the Delphi technique for this study.
In this research, The Delphi technique was employed to systematically combine the knowledge and opinion of the tourism e‐marketing and strategy experts, in order to arrive at an informed group consensus about which elements should be consider in the design en e‐marketing strategy in touristic firms. In contrast to the study, the present research included a number of e‐tourism, e‐marketing and e‐commerce managers, and tourism marketing professors in the panel of experts. The present Delphi study was administered via a Web‐based survey.

٢٥٨
4‐2‐3‐ Panel members individual characteristic and Selection
The next important step in the development stage of the survey was to select the panel of e‐tourism marketing or tourism e‐marketing strategy experts. According to Chan, Yung, Lam, Tam and Cheung (2001), the success of the Delphi method depends primarily on the careful selection of the panel. For example, in choosing the panel, a balanced representation of respondents is advisable. For this study, a group of e‐tourism or tourism e‐marketing experts was selected to provide a range of opinions on potential indicators, which could be used to measure the list of tourism e‐marketing strategy effective elements. As mentioned in third chapter, the Delphi participants should meet four “expertise” requirements:
i) knowledge and experience with the issues under investigation;
ii) capacity and willingness to participate;
iii) sufficient time to participate in the Delphi; and,
iv) Effective communication skills.
Commitment to participate in a multi‐round Delphi can be inferred by the round‐by‐round response rate. It is this research experience that those true experts in a field have great insight; unfortunately, they are often very busy and may not be able to participate fully. Engaging, concise, and well‐written questions can often entice their participation. Those with IT, marketing, tourism and strategy designing skills often excel at sample development and a high response rate (Hartman, 2009). The following criteria were used to identify eligible participants for the Delphi survey (Sherwood, 2007):
• Academics who have either published or lectured in the field of e‐tourism, tourism e‐marketing and strategy in Iran or Germany;
• Experts who are involved in marketing management, e‐commerce management in either of following Tourism organization and firms in Germany or Iran.
As it is research with Delphi method and need expert people and e‐marketing and e‐tourism is new subject, and the experts have to be qualification in three subject; tourism, e‐marketing and strategy designing and have to have related education and experience. Therefore you see there isn’t a lot of expert. Other side

٢٥٩
research is limited to Iran and Germany and it make research experts selection area smaller than before. Initially After considering the companies has been mentioned in first chapter, researcher has identified 60 Persons in Iran and Germany, which have mentioned qualifications. Researcher has started to find their connect information and tried to connect them and asked them about their interest and preoccupation to corporation in this research as expert. Researcher could find the connec on informa on of 53 of them and connected them (professor or the mentioned companies' marketing or e‐commerce manager) as potential panel members. According the Establishing of Delphi group method, in this research the Delphi Method contains of four parts too:
1. In first part, the responsible person who is the researcher too, send the questionnaire for the knowledgeable people of Delphi group. The questionnaire should not have so many and restricted questions. Questions should be completely relative and connected to the main subject and problems.
2. Researcher after consider and analyze the questionnaire and answers sends results or designs a new questionnaire from results and sends them to experts to improve their answers. In order to collect the views in this research, a new questioner from results had been sent to panel members.
3. Every one of the respondents reviewed the views of the group members and sent his new idea for the researcher or answers to new questionnaire. People of the group in our research after answering the new questions, send back the questionnaire to the responsible person (researcher).
4. In this part the case second and third had repeated till a completed view were introduced. In this research after three time reviewing the questionnaire (distributing and collecting, the completed result was achieved which was recognized by the Delphi group (Ahmary 1377, 54).
Halvin & press expressed that in such research, professionals and experts should be selected based on their professions and their knowledge in the field of research according to the Delphi method. Therefore random selection is not acceptable. He believes that an appropriate research group in Delphi method is the one that, the intellectual representatives of different group participate in that (Halvin & press 1975:4). In this research a professional or an expert is a person who has acquired the necessary knowledge and skills though training or practical experiences and more over is knowledgeable about the Tourism e‐marketing and related strategies

٢٦٠
in Iran and Germany. So according to this definition expert are professionals too. In order to be able to use vast and completed views the following five group's views have been gathered.
a‐ Tourism marketing or e‐tourism university lecturers, University professors and people with PHD degree who are knowledgeable and experienced about the E.M. Tourism and Germany and Iran's conditions.
b‐ People working in the Tourism organization (airlines, tour operators and chain hotels) who have enough knowledge and experience in using Electronic instrument and have professional information at least in branches of tourism e‐marketing strategy which includes:
i. Managers or marketing managers of tour operators in Iran and Germany.
ii. Managers or marketing managers of chain Hotels in Germany and Iran.
iii. Managers or marketing managers of airlines in Iran and Germany.
In this type of research, Delphi group members all the actual members whom the researcher is interested to contribute the achievement of the research to them. In this research the Delphi panel members have also been selected under certain condition. In other words since the Identification of tourism e‐marketing effective elements in Iran and Germany is studied here according to Delphi method, only professionals and experts can be the representative of the considered panel member and play the main role for evaluation. This Panel member is called here ''Members of Delphi Group '' (Babajani, 1998:137).
4‐3‐ Detail of Delphi group After field studies, performing research and visiting different site of Tourism
related to Iran and Germany and also Investigation about air lines, chain Hotels and Tourism tour operators, 53 ac ve and knowledgeable persons were with contact information identified and tried to connect them and get their agreement to have cooperation in this research. The phone call was also used to make sure that the correct email address was recorded for each of the panel members. Since Delphi method was to be done in different steps, so distributing questionnaires and then collecting the views of selected persons was to be repeated in each of the steps. Therefore perfect care and co‐operation were needed. Obviously in such cases besides being professional, enthusiasm may consider the main factor that leads the result to be more satisfactory.

٢٦١
Some of professor explained that it is not their main expert's area and some others were so busy and didn't accept to participate in this research. Some of the marketing managers explained that they don’t have allowed giving information and participating. At last 30 expert people from them were agreed to participate in the survey. The below table shows the basic information about sex and number of conclusive expert panel members:
Table 4‐1: Iran and Germany Experts' cooperation’s rate Members Man Women Total
frequency Percent frequency Percent frequency Percent
1 Iran 11 73% 4 27% 15 100%
2 Germany 10 67% 5 33% 15 100%
Total 21 70% 9 30% 30 100%
Source: the result of research
The experts for this study were selected with care and regard to the specific goal in mind to ensure heterogeneity in terms of the role they play in the Germany and Iran tourism industry. Experts were thus selected to be representative of the four Germany and Iran tourism industry performing sectors (Airlines, Chain Hotels, Tour Operator and Academics experts (universities professors). Researcher has tried to identify and select the experts and panel members from following organizations and firms with mentioned qualifications:
• Airlines e‐commerce or marketing manager from Germany.
• Chain hotel e‐commerce or marketing manager from Germany.
• Tour Operator e‐commerce or marketing manager from Germany.
• E‐tourism marketing professors, lecturers or researchers in Germany.
• Airlines e‐commerce or marketing manager from Iran.
• Chain hotel e‐commerce or marketing manager from Iran.
• Tour Operator e‐commerce or marketing manager from Iran.
• E‐tourism or tourism marketing professors, lecturers or researchers in Iran.
These academic individuals were selected from the Higher Education Sector. It was ensured that individuals were from different institutions namely University of Iran or Germany. As men oned 30 have par cipated in this research, which 15 were from Germany and 15 of them were from Iran:
• Two airline marketing manager from each of the Iran and Germany.
• Four chain hotel marketing manager from each of the Iran and Germany.

٢٦٢
• Three tour Operator marketing manager from each of the Iran and Germany.
• Six Tourism Marketing professors from each of the Iran and Germany.
The following tables shows detail of experts and panel members in this research who have been cooperated in this part of research in Iran and Germany as Delphi members. The occupations as well as the level of education of group members have been given in the following tables:
Table 4‐2: Germany and Iran Experts' coopera on’s rate members Total Experts Germany Iran
frequency Percent age in group
frequency Percent age in group
frequency
Percent age in group
1 University Lecturers or Professor 12 40% 6 40% 6 40%
2 Chain Hotels Marketing managers 8 27% 4 27% 4 27%
3 Tour Operator Marketing managers 6 20% 3 20% 3 20%
4 Air Lines Marketing managers 4 13% 2 13% 2 13%
Total 30 100% 15 50% 15 50%
Source: the result of research
As it is mentioned above, 30 persons have been participated in this research and considered Delphi groups members in Iran and Germany. They completed the questionnaires. This group is consist of Iran and Germany's airlines' marketing managers, chain hotels and tourism tour operators' marketing managers; and academic persons (member of scientific board of university who are experts in Tourism E‐Marketing Strategy). Also they have experience and knowledge about tourism e‐marketing Strategy.
Members of this group are professional in the field of T‐E‐M‐S and very much acquainted with those scientific basics and Germany or Iran’s conditions. As it is shown in the table 2, out of 30 experts, members of the Delphi group, four experts have master degree which makes 13 percentages, 13 experts equivalent to 43.5% have PhD degree and 13 experts equivalent to 43.5 have professor degree.
Table 4‐3: characteris c of Delphi group members according to educa on members Iran Germany Total
frequency Percent age in group
frequency Percent age in group
frequency Percent age in group
1 Master 2 13% 2 13% 4 13%
2 PhD 7 47% 6 40% 13 43.5%
3 Prf. Dr 6 40% 7 47% 13 43.5%
Total 15 100% 15 100% 30 100%
Source: the result of research

٢٦٣
In the Delphi method, it is assumed that there are some professionals and experts who are able to be the respondents. In this research a professional or an expert is a person who has acquired the necessary knowledge and skills through formal training or practical experiences in mentioned areas. According to the above definition experts are the professional who have enough knowledge and skills in the field of the relative researches.
It is to be mentioned that the Delphi group members beside identification of the tourism e‐marketing strategy effective elements in Iran and Germany through the certain steps, they have also clarified all those effective elements according to its priorities and importance introduced them, at the last step with the help of AHP Technique, in a separate questionnaire.
4‐4‐ Web‐based Surveys The use of electronic device and internet means to conduct surveys has
increased with the popularity of the World Wide Web (Web) as a mass communication medium. Electronic versions of surveys come in three forms, namely, fax‐based, email‐based and Web‐based. Fax‐based surveys are administered via fax, and are manually completed and faxed back to the researcher. Email‐based surveys are embedded in an email sent to participants, who click on the ‘reply’ button, fill out the survey and then click on the ‘send’ button. On the other hand, Web‐based surveys require the instrument to be accessible through a Web site, and respondents are solicited (either by traditional mail, email, telephone, or via other Web sites) to participate in the survey (Granello & Wheaton 2004). In addition, respondents are also required to have access to the Internet. For this matter, researcher have been used the "Unipark" web site (www.unipark.de). This website have allowed to researcher to design the online version of questionnaires and give ability to experts and Delphi group members to fill out it online.
Web‐based surveys compare favorably with other types of surveys on a number of levels and for a number of reasons. Email/Web‐based surveys also compared favorably in terms of lower costs. Nonetheless, there appeared to be disadvantages associated with using Web‐based surveys, namely, low coverage, high chances of wrong address and the high level of expertise needed to construct the survey instruments. (169) For this study, a decision was made to modify the traditional Delphi method from three to two rounds of questionnaires (both of

٢٦٤
which could be completed either via the internet or through mail and webpage, and to include telephone interviews before and after each of the two rounds of questionnaires. This decision was based on the exploratory nature of this study, to encourage panelist participation, and to diminish the likelihood of panelist attrition from fatigue in completing a third questionnaire. The qualitative interviews allowed panelists to reevaluate their responses based on group answers. The researchers could clarify panelists’ remarks, address discrepancies in the data, and offer a richer understanding of participants’ views.
The design of the instrument is extremely important in obtaining unbiased answers from respondents. When the visual design elements complement or support the verbal features of the survey instrument, efficiency and data quality gains may be achieved. Dillman et al. (1999) proposed 10 criterions for respondent‐friendly design principles for Web surveys. The main points were to limit advanced features, to include a welcome screen, make the initial question interesting, shorten line length and provide specific instructions for each set of questions. In short, a respondent‐friendly Web questionnaire is one that interfaces effectively with a wide variety of computers and browsers possessed by respondents’. The authors concluded that the overriding challenge of Web‐based survey design was to keep the questionnaires simple.
Regarding the use of the Internet for online Marketing and market research we can primarily identify the Internet as a tool to collect market and customer data. According to classic market research, we can use the Internet as a tool for (Weis and Steinmetz 2000; Theobald, Dreyer et al. 2001):
• Secondary and primary research,
• Qualitative and quantitative research,
• Addressed or anonymous online market research.
To capture a picture of the e‐marketing strategy's effective elements within the Iran and Germany tourism sector, we decided to use the Internet to run two online surveys (one expert survey). The term “online survey” is not very exact. There exists no generally accepted and standardized definition of what an online survey is. Therefore, we will define online surveys as online questionnaires that are presented to users of a website.

٢٦٥
The invitation of survey‐respondents can be done in four different ways such as Placing a static link on a website where one can click on, advertising the survey through banner‐ads, confronting the user with a full‐screen survey invitation, inviting a user to take part in the survey within a pop‐up window (e.g. invitation per email).
The first two methods mentioned are not suitable for conducting studies that are supposed to produce representative results. If a survey can be accessed through a static link, users could take part in the survey as often as they want. In terms of surveys that are advertised through banner‐ads it is to say that users who click on such banner‐ads differ very much from “normal” site‐users. Researcher in this research has decided to send the surveys via email to the participants.
As researcher had got the panel members' email address, he had decided to do this survey online on the Unipark webpage. He designed the two questionnaires for last step of research and sent their links in each survey of this research to experts who are the member of Delphi group and had corporation in this research.
4‐5‐ First Round In this research according the Delphi method, in first step (first questionnaire)
have used an open questionnaire for collecting the views of professionals and experts of Tourism E‐Marketing Strategy toward the identification the e‐marketing strategy effective elements in Iran and Germany, and then in order to classification effective elements, researcher has decided to design and use closed questionnaires in second and third questionnaires. Therefore, in order to develop necessary facilities for completing the questionnaire sent, correctly and having a regular communication with the respondent and also clearing any vague point related to the questionnaire, the following remedies have been considered:
a. Invite the respondents to participate in Delphi group.
b. Invite the respondents to participate in the survey.
c. Providing more explanation on the questionnaire.
d. Clearing vague point via telephone
The Delphi group’s members have been selected according to the above definition, which are prior to the others in the field of experience and profession.
٢٦٦
4‐5‐1‐ First questionnaire (open Questionnaire) In the first round, as the Delphi process traditionally has begun with an open‐
ended questionnaire. The open‐ended questionnaire serves as the cornerstone of soliciting specific information about a content area from the Delphi subjects (Custer, Scarcella, & Stewart, 1999). It should be noted that it is both an acceptable and a common modification of the Delphi process format to use a structured ques onnaire in Round 1 that is based upon an extensive review of the literature. Kerlinger (1973) noted that the use of a modified Delphi process is appropriate if basic information concerning the target issue is available and usable.
As Delphi method process and like a lot of smaller research, in this research too first round and first Questionnaire was an Open‐ended Questionnaire. In this Questionnaire, researcher has asked from experts in panel group (Delphi group) about "effective elements in tourism e‐marke ng strategy". It includes 4 questions as flowing:
1. What are the "Environmental effective elements" on tourism e‐marketing Strategy?
2. What are the "Companies elements (such as structure, management, employer, Software)" on tourism e‐marketing Strategy?
3. What are the "Effective elements from Customers (tourists) satisfaction and expects views" on tourism e‐marketing Strategy?
4. What are the "Special effective elements in Tourism industry's sections (Airline, tour operator or chain hotels)" on tourism e‐marketing Strategy?
4‐5‐2‐ Round one results The researcher has identified the experts and panel member according the their
expert, professionalization and mentioned qualification before but as all the panel members are expert and very busy person it was not easy to connect them and ask them to answer. The first Round Questionnaire has sent to experts with different methods as telephone, post, fax and email. More than for make it easy to answer for panel members and remove the post costs and process researcher put the a link of questionnaire in the "Unipark homepage" and it allow to panel members to answer to questionnaire online and off line. This page also make the extraction and analyze processes for researcher easy and reduce its' time. It is very much clear
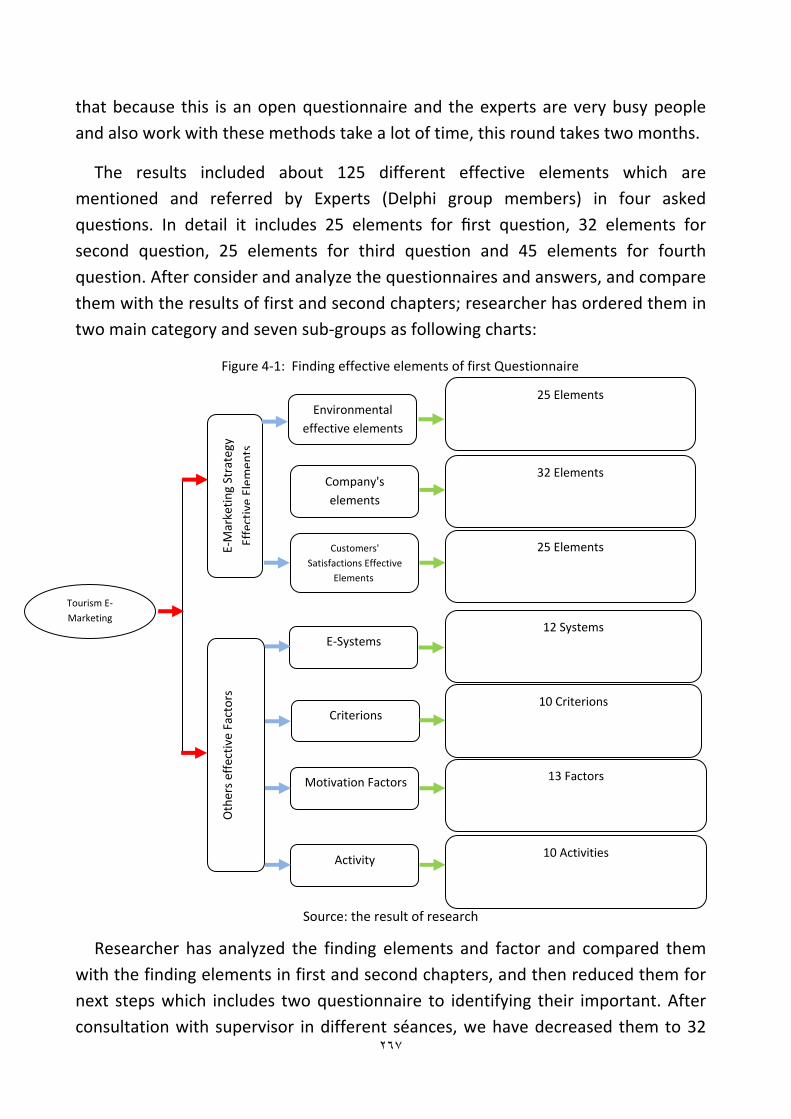
٢٦٧
that because this is an open questionnaire and the experts are very busy people and also work with these methods take a lot of time, this round takes two months.
The results included about 125 different effective elements which are mentioned and referred by Experts (Delphi group members) in four asked ques ons. In detail it includes 25 elements for first ques on, 32 elements for second ques on, 25 elements for third ques on and 45 elements for fourth question. After consider and analyze the questionnaires and answers, and compare them with the results of first and second chapters; researcher has ordered them in two main category and seven sub‐groups as following charts:
Figure 4‐1: Finding effective elements of first Questionnaire
Source: the result of research
Researcher has analyzed the finding elements and factor and compared them with the finding elements in first and second chapters, and then reduced them for next steps which includes two questionnaire to identifying their important. After consultation with supervisor in different séances, we have decreased them to 32
Tourism E‐Marketing
Environmental effective elements
Company's elements
Motivation Factors
Customers' Satisfactions Effective
Elements
E‐Systems
Criterions
32 Elements
25 Elements
13 Factors
10 Criterions
12 Systems
25 Elements
E‐Marketin
g Strategy
EffectiveElem
ents
Activity 10 Activities
Others effective Factors

٢٦٨
Tourism e‐marketing Strategy effective elements as following categories and details:
Figure 4‐2: Effective elements groups finding of first Questionnaire
Source: the result of research
In above figure have been show the three effective elements categories (Environmental effective elements, Company's elements and Effective elements from Customers (tourists) satisfaction) in this research which are main aim of this research has the most frequency among the Delphi members group. In following have mentioned the details of elements which are the result of first chapter and first (open‐end) questionnaire and have used for second questionnaire:
a) Environmental Effective Elements;
1. IT and Telecommunication Infrastructure Costs
2. General IT Knowledge and Culture in Society
3. Market (Capability, Potential, Turbulence, Orientation)
4. Competition Intensity and Competitors' Strategies
5. Availability of Resource and Environmental Opportunity
6. E‐Tourism Value‐Chain Players Power and Impacts
7. Human Resources Market (IT & E‐Marketing Specialist)
8. Government IT and E‐Commerce Policy, Laws, Rules
9. Technology and IT Systems Standards, Innovation, Capabilities and Turbulence
10. Business and Marketing Models Changes (Time &Process)
b) Companies Elements;
1. Products and Services Quality and Variety
2. Web Marketing Mix Strategy
3. Resource Availability (Finance, Technology etc)
4. Brand and Branding Strategy
5. Relationship and Strategic Alliances
6. Customer Segmentation and Targeting
7. Firm Specialists Employers Skills and Education
8. Restructuring and reengineering the processes
Tourism E‐Marketing Strategy effective Elements
Environmental effective elements Effective elements from Customers (tourists) satisfaction
Company's elements

٢٦٩
9. Firm IT Infrastructure Station and Orientation
10. Firm Competitive Advantages in E‐Marketing
11. Innovation support and Knowledge Management
12. Increased Web Traffic and Stickiness
c) Customers (Tourists) Satisfaction Effective Elements
1. Web and brand Reliability, Security, Privacy and Trust
2. Website (Attraction, Design, Availability, and Quality)
3. Transmission Speed and Conversion Rate
4. Tourists Needs, Experience and Expects in Market
5. E‐Shopping Facility and Support 6. Products and Service Quality, Variety and Innovation 7. Product & Service Flexibility and Individualization 8. Cost and Price Advantage for Customers
9. Customization (Service and CRM Coverage Level)
10. Perceived Added Value by Customers
In last Question of the second survey, respondents were given the opportunity to suggest additional effective elements that were not included in the original category list. A number of respondents took the chance to contribute to the general discussion on effective elements, and this information proved to be very valuable.
More than Researcher has reduced rest 40 elements to 32 elements and factors and divided to four new categories. Because it helps researcher to better analyze and consider in next Delphi step and questionnaire. These categories are E‐Systems, Motivation Factors, Criterion and Activities as following diagram and details:
Figure 4‐3: Other elements and factors groups finding of first Questionnaire
Source: the result of research
Each of the 30 Tourism E‐Marketing Strategy experts had received an email that contained information about the background and aims of the study, the URL and
Others Tourism E‐Marketing Strategy
ff ti F t
Motivation Factors Criterions E‐Systems Activity

٢٧٠
instructions for the Web site and contact details for any ethical or administrative problems. The respondents were given a period of three weeks to complete each the surveys, which started from the day the email was sent out. From the 30 panel members, 30 (100%) responded to the first round of the survey. Of these, 28 fully completed the survey and two completed only the first two questions. But researcher asked them to fill out questions completely and they completed it next days. At the end of the three‐week period, all the 30 panel members had responded to the survey. After this time, the survey was closed off and was no longer accessible to the panel.
Systems:
E‐Systems: e‐systems are the systems based on ICTs and internet which companies use them for their routines or specials functions. It includes the different variety of systems from sample to complicated and multifunction. But all of them are not important to attend them in design an e‐strategy or e‐marketing plan. With scan the available systems and their important according the results of first questionnaire and Buhalis in his book "E‐Tourism" researcher has listed some of the more important of them as mentioned in hereunder:
• Global Distribution Systems(GDSs)
• Executive Information Systems(EIS)
• Strategic Information Systems(SIS)
• Decision Support Systems(DSS)
• Management Information Systems(MIS)
• Databases Systems
• Expert Systems
• Destination Management Systems
• Mobil/WAP Based Systems
• Interactive Digital TV(IDTV)
Motivation Factors:
The motivations factors I this research are factors and elements which affect an e‐marketing strategy successfully and efficiency indirectly and they are in related

٢٧١
to different parts of tourism industry and players not only depend to one group of elements and players.
• Speed
• Security and Trust
• User‐Friendly
• Compressing data and Information
• Better Information and Intelligently
• Mobility
• Last Minute Price
Criterions:
They are scales and standards which have usage to assess and judge about the successfully and of a strategy or marketing plan. Here we have Criterions which helps to judge about successfully and identify their efficiency levels.
• Stockholders Satisfaction
• Customers Satisfaction
• Customers Number Web
• Visitors Numbers
• Market Share
• Costs
• Sell and Income
With the refer many of expert, researcher has find that is important that to know the IT and E‐marketing in which part of company use or will be use more. Than this part can play key role in design and successfully a company. Along the questionnaires, Researcher has considered the opinions and theories of some experts in this theme such as Buhalis and Kotler and has listed them as you see in following:
• Front Office(Reservation, Check in, Payment)
• Back Office(Management, Accounting & Payroll)

٢٧٢
• Promotion and advertising
• Marketing Research
• Performance Monitoring (Control of Business Processes and Personal)
• Customers Entertainment and Communication
• Integration and Partnership
• Education and Training
4‐5‐3‐ Round Two In the second round, each Delphi participant receives a second questionnaire
and is asked to review the items summarized by the investigators based on the information provided in the first round. Accordingly, Delphi panelists may be required to rate or “rank‐order items to establish preliminary priorities among items. As a result of round two, areas of disagreement and agreement are iden fied”(Ludwig, 1994, p. 54‐55). In some cases, Delphi panelists are asked to state the ra onale concerning ra ng priori es among items (Jacobs, 1996). In this round, consensus begins forming and the actual outcomes can be presented among the par cipants’ responses (Jacobs, 1996).(167)
The aim of second Round was to give the panel of experts the opportunity to suggest indicators to measure each of the elements. As with the first round, an email was sent out to the panel, which included a summary of the results of Round One, instructions for Round Two and the link to the Round Two survey instrument. The email also included a link to a Web page that contained additional information for those respondents that required more detail on the results of Round One. After the initial period, a reminder email was sent out to the panel members, which was successful in prompting additional responses. For this important as it has explained before, researcher has used "Unipark" webpage to dosing the questionnaire and sent the link to experts per email. You can see the link in following:
http://www.unipark.de/uc/Uni_Trier_2011_12_14_Mousavi/c4e1/
using of webpage and link allow to panel members to answer to questionnaire an d questions in everywhere and every time they like and have time online and let them to change their answers very easy. It also let to researcher to easier and in

٢٧٣
lesser time output data and input them in different software and make the analyze process shorter and easy than others method.
4‐5‐4‐ Round Two Results The average response me for Round Two of the survey was 14.2 days. This was
slower than Round One, which had an average response me of 10.6 days. In addi on, the response rate of 100%. In Ques ons 4 to 8 of the second survey, experts were asked to indicate how important has each of the effective elements and others factors. For ques ons 4 to 6 and ques on 8 have used a five‐point Likert‐type scale was used which consisted of the levels of Unimportant, Of Little Importance, Moderately Important, Important and Very Important. For question seven which includes 32 elements in three categories, have used the seven‐point Likert‐type scale. As first question is about organization where the panel members work and it is not important in this segment of research (because researcher have select the members according their qualification and organization who they work and he has all the information about them and more than this question doesn't affect the result of research); In following first have been analyzed second and third questions and after that we came to research aims which will answer with question four to eight. Man can see the results of this question in the following charts, tables and figures according the view Of Delphi group and panel members in Germany and Iran:
4‐5‐4‐1‐ Questions two and three
Question two: This question tries to give us a forecasting about the share of the e‐marketing and e‐market to whole the tourism market and marketing activities. This question includes five options to answer and all the possible answers. As our experts are from two country (Iran and Germany) which have different conditions and situation in tourism, internet and e‐marketing and also from different parts of tourism industry which too have different situations; the answers include all the possible option. It means they do not have same view about this question. In other word, the experts from Iran and Germany in different part of tourism industry (airlines, chain hotels and tour operators) have different forecasting about the future of e‐marketing share in next five years. The next table shows the whole frequency and percent of answers:
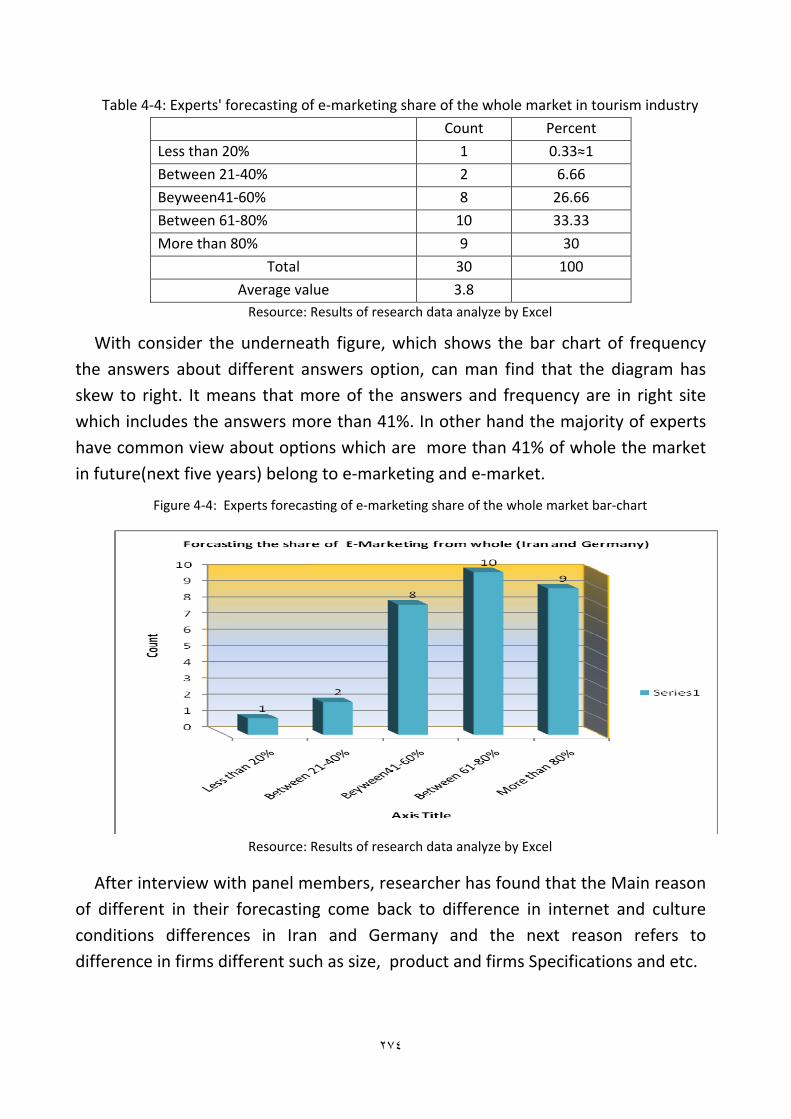
٢٧٤
Table 4‐4: Experts' forecasting of e‐marketing share of the whole market in tourism industry
Percent Count
0.33≈1 1Less than 20%
6.66 2Between 21‐40%
26.66 8Beyween41‐60%
33.33 10Between 61‐80%
30 9More than 80%
100 30Total
3.8Average valueResource: Results of research data analyze by Excel
With consider the underneath figure, which shows the bar chart of frequency the answers about different answers option, can man find that the diagram has skew to right. It means that more of the answers and frequency are in right site which includes the answers more than 41%. In other hand the majority of experts have common view about op ons which are more than 41% of whole the market in future(next five years) belong to e‐marketing and e‐market.
Figure 4‐4: Experts forecas ng of e‐marketing share of the whole market bar‐chart
Resource: Results of research data analyze by Excel
After interview with panel members, researcher has found that the Main reason of different in their forecasting come back to difference in internet and culture conditions differences in Iran and Germany and the next reason refers to difference in firms different such as size, product and firms Specifications and etc.

٢٧٥
Figure 4‐5: experts' forecas ng of e‐marketing share of the whole market pie‐chart
Resource: Results of research data analyze by Excel
The above chart shows the Pie‐chart of our Delphi group forecasting. Additional comments suggested that e‐marke ng share more than 41% of whole includes the 88% of forecas ng with experts who are panel members. For example, ten of experts which mean 35% of them are in common opinion which is the e‐marketing and e‐market share in next five years in tourism industry will be between 61‐80% to whole the market and marketing activities.
Question three: This question four is about E‐Marketing growth pattern in tourism industry forecasting. For this question after consider the common patterns and related documents and articles researcher has offer five options to answer and all the possible answers which includes Steady Growth, S‐curve Growth, Cyclical Growth, Discontinuous growth and others. The next table shows the whole frequency and percent of answers:
Table 4‐5: Experts views about the e‐marketing growth pattern percent count 46.66667 14 steady Growth 1
20 6 S‐curve Growth 2
10 3 Cyclical Growth 3
6.666667 2 Discontinuous Growth 4
16.66667 5 Others 5
30 Total
Resource: Results of research data analyze by Excel
In the table, it is very much obvious that the "steady Growth" has the most frequency among the Delphi members group’s view. So this can be considered the

٢٧٦
more common forecasting about the E‐Marketing growth pattern in tourism industry.
Figure 4‐6: e‐marketing growth pattern bar‐chart
Resource: Results of research data analyze by Excel
The result of asking from panel members about their opinion about E‐Marketing growth patterns and difference in their views have been show to researcher that Main reason of different in their forecasting come back to difference in internet and culture conditions differences in Iran and Germany and difference in firms different such as management views in company, company size, product and service nature, firms mission and vision in about e‐market and e‐marketing and etc.
Figure 4‐7: e‐marketing growth pattern pie‐chart
Resource: Results of research data analyze by Excel
The above chart shows the Pie‐chart of our Delphi group forecasting. Pie‐Chart gives useful information about data and makes it easy to understand, consider details and decide about them. For example "steady Growth" with 46% and "S‐curve Growth" with 20% have most common views about the E‐Marketing growth

٢٧٧
patterns in tourism industry according the Iran and Germany experts views who are member of Delphi group in this research.
4‐5‐4‐2‐ Ranking the elements In Questions four to eight in second round and survey questionnaire, the panel
members were asked to choose which important has each element of the list they considered and to order them of their importance. In order to achieve weighted rankings, the choices were given the following scores: 1=A few important; 2=some more important; 3=moderately important; 4=quite important; 5=rather more important; 6=Very important; 7=extremely important. In general, the effective elements with important more were ranked above the effective elements with lesser important, which again, appeared to reflect the results in Questions three to eight.
As it is obvious, the effective elements which will have the most frequency among the others have more important than others. This may be a sign of importance up to a certain level, but it reveals the effectiveness of effective elements in applying tourism e‐marketing strategy. The environmental effective elements were ranked as following:
4‐5‐4‐3‐ Question four: E‐Systems in Tourism E‐marketing 1. Global Distribution Systems(GDSs)
2. Executive Information Systems(EIS)
3. Strategic Information Systems(SIS)
4. Decision Support Systems(DSS)
5. Management Information Systems(MIS)
6. Databases Systems (DB)
7. Expert Systems (ES)
8. Destination Management Systems(DMS)
9. Mobil/WAP Based Systems (MBS)
10. Interactive Digital TV(IDTV)

٢٧٨
4-5-4-3-1- Cronbach Reliability Test Cronbach's alpha is the most common measure of internal consistency
("reliability"). It is most commonly used when there are multiple Likert questions in a survey/questionnaire that form a scale and you wish to determine if the scale is reliable. As you see it is suitable to use in this research because the questionnaire includes the different ques ons with 5 or 7 Likerk scales.
Researcher has here a devised a question with which they hope to measure how important have mentioned ten systems in e‐marketing in Iran and Germany tourism parts. Each ques on was a 5‐point Likert item from "a few important" to "extremely important agree". In order to understand whether the questions in this questionnaire all reliably measure the same latent variable (feeling of safety) (so a Likert scale could be constructed), a Cronbach's alpha was run on a sample size of 30 expert in Germany and Iran which includes 15 expert in each of them. SPSS produces many different tables. The first important table is the Reliability Statistics table that provides the actual value for Cronbach's alpha, as shown below:
Table 4‐6: Tourism e‐marketing systems Reliability Statistics (Cronbach's alpha)
Cronbach's Alpha Cronbach's Alpha Based on Standardized Items N of Items
.981 .982 10
Resource: Results of research data analyze by Spss
We can see that in this part about systems, Cronbach's alpha is 0.981, which indicates a high level of internal consistency for our scale with this specific sample about e‐systems important in tourism e‐marketing strategy according the experts views in Germany and Iran. (Note that a reliability coefficient of .70 or higher is considered "acceptable" in most social science research situations.) Essentially this means that respondents who tended to select high scores for one item also tended to select high scores for the others; similarly, respondents who selected a low score for one item tended to select low scores for the other items. Thus, knowing the score for one Task Value item would enable one to predict with some accuracy the possible scores for the other nine Task Value items.
Standardized item alpha, also shown in SPSS output above, is the average inter‐item correlation when item variances are equal. The difference between Cronbach's alpha and standardized item alpha is a measure of the dissimilarity of variances among items in the set. In a second use, standardized item alpha can be

٢٧٩
used to estimate the change in reliability as the number of items in an instrument or scale varies.
Table 4‐7: Tourism E‐marketing Systems (e‐systems) Inter‐Item Correlation Matrix (Cronbach's alpha)
Glo
bal D
istri
butio
n S
yste
ms
(GD
Ss)
Exe
cutiv
e In
form
atio
n S
yste
ms
(EIS
)
Stra
tegi
c In
form
atio
n Sy
stem
s (S
IS)
Dec
isio
n S
uppo
rt S
yste
ms
(DS
S)
Man
agem
ent I
nfor
mat
ion
Sys
tem
s (M
IS)
Dat
abas
es S
yste
ms
(DB
)
Exp
ert S
yste
ms
(ES
)
Des
tinat
ion
Man
agem
ent S
yste
ms
(DM
S)
Mob
il/W
AP
Bas
ed S
yste
ms
(MB
S)
Inte
ract
ive
Dig
ital T
V(ID
TV)
Global Distribution Systems(GDSs) 1.000 .505 .942 .950 .830 .899 .926 .936 .944 .871
Executive Information Systems(EIS) .505 1.000 .606 .656 .689 .486 .612 .667 .490 .709
Strategic Information Systems(SIS) .942 .606 1.000 .958 .875 .880 .917 .967 .929 .893
Decision Support Systems(DSS) .950 .656 .958 1.000 .891 .891 .940 .988 .920 .943
Management Information Systems(MIS) .830 .689 .875 .891 1.000 .893 .900 .901 .880 .833
Databases Systems(DB) .899 .486 .880 .891 .893 1.000 .899 .887 .930 .799
Expert Systems(ES) .926 .612 .917 .940 .900 .899 1.000 .933 .931 .898
Destination Management Systems (DMS) .936 .667 .967 .988 .901 .887 .933 1.000 .921 .922
Mobil/WAP Based Systems (MBS) .944 .490 .929 .920 .880 .930 .931 .921 1.000 .805
Interactive Digital TV(IDTV) .871 .709 .893 .943 .833 .799 .898 .922 .805 1.000
Resource: Results of research data analyze by SPSS
Table (4‐7) is matrix which shows the Inter‐Item Correlation. After analyze their ranking and average value if there is some variables with same scores, researcher will use this table for next questionnaire (AHP questionnaire) to reduces the items and will delete items which have low correlation with others. For example you see that the "Executive Information Systems(EIS)" has low correlation with others and if in next steps it has same average value and rank with one others and we want do delete one of them for next questionnaire we select this one. The Item‐Total Statistics table presents, as shown below:
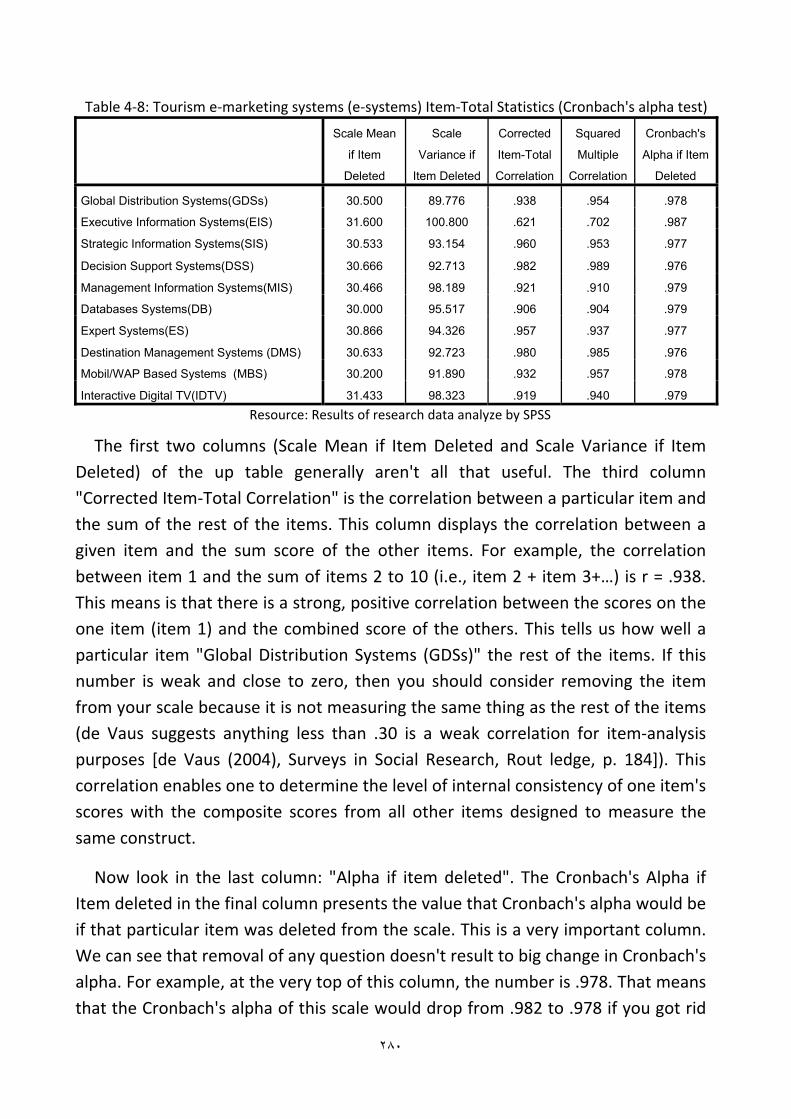
٢٨٠
Table 4‐8: Tourism e‐marketing systems (e‐systems) Item‐Total Statistics (Cronbach's alpha test)
Scale Mean
if Item
Deleted
Scale
Variance if
Item Deleted
Corrected
Item-Total
Correlation
Squared
Multiple
Correlation
Cronbach's
Alpha if Item
Deleted
Global Distribution Systems(GDSs) 30.500 89.776 .938 .954 .978
Executive Information Systems(EIS) 31.600 100.800 .621 .702 .987
Strategic Information Systems(SIS) 30.533 93.154 .960 .953 .977
Decision Support Systems(DSS) 30.666 92.713 .982 .989 .976
Management Information Systems(MIS) 30.466 98.189 .921 .910 .979
Databases Systems(DB) 30.000 95.517 .906 .904 .979
Expert Systems(ES) 30.866 94.326 .957 .937 .977
Destination Management Systems (DMS) 30.633 92.723 .980 .985 .976
Mobil/WAP Based Systems (MBS) 30.200 91.890 .932 .957 .978
Interactive Digital TV(IDTV) 31.433 98.323 .919 .940 .979 Resource: Results of research data analyze by SPSS
The first two columns (Scale Mean if Item Deleted and Scale Variance if Item Deleted) of the up table generally aren't all that useful. The third column "Corrected Item‐Total Correlation" is the correlation between a particular item and the sum of the rest of the items. This column displays the correlation between a given item and the sum score of the other items. For example, the correlation between item 1 and the sum of items 2 to 10 (i.e., item 2 + item 3+…) is r = .938. This means is that there is a strong, positive correlation between the scores on the one item (item 1) and the combined score of the others. This tells us how well a particular item "Global Distribution Systems (GDSs)" the rest of the items. If this number is weak and close to zero, then you should consider removing the item from your scale because it is not measuring the same thing as the rest of the items (de Vaus suggests anything less than .30 is a weak correlation for item‐analysis purposes [de Vaus (2004), Surveys in Social Research, Rout ledge, p. 184]). This correlation enables one to determine the level of internal consistency of one item's scores with the composite scores from all other items designed to measure the same construct.
Now look in the last column: "Alpha if item deleted". The Cronbach's Alpha if Item deleted in the final column presents the value that Cronbach's alpha would be if that particular item was deleted from the scale. This is a very important column. We can see that removal of any question doesn't result to big change in Cronbach's alpha. For example, at the very top of this column, the number is .978. That means that the Cronbach's alpha of this scale would drop from .982 to .978 if you got rid
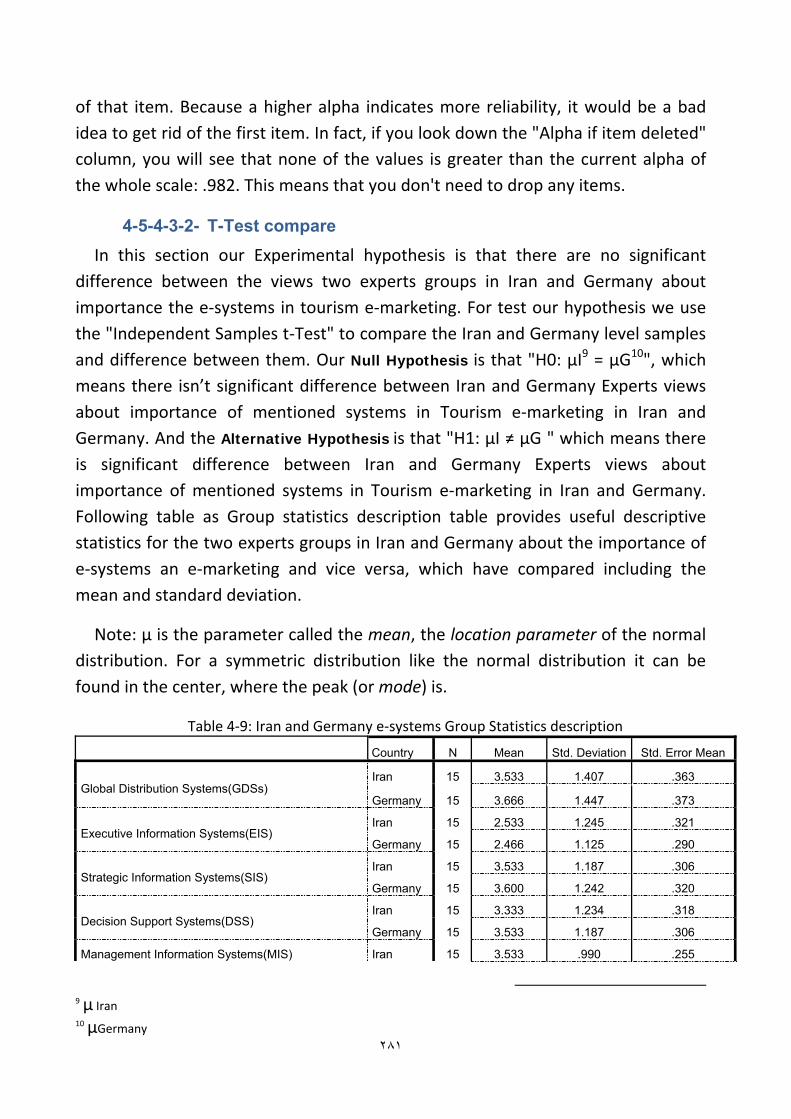
٢٨١
of that item. Because a higher alpha indicates more reliability, it would be a bad idea to get rid of the first item. In fact, if you look down the "Alpha if item deleted" column, you will see that none of the values is greater than the current alpha of the whole scale: .982. This means that you don't need to drop any items.
4-5-4-3-2- T-Test compare In this section our Experimental hypothesis is that there are no significant
difference between the views two experts groups in Iran and Germany about importance the e‐systems in tourism e‐marketing. For test our hypothesis we use the "Independent Samples t‐Test" to compare the Iran and Germany level samples and difference between them. Our Null Hypothesis is that "H0: μI9 = μG10", which means there isn’t significant difference between Iran and Germany Experts views about importance of mentioned systems in Tourism e‐marketing in Iran and Germany. And the Alternative Hypothesis is that "H1: μI ≠ μG " which means there is significant difference between Iran and Germany Experts views about importance of mentioned systems in Tourism e‐marketing in Iran and Germany. Following table as Group statistics description table provides useful descriptive statistics for the two experts groups in Iran and Germany about the importance of e‐systems an e‐marketing and vice versa, which have compared including the mean and standard deviation.
Note: μ is the parameter called the mean, the location parameter of the normal distribution. For a symmetric distribution like the normal distribution it can be found in the center, where the peak (or mode) is.
Table 4‐9: Iran and Germany e‐systems Group Statistics description
Country N Mean Std. Deviation Std. Error Mean
Global Distribution Systems(GDSs) Iran 15 3.533 1.407 .363
Germany 15 3.666 1.447 .373
Executive Information Systems(EIS) Iran 15 2.533 1.245 .321
Germany 15 2.466 1.125 .290
Strategic Information Systems(SIS) Iran 15 3.533 1.187 .306
Germany 15 3.600 1.242 .320
Decision Support Systems(DSS) Iran 15 3.333 1.234 .318
Germany 15 3.533 1.187 .306
Management Information Systems(MIS) Iran 15 3.533 .990 .255
9 μ Iran 10 μGermany

٢٨٢
Germany 15 3.733 .961 .248
Databases Systems(DB) Iran 15 4.000 1.195 .308
Germany 15 4.200 1.082 .279
Expert Systems(ES) Iran 15 3.133 1.187 .306
Germany 15 3.333 1.112 .287
Destination Management Systems (DMS) Iran 15 3.400 1.242 .320
Germany 15 3.533 1.187 .306
Mobil/WAP Based Systems (MBS) Iran 15 3.866 1.302 .336
Germany 15 3.933 1.334 .344
Interactive Digital TV(IDTV) Iran 15 2.533 .915 .236
Germany 15 2.800 1.014 .261 Resource: Results of research data analyze by SPSS
Because the standard deviations of experts views about systems importance in tourism e‐marketing for the two groups of Iran and Germany are almost similar (for example about "Global Distribu on Systems (GDSs))" the 1.40 and 1.44), we will use the "equal variances assumed" test. The results indicate that there isn't a statistically significant difference between the important of usage e‐systems Iran and Germany. In other words, Effective elements in views of Germany's Experts have a same statistically significantly as views of Iran's Experts.
Null Hypothesis: H0: μI = μG (null hypothesis)
Alternative Hypothesis: H1: μI ≠ μG (alternative hypothesis)
Particular hypothesis tested by the t‐test:
‐reject H0 If |t| > cortical value of t or reject H0 If p (or "sig") < Alpha level
This table provides the actual results from the independent t‐test and Levine's Test for Equality of Variances. If the variances are equal in both groups then the P‐value ("Sig.") will be greater than 0.05. However, if the "Sig." value is less than

٢٨٣
0.05, the variances are unequal. If we have unequal variances then we need to use the Equal variances not assumed column otherwise you use the Equal variances assumed column.
The first thing we need to do is check to see if we have similar variances in the two groups by checking the result of Levine's Test for Equality of Variances. To check this, we look at the "Sig." row within Levine's Test for Equality of Variances row:
Table 4‐10: T Test results for E‐systems in Iran and Germany Levene's Test for
Equality of Variances
t-test for Equality of Means
F Sig. t df Sig.
(2-tailed)
Mean Differenc
e Std. Error Difference
95% Confidence
Lower Upper
Global Distribution Systems(GDSs)
Equal variances assumed
.018 .896 -.256 28 .800 -.133 .52129265 -1.201 .934
Equal variances not assumed
-.256 27.978 .800 -.133 .52129265 -1.201 .934
Executive Information Systems(EIS)
Equal variances assumed
.356 .555 .154 28 .879 .066 .43351644 -.821 .954
Equal variances not assumed
.154 27.715 .879 .066 .43351644 -.821 .955
Strategic Information Systems(SIS)
Equal variances assumed
.049 .826 -.150 28 .882 -.066 .44365008 -.975 .842
Equal variances not assumed
-.150 27.943 .882 -.066 .44365008 -.975 .842
Decision Support Systems(DSS)
Equal variances assumed
.005 .943 -.452 28 .655 -.200 .44221664 -1.105 .705
Equal variances not assumed
-.452 27.958 .655 -.200 .44221664 -1.105 .705
Management Information Systems(MIS)
Equal variances assumed
.173 .681 -.561 28 .579 -.200 .35634832 -.929 .529
Equal variances not assumed
-.561 27.975 .579 -.200 .35634832 -.929 .529
Databases Systems(DB)
Equal variances assumed
.032 .858 -.480 28 .635 -.200 .41633320 -1.052 .652
Equal variances not assumed
-.480 27.729 .635 -.200 .41633320 -1.053 .653
Expert Systems(ES)
Equal variances assumed
.050 .824 -.476 28 .638 -.200 .42012848 -1.060 .660
Equal variances not assumed
-.476 27.883 .638 -.200 .42012848 -1.060 .660
Destination Management Systems (DMS)
Equal variances assumed
.012 .915 -.301 28 .766 -.133 .44365008 -1.042 .775
Equal variances not assumed
-.301 27.943 .766 -.133 .44365008 -1.042 .775
Mobil/WAP Based Systems (MBS)
Equal variances assumed
.015 .904 -.138 28 .891 -.066 .48140007 -1.052 .919
Equal variances not assumed
-.138 27.983 .891 -.0666 .48140007 -1.052 .919
Interactive Digital TV(IDTV)
Equal variances assumed
.002 .965 -.756 28 .456 -.266 .35276684 -.989 .455
Equal variances not assumed
-.756 27.711 .456 -.266 .352 -.989 .456
Resource: Results of research data analyze by SPSS

٢٨٤
1‐"Levene's Test for Equality of Variances" for variables shows that F quantities (.018, .356, .049, …)11 are not significant because the F sig.(.896, .555, .826 and …) are more than .05; therefore "Equal variances assumed" rows will be use to T‐test. The score (sig) has to be .05 or less than .05 to be considered significant.
Under the "t‐test for Equality of Means" look at "sig. (2‐tailed)" for "Equal variances assumed". The scores are more than .05, therefore with confidence level of 95% there aren’t a significant difference between the means of the two groups. It means with confidence level of 95% there are no significant difference between the means of the two Iran and Germany expert's group's views about the importance of different systems in Tourism e‐marketing strategy in Iran and Germany.
4-5-4-3-3- Friedman ranking Test The Friedman Test compares the mean ranks between the related groups and indicates how the groups differed and it is included for this reason. We intend to report the value for each related group or variable. A non‐parametric test (distribution‐free) used to compare observations repeated on the same subjects. This is also called a non‐parametric randomized black analysis of variance. And as the number of two Delphi experts in Iran and Germany are same and it agrees to basic assumptions of using the Friedman Test, we can use this test in our research to ranking the elements.
Table 4‐11: Iran and Germany Tourism E‐systems Friedman test Descriptive Statistics
N Mean Std. Deviation Minimum Maximum
Global Distribution Systems(GDSs) 30 3.600 1.404 1.00 5.00
Executive Information Systems(EIS) 30 2.500 1.167 1.00 5.00
Strategic Information Systems(SIS) 30 3.566 1.194 1.00 5.00
Decision Support Systems(DSS) 30 3.433 1.194 1.00 5.00
Management Information Systems(MIS) 30 3.633 .964 1.00 5.00
Databases Systems(DB) 30 4.100 1.124 1.00 5.00
Expert Systems(ES) 30 3.233 1.135 1.00 5.00
Destination Management Systems (DMS) 30 3.466 1.195 1.00 5.00
Mobil/WAP Based Systems (MBS) 30 3.900 1.295 1.00 5.00
Interactive Digital TV(IDTV) 30 2.666 .958 1.00 5.00 Resource: Results of research data analyze by SPSS
The hypotheses for the comparison across repeated measures are:
11 The score (sig) has to be .05 or less than .05 to be considered significant.

٢٨٥
• Ho: There is no difference between ten E‐Systems (The distributions are the same across repeated measures. H0: µ0 = µ = µ2 = µ3 = ….= µ10
• Ha: There is difference between ten E‐Systems (The distributions across repeated measures are different). Ha: Not all of the means are equal.
• Significance Level is α = 0.01 and Critical Value and Rejection Region reject the null hypothesis is p‐value ≤ 0.01.
Table 4‐12: Iran and Germany Tourism e‐systems Friedman Test Statisticsa
N 30
Chi-Square 146.774
df 9
Asymp. Sig. .000
a. Friedman Test
Note that the test statistic (Fr = Chi‐Square = 146.774) is corrected for the existence of ties in the ranks of the data. Since p‐value = 0.000 ≤ 0.01 = α, we reject the null hypothesis. That means that our null hypothesis is reject and we can with 99% Confidence Level say the "Not all of the means are equal" and there is difference between means of important of the tourism e‐systems in e‐marketing strategy in Iran and Germany.
The following table will be shows the rank of importance of the tourism e‐systems according the views of Iran and Germany's Delphi group members. The Ranks table shows the mean rank for each of the related groups, as shown below:
Table 4‐13: Iran and Germany Tourism E‐systems Ranks with Friedman test
Mean Rank
Global Distribution Systems(GDSs) 6.10
Executive Information Systems(EIS) 3.05
Strategic Information Systems(SIS) 6.02
Decision Support Systems(DSS) 5.43
Management Information Systems(MIS) 6.33
Databases Systems(DB) 8.13
Expert Systems(ES) 4.48
Destination Management Systems (DMS) 5.58
Mobil/WAP Based Systems (MBS) 7.38
Interactive Digital TV(IDTV) 2.48 Resource: Results of research data analyze by SPSS
As can see in over table, the "Databases Systems (DB)" with mean rank "8.13" sits in first Seat. It means that according the views of experts in Iran and Germany this element has more important as others in this category in Iran and Germany
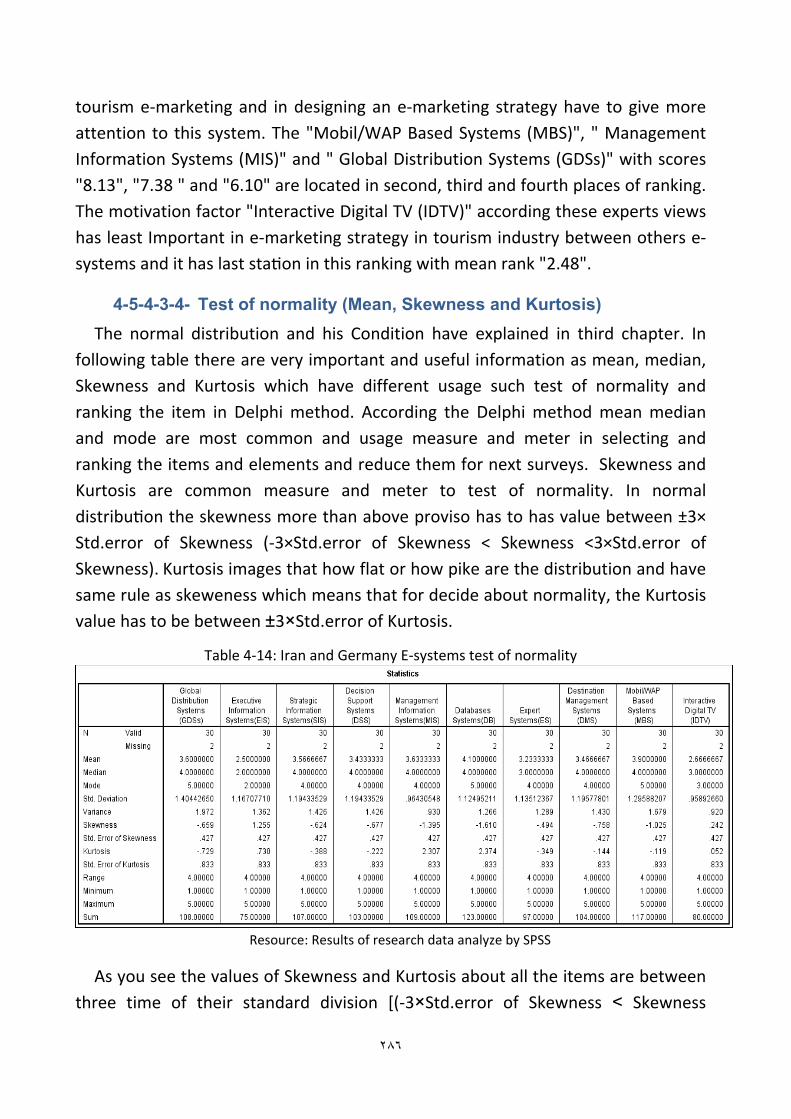
٢٨٦
tourism e‐marketing and in designing an e‐marketing strategy have to give more attention to this system. The "Mobil/WAP Based Systems (MBS)", " Management Information Systems (MIS)" and " Global Distribution Systems (GDSs)" with scores "8.13", "7.38 " and "6.10" are located in second, third and fourth places of ranking. The motivation factor "Interactive Digital TV (IDTV)" according these experts views has least Important in e‐marketing strategy in tourism industry between others e‐systems and it has last sta on in this ranking with mean rank "2.48".
4-5-4-3-4- Test of normality (Mean, Skewness and Kurtosis) The normal distribution and his Condition have explained in third chapter. In
following table there are very important and useful information as mean, median, Skewness and Kurtosis which have different usage such test of normality and ranking the item in Delphi method. According the Delphi method mean median and mode are most common and usage measure and meter in selecting and ranking the items and elements and reduce them for next surveys. Skewness and Kurtosis are common measure and meter to test of normality. In normal distribu on the skewness more than above proviso has to has value between ±3× Std.error of Skewness (‐3×Std.error of Skewness < Skewness <3×Std.error of Skewness). Kurtosis images that how flat or how pike are the distribution and have same rule as skeweness which means that for decide about normality, the Kurtosis value has to be between ±3×Std.error of Kurtosis.
Table 4‐14: Iran and Germany E‐systems test of normality
Resource: Results of research data analyze by SPSS
As you see the values of Skewness and Kurtosis about all the items are between three time of their standard division [(‐3×Std.error of Skewness < Skewness

٢٨٧
<3×Std.error of Skewness) and ‐3×Std.error of Kurtosis < Kurtosis <3×Std.error of Kurtosis)]. It asserts that our distribution is normal and we have normal distribution in e‐systems group in this question and in our research about tourism e‐marketing strategy in Iran and Germany in experts' views who are the member of Delphi group panel. For example, about first e‐system item "Global Distribution Systems (GDSs)" in above table the Skewness is (‐.659). As it has value less than one it shows that it is acceptable and the negative value shows that it has a little bit skew to left. More than as it is between ±3×Std. (±3×.427= ±1.281), we can conclude that it has normal distributions. In other hand, its Kurtosis value is ‐.729 and as it is less than one and between ±3× Std. error of Kurtosis (‐3×.833= ‐2.499 < ‐.729 < 3×.833= 2.499) it prove of null hypothesis about the normality of our distribution.
Figure 4‐8: Bar‐chart of E‐systems average value in Iran and Germany
Resource: Results of research data analyze by Excel
In summary, the overriding aim of the second round of the survey was to determine the importance of the list of effective elements and factors that were derived from the analysis conducted in first survey and Chapter Three. The surveys gave the panel of experts the opportunity to rate and ranks elements, as well as make suggestions and general comments on the impacts. Up diagram is the bar chart of tourism e‐systems average value or mean which help us to better understanding and better analyze about factors and items important ranking according the experts' views in Iran and Germany and decision about them. For

٢٨٨
example it is obvious that the "Databases Systems (DB)" which has the darkest color betweens and 6.10 score stand in the first place of importance in this group.
4‐5‐4‐4‐ Question five: Motivation Factors in Tourism E‐marketing?
• User‐Friendly
• Compressing data and Information
• Security and Trust
• Speed
• Better Information and Intelligently
• Mobility
• Last Minute Price
4‐5‐4‐4‐1‐ Cronbach Reliability Test
This question tries to measure how important have mentioned eight mentioned e‐marketing motivation factors in Germany and Iran. Each ques on was a 5‐point Likert item from "a few important" to "extremely important agree". Because this question of research includes the 5 Likerk scales researcher has used Cronbach's alpha which is the most common measure of internal consistency ("reliability"). It is most commonly used when there are multiple Likert questions in a survey/questionnaire that form a scale and you wish to determine if the scale is reliable.
In order to understand whether the questions in this questionnaire all reliably measure the same latent variable (feeling of safety) (so a Likert scale could be constructed), a Cronbach's alpha was run on a sample size of 30 expert in Germany and Iran which includes 15 expert in each of them. SPSS produces many different tables. The most important table is the Reliability Statistics table that provides the actual value for Cronbach's alpha, as shown below:
Table 4‐15: Motivation factors Reliability Statistics (Cronbach's alpha test) Cronbach's Alpha Cronbach's Alpha Based on Standardized
Items N of Items
.977 .978 7
Resource: Results of research data analyze by SPSS
We can see that in this part about systems, Cronbach's alpha is 0.977, which indicates a high level of internal consistency for our scale with this specific sample about e‐systems important according the experts views in Germany and Iran.

٢٨٩
Essentially this means that respondents who tended to select high scores for one item also tended to select high scores for the others; similarly, respondents who selected a low score for one item tended to select low scores for the other items. Standardized item alpha, also shown in SPSS output above, is the average inter‐item correlation when item variances are equal. The difference between Cronbach's alpha and standardized item alpha is a measure of the dissimilarity of variances among motivation factors items in the set. Following figure shows the Inter‐Item Correlation Matrix about the motivation factors:
Table 4‐16: Motivation factors Inter‐Item Correlation Matrix (Cronbach's alpha test)
Use
r-Frie
ndly
Com
pres
sing
data
Sec
urity
and
Trus
t
Spee
d
Bet
ter
Info
rmat
ion
Mob
ility
Last
Min
ute
Pric
e
User-Friendly 1.000 .900 .864 .896 .920 .915 .861
Compressing data .900 1.000 .769 .893 .899 .908 .878
Security and Trust .864 .769 1.000 .851 .837 .868 .713
Speed .896 .893 .851 1.000 .852 .906 .849
Better Information .920 .899 .837 .852 1.000 .844 .902
Mobility .915 .908 .868 .906 .844 1.000 .825
Last Minute Price .861 .878 .713 .849 .902 .825 1.000 Resource: Results of research data analyze by SPSS
The over table is matrix and shows the motivation factors Inter‐Item Correlation. For example you see that the "Last Minute Price" has low correlation with others than others items. But I have to emphasis here that its less than others but more than .70 is acceptable and more than .85 is good correla on. The "Item‐Total Statistics table" presents us too important information, you see it below:
Table 4‐17: Motivation factors Item‐Total Statistics (Cronbach's alpha test)
Scale Mean if
Item Deleted
Scale Variance
if Item Deleted
Corrected Item-
Total Correlation
Squared Multiple
Correlation
Cronbach's Alpha
if Item Deleted
User-Friendly 22.8333 31.454 .953 .917 .970
Compressing data 22.8667 32.326 .930 .918 .972
Security and Trust 22.0667 33.237 .862 .878 .977
Speed 22.9667 34.102 .931 .889 .972
Better Information 22.5667 33.771 .931 .935 .972
Mobility 22.5333 31.361 .936 .922 .972
Last Minute Price 23.3667 34.378 .884 .875 .975 Resource: Results of research data analyze by SPSS
In The first two columns (Scale Mean if Item Deleted and Scale Variance if Item Deleted) of the up table generally aren't all that useful. The third column
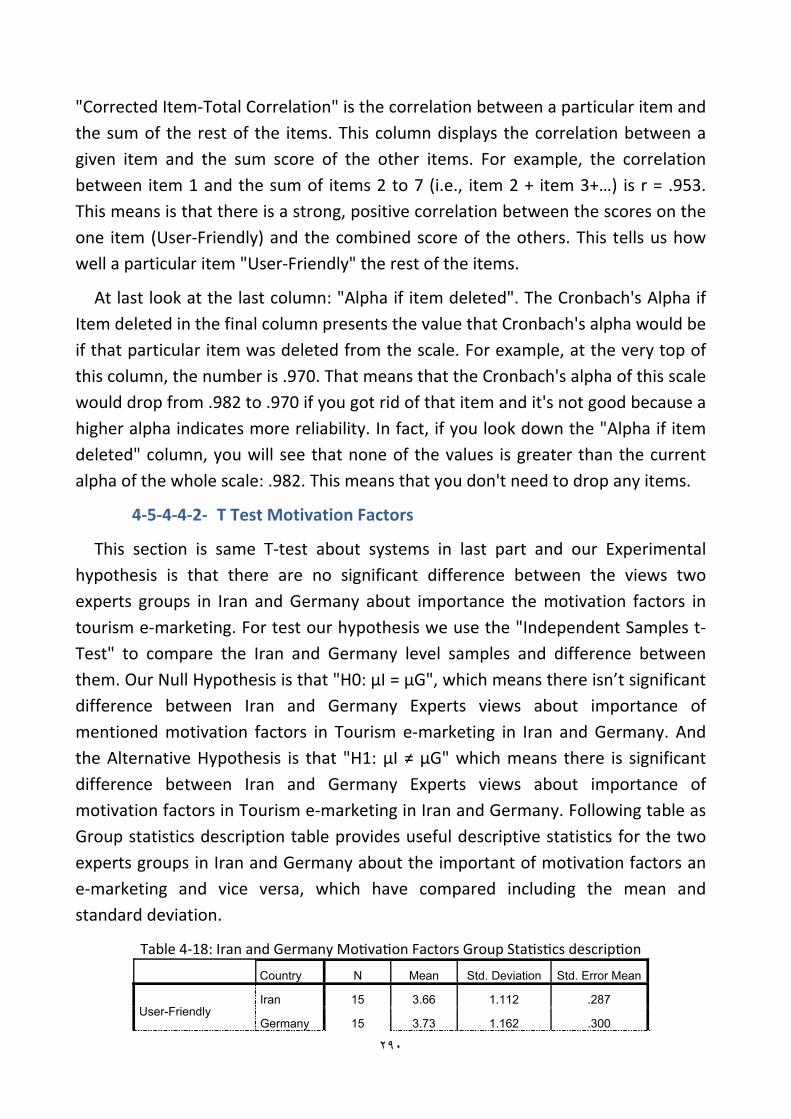
٢٩٠
"Corrected Item‐Total Correlation" is the correlation between a particular item and the sum of the rest of the items. This column displays the correlation between a given item and the sum score of the other items. For example, the correlation between item 1 and the sum of items 2 to 7 (i.e., item 2 + item 3+…) is r = .953. This means is that there is a strong, positive correlation between the scores on the one item (User‐Friendly) and the combined score of the others. This tells us how well a particular item "User‐Friendly" the rest of the items.
At last look at the last column: "Alpha if item deleted". The Cronbach's Alpha if Item deleted in the final column presents the value that Cronbach's alpha would be if that particular item was deleted from the scale. For example, at the very top of this column, the number is .970. That means that the Cronbach's alpha of this scale would drop from .982 to .970 if you got rid of that item and it's not good because a higher alpha indicates more reliability. In fact, if you look down the "Alpha if item deleted" column, you will see that none of the values is greater than the current alpha of the whole scale: .982. This means that you don't need to drop any items.
4‐5‐4‐4‐2‐ T Test Motivation Factors
This section is same T‐test about systems in last part and our Experimental hypothesis is that there are no significant difference between the views two experts groups in Iran and Germany about importance the motivation factors in tourism e‐marketing. For test our hypothesis we use the "Independent Samples t‐Test" to compare the Iran and Germany level samples and difference between them. Our Null Hypothesis is that "H0: μI = μG", which means there isn’t significant difference between Iran and Germany Experts views about importance of mentioned motivation factors in Tourism e‐marketing in Iran and Germany. And the Alternative Hypothesis is that "H1: μI ≠ μG" which means there is significant difference between Iran and Germany Experts views about importance of motivation factors in Tourism e‐marketing in Iran and Germany. Following table as Group statistics description table provides useful descriptive statistics for the two experts groups in Iran and Germany about the important of motivation factors an e‐marketing and vice versa, which have compared including the mean and standard deviation.
Table 4‐18: Iran and Germany Mo va on Factors Group Sta s cs descrip on
Country N Mean Std. Deviation Std. Error Mean
User-Friendly Iran 15 3.66 1.112 .287
Germany 15 3.73 1.162 .300

٢٩١
Compressing data Iran 15 3.60 1.183 .305
Germany 15 3.73 .961 .248
Security and Trust Iran 15 4.33 1.234 .318
Germany 15 4.60 .828 .213
Speed Iran 15 3.46 .990 .255
Germany 15 3.66 .816 .210
Better Information Iran 15 3.93 1.032 .266
Germany 15 4.00 .845 .218
Mobility Iran 15 3.93 1.279 .330
Germany 15 4.06 1.032 .266
Last Minute Price Iran 15 3.13 .990 .25573
Germany 15 3.20 .861 .22254 Resource: Results of research data analyze by SPSS
Because the standard deviations of experts views about motivation factors importance in tourism e‐marketing for the two groups of Iran and Germany experts are almost similar (for example about " User‐Friendly " the 1.11 and 1.16), we will use the "equal variances assumed" test. Only about "Security and Trust (1.23 and .82)" and "Compressing data (1.18 and .96)" there is a little more difference, but they are not so much that effect our results and we discuss about them. The results indicate that there isn't a statistically significant difference between the important of usage motivation factors in Iran and Germany tourism e‐marketing strategy. In other words, these motivation factors in views of Germany's Experts have a same statistically significantly as views of Iran's Experts.
Null Hypothesis: H0: μI = μG (null hypothesis)
Alternative Hypothesis: H1: μI ≠ μG (alternative hypothesis)
Particular hypothesis tested by the t‐test:
‐"reject H0 If |t| > cortical value of t" or – "reject H0 If p (or "sig") < Alpha level"
If the variances are equal in both groups then the P‐value ("Sig.") will be greater than 0.05. However, if the "Sig." value is less than 0.05, the variances are unequal. If we have unequal variances then we need to use the Equal variances not assumed column otherwise you use the Equal variances assumed column. First researcher checks to see if there are similar variances in the two groups by checking the result of Levine's Test for Equality of Variances. To check this, researcher looks at the "Sig." row within Levine's Test for Equality of Variances row:

٢٩٢
Table 4‐19: Iran and Germany Mo va on Factors T‐test description Levene's Test for
Equality of Variances
t-test for Equality of Means
F Sig. t df Sig. (2-tailed)
Mean Difference
Std. Error Difference
95% Confidence
Lower Upper
User-Friendly
Equal variances assumed .030 .863 -.160 28 .874 -.066 .415 -.917 .784
Equal variances not assumed
-.160 27.946 .874 -.066 .415 -.918 .784
Compressing
data
Equal variances assumed .489 .490 -.339 28 .737 -.133 .393 -.939 .672
Equal variances not assumed
-.339 26.872 .737 -.133 .393 -.941 .674
Security and
Trust
Equal variances assumed 1.378 .250 -.695 28 .493 -.266 .383 -1.052 .519
Equal variances not assumed
-.695 24.478 .494 -.266 .383 -1.057 .524
Speed
Equal variances assumed
.322 .575 -.603 28 .551 -.200 .331 -.878 .478
Equal variances not assumed
-.603 27.017 .551 -.200 .331 -.880 .480
Better
Information
Equal variances assumed .165 .688 -.193 28 .848 -.066 .344 -.772 .639
Equal variances not assumed
-.193 26.945 .848 -.066 .344 -.773 .640
Mobility
Equal variances assumed .444 .511 -.314 28 .756 -.133 .424 -1.003 .736
Equal variances not assumed
-.314 26.804 .756 -.133 .424 -1.004 .738
Last Minute
Price
Equal variances assumed .042 .839 -.197 28 .846 -.066 .339 -.761 .627
Equal variances not assumed .030 -.197 27.476 .846 -.066 .339 -.761 .628
Resource: Results of research data analyze by SPSS
As you can see in over table, "Levene's Test for Equality of Variances" for variables shows that F quantities (.030, .489, 1.37 and …) are not significant because the F sig. (.896, .555, .826 and …) are more than .05; therefore "Equal variances assumed" rows will be use to T‐test. The score (sig) has to be .05 or less than .05 to be considered significant.
Under the "t‐test for Equality of Means" look at "sig. (2‐tailed)" for "Equal variances assumed". The scores (.874, .874, .737 and …) are more than .05, therefore with confidence level of 95% there are no significant difference between the means of the two groups. It means with confidence level of 95% there are no significant difference between the means of the two Iran and Germany expert's group's views about the importance of different motivation factors in Tourism e‐marketing strategy in Iran and Germany.
4‐5‐4‐4‐3‐ Friedman Test (Ranking)
As explained in research method chapter, Friedman Test is an alternative to the repeated measures ANOVA, when the assumption of normality or equality of variance is not met. This, like many non‐parametric tests, uses the ranks of the data rather than their raw values to calculate the statistic. Since this test does not make a distribution assumption, it is not as powerful as the ANOVA. If there are only two measures for this test, it is equivalent to the sign test.

٢٩٣
The Friedman Test compares the mean ranks between the related groups and indicates how the groups differed and it is included for this reason. However, you are not very likely to actually report these values in your results section but researchers will report the value for each related group.
A non‐parametric test (distribution‐free) used to compare observations repeated on the same subjects. This is also called a non‐parametric randomized black analysis of variance. And as the numbers of two Delphi panels' members in Iran and Germany are same and it agrees to basic assumptions of using the Friedman Test, we can use this test in our research to ranking the elements.
Table 4‐20: Tourism mo va on factors Friedman test Descrip ve Sta s cs
N Mean Std. Deviation Minimum Maximum
User-Friendly 30 3.700 1.118 1.00 5.00
Compressing data 30 3.666 1.061 1.00 5.00
Security and Trust 30 4.466 1.041 1.00 5.00
Speed 30 3.566 .897 1.00 5.00
Better Information 30 3.966 .927 1.00 5.00
Mobility 30 4.000 1.144 1.00 5.00
Last Minute Price 30 3.166 .912 1.00 5.00 Resource: Results of research data analyze by SPSS
Upper table is a very useful table as it can be used to present descriptive statistics in results section for each of the conditions (depending on study design) for research dependent variable. The test statistic for the Friedman's test is a Chi‐square with a‐1 degrees of freedom, where is the number of repeated measures. degrees of freedom is here (10‐1= 9) nine. When the p‐value for this test is small (usually <0.01) you have evidence to reject the null hypothesis. The hypotheses for the comparison across repeated measures are:
• Ho: There is no difference between seven motivation factors (The distributions are the same across repeated measures. H0: µ0 = µ = µ2 = µ3 = ….= µ7
• Ha: There is difference between seven motivation factors (The distributions across repeated measures are different. Ha: Not all of the means are equal.
• Significance Level is α = 0.01 and Critical Value and Rejection Region reject the null hypothesis is p‐value ≤ 0.01.

٢٩٤
Notice that the hypothesis makes no assumptions about the distribution of the populations. These hypotheses could also be expressed as comparing mean ranks across measures. The null hypothesis in this test is that the distribution of the ranks of each type of score (i.e., reading, writing and math) are the same. To conduct a Friedman test, the data need to be in a long format. Researcher has handles this with SPSS, but in other statistical packages you will have to reshape the data before you can conduct this test.
This is the table which informs us of the actual result of the Friedman Test and whether there was an overall statistically significant difference between the mean ranks of related e‐marketing motivation factors. Look at the follows table:
Table 4‐21: Tourism mo va on factors Friedman test Sta s cs
N 30
Chi-Square 95.472
df 6
Asymp. Sig. .000 Resource: Results of research data analyze by SPSS
Note that the test statistic (Fr = Chi‐Square = 95.472) is corrected for the existence of ties in the ranks of the data. Since p‐value = 0.000 ≤ 0.01 = α, we reject the null hypothesis. That means that our null hypothesis is reject and we can with 99% Confidence Level say the "Not all of the means are equal" and there is difference between them.
The following table will be shows the rank of importance of the tourism e‐marketing motivation factors according the views of experts in both of the Iran and Germany. The Ranks table shows the mean rank for each of the related groups, as shown below:
Table 4‐22: Tourism mo va on factors Friedman test Ranks
Mean Rank
User-Friendly 3.72
Compressing data 3.65
Security and Trust 5.95
Speed 3.27
Better Information 4.62
Mobility 4.68
Last Minute Price 2.12 Resource: Results of research data analyze by SPSS
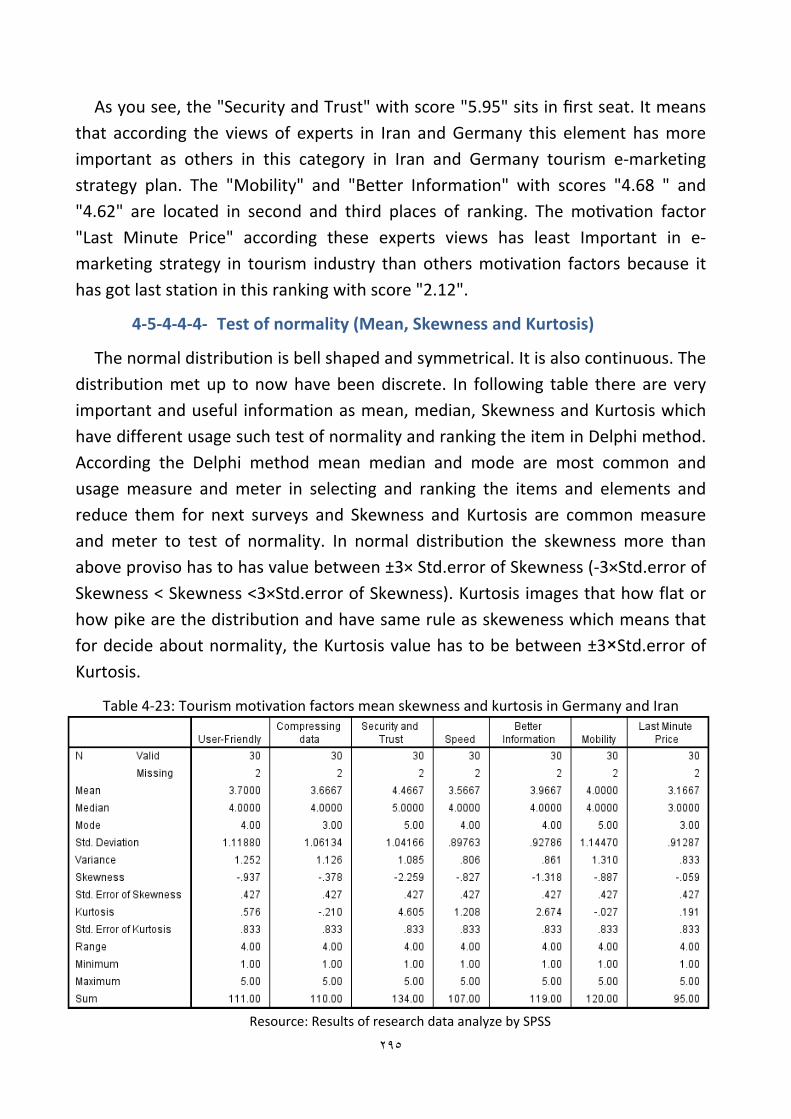
٢٩٥
As you see, the "Security and Trust" with score "5.95" sits in first seat. It means that according the views of experts in Iran and Germany this element has more important as others in this category in Iran and Germany tourism e‐marketing strategy plan. The "Mobility" and "Better Information" with scores "4.68 " and "4.62" are located in second and third places of ranking. The mo va on factor "Last Minute Price" according these experts views has least Important in e‐marketing strategy in tourism industry than others motivation factors because it has got last station in this ranking with score "2.12".
4‐5‐4‐4‐4‐ Test of normality (Mean, Skewness and Kurtosis)
The normal distribution is bell shaped and symmetrical. It is also continuous. The distribution met up to now have been discrete. In following table there are very important and useful information as mean, median, Skewness and Kurtosis which have different usage such test of normality and ranking the item in Delphi method. According the Delphi method mean median and mode are most common and usage measure and meter in selecting and ranking the items and elements and reduce them for next surveys and Skewness and Kurtosis are common measure and meter to test of normality. In normal distribution the skewness more than above proviso has to has value between ±3× Std.error of Skewness (‐3×Std.error of Skewness < Skewness <3×Std.error of Skewness). Kurtosis images that how flat or how pike are the distribution and have same rule as skeweness which means that for decide about normality, the Kurtosis value has to be between ±3×Std.error of Kurtosis.
Table 4‐23: Tourism motivation factors mean skewness and kurtosis in Germany and Iran
Resource: Results of research data analyze by SPSS

٢٩٦
As you see the values of Skewness and Kurtosis about all the items are between three time of their standard division [(‐3×Std.error of Skewness < Skewness <3×Std.error of Skewness) and ‐3×Std.error of Kurtosis < Kurtosis <3×Std.error of Kurtosis)]. It asserts that our distribution is normal and we have normal distribution in motivation factors group in this question and in our research about tourism e‐marketing strategy in Iran and Germany in experts' views who are the member of Delphi group and panel. For example, about first motivation factor in above table the Skewness is (‐.937). As it has value less than one it shows that it is acceptable and the negative value shows that it has a little bit skew to left. More than as it is between ±3×Std. (±3×.427= ±1.281), we can conclude that it has normal distributions. Other hand, its Kurtosis value is .576 and as it is less than one and between ±3× Std. error of Kurtosis (‐3×.833= ‐2.499 < .576 < 3×.833= 2.499) it prove of null hypothesis about the normality of our distribution.
Figure 4‐9: Tourism motivation factors average value bar chart in Germany and Iran
Resource: Results of research data analyze by Excel

٢٩٧
Up diagram is the bar chart of motivation factors average value or mean which help us to better understanding and better analyze about factors and items important ranking according the experts' views in Iran and Germany and decision about them. For example it is obvious that the security and trust which has the darkest color betweens and 6.47 score stand in the first place of importance in this group.
4‐5‐4‐5‐ Question six: Tourism Activities
1. Front Office(Reservation, Check in, Payment)
2. Back Office(Management, Accounting & Payroll)
3. Promotion and advertising
4. Marketing Research
5. Performance Monitoring (Control of Business Processes and Personal)
6. Customers Entertainment and Communication
7. Integration and Partnership
8. Education and Training
4‐5‐4‐5‐1‐ Cronbach Reliability Test
As before researcher use Cronbach's alpha which is the most common measure of internal consistency ("reliability") to considers the reliability of the Delphi group's members' views about Tourism organization's part and activities important in Germany and Iran. It is most commonly used when there are multiple Likert questions in a survey/questionnaire that form a scale and you wish to determine if the scale is reliable. As you see it is suitable to use in this question too because the ques onnaire includes the different ques ons with 5 Likerk scales. Each question was a 5‐point Likert item from "a few important" to "extremely important agree".
In order to understand whether the questions in this questionnaire all reliably measure the same Tourism organization's part and activities variable (so a Likert scale could be constructed), a Cronbach's alpha was run on a sample size of 30 expert in Germany and Iran which includes 15 expert in each of them. The first important table is the Reliability Statistics table that provides the actual value for Cronbach's alpha,:

٢٩٨
Table 4‐24: touris c organiza on's ac vi es Reliability (Cronbach's alpha test)
Cronbach's Alpha Cronbach's Alpha Based on Standardized Items N of Items
.985 .985 8 Resource: Results of research data analyze by SPSS
Man can see that score of tourism activities Cronbach's alpha is 0.985, which indicates a high level of internal consistency for our scale with this specific sample about tourism activities important according the experts views in Germany and Iran. Essentially this means that respondents who tended to select high scores for one item also tended to select high scores for the others; similarly, respondents who selected a low score for one item tended to select low scores for the other items.
Standardized item alpha, also shown in SPSS output above, is the average inter‐item correlation when item variances are equal. The difference between Cronbach's alpha and standardized item alpha is a measure of the dissimilarity of variances among items in the set. In a second use, standardized item alpha can be used to estimate the change in reliability as the number of items in an instrument or scale varies. As it is obvious here both of them are .985 and there is any different between them about tourism organization's activities items.
Table4‐25: touris c organiza on's ac vi es Inter‐Item Correlation Matrix (Cronbach's alpha)
Fron
t Offi
ce(R
eser
vatio
n,
Che
ck in
, Pay
men
t)
Bac
k O
ffice
(Man
agem
ent,
Acc
ount
ing
& P
ayro
ll)
Pro
mot
ion
and
adve
rtisi
ng
Mar
ketin
g R
esea
rch
Per
form
ance
Mon
itorin
g
(Con
trol o
f Bus
ines
s
Pro
cess
es a
nd P
erso
nal)
Cus
tom
ers
Ent
erta
inm
ent
and
Com
mun
icat
ion
Inte
grat
ion
and
Par
tner
ship
Edu
catio
n an
d Tr
aini
ng
Front Office(Reservation, Check in,
Payment) 1.000 .874 .842 .851 .922 .842 .919 .927
Back Office(Management,
Accounting & Payroll) .874 1.000 .936 .878 .865 .880 .868 .889
Promotion and advertising .842 .936 1.000 .862 .886 .936 .864 .915
Marketing Research .851 .878 .862 1.00
0 .841 .857 .918 .909
Performance Monitoring (Control of
Business Processes and Personal) .922 .865 .886 .841 1.000 .904 .933 .920
Customers Entertainment and
Communication .842 .880 .936 .857 .904 1.000 .893 .931
Integration and Partnership .919 .868 .864 .918 .933 .893 1.000 .944
Education and Training .927 .889 .915 .909 .920 .931 .944 1.000 Resource: Results of research data analyze by SPSS
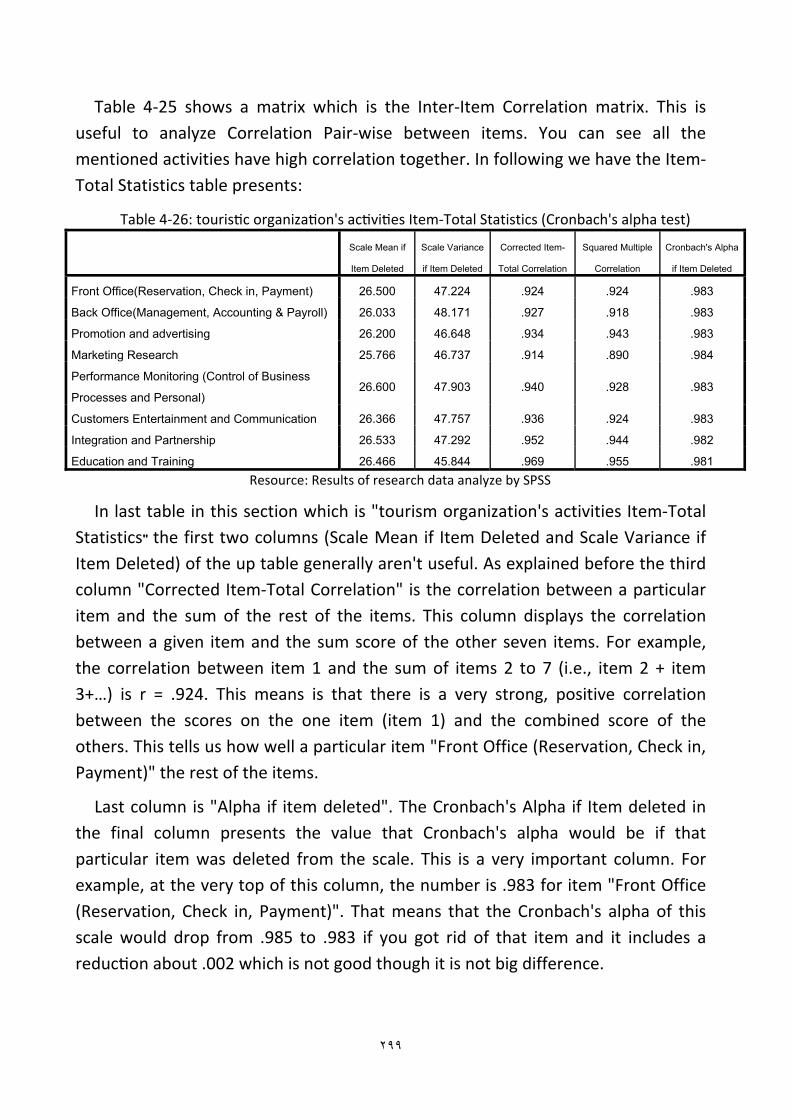
٢٩٩
Table 4‐25 shows a matrix which is the Inter‐Item Correlation matrix. This is useful to analyze Correlation Pair‐wise between items. You can see all the mentioned activities have high correlation together. In following we have the Item‐Total Statistics table presents:
Table 4‐26: touris c organiza on's ac vi es Item‐Total Statistics (Cronbach's alpha test)
Scale Mean if
Item Deleted
Scale Variance
if Item Deleted
Corrected Item-
Total Correlation
Squared Multiple
Correlation
Cronbach's Alpha
if Item Deleted
Front Office(Reservation, Check in, Payment) 26.500 47.224 .924 .924 .983
Back Office(Management, Accounting & Payroll) 26.033 48.171 .927 .918 .983
Promotion and advertising 26.200 46.648 .934 .943 .983
Marketing Research 25.766 46.737 .914 .890 .984
Performance Monitoring (Control of Business
Processes and Personal) 26.600 47.903 .940 .928 .983
Customers Entertainment and Communication 26.366 47.757 .936 .924 .983
Integration and Partnership 26.533 47.292 .952 .944 .982
Education and Training 26.466 45.844 .969 .955 .981 Resource: Results of research data analyze by SPSS
In last table in this section which is "tourism organization's activities Item‐Total Statistics" the first two columns (Scale Mean if Item Deleted and Scale Variance if Item Deleted) of the up table generally aren't useful. As explained before the third column "Corrected Item‐Total Correlation" is the correlation between a particular item and the sum of the rest of the items. This column displays the correlation between a given item and the sum score of the other seven items. For example, the correlation between item 1 and the sum of items 2 to 7 (i.e., item 2 + item 3+…) is r = .924. This means is that there is a very strong, positive correlation between the scores on the one item (item 1) and the combined score of the others. This tells us how well a particular item "Front Office (Reservation, Check in, Payment)" the rest of the items.
Last column is "Alpha if item deleted". The Cronbach's Alpha if Item deleted in the final column presents the value that Cronbach's alpha would be if that particular item was deleted from the scale. This is a very important column. For example, at the very top of this column, the number is .983 for item "Front Office (Reservation, Check in, Payment)". That means that the Cronbach's alpha of this scale would drop from .985 to .983 if you got rid of that item and it includes a reduc on about .002 which is not good though it is not big difference.

٣٠٠
4‐5‐4‐5‐2‐ Tourism Activities T test (compare)
For find that ob there is difference between expert views in Iran and Germany about important the e‐marketing in different tourism parts and activities our Experimental hypothesis is that there are no significant difference between the views two experts groups in Iran and Germany about the tourism activities important in tourism e‐marketing strategy. For test our hypothesis we use the "Independent Samples t‐Test" to compare the Iran and Germany level samples and difference between them. Our Null Hypothesis is that "H0: μI = μG", which means there isn’t significant difference between Iran and Germany Experts views about importance of mentioned tourism activities in Tourism e‐marketing in Iran and Germany. And the Alternative Hypothesis is that "H1: μI ≠ μG " which means there is significant difference between Iran and Germany Experts views in Iran and Germany. Following table as Group statistics description table provides useful descriptive statistics for the two experts groups in Iran and Germany about the importance of tourism organization's parts and tourism activities an e‐marketing and vice versa, which have compared including the mean and standard deviation.
Table 4‐27: Iran and Germany Tourism ac vi es Group Sta s cs descrip on
Country N Mean Std.
Deviation
Std. Error
Mean
Front Office(Reservation, Check in, Payment) Iran 15 3.533 1.060 .273
Germany 15 3.600 1.055 .272
Back Office(Management, Accounting & Payroll) Iran 15 4.000 1.069 .276
Germany 15 4.066 .883 .228
Promotion and advertising Iran 15 3.800 1.146 .296
Germany 15 3.933 1.032 .266
Marketing Research Iran 15 4.266 1.099 .283
Germany 15 4.333 1.112 .287
Performance Monitoring (Control of Business
Processes and Personal)
Iran 15 3.400 1.055 .272
Germany 15 3.533 .915 .236
Customers Entertainment and Communication Iran 15 3.600 1.055 .272
Germany 15 3.800 .941 .243
Integration and Partnership Iran 15 3.466 1.060 .273
Germany 15 3.600 .985 .254
Education and Training Iran 15 3.600 1.121 .289
Germany 15 3.600 1.121 .28950 Resource: Results of research data analyze by SPSS
Because the standard deviations of experts views about importance of tourism activities in tourism e‐marketing for the two groups of Iran and Germany are

٣٠١
almost similar (for example about "Front Office" they are (1.06 and 1.05), we will use the "equal variances assumed" test. The results indicate that there isn't a statistically significant difference between the important of tourism organization's activities in Iran and Germany tourism e‐marketing. In other words, mentioned activities in views of Germany's Experts have a same statistically significantly as views of Iran's Experts.
Null Hypothesis: H0: μI = μG (null hypothesis)
Alternative Hypothesis: H1: μI ≠ μG (alternative hypothesis)
Particular hypothesis tested by the t‐test: ‐ reject H0 If p (or "sig") < Alpha level
The first thing we need to do is check to see if we have similar variances in the two groups by checking the result of Levine's Test for Equality of Variances. To check this, we look at the "Sig." row within Levine's Test for Equality of Variances row:
Table 4‐28: Iran and Germany Tourism ac vi es T‐test description
Resource: Results of research data analyze by SPSS
"Levene's Test for Equality of Variances" for variables shows that F quantities (.002, .029, .057, …) are not significant because the F sig.(.969, .867, .813 and …) are more than .05; therefore "Equal variances assumed" rows will be use to T‐test The score (sig) has to be .05 or less than .05 to be considered significant.
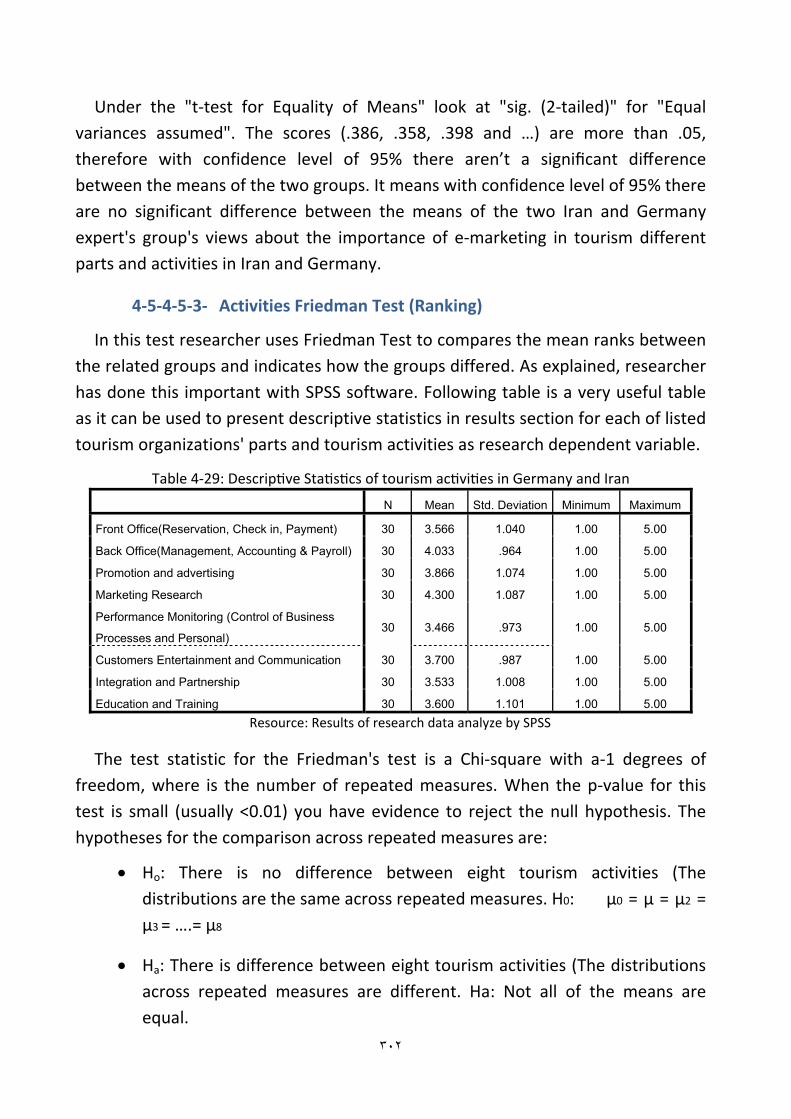
٣٠٢
Under the "t‐test for Equality of Means" look at "sig. (2‐tailed)" for "Equal variances assumed". The scores (.386, .358, .398 and …) are more than .05, therefore with confidence level of 95% there aren’t a significant difference between the means of the two groups. It means with confidence level of 95% there are no significant difference between the means of the two Iran and Germany expert's group's views about the importance of e‐marketing in tourism different parts and activities in Iran and Germany.
4‐5‐4‐5‐3‐ Activities Friedman Test (Ranking)
In this test researcher uses Friedman Test to compares the mean ranks between the related groups and indicates how the groups differed. As explained, researcher has done this important with SPSS software. Following table is a very useful table as it can be used to present descriptive statistics in results section for each of listed tourism organizations' parts and tourism activities as research dependent variable.
Table 4‐29: Descrip ve Sta s cs of tourism ac vi es in Germany and Iran
N Mean Std. Deviation Minimum Maximum
Front Office(Reservation, Check in, Payment) 30 3.566 1.040 1.00 5.00
Back Office(Management, Accounting & Payroll) 30 4.033 .964 1.00 5.00
Promotion and advertising 30 3.866 1.074 1.00 5.00
Marketing Research 30 4.300 1.087 1.00 5.00
Performance Monitoring (Control of Business
Processes and Personal) 30 3.466 .973 1.00 5.00
Customers Entertainment and Communication 30 3.700 .987 1.00 5.00
Integration and Partnership 30 3.533 1.008 1.00 5.00
Education and Training 30 3.600 1.101 1.00 5.00 Resource: Results of research data analyze by SPSS
The test statistic for the Friedman's test is a Chi‐square with a‐1 degrees of freedom, where is the number of repeated measures. When the p‐value for this test is small (usually <0.01) you have evidence to reject the null hypothesis. The hypotheses for the comparison across repeated measures are:
• Ho: There is no difference between eight tourism activities (The distributions are the same across repeated measures. H0: µ0 = µ = µ2 = µ3 = ….= µ8
• Ha: There is difference between eight tourism activities (The distributions across repeated measures are different. Ha: Not all of the means are equal.

٣٠٣
• Significance Level is α = 0.01 and Critical Value and Rejection Region reject the null hypothesis is p‐value ≤ 0.01.
Notice that the hypothesis makes no assumptions about the distribution of the populations. The null hypothesis in this test is that the distribution of the ranks of each type of score (i.e., reading, writing and math) are the same. This is the table which informs us of the actual result of the Friedman Test and whether there was an overall statistically significant difference between the mean ranks of related Tourism e‐marketing activities.
Table 4‐30: Friedman Test Sta s csa of tourism ac vi es in Germany and Iran N 30 Chi-Square 89.381 df 7 Asymp. Sig. .000 a. Friedman Test
Note that the test statistic (Fr = Chi‐Square = 89.381 and df=8‐1=7) is corrected for the existence of ties in the ranks of the data. Since p‐value = 0.000 ≤ 0.01 = α, we reject the null hypothesis. That means that our null hypothesis is reject and we can with 99% Confidence Level say the "Not all of the means are equal" and there is difference between tourism activities and company's segmentations.
Table 4‐31: Ranks of tourism ac vi es in Germany and Iran
Mean Rank
Front Office(Reservation, Check in, Payment) 3.77
Back Office(Management, Accounting & Payroll) 5.60
Promotion and advertising 4.93
Marketing Research 6.60
Performance Monitoring (Control of Business Processes and Personal) 3.37
Customers Entertainment and Communication 4.27
Integration and Partnership 3.60
Education and Training 3.87 Resource: Results of research data analyze by SPSS
The table point that "Marke ng Research" with score "6.60" stands in first place. It means that according the views of experts in Iran and Germany this element has more important as others in this category in Iran and Germany tourism e‐marketing strategy plan than others activities. The "Back Office (Management, Accoun ng & Payroll)" and "Promo on and adver sing" with scores "5.60" and "4.93" are located in second and third places of ranking. The mo va on factor "Last Minute Price" according these experts views has undermost place and

٣٠٤
Important between tourism e‐marketing strategy activities than others motivation factors because it has last sta on in this ranking with score "3.37".
4‐5‐4‐5‐4‐ Test of normality (Mean, Skewness and Kurtosis)
The distribution met up to now have been normal. A distribution is normal if the variable takes dis nct values such as 1, 2, 3, … and Skewness and Kurtosis are between their Std.error Celtic cross ±3. According the Delphi method mean median and mode are most common and usage measure and meter in selecting and ranking the items and elements and reduce them for next surveys and Skewness and Kurtosis are common measure and meter to test of normality. In normal distribution the skewness more than above proviso has to has value between ±3× Std.error of Skewness (‐3×Std.error of Skewness < Skewness <3×Std.error of Skewness). Kurtosis images that how flat or how pike are the distribution and have same rule as skeweness which means that for dicede about normality, the Kurtosis value has to be between ±3×Std.error of Kurtosis.
Table 4‐32: Tourism activities mean median mode, skewness and kurtosis in Germany and Iran
Resource: Results of research data analyze by SPSS
As you see the values of Skewness and Kurtosis about all the items are between three time of their standard division [(‐3×Std.error of Skewness < Skewness <3×Std.error of Skewness) and ‐3×Std.error of Kurtosis < Kurtosis <3×Std.error of Kurtosis)]. It asserts that our distribution is normal and we have normal distribution in tourism activities group in this question and in our research about tourism e‐marketing strategy in Iran and Germany. For example, about first motivation factor in above table the Skewness is (‐.584). As it has value less than one it shows that it is acceptable and the negative value shows that it has a little

٣٠٥
bit skew to left. More than as it is between ±3×Std. (±3×.427= ±1.281), we can conclude that it has normal distributions. Other hand, its Kurtosis value is .788 and as it is less than one and between ±3× Std. error of Kurtosis (‐3×.833= ‐2.499 < .788 < 3×.833= 2.499) it prove of null hypothesis about the normality of our distribution.
Figure 4‐10: Tourism activities average value chart bar in Germany and Iran
Resource: Results of research data analyze by Excel
Up diagram is the bar chart of tourism activities average value or mean which help us to better understanding and better analyze about factors and items important ranking according the experts' views in Iran and Germany and decision about them. For example it is obvious fourth item "Marketing Research" which has the darkest color betweens and 6.30 score stand in the first place of importance in this group.

٣٠٦
4‐5‐4‐6‐ Question seven: This question includes the three different parts and questions. First was "How is
Importance of each of the following elements to design and successfully performance E‐marketing Strategy in tourism industry?"
4‐5‐4‐6‐1‐ Environmental Effective Elements;
1. IT and Telecommunication Infrastructure Costs
2. General IT Knowledge and Culture in Society
3. Market (Capability, Potential, Turbulence, Orientation)
4. Competition Intensity and Competitors' Strategies
5. Availability of Resource and Environmental Opportunity
6. E‐Tourism Value‐Chain Players Power and Impacts
7. Human Resources Market (IT & E‐Marketing Specialist)
8. Government's IT and E‐Commerce Policy, Laws, Rules
9. Technology and IT Systems Standards, Innovation, Capabilities and Turbulence
10. Business and Marketing Models Changes (Time &Process)
4‐5‐4‐6‐1‐1‐ Cronbach Reliability Test Researcher has here a devised a question with which they hope to measure how
important have found e‐marketing environmental effective elements in Iran and Germany tourism. Each question was a 7‐point Likert item from "a few important" to "extremely important agree". In order to understand whether the questions in this questionnaire all reliably measure the same latent variable (so a Likert scale could be constructed), a Cronbach's alpha was run on a sample size of 30 expert in Germany and Iran which includes 15 expert in each of them.
Cronbach's alpha is the most common measure of internal consistency ("reliability"). It is most commonly used when there are multiple Likert questions in a survey/questionnaire that form a scale and you wish to determine if the scale is reliable. As you see it is suitable to use in this research because the question includes the 7 Likerk scales. For this test SPSS produces many different tables. The first important table is the Reliability Statistics table that provides the actual value for Cronbach's alpha, as shown in follow:
Table 4‐33: Tourism environmental effec ve elements Reliability Sta s cs (Cronbach's Alpha)
Cronbach's Alpha Cronbach's Alpha Based on Standardized Items N of Items
.994 .994 10 Resource: Results of research data analyze by SPSS

٣٠٧
About this question, Cronbach's alpha is 0.994, which indicates a very high level of internal consistency for our scale with this specific sample about tourism e‐marketing environmental effective elements important. It means also that 99% of variance in this score would be considers true score. Essentially this means that respondents who tended to select high scores for one item also tended to select high scores for the others and vice versa. Thus, knowing the score for one Task Value item would enable one to predict with some accuracy the possible scores for the other items.
Table 4‐34: Tourism environmental elements Reliability Inter‐Item Correlation Matrix Germany and Iran
IT a
nd T
elec
omm
unic
atio
n In
frast
ruct
ure
Cos
ts
Gen
eral
IT K
now
ledg
e an
d C
ultu
re in
Soc
iety
Mar
ket (
Cap
abili
ty,
Pot
entia
l, Tu
rbul
ence
, O
rient
atio
n)
Com
petit
ion
Inte
nsity
and
C
ompe
titor
s' S
trate
gies
Ava
ilabi
lity
of R
esou
rce
and
Env
ironm
enta
l Opp
ortu
nity
E-T
ouris
m V
alue
-Cha
in
Pla
yers
Pow
er a
nd Im
pact
s
Hum
an R
esou
rces
Mar
ket
(IT &
E-M
arke
ting
Spe
cial
ist)
Gov
ernm
ent I
T an
d E
-C
omm
erce
Pol
icy,
Law
s,
Rul
es
Tech
nolo
gy a
nd IT
Sys
tem
s S
tand
ards
, Inn
ovat
ion,
C
apab
ilitie
s an
d Tu
rbul
ence
Bus
ines
s an
d M
arke
ting
Mod
els
Cha
nges
(Tim
e &
Pro
cess
)
IT and Telecommunication Infrastructure Costs 1.00 .957 .913 .935 .978 .947 .956 .950 .943 .949
General IT Knowledge and Culture in Society .957 1.00 .939 .936 .962 .954 .956 .953 .972 .951
Market (Capability, Potential, Turbulence,
Orientation) .913 .939 1.00 .879 .914 .956 .957 .967 .954 .905
Competition Intensity and Competitors'
Strategies .935 .936 .879 1.00 .944 .923 .918 .908 .918 .947
Availability of Resource and Environmental
Opportunity .978 .962 .914 .944 1.00 .951 .959 .949 .959 .953
E-Tourism Value-Chain Players Impacts .947 .954 .956 .923 .951 1.00 .973 .985 .973 .942
Human Resources Market .956 .956 .957 .918 .959 .973 1.00 .971 .984 .933
Government's IT and E-Commerce Policy, Rules .950 .953 .967 .908 .949 .985 .971 1.00 .970 .939
Technology and IT Systems Standards,
Innovation, Capabilities and Turbulence .943 .972 .954 .918 .959 .973 .984 .970 1.00 .948
Business and Marketing Models Changes .949 .951 .905 .947 .953 .942 .933 .939 .948 1.00Resource: Results of research data analyze by SPSS
Table 4‐34 is matrix which shows the Inter‐Item Correlation. After analyze their ranking and average value if there are some variables with same scores, researcher will use this and next tables for design next questionnaire (AHP questionnaire) to reduce the items and will delete items which have low correlation with others. For example which has low correlation with others than others items and if in next steps it has same average value and rank with one others and we would like do
٣٠٨
delete one of them for next questionnaire we select this one. The next table presents The Item‐Total Statistics, as you can see in following:
Table4‐35: Tourism environmental effec ve elements Item‐Total Statistics about Germany and Iran
Sca
le M
ean
if
Item
Del
eted
Sca
le
Var
ianc
e if
Item
Del
eted
Cor
rect
ed
Item
-Tot
al
Cor
rela
tion
Squ
ared
Mul
tiple
Cor
rela
tion
Cro
nbac
h's
Alp
ha if
Item
Del
eted
IT and Telecommunication Infrastructure Costs 47.433 162.04 .971 .975 .994
General IT Knowledge and Culture in Society 47.333 165.67 .977 .970 .993
Market (Capability, Potential, Turbulence, Orientation) 47.600 171.42 .952 .949 .994
Competition Intensity and Competitors' Strategies 47.700 164.42 .944 .929 .994
Availability of Resource and Environmental Opportunity 47.433 166.32 .977 .972 .993
E-Tourism Value-Chain Players Power and Impacts 47.600 165.49 .979 .977 .993
Human Resources Market (IT & E-Marketing Specialist) 47.466 166.25 .980 .984 .993
Government's IT and E-Commerce Policy, Laws, Rules 47.600 167.35 .978 .981 .993
Technology and IT Systems Standards, Innovation, and Turbulence 47.466 166.80 .982 .988 .993
Business and Marketing Models Changes (Time &Process) 48.166 166.48 .964 .951 .993 Resource: Results of research data analyze by SPSS
The first two columns (Scale Mean if Item Deleted and Scale Variance if Item Deleted) of the up table generally aren't much important in this case. The third column "Corrected Item‐Total Correlation" is the correlation between a particular item and the sum of the rest of the items. This column displays the correlation between a given item and the sum score of the other items. For example, the correla on between item 1 and the sum of items 2 to 10 is r = .975. This means is that there is a strong, positive correlation between the scores on the one item (item 1) and the combined score of the others. This tells us how well a particular item "IT and Telecommunication Infrastructure Costs" the rest of the items. If this number is weak and close to zero, then you should consider removing the item from your scale because it is not measuring the same thing as the rest of the items.
The last column is "Alpha if item deleted which presents the value that Cronbach's alpha would be if that particular item was deleted from the scale. We can see that removal of any question doesn't result to big change in Cronbach's alpha. This is a very important column. You can see that happens any big thing and difference in whole score if researcher got rid each of that item. This means that you don't need to drop any items but we need to attend to this table in designing the next questionnaire when we want to reduce the items and delete some of them.

٣٠٩
4‐5‐4‐6‐1‐2‐ Environmental Effective Elements T Test (compare)
For this section as before our Experimental hypothesis is that there are no significant difference between the views two experts groups in Iran and Germany about importance the environmental tourism e‐marketing strategy effective elements. For test our hypothesis we use the "Independent Samples t‐Test" to compare the Iran and Germany level samples and difference between them. Our Null Hypothesis is that "H0: μI = μG", which means there isn’t significant difference between Iran and Germany Experts views about importance of found environmental effective elements in Iran and Germany. And the Alternative
Hypothesis is that "H1: μI ≠ μG " which means there is significant difference between Iran and Germany Experts views about important of mentioned tourism e‐marketing strategy environmental effective elements in Iran and Germany. Following table as Group statistics description table provides useful descriptive statistics for the two experts groups in Iran and Germany about their important in tourism e‐marketing strategy.
Table 4‐36: Iran and Germany Tourism environmental elements Group Sta s cs descrip on
Country N Mean Std.
Deviation
Std. Error
Mean
IT and Telecommunication Infrastructure Costs Iran 15 5.266 1.830 .472
Germany 15 5.600 1.454 .375
General IT Knowledge and Culture in Society Iran 15 5.466 1.597 .412
Germany 15 5.600 1.404 .362
Market (Capability, Potential, Turbulence, Orientation) Iran 15 5.200 1.424 .367
Germany 15 5.333 1.175 .303
Competition Intensity and Competitors' Strategies Iran 15 5.000 1.772 .457
Germany 15 5.333 1.397 .360
Availability of Resource and Environmental Opportunity Iran 15 5.266 1.667 .430
Germany 15 5.600 1.242 .320
E-Tourism Value-Chain Players Power and Impacts Iran 15 5.200 1.567 .404
Germany 15 5.333 1.447 .373
Government's IT and E-Commerce Policy, Laws, Rules Iran 15 5.200 1.567 .404
Germany 15 5.333 1.290 .333
Human Resources Market (IT & E-Marketing Specialist) Iran 15 5.266 1.624 .419
Germany 15 5.533 1.302 .336
Technology and IT Systems Standards, Innovation,
Capabilities and Turbulence
Iran 15 5.333 1.543 .398
Germany 15 5.466 1.355 .350
Business and Marketing Models Changes (Time &Process) Iran 15 4.600 1.502 .387
Germany 15 4.800 1.473 .380 Resource: Results of research data analyze by Spss
٣١٠
Because the standard deviations of experts views about tourism e‐marketing environmental element importance in its strategy for the two groups of Iran and Germany are almost similar (for example about " Government's IT and E‐Commerce Policy, Laws, Rules)" the 1.56 and 1.29), we will use the "equal variances assumed" test. The results indicate that there isn't a statistically significant difference between the important of environmental elements on tourism e‐marketing strategy in Iran and Germany. In other words, environmental effective elements in views of Germany's Experts have a same statistically significantly as views of Iran's Experts.
Null Hypothesis: H0: μI = μG and Alternative Hypothesis: H1: μI ≠ μG
If the variances are equal in both groups then the P‐value ("Sig.") will be greater than 0.05. However, if the "Sig." value is less than 0.05, the variances are unequal. If we have unequal variances then we need to use the Equal variances not assumed column otherwise you use the Equal variances assumed column.
The first thing we need to do is check to see if we have similar variances in the two groups by checking the result of Levine's Test for Equality of Variances. To check this, we look at the "Sig." row within Levine's Test for Equality of Variances row:
Table 4‐37: Iran and Germany Tourism environmental effec ve elements T‐test description
Resource: Results of research data analyze by SPSS

٣١١
"Levene's Test for Equality of Variances" for variables shows that F quantities (.556, .093, .189, …) are not significant because the F Sig.(.462, .762, .557 and …) are more than .05; therefore "Equal variances assumed" rows will be use to T‐test The score (Sig) has to be .05 or less than .05 to be considered significant.
Under the "t‐test for Equality of Means" look at "sig. (2‐tailed)" for "Equal variances assumed". The scores are more than .05, therefore with confidence level of 95% there aren’t a significant difference between the means of the two groups. It means with confidence level of 95% there are no significant difference between the means of the two Iran and Germany expert's group's views about the importance of different Tourism e‐marketing strategy environmental elements in Iran and Germany.
4‐5‐4‐6‐1‐3‐ Environmental Effective Elements Friedman Test (Ranking)
We use here too the Friedman Test compares the mean ranks between the related groups and indicates how the groups differed. This is also called a non‐parametric randomized black analysis of variance. Because the number of two Delhi panels' members in Iran and Germany are same and it agrees to basic assumptions of using the Friedman Test, we can use this test in our research to ranking the elements.
You can see in following a table which shows descriptive statistics in results section for each of the tourism marketing environmental effective elements as research dependent variable.
Table 4‐38: Tourism environmental effec ve elements important Friedman test Descrip ve Sta s cs
N Mean Std. Deviation Minimum Maximum
IT and Telecommunication Infrastructure Costs 30 5.433 1.633 1.00 7.00
General IT Knowledge and Culture in Society 30 5.533 1.479 1.00 7.00
Market (Capability, Potential, Turbulence, Orientation) 30 5.266 1.284 1.00 7.00
Competition Intensity and Competitors' Strategies 30 5.166 1.577 1.00 7.00
Availability of Resource and Environmental Opportunity 30 5.433 1.454 1.00 7.00
E-Tourism Value-Chain Players Power and Impacts 30 5.266 1.484 1.00 7.00
Human Resources Market (IT & E-Marketing Specialist) 30 5.400 1.452 1.00 7.00
Government's IT and E-Commerce Policy, Laws, Rules 30 5.266 1.412 1.00 7.00

٣١٢
Technology and IT Systems Standards, Innovation, Capabilities 30 5.400 1.428 1.00 7.00
Business and Marketing Models Changes (Time &Process) 30 4.700 1.465 1.00 7.00
Resource: Results of research data analyze by Spss
The following table will be shows the rank of importance of the tourism e‐marketing strategy environmental elements according the experts' views in Germany and Iran. Blow Ranks table shows the mean rank for each of the related groups, as shown below:
Table 4‐39: Tourism environmental effec ve elements important Ranks with Friedman test
Mean Rank
IT and Telecommunication Infrastructure Costs 6.28
General IT Knowledge and Culture in Society 6.70
Market (Capability, Potential, Turbulence, Orientation) 5.37
Competition Intensity and Competitors' Strategies 4.90
Availability of Resource and Environmental Opportunity 6.23
E-Tourism Value-Chain Players Power and Impacts 5.40
Human Resources Market (IT & E-Marketing Specialist) 6.05
Government's IT and E-Commerce Policy, Laws, Rules 5.40
Technology and IT Systems Standards, Innovation, Capabilities and Turbulence 6.05
Business and Marketing Models Changes (Time &Process) 2.62 Resource: Results of research data analyze by Spss
In rank table the "General IT Knowledge and Culture in Society" with mean rank "6.28" and "IT and Telecommunica on Infrastructure Costs" with score "6.28" sit in first and second seats. It means that according the views of experts in Iran and Germany this element has more important as others tourism e‐marketing environmental elements in Iran and Germany. The "Availability of Resource and Environmental Opportunity" and "Technology and IT Systems Standards, Innova on, Capabili es and Turbulence" with scores "6.23" and "6.05" are located in second and third place of ranking. The motivation factor "Business and Marketing Models Changes (Time &Process)" according these panels members' views has took bottommost Importance between these environmental elements in Germany and Iran e‐marketing strategy in tourism industry and it has last place in this ranking with mean rank "2.62".
The test statistic for the Friedman's test is a Chi‐square with a‐1 degrees (10‐1=9) of freedom, where is the number of repeated measures. When the p‐value for this test is small (usually <0.01) you have evidence to reject the null hypothesis. The hypotheses for the comparison across repeated measures are:

٣١٣
• Ho: There is no difference between ten environmental effective elements (The distributions are the same across repeated measures. H0: µ0= µ= µ2= µ3= ….= µ10
• Ha: There is difference between ten environmental effective elements (The distributions across repeated measures are different.
• Significance Level is α = 0.01 and Cri cal Value and Rejec on Region reject the null hypothesis is p‐value ≤ 0.01.
The null hypothesis in this test is that the distribution of the ranks of each type of score (i.e., reading, writing and math) are the same. To conduct a Friedman test, the data need to be in a long format. Researcher has handles this with SPSS. This is the table informs us of the actual result of the Friedman Test and whether there was an overall statistically significant difference between the mean ranks of related environmental effective elements on tourism e‐marketing strategies. Have look at the following table:
Table 4‐40: Environmental effective elements important Friedman Test Statisticsa
N 30
Chi-Square 86.895
df 9
Asymp. Sig. .000 Resource: research analyze result by SPSS
In table stands that the test statistic (Fr = Chi‐Square = 86.895) is corrected for the existence of ties in the ranks of the data. Since p‐value = 0.000 ≤ 0.01 = α, we reject the null hypothesis. That means that our null hypothesis is reject and we can with 99% Confidence Level say the "Not all of the means are equal" and there is difference between means experts' views about the environmental elements important.
4‐5‐4‐6‐1‐4‐ Test of normality (Mean, skewness and kurtosis)
For test of normality researcher has used the result of skewness and kurtosis. In following table there are very important and useful information as mean, median, Skewness and Kurtosis which have different usage such test of normality and ranking the item in Delphi method. According the Delphi method mean median and mode are common and usage measure and meter in selecting and ranking the items and elements and reduce them for next surveys. Skewness and Kurtosis are common measure and meter to test of normality. In normal distribution the

٣١٤
skewness more than following proviso has to has value between ±3× Std.error of Skewness (‐3×Std.error of Skewness < Skewness <3×Std.error of Skewness). Kurtosis images that how flat or how pike are the distribution and have same rule as skeweness which means that for decide about normality Kurtosis value has to be between ±3×Std.error of Kurtosis.
Table 4‐41: Environmental elements mean, skewness and kurtosis in Germany and Iran
Resource: Results of research data analyze by SPSS
As you see the values of Skewness and Kurtosis about some the items are between three time of their standard division error [(‐3×Std.error of Skewness < Skewness <3×Std.error of Skewness) and ‐3×Std.error of Kurtosis < Kurtosis <3×Std.error of Kurtosis)]. It asserts that our distribution is normal and we have normal distribution in environmental effective elements group in this question and in our research about tourism e‐marketing strategy in Iran and Germany in experts' views who are the member of Delphi group and panel. For example, about first environmental element in above table the Skewness is (‐1.221). As it has nega ve value we can say that it has a little bit skew to left. More than as it is between ±3×Std. (±3×.427= ±1.281), we can conclude that it has normal distributions. Other hand, its Kurtosis value is 1.052 and as it is between ±3× Std. error of Kurtosis (‐3×.833= ‐2.499 < 1.052 < 3×.833= 2.499) it prove of null hypothesis about the normality of our distribution. But About some others elements the skewness and kurtosis values are more than 3× their Std. division (such as item three "Market Capability, Potential, Turbulence, Orientation" which are ‐1.792 and

٣١٥
4.061) and it means about such items we have skew in distribution and it has so mach pike format.
Figure 4‐11: Environmental effec ve elements average value bar chart in Germany and Iran
Resource: Results of research data analyze by Excel
Up diagram is the bar chart of environmental effective elements average value or mean which help us to better understanding and better analyze about elements and items important ranking according the experts' views in Iran and Germany and decision about them. For example it is obvious that the "General IT Knowledge and Culture in Society" which has the darkest color betweens and 5.53 score stand in the first place of importance in this group.
4‐5‐4‐6‐2‐ Companies' Elements; 1. Products and Services Quality and Variety
2. Web Marketing Mix Strategy
3. Resource Availability (Finance, Technology etc)
4. Brand and Branding Strategy
5. Relationship and Strategic Alliances
6. Customer Segmentation and Targeting
7. Firm Specialists Employers Skills and Education
8. Restructuring and reengineering the processes
9. Firm IT Infrastructure Station and Orientation
10. Firm Competitive Advantages in E‐Marketing
11. Innovation support and Knowledge Management
12. Increased Web Traffic and Stickiness

٣١٦
4‐5‐4‐6‐2‐1‐ Cronbach Reliability Test Cronbach's alpha is the most common measure of internal consistency
("reliability"). It is most commonly used when there are multiple Likert questions in a survey/questionnaire that form a scale and you wish to determine if the scale is reliable. Researcher has here a devised a question with which they hope to measure how important have mentioned twelve company effective elements in Iran and Germany tourism e‐marketing. Each question was a 7‐point Likert item from "a few important" to "extremely important agree". In order to understand whether the questions in this questionnaire all reliably measure the same latent variable (feeling of safety) (so a Likert scale could be constructed), a Cronbach's alpha was run on a sample size of 30 expert in Germany and Iran which includes 15 expert in each of Iran and Germany. The first important table in usage the SPSS output is the Reliability Statistics table that provides the actual value for Cronbach's alpha, as following:
Table 4‐42: Companies' Elements Reliability Sta s cs
Cronbach's Alpha Cronbach's Alpha Based on
Standardized Items
N of Items
.995 .995 12 Resource: Results of research data analyze by SPSS
We can see that in this part about Firms' activities important, Cronbach's alpha is 0.995, which indicates a very high level of internal consistency for our scale with this specific sample about firm's e‐marketing effective elements important according the Germany and Iran's experts' views. (Note that a reliability coefficient of .70 or higher is considered "acceptable" in most social science research situations.)
Standardized item alpha, also shown in SPSS output above, is the average inter‐item correlation when item variances are equal. The difference between Cronbach's alpha and standardized item alpha is a measure of the dissimilarity of variances among items in the set. In a second use, standardized item alpha can be used to estimate the change in reliability as the number of items in an instrument or scale varies.

٣١٧
Table 4‐43: Companies' Elements Inter‐Item Correlation Matrix P
rodu
cts
and
Ser
vice
s Q
ualit
y an
d V
arie
ty
Web
Mar
ketin
g M
ix S
trate
gy
Res
ourc
e A
vaila
bilit
y (F
inan
ce, T
echn
olog
y et
c)
Bra
nd a
nd B
rand
ing
Stra
tegy
Rel
atio
nshi
p an
d S
trate
gic
Alli
ance
s
Cus
tom
er S
egm
enta
tion
and
Targ
etin
g
Firm
Spe
cial
ists
Em
ploy
ers
Ski
lls a
nd E
duca
tion
Res
truct
urin
g an
d re
engi
neer
ing
the
proc
esse
s
Firm
IT In
frast
ruct
ure
Sta
tion
and
Orie
ntat
ion
Firm
Com
petit
ive
Adv
anta
ges
in E
-Mar
ketin
g
Inno
vatio
n su
ppor
t and
Kno
wle
dge
Man
agem
ent
Incr
ease
d W
eb T
raffi
c an
d S
ticki
ness
Products and Services Quality and Variety 1.00 .950 .961 .925 .901 .947 .941 .954 .950 .941 .947 .889
Web Marketing Mix Strategy .950 1.00 .948 .936 .939 .950 .941 .970 .964 .963 .945 .908
Resource Availability (Finance, Technology
etc) .961 .948 1.00 .931 .932 .930 .925 .943 .943 .943 .933 .885
Brand and Branding Strategy .925 .936 .931 1.00 .910 .966 .973 .955 .965 .954 .980 .903
Relationship and Strategic Alliances .901 .939 .932 .910 1.00 .929 .922 .937 .931 .927 .923 .941
Customer Segmentation and Targeting .947 .950 .930 .966 .929 1.00 .982 .957 .954 .947 .976 .899
Firm Specialists Employers Skills and
Education .941 .941 .925 .973 .922 .982 1.00 .973 .968 .958 .994 .910
Restructuring and reengineering the
processes .954 .970 .943 .955 .937 .957 .973 1.00 .993 .974 .977 .926
Firm IT Infrastructure Station and Orientation .950 .964 .943 .965 .931 .954 .968 .993 1.00 .980 .971 .922
Firm Competitive Advantages in E-Marketing .941 .963 .943 .954 .927 .947 .958 .974 .980 1.00 .959 .924
Innovation support and Knowledge
Management .947 .945 .933 .980 .923 .976 .994 .977 .971 .959 1.00 .915
Increased Web Traffic and Stickiness .889 .908 .885 .903 .941 .899 .910 .926 .922 .924 .915 1.00Resource: Results of research data analyze by SPSS
The below Table is matrix which shows the Inter‐Item Correlation. After analyze their ranking and average value if there is some variables with same scores, researcher can use this table for next questionnaire (AHP questionnaire) to reduces the items and delete items which have low correlation with others. For example you see that the "Increased Web Traffic and Stickiness" has low correlation with others items than others. It means that if in next steps it has same average value and rank with one others and we want do delete one of them for next questionnaire we select this one. The Item‐Total Statistics table presents, as shown below:

٣١٨
Table 4‐44: Companies' Elements Item‐Total Statistics
Scale Mean if
Item Deleted
Scale
Variance if
Item Deleted
Corrected
Item-Total
Correlation
Squared
Multiple
Correlation
Cronbach's
Alpha if Item
Deleted
Products and Services Quality and Variety 58.466 257.913 .961 .969 .995
Web Marketing Mix Strategy 58.600 261.076 .972 .970 .994
Resource Availability (Finance, Technology etc) 58.266 265.720 .958 .964 .995
Brand and Branding Strategy 58.500 259.500 .971 .984 .994
Relationship and Strategic Alliances 58.666 267.678 .949 .958 .995
Customer Segmentation and Targeting 58.400 259.352 .975 .982 .994
Firm Specialists Employers Skills and Education 58.500 257.017 .980 .993 .994
Restructuring and reengineering the processes 58.666 260.644 .987 .995 .994
Firm IT Infrastructure Station and Orientation 58.700 260.148 .985 .994 .994
Firm Competitive Advantages in E-Marketing 58.800 260.372 .978 .971 .994
Innovation support and Knowledge Management 58.533 257.568 .984 .994 .994
Increased Web Traffic and Stickiness 59.533 263.430 .931 .927 .995 Resource: Results of research data analyze by SPSS
Like before same tables, the first two columns (Scale Mean if Item Deleted and Scale Variance if Item Deleted) of the up table generally aren't so useful and researcher doesn’t attend them here. The third column "Corrected Item‐Total Correlation" is the correlation between a particular item and the sum of the rest of the items. This column displays the correlation between a given item and the sum score of the other items. For example, the correlation between item 1 and the sum of items 2 to 12 (i.e., item 2 + item 3+…) is r = .969. This means is that there is a strong, posi ve correla on between the scores on the one item (item 1) and the combined score of the others. This tells us how well a particular item "Products and Services Quality and Variety" the rest of the items. The last column which named "Alpha if item deleted" presents the value that Cronbach's alpha would be if that particular item was deleted from the scale. We can see that removal of any question doesn't result to big change in Cronbach's alphaThis is a very important column.
4‐5‐4‐6‐2‐2‐ Firms' Effective Elements T Test (compare)
For discuss about the difference between the expert's views in Iran and Germany about the company's e‐marketing effective elements in tourism industry, research's Experimental hypothesis is that there are no significant differences between the views two experts groups in Iran and Germany about importance the touristic firm's effective elements. For test our hypothesis researcher uses the "Independent Samples t‐Test" to compare the Iran and Germany level samples and

٣١٩
difference between them. the Null Hypothesis is that "H0: μI = μG", which means there isn’t significant difference between Iran and Germany Experts views about importance of mentioned elements in Tourism e‐marketing strategy in Iran and Germany. And the Alternative Hypothesis is that "H1: μI ≠ μG " which means there is significant difference between Iran and Germany Experts views about importance of mentioned firm's effective elements in Tourism e‐marketing in Iran and Germany. Following table as Group statistics description table provides useful descriptive statistics for the two experts groups in Iran and Germany about the importance of company's e‐marketing effective elements in an touristic companies' strategy and vice versa, which have compared including the mean and standard deviation.
Table 4‐45: Iran and Germany Company's effec ve elements Group Sta s cs descrip on
Country N Mean Std. Deviation
Std. Error Mean
Products and Services Quality and Variety Iran 15 5.466 1.684 .434 Germany 15 5.533 1.597 .412
Web Marketing Mix Strategy Iran 15 5.266 1.624 .419 Germany 15 5.466 1.407 .363
Resource Availability (Finance, Technology etc) Iran 15 5.600 1.594 .411 Germany 15 5.800 1.146 .296
Brand and Branding Strategy Iran 15 5.333 1.759 .454 Germany 15 5.600 1.352 .349
Relationship and Strategic Alliances Iran 15 5.200 1.521 .392 Germany 15 5.400 1.121 .289
Customer Segmentation and Targeting Iran 15 5.466 1.641 .423 Germany 15 5.666 1.496 .386
Firm Specialists Employers Skills and Education Iran 15 5.333 1.759 .454 Germany 15 5.600 1.502 .387
Restructuring and reengineering the processes Iran 15 5.200 1.656 .427 Germany 15 5.400 1.352 .349
Firm IT Infrastructure Station and Orientation Iran 15 5.200 1.656 .427 Germany 15 5.333 1.397 .360
Firm Competitive Advantages in E-Marketing Iran 15 5.066 1.579 .407 Germany 15 5.266 1.486 .383
Innovation support and Knowledge Management Iran 15 5.333 1.759 .454 Germany 15 5.533 1.457 .376
Increased Web Traffic and Stickiness Iran 15 4.266 1.533 .396 Germany 15 4.600 1.454 .375
Resource: Results of research data analyze by SPSS
Because the standard deviations of experts views about firm's effective elements importance in e‐marketing strategy for the two groups of Iran and Germany's tourism marketing experts are almost similar (for example about " Customer Segmentation and Targeting" the 1.64 and 1.49), we will use the "equal variances assumed" test. The results indicate that there isn't a statistically significant difference between the important of usage company's elements Iran and Germany. In other words, Effective firm's e‐marketing effective elements in
٣٢٠
views of Germany's Experts have a same statistically significantly as views of Iran's Experts.
Null Hypothesis: H0: μI = μG; and Alternative Hypothesis: H1: μI ≠ μG
Particular hypothesis tested by the t‐test:
‐ reject H0 If p (or "sig") < Alpha level
The first thing we need to do is check to see if we have similar variances in the two groups by checking the result of Levine's Test for Equality of Variances. If the variances are equal in both groups then the P‐value ("Sig.") will be greater than 0.05. However, if the "Sig." value is less than 0.05, the variances are unequal. If we have unequal variances then we need to use the Equal variances not assumed column otherwise you use the Equal variances assumed column. To check this, researcher looks at the "Sig." row within Levine's Test for Equality of Variances row:
Table 4‐46: Iran and Germany Company's effec ve elements T‐test description
Resource: Results of research data analyze by SPSS
The results of "Levene's Test for Equality of Variances" for variables shows that F quantities (.052, .155, .725, and …) are not significant because the F sig(.822, .597, .402,and …) are more than .05; therefore "Equal variances assumed" rows will be

٣٢١
use to T‐test The score (sig) has to be .05 or less than .05 to be considered significant.
Under the "t‐test for Equality of Means" look at "sig. (2‐tailed)" for "Equal variances assumed". The scores are more than .05, therefore with confidence level of 95% there aren’t a significant difference between the means of the two groups. It means with confidence level of 95% there are no significant difference between the means of the two Iran and Germany expert's group's views about the importance of different firm's effective elements in Tourism e‐marketing strategy in Iran and Germany.
4‐5‐4‐6‐2‐3‐ Firms' Effective Elements Friedman Test (ranking)
Here with using the Friedman Test researcher compares the mean ranks between the related firm's tourism e‐marketing strategy's effective elements and indicates how the elements differed and it is included for this reason. The number of two experts' panels' members in Iran and Germany are same and it agrees to basic assumptions of using the Friedman Test, so we can use this test in our research to ranking the elements. The table which you see down is a useful table that presents descriptive statistics in results section for each of the company's effective elements as research dependent variable in this part.
Table 4‐47: company's effec ve elements important Friedman Test Descrip ve Sta s cs
N Mean Std. Deviation Minimum Maximum
Products and Services Quality and Variety 30 5.500 1.613 1.00 7.00
Web Marketing Mix Strategy 30 5.366 1.496 1.00 7.00
Resource Availability (Finance, Technology etc) 30 5.700 1.368 1.00 7.00
Brand and Branding Strategy 30 5.466 1.547 1.00 7.00
Relationship and Strategic Alliances 30 5.300 1.317 1.00 7.00
Customer Segmentation and Targeting 30 5.566 1.546 1.00 7.00
Firm Specialists Employers Skills and Education 30 5.466 1.613 1.00 7.00
Restructuring and reengineering the processes 30 5.300 1.489 1.00 7.00
Firm IT Infrastructure Station and Orientation 30 5.266 1.507 1.00 7.00
Firm Competitive Advantages in E-Marketing 30 5.166 1.510 1.00 7.00
Innovation support and Knowledge Management 30 5.433 1.590 1.00 7.00
Increased Web Traffic and Stickiness 30 4.433 1.478 1.00 7.00 Resource: Results of research data analyze by SPSS
The test statistic for the Friedman's test is a Chi‐square with a‐1 degrees of freedom, where is the number of repeated measures. When the p‐value for this
٣٢٢
test is small (usually <0.01) you have evidence to reject the null hypothesis. The hypotheses for the comparison across repeated measures are:
• Ho: There is no difference between twelve firm's elements (The distributions are the same across repeated measures. H0: µ0 = µ = µ2 = µ3 = ….= µ11
• Ha: There is difference between twelve firm's elements (The distributions across repeated measures are different. Ha: Not all of the means are equal.
• Significance Level is α = 0.01 and Critical Value and Rejection Region reject the null hypothesis is p‐value ≤ 0.01.
The null hypothesis in this test is that the distributions of the ranks of each type of score are the same. To conduct a Friedman test, the data need to be in a long format. Researcher has handles this with SPSS. Following table is the table which informs us of the actual result of the Friedman Test and whether there was an overall statistically significant difference between the mean ranks of related tourism firm's e‐marketing strategy effective elements.
Table 4‐48: Company's effective elements important Friedman Test Statisticsa N 30
Chi-Square 134.039 df 11
Asymp. Sig. .000
Note that in the 11 degrees of freedom, the test statistic (Fr = Chi‐Square = 134.039) is corrected for the existence of es in the ranks of the data. Since p‐value = 0.000 ≤ 0.01 = α, we reject the null hypothesis. That means that our null hypothesis is reject and we can with 99% Confidence Level say the "The distributions across repeated measures are different" and there is difference between them.
Table4‐49: Ranks of company's effec ve elements important Friedman Test
Mean Rank
Products and Services Quality and Variety 7.43
Web Marketing Mix Strategy 6.63
Resource Availability (Finance, Technology etc) 8.50
Brand and Branding Strategy 7.18
Relationship and Strategic Alliances 6.27
Customer Segmentation and Targeting 7.77
Firm Specialists Employers Skills and Education 7.20
Restructuring and reengineering the processes 6.27

٣٢٣
Firm IT Infrastructure Station and Orientation 6.07
Firm Competitive Advantages in E-Marketing 5.48
Innovation support and Knowledge Management 7.02
Increased Web Traffic and Stickiness 2.18 Resource: Results of research data analyze by SPSS
The up mentioned table shows the rank of importance of the tourism e‐marketing company's effective elements according the views of in both of the Iran and Germany experts. The Ranks table shows the mean rank for each of the related groups. As you see, the "Customer Segmentation and Targeting", "Products and Services Quality and Variety" and "Firm Specialists Employers Skills and Education" with scores "7.77", "7.43" and "7.20" sit in first to third seats. It means that according the views of experts in Iran and Germany these elements have more important than others in this category in Iran and Germany tourism e‐marketing strategy. The "Innovation support and Knowledge Management" and "Brand and Branding Strategy" with scores "7.18" and "7.02" are located in next places of ranking. The effective elements "Increased Web Traffic and Stickiness" with big difference than others according these experts views has least Important in e‐marketing strategy in tourism industry than others company's effective factors and it has last sta on in this ranking with "2.18" rank mean score.
4‐5‐4‐6‐2‐4‐ Test of normality (Average Value, Mean, Median and Mode)
For test of normality researcher has used the result of skewness and kurtosis. In following table there are very important and useful information as mean, median, Skewness and Kurtosis which have different usage such test of normality and ranking the item in Delphi method. According the Delphi method mean median and mode are common and usage measure and meter in selecting and ranking the items and elements and reduce them for next surveys. Skewness and Kurtosis are common measure and meter to test of normality. In normal distribution the skewness has to has value between ±3× Std. error of Skewness (‐3×Std.error of Skewness < Skewness <3×Std.error of Skewness). Kurtosis images that how flat or how pike are the distribution and have same rule as skeweness.

٣٢٤
Table 4‐50: Firms' effec ve elements mean, skewness and kurtosis in Germany and Iran
Resource: Results of research data analyze by SPSS
As table shows the values of Skewness and Kurtosis about some the items are between three time of their standard division error [(‐3×Std.error of Skewness < Skewness <3×Std.error of Skewness) and (‐3×Std.error of Kurtosis < Kurtosis <3×Std.error of Kurtosis)]. It asserts that our distribution is normal and we have normal distribution in company's effective elements group in this question and in our research about tourism e‐marketing strategy in Iran and Germany in experts' views who are the member of Delphi group and panel. For example, about last element in above table "Increased Web Traffic and Stickiness" the Skewness is (‐.135). As it has nega ve value we can say that it has a little bit skew to left. More than as it is between ±3×Std. (±3×.427= ±1.281), we can conclude that it has normal distributions. Other hand, its Kurtosis value is.012 and as it is between ±3× Std. error of Kurtosis (‐3×.833= ‐2.499 <.012 < 3×.833= 2.499) it prove of null hypothesis about the normality of our distribution. But About some others elements the skewness and kurtosis values are more than 3× their Std. division (such as item three " Resource Availability (Finance, Technology etc)" and which are skew=‐1.749 and kurtosis=3.799) and it means about such items we have skew in distribution and kurtosis shows so pike format in form.

٣٢٥
Figure 4‐12: Firms' effec ve elements average value bar chart in Germany and Iran
Resource: Results of research data analyze by Excel
Above diagram is the bar chart of firm's effective elements average value or mean which help us to better understanding and better analyze about factors and items important ranking according the experts' views in Iran and Germany and decision about them. For example it is obvious that the third element " Resource Availability (Finance, Technology etc)" which has the darkest color betweens and 5.70 score stand in the first place of importance in this group.
4‐5‐4‐6‐3‐ Customers (Tourists) Satisfaction Effective Elements
1. Web and brand Reliability, Security, Privacy and Trust
2. Website (Attraction, Design, Availability, and Quality)
3. Transmission Speed and Conversion Rate
4. Tourists Needs, Experience and Expects in Market
5. E‐Shopping Facility and Support 6. Products and Service Quality, Variety and Innovation 7. Product & Service Flexibility and Individualization 8. Cost and Price Advantage for Customers
9. Customization (Service and CRM Coverage Level)
10. Perceived Added Value by Customers
4‐5‐4‐6‐3‐1‐ Customer cronbach reliability Test
As researcher has used 7 Likerk scales for this ques on to measure how important have mentioned ten customers' effective elements on tourism e‐marketing in Iran and Germany tourism parts according the exerts' views; the Cronbach's alpha is

٣٢٦
right test to analyze the reliability. Cronbach's alpha is the most common measure of internal consistency ("reliability"). It is most commonly used when there are multiple Likert questions in a survey/questionnaire that form a scale and you wish to determine if the scale is reliable. Here has a devised a question with a 7‐point Likert for customer elements from "a few important" to "extremely important agree". In order to understand whether the questions in this questionnaire all reliably measure the variables (so a Likert scale could be constructed), a Cronbach's alpha was run on a sample size of 30 expert in Germany and Iran which includes 15 expert in each of them. The first important table which offers the SpSS software is the Reliability Statistics table that provides the actual value for Cronbach's alpha, as shown below:
Table 4‐51: Customers (Tourists) Sa sfac on Effec ve Elements Reliability Sta s cs
Cronbach's Alpha Cronbach's Alpha Based on
Standardized Items
N of Items
.993 .994 10 Resource: Results of research data analyze by Spss
The analyze results of Cronbach's alpha in this part about customers'(tourists) effective elements importance, Cronbach's alpha is 0.993, which indicates too very high level of internal consistency for our scale with this specific sample about consumers' effective elements important according the experts views in Germany and Iran. It means also that 99,3% of variability are in composite score by companying 10 item or we can say that 99,3% of variance in this score would be considers true score. Essentially this means that respondents who tended to select high scores for one item also tended to select high scores for the others; similarly, respondents who selected a low score for one item tended to select low scores for the other items. Thus, knowing the score for one Task Value item would enable one to predict with some accuracy the possible scores for the other nine Task Value items.
Standardized item alpha, also shown above, is the average inter‐item correlation when item variances are equal. The difference between Cronbach's alpha and standardized item alpha is a measure of the dissimilarity of variances among items in the set. In a second use, standardized item alpha can be used to estimate the change in reliability as the number of items in an instrument or scale varies.

٣٢٧
Table 4‐52: Customers (Tourists) Satisfaction Effective Elements Inter‐Item Correlation Matrix
Web
and
bra
nd R
elia
bilit
y,
Sec
urity
and
Tru
st
Web
site
(Attr
actio
n, D
esig
n
and
Qua
lity)
Tran
smis
sion
Spe
ed a
nd
Con
vers
ion
Rat
e
Tour
ists
Nee
ds, E
xper
ienc
e
and
Exp
ects
E-S
hopp
ing
Faci
lity
and
Sup
port
Pro
duct
s an
d S
ervi
ce
Qua
lity,
Var
iety
and
Pro
duct
& S
ervi
ce F
lexi
bilit
y
and
Indi
vidu
aliz
atio
n
Cos
t and
Pric
e A
dvan
tage
for C
usto
mer
s
Cus
tom
izat
ion
(Ser
vice
and
CR
M L
evel
)
Per
ceiv
ed A
dded
Val
ue b
y
Cus
tom
ers
Web and brand Reliability, Security and Trust 1.00 .934 .876 .980 .894 .948 .961 .945 .936 .927
Website (Attraction, Design and Quality) .934 1.00 .938 .940 .937 .931 .946 .969 .940 .955
Transmission Speed and Conversion Rate .876 .938 1.00 .886 .970 .907 .945 .928 .939 .949
Tourists Needs, Experience and Expects .980 .940 .886 1.00 .904 .925 .957 .952 .935 .940
E-Shopping Facility and Support .894 .937 .970 .904 1.00 .928 .948 .947 .952 .964
Products and Service Variety and Innovation .948 .931 .907 .925 .928 1.00 .934 .961 .968 .944
Product & Service Flexibility and
Individualization .961 .946 .945 .957 .948 .934 1.00 .943 .949 .962
Cost and Price Advantage for Customers .945 .969 .928 .952 .947 .961 .943 1.00 .968 .945
Customization (Service and CRM Level) .936 .940 .939 .935 .952 .968 .949 .968 1.00 .964
Perceived Added Value by Customers .927 .955 .949 .940 .964 .944 .962 .945 .964 1.00 Resource: Results of research data analyze by SPSS
Table 4‐52 is matrix, which shows the Inter‐Item Correlation. After analyze their ranking and average value if there is some variables with same scores, researcher will use this table for next questionnaire (AHP questionnaire) to reduces the items and will delete items which have low correlation with others. For example each one has low correlation with others and if in next steps it has same average value and rank with one others and we want do delete one of them for next questionnaire we select this one. The underneath table presents The "Item‐Total Statistics":
Table 4‐53: Customers (Tourists) Sa sfac on Effec ve Elements Item‐Total Statistics
Scale Mean if
Item Deleted
Scale
Variance if
Item Deleted
Corrected
Item-Total
Correlation
Squared
Multiple
Correlation
Cronbach's
Alpha if Item
Deleted
Web and brand Reliability, Security, Privacy and Trust 49.400 174.593 .959 .987 .993 Website (Attraction, Design, Availability, and Quality) 49.833 178.282 .969 .971 .992 Transmission Speed and Conversion Rate 50.433 179.978 .949 .964 .993 Tourists Needs, Experience and Expects in Market 49.366 177.137 .961 .983 .993 E-Shopping Facility and Support 50.300 178.424 .962 .969 .993 Products and Service Quality, Variety and Innovation 49.800 170.166 .964 .972 .993 Product & Service Flexibility and Individualization 50.133 178.326 .976 .976 .992 Cost and Price Advantage for Customers 49.666 175.471 .978 .985 .992 Customization (Service and CRM Coverage Level) 49.866 173.223 .977 .972 .992 Perceived Added Value by Customers 50.100 175.748 .976 .979 .992
Resource: Results of research data analyze by SPSS

٣٢٨
As explained the first two columns (Scale Mean if Item Deleted and Scale Variance if Item Deleted) of the up table generally aren't useful for us here. We go to the third column which named "Corrected Item‐Total Correlation" and is the correlation between a particular item and the sum of the rest of the items. This column displays the correlation between a given item and the sum score of the other items. For example, the correla on between item 1 and the sum of items 2 to 10 (i.e., item 2 + item 3+…) is r = .987. This means is that there is a strong, posi ve correla on between the scores on the one item (item 1) and the combined score of the others. This tells us how well a particular item "Web and brand Reliability, Security, Privacy and Trust" the rest of the items.
The Cronbach's Alpha if Item deleted in the final column presents the value that Cronbach's alpha would be if that particular item was deleted from the scale. We can see that removal of any question doesn't result to big change in Cronbach's alpha. This is a very important column. About customers effective elements all of them are .992 or .993 and we will have any difference if we got rid each of that items. This means that you don't need to drop any items.
4‐5‐4‐6‐3‐2‐ Customers (Tourists) Satisfaction Effective Elements T Test
Research Experimental hypothesis in this section is that there are no significant difference between the views two experts groups in Iran and Germany about importance of tourists satisfaction's effective elements on tourism e‐marketing strategy. For test our hypothesis we use the "Independent Samples t‐Test" to compare the Iran and Germany level samples and difference between them. Our Null Hypothesis is that "H0: μI = μG", which means there isn’t significant difference between Iran and Germany Experts views about importance of mentioned Tourism e‐marketing effective elements in customer's satisfaction side in Iran and Germany. And the Alternative Hypothesis is that "H1: μI ≠ μG " which means there is significant difference between Iran and Germany Experts views about importance of these customers side effective elements in Tourism e‐marketing in Iran and Germany. Following table as Group statistics description table provides useful descriptive statistics for the two experts groups in Iran and Germany about the importance of these elements an e‐marketing and vice versa, which have compared including the mean and standard deviation.
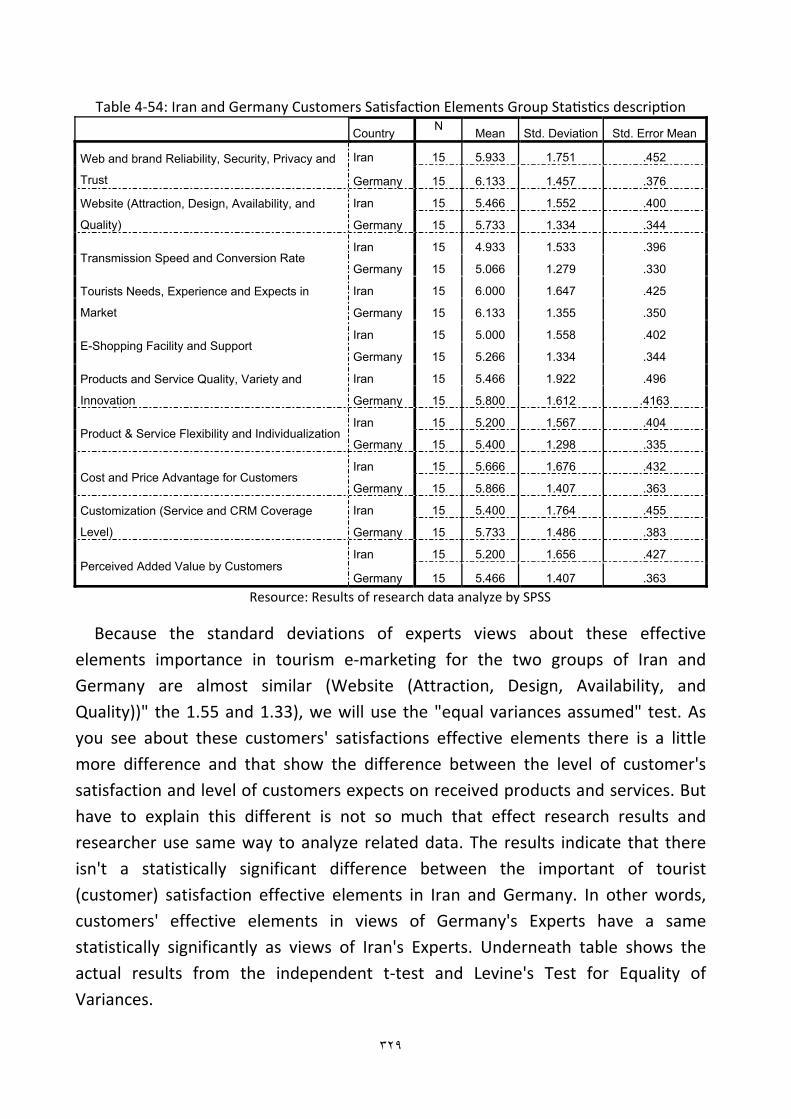
٣٢٩
Table 4‐54: Iran and Germany Customers Sa sfac on Elements Group Sta s cs descrip on
Country N Mean Std. Deviation Std. Error Mean
Web and brand Reliability, Security, Privacy and
Trust
Iran 15 5.933 1.751 .452
Germany 15 6.133 1.457 .376
Website (Attraction, Design, Availability, and
Quality)
Iran 15 5.466 1.552 .400
Germany 15 5.733 1.334 .344
Transmission Speed and Conversion Rate Iran 15 4.933 1.533 .396
Germany 15 5.066 1.279 .330
Tourists Needs, Experience and Expects in
Market
Iran 15 6.000 1.647 .425
Germany 15 6.133 1.355 .350
E-Shopping Facility and Support Iran 15 5.000 1.558 .402
Germany 15 5.266 1.334 .344
Products and Service Quality, Variety and
Innovation
Iran 15 5.466 1.922 .496
Germany 15 5.800 1.612 .4163
Product & Service Flexibility and Individualization Iran 15 5.200 1.567 .404
Germany 15 5.400 1.298 .335
Cost and Price Advantage for Customers Iran 15 5.666 1.676 .432
Germany 15 5.866 1.407 .363
Customization (Service and CRM Coverage
Level)
Iran 15 5.400 1.764 .455
Germany 15 5.733 1.486 .383
Perceived Added Value by Customers Iran 15 5.200 1.656 .427
Germany 15 5.466 1.407 .363 Resource: Results of research data analyze by SPSS
Because the standard deviations of experts views about these effective elements importance in tourism e‐marketing for the two groups of Iran and Germany are almost similar (Website (Attraction, Design, Availability, and Quality))" the 1.55 and 1.33), we will use the "equal variances assumed" test. As you see about these customers' satisfactions effective elements there is a little more difference and that show the difference between the level of customer's satisfaction and level of customers expects on received products and services. But have to explain this different is not so much that effect research results and researcher use same way to analyze related data. The results indicate that there isn't a statistically significant difference between the important of tourist (customer) satisfaction effective elements in Iran and Germany. In other words, customers' effective elements in views of Germany's Experts have a same statistically significantly as views of Iran's Experts. Underneath table shows the actual results from the independent t‐test and Levine's Test for Equality of Variances.

٣٣٠
Table 4‐55: Iran and Germany Customers Sa sfac on Effec ve Elements T‐test description
Resource: Results of research data analyze by SPSS
In Upper table the "Levene's Test for Equality of Variances" for variables shows that F quantities (.104, .265, .151, …) are not significant because the F sig.(.749, .609, .700 and …) are more than .05; therefore "Equal variances assumed" rows will be use to T‐test The score (sig) has to be .05 or less than .05 to be considered significant.
With attend to Particular hypothesis tested by the t‐test, which means we ((‐ reject H0 If p (or "sig") < Alpha level)) and look at "sig. (2‐tailed)" for "Equal variances assumed" Under the "t‐test for Equality of Means"; we can see that the scores (.736, .736, .616, and …) are more than .05, therefore with confidence level of 95% there aren’t a significant difference between the means of the two groups. It means with confidence level of 95% there are no significant difference between the means of the two Iran and Germany expert's group's views about the importance of customers' satisfaction effective elements in Tourism e‐marketing strategy in Iran and Germany.

٣٣١
4‐5‐4‐6‐3‐3‐ Tourists Satisfaction Effective Elements Friedman Test
As explained in research method before, researcher uses Friedman. This, like many non‐parametric tests, uses the ranks of the data rather than their raw values to calculate the statistic. If there are only two measures for this test, it is equivalent to the sign test. The Friedman Test compares the mean ranks between the related groups and indicates how the groups differed and it is included for this reason. It is a non‐parametric test (distribution‐free) and used to compare observations repeated on the same subjects. This is also called a non‐parametric randomized black analysis of variance. Because the number of two Delhi panels' members in Iran and Germany are same and it agrees to basic assumptions of using the Friedman Test, we allow using this test in this research to ranking the elements.
Table 4‐56: Customers Satisfaction Elements Group Friedman Test Descriptive Statistics
N Mean Std. Deviation Minimum Maximum
Web and brand Reliability, Security, Privacy and Trust 30 6.033 1.586 1.00 7.00
Website (Attraction, Design, Availability, and Quality) 30 5.600 1.428 1.00 7.00
Transmission Speed and Conversion Rate 30 5.000 1.389 1.00 7.00
Tourists Needs, Experience and Expects in Market 30 6.066 1.484 1.00 7.00
E-Shopping Facility and Support 30 5.133 1.431 1.00 7.00
Products and Service Quality, Variety and Innovation 30 5.633 1.751 1.00 7.00
Product & Service Flexibility and Individualization 30 5.300 1.417 1.00 7.00
Cost and Price Advantage for Customers 30 5.766 1.524 1.00 7.00
Customization (Service and CRM Coverage Level) 30 5.566 1.612 1.00 7.00
Perceived Added Value by Customers 30 5.333 1.516 1.00 7.00 Resource: Results of research data analyze by SPSS
Upper table presents descriptive statistics in results section for each of tourism e‐marketing strategy tourist's effective elements as research dependent variable. Also the following table will be shows the rank of importance of the tourism e‐marketing customers' satisfaction effective elements according the both of the Iran and Germany experts' views. The Ranks table shows the mean rank for each of the related groups:
Table 4‐57: Ranks Customers Sa sfac on Elements important with Friedman Test
Mean Rank
Web and brand Reliability, Security, Privacy and Trust 7.63
Website (Attraction, Design, Availability, and Quality) 5.77
Transmission Speed and Conversion Rate 3.17
Tourists Needs, Experience and Expects in Market 7.82

٣٣٢
E-Shopping Facility and Support 3.65
Products and Service Quality, Variety and Innovation 5.98
Product & Service Flexibility and Individualization 4.28
Cost and Price Advantage for Customers 6.57
Customization (Service and CRM Coverage Level) 5.63
Perceived Added Value by Customers 4.50 Resource: Results of research data analyze by SPSS
As you see, the "Tourists Needs, Experience and Expects in Market" and "Web and brand Reliability, Security, Privacy and Trust" with mean rank scores "7.82" and "7.63" stand in first and second places. It means that according the views of Delphi groups members in Iran and Germany these elements have more important as others in this category in Iran and Germany tourism e‐marketing strategy plan. The "Cost and Price Advantage for Customers" with score "6.57" and "Products and Service Quality, Variety and Innova on" with score "6.98" are sit in third and fourth place of ranking. The motivation factor "Last Minute Price" with score "2.12"and "" with mean rank "" according these experts views have least Important in e‐marketing strategy in tourism industry than others customers satisfaction effective elements factors because it has ninth and last importance ranking place in this ranking category.
The test statistic for the Friedman's test is a Chi‐square with a‐1 degrees of freedom (df=10‐1=9), where is the number of repeated measures. When the p‐value for this test is small (usually <0.01) you have evidence to reject the null hypothesis. The hypotheses for the comparison across repeated measures are:
• Ho: There is no difference between ten customers' satisfaction effective elements means H0: µ0 = µ = µ2 = µ3 = ….= µ10
• Ha: There is difference between ten customers' satisfaction effective elements means (The distributions across repeated measures are different).
• Significance Level is α = 0.01 and Cri cal Value and Rejec on Region reject the null hypothesis is p‐value ≤ 0.01.
To conduct a Friedman test, the data need to be in a long format therefore Researcher has handles this with SPSS. Next table informs us of the actual result of the Friedman Test and whether there was an overall statistically significant

٣٣٣
difference between the mean ranks of related consumers' effective elements about tourism e‐marketing. Look at the follows table:
Table 4‐58: Customers Sa sfaction Effective Elements Friedman Test Statistics
N 30
Chi-Square 131.016
df 9
Asymp. Sig. .000
Friedman's chi‐square has a value of 131.016 and a p‐value of 0.000 and is statistically significant. Hence, there is evidence that the distributions of the three types of scores are different. In other word since p‐value = 0.000 ≤ 0.01 = α, we reject the null hypothesis. That means that our null hypothesis is reject and we can with 99% Confidence Level say the "Not all of the means are equal" and there is difference between means of customer satisfaction elements importance in tourism e‐marketing to design a successfully strategy according the experts views in Iran and Germany which are member of Delphi group and panel in this research.
4‐5‐4‐6‐3‐4‐ Test of normality (Mean, Skewness and kurtosis)
Skewness and kurtosis are so common to test the normality of distribution and researcher has selected them to analyze the normality in this research. According the Delphi method mean median and mode are common and usage measure and meter in selecting and ranking the items and elements and reduce them for next surveys. Skewness and Kurtosis are common measure and meter to test of normality. In normal distribu on the skewness has to has value between ±3× Std.error of Skewness (‐3×Std.error of Skewness < Skewness <3×Std.error of Skewness). Kurtosis images that how flat or how pike are the distribution and have same rule as skeweness which means that the Kurtosis value has to be between ±3×Std.error of Kurtosis too.

٣٣٤
Table 4‐59: customers' effec ve elements mean, skewness and kurtosis in Germany and Iran
Resource: Results of research data analyze by SPSS
Above table shows the values of Skewness and Kurtosis about some the items are between three time of their standard division error [(‐3×Std.error of Skewness < Skewness <3×Std.error of Skewness) and (‐3×Std.error of Kurtosis < Kurtosis <3×Std.error of Kurtosis)]. It asserts that our distribution is normal and we have normal distribution in customers' effective elements group in this question and in our research about tourism e‐marketing strategy in Iran and Germany in experts' views who are the member of Delphi group and panel. For example, about third element in above table "Transmission Speed and Conversion Rate" the Skewness is (‐.909). As it has nega ve value we can say that it has a little bit skew to le . More than as it is between ±3×Std. (±3×.427= ±1.281), we can conclude that it has normal distributions. Other hand, its Kurtosis value is1.532 and as it is between ±3× Std. error of Kurtosis (‐3×.833= ‐2.499 <.012 < 1.532= 2.499) it prove of null hypothesis about the normality of our distribution. But About some others elements the skewness and kurtosis values are more than 3× their Std. division (such as item one "Web and brand Reliability, Security, Privacy and Trust" and which are skew=‐2.002 and kurtosis=3.533) and it means about such items we have skew in distribution and kurtosis shows so pike format in form.

٣٣٥
Figure 4‐13: customers' effec ve elements average value bar chart in Germany and Iran
Resource: Results of research data analyze by Excel
Up diagram is the bar chart of motivation factors average value or mean which help us to better understanding and better analyze about customer effective elements important ranking according the experts' views in Iran and Germany and decision about them. For example it is obvious that the item number four "Tourists Needs, Experience and Expects in Market" which has the darkest color betweens and 6.07 score stand in the first place of importance in this group.
4‐5‐4‐7‐ Question eight: How is Importance of each of the following criterion in E‐Marketing Strategy
success evaluation?
• Stockholders Satisfaction
• Customers Satisfaction
• Customers Number Web
• Visitors Numbers
• Market Share
• Costs
• Sell and Income

٣٣٦
4‐5‐4‐7‐1‐ Cronbach reliability test
Researcher uses here the Cronbach's alpha which is the most common measure of internal consistency ("reliability") to measure how important have mentioned seven in e‐marketing Criterions in Iran and Germany tourism according the Delphi group views. It is most commonly used when there are multiple Likert questions in a survey/questionnaire that form a scale and you wish to determine if the scale is reliable. As Researcher has devised a ques on with 5‐point Likert which each item can take a importance degree (scale) from "a few important with scale one" to "extremely important agree with scale five"; it allows him to use this test to consider question reliability. It was run on a sample size of 30 experts in Germany and Iran which includes 15 experts in each of them. SPSS produces many different tables. The first important table is the Reliability Statistics table that provides the actual value for Cronbach's alpha, as shown below:
Table 4‐60: Tourism e‐marketing strategy criterion Reliability Statistics
Cronbach's Alpha Cronbach's Alpha Based on
Standardized Items
N of Items
.973 .976 7 Resource: Results of research data analyze by SPSS
We can see that in this part about Criterions, Cronbach's alpha is 0.973, which indicates a high level of internal consistency for our scale with this specific sample about Criterions important according the experts views in Germany and Iran. (Note that a reliability coefficient of .70 or higher is considered "acceptable" in most social science research situations.)
Standardized item alpha, also shown in SPSS output above, is the average inter‐item correlation when item variances are equal. The difference between Cronbach's alpha and standardized item alpha is a measure of the dissimilarity of variances among items in the set. In a second use, standardized item alpha can be used to estimate the change in reliability as the number of items in an instrument or scale varies. You can see there is any significant difference between them about Criterions important. In following we have table which named "Inter‐Item Correlation Matrix".

٣٣٧
Table 4‐61: Tourism e‐marketing strategy criterion Inter‐Item Correlation Matrix S
tock
hold
ers
Sat
isfa
ctio
n
Cus
tom
ers
Sat
isfa
ctio
n
Cus
tom
ers
Num
ber W
eb
Vis
itors
Num
bers
Mar
ket S
hare
Cos
ts
Sel
l and
Inco
me
Stockholders Satisfaction 1.000 .853 .847 .890 .873 .905 .899
Customers Satisfaction .853 1.000 .841 .749 .684 .897 .890
Customers Number Web .847 .841 1.000 .905 .794 .919 .867
Visitors Numbers .890 .749 .905 1.000 .892 .879 .848
Market Share .873 .684 .794 .892 1.000 .779 .842
Costs .905 .897 .919 .879 .779 1.000 .877
Sell and Income .899 .890 .867 .848 .842 .877 1.000 Resource: Results of research data analyze by SPSS
Upside mentioned matrix shows the criterion Inter‐Item Correlation. For example you see that the "Visitors Numbers" has low correlation with others. In following we have presented the "Item‐Total Statistics table" which in it the first two columns (Scale Mean if Item Deleted and Scale Variance if Item Deleted) of the up table generally aren't important for our study but the third column "Corrected Item‐Total Correlation" is very important:
Table 4‐62: Tourism e‐marketing strategy criterion Item‐Total Statistics
Scale Mean if
Item Deleted
Scale Variance
if Item Deleted
Corrected Item-
Total Correlation
Squared
Multiple
Correlation
Cronbach's
Alpha if Item
Deleted
Stockholders Satisfaction 22.500 33.155 .938 .914 .967
Customers Satisfaction 21.933 33.651 .869 .893 .971
Customers Number Web 22.533 29.223 .924 .906 .970
Visitors Numbers 23.300 31.803 .922 .919 .967
Market Share 23.200 33.890 .857 .866 .972
Costs 22.233 31.702 .941 .923 .966
Sell and Income 22.700 33.734 .930 .898 .968 Resource: Results of research data analyze by SPSS
The "Corrected Item‐Total Correlation" is the correlation between a particular item and the sum of the rest of the items. This column displays the correlation between a given item and the sum score of the other items. For example, the correla on between item 1 and the sum of items 2 to 7 (i.e., item 2 + item 3+…) is r = .914. This means is that there is a strong, positive correlation between the scores on the one item (item 1) and the combined score of the others. This tells us how well a particular item "Stockholders Satisfaction" the rest of the items.
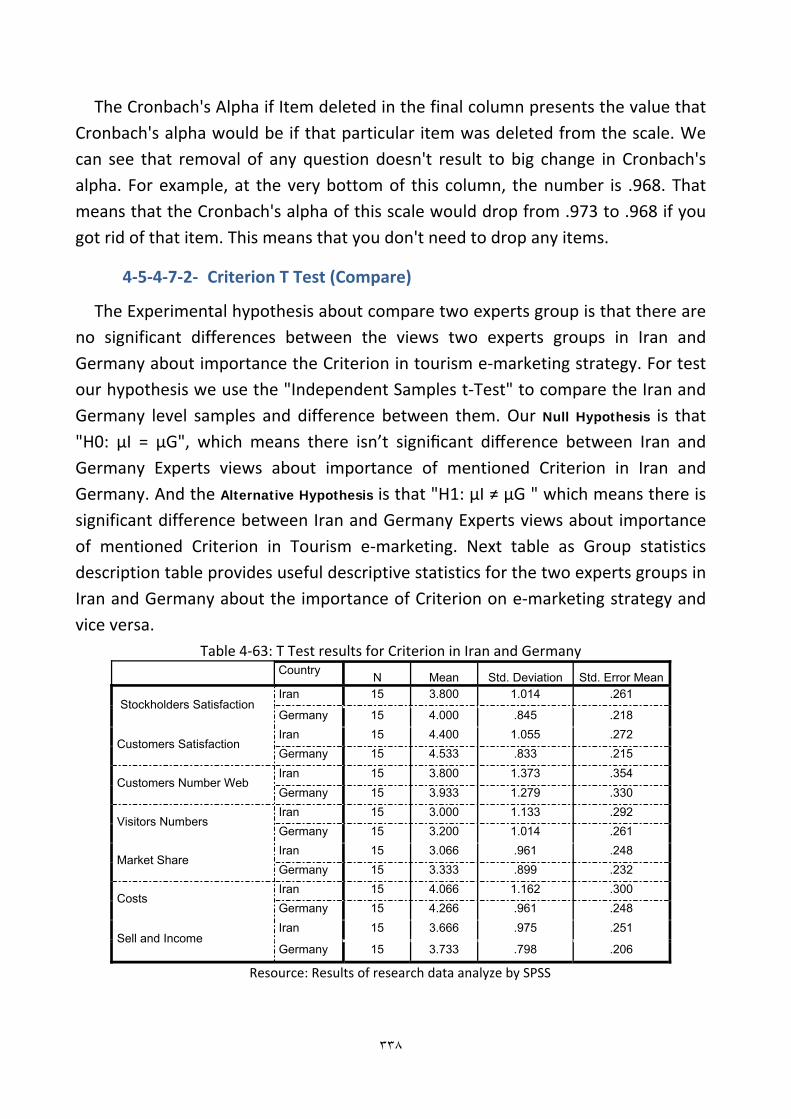
٣٣٨
The Cronbach's Alpha if Item deleted in the final column presents the value that Cronbach's alpha would be if that particular item was deleted from the scale. We can see that removal of any question doesn't result to big change in Cronbach's alpha. For example, at the very bottom of this column, the number is .968. That means that the Cronbach's alpha of this scale would drop from .973 to .968 if you got rid of that item. This means that you don't need to drop any items.
4‐5‐4‐7‐2‐ Criterion T Test (Compare)
The Experimental hypothesis about compare two experts group is that there are no significant differences between the views two experts groups in Iran and Germany about importance the Criterion in tourism e‐marketing strategy. For test our hypothesis we use the "Independent Samples t‐Test" to compare the Iran and Germany level samples and difference between them. Our Null Hypothesis is that "H0: μI = μG", which means there isn’t significant difference between Iran and Germany Experts views about importance of mentioned Criterion in Iran and Germany. And the Alternative Hypothesis is that "H1: μI ≠ μG " which means there is significant difference between Iran and Germany Experts views about importance of mentioned Criterion in Tourism e‐marketing. Next table as Group statistics description table provides useful descriptive statistics for the two experts groups in Iran and Germany about the importance of Criterion on e‐marketing strategy and vice versa.
Table 4‐63: T Test results for Criterion in Iran and Germany Country N Mean Std. Deviation Std. Error Mean
Stockholders Satisfaction Iran 15 3.800 1.014 .261
Germany 15 4.000 .845 .218
Customers Satisfaction Iran 15 4.400 1.055 .272 Germany 15 4.533 .833 .215
Customers Number Web Iran 15 3.800 1.373 .354 Germany 15 3.933 1.279 .330
Visitors Numbers Iran 15 3.000 1.133 .292 Germany 15 3.200 1.014 .261
Market Share Iran 15 3.066 .961 .248 Germany 15 3.333 .899 .232
Costs Iran 15 4.066 1.162 .300 Germany 15 4.266 .961 .248
Sell and Income Iran 15 3.666 .975 .251
Germany 15 3.733 .798 .206
Resource: Results of research data analyze by SPSS

٣٣٩
Because the standard deviations of experts views about Criterion importance in tourism e‐marketing for the two groups of Iran and Germany are almost similar (for example about "Customers Satisfaction" the 1.05 and .833), researcher will use the "equal variances assumed" test. The results indicate that there isn't a statistically significant difference between the important of Criterion in Iran and Germany tourism e‐marketing according the both countries expert's views. In other words, Criterion in views of Germany's Experts has a same statistically significantly as views of Iran's Experts.
This table provides the actual results from the independent t‐test and Levine's Test for Equality of Variances. If the variances are equal in both groups then the P‐value ("Sig.") will be greater than 0.05. However, if the "Sig." value is less than 0.05, the variances are unequal. If we have unequal variances then we need to use the Equal variances not assumed column otherwise you use the Equal variances assumed column. To check this, we have to look at the "Sig." row within Levine's Test for Equality of Variances row:
Table 4‐64: T Test results for Criterion in Iran and Germany
Resource: Results of research data analyze by SPSS
In upper table "Levene's Test for Equality of Variances" for variables shows that F quantities (.416, .171, .025, …)12 are not significant because the F sig.(.524, .682, .876 and …) are more than .05; therefore "Equal variances assumed" rows will be
12 The score (sig) has to be .05 or less than .05 to be considered significant.

٣٤٠
use to T‐test The score (sig) has to be .05 or less than .05 to be considered significant.
Under the "t‐test for Equality of Means" look at "sig. (2‐tailed)" for "Equal variances assumed". The scores (.562, .704, .785 and …) are more than .05, therefore with confidence level of 95% there aren’t a significant difference between the means of the two groups. It means with confidence level of 95% there are no significant difference between the means of the two Iran and Germany expert's group's views about the importance of different Criterion in Tourism e‐marketing strategy in Iran and Germany.
4‐5‐4‐7‐3‐ Criterion Friedman (Ranking)
Like before elements' groups researcher has done the Friedman test about tourism criterions to test to see whether there is different between the mean of these tourism e‐marketing criterions importance according the Delphi groups experts or not and also have done it for ranking them. Beneath table presents descriptive statistics such as mean and Std.Deviation in results section for each of the tourism e‐marketing criterion for research dependent mentioned variables.
Table 4‐65: Tourism e‐marketing Criterions Friedman Test Descriptive Statistics
N Mean Std. Deviation Minimum Maximum
Stockholders Satisfaction 30 3.900 .922 1.00 5.00
Customers Satisfaction 30 4.466 .937 1.00 5.00
Customers Number Web 30 3.866 1.306 1.00 5.00
Visitors Numbers 30 3.100 1.061 1.00 5.00
Market Share 30 3.200 .924 1.00 5.00
Costs 30 4.166 1.053 1.00 5.00
Sell and Income 30 3.700 .876 1.00 5.00 Resource: Results of research data analyze by SPSS
The test statistic for the Friedman's test is a Chi‐square with a‐1 degrees of freedom (which is 6 here), where is the number of repeated measures. When the p‐value for this test is small (usually <0.01) you have evidence to reject the null hypothesis. The hypotheses for the comparison across repeated measures are:
• Ho: There is no difference between sex criterions (The distributions are the same across repeated measures. H0: µ0 = µ = µ2 = µ3 = ….= µ6
• Ha: There is difference between sex criterion (The distributions across repeated measures are different. Ha: Not all of the means are equal.

٣٤١
• Significance Level is α = 0.01 and Critical Value and Rejection Region reject the null hypothesis is p‐value ≤ 0.01.
Following table informs us of the actual result of the Friedman Test and whether there was an overall statistically significant difference between the mean ranks of related e‐marketing criterions:
Table 4‐66: Tourism e‐marketing Criterions Friedman Test Statisticsa
N 30
Chi-Square 112.159
df 6
Asymp. Sig. .000
a. Friedman Test
Note that the test statistic (Fr = Chi‐Square = 112.159) is corrected for the existence of ties in the ranks of the data. Since p‐value = 0.000 ≤ 0.01 = α, we reject the null hypothesis. That means that our null hypothesis is reject and we can with 99% Confidence Level say the "Not all of the means are equal" and there is difference between Germany and Iran's experts' views about criterions important in tourism e‐marketing in Germany and Iran.
The following table will be shows the rank of importance of the tourism e‐marketing criterions according the views of experts in both countries (Germany and Iran). The Ranks table shows the mean rank for each of the related groups, as shown below:
Table 4‐67: Ranks of Tourism e‐marketing Criterions important with Friedman Test
Mean Rank
Stockholders Satisfaction 4.42
Customers Satisfaction 5.93
Customers Number Web 4.33
Visitors Numbers 2.03
Market Share 2.38
Costs 5.18
Sell and Income 3.72 Resource: Results of research data analyze by SPSS
The table shows that the "Customers Sa sfac on" with score "5.93" sit in first seat. It means that according the views of experts in Iran and Germany this element has more important than others in this category in Iran and Germany tourism e‐marketing strategy plan. The "Costs" and "Stockholders Satisfaction" with scores "5.18" and "4.42" are located in second and third place of ranking. The

٣٤٢
motivation factor "Last Minute Price" according these experts views has least Important in e‐marketing strategy than others criterions and stands at last station in this ranking with score "2.03".
4‐5‐4‐7‐4‐ Criterion test of normality (skew, kurtosis, Mean and Mode)
Researcher has used the result of skewness and kurtosis for test of normality. In following table there are very important and useful information as mean, median, Skewness and Kurtosis which have different usage such test of normality and ranking the item in Delphi method. According the Delphi method mean median and mode are common and usage measure and meter in selecting and ranking the items and elements and reduce them for next surveys. Skewness and Kurtosis are common measure and meter to test of normality. In normal distribution the skewness has to has value between ±3× Std.error of Skewness (‐3×Std.error of Skewness < Skewness <3×Std.error of Skewness). Kurtosis images that how flat or how pike are the distribution and have same rule as skeweness which means that for dicede about normality it has to be between ±3×Std.error of Kurtosis.
Table 4‐68: Criterions mean, mode skew and kurtosis value bar chart in Germany and Iran
Resource: Results of research data analyze by SPSS
As you see the values of Skewness and Kurtosis about all the items are between three time of their standard division [(‐3×Std.error of Skewness < Skewness <3×Std.error of Skewness) and ‐3×Std.error of Kurtosis < Kurtosis <3×Std.error of Kurtosis)]. It asserts that our distribution is normal and we have normal distribution in tourism e‐marketing strategy Criterion group in this question and in our research about tourism e‐marketing strategy in Iran and Germany in experts' views who are the member of Delphi group and panel. For example, about first

٣٤٣
Criterion in above table "Stockholders Satisfaction" the Skewness is (‐1.201). As it has value less than one it shows that it is acceptable and the negative value shows that it has a little bit skew to left. More than as it is between ±3×Std. (±3×.427= ±1.281), we can conclude that it has normal distributions. Other hand, its Kurtosis value is 2.352 and as it is less than one and between ±3× Std. error of Kurtosis (‐3×.833= ‐2.499 < 2.352 < 3×.833= 2.499) it prove of null hypothesis about the normality of our distribution.
Figure 4‐14: Criterion average value bar chart in Germany and Iran
Resource: Results of research data analyze by Excel
Up diagram is the bar chart of motivation factors average value or mean which help us to better understanding and better analyze about factors and items important ranking according the experts' views in Iran and Germany and decision about them. For example it is obvious that the second item "Customers Satisfaction" has the darkest color betweens and 6.47 score stand in the first place of importance in this group.
4‐5‐4‐8‐ The effective elements groups label ranking At last part of analyze the second questionnaire and second stage of research,
the effective elements groups' total average value and their ranking have been calculated. For this calculation we have used the total average value for each group. In following man can see the bar charts and pie‐chart of effective elements group in two main categories will be show. Primary main effective elements have been show in following:

٣٤٤
Figure 4‐15: T.E‐M.S effective elements group average value bar‐chart in Germany & Iran
Resource: Results of research data analyze
Customers (tourists) satisfaction elements which are elements in direct related to customers' needs, expects and perception, with average value"5.54 stand in first place of important to successfully a e‐marketing strategy according experts views in Iran and Germany in tourism industry.
Figure 4‐16: T.E‐M.S effective elements group average value pie‐chart in Germany and Iran
Resource: Results of research data analyze
Decision about the groups' importance in designing a strategy is one of the key decisions for management and strategy committee. About the other category elements groups (motivation factors, criterions, e‐systems and tourism organiza on and ac vi es), as it is mo va on factors with average value 5.79 and criterions with 5.77 sit in first and second seat of importance according panel members' opinions.

٣٤٥
Figure 4‐17: T.E‐M.S effective factors group average value bar‐chart (Germany and Iran)
Resource: Results of research data analyze
Bar charts show the frequency and make it easy to analyze and pie charts too help to better understand the share of each group. The next figure shows the pie‐chart the average value of others tourism e‐marketing strategy effective factors and elements.
Figure 4‐18: T.E‐M.S effective factors group average value pie‐chart (Germany and Iran)
Resource: Results of research data analyze
After receiving experts' responses, investigators need to convert the collected information into a well‐structured questionnaire. This chart is used as help instrument for the take better uptake of data collection about the other tourism e‐marketing effective elements. It shows that they have very close share (motivation factors26%, tourism organiza on ac vi es 25%, criterions 25% and e‐systems 24%).

٣٤٦
4‐6‐ Round three Theoretically, the Delphi process can be continuously iterated until consensus is
determined to have been achieved. The following discussion, however, provides guidelines for up to three iterations in order to assist those who decide to use the Delphi process as a data collection technique when it is determined that additional iterations beyond three are needed or valuable.
In the third round as final round, each Delphi panelist have received a AHP questionnaire that includes the remaining items of effective elements in tourism e‐marketing strategy and ratings summarized by the investigators in the previous round and are asked to revise their judgments or “to specify the reasons for remaining outside the consensus” (Pfeiffer, 1968, p. 152). This round provides a final opportunity for participants to make further clarifications of both the information and their judgments of the relative importance of the items and also to revise their judgments with AHP method. However, compared to the previous round, only a slight increase in the degree of consensus can be expected (Jacobs, 1996).
4‐6‐1‐ AHP method
After collecting the questionnaires, it had to be analyzed, which had been done with the help of group taking pairs comparison and group AHP method. First of all analyzing the model and decision tree (priority with respect to weaknesses and threats of e‐marketing strategy of tourism in Iran) was prepared via expert choice software. Then the views of each members group of Delphi separately were set in the tables of the model. In this way for each person six table and in total 180 tables were produced. The rate of inconsistency, considering priority for each table were calculated with the help of related software which it should have been less than 1%. However, in some of the cases this rate was more than 1%, so again with the help of the members group, the numbers were revised and the tables were developed with the rate of less than one percent.
In this stage researcher has been worked with AHP method and experts views in first and second stages' had been summarized and then the results as new questionnaire (AHP questionnaire) was sent back again to the Delphi members of the group (experts) in Iran and Germany, to be reviewed and modified. Then the questionnaires again were collected from the group.

٣٤٧
4‐6‐1‐1‐ The process of AHP
The process of taking pairs comparison based on AHP; compare simultaneously quality criteria but intangible with quantity criteria and tangible. These enable the decision makers to concentrate on the comparison of the case without any influence and external disturbance, so they improve the factors of decision making process to be ra onal (David, 1963:7). In this research and similar ones, for preparing taking pairs comparison questionnaire, in determining priorities of effective elements important; had to make a very thick volume of questionnaire, which might not be given back to the expert, or even if the experts would received it. It might not be answered relatively and the volume for the related answer would be increased. Therefore, instead of using taking pair's comparison questionnaires we used matrix questionnaire.
4‐6‐1‐2‐ Group decision making
In fact, the aim is to identify out of many components the ones which have necessary relation together. The first step to categorize the components of a case is to make priority over the other through taking pairs comparison. For performing this comparison, the components have been compared items in similar groups and with the help of the matrix method. Matrix method is simple and useful one. This method has the capability to introduce consistency test, collecting information through all possible comparison, an analyzing general priority sensitiveness and considera on of all changes in judgments (Ahmari, 1377: 98).
4‐6‐1‐3‐ Group taking pair’s comparison
Primarily AHP were using for individual decision making in the fluctuation environment. Then it was in the 80 decade that they start using it in group decision making. Applying AHP in group decision making cause not only the techniques advantages to be saved, but also the defects to be abolished one of the best methods for combination of matrix in traduced by the members group is applying geometrical mean method. Geometrical mean helps the researcher while considering judgments of the group, find out the taking pairs comparison result, which will be in decimal numbers. Whenever the numbers of experts related to the matter is very less, and according to the AHP technique for decision making the views of the expert would be enough so population sampling will be of nonuse. Therefore population sampling is not applicable here. On the other words in such

٣٤٨
cases statistic sampling and the theory of statistical decision making is not applicable (lai & yoon, 1981:12).
4‐6‐1‐4‐ Developing hierarchy
In this part according to the research done, tourism e‐marketing strategy effective elements have been set based on the hierarchy. The goal of this part of research is to determine effective elements important priorities with respect to E‐marketing strategy in Germany and Iran tourism industry. The model of hierarchy has been completed with the effective elements of each main group (five groups for this stage and AHP questionnaire which include three groups for main effective elements group). This can be shown in the form of tree. This tree in the professional software of taking pairs comparison AHP (expert choice) is shaped like figure 1:
Figure 4‐19: Effective elements AHP decision Tree
1. Products and Services Quality and Variety 2. Web Marketing Mix Strategy 3. Resource Availability (Finance, Technology etc) 4. Brand and Branding Strategy 5. Relationship and Strategic Alliances 6. Customer Segmentation and Targeting 7. Firm Specialists Employers Skills and Education 8. Restructuring and reengineering the processes 9. Firm Competitive Advantages in E‐Marketing 10. Innovation support and Knowledge Management
3. Web and brand Reliability, Security, and Trust4. Website (Attraction, Availability, and Quality) 5. Tourists Needs, Experience and Expects in Market 6. Products and Service Quality, Variety, Innovation
and Individualization 7. Cost and Price Advantage for Customers 8. Customization (Service and CRM Coverage Level) 9. Perceived Added Value by Customers 10. Transmission Speed and conversation Rate
Tourism EMarketing Strategy
Customers (Tourists) Satisfaction Effective
Elements
Companies Elements
Environmental Effective Elements
11. IT and Telecommunication Infrastructure Costs 12. General IT Knowledge and Culture in Society 13. Market (Capability, Potential, Turbulence, Orientation) 14. Availability of Resource and Environmental Opportunity 15. E‐Tourism Value‐Chain Players Power and Impacts 16. Human Resources Market (IT & E‐Marketing Specialist) 17. Government IT and E‐Commerce Policy, Laws, and Support 18. Technology and IT Systems Standards, Innovation,
Capabilities, Assessment and Turbulence

٣٤٩
It should be remembered that the number of Delphi iterations depends largely on the degree of consensus sought by the investigators and can vary from three to five (Delbecq, Van de Ven, Gustafson, 1975; Ludwig, 1994).(167) The third questionnaire includes the list, the ratings indicated, and the consensus, if any. The experts are asked to either revise their opinions or discuss their reasons for not coming to consensus with the group according AHP method in this research.(166)
After finishing this stage, according to the Delphi outcome, the identified effective elements via professional views of the Delphi members group (experts) another questionnaire was prepared to categorize the priorities of the tourism e‐marketing effective elements in each group separately based on taking pairs comparison AHP method. This questionnaire had been distributed to the members so their views become the fundamental of the priorities categorized. The results and data acquired from these questionnaires analyzed through expert choice software. The acquired information may be used for critical decision making on resources allocation and its determination according to the priorities and the importance of the applied weaknesses and threats. The results have been followed on the next coming tables.
4‐6‐1‐5‐ Explanation of taking pairs comparison operation
In the next part, the third questionnaire related to comparison which with the help of Delphi method and expert view had been completed in the first part, distributed and after completing was collected. As it is mentioned the results of the first and second surveys (Delphi method) ware the determination of the importance priority of e‐marketing strategy effective elements in tourism industry in Iran and Germany, which had been distributed to the members group of Delphi in form of a taking pair's comparison & AHP questionnaires. Obviously working with the members group of Delphi was very time consuming and a hard task. On one hand those people were very busy and on the other hand our work was very voluminous, and the presence of the researcher for complementary explanation was inevitable.
Afterwards revising the rate of inconsistency, now in order to reach to a general view about the effective elements priority identified the views of the members group of Delphi had to be combined. According Tomas.El.Saaty, the best method for calculating the advantages in each unit is geometrical mean. Primarily the views of each member separately were prepared in different sheets.
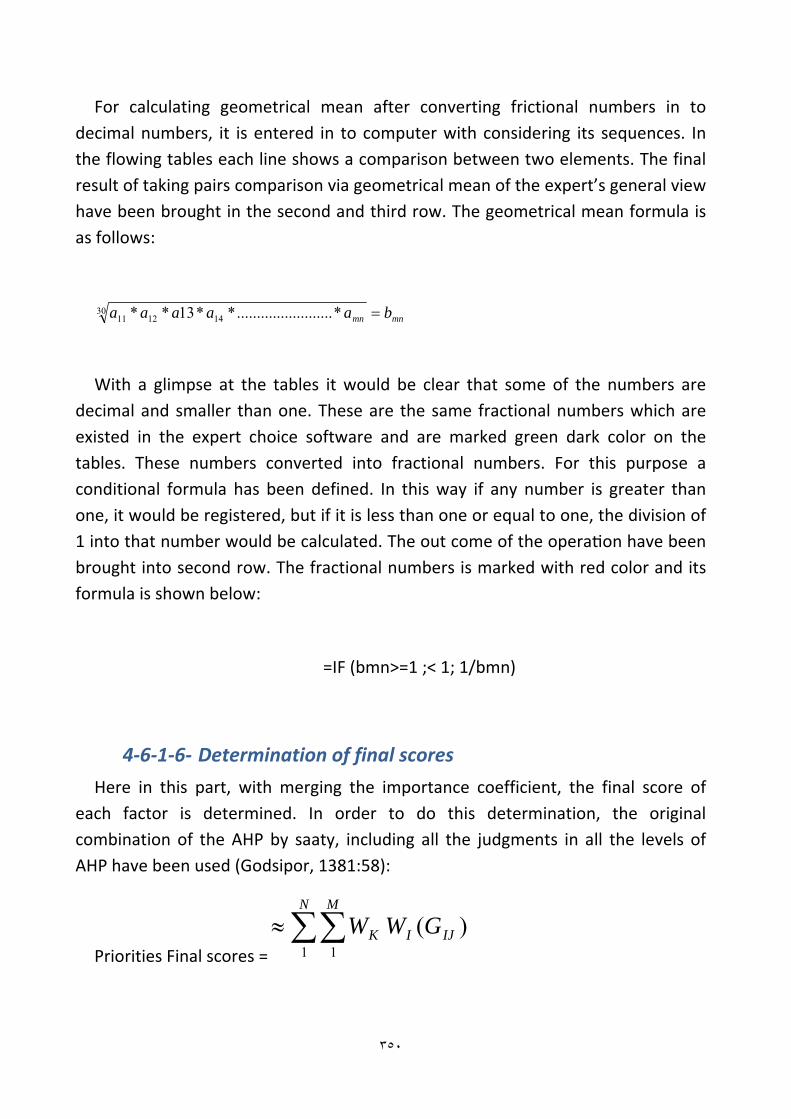
٣٥٠
For calculating geometrical mean after converting frictional numbers in to decimal numbers, it is entered in to computer with considering its sequences. In the flowing tables each line shows a comparison between two elements. The final result of taking pairs comparison via geometrical mean of the expert’s general view have been brought in the second and third row. The geometrical mean formula is as follows:
mnmn baaaaa =30141211 *........................**13**
With a glimpse at the tables it would be clear that some of the numbers are decimal and smaller than one. These are the same fractional numbers which are existed in the expert choice software and are marked green dark color on the tables. These numbers converted into fractional numbers. For this purpose a conditional formula has been defined. In this way if any number is greater than one, it would be registered, but if it is less than one or equal to one, the division of 1 into that number would be calculated. The out come of the opera on have been brought into second row. The fractional numbers is marked with red color and its formula is shown below:
=IF (bmn>=1 ;< 1; 1/bmn)
4‐6‐1‐6‐ Determination of final scores
Here in this part, with merging the importance coefficient, the final score of each factor is determined. In order to do this determination, the original combination of the AHP by saaty, including all the judgments in all the levels of AHP have been used (Godsipor, 1381:58):
Priorities Final scores =
)(1 1
IJI
N M
K GWW∑∑≈
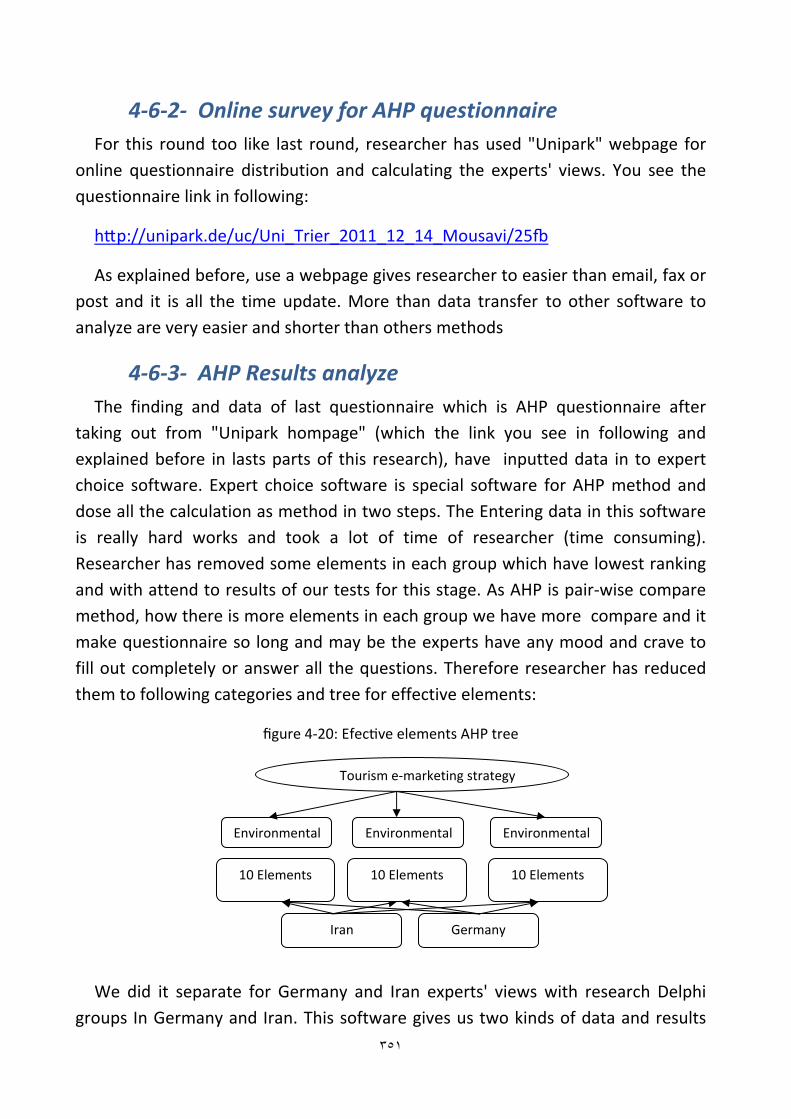
٣٥١
4‐6‐2‐ Online survey for AHP questionnaire For this round too like last round, researcher has used "Unipark" webpage for
online questionnaire distribution and calculating the experts' views. You see the questionnaire link in following:
http://unipark.de/uc/Uni_Trier_2011_12_14_Mousavi/25fb
As explained before, use a webpage gives researcher to easier than email, fax or post and it is all the time update. More than data transfer to other software to analyze are very easier and shorter than others methods
4‐6‐3‐ AHP Results analyze The finding and data of last questionnaire which is AHP questionnaire after
taking out from "Unipark hompage" (which the link you see in following and explained before in lasts parts of this research), have inputted data in to expert choice software. Expert choice software is special software for AHP method and dose all the calculation as method in two steps. The Entering data in this software is really hard works and took a lot of time of researcher (time consuming). Researcher has removed some elements in each group which have lowest ranking and with attend to results of our tests for this stage. As AHP is pair‐wise compare method, how there is more elements in each group we have more compare and it make questionnaire so long and may be the experts have any mood and crave to fill out completely or answer all the questions. Therefore researcher has reduced them to following categories and tree for effective elements:
figure 4‐20: Efec ve elements AHP tree
We did it separate for Germany and Iran experts' views with research Delphi groups In Germany and Iran. This software gives us two kinds of data and results
Tourism e‐marketing strategy
Environmental
10 Elements
Iran Germany
10 Elements 10 Elements
EnvironmentalEnvironmental

٣٥٢
for each of both. One is before calculations group label scale and second is Priorities Final scores after modify with calculations group label scale. Because of avoidance the repetition and prolongation researcher has brought and offered only the results of final scores which are include some diagrams about each of elements groups in each of countries. It will initiates with some table which shows the calculation results of final priorities for both of Iran and Germany and then will show bar charts, and will explain analyze results separately for each of Germany and Iran.
4‐6‐3‐1‐ Consistency of Judgments for Germany and Iran
After collecting the questionnaires, it had to be analyzed, which had been done with the help of group taking pairs comparison and group AHP method. First of all analyzing the model and decision tree (effective elements important priority with respect to e‐marketing strategy of tourism in Germany and Iran) was prepared via expert choice software. Then the views of each members group of Delphi separately were set in the tables of the model. In this way for each person six table and in total 360 tables were produced. The rate of inconsistency, considering priority for each table were calculated with the help of related software which it should have been less than 1% , but in some of the cases this rate was more than 1%, so again with the help of the members group, the numbers were revised and the table were developed with the rate of less than one percent.
For analyze data with Expert chose software and AHP method have to first consider the Consistency of Judgments. The Here the results have been prepared for final analyzing, and then an overall conclusion has been introduced via expert choice software based on the research model. The result has been also illustrated in the coming tables; each table analyzing is next to it.
Figure 4‐21: analyzing the rate of inconsistency in Iran and Germany
The result of the research
It can be understood here that the inconsistency rate of geometrical mean scores based on expert’s views is very low, even lower than 0.1 and equal to 0.01. This shows the priorities consistency (Taking pair’s comparison & scores).
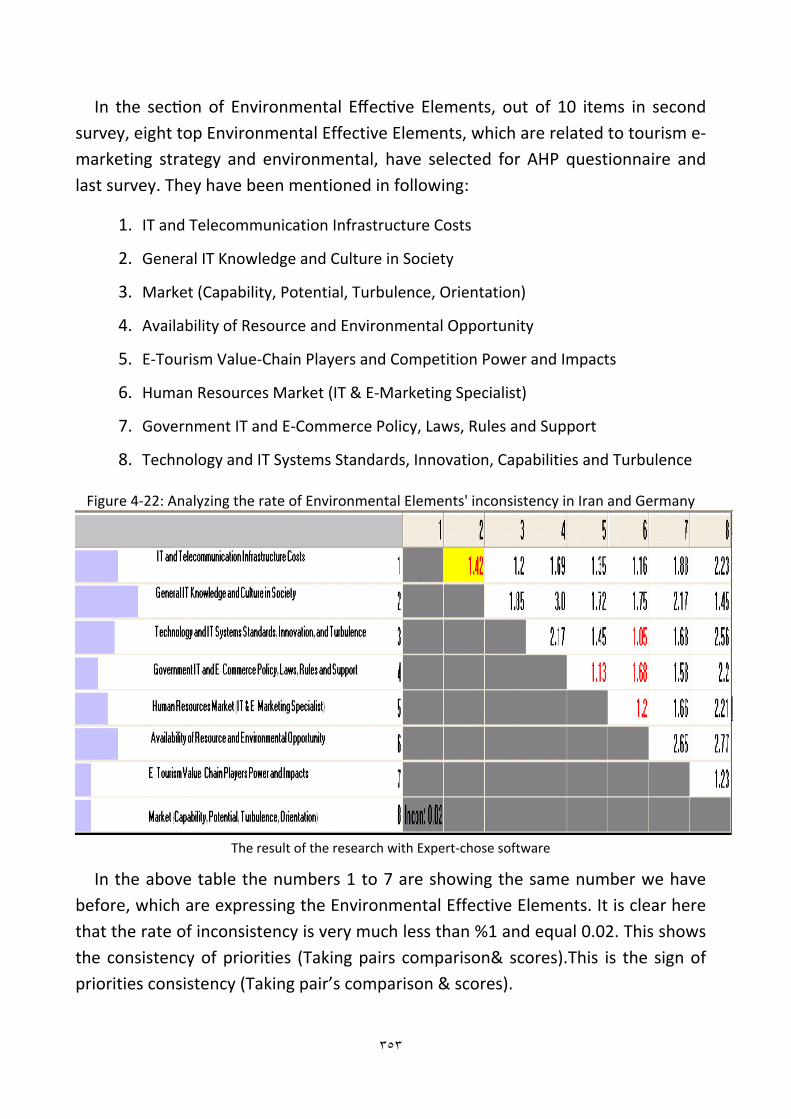
٣٥٣
In the sec on of Environmental Effec ve Elements, out of 10 items in second survey, eight top Environmental Effective Elements, which are related to tourism e‐marketing strategy and environmental, have selected for AHP questionnaire and last survey. They have been mentioned in following:
1. IT and Telecommunication Infrastructure Costs
2. General IT Knowledge and Culture in Society
3. Market (Capability, Potential, Turbulence, Orientation)
4. Availability of Resource and Environmental Opportunity
5. E‐Tourism Value‐Chain Players and Competition Power and Impacts
6. Human Resources Market (IT & E‐Marketing Specialist)
7. Government IT and E‐Commerce Policy, Laws, Rules and Support
8. Technology and IT Systems Standards, Innovation, Capabilities and Turbulence
Figure 4‐22: Analyzing the rate of Environmental Elements' inconsistency in Iran and Germany
The result of the research with Expert‐chose software
In the above table the numbers 1 to 7 are showing the same number we have before, which are expressing the Environmental Effective Elements. It is clear here that the rate of inconsistency is very much less than %1 and equal 0.02. This shows the consistency of priorities (Taking pairs comparison& scores).This is the sign of priorities consistency (Taking pair’s comparison & scores).

٣٥٤
About Companies Elements, from twelve items in second survey, ten top Environmental Effective Elements were selected, which are related to tourism e‐marketing strategy and environmental, for AHP questionnaire and last survey. They have been show in following:
1. Products and Services Quality and Variety
2. Web Marketing Mix Strategy
3. Resource Availability(Finance, Technology and etc)
4. Brand and Branding Strategy
5. Relationship and Strategic Alliances
6. Customer Segmentation and Targeting
7. Firm Specialists Employers Skills and Education
8. Restructuring and Reengineering the processes
9. Firm Competitive Advantages in E‐Marketing
10. Innovation support and Knowledge Management
Figure 4‐23: Analyzing the rate of Firms' effective elements' inconsistency in Iran and Germany
The result of the research with Expert‐chose software
It is to be men oned that the numbers 1 to 10 written on the table are the same numbers like items have mentioned before it. These numbers are indicating to the Firms' effective elements Identified by the members group of Delphi (experts). Matrix shows the mathematic calculations details with software. As it is clear and you see in table the rate of inconsistency is very low, less than %0.1 and equal to %.01. This shows the consistency of priorities (Taking pairs comparison & scores).

٣٥٥
For Customers (Tourists) Satisfaction Effective Elements group eight elements from ten in last survey have been selected for AHP questionnaire in last phase of research. They are coming below:
1. Web and brand Reliability, Security, and Trust
2. Website (Attraction, Availability, and Quality)
3. Tourists Needs, Experience and Expects in Market
4. Products and Service Quality, Variety, Innovation and Individualization
5. Cost and Price Advantage for Customers
6. Customization (Service and CRM Coverage Level)
7. Perceived Added Value by Customers
8. Transmission Speed and conversation Rate
Figure 4‐24: Analyzing the rate of Customers Elements' inconsistency in Iran & Germany
The result of the research with Expert‐chose software
It is to be explained that the numbers 1 to 8 which are showing the Iden fied Customers Satisfaction Effective Elements by the experts in Iran and Germany are the same number which have before specified. Table shows the mathematic calculations details with software. It can be understood here that the rate of inconsistency is very small, even smaller than %1 and equal to 0.01.
Also researcher has decided to identify the priority Criterions by AHP in this stage too. He used sane items without any change as you see in coming:
1. Stockholders Satisfaction

٣٥٦
2. Customers Satisfaction
3. Customers Number
4. Web Visitors Numbers
5. Market Share
6. Costs
7. Sell and Income
Figure 4‐25: analyzing the rate of Criterions' inconsistency in Iran and Germany
The result of the research with Expert‐chose software
The numbers 1 to 7 in matrix are the Criterions identified by the Delphi experts same. It shows the mathematic calculations details with software. It is also clear here that the rate of inconsistency is very small (%0.02) even smaller than one. This shows the consistency of priorities (Taking pair’s comparison & scores). More than before mentioned elements group, researcher have asked about the tourism activities importance priority for tourism e‐marketing strategy in AHP questionnaire which based on pair‐Weise compare without change in items as man can see in down:
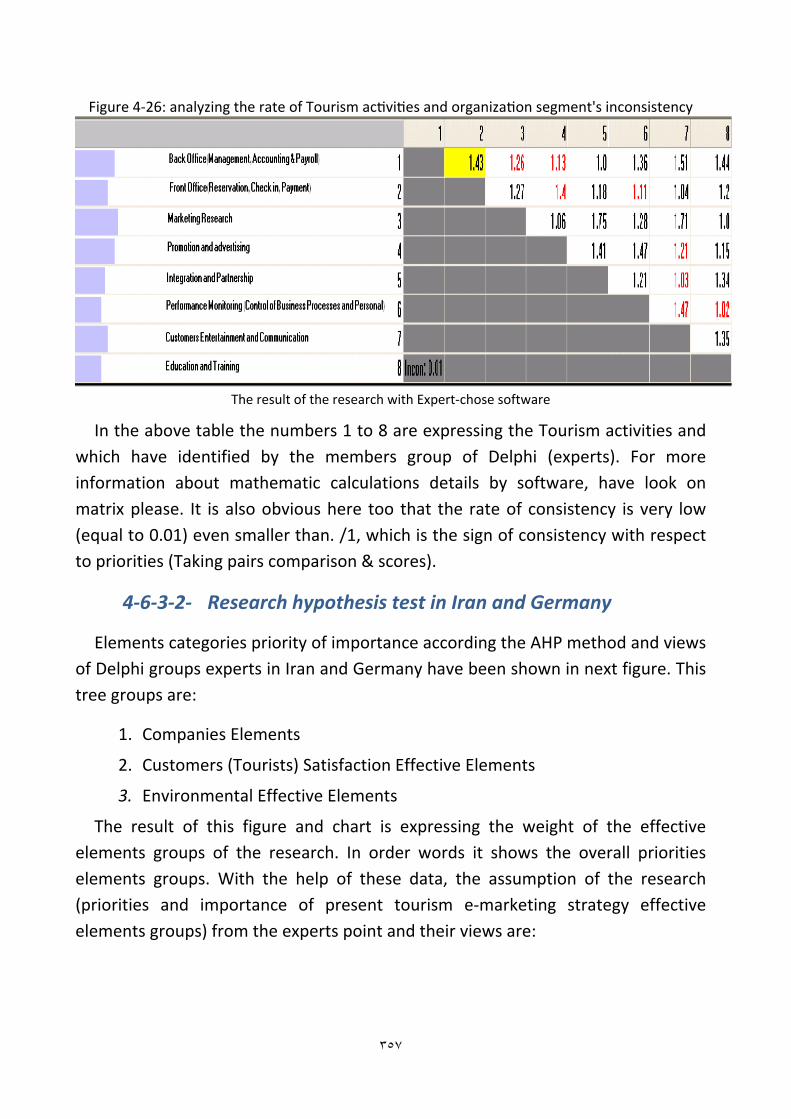
٣٥٧
Figure 4‐26: analyzing the rate of Tourism ac vi es and organiza on segment's inconsistency
The result of the research with Expert‐chose software
In the above table the numbers 1 to 8 are expressing the Tourism activities and which have identified by the members group of Delphi (experts). For more information about mathematic calculations details by software, have look on matrix please. It is also obvious here too that the rate of consistency is very low (equal to 0.01) even smaller than. /1, which is the sign of consistency with respect to priorities (Taking pairs comparison & scores).
4‐6‐3‐2‐ Research hypothesis test in Iran and Germany
Elements categories priority of importance according the AHP method and views of Delphi groups experts in Iran and Germany have been shown in next figure. This tree groups are:
1. Companies Elements
2. Customers (Tourists) Satisfaction Effective Elements
3. Environmental Effective Elements
The result of this figure and chart is expressing the weight of the effective elements groups of the research. In order words it shows the overall priorities elements groups. With the help of these data, the assumption of the research (priorities and importance of present tourism e‐marketing strategy effective elements groups) from the experts point and their views are:

٣٥٨
Figure 4‐27: priori es with respect to overall weaknesses and threats Iran and Germany
It can be understood that Customers (Tourists) Satisfaction Effective Elements with the weight and importance coefficient of .279 stand on the first priority. The second and third priority belongs to Companies Elements and Environmental Effective Elements with weight and importance coefficient of .237 and .219 respectively.
4‐6‐3‐3‐ Elements Important Priority in Iran
In this part we show the AHP results about Iran. As has explained before, the elements have reduced and in each group some of them have got rid of the list in AHP questionnaire. In tourism e‐marketing environmental effective elements group "Competition Intensity and Competitors' Strategies" and "Business and Marketing Models Changes (Time &Process" have got rid of the list and we have now eight environmental elements.
4‐6‐3‐3‐1‐ Environmental Effective Elements priorities in Iran
The next table shows the new and modified list and table of environmental effective elements which have been evaluated Whit experts and has been ranked according their views:
Table 4‐69: Environmental Effec ve Elements in AHP survey row Environmental Effective Elements
E1 IT and Telecommunication Infrastructure Costs E2 General IT Knowledge and Culture in Society E3 Technology and IT Systems Standards, Innovation, Capabilities, and TurbulenceE4 Government IT and E‐Commerce Policy, Laws, Rules and Support E5 Human Resources Market (IT & E‐Marketing Specialist) E6 Availability of Resource and Environmental Opportunity E7 E‐Tourism Value‐Chain Players' and Competitors' Power and Impacts E8 Market (Capability, Potential, Turbulence, Orientation)
Source: the result of the research

٣٥٩
In the following figure you can see the tourism e‐marketing strategy environmental effective elements importance priority according the experts views who are member of Delphi group in Iran:
Figure: 4‐28: Environmental Effec ve Elements final important priori es in Iran
Source: the result of the research with Expert‐chose software
It is to be explained that the numbers 1 to 8 on the above Tourism e‐marketing Environmental Effective Elements figure are the same elements which you see on the table (4‐69). In general point of view by Delphi members group (with the performance of weight for factors group) and calculating final weight of Environmental Effective Elements. The second Environmental Effective Elements "General IT Knowledge and Culture in Society" with the importance coefficient of .206 has been recognized as the most important Environmental Effec ve Element with respect to tourism e‐marketing strategy in Iran Tourism industry. The next Environmental Effective Elements are "IT and Telecommunication Infrastructure Costs" and "Availability of Resource and Environmental Opportunity" which are allocated the priorities. The last priorities belong to eighth and seventh Environmental Effective Elements in table with the rate of .73 and .66 respec vely.
4‐6‐3‐3‐2‐ Firms' Elements priorities in Iran
About the company's tourism e‐marketing strategy effective elements we have same story like before part and researcher has got rid two elements "Firm IT Infrastructure Station and Orientation" and " Increased Web Traffic and Stickiness" which have undermost ranks and with consider others test result such as Friedman. A er removing we have 10 elements for AHP ques onnaire in this group which have to compare pair‐wise. In this part we show the AHP results for Iran. As has explained before, the elements have reduced and in each group some of them have got rid of the list in AHP questionnaire. The following table shows the new
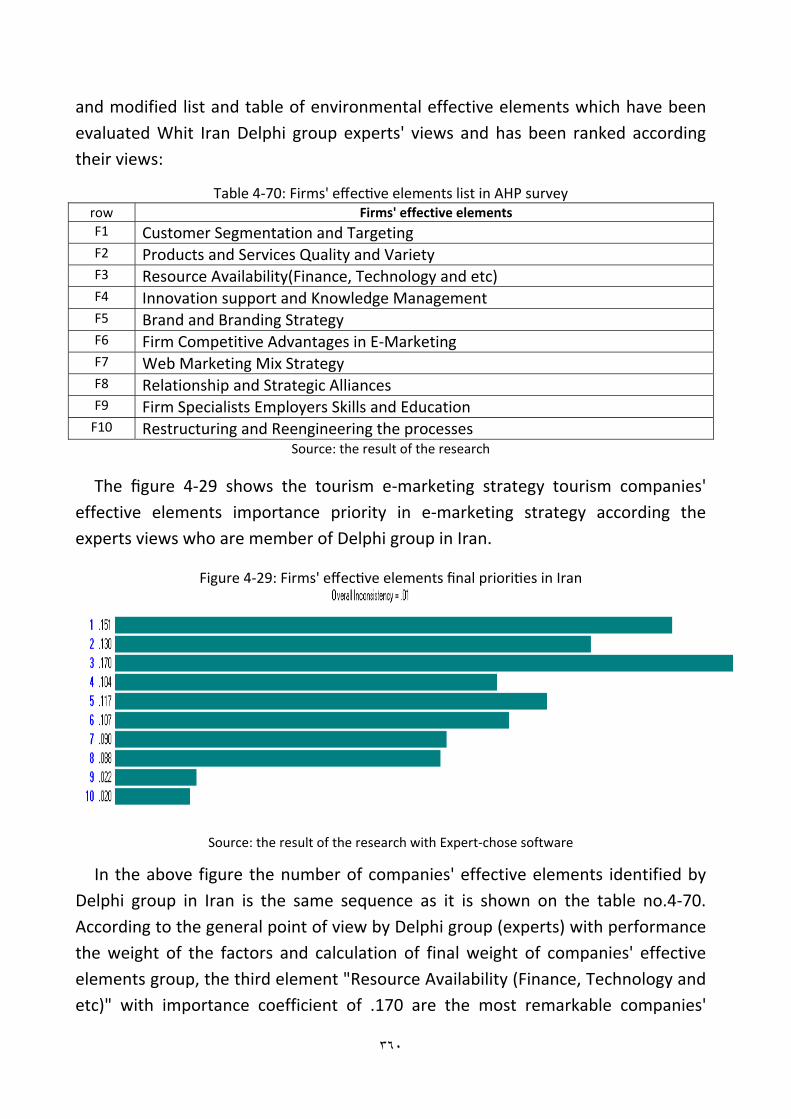
٣٦٠
and modified list and table of environmental effective elements which have been evaluated Whit Iran Delphi group experts' views and has been ranked according their views:
Table 4‐70: Firms' effec ve elements list in AHP survey row Firms' effective elements F1 Customer Segmentation and Targeting F2 Products and Services Quality and Variety F3 Resource Availability(Finance, Technology and etc)F4 Innovation support and Knowledge Management F5 Brand and Branding Strategy F6 Firm Competitive Advantages in E‐MarketingF7 Web Marketing Mix Strategy F8 Relationship and Strategic Alliances F9 Firm Specialists Employers Skills and Education F10 Restructuring and Reengineering the processes
Source: the result of the research
The figure 4‐29 shows the tourism e‐marketing strategy tourism companies' effective elements importance priority in e‐marketing strategy according the experts views who are member of Delphi group in Iran.
Figure 4‐29: Firms' effec ve elements final priori es in Iran
Source: the result of the research with Expert‐chose software
In the above figure the number of companies' effective elements identified by Delphi group in Iran is the same sequence as it is shown on the table no.4‐70. According to the general point of view by Delphi group (experts) with performance the weight of the factors and calculation of final weight of companies' effective elements group, the third element "Resource Availability (Finance, Technology and etc)" with importance coefficient of .170 are the most remarkable companies'

٣٦١
effective elements applicable to e‐marketing strategy designing in tourism, in Iran. The next two important companies' effective elements are "Customer Segmentation and Targeting" and "Products and Services Quality and Variety". The last priorities on this figure are elements no.9 "Firm Specialists Employers Skills and Education" and no.10 "Restructuring and Reengineering the processes" in table with the rate of .22 and .20 respectively.
4‐6‐3‐3‐3‐ Customers Satisfaction Effective Elements priorities in Iran
We have done same test About the Customers (Tourists) Satisfaction e‐marketing strategy effective elements and researcher has got rid here too two elements "E‐Shopping Facility and Support" and "Product & Service Flexibility and Individualization" from second questionnaire which have less ranks and less score from consider others test result such as Friedman. After removing we have eight elements for AHP questionnaire in this group of elements and this steep which have to compare pair‐wise. In this part we show the AHP results for Iran. The elements have reduced and in each group some of them have got rid of the list in AHP questionnaire by researcher to make short the compare process and require time to answer. The next table shows the new and modified list and table of Customers (Tourists) Satisfaction Effective Elements which have been evaluated Whit experts and has been ranked according their views:
Table 4‐71: Customers (Tourists) Sa sfac on Effec ve Elements in AHP survey
row Customers (Tourists) Satisfaction Effective Elements
C1 Perceived Added Value by CustomersC2 Cost and Price Advantage for CustomersC3 Tourists Needs, Experience and Expects in MarketC4 Products and Service Quality, Variety, Individualization and Innovation C5 Customization (Service and CRM Coverage Level)C6 Website (Attraction, Design, Availability, and Quality)C7 Transmission Speed and Conversion RateC8 Web and brand Reliability, Security, Privacy and Trust
Source: the result of the research
The figure (4‐30) shows the tourism e‐marketing strategy Customers (Tourists) Satisfaction Effective Elements' importance priority in e‐marketing strategy according the experts views who are member of Delphi group in Iran.
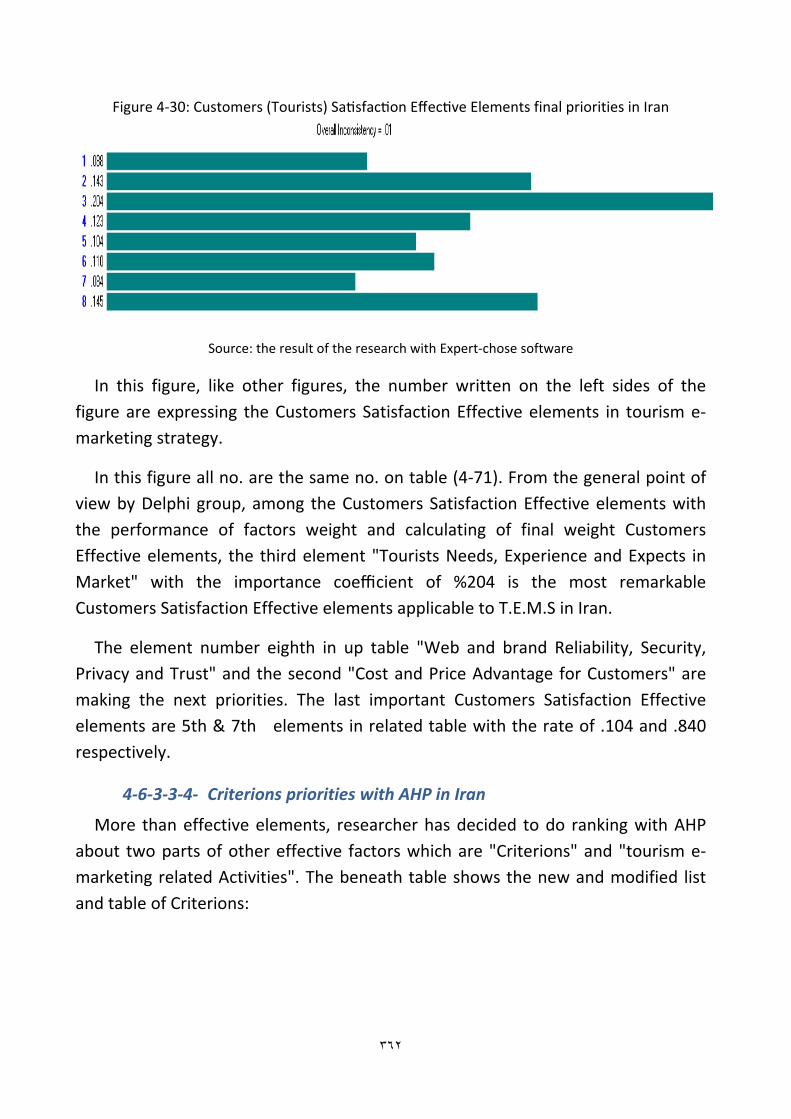
٣٦٢
Figure 4‐30: Customers (Tourists) Sa sfac on Effec ve Elements final priorities in Iran
Source: the result of the research with Expert‐chose software
In this figure, like other figures, the number written on the left sides of the figure are expressing the Customers Satisfaction Effective elements in tourism e‐marketing strategy.
In this figure all no. are the same no. on table (4‐71). From the general point of view by Delphi group, among the Customers Satisfaction Effective elements with the performance of factors weight and calculating of final weight Customers Effective elements, the third element "Tourists Needs, Experience and Expects in Market" with the importance coefficient of %204 is the most remarkable Customers Satisfaction Effective elements applicable to T.E.M.S in Iran.
The element number eighth in up table "Web and brand Reliability, Security, Privacy and Trust" and the second "Cost and Price Advantage for Customers" are making the next priorities. The last important Customers Satisfaction Effective elements are 5th & 7th elements in related table with the rate of .104 and .840 respectively.
4‐6‐3‐3‐4‐ Criterions priorities with AHP in Iran More than effective elements, researcher has decided to do ranking with AHP
about two parts of other effective factors which are "Criterions" and "tourism e‐marketing related Activities". The beneath table shows the new and modified list and table of Criterions:

٣٦٣
Table 4‐72: Criterions list in AHP survey Criterions
1 Customers Satisfaction
2 Customers Number
3 Costs
4 Market Share
5 Stockholders Satisfaction
6 Sell and Income
7 Web Visitors Numbers Source: the result of research
Outright man can see that we have any reduce about this category of factors (Criterions).The next figure shows the Criterions ' importance priority in e‐marketing strategy according the experts views who are member of Delphi group in Iran:
Figure 4‐31: Criterions final priori es in Iran
Source: the result of research with Expert‐chose software
The numbers 1 to 7 on the above figure are expressing the Criterions identified by the Delphi’s group as it is on the table 4, in general point of views of Delphi’s group and calculating the final weight of criterions, the first Criterion "Customers Satisfaction" with importance coefficient of .205 is the most important Criterions to E.M. of Tourism in IRAN. Next to this are the third "Costs" and the fifth one "Stockholders Satisfaction" which are allocated the next priorities of important. The 4th and the7th with the rate of .96 and .82 are collected the rest and the last of the priorities, respectively.
4‐6‐3‐3‐5‐ Tourism Activities priorities in Iran
At last question of last questionnaire researcher has asked about the importance priority of Tourism Activities and for this question too researcher has got rid any item like criterions. We have eight elements for AHP questionnaire in this group

٣٦٤
and in this steep have to compare them pair‐wise with AHP method. First we show the AHP results for Iran and in next sections will presents the AHP results about Iran.
Table 4‐73: Tourism Ac vi es in AHP survey row Tourism Activities
1 Back Office(Management, Accounting & Payroll)
2 Front Office(Reservation, Check in, Payment)
3 Marketing Research
4 Promotion and advertising 5 Integration and Partnership
6 Performance Monitoring (Control of Business Processes and Personal) 7 Customers Entertainment and Communication
8 Education and Training Source: the result of research
The figure 4‐32 includes the Tourism Activities' importance priority in e‐marketing strategy according the experts views who are member of Delphi group in Iran:
Figure 4‐32: Tourism Ac vi es Final priori es in Iran
The result of the research with Expert‐chose software
The number 1 to 8 in the above figure are the same numbers on table 4‐73, which are expressing the Tourism Activities identified by the Delphi’s group. The third item "Marketing Research" with importance coefficient of .150 is the most important item between others items in this category for applicable to E.M.S of Tourism in Iran. The next important Tourism Activities items are on the first row "Back Office (Management, Accounting & Payroll)" and the forth "Promotion and advertising" in the field of E. Trade, E. Marketing and E. Tourism. The sixth and the

٣٦٥
eighth items with the rate of .103 and .105 are making the last priori es respectively on this figure according the Iran Delphi groups' views.
4‐6‐3‐4‐ Germany AHP analyze results
After calculation was done, the numbers entered to the table of expert choice software based on the general model of the research. The results about Germany have been illustrated in the coming five figures. These figures are expressing the priorities and importance of weaknesses and threat with each group effective elements with the performance of weight and total priorities of the e‐tourism strategy effective elements according the Germany experts views which are member of this research Delphi group in Germany.
4‐6‐3‐4‐1‐ Environmental Effective Elements priorities in Germany
In this part we show the AHP results about Germany. As has explained before about Iran, in tourism e‐marketing environmental effective elements group "Competition Intensity and Competitors' Strategies" and "Business and Marketing Models Changes (Time &Process)" have got rid of the list and we have now eight environmental elements. The next table shows the new and modified list and table of environmental effective elements which have been evaluated Whit experts and has been ranked according Germany Delphi group views:
Table 4‐74: Environmental effec ve elements list in AHP Germany row Environmental Effective Elements
E1 IT and Telecommunication Infrastructure Costs E2 General IT Knowledge and Culture in Society E3 Technology and IT Systems Standards, Innovation, Capabilities, and TurbulenceE4 Government IT and E‐Commerce Policy, Laws, Rules and Support E5 Human Resources Market (IT & E‐Marketing Specialist) E6 Availability of Resource and Environmental Opportunity E7 E‐Tourism Value‐Chain Players' and Competitors' Power and Impacts E8 Market (Capability, Potential, Turbulence, Orientation)
Source: the result of research
The figure you can see the tourism e‐marketing strategy environmental effective elements importance priority according the experts views who are member of Delphi group in Germany:

٣٦٦
Figure 4‐33: Environmental effec ve elements priorities with AHP in Germany
Source: result of research with Expert‐chose software
Here also it should be explained that the number one to eight written on the figure are same environmental effective elements on the table (4‐74). After considering the general point of views by the Germany Delphi’s experts (with performance of weight of the factors), the second element General IT Knowledge and Culture in Society" with the importance coefficient of .206 is the most remarkable Environmental Effective Element in the group of Environmental Effective Elements. The next to this are the items "IT and Telecommunication Infrastructure Costs" and "Availability of Resource and Environmental Opportunity" which are allocated the priorities of important in Germany experts' opinions who are member of panel in this research. The last priorities are for Environmental Effective Elements no.7 "E‐Tourism Value‐Chain Players' and Competitors' Power and Impacts" and no.8 "Market (Capability, Poten al, Turbulence, Orientation)" with the rate of .73 and .66 respectively.
Note: If you compare the result of Iran and Germany about environmental effective elements, you cannot find any significant differences in their ranking and importance score.
4‐6‐3‐4‐2‐ Firms' Elements priorities in Germany
The AHP analyze result about the company's tourism e‐marketing strategy effective elements important priorities according the Germany Delphi experts group are same Iran and it has got rid two elements "Firm IT Infrastructure Station and Orientation" and " Increased Web Traffic and Stickiness" which have undermost ranks and with consider others test result such as Friedman. There are

٣٦٧
10 elements for AHP ques onnaire in this group, which have to compare pair‐wise. In this part, we show the AHP results for Germany. In following table, you see the new and modified list and table of Firms' effective elements, which have been evaluated Whit Germany experts and have been ranked according their views:
Table 4‐75: Firms effec ve elements list in AHP Germany row Firms' Elements
F1 Customer Segmentation and Targeting F2 Products and Services Quality and Variety F3 Resource Availability(Finance, Technology and etc)F4 Innovation support and Knowledge Management F5 Brand and Branding Strategy F6 Firm Competitive Advantages in E‐MarketingF7 Web Marketing Mix Strategy F8 Relationship and Strategic Alliances F9 Firm Specialists Employers Skills and Education F10 Restructuring and Reengineering the processes
Source: the result of research
The upper figure shows the tourism e‐marketing strategy tourism companies' effective elements importance priority in e‐marketing strategy according the experts views who are member of Germany Delphi group.
Figure 4‐34: Firm's effec ve elements priori es with AHP in Germany
Source: the result of research with Expert‐chose software
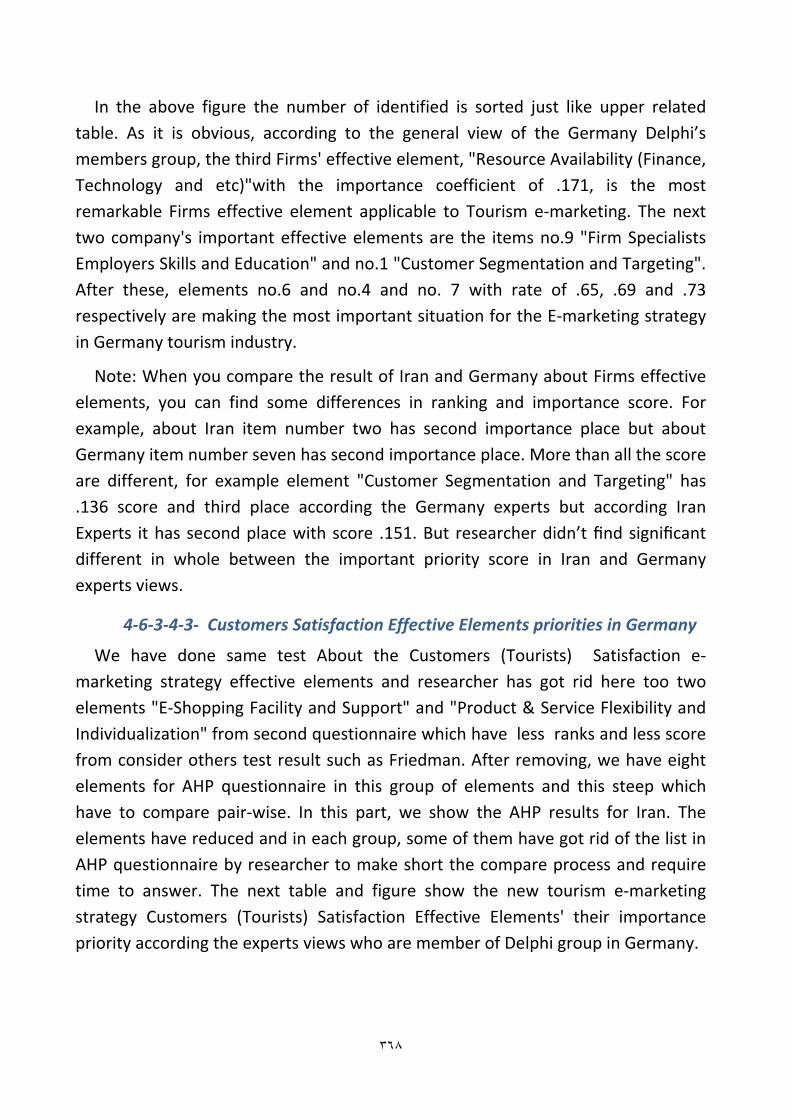
٣٦٨
In the above figure the number of identified is sorted just like upper related table. As it is obvious, according to the general view of the Germany Delphi’s members group, the third Firms' effective element, "Resource Availability (Finance, Technology and etc)"with the importance coefficient of .171, is the most remarkable Firms effective element applicable to Tourism e‐marketing. The next two company's important effective elements are the items no.9 "Firm Specialists Employers Skills and Education" and no.1 "Customer Segmentation and Targeting". After these, elements no.6 and no.4 and no. 7 with rate of .65, .69 and .73 respectively are making the most important situation for the E‐marketing strategy in Germany tourism industry.
Note: When you compare the result of Iran and Germany about Firms effective elements, you can find some differences in ranking and importance score. For example, about Iran item number two has second importance place but about Germany item number seven has second importance place. More than all the score are different, for example element "Customer Segmentation and Targeting" has .136 score and third place according the Germany experts but according Iran Experts it has second place with score .151. But researcher didn’t find significant different in whole between the important priority score in Iran and Germany experts views.
4‐6‐3‐4‐3‐ Customers Satisfaction Effective Elements priorities in Germany
We have done same test About the Customers (Tourists) Satisfaction e‐marketing strategy effective elements and researcher has got rid here too two elements "E‐Shopping Facility and Support" and "Product & Service Flexibility and Individualization" from second questionnaire which have less ranks and less score from consider others test result such as Friedman. After removing, we have eight elements for AHP questionnaire in this group of elements and this steep which have to compare pair‐wise. In this part, we show the AHP results for Iran. The elements have reduced and in each group, some of them have got rid of the list in AHP questionnaire by researcher to make short the compare process and require time to answer. The next table and figure show the new tourism e‐marketing strategy Customers (Tourists) Satisfaction Effective Elements' their importance priority according the experts views who are member of Delphi group in Germany.

٣٦٩
Table 4‐76: Customers effec ve elements list in AHP Germany row Customers (Tourists) Satisfaction Effective Elements
C1 Perceived Added Value by CustomersC2 Cost and Price Advantage for CustomersC3 Tourists Needs, Experience and Expects in MarketC4 Products and Service Quality, Variety, Individualization and Innovation C5 Customization (Service and CRM Coverage Level)C6 Website (Attraction, Design, Availability, and Quality)C7 Transmission Speed and Conversion RateC8 Web and brand Reliability, Security, Privacy and Trust
Figure 4‐35: Customers effec ve elements in AHP ques onnaire in Germany
Source: result of research with Expert‐chose software
The numbers one to eight written on the figure are the same Customers (Tourists) Satisfaction Effective Elements on the related table. According to the Delphi’s experts' views in Germany, third customer satisfaction element in table "Tourists Needs, Experience and Expects in Market" with the importance coefficient of .204 are the most important elements in his group for tourism e‐marke ng. The next important elements are item no.8 "Web and brand Reliability, Security, Privacy and Trust" and item no.2 "Cost and Price Advantage for Customers", which are respectively allocated further priorities. The last priorities are for the first item "Perceived Added Value by Customers" and the seventh item "Transmission Speed and Conversion Rate" with the rate of. /84 and. /88 respectively.
Note: in compare between Iran and Germany results researcher has find that there is any different between Iran and Germany experts views' who are panel members about importance and priority of Customers (Tourists) Satisfaction Effective Elements in tourism e‐marketing strategy.

٣٧٠
4‐6‐3‐4‐4‐ Criterions priorities with AHP in Germany
As explained about Iran, researcher has decided to do ranking with AHP two parts of other effective factors which are "Criterions" and "tourism e‐marketing related Activities" more than effective elements, about Germany too. The beneath table and figure show the new and modified list and the Criterions ' importance priority in e‐marketing strategy according the experts views who are member of Delphi group in Germany.
Table 4‐77: effec ve Criterions list in AHP Germany Criterions
1 Customers Satisfaction
2 Customers Number
3 Costs
4 Market Share
5 Stockholders Satisfaction
6 Sell and Income
7 Web Visitors Numbers
Figure 4‐36: priority of effec ve Criterions in tourism e‐marketing with AHP in Germany
Source: result of research with Expert‐chose software
Outright man can in related table see there is any reduce about this category of factors (Criterions) and the no.1 to no.7 on the above figure (4‐36), are the same items on the table (4‐77). From the general point of view of the experts of Delphi group among the Criterions category (with performance of factors weight), the first Criterion "Customers Satisfaction" with the importance coefficient of .205 is the most important Criterion applicable to tourism e‐marketing in Germany. Next to this are the items no.3 "Costs" and no.5 "Stockholders Sa sfac on" which are allocated next priority with respect to tourism e‐marketing strategy in Germany.
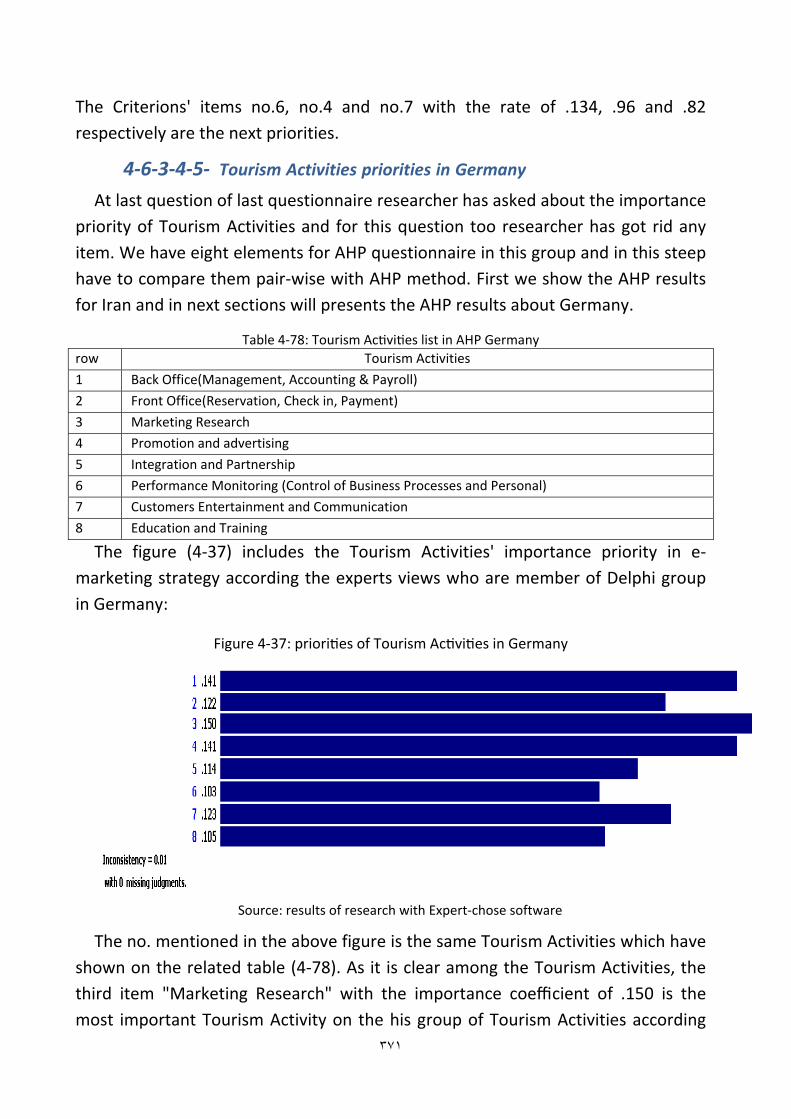
٣٧١
The Criterions' items no.6, no.4 and no.7 with the rate of .134, .96 and .82 respectively are the next priorities.
4‐6‐3‐4‐5‐ Tourism Activities priorities in Germany
At last question of last questionnaire researcher has asked about the importance priority of Tourism Activities and for this question too researcher has got rid any item. We have eight elements for AHP questionnaire in this group and in this steep have to compare them pair‐wise with AHP method. First we show the AHP results for Iran and in next sections will presents the AHP results about Germany.
Table 4‐78: Tourism Ac vi es list in AHP Germany row Tourism Activities
1 Back Office(Management, Accounting & Payroll)
2 Front Office(Reservation, Check in, Payment)
3 Marketing Research
4 Promotion and advertising
5 Integration and Partnership
6 Performance Monitoring (Control of Business Processes and Personal)
7 Customers Entertainment and Communication
8 Education and Training
The figure (4‐37) includes the Tourism Activities' importance priority in e‐marketing strategy according the experts views who are member of Delphi group in Germany:
Figure 4‐37: priori es of Tourism Ac vi es in Germany
Source: results of research with Expert‐chose software
The no. mentioned in the above figure is the same Tourism Activities which have shown on the related table (4‐78). As it is clear among the Tourism Activities, the third item "Marketing Research" with the importance coefficient of .150 is the most important Tourism Activity on the his group of Tourism Activities according
٣٧٢
the Germany Delphi group experts in tourism e‐marketing. Next to this Tourism Activities items no.4 "Promotion and advertising "and no. 1 "Back Office (Management, Accounting & Payroll)" are the next priority with same score (.141). But the sixth & eight items with the rat of .103 and .105 are stand in last place of mentioned Tourism Activities ranking.
Note: in compare between Iran and Germany results researcher has find that there is any different between Iran and Germany experts views' who are panel members about importance priority of Tourism Activities in of Tourism e‐marketing strategy.

٣٧٣
Chapter Five
Conclusion and
Recommendations

٣٧٤
5‐1‐ Introduction This chapter is dedicated to the summarization of the results presented in the
previous chapter, as well as the conclusions that can be derived from the gathered and collated data. Recommendations for actions as well as further studies are also included in this chapter. This part of the chapter will present the summarization of data. As with the previous chapter, it will also be divided into three parts for better understanding of the topics. More than chapter provides a summary of the research and includes recommendations for future related studies. These recommendations are based on reflections on the research, existing scholarly literature and survey results.
The purpose of this research was to find e‐marketing strategy effective elements in for the tourism industry in Iran and Germany by specifically using Delphi method. In this research, the author considered the environmental, organizational (company), customer satisfaction elements which affect e‐marketing strategies and e‐tourism strategies that can influence the generic e‐marketing strategies and successfully performance, which affect industry structures.
The author obtained valuable data and information researching the methodology, conducting interviews, discussions with key players and carrying out further research on this topic to gather research findings but some areas of this study were descriptive in nature. In determining the e‐marketing strategy effective elements in Iran and Germany tourism industry, the author obtained insights about e‐tourism and e‐marketing strategy subjects and players, such as customers expects, environment situation, governments' policies. It helped to explore the market segments and customer behavioral patterns, and to compare the impact of each effective element on generic e‐marketing strategies on the Iran and Germany Tourism industry and their impact on competitors.
The e‐marketing and e‐tourism can lade to a lot of benefits for tourism industry an d companies in this industry. Nevertheless, companies for use better from this opportunity and its benefits need to have strategy. Successfully performance a strategy and company depend to a lot of elements and factors. It is too about e‐marketing strategy but the some effective elements could be different. In this research had tried to identify and classification them and then determine their important in Iran and Germany tourism industry different sectors (Airlines, tour operator and chain hotels).

٣٧٥
Finding summery
The study did have some limitations and was susceptible to biased feedback by some of the respondents. Findings showed that competition between the existing companies in the Sri Lankan Housing Industry has been fierce with many similar‐sized companies, low entry and exit barriers, increasing threat from substitute products and increasing bargaining power of buyers. The result could be a new strategic direction, i.e. a new positioning, differentiation for competitive products of strategic partnerships. Next figure shows the areas of this research:
Figure 5‐1: area of research study
After study and consider books, articles and other secondary documents, the tourism industry and e‐marketing was also analyzed through in‐depth interviews, as a case study within the frame of Delphi study model and three questionnaire survey to ascertain the bargaining power of supplier's (airlines, tour operators and chain hotels) and customers. These results were evaluated by using frequency tables, Likert scale of comparisons and AHP method (Pair‐wise comparing).
With the comparison of effective elements ranking in second survey results and their final weight in AHP method, 10 more important tourism e‐marketing strategy effective elements based on their final weight have been sorted as below:
1‐ General IT Knowledge and Culture in Society (environmental) (.206)
2‐ Tourists Needs, Experience and Expects in Market (customer) (.204)
Air line
Tour operator
Chain Hotel
Strategy
E‐marketing
Tourism industry

٣٧٦
3‐ Resource Availability (Finance, Technology and etc) (company) (.170)
4‐ IT and Telecommunication Infrastructure Costs (environmental) (.152)
5‐Customer Segmentation and Targeting (company) (.151)
6‐ Availability of Resource and Environmental Opportunity (environmental) (.149)
7‐ Technology and IT Systems Standards, Innovation and etc (environmental) (.145)
8‐ Web and brand Reliability, Security, and Privacy and Trust (customer) (.145)
9‐ Cost and Price Advantage for Customers (customer) (.143)
10‐ Products and Services' Quality and Variety (company) (.130)
We showed that there are wide ranges of different kind and varieties of effective elements that affect the tourism e‐marketing strategy. The aim of this dissertation is to identification the effective elements and categorization them. More than above elements researcher have found and categorized some other elements and factors. These factors include four different groups in second round but in third round, researcher has considered only two of them, which are Criterions and Tourism Activities. The most seven important of this group according the views of experts in Iran and Germany are:
1‐ Customers Satisfaction (Criterions) (.205)
2‐ Costs (Criterions) (.186)
3‐ Stockholders Satisfaction (Criterions) (.153)
4‐ Marketing Research (Tourism Activities) (.150)
5‐ Customers Number (Criterions) (.145)
6‐ Promotion and advertising (Tourism Activities) (.149)
7‐ Back Office (Management, Accounting & Payroll) (Tourism Activities) (.145)
Customer sa sfac ons' elements with average value 5.54 according the research results have more important than other groups. The results of the survey indicate that, the total average value of the environmental elements as well as the companies effective in the Germany and Iran experts' views. Because the research is exploratory in nature, future research on the subject should be expanded to assess the practical application of these elements.

٣٧٧
In this category, you see that the first three places belong to Criterions and Tourism Activities in compeer state in next sits. It shows that Criterions separately have more important than Tourism activities items. The results of tests and analyze the questionnaires show that there is not significant different between the views of experts in Iran and Germany. It means that internet and e‐marketing as new phenomenon in marketing and tourism industry Here have to attend to this subject that the results are not completely same and do not explain the differences between two countries and Condition of different companies and tourism players, which are our case study in this research.
Researcher has tried to distinguish between short‐term elements and steady elements and focused on second group. Within the first chapter, researcher has line out the tourism value of the Internet and e‐marketing strategy in tourism industry as derived to research surveys. In the second chapter, researcher has considered and formulated tourism and e‐marketing situation and condition in Iran and Germany and our case studies tourism industry players (Airline, chain Hotels and Tour operator). Furthermore, has taken the two experts groups (Delphi Group) in Germany and Iran in three surveys in tried chapter, which you can see above the results. Next figure tries to show other aspect of subjects, which have been considered and analyzed in third chapter:
Figure 5‐2: Tourism E‐marketing Strategy different effective elements group in research
Source: research findings
Environment and its condition for e‐
tourism
Company's elementsand structure
Systems and technology
Touristic Organization activities
Criterions
Motivation Factors
Customer satisfaction
E‐marketing strategy in tourism industry

٣٧٨
The findings demonstrate that the Tourism industry has a good market and a high potential for e‐marketing and e‐tourism to be a profitable business venture. Findings also indicated that the industry was a developers/sellers market and company which work in this industry have to have suitable strategy in for successfully in their strategy implementation and performance need to consider big variety of elements which some of the have analyzed in this research.
5‐2‐ Conclusion Purpose of this chapter is to provide conclusions, implications,
recommendations, and an overall summary of the research. This research has been focused on identify tourism e‐marketing strategies' effective elements and their important of an e‐marketing‐based strategy for the improvement of retaining knowledge within the study three main tourism industry players Airline, chain Hotels and Tour operator) in Iran and Germany. However, this will not solve the housing problem in its entirety but research highlights the configuration and dynamics of knowledge sharing practices in a customer support center setting. Although this research provides insight into how important, have each of these recognized elements in implement and successfully e‐marketing strategies and the touristic companies which use e‐marketing in tourism international market and are one of the research case study.
More than, the same result and views about important of elements in this research doesn't means that they have same effect and trace and impress the e‐marketing strategy in same value in Germany and Iran but it means that the their important in compare other elements. It is same story about their important in different segments of tourism industry, which we have considered them as case study in this research (Airline, chain Hotels and Tour operator). For these sectors in regarding the five competitive forces for the sectors in Iran and Germany we can conclude that:
• The threat of substitute products/services and an increased power of suppliers are not seen as evident.
• An increased rivalry among existing firms is also not that relevant from the point of view of the industry experts.
• On the other hand, the Internet increases the threat of new entrants (in the form of new intermediaries) by reducing the entry barriers.

٣٧٩
• The Internet increases the power of firms by reducing of the switching costs.
• The Internet offers new possibilities to bypass intermediaries and to address customer needs directly; the power of such intermediaries is reduced.
• The Internet offer new tools and services (e.g. personalization) to place new products for individual customers.
In general, these are organizational problems. The ability to handle these problems will be a very important success factor to gain competitive advantage by using the Internet. Tourism E‐marketing development cycle has been showen a comprehensible model:
Figure 5‐3: Tourism E‐marketing development cycle
Source: result of research
The role of the Internet for thee‐marketing and tourism industry in Iran and Germany are same but with different situation and some different function to drive tourism industry toward future. Above figure shows tourism e‐marketing development cycle according the research results, which researcher offer to better understanding the research framework and elements affect on tourism marketing and related strategies and as recommendation for different players. In this chapter, researcher has derived some recommendations to enhance the competitive position of touristic firms by using the e‐marketing strategy.
Tourism Marketing and E‐Marketing
Mission and strategies
Internet and communication technologies
Customers' needs and expects

٣٨٠
5‐3‐ Recommendation Analysis and Generic Strategies Models were used as the conceptual framework
to determine a viable strategy for the e‐marketing strategy in tourism industry. To draw our recommendations, we first define some general suggestions. In general, tourism e‐marketing strategy need to take advantage of using ICT to reduce their marginalization from the mainstream tourism industry and to make their products available to institutional and make their websites dynamic. The Internet provides them with two major opportunities: The direct customer contact and a new worldwide distributions channel.
They may be able to achieve competitive advantage if they manage to develop and position their niche products as unique and design a spacious and practicable strategy. Enhancing the professionalism of tourism e‐marketing strategy, through analyze effective elements and a comprehensive model, can especially support strategies and successfully implementation. Researcher according the research findings and experts views suggests the following model:
Figure 5‐4: Recommended model for Tourism e‐marketing strategy by researcher
Source: result of research
E‐marketing strategy process
E‐marketing Strategy
Touristical Criterions
Technological Criterions
Customers' satisfaction elements
Company's elements
Environmental elements
Organization activities and Criterions
SWOT analyze
Implementation Control and improve

٣٨١
This strategy model would open a good opportunity for companies in tourism industry to the develop their market and if it managed successfully by them those companies could reap the benefits and be classified as overall cost leaders in the industry. Additionally, a more comprehensive survey should examine and re‐test the models practicality to assess a universal model. This process will immensely benefit the different touristic companies in the both countries, specifically the Iran. The researcher was able to accomplish the main purpose of this study, but there are still some areas that could be in further improve.
This research study was conducted to find a e‐marketing strategy effective elements for the tourism industry in Germany and Iran. These three effective elements group plus four other Factors group offers a good base to consider e‐marketing strategies and design a practice and efficacious strategy in e‐markets.
Nowadays, companies who work in e‐market and tourism Industry know that in order to be successful need an efficacious and comprehensive strategy for their e‐marketing activities. The results of this research give good view to companies in Iran and Germany (companies in other countries and industries) in orientation their e‐marketing strategies and studies.
These findings were aggregated and we formulated several recommendations for the three groups to improve their Internet strategy. These recommendations provide a snapshot of today’s developments and should help players to define their strategies. In general, we can draw the conclusion that innovative players who appreciate the power of the e‐marketing and adopt their e‐marketing strategy and internal processes to the new demands will be able to compete on an equal footing with some of their larger competitors in very competitive tourism market.
However, there is much more research that could be done in this area and the author intends to invite any other researcher to continue in this field in order to find the ideal fit. This could be applicable to even industries other than the tourism industry. While the study concluded that the tools examined were successful in meeting the objective of the research of finding a winning market Strategy for the tourism industry in Germany and Iran, it provides many avenues upon which future studies can be built.
Further research can be conducted by using the theoretical framework to evaluate other sectors within the travel and tourism industry. This could provide a more comprehensive insight view about the changes within the industry value

٣٨٢
chains and technology. Furthermore, this research was mainly focusing on a strategic evaluation of used effective elements and services of the Internet. To draw more specific recommendations for industry players, further research projects should look more deeply on quality parameter of the used services and try to define empirical models to evaluate their ability for competitive advantage.
The research has helped us to understand that it is still possible for developers to build decent and affordable e‐marketing strategy for companies in tourism industry by analyze effective elements. More than next subject according the researcher views and research findings could be future challenge and good area for futures research and researcher who want to study in e‐marketing and e‐tourism fields:
• Consider customers views about effective elements in e‐shopping process;
• Considers in different e‐marketing strategy models and identification their;
• Consider each of the companies, which were our case study (tour operators, Airlines and chain hotels) separately;
• Define a framework for e‐marketing with focus on competitive advantage for tourism, which can be systematized and evaluated from e‐ solutions;
• analyze the e‐marketing strategies in different countries which are good In e‐marketing, technology and tourism such as USA;
• analyze the role of the governments and international organizations;
• Define tourist needs and aspects from e‐tourism and e‐marketing and an tourists e‐marketing satisfaction models or E‐CRM model.
Even if this would take more time and effort and make some changes in the system, the researcher believes that e‐marketing and related strategies would become more beneficial if it could also process other countries and other documents that are secret in each company(such as strategies and finance documents. The future researchers should find time to personally seek out other technologies and systems that can benefit the operations of the e‐tourism and e‐marketing at the different levels of industry, market and company. The researcher also recommends that tampering of documents be discouraged and that safeguards be implemented before any occurrence of this will happened

٣٨٣
Bibliography (Reference):
‐ "Accor Becomes Partner in Beijing Tourist Board," (1999); Travel Trade Gazette UK & Ireland, August 23, 1999, p. 7.
‐ "Accor Unveils First New York City Property," (2000);Travel Weekly, August 7, 2000, p. 24. ‐ "Accor Web Site Tops 12 Million Hits," (2001); Lodging Hospitality, March 15, 2001, p. 42. ‐ Adam, S., Mulye, R, Deans, K., Palihawadana, D., 2002. E‐marketing in perspective: a three country
comparison of business use of the internet. Marke ng Intelligence and Planning 20 (4), 243‐251. ‐ Adersberger. Josef. (2005); " Zukunftstrend e‐tourism Plattformen" e‐tourism Seminar.Germany. ‐ A.J. Ness et al.(2001); The Role of ABM in Measuring Customer Value, http://www.mamag.com/
strategic finance/03f.htm. ‐ Airliners.net, (2006); "Retrieved on in airlines marketing strategy" London. ‐ Adam, S., Mulye, R, Deans, K., Palihawadana, D., (2002); "E‐Marketing in perspective: a three
country comparison of business use of the internet". Marke ng Intelligence and Planning 20 (4), 243‐251.
‐ Afuah, A., Tucci, C.L. (2001); "Internet Business Models and Strategies: Text and Cases". McGraw‐Hill, Boston.
‐ Alhawamdeh. A. Mohammad. (2007); "The role of knowledge management in building e‐business strategy". Proceedings of world congress on engineering and computer science. San Francisco. USA. October 2007.
‐ Alireza Mokhtar(2003); "APPLYING AHP METHODOLOGY TO SELECT THE BEST RAPID PROTOTYPING TECHNIQUE (Economical & Technical Approach)"; The 32nd interna onal conference on Industrial & Computer Engineering, Ireland Aug. 2003.
‐ Allen. Eric and, Fjermestad. Jerry, (2001); "E‐commerce marketing strategies: anintegrated frameworkand case analysis" Logis cs Informa on Management; Volume 14 . Number 1/2 . 2001 . pp. 14±23
‐ Amanda C. Simeُs da Silva*and Mischel Carmen N. Belderrain, (2010); "Prioritization of R&D projects in the aerospace sector: AHP method with ratings". Technological Institute of Aeronautics; So José dos Campos – Brazil.
‐ Amit, R. and Zott, C. (2001); "Value creation in E‐business"; Strategic Management Journal, Vol. 22, pp. 493 ‐ 520.
‐ Anderson, F. T. T. (1975); "A modified Delphi study of the political feasibility of critical issues affecting educational reform in Maryland". Unpublished doctoral dissertation, Virginia Polytechnic Institute and State University, Blacksburg, Virginia.
‐ Andreas Knorr und Silvia Žigová, " Competitive Advantage through Innovative Pricing Strategies: The Case of the Airline Industry". Berichte aus dem Weltwirtschaftlichen Colloquium der Universität Bremen, Germany, 2010, Pp 4‐9.
‐ Arabi Daft, DR, Seyyed Mohammad and Dr. translated from Parsaeeian Richard , (2009) theoretical bases of organization,: cultural research institute, third edition,Pp:78‐78; 361‐364.
‐ Armistead,Colin(1999). Knowledge management and process performance. Journal of Knowledge Management. 3(2) . pp. 143‐154
‐ Arthur,T., Bill. D., Stephen.B, Alastair.D., and Andrew.,W. (2002); "Management Information Systems: Concepts, issues, tools, and applications". Data Publishing, Melbourne.
٣٨٤
‐ Asia‐Pacific Ministerial Conference. (2002) Iran’s Plans for Developing a Sustainable Environment for Ecotourism: Strengthening Management Principles and the Legislative Framework. Retrieved April 1, 2005 from http://www.world‐tourism.org/sustainable/IYE/National_Activities/Maldives/iran.pdf
‐ Bacuvier, G. et al. (2001); "Customer lifetime value: Powerful insights into a company’s business and activities", http://www.bah.com/viewpoints /insights/cmt_clv_2.html.
‐ Bergsman, Steve, "Accor Gains Ground with U.S. Acquisitions," Hotel & Motel Management, May 27, 1991, pp. 3, 60‐61.
‐ Berlin Airport Company, (1990); "Monthly Timetable Booklets for Berlin", Tempelhof and Berlin Tegel Airports, Berlin Airport Company, West Berlin October.
‐ Bond, Helen, "Motel 6 Eyes More Moves," Hotel & Motel Management, May 27, 1991, pp. 1, 76. ‐ Bhide, A. V., McKinsey and Company. (1992; Harvard Business School Case 9‐393 066. Boston:
Harvard Business School, Nov. 8. ‐ Brooks, K. W. (1979). Delphi technique: Expanding applica ons. North Central Associa on
Quarterly, 53, 377‐385. ‐ Bruce E. Fad (2003); "Analytical Hierarchy Process (AHP) Approach to Size Estimation"; PRICE
Systems L.L.C. 17000 Commerce Parkway, Suite A ;Mount Laurel, New Jersey, 08003, USA . ‐ Barnes, J. L. (1987). An interna onal study of curricular organizers for the study of
technology. Unpublished doctoral dissertation, Virginia Polytechnic Institute and State University Blacksburg, Virginia.
‐ Bruce, Leigh, (1987) "The Two‐Headed Chairmanship That Keeps Accor Soaring," International Management, January 1987, pp. 26‐28.
‐ Bruner, G and A Kumar. (2000); “Web Commercials and Advertising Hierarchy of Effects”, Journal of Advertising Research; April: 35‐42.
‐ Buhalis. Dimitrios; (1999); "Informa on and communica on Technologies in Tourism". Proceeding of the international congerence in Innsburk, Published: SpringerWienNewYourk, Austria.
‐ Buhalis, Dr Dimitrios. ( 2001); "Tourism Product by using e‐Tourism " British‐Hellenic Chamber of Commerce Conference in Tourism, University of Surrey; Athens, 19 October.
‐ Buhalis, Dr Dimitrios,( first educaton 20032003)(2005); E‐Tourism "Information technology for strategic tourism management" Published:Prentice Hall. United Kingdom.
‐ Buhalis,ِِِِِِِDِِimitrius,(2004); “e‐tourism: information technology for strategic tourism management, UK, London : Prentice Hall.
‐ Carvalho, Pedro G.(2006); " Key Issues on Tourism Strategies"; Universidade da Beira Interior. Portugal. Paper to be presented at the 53rd Annual Conference of the North American Regional Science Associa on 16 November 2006.
‐ "Carlson Finalizes Deal," Travel Weekly, February 17, 1997, p. 38. ‐ Casussus, Barbara, "Accor Plans Expansion after Huge Rise in Profit," Travel Trade Gazette Europe,
April 8, 1999, p. 4. ‐ Cathy.HSU and others. (2008); "Tourism Marketing" an Asia‐pacific perspective" John Wiley & sons.
First published. Australia. ‐ CEDAR.(2009);" Strategy formula on", http://www.cedarconsul ng.com. ‐ Cetron, M. J. (1969). Technological forecasting. New York: Gordon and Breach. ‐ Chaffey. Dave, (2009); "E‐Business Management", Third Edition, Pearson Education. ‐ Chaffey (2002); "E‐business and e‐commerce management". Financial Times, Prentice Hall. Harlow,
UK. ‐ Charbaghi,Kazem&Newman,Victor(1997).The crisise of wealth creation. Jurnal of management
decisionPp: 35‐37.
٣٨٥
‐ Cheen ,Stephen, (2002); "E‐marketing strategic management", New York: John& Sons. Pp: 85‐88. ‐ Chen. Stephen, (2001); "Strategic management of e‐Business". Published by John Willy and Sons,
LTD; London, England. Published by John Willy and Sons, LTD; USA. ‐ Chia‐Chien Hsu,(2007); "Using Experts’ Opinions Through Delphi Technique Making Sense Of
Consensus". The Ohio State University & Brian A. Sand ford, Oklahoma State University. ‐ CEFRIO. (2009); “new e‐business models and SME development”. Canada. ‐ "Circling the Wagons," Economist, January 27, 1990. ‐ Colin, Simon, (2007) electronic marketing, translation et la: Atena publication, Iran technology
innovation research institute. Pp: 166‐177. ‐ "Commission Clears Accor, Hilton, Six Continents Internet Bookings Joint Venture," Europe Media,
May 20, 2003. ‐ Commission, European (2003) "Structure, performance and compe veness of European Tourism
and its enterprises". EU ‐ Office for Official Publications of the European Communities. ‐ Cooke, S.(1994); "Database Marketing: Strategy or Tactical Tool?". Marketing Intelligence &
Planning. 12(4), 4‐7. ‐ Cooke. Simon; (1994); "Marketing Intelligence & Planning", Vol. 12 No. 6, pp. 4‐7© MCB University
Press Limited. ‐ Cote. Louise& others. (2009) E‐commerce overview series tourism accommodation sector in
Canada. ‐ Cote. Louise. (2005) "The strategic management process in e‐business" , Vincent. Suborn, Lvey
business journal, improving the practice management. Richard Lvey School of business, the University of Western Ontario, London. UK. May/June 2005.
‐ Coyle R G (1989) ‘A Mission‐orientated Approach to Defense Planning’, Defense Planning, Vol. 5, No.4. pp 353‐367.
‐ Crispin, Dale(2002); The compe ve networks of tourism e‐mediaries: New strategies, new advantages; University of Wolverhampton, Gorway Road, Walsall, West Midlands, WS1 3BD, UK;18th November.
‐ Cuhls, Kerstin (2007); "Delphi method Prepared ", Institute for Systems and Innovation Research, Germany.
‐ Cunninham. Michael, (2002); "E‐Strategy". First publish by Capsto publishing, UK. ‐ Daft, Richard , theoretical bases of organization, translated by DR, Seyyed Mohammad Arabi and Dr.
Parsaeeian: cultural research ins tute, third edi on 2006. P: 162‐166. ‐ Dailey, A. L. (1988). Faculty consensus at a mul ‐campus college through Delphi.
Community/Junior College Quarterly, 12, 21‐26. ‐ Dalkey, N. C. (1967). Delphi. Santa Monica, CA: The RAND Corpora on. ‐ Dalkey, N., & Helmer O. (1963). An experimental application of the Delphi method to the use
of experts. Management Science, 9(3), 458‐467. ‐ Damanpour,F. ”Organiztion Innovation: a Metanlysis Of Effect Of Determinants And Moderators,”
Academy Of Management Jounal, 34, 3, 1991, PP:555‐590. ‐ Daneshkhu, Scheherazade, "Hard to Find: Hotel Rooms and Profits," Financial Times, December 16,
1999, p. 37. ‐ David fred R, strategic management, translated by DR, Seyyed Mohammad Arabi and Dr.
Parsaeeian: cultural research ins tute, seventh edi on 2006. p:368 ‐ Dawson. Ray and Shah. Nilpa, (2009); "Formulating an E‐commerce Strategy", Southborough
University, UK.

٣٨٦
‐ Deitel, H.M., Deitel, P.G. and Nieto, T.R. (2001); "E‐Business & e‐Commerce HOW TO PROGRAM. Prentice‐Hall, Upper Saddle River.
‐ Desai, C., Fletcher, K., and Wright, G., (2001); "Drivers in the Adoption and Sophistication of Database Marketing in the Services Sector". The Service Industries Journal. 21(4), 17‐32.
‐ Deutsche Zentrale.für Tourismus e. V; (2009); "German National Tourist Board "Marketing and sales for “Destination Germany”".Frankfurt am Main. www.germany‐tourism.de
‐ Donna, B. Stoddard, & Micheael Littlejohn,”The Reality of Business Reengineering: Pacific Bells Centrex Provisioning Process” California Management Review.38 (3), spring 1999,pp: 54‐67 .
‐ Downey. Jim;(2007); "Service Strategic Analysis Tools and Technical Informa on " The Chartered Institute of Management Accountants ; United Kingdom, www.cimaglobal.com
‐ Dutton, J. and R. Duncan. (1987). “The Creation of Momentum for Change through the Process of Strategic Issue Diagnosis.” Strategic Management Journal, 8, 279‐295.
‐ Ebrahimi, Abdolhanid; Hasanni, Seyyed Mahood (2005). Marketing strategy in internet markets. Published by commerce research institute of Tehran, Pp:33.
‐ Ellsworth, Jill and Mathew. (1995); "marke ng on the internet: Mul media strategic for World Wide Web". Published by John Wiley & Sons; USA.
‐ Elmu , D. and Kathawala, Y. (2001); ‘An overview of strategic alliances’, Management Decision, Vol. 39, No. 3, pp.205 ‐ 217.
‐ Evans P., and Wurster, T. Blown to Bits. (2000); "E‐business strategy ‐ virtual value chain". Boston: Harvard Business School Press.
‐ Evans, Richard, "Le Motel 6, C'est Moi: (2001), France's Accor Has Mastered the American Art of Mass Marke ng," Barron's, April 30, p. 20.
‐ Evans, Daniel. (2002); "Internet and competitive advantage in Australian professional sport organizations". Deakin University, Victoria.
‐ Fangpin Ding. (2005);“E‐commerce and E‐Marketing". Shandong Coal Science and Technology, Shandong, China, (3), pp.41‐42.
‐ Finnegan, David. Leslie P. Willcock. (2007). Implemen ng CRM: from technology to knowledge. John Wiley son’s ltd. British library. London.
‐ Flanders, F. B. (1988). Determining curriculum content for nursery/landscape course work in voca onal agriculture for the 21st Century: A future’s study utilizing the Delphi technique. Doctoral Dissertation, University of Georgia.
‐ Fletcher, K., Wheeler, C. and Wright, J. (1992), “Success in Database Marke ng: Some Crucial Factors”, Marke ng Intelligence & Planning, Vol. 10 No. 6, pp. 18‐23.
‐ Flowers, Grant, "Accor to Expand Sofitel Brand Worldwide," Travel Weekly, March 25, 1999, p. 1. ‐ "French Hotel Group Acquires 40‐Percent Stake in Clal Tourism," Israel Business Today, May 2000, p.
17. ‐ "French Travel Groups Merge," Daily Deal, November 28, 2003. ‐ Galbraith, J. Designing Organizations (revised edition). San Francisco: Jossey‐Bass, 2002. ‐ Galliers, Robert D. and Leidner, Dorothy E.(2003) Strategic Informa on Management Challenges and
strategies in managing information systems (Third edition). Published by Butterworth‐Heinemann An imprint of Elsevier Science. Pp: 504.
‐ Geoff, Coyle;(2004); "THE ANALYTIC HIERARCHY PROCESS (AHP)Practical Strategy. Open Access Material. AHP" California, USA.
‐ Gollub, James, Hosier, Amy and Woo, Grace (2003) Using Cluster‐based economic strategy to minimize tourism leakages. World Tourism Organization Conference, Europe, ICF‐Global Economic Development Practice.

٣٨٧
‐ Gomes, L.F.A.M, Gomes, C.F.S. and Almeida, A.T., (2006), “Tomada de decisمo gerencial: enfoque multicritério”, Sمo Paulo, Atlas.
‐ Gordon. Theodore. J. (2004)"THE DELPHI METHOD". The Millennium Project Futures Research Methodology—V3.0, 2004.
‐ Grimm, T.(2002). Stereolithography, Selec ve laser sintering and Polyjet: Evalua on & applying the right technology. Accelerated Technology, Inc.
‐ Grobbelaar, S S (2007), R &D in the Na onal System of Innova on: a System Dynamics Model University of Pretoria etd.
‐ Gultai, R. (1999) ‘Network loca on and learning: The influence of network resources and firm capabilities on alliance formation’, Strategic Management Journal, Vol. 20, pp. 397‐ 420.
‐ Gula , R., Nohria, N. and Zaheer, A.(2000) ‘Strategic networks’, Strategic Management Journal, Vol. 21, pp. 203 ‐ 215.
‐ Gratzer, Mag. Markus(2003); Changes in the Travel and Tourism Industry Caused by the Internet ‐ Competitive Advantage for the SME. Accommodation Sector in Austria? Universität Wien
‐ Günazdin. M Urat; (2005), "THE DELPHI METHOD" H. Istanbul Uni. Turkey. ‐ Guo, L., (2005). Surveying Internet Usage and Impact in Five Chinese Cities. Research Center for
Social Development, Chinese Academy of Social Sciences, November. ‐ Gurău C. and A. Ranchhod, (2002), Measuring customer satisfaction: A platform for calculating,
predicting and increasing customer profitability, Journal of Targeting, Measurement and Analysis for Marke ng .10(3) (2002)203‐219.
‐ Gurau. calin. and others. (2003)"Customer‐Centric Strategic Planning: Integrating CRM in Online Business Systems";Heriot‐Watt University, School of Management, UK. Information Technology and Management 4, 199‐214.
‐ Guthan, Antje;( 2002); “The Impact of the Internet on Business Travel” Bournemouth University. ‐ Hamedan, Mahmood, (2004)Study of the e‐commerce in costumers behaviours as the Shaban Elahi
Guidance, expertise of commercial management, Tarbiat Moddaress university. Iran.. p:25 ‐ Harmon, P., Rosen, M., and Guttman, M. (2001), Developing E‐business systems and architectures A
Manager's Guide. Academic Press, San Francisco. ‐ Harrison. Jeffrey & Enz. A. Cathy. (2007); "Hospitality Strategic Management (concepts and
cases)".published by: John Wiley& sons. New York. Second edition. ‐ Hartman. Francis T; and Jennifer Krahn; (200); " The Delphi Method for Graduate Research"
University of Calgary,Calgary, CanadaJournal of Informa on Technology Educa on Volume 6. ‐ Hinsken. Ernst; (March, 2009); ``Government Policy Guidelines on Tourism`` Publisher. Federal
Ministry of Economics and Technology (BMWi). ‐ Holden. Gerg, Belew. Shannon, Elad. Joel; (2009); " E‐Business" : Applied Information Management
and the Graduate School of the University of Oregon in partial fulfillment of the requirement for the degree of Master of Scienc.
‐ Holowetzki, Antonina(2000). The rela onship between knowledge management and organiza onal culture: An examination of cultural factors that support the flow and management of knowledge within an organization. Presented to the Interdisciplinary Studies ProgramPp: 44‐46.
‐ Huband, Marc, "Big Investment in Tourism: Accor Group," Financial Times, December 20, 1999, p. 6. ‐ Hsu, Cathy. Killion, Les. Brawn, Graham. (2008); "Tourism Marketing". John Willy &sons. Australia. ‐ lages. carmen and others.(2004); " The relationship between E‐Marketing strategy and
performance: a conceptual framework in a web context". ISCTE business school‐Lisbon, Portugal. ‐ Ian. Chaston, (2001); "E‐Marketing Strategies " McGraw‐Hill, Maidenhead, Boston, Canada.

٣٨٨
‐ IBM; (2008), ‘’Customer Focused Airline: A Vision for Airline CRM ‘’ (Making the Customer Experience a Compe ve Advantage); IBM Corpora on 2008.
‐ IBM;(2009), "customer focused airline: a vision for airline CRM" IBM institute for business value study, 2009.
‐ Informed Marketer News (IMN); (2008); " Reality E‐Marketing: Strategy" http://www.markle.org/downloadable_assets/ final_9_2005.pdf, accessed may 2008, Page 5 of 9.
‐ Informed Marketer News(IMN); (2006); " Reality E‐Marketing: Strategy", Available from: http://www.markle.org/downloadable_assets/ final_11_2005.pdf, accessed June 2006, Page 1 of 3.
‐ Ijay Mahajan, and P.Rajan Varadarajan, (1999) Contemporary Perspec ves on Strategic Market planning Boston: Allyn and Bacon, pp8‐9.
‐ ΓΝΟΡΑ ;( 2005); A framework for a strategic action plan for the implementation of E‐Marketing Cyprus tourism organiza on; ICAP management consultants; November 2005.
‐ Inskeep. Edward. (1994), "National and Regional Tourism Planning Methodologies and case studies". word tourism organization, First e published by Routledge, London and New York.
‐ Inskeep. Edward, (1994); "Na onal and regional tourism planning: Swi . Louise, Sally Piff; (2010); "quan ta ve methods: Edinburgh Business School". Edi on:3rd; Published by: Palgrave Macmillan, UK.
‐ Ingold, Anthony/Ian Yeoman (2003), Yield Management: Strategies for the Service Industries, 2nd Edi on, London.
‐ Iranian tourism organiza on,(2006) Tourism administration reform and automation project documents,Pp:26.
‐ Iranian tourism organiza on,(2008) Country’s taxation comprehensive project, ,Pp:17. ‐ Iranian tourism organiza on,(2009) process Standardization project documents,Pp:12. ‐ Iranian tourism organiza on,(2010) Standardization project, Pp: 33. ‐ Iranian tourism organization,(2010) IT strategic project report ,Pp: 21. ‐ Ito, Harumi/Darin Lee (2003), Low Cost Carrier Growth in the U.S. Airline Industry:
Past, Present, and Future, Brown University Department of Economics Work‐ ing Paper No. 12/2003 (http://www.brown.edu/Departments/Economics/Papers/ 2003/2003‐12_paper. pdf).
‐ James E Pearce, Geoffrey I Webb, Robin N Shaw and Brian Garner, (2009); "A Systemic Approach to the Database Marketing Process". Deakin University.
‐ Jayr. Galbraith; (2003); " STRATEGY AND ORGANIZATION CONSULTING " Center for Effective Organizations ;Marshall School of Business; University of Southern California
‐ Jeffrey S. Harrison and Cathy A.Enz; (2007)Hospitality Management, concepts and cases; ‐ Jendricke. Uwe; (2010); " Germany Informa on sharing na onal strategyÄ , Bundesamt für
Sicherheit in der Informationstechnik(BSI) Bonn, Germany,march. ‐ Jiang. Hongwei. (2009); "Can Customer‐Centric E‐Business System Achieve Competitive Advantage
for Airline Industry?" RMIT University, Victoria, 3001, Australia. ‐ Jones, Sandra, "Accor Launches Rebranding, Proposes Venture with Air France," Hotel & Motel
Management, July 3, 1993, p. 11. ‐ Johnson. Cerry and Scholes. Kevan, (2006); " Exploring Corporate Strategy: WITH Companion
Website with Gradetracker, Student Access Card: Text and Cases"; Financial Times/ Pren ce Hall; 7 edition.
‐ Kalpicˇ,Brane and Bernus, Peter (2006). Business process modeling through the knowledge management perspective. Journal of knowledge management.10.( 3), pp:40‐56.

٣٨٩
‐ Kanagal. Nagasimha; (2008); "Role of Relationship Marketing in Competitive Marketing Strategy"; Indian Institute of Management, Journal of Management and Marketing Research; Bangalore.
‐ Kasperczyk. Nadja and Knicke.l Karlheinz, (2008); "The Analytic Hierarchy Process (AHP)" ([email protected]).
‐ Keeney, Ralph L. (1992); "Value Focus Thinking ‐ a path to creative decision making". Cambridge, Massachusetts, Harvard University Press.
‐ Kepner, C.H., and Tregoe, B.B., (1965); "The rational manager: a systematic approach to problem solving and decision making". McGraw Hill: New York.
‐ Kexin Zhao' Mu Xia, Michael J. Shaw. (2009); "The Equilibrium of B2B e‐Marketplaces: Ownership Structures, Market Competition, and Previous Buyer‐Seller Relationships"; Department of Business Administration, School of Business, University of Illinois at Urbana‐Champaign, 350 Wohler's Hall, MC‐706, Champaign, IL 61820, USA.
‐ Key Net; (2002); " Travel Agents & Overseas Tour Operators Market Report 2002". July 2002. Germany. http://www.keynote.co.uk/market‐intelligence/.
‐ Kiang. Melody Y. T.S. Raghu , Kevin Huei‐Min Shang; (1999); " Marke ng on the Internet — who can benefit from an online marke ng approach?". October 1999, USA.
‐ Kmieciak. Johannes. (2009); "Low cost airline" Ryan air case"; universität Münster. ‐ Kotler. Philip, Keller.KevinLane; (2009); "Marke ng management". 13 th.ed. New York, Pearson
Prentice Hall. ‐ Kotler. Philip; Bowen, John T. Makens, James C.; (2005), (2006); "Marke ng for Hospitality and
Tourism". 4 th.ed. Pearson Pren ce Hall. New Jersey, USA. ‐ Lages. Carmen, Rita. Paulo,2004); "The Relationship between E‐Marketing Strategy and
Performance: A Conceptual Framework in a Web Context " Lisbon, Portugal. ‐ Lee, H.L., and Whang, S., (2001); "E‐business and supply chain integration". Stanforford Global
Supply Chain Management Forum, http://www.stanford.edu/group/sc‐forum. ‐ Lee,Gwendolyn K. &Cole, Robert E.(2003). From a Firm Based to a Community‐Based Model of
Knowledge Creation: The Case of the Linux Kernel Development. Journal of Organization Science Vol.14, No.6, November–December 2003, pp:633–649.
‐ Lever, Robert, "Viva la Capitalisme," Barron's, June 2001, p. 14. ‐ Li. Shi, Jenni. Makkula(2004); "value chain & internet & differentiation strategy". Department of
Business Administration and Social Sciences. Finland. ‐ Lindvall, Mikael, Rus, Loana & Shina, Suman Sachin(2003). So ware system support for knowledge
management. Journal of Knowledge Management Vol7 No 2 .Pp:137‐150. ‐ Lucila, Carvalho, Louise. Scott. Ross Jeffery (2003); "Exploring the use of techniques from Grounded
theory in process, engineering"; university of new south Wales, 2052m Sydney, Australia. ‐ Lou ,Wenhong & Tung ,Y. Alex(1999) A framework for selec ng business process modeling methods.
Industrial Management & Data Systems. 99(7) ,Pp :312‐319 ‐ Macharis, C., Springael J., De Brucker, K., Verbeke, A. (2004); "Promethee and AHP: The design of
operational synergies in multicriteria analysis. Strengthening Promethee with ideas of AHP". European Journal of Opera onal Research 153: 307−317.
‐ Maclean,Rachcel and Blackie,Nigel M.(2004),“Customer and company voices in e‐commerce: a qualitiactive analysis“, Quantitive Market Research; An International Journal.7(4), Pp:243‐249, Derived from :http//www.emeraldinsght.com,may2005.
‐ Maier, Ronald & Remus, Ulrich(2003). Implementing process‐ oriented knowledge management strategies. Jurnal of knowkedge management. 7 (4) , pp: 62‐74.

٣٩٠
‐ MarchFIRST. (2010); ‘’MARCHFIRST TO HELP LUFTHANSA STRENGTHEN INTERNET PRESENCE, BUILD NEW E‐COMMERCE BUSINESS’’. www.marchFIRST.com.
‐ Mark Merkow; Jim Breithaupt, (2006); "Information Security Principles and Practices", Pearson Prentice Hall.
‐ Martin, Hepp Katharina, Siorpaes Daniel Bachlechner , (2005); "towards the semantic Web in e‐Tourism: Lack of Semantics or Lack of Content?". Austria: University of Innsbruck.
‐ Matlack, Carol, "It's Time for Accor to Get Some Respect," Business Week, September 22, 2003, p. 32.
‐ Matthew, R, (2000); "Beginning E‐commerce with Visual Basic", ASP, SQL Server 7.0 and MTS. Wrox, Birmingham.
‐ McCole, P., Ramsey, E.,(2004); "Internet enabled technology in knowledge‐intensive business services". Marke ng Intelligence and Planning 22 (7), 761‐779.
‐ McDowell, Edwin, "Not Just Leaving the Light On," New York Times, October 28, 1998, p. C1. ‐ McGrath, L., Helens, R., (2003), "Beware the Internet panacea: how tried and true strategy got
sidelined". Journal of Business Strategy 24 (6), 24‐28. ‐ "Meat and Drink," Economist, July 8, 1995, p. 7. ‐ Miller, D. (1998); "The Cold War: A Military History", London, John Murray. ‐ Millet, I., Wedley, W.C., (2002); "Modeling Risk and Uncertainty with the Analytic Hierarchy
Process". Journal of Multi−Criteria Decision Analysis, 11: 97−107. ‐ Mocker. Martin and Teubner, Alexander;(2006); "Uncovering the Contents of Information Strategy
in Practice"; Research in progress. Münster, November. ‐ Molla,Alemayehu(2004),“The impact of e‐Readiness on e‐commerce surccess in developing
countrise ;frim‐levelEvidence“,Instiute for Develpment policy and Management , Develpment informationWorking paper,No.(18),pp:1‐13, Derived from :http//www.idmp.man.ac.com.
‐ Moosavi, Seyed Siamak, taxation on e‐commerce and its applied model, Paper presented at the first congress Iranian taxa on policies: Tehran, December, 2007,2(1),Pp: 233.
‐ Muhammad Imran Yousuf (2007); "Using Experts’ Opinions Through Delphi Technique", University of Arid Agriculture, Rawalpindi, Pakistan.
‐ Nada M. A. Al‐Slamy(2008); "E‐Commerce security"; IJCSNS International Journal of Computer Science and Network Security, VOL.8 No.5, May 2008; Jordan.
‐ Namchul Shin.(2008); "STRATEGIES FOR COMPETITIVE ADVANTAGE IN ELECTRONIC COMMERCE". Department of Information Systems, School of Computer Science and Information Systems, Pace University.
‐ Nintendo.(2002); "Strategy Formulation and Implementation" ‐ Nonaka,Ikujiro, Von Krogh, George and Nishiguchi, Toshihiro (2000). Knowledge crea on . A source
of value. Published by Antony Row ltd.Pp:197 ‐ Novo, J., a Model of Future Customer Value (2001), http://www.digitrends.net/ebiz/13644_14931.
Html. ‐ Offsey, Steve (1997) Knowledge Management: LinkingPeople to Knowledge for Bottom Line Results.
Journal of Knowledge Management Volume 1 Number 2 December 1997 Pp:113‐122 . ‐ Olkowski. David J.( 2001); “Informa on Security Issues in E‐Commerce”, SANS GIAC Security
Essen als, March.26,. ‐ Papathanassis. Dr. Alexis; (2009); "Strategic System Integration in Tourism (Interaction, Cola and
Humming‐Tops)", Institut für Maritimen Tourismus. ‐ Papathanassis. Alexis; (2006); "Managing System Integration in Tourism; Institut für Maritimen
Tourismus ; Hanover.

٣٩١
‐ Paudel. Binaya and M.A. Hossain; (2005); "E‐TOURISM INVESTMENT DECISION MAKING SUPPORT SYSTEM"; University of Bradford, Bradford BD7 1DP, UK.
‐ Pavesi,Sara(2003). Enabling knowledge processes in innovative environments . Ph.D. thesis. University of Twente Also available in print: http://www.tup.utwente.nl/. Pp: 108.
‐ Peschike, Kevin, |(2001); E‐Marketing, A Value‐based framework, Chicago: A.T.Kearney. ‐ Phillips. Marc. (2001); "Email Marketing Strategies (getting your marketing mix right)". From APT
strategies, Australia. 1st me ever in Malaysia the internet guru live in ac on. Kuala lumpur5th&6th. ‐ "Playing Monopoly: Luxury Hotels," Economist, May 7, (1994), pp. 77‐78. ‐ Pogarčić. Ivan, Miro. Frančić, Vlatka. Davidović , (2008); "APPLICATION OF AHP METHOD IN TRAFFIC
PLANNING"; ; Business Dept, Study of Informa on Systems, Polytechnic of Rijeka, Trpimirova 2/V, 51000 Rijeka, Croa a.
‐ Poon,a. (1993); "Tourism, Technology and competitive strategies" , CAB international Oxford. ‐ Porter, M. (1980); "Competitive strategy: techniques for analyzing industries and competitors: with
a new introduction". Free Press, New York. ‐ Porter. M.E.(1985); "competitive strategy". Macmillan, New York. ‐ Porter, M., (2001); "Strategy and the Internet". Harvard Business Review 79 (3), 63‐78. ‐ Pride William, Ferrell O.C. (1999); "Marketing" Tenth Edition, Houghton Mifflin Company, USA.pp9. ‐ Proctor, Tony.(2008); " Strategic Marketing ; an introduction" First published 2000 by Routledge.
USA. ‐ Pulevska, Lidija;(2007) E‐CRM IN THE TOURISM SECTOR, Faculty of Economics, University ”Ss. Cyril
and Methodius” Skopje, Macedonia. ‐ Pulevska. Lidija. (2009); "E‐CRM in tourism sector". University of Suceava, Romania, Faculty of
economics, university" Ss Cyril and Methodius", Skopje Macedonia. Issue.5. page 14‐19. ‐ Rahamanseresht . &AS Mir .M (2007). Organizational Knowledge Creation & Commercialization of
State Mail Service. The international journal of public sector management .16.(5) Pp: 373‐392. ‐ Raggad. Bel; (2010); "E‐COMMERCE". Department of Information Systems, School of Computer
Science and Information Systems, Pace University. ‐ Ramanathan, R., (2001); "A note on the use of the analytic hierarchy process for environmental
impact assessment". Journal of Environmental Management, 63: 27−35. ‐ Reier, Sharon,(1992); "Bedroom Eyes," Financial World, June 9, 1992, pp. 56‐58. ‐ "Rest Assured,(1998);" Economist, January 10, 1998. ‐ Riemer, Blanca, "This Buy‐America Bandwagon Could Hit a Few Potholes," Business Week, July 30,
1990, p. 21. ‐ Rowley, Jennifer.(2002); "Synergy and strategy in e‐business". In: Marketing intelligence & planning.
‐ Bingley : Emerald, Vol. 20, No. 4 (2002), p. 215‐222 Ormskirk, UK ‐ Saaty T L (1980); "The Analytic Hierarchy Process", McGraw Hill International ‐ Saaty, T.L. (2008); “Decision making with the analytic hierarchy process”, International Journal of
Services Sciences, Vol. 1, No 1, pp. 83‐97. ‐ Saaty, T.L., (2004); “Rank from comparisons and from ratings in the analytic hierarchy/network
processes”, European Journal of Opera onal Research, Vol. 168, No 2, pp. 557‐570. doi: 10.1016/j.ejor.2004.04.032.
‐ Saha, S. K., (2000); "Organizing semiconductor companies for electronic commerce". Proc. IEMC’00, Albuquerque, New Mexico, pp. 213‐218.
‐ Saha, S. K., (2003); "A Conceptual Model for Electronic Commerce in the Semiconductor Industry". Proceedings of the ADIS Interna onal Conference: WWW/Internet 2003, Algarve, Portugal, 5‐8 November 2003, vol. 11, pp. 1175‐1178.
٣٩٢
‐ Samar K. Saha1 and Nitya (2004); L. Karmakar2; DEVELOPING A CUSTOMER‐CENTRIC E‐BUSINESS MODEL FOR A HIGH TECH SECTOR ; CA, USA; ISBN: 972‐98947‐8‐7 © 2004 IADIS
‐ Samar K. Saha and Nitya L. Karmakar (2006); "DEVELOPING A CUSTOMER‐CENTRIC E‐BUSINESS MODEL FOR A HIGH TECH SECTOR"; Waterloo, Ontario, Canada, 2006
‐ Sarmad.Saidi, Soheil. Mirabi, VahidReza, E‐commerce,(2004),Tehran,published by Porseman,no.1,Pp:289
‐ Sean Quan Lau;(2006); "Domain Analysis of E‐Commerce Systems Using Feature‐Based Model Templates"; presented to the University of Waterloo in fulfillment of the thesis requirement for the degree of Master of Applied Science in Electrical and Computer Engineering
‐ Shaw, R., (1993); "Making Database Marketing Work". Journal of Informa on Technology. 8, 110‐117.
‐ Sherwood.Peter.(2007); "A Triple Bottom Line Evaluation of the Impact of Special Events: The Development of Indicators"; Centre for Hospitality and Tourism Research. Victoria University.
‐ Sheth, J., and Sharma, A., (2005); "International E‐Marketing: opportunities and issues". Interna onal Marke ng Review. 22 (6), 611‐ 622.
‐ Sholdon,p.(1997); "Information Technologies for tourism", CBA, Oxford. ‐ Shundich, Steven,(1997); "Corporate 200: Through Mergers and Acquisi ons, Consolida on
Continues to Reshape Hospitality Industry Worldwide," Hotels, July 1997, p. 45. ‐ Siliang yang. (2001); "E‐commerce in airline business, resented at international symposium on
government in e‐commerce development". Ningbo, China. April.23‐24.2001. ‐ Sidron, Jorge,(2001); "Accor, Century International Cobrand Five Properties," Travel Weekly,
November 15, 2001, p. 20. ‐ Sinko, Jus n; (2011); " Marke ng Startegies Of Hotel Chain". Kaplan University. ‐ Smart. Draw, (2009); "Visual Strategic Planning "Thinking and Communica ng Visually in the
Strategic Planning Process". San Diego. Www.smartdraw.com, November 2009. ‐ Smith, P.R. and Chaffey, D. (2001); "E‐Marketing excellence: at the heart of E‐Business". Butterworth
Heinemann, Oxford, UK. ‐ Starkov. Max and Mechoso. Mariana;(2010); "Local Internet Marketing Strategies for Franchised
Hotels" ; HeBS; N e w Y o r k. ‐ Stadler. Monika,(2008); "E‐Marketing tragetien für die Hotellerie". ACCOR Hospitality, general
manager nonvoter Wien city. ‐ Steve Shipside, (2002); "E Marketing", Johan Wiley & Sons. ‐ Strauss, Karen, (2004); "Accor's Pélisson: 'It's Only the Beginning,'" Hotel, September 2004, p. 32. ‐ Strauss, J. and R. Frost (2001); E‐Marke ng, 2nd Ed, Pren ce‐Hall, New Jersey. ‐ "Suitehotel Brings All‐Suites to Europe Hotels,"(2002); Lodging Hospitality, March 1, 2002, p. 12. ‐ Supphellen, M. and H. Nysveen. (2001); “Drivers of Intention to Revisit the Web Sites of Well‐Known
Companies: The Role of Corporate Brand Loyalty.” Interna onal Journal of Market Research, 43 (3): 341‐352. .
‐ The German National Tourist Board (GNTB), (2007); "Marketing and sales for “Destination Germany” Deutsche Zentrale für Tourismus www.germany‐tourism.de
‐ The German Na onal Tourist Board (GNTB), (2009); German Na onal Tourist Board Incoming‐Tourism Germany Facts and Figures 2008; www.germany‐tourism.de
‐ The German Na onal Tourist Board (GNTB), (2010), German National Tourist Board Incoming‐Tourism Germany Facts and Figures 2009; www.germany‐tourism.de
‐ The German National Tourist Board (GNTB), (2009), Outlook for the German travel industry 2009 " Growth hiatus predicted"; www.germany‐tourism.

٣٩٣
‐ TSA / WTTC World Travel and Tourism Council, (2010); Travel and Tourism Economic Impact 2009, Executive Summary, UK
‐ UNCTAD. (1998), “International trade in tourism related services: issues and options for developing countries”. Expert mee ng Geneva,8‐10 June 1998., TD/B/Com.1/EM.6/2
‐ UNCTAD ;( 2005), " ICT AND TOURISM FOR DEVELOPMENT 'Background paper by the UNCTAD secretariat; United Nations Conference on Trade and Development 20 September 2005.
‐ UNCTAD ;( 2004), UNCTAD’S E‐TOURISM INITIATIVE; United Nations Conference on Trade and Development ; São Paulo, 13–18 June 2004
‐ UNCTAD, (2004), “UNCTAD’s E tourism ini a ve”, eleventh session Sao Paulo, 13‐18 June 2004. TD(xi)/BP/6
‐ Vellas. Francois, Becherel. Lionel, (2009); "The interna onal Marke ng of Travel and Tourism: A strategic Plan" first published by Macmiland peress LTD, London.
‐ Viehland. Dennis W.(2000), "critical success factors for developing an e‐business strategy". I.I.M.S., Massey University. Albany. www.massey.ac.nz/wwiims/rlims/. Sept.2000.
‐ Walsh, John P., "Accor Plans Balanced Growth in U.S.," Hotel & Management, April 15, 2002, p. 3. ‐ WCECS. (2009; "Proceedings of world congress on engineering and computer science". San
Francisco. USA. October 2007. ‐ Whi ord, Marty, "The Price Is Right," Hotel & Motel Management, August 9, 1999, p. 1. ‐ Whitman. Michall E. and Herbert J. Maiiord, (2003), “Information Security”, Thomson, Inc. , ‐ William. Stallings, (2003), “Cryptography and network Security”, 3rd edi on, Pren ce Hall,. ‐ Wober, K. Frew, A. and Hitz, M. (eds); (2002), ‘Information and Communication Technologies in
Tourism, proceedings of the international conference in Innsbruck, Austria. ‐ Wong ,Kuan Yew(2005). Cri cal success factors for implemen ng knowledge management in small
and medium enterprises Industrial Management & Data Systems 105 (3),pp: 261‐279. ‐ World Bank Advisor: Iran’s Economic Growth Depends on Expansion of Private Sector. (2004)
Retrieved March 3, 2005 from www.payvand.com ‐ Wyner, G. (2000), “Learn and Earn Through Testing on the Internet.” Marke ng Research, 12 (3): 37. ‐ Wyssusek, Boris, Schwartz, Mar n , Kremberg, Be na, Baier, Fabian & Krallmann, Hermann(2001).
Business Process Modelling as an Element of Knowledge Management – A Model Theory Approach. Paper presented at the conference Managing Knowledge 2001: Conversations and Critiques, Pp: 10.–11. April 2001, Leicester University, UK.
‐ Xiaoming Meng; (2009), ‘’ Developing Model of E‐commerce E‐Marketing; Proceedings of the Interna onal Symposium on Informa on Processing (ISIP’09) China, August, 2009, pp. 225‐228
‐ XYKA Inc.(2010), " XYKA solution for tour operators “Levi Sanchez. Director of Electronic Distribution Blue Sky Tours. India Development Center. USA.2010.
‐ Yahya, Salleh & Goh, Wee‐Keat(2002). Managing human resource toward achieving knowledge management. Journal of Knowledge Management. 6( 5). Pp: 457‐468.
‐ Yang. Siliang,(2001), "E‐commerce in airline business". Paper presented at the international symposium on government in e‐commerce development. Ningbo, China. April23‐24. 2001.
‐ Yaroslavl. Pavlicek. (July 2008), "Definition of the company strategy". LAENG. University west Bohemia. Proceedings of World congress on engineering. London. .
‐ Yin R. K. (1989), Case Study Research: Design and Methods, the United States of America, Sage Publications, Inc.
‐ Yingjian Feng. (2005), “Content of E‐Marketing Manage”. New Observe Web of E‐Marketing. http://www. marke ngman.net/wmtheo/zh264.htm, 2005‐3‐10.

٣٩٤
‐ Yongjun Chen, Xiaoming Meng. (2008), E‐commerce and E‐Marketing. Electronic Industry Press, Peking, China.
Internet sites References:
• http://www.marketing-insights.co.uk/wnim0402.htm • http://www.unwto.org/facts/eng/pdf/barometer/UNWTO_Barom10_update_april_en_excerpt
.pdf • http://en.wikipedia.org/wiki/Lufthansa • http://www.turismo-sostenibile.org/implement-sustainable-tourism-strategy.asplangeng • http://www.lhconsulting.com/ • www.marchFIRST.com • www.germany-tourism.de • http://www.homahotels.com/hotels.aspx • http://www.pih.ir/index.aspx?siteid=1&pageid=139 (Persian hotels) • http://www.accor.com • http://www.hrs.de/web3/ • http://www.fundinguniverse.com • http://www.ghoghnos.net • http://www.pasargadhotel.com • http://www.pars-international-hotel.com • http://www.berge-meer.de • http://www.fti.de/ • http://www.gofox.com • http://www.ltur.com/de • http://www.persepolistour.ir/ • http://sindbadtravelagency.com/ • http://tutor2u.net/business/strategy/strategy_marke ng.htm • http://www.quickmba.com/MarketingStrat.shtml • http://www.marketing‐insights.co.uk/wnim0502.htm • http://www.sabreairlinesolutions.com/news/pdfs/001 002_Speck.pdf, 2008 • http://www.e‐centricsolutions.com/E‐Centric Solutions Pvt. Ltd • http://www.itl.nist.gov/div898/handbook/eda/section3/eda35b.htm

٣٩٥
Appendices 1- SPSS 1-1- Coronbach Alpha Test GET FILE='C:\Documents and Settings\Administrator\Desktop\Elements PhD.sav'. DATASET NAME DataSet1 WINDOW=FRONT. RELIABILITY /VARIABLES=S1 S2 S3 S4 S5 S6 S7 S8 S9 S10 /SCALE('ALL VARIABLES') ALL /MODEL=ALPHA /STATISTICS=DESCRIPTIVE SCALE CORR /SUMMARY=TOTAL. Reliability
Notes Output Created 02-MAR-2012 11:54:35Comments
Input
Data C:\Documents and Settings\Administrator\Desktop\Elements PhD.sav
Active Dataset DataSet1 Filter <none> Weight <none> Split File <none> N of Rows in Working Data File 32
Matrix Input C:\Documents and Settings\Administrator\Desktop\Elements PhD.sav
Missing Value Handling
Definition of Missing User-defined missing values are treated as missing.
Cases Used Statistics are based on all cases with valid data for all variables in the procedure.
Syntax
RELIABILITY /VARIABLES=S1 S2 S3 S4 S5 S6 S7 S8 S9 S10 /SCALE('ALL VARIABLES') ALL /MODEL=ALPHA /STATISTICS=DESCRIPTIVE SCALE CORR /SUMMARY=TOTAL.
Resources Processor Time 00:00:00.02Elapsed Time 00:00:01.30
[DataSet1] C:\Documents and Settings\Administrator\Desktop\Elements PhD.sav Scale: ALL VARIABLES
Case Processing Summary N %
Cases Valid 30 93.8Excludeda 2 6.3Total 32 100.0
a. Listwise deletion based on all variables in the procedure.
Reliability Statistics Cronbach's Alpha Cronbach's Alpha
Based on Standardized Items
N of Items
.981 .982 10
٣٩٦
Item Statistics Mean Std. Deviation N Global Distribution Systems(GDSs) 3.6000000 1.40442650 30 Executive Information Systems(EIS) 2.5000000 1.16707710 30 Strategic Information Systems(SIS) 3.5666667 1.19433529 30 Decision Support Systems(DSS) 3.4333333 1.19433529 30 Management Information Systems(MIS) 3.6333333 .96430548 30
Databases Systems(DB) 4.1000000 1.12495211 30 Expert Systems(ES) 3.2333333 1.13512367 30 Destination Management Systems (DMS) 3.4666667 1.19577801 30
Mobil/WAP Based Systems (MBS) 3.9000000 1.29588207 30 Interactive Digital TV(IDTV) 2.6666667 .95892660 30
Inter-Item Correlation Matrix
Global Distributio
n Systems(
GDSs)
Executive Informatio
n Systems(
EIS)
Strategic Informatio
n Systems(
SIS)
Decision Support
Systems(DSS)
Management
Information
Systems(MIS)
Databases
Systems(DB)
Expert Systems(
ES)
Destination
Management
Systems (DMS)
Mobil/WAP Based Systems (MBS)
Interactive Digital
TV(IDTV)
Global Distribution Systems(GDSs) 1.000 .505 .942 .950 .830 .899 .926 .936 .944 .871
Executive Information Systems(EIS)
.505 1.000 .606 .656 .689 .486 .612 .667 .490 .709
Strategic Information Systems(SIS)
.942 .606 1.000 .958 .875 .880 .917 .967 .929 .893
Decision Support Systems(DSS) .950 .656 .958 1.000 .891 .891 .940 .988 .920 .943
Management Information Systems(MIS)
.830 .689 .875 .891 1.000 .893 .900 .901 .880 .833
Databases Systems(DB) .899 .486 .880 .891 .893 1.000 .899 .887 .930 .799
Expert Systems(ES) .926 .612 .917 .940 .900 .899 1.000 .933 .931 .898
Destination Management Systems (DMS)
.936 .667 .967 .988 .901 .887 .933 1.000 .921 .922
Mobil/WAP Based Systems (MBS) .944 .490 .929 .920 .880 .930 .931 .921 1.000 .805
Interactive Digital TV(IDTV) .871 .709 .893 .943 .833 .799 .898 .922 .805 1.000
Item-Total Statistics
Scale Mean if Item Deleted
Scale Variance if Item Deleted
Corrected Item-Total Correlation
Squared Multiple Correlation
Cronbach's Alpha if Item
Deleted
Global Distribution Systems(GDSs) 30.5000000 89.776 .938 .954 .978

٣٩٧
Executive Information Systems(EIS) 31.6000000 100.800 .621 .702 .987
Strategic Information Systems(SIS) 30.5333333 93.154 .960 .953 .977
Decision Support Systems(DSS) 30.6666667 92.713 .982 .989 .976
Management Information Systems(MIS) 30.4666667 98.189 .921 .910 .979
Databases Systems(DB) 30.0000000 95.517 .906 .904 .979
Expert Systems(ES) 30.8666667 94.326 .957 .937 .977
Destination Management Systems (DMS) 30.6333333 92.723 .980 .985 .976
Mobil/WAP Based Systems (MBS) 30.2000000 91.890 .932 .957 .978
Interactive Digital TV(IDTV) 31.4333333 98.323 .919 .940 .979
Scale Statistics
Mean Variance Std. Deviation N of Items 34.1000000 116.714 10.80341581 10
RELIABILITY /VARIABLES=M1 M2 M3 M4 M5 M6 M7 /SCALE('ALL VARIABLES') ALL /MODEL=ALPHA /STATISTICS=DESCRIPTIVE SCALE CORR /SUMMARY=TOTAL. Reliability
Notes Output Created 02-MAR-2012 12:03:38Comments
Input
Data C:\Documents and Settings\Administrator\Desktop\Elements PhD.sav
Active Dataset DataSet1 Filter <none> Weight <none> Split File <none> N of Rows in Working Data File 32Matrix Input
Missing Value Handling
Definition of Missing User-defined missing values are treated as missing.
Cases Used Statistics are based on all cases with valid data for all variables in the procedure.
Syntax
RELIABILITY /VARIABLES=M1 M2 M3 M4 M5 M6 M7 /SCALE('ALL VARIABLES') ALL /MODEL=ALPHA /STATISTICS=DESCRIPTIVE SCALE CORR /SUMMARY=TOTAL.
Resources Processor Time 00:00:00.00Elapsed Time 00:00:00.00
[DataSet1] C:\Documents and Settings\Administrator\Desktop\Elements PhD.sav Scale: ALL VARIABLES
Case Processing Summary N %
٣٩٨
Cases Valid 30 93.8Excludeda 2 6.3Total 32 100.0
a. Listwise deletion based on all variables in the procedure. Reliability Statistics
Cronbach's Alpha Cronbach's Alpha Based on
Standardized Items
N of Items
.977 .978 7Item Statistics
Mean Std. Deviation N User-Friendly 3.7000 1.11880 30 Compressing data 3.6667 1.06134 30 Security and Trust 4.4667 1.04166 30 Speed 3.5667 .89763 30 Better Information 3.9667 .92786 30 Mobility 4.0000 1.14470 30 Last Minute Price 3.1667 .91287 30
Inter-Item Correlation Matrix
User-Friendly Compressing data
Security and Trust
Speed Better Information
Mobility Last Minute Price
User-Friendly 1.000 .900 .864 .896 .920 .915 .861
Compressing data .900 1.000 .769 .893 .899 .908 .878
Security and Trust .864 .769 1.000 .851 .837 .868 .713
Speed .896 .893 .851 1.000 .852 .906 .849
Better Information .920 .899 .837 .852 1.000 .844 .902
Mobility .915 .908 .868 .906 .844 1.000 .825
Last Minute Price .861 .878 .713 .849 .902 .825 1.000
Item-Total Statistics
Scale Mean if Item Deleted
Scale Variance if Item Deleted
Corrected Item-Total Correlation
Squared Multiple Correlation
Cronbach's Alpha if Item Deleted
User-Friendly 22.8333 31.454 .953 .917 .970Compressing data 22.8667 32.326 .930 .918 .972Security and Trust 22.0667 33.237 .862 .878 .977Speed 22.9667 34.102 .931 .889 .972Better Information 22.5667 33.771 .931 .935 .972 Mobility 22.5333 31.361 .936 .922 .972Last Minute Price 23.3667 34.378 .884 .875 .975
Scale Statistics Mean Variance Std. Deviation N of Items
26.5333 44.671 6.68366 7 RELIABILITY /VARIABLES=A1 A2 A3 A4 A5 A6 A7 A8 /SCALE('ALL VARIABLES') ALL /MODEL=ALPHA /STATISTICS=DESCRIPTIVE SCALE CORR /SUMMARY=TOTAL. Reliability
Notes Output Created 02-MAR-2012 13:50:49Comments
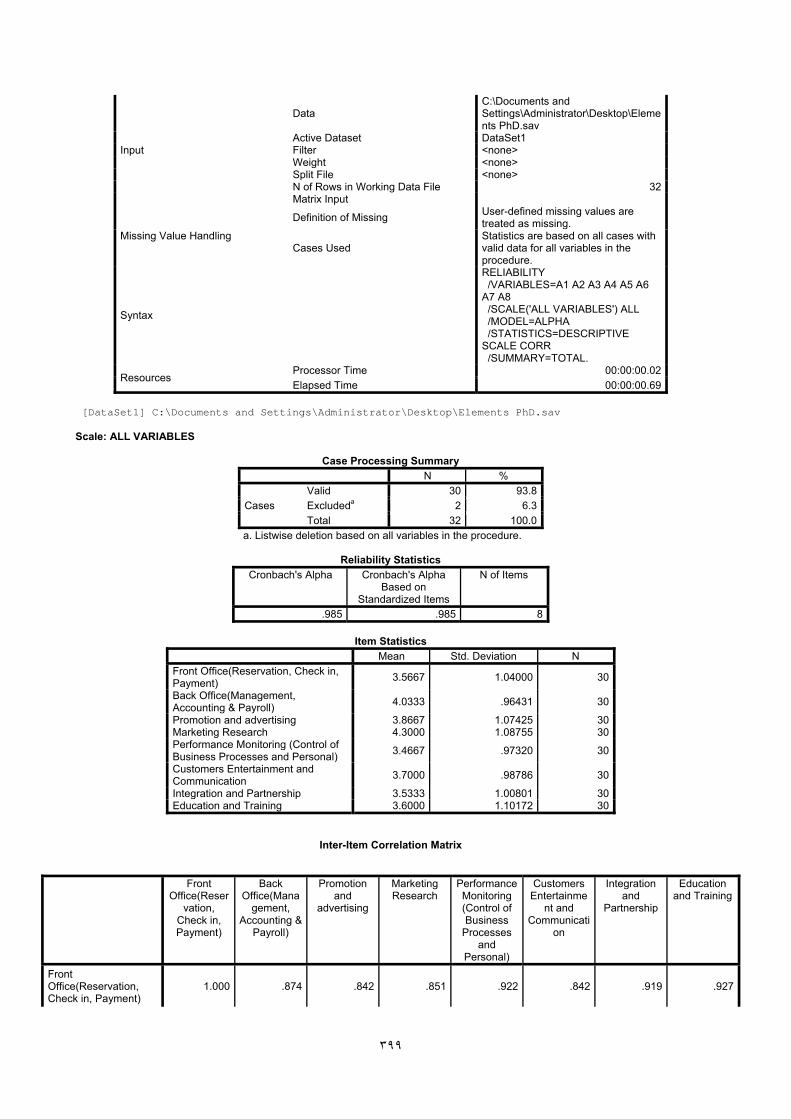
٣٩٩
Input
Data C:\Documents and Settings\Administrator\Desktop\Elements PhD.sav
Active Dataset DataSet1 Filter <none> Weight <none> Split File <none> N of Rows in Working Data File 32Matrix Input
Missing Value Handling
Definition of Missing User-defined missing values are treated as missing.
Cases Used Statistics are based on all cases with valid data for all variables in the procedure.
Syntax
RELIABILITY /VARIABLES=A1 A2 A3 A4 A5 A6 A7 A8 /SCALE('ALL VARIABLES') ALL /MODEL=ALPHA /STATISTICS=DESCRIPTIVE SCALE CORR /SUMMARY=TOTAL.
Resources Processor Time 00:00:00.02Elapsed Time 00:00:00.69
[DataSet1] C:\Documents and Settings\Administrator\Desktop\Elements PhD.sav Scale: ALL VARIABLES
Case Processing Summary N %
Cases Valid 30 93.8Excludeda 2 6.3Total 32 100.0
a. Listwise deletion based on all variables in the procedure.
Reliability Statistics Cronbach's Alpha Cronbach's Alpha
Based on Standardized Items
N of Items
.985 .985 8
Item Statistics Mean Std. Deviation N Front Office(Reservation, Check in, Payment) 3.5667 1.04000 30
Back Office(Management, Accounting & Payroll) 4.0333 .96431 30
Promotion and advertising 3.8667 1.07425 30 Marketing Research 4.3000 1.08755 30 Performance Monitoring (Control of Business Processes and Personal) 3.4667 .97320 30
Customers Entertainment and Communication 3.7000 .98786 30
Integration and Partnership 3.5333 1.00801 30 Education and Training 3.6000 1.10172 30
Inter-Item Correlation Matrix
Front Office(Reser
vation, Check in, Payment)
Back Office(Mana
gement, Accounting &
Payroll)
Promotion and
advertising
Marketing Research
Performance Monitoring (Control of Business
Processes and
Personal)
Customers Entertainme
nt and Communicati
on
Integration and
Partnership
Education and Training
Front Office(Reservation, Check in, Payment)
1.000 .874 .842 .851 .922 .842 .919 .927
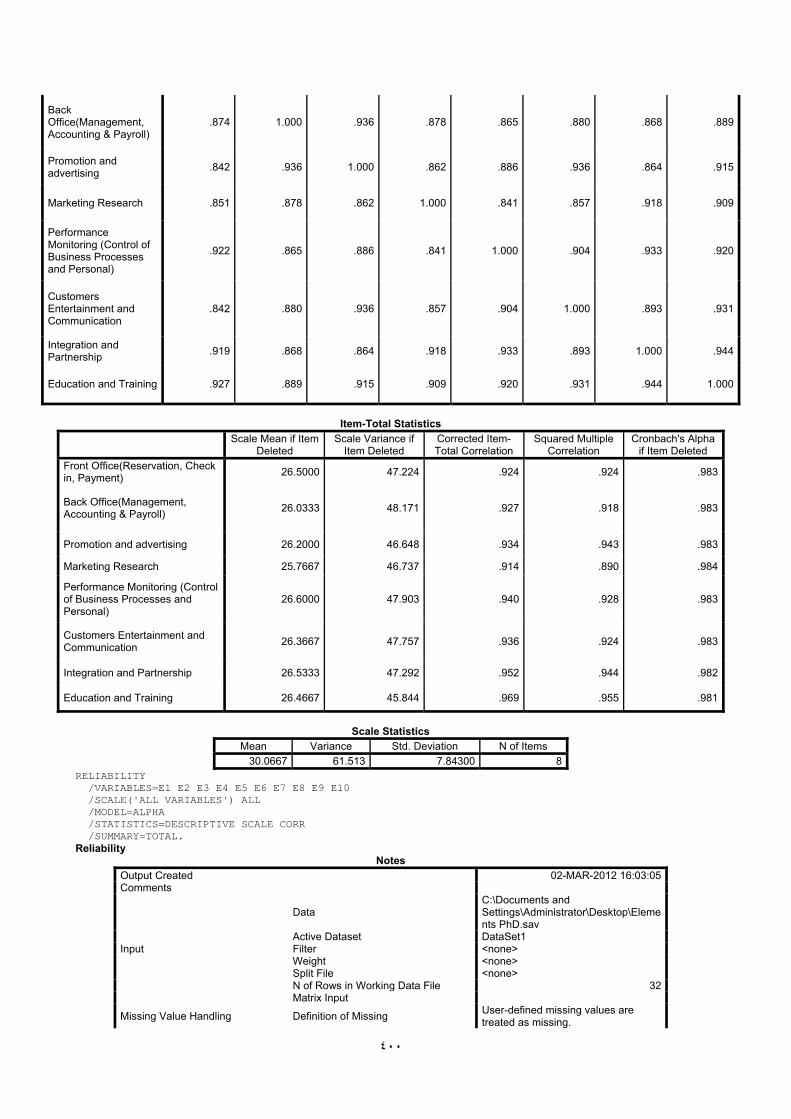
٤٠٠
Back Office(Management, Accounting & Payroll)
.874 1.000 .936 .878 .865 .880 .868 .889
Promotion and advertising .842 .936 1.000 .862 .886 .936 .864 .915
Marketing Research .851 .878 .862 1.000 .841 .857 .918 .909
Performance Monitoring (Control of Business Processes and Personal)
.922 .865 .886 .841 1.000 .904 .933 .920
Customers Entertainment and Communication
.842 .880 .936 .857 .904 1.000 .893 .931
Integration and Partnership .919 .868 .864 .918 .933 .893 1.000 .944
Education and Training .927 .889 .915 .909 .920 .931 .944 1.000
Item-Total Statistics
Scale Mean if Item Deleted
Scale Variance if Item Deleted
Corrected Item-Total Correlation
Squared Multiple Correlation
Cronbach's Alpha if Item Deleted
Front Office(Reservation, Check in, Payment) 26.5000 47.224 .924 .924 .983
Back Office(Management, Accounting & Payroll) 26.0333 48.171 .927 .918 .983
Promotion and advertising 26.2000 46.648 .934 .943 .983
Marketing Research 25.7667 46.737 .914 .890 .984
Performance Monitoring (Control of Business Processes and Personal)
26.6000 47.903 .940 .928 .983
Customers Entertainment and Communication 26.3667 47.757 .936 .924 .983
Integration and Partnership 26.5333 47.292 .952 .944 .982
Education and Training 26.4667 45.844 .969 .955 .981
Scale Statistics
Mean Variance Std. Deviation N of Items 30.0667 61.513 7.84300 8
RELIABILITY /VARIABLES=E1 E2 E3 E4 E5 E6 E7 E8 E9 E10 /SCALE('ALL VARIABLES') ALL /MODEL=ALPHA /STATISTICS=DESCRIPTIVE SCALE CORR /SUMMARY=TOTAL. Reliability
Notes Output Created 02-MAR-2012 16:03:05Comments
Input
Data C:\Documents and Settings\Administrator\Desktop\Elements PhD.sav
Active Dataset DataSet1 Filter <none> Weight <none> Split File <none> N of Rows in Working Data File 32Matrix Input
Missing Value Handling Definition of Missing User-defined missing values are treated as missing.

٤٠١
Cases Used Statistics are based on all cases with valid data for all variables in the procedure.
Syntax
RELIABILITY /VARIABLES=E1 E2 E3 E4 E5 E6 E7 E8 E9 E10 /SCALE('ALL VARIABLES') ALL /MODEL=ALPHA /STATISTICS=DESCRIPTIVE SCALE CORR /SUMMARY=TOTAL.
Resources Processor Time 00:00:00.02Elapsed Time 00:00:00.59
[DataSet1] C:\Documents and Settings\Administrator\Desktop\Elements PhD.sav Scale: ALL VARIABLES
Case Processing Summary N %
Cases Valid 30 93.8Excludeda 2 6.3Total 32 100.0
a. Listwise deletion based on all variables in the procedure.
Reliability Statistics Cronbach's Alpha Cronbach's Alpha
Based on Standardized Items
N of Items
.994 .994 10
Item Statistics Mean Std. Deviation N IT and Telecommunication Infrastructure Costs 5.4333 1.63335 30
General IT Knowledge and Culture in Society 5.5333 1.47936 30
Market (Capability, Potential, Turbulence, Orientation) 5.2667 1.28475 30
Competition Intensity and Competitors' Strategies 5.1667 1.57750 30
Availability of Resource and Environmental Opportunity 5.4333 1.45468 30
E-Tourism Value-Chain Players Power and Impacts 5.2667 1.48401 30
Human Resources Market (IT & E-Marketing Specialist) 5.4000 1.45270 30
Government IT and E-Commerce Policy, Laws, Rules 5.2667 1.41259 30
Technology and IT Systems Standards, Innovation, Capabilities and Turbulence
5.4000 1.42877 30
Business and Marketing Models Changes (Time &Process) 4.7000 1.46570 30
Inter-Item Correlation Matrix
IT and Telecommu
nication Infrastructu
re Costs
General IT Knowledge and Culture in Society
Market (Capability, Potential,
Turbulence, Orientation)
Competition Intensity
and Competitor
s' Strategies
Availability of
Resource and
Environmental
Opportunity
E-Tourism Value-Chain
Players Power and
Impacts
Human Resources Market (IT
& E-Marketing Specialist)
Government IT and E-Commerce
Policy, Laws, Rules
Technology and IT
Systems Standards, Innovation, Capabilities
and Turbulence
Business and
Marketing Models
Changes (Time
&Process)
IT and Telecommunication Infrastructure Costs
1.000 .957 .913 .935 .978 .947 .956 .950 .943 .949

٤٠٢
General IT Knowledge and Culture in Society
.957 1.000 .939 .936 .962 .954 .956 .953 .972 .951
Market (Capability, Potential, Turbulence, Orientation)
.913 .939 1.000 .879 .914 .956 .957 .967 .954 .905
Competition Intensity and Competitors' Strategies
.935 .936 .879 1.000 .944 .923 .918 .908 .918 .947
Availability of Resource and Environmental Opportunity
.978 .962 .914 .944 1.000 .951 .959 .949 .959 .953
E-Tourism Value-Chain Players Power and Impacts
.947 .954 .956 .923 .951 1.000 .973 .985 .973 .942
Human Resources Market (IT & E-Marketing Specialist)
.956 .956 .957 .918 .959 .973 1.000 .971 .984 .933
Government IT and E-Commerce Policy, Laws, Rules
.950 .953 .967 .908 .949 .985 .971 1.000 .970 .939
Technology and IT Systems Standards, Innovation, Capabilities and Turbulence
.943 .972 .954 .918 .959 .973 .984 .970 1.000 .948
Business and Marketing Models Changes (Time &Process)
.949 .951 .905 .947 .953 .942 .933 .939 .948 1.000
Item-Total Statistics
Scale Mean if Item Deleted
Scale Variance if Item Deleted
Corrected Item-Total Correlation
Squared Multiple Correlation
Cronbach's Alpha if Item Deleted
IT and Telecommunication Infrastructure Costs 47.4333 162.047 .971 .975 .994
General IT Knowledge and Culture in Society 47.3333 165.678 .977 .970 .993
Market (Capability, Potential, Turbulence, Orientation) 47.6000 171.421 .952 .949 .994
Competition Intensity and Competitors' Strategies 47.7000 164.424 .944 .929 .994
Availability of Resource and Environmental Opportunity 47.4333 166.323 .977 .972 .993
E-Tourism Value-Chain Players Power and Impacts 47.6000 165.490 .979 .977 .993
Human Resources Market (IT & E-Marketing Specialist) 47.4667 166.257 .980 .984 .993
Government IT and E-Commerce Policy, Laws, Rules
47.6000 167.352 .978 .981 .993
Technology and IT Systems Standards, Innovation, Capabilities and Turbulence
47.4667 166.809 .982 .988 .993

٤٠٣
Business and Marketing Models Changes (Time &Process)
48.1667 166.489 .964 .951 .993
Scale Statistics
Mean Variance Std. Deviation N of Items 52.8667 205.085 14.32079 10
RELIABILITY /VARIABLES=F1 F2 F3 F4 F5 F6 F7 F8 F9 F10 F11 F12 /SCALE('ALL VARIABLES') ALL /MODEL=ALPHA /STATISTICS=DESCRIPTIVE SCALE CORR /SUMMARY=TOTAL. Reliability
Notes Output Created 02-MAR-2012 16:11:08Comments
Input
Data C:\Documents and Settings\Administrator\Desktop\Elements PhD.sav
Active Dataset DataSet1 Filter <none> Weight <none> Split File <none> N of Rows in Working Data File 32Matrix Input
Missing Value Handling
Definition of Missing User-defined missing values are treated as missing.
Cases Used Statistics are based on all cases with valid data for all variables in the procedure.
Syntax
RELIABILITY /VARIABLES=F1 F2 F3 F4 F5 F6 F7 F8 F9 F10 F11 F12 /SCALE('ALL VARIABLES') ALL /MODEL=ALPHA /STATISTICS=DESCRIPTIVE SCALE CORR /SUMMARY=TOTAL.
Resources Processor Time 00:00:00.02Elapsed Time 00:00:00.03
[DataSet1] C:\Documents and Settings\Administrator\Desktop\Elements PhD.sav Scale: ALL VARIABLES
Case Processing Summary N %
Cases Valid 30 93.8Excludeda 2 6.3Total 32 100.0
a. Listwise deletion based on all variables in the procedure.
Reliability Statistics Cronbach's Alpha Cronbach's Alpha
Based on Standardized Items
N of Items
.995 .995 12
Item Statistics Mean Std. Deviation N Products and Services Quality and Variety 5.5000 1.61352 30
Web Marketing Mix Strategy 5.3667 1.49674 30 Resource Availability (Finance, Technology etc) 5.7000 1.36836 30
Brand and Branding Strategy 5.4667 1.54771 30 Relationship and Strategic Alliances 5.3000 1.31700 30 Customer Segmentation and Targeting 5.5667 1.54659 30
Firm Specialists Employers Skills and Education 5.4667 1.61316 30

٤٠٤
Restructuring and reengineering the processes 5.3000 1.48904 30
Firm IT Infrastructure Station and Orientation 5.2667 1.50707 30
Firm Competitive Advantages in E-Marketing 5.1667 1.51050 30
Innovation support and Knowledge Management 5.4333 1.59056 30
Increased Web Traffic and Stickiness 4.4333 1.47819 30
Scale Statistics
Mean Variance Std. Deviation N of Items
Inter-Item Correlation Matrix Products
and Services Quality
and Variety
Web Marketin
g Mix Strategy
Resource Availabilit
y (Finance, Technolo
gy etc)
Brand and
Branding Strategy
Relationship and
Strategic Alliances
Customer
Segmentation
and Targeti
ng
Firm Special
ists Employ
ers Skills and
Education
Restructuring
and reengineering
the proces
ses
Firm IT Infrastructure Station
and Orienta
tion
Firm Compe
titive Advantages in
E-Marketi
ng
Innovation
support and
Knowledge
Management
Increased Web Traffic
and Stickiness
Products and Services Quality and Variety 1.000 .950 .961 .925 .901 .947 .941 .954 .950 .941 .947 .889
Web Marketing Mix Strategy .950 1.000 .948 .936 .939 .950 .941 .970 .964 .963 .945 .908 Resource Availability
(Finance, Technology etc) .961 .948 1.000 .931 .932 .930 .925 .943 .943 .943 .933 .885
Brand and Branding Strategy .925 .936 .931 1.000 .910 .966 .973 .955 .965 .954 .980 .903 Relationship and Strategic
Alliances .901 .939 .932 .910 1.000 .929 .922 .937 .931 .927 .923 .941
Customer Segmentation and Targeting .947 .950 .930 .966 .929 1.000 .982 .957 .954 .947 .976 .899
Firm Specialists Employers Skills and Education .941 .941 .925 .973 .922 .982 1.000 .973 .968 .958 .994 .910
Restructuring and reengineering the processes .954 .970 .943 .955 .937 .957 .973 1.000 .993 .974 .977 .926
Firm IT Infrastructure Station and Orientation .950 .964 .943 .965 .931 .954 .968 .993 1.000 .980 .971 .922
Firm Competitive Advantages in E-Marketing .941 .963 .943 .954 .927 .947 .958 .974 .980 1.000 .959 .924
Innovation support and Knowledge Management .947 .945 .933 .980 .923 .976 .994 .977 .971 .959 1.000 .915
Increased Web Traffic and Stickiness .889 .908 .885 .903 .941 .899 .910 .926 .922 .924 .915 1.000
Item-Total Statistics
Scale Mean if
Item Deleted
Scale Variance if Item Deleted
Corrected Item-Total
Correlation
Squared Multiple Correlati
on
Cronbach's Alpha if Item
Deleted
Products and Services Quality and Variety 58.4667 257.913 .961 .969 .995
Web Marketing Mix Strategy 58.6000 261.076 .972 .970 .994
Resource Availability (Finance, Technology etc) 58.2667 265.720 .958 .964 .995
Brand and Branding Strategy 58.5000 259.500 .971 .984 .994
Relationship and Strategic Alliances 58.6667 267.678 .949 .958 .995
Customer Segmentation and Targeting 58.4000 259.352 .975 .982 .994
Firm Specialists Employers Skills and Education 58.5000 257.017 .980 .993 .994
Restructuring and reengineering the processes 58.6667 260.644 .987 .995 .994
Firm IT Infrastructure Station and Orientation 58.7000 260.148 .985 .994 .994
Firm Competitive Advantages in E-Marketing 58.8000 260.372 .978 .971 .994
Innovation support and Knowledge Management 58.5333 257.568 .984 .994 .994
Increased Web Traffic and Stickiness 59.5333 263.430 .931 .927 .995

٤٠٥
63.9667 310.309 17.61560 12 RELIABILITY /VARIABLES=CS1 CS2 CS3 CS4 CS5 CS6 CS7 CS8 CS9 CS10 /SCALE('ALL VARIABLES') ALL /MODEL=ALPHA /STATISTICS=DESCRIPTIVE SCALE CORR /SUMMARY=TOTAL. Reliability
Notes Output Created 02-MAR-2012 16:22:42Comments
Input
Data C:\Documents and Settings\Administrator\Desktop\Elements PhD.sav
Active Dataset DataSet1 Filter <none> Weight <none> Split File <none> N of Rows in Working Data File 32Matrix Input
Missing Value Handling
Definition of Missing User-defined missing values are treated as missing.
Cases Used Statistics are based on all cases with valid data for all variables in the procedure.
Syntax
RELIABILITY /VARIABLES=CS1 CS2 CS3 CS4 CS5 CS6 CS7 CS8 CS9 CS10 /SCALE('ALL VARIABLES') ALL /MODEL=ALPHA /STATISTICS=DESCRIPTIVE SCALE CORR /SUMMARY=TOTAL.
Resources Processor Time 00:00:00.02Elapsed Time 00:00:00.02
[DataSet1] C:\Documents and Settings\Administrator\Desktop\Elements PhD.sav Scale: ALL VARIABLES
Case Processing Summary N %
Cases Valid 30 93.8Excludeda 2 6.3Total 32 100.0
a. Listwise deletion based on all variables in the procedure. Reliability Statistics
Cronbach's Alpha Cronbach's Alpha Based on
Standardized Items
N of Items
.993 .994 10item Statistics
Mean Std. Deviation N Web and brand Reliability, Security, Privacy and Trust 6.0333 1.58622 30
Website (Attraction, Design, Availability, and Quality) 5.6000 1.42877 30
Transmission Speed and Conversion Rate 5.0000 1.38962 30
Tourists Needs, Experience and Expects in Market 6.0667 1.48401 30
E-Shopping Facility and Support 5.1333 1.43198 30 Products and Service Quality, Variety and Innovation 5.6333 1.75152 30
Product & Service Flexibility and Individualization 5.3000 1.41787 30
Cost and Price Advantage for Customers 5.7667 1.52414 30

٤٠٦
Customization (Service and CRM Coverage Level) 5.5667 1.61210 30
Perceived Added Value by Customers 5.3333 1.51620 30
Inter-Item Correlation Matrix
Web and
brand Reliabili
ty, Security
, Privacy
and Trust
Website (Attracti
on, Design, Availability, and Quality)
Transmission Speed
and Conver
sion Rate
Tourists Needs, Experience and Expects
in Market
E-Shoppin
g Facility
and Support
Products and
Service Quality, Variety
and Innovati
on
Product &
Service Flexibilit
y and Individualization
Cost and
Price Advanta
ge for Custom
ers
Customization
(Service and
CRM Covera
ge Level)
Perceived
Added Value
by Custom
ers
Web and brand Reliability, Security, Privacy and Trust 1.000 .934 .876 .980 .894 .948 .961 .945 .936 .927
Website (Attraction, Design, Availability, and Quality) .934 1.000 .938 .940 .937 .931 .946 .969 .940 .955
Transmission Speed and Conversion Rate .876 .938 1.000 .886 .970 .907 .945 .928 .939 .949
Tourists Needs, Experience and Expects in Market .980 .940 .886 1.000 .904 .925 .957 .952 .935 .940
E-Shopping Facility and Support .894 .937 .970 .904 1.000 .928 .948 .947 .952 .964
Products and Service Quality, Variety and Innovation .948 .931 .907 .925 .928 1.000 .934 .961 .968 .944
Product & Service Flexibility and Individualization .961 .946 .945 .957 .948 .934 1.000 .943 .949 .962
Cost and Price Advantage for Customers .945 .969 .928 .952 .947 .961 .943 1.000 .968 .945
Customization (Service and CRM Coverage Level) .936 .940 .939 .935 .952 .968 .949 .968 1.000 .964
Perceived Added Value by Customers .927 .955 .949 .940 .964 .944 .962 .945 .964 1.000
Item-Total Statistics
Scale Mean if Item Deleted
Scale Variance if
Item Deleted
Corrected Item-Total Correlation
Squared Multiple
Correlation
Cronbach's Alpha if Item
Deleted Web and brand Reliability, Security, Privacy and Trust 49.4000 174.593 .959 .987 .993
Website (Attraction, Design, Availability, and Quality) 49.8333 178.282 .969 .971 .992
Transmission Speed and Conversion Rate 50.4333 179.978 .949 .964 .993Tourists Needs, Experience and Expects in Market 49.3667 177.137 .961 .983 .993
E-Shopping Facility and Support 50.3000 178.424 .962 .969 .993Products and Service Quality, Variety and Innovation 49.8000 170.166 .964 .972 .993
Product & Service Flexibility and Individualization 50.1333 178.326 .976 .976 .992Cost and Price Advantage for Customers 49.6667 175.471 .978 .985 .992Customization (Service and CRM Coverage Level) 49.8667 173.223 .977 .972 .992
Perceived Added Value by Customers 50.1000 175.748 .976 .979 .992Scale Statistics
Mean Variance Std. Deviation N of Items 55.4333 217.289 14.74071 10
RELIABILITY /VARIABLES=C1 C2 C3 C4 C5 C6 C7 /SCALE('ALL VARIABLES') ALL /MODEL=ALPHA /STATISTICS=DESCRIPTIVE SCALE CORR /SUMMARY=TOTAL. Reliability
Notes

٤٠٧
Output Created 02-MAR-2012 16:28:15Comments
Input
Data C:\Documents and Settings\Administrator\Desktop\Elements PhD.sav
Active Dataset DataSet1 Filter <none> Weight <none> Split File <none> N of Rows in Working Data File 32Matrix Input
Missing Value Handling
Definition of Missing User-defined missing values are treated as missing.
Cases Used Statistics are based on all cases with valid data for all variables in the procedure.
Syntax
RELIABILITY /VARIABLES=C1 C2 C3 C4 C5 C6 C7 /SCALE('ALL VARIABLES') ALL /MODEL=ALPHA /STATISTICS=DESCRIPTIVE SCALE CORR /SUMMARY=TOTAL.
Resources Processor Time 00:00:00.02Elapsed Time 00:00:00.02
[DataSet1] C:\Documents and Settings\Administrator\Desktop\Elements PhD.sav Scale: ALL VARIABLES
Case Processing Summary N %
Cases Valid 30 93.8Excludeda 2 6.3Total 32 100.0
a. Listwise deletion based on all variables in the procedure. Reliability Statistics
Cronbach's Alpha Cronbach's Alpha Based on
Standardized Items
N of Items
.973 .976 7
Item Statistics Mean Std. Deviation N Stockholders Satisfaction 3.9000 .92289 30Customers Satisfaction 4.4667 .93710 30Customers Number Web 3.8667 1.30604 30Visitors Numbers 3.1000 1.06188 30Market Share 3.2000 .92476 30Costs 4.1667 1.05318 30Sell and Income 3.7000 .87691 30
Inter-Item Correlation Matrix
Stockholders Satisfaction
Customers Satisfaction
Customers Number Web
Visitors Numbers
Market Share
Costs Sell and Income
Stockholders Satisfaction 1.000 .853 .847 .890 .873 .905 .899
Customers Satisfaction .853 1.000 .841 .749 .684 .897 .890Customers Number Web .847 .841 1.000 .905 .794 .919 .867
Visitors Numbers .890 .749 .905 1.000 .892 .879 .848
Market Share .873 .684 .794 .892 1.000 .779 .842
Costs .905 .897 .919 .879 .779 1.000 .877
Sell and Income .899 .890 .867 .848 .842 .877 1.000
Item-Total Statistics

٤٠٨
Scale Mean if Item Deleted
Scale Variance if Item Deleted
Corrected Item-Total Correlation
Squared Multiple Correlation
Cronbach's Alpha if
Item Deleted
Stockholders Satisfaction 22.5000 33.155 .938 .914 .967Customers Satisfaction 21.9333 33.651 .869 .893 .971Customers Number Web 22.5333 29.223 .924 .906 .970Visitors Numbers 23.3000 31.803 .922 .919 .967Market Share 23.2000 33.890 .857 .866 .972Costs 22.2333 31.702 .941 .923 .966Sell and Income 22.7000 33.734 .930 .898 .968
Scale Statistics
Mean Variance Std. Deviation
N of Items
26.4000 43.972 6.63117 7End of job: 2 command lines 1 errors 0 warnings 1 CPU seconds
1-2- T-Test
T-TEST GROUPS=Country(1 2) /MISSING=ANALYSIS
/VARIABLES=S1 S2 S3 S4 S5 S6 S7 S8 S9 S10 /CRITERIA=CI(.95).
T-Test
Notes Output Created 24-FEB-2012 12:27:38
Comments
Input
Data E:\All the Phd Files\PhD Spss data\Elements PhD.sav
Active Dataset DataSet1 Filter <none>
Weight <none> Split File <none>
N of Rows in Working Data File 32
Missing Value Handling
Definition of Missing User defined missing values are treated as missing.
Cases Used
Statistics for each analysis are based on the cases with no
missing or out-of-range data for any variable in the analysis.
Syntax
T-TEST GROUPS=Country(1 2) /MISSING=ANALYSIS
/VARIABLES=S1 S2 S3 S4 S5 S6 S7 S8 S9 S10
/CRITERIA=CI(.95).
Resources Processor Time 00:00:00.03 Elapsed Time 00:00:00.77
[DataSet1] E:\All the Phd Files\PhD Spss data\Elements PhD.sav Group Statistics
Country N Mean Std. Deviation Std. Error Mean Global Distribution Systems(GDSs)
Iran 15 3.5333333 1.40746310 .36340541 Germany 15 3.6666667 1.44749373 .37374127
Executive Information Systems(EIS)
Iran 15 2.5333333 1.24594581 .32170182 Germany 15 2.4666667 1.12546287 .29059326
Strategic Information Systems(SIS)
Iran 15 3.5333333 1.18723368 .30654242 Germany 15 3.6000000 1.24211801 .32071349
Decision Support Systems(DSS)
Iran 15 3.3333333 1.23442680 .31872763 Germany 15 3.5333333 1.18723368 .30654242
Management Information Systems(MIS)
Iran 15 3.5333333 .99043040 .25572803 Germany 15 3.7333333 .96115010 .24816789
Databases Systems(DB) Iran 15 4.0000000 1.19522861 .30860670 Germany 15 4.2000000 1.08232554 .27945525
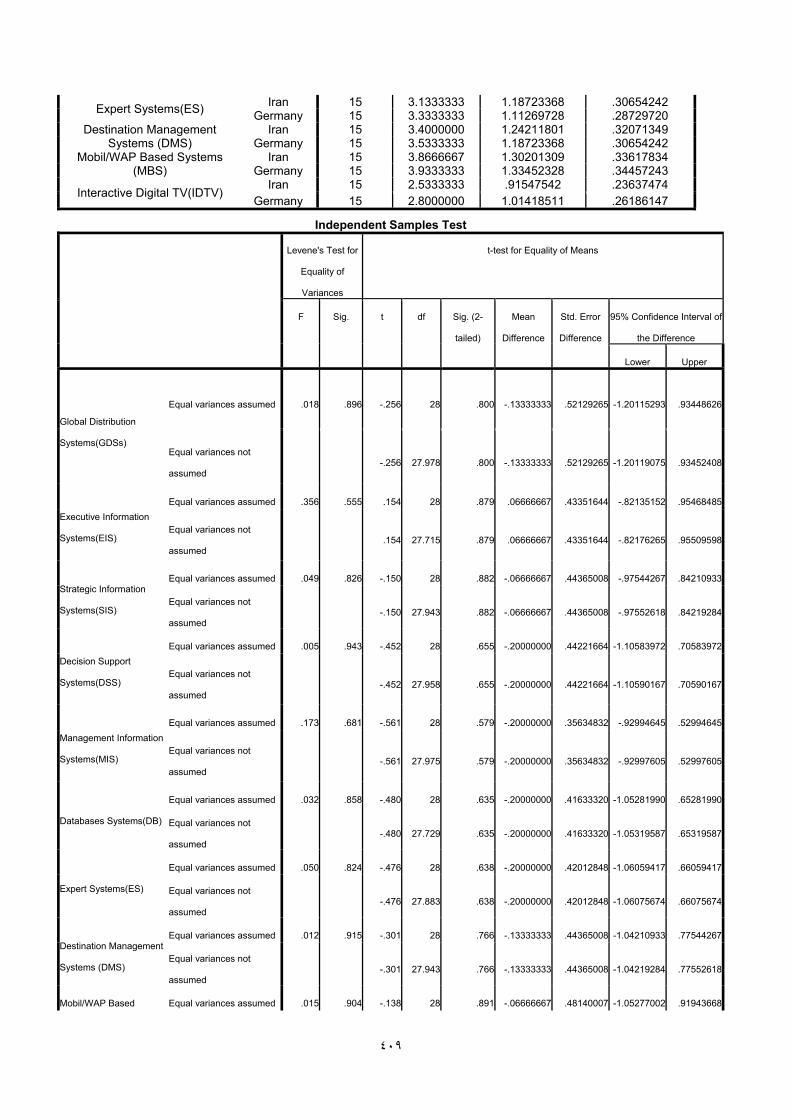
٤٠٩
Expert Systems(ES) Iran 15 3.1333333 1.18723368 .30654242 Germany 15 3.3333333 1.11269728 .28729720
Destination Management Systems (DMS)
Iran 15 3.4000000 1.24211801 .32071349 Germany 15 3.5333333 1.18723368 .30654242
Mobil/WAP Based Systems (MBS)
Iran 15 3.8666667 1.30201309 .33617834 Germany 15 3.9333333 1.33452328 .34457243
Interactive Digital TV(IDTV) Iran 15 2.5333333 .91547542 .23637474
Germany 15 2.8000000 1.01418511 .26186147
Independent Samples Test
Levene's Test for
Equality of
Variances
t-test for Equality of Means
F Sig. t df Sig. (2-
tailed)
Mean
Difference
Std. Error
Difference
95% Confidence Interval of
the Difference
Lower Upper
Global Distribution
Systems(GDSs)
Equal variances assumed .018 .896 -.256 28 .800 -.13333333 .52129265 -1.20115293 .93448626
Equal variances not
assumed
-.256 27.978 .800 -.13333333 .52129265 -1.20119075 .93452408
Executive Information
Systems(EIS)
Equal variances assumed .356 .555 .154 28 .879 .06666667 .43351644 -.82135152 .95468485
Equal variances not
assumed
.154 27.715 .879 .06666667 .43351644 -.82176265 .95509598
Strategic Information
Systems(SIS)
Equal variances assumed .049 .826 -.150 28 .882 -.06666667 .44365008 -.97544267 .84210933
Equal variances not
assumed
-.150 27.943 .882 -.06666667 .44365008 -.97552618 .84219284
Decision Support
Systems(DSS)
Equal variances assumed .005 .943 -.452 28 .655 -.20000000 .44221664 -1.10583972 .70583972
Equal variances not
assumed
-.452 27.958 .655 -.20000000 .44221664 -1.10590167 .70590167
Management Information
Systems(MIS)
Equal variances assumed .173 .681 -.561 28 .579 -.20000000 .35634832 -.92994645 .52994645
Equal variances not
assumed
-.561 27.975 .579 -.20000000 .35634832 -.92997605 .52997605
Databases Systems(DB)
Equal variances assumed .032 .858 -.480 28 .635 -.20000000 .41633320 -1.05281990 .65281990
Equal variances not
assumed
-.480 27.729 .635 -.20000000 .41633320 -1.05319587 .65319587
Expert Systems(ES)
Equal variances assumed .050 .824 -.476 28 .638 -.20000000 .42012848 -1.06059417 .66059417
Equal variances not
assumed
-.476 27.883 .638 -.20000000 .42012848 -1.06075674 .66075674
Destination Management
Systems (DMS)
Equal variances assumed .012 .915 -.301 28 .766 -.13333333 .44365008 -1.04210933 .77544267
Equal variances not
assumed
-.301 27.943 .766 -.13333333 .44365008 -1.04219284 .77552618
Mobil/WAP Based Equal variances assumed .015 .904 -.138 28 .891 -.06666667 .48140007 -1.05277002 .91943668

٤١٠
Systems (MBS) Equal variances not
assumed
-.138 27.983 .891 -.06666667 .48140007 -1.05279703 .91946370
Interactive Digital
TV(IDTV)
Equal variances assumed .002 .965 -.756 28 .456 -.26666667 .35276684 -.98927678 .45594345
Equal variances not
assumed
-.756 27.711 .456 -.26666667 .35276684 -.98961591 .45628257
T-TEST GROUPS=Country(1 2) /MISSING=ANALYSIS
/VARIABLES=M1 M2 M3 M4 M5 M6 M7 /CRITERIA=CI(.95).
T-Test Notes
Output Created 24-FEB-2012 18:53:29 Comments
Input
Data E:\All the Phd Files\PhD Spss data\Elements PhD.sav
Active Dataset DataSet1 Filter <none>
Weight <none> Split File <none>
N of Rows in Working Data File 32
Missing Value Handling
Definition of Missing User defined missing values are treated as missing.
Cases Used
Statistics for each analysis are based on the cases with no
missing or out-of-range data for any variable in the analysis.
Syntax
T-TEST GROUPS=Country(1 2) /MISSING=ANALYSIS
/VARIABLES=M1 M2 M3 M4 M5 M6 M7
/CRITERIA=CI(.95).
Resources Processor Time 00:00:00.02 Elapsed Time 00:00:02.05
DataSet1] E:\All the Phd Files\PhD Spss data\Elements PhD.sav Group Statistics
Country N Mean Std. Deviation Std. Error Mean
User-Friendly Iran 15 3.6667 1.11270 .28730
Germany 15 3.7333 1.16292 .30026
Compressing data Iran 15 3.6000 1.18322 .30551 Germany 15 3.7333 .96115 .24817
Security and Trust Iran 15 4.3333 1.23443 .31873 Germany 15 4.6000 .82808 .21381
Speed Iran 15 3.4667 .99043 .25573 Germany 15 3.6667 .81650 .21082
Better Information Iran 15 3.9333 1.03280 .26667 Germany 15 4.0000 .84515 .21822
Mobility Iran 15 3.9333 1.27988 .33046 Germany 15 4.0667 1.03280 .26667
Last Minute Price Iran 15 3.1333 .99043 .25573
Germany 15 3.2000 .86189 .22254
Independent Samples Test
Levene's Test for Equality of Variances
t-test for Equality of Means
F Sig. t df Sig. (2-tailed)
Mean Differen
ce
Std. Error
Difference
95% Confidence Interval of the
Difference Lower Upper

٤١١
User-Friendly
Equal variances assumed .030 .863 -.160 28 .874 -.06667 .41557 -.91792 .78459
Equal variances not assumed
-.160 27.946 .874 -.06667 .41557 -.91800 .78466
Compressing data
Equal variances assumed .489 .490 -.339 28 .737 -.13333 .39360 -.93959 .67292
Equal variances not assumed
-.339 26.872 .737 -.13333 .39360 -.94111 .67445
Security and Trust
Equal variances assumed 1.378 .250 -.695 28 .493 -.26667 .38380 -1.05284 .51951
Equal variances not assumed
-.695 24.478 .494 -.26667 .38380 -1.05797 .52464
Speed
Equal variances assumed .322 .575 -.603 28 .551 -.20000 .33142 -.87889 .47889
Equal variances not assumed
-.603 27.017 .551 -.20000 .33142 -.88000 .48000
Better Information
Equal variances assumed .165 .688 -.193 28 .848 -.06667 .34457 -.77249 .63916
Equal variances not assumed
-.193 26.945 .848 -.06667 .34457 -.77374 .64040
Mobility
Equal variances assumed .444 .511 -.314 28 .756 -.13333 .42464 -1.00316 .73650
Equal variances not assumed
-.314 26.804 .756 -.13333 .42464 -1.00492 .73825
Last Minute Price
Equal variances assumed .042 .839 -.197 28 .846 -.06667 .33900 -.76108 .62774
Equal variances not assumed
-.197 27.476 .846 -.06667 .33900 -.76167 .62834
T-TEST GROUPS=Country(1 2) /MISSING=ANALYSIS
/VARIABLES=A1 A2 A3 A4 A5 A6 A7 A8 /CRITERIA=CI(.95).
T-Test Notes
Output Created 24-FEB-2012 19:25:04 Comments
Input
Data E:\All the Phd Files\PhD Spss data\Elements PhD.sav
Active Dataset DataSet1 Filter <none>
Weight <none> Split File <none>
N of Rows in Working Data File 32
Missing Value Handling
Definition of Missing User defined missing values are treated as missing.
Cases Used
Statistics for each analysis are based on the cases with no
missing or out-of-range data for any variable in the analysis.
Syntax
T-TEST GROUPS=Country(1 2) /MISSING=ANALYSIS
/VARIABLES=A1 A2 A3 A4 A5 A6 A7 A8
/CRITERIA=CI(.95).
Resources Processor Time 00:00:00.02 Elapsed Time 00:00:00.06
[DataSet1] E:\All the Phd Files\PhD Spss data\Elements PhD.sav Group Statistics
Country N Mean Std. Deviation Std. Error Mean Front Office(Reservation, Check
in, Payment) Iran 15 3.5333 1.06010 .27372
Germany 15 3.6000 1.05560 .27255 Back Office(Management,
Accounting & Payroll) Iran 15 4.0000 1.06904 .27603
Germany 15 4.0667 .88372 .22817
Promotion and advertising Iran 15 3.8000 1.14642 .29601 Germany 15 3.9333 1.03280 .26667

٤١٢
Marketing Research Iran 15 4.2667 1.09978 .28396 Germany 15 4.3333 1.11270 .28730
Performance Monitoring (Control of Business Processes and
Personal)
Iran 15 3.4000 1.05560 .27255
Germany 15 3.5333 .91548 .23637
Customers Entertainment and Communication
Iran 15 3.6000 1.05560 .27255 Germany 15 3.8000 .94112 .24300
Integration and Partnership Iran 15 3.4667 1.06010 .27372 Germany 15 3.6000 .98561 .25448
Education and Training Iran 15 3.6000 1.12122 .28950
Germany 15 3.6000 1.12122 .28950 Independent Samples Test
Levene's Test for Equality of
Variances
t-test for Equality of Means
F Sig. t df Sig. (2-
tailed)
Mean Differe
nce
Std. Error
Difference
95% Confidence Interval of the
Difference Lower Upper
Front Office(Reser
vation, Check in, Payment)
Equal variances assumed
.002 .969 -.173 28 .864 -
.06667 .38627 -.85791 .72458
Equal variances not
assumed
-.173
27.999 .864 -
.06667 .38627 -.85791 .72458
Back Office(Manag
ement, Accounting &
Payroll)
Equal variances assumed
.029 .867 -.186 28 .854 -
.06667 .35813 -.80025 .66692
Equal variances not
assumed
-.186
27.043 .854 -
.06667 .35813 -.80143 .66809
Promotion and
advertising
Equal variances assumed
.057 .813 -.335 28 .740 -
.13333 .39841 -.94944 .68277
Equal variances not
assumed
-.335
27.700 .740 -
.13333 .39841 -.94984 .68317
Marketing Research
Equal variances assumed
.004 .948 -.165 28 .870 -
.06667 .40395 -.89412 .76078
Equal variances not
assumed
-.165
27.996 .870 -
.06667 .40395 -.89412 .76079
Performance Monitoring (Control of Business
Processes and
Personal)
Equal variances assumed
.098 .757 -.370 28 .714 -
.13333 .36078 -.87235 .60568
Equal variances not
assumed
-
.37027.451 .715 -
.13333 .36078 -.87301 .60635
Customers Entertainmen
t and Communicati
on
Equal variances assumed
.214 .648 -.548 28 .588 -
.20000 .36515 -.94797 .54797
Equal variances not
assumed
-.548
27.639 .588 -
.20000 .36515 -.94841 .54841
Integration and
Partnership
Equal variances assumed
.158 .694 -.357 28 .724 -
.13333 .37374 -.89891 .63224
Equal variances not
assumed
-.357
27.853 .724 -
.13333 .37374 -.89909 .63242
Education and Training
Equal variances assumed
.000 1.000 .000 28 1.000 .00000 .40941 -.83864 .83864

٤١٣
Equal variances not
assumed
.000 28.0
00 1.000 .00000 .40941 -.83864 .83864
T-TEST GROUPS=Country(1 2) /MISSING=ANALYSIS
/VARIABLES=E1 E2 E3 E4 E5 E6 E8 E7 E9 E10 /CRITERIA=CI(.95).
T-Test Notes
Output Created 25-FEB-2012 15:37:16 Comments
Input
Data E:\All the Phd Files\PhD Spss data\Elements PhD.sav
Active Dataset DataSet1 Filter <none>
Weight <none> Split File <none>
N of Rows in Working Data File 32
Missing Value Handling
Definition of Missing User defined missing values are treated as missing.
Cases Used
Statistics for each analysis are based on the cases with no
missing or out-of-range data for any variable in the analysis.
Syntax
T-TEST GROUPS=Country(1 2) /MISSING=ANALYSIS
/VARIABLES=E1 E2 E3 E4 E5 E6 E8 E7 E9 E10
/CRITERIA=CI(.95).
Resources Processor Time 00:00:00.00 Elapsed Time 00:00:00.34
[DataSet1] E:\All the Phd Files\PhD Spss data\Elements PhD.sav Group Statistics
Country N Mean Std. Deviation Std. Error Mean IT and Telecommunication
Infrastructure Costs Iran 15 5.2667 1.83095 .47275
Germany 15 5.6000 1.45406 .37544 General IT Knowledge and
Culture in Society Iran 15 5.4667 1.59762 .41250
Germany 15 5.6000 1.40408 .36253 Market (Capability, Potential,
Turbulence, Orientation) Iran 15 5.2000 1.42428 .36775
Germany 15 5.3333 1.17514 .30342 Competition Intensity and Competitors' Strategies
Iran 15 5.0000 1.77281 .45774 Germany 15 5.3333 1.39728 .36078
Availability of Resource and Environmental Opportunity
Iran 15 5.2667 1.66762 .43058 Germany 15 5.6000 1.24212 .32071
E-Tourism Value-Chain Players Power and Impacts
Iran 15 5.2000 1.56753 .40473 Germany 15 5.3333 1.44749 .37374
Government IT and E-Commerce Policy, Laws, Rules
Iran 15 5.2000 1.56753 .40473 Germany 15 5.3333 1.29099 .33333
Human Resources Market (IT & E-Marketing Specialist)
Iran 15 5.2667 1.62422 .41937 Germany 15 5.5333 1.30201 .33618
Technology and IT Systems Standards, Innovation,
Capabilities and Turbulence
Iran 15 5.3333 1.54303 .39841
Germany 15 5.4667 1.35576 .35006
Business and Marketing Models Changes (Time &Process)
Iran 15 4.6000 1.50238 .38791 Germany 15 4.8000 1.47358 .38048
Independent Samples Test
Levene's Test for Equality of
Variances
t-test for Equality of Means
F Sig. t df Sig. (2-
tailed)
Mean Differe
nce
Std. Error
Difference
95% Confidence Interval of the
Difference Lower Upper
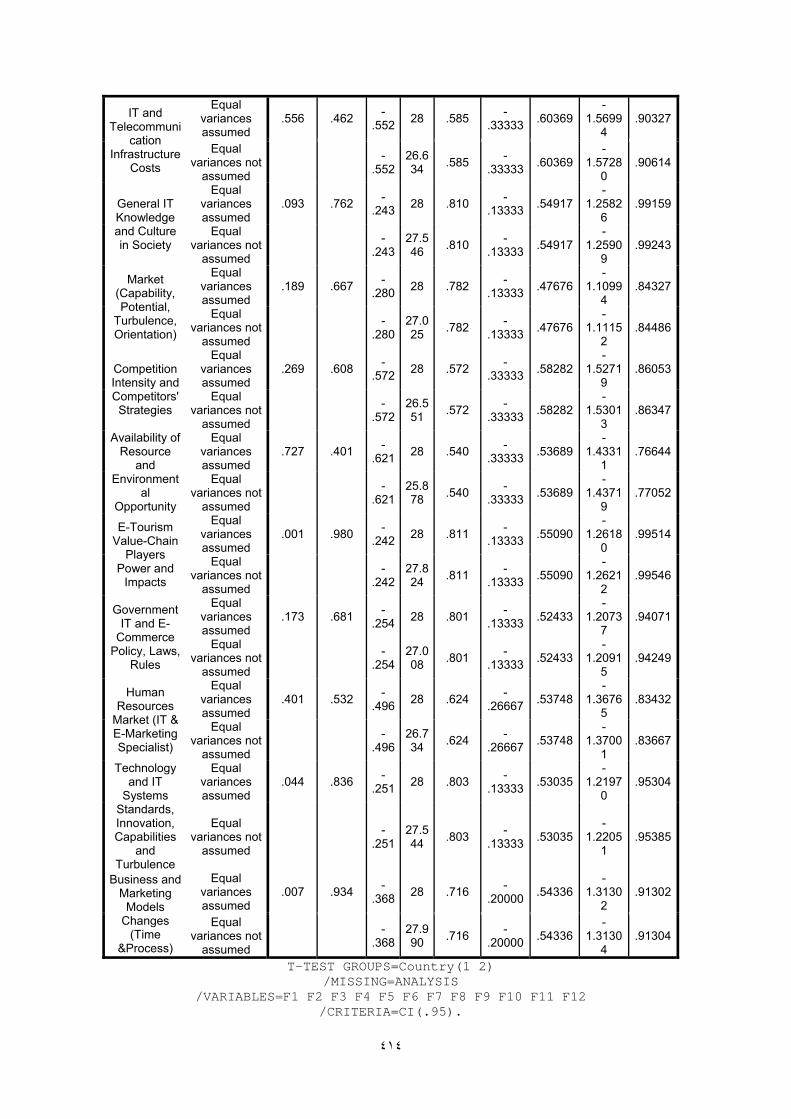
٤١٤
IT and Telecommuni
cation Infrastructure
Costs
Equal variances assumed
.556 .462 -.552 28 .585 -
.33333 .60369 -
1.56994
.90327
Equal variances not
assumed
-.552
26.634 .585 -
.33333 .60369 -
1.57280
.90614
General IT Knowledge and Culture in Society
Equal variances assumed
.093 .762 -.243 28 .810 -
.13333 .54917 -
1.25826
.99159
Equal variances not
assumed
-.243
27.546 .810 -
.13333 .54917 -
1.25909
.99243
Market (Capability, Potential,
Turbulence, Orientation)
Equal variances assumed
.189 .667 -.280 28 .782 -
.13333 .47676 -
1.10994
.84327
Equal variances not
assumed
-.280
27.025 .782 -
.13333 .47676 -
1.11152
.84486
Competition Intensity and Competitors' Strategies
Equal variances assumed
.269 .608 -.572 28 .572 -
.33333 .58282 -
1.52719
.86053
Equal variances not
assumed
-.572
26.551 .572 -
.33333 .58282 -
1.53013
.86347
Availability of Resource
and Environment
al Opportunity
Equal variances assumed
.727 .401 -.621 28 .540 -
.33333 .53689 -
1.43311
.76644
Equal variances not
assumed
-.621
25.878 .540 -
.33333 .53689 -
1.43719
.77052
E-Tourism Value-Chain
Players Power and
Impacts
Equal variances assumed
.001 .980 -.242 28 .811 -
.13333 .55090 -
1.26180
.99514
Equal variances not
assumed
-.242
27.824 .811 -
.13333 .55090 -
1.26212
.99546
Government IT and E-
Commerce Policy, Laws,
Rules
Equal variances assumed
.173 .681 -.254 28 .801 -
.13333 .52433 -
1.20737
.94071
Equal variances not
assumed
-.254
27.008 .801 -
.13333 .52433 -
1.20915
.94249
Human Resources
Market (IT & E-Marketing Specialist)
Equal variances assumed
.401 .532 -.496 28 .624 -
.26667 .53748 -
1.36765
.83432
Equal variances not
assumed
-.496
26.734 .624 -
.26667 .53748 -
1.37001
.83667
Technology and IT
Systems Standards, Innovation, Capabilities
and Turbulence
Equal variances assumed
.044 .836 -.251 28 .803 -
.13333 .53035 -
1.21970
.95304
Equal variances not
assumed
-
.25127.544 .803 -
.13333 .53035 -
1.22051
.95385
Business and Marketing
Models Changes
(Time &Process)
Equal variances assumed
.007 .934 -.368 28 .716 -
.20000 .54336 -
1.31302
.91302
Equal variances not
assumed
-.368
27.990 .716 -
.20000 .54336 -
1.31304
.91304
T-TEST GROUPS=Country(1 2) /MISSING=ANALYSIS
/VARIABLES=F1 F2 F3 F4 F5 F6 F7 F8 F9 F10 F11 F12 /CRITERIA=CI(.95).

٤١٥
T-Test Notes
Output Created 25-FEB-2012 17:36:38 Comments
Input
Data E:\All the Phd Files\PhD Spss data\Elements PhD.sav
Active Dataset DataSet1 Filter <none>
Weight <none> Split File <none>
N of Rows in Working Data File 32
Missing Value Handling
Definition of Missing User defined missing values are treated as missing.
Cases Used
Statistics for each analysis are based on the cases with no
missing or out-of-range data for any variable in the analysis.
Syntax
T-TEST GROUPS=Country(1 2) /MISSING=ANALYSIS
/VARIABLES=F1 F2 F3 F4 F5 F6 F7 F8 F9 F10 F11 F12
/CRITERIA=CI(.95).
Resources Processor Time 00:00:00.06 Elapsed Time 00:00:00.86
[DataSet1] E:\All the Phd Files\PhD Spss data\Elements PhD.sav Group Statistics
Country N Mean Std. Deviation Std. Error Mean Products and Services Quality
and Variety Iran 15 5.4667 1.68466 .43498
Germany 15 5.5333 1.59762 .41250
Web Marketing Mix Strategy Iran 15 5.2667 1.62422 .41937 Germany 15 5.4667 1.40746 .36341
Resource Availability (Finance, Technology etc)
Iran 15 5.6000 1.59463 .41173 Germany 15 5.8000 1.14642 .29601
Brand and Branding Strategy Iran 15 5.3333 1.75933 .45426 Germany 15 5.6000 1.35225 .34915
Relationship and Strategic Alliances
Iran 15 5.2000 1.52128 .39279 Germany 15 5.4000 1.12122 .28950
Customer Segmentation and Targeting
Iran 15 5.4667 1.64172 .42389 Germany 15 5.6667 1.49603 .38627
Firm Specialists Employers Skills and Education
Iran 15 5.3333 1.75933 .45426 Germany 15 5.6000 1.50238 .38791
Restructuring and reengineering the processes
Iran 15 5.2000 1.65616 .42762 Germany 15 5.4000 1.35225 .34915
Firm IT Infrastructure Station and Orientation
Iran 15 5.2000 1.65616 .42762 Germany 15 5.3333 1.39728 .36078
Firm Competitive Advantages in E-Marketing
Iran 15 5.0667 1.57963 .40786 Germany 15 5.2667 1.48645 .38380
Innovation support and Knowledge Management
Iran 15 5.3333 1.75933 .45426 Germany 15 5.5333 1.45733 .37628
Increased Web Traffic and Stickiness
Iran 15 4.2667 1.53375 .39601 Germany 15 4.6000 1.45406 .37544
Independent Samples Test Levene's Test for
Equality of Variances
t-test for Equality of Means
F Sig. t df Sig. (2-tailed)
Mean Differen
ce
Std. Error
Difference
95% Confidence Interval of the
Difference Lower Upper
Products and Services
Quality and Variety
Equal variances assumed
.052 .822 -.111 28 .912 -.06667 .59947 -1.29463 1.16129
Equal variances not
assumed
-.111 27.9
22 .912 -.06667 .59947 -1.29478 1.16145

٤١٦
Web Marketing Mix Strategy
Equal variances assumed
.155 .697 -.360 28 .721 -.20000 .55492 -1.33670 .93670
Equal variances not
assumed
-.360 27.4
45 .721 -.20000 .55492 -1.33774 .93774
Resource Availability (Finance,
Technology etc)
Equal variances assumed
.725 .402 -.394 28 .696 -.20000 .50709 -1.23873 .83873
Equal variances not
assumed
-.394 25.4
21 .697 -.20000 .50709 -1.24350 .84350
Brand and Branding Strategy
Equal variances assumed
.541 .468 -.465 28 .645 -.26667 .57293 -1.44027 .90694
Equal variances not
assumed
-.465 26.2
62 .645 -.26667 .57293 -1.44378 .91045
Relationship and Strategic
Alliances
Equal variances assumed
.243 .626 -.410 28 .685 -.20000 .48795 -1.19952 .79952
Equal variances not
assumed
-.410 25.7
44 .685 -.20000 .48795 -1.20348 .80348
Customer Segmentation and Targeting
Equal variances assumed
.011 .918 -.349 28 .730 -.20000 .57349 -1.37474 .97474
Equal variances not
assumed
-.349 27.7
62 .730 -.20000 .57349 -1.37519 .97519
Firm Specialists Employers Skills and Education
Equal variances assumed
.201 .658 -.446 28 .659 -.26667 .59735 -1.49028 .95695
Equal variances not
assumed
-.446 27.3
30 .659 -.26667 .59735 -1.49163 .95830
Restructuring and
reengineering the processes
Equal variances assumed
.395 .535 -.362 28 .720 -.20000 .55205 -1.33083 .93083
Equal variances not
assumed
-.362 26.9
23 .720 -.20000 .55205 -1.33287 .93287
Firm IT Infrastructure Station and Orientation
Equal variances assumed
.180 .675 -.238 28 .813 -.13333 .55948 -1.27937 1.01271
Equal variances not
assumed
-.238 27.2
28 .813 -.13333 .55948 -1.28084 1.01417
Firm Competitive
Advantages in E-Marketing
Equal variances assumed
.016 .899 -.357 28 .724 -.20000 .56005 -1.34720 .94720
Equal variances not
assumed
-.357 27.8
97 .724 -.20000 .56005 -1.34739 .94739
Innovation support and Knowledge
Management
Equal variances assumed
.394 .535 -.339 28 .737 -.20000 .58986 -1.40828 1.00828
Equal variances not
assumed
-.339 27.0
62 .737 -.20000 .58986 -1.41017 1.01017
Increased Web Traffic and Stickiness
Equal variances assumed
.026 .873 -.611 28 .546 -.33333 .54569 -1.45113 .78446
Equal variances not
assumed
-.611 27.9
21 .546 -.33333 .54569 -1.45127 .78461
T-TEST GROUPS=Country(1 2)
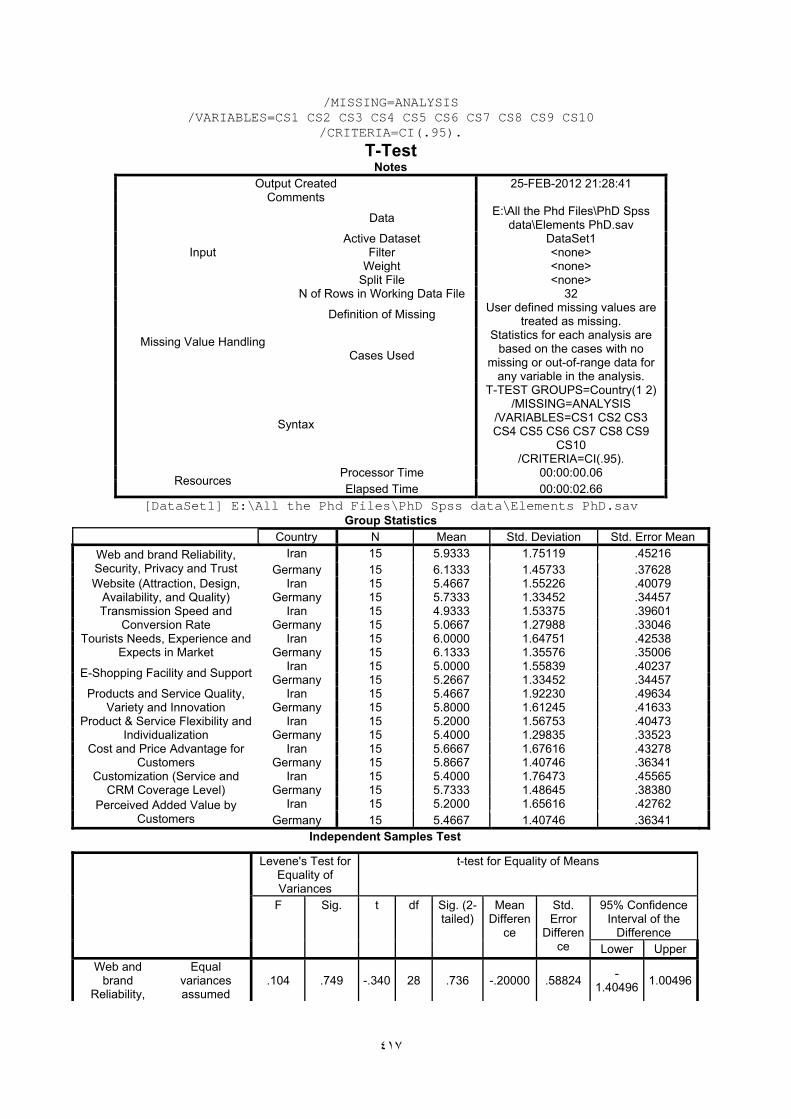
٤١٧
/MISSING=ANALYSIS /VARIABLES=CS1 CS2 CS3 CS4 CS5 CS6 CS7 CS8 CS9 CS10
/CRITERIA=CI(.95).
T-Test Notes
Output Created 25-FEB-2012 21:28:41 Comments
Input
Data E:\All the Phd Files\PhD Spss data\Elements PhD.sav
Active Dataset DataSet1 Filter <none>
Weight <none> Split File <none>
N of Rows in Working Data File 32
Missing Value Handling
Definition of Missing User defined missing values are treated as missing.
Cases Used
Statistics for each analysis are based on the cases with no
missing or out-of-range data for any variable in the analysis.
Syntax
T-TEST GROUPS=Country(1 2) /MISSING=ANALYSIS
/VARIABLES=CS1 CS2 CS3 CS4 CS5 CS6 CS7 CS8 CS9
CS10 /CRITERIA=CI(.95).
Resources Processor Time 00:00:00.06 Elapsed Time 00:00:02.66
[DataSet1] E:\All the Phd Files\PhD Spss data\Elements PhD.sav Group Statistics
Country N Mean Std. Deviation Std. Error Mean Web and brand Reliability, Security, Privacy and Trust
Iran 15 5.9333 1.75119 .45216 Germany 15 6.1333 1.45733 .37628
Website (Attraction, Design, Availability, and Quality)
Iran 15 5.4667 1.55226 .40079 Germany 15 5.7333 1.33452 .34457
Transmission Speed and Conversion Rate
Iran 15 4.9333 1.53375 .39601 Germany 15 5.0667 1.27988 .33046
Tourists Needs, Experience and Expects in Market
Iran 15 6.0000 1.64751 .42538 Germany 15 6.1333 1.35576 .35006
E-Shopping Facility and Support Iran 15 5.0000 1.55839 .40237 Germany 15 5.2667 1.33452 .34457
Products and Service Quality, Variety and Innovation
Iran 15 5.4667 1.92230 .49634 Germany 15 5.8000 1.61245 .41633
Product & Service Flexibility and Individualization
Iran 15 5.2000 1.56753 .40473 Germany 15 5.4000 1.29835 .33523
Cost and Price Advantage for Customers
Iran 15 5.6667 1.67616 .43278 Germany 15 5.8667 1.40746 .36341
Customization (Service and CRM Coverage Level)
Iran 15 5.4000 1.76473 .45565 Germany 15 5.7333 1.48645 .38380
Perceived Added Value by Customers
Iran 15 5.2000 1.65616 .42762 Germany 15 5.4667 1.40746 .36341
Independent Samples Test
Levene's Test for Equality of Variances
t-test for Equality of Means
F Sig. t df Sig. (2-tailed)
Mean Differen
ce
Std. Error
Difference
95% Confidence Interval of the
Difference Lower Upper
Web and brand
Reliability,
Equal variances assumed
.104 .749 -.340 28 .736 -.20000 .58824 -1.40496 1.00496

٤١٨
Security, Privacy and
Trust
Equal variances not
assumed
-.340 27.1
06 .736 -.20000 .58824 -1.40676 1.00676
Website (Attraction,
Design, Availability, and Quality)
Equal variances assumed
.268 .609 -.505 28 .618 -.26667 .52855 -1.34935 .81602
Equal variances not
assumed
-.505 27.3
84 .618 -.26667 .52855 -1.35045 .81712
Transmission Speed and Conversion
Rate
Equal variances assumed
.151 .700 -.259 28 .798 -.13333 .51578 -1.18987 .92320
Equal variances not
assumed
-.259 27.1
31 .798 -.13333 .51578 -1.19139 .92473
Tourists Needs,
Experience and Expects in
Market
Equal variances assumed
.125 .726 -.242 28 .811 -.13333 .55090 -1.26180 .99514
Equal variances not
assumed
-.242 27.0
00 .811 -.13333 .55090 -1.26369 .99702
E-Shopping Facility and
Support
Equal variances assumed
.049 .826 -.503 28 .619 -.26667 .52975 -1.35181 .81848
Equal variances not
assumed
-.503 27.3
53 .619 -.26667 .52975 -1.35297 .81964
Products and Service Quality,
Variety and Innovation
Equal variances assumed
.543 .467 -.515 28 .611 -.33333 .64783 -1.66035 .99368
Equal variances not
assumed
-.515 27.1
77 .611 -.33333 .64783 -1.66216 .99550
Product & Service
Flexibility and Individualizatio
n
Equal variances assumed
.152 .700 -.381 28 .706 -.20000 .52554 -1.27652 .87652
Equal variances not
assumed
-.381 27.0
62 .706 -.20000 .52554 -1.27820 .87820
Cost and Price Advantage for
Customers
Equal variances assumed
.449 .508 -.354 28 .726 -.20000 .56512 -1.35760 .95760
Equal variances not
assumed
-.354 27.1
87 .726 -.20000 .56512 -1.35917 .95917
Customization (Service and
CRM Coverage
Level)
Equal variances assumed
.437 .514 -.560 28 .580 -.33333 .59575 -1.55368 .88701
Equal variances not
assumed
-.560 27.2
14 .580 -.33333 .59575 -1.55527 .88860
Perceived Added Value by Customers
Equal variances assumed
.197 .661 -.475 28 .638 -.26667 .56118 -1.41619 .88285
Equal variances not
assumed
-.475 27.2
90 .638 -.26667 .56118 -1.41754 .88420
T-TEST GROUPS=Country(1 2) /MISSING=ANALYSIS
/VARIABLES=C1 C2 C3 C4 C5 C6 C7 /CRITERIA=CI(.95).
T-Test Notes
Output Created 25-FEB-2012 21:32:56 Comments

٤١٩
Input
Data E:\All the Phd Files\PhD Spss data\Elements PhD.sav
Active Dataset DataSet1 Filter <none>
Weight <none> Split File <none>
N of Rows in Working Data File 32
Missing Value Handling
Definition of Missing User defined missing values are treated as missing.
Cases Used
Statistics for each analysis are based on the cases with no
missing or out-of-range data for any variable in the analysis.
Syntax
T-TEST GROUPS=Country(1 2) /MISSING=ANALYSIS
/VARIABLES=C1 C2 C3 C4 C5 C6 C7
/CRITERIA=CI(.95).
Resources Processor Time 00:00:00.03 Elapsed Time 00:00:00.09
[DataSet1] E:\All the Phd Files\PhD Spss data\Elements PhD.sav
Group Statistics Country N Mean Std. Deviation Std. Error Mean
Stockholders Satisfaction Iran 15 3.8000 1.01419 .26186
Germany 15 4.0000 .84515 .21822
Customers Satisfaction Iran 15 4.4000 1.05560 .27255 Germany 15 4.5333 .83381 .21529
Customers Number Web Iran 15 3.8000 1.37321 .35456 Germany 15 3.9333 1.27988 .33046
Visitors Numbers Iran 15 3.0000 1.13389 .29277 Germany 15 3.2000 1.01419 .26186
Market Share Iran 15 3.0667 .96115 .24817 Germany 15 3.3333 .89974 .23231
Costs Iran 15 4.0667 1.16292 .30026 Germany 15 4.2667 .96115 .24817
Sell and Income Iran 15 3.6667 .97590 .25198
Germany 15 3.7333 .79881 .20625
Independent Samples Test
Levene's Test for Equality of Variances
t-test for Equality of Means
F Sig. t df Sig. (2-tailed)
Mean Differenc
e
Std. Error
Difference
95% Confidence Interval of the
Difference Lower Upper
Stockholders Satisfaction
Equal variances assumed .416 .524 -.587 28 .562 -.20000 .34087 -.89823 .49823
Equal variances not assumed
-.587 27.118 .562 -.20000 .34087 -.89926 .49926
Customers Satisfaction
Equal variances assumed .171 .682 -.384 28 .704 -.13333 .34733 -.84480 .57813
Equal variances not assumed
-.384 26.575 .704 -.13333 .34733 -.84652 .57985
Customers Number Web
Equal variances assumed .025 .876 -.275 28 .785 -.13333 .48469 -1.12617 .85950
Equal variances not assumed
-.275 27.862 .785 -.13333 .48469 -1.12639 .85972
Visitors Numbers
Equal variances assumed .011 .918 -.509 28 .615 -.20000 .39279 -1.00460 .60460

٤٢٠
Equal variances not assumed
-.509 27.659 .615 -.20000 .39279 -1.00505 .60505
Market Share
Equal variances assumed .126 .726 -.784 28 .439 -.26667 .33993 -.96299 .42966
Equal variances not assumed
-.784 27.879 .439 -.26667 .33993 -.96313 .42979
Costs
Equal variances assumed .147 .705 -.513 28 .612 -.20000 .38955 -.99795 .59795
Equal variances not assumed
-.513 27.041 .612 -.20000 .38955 -.99923 .59923
Sell and Income
Equal variances assumed .187 .669 -.205 28 .839 -.06667 .32563 -.73368 .60035
Equal variances not assumed
-.205 26.948 .839 -.06667 .32563 -.73485 .60152
End of job: 2 command lines 1 errors 0 warnings 1 CPU seconds GET
1-3- Firedman Test
FILE='C:\Documents and Settings\Administrator\Desktop\Elements PhD.sav'. DATASET NAME DataSet1 WINDOW=FRONT.
NPAR TESTS /FRIEDMAN=S1 S2 S3 S4 S5 S6 S7 S8 S9 S10
/STATISTICS DESCRIPTIVES /MISSING LISTWISE.
NPar Tests Notes
Output Created 28-FEB-2012 17:37:41 Comments
Input
Data C:\Documents and
Settings\Administrator\Desktop\Elements PhD.sav
Active Dataset DataSet1 Filter <none>
Weight <none> Split File <none>
N of Rows in Working Data File 32
Missing Value Handling
Definition of Missing User-defined missing values are treated as missing.
Cases Used Statistics for all tests are based on cases with no missing data
for any variables used.
Syntax
NPAR TESTS /FRIEDMAN=S1 S2 S3 S4 S5
S6 S7 S8 S9 S10 /STATISTICS DESCRIPTIVES
/MISSING LISTWISE.
Resources Processor Time 00:00:00.00 Elapsed Time 00:00:00.03
Number of Cases Alloweda 52428 a. Based on availability of workspace memory.
[DataSet1] C:\Documents and Settings\Administrator\Desktop\Elements PhD.sav Descriptive Statistics
N Mean Std. Deviation Minimum Maximum Global Distribution Systems(GDSs) 30 3.6000000 1.40442650 1.00000 5.00000
Executive Information Systems(EIS) 30 2.5000000 1.16707710 1.00000 5.00000
Strategic Information Systems(SIS) 30 3.5666667 1.19433529 1.00000 5.00000
Decision Support Systems(DSS) 30 3.4333333 1.19433529 1.00000 5.00000
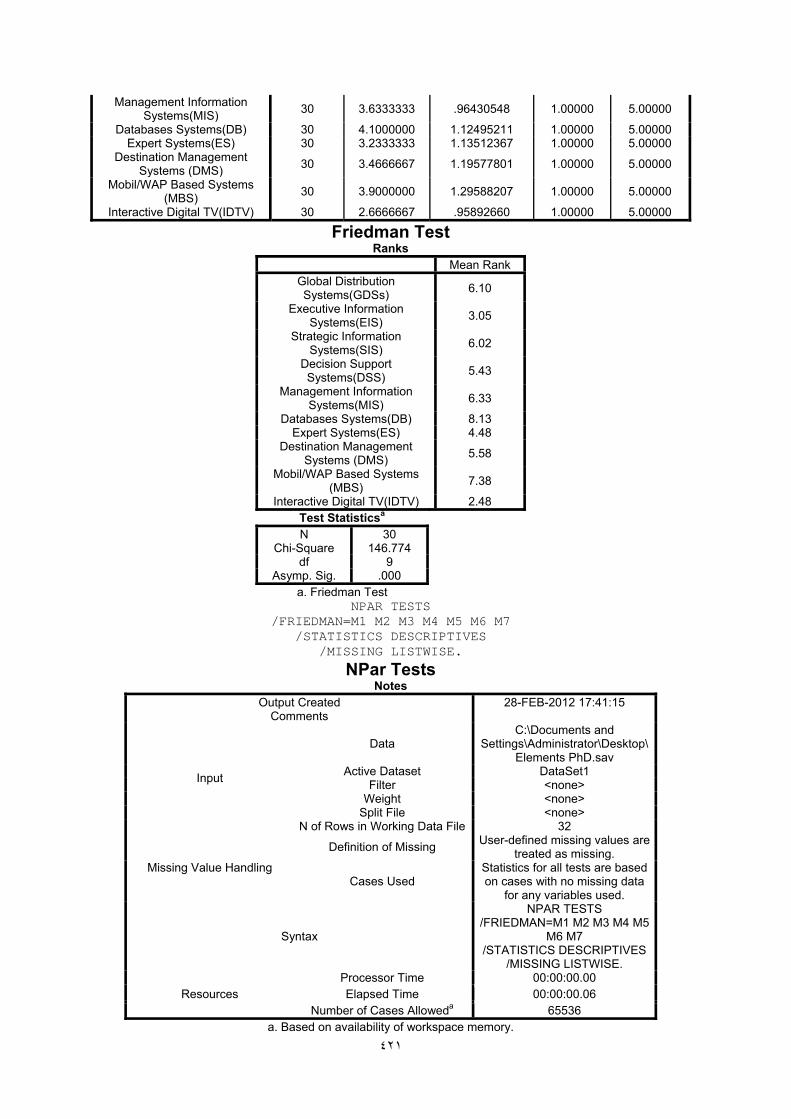
٤٢١
Management Information Systems(MIS) 30 3.6333333 .96430548 1.00000 5.00000
Databases Systems(DB) 30 4.1000000 1.12495211 1.00000 5.00000 Expert Systems(ES) 30 3.2333333 1.13512367 1.00000 5.00000
Destination Management Systems (DMS) 30 3.4666667 1.19577801 1.00000 5.00000
Mobil/WAP Based Systems (MBS) 30 3.9000000 1.29588207 1.00000 5.00000
Interactive Digital TV(IDTV) 30 2.6666667 .95892660 1.00000 5.00000
Friedman Test Ranks
Mean Rank Global Distribution Systems(GDSs) 6.10
Executive Information Systems(EIS) 3.05
Strategic Information Systems(SIS) 6.02
Decision Support Systems(DSS) 5.43
Management Information Systems(MIS) 6.33
Databases Systems(DB) 8.13 Expert Systems(ES) 4.48
Destination Management Systems (DMS) 5.58
Mobil/WAP Based Systems (MBS) 7.38
Interactive Digital TV(IDTV) 2.48 Test Statisticsa N 30
Chi-Square 146.774 df 9
Asymp. Sig. .000 a. Friedman Test
NPAR TESTS /FRIEDMAN=M1 M2 M3 M4 M5 M6 M7
/STATISTICS DESCRIPTIVES /MISSING LISTWISE.
NPar Tests Notes
Output Created 28-FEB-2012 17:41:15 Comments
Input
Data C:\Documents and
Settings\Administrator\Desktop\Elements PhD.sav
Active Dataset DataSet1 Filter <none>
Weight <none> Split File <none>
N of Rows in Working Data File 32
Missing Value Handling
Definition of Missing User-defined missing values are treated as missing.
Cases Used Statistics for all tests are based on cases with no missing data
for any variables used.
Syntax
NPAR TESTS /FRIEDMAN=M1 M2 M3 M4 M5
M6 M7 /STATISTICS DESCRIPTIVES
/MISSING LISTWISE.
Resources Processor Time 00:00:00.00 Elapsed Time 00:00:00.06
Number of Cases Alloweda 65536 a. Based on availability of workspace memory.
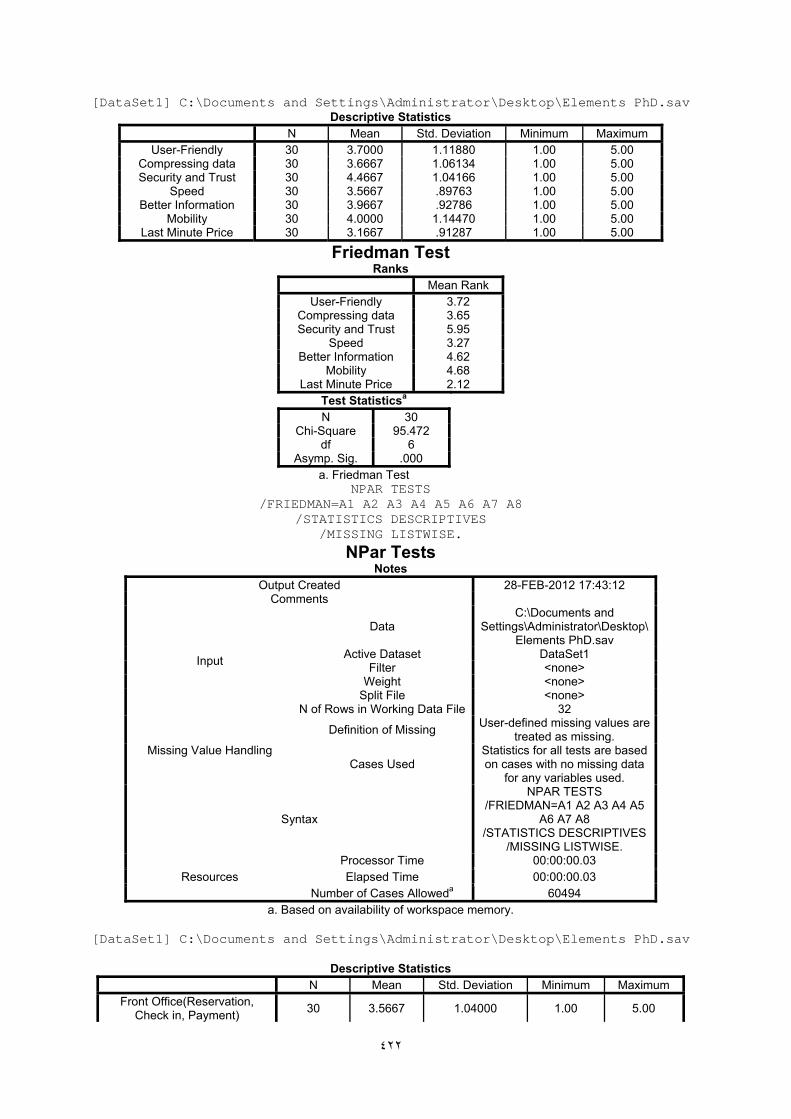
٤٢٢
[DataSet1] C:\Documents and Settings\Administrator\Desktop\Elements PhD.sav Descriptive Statistics
N Mean Std. Deviation Minimum Maximum User-Friendly 30 3.7000 1.11880 1.00 5.00
Compressing data 30 3.6667 1.06134 1.00 5.00 Security and Trust 30 4.4667 1.04166 1.00 5.00
Speed 30 3.5667 .89763 1.00 5.00 Better Information 30 3.9667 .92786 1.00 5.00
Mobility 30 4.0000 1.14470 1.00 5.00 Last Minute Price 30 3.1667 .91287 1.00 5.00
Friedman Test Ranks
Mean Rank User-Friendly 3.72
Compressing data 3.65 Security and Trust 5.95
Speed 3.27 Better Information 4.62
Mobility 4.68 Last Minute Price 2.12
Test Statisticsa N 30
Chi-Square 95.472 df 6
Asymp. Sig. .000 a. Friedman Test
NPAR TESTS /FRIEDMAN=A1 A2 A3 A4 A5 A6 A7 A8
/STATISTICS DESCRIPTIVES /MISSING LISTWISE.
NPar Tests Notes
Output Created 28-FEB-2012 17:43:12 Comments
Input
Data C:\Documents and
Settings\Administrator\Desktop\Elements PhD.sav
Active Dataset DataSet1 Filter <none>
Weight <none> Split File <none>
N of Rows in Working Data File 32
Missing Value Handling
Definition of Missing User-defined missing values are treated as missing.
Cases Used Statistics for all tests are based on cases with no missing data
for any variables used.
Syntax
NPAR TESTS /FRIEDMAN=A1 A2 A3 A4 A5
A6 A7 A8 /STATISTICS DESCRIPTIVES
/MISSING LISTWISE.
Resources Processor Time 00:00:00.03 Elapsed Time 00:00:00.03
Number of Cases Alloweda 60494 a. Based on availability of workspace memory.
[DataSet1] C:\Documents and Settings\Administrator\Desktop\Elements PhD.sav
Descriptive Statistics
N Mean Std. Deviation Minimum Maximum Front Office(Reservation,
Check in, Payment) 30 3.5667 1.04000 1.00 5.00
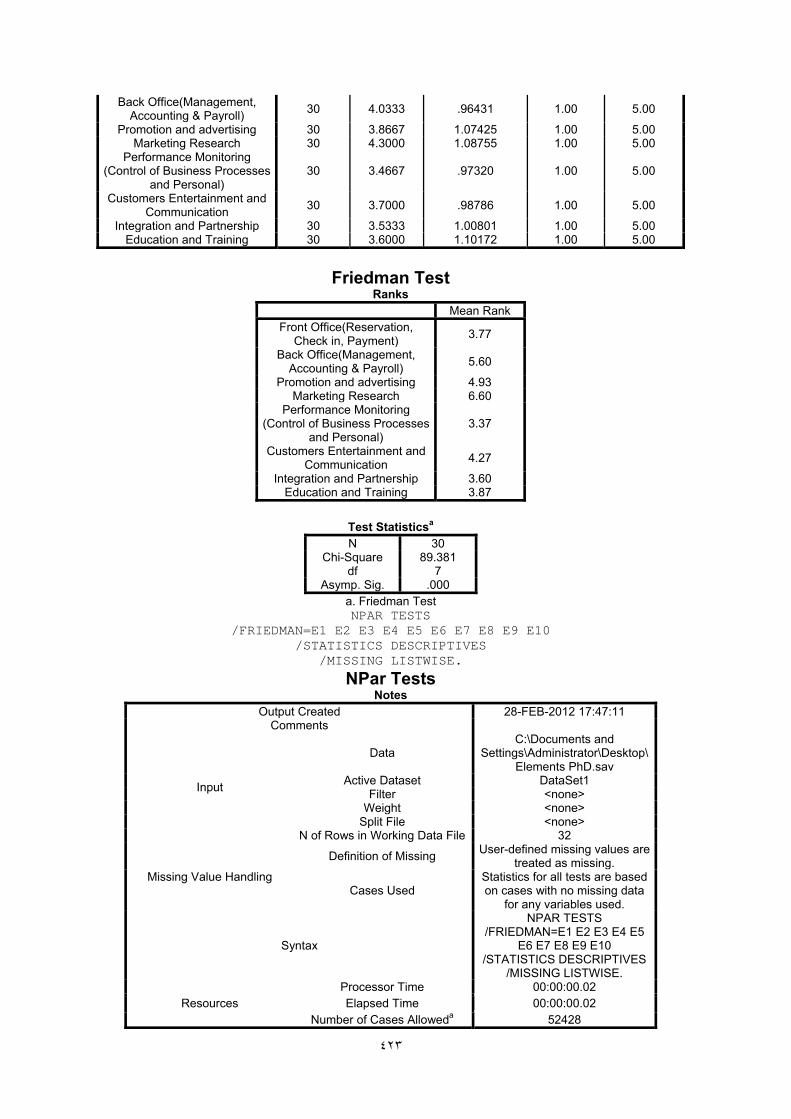
٤٢٣
Back Office(Management, Accounting & Payroll) 30 4.0333 .96431 1.00 5.00
Promotion and advertising 30 3.8667 1.07425 1.00 5.00 Marketing Research 30 4.3000 1.08755 1.00 5.00
Performance Monitoring (Control of Business Processes
and Personal) 30 3.4667 .97320 1.00 5.00
Customers Entertainment and Communication 30 3.7000 .98786 1.00 5.00
Integration and Partnership 30 3.5333 1.00801 1.00 5.00 Education and Training 30 3.6000 1.10172 1.00 5.00
Friedman Test
Ranks Mean Rank
Front Office(Reservation, Check in, Payment) 3.77
Back Office(Management, Accounting & Payroll) 5.60
Promotion and advertising 4.93 Marketing Research 6.60
Performance Monitoring (Control of Business Processes
and Personal) 3.37
Customers Entertainment and Communication 4.27
Integration and Partnership 3.60 Education and Training 3.87
Test Statisticsa N 30
Chi-Square 89.381 df 7
Asymp. Sig. .000 a. Friedman Test NPAR TESTS
/FRIEDMAN=E1 E2 E3 E4 E5 E6 E7 E8 E9 E10 /STATISTICS DESCRIPTIVES
/MISSING LISTWISE.
NPar Tests Notes
Output Created 28-FEB-2012 17:47:11 Comments
Input
Data C:\Documents and
Settings\Administrator\Desktop\Elements PhD.sav
Active Dataset DataSet1 Filter <none>
Weight <none> Split File <none>
N of Rows in Working Data File 32
Missing Value Handling
Definition of Missing User-defined missing values are treated as missing.
Cases Used Statistics for all tests are based on cases with no missing data
for any variables used.
Syntax
NPAR TESTS /FRIEDMAN=E1 E2 E3 E4 E5
E6 E7 E8 E9 E10 /STATISTICS DESCRIPTIVES
/MISSING LISTWISE.
Resources Processor Time 00:00:00.02 Elapsed Time 00:00:00.02
Number of Cases Alloweda 52428
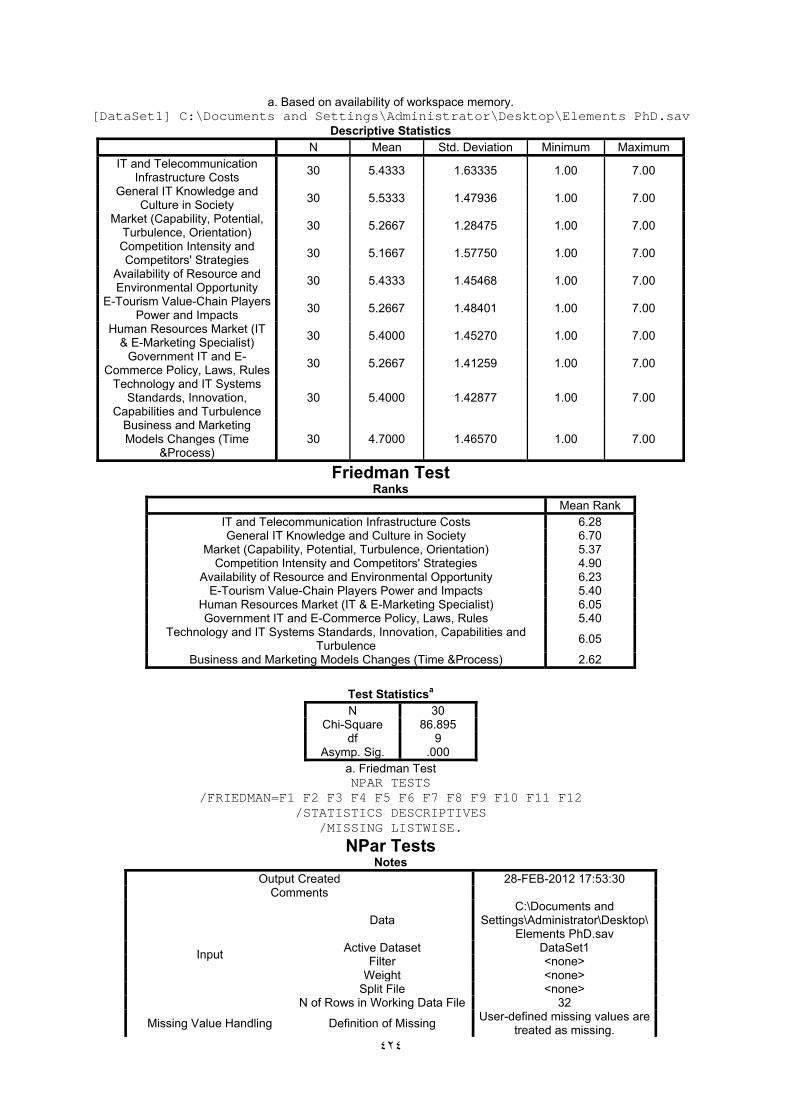
٤٢٤
a. Based on availability of workspace memory. [DataSet1] C:\Documents and Settings\Administrator\Desktop\Elements PhD.sav
Descriptive Statistics N Mean Std. Deviation Minimum Maximum
IT and Telecommunication Infrastructure Costs 30 5.4333 1.63335 1.00 7.00
General IT Knowledge and Culture in Society 30 5.5333 1.47936 1.00 7.00
Market (Capability, Potential, Turbulence, Orientation) 30 5.2667 1.28475 1.00 7.00
Competition Intensity and Competitors' Strategies 30 5.1667 1.57750 1.00 7.00
Availability of Resource and Environmental Opportunity 30 5.4333 1.45468 1.00 7.00
E-Tourism Value-Chain Players Power and Impacts 30 5.2667 1.48401 1.00 7.00
Human Resources Market (IT & E-Marketing Specialist) 30 5.4000 1.45270 1.00 7.00
Government IT and E-Commerce Policy, Laws, Rules 30 5.2667 1.41259 1.00 7.00
Technology and IT Systems Standards, Innovation,
Capabilities and Turbulence 30 5.4000 1.42877 1.00 7.00
Business and Marketing Models Changes (Time
&Process) 30 4.7000 1.46570 1.00 7.00
Friedman Test Ranks
Mean Rank IT and Telecommunication Infrastructure Costs 6.28 General IT Knowledge and Culture in Society 6.70
Market (Capability, Potential, Turbulence, Orientation) 5.37 Competition Intensity and Competitors' Strategies 4.90
Availability of Resource and Environmental Opportunity 6.23 E-Tourism Value-Chain Players Power and Impacts 5.40
Human Resources Market (IT & E-Marketing Specialist) 6.05 Government IT and E-Commerce Policy, Laws, Rules 5.40
Technology and IT Systems Standards, Innovation, Capabilities and Turbulence 6.05
Business and Marketing Models Changes (Time &Process) 2.62
Test Statisticsa N 30
Chi-Square 86.895 df 9
Asymp. Sig. .000 a. Friedman Test NPAR TESTS
/FRIEDMAN=F1 F2 F3 F4 F5 F6 F7 F8 F9 F10 F11 F12 /STATISTICS DESCRIPTIVES
/MISSING LISTWISE.
NPar Tests Notes
Output Created 28-FEB-2012 17:53:30 Comments
Input
Data C:\Documents and
Settings\Administrator\Desktop\Elements PhD.sav
Active Dataset DataSet1 Filter <none>
Weight <none> Split File <none>
N of Rows in Working Data File 32
Missing Value Handling Definition of Missing User-defined missing values are treated as missing.

٤٢٥
Cases Used Statistics for all tests are based on cases with no missing data
for any variables used.
Syntax
NPAR TESTS /FRIEDMAN=F1 F2 F3 F4 F5
F6 F7 F8 F9 F10 F11 F12 /STATISTICS DESCRIPTIVES
/MISSING LISTWISE.
Resources Processor Time 00:00:00.02 Elapsed Time 00:00:00.02
Number of Cases Alloweda 46260 a. Based on availability of workspace memory.
DataSet1] C:\Documents and Settings\Administrator\Desktop\Elements PhD.sav Descriptive Statistics
N Mean Std. Deviation Minimum Maximum Products and Services Quality
and Variety 30 5.5000 1.61352 1.00 7.00
Web Marketing Mix Strategy 30 5.3667 1.49674 1.00 7.00 Resource Availability (Finance,
Technology etc) 30 5.7000 1.36836 1.00 7.00
Brand and Branding Strategy 30 5.4667 1.54771 1.00 7.00 Relationship and Strategic
Alliances 30 5.3000 1.31700 1.00 7.00
Customer Segmentation and Targeting 30 5.5667 1.54659 1.00 7.00
Firm Specialists Employers Skills and Education 30 5.4667 1.61316 1.00 7.00
Restructuring and reengineering the processes 30 5.3000 1.48904 1.00 7.00
Firm IT Infrastructure Station and Orientation 30 5.2667 1.50707 1.00 7.00
Firm Competitive Advantages in E-Marketing 30 5.1667 1.51050 1.00 7.00
Innovation support and Knowledge Management 30 5.4333 1.59056 1.00 7.00
Increased Web Traffic and Stickiness 30 4.4333 1.47819 1.00 7.00
Friedman Test Ranks
Mean Rank Products and Services Quality
and Variety 7.43
Web Marketing Mix Strategy 6.63 Resource Availability (Finance,
Technology etc) 8.50
Brand and Branding Strategy 7.18 Relationship and Strategic
Alliances 6.27
Customer Segmentation and Targeting 7.77
Firm Specialists Employers Skills and Education 7.20
Restructuring and reengineering the processes 6.27
Firm IT Infrastructure Station and Orientation 6.07
Firm Competitive Advantages in E-Marketing 5.48
Innovation support and Knowledge Management 7.02
Increased Web Traffic and Stickiness 2.18
Test Statisticsa N 30
Chi-Square 134.039 df 11

٤٢٦
Asymp. Sig. .000 a. Friedman Test
NPAR TESTS /FRIEDMAN=CS1 CS2 CS3 CS4 CS5 CS6 CS7 CS8 CS9 CS10
/STATISTICS DESCRIPTIVES /MISSING LISTWISE.
NPar Tests Notes
Output Created 28-FEB-2012 18:25:13 Comments
Input
Data C:\Documents and
Settings\Administrator\Desktop\Elements PhD.sav
Active Dataset DataSet1 Filter <none>
Weight <none> Split File <none>
N of Rows in Working Data File 32
Missing Value Handling
Definition of Missing User-defined missing values are treated as missing.
Cases Used Statistics for all tests are based on cases with no missing data
for any variables used.
Syntax
NPAR TESTS /FRIEDMAN=CS1 CS2 CS3
CS4 CS5 CS6 CS7 CS8 CS9 CS10
/STATISTICS DESCRIPTIVES /MISSING LISTWISE.
Resources Processor Time 00:00:00.02 Elapsed Time 00:00:00.02
Number of Cases Alloweda 52428 a. Based on availability of workspace memory.
[DataSet1] C:\Documents and Settings\Administrator\Desktop\Elements PhD.sav Descriptive Statistics
N Mean Std. Deviation Minimum Maximum Web and brand Reliability, Security, Privacy and Trust 30 6.0333 1.58622 1.00 7.00
Website (Attraction, Design, Availability, and Quality) 30 5.6000 1.42877 1.00 7.00
Transmission Speed and Conversion Rate 30 5.0000 1.38962 1.00 7.00
Tourists Needs, Experience and Expects in Market 30 6.0667 1.48401 1.00 7.00
E-Shopping Facility and Support 30 5.1333 1.43198 1.00 7.00
Products and Service Quality, Variety and Innovation 30 5.6333 1.75152 1.00 7.00
Product & Service Flexibility and Individualization 30 5.3000 1.41787 1.00 7.00
Cost and Price Advantage for Customers 30 5.7667 1.52414 1.00 7.00
Customization (Service and CRM Coverage Level) 30 5.5667 1.61210 1.00 7.00
Perceived Added Value by Customers 30 5.3333 1.51620 1.00 7.00
Friedman Test Ranks
Mean Rank Web and brand Reliability, Security, Privacy and Trust 7.63
Website (Attraction, Design, Availability, and Quality) 5.77
Transmission Speed and Conversion Rate 3.17
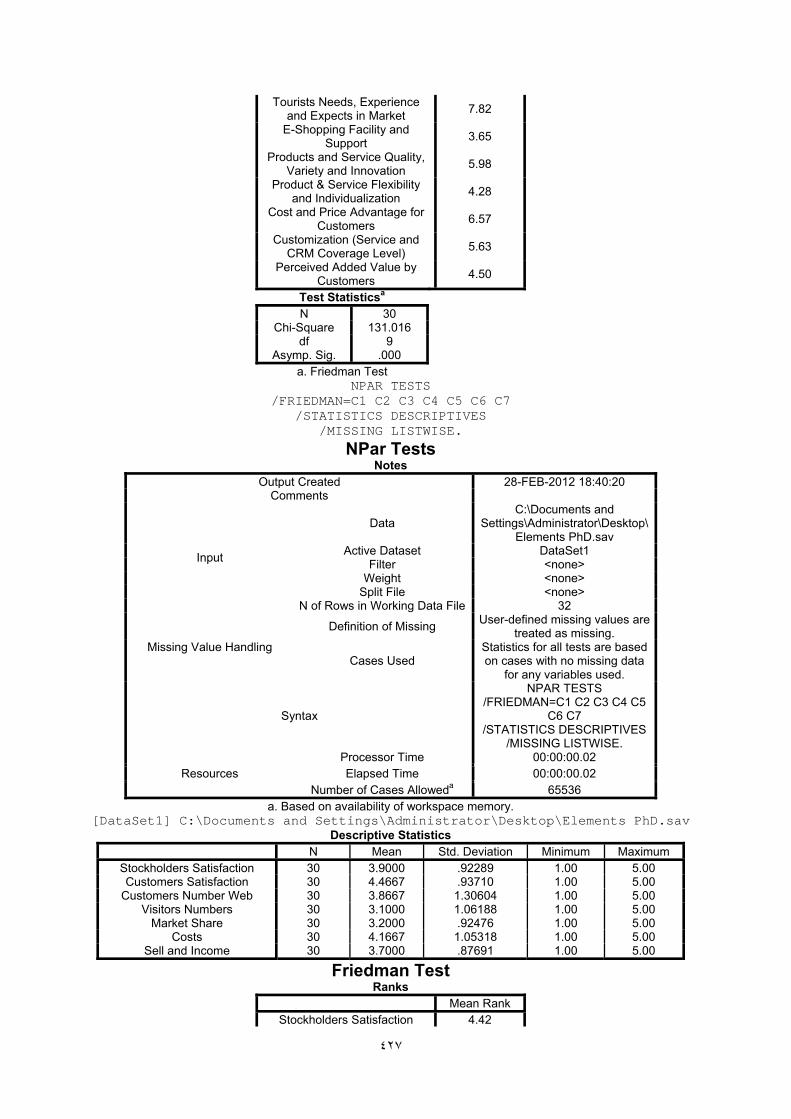
٤٢٧
Tourists Needs, Experience and Expects in Market 7.82
E-Shopping Facility and Support 3.65
Products and Service Quality, Variety and Innovation 5.98
Product & Service Flexibility and Individualization 4.28
Cost and Price Advantage for Customers 6.57
Customization (Service and CRM Coverage Level) 5.63
Perceived Added Value by Customers 4.50
Test Statisticsa N 30
Chi-Square 131.016 df 9
Asymp. Sig. .000 a. Friedman Test
NPAR TESTS /FRIEDMAN=C1 C2 C3 C4 C5 C6 C7
/STATISTICS DESCRIPTIVES /MISSING LISTWISE.
NPar Tests Notes
Output Created 28-FEB-2012 18:40:20 Comments
Input
Data C:\Documents and
Settings\Administrator\Desktop\Elements PhD.sav
Active Dataset DataSet1 Filter <none>
Weight <none> Split File <none>
N of Rows in Working Data File 32
Missing Value Handling
Definition of Missing User-defined missing values are treated as missing.
Cases Used Statistics for all tests are based on cases with no missing data
for any variables used.
Syntax
NPAR TESTS /FRIEDMAN=C1 C2 C3 C4 C5
C6 C7 /STATISTICS DESCRIPTIVES
/MISSING LISTWISE.
Resources Processor Time 00:00:00.02 Elapsed Time 00:00:00.02
Number of Cases Alloweda 65536 a. Based on availability of workspace memory.
[DataSet1] C:\Documents and Settings\Administrator\Desktop\Elements PhD.sav Descriptive Statistics
N Mean Std. Deviation Minimum Maximum Stockholders Satisfaction 30 3.9000 .92289 1.00 5.00 Customers Satisfaction 30 4.4667 .93710 1.00 5.00
Customers Number Web 30 3.8667 1.30604 1.00 5.00 Visitors Numbers 30 3.1000 1.06188 1.00 5.00
Market Share 30 3.2000 .92476 1.00 5.00 Costs 30 4.1667 1.05318 1.00 5.00
Sell and Income 30 3.7000 .87691 1.00 5.00
Friedman Test Ranks
Mean Rank Stockholders Satisfaction 4.42
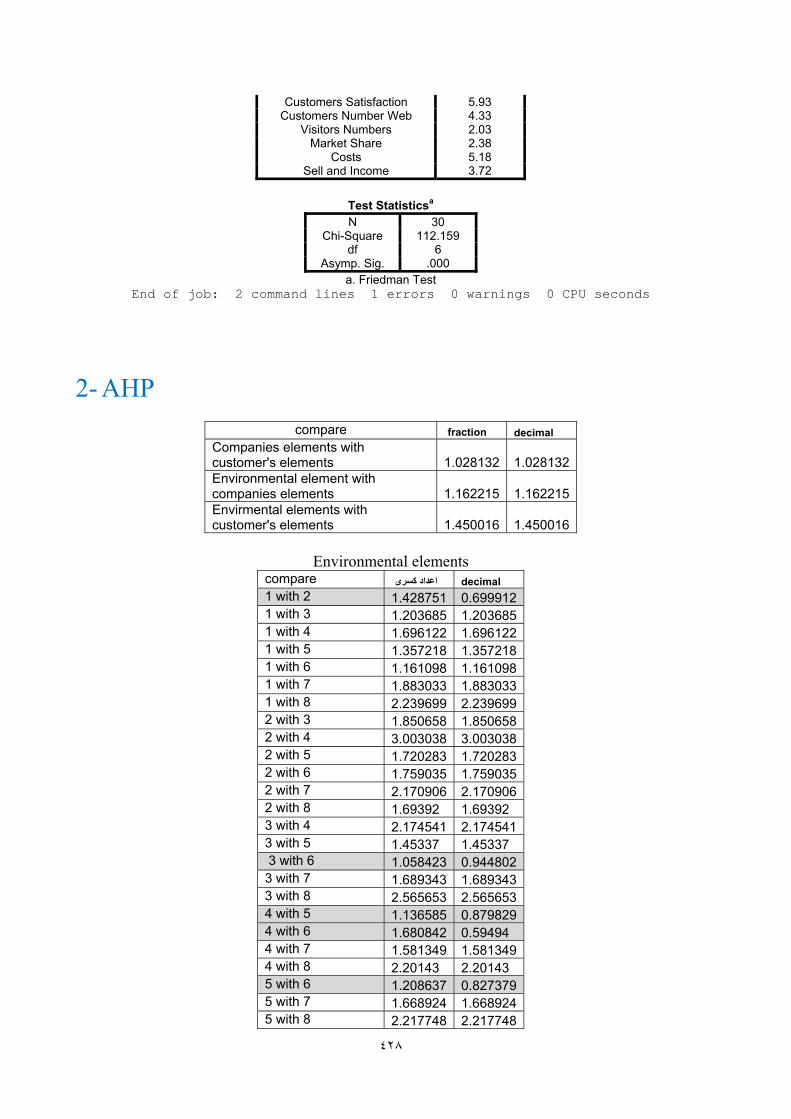
٤٢٨
Customers Satisfaction 5.93 Customers Number Web 4.33
Visitors Numbers 2.03 Market Share 2.38
Costs 5.18 Sell and Income 3.72
Test Statisticsa N 30
Chi-Square 112.159 df 6
Asymp. Sig. .000 a. Friedman Test
End of job: 2 command lines 1 errors 0 warnings 0 CPU seconds
2- AHP compare fraction decimal
Companies elements with customer's elements 1.028132 1.028132 Environmental element with companies elements 1.162215 1.162215 Envirmental elements with customer's elements 1.450016 1.450016
Environmental elements compare اعداد کسری decimal 1 with 2 1.428751 0.6999121 with 3 1.203685 1.2036851 with 4 1.696122 1.6961221 with 5 1.357218 1.3572181 with 6 1.161098 1.1610981 with 7 1.883033 1.8830331 with 8 2.239699 2.2396992 with 3 1.850658 1.8506582 with 4 3.003038 3.0030382 with 5 1.720283 1.7202832 with 6 1.759035 1.7590352 with 7 2.170906 2.1709062 with 8 1.69392 1.69392 3 with 4 2.174541 2.1745413 with 5 1.45337 1.45337 3 with 6 1.058423 0.9448023 with 7 1.689343 1.6893433 with 8 2.565653 2.5656534 with 5 1.136585 0.8798294 with 6 1.680842 0.59494 4 with 7 1.581349 1.5813494 with 8 2.20143 2.20143 5 with 6 1.208637 0.8273795 with 7 1.668924 1.6689245 with 8 2.217748 2.217748

٤٢٩
6 with 7 2.651982 2.6519826 with 8 2.772606 2.7726067 with 8 1.239165 1.239165
Companies' elements compare fraction decimal 1 with 2 1.901661 1.9016611 with 3 1.062907 0.9408161 with 4 1.715585 1.7155851 with 5 1.661175 1.6611751 with 6 1.714075 1.7140751 with 7 2.700118 2.7001181 with 8 1.336086 0.7484551 with 9 1.589662 1.5896621 with 10 1.277858 1.2778582 with 3 2.318112 0.4313862 with 4 1.349707 1.3497072 with 5 1.187442 0.8421462 with 6 1.37544 1.37544 2 with 7 1.146443 1.1464432 with 8 1.224481 0.816673 2 with 9 1.027441 1.0274412 with 10 1.13982 0.8773323 with 4 2.807875 2.8078753 with 5 2.14668 2.14668 3 with 6 2.918144 2.9181443 with 7 2.669448 2.6694483 with 8 1.113333 1.1133333 with 9 1.576496 1.5764963 with 10 2.036477 2.0364774 with 5 1.156396 0.8647554 with 6 1.606964 1.6069644 with 7 1.044696 0.9572174 with 8 2.726231 0.3668074 with 9 1.628309 0.6141344 with 10 1.204048 0.8305325 with 6 1.817557 1.8175575 with 7 1.362948 1.3629485 with 8 1.261009 0.7930165 with 9 1.109398 0.9013895 with 10 1.245628 1.2456286 with 7 1.015825 0.9844216 with 8 1.919462 0.5209796 with 9 1.297218 0.77088 6 with 10 1.142575 1.1425757 with 8 1.378811 0.7252637 with 9 1.060379 1.0603797 with 10 1.050609 0.9518298 with 9 2.03011 2.03011 8 with 10 1.87418 1.87418 9 with 10 1.0414 1.0414

٤٣٠
Customes elements compare اعداد کسری decimal 1 with 2 1.422963 0.7027591 with 3 3.145754 0.3178891 with 4 1.435796 0.6964781 with 5 1.327939 0.7530471 with 6 1.157601 0.8638561 with 7 1.397616 1.3976161 with 8 1.818384 0.5499392 with 3 1.050337 0.9520752 with 4 1.150335 0.8693122 with 5 1.501969 1.5019692 with 6 1.414133 1.4141332 with 7 1.599971 1.5999712 with 8 1.034337 1.0343373 with 4 1.856338 1.8563383 with 5 1.94886 1.94886 3 with 6 1.547022 1.5470223 with 7 2.585195 2.5851953 with 8 1.459965 1.4599654 with 5 1.172826 1.1728264 with 6 1.290354 0.7749814 with 7 1.560773 1.5607734 with 8 1.06922 0.9352615 with 6 1.181119 1.1811195 with 7 1.067113 0.9371075 with 8 1.332565 0.7504336 with 7 1.357871 1.3578716 with 8 1.715806 0.5828177 with 8 1.601616 0.62437
Criterions compare fraction decimal 1 with 2 1.577051 1.5770511 with 3 1.491275 1.4912751 with 4 1.855377 1.8553771 with 5 1.126902 1.1269021 with 6 1.571429 1.5714291 with 7 2.34331 2.34331 2 with 3 1.059368 1.0593682 with 4 1.835256 1.8352562 with 4 1.166226 0.8574672 with 6 1.328487 0.7527362 with 7 1.858396 1.8583963 with 4 1.574765 1.574765 3 with 5 1.248173 1.2481733 with 6 2.323362 2.3233623 with 7 2.564695 2.5646954 with 5 1.476401 0.6773234 with 6 1.49191 0.6702824 with 7 1.028071 1.0280715 with 6 1.265805 1.2658055 with 7 1.527492 1.527492

٤٣١
6 with 7 1.879305 1.879305
Tourism Activities compare اعداد کسری decimal 1 with 2 1.432838 1.4328381 with 3 1.266458 0.7896041 with 4 1.134784 0.8812251 with 5 1.002487 1.0024871 with 6 1.363322 1.3633221 with 7 1.519405 1.5194051 with 8 1.441087 1.4410872 with 3 1.273622 1.2736222 with 4 1.405791 0.7113432 with 5 1.181961 1.1819612 with 6 1.118009 0.8944482 with 7 1.047554 1.0475542 with 8 1.209999 1.2099993 with 4 1.063873 1.0638733 with 5 1.756704 1.756704 3 with 6 1.285595 1.2855953 with 7 1.712763 1.7127633 with 8 1.009926 0.9901714 with 5 1.415004 1.4150044 with 6 1.475892 1.4758924 with 7 1.214419 0.8234394 with 8 1.154308 1.1543085 with 6 1.21847 1.21847 5 with 7 1.038211 0.9631965 with 8 1.3446 1.3446 6 with 7 1.479928 0.6757086 with 8 1.021597 0.9788597 with 8 1.353234 1.353234
Sensitivity analysis Graph

٤٣٢

٤٣٣
Copyright © 2022 FDOKUMEN