Sustainable responsible investment in Malaysia and the region
50
In collaboration with: Trending: Sustainable responsible investment in Malaysia and the region
-
Upload
khangminh22 -
Category
Documents
-
view
0 -
download
0
Transcript of Sustainable responsible investment in Malaysia and the region

In collaboration with:
Trending: Sustainable responsible investment in Malaysia and the region

ASEAN SRI | 1
Trending: Sustainable responsible investment in Malaysia and the region
Lya RahmanChairperson,
Sustainable Investment PlatformSteering Committee
As Sustainable Responsible Investment (SRI) gains prominence amid growing investor awareness and participation in the ethical and sustainability-themed investment market, this research publication – aptly entitled Trending: Sustainable responsible investment in Malaysia and the region – is most timely, given that it provides insights on how the key ASEAN regional markets, namely Malaysia, Indonesia, the Philippines, Singapore, Thailand and Vietnam are driving SRI and adopting environmental, social and governance (ESG) practices.
This publication also provides insights on how the ASEAN61 countries are shaping policies to mitigate the impact of climate change while striving to advance or incorporate sustainability in their organizational and investment objectives.
Among the significant developments in the SRI market is the exponential growth of ASEAN sustainable bonds and sukuk (Islamic bonds) and the increasing investment focus on energy, green buildings and transportation, as well as the growing issuance of sustainability-themed products.
The publication also zooms in on the development of the ASEAN bourses in adopting ESG and sustainability; the green roadmaps, policies and regulations; and how these factors align with international initiatives to achieve a sustainable agenda by 2030.
With more ASEAN countries developing sustainability-themed assets, there is promising growth for the region’s responsible investment market segment in the years ahead.
Foreword
About SIP
► The Institutional Investors Council Malaysia (IIC) and Capital Markets Malaysia (CMM) jointly established the Sustainable Investment Platform (SIP) in April 2021. The SIP’s objective is to support institutional investors and the fund management industry in building the depth of SRI strategies which align financial returns with broader ESG priorities.
► Notably, the SIP’s mandate coincides with several initiatives that strive to bring sustainable finance and responsible investing into the mainstream Malaysian capital market.
Note: 1ASEAN6 refers to Malaysia, Indonesia, the Philippines, Singapore, Thailand and Vietnam.

ASEAN SRI | 2
Trending: Sustainable responsible investment in Malaysia and the region
Malaysia, along with the rest of ASEAN, are fast-tracking into sustainable responsible investment as they target positive impact and positive returns.
Market perspectives
Prior to the COVID-19 pandemic, global markets were already trending on SRI as major investors sought positive impact as well as positive returns. For institutional investors, this new bottom line has accelerated the use of ESG methodology as part of the screening and filtration process for investment selection.
ASEAN, with a sizeable capital market exceeding US$4.0t of assets under management, is stepping up focus on SRI as a new investment area. In just five years, 2016 to 2020, the ASEAN markets recorded an exponential 185% CAGR growth of ASEAN sustainable bonds, as well as an exponential 278% CAGR growth of sustainability-themed Shariah-compliant sukuk.
Looking ahead, the progressive ESG policy developments of the ASEAN6 countries and their increasing commitment toward net-zero carbon are fast-tracking the regional growth of sustainable responsible investment into the next decade.
Dato’ Abdul Rauf RashidMalaysia Managing PartnerErnst & Young PLT
Liew Nam SoonEY Asean Regional Managing PartnerErnst & Young Solutions PLT

ASEAN SRI | 3
Trending: Sustainable responsible investment in Malaysia and the region
Contents
Track market growth
► Global
► Bonds
► Equities
► Mutual funds
9
12
18
22
Zoom: roadmaps and priority areas
► Priority areas
► Roadmaps and action plans
► Sustainability roadmaps, plans
► Regulatory focus
24
25
27
29
Watch: ESG and SRI waves
► SRI market prospects
► SRI market phase assessment
► Green business opportunities
► Green infrastructure investment
33
34
35
36
References
► Country profiles
► Industry glossary, research sources and list of charts
► Industry contacts
► EY contacts
39
45
48
49
Executive summary 7
Foreword 1
Market perspectives 2

ASEAN SRI | 4
Trending: Sustainable responsible investment in Malaysia and the region
ASEAN investment mattersBuoyant dynamics and talent diversity continue to attract investor focus
Chart 1: ASEAN focus - international trade and investment expectations
ASEAN is a key regional hub propelled by dynamic economies and strong international trade linkages. ASEAN GDP, estimated at over US$3.0t, is projected to grow at a steady pace of about 5.3% CAGR over the medium-term, 2022 to 2025.
Today, the ASEAN6 total market capitalization of over US$2.8t1 is ranked 11th among global capital markets. The EY Capital Confidence Barometer 2021 (Southeast Asia) indicated that two-thirds of Southeast Asian executives perceived that their companies have outperformed in operational stability relative to their competitors during the pandemic. This confidence elevates the optimism for a near-term recovery with 86% saying they expect revenues to return to pre-pandemic levels by 2022. By mid-2022, more than half (56%) of Southeast Asian executives2 expect to pursue mergers and acquisitions.
Notes: 1 ASEAN6 market capitalization includes the Indonesia Stock Exchange (IDX), Bursa Malaysia, the Philippine Stock Exchange (PSE), Singapore Exchange (SGX), the
Stock Exchange of Thailand (SET), Ho Chi Minh Stock Exchange (HOSE) and Hanoi Stock Exchange (HNX), as of September 2021.2 Refers to survey respondents in the EY Capital Confidence Barometer 2021 (Southeast Asia)
Sources:► 2021 ASEAN Business Outlook Survey: ASEAN’s role in the Asia-Pacific, The American Chamber of Commerce in Singapore, March 2021 ► 2020 JETRO Survey on Business Conditions of Japanese Companies Operating Overseas (Asia and Oceania), Japanese External Trade Organization (JETRO),
December 2020► Australia Business in ASEAN Survey 2021, Australia-ASEAN Chamber of Commerce, August 2021► EU-ASEAN Business Sentiment Survey, EU-ASEAN Business Council, 2019-2020► Press Conference on Economic and Trade Cooperation between China and ASEAN, the 18th China-ASEAN Expo, and the 18th China-ASEAN Business &
Investment Summit Held in Beijing, China-ASEAN Business and Investment Summit (CABIS), 17 August 2021► Wang Yi: Trade between China and ASEAN Increases by Nearly 40 Percent in the First Half of 2021, Ministry of Foreign Affairs of the People’s Republic of China,
3 August 2021► World Federation of Exchanges
ASEAN’s growth is well-supported by its significant middle-class population of 193 million people comprising a third (33%) of the ASEAN6 population and its relatively young consumer demographics with over half (57%) of its population aged below 30 years.
Furthermore, among the emerging markets, ASEAN is a focal point of global investor interest as reflected by the findings of 2021 investor surveys across key OECD markets, including Australia, China, Japan, the European Union (EU) and the USA as highlighted below:

ASEAN SRI | 5
Trending: Sustainable responsible investment in Malaysia and the region
Notes:1Carbon intensity refers to greenhouse gas (GHG) intensity from seven GHGs namely carbon dioxide (CO2), methane (CH4), nitrous
oxide (N20), hydrofluorocarbons (HFCs), perfluorocarbons (PFCs), sulphur hexafluoride (SF6) and nitrogen trifluoride (NF3).2Singapore’s enhanced nationally determined contribution (NDC) aim to achieve peak emissions at 65MtCO2e around 2030.
Sources: United Nations Framework Convention on Climate Change (UNFCCC); respective government agencies’ official websites; media releases; EY research, Malaysia
ASEAN is committed to mitigating the impact of climate change
Thailand► To reduce GHG emissions by 20%
from the projected business-as-usual level by 2030
► To increase the installed capacity of renewable energy (RE) to 30% by 2037
► SET launched the SET Link platform to assist listed companies to enhance sustainability practices
Singapore► To reduce emission intensity by 36%
► To deploy at least 2GWp of solar power by 2030 and 200MW of energy storage systems beyond 2025
► SGX is investing SG$20m to expand its sustainability capabilities and initiatives
Malaysia► To reduce 45% of economy-wide
carbon intensity1 by 2030
► To increase the total installed capacity of RE to 31% by 2025 and 40% by 2035
► SC released a public consultation paper on principles-based SRI Taxonomy

ASEAN SRI | 6
Indonesia► To reduce 29% of GHG emissions
by 2030
► To increase new and renewable sources of energy to at least 23% by 2025 and 31% by 2050
► Indonesia requires at least Rp67,803t for green investment and green financing
Vietnam► To reduce 9% to 27% of GHG
emissions by 2030
► To increase the utilization rate of RE from about 7% in 2020 to more than 10% in 2030
► The World Bank3 provided an US$11.3m grant to spur energy-efficiency investments in Vietnam
Philippines► To reduce 75% of GHG emissions4
by 2030
► To increase RE capacity to at least 20,000MW by 2040
► The Government plans to spend about P318.6b on green projects in 2021-2022
and advancing sustainability
Notes:3 The World Bank, acting on behalf of the Green Climate Fund (GCF), signed the grant with the State Bank of Vietnam (SBV). The total
financing support from the GCF includes a US$75m guarantee.4 For the Philippines, of the 75% targeted reduction of GHG emissions, 72.29% is conditional upon the support of climate
finance, technologies and capacity development and 2.71% is unconditional and shall be implemented through domestic resources.
Sources: United Nations Framework Convention on Climate Change (UNFCCC); respective government agencies’ official websites; media releases; EY research

ASEAN SRI | 7
Trending: Sustainable responsible investment in Malaysia and the region
Executive summaryWhy ASEAN investment matters
Did you know?
CAGR of ASEAN sustainable bonds and sukuk issuance
(2016-20)
198%
ASEAN average GDP growth forecast (2022–25)
5.3%
Value of ASEAN potential business opportunities from the green/ low-
carbon economy
US$1t
Value of ASEAN average investment per annum in RE
(2025–30)
US$50b
ASEAN6 average target for reduction in GHG by 2030
38%
1Buoyant economic growth
Between 2010 and 2020, ASEAN1 recorded an above average economic growth of 6%. Over the next four years, 2022-25, the ASEAN economy is expected to grow steadily at a moderate pace of 5.3%, surpassing the average global growth forecast of 3.8%.
2Commitment to a low-carbon economy
The ASEAN6 countries are generally committed to addressing climate change by reducing GHG emissions by an estimated average of 38% by 2030. To date, there are 67 ASEAN6 signatories to the UN Principles for Responsible Investment (PRI), including asset owners, asset managers and service providers.
3Exponential growth in sustainable bonds and sukuk
ASEAN6 issued significant increases in sustainable bonds and sukuk (CAGR 198%) to finance growth which is aligned with ESG principles.
4Average RE investment of US$50b
The ASEAN RE sector is anticipated to attract an average investment of US$50b per annum from 2025 to 2030.
5Potential US$1t of green/ low-carbon business opportunities
By 2030, the ASEAN green / low-carbon economy is estimated to provide potential annual business opportunities of nearly US$1t.
Note:1 ASEAN refers to Brunei, Cambodia, Indonesia, Laos, Malaysia, Myanmar, the Philippines,
Singapore, Thailand and Vietnam

ASEAN SRI | 8
►Global
►Bonds
►Equities
►Mutual funds
Track market growth1

ASEAN SRI | 9
Trending: Sustainable responsible investment in Malaysia and the regionTrack1 Global
Definition: Sustainable responsible investment (SRI)
SRI generally includes sustainable-themed investments which are focused on ESG or the sustainable development goals (SDGs). SRI also includes impact investing based on positive, measurable social and environmental impact alongside financial returns.
Generally, the broader “responsible investment” segment does not directly target ESG or SDG-related themes. The four strategies adopted in the selection of targets include the integration of ESG factors in investment decisions, positive screening, negative screening and norms-based screening.
Sources:► Global Sustainable Investment Review 2020, Global Sustainable Investment Alliance (GSIA)► Financing for Sustainable Development Report 2020, United Nations, Inter-agency Task Force on Financing for Development► World Investment Report 2020 and 2021, United Nations Conference on Trade and Development (UNCTAD)► EY research
Sustainability-themedInvest in themes or assets around the UN SDGs
1
Sustainability-themed bonds/sukuk, equities and funds
All investment products
Impact investingGenerate positive, measurable social and environmental impact alongside financial return
2
ESG integrationIntegrate ESG factors into investment decisions to better manage risk and enhance financial returns
1
Positive screeningSelect companies across industries based on their sustainability performance
2
Negative screeningExclude activities or industries with clearly defined negative impact
3
Norms-based screeningScreen against the minimum standards of business practices based on international norms
4
SRI by themes
► Sustainability-themed investment:targets ESG or SDG-related themes
► Focused on social, financial market return and environmental impact
SRI by strategies and operations
► Responsible investment: general investment conducted in a sustainable responsible manner but not directly targeting ESG or SDG-related areas
► Focused on financial market return
SRI products
Bonds / Sukuk Equities Mutual funds► Green► Sustainability► Social
► Sustainability indices ► Sustainability-related funds / ESG funds / SDG-themed funds
Note: SRI excludes green loans, social loans and sustainability loans

ASEAN SRI | 10
Trending: Sustainable responsible investment in Malaysia and the regionTrack1 Global
Source: Is your ESG data unlocking long-term value?, EY, November 2021
Chart 2: Highlights of the EY Global Institutional Investor Survey 2021
Global institutional investors are focusing on ESG considerations
According to the EY Global Institutional Investor Survey (GIIS) 2021, 90% of institutional investors are focusing on the integration of ESG considerations into investment decision-making aside from risk identification across their portfolios and investment targets. Almost three-quarters (74%) are likely to divest companies with poor ESG track records. Most investors (77%) plan to step up on physical risk1
analysis and 80% will do more to evaluate transition risks2.
Notes:1 Physical risks refer to the impact of climate change on a business’ ability to provide its products and services2 Transition risks refer to the market impact that might result from the move to a low-carbon economy3 EMEIA refers to Europe, the Middle East, India and Africa
About the EY GIIS 2021:EY teams conducted a survey in June to July 2021 and received responses from 320 institutional investors across 19 countries. The respondents comprised Chief Investment Officers (28%) Managing Directors (27%), CEOs (19%), Research Directors (12%), portfolio managers (10%) and equity analysts (5%) from the Americas (38%), EMEIA3 (36%) and Asia-Pacific (26%).
of institutional investors will put greater emphasis on the corporates’ ESG performance while making investment strategies and decisions.
90%
of the investors surveyed would like the reporting of ESG performance measures against a set of globally consistent standards to become a mandatory requirement.
89%
said that investing in companies that have aggressive carbon-reduction initiatives is crucial in their decision-making strategies.
86%
mentioned that the lack of supply in green investments may lead to investors overpaying for green assets.
76%
of institutional investors are now more prone to divest companies with poor ESG performance.74%

ASEAN SRI | 11
Trending: Sustainable responsible investment in Malaysia and the regionTrack1 Global
24.9%
-0.1%
5.8%
-9.6%
63.0% 14.1% 9.1%
10,353
15,064
8,385
6,195
276 818 248
25,195
15,030
10,504
4,140 1,948 1,384 352
-
5,000
10,000
15,000
20,000
25,000
30,000
2016
2020
ESG integration Negative screening
Corporate engagement
and stakeholder
action
Norms-based investing
Sustainability-themed
investing
Positive screening
Impact investing
Sources:► ESG Investing: Practices, Progress and Challenges 2020, Boffo, R., and R. Patalano, OECD Paris ► Global Sustainable Investment Review 2020, GSIA► EY research
Among the sustainable investment strategies, ESG integration is the leading strategy, generating investments of over US$25t in 2020.
Although sustainability-themed investing is a comparatively new investment strategy, it has experienced a significant 63% CAGR growth since 2016 to reach nearly US$1.9t of assets in 2020.
Global sustainable investment
From 2016 to 2020, ESG integration and sustainability-themed investing posted strong growth while norms-based screening, positive screening as well as negative screening have experienced more variable trajectories.
In the medium- to long-term, the development of SRI will be shaped by investors’ preferences for ESG-related products, regulatory support to transition financial systems to be “greener” and the growth of investment products and services related to ESG (e.g., funds, ratings and indices).
Chart 3: Global sustainable investing strategies, 2016-20
US$b

ASEAN SRI | 12
Trending: Sustainable responsible investment in Malaysia and the regionTrack1 Bonds
Chart 4: Growth trend of ASEAN6 sustainable bonds and sukuk, 2016-21*
Sources:► ASEAN Capital Markets Forum► ASEAN Sustainable Finance, State of the Market 2020, Climate Bond Initiatives (CBI)► Media releases► EY research
Notes: The value of bonds and sukuk includes the respective bonds and green sukuk, sustainability sukuk and social sukuk as of 2 November 2021.1 Green bonds and sukuk are debt instruments which enable capital-raising and investment for projects with environmental benefits.2 Sustainability bonds and sukuk are debt instruments where the proceeds will be applied to financing both green and social projects.3 Social bonds and sukuk are debt instruments that raise funds for new and existing projects with positive social outcomes.
From 2016 to 2020, ASEAN sustainable bonds and sukukissuance grew exponentially at 198% CAGR to US$22.1b in 2020. The preliminary estimate of total sustainable bonds and sukukissued was US$29.8b in 2021.
As of 2 November 2021, green bonds and sukuk comprised nearly two-thirds (63%) of ASEAN sustainable bonds and sukukissuance. Green bonds and sukukrose exponentially by 106% CAGR, from US$253m in 2016 to US$4.5b in 2020.
Exponential growth of ASEAN sustainable bonds and sukuk
Chart 5: ASEAN6 - Value of green, sustainability and social bonds and sukuk, 2 November 2021
US$29.8b
Total ASEAN sustainable
bonds and sukuk, 2016-21*
US$18.7b(63%)
Greenbonds, sukuk
US$10.5b(35%)
Sustainability bonds, sukuk
US$508m(2%)
Social bonds, sukuk
4 13 2755
88117
0
50
100
150
200
250
300
350
400
450
500
0
5
10
15
20
25
30
35
2016 2017 2018 2019 2020 2021*
Value Volume
Value (US$b) Volume
US$0.3b
*US$29.8b
US$22.1b
500
400
300
200
100
* As of 2 November 2021
198%CAGR of total
value(2016-20)

ASEAN SRI | 13
Trending: Sustainable responsible investment in Malaysia and the regionTrack1 Bonds
Sources:► ASEAN Capital Markets Forum► ASEAN Sustainable Finance, State of the Market 2020, CBI► Media releases► EY research
From 2016 to 2020, Singapore issued nearly half (45%) of the ASEAN green bonds valued at US$6.4b.
Malaysia leads in sustainable sukuk issuance with total sukuk (green, sustainability and social sukuk) valued at US$3.9b.
The Philippines has an estimated one-third or 33% share of ASEAN sustainability bonds valued at US$2.5b.
Thailand issued the most social bonds with a total issuance of US$436m.
ASEAN6 markets: SRI bonds and sukuk
Singapore Indonesia Philippines Thailand Malaysia Vietnam
Green
Sustainability
Social
US$8.0b
US$6.1bUS$5.6b
US$5.3bUS$4.5b
US$0.2b
Chart 6: ASEAN6 aggregated value of SRI bonds and sukuk issuances by type, 2016-21*
Note: Sustainable bonds and sukuk include green, sustainability and social bonds/sukuk as of 2 November 2021. Numbers may not add up to total due to rounding adjustments.

ASEAN SRI | 14
Trending: Sustainable responsible investment in Malaysia and the regionTrack1 Bonds
Total ASEAN6 sukuk issued (as of 2 November 2021)
No. of issuers Value (US$) % of total sukuk
Green sukuk 19 4.7b 66%
Sustainability sukuk 8 2.3b 33%
Social sukuk 1 27m 1%
ASEAN6: sustainable sukuk on high growth trajectory
Sources:► ASEAN Capital Markets Forum► ASEAN Sustainable Finance, State of the Market 2020, CBI► Media releases► EY research
Over the last five years, 2016-20, ASEAN6 sustainable sukuk issuances grew 204 times.
As of 2 November 2021, the value of ASEAN6 sustainable sukuk is estimated to be US$7.0b. Among the sustainable sukuk (green, sustainability and social), Malaysia is the prime issuer at US$3.9b. Two-thirds (66%) of ASEAN6 sukuk are green sukuk, valued at US$4.7b.
Chart 7: ASEAN6 value of sustainable sukuk issuances, 2016-21*
2016 2017 2018 2019 2020 2021*
Green (S) Sustainability (S) Social (S)
US$7.0b
US$27m
US$5.5b
278% CAGR of total
value(2016-20)
Note: Numbers may not add up to 100% due to rounding adjustments.

ASEAN SRI | 15
Trending: Sustainable responsible investment in Malaysia and the regionTrack1 Bonds
Sources:► ASEAN Sustainable Finance, State of the Market 2020, CBI► World Investment Report 2020 – 2021, UNCTAD► EY research
Note: Others refer to sustainability (including green) projects such as pollution prevention and control, clean transportation, sustainable water and wastewater management, climate change adaptation and green buildings. Numbers may not add up to 100% due to rounding adjustments.
► The energy sector is the key driver of ASEAN6 sustainable bonds and sukuk, comprising almost half (49%) of the bond issuances.
► Green buildings account for 10% of the ASEAN6 issuance of sustainable bonds, followed by the transport sector at 9%.
► These three sectors command 68% of the ASEAN6 total issuance of bonds and sukuk.
Chart 8: ASEAN6 – Percentage of total sustainable bonds and sukuk
ASEAN6: sustainable bonds and sukuk are financing energy, green buildings and the transport sector
US$14.5b
US$2.9b
U$2.7b
US$0.63b
US$0.46b
US$0.36b
US$0.16b
US$0.027b
US$7.9b
Energy
Green buildings
Transport
Water and waste management
Women empowerment
Affordable housing
Land use
Social and education
Others
% of total sustainable bonds and sukuk
49%
10%
9%
2%
2%
1%
1%
0.1%
27%
68%
(as of 2 November 2021)

ASEAN SRI | 16
Trending: Sustainable responsible investment in Malaysia and the regionTrack1 Bonds
Note:1Total outstanding bonds include local currency (LCY) outstanding bonds (government bonds, corporate bonds and central bank bonds).
LCY-denominated bonds are bonds issued by government, corporates and financial institutions.
Sources:► Asia Bond Online; data retrieved from official website on 17 November 2021.► Asia Bond Monitor September 2021, Asia Bond Online, September 2021
From 2016 to 2020, the significant development of the ASEAN6 bond market strengthened its financial sector’s resilience. The total estimated ASEAN6 bonds outstanding1 is projected to reach over US$2.0t in 2021.
Malaysia, Indonesia, Singapore and Thailand accounted for more than 83% share of the ASEAN6 bond market in 2020.
ASEAN6: overview of the bond marketSignificant market development
Chart 9: ASEAN6 total outstanding bonds1, 2016-21*
* As of 30 September 2021 Total Bond Y-O-Y growth
180.4
321.5 355.6
0%
5%
10%
15%
20%
25%
30%
-
100
200
300
400
500
2016 2017 2018 2019 2020 2021*
IndonesiaUS$b %
260.2
399.1 410.6
-5%
0%
5%
10%
15%
20%
25%
30%
-
100
200
300
400
500
2016 2017 2018 2019 2020 2021*
MalaysiaUS$b %
232.3
380.4
434.6
0%
10%
20%
30%
40%
50%
-
100
200
300
400
500
2016 2017 2018 2019 2020 2021*
SingaporeUS$b %
98.2
178.4
-10%
0%
10%
20%
30%
40%
-
100
200
300
400
500
2016 2017 2018 2019 2020 2021*
PhilippinesUS$b %
303.0
464.7 429.6
-10%
0%
10%
20%
30%
-
100
200
300
400
500
2016 2017 2018 2019 2020 2021*
ThailandUS$b % US$b %
73.4 130.3
156.4
0%
10%
20%
30%
40%
50%
-
100
200
300
400
500
2016 2017 2018 2019 2020 2021*
Vietnam

ASEAN SRI | 17
Trending: Sustainable responsible investment in Malaysia and the regionTrack1 Bonds
Sources: ACMF official website, ICMA official website, CBI official website, EY research
Notes:1ACMF also published the ASEAN Social Bond Standards (ASBS) and the ASEAN Sustainability Bond Standards (ASUS).2ICMA also published the Sustainability Bond Guidelines (SBG) and the Sustainability-Linked Bond Principles (SLBP).
Green bonds and sukuk issued by ASEAN corporates and financial institutions adopt either one of the following green bond standards and guidelines issued by ACMF, CBI or ICMA.
ASEAN: green bond standards
Climate Bonds Standards (CBS)
Green Bond Principles (GBP)
ASEAN Green Bond Standards (AGBS)
Issuer
Project details
Reporting
External review
► ASEAN Capital Markets Forum (ACMF)1
► Climate Bonds Initiative (CBI)
► International Capital Market Association (ICMA)2
► To enhance transparency and create uniformity of the green bonds in ASEAN
► Eligible for green projects with clear environmental benefits
► Fossil fuel power generation projects are excluded to mitigate greenwashing
► The Climate Bonds Standard & Certification Scheme is for relevant stakeholders to identify and prioritize low-carbon and climate-resilient investments and mitigate greenwashing.
► Bonds, loans or other debt instruments under the Certification Scheme are aligned with the GBP and other global green bond standards (including the AGBS)
► All eligible projects and financing assets are aligned with the Paris Agreement goals.
► To enhance transparency and disclosure and promote integrity in the development of the green bond market.
► Eligible for green projects with clear environmental benefits.
► The proceeds of green bonds can be managed through a bond-by-bond approach or portfolio approach.
► Encouraged to provide more frequent periodic reporting
► Mandatory to prepare and disclose the Green Bond Framework pre-issuance or at issuance.
► Information on the use of proceeds should be updated and readily available annually until full allocation, and on a timely basis in the event of material developments.
► Voluntary basis (but recommended)
► Mandatory ► Recommended
Chart 10: Key green bond standards and guidelines in ASEAN

ASEAN SRI | 18
Trending: Sustainable responsible investment in Malaysia and the regionTrack1 Equities
Illustration:SRI initiatives in the Malaysian capital market
► SC launched the SRI Sukuk Framework.
► Bursa Malaysia launched the FTSE4Good Bursa Malaysia Index.
► First social impact sukuk issued in Malaysia, whereby proceeds from the RM1b SRI sukuk were to be utilized for education
► Introduction of sustainability reporting under the Bursa Malaysia listing requirements and Sustainability Reporting Guide.
► Tax incentives for SRI sukuk issuers from YA2016 to YA2020
► SC launched the Islamic Fund and Wealth Management Blueprint.
► SC issued the Guidelines on SRI Funds.
► SC issued the Malaysian Code on Corporate Governance (MCCG) 2017 to enhance the SRI ecosystem.
► Tax incentive for SRI funds for three years from YA2018 to YA2020
► Issuance of the world’s first green sukukin Malaysia under the SRI SukukFramework
► Issuance of the 2nd tranche of the social impact sukuk, with a retail portion
► Establishment of the RM6m Green SRI Sukuk Grant Scheme
► SC launched the Sustainable and Responsible Investment Roadmap for the Malaysian Capital Market.
► SC and Bank Negara Malaysia (BNM) established the Joint Committee on Climate Change (JC3).
► Tax incentives for SRI sukukand SRI funds issuers extended from YA2021 to YA2023 (Budget 2020)
► The Government approved an additional RM2b allocation under the Green Technology Financing Scheme (GTFS 3.0) until 2022 to encourage the issuance of SRI Sukuk (Budget 2021).
► BNM issued the Climate Risk Management and Scenario Analysis exposure draft.
► SC issued the revised MCCG 2021 which incorporates ESG areas of focus.
► SC expanded its Green SRI Sukuk Grant Scheme, and renamed it as the SRI Sukuk and Bond Grant Scheme.
► SC released a public consultation paper on Principles-based SRI Taxonomy.
► SC launched the NaviGate: Capital Market Green Financing Series, to create greater awareness and connectivity between green companies and the capital markets.
► The Government issued a RM666m Sukuk Prihatin to contribute toward the COVID-19 fund.
► The Government issued the world's first sovereign US dollar-denominated Sustainability Sukuk, via the issuance of US$800m 10-year trust certificates, where the proceeds will be used for eligible social and green projects that are aligned to the SDG goals.
► The Government has proposed the issuance of up to RM10b of sustainable sukuk for eligible social or environment-friendly projects (Budget 2022).
Source: EY research
2014 2015 2016
201720182019
2020 2021

ASEAN SRI | 19
Trending: Sustainable responsible investment in Malaysia and the regionTrack1 Equities
ASEAN bourses are serious about ESG and sustainability
Note:1 Reporting instruments referenced in written guidance on ESG reporting include the Global Reporting Initiative (GRI), the Sustainability Accounting Standards Board
(SASB), the International Integrated Reporting Council (IIRC), the Carbon Disclosure Project (CDP), the Task Force on Climate-Related Financial Disclosures (TCFD) and the Climate Disclosure Standards Board (CDSB)
Sources:► Financial Services Authority of Indonesia or Otoritas Jasa Keuangan (OJK); Securities Commission Malaysia (SC); Bursa Malaysia; Bangko Sentral ng Pilipinas
(BSP); SGX; SET; State Securities Commission (SSC) of Vietnam► Market Statistics - November 2021, World Federation of Exchanges; data retrieved from official website on 17 November 2021► Rediscover ASEAN: a growth story of 10 countries, EY, May 2017► SSE Initiatives► World Investment Report 2020 – 2021, United Nations Conference on Trade and Development (UNCTAD)► EY research
► ASEAN6 stock exchanges are part of the Sustainable Stock Exchanges (SSE) initiatives.
► ASEAN6 stock exchanges require public listed companies to submit ESG disclosure information.
► Most ASEAN6 bourses have launched sustainability-equity indices as a transparent platform for investors to track the performance of companies with good ESG practices.
Chart 11: Total ASEAN6 market capitalization, 2010-21*
*Market capitalization of seven stock exchanges in ASEAN which include IDX, Bursa, PSE, SGX, SET, HOSE and HNX. Historical 2010-20 data as at 31 December each year, except for 30 September 2021.
1.0
1.5
2.0
2.5
3.0
2010 2011 2012 2013 2014 2015 2016 2017 2018 2019 2020 2021*
3.7%CAGR (2010-20)
Value (US$t)
US$2.8tMarket capitalization*
Malaysia Indonesia Philippines Singapore Thailand Vietnam
Stock exchange Bursa Malaysia (Bursa)
Indonesia Stock Exchange (IDX)
Philippine Stock Exchange (PSE)
Singapore Exchange (SGX)
The Stock Exchange of
Thailand (SET)
Ho Chi Minh Stock Exchange
(HOSE)
Requires ESG reporting
Written guidance on ESG reporting1
ESG-related training
Sustainability equity indices
► FTSE4Good Bursa Malaysia Index
► FTSE4Good Bursa Malaysia Shariah Index
► SRI-KEHATI Index
► IDX ESG Leaders Index
► ESG Sector Leaders IDX KEHATI Index
► ESG Quality 45 IDX KEHATI
► SGX ESG Leaders Index
► SGX ESG Transparency Index
► SET Thailand Sustainability Index (SETTHSI)
► Vietnam Sustainability Index (VNSI)
✓ ✓
✓
✓
✓
✓
✓
✓
✓
✓
✓
✓
✓
✓
✓
✓✓
✓

ASEAN SRI | 20
Trending: Sustainable responsible investment in Malaysia and the regionTrack1 Equities
ASEAN6: equity marketsSteady growth
From 2016 to 2020, the total market capitalization of the ASEAN6 markets grew at 4.4% CAGR to US$2.6t in 2020, catapulting ASEAN6 to 11th position among the world’s largest capital markets.
Notes: 1Market capitalization of seven stock exchanges in ASEAN6 including Bursa, IDX, PSE, SGX, SET, HOSE and HNX. Historical data as of 31 December from 2016 to 2020, except September 2021.
Sources:► Market Statistics - November 2021, World Federation of Exchanges; data retrieved from official website on 17 November 2021► OJK; SC; Bursa Malaysia; BSP; SGX; SET; SSC Vietnam► Rediscover ASEAN: a growth story of 10 countries, EY, May 2017► EY research
428.2
494.1 534.9
-15%
-5%
5%
15%
25%
-
100
200
300
400
500
2016 2017 2018 2019 2020 2021*
IndonesiaUS$b %
379.0
452.9 430.3
-15%
-5%
5%
15%
25%
- 50
100 150 200 250 300 350 400 450 500
2016 2017 2018 2019 2020 2021*
MalaysiaUS$b %
291.3 330.8
375.0
-15%
-5%
5%
15%
25%
-
100
200
300
400
2016 2017 2018 2019 2020 2021*
PhilippinesUS$b %
640.3 652.1 652.3
-20%
-10%
0%
10%
20%
30%
-
100
200
300
400
500
600
700
800
2016 2017 2018 2019 2020 2021*
Singapore
US$b %
421.1
535.2 559.7
-20%
-10%
0%
10%
20%
30%
-
100
200
300
400
500
600
2016 2017 2018 2019 2020 2021*
Thailand
US$b %
72.2
184.9
242.8
-5%
5%
15%
25%
35%
45%
55%
65%
75%
-
50
100
150
200
250
300
2016 2017 2018 2019 2020 2021*
Vietnam
US$b %
Chart 12: ASEAN6 market capitalization1, 2016-21*
* As of 30 September 2021 Market capitalization Y-O-Y growth

ASEAN SRI | 21
Trending: Sustainable responsible investment in Malaysia and the regionTrack1 Equities
Notes: 1 Index performance (as of 31 December each year) includes the Jakarta Composite Index, Indonesia Sri KEHATI Index, LQ45 Index,
FTSE4Good Bursa Malaysia Index, FBM KLCI, Singapore ESG Leaders Index, Singapore ESG Transparency Index, Straits Times Index,SETTSHI and Stock Exchange of Thailand (SET) Index
2 Indonesia’s LQ45 Index constituents comprise 45 companies that have been included in the top 60 companies with the largest market capitalization and highest transaction value within the last 12 months, listed in the IDX for a minimum of 3 months and have sound financial conditions, growth prospects, high transaction value and frequency.
*Historical information for IDX ESG Leaders Index (2016-19), FTSE4Good Shariah (2016-20) and SETTSHI (2016 and 2017) is not available, and VNSI is not accessible as at 22 September 2021. 2021 figures as at September 2021.
Sources:► Refinitiv (formerly Thomson Reuters)► EY research
From 2016 to 2020, Malaysia’s FTSE4Good, and Singapore’s ESG Leaders and ESG Transparency indices outperformed their respective local capital market indices. These sustainability indices are indicative references of the ESG investment focus in the ASEAN markets.
ASEAN6: sustainability indicesMixed performance
110.4
101.1
118.7
80.0
100.0
120.0
140.0
2016 2017 2018 2019 2020 2021
Indonesia
SRI KEHATI Index
LQ45
Jakarta Composite Index
SRI KEHATI underperformed
(-7.0%)
Chart 13: ASEAN6 sustainability index performance1, 2016-21*
* As of 30 September 2021
112.5
111.6
107.1
80.0
100.0
120.0
140.0
2016 2017 2018 2019 2020 2021
Singapore
SGX ESG Leaders Index
SGX ESG Transparency Index
Straits Times Index
ESG Leaders outperformed (+1.0%)
ESG Transparency outperformed (+4.0%)
101.0
104.1
80.0
100.0
120.0
2016 2017 2018 2019 2020 2021
Thailand
SETTHSI
SET Index
SETTHSI underperformed
(-2.9%)
97.1
93.7
80.0
100.0
120.0
2016 2017 2018 2019 2020 2021
Malaysia
FTSE4GOOD
FBM KLCI
FTSE4Good outperformed
(+3.7%)

ASEAN SRI | 22
Track1 Mutual fund Trending: Sustainable responsible investment in Malaysia and the region
Notes:1 All figures are based on total AUM, except Thailand and Vietnam which are based on net asset value (NAV).2 Indonesia AUM includes the money market, equities, balanced funds, fixed income, protected funds, index funds and exchange-traded funds.3 Malaysia AUM includes equities, fixed income securities, money market placements, unit trust funds, private equity/unquoted stocks and others.4 the Philippines AUM includes feeder funds, fund-of-funds, fixed income funds, balanced funds, equities, bond funds, money market funds and others.
Historical data for 2019 and 2020 as of June for each respective years.5 Singapore AUM includes traditional and alternative funds (i.e. hedge fund, private equity, REITs, real estate).6 Thailand NAV includes mutual funds and trust funds, excluding property funds, infrastructure funds, vayupak funds and country funds.7 Vietnam refers to HOSE NAV. Y-O-Y growth for 2015-16 is not available.
Sources:► PT Bareksa Portal Investasi; SC Malaysia; Trust Officers Association of the Philippines; Monetary Authority of Singapore (MAS); The Securities and
Exchange Commission (SEC), Thailand; SSC Vietnam► EY research
Chart 14: ASEAN6 total AUM1, 2016-20
ASEAN6: mutual fund marketDouble-digit growth momentum
The generally robust economic outlook of the ASEAN6 markets will continue to attract investor focus on the trending fund opportunities in the growth sectors.
From 2016 to 2020, total assets under management (AUM) of ASEAN6 grew rapidly by 15.9% CAGR to US$4.0t in 2020.
25.1
40.5
0%
10%
20%
30%
40%
-
10
20
30
40
50
2016 2017 2018 2019 2020
Indonesia2
US$b %
155.2
225.6
-10%
-5%
0%
5%
10%
15%
20%
25%
-
60
120
180
240
2016 2017 2018 2019 2020
Malaysia3
US$b %
16.5
13.0
-60%-40%-20%0%20%40%60%80%100%
-
5
10
15
20
2016 2017 2018 2019 2020
Philippines4
US$b %
1,897.3
3,555.0
0%
5%
10%
15%
20%
25%
30%
- 500
1,000 1,500 2,000 2,500 3,000 3,500 4,000
2016 2017 2018 2019 2020
Singapore5
US$b %
119.6
159.5
0%
5%
10%
15%
-
50
100
150
200
2016 2017 2018 2019 2020
Thailand6
Total NAV Y-O-Y growth
US$b % US$b %
0.3
2.5
0%
20%
40%
60%
80%
100%
-
1
1
2
2
3
3
2016 2017 2018 2019 2020
Vietnam7
Total NAV Y-O-Y growth
Total AUM Y-O-Y growth

ASEAN SRI | 23
►Priority areas
►Roadmaps and action plans
►Sustainability roadmaps and plans
►Regulatory focus
Zoom roadmaps and priority areas2

ASEAN SRI | 24
Zoom2 Priority areas Trending: Sustainable responsible investment in Malaysia and the region
ASEAN sustainable capital market: roadmap and priority areas
In May 2020, the ASEAN Capital Markets Forum (ACMF) launched the Roadmap for the ASEAN Sustainable Capital Markets as part of its vision to develop an open and vibrant capital markets ecosystem which facilitates and mobilizes private sector capital in the financing of sustainable activities.
The ASEAN Roadmap outlined four priority areas including:
► Strengthening foundations► Catalyzing products and enabling access
to underserved areas► Raising awareness and capacity building► Increasing connectivity
Strengthening foundations
► Promoting corporate sustainability disclosures
► Promoting institutional investor disclosures
► Examining a common taxonomy
► Exploring transition standards
► Developing SRI fund standards
► Improving market access for sustainable products
► Developing ESG indices
► Using technology to facilitate cross-border participation in sustainable products
► Exploring incentives
Catalyzing products and enabling access to underservedareas
► Enhancing technical competence
► Promoting knowledge transfer
► Increasing public awareness
Raising awareness and capacity building
Increasing connectivity
► Developing a public database of sustainable products, projects and investors
► Leveraging multilateral and philanthropic efforts
► Coordinating efforts with public and financial sectors
Source:► Roadmap for ASEAN Sustainable Capital Markets, 2021-25, ACMF
Chart 15: Roadmap for ASEAN Sustainable Capital Markets – priority areas
1
2
3
4

ASEAN SRI | 25
Zoom2 Roadmaps and action plans Trending: Sustainable responsible investment in Malaysia and the region
ASEAN6: carbon tax regimes
ASEAN6 regulators are at the early stages of introducing carbon tax or carbon trading1
with the goal of reducing GHG emissions and achieving carbon neutrality.
While the carbon tax discourages GHG emissions, the carbon emission trading scheme allows green asset owners to trade their carbon surpluses with other entities as a country transitions to a low-carbon economy.
Chart 16: Development stages of carbon regimes1 in ASEAN6*
Singapore
► A carbon tax was implemented in January 2019 as part of the measures to reduce emissions, create green growth opportunities and transition to an energy-efficient low-carbon economy.
► Carbon tax rate: SGD5/tCO2e (valid until 2023)
► The Government plans to announce the revised carbon tax rate for 2024 in Singapore Budget 2022.
Vietnam
► The National Assembly of Vietnam (November 2020) passed the revised Law on Environmental Protection – which includes theintroduction of an emission trading scheme and carbon pricing for GHG emissions.
► The revised Law on Environmental Protection took effect on 1 January 2022.
Indonesia
► The Government plans to develop a presidential decree on the carbon exchange mechanism and pilot project for carbon trading in the energy sector.
► To impose a carbon tax in April 2022, starting with coal power plants
► A carbon tax rate: according to carbon market pricing or higher, with a floor rate of IDR30 (or US$0.21) per kilogram of CO2e
Planning stage
Malaysia
► 12th Malaysia Plan 2021-25: the Government announced plans to conduct a feasibility study on carbon pricing (including carbon tax and a carbon emission trading scheme).
► Budget 2022: a Voluntary Carbon Market initiative will be launched under Bursa Malaysia, a voluntary platform for carbon credit trading between green asset owners and other entities
► Budget 2022: Electronic vehicle (EV) incentives which will support the Low Carbon Mobility Blueprint, including the full exemption of import and excise duties and sales tax for EVs.
Thailand
► The Government is conducting a study to impose a carbon emission tax on the industrial sector, in line with the plan to reduce excise tax revenue from fossil fuels and promote EVs.
Implementation stage2
Notes:1Updates as at 24 January 2022.2The implementation stage includes countries that have announced the date the law takes effect.
*The Philippines Government has yet to announce any plans to impose a carbon tax (as of 24 January 2022). The Department of Finance stated the preference for the adoption of an intensity-based carbon emissions trading scheme over a carbon tax.
Source: EY research

ASEAN SRI | 26
Zoom2 Roadmaps and action plans Trending: Sustainable responsible investment in Malaysia and the region
ASEAN6: national development plans and policies on sustainability practices
ASEAN regulators and policymakers are developing policies and action plans toward achieving the Sustainable Development Agenda by 2030. These policies and plans include sustainable agendas/ green plans, sustainable investment, power or energy development plans and climate change adaptation or mitigation plans.
National development plans and policies MY ID PH SG TH VN
National development plan1 ✓ ✓ ✓ ✓ ✓ ✓
National action plan on sustainable agenda or green plan2 ✓ ✓ ✓ ✓ ✓
Long-term blueprint for low-carbon and climate resilience plan3 ✓ ✓
Climate change adaptation or mitigation plan4 ✓ ✓ ✓ ✓ ✓ ✓
Power or energy development plan (including RE or alternative energy)5 ✓ ✓ ✓ ✓ ✓ ✓
ESG-related or green taskforce or committee ✓ ✓ ✓ ✓ ✓ ✓
Sustainable investment and/or sustainable or green finance roadmap6 ✓ ✓ ✓ ✓ ✓
Chart 17: ASEAN6 sustainability-related roadmaps and action plans
Sources: Government official websites; EY research
Notes:1Refers to the annual development plan, mid-term plans and/or five to ten years plans. Examples of national development plans include
the 12th Malaysia Plan (MY) and the Singapore Green Plan 2030 (SG)2Examples of sustainable or green plans include the Roadmap of SDGs Indonesia towards 2030 (ID), the Environmental Sustainability in Malaysia 2020 – 2030 roadmap (MY), the Singapore Green Plan 2030 (SG), Thailand’s NDC Roadmap 2021 – 2030 (TH), the National Action Plan for the Implementation of the 2030 Agenda for Sustainable Development (VN)
3Examples of low-carbon and climate resilient plans include Indonesia’s Long-term Strategy for Low Carbon and Climate Resilience 2050 (ID LTS-LCCR 2050) and Singapore’s Long-Term Low-Emissions Development Strategy (LEDS) - Charting Singapore’s Low Carbon and Climate Resilient Future (SG)
4Examples of climate adaptation or mitigation plans include the National Climate Change Action Plan 2011-2028 (PH) and the Climate Change Master Plan 2015 – 2050 (TH)
5Examples of power or energy plans include The Philippine Energy Plan 2018-2040 (PH), the Alternative Energy Development Plan 2015-2036 (TH) and the Power Development Plan 2018-2037 (TH)
6Examples of sustainable investment or green finance roadmaps include the Sustainable Finance Roadmap Phase II, 2021 – 2025 (ID),SRI roadmap (MY), the Green Finance Action Plan (SG), a Sustainable Finance Roadmap which is incorporated into the SEC Strategic Plan 2020–2022 (TH), and the Financial Sector Action Plan on the Implementation of the National Green Growth Strategy up to 2020 (VN)

ASEAN SRI | 27
Zoom2 Sustainability, roadmaps, plans Trending: Sustainable responsible investment in Malaysia and the region
Illustration:
12th Malaysia Plan: advancing sustainability
According to the 12th Malaysia Plan, Malaysia’s development is aimed at advancing sustainability and promoting the green economy.
Among the priorities highlighted include enhancing green financing and incentives, driving investment in RE and promoting the circular economy.
Chart 18: Malaysia’s five-year sustainability plans under the 12th Malaysia Plan
Carbon emissions
► Promote the RE Certificate: enable the procurement and trading of RE
► Introduce a strategic long-term National Energy Policy: aligned with the carbon neutral aspiration
► Introduce an Act on energy-efficiency and conservation to regulate energy consumption by high intensity consumers (e.g., commercial and industrial sectors)
RE
Achieve carbon
neutrality by2050
► Develop a national adaptation plan to reduce GHG emissions
► Develop a Nationally Determined Contribution roadmap to set mitigation plans in fulfilling the Paris Agreement commitment
► Reduce hydrochlorofluorocarbon (HCFC) consumption by 67% in 2025
► Target 120 cities to achieve sustainable city status
► Adopt the green and resilient city concepts in cities, township developments and industrial estates
► Adoption of green certification tools during the construction and operational phases will be expanded (including government buildings and infrastructure projects)
Sustainable cities► Manage waste: waste separation at source, bolster the
“reduce, reuse and recycle” (3R) initiative and minimize single-use plastics (National Cleanliness Policy 2019)
► Establish integrated waste management facilities: manage different types of waste (e.g., solid waste, industrial waste and sewage)
► Develop a blueprint for the circular economy: solid waste, plastics, scheduled waste and agri-commodities
► Develop the Water Sector Transformation 2040 agenda across four phases
► Promote resource recovery from water and wastewater treatment: sludge, bio-sludge, bio-effluent and biogas
Waste and water management
► Introduce an economic model based on the green economy
► Implement the Low Carbon Mobility Blueprint action plan
► Mandatory adoption of National Green Standards
► Enhance existing green incentive schemes (i.e., Green Technology Financing Scheme (GTFS), Green Investment Tax Incentives (GITA), Green Investment Tax Exemptions (GITE)
► Introduce the Green Transport Index to promote a cleaner and sustainable transport system
► Increase the recycling rate of household waste by 40% and scheduled waste by 35%
Green economy
Source: Twelfth Malaysia Plan, Economic Planning Unit, 27 September 2021
Note: Malaysia’s Climate Change and Principle-based Taxonomy (CCPT) and the plan to introduce carbon pricing and carbon tax are complementary plans to achieve carbon neutrality by 2050.

ASEAN SRI | 28
Zoom2 Sustainability, roadmaps, plans Trending: Sustainable responsible investment in Malaysia and the region
Illustration:
Singapore Green Plan 2030
Singapore’s Green Plan 2030 aims to roll out bold and shared actions to address climate change.
In this 10-year plan, Singapore plans to enhance its commitments under the UN’s 2030 Sustainable Development Agenda and the Paris Agreement.
Chart 19: Sustainability initiatives under the Singapore Green Plan 2030
Source: Singapore Green Plan 2030
Note: The Financial Institutions Climate-related Disclosure and Charting Singapore’s Low-carbon and Climate Resilient Future documents support Singapore’s plan to halve peak emissions by 2050.
► Plant 1 million trees, ensure every household has access to parks within 10 minutes by 2030
► Develop new parks and enhance existing parks.
► Additional 1,000ha of green spaces by 2030
► Enhance green efforts in schools to reduce carbon emissions (e.g., Eco Stewardship Programme)
► Reduce waste sent to landfills by 30% by 2030
► Lower water consumption per household by 10% to 130 liters per capita per day, by 2030
► Introduce an Enterprise Sustainability Programme to assist local businesses to adopt sustainability practices
► Seek new carbon efficiency investments
► Increase local food production by establishing a 30-by-30 target by 2030, which aims to meet 30% of Singaporeans’ nutritional needs through locally produced food
► Moderate urban heat by using cool paint and increasing greenery
► Coastal and drainage flood protection measures (S$5b)
► Promote cleaner-energy vehicles, greener infrastructure buildings, sustainable towns and districts and investments in water R&D to halve the energy needed to produce desalinated water
Energy reset
City in nature
Green economy
Resilient future
Sustainable living
Halve peak
emissions by 2050

ASEAN SRI | 29
Zoom2 Regulatory focus Trending: Sustainable responsible investment in Malaysia and the region
ASEAN6: tracking ESG regulatory focus ASEAN6 regulators are encouraging companies to adopt ESG management practices in the banking and capital markets.
Vietnam► The Government issued a circular on public
disclosure for listed companies.
Thailand► SET announced the Thailand Sustainability
Investment.
► Disclosure of information on the securities market requires public listed companies to report on the environmental and social impacts annually.
ASEAN► FTSE Russell launched the FTSE4Good ASEAN 5
Index.
Singapore► SGX introduced a sustainability reporting
requirement based on a “comply or explain” basis.
2015-16
ASEAN► The ACMF launched the Green Bond Standards.
Singapore► MAS launched the Green Bond Grant Scheme.► SGX introduced a mandatory sustainability
reporting requirement for all SGX-listed issuers –effective financial year ending on 31 December 2017, or after.
Indonesia► OJK issued a regulation on the Implementation of
Sustainable Finance for Financial Services Companies, Issuers, and Public Companies which requires all listed companies to publish sustainable reports.
► OJK issued a regulation to regulate the issuance and terms of green bonds.
Malaysia► SC released Guidelines on SRI funds.► SC issued the new Malaysian Code on Corporate
Governance (MCCG 2017).
Thailand► SEC Thailand issued the Corporate Governance
Code in 2017.
Vietnam► SBV released the Green Project - Catalogue 1 which
identifies six categories of projects for green financing.
2017
ASEAN► The ACMF launched the ASEAN Social Bond
Standards (ASBS) and ASEAN Sustainability Standards (ASUS).
Indonesia► The MoF Indonesia issued a sovereign Green Bond
and Green Sukuk framework.► OJK, WWF Indonesia and eight of Indonesia’s
leading banks launched Indonesia’s Sustainable Finance Initiative (IKBI).
Malaysia► Bursa Malaysia announced the mandatory
disclosure of sustainability statements by public listed companies.
► BNM launched the Value-Based Intermediation (VBI) strategy paper and guidance documents.
Philippines► SEC Philippines approved the Guidelines on the
Issuance of Green Bonds under the ASEAN Green Bond Standards (AGBS).
Singapore► The Association of Banks in Singapore issued the
Guidelines on Responsible Financing.
Thailand► SEC Thailand introduced the green bond regulation.
Vietnam► Decree on provincial government debt management
on the issuance of municipal bonds, including municipal green bonds
► Decree on regulation on the issuance, registration, depository, listing and transaction of government debt instruments, including the introduction of green government bonds.
► Decree on regulation on the issuance of corporate bonds, including the legal framework for corporate green bonds issued.
2018
Chart 20: Key ESG regulations (policies and frameworks), ASEAN6, 2015-21

ASEAN SRI | 30
Zoom2 Regulatory focus Trending: Sustainable responsible investment in Malaysia and the region
Sources: Government official websites; EY research
Philippines► SEC Philippines issued Sustainability Reporting
Guidelines for Public Listed Companies.
► SEC Philippines issued Guidelines on the Issuance of Sustainability Bonds under the ASUS.
► SEC Philippines issued Guidelines on the Issuance of Social Bonds under the ASBS.
► The Commissioners approved the National Climate Risk Management Framework of 2019.
2019
Singapore► MAS enhanced the Green Bond Grant Scheme to the
Sustainable Bond Grant Scheme (SBGS).
Thailand► SEC Thailand adopted the ASEAN Social and
Sustainability Bond Standards.
► The Thai Bankers’ Association released the Sustainable Banking Guidelines on Responsible Lending.
Malaysia
► SC revised the SRI Sukuk Framework.
► BNM issued the Value-based Intermediation Financing and Investment Impact Assessment Framework (VBIAF) Guidance Document.
2020
Malaysia► Capital Markets Malaysia (CMM) and Global Compact
Network Malaysia jointly launched the Global Compact Network Malaysia Centre of Excellence.
► SC revised the Guidelines on the Registration of Bond Pricing Agencies.
► CMM launched the Malaysian Sustainable Finance Initiative (MSFI).
Philippines► The Asian Development Bank (ADB) issued the
ASEAN+3 Multi-currency Bond Issuance Framework Implementation Guidelines for the Philippines.
► BSP released the Sustainable Finance Framework.
Vietnam► Government issued an updated decree on corporate
bonds (including for corporate green bonds), effective 1 January 2021.
Singapore► MAS launched the Green and Sustainability-Linked
Loan Grant Scheme (GSLS), effective 1 Jan 2021.
► MAS issued the Guidelines on Environmental Risk Management for banks, insurers and asset managers.
Thailand► SEC Thailand and the Thailand Greenhouse Gas
Management Organization signed an MoU to encourage PLCs and listing companies to disclose their carbon footprints in their annual reports.
► SET Thailand launches SETLink, an online disclosure platform to assist PLCs to enhance their sustainability practices.
Malaysia► SC issued the revised MCCG 2021 which incorporates
ESG areas of focus.
► SC expanded its Green SRI Sukuk Grant Scheme and renamed it as the SRI Sukuk and Bond Grant Scheme.
► BNM issued the Climate Change and Principle-based Taxonomy .
► SC issued the five-year Capital Market Masterplan 3.
► SC released a public consultation paper on the Principles-based SRI Taxonomy.
► Establishment of a RM1b Low Carbon Transition Facility for small and medium enterprises to adopt sustainable and low-carbon practices.
► BNM issued the Climate Risk Management and Scenario Analysis exposure draft.
Singapore► MAS launched the Handbook on Implementing
Environmental Risk Management for banks, insurers and asset managers.
► GFIT issued a consultation paper on the proposed taxonomy for Singapore-based financial institutions.
► GFIT issued the Financial Institutions Climate-related Disclosure document.
► GFIT issued a white paper on Fostering Green Finance Solutions.
► SGX is accelerating its SGX FIRST sustainability agenda with the launch of new ESG derivatives.
Vietnam► SSC commissioned the guidelines on How to Issue
Green Bonds, Social Bonds and Sustainability Bonds.
2021
Indonesia► The Government of Indonesia is finalizing a Green
Taxonomy.
► OJK issued a further guidance for issuers or public companies on preparing their annual and sustainability reports.

ASEAN SRI | 31
Zoom2 Regulatory focus Trending: Sustainable responsible investment in Malaysia and the region
Source: EY research
ASEAN6 countries have joined international initiatives on sustainable finance.
ASEAN6 is aligned with international initiatives to achieve its sustainable agenda by 2030
ASEAN regulators and policymakers are taking progressive actions to align their national efforts with global initiatives on sustainability.
Key ESG-related taskforces/committees organized at the national level include:
Indonesia
► Sustainable Finance Taskforce
Malaysia
► Malaysian Green Financing Taskforce (MGFT)
► Joint Committee on Climate Change (JC3)► Malaysian Climate Change Action Council
(MyCAC)► Malaysian Sustainable Finance Initiative
(MSFI)► JC3 plans to establish a CCPT
Implementation Group
Philippines
► Inter-agency Task Force on Green Finance
Singapore
► Inter-Ministerial Committee on Climate Change
► Green Finance Industry Taskforce (GFIT)
Vietnam
► Vietnam Business Council for Sustainable Development (VBCSD)
► National Committee of Climate Change (NCCC)
► Advisory Council of the NCCC
Thailand
► A working group on Sustainable Finance► Inter-ministerial working group on
updating the NDC
Member of the Sustainable Banking Network
✓
✓
✓
✓
Indonesia
Philippines
Thailand
Vietnam
Member of the Coalition of Finance Ministers for Climate Action (Helsinki Principles)
✓ ✓
Indonesia
Philippines
✓
Malaysia
Supporter of the Task Force on Climate-related Financial Disclosures (TCFD)
✓
✓
✓
✓
Malaysia
Philippines
Singapore
Vietnam
✓ Indonesia ✓ Thailand
Member of the Network of Central Banks and Supervisors for Greening the Financing
System (NGFS)
✓
✓ ✓
✓Indonesia
Malaysia Singapore
Thailand
✓ Philippines
*Information as at 17 November 2021.

ASEAN SRI | 32
►SRI market prospects
►SRI market phase assessment
►Green business opportunities
►Green infrastructure investment
Watch ESG and SRI prospects3

ASEAN SRI | 33
Watch3 SRI market prospects Trending: Sustainable responsible investment in Malaysia and the region
ASEAN6: prospects for SRI - growth drivers
Notes:1Middle class refers to the number of people living in households earning or spending between US$10 and US$100 per person per day(2005 PPP US$). Data retrieved from the Development, Aid and Governance Indicators (DAGI), Brookings on 19 November 2021.
2The total ASEAN6 population data is retrieved from the United Nations, Department of Economic and Social Affairs, Population Division (2018) on 19 November 2021.
3ASEAN sustainability indices refer to the Indonesia SRI-KEHATI Index, Malaysia’s FTSE4Good Bursa Malaysia Index, Singapore’s ESGLeaders Index and ESG Transparency Index, and the SET Thailand Sustainability Index (SETTHSI).
The COVID-19 pandemic has created opportunities for the ASEAN6 countries to build greener and more sustainable economies. Resolute efforts by the ASEAN6 countries to step up on ESG policies and formulate action plans are encouraging the development of conducive green-focused ecosystems.
Guided by ESG, sustainability roadmaps and policies, and keeping up with consumer trends, the far-sighted corporates and investors in the ASEAN6 markets have already begun reshaping their strategies to seize new investment opportunities in sustainable businesses and practices.
Investors are increasing their focus on corporates with leading ESG practices
The recent exponential surge in ASEAN green, social and sustainable bonds demonstrate investors’ increasing interest in financing projects with environmental and social benefits. ASEAN sustainability indices3 provide investors with transparency to gauge the sustainability performance of listed companies with ESG practices.
Consumer behaviors are driving ESG and sustainability practices
Global and regional consumer surveys highlight increasing consumer awareness on the impact of climate change and their trending preference to support and work for companies that care about and act on ESG issues.
With the rising middle-class1 population in ASEAN6, from 33% of the total population2 in 2020 to the projected 50% by 2030, the adoption of ESG practices and SRI investments are likely to see a positive growth trajectory.
ASEAN6 SRI
prospects
ASEAN6 regulators are progressing alignment with global policy developments on ESG and sustainability
ASEAN6 policymakers and regulators are formulating national roadmaps, blueprints, policies and action plans anchored on sustainability, climate change and low-carbon to catalyze sustainability initiatives among local businesses.
ASEAN6 bourses have also issued sustainability reporting guidelines to complement the financial reporting for public-listed companies.
ASEAN corporates are moving into long-term ESG value propositions
ASEAN corporates are developing ESG propositions to create long-term value. By setting agile strategies and developing competencies to navigate a fast-evolving landscape that is ESG-focused, businesses can better compete and stand out.
For ASEAN businesses, a commitment to ESG would also involve transitioning to low-carbon measures, such as embracing RE sources or adopting initiatives to reduce GHG emissions. In terms of the social agenda, businesses could enhance efforts to reduce social and gender inequalities.
Chart 21: ASEAN6 SRI growth drivers

ASEAN SRI | 34
Watch3 SRI market phase assessments Trending: Sustainable responsible investment in Malaysia and the region
Early stage Intermediate stage Advanced stage
Notes:► Policies to mainstream sustainable finance aim to measure the general efforts of the ASEAN countries’ governments in developing and
mainstreaming sustainable finance.► Green taxonomy, sustainability risk management and sustainability disclosure aim to assess the extent of policy and regulatory actions
in relation to specific sustainability finance themes.► The sustainability debt market and sustainability index aim to evaluate the progress in the deployment of sustainable finance.
Source: EY research
The maturity of the SRI market in the ASEAN6 countries varies depending on the stage of the economic development of each country.
ESG and sustainability development policies and initiatives have been introduced to support the development of the SRI market.
Malaysia Indonesia Philippines Singapore Thailand Vietnam
VN
Sustainability disclosure
Sustainability risk management
Policies to mainstream
sustainable finance
Sustainable debt market
Sustainability index
Green definition/ taxonomy
PH
MY
MY PH SG
IDMY SG TH
MY SG THIDVN
ID TH VN
ASEAN6: assessing the SRI market phase
TH SGID PH VN
IDMY PH THSG
PH VN
VN
Chart 22: ASEAN6 state of SRI market development – broad assessment
IDMY PH THSG

ASEAN SRI | 35
Potential US$1t of business opportunities from ASEAN’s low-carbon economy
Chart 23: ASEAN6 sectors – green schemes and green investment policies
Sources:► Southeast Asia’s Green Economy: Pathway to Full Potential, Bain & Company, 25 November 2020► Regional Study on Green Jobs Policy Readiness in ASEAN 2021, ASEAN and International Labour Organization
Notes:1 Agriculture: R&D and technologies to optimize waste production, improve smart farming, ensure food and product safety, as well as to
develop high-value food products2 Construction: green buildings that adopt energy-efficient equipment and achieve environmental sustainability standards3 Energy and industry: develop and empower the usage of RE and energy efficiency4 Forestry, peatlands, marine resource: reduce emissions from deforestation and forest degradation through sustainable management
and the protection and enhancement of carbon stocks; reduce marine debris, monitor and map marine waste5 Medical services: intensive capacity building in technology and human capital in R&D and production technology for vaccines,
biopharmaceuticals and medical devices as well as clinical research and product registration of pharmaceuticals and medical devices6 Transport and public utilities: invest and catalyze investments in EVs, build efficient and accessible rail and bus networks, smart
transport options, the usage of biofuel and biogas 7 Tourism: support sustainable tourism standard system and conserve and rehabilitate the environment8 Urban and regional development: improve housing development9 Waste: reduce waste, improve waste treatment and move toward becoming a zero waste nation
Sectors MY ID PH SG TH VN
Agriculture1 ✓ ✓ ✓ ✓
Construction2 ✓ ✓
Energy and Industry3 ✓ ✓ ✓ ✓ ✓
Forestry, peatland and marine resources4 ✓ ✓
Medical services5 ✓
Transport and public utilities6 ✓ ✓ ✓
Tourism7 ✓
Urban and regional development8 ✓
Waste9 ✓ ✓ ✓ ✓
By 2030, ASEAN’s low-carbon economy may potentially provide annual business opportunities valued at US$1t. Key growth sectors include:
► Sustainable energy and resources (US$270b)► Sustainable and healthy food systems (US$205b)► Efficient industries and logistics (US$200b)► Green and connected cities (US$185b)
Watch3 Green business opportunities Trending: Sustainable responsible investment in Malaysia and the region

ASEAN SRI | 36
Note: The ACGF is owned by the finance ministries of the 10 ASEAN member countries and ADB. Co-financing partners include ADB, Agence Française de Développement, AIF, the European Investment Bank, the EU, KfW, and the Republic of Korea.
Sources:• Partners Pledge US $665 Million to Support Green Recovery in ASEAN, ADB, 2 November 2021• ASEAN Catalytic Green Finance Facility 2019–2020: Accelerating Green Finance in Southeast Asia, ADB, January 2021
De-risking and financing green infrastructure
Enabling green infrastructure
Leveraging resources and partnerships
► US$1.4b in total project costs
► US$823m in financing from ADB
► US$410m partner resources leveraged
► US$278m in private capital to be mobilized for ACGF projects
► US$40m AIF funding committed toward ACGF-eligible projects
► Reduction of 73,000 tons of CO2 per year expected from ACGF projects
► 22 projects to provide technical assistance during training events and international investor roundtables on green financing
► US$1.4b pledged in co-financing from partners
► US$7.5m in technical assistance pledged
► Six co-financing partnerships established
Chart 24: Selected green investment projects financed by ACGF
In April 2019, the ASEAN Infrastructure Fund (AIF) introduced the ASEAN Catalytic Green Finance Facility (ACGF) to accelerate green infrastructure investment in ASEAN.
The ACGF green financing initiative focuses on developing and supporting climate-positive and environmentally sustainable infrastructure projects.
Accelerating ASEAN green infrastructure investments
The eligibility criteria to apply for ACGF financing include having:
► Clear environmental goals and targets► A financial sustainability plan► A roadmap for attracting private
capital investment
Green infrastructure projects include RE, energy-efficiency solutions, sustainable urban transport, water supply and sanitation, waste management and climate-resilient agriculture.
COP26 in Glasgow:
The UK Government, Italian state lender CassaDepositi e Prestiti (CDP), the European Union, and the Green Climate Fund (GCF) have pledged their commitment to contribute US$665m to support the ACGF’s ASEAN Green Recovery Platform for low-carbon and climate-resilient infrastructure projects in ASEAN and accelerate COVID-19 pandemic recovery in the region.
Did you know?
Watch3 Green infrastructure investments Trending: Sustainable responsible investment in Malaysia and the region
ASEAN SRI | 37
Watch3 Green infrastructure investment Trending: Sustainable responsible investment in Malaysia and the region
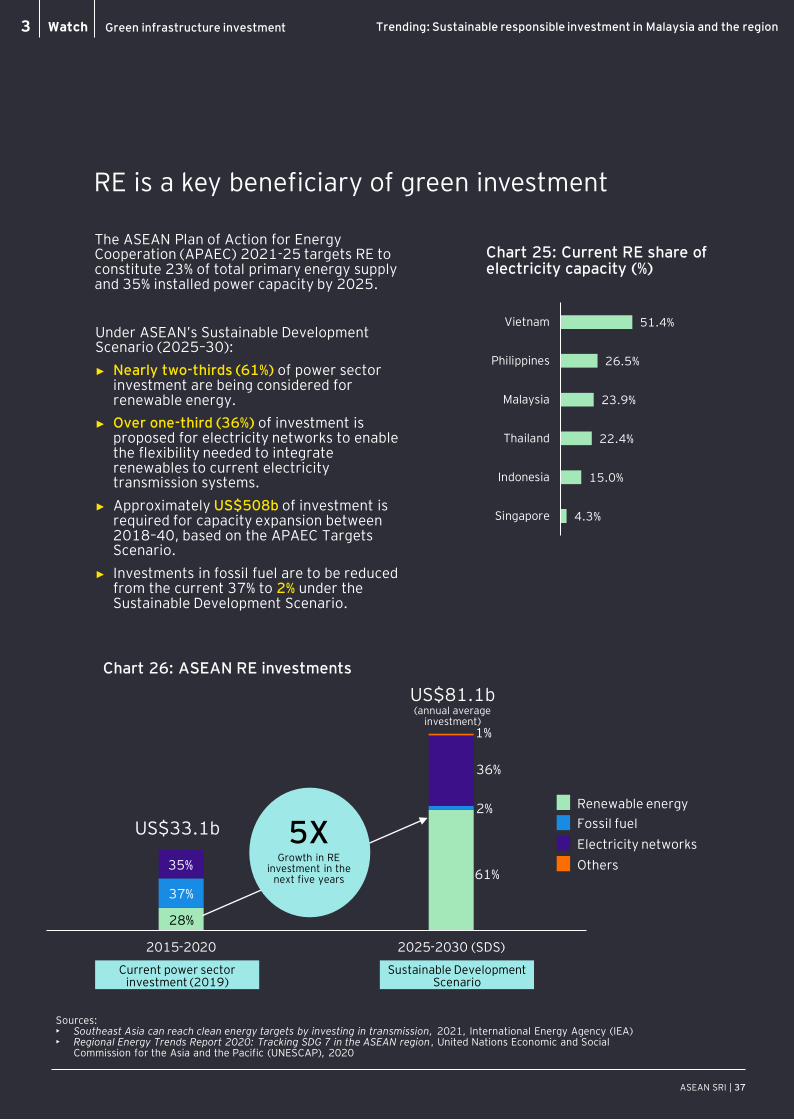
RE is a key beneficiary of green investment
The ASEAN Plan of Action for Energy Cooperation (APAEC) 2021-25 targets RE to constitute 23% of total primary energy supply and 35% installed power capacity by 2025.
Under ASEAN’s Sustainable Development Scenario (2025–30):
► Nearly two-thirds (61%) of power sector investment are being considered for renewable energy.
► Over one-third (36%) of investment is proposed for electricity networks to enable the flexibility needed to integrate renewables to current electricity transmission systems.
► Approximately US$508b of investment is required for capacity expansion between 2018–40, based on the APAEC Targets Scenario.
► Investments in fossil fuel are to be reduced from the current 37% to 2% under the Sustainable Development Scenario.
51.4%
26.5%
23.9%
22.4%
15.0%
4.3%
Vietnam
Philippines
Malaysia
Thailand
Indonesia
Singapore
Chart 25: Current RE share of electricity capacity (%)
Sources:• Southeast Asia can reach clean energy targets by investing in transmission, 2021, International Energy Agency (IEA)• Regional Energy Trends Report 2020: Tracking SDG 7 in the ASEAN region, United Nations Economic and Social
Commission for the Asia and the Pacific (UNESCAP), 2020
Chart 26: ASEAN RE investments
2015-2020 2025-2030 (SDS)
28%
37%
35%61%
2%
36%
1%
US$33.1b
Sustainable Development Scenario
Current power sector investment (2019)
US$81.1b(annual average
investment)
Growth in RE investment in the
next five years
5XOthers
Electricity networks
Fossil fuel
Renewable energy

ASEAN SRI | 38
►Country profiles
► Industry glossary, research sources and charts
► Industry contacts
►EY contacts
References4
ASEAN SRI | 39
References4 Country profiles
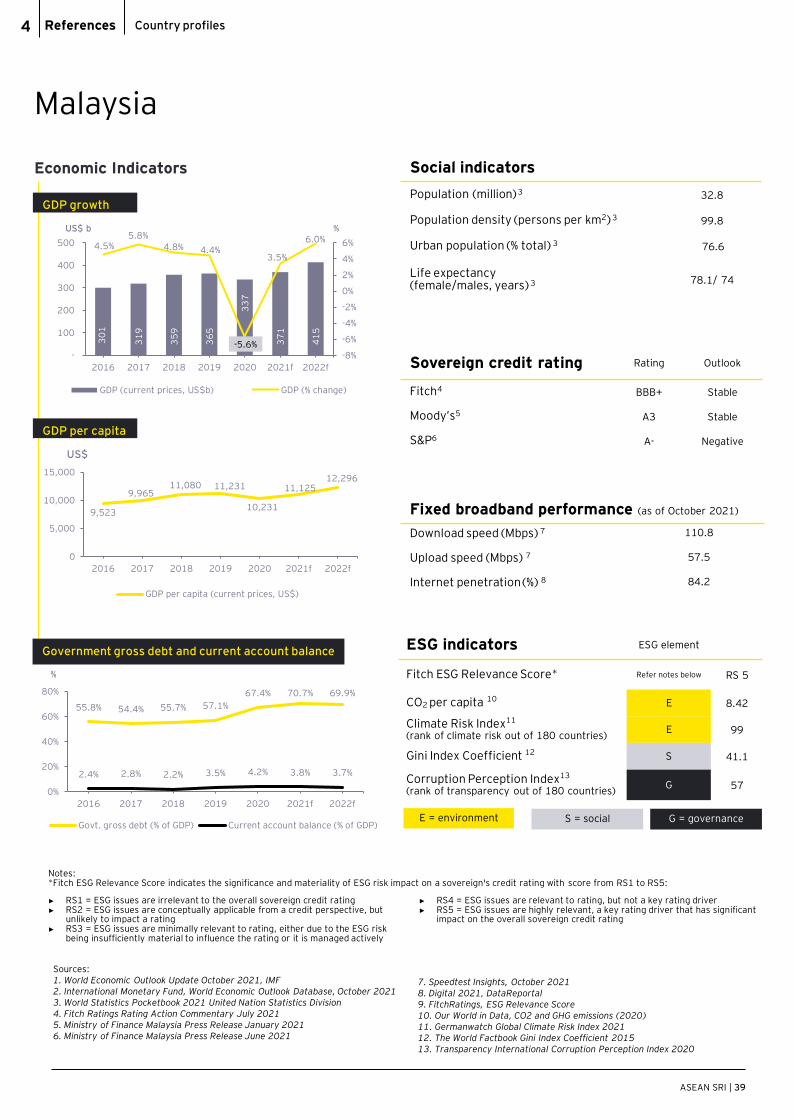
Malaysia
Fixed broadband performance (as of October 2021)
Download speed (Mbps) 7 110.8
Upload speed (Mbps) 7 57.5
Internet penetration(%) 8 84.2
Sovereign credit rating Rating Outlook
Fitch4 BBB+ Stable
Moody’s5 A3 Stable
S&P6 A- Negative
ESG indicators ESG element
Fitch ESG Relevance Score* Refer notes below RS 5
CO2 per capita 10 E 8.42
Climate Risk Index11
(rank of climate risk out of 180 countries)E 99
Gini Index Coefficient 12 S 41.1
Corruption Perception Index13
(rank of transparency out of 180 countries)G 57
Social indicators
Population (million)3 32.8
Population density (persons per km2) 3 99.8
Urban population (% total) 3 76.6
Life expectancy(female/males, years) 3 78.1/ 74
E = environment S = social G = governance
GDP growth
GDP per capita
Government gross debt and current account balance
30
1
31
9
35
9
36
5
33
7
37
1
41
5
4.5%5.8%
4.8% 4.4%
-5.6%
3.5%
6.0%
-8%
-6%
-4%
-2%
0%
2%
4%
6%
-
100
200
300
400
500
2016 2017 2018 2019 2020 2021f 2022f
GDP (current prices, US$b) GDP (% change)
US$ b %
9,523
9,965 11,080 11,231
10,231
11,125 12,296
0
5,000
10,000
15,000
2016 2017 2018 2019 2020 2021f 2022f
GDP per capita (current prices, US$)
US$
55.8% 54.4% 55.7% 57.1%
67.4% 70.7% 69.9%
2.4% 2.8% 2.2% 3.5% 4.2% 3.8% 3.7%
0%
20%
40%
60%
80%
2016 2017 2018 2019 2020 2021f 2022f
Govt. gross debt (% of GDP) Current account balance (% of GDP)
%
Sources: 1. World Economic Outlook Update October 2021, IMF2. International Monetary Fund, World Economic Outlook Database, October 20213. World Statistics Pocketbook 2021 United Nation Statistics Division4. Fitch Ratings Rating Action Commentary July 20215. Ministry of Finance Malaysia Press Release January 20216. Ministry of Finance Malaysia Press Release June 2021
7. Speedtest Insights, October 20218. Digital 2021, DataReportal9. FitchRatings, ESG Relevance Score10. Our World in Data, CO2 and GHG emissions (2020) 11. Germanwatch Global Climate Risk Index 202112. The World Factbook Gini Index Coefficient 201513. Transparency International Corruption Perception Index 2020
Economic Indicators
► RS1 = ESG issues are irrelevant to the overall sovereign credit rating► RS2 = ESG issues are conceptually applicable from a credit perspective, but
unlikely to impact a rating► RS3 = ESG issues are minimally relevant to rating, either due to the ESG risk
being insufficiently material to influence the rating or it is managed actively
► RS4 = ESG issues are relevant to rating, but not a key rating driver► RS5 = ESG issues are highly relevant, a key rating driver that has significant
impact on the overall sovereign credit rating
Notes:*Fitch ESG Relevance Score indicates the significance and materiality of ESG risk impact on a sovereign's credit rating with score from RS1 to RS5:

ASEAN SRI | 40
References4 Country profiles
Indonesia
Fixed broadband performance (as of October 2021)
Download speed (Mbps) 7 29.6
Upload speed (Mbps) 7 18.2
Internet penetration(%) 8 73.7
Sovereign credit rating Rating Outlook
Fitch4 BBB Stable
Moody’s5 Baa2 Stable
S&P6 BBB Negative
Sources: 1. World Economic Outlook Update October 2021, IMF2. International Monetary Fund, World Economic Outlook Database, October 20213. World Statistics Pocketbook 2021 United Nation Statistics Division4. Bank Indonesia – Fitch Ratings March 20215. Moody’s Credit Rating, Credit Opinion July 20216. Bank Indonesia - S&P Global Rating Research Update April 2021
7. Speedtest Insights, October 20218. Digital 2021, DataReportal9. FitchRatings, ESG Relevance Score10. Our World in Data, CO2 and GHG emissions (2020) 11. Germanwatch Global Climate Risk Index 202112. The World Factbook Gini Index Coefficient, 201913. Transparency International Corruption Perception Index 2020
ESG indicators ESG element
Fitch ESG Relevance Score* Refer notes below RS 5
CO2 per capita 10 E 2.16
Climate Risk Index11
(rank of climate risk out of 180 countries)E 14
Gini Index Coefficient 12 S 38.2
Corruption Perception Index13
(rank of transparency out of 180 countries)G 102
Social indicators
Population (million)3 276.3
Population density (persons per km2) 3 152.6
Urban population (% total) 3 56.0
Life expectancy3
(female/males, years)73.6 / 69.3
93
2
1,0
16
1,0
43
1,1
20
1,0
60
1,1
50
1,2
47
5.0% 5.1% 5.2% 5.0%
-2.1%
3.2%
5.9%
-4%
-2%
0%
2%
4%
6%
800
900
1,000
1,100
1,200
1,300
2016 2017 2018 2019 2020 2021f 2022f
GDP (current prices, US$b) GDP (% change)
US$ b %
3,606
3,886 3,947 4,196
3,922
4,225
4,538
3,000
3,500
4,000
4,500
5,000
2016 2017 2018 2019 2020 2021f 2022f
GDP per capita (current prices, US$)
US$
28.0% 29.4% 30.4% 30.6%36.6%
41.4% 43.3%
-1.8% -1.6% -2.9% -2.7% -0.4% -0.3% -1.0%
-20%
0%
20%
40%
60%
2016 2017 2018 2019 2020 2021f 2022f
Govt. gross debt (% of GDP) Current account balance (% of GDP)
%
E = environment S = social G = governance
GDP growth
GDP per capita
Government gross debt and current account balance
Economic Indicators
► RS1 = ESG issues are irrelevant to the overall sovereign credit rating► RS2 = ESG issues are conceptually applicable from a credit perspective, but
unlikely to impact a rating► RS3 = ESG issues are minimally relevant to rating, either due to the ESG risk
being insufficiently material to influence the rating or it is managed actively
► RS4 = ESG issues are relevant to rating, but not a key rating driver► RS5 = ESG issues are highly relevant, a key rating driver that has significant
impact on the overall sovereign credit rating
Notes:*Fitch ESG Relevance Score indicates the significance and materiality of ESG risk impact on a sovereign's credit rating with score from RS1 to RS5:

ASEAN SRI | 41
References4 Country profiles
Philippines
Fixed broadband performance (as of October 2021)
Download speed (Mbps) 7 71.1
Upload speed (Mbps) 7 69.8
Internet penetration(%) 8 67.0
Sovereign credit rating Rating Outlook
Fitch4 BBB Negative
Moody’s5 Baa2 Stable
S&P6 BBB+ Stable
ESG indicators ESG element
Fitch ESG Relevance Score* Refer notes below RS 5
CO2 per capita 10E 1.24
Climate Risk Index11
(rank of climate risk out of 180 countries)E 17
Gini Index Coefficient 12S 42.3
Corruption Perception Index13
(rank of transparency out of 180 countries)G 115
Social indicators
Population (million)3 111.0
Population density (persons per km2) 3 372.4
Urban population (% total) 3 47.1
Life expectancy(female/males, years) 3 75.3 /67.1
E = environment S = social G = governance
GDP growth
GDP per capita
Government gross debt and current account balance
31
9
32
9
34
7
37
7
36
2
38
6
40
6
7.1% 6.9% 6.3% 6.1%
-9.6%
3.2%6.3%
-15.0%
-10.0%
-5.0%
0.0%
5.0%
10.0%
-
100
200
300
400
500
2016 2017 2018 2019 2020 2021f 2022f
GDP (current prices, US$b) GDP (% change)
US$ b %
3,108 3,153
3,280
3,512
3,323
3,492
3,621
3,000
3,200
3,400
3,600
3,800
2016 2017 2018 2019 2020 2021f 2022f
GDP per capita (current prices, US$)
US$
37.3% 38.1% 37.1% 37.0%
51.7%59.1% 62.3%
-0.4% -0.7% -2.6% -0.8%3.6% 0.4% -1.8%
-20%
0%
20%
40%
60%
80%
2016 2017 2018 2019 2020 2021f 2022f
Govt. gross debt (% of GDP) Current account balance (% of GDP)
%
Sources: 1. World Economic Outlook Update October 2021, IMF2. International Monetary Fund, World Economic Outlook Database, October 20213. World Statistics Pocketbook 2021 United Nation Statistics Division4. Fitch Ratings Rating Action Commentary July 20215. Moody’s Rating Action April 20216. S&P Credit Rating May 2021
7. Speedtest Insights,October 20218. Digital 2021, DataReportal9. FitchRatings, ESG Relevance Score10. Our World in Data CO211. Germanwatch Global Climate Risk Index 202112. The World Factbook Gini Index Coefficient, 201813. Transparency International Corruption Perception Index 2020
Economic Indicators
► RS1 = ESG issues are irrelevant to the overall sovereign credit rating► RS2 = ESG issues are conceptually applicable from a credit perspective, but
unlikely to impact a rating► RS3 = ESG issues are minimally relevant to rating, either due to the ESG risk
being insufficiently material to influence the rating or it is managed actively
► RS4 = ESG issues are relevant to rating, but not a key rating driver► RS5 = ESG issues are highly relevant, a key rating driver that has significant
impact on the overall sovereign credit rating
Notes:*Fitch ESG Relevance Score indicates the significance and materiality of ESG risk impact on a sovereign's credit rating with score from RS1 to RS5:

ASEAN SRI | 42
References4 Country profiles
Singapore
Fixed broadband performance (as of October 2021)
Download speed (Mbps) 7 257.2
Upload speed (Mbps) 7 247.2
Internet penetration(%) 8 90.0
Sovereign credit rating Rating Outlook
Fitch4 AAA Stable
Moody’s5 Aaa Stable
S&P6 AAA Stable
ESG indicators ESG element
Fitch ESG Relevance Score* Refer notes below RS 5
CO2 per capita 10E 7.78
Climate Risk Index11
(rank of climate risk out of 180 countries)E 130
Gini Index Coefficient 12S 45.9
Corruption Perception Index13
(rank of transparency out of 180 countries)G 3
Social indicators
Population (million)3 5.9
Population density (persons per km2) 3 8,423.8
Urban population (% total) 3 100
Life expectancy(female/males, years) 3 85.5/ 81.2
E = environment S = social G = governance
GDP growth
GDP per capita
Government gross debt and current account balance
31
9
34
3
37
6
37
4
34
0
37
9
39
7
3.3%4.5% 3.5%
1.3%
-5.4%
6.0% 3.2%
-6.0%
-4.0%
-2.0%
0.0%
2.0%
4.0%
6.0%
8.0%
-
100
200
300
400
500
2016 2017 2018 2019 2020 2021f 2022f
GDP (current prices, US$b) GDP (% change)
US$ b %
56,846
61,175 66,676
65,641 59,795
66,263 69,129
0
20,000
40,000
60,000
80,000
2016 2017 2018 2019 2020 2021f 2022f
GDP per capita (current prices, US$)
US$
106.5% 107.8% 109.8%129.0%
154.9%137.9% 139.0%
17.6% 17.3% 15.4% 14.3% 17.6% 15.9% 15.7%
0%
50%
100%
150%
200%
2016 2017 2018 2019 2020 2021f 2022f
Govt. gross debt (% of GDP) Current account balance (% of GDP)
%
Sources: 1. World Economic Outlook Update October 2021, IMF2. International Monetary Fund, World Economic Outlook Database, October 20213. World Statistics Pocketbook 2021 United Nation Statistics Division4. Fitch Ratings Action Commentary August 20215. Moody’s Rating Action September 20206. S&P Global Rating Mid Year 2021
7. Speedtest Insights, October 20218. Digital 2021, DataReportal9. FitchRatings, ESG Relevance Score10. Our World in Data Co211. Germanwatch Global Climate Risk Index 202112. Key Household Income Trends 2020, Department of Statistics Singapore,
February 2021 (conversion by multiplying 100)13. Transparency International Corruption Perception Index 2020
Economic Indicators
► RS1 = ESG issues are irrelevant to the overall sovereign credit rating► RS2 = ESG issues are conceptually applicable from a credit perspective, but
unlikely to impact a rating► RS3 = ESG issues are minimally relevant to rating, either due to the ESG risk
being insufficiently material to influence the rating or it is managed actively
► RS4 = ESG issues are relevant to rating, but not a key rating driver► RS5 = ESG issues are highly relevant, a key rating driver that has significant
impact on the overall sovereign credit rating
Notes:*Fitch ESG Relevance Score indicates the significance and materiality of ESG risk impact on a sovereign's credit rating with score from RS1 to RS5:

ASEAN SRI | 43
References4 Country profiles
Thailand
Fixed broadband performance (as of October 2021)
Download speed (Mbps) 7 223.7
Upload speed (Mbps) 7 174.1
Internet penetration(%) 8 69.5
Sovereign credit rating Rating Outlook
Fitch4 BBB+ Stable
Moody’s5 Baa1 Stable
S&P6 BBB+ Stable
ESG indicators ESG element
Fitch ESG Relevance Score* Refer notes below RS 5
CO2 per capita 10E 3.69
Climate Risk Index11
(rank of climate risk out of 180 countries)E 34
Gini Index Coefficient 12S 34.9
Corruption Perception Index13
(rank of transparency out of 180 countries)G 104
Social indicators
Population (million)3 69.9
Population density (persons per km2) 3 136.9
Urban population (% total) 3 50.7
Life expectancy(female/males, years) 3 80.6/73.1
Economic Indicators
E = environment S = social G = governance
GDP growth
GDP per capita
Government gross debt and current account balance
41
4
45
7
50
6
54
4
50
2
54
6
58
6
3.4%4.2% 4.2%
2.3%
-6.1%
1.0%4.5%
-8.0%
-6.0%
-4.0%
-2.0%
0.0%
2.0%
4.0%
6.0%
-
100
200
300
400
500
600
700
2016 2017 2018 2019 2020 2021f 2022f
GDP (current prices, US$b) GDP (% change)
US$ b %
5,995
6,596 7,294 7,815
7,188
7,809 8,356
0
2,000
4,000
6,000
8,000
10,000
2016 2017 2018 2019 2020 2021f 2022f
GDP per capita (current prices, US$)
US$
41.7% 41.8% 42.0% 41.0%49.6%
58.0% 59.5%
10.5% 9.6% 5.6% 7.0% 3.5% -0.5% 2.1%
-20%
0%
20%
40%
60%
80%
2016 2017 2018 2019 2020 2021f 2022f
Govt. gross debt (% of GDP) Current account balance (% of GDP)
%
Sources: 1. World Economic Outlook Update October 2021, IMF2. International Monetary Fund, World Economic Outlook Database, October 20213. World Statistics Pocketbook 2021 United Nation Statistics Division4. Fitch Ratings Action Commentary August 20215. Moody’s Rating Action September 20206. S&P Global Rating Mid Year 2021
7. Speedtest Insights, October 20218. Digital 2021, DataReportal9. FitchRatings, ESG Relevance Score10. Our World in Data CO211. Germanwatch Global Climate Risk Index 202112. The World Factbook Gini Index Coefficient, 201913. Transparency International Corruption Perception Index 2020
► RS1 = ESG issues are irrelevant to the overall sovereign credit rating► RS2 = ESG issues are conceptually applicable from a credit perspective, but
unlikely to impact a rating► RS3 = ESG issues are minimally relevant to rating, either due to the ESG risk
being insufficiently material to influence the rating or it is managed actively
► RS4 = ESG issues are relevant to rating, but not a key rating driver► RS5 = ESG issues are highly relevant, a key rating driver that has significant
impact on the overall sovereign credit rating
Notes:*Fitch ESG Relevance Score indicates the significance and materiality of ESG risk impact on a sovereign's credit rating with score from RS1 to RS5:

ASEAN SRI | 44
References4 Country profiles
Vietnam
Fixed broadband performance (as of October 2021)
Download speed (Mbps) 7 84.1
Upload speed (Mbps) 7 74.4
Internet penetration(%) 8 70.3
Sovereign credit rating Rating Outlook
Fitch4 BB Positive
Moody’s5 Ba3 Positive
S&P6 BB Positive
ESG indicators ESG element
Fitch ESG Relevance Score* Refer notes below RS 5
CO2 per capita 10E 2.61
Climate Risk Index11
(rank of climate risk out of 180 countries)E 38
Gini Index Coefficient 12S 35.7
Corruption Perception Index13
(rank of transparency out of 180 countries)G 104
Social indicators
Population (million)3 98.2
Population density (persons per km2) 3 316.6
Urban population (% total) 3 36.6
Life expectancy(female/males, years) 3 79.4/71.2
Economic Indicators
E = environment S = social G = governance
GDP growth
GDP per capita
Government gross debt and current account balance
25
2
27
7
30
3
32
8
34
3
36
8
41
6
6.7% 6.9% 7.2% 7.2%
2.9%3.8%
6.6%
0.0%
2.0%
4.0%
6.0%
8.0%
-
100
200
300
400
500
2016 2017 2018 2019 2020 2021f 2022f
GDP (current prices, US$b) GDP (% change)
US$ b %
2,720
2,958 3,202 3,398 3,523 3,743
4,188
0
1,000
2,000
3,000
4,000
5,000
2016 2017 2018 2019 2020 2021f 2022f
GDP per capita (current prices, US$)
US$
47.6% 46.3% 43.7% 43.6% 46.3% 47.9% 47.8%
0.2% -0.6% 1.9% 3.8% 3.7% 1.8% 3.2%
-20%
0%
20%
40%
60%
2016 2017 2018 2019 2020 2021f 2022f
Govt. gross debt (% of GDP) Current account balance (% of GDP)
%
Sources: 1. World Economic Outlook Update October 2021, IMF2. International Monetary Fund, World Economic Outlook Database, October 20213. World Statistics Pocketbook 2021 United Nation Statistics Division4. Fitch Rating June 20215. Moody’s Rating Action January 20216. S&P Credit Rating April 2020
7. Speedtest Insights, October 20218. Digital 2021, DataReportal9. FitchRatings, ESG Relevance Score10. Our World in Data CO211. Germanwatch Global Climate Risk Index 202112. The World Factbook Gini Index Coefficient, 201813. Transparency International Corruption Perception Index 2020
► RS1 = ESG issues are irrelevant to the overall sovereign credit rating► RS2 = ESG issues are conceptually applicable from a credit perspective, but
unlikely to impact a rating► RS3 = ESG issues are minimally relevant to rating, either due to the ESG risk
being insufficiently material to influence the rating or it is managed actively
► RS4 = ESG issues are relevant to rating, but not a key rating driver► RS5 = ESG issues are highly relevant, a key rating driver that has significant
impact on the overall sovereign credit rating
Notes:*Fitch ESG Relevance Score indicates the significance and materiality of ESG risk impact on a sovereign's credit rating with score from RS1 to RS5:

ASEAN SRI | 45
References4 Glossary
Abbreviation Definition
3RACGFACMFADBAGBSAIFAPAECASBSASUSAUMBNMBSPCABIS
CBICBSCCPT
CDSBCH4
CMMCO2
COP26
ESGEUEVGBPGFITGHGGRIGSIAGSLS
HCFCHFCHNXHOSEICMICMAIDIDXi-ETFIIRCIKBIi-REITJC3JETROLCYLEDS
LTS-LCCR 2050MASMCCGMGFTMSFIMYMyCAC
Reduce, reuse and recycle ASEAN Catalytic Green Finance FacilityASEAN Capital Markets ForumAsian Development Bank ASEAN Green Bond StandardsASEAN Infrastructure FundASEAN Plan of Action for Energy CooperationAsean Social Bond Standards Asean Sustainability Bond Standards Assets under managementBank Negara Malaysia Bangko Sentral ng Pilipinas China-ASEAN Business and Investment Summit Climate Bonds InitiativeClimate Bonds Standard Climate Change and Principles-Based TaxonomyClimate Disclosure Standards Board MethaneCapital Markets MalaysiaCarbon dioxide 2021 United Nations Climate Change ConferenceEnvironmental, social and governanceEuropean UnionElectric vehicleGreen Bond Principles Green Finance Industry Taskforce Greenhouse gasGlobal Reporting Initiative Global Sustainable Investment AllianceGreen and Sustainability-Linked Loan Grant SchemeHydrochlorofluorocarbonHydrofluorocarbonHanoi Stock ExchangeHo Chi Minh Stock ExchangeIslamic capital market International Capital Market Association IndonesiaIndonesia Stock ExchangeIslamic Exchange Traded FundInternational Integrated Reporting CouncilIndonesia Sustainable Finance InitiativeIslamic Real Estate Investment Trust Joint Committee on Climate Change Japanese External Trade Organization Local currencyLong-Term Low-Emissions Development Strategy (Singapore)Long-term Strategy for Low Carbon and Climate Resilience 2050 (Indonesia)Monetary Authority of Singapore Malaysian Code on Corporate GovernanceMalaysian Green Financing TaskforceMalaysian Sustainable Finance InitiativeMalaysiaMalaysian Climate Change Action Council
Nitrous oxide Net asset value National Committee on Climate ChangeNationally determined contributionNitrogen trifluoride Network of Central Banks and Supervisors for Greening the Financing SystemOrganisation for Economic Co-operation and DevelopmentFinancial Services Authority of Indonesia PerfluorocarbonPhilippinesPublic listed companyPrinciples for Responsible InvestmentPhilippine Stock ExchangePT Sarana Multi Infrastruktur (Persero) Renewable energySustainability Accounting Standards Board Sustainability Bond Guidelines Sustainable Bond Grant Scheme State Bank of Vietnam Securities Commission Malaysia Sustainable Development GoalSecurities and Exchange Commission, ThailandStock Exchange of Thailand SET Thailand Sustainability Index Sulphur hexafluorideSingaporeSingapore ExchangeSustainable Investment PlatformSustainability-Linked Bond Principles Sustainable responsible investmentState Securities Commission of VietnamSustainable Stock ExchangesTask Force on Climate-Related Financial Disclosures ThailandThailand Sustainability InvestmentUnited Nations Conference on Trade and Development United Nations Framework Convention on Climate ChangeVietnam Business Council for Sustainable Development Value-Based IntermediationValue-based Intermediation Financing and Investment Impact Assessment Framework Guidance DocumentVietnamVietnam Sustainability Index
Abbreviation Definition
N2ONAVNCCCNDCNF3
NGFS
OECD
OJKPFCPHPLCPRIPSEPT SMIRESASBSBGSBGSSBVSCSDGSEC THSETSETTHSISF6
SGSGXSIPSLBPSRISSCSSETCFDTHTHSIUNCTAD
UNFCCC
VBCSD
VBIVBIAF
VNVNSI
Industry glossary
ASEAN SRI | 46
References4 Research sources
The information sources referenced in this publication are derived from online resources as well as various local and international publications, research papers and statistical bulletins.
1. 2020 JETRO Survey on Business Conditions of Japanese Companies Operating Overseas (Asia and Oceania), Japanese External Trade Organization (JETRO), December 2020
2. 2021 ASEAN Business Outlook Survey: ASEAN’s role in the Asia-Pacific, The American Chamber of Commerce in Singapore, March 2021
3. ASEAN Capital Markets Forum official website4. ASEAN Catalytic Green Finance Facility 2019–
2020: Accelerating Green Finance in Southeast Asia, ADB, January 2021
5. ASEAN Sustainable Finance, State of the Market 2020, Climate Bond Initiatives
6. Asia Bond Monitor March 2021, Asia Bond Online, March 2021
7. Asian Bond Online official website8. Australia Business in ASEAN Survey 2021,
Australia-ASEAN Chamber of Commerce, August 2021
9. Bangko Sentral ng Pilipinas (BSP) official website10. Bank Indonesia – Fitch Ratings March 202111. Bank Indonesia - S&P Global Rating Research
Update April 2021 12. Bank Negara Malaysia official website13. Bursa Malaysia official website14. Development, Aid and Governance Indicators
(DAGI), Brookings15. Digital 2021, DataReportal16. ESG Investing: Practices, Progress and
Challenges 2020, Boffo, R., and R. Patalano, OECD Paris
17. EU-ASEAN Business Sentiment Survey, EU-ASEAN Business Council, 2019-2020
18. Financial Services Authority of Indonesia (OJK) official website
19. Financing for Sustainable Development Report 2020, United Nations, Inter-agency Task Force on Financing for Development
20. Fitch Ratings Rating Action Commentary July 2021
21. Germanwatch Global Climate Risk Index 202122. Global Sustainable Investment Review 2020,
GSIA23. Indonesia Stock Exchange official website24. International Monetary Fund, World Economic
Outlook Database, October 202125. Malaysia International Islamic Financial Centre
(MIIFC) official website26. Ministry of Finance Malaysia Press Release
January 202127. Ministry of Finance Malaysia Press Release June
202128. Monetary Authority of Singapore official website29. Moody’s Credit Rating, Credit Opinion July 2021
31. Our World in Data CO232. Press Conference on Economic and Trade
Cooperation between China and ASEAN, the 18th China-ASEAN Expo, and the 18th China-ASEAN Business & Investment Summit Held in Beijing, China-ASEAN Business and Investment Summit (CABIS), 17 August 2021
33. PT Bareksa Portal Investasi official website34. Rediscover ASEAN: a growth story of 10
countries, EY, May 201735. Regional Energy Trends Report 2020: Tracking
SDG 7 in the ASEAN region, United Nations Economic and Social Commission for the Asia and the Pacific (UNESCAP), 2020
36. Roadmap for ASEAN Sustainable Capital Markets, 2021-2025, ACMF
37. Securities Commission Malaysia official website38. Singapore Exchange (SGX) official website39. Singapore Green Plan 203040. Southeast Asia can reach clean energy targets by
investing in transmission, 2021, IEA41. Speedtest Insights42. State Securities Commission of Vietnam official
website43. Statista Malaysia May 202144. Sustainable Stock Exchanges (SSE) Initiatives
official website45. The Global Economy46. The Securities and Exchange Commission,
Thailand official website47. The Stock Exchange of Thailand official website48. The World factbook Gini Index Coefficient 49. Transparency International Corruption Perception
Index 202050. Trust Officers Association of the Philippines
official website51. Twelfth Malaysia Plan, Economic Planning Unit,
27 September 202152. United Nation’s PRI official website53. United Nations, Department of Economic and
Social Affairs, Population Division (2018)54. Wang Yi: Trade between China and ASEAN
Increases by Nearly 40 Percent in the First Half of 2021, Ministry of Foreign Affairs of the People’s Republic of China, 3 August 2021
55. World Economic Outlook Update October 2021, IMF
56. World Investment Report 2020 and 2021, United Nations Conference on Trade and Development (UNCTAD)
57. World Statistics Pocketbook 2021 United Nation Statistics Division
Research sources
ASEAN SRI | 47
References4 Charts
No. Chart
1 ASEAN focus - international trade and investment expectations 2 Highlights of EY Global Institutional Investor Survey 20213 Global sustainable investing strategies, 2016-20204 Growth trend of ASEAN6 sustainable bonds and sukuk, 2016-20215 ASEAN6 - Value of green, sustainability and social bonds and sukuk, 2 November 2021 6 ASEAN6 aggregated value of SRI bonds and sukuk issuances by type, 2016-20217 ASEAN6 value of sustainable sukuk issuances, 2016-20218 ASEAN6 – Percentage of total sustainable bonds and sukuk9 ASEAN6 total outstanding bonds, 2016 – 202110 Key green bond standards and guidelines in ASEAN11 Total ASEAN6 market capitalization, 2010 – 202112 ASEAN6 market capitalization, 2016-202113 ASEAN6 sustainability index performance, 2016-202114 ASEAN6 total AUM, 2016-202015 Roadmap for ASEAN Sustainable Capital Markets – priority areas 16 Development stages of carbon regimes in ASEAN617 ASEAN6 sustainability-related roadmaps and action plans18 Malaysia’s five-year sustainability plans under the 12th Malaysia Plan19 Sustainability initiatives under the Singapore Green Plan 203020 Key ESG regulations (policies and frameworks), ASEAN6, 2015-202121 ASEAN6 SRI growth drivers22 ASEAN6 state of SRI market development – broad assessment23 ASEAN6 sectors – green schemes and green investment policies24 Selected green investment projects financed by ACGF25 Current RE share of electricity capacity (%) 26 ASEAN RE investments
Charts

ASEAN SRI | 48
As part of its developmental mandate, the Securities Commission Malaysia (SC) set up the Capital Markets Promotion Council (CMPC) in 2012 to strengthen its internationalisation agenda for Malaysia’s capital market. In 2014, the SC rebranded CMPC as Capital Markets Malaysia (CMM) to spearhead both the local and international positioning and profiling of the Malaysian capital market with its wide range of conventional and Islamic products, supported by a strong governance infrastructure.
CMM profiles the competitiveness and attractiveness of the various segments of the capital market via a comprehensive and integrated approach to increase international participation and enhance opportunities for Malaysian capital market intermediaries. In addition, CMM acts as the secretariat for the Sustainable Investment Platform.
CMM engages with a wide range of international and domestic stakeholders of the capital market. Our diverse network enables us to connect local capital market intermediaries to foreign stakeholders and provides a global platform to position Malaysia’s unique capital market offerings and expertise. As an affiliate of the SC, CMM also continuously engages with the capital market regulator, providing market insights, business development and stakeholder engagement support to market development initiatives.
Visit www.capitalmarketsmalaysia.com/
Capital Markets Malaysia
Industry contacts
Navina BalasingamHead, Stakeholder Engagement, Capital Markets Malaysia
Zalina ShamsudinGeneral Manager, Capital Markets Malaysia

EY | Building a better working world
EY exists to build a better working world, helping to createlong-term value for clients, people and society and build trustin the capital markets.
Enabled by data and technology, diverse EY teams in over150 countries provide trust through assurance and helpclients grow, transform and operate.
Working across assurance, consulting, law, strategy, tax andtransactions, EY teams ask better questions to find newanswers for the complex issues facing our world today.
EY refers to the global organization, and may refer to one or more,of the member firms of Ernst & Young Global Limited, each of which is a separate legal entity. Ernst & Young Global Limited, a UK company limited by guarantee, does not provide services to clients. Information about how EY collects and uses personal data and a description of the rights individuals have under data protection legislation are available via ey.com/privacy. EY member firms do not practice law where prohibited by local laws. For more information about our organization, please visit ey.com.
The views of third parties set out in this publication are not necessarily the views of the global EY organization or its member firms. Moreover, they should be seen in the context of the time they were made.
©2022 EYGM Limited.All Rights Reserved.
EYG no. 001949-22Gbl
EDNone
This material has been prepared for general informational purposes only and is not intended to be relied upon as accounting, tax, legal or other professional advice. Please refer to your advisors for specific advice.
ey.com/en_my
EY contacts
Dato’ Abdul Rauf RashidMalaysia Managing PartnerErnst & Young PLT
Chan Hooi LamEY Asean Financial Services Assurance LeaderMalaysia Financial Services Assurance Leader, Ernst & Young PLT
Shankar KanabiranMalaysia Financial Services Consulting LeaderErnst & Young Consulting Sdn Bhd
Pearlene CheongDirector, Research and ContentErnst & Young Consulting Sdn Bhd
Arina KokMalaysia Climate Change and Sustainability Services LeaderErnst & Young Consulting Sdn Bhd
Liew Nam SoonEY Asean Regional Managing Partner