RESPONSIBLE GLOBAL MOBILITY - Santa Fe Relocation
88
RESPONSIBLE GLOBAL MOBILITY PROTECTING YOUR GLOBAL MOBILITY PROGRAMME IN A WORLD OF HEIGHTENED RISK BASED ON THE 2015 GLOBAL MOBILITY SURVEY 1,282 COMPANIES 74 COUNTRIES 146,741 ASSIGNMENTS PA
-
Upload
khangminh22 -
Category
Documents
-
view
4 -
download
0
Transcript of RESPONSIBLE GLOBAL MOBILITY - Santa Fe Relocation

RESPONSIBLEGLOBAL MOBIL ITYPROTECTING YOUR GLOBAL MOBILITY
PROGRAMME IN A WORLD OF HEIGHTENED RISK
BASED ON THE 2015 GLOBAL MOBILITY SURVEY
1,282 COMPANIES
74 COUNTRIES
146,741 ASSIGNMENTS
PA

02 / 2015 Global Mobility Survey: Responsible Global Mobility
2015
INTRODUCTION 03
About The Global Mobility Survey Report 03
Benchmarking Portal 04
Expert Panel 04
SECTION ONE: KEY TRENDS 06
Part 1. Global Mobility Teams Stretched To Their Limit? 07
Part 2. Elevating Duty Of Care On The Global Mobility Agenda 15
Part 3. Time For Global Mobility To Demonstrate Its Value To The Business? 20
Part 4. Policy The Key To Improving Return On Investment 26
Part 5. Recommendations 32
METHODOLOGY 34
SECTION TWO: THE FULL RESULTS 38
01
02

www.globalmobilitysurvey.com / 03
ABOUT THE GLOBAL MOBIL ITY SURVEY REPORT
The Global Mobility survey is the world’s largest and most robust study of Global Mobility professionals worldwide. This year is the survey’s 5th anniversary and we’re delighted to announce a record number of responses with 1,282 companies from across 74 countries.
1,282 COMPANIES
74 COUNTRIES
INTRODUCTION

04 / 2015 Global Mobility Survey: Responsible Global Mobility
We hope you find the insights contained within this report useful. If you would like to explore the findings against your peers you can do so via the interactive web portal. You can compare your programme against others by variables by such as location of control, industry sector, number of assignments per annum, and many other parameters. To access to the portal, please visit: www.globalmobilitysurvey.com
In addition to the insights from the Global Mobility Survey 2015, the report also draws upon leading voices of authority to provide their interpretation, analysis and knowledge of the industry. This year’s experts are:
BENCHMARKING PORTAL
EXPERT PANEL
DAVID COLLINGS
(Phd) Professor od HRM, DCU Business School, Dublin City University
David Collings (PhD) is Professor of HRM at Dublin City University Business School where he leads the HR Directors’
Roundtable. He is also principal academic advisor to the Maturity Institute. He previously held academic appointments at the University of Sheffield
and National University of Ireland Galway and visiting appointments at King’s College London and Strathclyde University. His research and consulting interests focus on staffing with a particular focus on talent management and Global Mobility. He has published numerous papers in leading international outlets and consulted with
numerous leading organisations on these topics. In 2014 he was named by HR Magazine as one of the leading international thinkers in the field
of HR. You can follow him on twitter @collingsdg
PEGGY SMITH
President and CEO, SCRP, SGMS
Peggy Smith, SCRP, SGMS is the Chief Executive Officer of Worldwide ERC®. Worldwide ERCFutura BT networks workforce mobility
professionals and HR innovators, and is the recognised industry authority on relocation and international assignments in the US and major global traffic areas. Worldwide ERCFutura BT is headquartered in the Washington, DC, metropolitan area, with offices in Brussels, Belgium and Shanghai, China. Prior to joining Worldwide ERCFutura BT , Peggy held a 13-year tenure with Microsoft, where she managed the company’s annual mobility spend; developed and implemented strategy for the
company’s world-class Mobility Centre of Excellence (COE); expanded the centre from US to global coverage; integrated within the mobility program a range
of services that crossed major compensation and benefit segments (e.g., healthcare, compensation and relocation) and shifted the
Mobility COE from a cost model to a profit centre.
INTRODUCTION

www.globalmobilitysurvey.com / 05
EMMA HOLDER
Director Expat Academy
Emma is a Director of Expat Academy and has spent over 18 years working in Global Mobility as a specialist consultant, trainer, facilitator and in-house professional. Emma is in constant dialogue with Expat Academy members through numerous events and as a result Emma is well placed to comment on current trends and best practice. Emma started her career in international tax at Arthur Andersen, moved into International HR with
PwC and then moved in-house to work for Goldman Sachs and Diageo before joining Expat Academy.
YVONNE MCNULTY
Singapore Institute of Management University
Dr. Yvonne McNulty is a leading authority on expatriate return on investment and an academic expert in the
field of expatriation. A frequent and outstanding contributor to international conferences and other media in the area of global
management, Dr. McNulty is currently on the faculty at Singapore Institute of Management University. Her research has been featured in The New York Times, Economist Intelligence Unit, International Herald Tribune, BBC Radio, China Daily, The Financial Times, HR Monthly, Sydney Morning Herald and many other publications.
Dr. McNulty is a research consultant for the Global Mobility industry and serves on the editorial board of Journal of Global Mobility and Global
Business & Organizational Excellence. She is co-author of the best-selling “Managing Expatriates: A Return on
Investment Approach” (Business Expert Press, 2013).
DAVID SCHOFIELD
Strategic Business & Talent
David specialises in the integration of mobility with talent across Europe and the United States. He works with CEOs and Board Members of leading
multinational organisations.
David has held senior positions in the fields of Global Mobility, Human Resources and Risk & Quality. David is a frequent speaker at international conferences
and has published a number of articles on talent mobility and talent management.
INTRODUCTION
JOHN RASON
Head of Consultancy Services Santa Fe
As a Fellow of the CIPD, John is a recognised thought leader and speaker on strategic International HR, Talent Management and Global Mobility. John has 15 years of consultancy experience and has previously held senior HR roles in global businesses across a range of industry sectors. John is an International HR Professional who works with Global Mobility departments to help develop their mobility programmes. John has personally undertaken
senior HR international assignments in Saudi Arabia and Latvia.

06 / 2015 Global Mobility Survey: Responsible Global Mobility
THIS SECTION PROVIDES AN OVERVIEW OF THE KEY TRENDS IDENTIF IED FROM THIS YEAR’S SURVEY.
SECTION ONE:KEY TRENDS
01

www.globalmobilitysurvey.com / 07
THE GROWTH VS. COST PARADOX
Real growth in the Global Mobility sector reached new levels in the past twelve months with organisations reporting 24.8% net growth in assignment activity when compared to the previous year. Simultaneously, pressure to reduce overall Global Mobility costs remained the highest priority for most businesses.
Increasingly, therefore, we see a paradox between a need to expand Global Mobility activity and, at the same time, a demand to freeze or reduce the total programme cost. This raises two very pertinent questions:
I. What happens when Global Mobility is stretched to its limit?, and
II. Why does Global Mobility find itself in this position?
KEY TERM: Net Growth =
Companies reporting increase less companies reporting decrease
STRONG ASSIGNMENT GROWTH CONTINUES
The highest proportion of growth in assignment activity came from ‘mid-size’ programmes, or those organisations authorising 26-100 assignments per year. See Fig 1.
1-25
26-100
101-250
251-500
500+2014
2015
51.3%
59.6%
53.8%
18.6%
8.6%
27.1%
9.3%
5.0%
6.1%
8.2%
6.2%
24.8%
8.1%
5.2%
8.1%
Fig 1. Number of assignments organisations have authorised in the past 12 months
2013
PART 1. GLOBAL MOBIL ITY TEAMS STRETCHED TO THEIR L IMIT?

08 / 2015 Global Mobility Survey: Responsible Global Mobility
Fig 3. Predicted change in assignment activity over next 12 months(selected industries)
59.3% 12.3%28.4%Engineering
58.1% 6.5%35.4%
Technology and Communications 50.0% 14.6%35.4%
Oil and Gas
42.0% 18.0%40.0%
Consulting
40.9% 21.5%37.6%
Chemicals
39.2% 20.3%40.5%
Financial
38.6% 34.3%27.1%
Automotive
34.1% 30.8%35.2%Manufacturing
Increase No real change Decrease
Fig 2. Change in assignment activity over past 12 months(selected industries)
Increase No real change Decrease
52.6%
46.7%
45.2%
41.7%
46.0%
40.0%
40.8%
37.2%
37.1%
34.8%
43.6%
41.6%
36.0%
33.3%
47.4%
34.1%
10.3%
18.5%
11.2%
16.7%
18.0%
26.7%
11.8%
28.7%
Engineering
Technology and Communications
Oil and Gas
Consulting
Chemicals
Financial
Automotive
Manufacturing
Net growth in assignmentactivity in engineering
organisations
+42%
In particular, growth in assignments was led by the Engineering sector. Over the past twelve months, Engineering organisations experienced a net +42.0% increase in assignment activity. See Fig 2.
Engineering organisations report a very optimistic outlook going forward with a +47.0% net increase expected over the next twelve months. They will be joined in assignment growth by Consulting firms who predict a net +51.2% growth (continuing a trend for growth in this sector identified in 2014). See Fig 3.
Whilst Engineering and Consulting firms are expecting assignment activity to grow the most, we may be about to witness a slowing in the Oil and Gas industry. Despite strong net growth of +34.0% during 2014, falling oil prices and cost-cutting exercises are contributing to lower confidence for the next twelve months with expected net growth amongst Oil and Gas organisations falling to just +4.3%. Manufacturing companies also continue their restricted performance from 2014 (+8.5% net growth) with only +3.3% expected for the coming year.
Overall however, expected growth for the coming twelve months is very strong with an anticipated +24.8% (See Fig 4.) net growth in assignment activity globally, with particularly strong performance predicted from Asia managed programmes (+43%).
SECTION ONE: KEY TRENDS
Anticipated net growthin assignment activitywithin the consultancy
industry
+51%

www.globalmobilitysurvey.com / 09
Fig 4. Overall anticipated net growth in assignment activity over the next 12 months
+24.8%Net Growth
MULTIPLICITY OF ASSIGNMENT FACTORS
An increasingly global outlook for sourcing talent, diversity of candidates, dynamic legislation, challenging new markets, a dazzling array of compensation options, assignment packages and policy types make up the manifold variables that Global Mobility functions must now be able to manage.
With resources already stretched thinly in companies, these layers of complexity present today’s Global Mobility function with critical challenges when it comes to keeping pace with day-to-day administration, forcing them to spend most of their time performing reactive tasks instead of those that are more forward looking.
As an example of the increased diversity faced by Global Mobility, if we simply look at the range of assignment destinations that are now being served by the Global Mobility function, from the 1,282 respondents to this survey, a staggering 136 different countries were quoted in their top three assignment destinations. And destinations is just one variable! This increasing diversity of destinations is being driven primarily by two factors:
1. With organisations increasingly looking for new ways to gain a competitive advantage, ‘new frontier’ markets are becoming core to organisational strategy (as opposed to only focusing on the more ‘traditional’ markets)
2. We see a rise of intra-regional assignments managed out of Asia, Africa and South America. This points to a trend for local and regional management away from centralised control by European and North American headquartered businesses.
In European and North American managed programmes there is still a strong bias towards UK/ USA destinations but we are also seeing ‘new frontier’ markets such as China (Tier 3 & 4 cities) and India becoming key assignment destinations. DAVID COLLINGS
“This complexity reflects the challenges which HR functions more broadly experience in terms of greater complexity in
employee populations. For example, research conducted by Ed Lawlor and colleagues at the University of Southern California shows that HR professionals spend far more time on administrative tasks
than strategic ones and this has remained broadly consistent over the past two decades. It is fair to say that today’s Global
Mobility function faces a more complex management situation than its predecessor.”
SECTION ONE: KEY TRENDS

10 / 2015 Global Mobility Survey: Responsible Global Mobility
In Australasia the most common assignment destinations are also established English-speaking markets; Australia, UK and USA. However, again we are seeing a prevalence of assignments in relatively close-by emerging markets.
A phenomenon that has been observed readily over the past five years of the survey is the rise of these destination countries that are not only managing their own regional and global programmes, but driving growth in Global Mobility activity worldwide.
This has promoted the second factor which is an increase in intra-regional assignments managed out of Asia, Africa and South America. For example, only a few of the top 20 assignment destinations for programmes managed in Europe (4) or North America (8) were within Asia compared to over half of the programmes managed in Asia (12) including 3 of the top 4.
Add to these two factors, a new layer of complexity, given that candidates are being sourced from increasingly diverse talent pools at different points in their career and family lifecycle, and we see that the dynamics of Global Mobility are changing rapidly. Global Mobility departments are faced with a whole new series of motivational, cultural and economic factors, as highlighted by the vast spectrum of policy types currently being used by organisations (see Part 4 on page 26 for more details).
SECTION ONE: KEY TRENDS
Fig 5. Top 20 assignment destinations for European managed programmes
United States of America
China
United Kingdom
Germany
France
Brazil
United Arab Emirates
Singapore
Russia
India
Belgium
Mexico
Switzerland
Australia
Netherlands
Hong Kong
South Africa
Spain
Angola
Canada
14.1%
8.1%
7.4%
5.7%
4.6%
4.1%
3.4%
3.3%
3.0%
2.8%
2.3%
2.2%
2.2%
2.1%
1.9%
1.7%
1.6%
1.5%
1.4%
1.4%
Fig 7. Top 20 assignment destinations for Australasian managed programmes
Australia
United States of America
United Kingdom
Hong Kong
China
Singapore
New Zealand
Philippines
Canada
Indonesia
India
South Africa
Mongolia
Peru
Saudi Arabia
United Arab Emirates
Thailand
Korea South
Germany
Malaysia
23.4%
12.6%
9.6%
6.6%
6.6%
5.4%
3.6%
3.0%
3.0%
2.4%
2.4%
2.4%
1.2%
1.2%
1.2%
1.2%
1.2%
1.2%
1.2%
1.2%

2015 sees a rise in Asian, African and South American
destinations
USA, China, UK, Singapore and Germany top the list
of destinations
Companies quoted astaggering 136 different
countries as top 3destinations
www.globalmobilitysurvey.com / 11
SECTION ONE: KEY TRENDS
United States of America
China
United Kingdom
Singapore
Brazil
Canada
Malaysia
Mexico
South Africa
Australia
Hong Kong
Switzerland
Germany
India
Ireland
Netherlands
Korea South
France
Japan
Philippines
18.7%
13.8%
7.6%
6.7%
4.4%
3.6%
3.1%
2.7%
2.7%
2.7%
2.7%
2.2%
1.8%
1.8%
1.3%
1.3%
1.3%
1.3%
1.3%
1.3%
Fig 6. Top 20 assignment destinations for North American managed programmesFig 5. Top 20 assignment destinations for European managed programmes
United States of America
China
United Kingdom
Germany
France
Brazil
United Arab Emirates
Singapore
Russia
India
Belgium
Mexico
Switzerland
Australia
Netherlands
Hong Kong
South Africa
Spain
Angola
Canada
14.1%
8.1%
7.4%
5.7%
4.6%
4.1%
3.4%
3.3%
3.0%
2.8%
2.3%
2.2%
2.2%
2.1%
1.9%
1.7%
1.6%
1.5%
1.4%
1.4%
Fig 7. Top 20 assignment destinations for Australasian managed programmes
Australia
United States of America
United Kingdom
Hong Kong
China
Singapore
New Zealand
Philippines
Canada
Indonesia
India
South Africa
Mongolia
Peru
Saudi Arabia
United Arab Emirates
Thailand
Korea South
Germany
Malaysia
23.4%
12.6%
9.6%
6.6%
6.6%
5.4%
3.6%
3.0%
3.0%
2.4%
2.4%
2.4%
1.2%
1.2%
1.2%
1.2%
1.2%
1.2%
1.2%
1.2%
Fig 8. Top 20 assignment destinations for Asian managed programmes
China
United States of America
Singapore
Hong Kong
United Kingdom
Thailand
Indonesia
India
Malaysia
Vietnam
Australia
Germany
Philippines
Japan
France
Switzerland
Myanmar
Canada
United Arab Emirates
Korea South
15.0%
9.7%
8.3%
6.7%
5.9%
4.5%
4.4%
4.1%
3.8%
3.6%
3.5%
3.1%
2.8%
2.5%
2.0%
1.5%
1.4%
1.4%
1.1%
1.0%

12 / 2015 Global Mobility Survey: Responsible Global Mobility
Lack of data and connectedsystems inhibits the ability
to monitor costs andperformance
IS GLOBAL MOBILITY UNDER-RESOURCED?
With year-on-year growth in assignment activity and an increasingly complex range of assignment factors, there is a tangible need for a relative increase of resources allocated to Global Mobility in order that Global Mobility functions can serve their businesses effectively. Conversely however, the evidence strongly indicates that Global Mobility departments are being squeezed. See Fig 9.
The results show that Global Mobility functions are focusing on total mobility cost reduction with virtually all companies (92.8%) stating that containing Global Mobility costs is important, and over half (53.5%) feeling under significant pressure to reduce the overall cost of their programmes. This is particularly prevalent in the Engineering sector where, despite experiencing rapid growth in assignment volumes, over two thirds of companies (69%) said that reducing overall mobility costs is a high priority.
Rather than focusing on how Global Mobility programmes can deliver value to the business, it appears that many organisations are instead focused on total mobility cost reduction of their programme. This perhaps highlights that while Global Mobility functions would like to partner at a strategic level with their executive leadership their mandate is still firmly fixed on operational cost tracking and administration. Mobility functions see themselves as cost centres rather than talent enablers of competitive advantage for their organisations.
Fig 9. The Global Mobility Squeeze
PEGGY SMITH
“It’s fair to say that nearly everywhere in the world today, in every industry, we have environments where growth is occurring faster than companies can staff up to meet it.
More corporations and organisations are evaluating the need for an increasingly sophisticated talent management function,
and with that will come an amplified need for mobility specialists and professionals.
Most companies strike a good balance of maintaining in-house expertise and outsourced providers, but they are certainly stretched to do all that they want and
need to do.”
DAVID COLLINGS
“What is certainly clear is that Global Mobility continues to be viewed as a cost rather than a potential driver of value in
most organisations. Global Mobility needs to be better at framing investments in the function in language and metrics that senior decision makers buy into, and better at articulating the ROI in
mobility. This is the first step in increasing the resourcing of the Global Mobility function, which can lead to recognition that
adequate appropriate resourcing is required.”
Global Mobility
AvailableResources
Assignment Activity/Complexity
SECTION ONE: KEY TRENDS

www.globalmobilitysurvey.com / 13
Said that reducing overall mobility costs
was a high priority
53.5%
Said that containing global mobility costs
was important
92.8%
Therefore, it is alarming to think about the stresses that Global Mobility departments are likely to face going forward. This presents Global Mobility professionals with a unique, if challenging, opportunity – to change the conversation by positioning the Global Mobility function as a value provider rather than a cost centre function.
PEGGY SMITH
“As analytics and integrated HR/mobility systems grow in importance, we are likely to see a company’s
Global Mobility teams expand.”
SECTION ONE: KEY TRENDS
JOHN RASON: ADDRESSING THE “GLOBAL MOBILITY SQUEEZE”
As we can see, Global Mobility functions in most organisations are feeling the squeeze at multiple levels including; delivering on business objectives, requirement to provide meaningful reporting to the organisation, managing compliance for ever increasing corporate governance standards, working within complex international business structures, being expected to manage a broader range of assignment types and a constant pressure to reduce costs.
The unfortunate outcome of cost reduction is that it very often manifests itself in terms of reducing or freezing resources – head count, financial or otherwise. When you couple this with the fact that we are currently witnessing a record high in assignment activity we get a good idea of why Global Mobility professionals are becoming trapped in an administrative cycle. It is also why we are seeing the early adopters becoming more creative in their approach to resourcing.
One solution that I have seen to work well is when organisations take a more strategic approach to partnering with suppliers. Identifying one, or a few suppliers, and working with them as if they are internal business partners rather than third parties. I have seen this happen predominantly with larger programmes but I have seen it benefit businesses with smaller programmes too. By joining forces with specialist organisations, in-house Global Mobility and HR professionals are re-discovering the valuable time they have lost. Now they can focus on planning ahead and making improvements that enable them to deal with the needs of their business more effectively.
Making the correct choice of strategic partner is essential – get it right and you will experience the benefits in the short and longer term. As an example, if your own business cannot deliver a technology system that is fit for your purpose within the desired time frame, a wisely selected strategic partner may give you instant access to hi-tech data platforms and applications without the need for capital investment or on-going operational software costs. They can also help with analysis of data to help support ROI reporting and build your future business cases.
However, whilst the advantages of partnerships certainly make a compelling case, it’s also vital to approach any collaboration aware of the potential pitfalls. Partnerships should lead to increased efficiencies but, to do so, corporate roles and responsibilities need to be clearly defined. Establishing a partner with the right ‘organisational and culture fit’ is probably of equal importance as the operational services that you wish to have delivered. ‘Partnering’ is not the same as simply ‘outsourcing’. In the best arrangements, the client will still maintain high levels of ownership and engagement in the Global Mobility programme, collaborating with the partner to develop solutions to evolving business objectives. This type of relationship is not something that can be ‘thrown together’ overnight; it requires planning to ensure that communication and operational protocols are aligned from the start. So as pressures grow on Global Mobility departments, forming partnerships with specialist providers can be an excellent, cost-effective solution, but it also needs to be handled carefully.

14 / 2015 Global Mobility Survey: Responsible Global Mobility
SCARCE RESOURCES ARE FOSTERING A REACTIVE CULTURE
The tendency for Global Mobility programmes to be tactical rather than strategic was an area that was highlighted in last year’s report, and one that has again been brought to the fore by this year’s results.
Twelve months on from last year’s survey, and with internal resources under continued pressure, despite Global Mobility functions wishing to spend more time on proactive matters (48.9% want to be doing regular strategic workforce planning but in reality only 13.1% are managing this – see Fig 17), it is unsurprising to see that they continue to be shackled by reactive tasks. Unless something changes, as assignment activity increases, Global Mobility departments are going to be tied-into a vicious circle of reactive, administrative, ‘firefighting’ tasks which distract them away from doing the highly valuable, proactive activities they would like to be doing.
In order for Global Mobility departments to be able to break this cycle and act strategically within their organisations, finding alternative resources to handle the day-to-day activities must surely be a priority. In turn, this will enable them to focus on building a case for greater investment in Global Mobility to deliver value.
We have seen a great deal of intent from Global Mobility to reposition itself as a partner to the business, creating value and providing direction. However the overwhelming evidence shows that Global Mobility is failing to do this (not least the fact that most departments are unable to demonstrate ROI, many lack the systems to track outcomes accurately, and absolute cost reduction is still the number one priority).
To fix this in the short-term, Global Mobility teams need to look at new ways to bridge the resource gap – whether this means increasing head count or turning to co-sourcing, outsourcing and strategic partnerships to provide access to systems and resources that would normally require significant monetary and time investment.
Companies want to spend 35.8% more time onstrategic workforce
planning
35.8%
SECTION ONE: KEY TRENDS
DAVID SCHOFIELD / THE NEED FOR STRATEGIC GLOBAL MOBILITY
From my experience of working with multi-national organisations across industry sectors, high-performing businesses spend a significant amount of their time on strategic planning and ensuring that their Global Mobility programme aligns with, and helps to achieve, the company’s overall business objectives. Evidence shows that successful mobility programmes are built on business drivers and follow a structured approach:
I. Start with the organisation’s business strategy and objectives – e.g., introducing a new product or moving into a new geographic area;
II. The business strategy drives the HR/talent management strategy – e.g., recruiting and developing people with the right skills and potential;
III. Then talent mobility actions will link to the HR strategy – e.g., expanding an overseas operation can be supported by a long-term assignment into the location, and by shorter development secondments of local staff into more established countries.
The current mismatch in many organisations between the desire to behave strategically and the reality of focusing on administrative tasks represents an opportunity for Global Mobility teams to “raise their game”. It’s good to see from the survey that Global Mobility is aspiring to take a lead on things like workforce planning and assignee selection. The way to achieve this aspiration is two-fold:
First, the administrative tasks (including compliance, benefits and compensation) have to be properly dealt with – i.e., get the basics right! Second, Global Mobility needs to talk the language of the business. What business leaders really care about is how to exploit business opportunities and to manage strategic business risks. If you can show that a new mobility policy or investment in a programme of development assignments will help a business unit to grow, or to reduce risk in an overseas location, CEOs and Finance Directors will listen to you. Once you have their attention, you will be able to input to strategic decisions about the workforce.

www.globalmobilitysurvey.com / 15
As demonstrated by the primary tasks occupying Global Mobility professionals’ time (see Fig 17), there is a pre-occupation with immigration and tax compliance as organisations look to mitigate the risks associated with compliance failures. The Duty of Care here is clear and the risk of failure in this area may jeopardise the entire assignment.
TYPES OF RISK
Whilst these types of compliance issues should always remain a high priority, they should not be the sole consideration. In particular, Global Mobility programmes need to take six risk factors into consideration:
1. Legal risk to the business through compliance failure
2. Financial risk to the business through high programmes costs and/or fines due to compliance failure
3. Reputational risk to the business through negligence and/or compliance failure
4. Talent risk of failure to build and retain skilled employees
5. Human (personal) risk to assignees and their accompanying family
6. Performance risk to the quality of the assignee’s performance and impact on the business
INCREASING THE RISK
As we have already identified, in many companies Global Mobility is facing pressure in relation to resources and business demands. But does this pressure create a greater potential for a major failure in relation to any of these types of risk?
In an attempt to overcome these resourcing challenges, we see organisations using control strategies such as centralising programme management, introducing ‘consumerisation’ of Global Mobility packages (e.g. by offering lump sum payments) and outsourcing none core elements of their programme management.
Although each of these is by no means a minor undertaking, the solutions are aimed at tackling the symptoms rather than the cause, as departments battle to keep the lid on risk in the face of unsuitable underlying systems and processes.
In particular, with the majority of professionals’ time currently focussed on dealing with compliance issues, such as legal, financial and reputational risks; talent, human (personal) and performance risks can sometimes be neglected.
In the 2014 Global Mobility Survey we explored the talent aspect in detail, noting how, whilst fewer than half of organisations currently have talent management programmes, the implementation of talent management in strategic alignment with Global Mobility and overall business strategy enables organisations to more effectively resource the business’ demand for key skills, achieve corporate objectives and ensure higher levels of talent retention.
However, with constant pressure to reduce costs and a growing programme to manage, it can be easy to overlook the human elements that an assignment entails – a valued employee, and possibly their dependents, relocating to a new, often daunting and sometimes dangerous situation – and establish safe working and environmental conditions in the host location.
Thankfully this year the survey results showed that Duty of Care towards assignees in relation to human (personal) risk is a focus for many companies. The responsibility of businesses and Global Mobility functions has received greater emphasis lately through recent world events which have directly affected employees on assignment. The potential for critical
incidents is at an all time high.
2015 sees a renewed focus on duty of care
PART 2. ELEVATING DUTY OF CARE ON THE GLOBAL MOBIL ITY AGENDA
Over half of organisations have experienced a critical incident
50.7%

16 / 2015 Global Mobility Survey: Responsible Global Mobility
RE-PRIORITISING THE ASSIGNEE
Over half of organisations (50.7%) have at some point experienced a critical incident, where an assignee or their accompanying dependents has suffered a serious issue that has affected their personal safety or health, and more than 1 in 5 (21.8%) experienced a critical incident during the past year! See Fig 10.
The effect of critical incidents on the Global Mobility function are twofold:
1. Trauma and repercussions may stem from a critical incident.
2. Availability of assignment candidates for a project maybe affected based on the level of perceived risk.
Assignment candidates have a heightened, and often sensationalised, awareness of the risks they face in regards to assignments. Details of world events are readily available in today’s media. This creates a challenge for businesses that need to attract assignment candidates for affected countries. Therefore, there has been a reawakening to the human risk of assignments and the need for companies to provide assurances to their candidates that these risks have been identified and are being managed.
This is particularly the case with destinations that are now considered to be more ‘mainstream’. For example, the top five countries considered to be the most challenging destinations are:
Fig 10. Last experienced a critical incident...
Never
Less than 12 months ago
1-2 years ago
3-5 years ago
Over 5 years ago
49.3%
21.8%
9.7%
12.5%
6.7%
China
11.6%
India
7.3%
Russia
5.2%USA
4.7%
Brazil
5.1%
Within two of these highly ‘mainstream’ destinations – China and the USA – the most prevalent challenges taken into account by Global Mobility functions tend to have a heavy bias on ‘compliance’ risk. For example, this survey found that the two most prominent challenges faced with these destinations are immigration complications and differences in legislation.
In other destinations – such as India, Russia and Brazil – we see stronger prominence of assignee safety being taken into account with more than 1 in 10 organisations that send assignees to these destinations quoting concern over their personal safety. However, in many cases assignee safety is still playing second fiddle to compliance protection.
Whilst some may say that the focus on human (personal) Duty of Care never went away, it does certainly seem as though it has taken a back-seat behind dealing with more ‘corporate’ risks.
However, perhaps brought to the forefront by recent high profile world events, there are signs that we may be starting to see renewed focus, with benefits being recognised not only in protecting existing employees but also as a way of attracting talent.
Over half experienced a critical incidents within their global mobility
programme
50.7%
SECTION ONE: KEY TRENDS

www.globalmobilitysurvey.com / 17
RECOGNISING THE PERSONAL RISKS TO ASSIGNEES
When considering the personal risks faced by assignees, we asked organisations to focus on six key areas of risk: health risks, severe penalties for breaches of local laws, disease, terrorism, war and kidnap. What we found was overwhelming with 4 in 5 organisations saying their Global Mobility programmes are significantly affected by at least one of these risks. See Fig 11.
Top of the list is assignee health and safety risks – a significant threat to over half of Global Mobility programmes. In part this risk is linked to the rise of another risk – disease (35.0%) – something that is likely to have been brought to the forefront of many organisations minds by the highly publicised recent events across Western Africa.
The next area is breach of local regulation – something that can result in severe penalties upon the employee or their dependents, including imprisonment. As well as paying attention to ensuring compliance, organisations must also ensure that assignees are aware of their personal responsibilities to adhere to laws and regulations, taking steps to avoid potential threats.
Of course, depending upon your occupation, different risks are likely to hold increased significance.
One industry sector stands out as being particualry sensitive to risk – Oil and Gas.
Half of Oil and Gas organisations (50%) consider terrorism to be a significant risk to their Global Mobility programmes, with war (35%) and kidnap (32%) also highly prevalent. This is partly due to Oil and Gas organisations having historically operated in some more ‘challenging’ territories; but as a range of industry sectors seek to expand their footprints and take on new ventures, these risks are likely to proliferate. See Fig 12.
Assignee health & safety risks
Severe penalties for breaches of laws
Disease
Terrorism
War
Kidnap
53.0%
40.4%
35.0%
33.8%
24.4%
23.0%
Fig 11. Significant risks faced �by Global Mobility programmes
SECTION ONE: KEY TRENDS
Assignee health risks
Fig 12. Significant risks faced by Global Mobility programmes(selected industries)
Severe penaltiesfor breaches of
laws / regulations
Disease
Terrorism
War
Kidnap
0% 10% 20% 30% 40% 50% 60%
Oil and Gas
Oil and Gas
Oil and Gas
Oil and Gas
Oil and Gas
Manufacturing
Manufacturing
Manufacturing
ConsultingAutomotive
Engineering
Engineering
Technology and CommunicationsFinancialChemicals
18 / 2015 Global Mobility Survey: Responsible Global Mobility
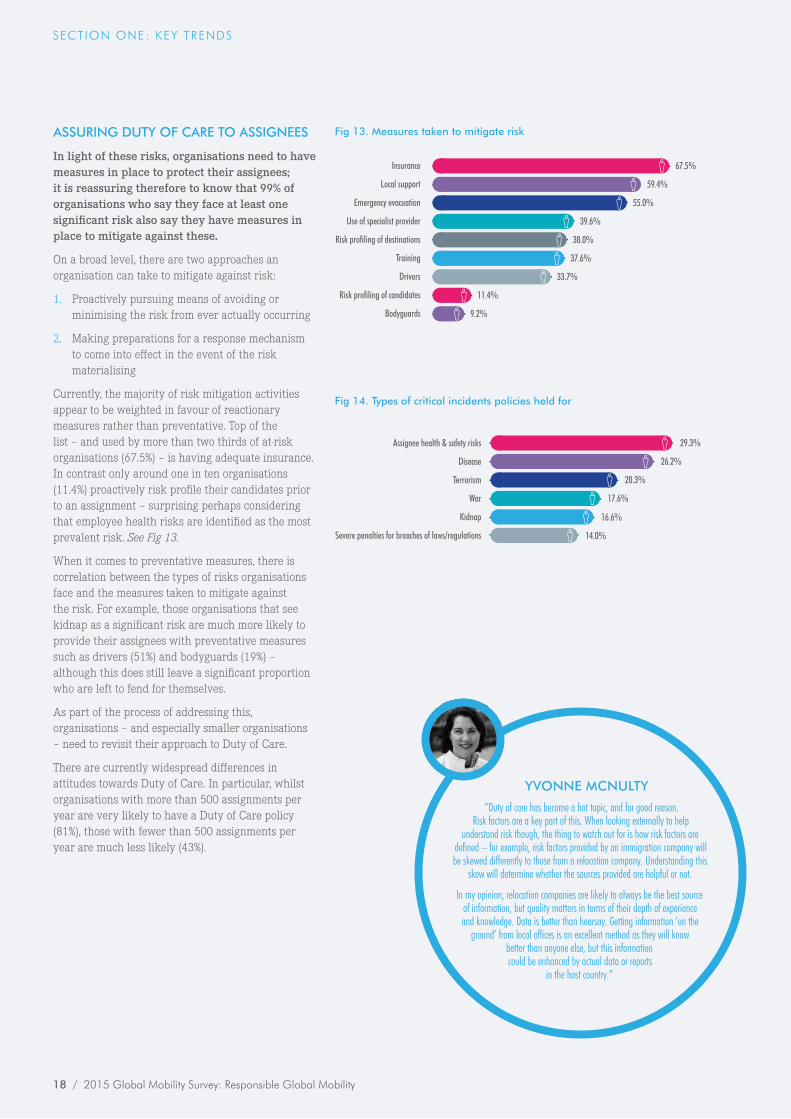
ASSURING DUTY OF CARE TO ASSIGNEES
In light of these risks, organisations need to have measures in place to protect their assignees; it is reassuring therefore to know that 99% of organisations who say they face at least one significant risk also say they have measures in place to mitigate against these.
On a broad level, there are two approaches an organisation can take to mitigate against risk:
1. Proactively pursuing means of avoiding or minimising the risk from ever actually occurring
2. Making preparations for a response mechanism to come into effect in the event of the risk materialising
Currently, the majority of risk mitigation activities appear to be weighted in favour of reactionary measures rather than preventative. Top of the list – and used by more than two thirds of at-risk organisations (67.5%) – is having adequate insurance. In contrast only around one in ten organisations (11.4%) proactively risk profile their candidates prior to an assignment – surprising perhaps considering that employee health risks are identified as the most prevalent risk. See Fig 13.
When it comes to preventative measures, there is correlation between the types of risks organisations face and the measures taken to mitigate against the risk. For example, those organisations that see kidnap as a significant risk are much more likely to provide their assignees with preventative measures such as drivers (51%) and bodyguards (19%) – although this does still leave a significant proportion who are left to fend for themselves.
As part of the process of addressing this, organisations – and especially smaller organisations – need to revisit their approach to Duty of Care.
There are currently widespread differences in attitudes towards Duty of Care. In particular, whilst organisations with more than 500 assignments per year are very likely to have a Duty of Care policy (81%), those with fewer than 500 assignments per year are much less likely (43%).
Insurance
Local support
Emergency evacuation
Use of specialist provider
Risk profiling of destinations
Training
Drivers
Risk profiling of candidates
Bodyguards
67.5%
59.4%
55.0%
39.6%
38.0%
37.6%
33.7%
11.4%
9.2%
Fig 13. Measures taken to mitigate risk
Assignee health & safety risks
Disease
Terrorism
War
Kidnap
Severe penalties for breaches of laws/regulations
Fig 14. Types of critical incidents policies held for
29.3%
26.2%
20.3%
17.6%
16.6%
14.0%
YVONNE MCNULTY
“Duty of care has become a hot topic, and for good reason. Risk factors are a key part of this. When looking externally to help
understand risk though, the thing to watch out for is how risk factors are defined – for example, risk factors provided by an immigration company will be skewed differently to those from a relocation company. Understanding this
skew will determine whether the sources provided are helpful or not.
In my opinion, relocation companies are likely to always be the best source of information, but quality matters in terms of their depth of experience and knowledge. Data is better than hearsay. Getting information ‘on the
ground’ from local offices is an excellent method as they will know better than anyone else, but this information could be enhanced by actual data or reports
in the host country.”
SECTION ONE: KEY TRENDS

www.globalmobilitysurvey.com / 19
The good news is that where Duty of Care policies do exist, these are often very extensive with the majority of policies extending not only to the immediate working environment but also to the assignee’s accommodation, travel to and from work/accommodation, off-site activities and even the assignee’s dependents. Fig 15.
It is certainly good to see that many companies are recognising their responsibility to protect their employees whilst on international assignments, but with many not having policies in place – for an assignee and / or their accompanying dependents – others may currently be exposed to serious levels of risk.
PEGGY SMITH
“Our members have long addressed their responsibility to the safety of their assignees and their families with great regard. Woven throughout their policy and process are commitments for the protection and safety of
mobile employees in their care.
What is growing in prevalence now is a movement toward creating more formal duty of care policies, recommendations and commitments. In most cases, that means developing an understanding of the legalities of one’s responsibility,
defining what constitutes standard and/or reasonable care, and ascertaining how to minimise potential for unfortunate outcomes
while conducting business.”
All on- and off-site activities
56%Accommodation
53%Travel to and from work/
accommodation
51%Assignee's dependents
50%
Fig 15. Extent of Duty of Care policy
SECTION ONE: KEY TRENDS
Proactively risk profile their candidates prior to an
assignment
11.4%
Organisations provide assignees with drivers
where there is a risk of kidnap
51%
20 / 2015 Global Mobility Survey: Responsible Global Mobility
Policy review
Process efficiencies
Tighter supplier cost management controls
Change benefits packages within policies
Rationalisation of service providers
Bundling of relocation services
Individual service cost savings
Change approach to compensation
Reduce number of assignments
Internal reorganisation
Change type of employee being relocated
Reducing the number of suppliers
Fig 16. Cost reduction strategies
44%
41%
31%
25%
25%
24%
24%
22%
20%
19%
16%
15%
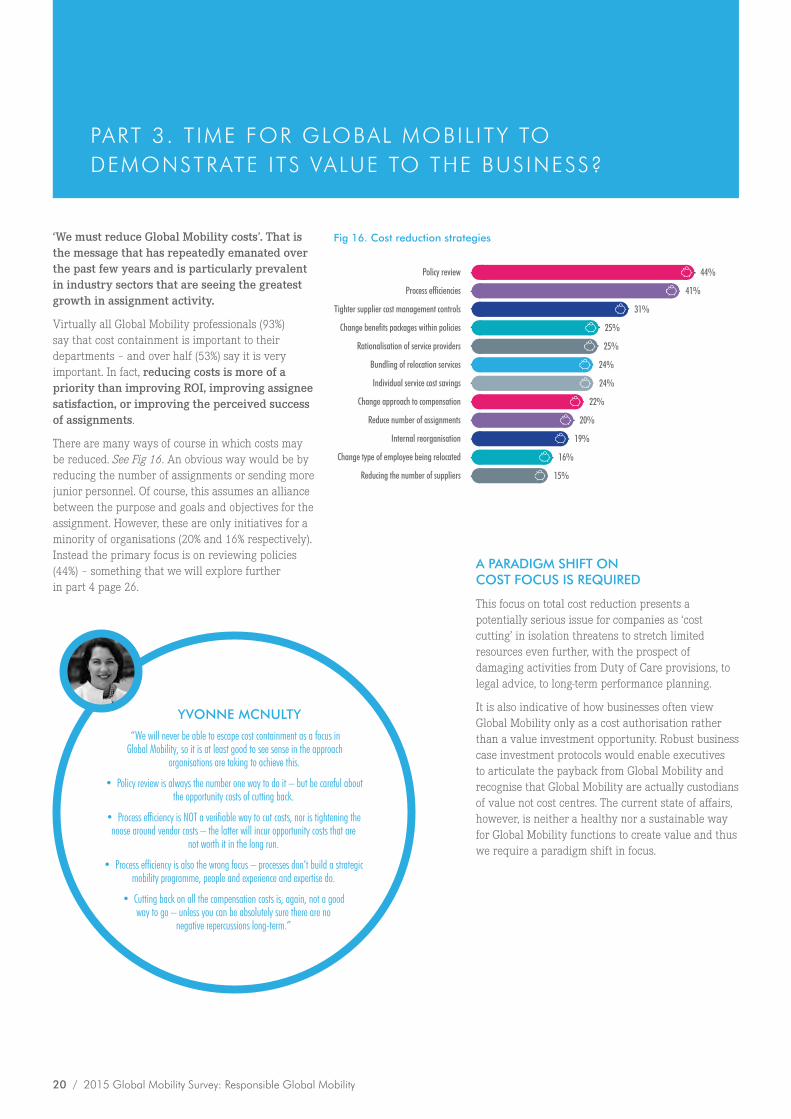
‘We must reduce Global Mobility costs’. That is the message that has repeatedly emanated over the past few years and is particularly prevalent in industry sectors that are seeing the greatest growth in assignment activity.
Virtually all Global Mobility professionals (93%) say that cost containment is important to their departments – and over half (53%) say it is very important. In fact, reducing costs is more of a priority than improving ROI, improving assignee satisfaction, or improving the perceived success of assignments.
There are many ways of course in which costs may be reduced. See Fig 16. An obvious way would be by reducing the number of assignments or sending more junior personnel. Of course, this assumes an alliance between the purpose and goals and objectives for the assignment. However, these are only initiatives for a minority of organisations (20% and 16% respectively). Instead the primary focus is on reviewing policies (44%) – something that we will explore further in part 4 page 26.
A PARADIGM SHIFT ON COST FOCUS IS REQUIRED
This focus on total cost reduction presents a potentially serious issue for companies as ‘cost cutting’ in isolation threatens to stretch limited resources even further, with the prospect of damaging activities from Duty of Care provisions, to legal advice, to long-term performance planning.
It is also indicative of how businesses often view Global Mobility only as a cost authorisation rather than a value investment opportunity. Robust business case investment protocols would enable executives to articulate the payback from Global Mobility and recognise that Global Mobility are actually custodians of value not cost centres. The current state of affairs, however, is neither a healthy nor a sustainable way for Global Mobility functions to create value and thus we require a paradigm shift in focus.
YVONNE MCNULTY
“We will never be able to escape cost containment as a focus in Global Mobility, so it is at least good to see sense in the approach
organisations are taking to achieve this.
• Policy review is always the number one way to do it – but be careful about the opportunity costs of cutting back.
• Process efficiency is NOT a verifiable way to cut costs, nor is tightening the noose around vendor costs – the latter will incur opportunity costs that are
not worth it in the long run.
• Process efficiency is also the wrong focus – processes don’t build a strategic mobility programme, people and experience and expertise do.
• Cutting back on all the compensation costs is, again, not a good way to go – unless you can be absolutely sure there are no
negative repercussions long-term.”
PART 3. T IME FOR GLOBAL MOBIL ITY TO DEMONSTRATE ITS VALUE TO THE BUSINESS?

www.globalmobilitysurvey.com / 21
To do so, Global Mobility functions must switch from a reactive approach to a strategic approach – something that was an ambition for many Global Mobility functions in last year’s survey. Whilst only 11% at the time were able to quote ‘strategic workforce planning’ as one of the top 5 activities involved in their job, 40% expressed a desire to make this a reality.
So what’s changed over the past 12 months? Unfortunately, not much. The percentage of professionals listing strategic workforce planning in their top five tasks has increased, but only by 2% (from 11% to 13%). See Fig 17.
DAVID COLLINGS
“For Global Mobility professionals to be seen to be adding value, involvement in strategic decision making can help raise their profile
with senior management.”
Assig
nmen
t Adm
inistr
ation
Assig
nmen
t Com
pens
ation
& B
enefi
ts
Tax C
ompli
ance
Immi
grati
on Co
mplia
nce
Assig
nmen
t man
agem
ent
Coor
dinati
ng w
ith ot
her d
epar
tmen
ts
Reloc
ation
Des
tinati
on Se
rvices
Payro
ll
Supp
lier M
anag
emen
t
Remo
vals
and h
ouse
hold
good
s
Expe
nse M
anag
emen
t
Evalu
ation
of ex
patri
ate vs
. loca
l hire
*
Emplo
ymen
t law
Recru
itmen
t
Prep
aring
repo
rts fo
r the
busin
ess
Strate
gic w
orkfo
rce pl
annin
g
Non m
obilit
y HR
activ
ities
Assig
nmen
t Can
didate
selec
tion
Mana
ging d
epar
tmen
t IT S
ystem
Othe
r
Fig 17. What activities occupy most time for mobility professionals?
2014 Survey
2015 Survey
40%
48%
40%
48%
43% 44
%
48%
43%
36%
43%
33%
26%
37%
27%
22% 23
%
18% 19
% 20%
18% 20
%18
%
18% 20
%16
%
12%
15%
14%
14%
11% 13
%
11% 12
%
11%
10%
3%5%
3% 4%
*New option for 2015
With this in mind, the key priority for the next 12 months remains the same as last year – spend more time strategic workforce planning! In fact, it’s growing in momentum – now representing a priority for 49% (previously 40%). See Fig 18.
SECTION ONE: KEY TRENDS

22 / 2015 Global Mobility Survey: Responsible Global Mobility
Assignment Administration
Assignment Compensation & Benefits
Tax Compliance
Immigration Compliance
Assignment management
Coordinating with other departments
Relocation Destination Services
Payroll
Supplier Management
Removals and household goods
Expense Management
Evaluation of expatriate vs. local hire*
Employment law
Recruitment
Preparing reports for the business
Strategic workforce planning
Non mobility HR activities
Assignment Candidate selection
Managing department IT System
Other
Fig 18. What activities Global Mobility spend most time on
29.2%
46.7%34.0%
35.1%
50.2%
28.4%
21.7%
10.8%
15.9%
10.2%
15.1%
35.6%
18.2%
10.8%
17.9%
48.9%
4.4%
27.0%
3.3%
3.4%
47.7%
47.6%
44.5%
43.3%
42.7%
36.9%
27.1%
22.9%
19.0%
18.4%
18.1%
17.7%
16.3%
14.9%
14.5%
13.1%
12.3%
9.7%
5.1%
4.1%
ACTUALLY SPEND TIME ON SHOULD SPEND TIME ON
YVONNE MCNULTY
“It’s no surprise that ‘assignment admin’ tops the list of current activities. This feeds into all the research showing that
Global Mobility management is largely transactional, no matter how much managers or their companies would like it to be otherwise. It is not until item
12 that any kind of strategic activity comes into the job description – evaluation of expatriate vs local hire options.
In contrast, the ‘wish list’ of activities tells a much better picture re: where mobility managers would like to focus their time, energy and expertise. I agree that assignment
management will always be the number one priority, and to some extent Global Mobility professionals will never escape compensation and benefits duties as these can, in many
instances, also feed into strategic workforce planning.
However, I disagree with immigration compliance – this is better left to the professionals (i.e. outsourced). Overall, this question paints a much
better picture of the intent, but it also highlights a massive gap between what professionals envision and the reality
of their current role.”
FREEING RESOURCE FOR STRATEGIC ACTIVITIES
By becoming more strategic, a range of benefits should emerge from closer alignment between Global Mobility and overall organisational strategy (only one quarter – 25.9% – currently say that their mobility strategy is very closely aligned with their organisation’s strategy), to increased focus on, and ability to measure, Return on Investment.
However, as the past twelve months have shown, becoming more strategic is not easy nor something that can be expected to happen in a short period of time. In 2014, one of the key barriers identified as preventing organisations from becoming more strategic was a lack of time and resource in the Global Mobility function, and this year’s findings reinforce this position.
SECTION ONE: KEY TRENDS

www.globalmobilitysurvey.com / 23
In the rapidly growing Engineering sector only 1 in 7 organisations (14%) say that their mobility strategy is very closely aligned with overall strategy. As economic resurgence leads to increased opportunities – and increased workloads – this suggests that Global Mobility functions, in Engineering organisations without additional resources, may become less proactive and more reactive as they battle to meet the Global Mobility needs of their organisations.
So as assignment activity continues to grow over the next twelve months, it is vital that organisations are able to dedicate increased resource to their Global Mobility programmes, allowing for more strategic focus.
DEMONSTRATING RETURN ON INVESTMENT
Part of the underlying reason why businesses typically view Global Mobility as a cost centre rather than a value centre is likely to be due to an inability to demonstrate the value of Global Mobility.
84.8% of Global Mobility professionals said they believe their Global Mobility programme delivers value for money. Yet few have the capability to articulate or demonstrate this value to their business.
A massive 72.0% of organisations said that they never or rarely measure Return on Investment on their assignments, thus making it virtually impossible to be seen as a value partner or build a case for increased investment in the department.
However, there is a distinct divide between companies where the Global Mobility professionals are ‘tactically focused’ and those where they are ‘strategically focussed’ (based on the activities they perform). ‘Strategic’ organisations are 26.8% more likely to measure ROI than their ‘tactical’ counterparts. See Fig 19.
SECTION ONE: KEY TRENDS
Of professionals believe their programme delivers
value for money.
84.8%
Say that mobility strategy is closely aligned with organisation’s strategy
25.9%
Fig 19. Measure ROI of assignments
TACTICAL
STRATEGIC
53.1%
21.3%
16.7%
26.3%
29.5%
28.2%
16.0%
Always 8.9%
Sometimes
Never
Rarely
Always
Sometimes
Never
Rarely

24 / 2015 Global Mobility Survey: Responsible Global Mobility
SELECTING APPROPRIATE SYSTEMS IS CRITICAL
Amongst Global Mobility professionals who are trying to measure ROI, there is widespread recognition that these measurements still leave much room for improvement. Less than one in seven organisations measuring ROI (12.9%) believe that the methodology they currently use is very useful; one in four (24.6%) think it’s not very useful.
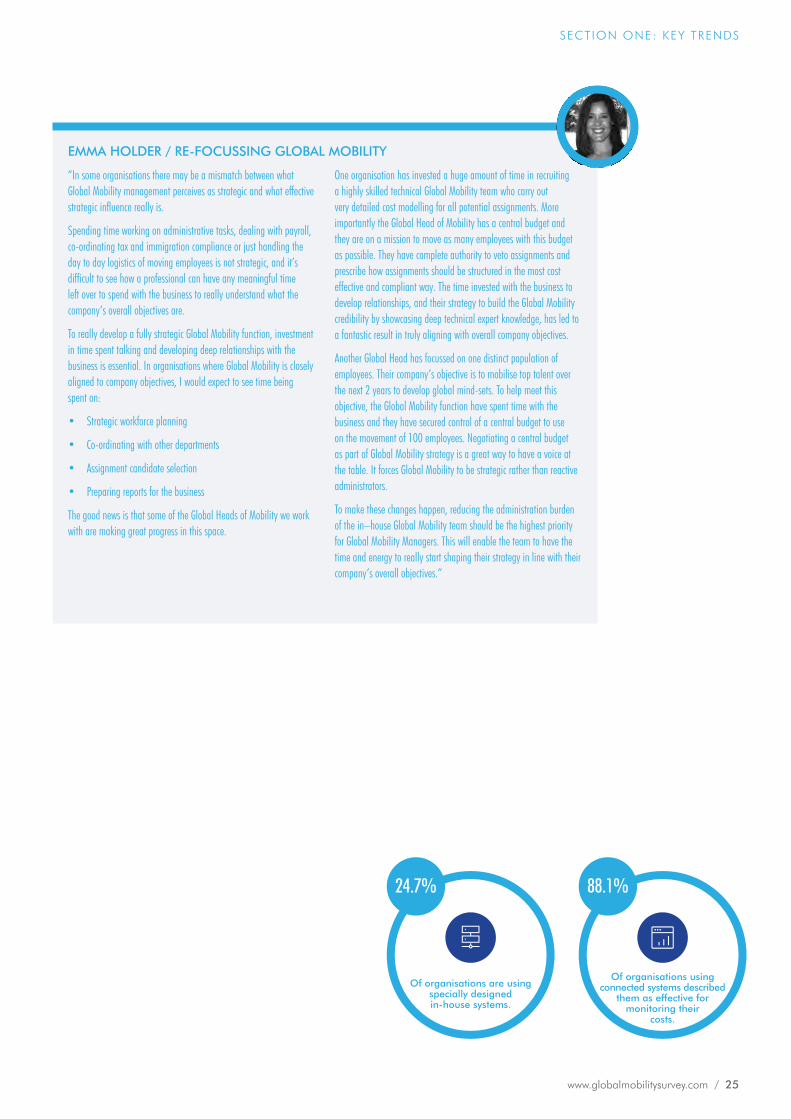
So where’s the methodology falling down? Perhaps part of the answer lies in the systems being used. Only 1 in 4 organisations (24.7%) are using specially designed in-house systems. Instead, the most commonly used system is everyday software such as Microsoft Excel (34.3%), with Big Four solutions (whether standard or customised) also representing a sizeable chunk. See Fig 20.
As a result, professionals are finding it very difficult to get timely, accurate insight with common complaints including ‘patchy data’ and the need for ‘time-consuming manual analyses’.
Once the assignee is on location, costs then need to be monitored throughout the assignment’s life; and again, the most commonly used system for doing so is everyday software like Microsoft Excel (37.8%). Here also, this is often failing to live up to the task. Only 7.8% describe everyday software as extremely effective for monitoring their costs whilst over one third (34.4%) say it is not very effective.
Instead, the most effective method appears to be utilising the power of a system that is connected across the entire business. 88.1% of organisations using connected systems describe them as effective at monitoring costs.
Having a globally connected system opens new possibilities for companies. At a basic level it enables Global Mobility functions to provide reporting to the business of spend and performance. This can be used to build a business case to demonstrate how Global Mobility delivers value to the organisation which can be used to create business cases for investment in Global Mobility. Further ahead there is even greater opportunity for utilising the power of ‘Big Data’ in relation to talent management and linking with other parts of the business.
Going forwards, measuring ROI will be vital for transforming business opinions of the Global Mobility function, for which connected systems and good data hold the key.
DAVID SCHOFIELD
“Demonstrating value to the business is a topic which resonates across the HR profession. For me, the way forward for Global Mobility
professionals to prove their value is partly around being in command of mobility data (numbers of assignees, cost of programmes, retention rates, return
on investment etc) and partly around having a commercial mind-set. Such a mind-set means trying to think like a CEO, or a Finance Director or a Head of Operations. What are their priorities and how can a mobility programme help to address these?
Measuring ROI (Return on Investment) is very important, but in reality over-complicated approaches can sometimes make the task seem impossible. I have found with a range of companies that a simpler, business-driven approach to ROI can work well. The twin focus
is on ‘Effective ROI’, i.e. whether the assignment achieves its objectives, and ‘Efficient ROI’, i.e. whether the overall cost is in line with predictions. This approach treats
a Global Mobility initiative like any other business investment, such as a new IT system or a marketing campaign and simply asks; ‘did it get the job done
at the expected cost?’
This approach requires objectives to be set and costs to be measured – which of course are good things.”
SECTION ONE: KEY TRENDS
Fig 20. Systems used to estimate assignment costs
34.3%
24.7%
17.0%
10.7%
5.7%
7.2%
Outsource to an external provider
Standard ‘Big 4’ system
Other
Customised ‘Big 4’ system
Specially designed in-house system
Everyday computer software (e.g. Microsoft Excel)
www.globalmobilitysurvey.com / 25
SECTION ONE: KEY TRENDS
Of organisations are using specially designed in-house systems.
24.7%
Of organisations using connected systems described
them as effective for monitoring their
costs.
88.1%
EMMA HOLDER / RE-FOCUSSING GLOBAL MOBILITY
“In some organisations there may be a mismatch between what Global Mobility management perceives as strategic and what effective strategic influence really is.
Spending time working on administrative tasks, dealing with payroll, co-ordinating tax and immigration compliance or just handling the day to day logistics of moving employees is not strategic, and it’s difficult to see how a professional can have any meaningful time left over to spend with the business to really understand what the company’s overall objectives are.
To really develop a fully strategic Global Mobility function, investment in time spent talking and developing deep relationships with the business is essential. In organisations where Global Mobility is closely aligned to company objectives, I would expect to see time being spent on:
• Strategic workforce planning
• Co-ordinating with other departments
• Assignment candidate selection
• Preparing reports for the business
The good news is that some of the Global Heads of Mobility we work with are making great progress in this space.
One organisation has invested a huge amount of time in recruiting a highly skilled technical Global Mobility team who carry out very detailed cost modelling for all potential assignments. More importantly the Global Head of Mobility has a central budget and they are on a mission to move as many employees with this budget as possible. They have complete authority to veto assignments and prescribe how assignments should be structured in the most cost effective and compliant way. The time invested with the business to develop relationships, and their strategy to build the Global Mobility credibility by showcasing deep technical expert knowledge, has led to a fantastic result in truly aligning with overall company objectives.
Another Global Head has focussed on one distinct population of employees. Their company’s objective is to mobilise top talent over the next 2 years to develop global mind-sets. To help meet this objective, the Global Mobility function have spent time with the business and they have secured control of a central budget to use on the movement of 100 employees. Negotiating a central budget as part of Global Mobility strategy is a great way to have a voice at the table. It forces Global Mobility to be strategic rather than reactive administrators.
To make these changes happen, reducing the administration burden of the in–house Global Mobility team should be the highest priority for Global Mobility Managers. This will enable the team to have the time and energy to really start shaping their strategy in line with their company’s overall objectives.”

26 / 2015 Global Mobility Survey: Responsible Global Mobility
Correct use of assignment type is critical to cost control and maximising return on investment. We’ve seen how, rightly or wrongly, there is significant emphasis on cost reduction within Global Mobility programmes. In line with this drive for cost optimisation, 37.4% of organisations report that they now continuously review their policies, and a further one third plan to conduct a formal review with the next year. See Fig 21.
Emerging from these reviews is a shift towards greater policy segmentation as businesses seek to reflect the requirement for policies to align more closely with the business and people drivers. In fact, nearly two-thirds of organisations (63.8%) now use different policies for different types of assignments. The only sector that varies significantly from this model is Government / Diplomatic Services who will often use a single policy (47.1%) – a reflection perhaps on how government policies adopt a more uniform approach?
Long-term assignments are the one assignment area in which the Standard Expatriate policy still dominates (used by 71.6%). See Fig 22.
PART 4. POLICY THE KEY TO IMPROVING RETURN ON INVESTMENT
Use different policiesfor different typesof assignments.
63.8%
10.9% of companiesdo not have polices
10.9%
Fig 21. Review of policies next due
Constant review
Next 6 months
6-12 months
12-24 months
No review date set
37.4%
18.2%
14.2%
13.2%
17.0%
Standard expatriate
Long-term on local packages
Localisation
Expat ‘Lite’
Permanent transfer
Localisation Plus
International local hire
Project
Local (Host)
Globalist
Specific to Partners
Rotational
Developmental/Graduate Program
Trainee
Extended Business Trip
Reduced Balance sheet
Commuter
Short Term
Fig 22. Policies used for long-term assignments
71.6%
26.1%
19.8%
18.2%
16.8%
15.7%
14.5%
13.0%
12.9%
12.5%
8.8%
7.1%
6.8%
5.1%
4.3%
4.0%
3.4%
2.5%

www.globalmobilitysurvey.com / 27
Here though, it is also interesting to note that Localisation and Localisation Plus policies are also prevalent (both used by 19.8% and 15.7% of companies respectively). This reflects a growing trend to focus on differentiating the business and people drivers of long term assignments – and whether it is principally for the benefit of the organisation, the employee or a combination of both.
In the short term policy landscape, there is a move towards refining the cost of packages to reflect the purpose of the assignment with the rise of Project, Extended Business, Trainee and Developmental / Graduate Programme policies. See Fig 23.
However, Standard Expatriate approaches still remain in prevalent use with just over 1 in 3 organisations adopting this policy for short-term assignments.
SECTION ONE: KEY TRENDS
Of companies use a singlepolicy approach
25.3%
One third of companiesexpect to review their
policies in the nextyear
32.4%
Short Term
Standard expatriate
Project
Extended Business Trip
Trainee
Developmental/Graduate Program
Expat ‘Lite’
Rotational
Commuter
Localisation
Specific to Partners
Reduced Balance sheet
Local (Host)
Localisation Plus
Globalist
International local hire
Long-term on local packages
Local (Host) Plus
Permanent transfer
Fig 23. Policies used for short-term assignments
57.3%
33.6%
32.9%
25.5%
21.6%
20.5%
18.5%
15.9%
8.2%
6.7%
6.4%
5.4%
5.3%
5.0%
4.7%
4.6%
4.6%
3.9%
2.2%
JOHN RASON
“The use of new policy types is particularly prevalent in the technology and consulting sectors, where the cost of short-term
mobility can be the difference between winning and losing projects and contracts. Equally, employees undertaking a graduate rotational
programme are unlikely to receive full short term assignment packages, hence the creation and growing adoption of
Development/Graduate Programme policies.”

28 / 2015 Global Mobility Survey: Responsible Global Mobility
Similarly, when it comes to commuter assignments, just over one half (56.2%) are using specific commuter policies. For the remainder, extended business trip and Standard Expatriate policies are widely used. See Fig 24.
For one-way assignments, the good news is that all seven of the most prevalently used policy types are based upon a permanent transfer or form of ‘local’ policy. However, there is wide variation in the types of ‘local’ policies used from ‘Localization’ to ‘International Local Hire’ and many organisations are using multiple different policy types. See Fig 25.
SECTION ONE: KEY TRENDS
Commuter
Extended Business Trip
Standard expatriate
Project
Expat ‘Lite’
Rotational
Short Term
Trainee
Developmental/Graduate Program
Globalist
Localisation Plus
International local hire
Reduced Balance sheet
Specific to Partners
Localisation
Local (Host) Plus
Local (Host)
Permanent transfer
Long-term on local packages
Fig 24. Policies used for commuter assignments
56.2%
22.5%
20.6%
18.7%
9.0%
8.2%
8.2%
6.0%
4.9%
4.5%
4.5%
3.7%
3.7%
3.7%
3.0%
2.6%
2.2%
1.5%
0.7%
Permanent transfer
Localisation
International local hire
Localisation Plus
Local (Host)
Local (Host) Plus
Long-term on local packages
Standard expatriate
Expat ‘Lite’
Project
Specific to Partners
Globalist
Extended Business Trip
Developmental/Graduate Program
Trainee
Reduced Balance sheet
Rotational
Short Term
Commuter
Fig 25. Policies used for one-way assignments
52.0%
38.7%
29.7%
29.7%
27.2%
21.4%
14.2%
13.0%
8.0%
5.9%
5.6%
5.0%
5.0%
4.3%
4.3%
4.0%
3.7%
3.4%
2.8%
JOHN RASON“It is not uncommon to see companies who will confess
to having employees on assignment on full expatriate conditions who have been in one location for up to 20 years!
Global Mobility has accountability to the business to eliminate this wastage by ensuring the correct policy and package is applied. This should be based on a continuous review of each new assignment business case and existing cases,
based on the requirements of the assignment.
To achieve this, Global Mobility must first be able to identify all their employees on assignment, be able to access full details of the assignment conditions and
have an effective process for assessing the assignment / policy suitability.
At the heart of this lies having a technology system that enables this. If this is not available within the organisation then this is an
opportunity to invest and develop a system that supports your Global Mobility function.”

www.globalmobilitysurvey.com / 29
JOHN RASON
“Smart application of policies can improve the ROI of your Global Mobility spend. ‘Segmentation and
Targeting’ is key to this, whereby assignment types are more correctly segmented by business drivers and relevant policy types are
developed to accurately target the need of each assignment is now seen as a key enabler for Global Mobility.
Segmentation and Targeting offers an effective means of reducing total programme costs without jeopardising assignment quality. As such, traditional short-term and long-term policies are being augmented
with additional policies to reflect the increasing assignment diversity. The trick is in how companies effectively segment
the policies they create to meet these needs and how accurately they are at targeting.”
POLICY SEGMENTATION & TARGETING
So policy segmentation is growing in favour as organisations look to optimise their costs, and with increasingly diverse global workforces, there is compelling justification:
• Four generations are now concurrently in the global workforce
• There is a constantly changing geo-political landscape of emerged and emerging economies
• Emerging economies are often now the new headquarters for outbound assignees and traditional western-based policies may not reflect the social and cultural requirements of this assignee population.
Earlier in this report, we noted how 35.6% of professionals felt that evaluating expatriate vs. local hire options should be one of the activities they spend most time on. This is indicative of businesses waking up to the fact that traditional approaches may no longer be the optimum solution, and as such the trend for targeted policy types is likely to grow.
However, it is worth noting that there is a danger for smaller Global Mobility programmes to over-complicate policy options, resulting in an ‘unwieldy’ array of difficult to manage policies for what in reality may be a small internationally-mobile workforce.
The larger programmes (with 250 plus assignees) are more likely to have sufficient headcount to effectively manage a wider range of policies. For others, the ‘keep it simple’ mantra may reflect why traditional policies remain in popular use. It is a difficult paradox. With local market salaries in emerging economies often now matching and exceeding their western economy counterparts, adopting a local-plus package instead of a traditional policy could actually be significantly more costly for the organisation. But having the time and resources to evaluate this in detail for smaller programmes could be fraught with pitfalls.
What is clear is that the modern-day Global Mobility professional has a wide-range of policies available with which to implement cost-effective Global Mobility and it is vital that the correct policy is selected depending upon the type of assignment. However, what is also clear is that for many organisations there is still a mismatch occurring when it comes to aligning the assignment requirement with the optimum policy.
SECTION ONE: KEY TRENDS
A ‘keep it simple’mantra may reflect why traditional
policies remain popular

30 / 2015 Global Mobility Survey: Responsible Global Mobility
RE-EVALUATING COMPENSATION BY ASSIGNMENT REQUIREMENTS
Even once you’ve navigated this world of varying policy approaches though, the complexity doesn’t end there. Virtually all organisations (93.8%) also employ multiple compensation approaches, varying the contents of assignment packages depending upon the circumstances of the individual assignee.
Of course, in itself this is not a particularly new phenomenon – assignment packages have historically been designed to reflect the seniority of the assignee and the ‘risk’ or ‘hardship’ level of the destination. However, the causes of package variations are now changing. Nearly two-thirds of organisations (59.8%) no longer consider seniority as part of the package deliberation; instead, growing numbers are turning towards more ‘situation-specific’ determinants, such as whether the assignee volunteered or was nominated for the assignment (28.5%). See Fig 26.
In particular, white collar industries such as Legal (69%) and Professional Services (57%) are more likely to use measures such as whether the assignment was voluntary or nominated, whereas blue-collar industries such as Tobacco (100%) and Mining (79%) are more likely to still be working by seniority.
This highlights the need for Global Mobility professionals to remain closely connected with their business and HR/talent counterparts to ensure the right compensation and policy approach as circumstances evolve.
Going forwards this means that there will continue to be cultural and professional differences in the packages required to attract, re-deploy and retain an internationally-mobile workforce. As the next generation of talent enters into the global workplace, it is likely that their career aspirations will demand an international experience, whether or not this is sponsored by their employer. On the other hand, motivating technical specialists and executives to accept assignments in unstable geo-political economies may still require hardship and other incentives to ensure timely delivery of projects and new ventures.
THE RISE OF DISCRETIONARY BENEFITS
So what does this mean in terms of package contents? Whilst certain benefits, such as immigration visas and work permits, are still nearly always included in compensation packages (95%), other features, such as school fees, language training, accompanying partner assistance, cultural training and hardship allowances, may be included or excluded in any package at the organisation’s discretion depending on the individual circumstances and the business case for the assignment. See Fig 27.
SECTION ONE: KEY TRENDS
Do not consider seniority as part of the compensation
package deliberation
59.8%
Fig 26. Criteria for varying compensation approach
40.2%
39.2%
31.7%
28.5%
23.2%
21.8%
16.8%
3.3%
Grade / seniority
Hardship destination
Employee development vs. business need
Voluntary vs. nominated assignment
Intra- vs. inter-regional
National vs. international
Business unit of assignee
Other

www.globalmobilitysurvey.com / 31
Exactly who ‘owns’ the discretion for determining assignment packages though is an interesting question. The management of the majority of Global Mobility programmes are handled on a regional basis (i.e. Middle-Eastern-based personnel coordinate assignments in the Middle East, etc.); however, if you’re based in the USA (72%) or Europe (58%) then you’re much more likely to have a global remit. See Fig 28.
This differentiation is likely to be important. Single, global coordination should lead to increased compliance and cost efficiencies; however, if implemented poorly it can also lead to bureaucracy overriding common-sense and a failure to recognise individual circumstances.
SECTION ONE: KEY TRENDS
Employ a multiple compensation
approach
93.8%
Fig 27. Contents of assignment benefits packages(those who vary compensation approaches)
Always included
Included at discretion
Immigration visas / work permits
Medical / health cover
Temporary housing
Household good moving
Relocation allowance
Tax briefing and equalisation
Social Security
Pay arrangements
Cost of Living Allowance
Destination services
Settling in support
School fees
Language training
Accompanying partner assistance
Housing norm
Cultural training
Hardship allowance
Tenancy management
Insurance
International banking services
Career management / mentoring
Property management
Negative CoLA
Home sale (funded)
95% 3%
8%88%
18%78%
16%76%
72%
71%
67%
66%
62%
58%
54%
46%
40%
40%
37%
34%
32%
31%
29%
23%
22%
19%
16%
8%
19%
15%
12%
11%
23%
27%
24%
42%
39%
36%
21%
38%
37%
24%
20%
22%
25%
24%
20%
24%
North America
Europe
Pacific
Middle East
Asia
Africa
South America
Fig 28. Professionals with a global remit by region personally-based
72.3%
57.8%
34.8%
29.4%
21.3%
20.0%
15.4%

32 / 2015 Global Mobility Survey: Responsible Global Mobility
• Data analytics: understanding what metrics and data are valuable to executive leadership.
I. When presenting Global Mobility to the business use similar business language and data that your CEO would use to present to their Board or shareholders.
II. Shift the discussion from ‘cost authorisations for assignments’ to ‘assignment investment plans’. Isn’t this the start of Return on Investment discussions?
III. The leading-edge organisations have also put in place mentor programmes to ensure their talent remain connected throughout the assignment period.
IV. Organisations probably do possess the data required to demonstrate value to the business. The big problem is being able to access and manage that data across multiple sources (especially for companies who are de-centralised or use basic Excel spreadsheets to run their programmes). Options exist to buy tailored Global Mobility software or indeed have this provided as part of a broader organisational review of the mobility function. Investing capital in buying a system (with implementation costs) plus operational software licence costs should be considered versus an operational cost of delivery via a Global Mobility management company; decisions that will be different for every organisation.
• Policy alignment: segment assignments based on benefits sought from the assignment rather than just seniority or grade of the employee. For example; is it initiated by the organisation to achieve specific business objectives, part of employee development plan or self-initiated by the employee for personal benefit?
I. Engage business and senior HR stakeholders in challenging the business and talent objectives for Global Mobility.
II. Segment policy types and benefits to enable all stakeholders to re-focus their ‘line of sight’ between assignment goals and developmental benefits for the employee.
III. Consider whether Talent Management and Global Mobility should jointly engage on policy development.
IV. Consider whether you are able to assess the policy impact on cost to the business by re-aligning policy types and conditions – doing more with less could be an achievable goal?
PART 5. RECOMMENDATIONS
This year’s survey identified key trends and critical challenges that are being faced by businesses and their Global Mobility functions worldwide. The following recommendations have been developed in order to address some of these issues.
ENABLING GLOBAL MOBILITY TEAMS TO CREATE VALUE AT A STRATEGIC LEVEL
1 0 1 0 00 1 0 1 0 1 0 1 0 10 1 1 0 0 11 0
1 0 1 0 1 0 1 0 1 0 1 1 0 1

www.globalmobilitysurvey.com / 33
• Global Mobility roles and responsibilities: how can the Global Mobility function be more strategic when they are resource constrained?
I. Consider if you should ‘Make’ or ‘Buy’ the solutions your Global Mobility challenges based on;
i. Existing internal competencies
ii. Do these align with the executive leadership’s expectation for Global Mobility?
iii. What are the activities that are mission-critical that can only be executed internally and does this vary region or business lines?
iv. Would partnering with a specialist company (single or multiple services) improve the effieciency of your business?
v. Is there a broader change transformation that should include Global Mobility – especially as Global Mobility can sometimes been as an ‘ivory tower’?
vi. Structurally, to whom should the Global Mobility function report into? HR, Centre of Excellence, Talent – or a Global Mobility Department in its own right - with a Profit Centre accountability rather than a Cost Centre (fixed overhead)?
• Duty of Care - Review your current Duty of Care to ensure that personal risk receives the level of consideration it deserves. Consider the following as part of your review:
I. Having a clearly defined, Duty of Care policy and standard operating procedures for critical incidents creates an organisational focus on considering employees not as resources but as human beings, who care about their work and their company.
II. Undertaking a strategic risk review of all forms of mobility ensures that there is a proactive approach to managing duty of care. How many business travellers do you have? One global business recently estimated they have 4,500 business travellers in addition to their Global Mobility programme.
III. Recognising Duty of Care as a pro-active opportunity to contribute to your employer brand may facilitate you being able to hire technical talent to work in unstable countries. Showing the CEO that Global Mobility has contributed to the Talent agenda and achievement of entrepreneurial objectives can only enhance business recognition of the value that the Global Mobility function can create for the organisation.
IV. Instilling a raised level of consciousness for management, employees and communicating this with broader stakeholders (such as investors) is something that the extraction and manufacturing industries have been pioneering for decades. For many emergent industries, there is perhaps a greater naivety and laissez-faire approach. It only takes one crisis to have substantial impact on all levels of the organisation. If you fail to prepare, prepare to fail.
V. Invest in a global critical incident specialist partner BUT having clearly defined policies, crisis plans and roles and authorities must go hand in hand with the specialist partnering.
SECTION ONE: KEY TRENDS
1 0 1 0 00 1 0 1 0 1 0 1 0 10 1 1 0 0 11 0
1 0 1 0 1 0 1 0 1 0 1 1 0 1

34 / 2015 Global Mobility Survey: Responsible Global Mobility
METHODOLOGY
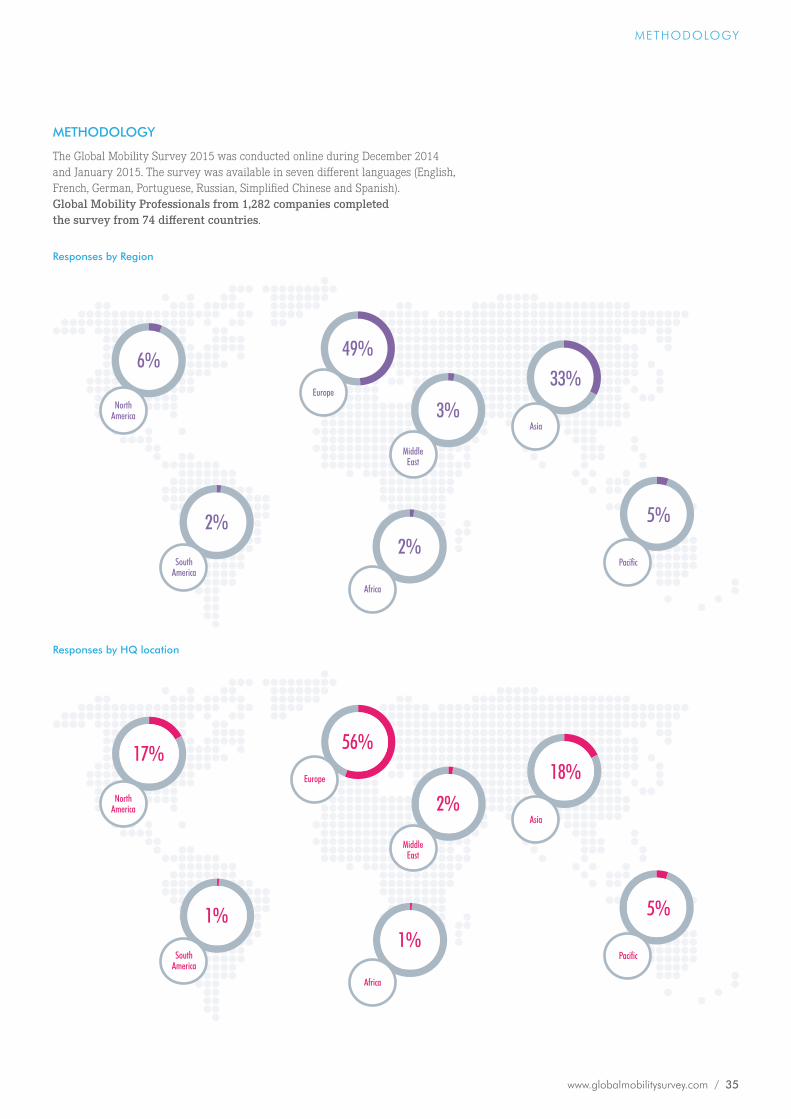
www.globalmobilitysurvey.com / 35
METHODOLOGY
METHODOLOGY
The Global Mobility Survey 2015 was conducted online during December 2014 and January 2015. The survey was available in seven different languages (English, French, German, Portuguese, Russian, Simplified Chinese and Spanish). Global Mobility Professionals from 1,282 companies completed the survey from 74 different countries.
Responses by Region
6% 49%
2%2%
3%
33%
5%
NorthAmerica
MiddleEast
Europe
Asia
Pacific
Africa
SouthAmerica
Responses by HQ location
17% 56%
1%1%
2%
18%
5%
NorthAmerica
MiddleEast
Europe
Asia
Pacific
Africa
SouthAmerica
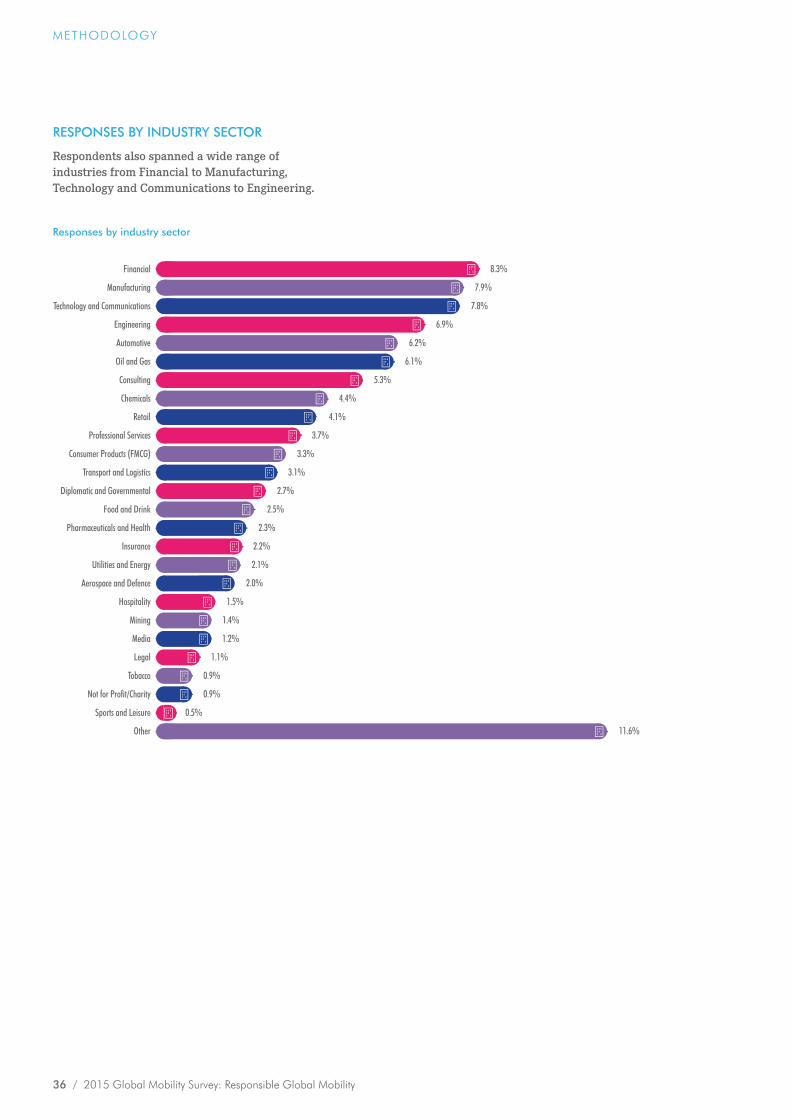
36 / 2015 Global Mobility Survey: Responsible Global Mobility
METHODOLOGY
RESPONSES BY INDUSTRY SECTOR
Respondents also spanned a wide range of industries from Financial to Manufacturing, Technology and Communications to Engineering.
Responses by industry sector
Financial
Manufacturing
Technology and Communications
Engineering
Automotive
Oil and Gas
Consulting
Chemicals
Retail
Professional Services
Consumer Products (FMCG)
Transport and Logistics
Diplomatic and Governmental
Food and Drink
Pharmaceuticals and Health
Insurance
Utilities and Energy
Aerospace and Defence
Hospitality
Mining
Media
Legal
Tobacco
Not for Profit/Charity
Sports and Leisure
Other
8.3%
7.9%
7.8%
6.9%
6.2%
6.1%
5.3%
4.4%
4.1%
3.7%
3.3%
3.1%
2.7%
2.5%
2.3%
2.2%
2.1%
2.0%
1.5%
1.4%
1.2%
1.1%
0.9%
0.9%
0.5%
11.6%

www.globalmobilitysurvey.com / 37
METHODOLOGY
PARTICIPATING ORGANISATIONS
Below is a list of some of the organisations who took part in the survey*:
A.RaymondAB InbevABBABT Associates Inc.Acciona AguaAccor Asia PacificAdeoAdidasAeon Asia Sdn BhdAFPAIAAir FranceAirbus HelicoptersAker SolutionsAkzo NobelAlbemarleAldiAllianz Of AmericaAllnexAlstomAlter DomusAmdatex Las PiñasAna BalatANZArupAS AvocatsAtensoAtkinsAtlas CopcoAusencoAusyAvery DennisonAXAAzimut HotelsBahrain PetroleumBam DecorientBanco De SabadellBanco SantanderBASFBATBC AgBendigo BankBentelerBesixBharti Airtel BIABlizzard EntertainmentBNP ParibasBody Fashion ThailandBody ShopBrambles LimitedBrigestoneBA TobaccoBrunel EnergyBühler AgBupaBystronic Laser AgCabot CorporationCamoplast SolidealCargillCarlsberg GroupCB&ICentricaCG Power SystemsCGD
CGIChevron PhillipsCimporCitibankClariantCNH IndustrialCoatsCoca-ColaCollinson GroupColt Technology Comsa EmteCotecna Inspection SaCovanceCSG InternationalCushman & WakefieldCytec Industries Inc.DanfossDanoneDassault SystèmesDavitaDaymon WorldwideDBS BankDelfingen Pt PortoDellDFSDHLDigicel GroupDLA PiperDoosan BabcockDouwe EgbertsDow Chemicals DTC SASDysonEaton InvestmentEC HarrisEDAEdconElastomer Solutions Electricfil AutomotiveEliaEmbraer ChinaEtisalatEnagasEncoreEnel IngegneriaEnersisEquifaxERMEuroclearEurolux AccountingEuronewsEverisEVNFCAFederal-Mogul FedexFerrovialFiege LtdFlextronicsFluor Arabia LimitedFMCFrieslandcampinaFuji XeroxFujitsuG&S
GabeGeneral MotorsGeoxGoodyear DunlopGraincorpGrant ThorntonGroupamaGroupe LactalisGroupmGrupo AgbarGrupo Antolin IrausaGrupo CodorniuGrupo VendapGruppo CampariGulfstream Aerospace Hager ElectroHalliburtonHasbro IncHaworthHeineken InternationalHempelHenkelHima AustraliaHindujaHolcim PhilsHK and China Gas HovioneHSBCHuntsmanHutchinsonIATAIBL ConsultingIgate Global SolutionsIHGINGIngersoll Rand IntelIntertrustInti Brunel TeknindoI-O & YTIpsos MoriIT OneITXJacobsJohnson ControlsJohnson MattheyKellogg CompanyKelly Services Inc.KerajetKeycooptKnauf InsulationKnorr-BremseKrauss Maffei GroupLanxessLenovo GroupLeoni Wiring SystemsLhoist GroupLiberty GlobalLiberty MutualLinde WiemannLindtLloyd’s RegisterL’OréalLR-SenergyLSM
Lucite InternationalLYMHMaersk OilMAN Truck & BusManitowoc CompanyManulifeMayer BrownMBDAMelexis TechnologiesMeliá Hotels Mercedes BenzMicron TechnologyMicrosourcingMinter EllisonMitsui ChemicalsMOL GroupMSD VietnamMTRMultichoiceMwh Global Inc.NavantiaNCI AgencyNestleNetappNewrestNexteer AutomotiveNissanNokiaNovelisNutrecoNutrixoNXP SemiconductorsNYU ShanghaiO3B NetworksOcé-Technologies OdebrechtOdgers BerndtsonOlympus CorporationOms Holdings Pte LtdOwens CorningPagegroupPanafric GlobalPanalpinaParexel InternationalPernod RicardPetrofac LimitedPeugeot CitroenPfizerPorrProspectiuniPVH CorpQBEQinetiq LtdQuest GlobalReed ElsevierRepsolRicardo PlcRiversideRlg InternationalRockwell CollinsRohde & SchwarzRowan CompaniesRBSSageSaint-Gobain Glass
SamsungSanofiSAPSBM OffshoreSCASCG Chemicals Co.Schneider ElectricSemperit Ag HoldingSener IngenieriaServier RussieSESSiikaSopra BankingStandard LifeState StreetStatoilStratasys Ap LimitedSuez EnvironnementSun LifeSuncorpSydha Logistix Takeda Talanx AgTarget AustraliaTechnip IberiaTelefonicaTelventTemenosTescoThe World Banktheconnectconcept.comThought 2 Finish Ltd.TOTALTransfield ServicesTransit MarillTransworldTrouw Nutrition TSWPTui Travel A&DTurner International LlcTuv RheinlandUbifranceUcb SaValeoVanderlande IndustriesVifor PharmaVinx Malaysia Sdn BhdVodafoneVorwerk & Co. KgWabcoWallem Services WalmartWebasto RoofWebster ViennaWelltec Oilfield Wipro LtdWood GroupWorleyparsonsWPPYokogawa EngineeringYves Rocher VostokZurich Insurance
*Organisation names recorded voluntarily.

SECTION TWO: THE FULL RESULTS
38 / 2015 Global Mobility Survey: Responsible Global Mobility
02

www.globalmobilitysurvey.com / 39
SECTION TWO: THE FULL RESULTS
Q1. Which of the following best describes the primary industry in which your organisation operates?
Financial
Manufacturing
Technology and Communications
Engineering
Automotive
Oil and Gas
Consulting
Chemicals
Retail
Professional Services
Consumer Products (FMCG)
Transport and Logistics
Diplomatic and Governmental
Food and Drink
Pharmaceuticals and Health
Insurance
Utilities and Energy
Aerospace and Defence
Hospitality
Mining
Media
Legal
Tobacco
Not for Profit/Charity
Sports and Leisure
Other
8.3%
7.9%
7.8%
6.9%
6.2%
6.1%
5.3%
4.4%
4.1%
3.7%
3.3%
3.1%
2.7%
2.5%
2.3%
2.2%
2.1%
2.0%
1.5%
1.4%
1.2%
1.1%
0.9%
0.9%
0.5%
11.6%
Base: All respondents (1282)
Q2. In which country is your organisation headquartered? Grouped by region
Europe
Asia
North America
Australasia
Middle East
Africa
South America
56.0%
18.0%
17.0%
5.0%2%
1% 1%
Base: All respondents (1282)

40 / 2015 Global Mobility Survey: Responsible Global Mobility
SECTION TWO: THE FULL RESULTS
Q4A. Which of the following regions is your department responsible for?
Global - all regions
Asia
Europe
Middle East
Africa
North America
Pacific
South America
Local country(ies) only
43.4%
22.9%
17.2%
6.5%
6.4%
6.1%
5.8%
3.0%
16.5%
Base: All respondents (1282)
Q3. And in which country is the respondent based? Grouped by region
Europe
Asia
North America
Australasia
Middle East
Africa
South America
49%
33%
6%
5%3%2%2%
Base: All respondents (1282)

www.globalmobilitysurvey.com / 41
SECTION TWO: THE FULL RESULTS
Q4B. Which of the following regions is your department responsible for? Split by location of respondent
North American
European
Australasian
Middle Eastern
Asian
African
South American
Base: All respondents (1282)
0% 10% 20% 30% 40% 50% 60% 70% 80%
Global – all regions
Europe
Asia
North America
Pacific
Africa
Middle East
South America
Local country(ies) only
Programmesmanaged from:

42 / 2015 Global Mobility Survey: Responsible Global Mobility
SECTION TWO: THE FULL RESULTS
Global Mobility Specialist
HR Generalist / HR Business Partner
General Management (business unit)
Compensation & Benefits
Talent Management
Other
Q5. Which of the following best describes your job role?
32.2%
25.4%
11.8%
13.0%
14.9%
2.7%
Base: All respondents (1282)
Q6A. How closely aligned do you think your Global Mobility strategy is with your company’s overall objectives?
25.9%
51.9%
19.0%
3.2%
Very closely aligned
Quite closely aligned
Not very closely aligned
Not at all aligned
Base: All respondents (1282)
Q6B. How closely aligned do you think your Global Mobility strategy is with your company’s overall objectives?
0%
10%
20%
30%
40%
50%
60%
70%
80%
90%
100%
Finan
cial
Tech
nolog
y and
..
Manu
factur
ing
Autom
otive
Oil a
nd G
as
Cons
ulting
Chem
icals
Engin
eerin
g
Diplo
matic
and G
over
nmen
tal
Retai
l
Food
and D
rink
Cons
umer
Prod
ucts
(FMC
G)
Aero
spac
e and
Defe
nce
Insu
ranc
e
Profe
ssion
al Se
rvices
Trans
port
and L
ogist
ics
Phar
maceu
ticals
and H
ealth
Utilit
ies an
d Ene
rgy
Toba
cco
Not f
or Pr
ofit/C
harit
y
Spor
ts an
d Leis
ure
Lega
l
Minin
g
Media
Hosp
itality
Very closely aligned
Quite closely aligned
Not very closely aligned
Not at all aligned

www.globalmobilitysurvey.com / 43
SECTION TWO: THE FULL RESULTS
Q7A. Below is a list of activities that your Global Mobility management team might undertake. Please indicate which 5 of these activities take up most of your time.
Other
Managing department IT System
Assignment Candidate selection
Non mobility HR activities
Strategic workforce planning
Preparing reports for the business
Recruitment
Employment law
Evaluation of expatriate vs. local hire options
Expense Management
Removals and household goods
Supplier Management
Payroll
Relocation Destination Services
Coordinating with other departments
Assignment management
Immigration Compliance
Tax Compliance
Assignment Compensation & Benefits
Assignment Administration 47.7%
47.6%
44.5%
43.3%
42.7%
36.9%
27.1%
22.9%
19.0%
18.4%
18.1%
17.7%
16.3%
14.9%
14.5%
12.3%
9.7%
5.1%
4.1%
Base: All respondents (1282)

44 / 2015 Global Mobility Survey: Responsible Global Mobility
SECTION TWO: THE FULL RESULTS
0% 10% 20% 30% 40% 50% 60% 70%
Q7B. Below is a list of activities that your Global Mobility management team might undertake. Please indicate which 5 of these activities take up most of your time.
Other
Managing department IT System
Assignment Candidate selection
Non mobility HR activities
Strategic workforce planning
Recruitment
Preparing reports for the business
Employment law
Expense Management
Removals and household goods
Evaluation of expatriate vs. local hire options
Supplier Management
Payroll
Relocation Destination Services
Coordinating with other departments
Assignment management
Immigration Compliance
Tax Compliance
Assignment Compensation & Benefits
Assignment Administration
Global Mobility Specialist
HR Generalist
General Management
Compensation & Benefits
Role:

www.globalmobilitysurvey.com / 45
SECTION TWO: THE FULL RESULTS
Q8A. And please indicate the top 5 activities that, in your opinion, the Global Mobility management team should be spending most time on.
50.2%
48.9%
46.7%
35.6%
35.1%
34.0%
29.2%
28.4%
27.0%
21.7%
18.2%
17.9%
15.9%
15.1%
10.8%
10.8%
10.2%
4.4%
3.3%
Other
Managing department IT System
Non mobility HR activities
Removals and household goods
Payroll
Recruitment
Expense Management
Supplier Management
Preparing reports for the business
Employment law
Relocation Destination Services
Assignment Candidate selection
Coordinating with other departments
Assignment Administration
Tax Compliance
Immigration Compliance
Evaluation of expatriate vs. local hire options
Assignment Compensation & Benefits
Strategic workforce planning
Assignment management
3.4%
Base: All respondents (1282)

46 / 2015 Global Mobility Survey: Responsible Global Mobility
SECTION TWO: THE FULL RESULTS
0% 10% 20% 30% 40% 50% 60% 70%
Q8B. And please indicate the top 5 activities that, in your opinion, the Global Mobility management team should be spending most time on.
Other
Managing department IT System
Non mobility HR activities
Recruitment
Removals and household goods
Payroll
Expense Management
Supplier Management
Preparing reports for the business
Employment law
Relocation Destination Services
Assignment Candidate selection
Coordinating with other departments
Assignment Administration
Tax Compliance
Immigration Compliance
Evaluation of expatriate vs. local hire options
Strategic workforce planning
Assignment Compensation & Benefits
Assignment management
Global Mobility Specialist
HR Generalist
General Management
Compensation & Benefits
Role:

www.globalmobilitysurvey.com / 47
SECTION TWO: THE FULL RESULTS
1 – 25
26 - 50
51 - 100
101 - 250
251 - 500
501 - 1000
1001+
Q9A. Approximately how many expats/assignees does your organisation have in total worldwide?
25.6%
14.0%
14.4%
13.9%12.6%
10.7%
8.8%
Base: All respondents (1282)
Q9B. Approximately how many expats/assignees does your organisation have in total worldwide?
0%
10%
20%
30%
40%
50%
60%
70%
80%
90%
100%
Man
ufac
turin
g
Tech
nolo
gy a
nd C
omm
unic
atio
ns
Auto
mot
ive
Cons
ultin
g
Fina
ncia
l
Engi
neer
ing
Oil
and
Gas
Util
ities
and
Ene
rgy
Prof
essi
onal
Ser
vice
s
Food
and
Drin
k
Tran
spor
t and
Log
istic
s
Phar
mac
eutic
als a
nd H
ealth
Reta
il
Chem
ical
s
Cons
umer
Pro
duct
s (FM
CG)
Aero
spac
e an
d D
efen
ce
Insu
ranc
e
Dip
lom
atic
and
Gov
ernm
enta
l
Not
for P
ro�t
/Cha
rity
Hos
pita
lity
Lega
l
Min
ing
Med
ia
Toba
cco
Spor
ts a
nd L
eisu
re
1001+
501 - 1000
251 - 500
101 - 250
51 - 100
26 - 50
1 - 25

48 / 2015 Global Mobility Survey: Responsible Global Mobility
SECTION TWO: THE FULL RESULTS
1 – 25
26 - 50
51 - 100
101 - 250
251 - 500
501 - 1000
1001+
Q10. And approximately how many assignments has yourorganisation authorised in the last 12 months?
51.3%
2.6% 3.6%6.1%
14.5%
12.6%
9.3%
Base: All respondents (1282)
Q11A. How does this compare with the number of assignments authorised in the previous 12 month period?
14.2%
28.7%
5.5%
38.9%
12.7%A significant increase
A slight increase
No real change
A slight decrease
A significant decrease
Base: All respondents (1282)
Q11B. How does this compare with the number of assignments authorised in the previous 12 month period?
0%
10%
20%
30%
40%
50%
60%
70%
80%
90%
100%
Engin
eerin
g
Tech
nolog
y and
Comm
unica
tions
Oil a
nd G
as
Cons
ulting
Chem
icals
Finan
cial
Autom
otive
Manu
factur
ing
Food
and D
rink
Profe
ssion
al Se
rvice
s
Insur
ance
Cons
umer
Prod
ucts
(FMCG
)
Diplo
matic
and G
overn
menta
l
Trans
port
and L
ogist
ics
Retai
l
Utilit
ies an
d Ene
rgy
Phar
maceu
ticals
and H
ealth
Aeros
pace
and D
efenc
e
Lega
l
Media
Hosp
itality
Minin
g
Sport
s and
Leisu
re
Not f
or Pr
ofit/C
harit
y
Toba
cco
A significant decrease
A slight decrease
No real change
A slight increase
A significant increase

www.globalmobilitysurvey.com / 49
SECTION TWO: THE FULL RESULTS
Q12. And do you expect the number of assignments authorised to increase or decrease over the next 12 month period?
10.2%
35.0%
4.8%
34.4%
15.6%A significant increase
A slight increase
No real change
A slight decrease
A significant decrease
Base: All respondents (1282)
1.4%
1.4%
1.4%
1.5%
1.6%
1.8%
1.9%
2.0%
2.0%
2.7%
2.8%
3.1%
3.2%
3.6%
3.7%
4.2%
5.1%
7.0%
10.4%
12.8%
South Africa
Belgium
Philippines (The)
Canada
Russia
Indonesia
Switzerland
Malaysia
Thailand
United Arab Emirates
Brazil
India
France
Australia
Hong Kong
Germany
Singapore
United Kingdom
China (Mainland)
United States of America
Q13A. What are likely to be the three most common assignment destinations for your organisation over the coming 12 months?
Base: All respondents (1282)
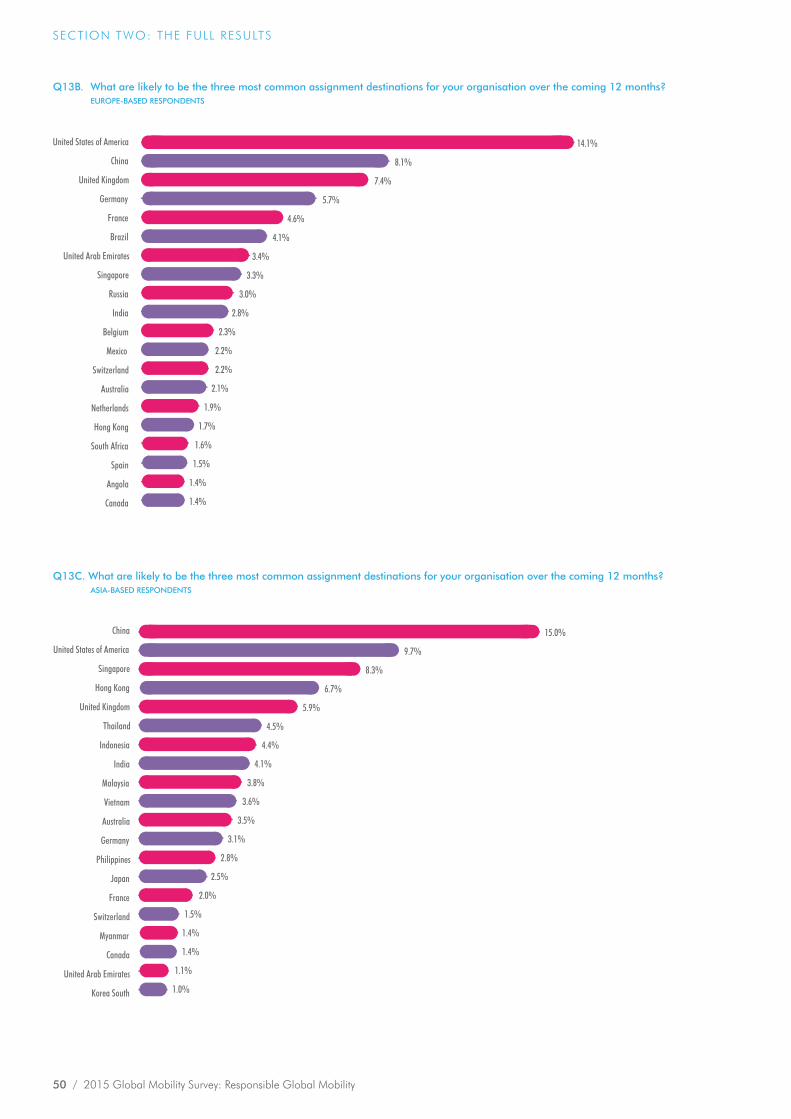
50 / 2015 Global Mobility Survey: Responsible Global Mobility
SECTION TWO: THE FULL RESULTS
Q13B. What are likely to be the three most common assignment destinations for your organisation over the coming 12 months? EUROPE-BASED RESPONDENTS
Canada
Angola
Spain
South Africa
Hong Kong
Netherlands
Australia
Switzerland
Mexico
Belgium
India
Russia
Singapore
United Arab Emirates
Brazil
France
Germany
United Kingdom
China
United States of America
1.4%
1.4%
1.5%
1.6%
1.7%
1.9%
2.1%
2.2%
2.2%
2.8%
3.0%
3.3%
3.4%
4.1%
4.6%
5.7%
7.4%
8.1%
14.1%
2.3%
Q13C. What are likely to be the three most common assignment destinations for your organisation over the coming 12 months? ASIA-BASED RESPONDENTS
Korea South
United Arab Emirates
Canada
Myanmar
Switzerland
France
Japan
Philippines
Germany
Australia
Vietnam
Malaysia
India
Indonesia
Thailand
United Kingdom
Hong Kong
Singapore
United States of America
China
1.0%
1.1%
1.4%
1.4%
1.5%
2.0%
2.5%
2.8%
3.1%
3.5%
3.6%
3.8%
4.1%
4.4%
4.5%
5.9%
6.7%
8.3%
9.7%
15.0%

www.globalmobilitysurvey.com / 51
SECTION TWO: THE FULL RESULTS
1.3%
1.3%
1.3%
1.3%
1.3%
1.3%
1.8%
1.8%
2.2%
2.7%
2.7%
2.7%
2.7%
3.1%
3.6%
4.4%
6.7%
7.6%
13.8%
18.7%
Q13D. What are likely to be the three most common assignment destinations for your organisation over the coming 12 months? NORTH AMERICA-BASED RESPONDENTS
Philippines
Japan
France
Korea South
Netherlands
Ireland
India
Germany
Switzerland
Hong Kong
Australia
South Africa
Mexico
Malaysia
Canada
Brazil
Singapore
United Kingdom
China
United States of America
Q13E. What are likely to be the three most common assignment destinations for your organisation over the coming 12 months? AUSTRALASIA-BASED RESPONDENTS
1.2%
1.2%
1.2%
1.2%
1.2%
1.2%
1.2%
1.2%
2.4%
2.4%
2.4%
3.0%
3.0%
3.6%
5.4%
6.6%
6.6%
9.6%
12.6%
23.4%
Malaysia
Germany
Korea South
Thailand
United Arab Emirates
Saudi Arabia
Peru
Mongolia
South Africa
India
Indonesia
Canada
Philippines
New Zealand
Singapore
China
Hong Kong
United Kingdom
United States of America
Australia

52 / 2015 Global Mobility Survey: Responsible Global Mobility
SECTION TWO: THE FULL RESULTS
Q14A. And which countries do you find are typically the most challenging relocation destinations?
1.3%Mexico
1.3%Switzerland
1.4%Japan
1.4%Australia
1.4%France
1.5%Algeria
1.6%Nigeria
1.7%Afghanistan
1.9%Vietnam
2.1%United Arab Emirates
2.1%Angola
2.2%South Africa
2.3%United Kingdom
2.5%Saudi Arabia
3.2%Indonesia
4.7%United States of America
5.1%Brazil
5.2%Russia
7.3%India
11.6%China (Mainland)
Base: All respondents (1282)
Q14B. And which countries do you find are typically the most challenging relocation destinations? EUROPE-BASED RESPONDENTS
1.4%
1.4%
1.5%
1.5%
1.6%
1.8%
1.8%
1.9%
2.1%
2.2%
2.2%
2.2%
2.4%
3.0%
3.0%
5.7%
6.5%
6.6%
7.1%
8.8%
Australia
Singapore
Kazakhstan
Turkey
Nigeria
Algeria
Switzerland
Mexico
Saudi Arabia
Angola
France
Germany
South Africa
United Arab Emirates
United Kingdom
India
Brazil
United States of America
Russia
China

www.globalmobilitysurvey.com / 53
SECTION TWO: THE FULL RESULTS
Q14C. And which countries do you find are typically the most challenging relocation destinations? ASIA-BASED RESPONDENTS
1.4%
1.5%
1.6%
1.7%
1.9%
1.9%
2.1%
2.4%
2.5%
2.6%
2.8%
2.9%
2.9%
3.6%
4.1%
4.6%
6.0%
6.8%
8.5%
13.3%
France
Cambodia
United Arab Emirates
Philippines
Japan
Myanmar
Brazil
Afghanistan
Australia
Malaysia
Germany
Hong Kong
Thailand
Singapore
United Kingdom
Vietnam
United States of America
Indonesia
India
China
Q14D. And which countries do you find are typically the most challenging relocation destinations? NORTH AMERICA-BASED RESPONDENTS
1.2%
1.2%
1.6%
1.6%
1.6%
2.0%
2.0%
2.0%
2.4%
2.4%
2.8%
2.8%
3.2%
3.2%
3.6%
4.4%
5.2%
5.6%
10.0%
13.1%
Indonesia
Hong Kong
Malaysia
Colombia
Peru
France
Nigeria
Turkey
Singapore
Russia
Australia
Angola
United Kingdom
Canada
Mexico
South Africa
United States of America
India
Brazil
China

54 / 2015 Global Mobility Survey: Responsible Global Mobility
SECTION TWO: THE FULL RESULTS
Q15A. Generally speaking, what is it about these locations that makes them particularly challenging?
7.5%
13.9%
22.1%
23.6%
26.4%
28.7%
29.0%
30.9%
32.1%
42.8%
43.0%
56.0%
Other
Diversity (e.g. race, sexuality, religion, gender)
Availability of suitable housing
High cost of living
Language difficulties
Lack of facilities to support the relocating employee’s accompanying family
Complicated tax system
Political climate
Differences in legislation
Concerns about personal security/safety
Cultural differences
Immigration complications
Base: All respondents (1282)
Q14E. And which countries do you find are typically the most challenging relocation destinations? AUSTRALASIA-BASED RESPONDENTS
1.2%
1.8%
1.8%
1.8%
1.8%
2.4%
2.4%
2.4%
2.4%
3.0%
3.0%
3.6%
3.6%
4.8%
6.0%
6.5%
7.1%
7.7%
7.7%
8.3%
Russia
Peru
Thailand
Japan
Singapore
Germany
United Arab Emirates
Saudi Arabia
Canada
Mongolia
South Africa
Hong Kong
India
Papua New Guinea
United Kingdom
Indonesia
United States of America
Australia
China
Vietnam
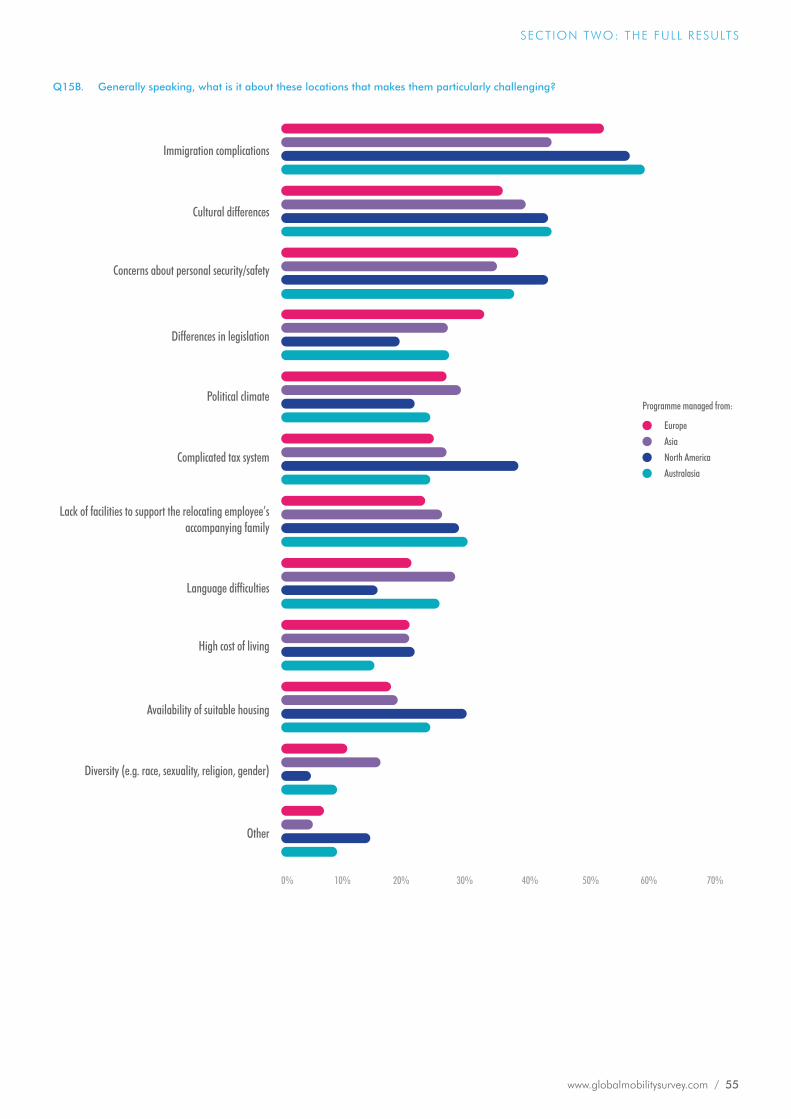
www.globalmobilitysurvey.com / 55
SECTION TWO: THE FULL RESULTS
Other
Diversity (e.g. race, sexuality, religion, gender)
Availability of suitable housing
High cost of living
Language difficulties
Lack of facilities to support the relocating employee’s accompanying family
Complicated tax system
Political climate
Differences in legislation
Concerns about personal security/safety
Cultural differences
Immigration complications
0% 10% 20% 30% 40% 50% 60% 70%
Programme managed from:
Europe
Asia
North America
Australasia
Q15B. Generally speaking, what is it about these locations that makes them particularly challenging?

56 / 2015 Global Mobility Survey: Responsible Global Mobility
SECTION TWO: THE FULL RESULTS
Q16A. Which of the following best describes how you structure your Global Mobility policies?
25.3%
10.9%
63.8%
We have a single policy that we use for every assignment
We have a set of different policies for different types of assignments - e.g. short-term policies, long-term policies, commuter policies, one-way policies
We do not have any set policies
Base: All respondents (1282)
Retai
l
Autom
otive
Manu
factur
ing
Cons
ulting
Oil a
nd G
as
Finan
cial
Chem
icals
Tech
nolog
y and
Comm
unica
tions
Engin
eerin
g
Diplo
matic
and G
over
nmen
tal
Trans
port
and L
ogist
ics
Utilit
ies an
d Ene
rgy
Profe
ssion
al Se
rvices
Aero
spac
e and
Defe
nce
Food
and D
rink
Cons
umer
Prod
ucts
(FMC
G)
Insu
ranc
e
Phar
maceu
ticals
and H
ealth
Hosp
itality
Media
Minin
g
Not f
or Pr
ofit/C
harit
y
Toba
cco
Spor
ts an
d Leis
ure
Lega
l
Q16B. Which of the following best describes how you structure your Global Mobility policies?
0%
10%
20%
30%
40%
50%
60%
70%
80%
90%
100%
No policies
Set of different policies
Single policy

www.globalmobilitysurvey.com / 57
SECTION TWO: THE FULL RESULTS
4.4%
2.4%
4.0%
5.6%
6.7%
7.5%
7.7%
8.3%
8.9%
11.3%
12.3%
12.3%
13.1%
15.1%
17.5%
19.4%
22.0%
24.4%
24.6%
33.7%
Other
Reduced balance sheet
Commuter
Specific to partners
Developmental/Graduate program
Globalist
Localization Plus
Trainee
Rotational
Local (Host) Plus
Local (Host)
Extended business trip
Expat 'Lite'
Localization
Project
Permanent transfer
International local hire
Long-term assignments on local packages
Short term
Standard expatriate (Balance sheet)
Q18. Which of the following compensation approaches do you typically use? SINGLE POLICY ONLY
22.4%
34.0%
41.1%
91.2%
94.9%
Other
Commuter assignments
One-way assignments
Short-term assignments
Long-term assignments
Q17. Which of the following do you have policies for?
Base: All respondents (1282)

58 / 2015 Global Mobility Survey: Responsible Global Mobility
SECTION TWO: THE FULL RESULTS
Standard expatriate
Long-term on local packages
Localization
Expat ‘Lite’
Permanent transfer
Localization Plus
International local hire
Project
Local (Host)
Globalist
Specific to Partners
Rotational
Developmental/Graduate Program
Trainee
Extended Business Trip
Reduced Balance sheet
Commuter
Short Term
Q19A. Which of the following compensation approaches do you typically use for each of the different policies types? LONG-TERM ASSIGNMENTS
71.6%
26.1%
19.8%
18.2%
16.8%
15.7%
14.5%
13.0%
12.9%
12.5%
8.8%
7.1%
6.8%
5.1%
4.3%
4.0%
3.4%
2.5%
Short Term
Standard expatriate
Project
Extended Business Trip
Trainee
Developmental/Graduate Program
Expat ‘Lite’
Rotational
Commuter
Localization
Specific to Partners
Reduced Balance sheet
Local (Host)
Localization Plus
Globalist
International local hire
Long-term on local packages
Local (Host) Plus
Permanent transfer
Q19B. Which of the following compensation approaches do you typically use for each of the different policies types? SHORT-TERM ASSIGNMENTS
57.3%
33.6%
32.9%
25.5%
21.6%
20.5%
18.5%
15.9%
8.2%
6.7%
6.4%
5.4%
5.3%
5.0%
4.7%
4.6%
4.6%
3.9%
2.2%
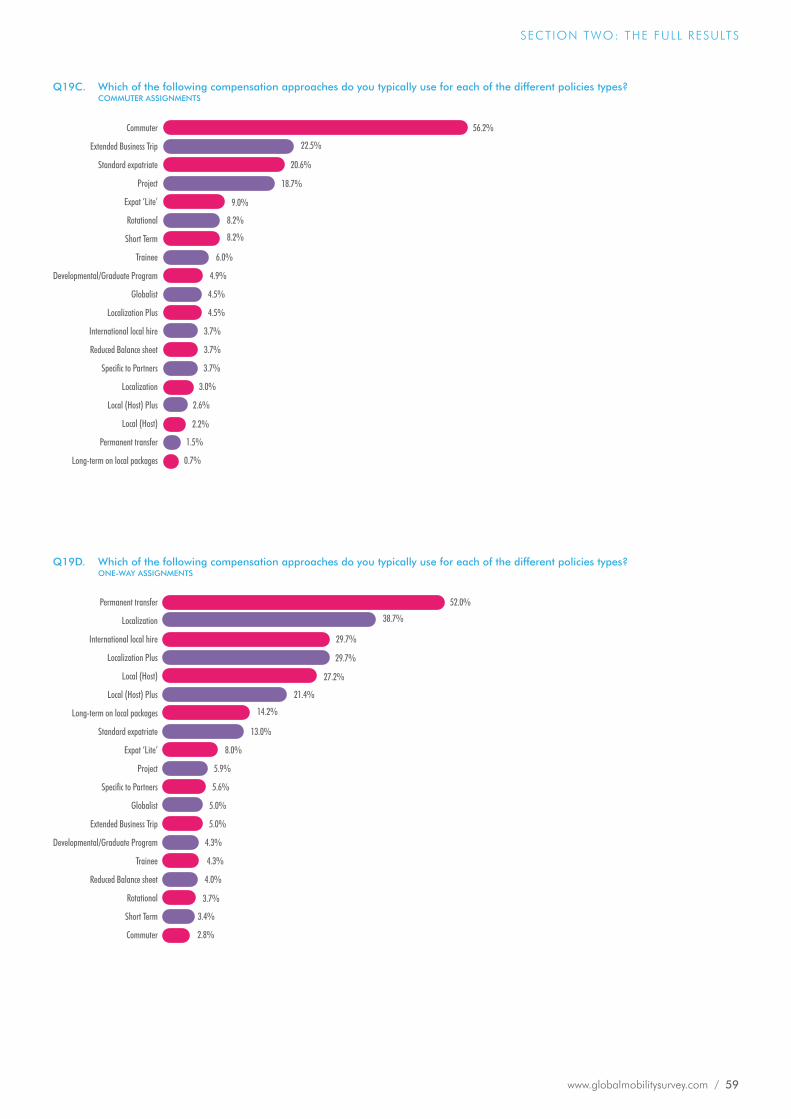
www.globalmobilitysurvey.com / 59
SECTION TWO: THE FULL RESULTS
Commuter
Extended Business Trip
Standard expatriate
Project
Expat ‘Lite’
Rotational
Short Term
Trainee
Developmental/Graduate Program
Globalist
Localization Plus
International local hire
Reduced Balance sheet
Specific to Partners
Localization
Local (Host) Plus
Local (Host)
Permanent transfer
Long-term on local packages
Q19C. Which of the following compensation approaches do you typically use for each of the different policies types? COMMUTER ASSIGNMENTS
56.2%
22.5%
20.6%
18.7%
9.0%
8.2%
8.2%
6.0%
4.9%
4.5%
4.5%
3.7%
3.7%
3.7%
3.0%
2.6%
2.2%
1.5%
0.7%
Permanent transfer
Localization
International local hire
Localization Plus
Local (Host)
Local (Host) Plus
Long-term on local packages
Standard expatriate
Expat ‘Lite’
Project
Specific to Partners
Globalist
Extended Business Trip
Developmental/Graduate Program
Trainee
Reduced Balance sheet
Rotational
Short Term
Commuter
Q19D. Which of the following compensation approaches do you typically use for each of the different policies types? ONE-WAY ASSIGNMENTS
52.0%
38.7%
29.7%
29.7%
27.2%
21.4%
14.2%
13.0%
8.0%
5.9%
5.6%
5.0%
5.0%
4.3%
4.3%
4.0%
3.7%
3.4%
2.8%

60 / 2015 Global Mobility Survey: Responsible Global Mobility
SECTION TWO: THE FULL RESULTS
6.2%
3.3%
16.8%
21.8%
23.2%
28.5%
31.7%
39.2%
40.2%
None of the above
Other
The business unit / department of the assignee
Whether the assignment is within one country (e.g. UK vs. international)
Whether the assignment is intra-regional (e.g. within N. America or Asia) vs. inter-regional (e.g. Europe to Africa)
Whether the assignment was initiated by the employee (e.g. volunteered) vs. by management (e.g. nominated)
Whether the assignment is for the employee’s long-term personal personal development vs. of immediate strategic importance to the business
Whether or not the location is considered to be a hardship destination
The employee’s grade / seniority
Q20A. Do the contents of the assignment packages you offer vary according to any of the following criteria?
Base: All respondents (1282)

www.globalmobilitysurvey.com / 61
SECTION TWO: THE FULL RESULTS
0% 10% 20% 30% 40% 50% 60%
None of the above
Other
Business unit
Within one country vs. international
Intra-regional vs. inter-regional
Initiated by the employee vs. by management
Personal development vs. strategic
Hardship destination
Grade / seniority
Consulting
Manufacturing
Retail
Financial
Technology and Communications
Oil and Gas
Engineering
Automotive
Chemicals
Q20B. Do the contents of the assignment packages you offer vary according to any of the following criteria? (Split by top industry sectors)
Consulting
Oil and Gas
Financial
Technology and Communications
Engineering
Financial
Retail
Automotive

62 / 2015 Global Mobility Survey: Responsible Global Mobility
SECTION TWO: THE FULL RESULTS
Q21. What are the benefits of not varying the policies used?
“Consistency, across the diversity of our organisation means that our organisation is in line with our awards, policies and legislations.”
“Fair & Equal Treatment of all assignees, clear expectations regarding assignments which are established in the organization.”
“Ease of communication and simplicity of management across different business units.”
“One common system should make the administration easier.”
ConsistencyFairness and Equality
Easy to manageLess administration
Q22. And what are the challenges or difficulties of not varying the policies used?
Higher costsLack consideration for individual circumstances
Lack of flexibilityReduced competitiveness
“Rigidity, overlooking specificneeds/circumstances leading to unhappiness demoralized/demotivated expatriates, and an employer seen as inhumane and not encouraging expatriation”
“Not following local market practices and maybe not being competitive in local market versus local peers.”
“It doesn't differentiate bvetween people's specific circumstances”
“Every case is different. There is no set of policies that apply every single time.”

www.globalmobilitysurvey.com / 63
SECTION TWO: THE FULL RESULTS
Q24. And what are the challenges or difficulties of varying the policies used?
Ensuring fair treatment
ComplexityAdministrative burden
“Complexity in making the right decision to fit an assignee into the right policy.”
“Different treatment. Each case is a special case. Anger and frustration of Expats over length of deliberations (haggling). Cherry-picking. Change of benefits for cash.”
“Inconsistency and 'unfair', creating precedents. Business then think they can challenge each assignment”
“It is very difficult to avoid discrimination when you have this type of variety. It is a huge challenge to create a fair policy when you have a diversity of profiles and countries.”
“More complicated administration and additional communication required to ensure assignees understand the differences in packages.”
Q23. What are the benefits of varying the policies used?
FlexibilityMeets specific needs
Cost effectiveCustomised solutions
“Able to provide benefits appropriate to the circumstances.”
“Keeps costs to a minimum. Ensures that the assignment meets the business need.”
“Reduce exceptions by having policies based on the situation.”
“Ability to match policy with the needs of the assignment.”
“Relevant to the assignment type, allows more efficient administration and cost management.”

64 / 2015 Global Mobility Survey: Responsible Global Mobility
SECTION TWO: THE FULL RESULTS
Q26. To what extent are the following elements generally included in your assignment packages? (Multiple policies)
Always included
Included at discretion
Immigration visas / work permits
Medical / health cover
Temporary housing
Household good moving
Relocation allowance
Tax briefing and equalisation
Social Security
Pay arrangements
Cost of Living Allowance
Destination services
Settling in support
School fees
Language training
Accompanying partner assistance
Housing norm
Cultural training
Hardship allowance
Tenancy management
Insurance (e.g. house insurance)
International banking services
Career management / mentoring
Property management
Negative CoLA
Home sale (funded)
95.4% 2.8%
7.9%87.8%
17.7%78.1%
16.4%76.0%
72.0%
71.3%
67.0%
65.5%
62.0%
58.2%
53.5%
46.2%
40.5%
39.9%
37.4%
34.2%
32.4%
30.7%
29.3%
22.7%
22.2%
18.8%
16.1%
8.3%
18.8%
15.2%
12%
11.2%
23.2%
27.1%
23.6%
42.4%
39.4%
35.9%
20.8%
38.0%
37.2%
24.4%
19.7%
22.4%
25.2%
24.1%
20.4%
24.4%
Q25. Which of the following elements do your typical assignment packages include? (Single policy only)
6.8%
6.2%
11.7%
13.0%
14.2%
17.3%
30.2%
31.5%
33.6%
36.1%
41.0%
44.1%
45.1%
49.4%
54.9%
58.0%
58.6%
59.9%
60.2%
72.2%
75.3%
80.9%
80.9%
83.3%
91.0%
Other
Home sale (funded)
Reduction in salary if destination has a lower cost of living than origin (i.e. negative CoLA)
International banking services
Career management / mentoring
Property management
Tenancy management
Hardship allowance
Housing norm
Insurance (e.g. house insurance)
Accompanying partner assistance
Cultural training
Pay arrangements (structuring of package, balance sheet calculations and payroll delivery)
Settling in support
Social Security
Cost of Living Allowance (CoLA) – aka Goods & Services Differential
Tax briefing and equalisation
Language training
Destination services (area orientation, home finding, school search)
School fees
Relocation allowance
Household good moving
Temporary housing (serviced accommodation/hotel)
Medical / health cover
Immigration visas / work permits

www.globalmobilitysurvey.com / 65
SECTION TWO: THE FULL RESULTS
Q27A. When do you next plan to review your Global Mobility policies?
37.4%
18.2%
14.2%
17.0% Policies are under constant review
Within the next 6 months
Within the next 6-12 months
Within the next 12-24 months
We have no plans to review our policies
13.2%
Base: All respondents (1282)
Q27B. When do you next plan to review your Global Mobility policies? SPLIT BY INDUSTRY – ALL INDUSTRIES WITH AT LEAST 20 RESPONSES.
0%
10%
20%
30%
40%
50%
60%
70%
80%
90%
100%
We have no plans to review our policies
Within the next 12-24months
Within the next 6-12months
Within the next 6 months
Policies are underconstant review
Retai
l
Tech
nolog
y and
Comm
unica
tions
Insu
ranc
e
Utilit
ies an
d Ene
rgy
Finan
cial
Oil a
nd G
as
Chem
icals
Manu
factur
ing
Cons
umer
Prod
ucts
(FMC
G)
Diplo
matic
and G
over
nmen
tal
Profe
ssion
al Se
rvices
Engin
eerin
g
Cons
ulting
Autom
otive
Trans
port
and L
ogist
ics
Phar
maceu
ticals
and H
ealth
Food
and D
rink
Aero
spac
e and
Defe
nce

66 / 2015 Global Mobility Survey: Responsible Global Mobility
SECTION TWO: THE FULL RESULTS
Assignee health risks
Severe penalties for breaches of laws / regulations
Disease
Terrorism
Political corruption
War
Kidnap
Other (please specify)
None of the above
53.0%
40.4%
35.0%
33.8%
25.6%
24.4%
Q28A. Which, if any, of the following do you consider to be significant risks your organisation faces when organising and managing international assignments?
23.0%
4.3%
19.8%
Base: All respondents (1282)
Q27C. When do you next plan to review your Global Mobility policies? Split by number of annual assignments.
0%
10%
20%
30%
40%
50%
60%
70%
80%
90%
100%
1 – 25
26 -
50
51 -
100
101 -
250
251 -
500
501 -
1000
1001
+We have no plans to review our policies
Within the next 12-24months
Within the next 6-12months
Within the next 6 months
Policies are underconstant review

www.globalmobilitysurvey.com / 67
SECTION TWO: THE FULL RESULTS
0% 10% 20% 30% 40% 50% 60%
Financial
Manufacturing
Technology and Communications
Engineering
Automotive
Oil and Gas
Consulting
Chemicals
Q28B. Which, if any, of the following do you consider to be significant risks your organisation faces when organising and managing international assignments?
None of the above
Other (please specify)
Kidnap
War
Political corruption
Terrorism
Disease
Severe penalties for breaches of laws / regulations
Assignee health risks
Manufacturing
Manufacturing
Manufacturing
Technology and Communications
Oil and Gas
Oil and Gas
Oil and Gas
Oil and Gas
Oil and Gas
Oil and Gas
Engineering
Engineering
Engineering
Chemicals

68 / 2015 Global Mobility Survey: Responsible Global Mobility
SECTION TWO: THE FULL RESULTS
Insurance
Local support
Emergency evacuation
Use of specialist provider
Risk profiling of destinations
Training
Drivers
Risk profiling of candidates
Bodyguards
Other (please specify)
None of the above
67.5%
59.4%
55.0%
39.6%
38.0%
37.6%
33.7%
11.4%
9.2%
Q29. Which of the following measures does your organisation take to mitigate against these risks?
3.4%
1.2%
Base: All respondents (1282)
Assignee health risks
Disease
Terrorism
We do not hold any Critical Incident policies
War
Kidnap
Severe penalties for breaches of laws / regulations
Political corruption
#Risk identified inprevious questions#
Other
Q30. And which of the following does your organisation hold Critical Incident policies for?
43.1%
38.6%
29.8%
29.1%
25.9%
24.4%
20.6%
20.1%
1.2%
4.3%
Base: All respondents (1282)
Q33A. When was the last time your organisation experienced a Critical Incident relating to one of these risks?
21.8%
9.7%
12.5%
6.7%
49.3%
Within the last 12 months
Within the last 2 years
Within the last 5 years
Over 5 years
We've never had a critical incident
Base: All respondents (1282)

www.globalmobilitysurvey.com / 69
SECTION TWO: THE FULL RESULTS
Q34A. Does your organisation have a formal ‘duty of care’ policy in place for assignments?
46.0%54.0%
Yes
No
Q33B. When was the last time your organisation experienced a Critical Incident relating to one of these risks?
0%
10%
20%
30%
40%
50%
60%
70%
80%
90%
100%
Never
Over 5 years
Last 5 years
Last 2 years
Last 12 months
Oil a
nd G
as
Engin
eerin
g
Autom
otive
Tech
nolog
y and
Comm
unica
tions
Manu
factur
ing
Finan
cial
Diplo
matic
and G
over
nmen
tal
Food
and D
rink
Cons
umer
Prod
ucts
(FMC
G)
Profe
ssion
al Se
rvices
Trans
port
and L
ogist
ics
Retai
l
Cons
ulting
Utilit
ies an
d Ene
rgy
Chem
icals
Spor
ts an
d Leis
ure
Toba
cco
Aero
spac
e and
Defe
nce
Minin
g
Phar
maceu
ticals
and H
ealth
Insu
ranc
e
Lega
l
Media
Hosp
itality
Not f
or Pr
ofit/C
harit
y
Oil a
nd G
as
Finan
cial
Autom
otive
Manu
factur
ing
Engin
eerin
g
Tech
nolog
y and
Comm
unica
tions
Profe
ssion
al Se
rvices
Retai
l
Chem
icals
Cons
ulting
Food
and D
rink
Trans
port
and L
ogist
ics
Aero
spac
e and
Defe
nce
Cons
umer
Prod
ucts
(FMC
G)
Spor
ts an
d Leis
ure
Minin
g
Utilit
ies an
d Ene
rgy
Diplo
matic
and G
over
nmen
tal
Lega
l
Hosp
itality
Insu
ranc
e
Not f
or Pr
ofit/C
harit
y
Media
Phar
maceu
ticals
and H
ealth
Toba
cco
Q34B. Does your organisation have a formal ‘duty of care’ policy in place for assignments?
0%
10%
20%
30%
40%
50%
60%
70%
80%
90%
100%
Yes
No

70 / 2015 Global Mobility Survey: Responsible Global Mobility
SECTION TWO: THE FULL RESULTS
Q35A. Which of the following assignee environments does this ‘duty of care’ policy extend to?
50.1%
51.5%
52.9%
56.1%
63.2%
Assignee's dependents
Travel to and from work/accommodation
Accommodation
Entirety of activities during assignment
Working environment
Base: All respondents (1282)
Q35B. Which of the following assignee environments does this ‘duty of care’ policy extend to?
Assignee's dependents
Travel to and from work/accommodation
Accommodation
Entirety of activities during assignment
Working environment
0% 10% 20% 30% 40% 50% 60% 70% 80%
Financial
Technology & Comms
Manufacturing
Oil and Gas
Engineering
Automotive
Consulting
Engineering

www.globalmobilitysurvey.com / 71
SECTION TWO: THE FULL RESULTS
Q36. On the whole, how effective do you think your organisation’s ‘duty of care’ policy is at ensuring that your assignees are safe and protected whilst on assignment?
30.7%
65.9%
Extremely effective
Quite effective
Not very effective
Not effective at all 0.0%
3.4%
Q38A. How do you keep up-to-date with developments on Global Mobility risk factors?
13.8%
6.1%
4.4%
9.7%
16.1%
16.5%
17.7%
18.8%
21.7%
22.1%
22.7%
25.6%
29.0%
34.1%
35.6%
36.4%
I don’t keep up-to-date with changes to risk factors
Other
NGOs
Accounting companies
Medical organisations
Specialist security companies
Events
Specialist risk management companies
Legal firms
General insurance providers
Forums
e-bulletins
Immigration companies
Government sources
Own local offices
Relocation providers
Base: All respondents (1282)

72 / 2015 Global Mobility Survey: Responsible Global Mobility
SECTION TWO: THE FULL RESULTS
Q38C. Do you believe your Global Mobility programme delivers value for money?
Yes
No
94% 87%
71% 61%
Very closely aligned Quite closely aligned Not very closelyaligned
Not at all aligned
Q38B. Do you believe your Global Mobility programme delivers value for money?
84.8%
15.2% Yes
No
Base: All respondents (1282)
Q39. What system do you primarily use to estimate the cost of an assignment before it is authorised?
6.5%
5.2%
9.5%
9.8%
15.5%
22.4%
31.2%
Other
We use a standard ‘Big 4’ system
We don’t estimate this cost
We outsource to an external provider (but not one of the ‘Big 4’)
We use a customised ‘Big 4’ system (PwC, KPMG, Deloitte or E&Y)
We use our own specially designed in-house system
We use everyday computer software (e.g. Microsoft Excel)
Base: All respondents (1282)

www.globalmobilitysurvey.com / 73
SECTION TWO: THE FULL RESULTS
Q40. How accurate do you find this system is for estimating the cost of assignments?
10.6%17.7% Extremely accurate
Quite accurate
Not very accurate
Not accurate at all
70.0%
1.7%
Base: All respondents (1282)
How does your programme deliver value to your business?
Mobilised workforce
Facilitate knowledge transfer
Cost savingsAttract talent
Higher profitability
“Transfer of knowledge becomes faster, improving performance of the business.”
“We put the right employees in the places where their skills will have the most positive impact on the business – helping the company achieve its targets.”
“Enables us to attract and retain the best people in the industry. Makes us more competitive as a company.”
“We provide the cost estimates to business before going ahead.”
“We link cost of assignments to the results of the local business to prove ROI.”
“Assignment costs and employee performance are monitored.
“We facilitate training of many talented people who come back with new knowledge and skills from abroad. They apply these at a local business level.”

74 / 2015 Global Mobility Survey: Responsible Global Mobility
SECTION TWO: THE FULL RESULTS
Q41. You mentioned that this system for estimating costs is accurate. Why is this?
BespokeDetailed
FlexibleUp-to-date
“It provides a very detailed overview of cost to be incurred over the span of assignment.”
“The system is completely bespoke to our company and we have access to make any necessary changes pretty much immediately. The system has been tuned and tweaked and improved upon over the last 5 years and continues to develop as a program and 0with the business needs.”
“We keep the system up to date.”
“It gives us flexibility to amend our working techniques as per different region/location and even incorporate all regular changes in law and compliance released.”
Q41. You mentioned that this system for estimating costs is not accurate. Why is this?
Poor tax calculationsHuman error
Highly manualLack of consistency
“The system is not adapted to calculate tax correctly.”
“1. very manual 2. large room for error 3. time consuming.”
“We’re buried in spreadsheet land. We need to spend money on a more effective system/tool.”
“Is not very friendly user and difficult to update.”
“Each country has its own templates.”

www.globalmobilitysurvey.com / 75
SECTION TWO: THE FULL RESULTS
Q42. And how do you currently track costs during an assignment?
6.6%
9.6%
13.6%
13.6%
14.0%
21.3%
37.8%
Other
A connected system
Multiple systems unconnected
Outsourced supplier
Specialist software in-house
We do not track assignment costs
Everyday software e.g. Excel in-house
Base: All respondents (1282)
Q43A. How effective do you find this method in tracking assignment costs?
11.5%
26.5%
58.2%
3.8%Extremely effective
Quite effective
Not very effective
Not effective at all
Q43B. How effective do you find this method in tracking assignment costs?
0%
10%
20%
30%
40%
50%
60%
70%
80%
90%
100%
Speci
alist
softw
are i
nhou
se
A co
nnect
ed sy
stem
Ever
yday
softw
are e
.g. Ex
cel in
-hou
se
Outso
urced
supp
lier
Multip
le sys
tems u
ncon
necte
d
Not effective at all
Not very effective
Quite effective
Extremely effective

76 / 2015 Global Mobility Survey: Responsible Global Mobility
SECTION TWO: THE FULL RESULTS
Q44. You mentioned that this system for tracking costs is not effective. Why is this?
Disjointed
Not user-friendlyComplicated to track
“It’s not really a system at the moment – we have multiple data sources which are collated into a spreadsheet. Would be great to utilize a new system to track costs automatically.”
“[We need] one global, connected, permanently updated system.”
“Cost related data is huge. Excel files cannot be managed well. We cannot generate reports.”
“It's very difficult to pull together costs from multiple systems.”
“Hard to find costs in multiple systems. Information not available for the entire expat population!”
Q44. You mentioned that this system for tracking costs is effective. Why is this?
DetailedCentralised
Up-to-date
“It tracks all movements across locations and keeps a tab on people movements from one centralised location”
“All costs are itemised and collated and referred back to business unit managers”
“You can report by assignee and by invoiced element.”
“The costs are updated constantly and are on a system that we can run reports on an as needed basis.”
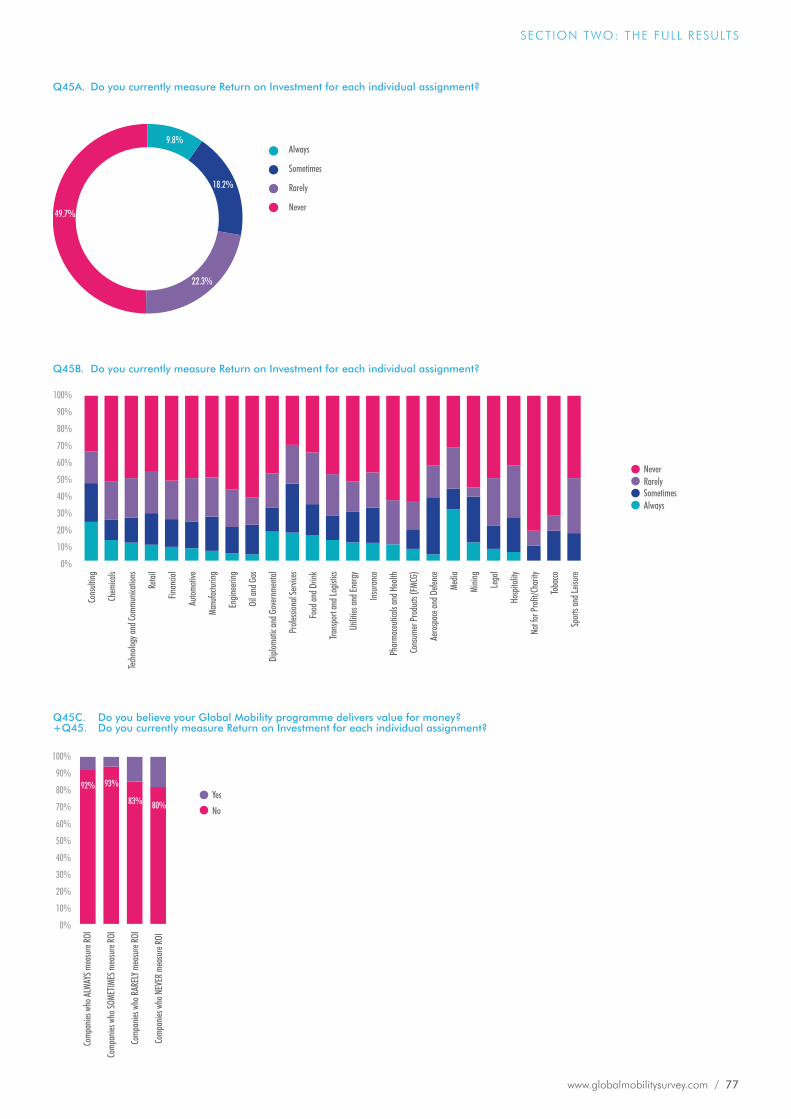
www.globalmobilitysurvey.com / 77
SECTION TWO: THE FULL RESULTS
Q45A. Do you currently measure Return on Investment for each individual assignment?
18.2%
49.7%
22.3%
9.8%Always
Sometimes
Rarely
Never
Q45B. Do you currently measure Return on Investment for each individual assignment?
0%
10%
20%
30%
40%
50%
60%
70%
80%
90%
100%
Cons
ulting
Chem
icals
Tech
nolog
y and
Comm
unica
tions
Retai
l
Finan
cial
Autom
otive
Manu
factur
ing
Engin
eerin
g
Oil a
nd G
as
Diplo
matic
and G
over
nmen
tal
Profe
ssion
al Se
rvices
Food
and D
rink
Trans
port
and L
ogist
ics
Utilit
ies an
d Ene
rgy
Insu
ranc
e
Phar
maceu
ticals
and H
ealth
Cons
umer
Prod
ucts
(FMC
G)
Aero
spac
e and
Defe
nce
Media
Minin
g
Lega
l
Hosp
itality
Not f
or Pr
ofit/C
harit
y
Toba
cco
Spor
ts an
d Leis
ure
RarelyNever
AlwaysSometimes
Q45C. Do you believe your Global Mobility programme delivers value for money? +Q45. Do you currently measure Return on Investment for each individual assignment?
0%
10%
20%
30%
40%
50%
60%
70%
80%
90%
100%
Comp
anies
who
ALW
AYS m
easu
re R
OI
Comp
anies
who
SOME
TIMES
mea
sure
ROI
Comp
anies
who
RAR
ELY m
easu
re R
OI
Comp
anies
who
NEV
ER m
easu
re R
OI
Yes
No
92% 93%
83% 80%
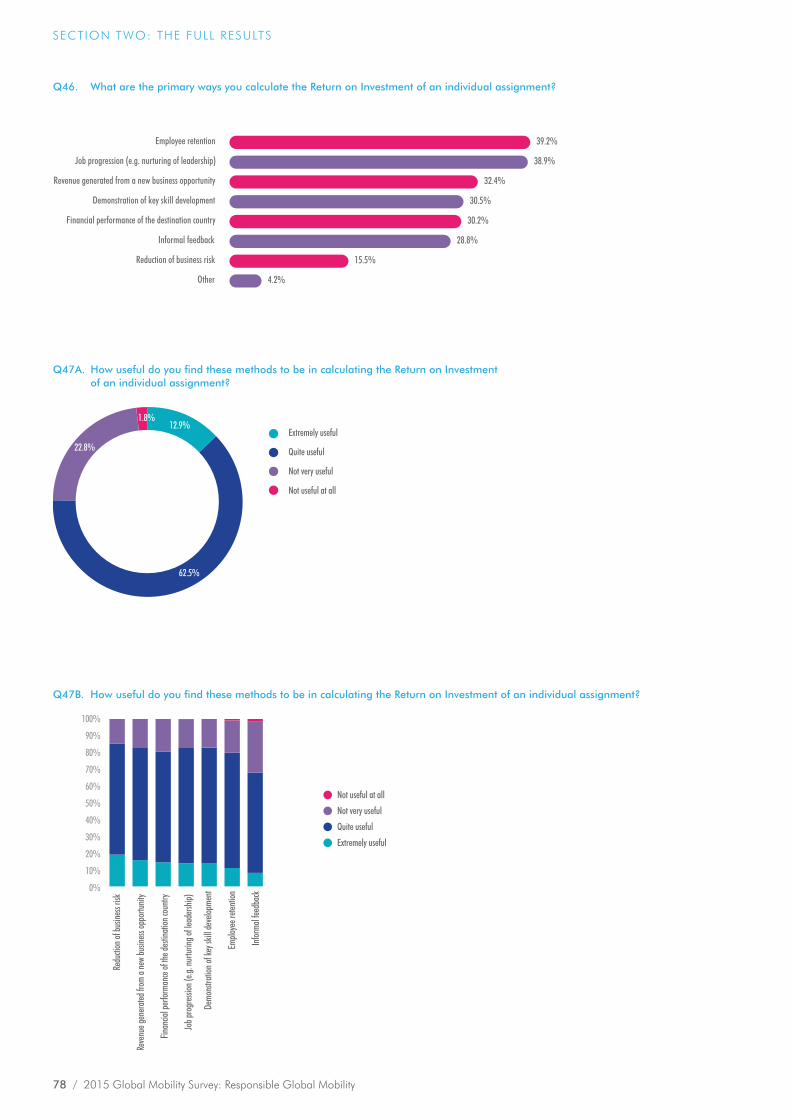
78 / 2015 Global Mobility Survey: Responsible Global Mobility
SECTION TWO: THE FULL RESULTS
Q46. What are the primary ways you calculate the Return on Investment of an individual assignment?
4.2%
15.5%
28.8%
30.2%
30.5%
32.4%
38.9%
39.2%
Other
Reduction of business risk
Informal feedback
Financial performance of the destination country
Demonstration of key skill development
Revenue generated from a new business opportunity
Job progression (e.g. nurturing of leadership)
Employee retention
Q47A. How useful do you find these methods to be in calculating the Return on Investment of an individual assignment?
62.5%
22.8%
1.8%12.9%
Extremely useful
Quite useful
Not very useful
Not useful at all
Not useful at all
Not very useful
Quite useful
Extremely useful
Q47B. How useful do you find these methods to be in calculating the Return on Investment of an individual assignment?
0%
10%
20%
30%
40%
50%
60%
70%
80%
90%
100%
Redu
ction
of bu
sines
s risk
Reve
nue g
ener
ated f
rom
a new
busin
ess o
ppor
tunity
Finan
cial p
erfor
manc
e of t
he de
stina
tion c
ountr
y
Job p
rogr
essio
n (e.g
. nur
turing
of le
ader
ship)
Demo
nstra
tion o
f key
skill
deve
lopme
nt
Emplo
yee r
etenti
on
Infor
mal fe
edba
ck

www.globalmobilitysurvey.com / 79
SECTION TWO: THE FULL RESULTS
Q48. You mentioned that this system for measuring ROI is bad. Why is this?
“It can only provide us with a snapshot of the expat’s performance and any other deeper details are left out. Hence, the usefulness of the system is quite limited. The system would be more effective if it can provide us more analytical metrics of the ROI of an assignment, this will give us a better insight of the ROI.”
“The business is focused on immediate short term value creation of mobility assignments. The hidden and opportunity costs of assignments are not really taken into consideration. To attempt to do more thorough ROI analysis would require additional resources the business does not have.”
“Measuring qualitative factors is never perfect.”
“Return on Investment is an accounting/financial term which does not always translate effectively to intrinsic and less visible benefits such as employee retention and satisfaction”
“We do not have a consistent approach for measuring ROI.”
Lack consistency in approachDifficulty calculating intangibles
Wrong metrics usedInformal system used
Q49. How important is assignment cost containment to your organisation?
6.3%
40.1%
0.8%
52.8%
Very important
Quite important
Not very important
Not at all important

80 / 2015 Global Mobility Survey: Responsible Global Mobility
SECTION TWO: THE FULL RESULTS
Policy review
Process efficiencies
Tighter vendor/supplier cost management controls
Change benefits packages within your policy
Rationalisation of service providers
Bundling of relocation services (e.g. combining services for greater efficiency)
Individual service cost savings (e.g. renegotiation of costs with suppliers)
Change approach to compensation (e.g. cost of living allowances)
Reduce number of relocations
Internal reorganisation
Change type of employee being relocated
Reducing the number of suppliers
Other
None of the above
Q51A. Which, if any, of the following areas are you focussing on for reducing your organisation’s mobility programme costs?
44.1%
41.5%
31.2%
25.4%
24.8%
24.1%
24.0%
21.8%
20.4%
18.7%
16.2%
15.1%
2.2%
4.1%
Q50. Please rank the following in order of priority.
11.2%
14.1%
15.3%
27.0%
35.0%
19.6%
19.8%
22.0%
21.2%
18.5%
18.7%
19.5%
23.4%
20.9%
17.1%
20.4%
21.6%
24.5%
15.7%
16.3%
30.1%
25.0%
14.8%
15.2%
13.1%
Reducing the administration burden on the in-house Global Mobility team
Improving perceived ‘success rates’ from assignments
Improving assignee satisfaction
Improving ROI (cost/effectiveness) of each assignment
Reducing overall Global Mobility costs
Priority #1 #2 #3 #4 #5 High Low
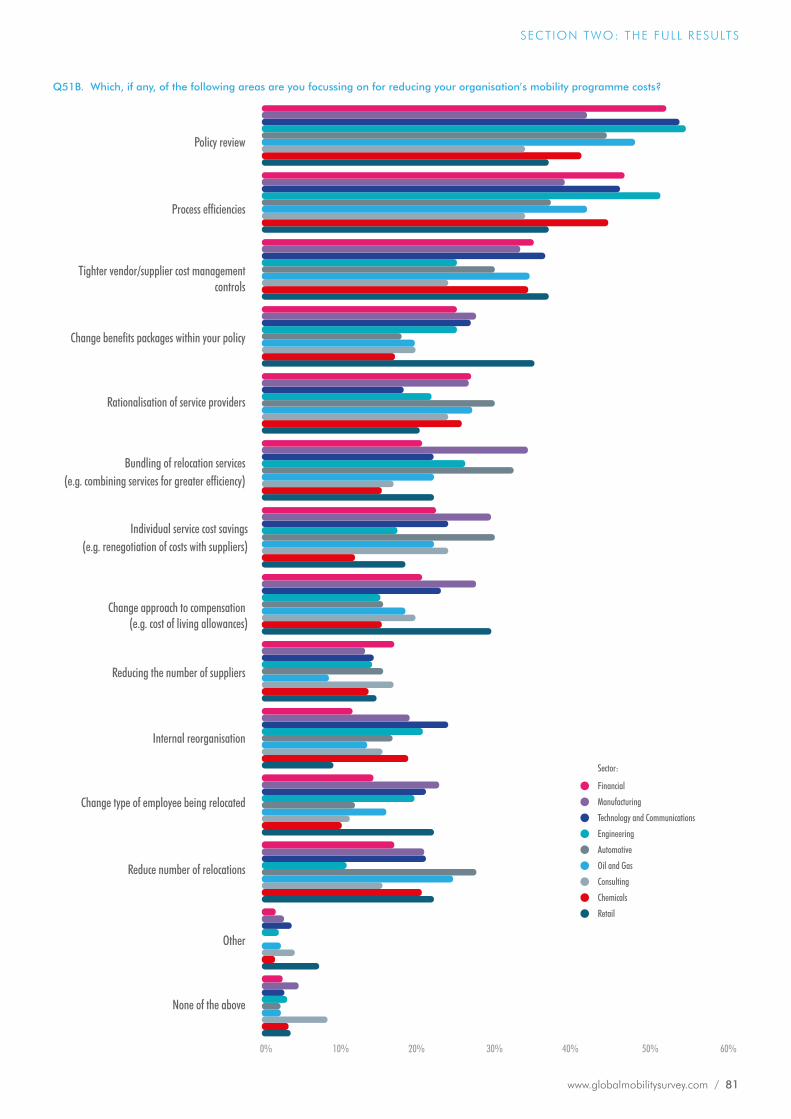
www.globalmobilitysurvey.com / 81
SECTION TWO: THE FULL RESULTS
0% 10% 20% 30% 40% 50% 60%
Financial
Manufacturing
Technology and Communications
Engineering
Automotive
Oil and Gas
Consulting
Chemicals
Retail
Sector:
Q51B. Which, if any, of the following areas are you focussing on for reducing your organisation’s mobility programme costs?
None of the above
Other
Reduce number of relocations
Change type of employee being relocated
Internal reorganisation
Reducing the number of suppliers
Change approach to compensation (e.g. cost of living allowances)
Individual service cost savings (e.g. renegotiation of costs with suppliers)
Bundling of relocation services (e.g. combining services for greater efficiency)
Rationalisation of service providers
Change benefits packages within your policy
Tighter vendor/supplier cost management controls
Process efficiencies
Policy review

82 / 2015 Global Mobility Survey: Responsible Global Mobility
SECTION TWO: THE FULL RESULTS
Q53. Regardless of what you are or are not focussing on at present, which of the following do you think would be the most effective areas for reducing the costs of your organisation’s mobility programme?
2.0%
1.7%
1.6%
7.8%
12.4%
12.8%
13.4%
15.1%
17.6%
17.6%
17.6%
21.5%
25.8%
32.1%
32.7%
None of the above
Other
#other carried forwards#
Reducing the number of suppliers
Internal reorganisation
Individual service cost savings (e.g. renegotiation of costs with suppliers)
Rationalisation of service providers
Change type of employee being relocated
Reduce number of relocations
Bundling of relocation services (e.g. combining services for greater efficiency)
Change approach to compensation (e.g. cost of living allowances)
Change benefits packages within your policy
Tighter vendor/supplier cost management controls
Process efficiencies
Policy review
www.globalmobilitysurvey.com / 83
SECTION TWO: THE FULL RESULTS
SANTA FE RELOCATION SERVICES
Santa Fe is a Global Mobility services company specialising in managing and delivering the full range of assignment services through locally-based offices in 56 countries worldwide. Visit www.santaferelo.com.
CIRCLE RESEARCH
Circle Research is an independent global research company. All research is conducted to ISO20252 standards. Visit www.circle-research.com.
SANTA FE AND CIRCLE RESEARCH
The survey is commissioned by Santa Fe Relocation Services. Research is conducted by Circle Research.

84 / 2015 Global Mobility Survey: Responsible Global Mobility
NOTES

www.globalmobilitysurvey.com / 85
ACTION POINTS

86 / 2015 Global Mobility Survey: Responsible Global Mobility

www.globalmobilitysurvey.com / 87

FOR MORE INFORMATION, V IS IT WWW.GLOBALMOBILITYSURVEY.COM