Sustainability Reporting in the Maritime Container Shipping Industry
107
1 2 Sustainability Reporting in the Maritime Container Shipping Industry A study of the maturity, barriers and drivers of industry reporting Masters Thesis MORRIS Jonathan June 2013 Jonathan Morris Master of Science in Sustainable Development 2010-2011 Afshin Mehrpouya, Academic Advisor Assistant Professor of Accounting and Management Control Angie Farrag, Professional Advisor Associate Director, Transportation and Logistics Practice, BSR
Transcript of Sustainability Reporting in the Maritime Container Shipping Industry
1
2
Sustainability Reporting in the Maritime Container
Shipping Industry
A study of the maturity, barriers and drivers of industry reporting
Masters Thesis
MORRIS Jonathan
June 2013
Jonathan Morris
Master of Science in Sustainable Development 2010-2011
Afshin Mehrpouya, Academic Advisor
Assistant Professor of Accounting and Management Control
Angie Farrag, Professional Advisor
Associate Director, Transportation and Logistics Practice, BSR

2
Summary
Executive Summary ..................................................................................................... 5
Acknowledgements ...................................................................................................... 8
Introduction .................................................................................................................. 9
1. Aim and Research Methodology....................................................................... 14 1.1. Aim of the research .............................................................................................. 14 1.2. Choice of Industry and Companies Selected ..................................................... 14 1.3. Methodology ......................................................................................................... 16
2. Literature Review .............................................................................................. 20 2.1. Origins and Current State of Sustainability Reporting .................................... 20 2.2. Motivations For Companies to Report ............................................................... 25 2.3. Factors Influencing the Selection of Reporting Content .................................. 28 2.4. Previous Research on Sector-Specific Reporting .............................................. 34 2.5. Previous Research on Maritime Transportation Sector ................................... 36
3. Current State of Sustainability Reporting ....................................................... 40 3.1. Choice of Indicators ............................................................................................. 41 3.2. Results: A Look at Reporting Maturity ............................................................. 46 3.3. Discussion of Results ............................................................................................ 48
4. Barriers and Drivers to Industry Reporting ................................................... 52 4.1. Background and Overview of the Maritime Shipping Industry ...................... 52 4.2. Maritime Container Transportation .................................................................. 54 4.3. Identifying Industry Barriers and Drivers ........................................................ 63 4.4. Barriers to Reporting ........................................................................................... 65 4.5. Drivers to Reporting ............................................................................................ 73 4.6. Results ................................................................................................................... 78 4.7. Trends in Sustainability Reporting .................................................................... 79
5. Conclusions ......................................................................................................... 81 5.1. General Conclusions ............................................................................................ 81 5.2. Limitations and Further Research ..................................................................... 87
Appendix 1 – Full List of Analyzed Sustainability Reports ................................... 89
Full List of Analyzed Sustainability Reports; Source: Author .............................. 89
Appendix 2 – Full Semi-Structured Interview Questionnaire ............................... 90
Appendix 3 – Factiva Research ................................................................................ 91
Bibliography ............................................................................................................... 99

3
Acronyms
3PL Third-Party Logistics Company
AA1000AS AccountAbility 1000 Assurance Standard
ACCA Association of Chartered and Certified Accountants
B2B Business-to-Business
B2C Business-to-Customer
C02 Carbon Dioxide
CCWG Clean Cargo Working Group
CDP Carbon Disclosure Project
CERES The Coalition for Environmentally Responsible Economies
CSI Clean Shipping Initiative
CSR Corporate Social Responsibility
DDT Dichlorodiphenyltrichloroethane (chemical)
DJSI Dow Jones Sustainability Index
DWT Deadweight Tonnage
ESC European Shippers Council
ESG Environmental, Social, Governance
ESI Environmental Ship Index
FOC Flags of Convenience
GRI Global Reporting Initiative
GSF Global Shippers Forum
HSE Health, Safety, and Environment
ICFTU International Confederation of Free Trade Unions
IIRC International Integrated Reporting Council
IMO International Maritime Organization
IR Integrated Reporting
ISO International Organization for Standardization
ITF International Transport Forum
KPI Key Performance Indicator
MARPOL International Convention for the Prevention of Pollution from Ships
NGO Nongovernmental Organization
OECD Organization for Economic Cooperation and Development
SASB Sustainability Accounting Standards Board
4
SEC U.S. Securities and Exchange Commission
SIU Seafarers International Union of North America
SSI Sustainable Shipping Initiative
TEU Twenty-Foot Equivalent Unit
UNCED United Nations Conference on Environment and Development
UNCTAD United Nations Conference on Trade and Development
UNEP United Nations Environmental Program
UNGC United Nations Global Compact
WCED United Nations World Commission on Environment and Development
WWF World Wildlife Federation
5
Executive Summary
This master’s thesis explores sustainability reporting practices of major container
carriers within the maritime shipping industry. The author was inspired to conduct
this study after finding in his professional work that the level of information available
on industry reporting practices was limited, even superficial. Despite existing
information provided in business reports focused on the number of sustainability
reports issued in the transportation sector, it appeared crucial to dig further to
understand the factors behind industry reporting in order to provide relevant insights
to carriers on how to improve. The goal of this study is therefore to define how
container carriers communicate on sustainability and to clarify the motivations behind
their current reporting efforts, by answering the following research questions:
1. What is the current state of sustainability reporting practices by maritime
container carriers? This question is a starting point to uncovering whether the
industry is leading or lagging in reporting, and whether current sustainability
reports meet the expectations of their users.
2. What industry barriers and drivers exist which help to understand the current
state of sustainability reporting? This question reveals the challenges that
carriers face in reporting as well as possible avenues for improvement.
The study uses a general inductive approach for qualitative data analysis allowing
ideas to be constructed throughout the course of data gathering, rather than starting
with a pre-determined hypothesis.
The author begins measuring sustainability reports by creating indicators to evaluate
at once the level of communication and the robustness of carrier sustainability actions.
To conduct such in-depth research it was deemed necessary to focus on a limited
number of carriers. The maritime shipping industry is highly concentrated among
twenty carriers, who together represent 83.4 percent of market share, which the author
considers as a fair representation of industry performance. Consequently, these twenty
carriers are defined as the scope for this first phase of the research. The author uses
content analysis to review 51 sustainability reports issued by these carriers between
6
2002-2012. Each report is coded based on six selected indicators, which together
account for a report’s level of maturity1, and then charted and compared.
In a second phase, the author constructs hypotheses on barriers and drivers to
reporting by analyzing the industry value chain, identifying key stakeholder pressures,
and performing archival research on social and environmental industry shocks
between 2002-2012. Finally, ten stakeholders including carriers, clients, ESG analysts,
consultants and reporting experts are interviewed to provide their perception and
comprehension of the current state of reporting, their opinions on barriers and drivers,
and their expectations for reporting evolution and improvement.
Results are as follows: After the maritime industry’s entrance into reporting in 2002
with only one carrier reporting, and a sustained increase of reports until 2008 with
seven carriers reporting, the data shows a subsequent stagnation in the number of
reporting carriers: between 2008 and 2012, the number of net yearly sustainability
reports remains between seven and nine. Surprisingly enough, 2008 is also begins a
second type of stagnation in industry reporting, as the maturity level of sustainability
reporting (according to the author’s pre-selected indicators) sees no further
improvement after 2008 levels. This is even more surprising as 2008 witnesses the
first report from market leader Maersk Line, an event that could otherwise have been
expected to compel additional carriers to report. Initially, seen from this ‘data-driven’
perspective, it appears that maritime industry reporting reached an insurmountable
reporting plateau in 2008.
Yet the second phase of research uncovers additional dynamics at work behind the
data, providing insight from analysis of the value chain and interviews of industry
specialists, revealing certain barriers that may have caused the plateau in reporting,
and offering drivers as an avenue to understand how to overcome the perceived
current stagnation in reporting maturity.
Results reveal two barriers to reporting: a lack of internal resources to support
sustainability efforts, including reporting, and a negative image of container carriers
1 Reporting maturity is tested through a study of six indicators that, together, define reporting maturity as consistency with reporting standards, quality of communications, and intensity of sustainability practices within an organization.
7
portrayed in the media, reinforced by an industry aversion to communication.
Discounted as barriers, complex ship ownership and industry regulatory structures are
identified as limiting factors to reporting.
Results also reveal two drivers to reporting: customer pressure and NGO/
Sustainability Index pressure, which both place requirements on carriers to publish a
range of sustainability information in reports. Discounted as a driver, increasing
regulation was identified as an enabling factor, allowing for carriers to prepare certain
sustainability-related data but not pushing for the publication of a sustainability report.
Peer reporting was identified as both a barrier and a driver, since an existing peer
reporter can either eliminate the competitive advantage of being a first-mover or
encourage competitors to report in order to stay in step with industry leaders.
These results identify industry challenges to be addressed in order to improve
sustainability reporting. In the short term, carriers can improve the content of their
reports to meet stakeholder expectations by doing the following:
- Focusing on priority issues as determined through a materiality analysis;
- Connecting sustainability efforts with the investment community;
- Providing greater levels of transparency on lobbying and public policy efforts;
- Communicating on social benefits beyond philanthropic efforts.
In the long term, barriers reveal an industry culture that does not see the business
value in sustainability and does not actively communicate for fear of media
repercussion. Addressing these challenges may requires more complex solutions, such
as proving the businesses case for sustainability to convince senior management at
carriers to begin allocating additional resources to sustainability efforts, and
invitations by media networks for carriers to share their positive efforts, in order to
reverse the negative media image and carrier resistance to communication.
Ultimately, this study’s findings on industry reporting maturity and underlying
barriers and drivers should be treated as indicative since it is limited by the sample
sizes used in both the reporting content analysis and the series of stakeholder
interviews. Further research could be performed to reinforce or refute these findings
either through using larger samples, testing a broader range of reporting indicators, or
comparing the maritime shipping industry against other industries.
8
Acknowledgements
Writing this thesis has been a fulfilling experience. I am grateful to Professor Afshin
Mehrpouya, who supervised my work with kindness and professionalism. Professor
Mehrpouya’s willingness to share his knowledge and experience has been of
tremendous help to both structure my work and raise its quality level. I also thank the
academic team of the HEC MSc in Sustainable Development, in particular Benedicte
Faivre-Tavignot and Fabrice Graff for their continued support and understanding
throughout the academic year and until now.
I am also grateful to Angie Farrag, my manager at BSR, for planting the seeds of my
thesis topic and inspiring me to tackle this relatively unexplored subject area. Her
continued input and support have been priceless during this paper’s development. I
owe a special thanks to the many people that I have read and interviewed during my
research, who enabled me to develop many of the arguments and insights presented
here.
My family and friends contributed to this thesis in several ways. My parents, Patricia
and Robert, gave me much more than financial support. The choices I have made in
my life, including the choice to study and live in France, have been to a great extent
influenced and encouraged by my parents’ love and complete generosity. I also thank
my sister Rebecca, Aunt Trish and Uncle David for their love and support, and for
their tireless help in providing interview transcriptions. Further, I am in debt to my
fellow classmates for their willingness to discuss ideas and provide advice, and to my
friends all over the world who provided copyedits.
And last, but by no means least, I would like to thank my wife, Alix, who has been
ever supportive of this project, picking me up at the most difficult of times, and
inspiring me to move forward at all times. Alix’s help and patience are behind every
part of this research, and it is to her that I dedicate what follows.
9
Introduction Over the past decade, the concept of sustainability has become a key priority for
business. Sustainability itself represents a company’s very ability to “survive and
thrive” over the long-term in an increasingly globalized world, and achieving
sustainability requires engagement across a business’s full range of activities and
processes (Carroll, et al., 2012: 23). Today, a clear indicator of an organization’s
commitment to sustainability is its level of accounting and disclosure, most often seen
through the publication of a sustainability report.
According to the Global Reporting Initiative (GRI), the world’s leading voluntary
reporting framework, over 5,200 organizations have now issued a total of 13,540
reports as of April 2013, and the number continues to increase (GRI). However, the
practice of sustainability reporting has not always been as widespread, and in fact, is
intricately linked to today’s corporate acceptance of sustainability as a means to
achieve performance goals. Before discussing the current state of sustainability
reporting and analyzing the maritime shipping industry’s reporting practices, it is
therefore necessary to introduce the origins of the private sector’s engagement with
sustainability, which has emerged slowly over the past few decades, mainly as the
result of environmental and social debates that increasingly called for political action
(and increased political pressure) on national and international levels.
Perhaps most influential in sparking the debate around corporate environmental
sustainability was the publication of the 1962 book “Silent Spring”, written by author
and ecologist Rachel Carson. Her work brought together the disciplines of toxicology
and ecology to illustrate for the first time the potentially harmful relationship between
the private sector and nature, suggesting that use of the pesticide DDT was building to
dangerous levels, and unless otherwise checked, would create an environmental
catastrophe with public health consequences (Carson 2002). Its publication brought
cries of foul from industry and a new level of public awareness concerning mankind’s
impacts on nature, as well as action from the United States government – resulting in
10
control and subsequently banning of DDT and the establishment of the US
Environmental Protection Agency (National Resources Defense Council).
At roughly the same time, economist Milton Friedman kicked off the debate around
corporate social responsibility when he published his seminal book “Capitalism and
Freedom” in 1962, in which he defined a theory that would later come to be known as
stockholder theory. His work was solidified in a 1970 New York Times Magazine
article entitled “The Social Responsibility of Business is to Increase its Profits,”
arguing that the core and unique responsibility of business is “to increase its profits so
long as it stays within the rules of the game, which is to say, engages in open and free
competition without deception or fraud" (Friedman 1970). In the article, Friedman
criticized the growing idea of corporate consciousness and claimed that forced “social
responsibility” in fact imposes a unwanted tax on shareholders in order to pay for
social good. Friedman’s work was later challenged by Edward R. Freeman in his 1984
book “Strategic Management: A Stakeholder Approach.” Freeman popularized the
concept that the responsibility of business extended beyond shareholders to diverse
groups known as stakeholders, or those who have “stake” in the operations of a
company and its impacts, and argued that each should be accorded equal regard in the
eyes of the corporation (Freeman 2010). Freeman implied that a good relationship and
responsibility towards stakeholders leads to increased corporate performance.
By the 1980s, these growing debates on the environmental and social responsibilities
of the private sector entered into the national and international policy sphere. The
United Nations mobilized to address these issues specifically through the foundation
of the UN World Commission on Environment and Development (WCED) in 1983
and its final report “Our Common Future” in 1987, as well as during the seminal 1992
UN Conference on Environment and Development (UNCED), or Earth Summit, in
Rio de Janeiro. The term sustainability itself is a derivative of the concept of
sustainable development2, which “Our Common Future” defined as “meeting the 2 The terms sustainability and sustainable development are often used interchangeably, however
sustainability has become broadly accepted as “the goal” whereas sustainable development is “the
process towards this goal” (Schaltegger et al. 2003: 22). This paper defines sustainability as an
organization’s ability to be at once financially sustainable while also fulfilling social and
environmental responsibilities and stewardship.
11
needs of the present without compromising the ability of future generations to meet
their own needs” (United Nations 1987: 24). This oft-cited definition of sustainable
development was further elaborated and broadly accepted during the Rio Earth
Summit in 1992 with the publication of the Brundtland Report, which clearly linked
development with environmental protection and broadly raised environmental
awareness among the business community.
In 1999, then UN secretary-general Kofi Annan fundamentally solidified the
relationship between the private sector and the United Nation’s policies on sustainable
development when he announced the creation of the UN Global Compact. This
initiative offered businesses the opportunity to voluntarily align their operations and
strategies with ten principles covering the environment, human rights, labor standards
and anti-corruption (Rasche 2012), and swiftly became the world’s leading corporate
responsibility initiative. The United Nations further engaged the private sector during
the Millennium Summit in September 2000, when member states unanimously
adopted the United Nations Millennium Declaration, a declaration charging the
private sector and civil society organizations to make greater contributions to the
United Nation’s adopted goals (United Nations 2000), later known as the Millennium
Development Goals.
More recent years have seen a refinement of the United Nation’s global policy for
sustainability and a call for greater engagement and accountability from the private
sector. The UN World Summit of 2002 in Johannesburg addressed for the first time
the topic of corporate accountability, and specifically non-financial reporting (United
Nations 2002) by increasing the call for disclosure. New York’s 2005 World Summit
broadened the ambition of sustainable development within the private sector to cover
economic, social and environmental aspects, and pushed for the adoption of policies
that emphasized corporate accountability (United Nations 2005). And most recently,
the Rio de Janeiro Rio+20 Summit in 2012 took stock of sustainability progress over
the past 20 years, and called for renewed private sector engagement on the
commitments they had made toward more responsible business practices through the
Global Compact (United Nations 2012).
12
The combination of these debates and resulting international policies have yielded
today’s mainstream understanding and acceptance of sustainability, which for the
private sector involves addressing the economic, environmental and social impacts of
a company’s operations. The economic aspect of sustainability is to secure long-term
financial performance of a company, which is inherent to a company’s existence. The
environmental aspect of sustainability refers to a company’s relationship, influence,
and dependency on the natural environment, covering a wide range of issues such as
resource use, greenhouse gas emissions, waste production, biodiversity loss, and
energy use. The social aspect of sustainability includes human rights issues such as
equality and fair treatment and governance issues such as corruption and bribery, as
well as a company’s consideration and inclusion of their stakeholders.3
As a consequence, sustainability reporting has become a widely adopted means of
communicating the objectives, efforts, and achievements of a company’s
sustainability strategy. Standalone sustainability reports published in addition to
annual reports first emerged as environmental reports towards the end of the 1980s,
mostly in response to public pressure and due to an increasing awareness of industry’s
impacts on the environment. Since then, sustainability reporting has become
widespread, expanding from purely environmental to more comprehensive reports
covering the environmental, social, and economic aspects of sustainability. Along
with reporting, sustainability accounting has developed as both a professional and
academic discipline. Voluntary guidelines such as the Global Reporting Initiative
(GRI) as well as external assurance from independent third parties have led to an
improvement of the quality of this extra-financial reporting. And today, there are
increasing numbers of conversations about the convergence of sustainability reporting
with annual financial reporting in what would become one integrated, comprehensive
report on a company’s activities. The International Integrated Reporting Council
(IIRC), a global coalition of regulators, investors, companies, standard setters, the
accounting profession and NGOs, released its draft guidelines in April 2013 with
ambitions to publish final guidance later in the year.
3 Most often associated with social sustainability is the concept of Corporate Social Responsibility (CSR), which this paper treats as a sub-set of sustainability (financial, social, and environmental responsibility) for simplicity.
13
Along with the rise of sustainability reporting came a natural rise in studies on
sustainability reporting, ranging broadly in approach and methodology. These studies
analyze a multitude of factors including company size, stakeholder pressure, and
media exposure (Wegener, et al 2013, Hackstone/Milne 1995, Ho/Tayler 2007,
KPMG 2011), or look specifically at the dependence between country and reporting
practices (Chapple/Moon 2005, Holland/Foo 2003, Kolk 2005). Benchmark studies
have been performed by consulting companies and industry associations to provide a
general examination of current reporting practices (KPMG 2011,
UNEP/SustainAbility 2006). And finally, studies were performed which looked at
practices within a country (Moneva 2000, Hedberg 2003, Vormedal 2006, Daub
2007), or within specific sectors (e.g. Perez 2009, Adams/Kuasirikun 2000, Mak et al.
2007, Van Wijk/Persoon 2006).
Of all studies concerning sector-specific reporting, the only study to broadly address
transportation (incorporating maritime transportation) was the KPMG benchmark
study indicating “transport” as a sector, ranking it 13th out of 16 sectors studied in
terms of availability of sustainability reports (2011). Further, only a handful were
found to focus on transportation industries, such as Mak’s study of Asian and
European Airlines (2007), and only two were found to focus on maritime
transportation (Fet 2003, Deengar 2007). This led the author to confirm the validity in
his choice of conducting a masters thesis to study sustainability reporting practices of
the maritime container transportation industry, since this is a minimally explored
topic within the field of sustainability reporting.

14
1. Aim and Research Methodology
This section will present the general aim and research methodology used in this study.
It will also present the research questions that will be developed throughout each
section of this paper.
1.1. Aim of the research This study intends to analyze the current practices in sustainability reporting in the
maritime container transportation industry. More specifically, this study aims to: 1.
Determine the state of the maritime transportation industry in sustainability reporting,
evaluating the maturity of sustainability reports published by companies in the sector
between 2002-2012, and 2. Understand the key industry barriers and drivers to
reporting. In this paper, reporting maturity is tested through a study of six indicators
that, together, define reporting maturity as consistency with reporting standards,
quality of communications, and intensity of sustainability practices within an
organization (see section 3.1 for a more detailed discussion and definition of these
indicators). This research follows an inductive process of data gathering to construct
general ideas about the chosen topic, and as such does not have a formal hypothesis to
test.
This study is structured as follows: First, a literature review is performed on the theme
of sustainability reporting and industry-specific reporting. Second, an analysis of
industry sustainability reporting is conducted over a longitudinal study period from
2002-2012 to understand maturity. And finally, key barriers and drivers to reporting
are identified through industry and stakeholder analysis, archival research, and a
series of semi-structured interviews with industry stakeholder. Conclusions and
recommendations are drawn based on the cross-examination of the results from these
two studies.
1.2. Choice of Industry and Companies Selected The author chose to study the maritime shipping industry to link with his professional
work at BSR, a business network and consultancy specialized in corporate

15
responsibility. The author sees the industry as a cornerstone of world trade, with
enormous potential to enable economic growth by creating trade flows and links
between markets, but also a victim of the volatility of international financial markets,
which have resulted in regular periods of boom and bust, and have currently thrown
the industry into deep financial crisis. The author was profoundly curious to
understand how companies are addressing long-term sustainability within such a
volatile environment, but had difficulty finding communication on the subject from
maritime carriers.
Thanks to privileged access to carriers and their customers in BSR’s Clean Cargo
Working Group, an industry initiative focused on environmental performance
improvement among container carriers within the maritime transportation industry,
the author posed questions to participants about sustainability reporting and learned
that the maritime industry has always been resistant to broad communications,
partially explaining the lack of reporting. However, it was apparent that the last few
years had given rise to sustainability reporting from a handful of container carriers.
This contradiction posed interesting questions about why and to what degree this
traditionally opaque industry had begun communicating on sustainability, and the
author saw potential business benefits in learning what the barriers and drivers to
communication would reveal about industry sustainability practices, and how they
could be addressed to improve sustainability reporting.
Further driving the choice of studying the maritime shipping industry, initial desktop
research showed that minimal studies had been performed on the industry’s
sustainability practices and even less on its reporting practices, indicating that the
current study would therefore be adding to the academic literature on the industry.
Maritime container transportation was selected as a sub-sector to narrow the focus of
the study and to provide direct business benefit to the author’s work with the Clean
Cargo Working Group.
The container carrier companies analyzed were selected out of the top 20 container
carriers by volume and equally spread across regions in order to limit the effect of
company size and geography on findings.

16
Table 1: Carrier Size and Geography; Source: Elaborated by Author
1.3. Methodology This section describes the research methodology used in this masters thesis. It
presents the research strategy, research method and the approach to data analysis.
1.3.1. Research Strategy When performing academic research, it is possible to choose between two main types
of research strategies: quantitative or qualitative research. These two research
strategies follow fundamentally different approaches, particularly concerning the
collection and analysis of data; quantitative research is focused on numerical values
as a data source, whereas qualitative research relies on words, ethnography or
observation as a data source (Bryman/Bell 2007). It was decided to use a qualitative
approach for this thesis since it allows for a study of written materials published by
companies on their sustainability performance. This is thought to be appropriate to the
aim of the thesis, which involves the analysis of sustainability reports in order to
determine the maturity of industry reporting over the past 10 years, industry value
chain and stakeholder analysis, archival research, and interviews with key
stakeholders.
1.3.2. Research Method The research method of this thesis involves literature review, report analysis, industry
research, and a series of semi-structured interviews. The combination of the four is
deemed adequate to reach the aim of the thesis.
17
1.3.2.1. Literature review It is essential that an appropriate level of theoretical study be conducted in the context
of a research problem (Saunders et al, 2009). For this reason, the author conducted a
literature review using sources mainly consisting of articles published in academic
journals within the last 5-10 years. In addition, the author reviewed his own published
business reports on sustainability reporting laws, which helped to frame the topic of
sustainability reporting from a regulatory standpoint. As a model, the author used a
literature review process suggested by Mark Saunders, professor in Business Research
at the School of Management at the University of Surrey (Saunders, et al, 2009),
which consists of determining parameters for the literature search and using keyword
search to narrow the field of literature review.
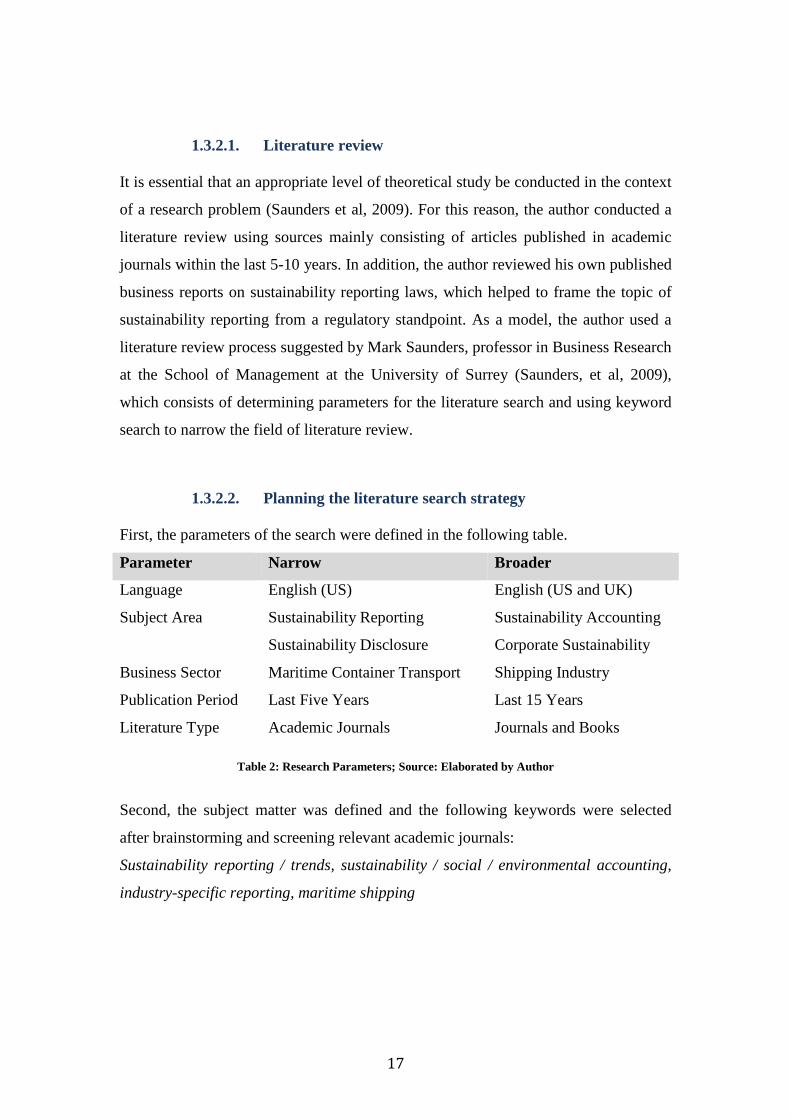
1.3.2.2. Planning the literature search strategy First, the parameters of the search were defined in the following table.
Parameter Narrow Broader
Language English (US) English (US and UK)
Subject Area Sustainability Reporting
Sustainability Disclosure
Sustainability Accounting
Corporate Sustainability
Business Sector Maritime Container Transport Shipping Industry
Publication Period Last Five Years Last 15 Years
Literature Type Academic Journals Journals and Books
Table 2: Research Parameters; Source: Elaborated by Author
Second, the subject matter was defined and the following keywords were selected
after brainstorming and screening relevant academic journals:
Sustainability reporting / trends, sustainability / social / environmental accounting,
industry-specific reporting, maritime shipping

18
1.3.2.3. Conducting the Literature Research The author recognizes that in a reduced timescale the research performed would only
reveal a portion of the relevant literature. A browsing and screening process was used
when reviewing literature with the help of the above keywords to identify articles and
books that were deemed important for the theoretical review.
1.3.2.4. Conducting the Report Analysis The research method chosen for the study of selected container carrier sustainability
reports is qualitative content analysis. Content analysis is considered to be the most
suitable method for the purpose of this study. Its origins date to the 19th century when
it was originally used to analyze newspaper and magazine articles, and it has more
recently been broadly used in corporate social and environmental responsibility
research (Gray, et al. 1995). As a research tool, content analysis has been used to
search for the presence of certain words and concepts within texts. The particular
method used in this thesis is a deductive approach, developing a conceptual
framework of six indicators to test through data gathering (Saunders, et. al 2009).
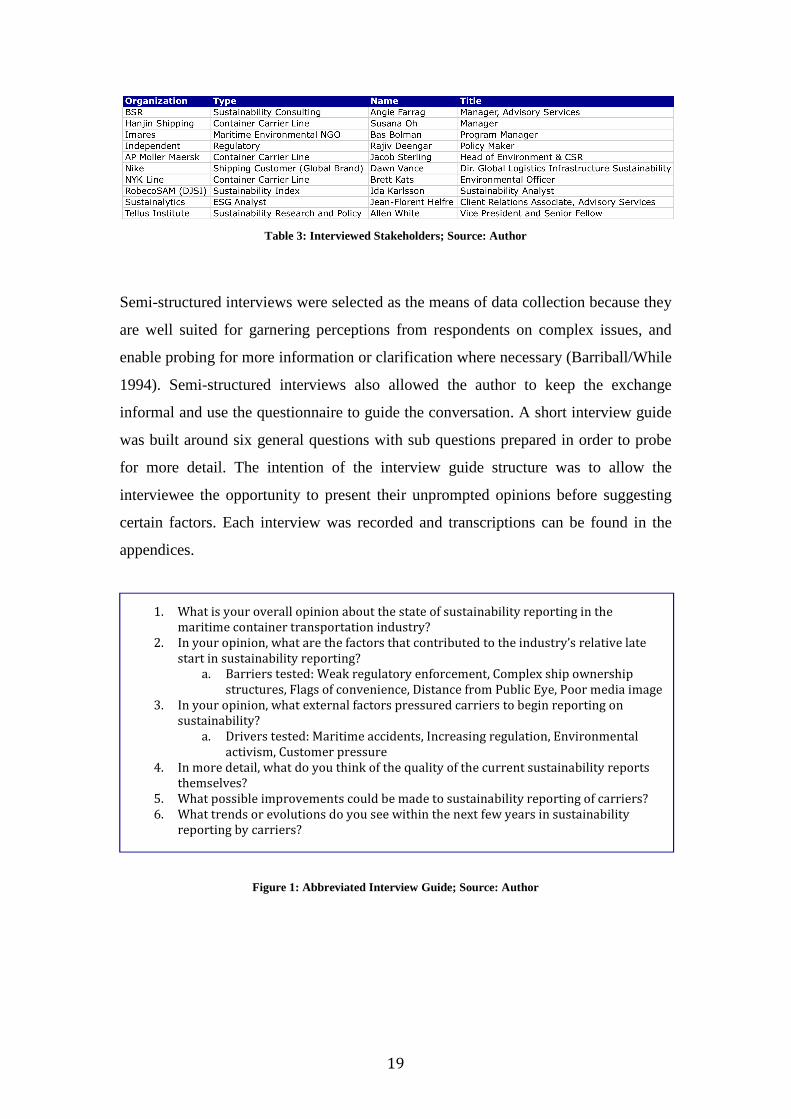
1.3.2.5. Conducting the Semi-Structured Interviews Given the limited information accessible through publicly available reports, the author
conducted a series of semi-structured interviews with key industry stakeholders to
complement the content analysis, further reveal the state of industry reporting, and
identify barriers and drivers. The author invited over fifty candidates across a range of
industry stakeholder groups to participate in semi-structured interviews, and
eventually secured and conducted a series of ten interviews with a number of
stakeholders including maritime container carriers, customers, NGOs, ESG analysts,
sustainability indices, as well as academics and experts working on sustainability
reporting frameworks.
19
Table 3: Interviewed Stakeholders; Source: Author
Semi-structured interviews were selected as the means of data collection because they
are well suited for garnering perceptions from respondents on complex issues, and
enable probing for more information or clarification where necessary (Barriball/While
1994). Semi-structured interviews also allowed the author to keep the exchange
informal and use the questionnaire to guide the conversation. A short interview guide
was built around six general questions with sub questions prepared in order to probe
for more detail. The intention of the interview guide structure was to allow the
interviewee the opportunity to present their unprompted opinions before suggesting
certain factors. Each interview was recorded and transcriptions can be found in the
appendices.
Figure 1: Abbreviated Interview Guide; Source: Author
1. What is your overall opinion about the state of sustainability reporting in the
maritime container transportation industry?
2. In your opinion, what are the factors that contributed to the industry’s relative late
start in sustainability reporting?
a. Barriers tested: Weak regulatory enforcement, Complex ship ownership
structures, Flags of convenience, Distance from Public Eye, Poor media image
3. In your opinion, what external factors pressured carriers to begin reporting on
sustainability?
a. Drivers tested: Maritime accidents, Increasing regulation, Environmental
activism, Customer pressure
4. In more detail, what do you think of the quality of the current sustainability reports
themselves?
5. What possible improvements could be made to sustainability reporting of carriers?
6. What trends or evolutions do you see within the next few years in sustainability
reporting by carriers?
20
2. Literature Review
The following sections discuss the existing literature on sustainability reporting by
looking at the evolution and current state of social and environmental disclosure,
company motivations to report, a focus on current reporting frameworks, guidelines,
and standards, and previous research on sector-specific reporting with a focus on the
maritime transport sector.
Related to the research questions, the intention of this section is to provide broader
context for the current sustainability reporting practices of the maritime shipping
industry, and to identify any gaps in existing literature that confirm the necessity of
this study. Further, the review of previous research and sector-specific reporting and
studies performed on the maritime shipping industry are intended to provide insight
into potential barriers and drivers to reporting for the sector.
2.1. Origins and Current State of Sustainability Reporting Sustainability reporting has not always resembled its current state. This first section
addresses the developments that have occurred over the past few decades regarding
the issues included in sustainability reports.
2.1.1. Evolution of Extra-Financial Reporting Today’s mainstream sustainability reporting can trace its roots in the 1970s when
companies in the US began the practice of social accounting and reporting to identify,
measure, monitor and report their social and economic effects on society (Kolk 2005).
This was a minority practice that partially stemmed from the Friedman-Freeman
debate and it is notably the first appearance of such social accounting. In the late
1980s, reporting on extra-financial issues broadly re-appeared due mainly to a rise in
NGO awareness of, and public pressure on, the impacts of globalization and its
associated environmental consequences.
The first standalone “environmental reports” were published in 1989 thanks in part to
the work of the WCED and UNCED, and soon afterwards environmental reporting
became regular practice for larger multinationals, with tack-on effects among smaller
and medium companies (Kolk 2004). Reporting continued to mature in the 1990s with
the publication of sustainability reports that covered social and economic issues along

21
with the standard environmental disclosures. Manufacturing sectors with high
environmental impact led the pack in terms of reporting maturity, whereas sectors
with lower environmental impact lagged behind in their reporting (KPMG 2011; Kolk
2004).
2.1.2. Characteristics of Modern Sustainability Reporting This section describes certain characteristics of today’s sustainability reporting as
revealed through recent studies on reporting trends. The intention is to further
contextualize the landscape in which maritime container companies are expected to
report.
It is worth repeating that the quantity of sustainability reports issued today is simply
staggering. In addition to GRI’s declared number of 5,200 organizations reporting
with their framework (GRI), the online database CorporateRegister.com, which tracks
the number of companies that have issued non-financial reports since 1992, has
published an even more impressive figure. According to their records, the number of
non-financial reports has increased from less than 50 in 1992 to over 47,626 across
9,905 companies in 2013 (Palenberg 2006; CorporateRegister). KPMG takes these
numbers as a sign that “corporate responsibility reporting in industrialized countries
has clearly entered the mainstream” (KPMG 2011). Palenberg explains this increase,
saying that nearly all companies in the industrialized world are expected to report on
corporate responsibility due to legal or regulatory requirements (Palenberg 2006).
Nevertheless, UNEP clearly states that reporting remains a dynamic field, with new
entrants from non-OECD countries making up half of their 50 studied reporting
leaders (UNEP/SustainAbility 2006), showing that new reporters are not only coming
from developed, northern economies.
This being said, sustainability reports are most frequently being published by
companies located in OECD countries. The growth in reporting has been strongest in
the UK, the US and Japan (Palenberg 2006). UNEP names the United Kingdom as the
striking leader of all companies analyzed in their 2006 study, and that European
reporters and the Netherlands also appeared in the top five of their report ranking
(UNEP/Sustainability 2006). KPMG reaches similar conclusions, showing that five of
22
the ten countries leading the pack in reporting are European nations (KPMG 2011: 4).
Increasingly, studies have also shown strong emergence from non-OECD reporters as
well, including South Africa and Brazil (Palenberg 2006: 9; UNEP/SustainAbility
2006) and Hong Kong and India (UNEP/SustainAbility 2006).
A broad range of report types are being issued from corporations across these
geographies. As mentioned earlier, the first standalone reports were focused on
environmental information in the US and Western Europe. These reports broke the ice
for the more comprehensive sustainability reporting seen among companies today,
which are often referred to as “sustainability”, “sustainable development”, “corporate
responsibility”, and “corporate social responsibility” reports (KPMG 2011), as well as
“social and environmental responsibility” or “social liability” reports. Standalone
environmental reports are still being issued by certain companies, but KPMG claims
that more comprehensive sustainability reports covering environmental, social, and
economic issues have “come of age in 2011” (KPMG 2011: 6), or in other words, are
now the mainstream.
Sectors play a determining role in whether or not a company issues a sustainability
report. The KPMG study finds that the forestry, pulp and paper industry leads
reporting companies, along with mining, automotive, media, and utilities companies
following close behind. At the other end of the spectrum, trade and retail, transport,
and metals, engineering, and manufacturing are rated as the poorest performing, or
least reporting sectors, which is surprising as these are sectors with high
environmental impact (KPMG 2011). These results vary greatly from those stated in
the dated 2006 UNEP study, which showed transport, banking, and electricity as
leading sectors at the time while beverage, retail, and general utilities sectors were the
least reporting sectors (UNEP/SustainAbility 2006). KPMG provides brief analysis to
note that their own results have drastically changed within the past three years, when
their 2008 results were more in line with the UNEP study. KPMG also notes that
reporting practices are sometimes misleading regarding a sector’s sustainability
performance, singling out transport as a sector that has made great strides in
incorporating low emissions policies whereas only 57 percent of companies in that
sector issue sustainability reports (KPMG 2006).
23
Company size is a key characteristic of sustainability reporting practices. Palenberg
notes that the publication of non-financial reporting remains strongest among
multinationals, and that typically small and medium enterprises have been excluded
from the growth of reporting practices across geographies (Palenberg 2006). He
stresses, “without a doubt, the number of SMEs in the pool of non-financial reporters
is very small” (Palenberg 2006: 13). This phenomenon could possibly be explained by
certain barriers for SMEs to report, such as low public visibility and pressure, lack of
competitive pressure, lack of internal resources to produce a report, and a low return
on investment for reporting. In addition, SMEs do not experience the same first-
mover competitive pressure to report as multinationals do, for which there can be
certain disadvantages for non-reporting (Palenberg 2006) such as being rated as “less
transparent than their peers” (KPMG 2011: 11).
KPMG supports Palenberg’s comments, noting that companies with revenues of more
than $US50 billion are twice as likely as those with revenues under $US1 billion to
issue sustainability reports (KPMG 2011). KPMG also comments on company
ownership as it relates to sustainability reporting, mentioning that of the 100 largest
companies measured across 34 countries, 69 percent of publicly traded companies
issue sustainability reports whereas only 36 percent of private or family-owned
companies issue report (KPMG 2011). This suggests that regulations and financial
market requirements do have an impact on a company’s reporting practices,
regardless of size, but only if they are publicly traded.
According to UNEP the real question to be asked, however, is not on reporting
quantity, type, or geographic distribution, but rather on the quality of those reports.
The report concludes that links are increasing between what is reported and what is
being implemented as core business processes (UNEP/SustainAbility 2006), showing
that reporting is not merely a communications exercise but rather driving internal
change. The KPMG study supports this sentiment, showing that regional leaders are
strong in both the quality of their communications but also the level of sustainability
process maturity within the organization (a crossover which this thesis will further
refer to as reporting “maturity”) (KPMG 2011).
In addition, Palenberg notes that non-financial reporting has moved towards external
assurance of reports, a practice believed to increase quality and reliability of reporting
(Palenberg 2006). He further cites a 2004 Association of Chartered Certified

24
Accountants (ACCA) study, which finds that nearly 40% of all reports included
assurance in 2006 compared to 17% of reports in 1996. Kolk also supports that
verification provides a measure of assurance about the reliability of the report (Kolk
2004). However, both Kolk and Palenberg warn that assurance tools and
methodologies vary greatly and that assurance is generally only conducted on certain
parts of reports (Kolk 2004, Palenberg 2006), so it not always a clear sign of quality.
Despite the potential business benefits arising from increased links between
communications and policies as well as the rise in external assurance, studies
conclude that the overall quality of reports as a function of content and reliability
remains very low (Palenberg: 2006). The previously cited ACCA study notes that
many reports simply fail to address the biggest, most relevant sustainability issues
“such as sector-specific impacts and global issues such as dependence on fossil fuels,
human rights, and labor issues” (Palenberg 2006; ACCA 2004). This lack of
“materiality” or relevance of reported issues was also highlighted by the UNEP study,
which stated that most of even the 50 reporting leaders found it difficult to balance
competing demands from the issues relevant to diverse stakeholder groups
(UNEP/SustainAbility 2006). KPMG adds that data quality continues to be a
significant issue, with over a third of the global 250 reporting leaders restating
information in their sustainability reports without significant updates to the reported
data (KPMG 2011).
Further, quality is hard to assess across the wide variety of reports issued with
substantial differences in length, scope and depth (Kolk 2004). An explanation for
this lack of comparability is that extra-financial reporting remains a mainly voluntary
practice (Palenberg 2006) and there exists no global standing rule or mandatory
reporting law (see section 2.3 Factors Influencing Selection of Reporting Content).
This theoretical review of existing literature on sustainability reporting has provided
key context for the research question on the current state of reporting within the
maritime transportation industry. As demonstrated, sectors vary greatly in their
reporting activities and general adherence to the increasing voluntary reporting
frameworks. The transportation sector in particular is one of the least reporting among
those reviewed by the KPMG survey of top reporting companies, giving an indication
that this may be a lagging sector. In addition, this analysis provided the author with

25
ideas regarding potential corporate barriers and drivers to reporting for consideration
in answering the second research question. Retained from this discussion are the
following elements, which are later considered when analyzing barriers and drivers to
reporting for the maritime shipping industry:
• Potential Barriers: lack of sustainability resources, lack of competitive
pressure
• Potential Drivers: reporting regulated
• Potentially Either: geography, industry sector, OECD-location, ownership,
environmental impact, company size
The following section continues the literature review by looking more specifically at
studies revealing the motivations explain why companies may issue sustainability
reports or not. The author intends to use findings to continue building on the list of
potential barriers and drivers to sustainability reporting.
2.2. Motivations For Companies to Report Companies have various reasons to publish sustainability reports beyond the
occasionally applicable regulatory requirements suggested in the previous section.
Much of the existing research cites legitimacy theory as one of the more probable
explanations for the increase in sustainability reporting over the past decades.
Legitimacy theory is based on the idea that in order to continue operating successfully,
companies must act within the bounds of what society identifies as socially acceptable.
As sustainability reporting has grown in social importance, voluntary disclosure of
information acts to further legitimize a company’s existence. This theory has been
adopted and validated in a long list of previous studies (O’Donovan 2002, Bebbington
et. al 2008, Deegan et. al 2002), and is accepted as the de-facto backdrop for company
voluntary reporting motivations. Nevertheless, Kolk details the following potential
motivations for a company to report, which the author affirms are as valid today as
when they were published almost ten years ago (Kolk 2004):
• enhanced ability to track progress towards specific targets;
• facilitating the implementation of [an] environmental strategy;

26
• greater awareness of broad environmental issues throughout the organization;
• ability to clearly convey corporate message internally and externally;
• improved all-round credibility from greater transparency;
• ability to communicate efforts and standards;
• license to operate and campaign;
• reputational benefits, cost savings identification, increased efficiency,
enhanced business;
• development opportunities and enhanced staff morale.
Additionally, the previously cited KPMG survey of companies asked questions on the
business imperative behind sustainability reporting for the past 18 years. The 2011
report finds that reputation or brand considerations top the list of business drivers
globally among 67 percent of surveyed companies, followed by ethical considerations
and employee motivation at 58 percent and 44 percent respectively (KPMG 2011).
Paradoxically, close to half of the top 250 global companies surveyed reported
gaining financial value from reporting, while financial concerns such as market
consideration and cost savings came in last on the list of business drivers with only 22
percent and 10 percent of surveyed companies claiming them as motivations (KPMG
2011).
Palenberg’s 2006 study states that stakeholder pressure remains a key driver to
sustainability reporting, with the important caveat that stakeholder pressures can both
wax and wane and may change in the future (Palenberg 2006). Through further desk
research and an interview series conducted with key stakeholder groups, Palenberg
identified the eight most frequently mentioned factors behind why companies issue
sustainability reports. Most important was strategic management of reputation and
brand, mentioned 51 percent of the time, competitor reporting, 28 percent of the time,
and reacting to NGO pressure, 13 percent of the time (Palenberg 2006). This
underscores the premise that a large number of respondents believe sustainability
reporting is a reactive, rather than proactive measure, and a practice conducted by
companies confronted with significant stakeholder pressure.
27
2.2.1. Reasons for Non-Reporting While the case has been made for the motivations behind issuing sustainability reports,
certain companies continue to have reasons for non-reporting. As mentioned earlier,
companies are not concerned with disclosing sustainability information if there are
doubts on the return on investment for the organization, if customers are uninterested
in the information, if the company lacks internal resources, or if there is a lack of
external pressure from stakeholders. Kolk supports a number of these reasons in the
following list of motivations for non-reporting (Kolk 2004):
• doubts about the advantages it would bring to the organization;
• competitors are not publishing reports;
• customers (and the general public) are not interested in it, it will not increase
sales;
• the company already has a good reputation for its environmental performance;
• there are many other ways of communicating about environmental issues;
• it is too expensive;
• it is difficult to gather consistent data from all operations and to select correct
indicators;
• it could damage the reputation of the company, have legal implications or
wake up ‘sleeping dogs’ (such as environmental organizations).
This discussion added the following elements to the previous list of potential barriers
and drivers:
• Potential Barriers: lack of sustainability resources, lack of competitive
pressure, low public visibility, low return on investment, reputation, cost,
consistency
• Potential Drivers: reporting regulated, awareness of issues, clarity of message,
license to operate, employee morale, goal-setting, transparency
• Potentially Either: geography, industry sector, OECD-location, ownership,
environmental impact, company size
28
The following section is a brief description of the available voluntary and mandatory
standards, frameworks and guidelines on sustainability reporting, and how they affect
current corporate reporting practices. These guidelines are important to understand
what expectations and pressures are placed on companies when they issue
sustainability reports.
2.3. Factors Influencing the Selection of Reporting Content A 2011 KPMG Survey showed that 95 percent of the 250 largest companies in the
world (G250) now report on their sustainability activities, while 80 percent adhere to
the GRI Reporting Guidelines (KPMG 2011). The remaining 15 percent either adhere
to a different voluntary framework or to some form of national regulation.
2.3.1. Voluntary Standards, Frameworks and Guidelines Global Reporting Initiative (GRI) Guidelines The Global Reporting Initiative is a multi-stakeholder organization founded in 1997
by the United Nations Environmental Program (UNEP) and CERES, a non-profit
organization created to change corporate environmental practices.4 The objective of
the GRI is to provide all companies and organizations with a comprehensive
sustainability reporting framework in order to create “a sustainable global economy
where organizations manage their economic, environmental, social and governance
performance and impacts responsibly and report transparently” (GRI). GRI issues
their guidance through a process of continuous improvement. The first GRI guidelines
were released in 2000, the second version G2 was published in 2002 and the G3.1 was
in 2006. GRI has just recently released its fourth version, G4, in May 2013 after a
period of public consultation.
The GRI Reporting Framework contains general guidance and prescriptive indicators
concerning an organization’s strategy, its management approach, and its economic,
environmental and social sustainability performance. Also released are sector-specific
supplements that add sector-specific indicators and specific guidance for sector
4 Interestingly, CERES was founded the same year as the Exxon Valdez oil Spill, and in response
to the spill created the Valdez principles, a 10 point code of corporate environmental conduct to
be publicly endorsed by CERES companies. Today’s leading sustainability reporting framework
therefore had its origins very closely linked to the maritime transportation sector.

29
application. In the current G3.1 version, reporting organizations are requested to self-
declare their GRI application level of either A, B, or C, a measure of completeness to
fulfilling the guidance (GRI 2006). The GRI guidelines are the leading voluntary
reporting framework available today.
International Integrated Reporting Council (IIRC)
In recent years the notion of integrated reporting (IR) has gained in popularity. The
purpose of integrated reporting is to create one single, concise and comprehensive
document detailing how an organization’s strategy, governance, performance and
prospects lead to the creation of value over the short, medium and long term (IIRC).
This report would include the information typically found in a company’s financial
statements as well as the information found in standalone sustainability reports,
replacing these two separate documents by providing one reference document for all
stakeholders. Yet discussions around integrated reporting have raised a myriad of
concerns over the format, content, and usefulness of such reporting.
To address these concerns and work toward an agreed-upon framework, the IIRC was
launched in 2010 by the Prince of Wales along with a number of international
partners. The IIRC calls itself a global coalition of regulators, investors, companies,
standard setters, accountants, and NGOs working to create a globally accepted
framework for IR in order to encourage movement toward this type of reporting
(IIRC). The framework has undergone discussion for the past two years, and was
recently released in a draft form in April 2013 for a public consultation until
December 2013, at which point it will undergo a pilot test period amongst 90
organizations until September 2014 (IIRC).
ISO26000 ISO26000 was launched as a standard in 2010 following five years of negotiation
with around 500 stakeholders from government, NGOs, industry, consumer groups
and labor organizations (ISO). The standard provides guidance for companies on
social responsibility, developing sustainability management routines and practices,
and on how to discuss social responsibility with their relevant stakeholders. ISO26000
is voluntary guidance.
30
OECD Guidelines for Multinational Enterprises The Organization for Economic Cooperation and Development (OECD) Guidelines
are recommendations for multinational companies who operate in who countries
adhering to the OECD. The guidelines were first created in 1976 as voluntary
standards for conducting business responsibly in a number of areas including human
rights, employment, the environment, information disclosure, combating bribery,
consumer interests, science and technology, competition and taxation. They are non-
binding voluntary principles and standards for responsible business conduct in a
global context in conformance with applicable laws and international standards, and
are recognized as the only multilaterally agreed code of responsible business conduct
to which governments have committed. Today they represent “far-reaching
recommendations for responsible business conduct that 44 adhering governments –
representing all regions of the world and accounting for 85% of foreign direct
investment – encourage their enterprises to observe wherever they operate” (OECD).
The guidelines were most recently updated for the fifth time in May of 2010 to
guarantee their continued role as a leading international instrument for responsible
business conduct (OECD 2011).
AA1000
AccountAbility’s AA1000 series are “principles-based standards to help organizations
become more accountable, responsible and sustainable” (AccountAbility). The
standards provide a framework for organizations to identify, prioritize and respond to
sustainability challenges, and provide guidance on sustainability assurance and
stakeholder engagement. They have been developed through a multi-stakeholder
process to ensure independence and relevance to those who will use them.
National Voluntary Standards In addition to voluntary frameworks, there are also a rising number of voluntary
reporting standards that are being promoted by national governments. The author has
conducted previous research into these standards, and has identified the following: the
Canada Environmental Protection Act of 1992, the Norway Accounting Act of 1998,
the Australia Corporations Act of 2001, the Japan Law of Promoting Environmentally

31
Conscious Business Activities of 2001, the Ireland Council of Institutions Act of 2006,
the Brazil Electricity Sector Regulations of 2007, the US Reporting of Greenhouse
Gas Rule of 2009, the India Companies Act of 2011, and the Spain Sustainable
Economy Law of 2011 (Morris/Baddache 2012b). These voluntary regulations range
in their scope and thematic focus, but show an overall pattern of increased interest in
providing regulatory frameworks for corporate disclosure.
Figure 2: National Voluntary and Mandatory Reporting Laws; Source: Morris/Baddache 2012b
2.3.2. Mandatory Standards and Laws
National Mandatory Standards Mandatory reporting regulations are also on the rise, with the most recent and
comprehensive law published in France in 2013, called the Grenelle II Act 225
(Morris/Baddache 2012b). This prescriptive law requires reporting on 32 social,
environmental and governance indicators covering a range of issues including
employment figures, waste management, and anti-corruption practices. It is one of the
first reporting laws to require both listed and unlisted, French and foreign companies
to report. Article 225 law joins the ranks of prior mandatory reporting laws such as
Denmark’s Financial Statements Act of 2009 which requires reporting on social
responsibility, actions and achievements and South Africa’s King Code of
32
Governance of 2009 which requires reporting on social, environmental and economic
indicators. In addition to national governments, stock exchanges have also begun
requiring companies to report on sustainability activities, such as the Shanghai Stock
Exchange in China or the Securities and Exchange Commission (SEC) in the US,
requiring information on regulatory compliance related to the environment
(Morris/Baddache 2012b). These fragmented laws serve to advance regional reporting
activity, but further cause lack of comparability among reporting companies.
This analysis of reporting standards shows that while national mandatory laws act as a
driver toward sustainability reporting, the fragmentation between countries stands to
be problematic for companies operating in multiple geographies and may act as a
barrier to cohesive reporting. In addition, the fragmentation of voluntary reporting
standards is certainly a barrier to reporting, leaving many companies confused about
how to comply with multiple standards at once. Reporting standards are therefore
both a potential driver and barrier to reporting to be considered within this study.
Almost all of the reporting standards highlight that stakeholders must be engaged in
order to issue an effective report. The following section addresses the questions of
why stakeholders are important to reporting, and how they are accounted for in
current reporting practices. The intention is to provide general context for comparison
with how maritime container carriers account for stakeholders in their reporting.
2.3.3. Stakeholder Expectations Stakeholder engagement has become a fundamental part not only of company
sustainability reporting practices, but also of core sustainability strategy. A
company’s legitimacy in their sustainability practice requires both an engagement
strategy and demonstrated efforts to involve their various stakeholder groups in the
company’s activities. Through prior work, the author has identified three levels of
stakeholder engagement that companies can employ – the lowest is to “Inform,” or
simply to broadcast information via traditional media, the next is to “Communicate,”
which entails tailored communications to particular stakeholder groups through such
formats as surveys, social media and conferences, and the highest is to “Engage,”

33
which can involve partnerships, joint ventures, or even research collaborations with
stakeholders (Morris/Baddache 2012a).
No legal standards or regulations exist concerning the involvement of stakeholders in
business practices. However, all of the identified voluntary reporting frameworks
identify stakeholders and stakeholder engagement as a key element in sound
sustainability reporting practice. AA1000 and GRI both refer to stakeholder
engagement as a necessary step in identifying reporting materiality, and all four
frameworks, AA1000, GRI ISO26000 and OECD Guidelines were themselves
developed through a stakeholder engagement process. GRI further states that a
company’s report should be based on the expectations and interests of stakeholders
with regard to scope, boundary, application of indicators and assurance approach
(GRI 2006).
Nevertheless, companies still struggle to engage with their stakeholders in meaningful
ways. Prior research conducted by the author revealed that companies often feel
increased external pressure but mistakenly putting stakeholder engagement into a
public relations or communications team. When it comes time to engage, these
companies speak only to known parties rather than the most relevant stakeholders,
and have difficulty linking feedback to internal business processes (Morris/Baddache
2012b). Regardless, companies in all sectors will soon be motivated to improve their
level of engagement as the new GRI G4 guidelines consider engagement as a
necessary step to defining materiality and reporting on relevant issues.
This section shows that while stakeholder engagement is identified as a necessary part
of reporting frameworks, companies themselves still struggle to engage properly. It
should be considered that those companies who do engage with stakeholders in their
sustainability reporting are employing a leading practice. The author retains this
element as a criterion for report evaluation.
Moving on from reporting frameworks and stakeholders, the next section will look
more closely at research on sector-specific reporting to understand what
methodologies have been employed to judge the extent or quality of industry
reporting. The author intends to inform his content analysis methodology from this
review.

34
2.4. Previous Research on Sector-Specific Reporting Sector-specific research on sustainability reporting is increasingly available but
studies range greatly in scope, methodology, and aim. In addition to the surveys
offered by KPMG and UNEP/SustainAbility, the author examined the following
studies to identify potential models for conducting a sector reporting review, and to
better understand if previous research exists on identifying industry-specific barriers
and drivers to reporting.
Adams and Kuasirikun examined the largest UK and German chemical and
pharmaceutical companies through a comparative and longitudinal study of company
reporting practices (Adams/Kuasirikun 2000). The study was performed over a period
of 10 years using content analysis to measure reporting maturity, and results showed
that German companies in these industries had reached maturity earlier. This study
ultimately measured the performance of countries rather than an industry, but the
method of longitudinal analysis was retained for this thesis.
Guthrie et al. studied social and environmental reporting of the Australian Food and
Beverage Industry by building a framework to examine disclosure across many
reporting media, such as annual reports and websites (Guthrie, et al. 2008). The study
addressed a research gap by developing an analysis framework that included industry-
specific variables. After performing content analysis across a sample of representative
company disclosure in 2004, the study found that disclosures were mostly declarative,
that companies were most often reporting on industry-specific issues, and that
websites had a higher frequency of disclosure. This study reinforced that
sustainability reporting often occurs across several media, revealing a limitation in the
author’s intended scope of looking exclusively at sustainability reports.
Jenkins and Yakovleva explored the development of the media of social and
environmental disclosure in the mining industry and of the factors that drove the
development of disclosure (Jenkins/Yakovleva 2004). The chosen method was to
perform a temporal analysis of recent trends using a case study of the 10 largest
mining companies in order to identify variation in reporting maturity, offering a
simple classification of leaders to laggards. The study chose content analysis as the
35
data collection method and found that sector reporting is becoming more sophisticated
across a range of variables, such as accordance with GRI, increasing levels of external
verification, and a trend toward more producing more CSR reports.
Perez and Sanchez equally looked at the evolution of sustainability reporting in the
mining industry (Perez/Sanchez 2009). This study analyzed 31 reports published by
four major mining companies between 2001 and 2006 across 62 indicators using
content analysis and a basic rating scale of 0 or 1 to identify the presence of absence
of information. The results showed an evolution in reporting comprehensiveness and
depth, and basic accordance with Jenkins and Yakovleva. The author retained the
method of a rating scale for this thesis.
Transportation-focused studies were also identified and reviewed for methodological
approach as well as thematic similarities with the maritime transportation industry.
Mak et. al performed a comparative study of environmental reports issued by
European and Asian airlines to identify the status and progress of environmental
reporting within the industry (Mak. et al 2007). The study analyzed only
environmental reports available online across 10 European airlines and 23 Asian
airlines during the reporting year 2001, adopting a framework designed by Adams in
1998 measuring 15 elements related to environmental improvement and
environmental systems. The findings, based on thematic content of the reports, varied
greatly depending on the element measured, and showed that reports produced by
European airlines were richer in content than those from Asian airlines, a finding for
comparison within this thesis.
Van Wijk and Persoon looked at the transportation-related sector of tourism by
examining the sustainability reporting among international tour operators, or firms in
which at least half of its revenues come from selling holiday packages (Van
Wijk/Persoon 2006). The study performed content analysis of 42 operators’ annual
reports, sustainability reports and websites using a framework that analyzed firm size,
industry sector characteristics, nationality, and business model. Results show that firm
size played an important role in the robustness of reporting, that brick and mortar
operators performed better than their online counterparts, and that nationality did not
play a role in reporting quality. Ultimately this industry was found to be a laggard in
reporting compared to others.

36
A number of common themes were found among the examined research. First,
content analysis is repeatedly the accepted method of examining sustainability
reporting. While studies range on the frameworks and criteria used for their research,
each has developed a coding or scoring system to facilitate the final analysis and
discussion. Certain studies focus exclusively on one reporting medium, such as
environmental reports, and others attempt comprehensive analysis across multiple
media. The theme of maturity often recurs within the literature, confirming the
author’s choice to focus on the maturity of the maritime transportation sector. And
finally, though generally applicable barriers and drivers such as size, geography, and
sector were addressed in studies, the specific barriers and drivers to the maritime
container transportation industry remain unknown, providing further evidence that
this thesis will add to existing literature.
The following section will complement these findings from general sector-specific
studies on reporting by looking specifically at the maritime transportation sector.
2.5. Previous Research on Maritime Transportation Sector
While studies on sustainability reporting of the maritime transportation sector remain
very few, a number of studies have been performed on the sustainability of the
industry. In addition, industry papers reveal necessary context of the CSR issues
specific to the maritime transportation industry.
Coady and Strandberg prepared a comprehensive look at the state of corporate social
responsibility in the maritime shipping industry in preparation for the Rio+20
conference in 2012 (Coady/Strandberg 2012). The paper provides a general survey of
existing information on CSR issues specific to the shipping industry and ship owners,
as well as a short literature review of papers and reports issued by industry initiatives
in order to present a draft CSR framework for the shipping sector. Four key findings
are presented in this research: CSR activities in other global sectors are increasing,
CSR activities in the shipping industry are also increasing and evolving due to new
performance requirements from regulatory agencies, customers, investors, NGOS,
and leading companies, SMEs could be at risk if they do not participate in the
37
development of sector CSR standards, and industry associations have a key role to
play in addressing barriers to CSR engagement. Perhaps most important and relevant
to the development of the author’s thesis, Coady and Strandberg indentified key
industry barriers to addressing CSR within maritime shipping. These key barriers
include: a general lack of knowledge of what CSR is, the systemic issue of a highly
regulated industry that has to function across diverse public policy regimes, the
disparate and fragmented nature of the sector, and the complexity and cost of CSR
activities which can be prohibitive for SMES – the majority of carriers in the shipping
industry. The paper concludes that one possible solution to overcoming these barriers
is through participation in industry associations (Coady/Strandberg 2012). The author
considered these barriers when developing hypotheses to test with industry
stakeholders.
Alternatively, McGuire and Perivier argue in “The Nonexistence of Sustainability in
International Maritime Shipping” that the shipping industry practice of using open
registries5 undermines the industry’s ability to internalize the true sustainability costs
associated with shipping (McGuire/Perivier 2011). This study is designed to serve as
a scoping piece to identify the unsustainable practices of the maritime industry,
standing in clear contrast to the hopeful nature of Coady and Strandberg’s findings.
The primary conclusions are that all efforts toward industry sustainability are crippled
by the open registry system, and that the un-sustainability of the industry will increase
as globalization amplifies maritime shipping demand. A possible solution presented is
an increased academic focus on the industry’s open registry practice to gain insight on
how to get cultural industry acceptance to internalize these currently externalized
costs. The author also included that the practice of open registries is a key barrier to
sustainability reporting.
Additional studies looked closer at particular segments of the maritime shipping
industry, in order to further define CSR issues and providing recommendations to
improve CSR practices. Fafaliou et al. attempted to clarify the meaning of CSR in the
European maritime sector, in particular for Greek-owned short sea shipping (i.e. on
inland waterways), across a number of variables by interviewing company employees.
5 The practice of open registries refers to owners registering their vessels in countries that do not require a legal or economic link between the ownership of the vessel and the jurisdiction in which the vessel is registered. This concept is explained further in following sections of the paper (see: Flags of Convenience).

38
Results showed that all interviewed respondents were aware of the notion of CSR,
either informed through the press of through personal acquaintances. The researchers
also unearthed certain barriers to engaging in CSR, such as lack of public support,
lack of information, or no self-consciousness of CSR impact on business activity. The
findings also showed that ownership plays a key role as only subsidiaries of
international conglomerates or companies owned by those personally aware of
benefits from CSR engage in the application of CSR activities. Pinock and Ajagunna
focused specifically on Caribbean ports and their challenges to reach a measure of
sustainability (Pinnock/Ajagunna 2012). The study presents certain barriers to
sustainability for these ports, such as unfavorable economies of scale and a lack of
competition. Further, the research concludes by presenting nine policy
recommendations to advance sustainability in the region.
Only two papers were found during the literature review that addressed sustainability
reporting of the maritime transportation sector directly. A paper by Rajiv Deengar
entitled “A Role for Sustainability Reporting in the Maritime Shipping Industry” was
unavailable to the author, however Deengar was interviewed as a key stakeholder as
part of the semi-structured interview study. Fet released a paper in 2003 entitled
“Sustainability Reporting in the Shipping Industry” to provide a sector-specific look
at how the GRI guidelines would affect industry reporting practices (Fet 2003). The
paper identifies a key framework for reporting indicators based on the life cycle
assessment (LCA) of an ocean vessel, noting the importance of a value chain
approach. Ultimately the research presents an overview of reporting systems and
environmental management tools, but given its early year of publication does not
attempt to measure or analyze existing sustainability reports.
Research performed on the sustainability practices of transportation companies, and
specifically on the maritime transportation industry, has revealed a number of initial
barriers that may explain this poor performance. Few studies have been performed
specifically on maritime transport, and of those studies only two were identified that
focused on reporting, and neither analyzed current reporting maturity. The review of
maritime shipping sector research revealed a short list of potential barriers for the
industry to engage broadly in sustainability efforts, which the author will retain for
later consideration in answering this study’s second research question:

39
• a general lack of knowledge of CSR, lack of information, no self-
consciousness of CSR impact on business activity
• systemic issue of a highly regulated industry that has to function across
diverse public policy regimes (regulatory landscape)
• disparate and fragmented nature of the sector
• complexity and cost of CSR activities which can be prohibitive for SMES,
unfavorable economies of scale
• efforts toward industry sustainability are crippled by the open registry system
(flags of convenience)
• lack of public support
• ownership, conglomerate control
• lack of competition
This concludes the theoretical review of existing literature on the current state of
sustainability reporting, developing context on the current state of reporting, learning
how the landscape of reporting guidelines acts to drive reporting, noting the
importance of stakeholders, examining methodologies to study sector-specific
reporting, and validating the need for this study among prior studies maritime
shipping sector reporting. The identified barriers and drivers will be retained for
further analysis in the following sections.
The next section of the thesis will begin the empirical study of maritime container
reporting through a longitudinal analysis of sustainability reports, and then discuss the
results in context of the findings from the literature review.

40
3. Current State of Sustainability Reporting This section presents a study of the industry’s reporting maturity through content
analysis of published sustainability reports. Maturity is here defined as a combined
measure of both external communications practices as well as internal sustainability
processes which enable communication (see 3.1: choice of indicators). The section
begins with a presentation of the criteria used for report inclusion, describes the
methodology and choice of indicators used to measure the reports, presents the results
from the study, and offers a short discussion on the trends identified in the results.
Relative to the research questions, the intention of this section is to illustrate the
current state of industry reporting as measured by its level maturity. This is a
necessary starting point before analyzing the barriers and drivers to reporting.
In order to produce a representative sample of sustainability reports within the
industry, content analysis was performed on reports issued by the top 20 container
carriers by volume over the past 10 year period, beginning with the first report issued
in 2002 and ending with reports issued in 2013 on activities in calendar year 2012.
Among the top 20 carriers, only the 12 companies who issued sustainability reports
were included for analysis. Sustainability reports were selected for inclusion only if
they were released as separate publications, and if they were available for download
on carrier websites as of April 1st, 2013.
Excluded from this study was information found in annual reports, in communications
such as press releases or news articles, or on carrier websites. These selection criteria
resulted in a sample of 51 sustainability reports issued over the ten-year period,
deemed to be a representative sample of the industry. The types of reports analyzed
include: sustainability, CSR, social responsibility, environmental, and environmental
and social.
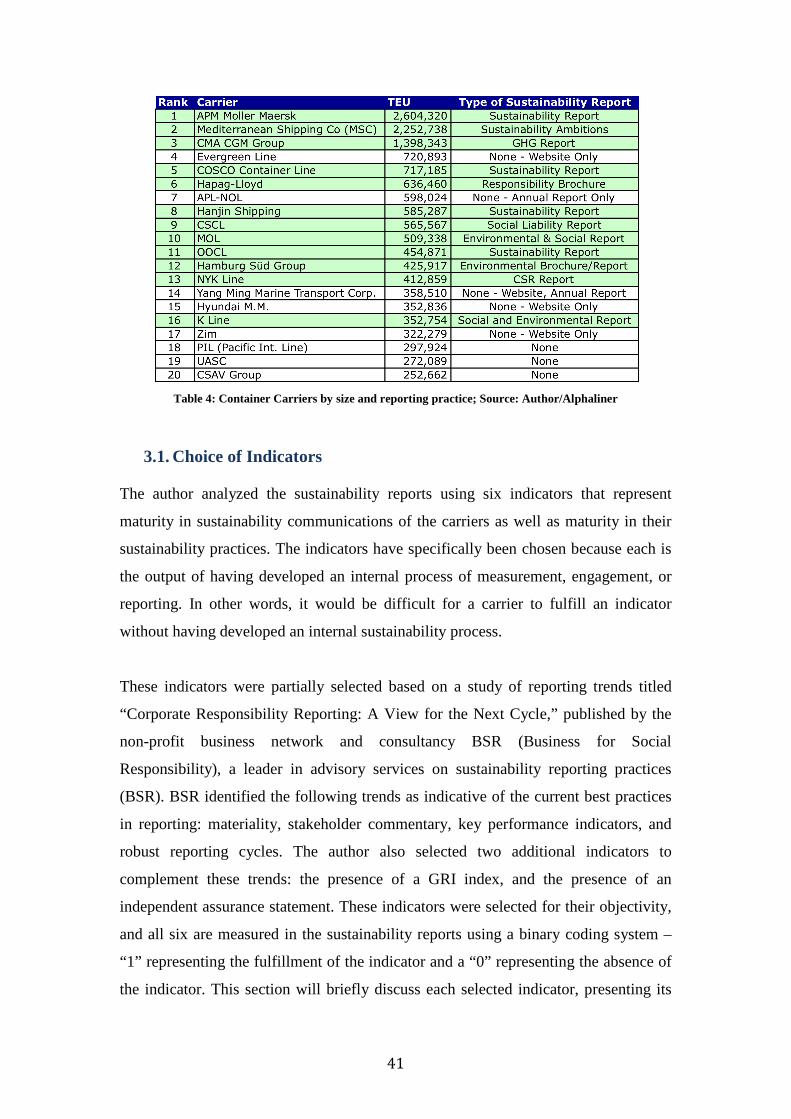
41
Table 4: Container Carriers by size and reporting practice; Source: Author/Alphaliner
3.1. Choice of Indicators The author analyzed the sustainability reports using six indicators that represent
maturity in sustainability communications of the carriers as well as maturity in their
sustainability practices. The indicators have specifically been chosen because each is
the output of having developed an internal process of measurement, engagement, or
reporting. In other words, it would be difficult for a carrier to fulfill an indicator
without having developed an internal sustainability process.
These indicators were partially selected based on a study of reporting trends titled
“Corporate Responsibility Reporting: A View for the Next Cycle,” published by the
non-profit business network and consultancy BSR (Business for Social
Responsibility), a leader in advisory services on sustainability reporting practices
(BSR). BSR identified the following trends as indicative of the current best practices
in reporting: materiality, stakeholder commentary, key performance indicators, and
robust reporting cycles. The author also selected two additional indicators to
complement these trends: the presence of a GRI index, and the presence of an
independent assurance statement. These indicators were selected for their objectivity,
and all six are measured in the sustainability reports using a binary coding system –
“1” representing the fulfillment of the indicator and a “0” representing the absence of
the indicator. This section will briefly discuss each selected indicator, presenting its

42
definition, its importance in representing reporting maturity, and the method used to
determine its fulfillment.
3.1.1. GRI Index As part of adherence with the GRI reporting guidelines, companies are requested to
include a table within their reports matching GRI indicators to the pages on which the
information is reported – referred to in this study as the GRI Index. This is an
important indicator of report maturity, as it shows a company’s dedication to go
beyond using the GRI as simple guidelines for reporting but rather a means by which
to catalogue its efforts and self-measure the completeness of its reporting versus the
GRI. It also gives readers a clear view of the company’s self-declared compliance to
this best practice framework in voluntary reporting, helping to understand the level of
ambition in reporting.
In order to measure indicator fulfillment, the author performed a keyword search for
the terms “GRI” or “global reporting initiative” and looked either in the table of
contents or in the last few pages of the report for the presence of the index. In certain
cases, the report redirected the author to an index published on the carrier company’s
website, which was counted as indicator fulfillment.
3.1.2. Materiality Process As defined in the BSR report, materiality is a process of focusing on areas that deliver
greatest business value to a company and its stakeholders rather than trying to address
every sustainability risk and opportunity (BSR). The author considers materiality as a
process for defining and prioritizing the most relevant sustainability issues on which
to focus strategy and reporting resources, identified in large part through stakeholder
engagement. Materiality as a concept has roots in US financial reporting, defined by
U.S. Supreme Court as “presenting a substantial likelihood that the disclosure of the
omitted fact would have been viewed by the ‘reasonable investor’ as having
significantly altered the ‘total mix’ of information made available” (SASB). The
inclusion of a materiality process is an important indicator of reporting maturity
because it reflects a level of sophistication in a company’s approach to sustainability

43
strategy as well as an interest in reporting only the most relevant topics for
stakeholders. For the reader, this also translates into reports that are generally more
concise or focused to topics of interest.
In order to measure indicator fulfillment, the author performed a keyword search for
the term “materiality” and looked closely at the carrier’s explanation of its CSR or
sustainability strategy for any discussion defining a scope of reported indicators.
3.1.3. Stakeholder Commentary An additional indicator highlighted in the BSR trends report, stakeholder commentary
is defined as the inclusion within a report of independent third-party opinions on the
reporting practices or sustainability performance of a company. Stakeholder
commentary can appear in the form of stakeholder dialogue, chapter comments, or
longer statements on the full report, and may be provided by individual internal or
external stakeholders or by stakeholder panels. In the author’s opinion, stakeholder
commentary is a means by which to solicit broad, unedited opinions, and by that
definition does not include stakeholder surveys, which are pre-determined
questionnaires designed by companies on a limited scope of information. Stakeholder
surveys were therefore not counted as indicator fulfillment.
The inclusion of stakeholder commentary is an important indicator of reporting
maturity, as it reveals a deep practice in stakeholder engagement – commentary is an
outcome of such engagement. In addition, the presence of commentary shows the
willingness of a company to be open to objective critiques of both its sustainability
reporting and sustainability performance, to which it will be held accountable. This
commentary also provides a balanced peer opinion against which a reader can
compare his or her own opinion. In order to measure indicator fulfillment, the author
performed a keyword search for the terms “stakeholder,” “stakeholder commentary,”
and “stakeholder dialogue,” and further looked for evidence of stakeholder
commentary throughout the report, generally sectioned off graphically in text boxes.
3.1.4. Key Performance Indicators

44
An additional indicator of reporting maturity is a company’s definition and use of Key
Performance Indicators, or KPIs. BSR’s trends report defines KPIs as a selection of
seven to 15 indicators that provide an at-a-glance view of a company’s CSR
performance across social, economic and environmental issues. This study considers a
broader definition – providing a short list of quantitative or qualitative indicators
linked to a company’s strategy, as opposed to a laundry list of activities. The use of
KPIs is an important indicator of reporting maturity as it demonstrates a company’s
desire to define reasonable measures of its sustainability performance, and their use
may indicate the initial steps toward a full materiality process in concert with its
stakeholders. Further, KPIs provide readers a set of indicators by which they can track
company progress toward its sustainability objectives.
In order to measure indicator fulfillment, the author performed a keyword search for
the terms “KPIs” or “key performance indicators,” and more closely looked through
sections on sustainability strategy to search for any mention of grouping or
prioritizing of indicators. Of all measured indicators in this study, KPIs are perhaps
the most subjective since each company may have a different definition and way of
presenting of what is key to their performance. However, the author considers this
indicator as a valid measure of maturity, since a correlation was found between the
identification of KPIs and company adherence to GRI, which itself recommends such
a process of indicator prioritization in its guidance.
3.1.5. Assurance Statement Assurance statements are evaluations by independent, third-parties who use a set of
standards to assess a company’s systems, processes and competencies that underline
its sustainability performance, including the self-declared information presented in
sustainability reports. These statements were borne out of pressure from stakeholder
groups such as investors and governments to produce similar verifications to those
found in financial reporting. Today, sustainability report assurance is a growing
practice that claims to have moved beyond simple verification, instead helping
companies demonstrate the credibility of commitments and accuracy of claims along
with providing suggestions for continuous improvement in reporting and strategy. The
inclusion of an assurance statement is an important indicator of reporting maturity as

45
it demonstrates to readers a company’s willingness to commission and transparently
present a professional account of their claims, to which the company will be held
accountable.
In order to measure indicator fulfillment, the author looked for the presence of an
assurance statement from one of the following types of assurance providers:
professional audit firms such as PriceWaterhouseCoopers or KPMG, quality
assurance firms such as BureauVeritas or Lloyd’s Register, or CSR assurance
consultancies such as Verite or Solstice. The presence of statements from civil society
firms, opinion-leaders, and advisory panels were considered as stakeholder
commentary rather than assurance statements.
3.1.6. Regular Reporting Cycle The final indicator selected from the BSR trends report is a robust reporting cycle,
which the author re-framed for this study as regular reporting cycle considering the
short period of time studied. Regular reporting cycle is defined as an annual or every-
two-year reporting cycle, where the first year of reporting does not qualify. The
existence of a regular reporting cycle is an important indicator of reporting maturity
as it shows a dedication to measuring and reporting sustainability progress over time.
A regular reporting cycle creates a level of accountability for the presented
information, requiring discipline within a company to follow through with
commitments made as part of their sustainability strategy. In addition, a regular cycle
gives readers the ability to compare a company’s progress year-over-year as a
“capture of time”, unlike the constantly updated communications on websites or
through social media.
In order to measure indicator fulfillment, the author researched and collected all
carrier sustainability reports within the 2002 – 2012 period and noted the years in
which reports were published. All reports that were regularly followed by a second
report on an annual or bi-annual schedule were counted, with the exception of the first
year reporting.

46
3.1.7. Excluded Indicators Additional indicators considered for this study include both adherence to the UN
Global Compact (UNGC) and the use of integrated reporting as defined by the
International Integrated Reporting Council (IIRC). On the former, brief analysis of
current reports revealed that only a subset of carriers already employing GRI were
inclined to track towards the UNGC, making this indicator somewhat redundant. In
addition, the UN Global Compact is more clearly linked to sustainability strategy
rather than reporting practices. On the latter, no container carriers currently issue
integrated reports as defined by the IIRC, deeming this indicator inconsequential. This
will however become a valid indicator to include in future studies, as the IIRC has
just released their draft guidance on integrated reporting in April 2013.
3.2. Results: A Look at Reporting Maturity The results of the content analysis are presented in the following table:
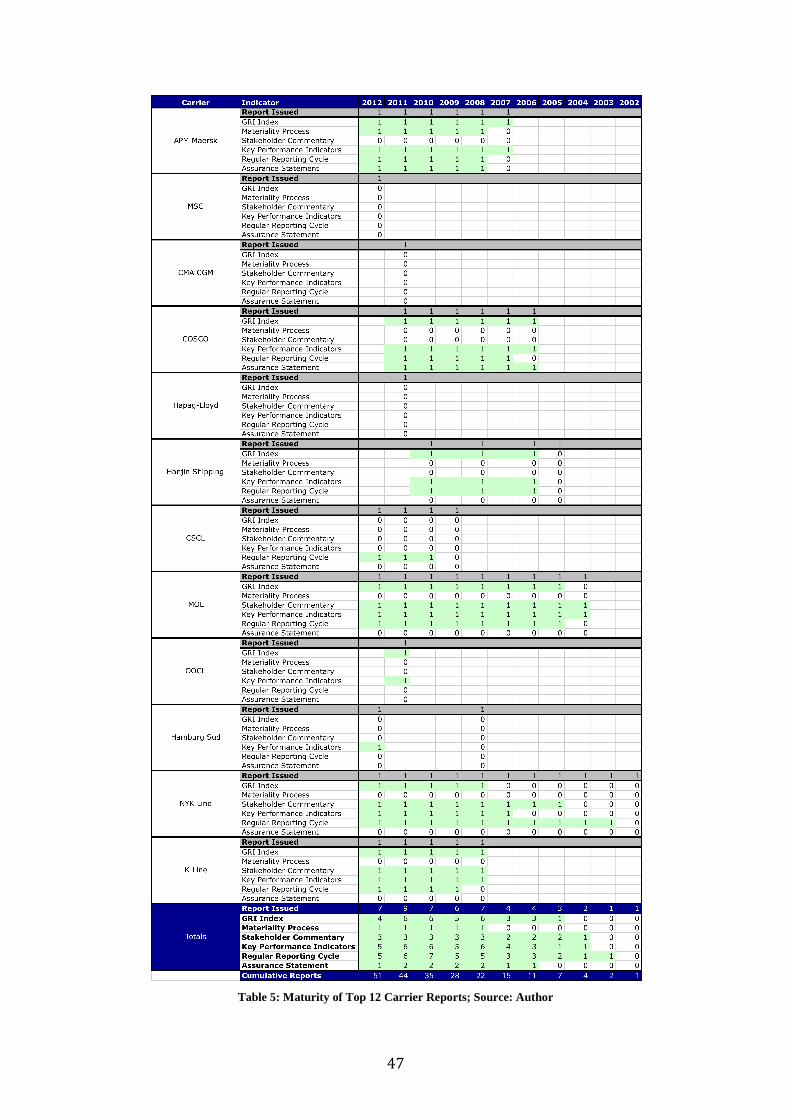
47
Table 5: Maturity of Top 12 Carrier Reports; Source: Author
48
3.3. Discussion of Results Looking first at the evolution of the reporting landscape, there is clearly an increasing
trend of the quantity of published reports over the past ten years, rising from one
report published annually in 2002-2003 to between seven to nine reports published
annually in 2011-2012. A second noticeable trend is that reporting experienced a
geographical progression, beginning in Japan with NYK Line in 2002 and MOL in
2004, moving to Korea with Hanjin Shipping in 2005, and then to China with
COSCO in 2006 (and CSCL in 2009), and eventually moving into Europe to
Denmark with Maersk in 2007, and finally Germany, France and Switzerland between
2008 and 2012. This regional movement shows interesting first mover effects with
one regional leader and multiple regional followers reporting in succession. Finally,
by measuring the growth of representative market share, it also could also be argued
that sustainability reporting became a mature industry practice in 2007/2008 with the
entrance of Maersk Line, resulting in almost 30% of market share represented by
industry carriers issuing reports. The share represented by all reporting carriers today
totals to just over 60%.
Looking next at the indicators of reporting maturity, all measured indicators saw
growth over the studied time period and today the reporting carriers show good
practice in three of the six indicators. On the positive side, half of all carriers have
signed onto using GRI as a reporting standard, have begun a process to identify and
report on key performance indicators, and are reporting on regular cycles. On the
negative side, only one quarter of reporting carriers include stakeholder commentary
in their reports, and between one to two carriers perform a materiality analysis and/or
contract independent assurance statements. These poorly performing indicators
illustrate great opportunities for improvement in reporting practices.
One of the more significant indicators, GRI indices first appeared in 2005 and the
indicator reached its peak and plateau in 2008 with six of twelve carriers reporting.
This is a significant finding since two years prior in 2006 GRI had launched its G3
Guidelines, a comprehensive upgrade to the more general guidance that had been
provided since the organization’s inception in 1997. While correlation cannot prove
causation, the number of GRI indices remained high after this date leading the author
49
to believe there is indeed a connection between the new guidelines and the increased
reporting. Additionally, those companies who include GRI indices also score well on
the presence of Key Performance Indicators, showing a potential connection between
the process of GRI compliance and the definition of key sustainability activities. Also
a leading indicator, all carriers who issued more than single-year reports established
regular reporting cycles – with the exception of Hamburg Sud. This shows that these
carriers consider sustainability measurement and reporting a long-term investment
into sustainability performance.
Among the marginal indicators, stakeholder commentary appeared only in reports
issued by the three Japanese carriers, NYK Line, MOL and K-Line. Two of these
carriers, K-Line and MOL, included commentary starting in their first issued reports,
and NYK Line began including commentary in 2005 when they changed from an
Environmental to a CSR report. This may reveal a cultural importance to including
stakeholder viewpoints within reports issued in Japan, or conversely a lack of
perceived importance within the rest of the industry to include stakeholder comments.
Also a marginal indicator, assurance statements were commissioned and appear only
in reports issued by COSCO and Maersk Line. This could be attributed to the
relatively large size of these two carriers and the additional resources they allocate to
their sustainability practices. In both cases of stakeholder commentary and assurance,
the carriers fulfilling these indicators should be used as examples of best practice for
others.
Finally, as the lagging indicator, materiality process was only defined by the industry
leader Maersk Line. This is a puzzling result since materiality is often facilitated by
adherence to the GRI as well as the identification of Key Performance Indicators,
indicators on which half of the studied carriers scored well. Defining a materiality
process and using it to focus the topics presented in sustainability reports is a priority
next step towards improving the maturity of these carriers’ published reports.
3.3.1. Stakeholder Input from Interviews Stakeholders were asked during interviews to provide their thoughts on the current
state of industry sustainability reporting. Most experts interviewed believe that the
50
maritime container transportation industry is lagging behind others when it comes to
sustainability reporting (Farrag, Borman, Sterling, Helfre, White, Deengar), echoing
the results of the 2011 KPMG survey of industries. An ESG analyst went as far as to
say that maritime shipping is in the bottom 20% of all industries (Helfre).
Certain interviewees explain that this is attributed to the fact that maritime shipping is
a service sector, which like other service sectors have been lagging in reporting, or
that maritime shipping is not a largely publicly traded industry and the privately-
owned carriers are not subject to the rigorous filing requirements of the United States
or the United Kingdom which would have pushed them to report earlier (White). Yet
there is a sense that the sector is improving, perhaps more rapidly than related sectors
like port operations (Helfre) and air cargo (Vance), which are lagging even further
behind.
3.3.1.1. Potential Improvements to Reporting
Interviewed experts were also asked to identify current best practices in industry
sustainability reports, as well as speculate on where improvements should be made to
reporting. The following is a brief discussion of their responses.
Both sustainability analysts and container carriers themselves agree that carriers are
using good practices in reporting on environmental emissions and health & safety
(Karlsson, Oh), explaining that these are industry issues they had addressed long
before they were associated with sustainability (Oh). However, there is much room
for improvement. Carriers need to focus on the core issues relevant to their operations
and most do not yet have a materiality process in place (Oh). Carriers also need to
show stronger links between their sustainability efforts and the investment community,
for example demonstrating how fuel consumption affects their operational success in
terms of the bottom line (Karlsson).
Analysts believe that carriers need to be more transparent on certain issues, such as
lobbying and public policy engagement as well as supply chain activities (Helfre).
And finally, an interviewed carrier identified that carriers could stand to make greater
social contribution beyond philanthropic efforts (Oh). These recommendations, along
with the results of the report content analysis, provided a clear starting point for
51
carriers looking to improve both their sustainability reporting and their sustainability
practices.
3.4. Discussion Summary The six indicators measured during the content analysis reveal that the maritime
container industry attained its current level of sustainability reporting maturity around
2008. From this point on, half of the carriers studied scored on three to five of the six
indicators. Perhaps more revealing is the performance of the other half of reporting
carriers included in this study, which continued to score either zero or one out of the
six indicators. This leads the author to conclude that only six of the top 20 carriers are
currently issuing what could be considered mature sustainability reports.
This performance, supplemented by the general sentiments from stakeholders, leads
the author to conclude that the industry is in fact lagging in its reporting practices.
This answers the first research question set out in this report to define the current state
of sustainability reporting practices.
The limitations of the conclusions drawn here are related to the choice of indicators,
and the decision to study only the top 20 carriers by TEU volume. It is possible that
with a different selection of indicators, reporting carriers would have shown improved
scores. However, as these six indicators were deemed to broadly represent reporting
maturity, it is the author’s opinion that the presented trends are accurate and that only
a handful of container carriers are performing at a good level of reporting practice.
The following section continues the empirical study by focusing on the second
research question, attempting to understand the barriers that have caused this
reporting lag, as well as the drivers which prompted carriers to begin reporting.

52
4. Barriers and Drivers to Industry Reporting
This section aims in multiple parts to provide an overview of the studied industry,
present its key stakeholders, develop an understanding of any structural elements that
have acted as barriers or drivers to sustainability reporting, and to provide stakeholder
discussion on the discovered barriers and drivers.
Section 4.1 will study the composition and operations of the global shipping fleet and
explore container shipping as the driving factor of the industry’s historical growth.
Section 4.2 will describe the container shipping industry value chain and present
container shipping’s major actors and stakeholders, with the intent of discovering
possible systemic barriers or sources of pressure (drivers) to report on sustainability.
Section 4.3 will present the identified barriers and drivers, and provide stakeholder
discussion to confirm or deny their importance and influence on carrier reporting
practices.
4.1. Background and Overview of the Maritime Shipping Industry Freight transport largely defines the maritime shipping industry today, as the
popularization of international air travel has relegated passenger travel at sea to
shorter trips and pleasure cruises (Lehmköster 2010). The global merchant fleet is
broadly made up of three major types of vessels: bulk carriers, which are designed to
transport unpackaged commodities; tankers, which are designed to transport liquid
cargo, most frequently oil; and container ships. These three categories account for
around 85 percent of the global fleet, which is comprised of more than 50,000 vessels
(Heiberg 2003). Freight traffic is measured in deadweight (dwt) tons, which describes
the amount of cargo that can be safely loaded onto an empty ship. The global fleet has
a capacity of around 1192 million dwt, with bulk carriers accounting for 418 million
dwt, tankers also accounting for 418 million dwt, and container ships accounting for
162 dwt (Lehmköster 2010).
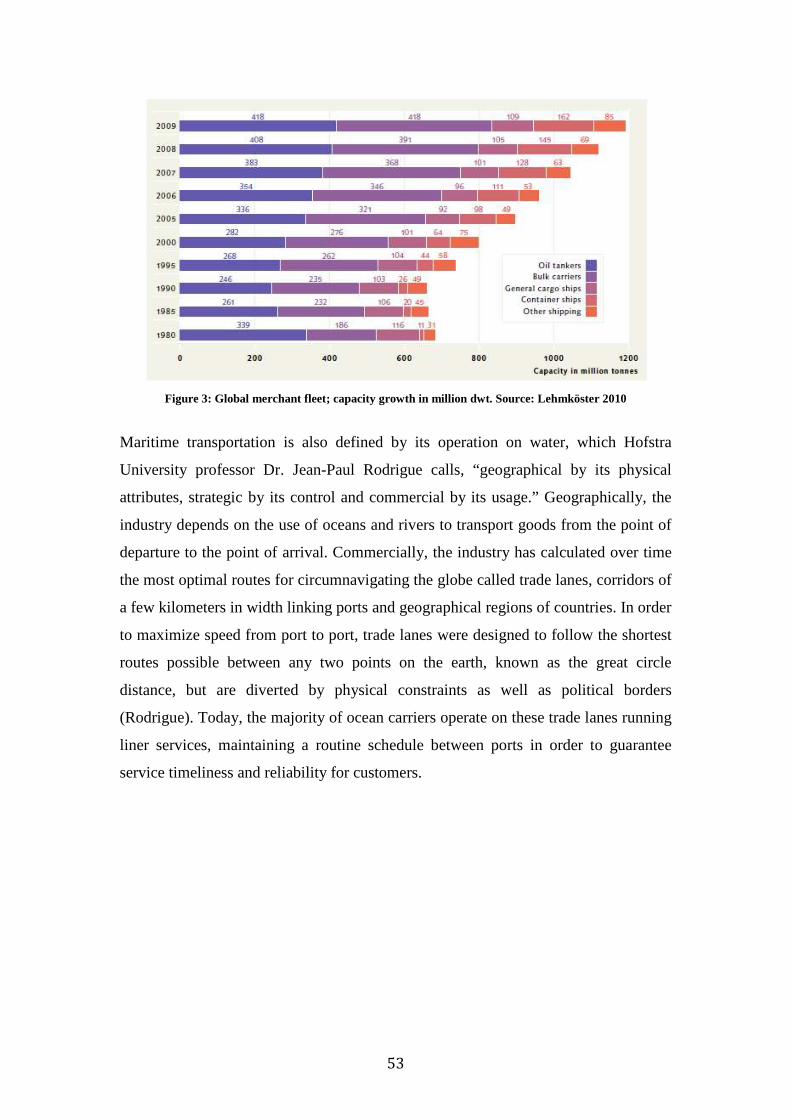
53
Figure 3: Global merchant fleet; capacity growth in million dwt. Source: Lehmköster 2010
Maritime transportation is also defined by its operation on water, which Hofstra
University professor Dr. Jean-Paul Rodrigue calls, “geographical by its physical
attributes, strategic by its control and commercial by its usage.” Geographically, the
industry depends on the use of oceans and rivers to transport goods from the point of
departure to the point of arrival. Commercially, the industry has calculated over time
the most optimal routes for circumnavigating the globe called trade lanes, corridors of
a few kilometers in width linking ports and geographical regions of countries. In order
to maximize speed from port to port, trade lanes were designed to follow the shortest
routes possible between any two points on the earth, known as the great circle
distance, but are diverted by physical constraints as well as political borders
(Rodrigue). Today, the majority of ocean carriers operate on these trade lanes running
liner services, maintaining a routine schedule between ports in order to guarantee
service timeliness and reliability for customers.
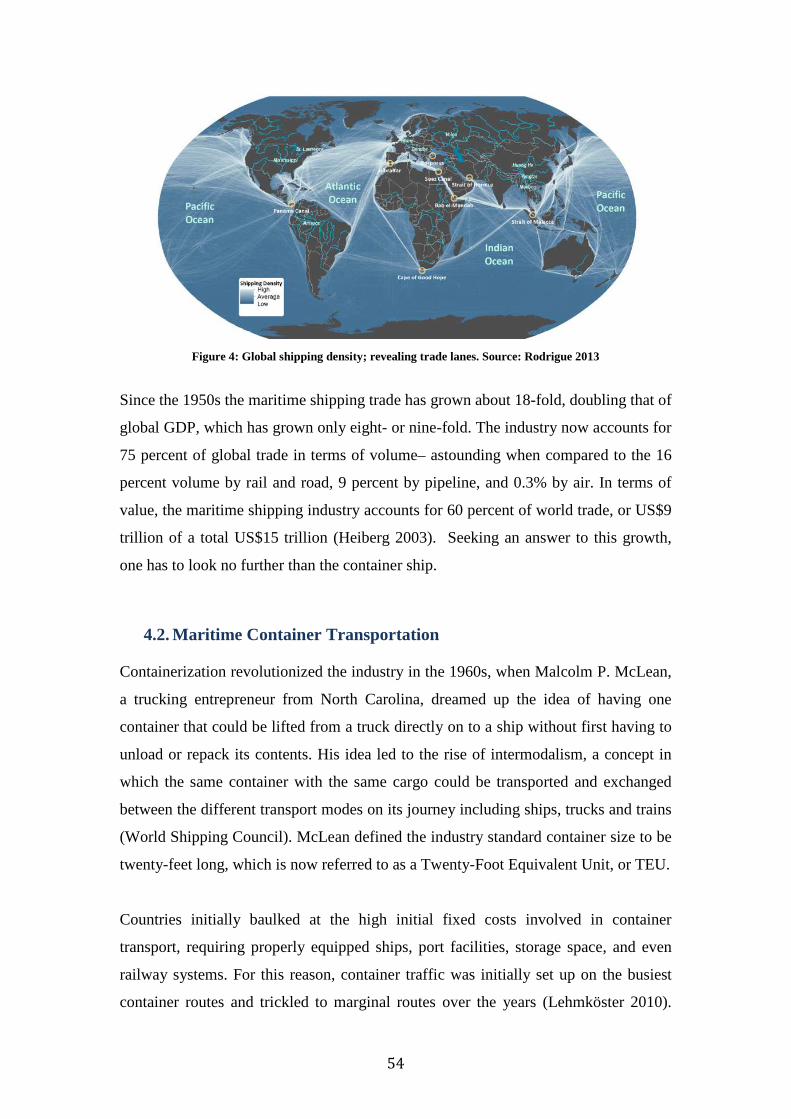
54
Figure 4: Global shipping density; revealing trade lanes. Source: Rodrigue 2013
Since the 1950s the maritime shipping trade has grown about 18-fold, doubling that of
global GDP, which has grown only eight- or nine-fold. The industry now accounts for
75 percent of global trade in terms of volume– astounding when compared to the 16
percent volume by rail and road, 9 percent by pipeline, and 0.3% by air. In terms of
value, the maritime shipping industry accounts for 60 percent of world trade, or US$9
trillion of a total US$15 trillion (Heiberg 2003). Seeking an answer to this growth,
one has to look no further than the container ship.
4.2. Maritime Container Transportation Containerization revolutionized the industry in the 1960s, when Malcolm P. McLean,
a trucking entrepreneur from North Carolina, dreamed up the idea of having one
container that could be lifted from a truck directly on to a ship without first having to
unload or repack its contents. His idea led to the rise of intermodalism, a concept in
which the same container with the same cargo could be transported and exchanged
between the different transport modes on its journey including ships, trucks and trains
(World Shipping Council). McLean defined the industry standard container size to be
twenty-feet long, which is now referred to as a Twenty-Foot Equivalent Unit, or TEU.
Countries initially baulked at the high initial fixed costs involved in container
transport, requiring properly equipped ships, port facilities, storage space, and even
railway systems. For this reason, container traffic was initially set up on the busiest
container routes and trickled to marginal routes over the years (Lehmköster 2010).
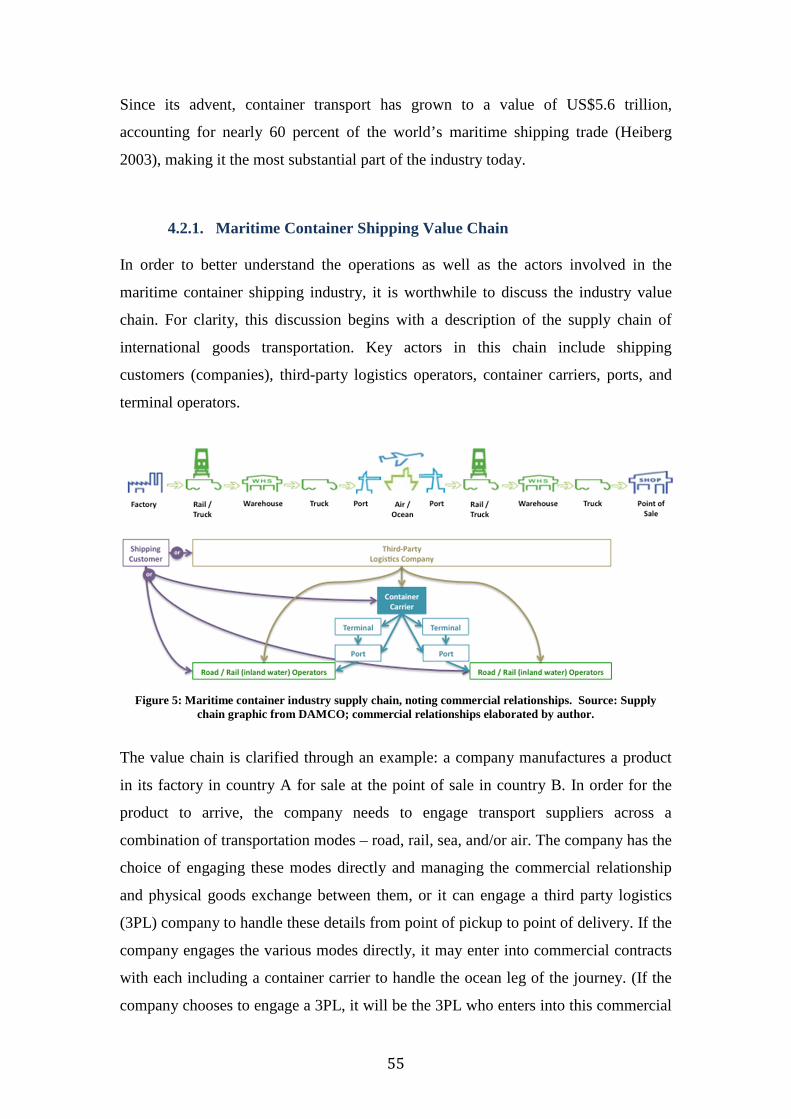
55
Since its advent, container transport has grown to a value of US$5.6 trillion,
accounting for nearly 60 percent of the world’s maritime shipping trade (Heiberg
2003), making it the most substantial part of the industry today.
4.2.1. Maritime Container Shipping Value Chain In order to better understand the operations as well as the actors involved in the
maritime container shipping industry, it is worthwhile to discuss the industry value
chain. For clarity, this discussion begins with a description of the supply chain of
international goods transportation. Key actors in this chain include shipping
customers (companies), third-party logistics operators, container carriers, ports, and
terminal operators.
Figure 5: Maritime container industry supply chain, noting commercial relationships. Source: Supply
chain graphic from DAMCO; commercial relationships elaborated by author.
The value chain is clarified through an example: a company manufactures a product
in its factory in country A for sale at the point of sale in country B. In order for the
product to arrive, the company needs to engage transport suppliers across a
combination of transportation modes – road, rail, sea, and/or air. The company has the
choice of engaging these modes directly and managing the commercial relationship
and physical goods exchange between them, or it can engage a third party logistics
(3PL) company to handle these details from point of pickup to point of delivery. If the
company engages the various modes directly, it may enter into commercial contracts
with each including a container carrier to handle the ocean leg of the journey. (If the
company chooses to engage a 3PL, it will be the 3PL who enters into this commercial

56
contract with the container carrying company.) The container carrier receives the
goods at a port of departure, transports the goods across the ocean, and unloads the
goods at the port of arrival in the destination country.
From the container carrier perspective the value chain has two commercial
relationships to consider; on one side with the shipping customer or 3PL as described
above, and on the other side the relationship with ports. In order to load and unload
goods from a local port, the carrier must pay port fees to the port authority as well as
establish a contract with local terminal operators. It is worth noting that many carrier
companies are also vertically integrated with terminal operations to facilitate this
transaction and avoid further terminal charges. The terminal operator itself enters into
a commercial relationship with the local port authority management to lease and
operate on the land (Federal Maritime Commission).
In reality, this is an over-simplification of container flows in the port supply chain,
which includes a number of handovers to other transport modes in the area
surrounding the port known as the hinterland, including smaller “feeder” ships that
transport goods further inland, along with traditional rail and road connections. A
recent study from the University of Antwerp, sponsored by the OECD and
International Transport Forum, states that the multitude of modal choices implies that
modeling port-related hinterland flows remains a very difficult exercise (Nottebottom
2008). For the sake of efficiency, this paper considers that port authorities handle the
commercial relationships with these modes, the cost of which may have an effect on
carrier port fees.
A unique element in the maritime container shipping industry value chain is its ship
ownership structure, which exists in part due to the extreme capital costs in building
and operating ships. There are three parties in ship ownership to consider: the owner,
the operator, and the charterer. When a person who fits out a ship is also the
proprietor of the ship he is called the ship owner. Usually a ship will not be owned by
a single person because of the large investment required but rather owned by a group
of persons, or an enterprise such as a bank, which form a company or partnership. The
day-to-day manager who is engaged in the transportation of goods and/or passengers
is generally referred to as the ship operator. And the "charterer" is the person or the
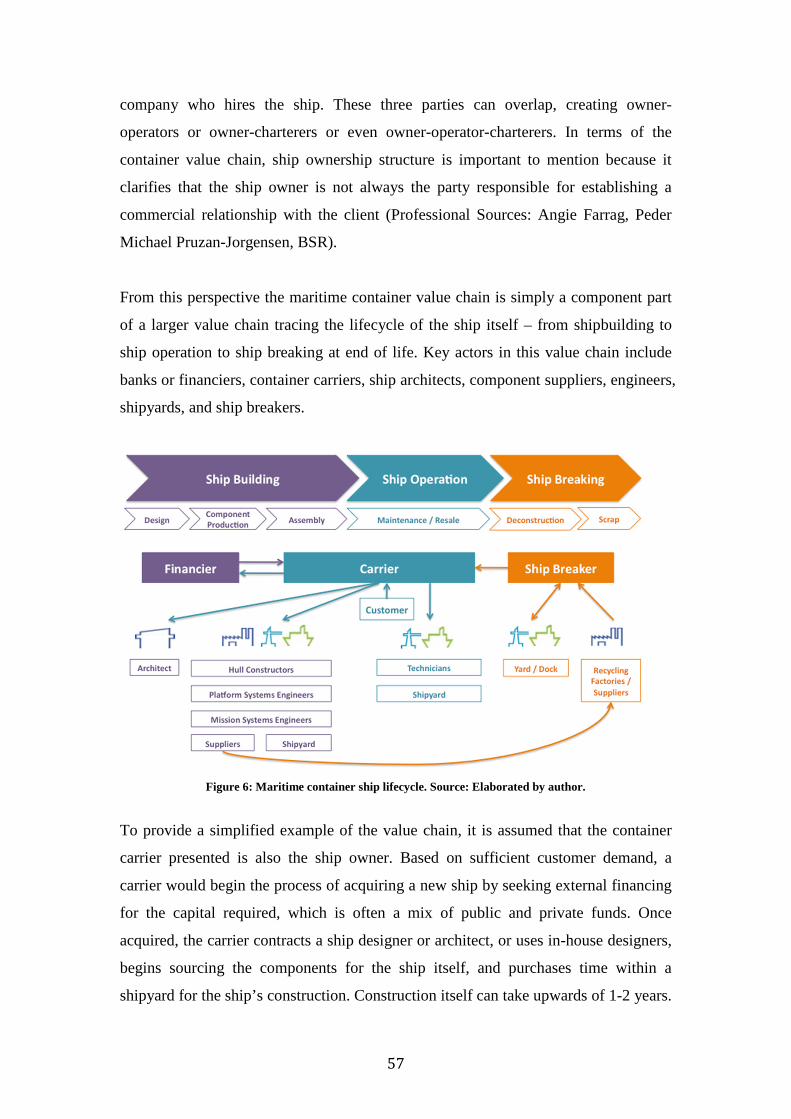
57
company who hires the ship. These three parties can overlap, creating owner-
operators or owner-charterers or even owner-operator-charterers. In terms of the
container value chain, ship ownership structure is important to mention because it
clarifies that the ship owner is not always the party responsible for establishing a
commercial relationship with the client (Professional Sources: Angie Farrag, Peder
Michael Pruzan-Jorgensen, BSR).
From this perspective the maritime container value chain is simply a component part
of a larger value chain tracing the lifecycle of the ship itself – from shipbuilding to
ship operation to ship breaking at end of life. Key actors in this value chain include
banks or financiers, container carriers, ship architects, component suppliers, engineers,
shipyards, and ship breakers.
Figure 6: Maritime container ship lifecycle. Source: Elaborated by author.
To provide a simplified example of the value chain, it is assumed that the container
carrier presented is also the ship owner. Based on sufficient customer demand, a
carrier would begin the process of acquiring a new ship by seeking external financing
for the capital required, which is often a mix of public and private funds. Once
acquired, the carrier contracts a ship designer or architect, or uses in-house designers,
begins sourcing the components for the ship itself, and purchases time within a
shipyard for the ship’s construction. Construction itself can take upwards of 1-2 years.
58
Before the ship is built, the carrier may also source a number of additional containers
for use with the new vessel.
During the ship’s lifecycle, the carrier will regularly contract a shipyard to perform
upkeep and maintenance on the ship. The carrier may even resell the ship after a
certain number of years of service to recuperate part of their original investment.
Ships remain in operation for a maximum of 30-40 years. Ultimately, the carrier will
sell the ship to a ship breaker, who works within their own yards or docks to break the
ship and sell materials for scrap.
This section reveals that both carrier size and complex ship ownership are potential
barriers to be considered when looking at container carrier sustainability reporting
practices. This section also illustrated a few of the important actors in the maritime
container value chain, and the following sections will take a closer look at these
industry stakeholders importance and how they may count as barriers and drivers to
reporting.
4.2.2. Main Carriers in Maritime Container Shipping In order to determine the major maritime container carriers to use in this study, the
author consulted Alphaliner, which is known as the most credible platform for
information and statistics on the liner shipping industry and on containerships.
Alphaliner reports that as of March 2013 there are over 100 container carriers
operating 5,934 ships on liner trades, accounting for 16,935,020 TEU and
217,306,066 dwt. The graphic below shows the top 30 operators by TEU.
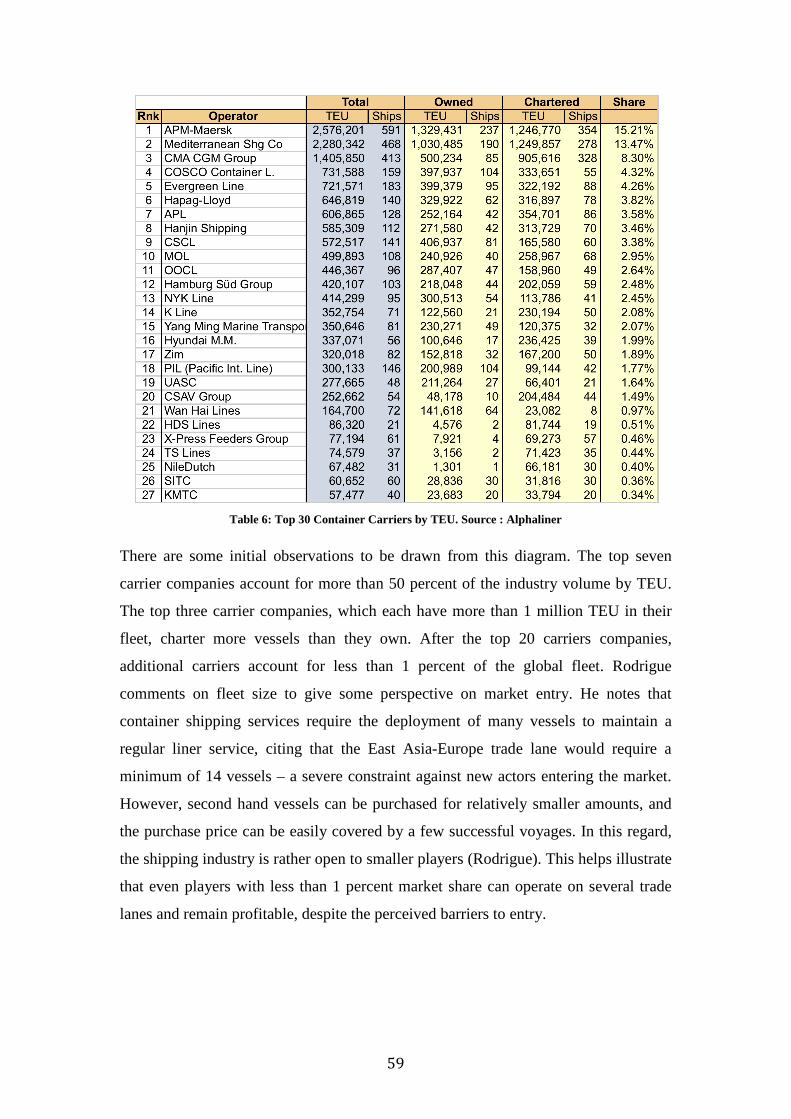
59
Table 6: Top 30 Container Carriers by TEU. Source : Alphaliner
There are some initial observations to be drawn from this diagram. The top seven
carrier companies account for more than 50 percent of the industry volume by TEU.
The top three carrier companies, which each have more than 1 million TEU in their
fleet, charter more vessels than they own. After the top 20 carriers companies,
additional carriers account for less than 1 percent of the global fleet. Rodrigue
comments on fleet size to give some perspective on market entry. He notes that
container shipping services require the deployment of many vessels to maintain a
regular liner service, citing that the East Asia-Europe trade lane would require a
minimum of 14 vessels – a severe constraint against new actors entering the market.
However, second hand vessels can be purchased for relatively smaller amounts, and
the purchase price can be easily covered by a few successful voyages. In this regard,
the shipping industry is rather open to smaller players (Rodrigue). This helps illustrate
that even players with less than 1 percent market share can operate on several trade
lanes and remain profitable, despite the perceived barriers to entry.

60
4.2.3. Maritime Container Shipping Key Industry Stakeholders Stakeholders are key to understanding the pressures placed on container carriers to
report on their sustainability performance. This section briefly describes each
stakeholder group’s relation to container carriers and how their activities may
influence carrier reporting practices. The intention is to identify possible sources of
pressure that can be included as drivers to sustainability reporting.
It should be noted that additional industry stakeholders exist with a lesser influence on
sustainability reporting including the media, port and terminal operators, intermodal
operators (road, rail, and air), financiers/ship owners, employees, and end consumers.
Customers
Shipping customers are defined as those who purchase transportation services from
maritime container carriers. This stakeholder group puts direct pressure on carriers to
report on both their social and environmental performance. Some examples of large
maritime shipping customers are Nike and Heineken. Third-Party Logistics (3PL)
Companies can also be considered a shipping customer in the eyes of the carrier. 3PLs
act as middleman, selling transportation services to brands and aggregating shipping
demand in order to purchase transportation services at lower rates from container
carriers. 3PLs influence carrier reporting in the same manner as customers, passing on
customer requests for social and environmental information to carriers. Some
examples of 3PLs include DAMCO, DHL and DBSchenker.
Regulators
Regulation in the maritime shipping industry is a partnership between two entities, the
International Maritime Organization (IMO) and its constituent member countries. The
IMO was created by a UN convention in 1958 and acts as the self-regulator of the
maritime shipping industry, primarily focused on safety, security and prevention of
marine pollution. As a group, the IMO creates instruments as standards for marine
operation and works to follow these instruments through to implementation by its
member countries. An example of these instruments is the International Convention
for the Prevention of Pollution from Ships (MARPOL) in 1973, which regulates
accidental and operational oil pollution as well as chemicals, goods in packaged form,
sewage, garbage and air pollution (IMO). The IMO has a clear impact on industry
61
sustainability reporting, as their three core areas of regulation are safety, security and
pollution – key sustainability topics for carriers. Further, compliance with member
country laws based on IMO regulations requires carriers to report on these issues.
Classification Societies
Classification societies are non-governmental organizations that act as insurance
bodies, setting and verifying technical standards for the construction and operation of
ships to better identify the risks in operation. They are contracted by carriers to
validate that a ship is built according to these standards, and also carry out routine
audits of the ship in service to check compliance with the standards (Lloyd’s List).
The pressure exerted on a carrier is inherent to this process – societies oblige the
carriers to report on certain information to be compliant, and when a ship is found to
be non-compliant, the carrier must work towards compliance to become “classed” by
the society. Classification societies also lobby the IMO, which can have additional
consequences on the regulation of carriers. The largest names include ClassNK, ABS,
and Lloyd’s Register (Lloyd’s List).
Activist Groups
Activist organizations are generally reactive and serve the place pressure on carriers
with poor sustainability practices. These organizations produce reports and conduct
campaigns against offending carriers with the aim of raising public awareness,
increasing political attention, and eventually changing the practice and performance
of the company. The two largest activist groups in maritime shipping are WWF and
Greenpeace.
Industry Associations
The term industry associations can cover a broad range of non-governmental
organizations (NGOs), including trade organizations working on industry topics,
customer organizations focused on supply chain management, or trade unions
representing seafarers. Each of these organizations have different types of influence
on sustainability reporting: trade organizations generally enable container carriers to
develop standards and the means by which to measure and report on sustainability
issues, customer organizations pressure carriers to produce information relative to
their particular industry, and labor unions work to ensure that carriers demonstrate
62
their respect for seafarer rights. Examples of trade organizations include the
Sustainable Shipping Initiative (SSI), the Environmental Ship Index (ESI), the Clean
Shipping Initiative (CSI), and the Clean Cargo Working Group (CCWG). Examples
of customer organizations include the European Shippers Council (ESC) and the
Global Shippers Forum (GSF). An example of a large trade union is the Seafarers
International Union of North America (SIU).
Environmental, Social, and Governance (ESG) Analysts
The past 10 years have seen the rise of specialty agencies that act as advisors to
investors on the extra-financial performance of companies, categorized here as ESG
Analysts. Analysts submit requests to maritime carriers to complete and submit
comprehensive questionnaires that cover their environmental, social, and governance
performance, and rate and rank the responses by industry for interested investors.
Examples of ESG Analyst groups include MSCI, Vigeo, and Sustainalytics.
Sustainability Indices
A sustainability index is a market listing that highlights companies managed in a way
that respects the environment and society. Listing on a sustainability index often
rewards companies with increased respect and legitimacy, and grants access to
socially and environmentally conscious investors. Indices seek representation across
all major industries including maritime transportation, and similarly to ESG Analysts
send out requests for sustainability information through questionnaires, obliging
carriers to report on their sustainability practices. The largest of these indices includes
the Dow Jones Sustainability Index (DJSI) managed by RobecoSAM, the
FTSE4Good Index owned by the Financial Times and the London Stock Exchange,
and the Ethibel Sustainabilty Index (ESI) managed by Standard & Poors.
From this review of stakeholders, it is apparent that customers, ESG analysts and
sustainability indices have the most direct influence on a container carrier’s reporting
practices given the industry’s current financial crisis. All three of these groups send
direct questionnaire to carriers on their social and environmental practices, and all
three have shareholder groups directly monitoring carrier companies’ financial
sustainability. Pressure from each of these three groups is therefore considered
potential drivers for carrier sustainability reporting.
63
This brief industry overview provided key insight into the operations, value chain
relationships, and stakeholder pressures exerted on maritime container carriers. The
following section will put together the list of potential barriers and drivers to reporting
that have been identified thus far in the research in order to answer the second
research question–highlighting the key barriers and drivers specific to sustainability
reporting in the maritime container shipping industry.
4.3. Identifying Industry Barriers and Drivers This section intends to identify the key industry barriers and drivers to maritime
container carrier sustainability reporting. First, the author presents a full list of
potential barriers and drivers to reporting that have been identified throughout this
study, including in the literature review and in the study of the industry value chain
and stakeholders. Added to this list are additional potential barriers and drivers
identified in an archival Factiva search6 of industry social and environmental shocks
over the past 10 years. The author then develops a shortlist of potential barriers and
drivers, presents the case for each, and provides discussion from the industry
stakeholder interviews that either confirms or denies the relevance of the barrier or
driver. Conclusions are presented in the final section of the thesis.
6 The Factiva search was performed using certain keywords inspired by the author’s previous work in this sector, including maritime transport, maritime freight, container ship, environment, social, accidents, disasters, human rights, piracy, and risk. Full details of this search are available in
Appendix 4.
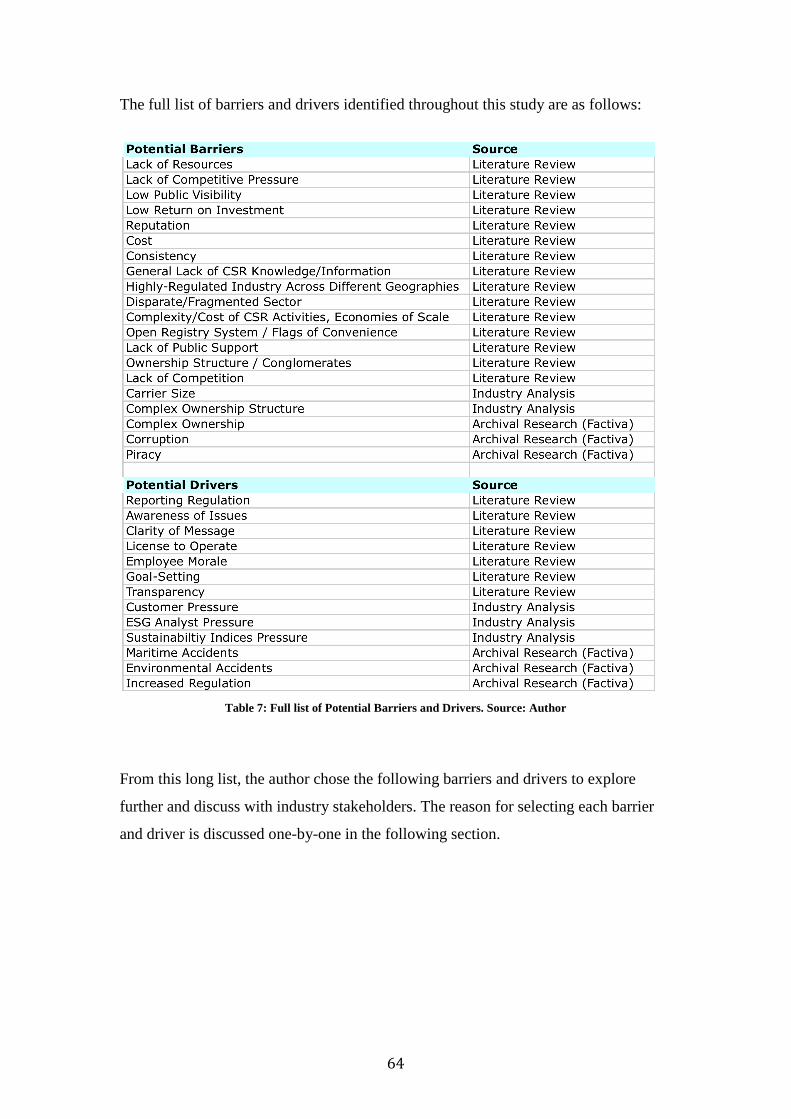
64
The full list of barriers and drivers identified throughout this study are as follows:
Table 7: Full list of Potential Barriers and Drivers. Source: Author
From this long list, the author chose the following barriers and drivers to explore
further and discuss with industry stakeholders. The reason for selecting each barrier
and driver is discussed one-by-one in the following section.

65
Table 8: Short List of Barriers and Drivers. Source: Author
4.4. Barriers to Reporting
4.4.1. Regulatory Structure The study of industry stakeholders revealed that regulation in ocean transportation is
different than that of land-based industries. Companies who own assets and operate
physically within a country are subject to the local laws and regulations of that
country, and the host country has the ability to enforce regulations if a company is
found in violation of a law. Ocean transportation is not physically located in one
specific country. The industry’s assets (ships) operate in international waters and only
temporarily rest within national jurisdictions to load and unload their cargoes, at
which time the ship is subject to national laws. However, even then there are
questions of who is directly implied by these laws, due to the complexity of ship
ownership (see: Complex Ship Ownership).
Further, there exists no international governmental jurisdiction that can create and
enforce regulation on ocean transportation in international waters. The International
Maritime Organization was created in the 1940s as a self-regulatory body under the
auspices of the United Nations in reaction to a growing need for standards and legal
instruments to govern the industry (IMO). The IMO has 170 member states that
participate and agree to locally adopt the IMO’s regulations and enforce them as
national law. Yet the effectiveness of this structure greatly depends on the vigor and

66
robustness of each member state’s own expertise, experience and resources enabling
them to enforce these laws. In addition, there is a limited amount of sanction power
that the IMO has to hold the member states accountable. Consequently, this creates a
situation where there exist theoretical international laws, but in reality there is an
inequality in how they are enforced. This raises the question: Who is capable of
enforcing law on carriers?
4.4.1.1. Stakeholder Discussion Interviewees thought that regulation has not been strict enough to push carriers
toward sustainability (Helfre). Even those who feel the IMO serves as a useful self-
regulatory body believe it faces issues of global governance (White) when it comes to
national enforcement of regulations. An illustrative case of the perceived weakness of
the IMO’s member state structure is the Republic of Korea, which has been part of the
IMO since 1962 but did not begin enforcing regulation on maritime carriers until
2010-2011 (Oh). Further complicating the regulatory structure, interviewed experts
agree that regulations cannot reach in international waters (White, Karlsson), creating
a contradictory situation for enforcement. Re-examining the case of Korea, even
though the government is now paying attention on a national level to the IMO-drafted
regulations, the country’s container carriers operate in international waters outside of
the short sea range where Korea has jurisdiction - so the government cannot actually
enforce the regulations (Oh).
Regulatory issues run deeper than weak enforcement and border on voluntary
avoidance. Interviewees mentioned that flags of convenience have for a long time
given carriers the ability to avoid regulatory pressure at a national level (Karlsson). If
this voluntary practice goes unchecked, the continued lack of transparency will
reinforce the industry status among ESG analysts (and thus investors) as a laggard in
sustainability (Helfre). In addition, external stakeholders have long viewed shipping
as the most environmentally friendly mode of transport. As a result, the maritime
industry has received significantly less regulatory pressure to report on its
environmental performance than road and air transport have received (Karlsson) in
the past decades.

67
Paradoxically, and almost despite these factors, shipping customers note that carriers
are often too preoccupied with the notion of meeting regulatory compliance – to the
detriment of sustainability reporting. Policy makers note that regulation has
debilitated the industry, which has created carriers who are too dependant on
regulations and so caught up in compliance that they do not see the need to report
beyond what is required (Deengar). An interviewed shipping customer mentioned that
the resistance was palpable 10 years ago when asking carriers to report on anything
more than required by regulation (Vance), and it has taken a number of years to reach
a certain level of transparency and willingness to share such information.
Similarly to ownership, regulatory weakness continues to exist today and must be
considered a limiting factor rather than a strict barrier. One interesting potential
solution noted by a policy maker to overcoming this barrier is more active
participation in the legislative process on the national level. Engaging with
policymakers to provide expertise on the industry to the policymakers to guide the
regulation. Further, learning from policymakers in order to voluntarily report on
certain topics may prevent the creation of additional legislation (Deengar).
4.4.2. Complex Ship Ownership The study of the industry value chain revealed that ownership is complex and
different for each vessel. Ships are often owned by a bank or group of financiers,
managed by a carrier company headquartered in their home country, registered or
“flagged” in a second country, and operated by a company independent of the carrier.
Further, when it comes to local law enforcement, ships are steered into and out of
national ports by a pilot working for the local port authority of that country. This
ownership and operation structure complicates the attribution of consequences for
individual actors when a ship is found to violate a law. This raises the question:
Which actor is legally responsible for a ship?
Further, ship owners often wish to conceal their identity. A 2003 report by the OECD
entitled “Ownership and Control of Ships” concludes that it is very easy and fairly
inexpensive to establish a complex web of corporate identities to cover the identities
of beneficial owners of ships (OECD 2003) - a beneficial owner being defined by
68
Investopedia as “a person who enjoys the benefits of ownership even though [legal]
title is in another name” (Investopedia). The means of creating this web are
mechanisms legally available in many jurisdictions, and result in an incorporated
International Business Corporation or Private Limited Company that can do business
around the world (OECD 2003). The most important feature that facilitates this
process is the ability of corporations to be registered as owners of vessels, and the
most common mechanisms to provide anonymity for beneficial owners are bearer
shares, nominee shareholders, nominee Directors, the use of intermediaries, and a
sustained failure of jurisdictions to require reporting from ship owners. Open registers,
defined in the following section, are the easiest jurisdictions in which to register
vessels covered by such complex legal and corporate mechanisms (OECD 2003).
The OECD does not venture into value judgment on this practice, however the paper
does hypothesize on the reasons why owners may seek anonymity. The report states
that while certain owners may have perfectly legitimate or innocuous reasons, others
may seek anonymity to minimize legal and fiscal exposure, or worse yet, for reasons
that are “absolutely illegal, such as criminal activities or money laundering” (OECD
2003: 4). This raises the question: Does this ship ownership structure act as a means
to avoid disclosure?
4.4.2.1. Stakeholder Discussion Complex ownership structure within the industry was identified by interviewees as a
key factor that delayed reporting. Ownership was called by one expert “the unsung
issue in sustainability,” resulting in entangled structures that have an effect on
accountability and liability and make it harder for customers and stakeholders to track
down responsible parties (White) to respond to requests for information (Sterling).
In maritime shipping, container carriers own perhaps half of their vessels and charter
the other half. This ownership structure helps the carriers to avoid credit issues due to
the cyclical nature of the market (Helfre), but limits their control and responsibility in
ship operations. There is a famous saying that “you can’t tell a ship’s captain what to
do” (Farrag), and carriers themselves admit limited control to what happens on board
chartered vessels including factors like fuel use and consumption (Oh). This was

69
noted to be a common consequence of outsourcing – those who outsource the
transport of goods to independent ship owners feel less responsibility to measure the
sustainability impacts of those vessels (Karlsson). In addition, carriers do not own the
containers they carry and in most cases do not know what they are transporting (Oh).
An interviewee illustrates ownership complexity with an example: a ship management
company from Hong Kong running ships through the Philippines and trying to get the
maximum return for the ship-owner is concerned with the shipping rates and hardly
with anything else, including the sustainability of its operations (Deengar).
It is interesting to point out that complex ownership is a factor that still exists in the
industry, even though a number of carriers have begun to report. Due to this, the
author must conclude that ownership is not a barrier but rather a limiting factor to
reporting.
4.4.3. Poor Media Image / Poor Communications: Stakeholder Discussion
A third factor tested during stakeholder interviews is the poor image of the industry as
presented in mainstream media. Stakeholders agreed that there exists a negative
media spiral linked to lackluster carrier communications efforts that remains a
sustained barrier to reporting (Sterling). Carriers do not traditionally proactively
communicate for fear that reported information is poorly received, yet because the
mainstream media only features the industry with stories of maritime accidents or
environmental disasters, the industry’s image remains poor (Sterling). This is
confounding to analysts, who are curious to know why carriers don’t communicate
positive efforts through the media (Helfre), noting that those companies who perform
best on sustainability rankings are those who actively communicate (Karlsson). One
interviewed carrier mentioned that is a long-standing industry tradition, and that top
company management at the interviewee’s company is still unwilling to report on
issues such as corruption (Oh).
Given these results the author concludes that this factor, while not as systemic as
factors such as complex ownership or weak regulatory enforcement, remains a key
barrier to sustainability reporting.

70
4.4.4. Distance From Public Eye The author’s Factiva search and value chain analysis revealed that unlike other
industries, maritime transportation is far from the regard of the public in many ways.
• Physical: While trucks and trains physically enter our daily lives, ships are
remote and contained to offshore routes, out of sight.
• Commercial: This is a B2B industry and consumers do not (often) purchase
ocean transportation directly, so they do not have a direct commercial link to
the activities of the industry.
• End Product: Transportation has only recently entered into the scope of
product labeling schemes, and no indication of the impact of maritime
shipping is present on products.
• Media: Outside of disasters, traditional media outlets are not interested by the
industry, and so it does not enter into regular consumer awareness.
This raises the question: Does the distance from the public put less pressure on
carriers to report?
4.4.4.1. Stakeholder Discussion
Originally thought by the author to be a strong barrier, distance from the public eye
was generally discounted. In fact, certain interviewees compare maritime shipping to
other industries such as oil & gas companies who are also out of the public eye but are
very advanced in sustainability reporting (Borman). Other interviewees failed to see
the link between this distance and reporting practices (Helfre).
4.4.5. Flags of Convenience Further complicating a ship’s subjectivity to laws is the question of ship registration.
The study of the industry value chain revealed that according to international law, and
to the admiralty laws of most states, every vessel engaged in international trade must
be registered in a country, called its flag state (ICFTU 2002). In addition, and also
consistent with international law, any country has the right to allow a ship to fly its
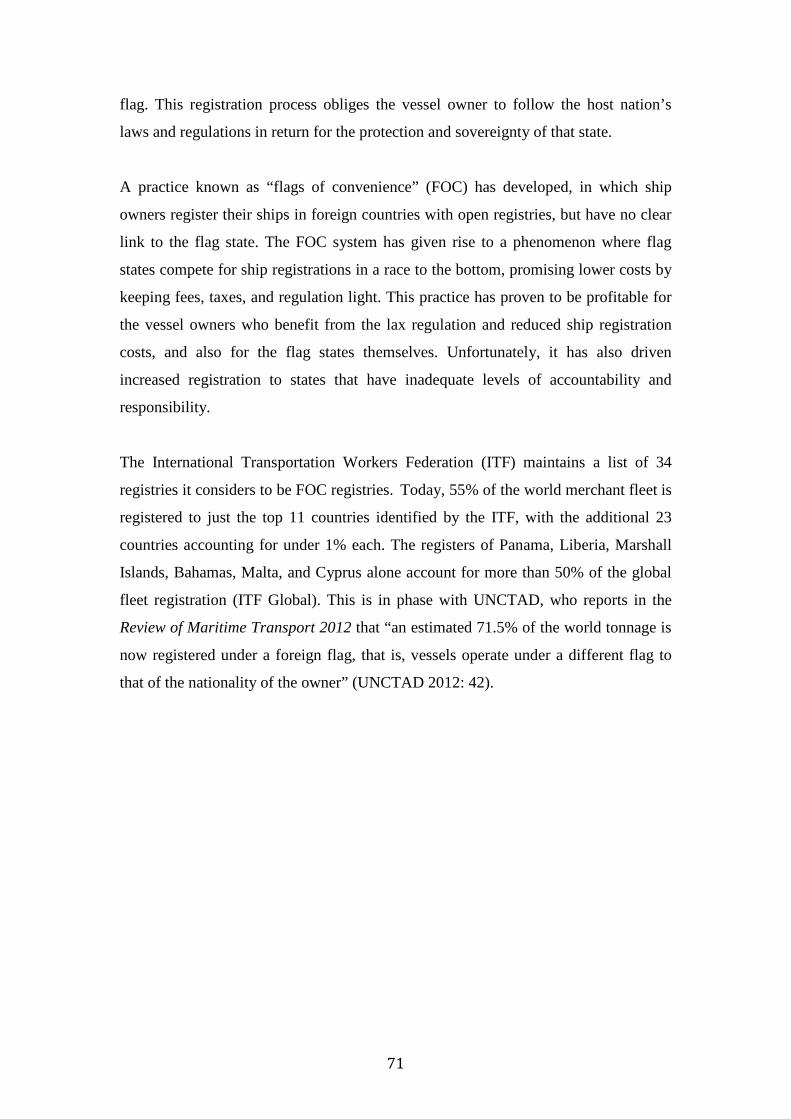
71
flag. This registration process obliges the vessel owner to follow the host nation’s
laws and regulations in return for the protection and sovereignty of that state.
A practice known as “flags of convenience” (FOC) has developed, in which ship
owners register their ships in foreign countries with open registries, but have no clear
link to the flag state. The FOC system has given rise to a phenomenon where flag
states compete for ship registrations in a race to the bottom, promising lower costs by
keeping fees, taxes, and regulation light. This practice has proven to be profitable for
the vessel owners who benefit from the lax regulation and reduced ship registration
costs, and also for the flag states themselves. Unfortunately, it has also driven
increased registration to states that have inadequate levels of accountability and
responsibility.
The International Transportation Workers Federation (ITF) maintains a list of 34
registries it considers to be FOC registries. Today, 55% of the world merchant fleet is
registered to just the top 11 countries identified by the ITF, with the additional 23
countries accounting for under 1% each. The registers of Panama, Liberia, Marshall
Islands, Bahamas, Malta, and Cyprus alone account for more than 50% of the global
fleet registration (ITF Global). This is in phase with UNCTAD, who reports in the
Review of Maritime Transport 2012 that “an estimated 71.5% of the world tonnage is
now registered under a foreign flag, that is, vessels operate under a different flag to
that of the nationality of the owner” (UNCTAD 2012: 42).
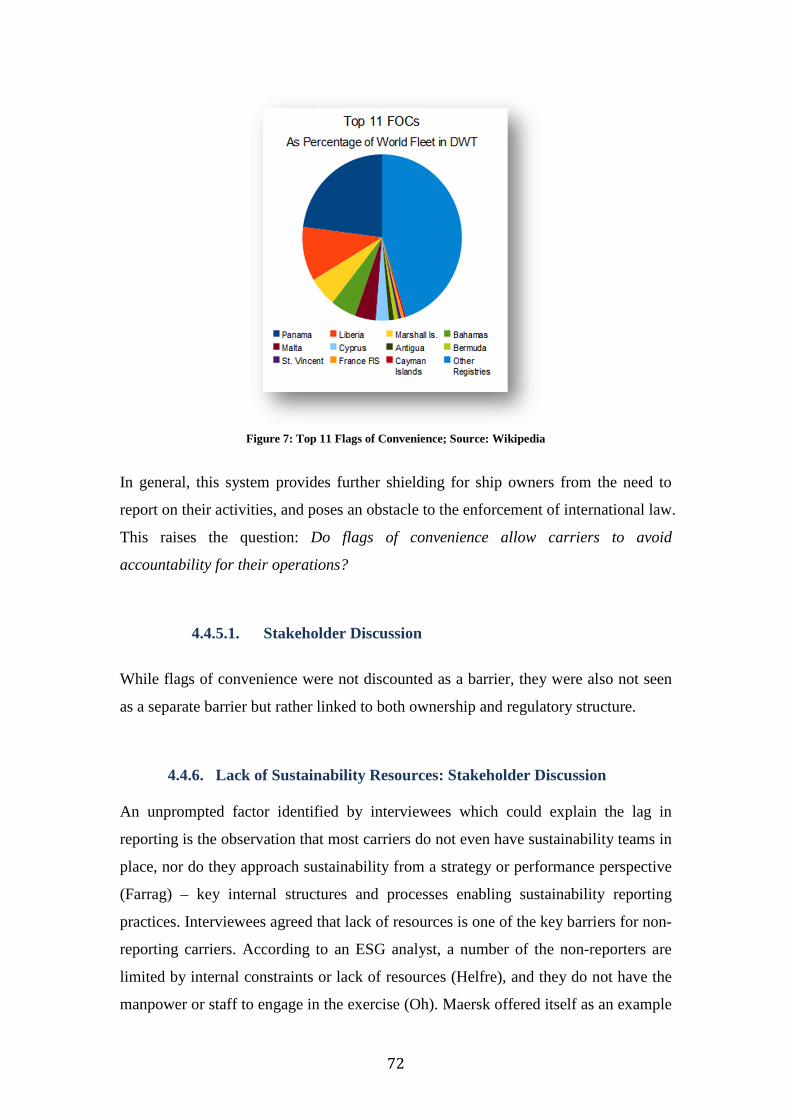
72
Figure 7: Top 11 Flags of Convenience; Source: Wikipedia
In general, this system provides further shielding for ship owners from the need to
report on their activities, and poses an obstacle to the enforcement of international law.
This raises the question: Do flags of convenience allow carriers to avoid
accountability for their operations?
4.4.5.1. Stakeholder Discussion
While flags of convenience were not discounted as a barrier, they were also not seen
as a separate barrier but rather linked to both ownership and regulatory structure.
4.4.6. Lack of Sustainability Resources: Stakeholder Discussion An unprompted factor identified by interviewees which could explain the lag in
reporting is the observation that most carriers do not even have sustainability teams in
place, nor do they approach sustainability from a strategy or performance perspective
(Farrag) – key internal structures and processes enabling sustainability reporting
practices. Interviewees agreed that lack of resources is one of the key barriers for non-
reporting carriers. According to an ESG analyst, a number of the non-reporters are
limited by internal constraints or lack of resources (Helfre), and they do not have the
manpower or staff to engage in the exercise (Oh). Maersk offered itself as an example
73
– the key reason for its ability to issue a sustainability report is the fact that Maersk is
a large company with a large sustainability team. Maersk knows that other carriers
don’t have dedicated personnel (Sterling). As an added factor, carriers have been
traditionally focused on issuing a different set of reports associated with safety and
security of their vessels (Sterling), which may have pulled resources in a different
direction.
These results have convinced the author that lack of internal sustainability focus or
lack of a dedicated sustainability team has been and remains a key barrier to
sustainability reporting.
4.5. Drivers to Reporting
4.5.1. Maritime Accidents and Environmental Activism Factiva research of industry social and environmental shocks over the past 10 years
revealed that the maritime shipping industry rarely appeared in mainstream media
outlets unless it was in reaction to a maritime accident that caused eventual pollution.
A particularly illustrative example is the Prestige oil spill of November 2002. The
Greek-owned oil tanker Prestige left Portuguese harbor and almost immediately
noticed that the ship’s hull integrity was compromised. The captain issued a distress
call, but was refused harbor by Spanish, French and Portuguese authorities that feared
pollution of their coastlines. As a result, the vessel was forced to remain in stormy
waters and eventually split in two, releasing 125 tons of oil a day and totaling to over
63,000 tons of leaked oil, causing the largest recent environmental disaster in the
maritime industry. In response, the event was publicized and heavily criticized by the
WWF which prompted the vessel’s classification society ABS to issue a report on the
event, and the IMO and EU to pursue new regulation on requiring double hulls for all
future vessel construction. The author therefore hypothesizes that maritime accidents
are a potential driver that push maritime actors to report on certain aspects of their
sustainability performance, notably their impacts on the environment. In addition, this
example demonstrates that NGOs take an activism role in response to maritime
accidents, which the author retains as a second potential driver to reporting.

74
4.5.1.1. Stakeholder Discussion
• Environmental Activism – Carrier companies, analysts and policy makers
agreed that militant environmental activism rarely happens in maritime
container shipping (Sterling), to the point where it is generally non-existent
(Helfre). Even mainstream environmental non-profits mentioned that activism
has not had much effect (Borman) on sustainability reporting practices. An
interviewed policy maker noted that activism is not prevalent for container
carriers, but more for tankers or bulk carriers (Deengar).
• Maritime Accidents – The occurrence of maritime accidents was almost
universally rejected as a barrier to reporting, and certain interviewees saw it as
a driver to reporting when accidents enter the public eye (Borman). An
interviewed analyst agreed with a policy maker that container carrier accidents
that expose the products of a known brand might cause the brand to report
(Helfre, Deengar) but not the carrier.
4.5.2. Increased Regulation
The past few years have also given rise to increasing regulations placed on the
maritime shipping industry. While the IMO’s MARPOL regulation went into effect in
1978, it was recently amended in 2000 to increase the sanctions against non-
compliance (IMO). The IMO also issued the International Safety Management Code
on July 1, 1998 and in the same year introduced amendments to the International
Convention on Standards of Training, Certification and Watchkeeping for Seafarers.
New conventions were adopted in the 2000s related to anti-fouling systems, ballast
water management and ship recycling (IMO). In addition, the 2000s brought a focus
on maritime security with the 2004 International Ship and Port Facility Security
(ISPS) Code as well as the 2005 Convention for the Suppression of Unlawful Acts
(IMO). All of these regulations touch on key elements of sustainability, such as
environmental protection, employee safety, bribery prevention, and security, and
increase the compliance and reporting requirements of maritime carriers. The author
retains that this recent increase in regulation acts as a potential driver for
sustainability reporting.

75
4.5.2.1. Stakeholder Discussion
Interviews have revealed that an increase of industry regulation cannot be considered
a driver of sustainability reporting. An industry consultant noted that social and
environmental regulations are tightening up, giving carriers common standards
against which they can measure their performance (Farrag). Experts agree that
regulations, such as the IMO regulations identified earlier on ballast water and SOx
emissions, are enabling carriers to report (Karlsson) and to account for their activities
(Sterling). However, there is a shared sentiment that while regulation helps to
standardize the issues addressed by the industry, it does not directly drive reporting
(Farrag, Sterling). And as noted, too much focus on regulation has caused carriers to
focus more on compliance than on reporting (Deengar). The author therefore
concludes that regulation can in certain ways be considered an enabling factor of
reporting, but not a key driver.
4.5.3. Customer Pressure
Additionally increasing is customer awareness of the environmental impacts of their
supply chain providers, all the way to maritime container transportation. Through his
professional work, the author has seen an increase in customer pressure exerted on
container carriers by the shipping customers involved in the Clean Cargo Working
Group, an industry initiative focused on environmental performance improvement
within the maritime transportation industry. The group was formed in 2003 when
concerned shipping customers came together to identify possible ways of improving
their carrier performance, and today provides those shipping customers the
opportunity to measure carrier performance and make procurement selections based
on reported information. The author sees the success of this initiative as justification
for defining customer pressure as a potential driver for increased carrier reporting.
4.5.3.1. Stakeholder Discussion A key driver identified by interviewed experts that pushed container carriers to begin
publishing sustainability reports was growing pressure from shipping customers. An
interviewed reporting expert noted that the environmental impacts of shipping were
76
long unknown to the customer (White) or simply not considered as the biggest impact
that warranted their attention (Sterling). Prior to 10 years ago, customers were more
focused on the classic purchasing criteria such as delivery date and price (Vance). The
lack of awareness also extended to other stakeholders such as regulators and analysts
(Helfre), and even carriers themselves were not aware at the time of what constituted
sustainability issues (Oh).
An ESG analyst noted that awareness began to grow among customers in 2003, and
has redoubled since the economic crisis in 2008 (Helfre). At the time, customers
began asking questions about carriers’ green programs and social initiatives, and even
though carriers were working in these areas they did not know to report them as
sustainability (Oh). This awareness grew in part to the publication of certain reports
and the growth of emerging sustainability standards. UNEP released a report in 2006
that demonstrated the significant percentage of greenhouse gas emissions contributed
by the maritime shipping industry (Farrag). Initiatives like the Carbon Disclosure
Project issued guidance on how to measure what they call Scope 3 emissions
(including transportation services) in 2011, which prompted customers to look into
their supply chains emissions (Helfre).
As a result of this rising awareness, shipping customers, led by the biggest brands or
global players, have increasingly pushed into their supply chains to ask transport
providers to report on their emissions (White, Oh, Farrag, Karlsson, Sterling, Helfre).
This pressure has been strongest on container carriers, which transport the goods of a
large number of customers at once and would have received multiple requests per
vessel (Deengar). An interviewed carrier noted that customers have been a key factor
in raising awareness of sustainability issues among carriers (Oh), who now see
reporting as an opportunity to demonstrate their sustainability performance to their
customers (Borman). Customers note that even today’s non-reporters are feeling the
pressure to report, and asking customers how they can begin building sustainability
reports (Vance).
These results confirm the author’s observation that customer pressure has resulted in
increased transparency and reporting by carriers. It is interesting to note that not only
did this pressure push carriers to report, but it also increased their capacity to do so.
77
Further, customer pressure enabled direct dialogue with customers to discuss which
issues were relevant for reporting, and established this discipline of customer
engagement among carriers. The author confirms that customer pressure is a key
driver of sustainability reporting, and stands to continue increasing reporting practices
among industry laggards.
4.5.4. Sustainability Ratings: NGO/Index Pressure: Stakeholder Discussion
Along with customer pressure, interviewed experts note that NGO and Sustainability
Index pressure have further acted as a driver for reporting. The rise of non-
governmental movements such as Green Awards, the Clean Ship Index (CSI), and the
Environmental Ship Index (ESI) have increased the requests for information from
carriers on their sustainability practices (Borman). Standards organizations such as the
CDP and sustainability indices such as the Dow Jones Sustainability Index have
increasingly issued questionnaires to carriers asking about their sustainability
performance (Oh). As one interviewed carrier notes, in order to respond to these
diverse and broad questionnaires, carriers had to begin monitoring their own
sustainability activities and develop internal processes to report on them (Oh).
The author sees a clear relation between these increased sustainability ratings
initiatives, which have developed over the past 10 years, and the evolution of carrier
reporting as demonstrated in the content analysis study. Though unprompted, this
factor is therefore considered to be a key driver in sustainability reporting. However,
further study would be required to understand the relationship between the
information requested from these NGOS and sustainability indices and the
information eventually published in sustainability reports.
4.5.5. Peer Reporting: Stakeholder Discussion Peer reporting is a factor identified by experts both as a driver to reporting activity as
well as a barrier. An interviewed sustainability analyst explained it as follows: a
market leader issues a sustainability report and causes other companies to emulate its
activity, but once this first mover advantage has been claimed by one or two
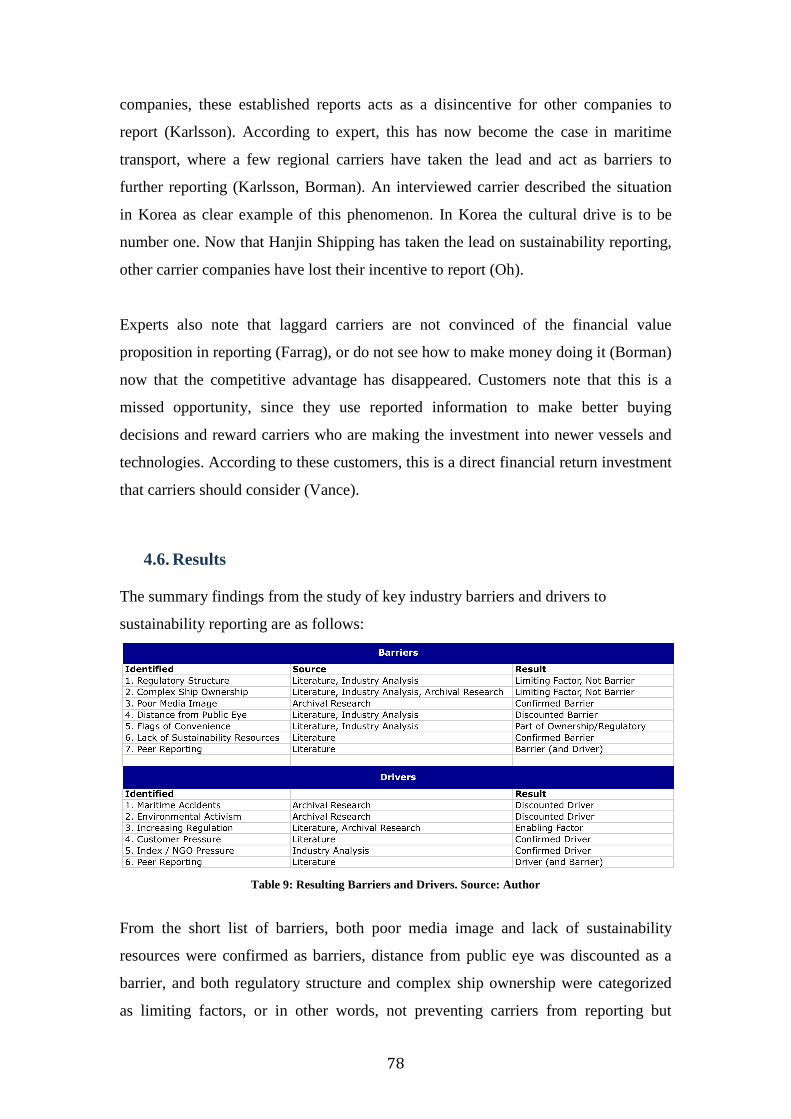
78
companies, these established reports acts as a disincentive for other companies to
report (Karlsson). According to expert, this has now become the case in maritime
transport, where a few regional carriers have taken the lead and act as barriers to
further reporting (Karlsson, Borman). An interviewed carrier described the situation
in Korea as clear example of this phenomenon. In Korea the cultural drive is to be
number one. Now that Hanjin Shipping has taken the lead on sustainability reporting,
other carrier companies have lost their incentive to report (Oh).
Experts also note that laggard carriers are not convinced of the financial value
proposition in reporting (Farrag), or do not see how to make money doing it (Borman)
now that the competitive advantage has disappeared. Customers note that this is a
missed opportunity, since they use reported information to make better buying
decisions and reward carriers who are making the investment into newer vessels and
technologies. According to these customers, this is a direct financial return investment
that carriers should consider (Vance).
4.6. Results The summary findings from the study of key industry barriers and drivers to
sustainability reporting are as follows:
Table 9: Resulting Barriers and Drivers. Source: Author
From the short list of barriers, both poor media image and lack of sustainability
resources were confirmed as barriers, distance from public eye was discounted as a
barrier, and both regulatory structure and complex ship ownership were categorized
as limiting factors, or in other words, not preventing carriers from reporting but
79
making it more difficult to do so. From the short list of drivers, both customer
pressure and NGO/Index pressure were confirmed as drivers, both maritime accidents
and environmental activism were discounted as drivers, and increasing regulation was
cited as an enabling factor, or in other words, not obliging carriers to report but
facilitating reporting. Peer reporting was found to be both a driver and a barrier to
reporting, depending on the situation in which it arose.
These results answer the second research question in this study, and provide insight
into why container carriers were delayed in their reporting practices, and what
eventually pressured them to begin issuing sustainability reports. Given the small
sample size of the industry stakeholders interviewed, these barriers and drivers must
be considered indicative but not exhaustive.
4.7. Trends in Sustainability Reporting During the stakeholder interviews, in addition to questions on barriers and drivers the
author asked questions about current factors that stand to influence sustainability
reporting practices going forward. The following is a brief discussion of these factors.
4.7.1. Industry-specific reporting Experts agree that the biggest trend in reporting today is the development of industry-
specific guidance. Increased focus on sector-specificity from three of the major
voluntary guidance organizations, GRI, IIRC, SASB, will have an impact on all
sectors including maritime transportation (White). There is also increased expectation
that shipping will come up with its own standards over the next decade (Borman),
finding industry-specific topics relevant to its stakeholders (Karlsson). Further,
analysts believe that the CDP stand to develop more elaborated sections with
questions specifically concerning shipping (Helfre).
4.7.2. Reporting laws Experts also noted that national mandatory reporting laws, specifically carbon-related
laws will push carriers to develop reports in the future (Farrag). Sustainability

80
analysts claim that this move from voluntary to mandatory reporting at a national
level is the only driver that will convince non-reporters to issue sustainability reports
(Helfre). As one expert said clearly, the period of voluntary reporting is over
(Karlsson).
4.7.3. Materiality While materiality is an identified weak point in current reports, the market leader
Maersk line noted that there will be a divergence to 2 types of reports in the future:
those that try to follow GRI guidance in a comprehensive way, and those that are
leaner and more material (Sterling).
4.7.4. ESG Analysis ESG analysts noted the industry’s largest player Maersk Line is no longer answering
certain requests from agencies like Sustainalytics (Helfre), perhaps indicating that the
dramatic increase in requests through sustainability ratings and indices over the past
10 years is beginning to cause carrier fatigue.
This section identified the key barriers and drivers to the industry’s current reporting
practices as studied through the maturity analysis. The next section will provide final
cross-analysis and conclusions from the global study.
81
5. Conclusions
5.1. General Conclusions This study intended to provide a snapshot of the current state of sustainability
reporting in the maritime container transport industry, by examining the current
literature on the industry’s reporting practices and performing empirical studies on
both reporting maturity as well as on the key drivers and barriers to reporting
practices. The questions it set out to answer were:
• What is the current state of sustainability reporting practices by maritime
container carriers? (By extension, what is the maturity of current reports?)
• What industry barriers and drivers exist to the practice of sustainability
reporting which explain this current state?
Both a review of the available literature and an empirical study of reporting using
content analysis revealed that the industry is in fact a laggard in reporting. A 2011
KPMG survey of top reporters ranked transportation 14 out of 16 sectors in terms of
report availability (KPMG 2011). Content analysis showed that the maritime
container shipping industry only began issuing environmental reports in 2002, well
behind the origins of standalone environmental reports in 1989 (Kolk 2004). Asian
carriers were first to issue standalone reports and it took an additional five years for
the first European carrier to issue similar reports.
In addition, the industry attained its current level of sustainability reporting maturity
(measured by the six developed indicators: presence of GRI Index, materiality
analysis, stakeholder commentary, KPIs, assurance statement, and robust reporting
cycle) around 2008 when four of the seven reporting carriers scored on three of the
six measured indicators. However, even today, only six of the industry’s top 20
carriers by volume score on these same three indicators, showing that the industry has
not improved further since 2008, reaching a perceived plateau. Interviews with
stakeholders later confirmed these findings, with six out of 10 interviewees stating
without prompting that the industry is lagging in reporting.

82
Figure 8: Key Barriers and Drivers to Sustainability Reporting; Source: Author
The second phase of the study, composed of analyzing the industry value chain,
archival research on industry shocks, and a series of semi-structured interviews with
industry stakeholders, revealed two key barriers that have prevented industry
reporting. The identified barriers were lack of sustainability resources and a negative
media image of carriers:
• The industry currently suffers from a partial and negative media image since
mainstream media outlets seem to not find general interest in reporting on the
maritime industry (perhaps due to its complex technical nature) except
surrounding such events as maritime accidents, pollution, corruption, or piracy.
This has resulted in a tense relationship between media and maritime carriers
and reinforced the maritime industry’s “long-standing tradition” (Oh) of
resistance to communicating on controversial topics, and by extension, a
barrier to reporting on a broad array of sustainability issues.
• A second barrier finds that non-reporting carriers may not be issuing
sustainability reports for lack of resources (funds, employees, time) put behind
sustainability efforts, resulting in the lack of a dedicated internal sustainability
team or limited engagement on sustainability by upper management. Since this
study examined only the twenty largest maritime carriers, the author does not
believe this is due to a lack of funding. Instead, this barrier indicates a
potentially deeper problem of corporate culture within the industry, namely
that carriers do not see sustainability as key to their continued financial
performance. Consequently, lack of resources could be seen as a false barrier,
or more likely, a symptom of industry culture that needs further study.
In addition, this study has identified limiting factors to reporting, which either make
reporting difficult or allow carriers to avoid reporting but do not prevent it outright.

83
These limiting factors are complex ship ownership structure and weak regulatory
structure:
• The maritime shipping industry depends on the operation of capital-intensive
vessels that pose many risks in their operations, which has seen the rise of
individuals looking for a way to profit from investing in vessel ownership
while simultaneously distancing themselves from risks, resulting in complex
ownership structures through both shell companies and registration of vessels
in countries with low regulations, a practice known as flags of convenience.
Complex ship ownership is therefore a limiting factor since, as carriers are
decreasingly the owners of the ships they operate, it affects a carrier’s control
and influence on a vessel’s operations and impacts. This limited liability,
accountability, and responsibility results in limited motivation (or perhaps
means) for a carrier to report on a vessel’s sustainability performance. Further,
there is little recourse for stakeholders to pressure carriers to report on the
overall sustainability of their fleet, since both stakeholders and carriers have
difficulty holding legitimate owners accountable.
• Weak regulatory structure is also identified as a limiting factor to reporting.
The maritime shipping industry operates in unregulated international waters,
which makes it difficult for both the industry’s self-regulatory body, the IMO,
and its member states to enforce regulation on carriers. Stakeholders add that
regulation has thus far not pushed carriers to sustainability; in part because
maritime shipping is seen as the most environmentally friendly mode of
transport and regulatory attention has focused elsewhere. Additionally, the
practice of flags of convenience limits the effectiveness of the current
regulation in place, since they are more broadly enforced in non-flag of
convenience nations. It would seem from this discussion that weak regulatory
structure is indeed a barrier to sustainability reporting, however, this assumes
that regulation is the sole driver to reporting, and that its absence would be a
complete block to reporting, which is proven not to be the case. Therefore
weak regulatory jurisdiction and enforcement have been a hindrance to
widespread sustainability reporting, limiting what carriers are obligated to
report, but it has not prevented the practice from occurring voluntarily.
84
For both of these issues, additional research would need to be performed at a more
granular level of detail, looking specifically at the types of ownership structures that
exist within the industry (including the role played by flags of convenience), and
looking specifically at individual regulations, to understand how these factors directly
link with reporting practices.
Though the current regulatory structure is seen as a limiting factor, increasing
regulation itself has been identified as an enabling factor to reporting, which helps
build reporting capacity but does not oblige publishing, and as such is not a driver.
• An increased focus by regulators on the environmental performance of the
maritime shipping industry has led to increasing regulation over the past few
years. This is forcing carriers to begin measuring and reporting on certain
sustainability information, but does not obligate the publication of a report. In
the absence of specific sustainability reporting laws, this increasing regulation
is not seen as a driver of reporting.
This study has identified two key drivers that have pushed carriers to report, both
linked to stakeholders: customer pressure and NGO/Sustainability Index pressure.
• Customer pressure is key to explaining the rise in reporting over the past 10
years. Certain events such as the publication of the UNEP report “Bridging the
Emissions Gap” in 2006, or the 2001 publication and continuous refinement of
the GHG Protocol Accounting Standards, have demonstrated to shipping
customers the significant percentage of greenhouse gas emissions contributed
by the maritime shipping industry, and prompted customers to look into their
supply chains and ask transport providers to report on their emissions. This
pressure from customers has been a factor in raising awareness of
sustainability issues among carriers, who have begun to see reporting as an
opportunity to differentiate themselves to their customers through
sustainability performance. Similarly, it is important to note that pressure from
customers has direct financial implications for carriers, since sustainability
performance is becoming an increasing evaluated criterion in bidding
processes. Customer pressure is therefore a driver, since it at once builds
85
carrier capacity to gather sustainability information and requires the
publication of this information in a synthesized report.
• NGO / Sustainability Index pressure refers to the rise of sustainability indices
such as the Dow Jones Sustainability Index, launched in 1999, or the
FTSE4Good Index launched in 2001, and the subsequent pressure placed on
carriers to report on information in order to be listed. In order to respond to
these diverse and broad questionnaires, carriers have had to begin monitoring
their own sustainability activities and develop internal processes to report on
them. Again, it is important to note that pressure from sustainability indices
has direct financial implications, as carriers have something to gain from
accessing an investor pool interested in rewarding sustainability performance.
NGO/Sustainability Index pressure is therefore a driver of carrier reporting, as
the indices specifically measure the quality of information published in
sustainability reports, requiring the carrier to report.
Identified as both a driver and a barrier to industry reporting is peer reporting. As
mentioned, an existing peer report can either eliminate the competitive advantage of
being a first-mover or encourage competitors to report in order to stay in step with
industry leaders. This was reflected in the analysis of industry reporting, as both Asia
and European regions saw first movers take the lead and drive one or two additional
carriers to report soon thereafter, whereas the entrance of Maersk Line seemingly
acted as a barrier to additional carriers issuing mature reports. Peer reporting would
therefore need to be studied on a case by case basis to understand its nature.
In sum, the author believes that this study of the industry’s reporting maturity as well
as its key barriers and drivers has served as a key starting point for improving industry
reporting going forward.
Carriers who are currently reporting can improve their report maturity in the eyes of
stakeholders by building a materiality process to select the most relevant reporting
topics, engaging with stakeholders to include their unedited feedback on report
quality, and by contracting independent third party assurance to increase the level of
trust in the reported information. Further, stakeholders suggest that carriers
communicate on how their sustainability efforts connect with the investment
community, that they include greater levels of transparency on lobbying and public
86
policy efforts, and that they begin communicating on the social benefits provided by
carrier activity beyond philanthropic efforts. These recommendations are quick wins.
Conversely, non-reporting carriers may be encouraged to report if the barriers
identified in this report are overcome. Addressing the barrier of lack of sustainability
resources will most likely require proving the business case of sustainability to upper
management within carriers. Much progress on this front has already been made, but
this requires further work by external consulting firms, customers, and even internal
champions to demonstrate the potential financial, reputational, and legitimacy gains in
investing in sustainability. Groups like Natural Capitalism have worked to prove the
business case of sustainability, but these general studies need to be made more
relevant to actors in the maritime shipping industry.
Addressing the barrier of negative media image may prove easier, but it would most
likely require active invitations by media outlets to maritime carriers, giving them a
safe haven to present their efforts in a positive light. Thankfully, there are
developments on this front that may help encourage carriers and media to bridge the
gap. A recent example is the English news agency ITN, who will be creating a
dedicated news channel called ITN Global Logistics and Transport News featuring
maritime shipping initiatives (among other modes) and providing a platform for
industry actors to communicate on their achievements. This initiative by a mainstream
news outlet shows that media outlets respond to the interests of their viewers, who
increasingly want to know the sustainability impacts of their products, including how
they are transported. By levering consumer and customer interest in sustainability,
additional media outlets may be inspired to engage the maritime industry and break
the communications barrier.
This study has therefore succeeded in providing a snapshot of current reporting
practices, industry barriers and drivers, and potential avenues to improve reporting
going forward. However, the reporting landscape is constantly changing. This past
month saw the emergence of the new GRI G4 guidelines and the draft IIRC integrated
reporting standard, and this year stands to see increased focus on sector-specific
indicators and the rise of additional mandatory sustainability reporting laws. The
author feels that this fragmentation in standards may pose an additional barrier to
sustainability reporting for non-reporting carriers, adding to the complexity of what
87
needs to be reported, by when and to whom. In addition, there is growing sentiment
that voluntary reporting period has done all it can to encourage carrier reporting, that
the first-mover competitive advantages have already been seized in major markets,
and that the period of voluntary reporting is over. In other words, there is a sentiment
that no additional efforts to overcome the current barriers and reinforce the identified
drivers will help the industry to break through the observed reporting plateau. If this
proves to be true, it remains to be seen if reporting laws will have enough weight to
push the last major maritime carriers to issue sustainability reports.
5.2. Limitations and Further Research The limitations of the conclusions in this research arise from methodological choices
made by the author. Concerning the content analysis, the author’s chose a narrow
scope of six representative indicators across the top 20 carriers by TEU volume
during the past 10 years. This small sample size is adequate for the sake of this paper,
but at best provides tendencies for this representative group rather than firm
conclusions for the entire industry. An additional limitation is the restriction of
examining only sustainability reports available on carrier websites, whereas other
documents or website content published by carriers were not examined. The author
chose this restriction to simulate the position of report users, who presumably do not
want to search for information across multiple documents but rather find the
information they need quickly and in one source. This choice could lead to incorrect
conclusions in case a carrier had published sustainability-related information
elsewhere or had produced a report which was not available online at the time of the
study. A further limitation is related to comparison, both the inherent incomparability
of sustainability reports, and the choice not to compare the studied sector with an
external sector. Finally, a potential problem with the findings is the underlying
subjectivity concerning the scoring of selected indicators, since the author was the
only researcher who analyzed reports for the reported information. A second
researcher may have helped to correct this subjectivity.
Concerning the series of semi-structured interviews, the limitations are directly linked
to the nature of interviews. While over fifty potential stakeholders were identified the
final pool of respondents who agreed to participate was out of the author’s control and

88
accepted due to the time restrictions of the study. An additional limitation is in the
structure of the questionnaire, which the author designed to be semi-open ended but
also guided by certain discovered barriers and hypotheses.
Consequently, further research on the maturity, barriers and drivers of sustainability
reporting in the maritime container transportation industry is desirable, and should be
based on larger samples of both reports as well as interviewees. Differences in
sustainability reporting of the maritime container transportation industry and other
sectors should be evaluated as well. Further content research could be performed with
a broader range of criteria, specifically focused on the GRI framework and its draft
transportation sector supplement, which stakeholders identified would have increasing
importance in the reporting practices of carriers. And finally, further research on
barriers and drivers could be made more concrete through the use of case studies of
container carriers to provide specific examples of good and best practices to reporting.
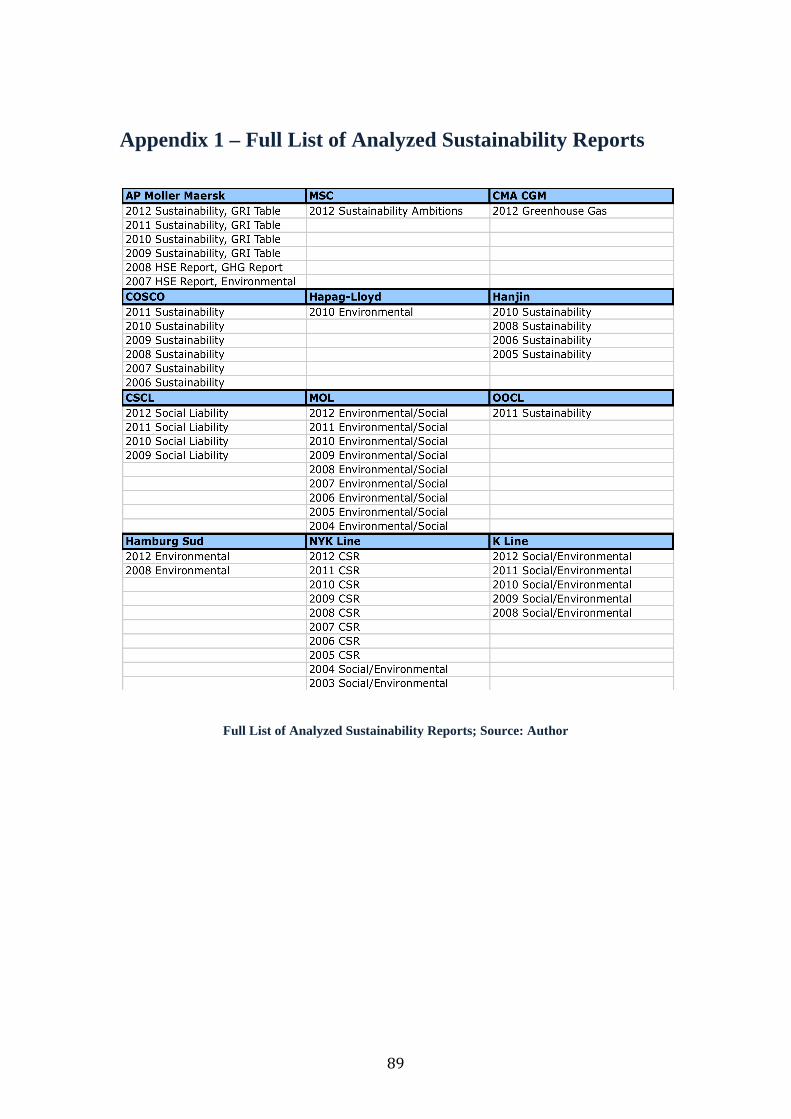
89
Appendix 1 – Full List of Analyzed Sustainability Reports
Full List of Analyzed Sustainability Reports; Source: Author

90
Appendix 2 – Full Semi-Structured Interview Questionnaire Questionnaire | Jonathan Morris | Thesis on maritime container sustainability reporting The intention of the below questionnaire is to gather a variety of perspectives on maritime container sustainability reporting practices. I have invited container carriers, regulators, analysts, non-government organizations, reporting bodies, and sustainable indices to answer. Please answer the following questions as fully as you can, to the best of your knowledge. When in doubt, a longer, more diverse answer is preferable.
1. What is your overall opinion about sustainability reporting in the maritime container transportation industry?
a. How does sustainability reporting compare with other sectors? Is it behind other sectors? Is it more advanced?
b. Who do you think is the main audience? c. What purpose does sustainability reporting serve? d. Does it meet the needs of [you] / the key audience?
2. Despite initial environmental reports from carriers appearing in 2002, it took until 2006-2007 to see 5 or 6 of the major container carriers begin reporting. In your opinion, what are the factors that contributed to the late start in sustainability reporting?
a. What barriers within the industry prevented carriers from reporting on sustainability earlier?
b. Please provide your thoughts on the following barriers. Were these a factor in the delay of sustainability reporting?
i. Weak Regulatory Enforcement (open oceans, international policy) ii. Complex Ship Ownership Structures (owner, operator, charterer, etc) iii. Flags of Convenience iv. Distance from Public Scrutiny v. Poor Media Image (only enters mainstream media in case of accident,
corruption, etc) 3. In your opinion, what pressured carriers to begin reporting on sustainability?
a. What external factors or drivers encouraged or required sustainability reporting by carriers?
b. Were there significant events / regulations over the past 10 years that could explain the move towards sustainability reporting?
c. Please provide your thoughts on the following drivers. Were these a factor that pushed carriers to report on sustainability?
i. Maritime Accidents ii. Increased Regulation iii. Environmental Activism iv. Client/Customer Pressure
d. What external stakeholders pressure carriers to report on sustainability? 4. In more detail, what do you think of the quality of the current sustainability reports
themselves? a. What are some best practices of the sustainability reporting within the industry? b. What are the weak points in reporting? c. To whom are the reports addressing? d. Do the reports fulfill their purpose?
5. What trends or evolutions do you see within the next few years in sustainability reporting by carriers?
a. What current drivers could lead towards changes in sustainability reporting? 6. What possible improvements could be made to sustainability reporting by carriers?
a. What are the opportunities to create higher quality sustainability reports? b. What about for those companies not reporting, what would be the key motivating
factors

91
Appendix 3 – Factiva Research Introduction to social and environmental Shocks in Maritime Transportation
Industry between 2003 and 2013
Historically shrouded and kept out of public scrutiny, the maritime shipping industry
has experienced growing pressure to report on its activities over the past 10 years.
These pressures have grown, in part, due to the increased awareness of industry
practices, accidents and scandals through media exposure, which has triggered
regulators, civil society and the public to hold the shipping industry accountable and
caused subsequent changes seen in industry reporting. The following is a recap of key
industry events over the past 10 years as research through news aggregator Factiva,
grouped into the principle categories of safety (negligent accidents), security
(piracy/terrorism attacks), environment (oil spills), and governance (illegal bilge
water and oil dumps). For each event, a short note is given on changes in industry
reporting.
Safety
Negligence
MV Tricolor
On December 14, 2002 in the early morning fog, the MV Tricolor collided with a
Bahamanian flagged container ship the Kariba with a load of 3,000 cars in the English
Channel, listing to its side and sinking in the middle of the channel. Despite
protections set up around the wreck, two days later the cargo ship Nicola, followed by
another vessel, the Vicky, carrying 70,000 tons of fuel, struck the sunken Norwegian
vessel after failing to heed French naval warnings. (Factiva: Fuel tanker hits sunken
ship in channel). The Vicky made it safely to a nearby harbor but its reinforced hull
was cracked in several places and it was leaking oil into nearby waters. According to
Numast spokesman Andrew Linington, 90% of these accidents happen as the result of
the human factor. He said that there is a constant drive to reduce crewing levels,
pushing people to work 80 to 90 hour weeks. (a lack of interest/recruitment in
seafaring).

92
The actors involved were the two original ships involved in the collision, the Tricolor
and the Kariba, as well as the Nicola, the Vicky, and local French authorities. The
ship-owner of the Tricolor was Capital Bank of Scotland and its operator was
Wallenius Wilhelmsen Linesworth.
Reporting Consequences
Royal Bank of Scotland – no reported information.
Wallenius Wilhemsen – privately owned, no reported information, started
environmental reporting in 2005.
However, there was heavy media and NGO reporting.
MSC Napoli
In January, 2007 the MSC Napoli, carrying 2,318 containers, was deliberately
grounded near Devon, UK after suffering hull damage in the English Channel two
days earlier. The vessel issued a distress call, and authorities decided that the least
environmentally risky option was to tow the vessel in. However while towing to port
for repairs, the vessel was beached after fears arose of it breaking up (Factiva: years
of pollution averted by beaching). Despite this precaution, the vessel began leaking
over 200 tons of oil, affecting over 1,000 seabirds. (Factiva: fears grow for heritage
coast). In a later investigation by the Marine Accident Investigation Branch, it was
found that the Napoli was carrying many overloaded containers and was travelling too
fast for the conditions, sacrificing safety and risking an environmental disaster to
reduce costs and meet tight delivery schedules (Factiva: probe finds shipping Indus
sacrificing safety).
The actors involved in this incident were the ship owner Metvale Limited, the ship
chartering company MSC, the ship operator Zodiac Maritime Agencies Ltd, the NCP
Environment Group, the Devon County Court, Det Norske Veritas classification
society and the Marine Accident Investigation Branch.
Reporting Consequences
Metvale Limited – private, limited company.
Zodiac Maritime Agencies – privately owned, no reported information, started
environmental reporting in 2010.
93
Det Norske Veritas reported on this accident in their 2008 Annual Report, stating that
an investigation concluded there were human and technical reasons behind this
accident. In a separate Press Release, the company concluded that the technical
reason behind the ship’s troubles, insufficient buckling strength in the forward part of
the ship’s engine room, was a “minor structural modification” and would only need to
be repaired on a few other ships.7 Again, there was heavy media and NGO reporting.
COSCO Busan
On November 7th, 2007, the pilot of the freighter COSCO Busan sideswiped a support
of the San Francisco-Oakland Bay Bridge, causing a huge spill in the San Francisco
bay. Captain John Cota had boarded the ship locally and was working with a Chinese-
speaking crew to navigate the vessel out of the bay, but struggled to read navigational
devices amidst anxiety about thick fog. Transcriptions showed that he apologized to
the Chinese crew after the accident. (Factiva: pilot, crew struggled in fog before bay
oil spill).
The city of San Francisco filed a lawsuit against the ship owners and other parties
seeking assorted damages, civil penalties, and recouping of costs to clean up the spill.
Named in the lawsuit were the ship owner Regal Stone and operator Fleet
Management, Hanjin Shipping Co. Ltd. Who owned the fuel, Synergy Management
Services and Synergy Marine, agents of Regal Stone, and John Cota (Factiva: san
Francisco sues ship owner, others over oil spill in bay).
It was later determined during a National Transportation Safety Board hearing that
Cota was taking prescription medications to combat a number of ailments, and
physicals showed that he had a prior history of alcohol abuse and depression, and
recently began suffering from sleep apnea. He was taking lorazepam, an anti-anxiety
medication, Wellbutrin for depression, Valium as a sleep aid, Aciflux for heartburn,
Lipitor for high cholesterol, Alphagan for glaucoma, Imitrex for migraines, and
potassium citrate for kidney stones. The hearing revealed that use of these
medications prompted the Coast Guard to ask Cota to voluntarily turn in his mariner’s
license in the weeks after the accident.
7 http://www.dnv.com/press_area/press_releases/2008/dnvconcludes.asp
94
NTSB investigator Dr. Barry Strauch also revealed that Cota was convicted of driving
under the influence in 1999 and entered an alcohol rehabilitation program, and was
later granted a waiver to retain his pilot’s license.
Cota pleaded not guilty to criminal negligence and violating environmental laws and
refused to testify in the hearing. (Factiva: Impact of medications prompted request for
license of pilot on oil-spilling container ship). He was sentenced to 10 months in
prison, one year of supervised release and 200 hours of community service for his role.
(USDOJ : Cosco Busan Operator Admits Guilt in Causing Oil Spill).
The environmental price tag for the oil spill exceeded $5 million. The ship’s owner,
Regal Stone Ltd. Of Hong Kong, was asked to pay for the impact including damage to
wildlife and human costs. (Factiva: the spill is not over). The ship operator Fleet
Management Ltd eventually agreed to pay a total $10 million criminal penalty.
(USDOJ : Cosco Busan Operator Admits Guilt in Causing Oil Spill). The final
settlement in 2011 required the owners of the ship to pay $44 million for all the
resource damages caused by the oil spill. (Baykeeper : COSCO settlement falls short).
The actors involved in this incident are the ship-owner Regal Stone Ltd, operator
Fleet Management Ltd, the pilot John Cota, the crew of the Cosco Busan, the San
Francisco Port Authority, the National Transport Safety Board, Department Fish and
Game, PRBO Conservation Science, National Marine Fisheries Service, the City of
San Francisco.
Reporting Consequences
Regal Stone Ltd – private company, no reported information.
Fleet Management Ltd – private company, no reported information.
The NTSB issued a full accident 160 page accident report.
Cosco issued both a Sustainability report and an Environment report in 2008, but
made no mention of the Cosco Busan incident in either.
Heavy media reporting, NGO reporting, and legal reporting.
Security
Piracy (& terrorist attacks)
MV Sirius Star
95
Piracy off the coast of Somalia rose to a crescendo between 2005 and 2008, the year
when some 100 reported vessels were captured and held for Ransom off the coast of
the African nation. One such attack happened on November 15th, 2008 when the MV
Sirius Star, a Saudi-owned oil tanker and operated by Vela International Marine, was
en route from Saudi Arabia to the US and attacked by Somali pirates. The
International Chamber of Shipping said the ship was 800 miles east of Mombasa,
Kenya when attacked. The ship had 25 crew members on board and was carrying over
US$100 Million worth of oil. (Guardian: Pirates hijack Saudi-owned oil tanker with
British crew on board)
This attack made world headlines since the Sirius Star is three times the mass of a US
aircraft carrier and capable of carrying over 2m barrels of crude oil, and was attacked
twice as far out to sea as other attacks at the time, according the US Navy. Even more
astonishing, days later the Somali pirates demanded US$25 million ransom for the
safe return of the ship and crew. The UK government refused, and the Somali pirates
counter-demanded US$15 million. Finally, on January 9, 2009 the BBC reported that
the ship had been freed after a ransom of US$3 million had been paid. (BBC News:
Saudi tanker freed off Somalia). This attack showed that Somali pirates were
operating in an area of over 2.8 million square kilometers, an area larger than
international security forces could patrol.
The actors involved in this incident were the ship-owner Vela International Marine,
unidentified Somali pirates, Somali spokesperson Mohamed Said, and British foreign
secretary David Milliband.
Reporting Consequences:
Vela International Marine – private company, no reporting, but the company issued 3
short press release statements during the capture and return of the vessel.
Environment
Oil Spills
Prestige
96
On November 13 2002, the Greek-owned oil tanker Prestige, carrying 77,000 tons of
oil, was caught in a storm northwest of Spain when one of its 12 tanks burst. Fearing
that the vessel would sink and cause a major environmental disaster, the ship’s
captain radioed nearby Spanish rescue workers in hopes of being brought into harbor.
To his distress, local authorities from Spain, Portugal and France all refused harbor
and ordered the ship kept at sea to avoid endangering their coastlines. The integrity of
the single hull on the vessel soon deteriorated and a 12 meter portion broke off,
releasing oil into the open water. On November 19th, the ship split in half and sank
along the coast, releasing 125 tons of oil a day and totaling to over 63,000 tons of
leaked oil, causing the largest recent environmental disaster in the maritime industry.
(source: multiple)
This incident involved a number of actors including the ship-owner Mare Shipping,
Inc. operator Universe Maritime Ltd, and its ship captain Apostolos Mangouras, the
port authorities of Spain, Portugal and France, the classification society ABS who
approved the ship fit for sailing, as well as the WWF who publicized the event, and
indirectly, the EU, US, and the IMO who pursued subsequent legislation to protect
against future spills.
This event caused a series of new laws and regulations including the 2003 EU
Regulation 1726/2003 which accelerated phasing-in of double-hull for single-hull oil
tankers, the 2005 EU Third Maritime Safety Package whose main objective was to
benefit those operators who respected the safety standards, as well as single-hull
vessel bans in the US, Italy, and Spain (Factiva: Italy bans obsolete cargo ships from
its waters) .
It also caused a public outcry among environmentalists, including the WWF who
published a series of reports including the 2003 Report, “The Prestige: One Year On,
A Continuing Disaster”
(http://www.wwf.fi/www/uploads/pdf/Prestige_raportti_marras03.pdf)
Reporting Consequences
Mare Shipping Inc. – a private Liberian company, no reporting.
Universe Maritime Ltd – Greek private company, no reporting.

97
ABS openly reported in their 2003 Annual Report, disavowing allegations against the
company. They claim to have become the scapegoat for Spanish and regional
governments. They stated that in response to the media scrutiny and political criticism,
they “established new standards for transparent and open cooperation with
governments, industry partners and the media.” They do believe that the incident
fueled the industry move to double-hulled vessels. (The trial is still ongoing to this
day).
WWF issued a report on the environmental destruction one year after the event.
Governance
Illegal Dumping of Bilge Water and Oil
MSC Elena
In May 2005, inspectors detained the chief engineer Mani Singh of the MSC Elena
and its crew after discovering a concealed pipe (known as a “magic pipe”) that
bypassed treatment equipment to discharge oil sludge and bilge water directly into the
ocean (Factiva: MSC engineer charged in pollution probe). The US Justice
Department later discovered in a hearing that company officials in Hong Kong told
crew members to lie, and the ship engineers ordered documents destroyed and
concealed. Singh pleaded guilty to making false statements to the Coast Guard,
denying knowledge about the existence and use of the pipe, obstructing justice,
concealing evidence and concealing discharges in a falsified log. He was sentenced to
pay $3,500 in fines (Factiva: ship’s engineer sentences in maritime pollution case)
and sentenced to 2 months in prison (Factiva: prison for MSC engineer in magic pipe
pollution case).
The company that owns the Elena, MSC Ship Management Limited pleaded guilty
and agreed to pay the largest fine ever associated with a single ship’s illegal pollution
at sea – a sum of $10.5 million (Factiva: ship’s engineer sentences in maritime
pollution case).
The actors in this incident include the ship owner MSC Ship Management Limited,
chief engineer Many Singh, the Coast Guard of the state of Massachusetts, the US
Department of Justice.
98
Reporting Consequences
MSC Ship Management Limited – private company, no reporting.
Jane Maersk
In recent years, other carriers had also been charged for bypassing oily-water
separators, including AP Moller Maersk in September 2003 who agreed to pay
$500,000 in a plea bargain in federal court after presenting false records of an oil spill
in San Francisco concerning Vessel Jane Maersk, and Evergreen International in
April 2004 who agreed to pay $15 million in fines and $10 million to environmental
groups after pleading guilty to having bypass equipment aboard seven of its ships
(Factiva: MSC engineer charged in pollution probe).
Reporting Consequences
AP Moller Maersk – no reporting at the time of incident.
Evergreen Marine – no evident reporting at time of incident.
99
Bibliography ACCA and CorporateRegister.com. (2004). “Toward transparency: progress on global
sustainability reporting 2004.” London: ACCA. Online: www.accaglobal.com/pdfs/environment/towards_trans_2004.pdf . Accessed : May 4, 2013.
Adams, Carol, Nongnooch Kuasirikun. (2000). “A comparative analysis of corporate
reporting on ethical issues by UK and German chemical and pharmaceutical companies”. European Accounting Review, Vol. 9, Issue 1. 53-79.
Alphaliner. Top 100 Operated Fleets. Online:
http://www.alphaliner.com/top100/index.php. Accessed : March 10, 2013. Barriball, K. Louise, and Alison While (1994). “Collecting data using a semi-
structured interview: a discussion paper.” Journal of Advanced Nursing. Vol. 19. 328-355.
Bebbington, Jan, Carlos Larrinaga-Gonzalez and Jose M. Moneva-Abadia. (2008).
"Legitimating reputation/the reputation of legitimacy theory", Accounting, Auditing & Accountability Journal. Vol. 21 Issue: 3. 371 - 374
Bryman, Alan and Emma Bell. (2007). Business Research Methods, 3rd Edition.
Oxford: Oxford University Press. 404. BSR. (2010). “Corporate Responsibility Reporting: A View for the Next Cycle. Nine
Key Trends.” Online: http://www.bsr.org/reports/BSR_Corporate_Responsibility_Reporting.pdf. Accessed: April 23, 2013.
Carroll Archie B., Ann K. Buchholtz. (2012). Business & Society: Ethics,
Sustainability and Stakeholder Management. Eighth Edition. Mason: South-Western Cengage Learning.
Carson, Rachel (1962). Silent Spring. Boston: Houghton Mifflin Company. Online:
www.science.smith.edu/~jcardell/Courses/EGR100/.../SilentSpring.pdf . Accessed : April 14th, 2013.
Coady, Lina and Coro Strandberg. (2012). “Corporate Social Responsibility and the
Shipping Industry: A Global Perspective”. Singapore: University of British Columbia and Strandberg Consulting.
Chapple, Wendy, Jeremy Moon. (2005). “Corporate Social Responsibility (CSR) in
Asia”. Business & Society, Col. 44 No. 4. 415-441.
Daub, Claus-Heinrich. (2007). “Assessing the quality of sustainability reporting: an alternative methodological approach”. Journal of Cleaner Production, Vol. 15, Issue 1. 75-85.
100
Deegan, Craig, Michaela Rankin, and John Tobin. (2002). "An examination of the
corporate social and environmental disclosures of BHP from 1983-1997: A test of legitimacy theory". Accounting, Auditing & Accountability Journal. Vol. 15 Issue: 3. 312 - 343
Elo, Satu and Helvi Kyngas. (2008) “The qualitative content analysis process”. Journal of Advanced Nursing, Vol. 62, Issue 1. 107-115. Fafaliou, Irene and Maria Lekakou. (2006). “Is the European shipping industry aware
of corporate social responsibility? The case of the Greek-owned short sea shipping companies.” Marine Policy, Vol. 30, Issue 4. 412-419.
Federal Maritime Commission. Marine Terminal Operators. Online: http://www.fmc.gov/resources/marine_terminal_operators.aspx. Accessed : March 10, 2013.
Fet, AM. (2003). “Sustainability Reporting in Shipping”. Journal of Marine Design
and Operations.11-24.
Flags of Convenience. Wikipedia. Online: http://en.wikipedia.org/wiki/Flag_of_convenience#cite_note-review-28. Accessed: March 16, 2013.
Fonseco, Alberto. (2010). Requirements and Barriers to Strengthening Sustainability
Reporting among Mining Corporations. Thesis for Doctor in Philosophy in Geography. Ontario: University of Waterloo.
Friedman, Milton. (1970). “The Social Responsibility of Business is to Increase its
Profits”. The New York Times Magazine, September 13, 1970. The New York Times Company.
Giannarakis, Grigoris, Nikolaus Sariannidis, Nikolaus Litinas. (2011). “An Analysis of Corporate Social Responsibility in the Greek Telecommunications Sector”. Global Business and Organizational Excellence.
Global Reporting Initiative: Sustainability Disclosure Database. http://database.globalreporting.org/. Accessed April 27, 2013.
Gorgon, R.L. (1975). Interviewing: Strategy, Techniques and Tactics. Dorsey Press,
Illinois. Gray, R., D Walters, J Bebbington, and I Thompson. (1995). “The greening of
enterprise: an exploration of the (non) role of environmental accounting and environmental accountants in organizational change” Critical Perspectives on Accounting, Vol. 6, No. 3. 211-39.
GRI. G3.1 Guidelines Introduction. Online: https://www.globalreporting.org/reporting/latest-guidelines/g3-1-guidelines/Pages/default.aspx. Accessed April 28th, 2013.
101
GRI. GRI Sustainability Reporting Guidelines. (2006). Version 3.1. Online:
https://www.globalreporting.org/reporting/latest-guidelines/g3-1-guidelines/Pages/default.aspx. Accessed April 28th, 2013.
Guthrie, James, Suresh Cuganesan, and Leanne Ward. (2008). “Industry specific social and environmental reporting: The Australian Food and Beverage Industry.” Accounting Forum. 1-15.
Hackstone, D, M. Milne. (1995). “Some Determinants of Social and Environmental Disclosures in New Zealand Companies“, Accounting, Auditing and Accountability Journal, Vol. 9, Issue 1. 77-108.
Hedberg, Carl-Johan, Frederik von Malmborg. (2003). “The Global Reporting
Initiative and corporate sustainability reporting in Swedish companies”. Corporate Social Responsibility and Environmental Management, Volume 10, Issue 3. 153–164.
Heiberg, Hans Oust. (2012). The Global Enabling Trade Report 2012: Reducing
Supply Chain Barriers. Chapter 1.8: The Merchant Fleet: A Facilitator of World Trade. World Economic Forum. 107-112.
Ho, L.-C., M.E. Taylor. (2007). “An Empirical Analysis of Triple Bottom-Line Reporting and its Determinants: Evidence from the United States and Japan”, Journal of International Financial Management and Accounting, Vol. 18, Issue 2. 123-150.
Holland, L, Y.B. Foo. (2003). “Differences in Environmental Reporting Practices in
the UK and the US: The Legal and Regulatory Context”, The British Accounting Review, Vol. 35, Issue 1. 81-93.
IIRC. About: Why Do We Need the IIRC. http://www.theiirc.org/about/aboutwhy-do-we-need-the-iirc/. Accessed: April 15, 2013. IMO. Brief History of IMO. Online:
http://www.imo.org/About/HistoryOfIMO/Pages/Default.aspx. Accessed: March 17, 2013.
International Confederation of Free Trade Unions. (2002): More Troubled Waters: Fishing, Pollution and FOCs. 7.
Investopedia. Beneficial Owner Definition. Online:
http://www.investopedia.com/terms/b/beneficialowner.asp. Accessed: February 18th, 2013.
ISO. ISO26000 Standard. Online:
http://www.iso.org/iso/home/standards/iso26000.htm. Accessed April 28th, 2013.
ITF Global. Flags of Convenience Countries. Online:
102
http://www.itfglobal.org/flags-convenience/flags-convenien-183.cfm. Accessed: March 17, 2013.
Jenkins, Heledd, and Natalia Yakovleva. (2004). “Corporate social responsibility in the mining industry: Exploring trends in social and environmental disclosure.” Journal of Cleaner Production. 271-284.
Kolk, A. (2004). “A decade of sustainability reporting: developments and significance.” International Journal of Environment and Sustainable Development, Volume 3, No. 1. 51-64.
Kolk, A. (2005). “Environmental Reporting by Multinationals from the Triad: Convergence or Divergence”, Management International Review, Special Issue. Vol. 45. 145-166.
Lehmköster, Jan. (2010). World Ocean Review: Living with the Oceans. Maribus. 164-175.
KPMG. (2011). “KPMG International Survey of Corporate Responsibility Reporting 2011”. Online: http://www.kpmg.com/global/en/issuesandinsights/articlespublications/corporate-responsibility/pages/2011-survey.aspx. Accessed: April 15th, 2013.
Lloyd’s List. Lloyd’s List Top 100: Classification. Online: http://www.lloydslist.com/ll/news/top100/classification/;jsessionid=91FAECDAB3089918613DF6E692CCC07F. Accessed: March 31, 2013.
Lloyd’s List. Lloyd’s List Top 100: Finance. Online: http://www.lloydslist.com/ll/news/top100/finance/;jsessionid=3F956A4D979641B26F960C1B6683D525. Accessed: March 31, 2013. Mak, B.L.M., W.W.H. Chan, K. Wong, C. Zheng. (2007). “Comparative Studies of
Standalone Environmental Reports – European and Asian Airlines”. Transportation Research Part D, Vol. 12. 45-52.
McGuire, Chad and Helen Perivier. (2011). “The Nonexistence of Sustainability in International Maritime Shipping: Issues for Consideration”. Journal of Sustainable Development, Vol 4, No. 1.
Moneva, Jose, Fernando Llena. (2000). “Environmental disclosures in the annual
reports of large companies in Spain”. The European Accounting Review, 9:1. 7-29.
Morris, Jonathan and Farid Baddache. (2012a). “Back to Basics: How to Make Stakeholder Engagement Meaningful for Your Company”. BSR.
Morris, Jonathan and Farid Baddache. (2012b). “The Five W’s of France’s CSR
Reporting Law”. BSR. 2-3. National Resources Defense Council. The Story of Silent Spring. Online:
103
http://www.nrdc.org/health/pesticides/hcarson.asp. Accessed: April 15th, 2013.
Nottebottom, Theo. (2008) “The relationship between seaports and the inter-modal hinterland in light of global supply chains.” Discussion Paper 2008:10: University of Antwerp. 7.
O’Donovan, Gary. (2002). “Environmental disclosures in the annual report:
Extending the applicability and predictive power of legitimacy theory". Accounting, Auditing & Accountability Journal. Vol. 15 Issue: 3. 344 – 371
OECD. OECD Guidelines for Multinational Enterprises. Online:
http://www.oecd.org/daf/inv/mne/oecdguidelinesformultinationalenterprises.htm. Accessed April 28th, 2013.
OECD. (2003). “Ownership and Control of Ships”. Directorate for Science,
Technology and Industry. Maritime Transport Committee .3. Pinnock, Fritz and Ibrahim Ajagunna. (2012). The Caribbean Maritime
Transportation Sector: Achieving Sustainability through Efficiency.” The Caribbean Papers. The Centre for International Governance Innovation.
Perez, Fabiana, Luis E. Sanchez. (2009). “Assessing the Evolution of Sustainability
Reporting in the Mining Sector”. Environmental Management, Vol. 43, Issue 6. 949 – 961.
Petereit, Annekatrin. (2008). Sustainability Reporting of the Forest and Paper Sector.
Recommendations for improvements of corporate responsibility reports of forest and paper companies based on quality assessments. Masters thesis. Alnarp: Swedish University of Agricultural Sciences.
Rasche, A. (2012). The United Nations and Transnational Corporations: How the UN
Global Compact Has Changed the Debate, in: Lawrence, J./Beamish, P. (eds.) Globally Responsible Leadership: Business According to the UN Global Compact. Thousand Oaks: Sage. 33-49.
Rodrigue, Jean-Paul. The Geography of Transport Systems. Third Edition. New York:
Routledge. http://people.hofstra.edu/geotrans/eng/ch3en/conc3en/ch3c4en.html. Accessed : March 9, 2013.
SASB. Why is it Important? The Definition of Materiality. Online: http://www.sasb.org/materiality/important/. Accessed: April 15th, 2013.
Saunders, Mark N.K., Philip Lewis, Adrian Thornhill. (2009). Research Methods for
Business Students, Fifth Edition. London: Pearson Education Limited. Schaltegger, S., R. Burritt, H. Petersen. (2003). An Introduction to Corporate
Environmental Management: Striving for Sustainability. Greenleaf Publishing Limited, Sheffield.
104
UNCTAD. (2012). “Review of Maritime Transport 2012.” Online: unctad.org/en/PublicationsLibrary/rmt2012_en.pdf. Accessed : March 20th, 2013.
UNEP, Sustainability, Standard & Poor’s. (2006). “Tomorrow’s Value. The Global
Reporters 2006 Survey of Corporate Sustainability Reporting.”, Online: http://www.sustainability.com/downloads_public/insight_reports/tomorrowsvalue.pdf (02.07.2007)
United Nations. (2000a). “United Nations Millennium Declaration”, online:
http://www.un.org/millennium/. Accessed: April 10th, 2013. United Nations. (2002b). “The Johannesburg Declaration on Sustainable
Development”, Online: www.un.org/jsummit/html/documents/summit_docs/0409_l6rev2_pol_decl.pdf. Accessed: April 10th, 2013.
United Nations. (2005). “Resolution adopted by the General Assembly. 60/1. 2005
World Summit Outcome”, online: http://daccessdds.un.org/doc/UNDOC/GEN/N05/487/60/PDF/ N0548760.pdf?OpenElement. Accessed: April 10th, 2013.
United Nations. (2012). “The Future We Want”, online:
http://www.un.org/en/sustainablefuture/. Accessed: April 10th, 2013. United Nations. (1987). “Our Common Future. Report of the World Commission of
Environment and Development” (Brundtland Report). Online: http://www.are.admin.ch/ themen/nachhaltig/00266/00540/00542/index.html?lang=en. Accessed: April 10th, 2013.
Vormedal, Irja, Audun Ruud. (2009). “Sustainability reporting in Norway – an
assessment of performance in the context of legal demands and socio-political drivers”. Business Strategy & the Environment, Vol. 18 Issue 4. 207-222.
Wegener, Matt, Fayez A.Elayan, Sandra Felton, Jingyu Li. (2013). “Factors
Influencing Corporate Environmental Disclosures”. Accounting Perspectives, Vol. 12 No. 1.
Van Wijk, J, Winifried Persoon. (2006). “A Long-haul Destination: Sustainability
Reporting Among Tour-Operators”. European Management Journal, Vol. 24. Issue 6. 381-395.
World Shipping Council. (2013). About The Industry. Online:
http://www.worldshipping.org/about-the-industry/history-of-containerization/industry-globalization. Accessed : March 9, 2013.
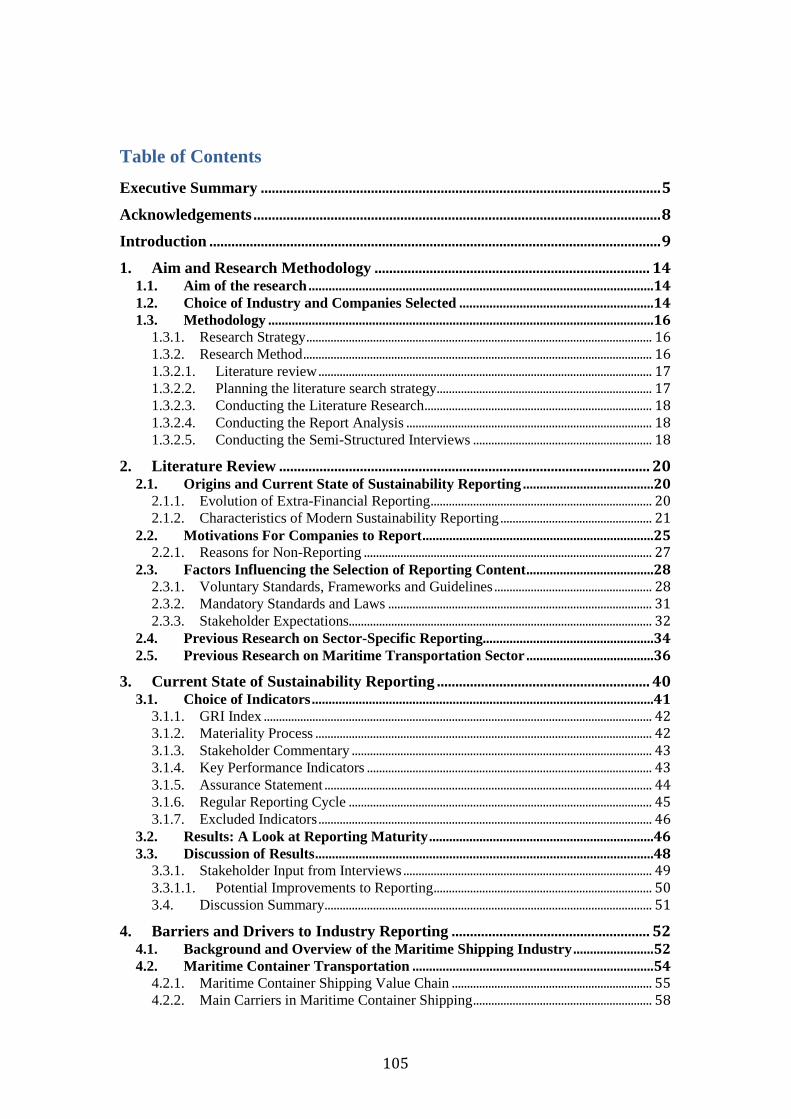
105
Table of Contents
Executive Summary ............................................................................................................. 5
Acknowledgements ............................................................................................................... 8
Introduction ........................................................................................................................... 9
1. Aim and Research Methodology ........................................................................... 14
1.1. Aim of the research .......................................................................................................14
1.2. Choice of Industry and Companies Selected ..........................................................14
1.3. Methodology ...................................................................................................................16
1.3.1. Research Strategy .................................................................................................................. 16
1.3.2. Research Method ................................................................................................................... 16
1.3.2.1. Literature review .............................................................................................................. 17
1.3.2.2. Planning the literature search strategy ....................................................................... 17
1.3.2.3. Conducting the Literature Research ........................................................................... 18
1.3.2.4. Conducting the Report Analysis ................................................................................. 18
1.3.2.5. Conducting the Semi-Structured Interviews ........................................................... 18
2. Literature Review ..................................................................................................... 20
2.1. Origins and Current State of Sustainability Reporting .......................................20
2.1.1. Evolution of Extra-Financial Reporting ......................................................................... 20
2.1.2. Characteristics of Modern Sustainability Reporting .................................................. 21
2.2. Motivations For Companies to Report .....................................................................25 2.2.1. Reasons for Non-Reporting ............................................................................................... 27
2.3. Factors Influencing the Selection of Reporting Content ......................................28
2.3.1. Voluntary Standards, Frameworks and Guidelines .................................................... 28
2.3.2. Mandatory Standards and Laws ....................................................................................... 31
2.3.3. Stakeholder Expectations .................................................................................................... 32
2.4. Previous Research on Sector-Specific Reporting...................................................34
2.5. Previous Research on Maritime Transportation Sector ......................................36
3. Current State of Sustainability Reporting .......................................................... 40
3.1. Choice of Indicators ......................................................................................................41
3.1.1. GRI Index ................................................................................................................................ 42
3.1.2. Materiality Process ............................................................................................................... 42
3.1.3. Stakeholder Commentary ................................................................................................... 43
3.1.4. Key Performance Indicators .............................................................................................. 43
3.1.5. Assurance Statement ............................................................................................................ 44
3.1.6. Regular Reporting Cycle .................................................................................................... 45
3.1.7. Excluded Indicators .............................................................................................................. 46
3.2. Results: A Look at Reporting Maturity ...................................................................46
3.3. Discussion of Results .....................................................................................................48 3.3.1. Stakeholder Input from Interviews .................................................................................. 49
3.3.1.1. Potential Improvements to Reporting ........................................................................ 50
3.4. Discussion Summary ............................................................................................................ 51
4. Barriers and Drivers to Industry Reporting ...................................................... 52
4.1. Background and Overview of the Maritime Shipping Industry ........................52
4.2. Maritime Container Transportation ........................................................................54
4.2.1. Maritime Container Shipping Value Chain .................................................................. 55
4.2.2. Main Carriers in Maritime Container Shipping ........................................................... 58
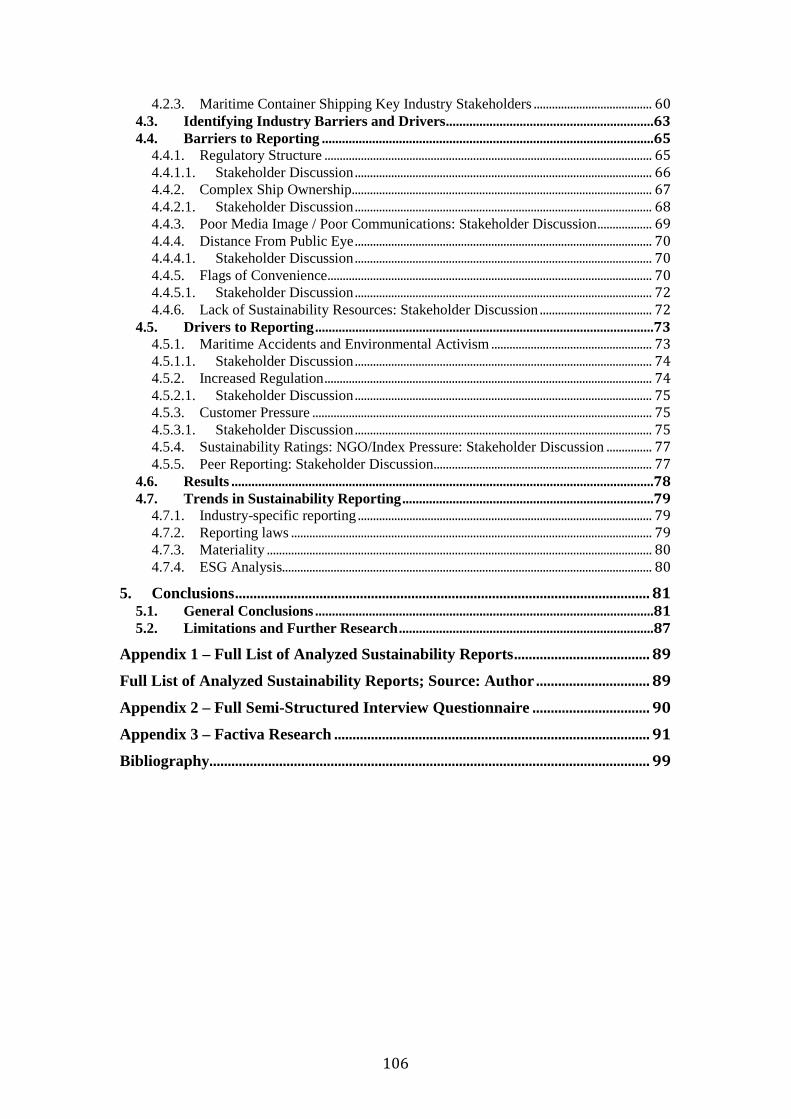
106
4.2.3. Maritime Container Shipping Key Industry Stakeholders ....................................... 60
4.3. Identifying Industry Barriers and Drivers ..............................................................63
4.4. Barriers to Reporting ...................................................................................................65 4.4.1. Regulatory Structure ............................................................................................................ 65
4.4.1.1. Stakeholder Discussion .................................................................................................. 66
4.4.2. Complex Ship Ownership ................................................................................................... 67
4.4.2.1. Stakeholder Discussion .................................................................................................. 68
4.4.3. Poor Media Image / Poor Communications: Stakeholder Discussion .................. 69
4.4.4. Distance From Public Eye .................................................................................................. 70
4.4.4.1. Stakeholder Discussion .................................................................................................. 70
4.4.5. Flags of Convenience ........................................................................................................... 70
4.4.5.1. Stakeholder Discussion .................................................................................................. 72
4.4.6. Lack of Sustainability Resources: Stakeholder Discussion ..................................... 72
4.5. Drivers to Reporting .....................................................................................................73
4.5.1. Maritime Accidents and Environmental Activism ..................................................... 73
4.5.1.1. Stakeholder Discussion .................................................................................................. 74
4.5.2. Increased Regulation ............................................................................................................ 74
4.5.2.1. Stakeholder Discussion .................................................................................................. 75
4.5.3. Customer Pressure ................................................................................................................ 75
4.5.3.1. Stakeholder Discussion .................................................................................................. 75
4.5.4. Sustainability Ratings: NGO/Index Pressure: Stakeholder Discussion ............... 77
4.5.5. Peer Reporting: Stakeholder Discussion ........................................................................ 77
4.6. Results ..............................................................................................................................78
4.7. Trends in Sustainability Reporting ...........................................................................79 4.7.1. Industry-specific reporting ................................................................................................. 79
4.7.2. Reporting laws ....................................................................................................................... 79
4.7.3. Materiality ............................................................................................................................... 80
4.7.4. ESG Analysis.......................................................................................................................... 80
5. Conclusions ................................................................................................................. 81
5.1. General Conclusions .....................................................................................................81
5.2. Limitations and Further Research ............................................................................87
Appendix 1 – Full List of Analyzed Sustainability Reports ..................................... 89
Full List of Analyzed Sustainability Reports; Source: Author ............................... 89
Appendix 2 – Full Semi-Structured Interview Questionnaire ................................ 90
Appendix 3 – Factiva Research ...................................................................................... 91
Bibliography ........................................................................................................................ 99
107
Table of Tables Table 1: Carrier Size and Geography; Source: Elaborated by Author……….16 Table 2: Research Parameters; Source: Elaborated by Author……………….17 Table 3: Interviewed Stakeholders; Source: Author……………………............19 Table 4: Container Carriers by size and reporting practice; Source:
Author/Alphali ………………...………………………………...……………..41 Table 5: Maturity of Top 12 Carrier Reports; Source: Author ………………..47 Table 6: Top 30 Container Carriers by TEU. Source : Alphaliner….………..59 Table 7: Full list of Potential Barriers and Drivers. Source: Author…….…..64 Table 8: Short List of Barriers and Drivers. Source: Author …………………..65 Table 9: Resulting Barriers and Drivers. Source: Author……………………….78 Table of Figures Figure 1: Abbreviated Interview Guide; Source: Author……………….…...20 Figure 2: National Voluntary and Mandatory Reporting Laws; Source: Morris,
BSR………………………………………...………………………………......32 Figure 3: Global merchant fleet; capacity growth in million dwt. Source:
Lehmköster 2010………………………………...…………..........................53 Figure 4: Global shipping density; revealing trade lanes. Source: Rodrigue ...... 54 Figure 5: Maritime container industry supply chain, noting commercial
relationships. Source: Supply chain graphic from DAMCO; Commercial relationships elaborated by author................................................................... 55
Figure 6: Maritime container ship lifecycle. Source: Elaborated by author. ...... 57 Figure 7: Top 11 Flags of Convenience; Source: Wikipedia……………………72 Figure 8: Key Barriers and Drivers to Sustainability Reporting; Source:
Author ……...………………………………...………………………………81