Sustainability Report - Mziq
108
GRUPO Sustainability Report 2020
-
Upload
khangminh22 -
Category
Documents
-
view
1 -
download
0
Transcript of Sustainability Report - Mziq

G R U P O
Sustainability Report
2020

Contents
6 GRI Standards
Content Index
Page 59
Credits
Page 64Attachments 3 Outlook
Page 22
Operational
Page 23
Financial
Page 27
Performance
5Environmental Responsibility2 Profile
Page 08
Corporate
Governance
Page 12
Ethics
Page 15
Measures
against Covid-19
Page 18
About Equatorial Energia
1 About the
Report
Page 04
Message
from the CEO
Page 05
Introduction 4 Employees
Page 29
Suppliers
Page 37
Customers
Page 40
Society
Page 43
Community
Page 45
Value Relations
Environmental
Management
Page 51
Eco-efficiency
Page 53
Sustainability Report • 2020
2Introduction About Equatorial Energia Performance Value Relations Environmental Responsibility Attachments

1Introduction

About the ReportWelcome to the 5th Sustainability Report of Equatorial Energia Group. In this publication,
you will find information about the Group’s companies, with an overview of their value
creation for the society. In this Report, we also share our operations’ performance and
impact within the period from January 1st to December 31st, 2020.
Along the content, we are committed to reiterating our commitment to transparency
and best reporting practices. For this purpose, this publication is based on the widely
recognized international reporting guideline, the Global Reporting Initiative (GRI), with
adherence to the Core.
MaterialityIn 2020, we updated our materiality study to identify the most relevant topics for our
business model in the context of the industry and external scenarios. Besides the
research carried out by a benchmarking process, we consulted our stakeholders by
means of an online questionnaire.
The survey was taken by employees, suppliers, public authorities, class associations
and legal representatives, who contributed with their answers. The steps were then
consolidated and aligned with the leadership’s vision, resulting in the list of material
topics for Equatorial.
GRI 102-40 | 102-42 | 102-43 | 102-44 | 102-46 | 102-47
Material topics
• Health and safety of employees and service providers;• Quality of services provided;• Ethics;• Reduction of greenhouse gas emissions;• Business Model Innovation;• Community development;• Talent retention and development;• Safety of clients and society;• Respect for labor legislation;• Preservation of biodiversity.
Sustainability Report • 2020
4About Equatorial Energia Performance Value Relations Environmental Responsibility AttachmentsIntroduction
Message from the CEOThe year 2020 was an extremely challenging year for
everyone. At Equatorial Energia, we had a positive start to
the year with the victories and growth achieved in 2019,
until the official announcement of the pandemic in March.
The pandemic, in turn, generated transformations in all
spheres of society and demanded a lot of care from us
regarding the prevention of the disease and attention to
the sudden changes we had to make in the company’s
actions and strategies.
In critical times like the ones we are going through, being
supportive and empathetic is crucial. For this reason, the
Group has promoted several actions and attitudes for
the well-being of society. Among these measures, we
highlight the implementation of the contingency system
for essential services, the home office system in all activities
suitable for such, and a series of measures to preserve our
workforce, as well as the restriction for some field activities.
We understand our relevant social role in the locations
where we operate. In partnership with the public
authorities of the states of Pará, Maranhão, Piauí, and
Alagoas, Equatorial Group has joined the initiatives to
contribute to the most vulnerable communities and those
most affected by the new coronavirus pandemic.
We did and continue to do this through the donation of
medical and hospital equipment, tons of food, and hygiene
material items, which were distributed to institutions and
families in order of priority, demand, and service needs.
Our donations exceeded R$10 million and we will continue
to work actively to support both those close to us and the
whole country to come out of this crisis stronger.
As always, our culture of excellence, respect and safety,
ensured the resilience and perseverance of all our
employees. We reinforced and strengthened our values
and purpose in the Group companies, which reflected in
the positive results during a year full of uncertainties.
Our solidarity actions have contributed to minimize the impacts of the pandemic on people’s health and lives.
With life increasingly online and changing habits,
some major milestones in 2020 were undoubtedly the
innovation of remote service and digital transformation.
Besides our website, which consolidated itself as an
important customer service channel, encompassing
the main services offered in the face-to-face service,
with a simple and functional layout, we also had
the consolidation of the application and the service
provided by Clara, our artificial intelligence, via
WhatsApp.
GRI 102-14 | 102-10
Sustainability Report • 2020
5About Equatorial Energia Performance Value Relations Environmental Responsibility AttachmentsIntroduction

The App proposes to be light, offering the services of
Notification of a Power Outage, 2nd copy of the bill, and
Payment Code, as well as directing to other services
on the website. Clara, on the other hand, has become
the first (and common) service option for countless
customers in the different states. Besides offering
simpler and faster service, it guarantees greater
closeness to the user.
Our mission is to improve people’s lives, doing everything we know with the highest level of excellence and acting with synergic business fronts.
Despite the pandemic scenario, 2020 was a year that
signaled another important step in the growth of
Equatorial Energia Group.
In distribution, we had several challenges, but we
managed to close with a 3.8% growth over the energy
sold. In the new distributors, we had the approval of the
Extraordinary Tariff Review in Alagoas in May and in Piauí
in December, an important step in the value creation
process of these assets.
Since the beginning of Equatorial Transmissão’s projects
in 2017, approximately R$ 5 billion have already been
invested. We have decelerated investments compared
to the same period of the previous year, which shows
that we are already in the final phase of implementation
of transmission projects and, in general, significantly
ahead of the regulatory deadlines for project execution.
In the distribution segment, there was an acceleration
of investments in practically all the distributors, despite
the pandemic, totaling R$1.8 billion, considering the
use of own resources and the investment in the Luz
Para Todos Program. This total investment volume is
aimed at expanding and maintaining the networks,
improving the quality of supply, universalizing access to
the electricity grid and the interconnection of isolated
systems in Pará.
This high investment level allowed Equatorial
Maranhão and Equatorial Pará to maintain their
quality indicators Equivalent Interruption Duration
per Consumer Unit (DEC) and Equivalent Interruption
Frequency per Consumer Unit (FEC) substantially
better than the regulatory targets, reaching 13.4 hours
and 5.9 times in Maranhão, and 20.2 hours and 10.8
times in Pará.
In the National Agency of Electrical Energy (ANEEL) Service
Continuity Ranking, which measures the quality of energy
supply against regulatory limits, Equatorial Pará was the
2nd best company in the country in 2020, while Maranhão
ranked 8th, among concessionaires with more than 400
thousand consumers.
From the financial perspective, we continue to show
stability in our results, as well as security from the
liquidity point of view, ending the year with R$7.7 billion
in consolidated cash.
On the following pages, you will find further details
about our operations, our people, and the victories
achieved, as well as the challenges overcoming that
2020 brought.
Enjoy your reading!
Augusto Miranda President of Equatorial Energia
Sustainability Report • 2020
6About Equatorial Energia Performance Value Relations Environmental Responsibility AttachmentsIntroduction
2About Equatorial Energia

Mission
Ensure excellence in asset management, with
quality and profitability, contributing to the
continuous growth of the business and social
development.
ProfileEquatorial Energia S.A. is a holding company with
operations in the electricity sector. The Group is
headquartered in Brasilia (DF), and is focused on the areas
of distribution, transmission, generation and services (sale
of energy and telecommunications).
With ten high performance companies and solid
results, the Equatorial Energia Group has been working
continuously for the evolution of the acquired
companies, ensuring their operational excellence.
The Group’s companies are: Equatorial Maranhão,
Equatorial Pará, Equatorial Piauí, Equatorial Alagoas,
Geramar, Equatorial Transmissão, Intesa, Equatorial
Telecom, Sol Energias and 55 Soluções. Currently, we
serve about 10% of the total Brazilian consumers and account for 6.5% of the distribution market in
the national territory.
* Photo taken before the Covid-19 pandemic.
GRI 102-1 | 102-2 | 102-3 | 102-4 | 102-5 | 102-6 | 102-7
Vision
To be a world reference in operational excellence
and profitability in the energy and utilities sector.
Values
• Focus on People
• Emphasis on meritocracy
• Ethics and Sustainability
• Safety
• Efficient Capital Allocation
• Obstinacy for Profit
• Transparency
Sustainability Report • 2020
8Introduction Performance Value Relations Environmental Responsibility AttachmentsAbout Equatorial Energia
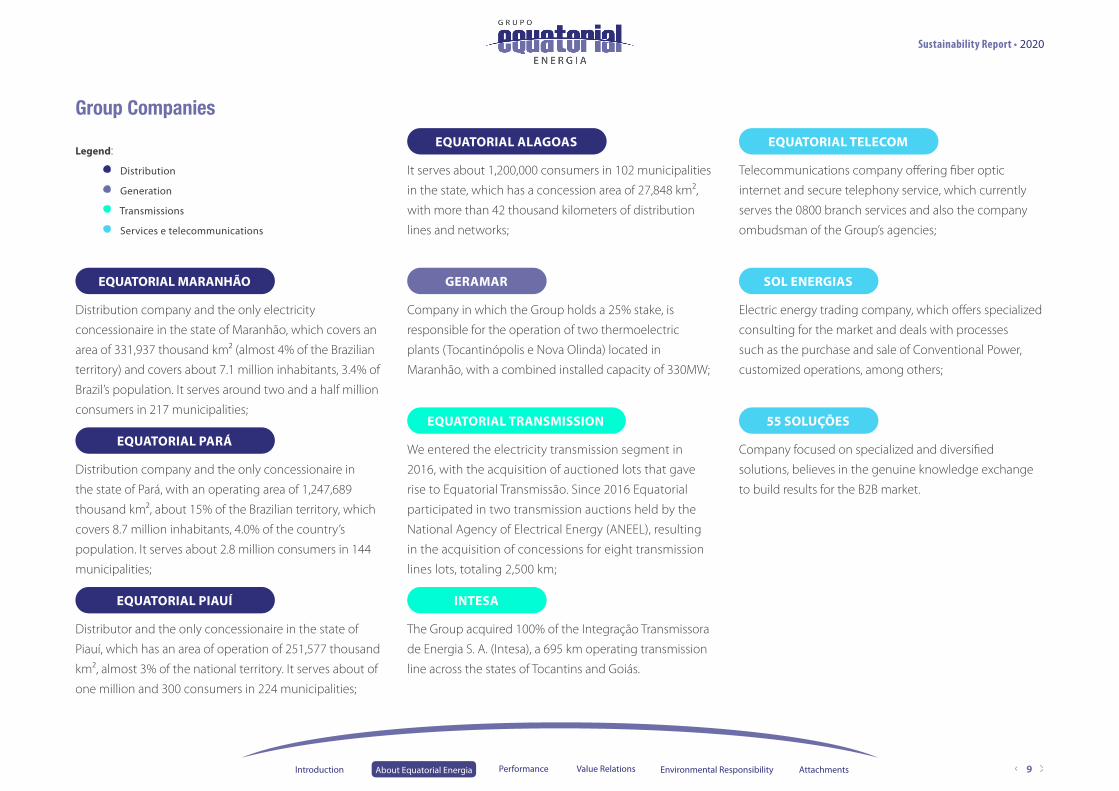
Group Companies
Legend:
Distribution
Generation
Transmissions
Services e telecommunications
EQUATORIAL MARANHÃO
Distribution company and the only electricity
concessionaire in the state of Maranhão, which covers an
area of 331,937 thousand km² (almost 4% of the Brazilian
territory) and covers about 7.1 million inhabitants, 3.4% of
Brazil’s population. It serves around two and a half million
consumers in 217 municipalities;
EQUATORIAL PARÁ
Distribution company and the only concessionaire in
the state of Pará, with an operating area of 1,247,689
thousand km², about 15% of the Brazilian territory, which
covers 8.7 million inhabitants, 4.0% of the country’s
population. It serves about 2.8 million consumers in 144
municipalities;
EQUATORIAL PIAUÍ
Distributor and the only concessionaire in the state of
Piauí, which has an area of operation of 251,577 thousand
km², almost 3% of the national territory. It serves about of
one million and 300 consumers in 224 municipalities;
EQUATORIAL ALAGOAS
It serves about 1,200,000 consumers in 102 municipalities
in the state, which has a concession area of 27,848 km²,
with more than 42 thousand kilometers of distribution
lines and networks;
GERAMAR
Company in which the Group holds a 25% stake, is
responsible for the operation of two thermoelectric
plants (Tocantinópolis e Nova Olinda) located in
Maranhão, with a combined installed capacity of 330MW;
EQUATORIAL TRANSMISSION
We entered the electricity transmission segment in
2016, with the acquisition of auctioned lots that gave
rise to Equatorial Transmissão. Since 2016 Equatorial
participated in two transmission auctions held by the
National Agency of Electrical Energy (ANEEL), resulting
in the acquisition of concessions for eight transmission
lines lots, totaling 2,500 km;
INTESA
The Group acquired 100% of the Integração Transmissora
de Energia S. A. (Intesa), a 695 km operating transmission
line across the states of Tocantins and Goiás.
EQUATORIAL TELECOM
Telecommunications company offering fiber optic
internet and secure telephony service, which currently
serves the 0800 branch services and also the company
ombudsman of the Group’s agencies;
SOL ENERGIAS
Electric energy trading company, which offers specialized
consulting for the market and deals with processes
such as the purchase and sale of Conventional Power,
customized operations, among others;
55 SOLUÇÕES
Company focused on specialized and diversified
solutions, believes in the genuine knowledge exchange
to build results for the B2B market.
Sustainability Report • 2020
9Introduction Performance Value Relations Environmental Responsibility AttachmentsAbout Equatorial Energia

Operations overviewEquatorial Energia Pará
Equatorial Energia Maranhão
Equatorial Energia Piauí
Equatorial Energia Alagoas
Equatorial Group operation area
Legend:
Headquarters of other Group Companies:
Grupo Equatorial (DF)
Equatorial Transmissão (DF)
55 Soluções (PA/MA)
Equatorial, TELECOM (MA)
EQTPREV (PA/MA)
Equatorial Transmissão Working Sites
Population of the states
687 Municipalities
21,2 Million
7,4 MillionCustomers
Extension of the states1.859.234 km2
Sustainability Report • 2020
10Introduction Performance Value Relations Environmental Responsibility AttachmentsAbout Equatorial Energia

Distribuition
Generation
Transmission
energy distributed.
of installed capacity.
of Transmission Lines (LTs).
which represent an increase of 110% in TLs extension.
customers
of assured energy.
22,354 GWh
322 MW
3,281 Km
7.7 million
240 MW
12 subestations
Concession area (Km2)
Municipalities (UN.)
Consumers (Million)
Network extension (Km)
Maranhão 332,000 217 2.5 123,033
Pará 1,248,000 144 2.7 121,512
Piauí 251,000 244 1.3 91,765
Alagoas 28,000 102 1.1 47,788
In 2020, we have consolidated the Group’s national performance with a common and unified visual identity.
With the brand’s evolution, the companies embarked on a phased process to transform its visual identity into all
products, in both physical and virtual environments.
Sustainability Report • 2020
11Introduction Performance Value Relations Environmental Responsibility AttachmentsAbout Equatorial Energia

Corporate GovernanceEquatorial Energia is committed to transparent
management, in line with the best market
practices. Listed at B3’s highest level of Corporate
Governance, the Novo Mercado, the Company
understands the primary role of maintaining
a dynamic and attentive management for
continuous improvements, which values the
close relationship with its stakeholders and
the operational excellence of all the group
companies.
Equatorial Energia is a corporation, a group with
pulverized control. In other words, there is no
controlling shareholder or controlling block in
these companies.
Legend:
Distribuition
Transmission
Others
GRI 102-7 | 102-18 | 102-26
94.5% 100% 25%
96.4% 100% 100%
51%90.1%
58.7%
87%
G R U P O
Geramar
55 SoluçõesEquatorial Alagoas
Equatorial Distribuição
Equatorial Piauí
Equatorial Transmissão
INTESA
Sol Energias
Equatorial Maranhão
Equatorial Pará
Sustainability Report • 2020
12Introduction Performance Value Relations Environmental Responsibility AttachmentsAbout Equatorial Energia

Structure
Regulation, and New Business
Tinn Amado
Financial and IRLeonardo Lucas
People and Management
Shared Services CenterHumberto Nogueira
DistributionSérvio Túlio
Transmission and Other Business
Joseph Zwecker
Board of Directors
CEOCEO
Legal and ComplianceJosé Sobral
Board of Directors (BD): is the Group’s collegiate deliberative body, responsible for
elaborating the strategic planning of the business and establishing policies. In these
activities, the various aspects that encompass the business are considered, including socio-
environmental and economic aspects. The BD meetings are held whenever necessary,
when called by the president of the body or by the majority of its members.
Board of Executive Officers: formed by legal representatives, responsible for the day-to-
day management of the Company and for the implementation of the general policies and
guidelines established by the Board of Directors.
Age group of governance bodies Between 30 and 50 years old Over 50 years old
Board of Directors 62.5% 37.5%
Board of Executive Officers 50% 50%
Fiscal Council 30% 70%
EQTL Maranhão Augusto Dantas
EQTL Pará Marcos Almeida
EQTL Alagoas Humberto Soares
EQTL Piauí Maurício Velloso
Sustainability Report • 2020
13Introduction Performance Value Relations Environmental Responsibility AttachmentsAbout Equatorial Energia

Risk Management
At Equatorial Energia, risk management is inherent to the businesses of the companies,
aiming at forecasting and anticipating possible impacts of factors external to the
performance and reputation of its controlled companies.
The Company monitors the efficiency of internal controls through the Corporate Audit
Management and Risk Management and Internal Controls department. Internal Audit
selects, develops and conducts continuous assessments to ensure the effectiveness
of internal control mechanisms, while the Audit Committee oversees internal control
development and performance.
We operate on three defense fronts aimed at preventing, detecting and remedying fraud,
in accordance with rules and regulations for administrative, operational and financial
processes, which are periodically reviewed by risk analysts and quality consultants.
We implemented an Internal Controls and Risks department for the continuous
improvement of risk management practices, protecting the Group from possible risks
in line with its strategy, processes and assets. With this structuring of the Company’s risk
management, the Risk Management and Internal Controls department will be responsible
for evaluating and monitoring risk exposures, supporting the Audit Committee with
information, constantly feeding back the records of losses that happen in the Company.
* Photo taken before the Covid-19 pandemic.
Sustainability Report • 2020
14Introduction Performance Value Relations Environmental Responsibility AttachmentsAbout Equatorial Energia

EthicsEthics and transparency are the pillars that underpin all
Equatorial Group business relationships and operation.
We have a Code of Ethics and Conduct establishing rules
for the performance of all employees, in line with the
Company’s principles and values, in addition to defining
procedures for management policies, conflicts of interest,
corruption and guiding the way in which relationships
with all stakeholders must be conducted. The Group also
has a Supplier Code of Ethics, which sets the standards for
Equatorial’s supply chain.
Upon their admission, all employees of the Company
participate in an integration meeting, when aspects
of the Code are addressed, and all employees commit
themselves with it. The Internal Audit is the guardian and
responsible for the Code of Ethics dissemination, but
each employee is also responsible for safeguarding such
document.
Subsidiaries also rely on the Ethics Committees,
composed by the president and management. The
committee is responsible for internally monitoring and
disseminating the application of the Code of Conduct,
evaluating cases registered or investigated by the internal
audit and focusing on suggesting internal processes
and controls improvements. It is also the Committee’s
responsibility to determine disciplinary sanctions in
proven misconduct cases.
In 2020, the Company structured its Compliance
department, which has a committee that reports directly
to the Board of Directors. Compliance management aims
to prevent and detect irregularities within all the Group’s
companies, disseminating Equatorial Energia’s Integrity
Program at all levels.
The Program is focused on anti-corruption and compliance
measures, and has nine pillars: Internal Controls, Training
and Communication, Whistleblowing Channels, Code of
Conduct and Compliance Policies, Risk Analysis, Support to
Senior Management, Internal Investigations, Due Diligence
and Monitoring and Auditing.
GRI 102-16 | 103-1 | 103-2 | 103-3
LEARN MORECode of Ethics and Conduct:
www.equatorialenergia.com.br
Whistleblowing Channel:
www.canalconfidencial.com.br/equatorial/* Photo taken before the Covid-19 pandemic.
Sustainability Report • 2020
15Introduction Performance Value Relations Environmental Responsibility AttachmentsAbout Equatorial Energia

Fight Against Corruption Integrity Program
In 2020, the Logistics and Supply Management, External Communication, Marketing
and Sustainability, Planning and General Infrastructure Management departments
underwent a risk assessment related to corruption.
Four significant risks were mapped, among which three involved the lack of a
reputational analysis and evaluation procedure for service and material suppliers,
donations beneficiaries and sponsors, and beneficiaries of research and
development projects and energy efficiency projects, respectively.
The fourth risk is related to inconsistencies in the quotation process and lack of
monitoring and inspection in processes and the supplier’s commitment to the integrity
and anti-corruption requirements demanded by the Company.
This mapping enabled internal development by the plan areas themselves with a series
of actions, including to comply with the Anti-Corruption Law. The entire process is
monitored by means of agreements and action plans, with the application of corrective
measures when necessary.
To address the commitment to ethics in a systematic and structured manner throughout
the business, we rely on the Equatorial Group’s Integrity Program. The Group has the
Program to prevent, detect and respond to inappropriate conduct, in addition to
promoting a culture of ethics that encourages compliance with laws.
In 2020, several initiatives were carried out, among which we highlight the following:
• New Employee Integration Program: Its purpose is to present the Company’s Integrity Program and the Code of Ethics
and Conduct to the new employee, strengthening good practices and fighting
corruption. In 2020, 190 employee underwent this training;
• Monthly Compliance Dialogue: Alignment with the company’s areas, where day-to-day operational and technical
activities are reconciled with the Integrity Program. These conversations cover topics
such as Financial Compliance and Compliance and Digital Security;
• Compliance training for 55 Solutions meter readers: Gamified training on the Niduu online platform, which is able to measure the level
of content absorption by the employee. Through the platform, we made 17 online
courses available during the months of May and June to encourage our employees
in their self-development during the quarantine;
• Internal communication: We have a structure with several campaigns for the Company’s internal public,
carried out in physical spaces, as with posters in the corridors, and in a virtual
environment, with the Mr. Ético channel, which strengthens the recommendations
from the Code of Ethics and Conduct and answer questions from employees.
GRI 205-1 | 205-2 GRI 205-1
Sustainability Report • 2020
16Introduction Performance Value Relations Environmental Responsibility AttachmentsAbout Equatorial Energia

Privacy Program
Structured to meet the determinations of the General Data Protection Act (LGPD),
Equatorial Energia Group’s Privacy Program has pillars that give it a Privacy Governance
structure and comply with legal provisions, with a market leading trend. We highlight the
following advances:
• Technical and intellectual support: support from specialized offices and
consultancies, which underpinned the whole structure of Grupo Equatorial’s Privacy
Program;
• Internal policy: approval of the Protection of Personal Data Internal Policy by the
Board of Directors, a fact that reflects the relevance and level of maturity of our
Governance in Privacy;
• Appointment of the Officer: appointment of Director José Sobral, who chairs the
Privacy Committee, as the Group’ s Data Protection Officer;
• Privacy Governance: we have the Group’s Privacy Governance structure, with
emphasis on the Privacy Committee, responsible for making sensitive decisions for
program improvements;
• Privacy Notice: made available on the website of all Equatorial Energia Group
companies the Privacy and Cookies Notice, in order to safeguard transparency;
• LGPD Hotsite: we have developed an interactive and easy-to-use website that
compiles the main concepts of personal data protection and Equatorial’s conduct
on the subject;
• Data Mapping and Risk Assessment: diagnosis and risk assessment to map the
data handled in the activities developed and the risks arising from them in our
operations, resulting in a risk matrix that meets the specificities of the business
and is able to mitigate or neutralize any non-conformities that would threaten
our operations;
• Endomarketing campaign: with the support of specialized consulting firm,
we developed an internal campaign for awareness and dissemination of the
Privacy Program;
• Customized training: we rely on learning and communication tools to spread the
theme to all employees, such as the Corporate University and customized training
with strategic areas, held periodically by the Compliance and LGPD team.
These and other aspects have been constantly worked on to strengthen our Privacy
Program, ensuring our continued progress and advancement on our perennial Privacy
Governance journey.
Sustainability Report • 2020
17Introduction Performance Value Relations Environmental Responsibility AttachmentsAbout Equatorial Energia

Measures against Covid-19
We have implemented preventive and risk mitigation
measures since the beginning of the global pandemic
declared by the World Health Organization (WHO). We
act in line with the guidelines established by national
and international health authorities, aiming to minimize
impacts to the health and safety of employees, their
families, partners, and communities.
Besides protecting our people, we made donations to
support the population during this time of crisis. In all,
during the pandemic of the new coronavirus, more than
R$10 million were invested in different support fronts
in the four states where the Group operates: Alagoas,
Maranhão, Pará, and Piauí.
Sustainability Report • 2020
18Introduction Performance Value Relations Environmental Responsibility AttachmentsAbout Equatorial Energia

EQUATORIAL MARANHÃO
R$ 503,494.00 in donations to the state government and city halls.
• 300 personal hygiene items;
• 23 healthcare equipment and electronics;
• 25 tons of food.
R$ 340,067.10 for exchanging refrigerators through the energy efficiency program.
EQUATORIAL ALAGOAS
Over R$400 thousand to assist in the construction of a virtual Intensive Care Unit (ICU).
R$ 981,732.50 in donations to the state government:
• R$ 406,828.00 transferred for mobile ICU;
• 300 healthcare equipment items and accessories;
• 100 tons of food.
R$ 1 million to improve the efficiency of the State General Hospital in Maceió (AL).
• We installed a generator for solar energy improvement through the Energy Efficiency Program – PEE ANEEL;
• We allocated R$340,067.10 to the State for the exchange of refrigerators through the energy efficiency program.
EQUATORIAL PIAUÍ
R$ 504,753.67 in donations to the state government, city halls, and social institutions.
• 80 thousand hygiene and cleaning items;
• 700 personal hygiene items;
• 88 tons of food.
R$ 575,000.00 for exchanging refrigerators through the energy efficiency program.
• R$ 5.5 million to field hospitals and mobile ICUs;
• R$ 180 thousand in hygiene and cleaning items;
• 761 pieces of equipment for hospitals;
• 371 tons of food.
EQUATORIAL PARÁ
Maintenance of more than 700 hospital beds in four field hospitals in the cities of Belém, Marabá, Santarém and Breves.
R$ 5,492,803.00 in donations to the state government, municipalities and social institutions:
• R$ 5 million for field hospitals;
• 95 thousand personalhygiene items;
• 110 tons of food.
R$ 7,482,783.17 in direct donations
R$ 3,288,829.05 in energy efficiency actions
R$ 10,771,612.22total donations
Sustainability Report • 2020
19Introduction Performance Value Relations Environmental Responsibility AttachmentsAbout Equatorial Energia

Activities with employees Focus on customers
In March 2020, the internal communication strategies and endomarketing
actions focused on the Together for Prevention Campaign, created
to counter Covid-19. With the dissemination of information in several
formats, such as: internal videos, e-mail marketing, board communications,
guidance via internal communication channels and WhatsApp cards.
The campaign was massively used by the Group to ensure awareness and dissemination
of the prevention measures that have since been adopted in all our companies.
Furthermore, the communication for the leadership was also an important pillar
of the campaign, which included the creation of pieces and press releases with
information directed to this public, especially with regard to routine changes in the work
environment and the implementation of home office for a large part of the employees.
Also in March, due to the pandemic, we had our efforts and eyes totally focused
on the health and safety of our employees. Another action carried out during this
period was the Nutrition Campaign with the preparation of informative pieces with
tips on nutrition and healthy habits for all our employees throughout the month.
Power cut suspension for 90 days
Following ANEEL’s set of measures to guarantee the continuity of the
electricity distribution service amid the new coronavirus pandemic scenario,
Equatorial Group temporarily prohibited the suspension of supply due
to default for 90 days, in addition to creating a series of notices in the
social networks, so as to inform the public about the measures.
Expansion in the customer service digital channels
To facilitate access to services of the distributor as well as ensure customer
safety, Equatorial Group made investments in digital service channels, such as
the implementation of a virtual assistant, Clara, to serve the public by WhatsApp.
Besides the launch of a smartphone App and a new website, with more
services and new technologies, such as online bill payment by credit card.
Low Income Campaign
In March, the federal government’s provisional measure 950/2020 established a
100% discount on the Social Tariff for low-income consumers on their energy bills.
To inform customers, Equatorial Group mobilized social networks in all four states.
Sustainability Report • 2020
20Introduction Performance Value Relations Environmental Responsibility AttachmentsAbout Equatorial Energia

3Performance

OutlookIn 2020, under the coronavirus pandemic effect, the economic scenario worldwide and
in the country went backwards. We ended the year with the SELIC rate at 2% and a 4.1%
drop in the GDP, according to the Brazilian Institute of Geography and Statistics (IBGE).
In the energy sector, we felt the effects of the quarantine in our operations to combat
losses between March and July 2020. The limitation of field activities in this period
generated an important reduction in the number of actions projected, frustrating the
results of the loss combat plan and contributing to the increase of this index.
Moreover, we had a significant reduction in consumption in classes with lower history
of fraud, such as commercial and public power, and the regulatory review of the
estimated time of use of public lighting by the National Agency of Electrical Energy
(ANEEL) in August 2020.
In the transmission segment, the Company ended the year with 75% of the operational
Annual Allowed Revenue (RAP), including the Revenue Release Agreements (TLR),
which represents around R$ 722 million in revenues.
In distribution, we had several challenges, but we managed to close the year with a
3.8% growth over the energy sold. In the new distributors, we had the approval of the
Extraordinary Tariff Review in Alagoas in May and in Piauí in December, an important
step in the process of creating value for these assets.
* Photo taken before the Covid-19 pandemic.
Sustainability Report • 2020
22Introduction About Equatorial Energia Value Relations Environmental Responsibility AttachmentsPerformance

OperationalThe 2020 fiscal year was a year that marked another important step in Equatorial
Energia Group’s growth, especially in the transmission and distribution segments.
TransmissionWe finalized six of the eight SPE’S in 2020, with 95% physical delivery
and 75% revenue already available. Besides the SPE’S, Equatorial
Group has 100% direct stake in Intesa, the operational line.
SPE State Km Subestations
SPE 1 BA 251 –
SPE 2 BA 213 1
SPE 3 BA/PI 380 –
SPE 4 BA/MG 594 1
SPE 5 BA/MG 257 –
SPE 6 MG 330 –
SPE 7 PA 125 2
SPE 8 PA 436 3
INTESA TO/GO 695 5
Total 3281 12
Legend:
Group 1
Group 2
Group 3
Group 4
Since October 2019, Equatorial has an Environmental Installation License for 100% of all
its eight lots under development.
Sustainability Report • 2020
23Introduction About Equatorial Energia Value Relations Environmental Responsibility AttachmentsPerformance

Distribution
(MWh) Maranhão Pará Piauí Alagoas
Injected energy Variation in relation to 2019
7,846,2934.4%
12,321,4562.2%
5,007,5792.0%
5,030,7074.1%
Distributed energy Variation in relation to 2019
6,426,5263.3%
8,616,9561.8%
3,657,7997.5%
3,494,392- 4.5%
Connection energy with other distributors Variation in relation to 2019
8,65438.6%
–
132,9363.6%
16,783
37.6%
(MWh) Maranhão Pará Piauí Alagoas
Total/Injected losses 18.5% 30.8% 21.5% 23.6%
As for the distribution segment, there was an acceleration of investments in nearly all
the distributors, despite the pandemic, totaling R$1.8 billion, considering the use of
own resources and the investment by the Luz Para Todos Program. This entire volume of
investments is aimed at expanding and maintaining the networks, improving the quality
of supply, universalizing access to the electricity grid and the interconnection of isolated
systems in Pará.
In Equatorial Alagoas, energy losses represented 23.6% or a drop of 6.6 p.p compared
to 2019. In Equatorial Piauí, total losses closed the year at 21.5% down 2.8 p.p from the
previous year’s closing. Maranhão and Pará registered respectively annual losses of 18.5%
and 30.8% which represented increases of 0.5 p.p and 0.7 p.p between the fiscal years.
Injected And Distributed Energy
Losses in Energy Distribution* Photo taken before the Covid-19 pandemic.
Sustainability Report • 2020
24Introduction About Equatorial Energia Value Relations Environmental Responsibility AttachmentsPerformance

The distribution system quality and efficiency
level is measured by the Equivalent Interruption
Duration per Consumer Unit (DEC), which measures
the average duration of interruptions, in hours per
customer per period, and the Equivalent Interruption
Frequency per Consumer Unit (FEC), which measures
the frequency of interruptions, in number of
interruptions per customer per period. That is, the
lower these rates are, the better the quality of the
operation.
Quality Indicators
Maranhão Pará Piauí Alagoas
13.7
DEC 2019 FEC 2019DEC 2020 FEC 2020
13.4
6.6 5.9
34.9
27.6
13.1 12.8
21.820.2
12.2 10.8
38.7
19.316.3
9.6
* Photo taken before the Covid-19 pandemic.
Index in the last quarter of the yearGRI 103-1 | 103-2
Sustainability Report • 2020
25Introduction About Equatorial Energia Value Relations Environmental Responsibility AttachmentsPerformance

INNOVATION
The year 2020 was marked by innovations in remote service and as we were already on the path to an
increasingly digital service, we were able to consolidate our artificial intelligence, Clara.
Clara is the first initiative of this nature in the electric sector. It offers the most sought-after services in the
service channels, such as issuing the 2nd bill copy, payment code, debt consultation, informing power
outages, and reconnection via WhatsApp. With it, more than 1.7 million customers have already been
served, with a 93% customer reliability rate (customers who contact Clara and do not call the Call Center).
Just like Clara, the website and the app have consolidated themselves as important customer service
channels, encompassing the main services offered in face-to-face customer service with a simple and
functional layout.
In addition, as a way to assist in the migration of customers to digital service, some branches were modified
to offer self-service through tablets containing our APK. We also participated in the planning process of the
environment, to make it user-friendly for the customer.
ONLINE INSTALLMENT PLAN
With this service, we have made the website service equal to the in-person service in terms of the major
services offered. Since August 2020, our clients can negotiate online and automatically, including paying
the down payment in installments on the site itself.
GRI 103-1 | 103-3
Sustainability Report • 2020
26Introduction About Equatorial Energia Value Relations Environmental Responsibility AttachmentsPerformance

FinancialWith a performance focused, guided by operational excellence, 2020 brought positive
returns for the Equatorial Group. We ended the period with R$ 7.7 billion in consolidated
cash, and adjusted consolidated EBITDA reached R$ 4.764 billion, growth of 17% over
2019. Our net operating revenue totaled R$ 17.890 billion in the year, 5% lower than in the
previous year.
GRI 201-1 | 103-1 | 103-2 | 103-3
Financial highlights (R$ million) 2020 2019
Net Operating Revenue (ROL) 17,890 18,796
Adjusted EBITDA 4,764 4,056
EBITDA Margin (%ROL) 17% 21.6%
Adjusted net income 2,826.33 1,484
Investments 2,908 4,768
Adjusted EBITDA per distributor (R$ million) 2020 2019
Maranhão 1,086 983
Pará 1,418.1 1,081
Piauí 850 161
Alagoas 527 235
* Photo taken before the Covid-19 pandemic.
Sustainability Report • 2020
27Introduction About Equatorial Energia Value Relations Environmental Responsibility AttachmentsPerformance

4Value Relations

EmployeesOur People are the ones who make the operational excellence of the Equatorial Group companies happen. Their
well-being and continuous development are priorities for the Group¸ with a focus on employee engagement. We are
absolutely committed to the care and support of the Group’s professionals, who you will know better below.
All Equatorial Energia employees have a permanent, full-time contract with the Companies. The distributors have a
higher number of outsourced workers who hold positions as electricians, negotiators, service providers and call center.
GRI 102-7 | 102-8 | 401-2 | 405-1
7,500employees
By gender By region By age group
until 30 years old
between 30 and 50 years old
over 50 years old
14.9%
16.3%
68.8%5,10068%
5,04767.3%
32.3%2,422
0.4%31
32%2,400
* Photo taken before the Covid-19 pandemic.
Northeast
North
Other regions
Sustainability Report • 2020
29Introduction About Equatorial Energia Performance Environmental Responsibility AttachmentsValue Relations

SatisfactionIn 2020, we consolidated the integration of our organizational culture in all companies
recently acquired by the Group. The focus is to maintain a harmonious climate and
genuine exchanges between people, so that everyone finds help and support in the
day-to-day challenges. This climate is supported by various actions to promote the
well-being and integration of employees, such as training programs, the consolidated
compensation policy, Occupational Health and Safety (OHS) programs, spaces for leisure
and rest, events for socializing and celebration.
In recent years, two of our companies have appeared in the Great Place to Work (GPTW) ranking, Equatorial Maranhão and Equatorial Pará, as well as in the Melhores Empresas Para Trabalhar (Best Companies to Work For) by Você S/A.
* Photo taken before the Covid-19 pandemic.
Sustainability Report • 2020
30Introduction About Equatorial Energia Performance Environmental Responsibility AttachmentsValue Relations

People ManagementAttracting, mapping, evaluating, developing and retaining talent are the lines of activity of
the Integrated People Management System (SIGG), a model created to meet employees’
needs in relation to development, career path and growth.
INTEGRATED PEOPLE MANAGEMENT SYSTEM
1. Attracting
4. Retaining
2. Mapping and Evaluating
3. Developing
AttractingTalent attraction takes place on five different fronts:
Internal Recruitment, External Recruitment, Internship Program, Trainee Program and
Young Apprentice Program.
• Internal recruitment: It is the valorization of our talents. The manager requesting a specific vacancy checks
if there are any employees or interns within his/her own team capable of filling
the position.
If not, the vacancy is announced to all employees, through the Career Opportunity
notice. All participants in the internal recruitment processes receive feedback from
the People and Management department or from the area manager.
• External recruitment: The selection process verifies how the candidate positions himself/herself in
situations that bring the values of the Group’s companies.
Besides meeting the technical and competence skills required by the vacancy, the
candidate is selected for his/her compatibility with the organizational culture of
the companies.
Sustainability Report • 2020
31Introduction About Equatorial Energia Performance Environmental Responsibility AttachmentsValue Relations
Training and Development
Equatorial’s employees rely on development and training programs, which give
strength to the Group’s care and appreciation cycle with its professionals.
To meet the challenges and the new pandemic global context, we carried out
and adapted several actions in order to continue fostering and driving our
Corporate Ideology, ensuring the continuity of processes, development of our
team and maintenance of our employees’ productivity for high performance
and achievement of results. In 2020, the following actions were carried out:
• External Mapping of Potential Successors: every year we identify
critical positions in the Group and map out professionals in the market to
maximize the chances of attracting potential successors and ensure the
success of business continuity with greater assertiveness. In 2020, there
were five positions mapped, hiring three mapped professionals*;
• Promotion of Talents to Strategic Positions: aiming to track the Group’s
growth, changes in the organizational structure, and to recognize our
internal talents, we promoted 23 employees to strategic positions;
• Hiring for Strategic Positions: to meet the demands of the new organizational
structure in the face of the pandemic, we sought professionals in the market
with a profile for strategic positions, giving more oxygen to our team and
new learning and contributions. In 2020, 24 new professionals were hired.
*For the external map, 46 interviews were conducted by the Corporate Management of Development and Internal Communication and 26 interviews by the position managers.
GRI 103-1 | 103-2 | 103-3
* Photo taken before the Covid-19 pandemic.
Sustainability Report • 2020
32Introduction About Equatorial Energia Performance Environmental Responsibility AttachmentsValue Relations

Facing the new context and to support the business sustainability, we revamped
some development programs and proposed Change Management strategies.
• We redesigned the Leader DNA with programs for all levels
to support our Leaders in their daily challenges and prepare
them to achieve the expected results with their teams;
• We adapted the presentations of the Improvement Projects of the Leader in Me Program of Equatorial Pará to the online model;
• We redesigned the Trainee Program, Internship Program and the Adding up the Differences Program to include innovation and technology;
• We designed the Change Management Strategy program to prepare
and support the company in the pandemic, extended the program to
SAP HR and mapped the impacts of the 1st wave of the project;
• Start of the Equatorial Executives Program with the approval of
Regulation training for Directors and Superintendents.
We adapted several training actions to the online model and intensified the
support to the Business Units so that our employees can continue improving
knowledge, developing skills, and achieving high performance.
• We made 17 online courses available on the Niduu App during
the months of May and June to encourage our employees in self-development during the pandemic quarantine;
• We have adapted the General and Leadership Integration program,
as well as all other trainings, to the online model;
• We conducted Webinars with Nortus and the development of People and Management Guides with essential topics to support managers in the context of the coronavirus pandemic;
• We hold Leadership Workshops for Office 365;
• Support in the Customer Journey Project at Equatorial Pará, as well as to
the Business Units in online training sessions and workshops;
• We unified the supplier to the execution of mandatory safety trainings and execution of training in the system for process owners in the BUs.
• Participation in the RR of the Infrastructure and Telecom Management presenting the theme “Communication Effectiveness in Customer Service”.
Sustainability Report • 2020
33Introduction About Equatorial Energia Performance Environmental Responsibility AttachmentsValue Relations

We conducted the online training process via Niduu in the Causes and Subcauses Project
(with 2,293 employees trained), in the Nice Project (both from Operations Management
with 5,103 employees trained), and in 55 Solutions’ “Tô na Frente!” Program (with 471
employees trained on average).
Among the support in the online trainings and workshops, we had:
• Customer Journey – EQTL PA
• CSC Service Excellence and Guideline
• Donation and Sponsorship Workshop
• Jusprocesso
• Institutional Relations and Training of Spokespeople
• Works and Materials Workshop
• Inspection of Transmission Lines using Drones
• Office 365 Tools Workshop
• My Energy Transforms – EQTL PI and EQTL AL
Throughout 2020 we held 21 internal Campaigns and Events so as to engage our
employees in relevant causes, strengthen our Organizational Culture and disseminate the
feelings of “humanization”, “group belonging” and “cooperation”. Moreover, we had
the SAP Concur and Office 365 campaigns.
We started a new project by carrying out a diagnosis to identify the main knowledge,
skills, and competencies that are critical for professionals to achieve the best results in
the Group and meet the company’s expectations. We had 197 employees interviewed,
among these, 24 people from Senior Management, 67 people from Corporate, 84 people
from Distribution, 18 people from Transmission, and 4 people from the Project Team.
About 110 hours were dedicated to the diagnosis.
DiversityAs important as developing our people is to ensure their well-being and emotional
health, which are tied to the freedom to be who they are in the workplace. Accordingly,
diversity is an intrinsic factor in the Group’s performance.
Our operations have programs aimed specifically at serving, attracting and retaining
women. Such as the Pregnant Woman Workshop Program, which addresses nutrition
and physical activities for pregnant women, ensuring guidance as to the care of the
newborn and basic knowledge about the pregnancy period. Here, the Maternity Leave
period is extended to 180 days.
* Photo taken before the Covid-19 pandemic.
Sustainability Report • 2020
34Introduction About Equatorial Energia Performance Environmental Responsibility AttachmentsValue Relations

Occupational Safety And Health (OSH)GRI 103-1 | 103-2 | 103-3 | 403-2 | 403-3 | EU16
Our way is to value life. Safety is a pillar transversal to the
entire performance of the Equatorial Energia Group, it is
a commitment signed with all individuals involved in the
operation, regardless of position or functional level.
Part of the safety management processes is carried
out by the Health Engineering and Occupational Medicine Service (SESMT) and in initiatives such as
awareness dialogues, safety campaigns and workshops,
emergency drills, training for the Emergency Brigade,
educational lectures, frequent inspections and training
to class supervisors – responsible for multiplying and
disseminating practices.
SAFETY DIALOGUE Program to create, develop and maintain preventive attitudes through the awareness of all
employees, aligning them with Occupational Safety and Medicine topics. Lasting five to ten
minutes, the Dialogue takes place daily in all operational areas and once a month in administrative
area meetings.
SAFETY BLITZ Unscheduled visits by prevention teams in the field, the purpose of which is to verify Workplace
Safety practices in the performance of employee activities. Employees participate in campaigns in
which they are recognized for each blitz with 100% assertiveness, with the delivery of a gift and the
possibility of being nominated as a Safe Professional, earning bonuses in shopping vouchers.
SAFETY INSPECTIONS Initiatives to ensure compliance with legislation regarding the availability of safety materials,
vehicles in perfect condition and safe installations.
Sustainability Report • 2020
35Introduction About Equatorial Energia Performance Environmental Responsibility AttachmentsValue Relations

The Internal Week for Occupational Accidents Prevention (SIPAT) also takes
place annually, which deals with the issues discussed throughout the year with greater
emphasis. Every month, area managers conduct field inspections to check for gaps in the
system and bring inputs for the continuous improvement of safety in the areas.
Among these routine procedures, there is also occupational health support. In addition
to the Occupational Health Medical Control Program (PCMSO), which provides
medical support to employees, there is also the Viver Mais Program, which consists of
monitoring and follow-up on chronic diseases.
The program Segundos de Vida is another initiative to encourage safety practices
that guarantee the integrity of all employees working in the electric power system.
The initiative is part of the Integrar Program, the initial welcome training for service
providers. Through it, the main service providers companies participate and their
employees are trained with video classes that bring mandatory safety standards and
practices. The employee is then evaluated and, if his/her score is enough, he/she
signs the Pact for Life in the presence of his /her family, a document in which he/she
commits himself/herself to the performance of his/her activities in line with safety
recommendations.
Occupational Health and Safety in Times of Covid-19We know that the pandemic brought about several transformations in all
levels of society and demanded from us a lot of care regarding the prevention
of the disease and attention to the sudden changes that we had to make
in the company’s actions and strategies. In critical periods like the one we
are going through, being supportive and empathetic is fundamental.
For this reason, the Group has promoted several actions and attitudes for
the well-being of society. Among these measures, we highlight:
• Implementation of the contingency regime for essential services;
• Adoption of restrictions for some field activities;
• Implementation of the home office system in all activities suitable for such;
• Implementation of a series of labor measures to preserve our workforce.
WELFARE AND QUALITY OF LIFE The Group has a program that covers various quality of life practices, such as the sport support program that promotes and encourages physical exercise, with financial support
included. We offer employees the Discount Club, which provides discounts on access to services through an agreement with companies in the distributors’ region, such as
language schools and other institutions. An annual fair also takes place, where members of the Club bring their products to employees inside the companies.
Sustainability Report • 2020
36Introduction About Equatorial Energia Performance Environmental Responsibility AttachmentsValue Relations

SuppliersTransparent and honestly conducted value relationships
with our suppliers are essential for our performance.
With the same standards of excellence and demanding
safety procedures for suppliers performance, we
maintain a responsible and efficient supply chain.
Selection and evaluation criteriaTo be part of the Group’s supply chain, the
company must establish standards of behavior
in relations with its workers, such as fighting
child labor and forced or compulsory labor, and
with the environment, with care and actions that
contribute to the sustainable development.
The parent company also has a Management
Excellence Program – Equatorial Energia
Suppliers, which provides support for the
implementation of company management
models, in addition to guiding the adequacy of
these models to Equatorial Energia’s criteria.
The criteria related to the respect to the Group’s
organizational principles and to the social and
environmental responsibility and health and safety rules
are included in the contractual clauses with suppliers.
To verify the companies’ engagement with the defined
principles and values, on-the-spot audits are carried
out, as well as actions to disclose the mission, vision
and institutional values with the companies.
In case of any type of non-compliance is verified,
depending on the level of seriousness, a base
report is generated for the formulation of an action
plan. The actions are monitored in the monitoring
visits carried out every six months, during which
suggestions for improvement are made.
Furthermore, suppliers are trained and audited
by the Management Excellence Program –
Equatorial Energia Suppliers, which establishes
scores for different dimensions of the supplier’s
performance, among which is Compliance.
Supplier SegmentationPossible suppliers are registered and segmented based
on economic, financial, legal, tax and labor criteria,
taking into account the Code of Ethics and Conduct.
These criteria ensure that only those who share
our values become Equatorial’s business partners.
Suppliers are then pre-qualified and registered
according to supply category, segmented as
materials and equipment or services suppliers.
In 2020, we had 2,019 active suppliers, segmented in the areas of services and materials.
GRI 103-1 | 103-2 | 103-3
Sustainability Report • 2020
37Introduction About Equatorial Energia Performance Environmental Responsibility AttachmentsValue Relations

Recognition and developmentThe Supplier Management Excellence Program
aims to analyze the quality of suppliers’ deliveries,
aligning the rendering of services to the required
standards of excellence while fostering innovation
in the partners’ processes, products and services.
To recognize its efforts, the Group holds the Suppliers
of the Year Award, which certifies the best suppliers
in the chain and encourages improvements,
establishing new quality standard requirements.
The companies are evaluated according to the strategic
objectives (pillars) and pre-set requirements, which are
obtained through monitoring visits, pre-audits, on-
site audits, and evaluation by the Contract Managers
through Equatorial Energia’s management control items.
The partial result is released every six months and,
at the end of the process, the companies with
the highest scores win the Suppliers of the Year
Award, delivering the award at a solemn event.
Besides the categories awarded by segment,
companies that meet all the requirements related
to the following categories are also recognized:
Safety, Socio-environmental, Quality of Life,
Standard Warehouse and Higher Evolution.
Another way to ensure suppliers’ engagement is
training, which ensures the alignment, development,
awareness and enhancement of the skills and
competences of outsourced workers. To contribute
to this development, we maintain, in partnership
with the Industries Federation System of the State
of Maranhão (Fiema), the Supplier Development
Program (PDF) of the State of Maranhão.
Through it, Equatorial offers training, support and
certification to companies to make them more
competitive, fostering excellence in meeting
the demand for services and products in the
state. It is also part of our vision to maintain
policies to assist the development of small and
micro-enterprises, which are prioritized when
choosing suppliers and receive assistance for
their production and management processes.
Aiming at the appreciation and strengthening of
our Brand, we took to our partners several trainings
and awareness raising sessions, involving the entire
Equatorial Pará’s presidency, boards, management
and front line. In the first training wave, we reached
3,819 third-party employees. In the second wave,
an average of 4,474 employees were reached.
Also, to better train people about Equatorial
Pará’s processes, we are preparing an e-book
that aims to bring a new way of looking at the
customers’ frequently asked questions.
In 2020, even with pandemic impacts, more than 40 thousand hours of training sessions were held, reaching an audience of more than 20 thousand participants.
Sustainability Report • 2020
38Introduction About Equatorial Energia Performance Environmental Responsibility AttachmentsValue Relations

RELATIONSHIP CHANNELS
Speak up Partner Portal: Platform for solving suppliers’ problems and understanding their demands,
with access to technical standards, procedures and safety actions, social and
environmental responsibility, manual and attachments of the Management
Excellence Program, communication channel for complaints and various
claims, link to the tool for managing third-party obligations, among others
Chat with Equatorial: The Group’s confidential communication channel, which allows fast, impartial,
and secure interaction with service providers. The channel is available 24
hours a day, seven days a week and can be accessed over the internet or by
toll-free call.
Business Briefing: Communication with the service about changes, conduct, orientations and
any other process that affects the client.
Clara: Grupo Equatorial’s consolidated digital customer service channel, being the
first (and usual) service option for countless customers in the different states.
* Photo taken before the Covid-19 pandemic.
Sustainability Report • 2020
39Introduction About Equatorial Energia Performance Environmental Responsibility AttachmentsValue Relations

CustomersWe have an innovative operation, aligned with the digital
age that provides closeness to this stakeholder, greater
speed in solving their questions, monitoring with artificial
intelligence tools and platforms, which ensure a light,
intuitive and dynamic use. Our online services take place
via website, APP, WhatsApp and Cognitive IVR. Among
the personal forms of customer service, we have the
Call Center and face-to-face service at Branches and
Accredited Companies.
We also work tirelessly to ensure our energy reliability, always
concerned with aligning the performance of all the Group’s
companies, including those most recently acquired, with the
delivery expectations and services for our customers.
In 2020, we carried out the essential process of adapting
the new companies to Equatorial’s quality and excellence
standards, which reflected in the satisfaction of our
consumers and in the transparent and close relationship
maintained with them.
Among the goals achieved in the year, we had the
expansion of online services, Customer Experience
standardization, easier access to service channels, optimized
costs, and associated revenues for Grupo Equatorial.
GRI 103-1 | 103-2 | 103-3
* Photo taken before the Covid-19 pandemic.
Sustainability Report • 2020
40Introduction About Equatorial Energia Performance Environmental Responsibility AttachmentsValue Relations

DistributionCompliant with current regulations (Resolution No.
414/2010) defined by ANEEL, Equatorial’s customers
are segmented into groups according to the voltage
supplied to them. They are:
• High Voltage Customers (Group A): those with
supply voltage equal to or greater than 2.3 kV,
subdivided by voltage level ranges, which include
the Master Corporate Service, Corporate Customers
and Government (state, federal, networks and city
halls) segments);
• Low Voltage Customers (Group B): those with
a supply voltage below 2.3 kV, grouped into the
Conventional Household, Low Income Household,
Commercial, Industrial and Rural categories.
The segmentation of this public has a strategic
purpose and makes service more efficient, minimizing
costs and maximizing results, by focusing on the
profile by type of customer. Furthermore, our
distributors have established a second classification
that segments the portfolio by target customers, also
classified into two major groups: Corporate Service
and Retail Service.
COMMUNICATION CHANNELS
We have several open channels to make it easier and maintain a direct communication with our
consumers:
• Service Branches;
• Digital media: app, e-mails, websites, digital newsletters, social networks and Clara via WhatsApp;
• Claim form (forms available at branches and service points) and SMS;
• Telephone service centers, free and 24h/day;
• Self-service kiosks and totems;
• Media: TV, radio and print media;
• Educational lectures;
• Brochure in the branches and energy bills;
• Vehicles fleet, bicycles and sound cars;
• Write to the President.
OMBUDSMAN
The Ombudsman of the Group’s companies are prepared to receive complaints, claims, suggestions and
praise, with a physical structure for face-to-face service and a Call Center (0800).
In all, 107,900 requests were received by the Equatorial Group Ombudsman in 2020.
Sustainability Report • 2020
41Introduction About Equatorial Energia Performance Environmental Responsibility AttachmentsValue Relations

SatisfactionGRI 103-1 | 103-2 | 103-3
The Equatorial Group companies have a pact with excellence in customer service, also
because They believe that care in this relationship is one of their great advantages in the
market, responsible for the continuous evolution of business.
To ensure the quality of this front and the constant search for improvements, we closely
monitor the consumer experience and prioritize genuine listening through surveys with
this stakeholder.
Controlled companies have a Consumer Council, which provides the return of customers
and their role in the value chain, reinforcing the consumers’ role as partners in Equatorial’s
business An example of this attention was the management work at Equatorial Pará, took
over by the Group in a time of crisis; two years later, in 2020, to company appears as a
finalist in the Customer Satisfaction Award.
The Customer Satisfaction Award, formerly known as the ANEEL Consumer Satisfaction
Index (IASC) is the main tool for monitoring consumer satisfaction in the electricity sector.
The best companies in the Index are recognized with the ANEEL Quality Award.
The survey also ascertains as aspects the Trust, Loyalty, Perceived Quality and Perceived
Value. In 2019, the Brazil Concessionaires index was 67.38, with a variation of 1.93%
compared to 2018. The Brazil Permissionaires index, meanwhile, stood at 78.19, 6.57%
higher than 2018.
The survey assesses the satisfaction level of residential consumers with the services
provided by the distributors. The regulatory agency also analyzes the quality of the
services by means of two indicators, the Equivalent Interruption Duration per Consumer
Unit (DEC) and the Equivalent Interruption Frequency per Consumer Unit (FEC), which
represent the time and the number of times that a consumer unit was left without
electricity during the period.
* Photo taken before the Covid-19 pandemic.
Sustainability Report • 2020
42Introduction About Equatorial Energia Performance Environmental Responsibility AttachmentsValue Relations

SocietyIn 2020, we generated thousands of jobs with
Transmission works to structure a platform to create
value for the entire society, in addition to that generated
by the Equatorial Group companies through services,
products and businesses. We are establishing ourselves
in new markets, expanding the offer of Equatorial
excellence to areas connected to energy or not. We
have consolidated the work that came to fruition
in 2019, strengthening and expanding the Group’s
contribution fronts for socio-environmental indicators.
We are working to increasingly impact social aspects,
engage society, important causes such as those of
minority groups and other issues relevant to the states in
which we operate. We also aim to continuously invest in
research and innovation, offering more and more tools
that are compatible with the digital age in which we live.
Equatorial Energia’s own business model concept comes
from a sector with high level of taxation, generating
value for the government through the collection of taxes
that are applied to support public policies, promoting
development and robust investments in all states.
We all work for social development. Our employees
have engaged and participated in actions focused
on raising their awareness for social responsibility
and the performance of everyone in this area. We
corroborate this commitment by partnering with
institutions such as the United Nations Children’s
Fund (Unicef ), the Association of Parents and Friends
of the Specially Challenged (APAE) and the Good Will
Legion (LBV), which embrace important causes.
GRI 102-12
The Equatorial Energia Group is a partner of the
United Nations Children’s Fund (Unicef ), a United
Nations body focused on defending children’s
rights. We are also one of the main supporters
of the Unicef Seal, an initiative to encourage
and recognize real and positive advances in the
promotion, execution and guarantee of the rights
of children and adolescents in municipalities in
the Semi-Arid and Brazilian Legal Amazon.
Learn more about the Seal here:
selounicef.org.br
Sustainability Report • 2020
43Introduction About Equatorial Energia Performance Environmental Responsibility AttachmentsValue Relations

Social Responsibility in Covid-19 timesWe understand our responsibility to the people we serve,
and we strive to innovate and enhance this look beyond
energy investments.
With Platform E+ it has become possible to
communicate, systematize and leverage sustainable
actions developed in the places where we operate. With
innovative management strategies and tools, Equatorial
Energia Group invests in solid partnerships to add
value and make corporate projects possible, seeking
connection between people and opportunities.
In 2020, the E+ Recycling in Piauí collected 341.1 tons
of waste and offered customers participating in this
project a bonus of R$ 34,210.66 in their energy bills.
Additionally, we allocated R$ 575,000.00 to exchange
refrigerators through the energy efficiency program.
ACTIONS
Luzes na Cidade: contributes to
municipalities with public lighting projects.
E+ Energia do Bem: implements equipment
and technology solutions to improve the energy
efficiency of low-income family homes.
E+ Comunidade: strives to build mutual
collaboration relations with the community
through projects such as the Low-
Income Social Tariff and related ones.
E+ Geladeira Nova: consists of exchanging
inefficient refrigerators for new ones,
contributing to energy savings.
E+ Reciclagem: exchanges recyclable waste
for a bonus in the energy bill, promoting
the responsible disposal of the materials
received. In 2020, E+ Reciclagem in Piauí
collected 341.1 tons of waste and offered
participating customers a bonus of R$ 34,210.66
in energy bills. Moreover, we have allocated
R$575,000.00 to exchange refrigerators
through the energy efficiency program.
E+ Cultura: supports cultural initiatives that value
the local population, including the most diverse
modalities in the area. Learn more on page 49.
E+ Esporte: pursues initiatives that strengthen
sports practice and raise the performance
status of the supported athletes.
E+ Energia Profissional: we contributed to the
entry into the job market or entrepreneurship
of more than 300 people, offering training for
baker, haircut, eyebrow designer, electrician,
meter reader, and bricklayer. We also foster
environmental responsibility, allied with
the assurance of a community partnership
that values selective waste collection.
Sustainability Report • 2020
44Introduction About Equatorial Energia Performance Environmental Responsibility AttachmentsValue Relations

CommunityFor Equatorial Group, it is imperative to contribute to transform the population reality in
the communities in which it operates, valuing diversity and the inclusion of all. We are
concerned with what is most relevant to these communities, working to deliver beyond
what is expected of us. To this end, we map the potential impacts of the Company in
these locations.
The possible impacts on distribution services are mainly related to the interruption in the
energy supply, scheduled or not, which creates risks for consumers dependent on devices
for health, safety, economic activities, among others. In addition, there is the possibility
of insecurity and the risk of electric shock or fire due to possible cables broken in the grid
and due to improper contact with the grid. This situation is aggravated in low-income
communities, due to irregular installations and kites flying close to the electricity grid.
To mitigate and minimize these risks, the Group’s companies develop communication
campaigns in order to communicate, raise awareness and educate local populations. We
also have a program called Seconds of Life, which aims to raise awareness about safety.
In transmission activities, the operational impacts apply, in particular, to the noise, which
can be identified in the vicinity of substations and high voltage grids. As a solution,
companies are integrated with communities and follow strict environmental controls.
GRI 103-1 | 103-2 | 103-3 | 413-2
* Photo taken before the Covid-19 pandemic.
Sustainability Report • 2020
45Introduction About Equatorial Energia Performance Environmental Responsibility AttachmentsValue Relations

Fostering developmentIn addition to quality services and products, we engage in knowledge sharing,
information dissemination and development and citizenship through specific actions
and initiatives.
These practices, in line with the Sustainable Development Goals (SDGs) defined by the
United Nations General Assembly, have been part of our companies’ businesses since
the Group’s operational planning. In 2019, we started working more clearly with our new
sustainability platform, with a strong focus on sustainable initiatives.
In 2020, we invested more than R$ 24 million in social development, including direct and incentivized resources.
We maintained our strong social promotion strategy in the states of Maranhão and Pará,
acting via the incentive law to contribute to culture and sport, with robust investments
in this regard.
We also focus on our relationship with the communities, working closely with this
audience. Equatorial made visits to nearby municipalities, developing social and
communication actions. Through campaigns and lectures, we guide the population and
talk about the risks related to energy, addressing issues such as conscious use and safety.
* Photo taken before the Covid-19 pandemic.
Social TariffThe Social Electricity Tariff program is an initiative of the Ministry of Mines and
Energy and ANEEL, providing discounts of up to 65% on the electricity bill for
families registered with the Unified Registry or people receiving the Continuous
Social Assistance Benefit, or BPC (Benefício de Prestação Continuada). As agents
of transformation in the communities, the Equatorial Group companies support
residents by making their registration so that they have access to the benefit.
Currently 28% of our customers are registered in the Program and in 2020 more
than 600 thousand new customers were registered.
Sustainability Report • 2020
46Introduction About Equatorial Energia Performance Environmental Responsibility AttachmentsValue Relations

Renovated InstitutionsIn 2020, we had an investment by Equatorial Pará of R$4.5 million for renovations in
social institutions.
• No Olhar NGO: We built the headquarters of the NGO No Olhar, which aims to offer courses in creative
economy, having as target audience people in situations of social risk, purchase of
equipment and a vehicle to sell the products;
• APPD – Para Association of People with Disabilities: We remodeled the building adapting accessibility and acquired computers to
reopen the training center;
• Lar Fabiano de Cristo: We delivered to the Lar Fabiano de Cristo social institution a store so that the people
assisted at the premises could have a place to sell their products, generating income
for them. Besides a training space with all the necessary equipment and furniture for
the courses;
• Castelo dos Sonhos: We built the headquarters of the Castelo dos Sonhos social project, which aims to
serve children and teenagers between six and 17 years old, during after-school hours
with recreational activities focused on sports. There are about 380 direct beneficiaries.
Energy in the CommunityProject to promote sustainability through open dialogue with the community, making
residents aware of the safe and sustainable use of electric energy, encouraging efficient
habits. Part of the project takes place in the Group’s mobile unit, delivering services such
as a second copy of the bill, debt negotiation, change of ownership and registration in
the Electricity Social Tariff. More than 60 thousand actions were carried out, with about
26,891 thousand clients impacted.
Professional TrainingIn partnership with SENAI, SENAC, Instituto Mix and Embelleze we offer professional
courses for the population of the municipalities of Belém, Castanhal, Santarém, Marabá,
Ananindeua, Parauapebas, Soure, Terra Alta, among others. With an investment of more
than R$ 310 thousand, citizens had courses in barber, hairdresser, eyebrow designer,
motorcycle mechanic, outboard motor mechanic, administrative assistant, party sweets
and snacks, industrial dressmaker and cashier. We trained 63 groups, training 1,449 people during the year, in over 17 municipalities.
course by region regional breakdown
18
10
5270
418
377
199
18512
18
63groups
1,449people trained
North Northeast South West Center
Sustainability Report • 2020
47Introduction About Equatorial Energia Performance Environmental Responsibility AttachmentsValue Relations

Energia do bem networkEnergia do Bem is the volunteer program sponsored by the Equatorial Energia Group,
where employees are encouraged to participate and perform various voluntary actions. In
2020, however, it was not possible to accomplish this due to the social distancing protocol.
Luz Para Todos programActing in partnership with Luz para Todos, a federal government program created in
2003 to promote access to electricity for families living in rural areas. The program works
extending grids, implementing isolated systems and making home connections.
Culture and SportBecause we believe in the cultural and sports potential to generate economic and social
transformation, Equatorial Energia sponsors several social and sports projects. We serve
and assist directly more than 500 children and adolescents.
With the pandemic scenario, unfortunately, many projects could not take place due to
health protocols, which resulted in a drop in the investment amount, about R$6.2 million
– a 41% drop if compared to the 2019 amount of R$15 million. There were 17 projects
executed in total, 12 in sports and five in culture. We list below the highlights:
Maranhão: In 2020, we executed 12 sports projects through the State Sports Incentive Law, and five
cultural projects through the State Culture Incentive Law. Approximately 1 million people
were reached by Equatorial Maranhão’s projects.
Among the initiatives we support are: the Maranhão Soccer Championship, which
returned in July with unattended games and internet broadcasts, with the participation
of eight clubs; for the Maranhão Aquatic Marathons we maintained the sponsorship,
since 2015, of the athlete Júlia Nina, and in 2020 we ensured that Júlia’s training routine
would continue, even with the postponed competitions; the Illumina Christmas Project, which brought a beautiful decoration to Imperatriz de São Luís; the Christmas Dolls Project, which had the distribution of toys representing the maranhense ethnic
groups by the company Éguas PaperToy. We also supported the construction of Parque João do Vale, in Pedreiras, and the Pisa na Fulô Project, which will guarantee cultural
equipment for the park; the Maranhense Sports Center for the Blind, which offers
soccer for the blind; and the Women’s Basketball League, which had to be cancelled
because of the pandemic.* Photo taken before the Covid-19 pandemic.
Sustainability Report • 2020
48Introduction About Equatorial Energia Performance Environmental Responsibility AttachmentsValue Relations

Pará: In the same year, Equatorial Pará received from the State
Government the Partner Company Seal that invested in
Pará’s culture. The recognition is a reason for great pride,
because with the E+ Cultura Program it was possible
to bring entertainment to customers, besides having
created more than 600 direct jobs for one of the groups
most affected by the pandemic, which was the culture
and creative economy sector.
Piauí: The year 2020 also marked the arrival of E+ Cultura in
Piauí. The Equatorial Energia Group began its sponsorship
actions in the state including 71 projects, investing
more than R$ 6 million in actions to promote the culture
and identities of Piauí, financing initiatives from north
to south of the state, from the most varied segments:
music, theater, dance, humor, cinema, literature, plastic
arts, gastronomy, research and documentation, historical,
artistic and environmental heritage. As in Maranhão and
Pará, in Piauí Equatorial Energia’s cultural sponsorship
takes place through the State Law for Cultural Incentive.
The projects are selected by the board of the State
System for Cultural Incentive (SIEC), linked to the
Piauí Culture Secretariat, and then made available for
companies to sponsor.
In the first year of cultural sponsorship in Piauí, we
contributed to spaces such as the Museu do Mar,
located in Parnaíba and currently considered the
biggest museum in the state. We also supported
the construction, renovation and modernization of
equipment in the Tertuliano Brandão (Pedro II) Cultural
Center, the 24 de Janeiro Monument (Oeiras), the Cristo
Rei Museum and the 04 de Setembro Theater, the latter
two in the capital city.
In music, we support the shows schedule in the format of
live broadcasts and projects such as the Dona Gal Music
School and Music for All, for training musicians.
GRI 102-13
Equatorial is part of governance and maintains the
Maranhão Business Citizenship Institute (ICEMA),
which promotes the discussion of corporate
social responsibility. In addition, it also acts in the
governance of the Brazilian Human Resources
Association (ABRH).
Social Action Highlights2020
81projects to encourage sports and culture.
157,000 new families registered for the Social Tariff in 2020.
5 millionpeople impactedby Equatorial Maranhão.
over than 600 direct jobs created for people impacted by the pandemic.
Humorous artists such as Dirceu Andrade and João
Cláudio Moreno also had their projects financed by
Equatorial Piauí. Junta – International Dance Festival and
the 23rd International Meeting of Culture and Capoeira,
hosted in the state, projected the Equatorial brand as a
partner company of culture beyond the limits of Piauí
territory. The same happened with national events, such
as the 9th Piauí National Theater Festival and the 15th
National Meeting of Cinema and Video of the Sertão.
Sustainability Report • 2020
49Introduction About Equatorial Energia Performance Environmental Responsibility AttachmentsValue Relations

5Environmental Responsibility

Environmental ManagementAs it operates in highly sensitive biomes such as the Amazon, Cerrado, Atlantic Rainforest, Caatinga and coastal areas
with the four distributors, Equatorial Energia’s environmental responsibility in processes management is a strategic point.
To manage these environmental issues, Equatorial Energia is based on a Sustainability Policy, which includes conducting
a balance between business opportunities, financial performance and socio-environmental responsibility in its
operations. In the document, we are committed to social development and environmental conservation, pollution
prevention, economic growth in the regions where we operate, efficiency in the use of natural resources and continuous
improvement of processes.
To this end, we also have a robust organizational structure, an area specialized in the environmental management of
processes, the Corporate Environment Executive Area, linked to the Expansion and Environment Planning Corporate
Management. The specialized area is responsible for the identification and definition of an internal regulations standard,
based on the ISO 14000 international standard, aiming at making the prior identification and control of environmental
impacts related to the business more efficient. Also, the area’s processes are strengthened by the Environmental
Management System.
With our recent entry into the transmission sector, we are revisiting the guidelines to make them increasingly sensitive
to the impact that our operations may have, adapting processes to meet all aspects that affect operations with
transmission towers.
Besides observing the definitions established by the inspection bodies and the operation in accordance with
environmental legislation, our companies operate in a conscious and efficient manner, both in the use of natural
resources and in establishing engagement processes for employees, partners and the community on the subject.
* Photo taken before the Covid-19 pandemic.
Sustainability Report • 2020
51Introduction About Equatorial Energia Performance Value Relations AttachmentsEnvironmental Responsibility

Environmental LicensingGRI 413-2
The environmental licensing process authorizes
and monitors the implementation and operation of
activities with significant environmental impact. It is
the legal obligation of the entrepreneur to obtain the
necessary environmental licenses.
Among the different segments of the electricity
sector, the energy distribution activity has minor
local impacts, such as in relation to generation.
However, the distribution network works may cross
territories considered environmentally sensitive as
well as protected areas of socio-cultural interest
such as indigenous communities or quilombolas.
Moreover, one of the main environmental impacts of
the activity that happens during the implementation
of these projects is the vegetation suppression in the
distribution line layout.
Thus, for the installation and operation of these projects in
a safe manner, legally supported from an environmental
point of view, it is needed to obtain environmental
authorizations from the responsible agencies.
Environmental licensing at Equatorial Energia
is carried out for all new ventures, for which
specific environmental studies are prepared. The
management and monitoring of the environmental
licensing processes in 2020 took place jointly with
65 environmental agencies, in the four states of the
distributors, at the federal, state and municipal levels.
Approximately 92 meetings were held with these
environmental agencies in the period, to issue the
required environmental licenses.
In 2020, 481 license application processes were filed,
covering around 103 municipalities in the states of
Maranhão, Pará, Piauí and Alagoas. In the same year,
a total of 458 environmental licenses were issued,
for new construction and renewals of licenses for
enterprises in operation, for the four distributors.
It is important to point out that in addition to this data,
the licensing in 2020 had a very positive progress in
Special Project processes, where 2,189 environmental
licenses were issued, which will make it possible to bring
quality energy to about seven thousand consumers.
* Photo taken before the Covid-19 pandemic.
Environmental integration for new worksThe Environmental Integration for new works happens to
transfer licensed information and the necessary actions
to fulfill its conditions to the expansion managers and
service providers that execute the new works. At the
Integration, the responsibilities of the parties involved are
also determined.
In 2020, even with the pandemic in place, Equatorial
Energia made this tool even more effective, in all
its distributors, which underwent 34 Environmental
Integrations for new works.
Sustainability Report • 2020
52Introduction About Equatorial Energia Performance Value Relations AttachmentsEnvironmental Responsibility
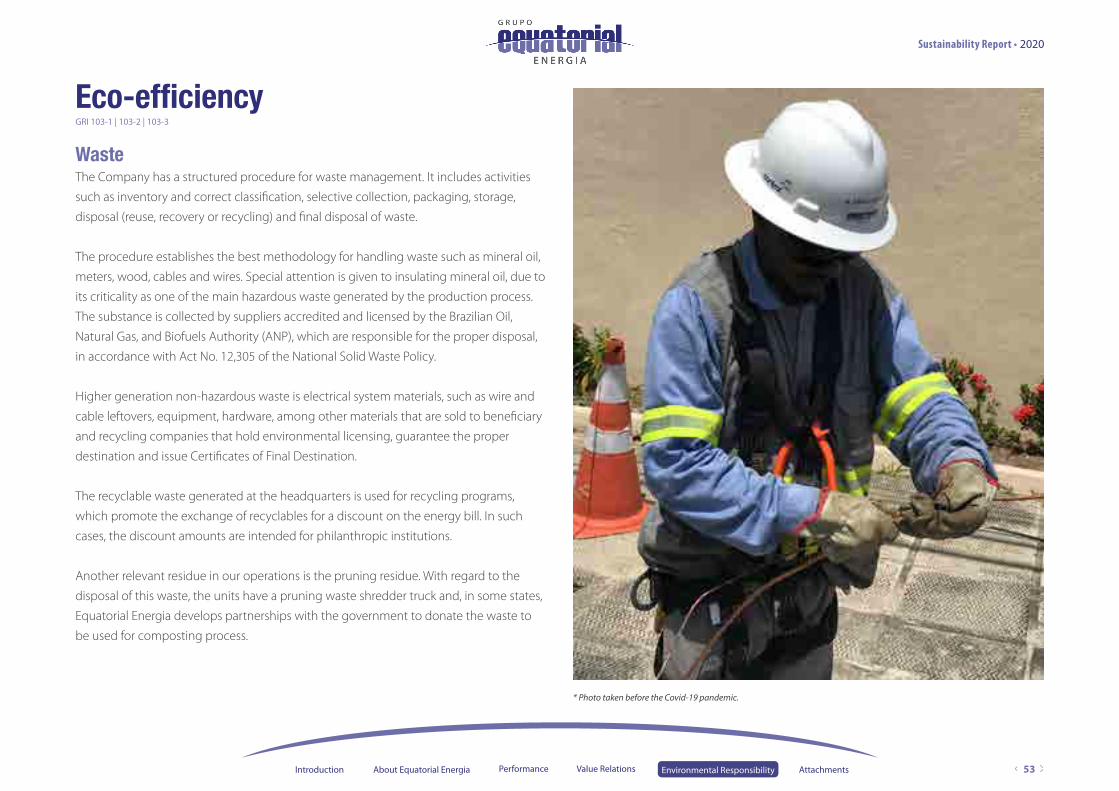
Eco-efficiency
WasteThe Company has a structured procedure for waste management. It includes activities
such as inventory and correct classification, selective collection, packaging, storage,
disposal (reuse, recovery or recycling) and final disposal of waste.
The procedure establishes the best methodology for handling waste such as mineral oil,
meters, wood, cables and wires. Special attention is given to insulating mineral oil, due to
its criticality as one of the main hazardous waste generated by the production process.
The substance is collected by suppliers accredited and licensed by the Brazilian Oil,
Natural Gas, and Biofuels Authority (ANP), which are responsible for the proper disposal,
in accordance with Act No. 12,305 of the National Solid Waste Policy.
Higher generation non-hazardous waste is electrical system materials, such as wire and
cable leftovers, equipment, hardware, among other materials that are sold to beneficiary
and recycling companies that hold environmental licensing, guarantee the proper
destination and issue Certificates of Final Destination.
The recyclable waste generated at the headquarters is used for recycling programs,
which promote the exchange of recyclables for a discount on the energy bill. In such
cases, the discount amounts are intended for philanthropic institutions.
Another relevant residue in our operations is the pruning residue. With regard to the
disposal of this waste, the units have a pruning waste shredder truck and, in some states,
Equatorial Energia develops partnerships with the government to donate the waste to
be used for composting process.
GRI 103-1 | 103-2 | 103-3
* Photo taken before the Covid-19 pandemic.
Sustainability Report • 2020
53Introduction About Equatorial Energia Performance Value Relations AttachmentsEnvironmental Responsibility

Energy Efficiency ProgramThe Energy Efficiency Program is an initiative of the
Equatorial Group that has several projects aimed at
reducing the consumption of non-renewable resources.
Aims to disseminate environmental
education by exchanging recyclable waste
for bonuses on the energy bill.
The first phase of the program is consolidated by the
intensification of the registration activity to maintain
and increase the number of consumers with the benefit
of the Social Tariff for Electrical Energy (TSEE). In this
phase, there are visits and prospection of customers
with potential to participate in the Energy Efficiency
Program, but who are not inserted in social programs
or do not have the Social Identification Number (NIS).
The NIS is a registration number assigned by
Caixa Econômica Federal to beneficiaries of a
social project that do not yet have a registration
in the Social Integration Program (PIS).
With the NIS, those registered may participate
in government social programs such as Bolsa
Família, the Garantia de Safra – for family farmers –,
among others. Normally, the registrations for
such programs are made at the city hall.
So far, the Program has collected 2,977.4 tons of
waste, saving more than 18 thousand MWh.
The front brings actions that encourage practical
use, such as the exchange of old refrigerators for
new, more efficient ones, as well as the replacement
of incandescent light bulbs for more efficient ones.
Furthermore, the project involves the dissemination of
awareness to consumers, dealing with topics such as
energy efficiency, rational use of electricity, and safety,
including the distribution of educational booklets.
In this stage, 3,600 refrigerators were exchanged
for more efficient models and about 7,200
families received guidance on the rational use of
electricity. To do so, Equatorial provided a truck
that traveled through certain municipalities of
Maranhão, taking these benefits to its customers.
In 2020, more than 4,070 families were benefited,
and more than 18 thousand light bulbs were
changed in low-income communities.
Sustainability Report • 2020
54Introduction About Equatorial Energia Performance Value Relations AttachmentsEnvironmental Responsibility

Results
Over 41 thousand refrigerators
replaced in Low Income
Communities;
Over 500 thousand light bulbs
with LED technology replaced
+ 32,000 MWh/year of energy
savings generated by Energy
Efficiency actions;
Educational actions with
distribution of booklets to
+40,000 families;
Over 2,400 adaptations in
electrical installations for
residents of low-income
communities;
Income Generation and
Training
Over 41,000 Retrofit of
Institutions’ Lighting Systems;
Over 790 Retrofit of Heating
and Cooling Systems;
Over 12,000 MWh/year of
energy savings generated by
Energy Efficiency actions;
Over 670 kWp Photovoltaic
systems deployed in
institutions.
Over 6,800 refrigerators
purchased by customers with a
50% discount;
Over 3,600 air conditioners
purchased by customers with
50% discount;
Over 9,700 MWh/year of energy
savings generated by Energy
Efficiency actions.
Over 4 thousand LED-
technology public lighting
fixtures replaced Over 2,000
MWh/year of energy savings
generated by the Energy
Efficiency action; more efficient
light bulbs, bringing savings for
the municipality.
400 tons of waste for recycling
(paper, metal, plastic, and
cooking oil).
Sustainability Report • 2020
55Introduction About Equatorial Energia Performance Value Relations AttachmentsEnvironmental Responsibility

Results
ENVIRONMENTAL BENEFIT
Over 200.000 trees
were not cut down;
Over 41 thousand inefficient
refrigerators disposed of
in an environmentally
correct manner;
Over 500 thousand inefficient
light bulbs discarded in an
environmentally correct way;
Over 3,600 tons of
CO2 captured.
Over 106.000 trees
were not cut down;
Over 41 thousand light
bulbs discarded in an
environmentally correct way;
Over 790 air conditioners
disposed of in an
environmentally correct manner;
+ 26 inefficient refrigerators
disposed of in an
environmentally correct manner;
Over 1,600 tons of CO2 captured;
Promote the use of Renewable
Energy Sources in institutions.
Over 42.000 trees were
not cut down;
Over 6.800 inefficient
refrigerators disposed of
in an environmentally
correct manner;
Over 3.600 inefficient light
bulbs discarded in an
environmentally correct way;
Over 1,300 tons of
CO2 captured.
Over 4.900 trees were
not cut down;
Over 4 thousand inefficient
light bulbs discarded in an
environmentally correct way;
Over 697 tons of CO2 captured.
Over 5.000 trees were
not cut down;
Over 839,000 m3 of water saved
in the recycling process;
Over 101.600 tons of
CO2 captured.
Over 400 tons of materials
ceased to go into the
garbage, streets and rivers.
Sustainability Report • 2020
56Introduction About Equatorial Energia Performance Value Relations AttachmentsEnvironmental Responsibility
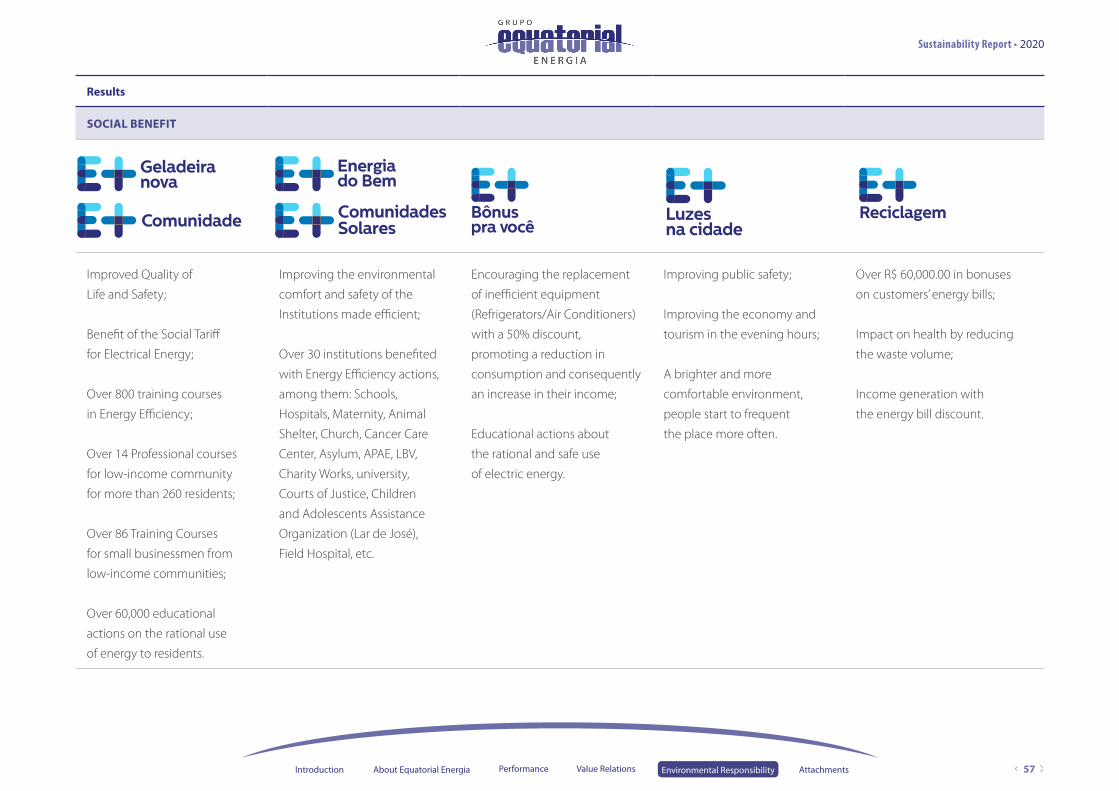
Results
SOCIAL BENEFIT
Improved Quality of
Life and Safety;
Benefit of the Social Tariff
for Electrical Energy;
Over 800 training courses
in Energy Efficiency;
Over 14 Professional courses
for low-income community
for more than 260 residents;
Over 86 Training Courses
for small businessmen from
low-income communities;
Over 60,000 educational
actions on the rational use
of energy to residents.
Improving the environmental
comfort and safety of the
Institutions made efficient;
Over 30 institutions benefited
with Energy Efficiency actions,
among them: Schools,
Hospitals, Maternity, Animal
Shelter, Church, Cancer Care
Center, Asylum, APAE, LBV,
Charity Works, university,
Courts of Justice, Children
and Adolescents Assistance
Organization (Lar de José),
Field Hospital, etc.
Encouraging the replacement
of inefficient equipment
(Refrigerators/Air Conditioners)
with a 50% discount,
promoting a reduction in
consumption and consequently
an increase in their income;
Educational actions about
the rational and safe use
of electric energy.
Improving public safety;
Improving the economy and
tourism in the evening hours;
A brighter and more
comfortable environment,
people start to frequent
the place more often.
Over R$ 60,000.00 in bonuses
on customers’ energy bills;
Impact on health by reducing
the waste volume;
Income generation with
the energy bill discount.
Sustainability Report • 2020
57Introduction About Equatorial Energia Performance Value Relations AttachmentsEnvironmental Responsibility

6Attachments

GRI Standards Content IndexGRI 102-55
Universal Standards Reference (Page)/Direct answer
General Content
ORGANIZATIONAL PROFILE
102-1 Name of the organization Page 08
102-2 Activities, brands, products, and services Page 08
102-3 Location of headquarters Page 08
102-4 Location of operations Page 08
102-5 Ownership and legal form Page 08
102-6 Markets served Page 08
102-7 Scale of the organization Pages 08, 12, 29
102-8 Information on employees and other workers Page 29
102-9 Supply chain Page 37
102-10 Significant changes to the organization and its supply chain Page 05
102-11 Precautionary Principle or approachThe Group does not formally adhere to the principle but has a robust Risk Management structure (page 14).
102-12 External initiatives Page 43
102-13 Membership of associations Page 49
STRATEGY
102-14 Statement from senior decision-maker Page 05
Sustainability Report • 2020
59Introduction About Equatorial Energia Performance Value Relations Environmental Responsibility Attachments

Universal Standards Reference (Page)/Direct answer
ETHICS AND INTEGRITY
102-16 Values, principles, standards, and norms of behavior Page 15
GOVERNANCE
102-18 Governance structure Page 12
102-26 Role of highest governance body in setting purpose, values, and strategy Page 12
STAKEHOLDER ENGAGEMENT
102-40 List of stakeholder groups Page 04
102-41 Collective bargaining agreements 100% of the distributors’ employees.
102-42 Identifying and selecting stakeholders Page 04
102-43 The organization’s approach to stakeholder engagement, including frequency of engagement Page 04
102-44 Key topics and concerns that have been raised through stakeholder engagement Page 04
REPORTING PRACTICES
102-45 Entities included in the consolidated financial statements
55 Soluções S/A, Equatorial Telecomunicações Ltda, Solenergias Comercializadora de Energia S/A, Equatorial Energia Distribuição S/A, Equatorial Transmissão S/A e Equatorial Energia S/A.
102-46 Defining report content and topic Boundaries Page 04
102-47 List of material topics Page 04
102-48 Restatements of information given in previous reports, and the reasons for such restatements There were none.
102-49 Significant changes from previous reporting periods in the list of material topics and topic Boundaries There were none.
102-50 Reporting period January 1st to December 31st, 2020.
Sustainability Report • 2020
60Introduction About Equatorial Energia Performance Value Relations Environmental Responsibility Attachments
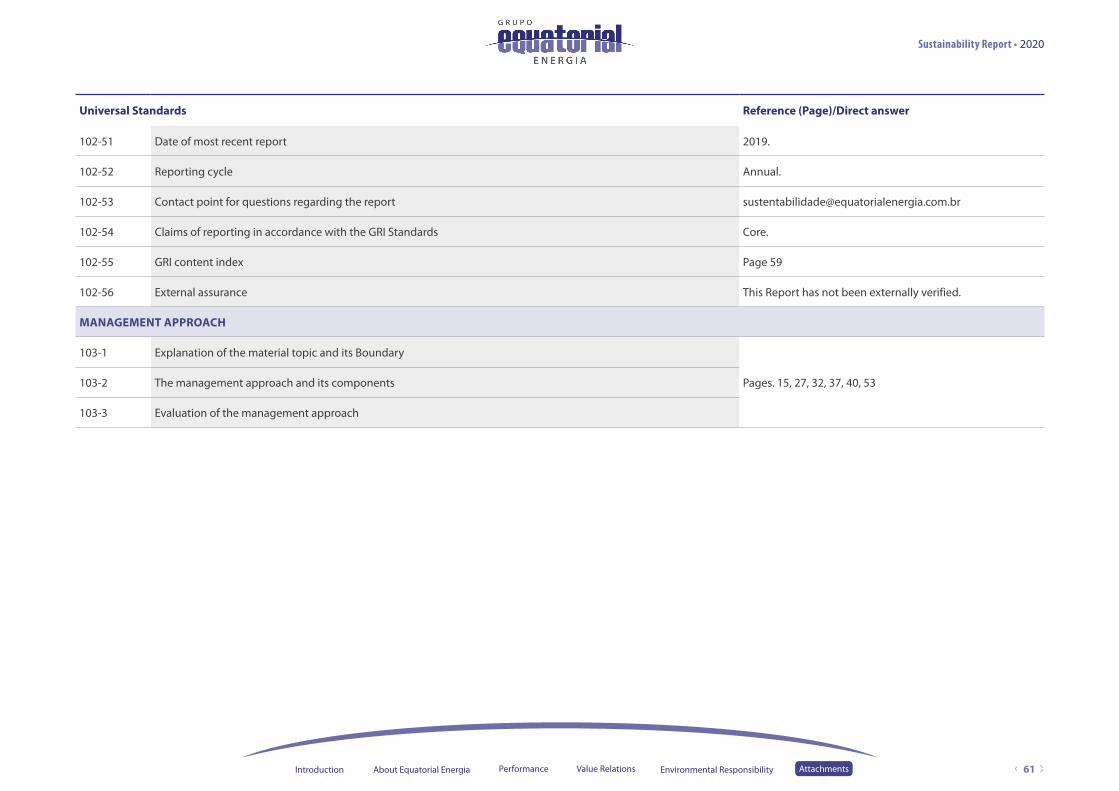
Universal Standards Reference (Page)/Direct answer
102-51 Date of most recent report 2019.
102-52 Reporting cycle Annual.
102-53 Contact point for questions regarding the report [email protected]
102-54 Claims of reporting in accordance with the GRI Standards Core.
102-55 GRI content index Page 59
102-56 External assurance This Report has not been externally verified.
MANAGEMENT APPROACH
103-1 Explanation of the material topic and its Boundary
Pages. 15, 27, 32, 37, 40, 53103-2 The management approach and its components
103-3 Evaluation of the management approach
Sustainability Report • 2020
61Introduction About Equatorial Energia Performance Value Relations Environmental Responsibility Attachments

Specific Content Reference (Page)/Direct answer
Economic Content
ECONOMIC PERFORMANCE
201-1 Direct economic value generated and distributed Page 27
ANTI-CORRUPTION
205-1Total number and percentage of operations assessed for risks related to corruption and significant risks related to corruption identified
Page 16
205-2 Communication and training about anti-corruption policies and procedures Page 16
Social Content
EMPLOYMENT
401-2 Benefits provided to full-time employees that are not provided to temporary or part-time employees Page 29
OCCUPATIONAL HEALTH AND SAFETY
403-2 Hazard identification, risk assessment, and incident investigation Page 35
403-3 Occupational health services Page 35
DIVERSITY AND EQUAL OPPORTUNITY
405-1Diversity of governance bodies and employees with percentage of individuals by gender, age group, minority or vulnerable groups and other indicators of diversity
Page 29. At Equatorial, 15.4% of the senior management is composed of women.
NON-DISCRIMINATION
413-2 Operations with significant actual and potential negative impacts on local communities Pages 45, 52
Social Content
SOCIOECONOMIC COMPLIANCE
EU16Policies and requirements regarding health and safety of employees and employees of contractors and subcontractors (DMA)
Page 35
EU18 Percentage of contractor and subcontractor employees that have undergone relevant health and safety training 87%
Sustainability Report • 2020
62Introduction About Equatorial Energia Performance Value Relations Environmental Responsibility Attachments

ANEEL Indicators
EQUATORIAL MARANHÃO
Operational and Productivity IndicatorsTechnical data (inputs, production capacity, sales, losses)
OPERATIONAL 2020 2019 2018
Number of Consumers Served – Captive 2,595,101 2,548,653 2,491,750
Number of Consumers Served – Free 180 125 95
Number of Locations Served (Municipalities) 217 217 217
Number of Own Employees 1,211 1,170 1,151
Number of Outsourced Employees 5,015 5,364 5,527
Number of Commercial Offices 117 117 117
Energy Supplied (MWh) /Employee 5,481 5,485 5,396
ENERGY PURCHASED (GWH) 2020 2019 2018
Energy Purchased (GWh) 7,883 7,631 7,588
1) Itaipu
2) Auction (including auction of the federal generators (Year 2002)) 7,630,700 7,588
3) Concessionaire Supply
Global Electricity Losses (Gwh) 1,512 1,411 1,292
ENERGY SOLD(GWH) 2020 2019 2018
Energy sold (Gwh) 6,637 6,417 6,211
Residential 3,570 3,304 3,205
Commercial 522 464 416
Industrial 1,184 1,250 1,235
Rural 265 225 201
Public Power 360 428 410
Public Lighting 391 415 427
Public Service 346 331 317
Sustainability Report • 2020
63Introduction About Equatorial Energia Performance Value Relations Environmental Responsibility Attachments

OPERATIONAL 2020 2019 2018
Number of Substations (un) 140 138 138
Installed Capacity (MVA) 3,099.6 3,074.792 3,044.04
Transmission Lines (km) 5,283 5,278 5,278
Distribution Networks (km) 109,940.7 109,516 109,349.7
Distribution Transformers (un) 138,837 135,451 133,903
Installed Capacity -MT (MVA) 293.5 290.57 287.7
Energy sold per installed capacity (GWh/MVA*hours/year) 2 2 2
Energy sold per employee (MWh) 5 5 5
Number of Consumers per Employee 2,143.089182 2,178.442735 2,164.939183
Added Value¹/GWh Sold 0
Average Residential Consumption per Consumer (kWh/Year) 129.99 121.60 120.63
Company's overall Equivalent Interruption Duration per Consumer Unit " DEC" – Calculated value 13.44 13.72 14.02
Company's overall Equivalent Interruption Duration per Consumer Unit " DEC" – Limit 16.72 17.35 18.03
Company's overall Equivalent Interruption Frequency per Consumer Unit "FEC" – Calculated value 6.02 6.56 6.93
Company's overall Equivalent Interruption Frequency per Consumer Unit "FEC" – Limit 10.21 10.82 11.47
Economic-Financial IndicatorsValue Added Statement (EC)
IN THOUSANDS OF REAIS
2020 2019 2018
1 – Revenues 5,419,542 5,118,951 5,132,903
1.1) Sales of goods, products and services 5,466,171 5,280,791 5,270,892
1.2) Other Revenues 1,438 -48,283 -29,272
1.3) Revenues related to the construction of own assets 0 0 0
1.4) Provision for Doubtful Receivables – Reversal/(Constitution) -48,067 -90,414 -72,290
1.5) Provision for civil, fiscal and labor lawsuits – (23,143) (36,427)
2 – Inputs Acquired From Third Parties (includes the values of taxes – ICMS, IPI, PIS and Cofins) (2,839,017) (2,534,561) (2,602,220)
2.1) Cost of products, goods and services sold -2,367,068 -2,172,825 -2,278,043
Sustainability Report • 2020
64Introduction About Equatorial Energia Performance Value Relations Environmental Responsibility Attachments

2.2) Materials, energy, third party services and others -433,515 -361,736 -324,177
2.3) Loss/Recovery of asset values 0 0 0
2.4) Others (specify) -38,434 0 0
3 – Gross Added Value (1-2) 2,580,525 2,584,390 2,530,683
4 – Depreciation, Amortization And Depletion -190,468 -183,792 -171,689
5 – Net Value Added Produced By The Entity (3-4) 2,390,057 2,400,598 2,358,994
6 – Added Value Received In Transfer 159,239 213,155 316,033
6.1) Equity accounting result
6.2) Financial revenues 159,239 213,155 316,033
6.3) Others
7 – Total Value Added To Be Distributed (5+6) 2,549,296 2,613,753 2,675,027
8 – Distribution Of Added Value 2,549,296 2,613,753 2,675,027
8.1) Personnel 123,305 124,900 106,946
8.1.1 – Direct compensation 66,290 98,963 91,786
8.1.2 – Benefits 49,003 34,553 30,379
8.1.3 – F.G.T.S 8,012 7,901 7,438
8.2) Taxes, fees and contributions (16,517) (22,657)
8.2.1 – Federal 1,530,203 1,622,100 1,606,348
8.2.2 – State 683,482 712,548 764,063
8.2.3 – Municipal 845,075 908,014 839,533
8.3) Return on Third Party Capital 1,646 1,538 2,752
8.3.1 – Interest 195,515 219,678 289,377
8.3.2 – Rents 158,985 183,407 220,184
8.3.3 – Others 1,629 1,876 4,156
8.4) Return on Equity 34,901 34,395 65,037
8.4.1 – Interest on Equity Capital 700,273 647,075 672,356
8.4.2 – Dividends
8.4.3 – Retained Earnings/Year's Loss 479,930 804,322 257,711
8.4.4 – Non-Controlling Interest in Retained Earnings (for consolidation only) 220,343 -157,247 414,645
Sustainability Report • 2020
65Introduction About Equatorial Energia Performance Value Relations Environmental Responsibility Attachments

Internal Social IndicatorsEmployees | Employability | Managers
GENERAL INFORMATION 2020 2019 2018
Total number of employees 1,211 1,170 1,151
Number of employees (outsourced, subcontracted, self-employed) by type of employment, employment contracts and region) 5,015 5,500 5.527
Employees aged up to 30 years old (%) 20.56% 22.05% 25.54%
Employees aged 31 to 40 (%) 48.06% 47.44% 45.87%
Employees aged 41 to 50 (%) 20.56% 19.32% 17.03%
Employees aged over 50 years (%) 10.82% 11.20% 11.56%
Number of women in relation to the total number of employees (%) 32.04% 30.26% 29.19%
Women in management positions – in relation to the total number of management positions (%) 25.99% 23.39% 21.52%
Black (black and brown) female employees – in relation to the total number of employees (%) 17.67% 16.67% 16.51%
Black (black and brown) male employees – in relation to the total number of employees (%) 43.77% 44.79% 45.26%
Black (black and brown) employees in managerial positions in relation to the total number of managerial positions (%) 48.33% 50.29% 49.37%
Interns in relation to the total number of employees (%) 2.15% 2.99% 3.39%
Employees in the apprentice hiring program (%) 1.07% 1.88%
Employees with disabilities 4.95% 4.96% 4.43%
COMPENSATION, BENEFITS AND CAREER 2020 2019 2018
Compensation
Gross payroll 80,922 80,449 128,366
Mandatory social charges 29,116 26,420 27,848
Benefits
Education 157 146 111
Food 15,960 15,937 13,543
Transportation 106 392 341
Health 14,878 14,510 13,460
Foundation 3,017 2,367 2,816
Safety and Occupational Medicine 573 822 843
Culture 0 0 0
Sustainability Report • 2020
66Introduction About Equatorial Energia Performance Value Relations Environmental Responsibility Attachments

Training and Professional Development 350 1,219 384
Day care centers or day care assistance 1,313 1,401 800
Other (specify): group insurance 268 305 262
PROFIT SHARING 2020 2019 2018
Total investment in the company's profit sharing program (R$ Thousand) 25,400 23,494 17,723
Amounts distributed in relation to gross payroll (%) 31.39% 29.20% 13.81%
Division of the highest compensation by the lowest compensation paid by the grantor 11.68 10.45 11.41
Division of the lowest compensation paid by the company by the minimum wage in effect 1.80 1.82 1.76
COMPENSATION PROFILE 2020 2019 2018
By Category (average salary in the current year) – R$
Board positions 9,522.49
Managerial positions 11,084.73 12,734.26 5,170.57
Administrative positions 4,827.85 4,270.89 3,482.65
Production positions 3,627.06 3,313.84 2,659.54
OCCUPATIONAL HEALTH AND SAFETY 2020 2019 2018
Average overtime per employee/year
Total company's TF rate (frequency rate) in the period for employees 2.49 4.37 0.7
Total company's TG rate (severity rate) in the period for employees 1,599.53 2.91 4
Total company's TF rate (frequency rate) in the period for outsourced/contracted employees 6.28 7.97 6.2
Total company's TG rate (severity rate) for outsourced/contracted employees 532.68 2,802.86 725
Total company's TF rate (frequency rate) in the period for workforce (own + subcontractors) 5.58 7.29 5.19
Total company's index TG (severity rate) in the period, for workforce (own + outsourced) 731.89 2,278.28 455.44
Deaths – own employees 0 0 0
Deaths – outsourced 1 3 1
PROFESSIONAL DEVELOPMENT 2020 2019 2018
Education profile – break down, in percentage, in relation to the total number of employees
Elementary school 0.33% 0.60% 0.61%
High school 39.64% 47.01% 46.22%
Technical education 1.49% 26.50% 22.85%
Sustainability Report • 2020
67Introduction About Equatorial Energia Performance Value Relations Environmental Responsibility Attachments

External Social IndicatorsCustomers | Consumers
Excellence in service
CONSUMERS AND COSTUMERS PROFILE 2020 2019 2018
Energy sales by tariff class (GWh): % Total
Residential 53.78% 51.50% 51.50%
Low Income Residential 16.20% 13.35% 14.80%
Commercial 17.84% 19.48% 19.80%
Industrial 7.86% 7.23% 6.70%
Rural 4.00% 3.50% 3.20%
Public Lighting 5.89% 6.47% 6.90%
Public Service 5.21% 5.16% 5.10%
Public power 5.43% 6.67% 6.60%
CUSTOMER SATISFACTION 2020 2019 2018
Satisfaction indexes obtained by the IASC Survey – ANEEL 61.85 64.99
Satisfaction indexes obtained by surveys from other entities (ABRADEE, Vox Populi and others) and/or own surveys (specify)
79.4 70.5 73.3
CUSTOMER SERVICE 2020 2019 2018
Call Center
Calls Received (units) 2,590,029 3,011,329 3,926,002
Average Number of Answerers (units) 335 105 140
INS – Service Level Index (%) 80.64% 87.24% 8,735.64%
IAb – Abandonment rate (%) 3.06% 2.19% 315.28%
ICO – Busy Calls Index (%) 0.00 0.02 1.67
TMA – Average Response Time (s) 162 154 162
Higher education 46,00% 41,03% 37,97%
Post-graduation (specialization, master's, doctorate) 12,55% 11,37% 11,03%
Amount invested in professional development and education (R$ thousand) 384
Average hours of training per year, per employee, broken down by functional category 25 19 45,5
Sustainability Report • 2020
68Introduction About Equatorial Energia Performance Value Relations Environmental Responsibility Attachments

VIOLATION OF COMMERCIAL SERVICE DEADLINES 2020 2019 2018
Calls made (units) 749,615
Revenues made after the deadline (units) 116,340
Call Answering Efficiency (%) 84.48%
Energy Efficiency ProgramProjects
Project Typology
2020 2019 2018
Investment (R$ thousand)
Source of Resources (R$ thousand)
Investment (R$ thousand)
Source of Resources (R$ thousand)
Investment (R$ thousand)
Source of Resources (R$ thousand)
Total % Own Third Party Clients Total % Own Third Party Clients Total % Own Third Party Clients
Industrial 0.00 0.00 0 0 -
Commerce and Services 425.48 3.85% 425.48 138,070.84 1% -
Public Power 1,038.88 9.40% 1,038.88 370,789.18 3.17% 370,789.18 210,355.01 1.80% 97.66
Public Service 0.00 0.00 0 0% -
Rural 0.00 0.00 0 0 -
Residential 160.84 1.46% 160.84 1.889.359,26 16% -
Low Income Residential 8,006.66 72.45% 8,006.66 9,693,836.75 82.83% 9,693,836.75 12.893.175,01 110.17% 2,538.49
Public Lighting 1,419.60 12.85% 1,419.60 1,638,556.21 14% 1,638,556.21 1.827.789,81 16% -
Municipal Energy Management 0.00 0.00 0 0 -
Educational 0.00 0.00 891.45 0% 891.45
Total 11,051.46 100.00% 11,051.46 11,703,182.14 100.00% 11,703,182.14 16,959,641.38 100.00% 3,527.60
Sustainability Report • 2020
69Introduction About Equatorial Energia Performance Value Relations Environmental Responsibility Attachments

Energy Efficiency ProgramProject Typology
Project Typology
2020 2019 2018
Unit servedEnergy Saved (WWh/year)
Peak Demand Reduction (kW)
Unit servedEnergy Saved (WWh/year)
Peak Demand Reduction (kW)
Unit servedEnergy Saved (WWh/year)
Peak Demand Reduction (kW)
Industrial 0 0 0 0 0
Commerce and Services 1 22.74 5 0 0 7 264.88 108.16
Public Power 157.55 13.02 3 188.4 39
Public Service 0 0 0 0 0
Rural 0 0 0 0 0
Residential 10 19.93 3.32 170,000 3,281.06 1,486.63
Low Income Residential 12,259 18,480.49 5,369.89 14,986.07 1,615.32 255,000 45,531.97 13,275.61
Public Lighting 7 415.35 94.83 781.29 178.39 20,000 433.45 99.23
Municipal Energy Management 0 0 0 0 0
Educational 0 0 0 0 0
Total 12,277 18,938.51 5,473.04 0 0.00 0
Electric Sector IndicatorsResources Applied to Research and Technological and Scientific Development R$ Thousand
By research theme (Research and Development Manual – ANEEL)2020 2019 2018
Value (R$) (%) Value (R$) (%) Value (R$) (%)
FA- Alternative Sources of Electric Energy Generation 10,043,358.95 70% 710,224.01 10% - -
GT – Thermoelectric Generation 0% – 0% - -
GB – Basin and Reservoir Management 0% – 0% - -
MA – Environment 248,266.99 2% – 0% - -
SE – Safety 766,574.40 5% – 0% - -
EE – Energy Efficiency 0% 4,566,987.60 64% 436.77 32.01%
PL – Power Systems Planning 268,244.48 2% – 0% - -
OP – Power Systems Operation 0% – 0% 654 47.93%
Sustainability Report • 2020
70Introduction About Equatorial Energia Performance Value Relations Environmental Responsibility Attachments

SC – Electric Power Systems Supervision, Control and Protection 1,595,524.76 11% 389,720.02 5% - -
QC – Electric Power Service Quality and Reliability 53,521.00 0% – 0% - -
MF – Measurement, Billing, and Combating Commercial Losses 1,156,214.17 8% 911,979.82 13% - -
OR – Other. 122,068.74 1% 538,165.38 8% 273.85 20.07%
Total 14,253,773.49 7,117,076.83 1,364.62
Environmental DimensionEnvironmental Indicators
RECOVERY OF DEGRADED AREAS 2020 2019 2018
Isolated protected network (ecological network or green line) in urban area (in km). 8,599.10 8,761.42 8,160.76
Percentage of isolated protected network/total distribution network in urban area – %. 6.04% 30.04% 28.57%
WASTE GENERATION AND TREATMENT 2020 2019 2018
Emission
Annual volume of greenhouse gases (CO2, CH4, N2O, HFC, PFC, SF6) emitted into the atmosphere (in tons of CO2 equivalent). 1,521.51 1,686.81 1,702.78
Annual volume of ozone-depleting gas emissions (in tons of CFC equivalents). N/A N/A N/A
Effluent
Total water discharge, by quality and destination N/A N/A
Solids
Annual amount (in tons) of solid waste generated (garbage, waste, garbage, etc.). 227.25 553.50 560.86
Quantity of waste contaminated by PCB (Ascarel) disposed of N/A 0 0
USE OF RESOURCES IN THE ORGANIZATION’S PRODUCTION PROCESS AND MANAGEMENT PROCESSES 2020 2019 2018
Total energy consumption by source: 7,883,306 7,630,980 7,588,209
Hydroelectric (in MWh) 5,202,952 4,081,412 5,743,999
Fossil fuels 2,431,961 3,310,545 1,622,045
Alternative sources (gas, wind, solar etc) 248,393 239,023 222,166
Energy consumption per kWh distributed (sold) 0.14% 0.15% 0.15%
Direct energy consumption broken down by primary energy source, in GJ
Diesel 328,797.19 L 12,301.06 12,425.29
Gasoline 313,089.434 L 11,912.00 11,987.68
Ethanol 0.00 0.00 0.00
Sustainability Report • 2020
71Introduction About Equatorial Energia Performance Value Relations Environmental Responsibility Attachments

Natural Gas N/A 0.000 0.000
Others (specify)
Total water consumption per source (in m3)
Supply (public network) 21,981 31,938 32,731
Underground source (well) 3,420 2,395 1,500
Surface catchment (water courses) N/A 0 0
Total water consumption (in m3) 25,401 34,333 34,231
Water consumption per employee (in m3) 20.48 29.34 28.77
ENVIRONMENTAL EDUCATION AND AWARENESS 2020 2019 2018
Environmental education – Community – In the organization
Number of employees trained in environmental education programs. 35 247 343
Percentage of employees trained in environmental education programs/total employees. 3% 26% 29%
Number of hours of environmental training/total hours of training. 0.01000 0.00012 0.00020
Environmental Education – Community 1 - -
Number of elementary and high school units served. 5 147 367
Number of students served. 220 22,091 35,298
Number of trained teachers. 3 582 417
Number of technical and higher education units served. 2 1
Number of students served. 50 37
ENVIRONMENTAL PERFORMANCE 2020 2019 2018
Vegetal suppression N/A N/A
Pruning Volume of waste generated in kg per month. N/A N/A
Oil Leakage (Points of leakage per month). - -
Sustainability Report • 2020
72Introduction About Equatorial Energia Performance Value Relations Environmental Responsibility Attachments

Transmission Lines (km) 1,854 1,935
Distribution Networks (km) 42,171 42,875
Distribution Transformers (un) 30,435 28,828
Average Residential Consumption per Consumer (kWh/Year) 123.55 119.38 109.73
Company's overall Equivalent Interruption Duration per Consumer Unit " DEC" – Calculated value 66.13 38.68 19.25
Company's overall Equivalent Interruption Duration per Consumer Unit " DEC" – Limit 15.48 15.48 15.5
Company's overall Equivalent Interruption Frequency per Consumer Unit "FEC" – Calculated value 19.1 16.32 9.55
Company’s overall Equivalent Interruption Frequency per Consumer Unit “FEC” – Limit 12.94 12.94 12.95
Number of Commercial Offices 104 104 104
Energy Supplied (MWh) /Employee 3,741
Energy generated (Gwh) 0 0 -
ENERGY PURCHASED (GWH) 2020 2019 2018
Energy Purchased (GWh) 4,661 4,789 4,770
1) Itaipu
2) Auction (including auction of the federal generators (Year 2002)) 4,661 4,789 4,765
ENERGY SOLD(GWH) 2020 2019 2018
Energy sold(Gwh) 3,175 3,171 3,187
Residential 1,555 1,438 1,434
Commercial 611 692 690
Industrial 144 199 246
Rural 205 170 189
Public Power 150 198 186
Public Lighting 278 253 226
Public Service 232 221 215
OPERATIONAL 2020 2019 2018
Number of Substations (un) 40 40 40
Installed Capacity (MVA) 1,007 1,007 974.5
Sustainability Report • 2020
73Introduction About Equatorial Energia Performance Value Relations Environmental Responsibility Attachments

Economic-Financial IndicatorsValue Added Statement (EC)
In thousands of reais
2020 2019 2018
1 – Revenues 2,857,029 3,037,059 2,874,919
1.1) Sales of goods, products and services 2,852,761 2,944,593 2,850,423
1.2) Other Revenues 1,609 30,925 8,033
1.3) Revenues related to the construction of own assets – – 126,728
1.4) Provision for Doubtful Receivables – Reversal/(Constitution) 2,659 61,541 (110,265)
2 – Inputs Acquired From Third Parties (includes the values of taxes – ICMS, IPI, PIS and Cofins) (1,538,232) (1,428,108) (1,512,604)
2.1) Cost of products, goods and services sold (1,372,583) (1,262,895) (1,136,213)
2.2) Materials, energy, third party services and others (136,878) (165,213) (139,893)
2.3) Loss/Recovery of asset values – – –
2.4) Others (specify) (28,771) – (236,498)
3 – Gross Added Value (1-2) 1,318,797 1,608,951 1,362,315
4 – Depreciation, Amortization And Depletion (63,186) (53,120) (47,969)
Transmission Lines (km) 1,854 1,935
Distribution Networks (km) 42,171 42,875
Distribution Transformers (un) 30,435 28,828
Average Residential Consumption per Consumer (kWh/Year) 123.55 119.38 109.73
Company's overall Equivalent Interruption Duration per Consumer Unit " DEC" – Calculated value 66.13 38.68 19.25
Company's overall Equivalent Interruption Duration per Consumer Unit " DEC" – Limit 15.48 15.48 15.5
Company's overall Equivalent Interruption Frequency per Consumer Unit "FEC" – Calculated value 19.1 16.32 9.55
Company’s overall Equivalent Interruption Frequency per Consumer Unit “FEC” – Limit 12.94 12.94 12.95
Sustainability Report • 2020
74Introduction About Equatorial Energia Performance Value Relations Environmental Responsibility Attachments

5 – Net Value Added Produced By The Entity (3-4) 1,255,611 1,555,831 1,314,346
6 – Added Value Received In Transfer 205,615 834,313 185,686
6.1) Equity accounting result – – –
6.2) Financial revenues 205,615 834,313 185,686
6.3) Others – – –
7 – Total Value Added To Be Distributed (5+6) 1,461,226 2,390,144 1,500,032
8 – Distribution Of Added Value 1,461,226 2,287,671 1,500,032
8.1) Personnel 66,998 166,354 159,487
8.1.1 – Direct compensation 43,945 87,022 98,452
8.1.2 – Benefits 16,588 27,466 53,193
8.1.3 – F.G.T.S 6,465 51,866 7,842
8.2) Taxes, fees and contributions 733,579 720,504 1,065,313
8.2.1 – Federal 282,869 295,756 523,689
8.2.2 – State 449,842 424,399 435,124
8.2.3 – Municipal 868 349 106,500
8.3) Return on Third Party Capital 207,359 1,053,991 253,347
8.3.1 – Interest 159,739 162,610 241,945
8.3.2 – Rents 523 5,801 11,402
8.3.3 – Others 47,097 885,580 –
8.4) Return on Equity 453,290 346,822 21,885
8.4.1 – Interest on Equity Capital – – –
8.4.2 – Dividends – – –
8.4.3 – Retained Earnings/Year's Loss 453,290 346,822 21,885
8.4.4 – Non-Controlling Interest in Retained Earnings (for consolidation only) – – –
Sustainability Report • 2020
75Introduction About Equatorial Energia Performance Value Relations Environmental Responsibility Attachments
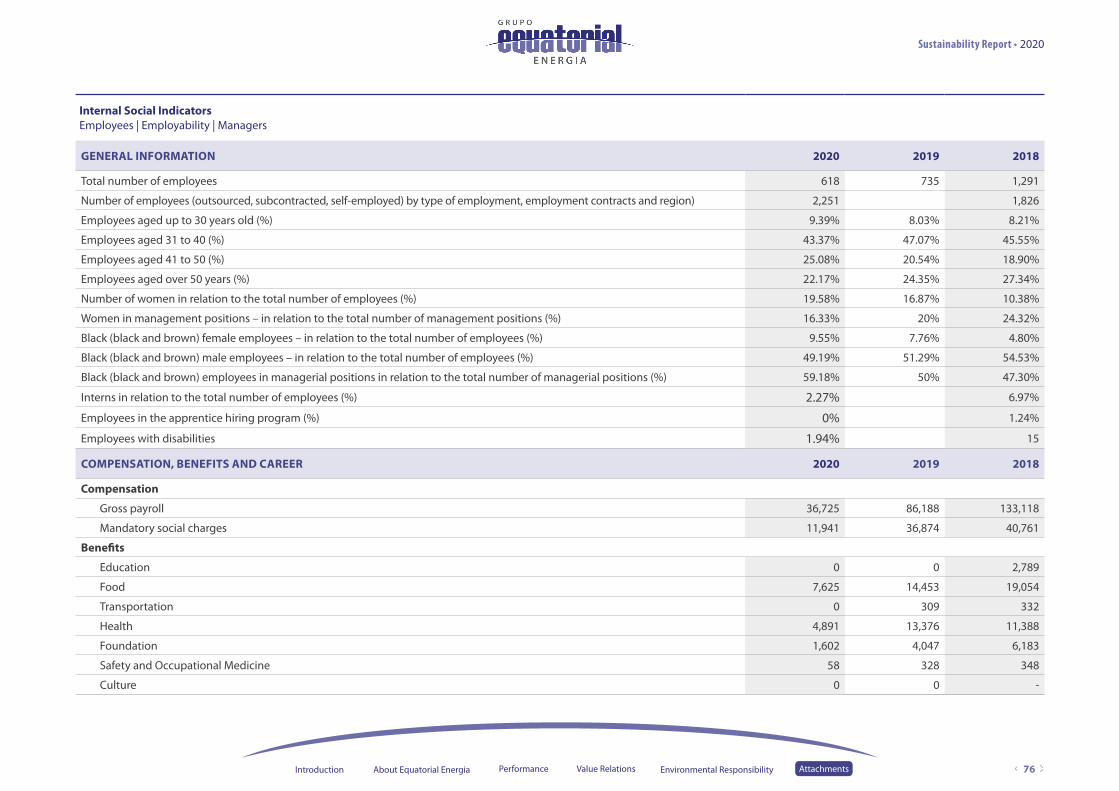
Internal Social IndicatorsEmployees | Employability | Managers
GENERAL INFORMATION 2020 2019 2018
Total number of employees 618 735 1,291
Number of employees (outsourced, subcontracted, self-employed) by type of employment, employment contracts and region) 2,251 1,826
Employees aged up to 30 years old (%) 9.39% 8.03% 8.21%
Employees aged 31 to 40 (%) 43.37% 47.07% 45.55%
Employees aged 41 to 50 (%) 25.08% 20.54% 18.90%
Employees aged over 50 years (%) 22.17% 24.35% 27.34%
Number of women in relation to the total number of employees (%) 19.58% 16.87% 10.38%
Women in management positions – in relation to the total number of management positions (%) 16.33% 20% 24.32%
Black (black and brown) female employees – in relation to the total number of employees (%) 9.55% 7.76% 4.80%
Black (black and brown) male employees – in relation to the total number of employees (%) 49.19% 51.29% 54.53%
Black (black and brown) employees in managerial positions in relation to the total number of managerial positions (%) 59.18% 50% 47.30%
Interns in relation to the total number of employees (%) 2.27% 6.97%
Employees in the apprentice hiring program (%) 0% 1.24%
Employees with disabilities 1.94% 15
COMPENSATION, BENEFITS AND CAREER 2020 2019 2018
Compensation
Gross payroll 36,725 86,188 133,118
Mandatory social charges 11,941 36,874 40,761
Benefits
Education 0 0 2,789
Food 7,625 14,453 19,054
Transportation 0 309 332
Health 4,891 13,376 11,388
Foundation 1,602 4,047 6,183
Safety and Occupational Medicine 58 328 348
Culture 0 0 -
Sustainability Report • 2020
76Introduction About Equatorial Energia Performance Value Relations Environmental Responsibility Attachments

Training and Professional Development 78 93 936
Day care centers or day care assistance 796 2,886 1,923
Other (specify): group insurance 1,150 220 19
PROFIT SHARING 2020 2019 2018
Total investment in the company's profit sharing program (R$ Thousand) 6,448 4,330
Amounts distributed in relation to gross payroll (%) 17.56% 0.00% 3.25%
Division of the highest compensation by the lowest compensation paid by the grantor 29.77 33.25
Division of the lowest compensation paid by the company by the minimum wage in effect 0.89 1.52
COMPENSATION PROFILE 2020 2019 2018
By Category (average salary in the current year) – R$
Board positions 24,266.09
Managerial positions 9,580.32 9,074.56 11,089.57
Administrative positions 4,465.11 4,792.33 7,510.85
Production positions 3,833.18 3,519.94 4,314.27
OCCUPATIONAL HEALTH AND SAFETY 2020 2019 2018
Average overtime per employee/year 126
Total company's TF rate (frequency rate) in the period for employees 10.45 5.39 4.78
Total company's TG rate (severity rate) in the period for employees 30.49 23.17 354
Total company's TF rate (frequency rate) in the period for outsourced/contracted employees 15.79 5.39 4.95
Total company's TG rate (severity rate) for outsourced/contracted employees 117 1,941.31 254
Total company's TF rate (frequency rate) in the period for workforce (own + subcontractors) 14.77 5.39 4.88
Total company's index TG (severity rate) in the period, for workforce (own + outsourced) 100.34 1,230.57 298
Deaths – own employees 0 0 0
Deaths – outsourced 0 1 0
PROFESSIONAL DEVELOPMENT 2020 2019 2018
Education profile – break down, in percentage, in relation to the total number of employees
Elementary school 15.37% 18.50% 18.36%
High school 34.63% 46.12% 49.88%
Technical education 0.97% 0.41% 9.30%
Sustainability Report • 2020
77Introduction About Equatorial Energia Performance Value Relations Environmental Responsibility Attachments

Higher education 42.72% 28.71% 19.05%
Post-graduation (specialization, master's, doctorate) 6.31% 6.26% 3.41%
Amount invested in professional development and education (R$ thousand) 93 725
Average hours of training per year, per employee, broken down by functional category 2 17 45.5
External Social IndicatorsCustomers | Consumers
Excellence in service
CUSTOMER SATISFACTION 2020 2019 2018
Satisfaction indexes obtained by the IASC Survey – ANEEL 64.2 63.49
Satisfaction indexes obtained by surveys from other entities (ABRADEE, Vox Populi and others) and/or own surveys (specify)
72.7 56.6 62.3
CUSTOMER SERVICE 2020 2019 2018
Call Center
Calls Received (units) 1,204,168 1,391,641 610,735
Average Number of Answerers (units) 335 44 30
INS – Service Level Index (%) 80.84% 92.55% 92.31%
IAb – Abandonment rate (%) 3.19% 1.76% 2.41%
ICO – Busy Calls Index (%) 0.06 0.14 -
TMA – Average Response Time (s) 163 154 2.58
VIOLATION OF COMMERCIAL SERVICE DEADLINES 2020 2019 2018
Calls made (units) 462,112 302,001
Revenues made after the deadline (units) 31,301 24,204
Call Answering Efficiency (%) 93.23% 91.98%
NUMBER OF CONSUMER COMPLAINTS FORWARDED 2020 2019 2018
To ANEEL – state/regional agencies 425 716 918
To PROCON 425 1,337 789
To the courts 2,934 3,217 1,467
Sustainability Report • 2020
78Introduction About Equatorial Energia Performance Value Relations Environmental Responsibility Attachments

Energy Efficiency ProgramProjects
Project Typology
2020 2019 2018
Investment (R$ thousand) Source of Resources (R$ thousand) Investment (R$ thousand) Source of Resources (R$ thousand) Investment (R$ thousand) Source of Resources (R$ thousand)
Total % Own Third Party Clients Total % Own Third Party Clients Total % Own Third Party Clients
Industrial
Commerce and Services
Public Power 3,193.66 19.14% 3,193.66 1,774,332.16 10.29% 1,774,332.16 97.66 2.77% 97.66
Public Service 3,004.29 18.01% 3,004.29
Rural
Residential 793.84 4.76% 237.84 6,026,733.05 34.95% 6,026,733.05
Low Income Residential 8,771.73 52.58% 9,327.73 5,443,318.33 31.56% 5,443,318.33 2,538.49 71.96% 2,538.49
Public Lighting 919.18 5.51% 919.18 3,552,726.13 20.60% 3,552,726.13
Municipal Energy Management
Educational 449,212.81 2.60% 449,212.81 891.45 25.27% 891.45
Total 16,682.70 100.00% 16,682.70 17,246,322.48 100% 17,246,322.48 3,527.60 100% 3,527.60
Sustainability Report • 2020
79Introduction About Equatorial Energia Performance Value Relations Environmental Responsibility Attachments

Energy Efficiency ProgramProject Typology
Project Typology
2020 2019 2018
Unit servedEnergy Saved (WWh/year)
Peak Demand Reduction (kW)
Unit servedEnergy Saved (WWh/year)
Peak Demand Reduction (kW)
Unit servedEnergy Saved (WWh/year)
Peak Demand Reduction (kW)
Industrial
Commerce and Services
Public Power 3 871.53 68.35 2 557.3 60.73 2 557.3 60.73
Public Service
Rural
Residential 20,010 1,041.93 189.99 3,908 2,295.14 346.11 3,908 2,295.14 346.11
Low Income Residential 5,544 392.19 57.51 10,000 1,662.36 466.75 10,000 1,662.36 466.75
Public Lighting
Municipal Energy Management
Educational 40 N/A N/A 84 N/A N/A
Total 25,557 2,305.65 315.85 20,721 3,443.65 521.21
Electric Sector IndicatorsResources Applied to Research and Technological and Scientific Development R$ Thousand
By research theme (Research and Development Manual – ANEEL)2020 2019 2018
Value (R$) (%) Value (R$) (%) Value (R$) (%)
FA- Alternative Sources of Electric Energy Generation 1,852,632.13 24% 710,224.01 10% - -
GT – Thermoelectric Generation 0% – 0% - -
GB – Basin and Reservoir Management 0% – 0% - -
MA – Environment 0% – 0% - -
SE – Safety 0% – 0% - -
EE – Energy Efficiency 0% 4,566,987.60 64% - -
Sustainability Report • 2020
80Introduction About Equatorial Energia Performance Value Relations Environmental Responsibility Attachments

PL – Power Systems Planning 0% – 0% - -
OP – Power Systems Operation 0% – 0% - -
SC – Electric Power Systems Supervision, Control and Protection 1,298,742.35 17% 389,720.02 5% - -
QC – Electric Power Service Quality and Reliability 0% – 0% - -
MF – Measurement, Billing, and Combating Commercial Losses 4,532,122.84 58% 911,979.82 13% - -
OR – Other. 117,058.00 2% 538,165.38 8% - -
Total 7,800,555.32 7,117,076.83 - -
Environmental DimensionEnvironmental Indicators
RECOVERY OF DEGRADED AREAS 2020 2019 2018
Isolated protected network (ecological network or green line) in urban area (in km). 1,449.66 3,175.76 1,855.94
Percentage of isolated protected network/total distribution network in urban area – %. 3.36% 7.42% 18.90%
WASTE GENERATION AND TREATMENT 2020 2019 2018
Emission
Annual volume of greenhouse gases (CO2, CH4, N2O, HFC, PFC, SF6) emitted into the atmosphere (in tons of CO2 equivalent). 681.096 879.112 N/A
Annual volume of ozone-depleting gas emissions (in tons of CFC equivalents). N/A N/A
Effluent
Total water discharge, by quality and destination N/A N/A
Solids
Annual amount (in tons) of solid waste generated (garbage, waste, garbage, etc.). 2,330 N/A N/A
Quantity of waste contaminated by PCB (Ascarel) disposed of N/A N/A N/A
USE OF RESOURCES IN THE ORGANIZATION’S PRODUCTION PROCESS AND MANAGEMENT PROCESSES 2020 2019 2018
Total energy consumption by source:
Energy consumption per kWh distributed (sold) 4,661,320.575 4,788,994.652 4,864,000
Hydroelectric (in MWh) 2,363,848 2,712,829 2,748,884.77
Fossil fuels 640,459 755,107 622,892
Alternative sources (gas, wind, solar etc) 1,657,014 1,321,058 1,492,223.63
Ethanol 170,423 L N/A N/A
Sustainability Report • 2020
81Introduction About Equatorial Energia Performance Value Relations Environmental Responsibility Attachments

Natural Gas 111,727 L N/A N/A
Others (specify) 40 L - -
Total water consumption per source (in m3) N/A
Supply (public network) 6,838 4,882 5,562
Underground source (well) 1,200 N/A N/A
Surface catchment (water courses) N/A N/A
Total water consumption (in m3) 4,665.38 4,882 5,562
Water consumption per employee (in m3) 7.90 8.07 4.31
ENVIRONMENTAL EDUCATION AND AWARENESS 2020 2019 2018
Environmental education – Community – In the organization 4 -
Number of employees trained in environmental education programs. 65 93 -
Percentage of employees trained in environmental education programs/total employees. 10.55 7.42 -
Number of hours of environmental training/total hours of training. 0.0172 73 -
Environmental Education – Community 7 -
Number of elementary and high school units served. 0 41 84
Number of students served. 0 6,491 14,542
Number of trained teachers. 0 268 602
Number of technical and higher education units served. 0 0 -
Number of students served. 0 0 -
ENVIRONMENTAL PERFORMANCE 2020 2019 2018
Vegetal suppression N/A N/A
Pruning Volume of waste generated in kg per month. N/A N/A
Oil Leakage (Points of leakage per month). N/A -
Sustainability Report • 2020
82Introduction About Equatorial Energia Performance Value Relations Environmental Responsibility Attachments

EQUATORIAL PARÁ
Operational and Productivity IndicatorsTechnical data (inputs, production capacity, sales, losses)
OPERATIONAL 2020 2019 2018
Number of Consumers Served – Captive 2,732,774 2,710,305 2,643,582
Number of Consumers Served – Free 360 281 197
Number of Locations Served (Municipalities) 144 144 144
Number of Own Employees 1,219 1,273 1,367
Number of Outsourced Employees 6,739 7,442
Number of Commercial Offices 79 79
Energy Supplied (MWh) /Employee 2,242 2,129 1,934
ENERGY PURCHASED (GWH) 2020 2019 2018
Energy Purchased (GWh) 11,457 11,544 11,273
1) Itaipu 11,273.39
2) Auction (including auction of the federal generators (Year 2002)) 11,543,412 7,588
ENERGY SOLD(GWH) 2020 2019 2018
Energy sold (Gwh) 7,334 7,193 7,343
Residential 3,929 3,612 3,672
Commercial 1,407 1,477 1,526
Industrial 465 520 579
Rural 310 283 276
Public Power 481 554 526
Public Lighting 477 490 507
Public Service 264 256 258
Sustainability Report • 2020
83Introduction About Equatorial Energia Performance Value Relations Environmental Responsibility Attachments

OPERATIONAL 2020 2019 2018
Number of Substations (un) 117 117 117
Installed Capacity (MVA) 3,787 3,653 3,652.99
Transmission Lines (km) 4,524 5,721 5,721
Distribution Networks (km) 152,425 149,160 149,160
Distribution Transformers (un) 153,558 157,609 157,609
Average Residential Consumption per Consumer (kWh/Year)
Company's overall Equivalent Interruption Duration per Consumer Unit " DEC" – Calculated value 24.35 21.88 20.12
Company's overall Equivalent Interruption Duration per Consumer Unit " DEC" – Limit 29.2 28.53 27.58
Company's overall Equivalent Interruption Frequency per Consumer Unit "FEC" – Calculated value 15.55 12.25 10.8
Company's overall Equivalent Interruption Frequency per Consumer Unit "FEC" – Limit 25.09 23.4 22.2
Economic-Financial IndicatorsValue Added Statement (EC)
IN THOUSANDS OF REAIS
2020 2019 2018
1 – Revenues 7,800,841 7,780,021 7,533,710
1.1) Sales of goods, products and services 8,011,990 8,152,458 7,699,106
1.2) Other Revenues 948 (184,066) (39,802)
1.3) Revenues related to the construction of own assets – – –
1.4) Provision for Doubtful Receivables – Reversal/(Constitution) (212,097) (173,215) (127,237)
1.5) Provision for civil, fiscal and labor lawsuits – (15,156) 1,643
2 – Inputs Acquired From Third Parties (Includes The Values Of Taxes – Icms, Ipi, Pis And Cofins) (4,051,462) (4,065,580) (4,143,209)
2.1) Cost of products, goods and services sold (3,471,992) (3,571,399) (3,625,649)
2.2) Materials, energy, third party services and others (395,547) (379,626) (412,568)
2.3) Loss/Recovery of asset values
2.4) Others (specify) (183,923) (114,555) (104,992)
3 – Gross Added Value (1-2) 3,749,379 3,714,441 3,390,501
4 – Depreciation, Amortization And Depletion (312,043) (306,964) (249,963)
Sustainability Report • 2020
84Introduction About Equatorial Energia Performance Value Relations Environmental Responsibility Attachments

5 – Net Value Added Produced By The Entity (3-4) 3,437,336 3,407,477 3,140,538
6 – Added Value Received In Transfer 519,985 430,533 455,645
6.1) Equity accounting result
6.2) Financial revenues 519,985 430,533 455,645
6.3) Others
7 – Total Value Added To Be Distributed (5+6) 3,957,321 3,838,010 3,596,183
8 – Distribution Of Added Value 3,957,321 3,838,010 3,596,183
8.1) Personnel 133,150 130,193 143,471
8.1.1 – Direct compensation 96,263 105,822 113,189
8.1.2 – Benefits 27,539 40,554 40,264
8.1.3 – F.G.T.S 9,348 9,654 12,820
8.2) Taxes, fees and contributions (25,837) (22,802)
8.2.1 – Federal 2,392,348 2,673,378 2,293,265
8.2.2 – State 1,032,509 1,248,967 996,803
8.2.3 – Municipal 1,358,701 1,423,340 1,296,314
8.3) Return on Third Party Capital 1,138 1,071 148
8.3.1 – Interest 713,279 565,323 704,055
8.3.2 – Rents 609,791 365,120 534,779
8.3.3 – Others 457 (989) 12,970
8.4) Return on Equity 103,031 201,192 156,306
8.4.1 – Interest on Equity Capital 718,544 469,116 455,392
8.4.2 – Dividends
8.4.3 – Retained Earnings/Year's Loss 581,863 331,295 88,168
8.4.4 – Non-Controlling Interest in Retained Earnings (for consolidation only) 136,681 137,821 367,224
Sustainability Report • 2020
85Introduction About Equatorial Energia Performance Value Relations Environmental Responsibility Attachments

Internal Social IndicatorsEmployees | Employability | Managers
GENERAL INFORMATION 2020 2019 2018
Total number of employees 1,219 1,273 1,367
Number of employees (outsourced, subcontracted, self-employed) by type of employment, employment contracts and region) 6,739 7,442
Employees aged up to 30 years old (%) 16.30% 16.50% 17.34%
Employees aged 31 to 40 (%) 36.00% 36.37% 38.70%
Employees aged 41 to 50 (%) 32.50% 31.50% 28.31%
Employees aged over 50 years (%) 15.20% 15.63% 15.65%
Number of women in relation to the total number of employees (%) 30.60% 31.42% 32.19%
Women in management positions – in relation to the total number of management positions (%) 18.11% 20.14% 21.19%
Black (black and brown) female employees – in relation to the total number of employees (%) 20.26% 20.50% 20.48%
Black (black and brown) male employees – in relation to the total number of employees (%) 48.81% 47.92% 46.67%
Black (black and brown) employees in managerial positions in relation to the total number of managerial positions (%) 60.63% 59.71% 59.60%
Interns in relation to the total number of employees (%) 3.86% 5.11% 4.90%
Employees in the apprentice hiring program (%) N/A 3.69% 0.95%
Employees with disabilities 5.74% 5.42% 7.20%
COMPENSATION, BENEFITS AND CAREER 2020 2019 2018
Compensation
Gross payroll 70,563 81,198 140,088
Mandatory social charges 26,618 27,204 29,026
Benefits
Education 149 147 138
Food 15,412 16,658 15,004
Transportation 105 338 390
Health 15,596 14,725 13,946
Foundation 2,605 3,134 4,457
Safety and Occupational Medicine 499 470 627
Culture 0 0
Sustainability Report • 2020
86Introduction About Equatorial Energia Performance Value Relations Environmental Responsibility Attachments

Training and Professional Development 396 910 316
Day care centers or day care assistance 1,563 1,756 1,628
Other (specify): group insurance 6,773 142 2,121
PROFIT SHARING 2020 2019 2018
Total investment in the company's profit sharing program (R$ Thousand) 17,624 14,945 25,320
Amounts distributed in relation to gross payroll (%) 24.98% 18.41% 18.07%
Division of the highest compensation by the lowest compensation paid by the grantor 18.22 15.78
Division of the lowest compensation paid by the company by the minimum wage in effect 1.57 1.535821643
COMPENSATION PROFILE 2020 2019 2018
By Category (average salary in the current year) – R$Board positions 8,434.64
Managerial positions 11,009.02 16,343.75 8,689.88
Administrative positions 4,791.57 4,100.55 3,494.70
Production positions 3,657.51 3,243.88 2,950.22
OCCUPATIONAL HEALTH AND SAFETY 2020 2019 2018
Average overtime per employee/year
Total company's TF rate (frequency rate) in the period for employees 2.89 3.09 4.37
Total company's TG rate (severity rate) in the period for employees 2,179.5 15.79 25.91
Total company's TF rate (frequency rate) in the period for outsourced/contracted employees 4.88 5.06 4.86
Total company's TG rate (severity rate) for outsourced/contracted employees 1,820.90 810.5 789.36
Total company's TF rate (frequency rate) in the period for workforce (own + subcontractors) 4.58 4.76 4.79
Total company's index TG (severity rate) in the period, for workforce (own + outsourced) 1,874.96 688.18 675.03
Deaths – own employees 1 0 0
Deaths – outsourced 4 2 1
PROFESSIONAL DEVELOPMENT 2020 2019 2018
Education profile – break down, in percentage, in relation to the total number of employees
Elementary school 2.20% 3.46% 1.10%
High school 44.02% 53.81% 39.36%
Technical education 4.05% 1.89% 18.51%
Higher education 44.08% 34.88% 35.11%
Post-graduation (specialization, master's, doctorate) 5.68% 5.97% 5.93%
Amount invested in professional development and education (R$ thousand) 0.23%
Sustainability Report • 2020
87Introduction About Equatorial Energia Performance Value Relations Environmental Responsibility Attachments

External Social IndicatorsCustomers | Consumers
Excellence in service
CUSTOMER SATISFACTION 2020 2019 2018
Satisfaction indexes obtained by the IASC Survey – ANEEL 52.28 50.01
Satisfaction indexes obtained by surveys from other entities (ABRADEE, Vox Populi and others) and/or own surveys (specify)
65.5 48.04 65.8
CUSTOMER SERVICE 2019 2018
Call Center
Calls Received (units) 2,749,597 3,429,198 4,443,252
Average Number of Answerers (units) 335 130 161
INS – Service Level Index (%) 81.20% 87.09% 86.67
IAb – Abandonment rate (%) 2.59% 2.05% 2.43%
ICO – Busy Calls Index (%) 0 0 0.46
TMA – Average Response Time (s) 175 161 162
VIOLATION OF COMMERCIAL SERVICE DEADLINES 2020 2019 2018
Calls made (units) 1,005,200
Revenues made after the deadline (units) 145,155
Call Answering Efficiency (%) 85.56%
Sustainability Report • 2020
88Introduction About Equatorial Energia Performance Value Relations Environmental Responsibility Attachments

Energy Efficiency ProgramProjects
Project Typology2020 2019 2018
Investment (R$ thousand) Source of Resources (R$ thousand) Investment (R$ thousand) Source of Resources (R$ thousand) Investment (R$ thousand) Source of Resources (R$ thousand)Total % Own Third Party Clients Total % Own Third Party Clients Total % Own Third Party Clients
Industrial 0 0.00% - -
Commerce and Services – 338,724.55 1.06% 338,724.55 1,589,538.07 4.53% - -
Public Power 20.00 0.07% 20.00 103,622.50 0.32% 103,622.50 217,817.91 0.62% - -
Public Service 746,131.2 2.12% - -
Rural 0 0.00% - -
Residential 6,920.93 25.91% 6,920.93 7,081,025.51 22.13% 7,081,025.51 2,240,889.97 6.38% - -
Low Income Residential 17,138.37 64.17% 17,138.37 22,653,487.44 70.80% 22,653,487.44 24,776,795.28 70.54% - -
Public Lighting 2,629.46 9.84% 2,629.46 1,818,697.42 5.68% 1,818,697.42 5,554,005.64 15.81% - -
Municipal Energy Management 0 0.00% - -
Educational 0 0.00% 455.35 -
Total 26,708.76 100% 26,708.76 31,995,557.42 100% 31,995,557.42 35,125,178.07 100% 455.35 -
Energy Efficiency ProgramProject Typology
Project Typology
2020 2019 2018
Unit servedEnergy Saved (WWh/year)
Peak Demand Reduction (kW)
Unit servedEnergy Saved (WWh/year)
Peak Demand Reduction (kW)
Unit servedEnergy Saved (WWh/year)
Peak Demand Reduction (kW)
Industrial 0 0 0
Commerce and Services 1 454.76 113.49 2 264.88 108.16
Public Power 1 174.88 52.60 1 15.90 4.78 3 188.4 39
Public Service 1 190.78 57.38 0 0 0
Rural
Residential 33,478 11,515.44 1,626.91 33,478 6,428.21 2,278.62 170,000 3,281.06 1,486.63
Low Income Residential 64,206 12,391.43 2,191.98 64,206 12,878.48 2,206.35 255,000 45,531.97 13,275.61
Sustainability Report • 2020
89Introduction About Equatorial Energia Performance Value Relations Environmental Responsibility Attachments

Public Lighting 9.00 1,162.63 269.28 6.79 3,217.69 745.00 20,000 433.45 99.23
Municipal Energy Management
Educational
Total 97,694 25,244 4,141 97,692 22,995 5,348 445,005 49,700 15,009
Electric Sector IndicatorsResources Applied to Research and Technological and Scientific Development R$ Thousand
By research theme (Research and Development Manual – ANEEL)2019 2018
Value (R$) Value (R$) (%) Value (R$) (%)
FA – Alternative Sources of Electric Energy Generation 186,623.90 3% 1,906,689.56 13% 0%
GT – Thermoelectric Generation 0% 0% 0%
GB – Basin and Reservoir Management 0% 0% 0%
MA – Environment 487,239.50 7% 376,773.05 3% 1,131,307.43 6%
SE – Safety 2,120,608.00 30% 1,436,724.80 10% 2,027,258.55 11%
EE – Energy Efficiency 539,604.00 8% 0% 0%
PL – Power Systems Planning 484,399.65 7% 0% 5,835,316.2 30%
OP – Power Systems Operation 0% 7,937,917.94 55% 542,560 3%
SC – Electric Power Systems Supervision, Control and Protection 2,017,747.09 29% 0% 7,929,532.34 41%
QC – Electric Power Service Quality and Reliability 59,921.16 1% 0% 559,859.96 3%
MF – Measurement, Billing, and Combating Commercial Losses 680,663.90 10% 1,612,567.65 11% 1,010,032.99 5%
OR – Other. 421,672.51 6% 3,190,111.89 22% 117,800 1%
Total 6,998,479.71 14,554,095.34 19,153,667.47
Sustainability Report • 2020
90Introduction About Equatorial Energia Performance Value Relations Environmental Responsibility Attachments
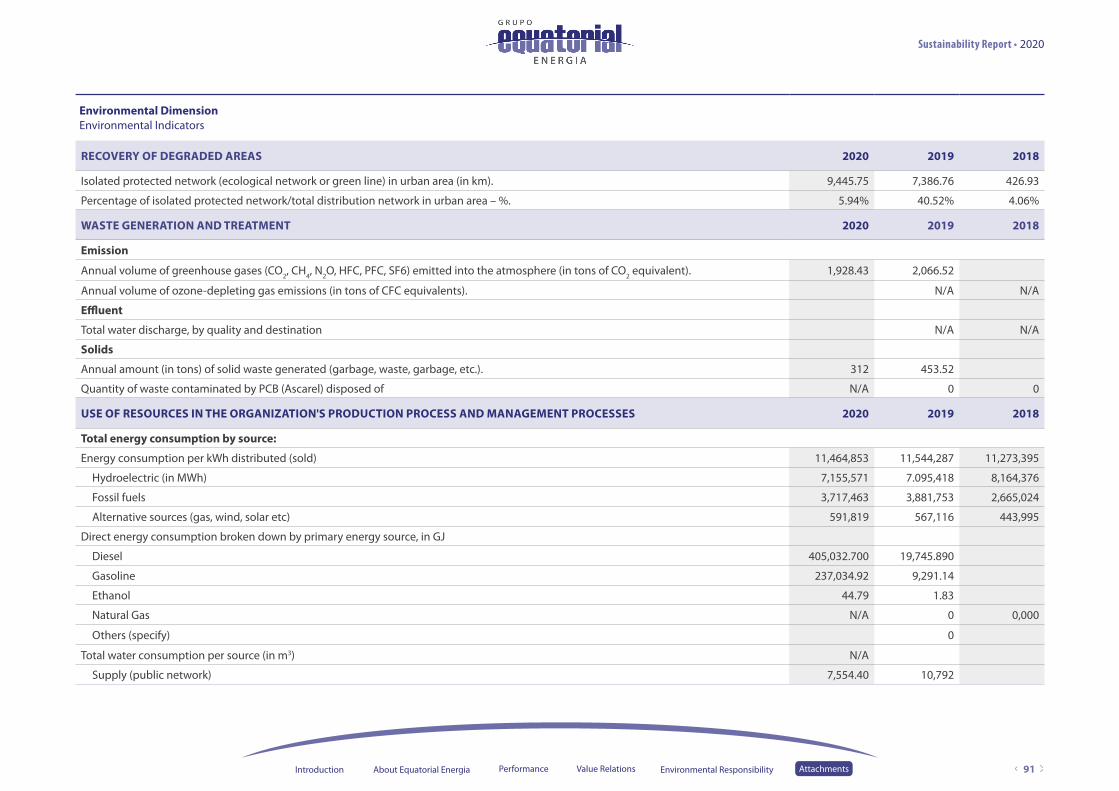
Environmental DimensionEnvironmental Indicators
RECOVERY OF DEGRADED AREAS 2020 2019 2018
Isolated protected network (ecological network or green line) in urban area (in km). 9,445.75 7,386.76 426.93
Percentage of isolated protected network/total distribution network in urban area – %. 5.94% 40.52% 4.06%
WASTE GENERATION AND TREATMENT 2020 2019 2018
Emission
Annual volume of greenhouse gases (CO2, CH4, N2O, HFC, PFC, SF6) emitted into the atmosphere (in tons of CO2 equivalent). 1,928.43 2,066.52
Annual volume of ozone-depleting gas emissions (in tons of CFC equivalents). N/A N/A
Effluent
Total water discharge, by quality and destination N/A N/A
Solids
Annual amount (in tons) of solid waste generated (garbage, waste, garbage, etc.). 312 453.52
Quantity of waste contaminated by PCB (Ascarel) disposed of N/A 0 0
USE OF RESOURCES IN THE ORGANIZATION'S PRODUCTION PROCESS AND MANAGEMENT PROCESSES 2020 2019 2018
Total energy consumption by source:
Energy consumption per kWh distributed (sold) 11,464,853 11,544,287 11,273,395
Hydroelectric (in MWh) 7,155,571 7.095,418 8,164,376
Fossil fuels 3,717,463 3,881,753 2,665,024
Alternative sources (gas, wind, solar etc) 591,819 567,116 443,995
Direct energy consumption broken down by primary energy source, in GJ
Diesel 405,032.700 19,745.890
Gasoline 237,034.92 9,291.14
Ethanol 44.79 1.83
Natural Gas N/A 0 0,000
Others (specify) 0
Total water consumption per source (in m3) N/A
Supply (public network) 7,554.40 10,792
Sustainability Report • 2020
91Introduction About Equatorial Energia Performance Value Relations Environmental Responsibility Attachments

Underground source (well) 44,316.30 34,722 2,669,196
Surface catchment (water courses) N/A 0 0
Total water consumption (in m3) 51,807.70 45,514
Water consumption per employee (in m3) 10 36
ENVIRONMENTAL EDUCATION AND AWARENESS 2020 2019 2018
Environmental education – Community – In the organization 20 -
Number of employees trained in environmental education programs. 16 95 275
Percentage of employees trained in environmental education programs/total employees. 0.1% 7% 2.011%
Number of hours of environmental training/total hours of training. 0.00091 0.03 76.00
Environmental Education – Community -
Number of elementary and high school units served. 40 35
Number of students served. 1,513 1,582
Number of trained teachers. 0 75
Number of technical and higher education units served. 0 4
Number of students served. 0 117
ENVIRONMENTAL PERFORMANCE 2020 2019 2018
Vegetal suppression 6,648.32 Ha 1,639.67 Ha N/A
Pruning Volume of waste generated in kg per month. 1,289.16 2,683.17 N/A
Oil Leakage (Points of leakage per month). N/A N/A -
Sustainability Report • 2020
92Introduction About Equatorial Energia Performance Value Relations Environmental Responsibility Attachments

EQUATORIAL PIAUÍ
Operational and Productivity IndicatorsTechnical data (inputs, production capacity, sales, losses)
OPERATIONAL 2020 2019 2018
Number of Consumers Served – Captive 1,328,384 1,300,842 1,246,161
Number of Consumers Served – Free 96 22 15
Number of Locations Served (Municipalities) 224 224 224
Number of Own Employees 1,109
Number of Outsourced Employees
Number of Commercial Offices
Energy Supplied (MWh) /Employee 3,295
Energy generated (Gwh)
ENERGY PURCHASED (GWH) 2020 2019 2018
Energy Purchased (GWh) 5,420 5,250 5,295
1) Itaipu
2) Auction (including auction of the federal generators (Year 2002))
3) Concessionaire Supply
Global Electricity Losses (Gwh) 1,054 1,217 1,378
Electric Losses – Total (%) over the energy requirement 24.30% 28.07%
Technical losses – (%) of the energy requirement 12.17% 12.28%
Non-Technical Losses (%) – over Energy Requirement 12.13% 15.78%
ENERGY SOLD(GWH) 2020 2019 2018
Energy sold(Gwh) 3,689 3,654 3,397
Residential 1,888 1,776 1,656
Commercial 729 812 770
Industrial 191 208 200
Rural 225 178 174
Public Power 205 265 254
Public Lighting 256 228 168
Public Service 194 187 175
Sustainability Report • 2020
93Introduction About Equatorial Energia Performance Value Relations Environmental Responsibility Attachments

Economic-Financial IndicatorsValue Added Statement (EC)
IN THOUSANDS OF REAIS
2020 2019 2018
1 – Revenues 3.484.434 3.671.885 3.058.532
1.1) Sales of goods, products and services 3.487.989 3.464.332 3.117.730
1.2) Other Revenues 7.094 102.947 –
1.3) Revenues related to the construction of own assets – – –
1.4) Provision for Doubtful Receivables – Reversal/(Constitution) (10.649) 104.606 (59.198)
2 – Inputs Acquired From Third Parties (includes the values of taxes – ICMS, IPI, PIS and Cofins) (1.665.435) (2.026.104) (1.712.853)
OPERATIONAL 2020 2019 2018
Number of Substations (un) 94 90 90
Installed Capacity (MVA) 1,530.5 1,465.5 1,465.5
Transmission Lines (km) 3,049 3,028 3,028
Distribution Networks (km) 100,783 97,516 92,910
Distribution Transformers (un) 74,636 71,746 66,369
Installed Capacity -MT (MVA) 2,049 1,982 1,840
Energy sold per installed capacity (GWh/MVA*hours/year) 20,173 21,291 19,822
Energy sold per employee (MWh) 4,896 3,212 1,649
Number of Consumers per Employee 1,850 1,173 620
Average Residential Consumption per Consumer (kWh/Year) 143 131 123
Company's overall Equivalent Interruption Duration per Consumer Unit " DEC" – Calculated value 23.4 21.89 23.52
Company's overall Equivalent Interruption Duration per Consumer Unit " DEC" – Limit 20.55 19,17 20.66
Company's overall Equivalent Interruption Frequency per Consumer Unit "FEC" – Calculated value 16.41 14,69 14.07
Company's overall Equivalent Interruption Frequency per Consumer Unit "FEC" – Limit 14.05 12,43 13.98
Sustainability Report • 2020
94Introduction About Equatorial Energia Performance Value Relations Environmental Responsibility Attachments

2.1) Cost of products, goods and services sold (1,630,995) (1,880,194) (1,498,750)
2.2) Materials, energy, third party services and others (180,588) (145,910) (186,000)
2.3) Loss/Recovery of asset values 162,791 – –
2.4) Others (specify) (16,643) – (28,103)
3 – Gross Added Value (1-2) 1,818,999 1,645,781 1,345,679
4 – Depreciation, Amortization And Depletion (145,423) (95,550) (49,174)
5 – Net Value Added Produced By The Entity (3-4) 1,673,576 1,550,231 1,296,505
6 – Added Value Received In Transfer 243,488 284,048 932,840
6.1) Equity accounting result – – –
6.2) Financial revenues 243,488 284,048 932,840
6.3) Others – – –
7 – Total Value Added To Be Distributed (5+6) 1,917,064 1,834,279 2,229,345
8 – Distribution Of Added Value 1,917,064 1,740,660 2,155,683
8.1) Personnel 62,463 164,886 313,776
8.1.1 – Direct compensation 38,110 106,778 179,416
8.1.2 – Benefits 10,646 31,744 34,210
8.1.3 – F.G.T.S 13,707 26,364 100,150
8.2) Taxes, fees and contributions 943,754 1,048,204 1,076,459
8.2.1 – Federal 338,392 367,173 468,915
8.2.2 – State 605,260 680,799 606,866
8.2.3 – Municipal 102 232 678
8.3) Return on Third Party Capital 291,447 434,291 836,074
8.3.1 – Interest 242,350 276,662 582,019
8.3.2 – Rents (231) 4,049 9,169
8.3.3 – Others 49,328 153,580 244,886
8.4) Return on Equity 619,400 93,279 (70,626)
8.4.1 – Interest on Equity Capital – – –
8.4.2 – Dividends – – –
8.4.3 – Retained Earnings/Year's Loss 619,400 93,279 (70,626)
8.4.4 – Non-Controlling Interest in Retained Earnings (for consolidation only) – – –
Sustainability Report • 2020
95Introduction About Equatorial Energia Performance Value Relations Environmental Responsibility Attachments

Internal Social IndicatorsEmployees | Employability | Managers
GENERAL INFORMATION 2020 2019 2018
Total number of employees 718 1,109
Number of employees (outsourced, subcontracted, self-employed) by type of employment, employment contracts and region) 2,967
Employees aged up to 30 years old (%) 18.94% 18.03%
Employees aged 31 to 40 (%) 50.42% 50.50%
Employees aged 41 to 50 (%) 19.08% 19.84%
Employees aged over 50 years (%) 11.56% 11.63%
Number of women in relation to the total number of employees (%) 17.55% 13.35%
Women in management positions – in relation to the total number of management positions (%) 9.38% 28.57%
Black (black and brown) female employees – in relation to the total number of employees (%) 11.84% 9.11%
Black (black and brown) male employees – in relation to the total number of employees (%) 63.93% 69.16%
Black (black and brown) employees in managerial positions in relation to the total number of managerial positions (%) 50.00% 39.29%
Interns in relation to the total number of employees (%) N/A
Employees in the apprentice hiring program (%) 3.62%
Employees with disabilities 2.37%
COMPENSATION, BENEFITS AND CAREER 2020 2019 2018
Compensation
Gross payroll 45,663 89,953
Mandatory social charges 20,592 30,437
Benefits
Education 0 0
Food 11,330 13,434
Transportation 42 618
Health 5,057 3,829
Foundation 721
Safety and Occupational Medicine 146 26
Sustainability Report • 2020
96Introduction About Equatorial Energia Performance Value Relations Environmental Responsibility Attachments

Culture 0 0
Training and Professional Development 86 84
Day care centers or day care assistance 990 1,199
Other (specify): group insurance 23,592 2,654
COMPENSATION PROFILE 2020 2019 2018
By Category (average salary in the current year) – R$
Board positions
Managerial positions 10,838.33 11,690.35
Administrative positions 4,779.45 4,903.13
Production positions 4,111.19 4,362.66
OCCUPATIONAL HEALTH AND SAFETY 2020 2019 2018
Average overtime per employee/year
Total company's TF rate (frequency rate) in the period for employees 5.64 8.39
Total company's TG rate (severity rate) in the period for employees 34.41 89.01
Total company's TF rate (frequency rate) in the period for outsourced/contracted employees 9.82 9.51
Total company's TG rate (severity rate) for outsourced/contracted employees 3,884.5 111.77
Total company's TF rate (frequency rate) in the period for workforce (own + subcontractors) 8.71 8.97
Total company's index TG (severity rate) in the period, for workforce (own + outsourced) 2,860.08 100.80
Deaths – own employees 0 0
Deaths – outsourced 3 0
PROFESSIONAL DEVELOPMENT 2020 2019 2018
Education profile – break down, in percentage, in relation to the total number of employees
Elementary school 2.00% 3.88%
High school 43.31% 63.75%
Technical education 1.11% 0.63%
Higher education 51.20% 30.03%
Post-graduation (specialization, master's, doctorate) 2.37% 1.71%
Sustainability Report • 2020
97Introduction About Equatorial Energia Performance Value Relations Environmental Responsibility Attachments

External Social IndicatorsCustomers | Consumers
Excellence in service
CONSUMERS AND COSTUMERS PROFILE 2020 2019 2018
Energy sales per tariff class (GWh): % Total
Residential 51.12% 46.85% 46.90%
Low Income Residential 15.46% 10.55% 9.74%
Commercial 19.74% 21.42% 21.81%
Industrial 5.18% 5.49% 5.67%
Rural 6.10% 4.68% 4.92%
Public Lighting 6.93% 7% 7.20%
Public Service 5.25% 6.03% 4.76%
Public power 5.55% 4.92% 4.96%
CUSTOMER SATISFACTION 2020 2019 2018
Satisfaction indexes obtained by the IASC Survey – ANEEL 61.44
Satisfaction indexes obtained by surveys from other entities (ABRADEE, Vox Populi and others) and/or own surveys (specify) 73.0 58.5 52.4
CUSTOMER SERVICE 2020 2019 2018
Call Center
Calls Received (units) 1,688,081 1,391,641
Average Number of Answerers (units) 335 44
INS – Service Level Index (%) 82.23% 92.55%
IAb – Abandonment rate (%) 4.93% 1.76%
ICO – Busy Calls Index (%) 0.01 0.14
TMA – Average Response Time (s) 151 154
Sustainability Report • 2020
98Introduction About Equatorial Energia Performance Value Relations Environmental Responsibility Attachments

Energy Efficiency ProgramProjects
Project Typology
2020 2019 2018
Investment (R$ thousand) Source of Resources (R$ thousand) Investment (R$ thousand) Source of Resources (R$ thousand)
Investment (R$ thousand)
Source of Resources (R$ thousand)
Total % Own Third Party Clients Total % OwnThird Party
Clients Total % OwnThird Party
Clients
Industrial 0 0
Commerce and Services
Public Power 103.89 0.46% 103.89 259,120.73 0,98%
Public Service
Rural
Residential 5,528.96 24.52% 5,528.96 4,993,658.56 18,80%
Low Income Residential 11,574.49 51.34% 11,574.49 13,102,583.22 49,32%
Public Lighting 5,339.23 23.68% 5,339.23 8,209,139.48 30,90%
Municipal Energy Management
Educational
Total 22,546.57 100.00% 22,546.57 26,564,501.99 100% 0 100%
VIOLATION OF COMMERCIAL SERVICE DEADLINES 2020 2019 2018
Calls made (units) 496,799
Revenues made after the deadline (units) 16,623
Call Answering Efficiency (%) 96.65%
NUMBER OF CONSUMER COMPLAINTS FORWARDED 2020 2019 2018
To ANEEL – state/regional agencies 872 1,168 899
To PROCON 425 1,337
To the courts 2,934 3,217
Sustainability Report • 2020
99Introduction About Equatorial Energia Performance Value Relations Environmental Responsibility Attachments

Energy Efficiency ProgramProject Typology
Project Typology
2020 2019 2018
Unit servedEnergy Saved (WWh/year)
Peak Demand Reduction (kW)
Unit servedEnergy Saved (WWh/year)
Peak Demand Reduction (kW)
Unit servedEnergy Saved (WWh/year)
Peak Demand Reduction (kW)
Industrial
Commerce and Services 2 264.88 108.16
Public Power 2 168.23 13.77 3 188.4 39
Public Service
Rural
Residential 12,510 720.73 183.02 1,751.31 483.45 170,000 3,281.06 1,486.63
Low Income Residential 8,544 1,620.95 193.88 1,474.72 377.8 255,000 45,531.97 13,275.61
Public Lighting 9 2,435.94 525.46 20,000 433.45 99.23
Municipal Energy Management
Educational
Total 21,063 2,341.68 902.36
Electric Sector IndicatorsResources Applied to Research and Technological and Scientific Development R$ Thousand
By research theme (Research and Development Manual – ANEEL)2020 2019 2018
Value (R$) (%) Value (R$) (%) Value (R$) (%)
FA – Alternative Sources of Electric Energy Generation 0 0%
GT – Thermoelectric Generation 0 0%
GB – Basin and Reservoir Management 0 0%
MA – Environment 0 0%
SE – Safety 0 0%
EE – Energy Efficiency 2,462,040.69 1,615,804.23 18%
PL – Power Systems Planning 2,900,424.66 0 0%
Sustainability Report • 2020
100Introduction About Equatorial Energia Performance Value Relations Environmental Responsibility Attachments

OP – Power Systems Operation 6,046,192.23 5,590,877.57 64%
SC – Electric Power Systems Supervision, Control and Protection 0 0%
QC – Electric Power Service Quality and Reliability 0 0%
MF – Measurement, Billing, and Combating Commercial Losses 2,471,997.91 1,530,613.57 17%
OR – Other. 43,726.49 36,011.94 0%
Total 13,924,381.98 8,773,307.31 0
Environmental DimensionEnvironmental Indicators
RECOVERY OF DEGRADED AREAS 2020 2019 2018
Isolated protected network (ecological network or green line) in urban area (in km). 1,361.15 846.92
Percentage of isolated protected network/total distribution network in urban area – %. 1.4% 26%
WASTE GENERATION AND TREATMENT 2020 2019 2018
Emission
Annual volume of greenhouse gases (CO2, CH4, N2O, HFC, PFC, SF6) emitted into the atmosphere (in tons of CO2 equivalent). 1,679.70 2,143.32
Annual volume of ozone-depleting gas emissions (in tons of CFC equivalents). N/A
Effluent
Total water discharge, by quality and destination N/A N/A
Solids
Annual amount (in tons) of solid waste generated (garbage, waste, garbage, etc.). 243.97 N/A
Quantity of waste contaminated by PCB (Ascarel) disposed of N/A 0
USE OF RESOURCES IN THE ORGANIZATION'S PRODUCTION PROCESS AND MANAGEMENT PROCESSES 2020 2019 2018
Total energy consumption by source: 5,397,899 5,250,372 5,294,992
Hydroelectric (in MWh) 4,063,185 3,854,535 4,126,180
Fossil fuels 1,202,954 1,267,178 1,051,436
Alternative sources (gas, wind, solar etc) 131,759 128,659 117,377
Energy consumption per kWh distributed (sold) 0.12% 0.11% 0.16%
Direct energy consumption broken down by primary energy source, in GJ
Sustainability Report • 2020
101Introduction About Equatorial Energia Performance Value Relations Environmental Responsibility Attachments

Diesel 548,432 L 12
Gasoline 113,593 L 19,165
Ethanol 42 L 4,987.29
Natural Gas N/A
Others (specify) N/A
Total water consumption per source (in m3)
• supply (public network) 10,902
• underground source (well) 2,160
• surface catchment (water courses) N/A
Total water consumption (in m3) 12,789.45
Water consumption per employee (in m3) 18
ENVIRONMENTAL EDUCATION AND AWARENESS 2020 2019 2018
Environmental education – Community – In the organization 6 0
Number of employees trained in environmental education programs. 18 0
Percentage of employees trained in environmental education programs/total employees. 2.50% 0
Number of hours of environmental training/total hours of training. 0.00035 0
Environmental Education – Community 0
Number of elementary and high school units served. 0
Number of students served. 0
Number of trained teachers. 0
Number of technical and higher education units served. 0
Number of students served. 0
ENVIRONMENTAL PERFORMANCE 2020 2019 2018
Vegetal suppression N/A N/A
Pruning Volume of waste generated in kg per month. N/A N/A
Oil Leakage (Points of leakage per month). N/A -
Sustainability Report • 2020
102Introduction About Equatorial Energia Performance Value Relations Environmental Responsibility Attachments

Additional Indicators for Equatorial Energia Group
ENVIRONMENTAL INDICATORS
INDICATOR
Energy Efficiency Goals
1 - Economic Feasibility (Cost-Benefit Ratio – RCB < 0.8): It aims to indicate the investments that would bring economic benefits, from the consumption reduction provided by the energy efficiency actions.2 - Indicator Benefits:• Annual Energy Savings (MWh/year);• Tons of waste sent for recycling; • Amount of CO2 captured;• Trees preserved;• Energy Generated by Alternative Source (KWp);• Disposal of inefficient equipment (lamps, refrigerators, etc.); • Water savings in recycling;• Retrofit of Lighting Systems, refrigeration and air conditioning.
Environmental Management Team
The department specialized in the environmental management of the processes is the Environmental Corporate Executive, linked to the Environmental and Expansion Planning Corporate Management. It is up to the specialized department to identify and define a internal normative standard, based on the ISO 14000 international norm, aiming to make the prior identification and the environmental impacts control related to the business more efficient. Additionally, the area's processes are strengthened by the Environmental Management System.
Total energy use (gigajoule)/million in revenue R$ 33,30
Total water use/million in revenue R$ 27,52
Biodiversity Impact Reduction
The identification of the impacts on biodiversity and its risks related to the deployment of our assets is done by means of specific environmental studies carried out prior to the deployment of each project.
The main risks of impacts on biodiversity in these studies are related to the construction phase of power distribution and transmission lines and networks, and they concern the opening of right-of-way and access roads, and in the maintenance phase, the cleaning of right-of-way.
Another aspect related to risks on biodiversity in the deployment and maintenance phases of assets is related to the interference in Conservation Units in their various categories and environmentally sensitive areas such as Permanent Preservation Areas (APPs).
It should be noted that, after the impacts are identified, measures to eliminate, mitigate or compensate the negative impacts on biodiversity are evaluated, prior to the implementation of the future asset.
Sustainability Report • 2020
103Introduction About Equatorial Energia Performance Value Relations Environmental Responsibility Attachments

Total Waste/Million in Revenue R$ 0,91
Total Hazardous Waste/million in Revenue R$ 0,10
Self-reported environmental fines/revenues in million 0,26
SOCIAL INDICATORS
INDICATOR
Employee satisfactionThe year 2020 was an unusual year in terms of participation in surveys to identify employee satisfaction due to the Covid pandemic. But for 15 years the company Equatorial MA remained in the rankings of best companies of Você S/A magazine and Great Place to Work, as well as Equatorial PA that remained for 8 years.
Salary Gap (The CEO's total salary (or highest salary) divided by average salaries and benefits)
17.22
Net job creation 7,375
Employee Turnover 21.36%
Female Employees 27.94%
Female Managers 19.82
Flexible working hoursEquatorial Energia Group has initiatives that contribute to the balance between work and personal life, such as the implementation of a time bank. It has also embraced remote work during the worst pandemic period.
Daycare ServicesEquatorial Energia Group grants its employees the Day Care Aid benefit, comprising the reimbursement of these expenses, with special coverage for children with special needs, observing the criteria established in the normative instruments.
Employees with Disability 2.18%
Employee health and safety training hours 24,608
Occupational Diseases We had no occupational diseases recorded.
Lost Days/Millions of Working Days 1,495
Average training hours 9.1
Sustainability Report • 2020
104Introduction About Equatorial Energia Performance Value Relations Environmental Responsibility Attachments

Training costs per employee R$ 233,276
Freedom of Association Policy
The relationship between the company and the unions is guided by respect and recognition of the institutions' legitimacy as representatives of the workers, within the ethical principles and values that guide good union practices. To this end, negotiation is the main way to adjust conduct and establish rights and duties between the parties. The group guarantees the right of free association, organization, and union mobilization to all of its employees, and makes use of internal communication channels to disclose and report on the negotiations' progress. Together with the unions, it negotiates solutions for issues involving workers, whose rights are guaranteed by the Collective Labor Agreements in force, Equatorial Energia's Code of Ethics and national and international laws on human and labor rights that the company is committed to respecting and complying with. Collective bargaining clauses are inspected by unions representing the employees and by public labor inspection agencies.
Business Ethics improvement tools
The company has a dedicated channel for receiving accusations from all its own employees and third parties, which operates 24 hours a day, seven days a week.
The Company's Code of Ethics and Conduct includes information on business ethics, possible code violations, as well as corrective actions aimed at improving our processes.
Whistleblower ProtectionThe Code of Ethics and Conduct, in its paragraph 26.6, grants to the accused the confidentiality of the data reported in the complaint, as well as assures the anonymity of the whistleblower source, and even in the website for reporting there is an option for the whistleblower to remain anonymous when reporting.
Product Liability Monitoring
The possible impacts on distribution services are mainly related to the interruption of power supply, scheduled or not, which generates risks to consumers dependent on appliances for health, safety, economic activities, among others. There is also the possibility of insecurity and the risk of electric shock or fire due to eventual broken cables in the grid and improper contact with the grid. This situation is made worse in low-income communities, due to irregular installations and the flying of kites near the power grid.
To mitigate and minimize these risks, the Group's companies develop communication campaigns so as to communicate, sensitize and educate local populations. We also have a program called Segundos de Vida (Seconds of Life), which aims to raise awareness about safety. In transmission activities, the operation impacts apply, in particular, to noise, which can be identified in the vicinity of substations and high-voltage networks. As a solution, the companies are integrated with the communities and follow strict environmental controls.
Customer satisfactionConsidering the ANEEL Consumer Satisfaction Index, we have good results in the distributors, on a scale of 1 to 10, 10 being excellent:• Maranhão: 7.4 • Pará: 6.8 • Piaui: 7.1 • Alagoas: 7.2
GOVERNANCE INDICATORS
INDICATOR
Internal Audit Department ReportsThe Audit, Risks and Internal Controls Management is linked to the Board of Directors, and is overseen by the Audit Committee – COAUD, where besides defining the Annual Audit Plan, it oversees the work carried out, and is independent of the Audit Manager.
Sustainability Report • 2020
105Introduction About Equatorial Energia Performance Value Relations Environmental Responsibility Attachments
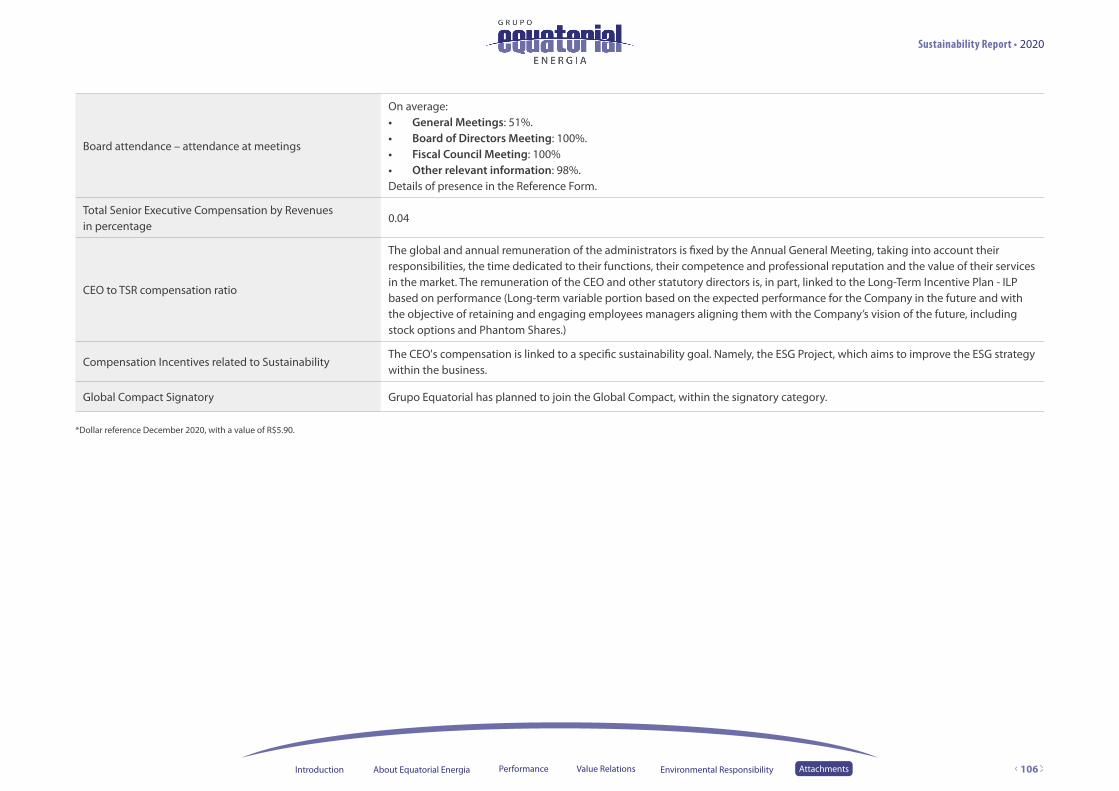
Board attendance – attendance at meetings
On average:• General Meetings: 51%.• Board of Directors Meeting: 100%.• Fiscal Council Meeting: 100%• Other relevant information: 98%.Details of presence in the Reference Form.
Total Senior Executive Compensation by Revenues in percentage
0.04
CEO to TSR compensation ratio
The global and annual remuneration of the administrators is fixed by the Annual General Meeting, taking into account their responsibilities, the time dedicated to their functions, their competence and professional reputation and the value of their services in the market. The remuneration of the CEO and other statutory directors is, in part, linked to the Long-Term Incentive Plan - ILP based on performance (Long-term variable portion based on the expected performance for the Company in the future and with the objective of retaining and engaging employees managers aligning them with the Company’s vision of the future, including stock options and Phantom Shares.)
Compensation Incentives related to SustainabilityThe CEO's compensation is linked to a specific sustainability goal. Namely, the ESG Project, which aims to improve the ESG strategy within the business.
Global Compact Signatory Grupo Equatorial has planned to join the Global Compact, within the signatory category.
*Dollar reference December 2020, with a value of R$5.90.
Sustainability Report • 2020
106Introduction About Equatorial Energia Performance Value Relations Environmental Responsibility Attachments

CreditsCoordinationEquatorial EnergiaPresidency
Customer Experience, Digital and External Communication Superintendent
External Communication, Marketing and Sustainability Management
Editorial project:writing, GRI consulting and Integrated Reporting and translationRICCA Sustentabilidadewww.riccari.wixsite.com/sustentabilidade
Graphic design: layout, diagramming and illustrationsRICCA Sustentabilidadewww.riccari.wixsite.com/sustentabilidade
PhotosBanco de Imagens Equatorial Energia
Equatorial Energia MaranhãoAlameda A, Quadra SQS, no 100 Loteamento
Quitandinha – Alto do Cahau
CEP: 65071-680
+55 (98) 3217-2325
Equatorial Energia ParáRodovia Augusto Montenegro, S/N, Km 8,5
Bairro do Coqueiro – Belém – PA
CEP: 66823-010
+55 (91) 3216-1480
Equatorial PiauíRua. João Cabral, nº 730 – CEP: 64001-030 – Teresina/PI
Equatorial Energia PiauíAvenida Fernandes Lima, 349, Farol – CEP: 57.052-902 – Maceió/AL
+55 (82) 2126-9352
Customer Service:www.equatorialenergia.com.br
Sustainability Report • 2020
107Introduction About Equatorial Energia Performance Value Relations Environmental Responsibility Attachments
G R U P O