SUSTAINABILITY REPORT - Amazon AWS
42
2019 SUSTAINABILITY REPORT
-
Upload
khangminh22 -
Category
Documents
-
view
0 -
download
0
Transcript of SUSTAINABILITY REPORT - Amazon AWS

2019SUSTAINABILITY REPORT

2
3
2019SUSTAINABILITY
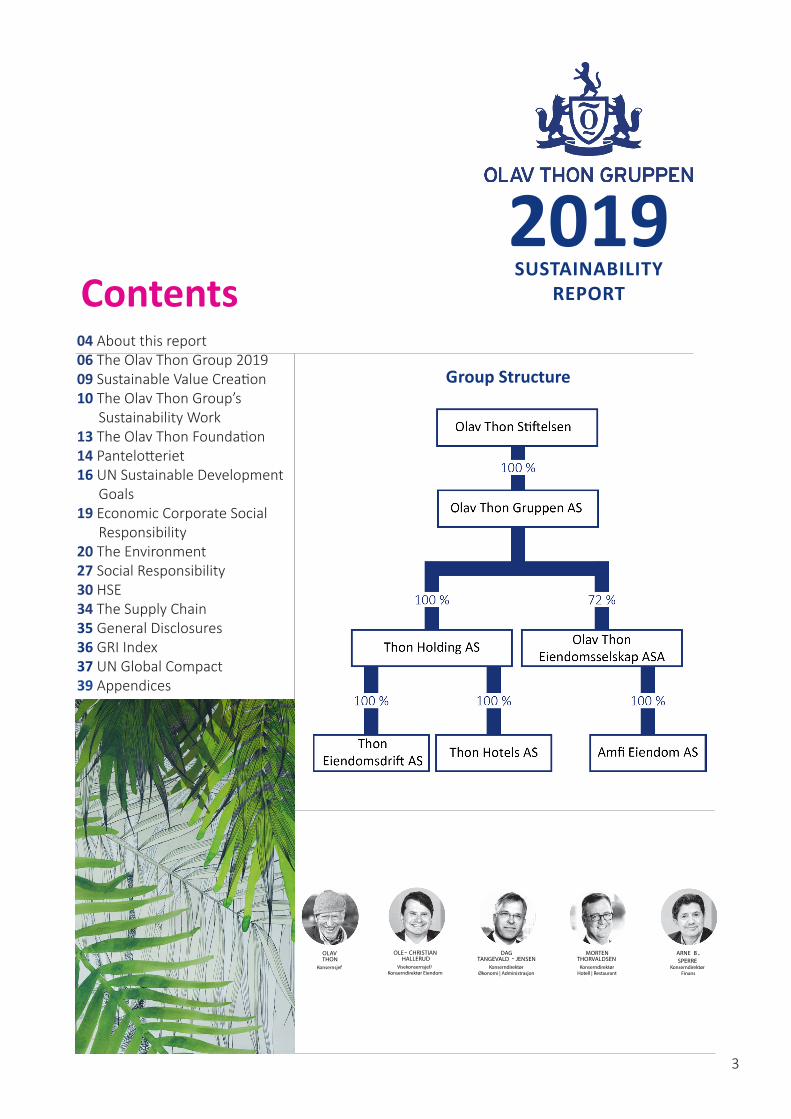
REPORTContents04 About this report06 The Olav Thon Group 201909 Sustainable Value Creation10 The Olav Thon Group’s Sustainability Work13 The Olav Thon Foundation14 Pantelotteriet16 UN Sustainable Development Goals19 Economic Corporate Social Responsibility20 The Environment27 Social Responsibility30 HSE34 The Supply Chain35 General Disclosures36 GRI Index37 UN Global Compact39 Appendices
Executive Management Team
Group Structure
OLAV THON
DAG TANGEVALD - JENSEN
OLE- CHRISTIAN HALLERUD
MORTEN THORVALDSEN
ARNE B . SPERRE
Konsernsjef KonserndirektørØkonomi | Administrasjon
Visekonsernsjef/Konserndirektør Eiendom
KonserndirektørHotell | Restaurant
KonserndirektørFinans

4
The Olav Thon Group has reported in accordance with the Global Reporting Initiative’s (GRI) reporting framework since 2013. This report has been prepared in accordance with GRI Standards (Core).
LIMITATIONS AND REPORTING PERIODThis Sustainability Report is aimed at our customers, guests, employees, suppliers, the local communities in which we operate, students, special interest groups, and public authorities. We regard all of you as stakeholders who are affected by, and have a considerable influence on, our business.
The data presented in this report is for all the companies in the Olav Thon Group, which means business units of which the Olav Thon Group owns more than 50%. Any exceptions are explained in the notes on the individual data.The report is for the calendar year 2019 and has been produced in Norwegian, Swedish, and English. The Group has an annual reporting cycle, meaning that the next report will be published in the second quarter of 2021. The previous report was published in September 2019.
MATERIALITY ANALYSIS AND STAKEHOLDER DIALOGUEWe have previously conducted a materiality analysis in order to define the content of the Sustainability Report and ensure that the report is as relevant to our core operations as possible. This was done for the first time in 2013 as part of the preparations for the first sustainability report.We need to conduct these stakeholder dialogues and materiality analyses at regular intervals and, for this reason, a new stakeholder dialogue and a new
materiality analysis were conducted in 2016/2017.
The need to repeat these was first discussed in a meeting with the group directors in September 2016, at which a decision was made to conduct a combined stakeholder dialogue and materiality analysis with key personnel in the Group, as well as the group directors. The Group’s economic, environmental and social impact was examined earlier to determine our footprint and thereby identify the areas in which we can make a contribution in the form of sustainable development. The previous materiality analysis is still viewed as highly relevant in the context of the Sustainability Report, although some adjustments have been made following the new stakeholder dialogue.
The stakeholder dialogue was conducted in two phases: an ongoing dialogue with key personnel in the Group and interviews with the group directors. The ongoing dialogue with key personnel is essential in order to obtain relevant information and focus our efforts in the direction the organisation deems necessary at any given time. At the same time, it is the group directors who make decisions in the area of sustainability and it is important that information on trends is communicated to the group directors, so that they can make well-informed decisions on the direction of the work.
The combined stakeholder dialogue and materiality analysis was conducted by the technical adviser for sustainability work, who analysed aspects and associated indicators and also collected priority analyses from the group directors in relation to the various aspects (including simple explanations for each aspect). Interviews were then conducted with the group directors in which the aspects were reviewed and explained further. The technical adviser and group directors discussed the aspects and related significant/relevant indicators (based on the previous materiality analysis and a new analysis conducted by the technical adviser looking at market demand and signals from the executive management team and from key personnel in the organisation). All group directors were then given the opportunity to prioritise the aspects anew. These were compiled in a priority table (average of all of the group directors’ priorities), which in turn formed the basis for the managers’ report with recommendations. This report has taken the previous materiality analysis into account, as well as the most recent stakeholder dialogue.
FOCUS AREASIn our sixth sustainability report, we have decided to emphasise four focus areas for the Group: economics; environment and green operations; health and safety; diversity and inclusion.
The Olav Thon Group is a member of the UN Global Compact and this is the sixth time it has published a sustainability report. The purpose of the report is to describe how the Group strives to operate responsibly and sustainably.
About this report

5
5,8
4,4
3,2
1,4
3,03,2
Economic
Human rightsEnvironmental
Labor prac�ces/decent workSocietyProduct responsibility

6
The Olav Thon Group 2019
7972
11
981
90
Total:
*Of w
hich 5 hotels and 3 apartment hotels
in Brussels and 1 hotel in Ro�erdam
Brussels/Ro�erdam*Hotels
Shopping centres
OUR SHOPPING CENTRESAND HOTELS
Norway
Sweden
The Group owns or manages 9 of the 10 largestshopping centres in Norway.
9 OF THE 10 LARGEST
Thon Hotels has about Thon HotelRosenkrantz Bergen
2019
AMFI Madla was
DID YOU KNOW...
10.450 hotel roomsspread across 72 hotelsin Norway
was named best hotelnamed best shoppingcentre 2019
KJØPESENTERNÆRINGSEIENDOM
BOLIG

7
Net investments totalled NOK 2.5 billion in 2019
At the year end, cash reservesamounted toNOK 9.4 billion
4,2Olav Thon
Group’s profitbefore tax in
2019:
BILLION(NOK)


9
The Olav Thon Group has been a signatory to the UN Global Compact initiative since 2012. This is the world’s largest
corporate sustainability initiative and is based on 10 principles covering the areas of human rights, labour practices,
the environment and anti-corruption. We signed up to the Global Compact out of a desire to run our business in
accordance with these principles wherever possible.
In December 2013, I established the Olav Thon Foundation and transferred ownership of the Olav Thon Group
to it. The purpose of the foundation is to exercise stable, long-term ownership of Olav Thon Gruppen AS and its
subsidiaries, and to distribute funds to non-profit causes. I hope that ensuring the continued development of the
Olav Thon Group, while also making sure that some of the profits generated by the business are used for non-profit
purposes, will prove a sustainable approach – for the company, its employees and for society in general.
I hope you find this a good read!
Olav Thon
Chairman of the Board/Group CEO
It is my great pleasure to present the Olav Thon Group’s sixth Sustainability Report, which has been produced to systemise and promote the Olav Thon Group’s work on sustainable development.
Sustainable value creation

10
The Olav Thon Group’s Sustainability WorkThe Olav Thon Group works systematically on sustainability and corporate social responsibility. We have policies and guidelines in place and we continuously follow up on sustainability and corporate social responsibility work.
In order to integrate the consideration for human rights, employee rights, equality and anti-discrimination, social conditions, the external environment and the fight against corruption, the Olav Thon Group has developed a policy for corporate social responsibility, joined the UN Global Compact as a member, prepares annual reports in accordance with GRI Standards, employed its own sustainability advisor and convenes annual status meetings for corporate management addressing sustainability and corporate social responsibility.
CORPORATE SOCIAL RESPONSIBILITY POLICYThe Olav Thon Group policy for corporate social responsibility describes the Group’s goal of pursuing the most sustainable development possible in its business activities. Corporate social responsibility in the Olav Thon Group is based on Norwegian legislative requirements and standards as well as the principles of the UN Global Compact and the guidelines of the Global Reporting Initiative (GRI). In accordance with our policy, the focus is on waste, energy, health and safety (for employees, customers and guests), diversity, equality and anti-discrimination, as well as the impact on local communities.
ORGANISATION OF THE WORKThe Executive Management Team is responsible for the Olav Thon Group’s work on corporate social responsibility and sustainability. The professional and everyday responsibility for facilitation
and coordination has been assigned to the HSE department, represented by the Group’s sustainability advisor. The various companies/entities within the Group are responsible for the everyday implementation of sustainability measures.
The work on corporate social responsibility and sustainability will be highlighted internally and externally through annual sustainability reports, as well as internally through the use of separate tools for internal communication.
OVERALL EVALUATION OF THE WORK IN THE LAST YEARThe work on sustainability and corporate social responsibility is evaluated annually at status meetings between the HSE department and the Executive Management Team. At the 2019 status meeting, the 2018/2019 status was presented, alongside proposals for activities in 2019/2020. During 2019, work has been undertaken on various aspects of the Group’s sustainability work and certain elements have been given greater priority than others. The largest change is the Group’s designation of relevant UN Sustainable Development Goals. This is followed by reporting in accordance with GRI standards for the first time. Other than this, the work is considered satisfactory in accordance with the Group’s corporate social responsibility policy. However, work will still be undertaken to ensure better integration in the Group’s everyday operations and strategic decisions in 2020.
Further evaluation of the Group’s focus areas is addressed in the various chapters of this report.
OTHER POLICIES AND GUIDELINESThe Olav Thon Group has a number of policies and guidelines within corporate social responsibility and sustainability.
Policies: - Environmental Policy - Diversity and Equality Policy - Group Procurement Policy - Travel Policy
Guidelines - Supplier Code of Conduct - Guidelines for waste sorting - Guidelines for company/service
cars - Guidelines for responsible
procurement
EXPECTATIONS GOING FORWARDWith regard to the Olav Thon Group’s work going forward, the expectation is that policies and guidelines will be revised, annual sustainability reports will be validated externally in future and that a new materiality analysis is conducted, that stakeholder dialogue takes place to a greater extent in connection with sustainability work, that work is undertaken to establish a sustainability strategy within the Group and that a new system for internal control of the work on sustainability and corporate social responsibility is established. These measures are not expected to be implemented in 2020 but the work on the measures will commence from and including 2020.

11


13
SOCIAL COMMITMENTOlav Thon has dedicated his working life to creating value and secure jobs. Both Olav Thon personally and the Olav Thon Group have increasingly made active contributions towards a better society.
LONG-TERM OWNERSHIP OF THE OLAV THON GROUPThe job of the foundation’s board is, through its management of the Olav Thon Group, to ensure that the Group develops in line with the values, vision and ideas on which Olav Thon has based his business career.
The foundation will continue to own all of the shares in Olav Thon Gruppen AS, which will remain domiciled in Norway. The Group’s largest business area will be property management and acquisition. A substantial part of its operations will take place in Norway. The aim is to grow the business. Priority will be given to ensuring that the Group is in an unquestionably strong financial position at all times.
SUPPORT FOR NON-PROFIT CAUSESThe foundation will support causes within the areas of mathematics, science and medicine. This may be done by awarding prizes to Norwegian and international researchers and through direct support for research projects.
Support will also be provided both for general non-profit causes and for the construction of properties for use for non-profit purposes in Norway.
A large number of applications for support of non-profit causes were received in 2019. Distributions of approximately NOK 35 million (NOK 79 million in 2018) were approved. Funding was distributed to 17 non-profit causes in 2019.
For the fifth year running, academic prizes and funding for outstanding teaching and research in the medical and scientific fields were awarded in 2019. Prizes and funding were awarded in four different categories – an international research award, national awards for outstanding teaching, support for Nordic research collaboration in medicine and support for student-led research. Altogether, awards totalling almost NOK 30 million were presented and shared by the award winners.
For more information on the award winners, please visit the Olav Thon Foundation website.
The Olav Thon Foundation was established in December 2013. Immediately following its formation, Olav Thon transferred all of the shares in Olav Thon Gruppen AS to the foundation. The purpose of the Olav Thon Foundation is to exercise stable, long-term ownership of Olav Thon Gruppen AS and to distribute funds to non-profit causes.
The Olav Thon Foundation

14
PantelotteriThe Pantelotteri is an eco-friendly lottery in which bottle deposits are used as the stake in the lottery. The idea is that the bottle deposit lottery will encourage more people to recycle bottles, while also creating a permanent source of funding for non-profit organisations. The lottery is operated by Norsk Pantelotteri AS, a company owned by the Norwegian Red Cross and the Olav Thon Group.
45.43%Market share in best shop
NOK 62.7 millionContribution to the Norwegian Red Cross in 2019
NOK 306.5 millionContribution to the Norwegian Red Cross since 2008
NOK 523,470Funds raised in best shop
In July alone, a pledge of NOK 18 million in bottle deposit returns was made, NOK 4 million more than in July the previous year. This is the highest one-month total ever. The increase in revenue was no less than 24 percent for the year as a whole. In 2019, an invitation was extended for Joker and Nærbutikken retailers to join the Pantelotteri. This contributes to increased distribution and higher income.
In total, the Pantelotteri contributed NOK 62.7 million to the Norwegian Red Cross in 2019. This has a major impact on humanitarian work, locally, nationally and internationally.
Half of the income goes to the local Red Cross branches, for many of which these funds have become one of their most important sources of income. This means better preparedness and more visitors, homework helpers, refugee guides and much more.
2019 will go down in history as the best year for the Pantelotteri of all time. This has a major impact on humanitarian work.
kr 9
2854
3
kr 4
914
206
kr 7
784
657
kr 1
242
361
1
kr 1
852
384
0
kr 2
380
037
0
kr 2
624
145
5
kr 2
989
104
8
kr 3
209
111
1
kr 3
717
089
3 kr 4
998
336
9
kr 6
269
871
8
2008 2009 2010 2011 2012 2013 2014 2015 2016 2017 2018 2019
Contributions to the Norwegian Red CrossThe Norwegian Red Cross’s annual income from Pantelotteri has risen dramatically since it was started and amounted to no less than NOK 62.7 million in 2019.

15
The Norwegian Red Cross will receive NOK 62 million from the Pantelotteri in 2019, up from NOK 50 million in 2018.
NOK 62 million for the Norwegian Red Cross
kr 0 kr
260
51 0
17
kr 4
4574
857
kr 6
8375
227
kr 9
4616
682
kr 1
2450
7 73
0
kr 1
5659
8 84
1
kr 1
9376
9 73
4
kr 2
4375
3 10
3
kr 3
0645
1 82
1
2008 2009 2010 2011 2012 2013 2014 2015 2016 2017 2018 2019
kr 0 kr 5
842
749
kr 2
6051
017
kr 4
4574
857
kr 6
8375
227
kr 9
4616
682
kr 1
2450
7 73
0
kr 1
5659
8 84
1
kr 1
9376
9 73
4
kr 2
4375
3 10
3
kr 3
0645
1 82
1
2008 2009 2010 2011 2012 2013 2014 2015 2016 2017 2018 2019
Accumulated contributions to the Norwegian Red Cross
Adding up the annual funds raised by Pantelotteri gives you the total amount raised since it started in 2008. The total has now surpassed NOK 306 million.
“2019 has been a year with a high number of emergency response missions and injuries in extreme weather conditions. In such conditions, it is crucial that we have the funds to act quickly. We are now entering a year with major challenges ahead. The income from the Pantelotteri therefore means a lot to us and to all of those we are able to assist in a variety of different ways. Locally, the funds help to improve preparedness, counteract loneliness and social exclusion and to create safe and positive conditions for children and young people,” says Robert Mood, President of the Norwegian Red Cross.
Taking the lead in the countyIn 2019, Joker and Nærbutikken became part of the Pantelotteri. Even though it is optional for stores to join, nearly 200 retailers have chosen to have the lottery in their stores. Just a few months after Joker Fjellbu had a bottle bank with a “donate to the Red Cross” button installed, the store has taken the lead in the list of stores where customers give the greatest proportion of the bottle deposit to the Norwegian Red Cross in all of Oppland.
“Previously it was a bit of a chore to return bottles here. I think the old machine was driving both customers and employees a bit crazy,” explains shopkeeper Lars Jølstad.
The previous bottle machine was 17 years old and it was both slow and noisy. The new Tomra machine was installed this summer and this time Pantelotteri was included. This resulted in the amount of bottle deposits at the store doubling and took Joker Fjellbu into the lead when it came to Oppland stores and the proportion of deposit returns donated to the Pantelotteri.“It would also appear that the new, much quicker, machine is attracting more customers. Customers also seem to consider it a positive that they are able to support the Norwegian Red Cross through their bottle deposit returns,” says Jølstad.
The new machine is great news for Nord-Aurdal Red Cross Emergency Response Corps and Executive Director Odd Magne Bjørgo.The Emergency Response Corps currently has around 14 active members, who have all undertaken extensive training in first aid and emergency preparedness.“The funds from the Pantelotteri have become an important source of income for us. I would therefore like to thank everyone who contributes. Another store supporting the lottery means that we can receive even more funds to run the emergency response corps,” says Bjørgo.
Funds water rescueBrummunddal Red Cross Emergency Response Corps is one of the local branches that receive the most funds from the Pantelotteri in Hedmark. Director Pål Chr. Tyskeberg also really appreciates the willingness to donate among all bottle deposit users in the county. The Emergency Response Corps has, among other things, specialised in water rescue and has its own boat and its own underwater drone.“The drone is pretty unique and allows us to carry out underwater searches without using divers,” says Tyskeberg. A team of around 20 people work on water rescue and many of them practice every week. During winter, training takes place at a swimming pool. In total, there are now 70 volunteers in the local emergency response corps, from 15-year old trainees to the oldest member, who clocks in at the age of 70. Several of the volunteers staff the corps’ ambulance or act as drivers for A&E during evenings and weekends.“We also have a team of girls that have specialised in climbing and rope rescue. All in all, this means that we are extremely well equipped in the event that search and rescue is required. Often this also results in us assisting in areas outside of Hedmark and Oppland,” the Emergency Response Corps Director says.

16
The Olav Thon Group believes that it is essential to identify the most relevant goals the Group can help to achieve in order to make a genuine contribution to the UN’s Agenda 2030 and the Sustainable Development Goals. In connection with this, it has completed a project aimed at identifying which of the UN Sustainable Development Goals it would be most relevant for the Olav Thon Group to focus on.
THE PROJECTThe Olav Thon Group’s executive management team has, together with the Group’s sustainability adviser, mapped the Group’s value chain based on the GRI and the Global Compact’s guide on identifying UN Sustainable Development Goals. Based on this mapping, we analysed which of the Sustainable Development Goals the Group appears to have the greatest impact on, both in a positive and a negative sense. Next we determined where in the value chain this impact occurs and which targets it would be most relevant for us to contribute to achieving. The Olav Thon Group has also chosen which of the measurable indicators it would seek to report progress on. Some of the indicators have been modified to better reflect our own operations, although the same principles apply as for the original indicators.
IDENTIFIED SUSTAINABLE DEVELOPMENT GOALSThe Olav Thon Group has identified four Sustainable Development Goals that stand out as the most relevant goals that the Group can help to achieve:
• 12 - Responsible consumption and production
• 8 - Decent work and economic growth
• 11 - Sustainable cities and communities
• 9 - Industry, innovation and infrastructure
In addition to identifying these goals, we have chosen to identify the targets it would be most relevant for us to work on. We have also chosen to identify which indicators we will seek to report on in order to measure the Olav Thon Group’s contribution.*
THE OLAV THON GROUP’S CONTRIBUTIONThe Olav Thon Group aims to contribute by minimising its negative impact and increasing its positive impact on the UN Sustainable Development Goals. As a major purchaser of goods and services, a group with many customers and employees and as a cornerstone company and district developer, the Olav Thon Group can contribute in many links of the chain. We will make sure we buy the raw materials that are best for the environment and social conditions. We will reduce our consumption in production and operations. We will influence our suppliers and make sure that the services we offer our customers are sustainable. We will streamline our day-to-day operations. And we will be inclusive and contribute to a diverse business world.
We have developed more detailed documents on how we determined the impact the Olav Thon Group has on the various Sustainable Development Goals and how we will contribute. These documents have been published on www.olavthon.no.
The work to operationalise the Sustainable Development Goals has not been completed and will continue in 2020. There are therefore limited opportunities to report on the goals for the 2019 calendar year. It has been decided that the SDG Action Manager tool, developed by B Lab and UN Global Compact, will be used as the evaluation tool for the work on the Sustainable Development Goals.
As part of the Global Compact, the Olav Thon Group wants to help achieve the UN’s Agenda 2030.
UN Sustainable Development Goals
* See the next page for more information.

17
VALU
E CH
AIN
• Ra
w m
ater
ials
• Su
pplie
rs•
Inbo
und
logi
stics
• Co
mpa
ny o
pera
tions
• Pr
oduc
t use
• Pr
oduc
t end
of l
ife
TARG
ETS
• 12
.2•
12.3
• 12
.5•
12.6
IND
ICAT
ORS
• 12
.2.1
• 12
.2.2
• 12
.3.1
• 12
.5.1
• 12
.6.1
VALU
E CH
AIN
• Ra
w m
ater
ials
• Su
pplie
rs•
Com
pany
ope
ratio
ns
TARG
ETS
• 8.
2•
8.4
• 8.
5•
8.7
• 8.
8
IND
ICAT
ORS
• 8.
2.1
• 8.
4.1
• 8.
4.2
• 8.
5.1
• 8.
8.1
VALU
E CH
AIN
• In
boun
d lo
gisti
cs•
Com
pany
ope
ratio
ns
TARG
ETS
• 11
.3•
11.4
• 11
.6•
11.7
IND
ICAT
ORS
• 11
.4.1
• 11
.7.1
• 11
.7.2
VALU
E CH
AIN
• Ra
w m
ater
ials
• In
boun
d lo
gisti
cs
TARG
ETS
• 9.
1•
9.4
IND
ICAT
ORS
• 9.
1.2
• 9.
4.1


19
INCOME AND PROFITSIn 2019, the Olav Thon Group achieved operating income of NOK 10,412.7 million and its retained earnings amounted to NOK 3,035.1 million. These retained earnings were invested in expansion and business improvements in line with the Olav Thon Foundation’s articles of association. FINANCIAL CONTRIBUTIONS TO SOCIETYThe Group’s financial contributions to society are divided into several factors. Its operating costs constitute indirect socioeconomic support in that they contribute to other
Norwegian companies’ earnings from sales of their goods and services. The payment of employee wages and benefits represents a more direct contribution. The Olav Thon Group paid NOK 1,715.6 million in wages and benefits to employees in 2019. This impacts the economy by contributing to the personal finances of each employee and helps to maintain the purchasing power of our workforce, as well as their contributions to society through the payment of taxes and duties. The Olav Thon Group is also a direct contributor to society through the payment of taxes and duties. In addition, the retained earnings generated by the company are used
to expand the business. This is in line with the Olav Thon Foundation’s articles of association and helps create jobs and value for Norwegian society.
The Olav Thon Group also contributes through investment in local communities. In some cases, we will make improvements to public spaces/installations adjacent to our construction projects. This could entail planting trees, building new pavements, or similar measures. Through the Pantelotteri, funds are distributed to the Norwegian Red Cross and are allocated directly to the local and central work of the Norwegian Red Cross. In 2019, the Olav Thon Group invested NOK 84 million in local communities.
In addition to investment in local communities, funds are distributed to non-profit causes including scientific research by the Olav Thon Foundation. This payment is financed through dividends paid to the Olav Thon Foundation by the Olav Thon Group. In 2019, dividends amounting to NOK 50 million were paid from the Olav Thon Group to the Olav Thon Foundation and NOK 44 million was awarded as prizes.
Further explanation of financial figures can be found in the appendix (p. 39).
The Olav Thon Group is a commercial actor and income and profit are key focus areas in day-to-day operations. The economic aspect also entails contributions to society in the form of taxes and duties, employee wages and benefits, and investment in business expansion, which in turn leads to new jobs.
Economic social responsibility
5 058,6 5 345,8 4 423,11 505,0 1 505,0 1 590,61 278,0 1 107,9 1 632,6
213,7 371,7 508,0- - 71,4
2 116,6 2 605,3 2 815,6
10 172,0 10 935,0 11 041,32016 2017 2018
3 828,81 715,61 337,0
412,384,0
3 035,1
10 412,72019
RevenuesOpera�ng costsEmployee wages and benefitsPayment to suppliers of capitalPayment to authori�esInvestments in societyFinancial values retained in the company
DivisionAmounts in NOK millions
Opera�ng expenses
Employee wages and benefits
Payment to suppliers of capital
Payments to authori�es
Investments in society
Outgoings 2019

20
In order to safeguard the external environment, the Olav Thon Group undertakes systematic and focused work in the areas where the Group has the most impact. These considerations are integrated by the Group through its environmental policy. The policy focuses on environmental management and the two main focus areas of the Olav Thon Group’s work with the environment: waste and energy.
THON HOTELSThon Hotels’ Eco-Lighthouse certifies all of the hotels it owns in Norway. As one of Norway’s largest hotel chains, Thon Hotels has a responsibility to contribute to a better environment. With more than 2.8 million guest nights per year, it is important to facilitate eco-friendly consumption, reduced waste and energy savings.
Thon Hotels is also a control member of Grønt Punkt Norge and requires its Norwegian suppliers to be members of a return scheme for packaging.
REVISED HQ MODELIn 2015, Thon Hotels was certified according to the headquarters model. The model ensures that responsibility for the environmental management system is anchored where it naturally belongs and clarifies which processes and environmental requirements headquarters is responsible for and which environmental requirements
the individual subsidiaries are responsible for following up.The model was revised in 2016 after Thon Hotels became a part of Eco-Lighthouse’s HQ model in 2015. Eco-Lighthouse has improved its digital interface and has now completed a comprehensive digital solution for certification and recertification. In the transition to the digital solution, Thon Hotels reviewed the criteria again and reallocated them between headquarters and subsidiaries, albeit without any significant changes. The new digital solution makes the certification process easier and more transparent for underlying units and allows better integration with the person assigned responsibility for Eco-Lighthouse certification at headquarters. Certification based on the new model was carried out for the first time in 2017, with great success. Thon Hotel's headquarters was re-certified in 2019. The certification is perceived to have a positive impact on the environmental efforts at the hotels.
The headquarters model will contribute to simpler and more rational certification for the hotels, stronger local support and better information flow. Thon Hotels’ overall environmental results are presented to management annually. The ambitions of the environmental work will be strengthened and further highlighted. The pace is expected to be maintained where certification is concerned and all new hotels are expected to be Eco-Lighthouse certified regardless of whether they are franchised or owned.
GREEN BUILDING ALLIANCEIn 2019, the Olav Thon Group became a member of the Green Building Alliance. The Green Building Alliance is a non-profit membership association for companies from the construction and property sectors. The Olav Thon Group considers the Green Building Alliance to be a key forum for exchanging expertise with the industry, so that the Olav Thon Group can be part of a sustainable construction and property sector. This is a great way for us to manifest our corporate social responsibility and is a key source for green property development. At the Olav Thon Group, we focus on skills development among technical operations employees. The membership of the Green Building Alliance provides us with access to valuable training materials. The skills development itself has taken place individually using online training with central follow-up. This allows each operational employee to manage the speed and progress themselves. The membership of the Green Building Alliance is perceived as having a positive impact on such skills development, as well as fostering collaboration across the property industry.
The Olav Thon Group will always strive to take account of environmental challenges within its business and in society in general. The Group focuses on environmental efficiency and energy and waste management are core concerns.
Environment

21
THE GROUP'S WORK ON WASTEThe Olav Thon Group has an environmental policy, in which waste is designated as one of two main focus areas. We have expressed an ambition to reduce the volume of waste and also to achieve an average sorting rate of 60% in the Group. To achieve this, the Olav Thon Group has established separate guidelines for waste sorting and waste schedules developed for the various entities in the Group. All of this takes place in close dialogue with the waste management provider. Status meetings with suppliers are convened at regular intervals, waste is a subject in internal communication as well as an agenda item at the annual status meeting on sustainability with the Executive Management Team.
VOLUMEFor the first time in several years, the volume of waste in the Olav Thon Group is increasing. The increase can predominantly be attributed to the shopping centre division and may have been caused by changes to the property portfolio or tenancy relationships. The actual change in volume from 2018 to 2019 is 6.3%, corresponding to approximately 1,938 tonnes of waste.
SORTING RATEThe average sorting rate in the Group is 51.6%, which is below our stated target of an average sorting rate of 65%. Even though the target has not been achieved, the sorting rate was 1.9 percentage points higher in 2019 than in 2018. The sorting rate has therefore continued to steadily increase since 2016, but
with a more pronounced increase from 2018 to 2019.
There are considerable differences between the various divisions/companies. The most significant division is the shopping centres, which account for the largest volume in the Group (67.8%). Other significant divisions are Thon Hotels (11.3%) and commercial property (9.9%). It is particularly important that these three divisions perform well with respect to sorting rates. If these divisions do not perform well, the target of a sorting rate of 60% will be impossible to achieve. The shopping centres achieved an average sorting rate of 56.1% in 2019. This is 0.9 percentage points higher than in 2018 but remains stable at around 55%. Commercial properties decreased by 1.0 percentage point from the 2018 level to a sorting rate of 34.4%. The Olav Thon Group’s commercial properties are largely older city blocks in the centre of Oslo with little space for waste management. This means that it is challenging to establish and manage a high sorting rate for waste. In 2019, as in 2018, Thon Hotels achieved an increase in
The Olav Thon Group’s goals are to reduce the amount of waste the Group produces and to be able to demonstrate a higher sorting rate in order to reduce the Group’s impact on the external environment.
Waste
WASTE VOLUME (TON)
NON�HAZARDOUS HAZARDOUS
0
5000
10000
15000
20000
25000
30000
35000
2015 2016 2017 2018 2019
SORTING RATIO
47,7 % 46,0 % 48,6 % 49,7 %
2015 2016 2017 2018
51,6 %
2019
46,0 % 47,5 % 49,1 % 53,9 %36,0 % 33,0 % 38,1 % 35,4%54,0 % 48,9 % 43,2 % 53,2 %50,2% 44,9% 59,0% 55,5 %35,9 % 12,7 % 40,2 % 24,0 %22,0 % 23,9 % 5,6 % 17,7 %12,0 % 10,0 % 7,2 % 3,8 %43,0 % 50,0 % 84,1 % 29,7 %17,0 % 30,1 % 37,6 % 37,0 %47,7 % 46,0 % 48,6 % 49,7 %
54,5 % 56,0 % 55,5 % 55,2 %2015 2016 20182017 2019
56,9 %34,4 %54,5 %52,8 %24,0 %17,1 %5,3 %57,4 %23,0 %51,6 %
56,1 %Shopping centreHotelPropertyHeadquartersSwedenBeneluxResthonUnger FabrikkerFollo FjernvarmeConrad LangaardTotalt
Division
*The base data and caveats concerning waste statistics are explained in the appendix (p. 36). You can also finda more detailed overview of waste management methods for various waste fractions in the Olav Thon Group.
MATERIAL RECYCLING ENERGY RECOVERY
LANDFILL
WASTE TREATMENT (2019)

22
its sorting rate. In 2019, Thon Hotels achieved a sorting rate of 56.9%, which represents an increase of 3 percentage points. Thon Hotels is now the business area in the Olav Thon Group with the highest average sorting rate.As is apparent from the historic overview of the sorting rate per division, there have been some big annual variations in the sorting rates. This may be due to sources of errors, but it has not proved possible to identify any.
WASTE MANAGEMENTIn collaboration with our new waste disposal supplier, Retura, we can report on our waste management methods. This allows us to see how much of our waste is recycled, as well as how the materials are recycled. The waste firstly has to be sorted into fractions in order to be recycled. This means that there is a strong correlation between the sorting rate and the material recovery rate. In 2019, the Olav Thon Group achieved a material recovery rate of 55.6%. In addition, 44.3% of the waste was used for energy recovery in the form of incineration. 0.1% of waste went to landfill.
The majority of the waste that goes to energy recovery is residual waste.
Therefore, a good sorting rate means a higher material recovery rate, which is more sustainable than energy recovery.
ASSESSMENT AND EXPECTATIONSThe overall trend in waste volume is negative, while the overall trend in sorting rate is positive. However, there is still some way to go to achieve the goal of an average sorting rate of 60% for the Group. The collaboration with the waste disposal provider is anticipated to continue and we will also make internal advances in the form of internal communication. Waste is an area in constant development, especially with regard to innovation in equipment and downstream solutions. We anticipate that we will continue to explore the possibilities within the waste segment.
MEASURES IN 2019- Further increased focus on monitoring, customer service and information.- Monthly reports on costs and sorting rate to be sent to each location.- Focus on optimisation and review of status reports at the local level.- Increased frequency of central status meetings with waste management providers.- Optimisation of handling of food
waste at hotels.
TOO GOOD TO GOThon Hotels entered into an agreement with Too Good To Go for some of its hotels in 2016. The number of participating hotels has since increased and in 2019 there were 27 hotels offering food via Too Good To Go.Too Good To Go is a solution designed to reduce food waste. It helps restaurants and other food outlets sell their surplus food. In brief, the participating hotels are registered in Too Good To Go’s app, which enables users to order surplus food. The food can usually be picked up just after the restaurant closes, and entails minimal extra work for our employees. The main aim of this measure is to reduce food waste after the food has been cooked.
The most important thing food suppliers can do is reduce waste in production, but if surplus food is unavoidable, Too Good To Go is an initiative that makes it possible to prevent this surplus food from going to waste. This is great for the environment and for finances, both ours and the finances of those who use Too Good To Go.
Thon Hotels rescued 23,939 portions of surplus food from
0
20
40
60
80
100
2015
2016
2017
2018
2019
Conrad La
ngaard
Follo
Fjernva
rme
Headquart
er
Hotels Benelux
Hotels Norw
ay
Shopping c
enters
Property
Resthon
Sweden
Unger F
abrik
ker
SORTING RATIO PER DIVISION

23
going to waste in 2019, saving the environment 59.8 tonnes of CO2. This is equivalent to a car driving 238,805 km, or charging 7,626,427 mobile phones.
KUTTMATSVINN 2020In 2017, Thon Hotels signed a contract to participate in the KuttMatSvinn 2020 (cut food waste) project. One third of all food produced is thrown away. If food waste were a country, it would be the world’s third largest country in terms of greenhouse gas emissions. KuttMatSvinn was started as a measure aimed at contributing to the UN Sustainable Development Goal of cutting food waste by 50% by 2030.The aim of the project is to cut food waste in the catering industry by 20% by 2020. Several other large hotel chains are participating in the project, along with many individual hotels and restaurants. Thon Hotels will contribute by taking various steps to reduce our food waste. All of the food we throw away must be weighed, which enables us to see whether we need to change the way we procure and produce food in our hotels. Thon Hotels chefs are encouraged to be creative in terms of food reuse, we encourage guests to help reduce the amount of food waste on their plates and Too Good To Go is used to sell surplus food.
WAISTERThe Olav Thon Group has previously participated in the pilot testing of Waister, a food waste drying machine. Following a brief stay at Thon Hotel Arena, the machine was returned to the factory in Italy for calibration and further testing. The machine later returned to Thon Hotel Arena as a full production model. It should be capable of reducing the volume of food waste by 75-80%, which benefits the environment through less logistics and waste management. In addition to this, the downstream solutions are much better for this dry waste than for normal food waste. The end product is significantly better for incineration than wet waste and the biogas potential is around three times as high as for wet food waste.
In 2019, three new machines were procured for Thon Hotel Opera, Thon Hotel Oslo Airport and Hotel Bristol respectively.

24
0
50 000 000
100 000 000
150 000 000
200 000 000
250 000 000
300 000 000
CONSUMPTION 2019 (KWH)
Non-renewable sources
Renewable sources
Electricity District hea�ng
District cooling
THE GROUP'S WORK WITH ENERGYThe Olav Thon Group undertakes systematic work with energy to safeguard the external environment. Our environmental policy focuses on energy management through awareness, training and increased expertise. In addition, we also focus on energy reduction and the phasing out of fossil fuels. This is done, among other things, through an energy monitoring system, a focus on LED lighting, water consumption and demand management. The work is overseen by a separate technical department holding the overall responsibility for the work on energy management and energy optimisation.
ENERGY CONSUMPTION WITHIN THE ORGANISATIONReporting these figures for a group with numerous subsidiaries and different types of operations is complicated. The figures have been taken from our energy portal, Energinet, in which some of the figures are checked against purchases and the accounts.*
The reporting categories are in accordance with GRI Standards.
The Olav Thon Group’s total energy consumption increased by approximately 2.8% from 2018 to 2019. Electricity consumption increased by 1.4% in 2019, which is mainly due to a general increase in space. District heating consumption increased by 9.4% in 2019, which is expected to be linked to the decrease in oil consumption and new district heating connections, as well as a general increase in space. District cooling consumption experienced a decrease of 19.9% and is thought to be the result of a cooler summer in 2019.
Non-renewable fuels experienced a decrease of 8% from 2018 to 2019. This was predominantly caused by a decrease in the procurement of gas. Most the consumption
of non-renewable fuels in 2019 involved gas, which is used for peak loads in Follo Fjernvarme’s district heating production. The consumption of non-renewable fuels is small compared to the total consumption in the Group. Of the total consumption, non-renewable consumption accounts for only 1.3%. Of this, the non-renewable consumption comprises 83.4% gas for the production of district heating and the remaining 16.6% consists of oil.
The statistics indicate that by far the largest source of energy consumed by the Olav Thon Group is electricity. This comes as no surprise since a large number of our technical facilities are wholly or partly powered by electricity and the Olav Thon Group is a major player in the property industry. Some of the electricity consumption is used to
Energy is one of the Olav Thon Group’s two main focus areas within environment and green operations. The focus is on energy management and cutting energy consumption through better systems and more frequent reporting.
Energy
0
2 000 000
4 000 000
6 000 000
8 000 000
10 000 000
12 000 000
PRODUCTION 2019 (KWH)
Sales district hea�ng
Sales district cooling
* The base data, explanations and caveats are commented on in the appendix (p. 39).
25
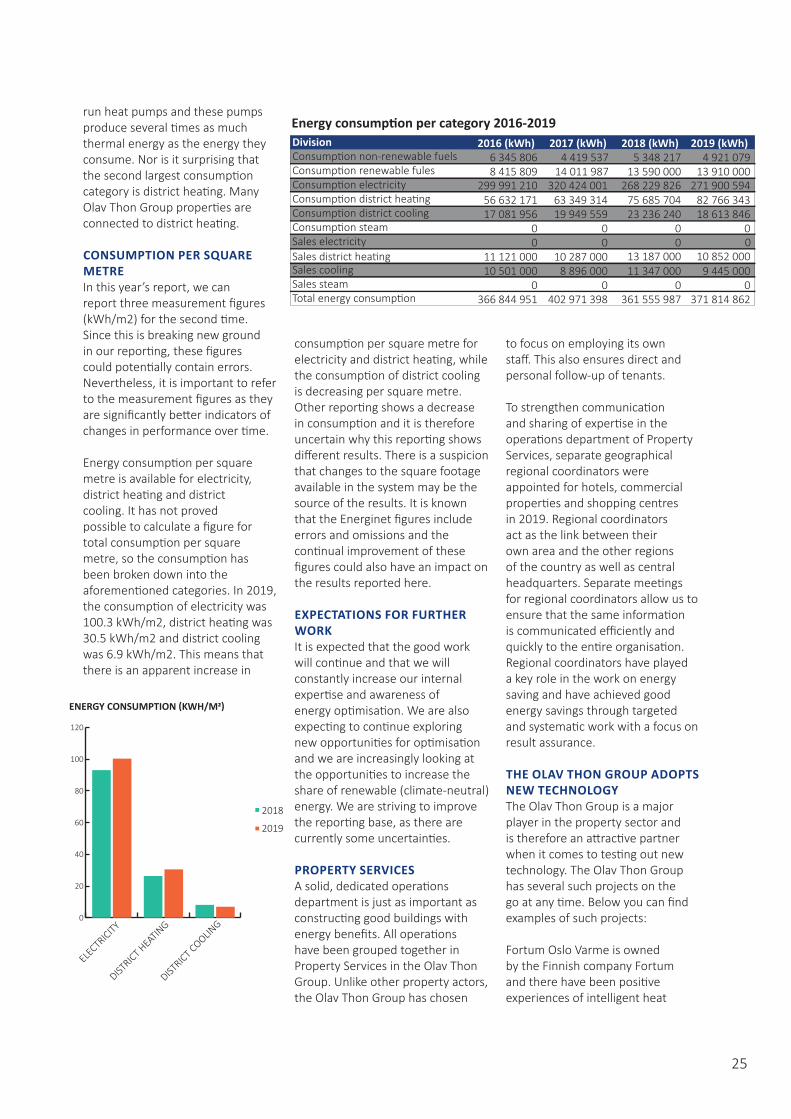
run heat pumps and these pumps produce several times as much thermal energy as the energy they consume. Nor is it surprising that the second largest consumption category is district heating. Many Olav Thon Group properties are connected to district heating.
CONSUMPTION PER SQUARE METREIn this year’s report, we can report three measurement figures (kWh/m2) for the second time. Since this is breaking new ground in our reporting, these figures could potentially contain errors. Nevertheless, it is important to refer to the measurement figures as they are significantly better indicators of changes in performance over time.
Energy consumption per square metre is available for electricity, district heating and district cooling. It has not proved possible to calculate a figure for total consumption per square metre, so the consumption has been broken down into the aforementioned categories. In 2019, the consumption of electricity was 100.3 kWh/m2, district heating was 30.5 kWh/m2 and district cooling was 6.9 kWh/m2. This means that there is an apparent increase in
consumption per square metre for electricity and district heating, while the consumption of district cooling is decreasing per square metre. Other reporting shows a decrease in consumption and it is therefore uncertain why this reporting shows different results. There is a suspicion that changes to the square footage available in the system may be the source of the results. It is known that the Energinet figures include errors and omissions and the continual improvement of these figures could also have an impact on the results reported here.
EXPECTATIONS FOR FURTHER WORKIt is expected that the good work will continue and that we will constantly increase our internal expertise and awareness of energy optimisation. We are also expecting to continue exploring new opportunities for optimisation and we are increasingly looking at the opportunities to increase the share of renewable (climate-neutral) energy. We are striving to improve the reporting base, as there are currently some uncertainties.
PROPERTY SERVICESA solid, dedicated operations department is just as important as constructing good buildings with energy benefits. All operations have been grouped together in Property Services in the Olav Thon Group. Unlike other property actors, the Olav Thon Group has chosen
to focus on employing its own staff. This also ensures direct and personal follow-up of tenants.
To strengthen communication and sharing of expertise in the operations department of Property Services, separate geographical regional coordinators were appointed for hotels, commercial properties and shopping centres in 2019. Regional coordinators act as the link between their own area and the other regions of the country as well as central headquarters. Separate meetings for regional coordinators allow us to ensure that the same information is communicated efficiently and quickly to the entire organisation. Regional coordinators have played a key role in the work on energy saving and have achieved good energy savings through targeted and systematic work with a focus on result assurance.
THE OLAV THON GROUP ADOPTS NEW TECHNOLOGYThe Olav Thon Group is a major player in the property sector and is therefore an attractive partner when it comes to testing out new technology. The Olav Thon Group has several such projects on the go at any time. Below you can find examples of such projects:
Fortum Oslo Varme is owned by the Finnish company Fortum and there have been positive experiences of intelligent heat
8 415 809 14 011 987 13 590 000299 991 210 320 424 001 268 229 826
56 632 171 63 349 314 75 685 70417 081 956 19 949 559 23 236 240
0 0 00 0 0
11 121 000 10 287 000 13 187 00010 501 000 8 896 000 11 347 000
0 0 0366 844 951 402 971 398 361 555 987
6 345 806 4 419 537 5 348 2172016 (kWh) 2017 (kWh) 2018 (kWh)
13 910 000271 900 594
82 766 34318 613 846
00
10 852 0009 445 000
0371 814 862
4 921 0792019 (kWh)
Consump�on non-renewable fuelsConsump�on renewable fulesConsump�on electricityConsump�on district hea�ngConsump�on district coolingConsump�on steamSales electricitySales district hea�ngSales coolingSales steamTotal energy consump�on
DivisionEnergy consump�on per category 2016-2019
ENERGY CONSUMPTION (KWH/M2)
DISTRICT COOLIN
G
DISTRICT HEATIN
G
ELECTRICITY
0
20
40
60
80
100
120
2018
2019

26
management in Finland. In brief, the solution is about controlling the so-called heating curve for district heating based on variable demand throughout the day rather than a fixed configured curve. By controlling the heating levels based on the heat stored in the building and the weather forecasts, a more stable indoor temperature is achieved, along with lower energy consumption. The project was established as a pilot at three of our residential properties in the centre of Oslo and we have chosen to make the solution permanent following the pilot.
One of the major challenges in the energy market is to obtain enough electrical output when market players request energy at the same time. This is caused by coinciding start-up times or when high or low temperatures require a lot of heating or cooling at the same time. As an alternative to expanding major electricity production and distribution networks, Statnett is seeking solutions to regulate subscribers’ power outlets so demand can be reduced. The Olav Thon Group participates in several pilot projects in which the purpose is to identify unallocated energy. Such projects could explore equipment that is not critical to operations, or identify other solutions for meeting energy demands. By identifying such output for short periods, major investments can be saved, especially in the distribution network. Such measures are rewarded in the regulatory energy market.
Many properties suffer from major air leaks. This is due to pressure differences between the inside
and the outside. This results in unwanted draughts and, not least, an influx of cold or warm outdoor air that has to be heated or cooled depending on season. This is especially prevalent at shopping centres. The Olav Thon Group was the first shopping centre chain to adopt new technology to stabilise and balance out this pressure imbalance. We ran pilot projects at two large shopping centres, with extremely positive results. We reduced draughts and saved energy. Several tenants have reported a noticeable reduction in draught issues.
ELECTRIC CAR CHARGINGAs early as December 2017, the Olav Thon Group entered into an agreement with the car charging company Grønn Kontakt. The agreement covers the delivery and operation of charging stations at Olav Thon Group premises. The agreement is an important contribution towards achieving Norway’s climate goals and fits well into the Olav Thon Group’s work on corporate social responsibility. At the end of 2019, 26 shopping centres had fully-fledged charging provisions and there is continuous development taking place to ensure that the Olav Thon Group shopping centres form a substantial part of the Norwegian charging infrastructure.
MASTER’S THESESThe Olav Thon Group’s property stock is extremely well suited as a starting point for master’s theses. Through a collaboration with a leading consultancy firm, we come into contact with master’s students seeking suitable assignments. In this way, we take corporate social
responsibility, while also benefiting from the results of the work.
DISTRICT HEATINGDistrict heating is considered a renewable thermal energy source and is therefore a natural first choice where available. In Oslo alone, more than 70 properties are connected to the district heating network. A major upgrade to Storgata is under way in Oslo, a project spanning several years. Pavements are being widened and, in connection with this work, the Olav Thon Group has contributed to establishing district heating in the pavements to ensure safe and ice-free pavements throughout winter.
SENTER SYDAs part of a larger Enova-funded project, we have completed a major upgrade to the technical installations at Senter Syd Mortensrud. The background to the project was the poor indoor climate and a need to replace the ventilation and cooling system and more. Such a project allows for energy optimisation of the systems and the results have been extremely positive, with savings of approximately NOK 800,000 compared to previous years. By harnessing the heat from the cooling units, further savings can be achieved on the purchase of district heating. Senter Syd is one of several centres with a particular energy focus.

27
The Olav Thon Group’s work on equality and anti-discrimination is rooted in our diversity and equality policy. The purpose of the policy is to promote equality and ensure equal opportunities and rights for everyone, regardless of ethnicity, religion, sexual orientation, age and/or disability. This applies to all aspects of employment: recruitment, pay and working conditions, development opportunities, as well as termination of employment.
GENDER BREAKDOWNThe Olav Thon Group has a balanced gender breakdown and the trend is towards a steadily growing proportion of women. The gender breakdown among managers remains on a par with that in previous years.
The proportion of female employees was higher in 2019 than in 2018. The proportion of women in the Group is 54%. An increase of three percentage points has been recorded since 2015. This demonstrates the Olav Thon Group’s positive attitude towards equality.
The total proportion of female managers is at the same level in 2019 as in 2018. Women occupied 46% of senior positions in 2019. There are variations in gender breakdown when differentiating between managers and senior managers. The percentage of women in senior management is 44%. Amongst middle management it is 48%. This means that the proportion of women in senior management has increased by three percentage points since 2018. This is
a positive improvement but there is still some potential for improvement among senior management.
In 2019 there was an increase in the number of managers of 9% compared to 2018. Broken down by gender, there was an increase of 8% in male managers and 10% in female managers. This means that more female than male managers were appointed by the Olav Thon Group in 2019.
AGE BREAKDOWNThe age breakdown of the Olav Thon Group’s employees is balanced. 48% of employees are in the 30-49 age group. This is a large group and spans a wide range of experience and skills. Besides the 30-49 age group, a large proportion of the Group’s employees are younger than 30. A large proportion of these work in Thon Hotels, which as a division attracts many young employees. The hotel division also has the highest number of employees, meaning that Thon Hotels has a big impact on the Group’s gender and age statistics for its employees. We consider this broad age distribution to be positive.
EXPECTATIONS FOR THE FUTUREThe work is expected to continue. There are no further expectations of major changes to the way in which we work on equality and inclusion at the current time.
We strive to achieve genuine equality and good diversity among our employees in the Olav Thon Group. That is why we are able to point to a balanced gender breakdown and our commitment to several inclusion projects.
Social responsibilityGender and age breakdown
AGE DISTRIBUTION
Under 30 30-49 50 and over
33 %
48 %
19 %
Women Men
GENDER DISTRIBUTION AMONG MANAGERS AND MIDDLE MANAGEMENT
MIDLLE MANAGEMENT MANAGERS
0
50
100
150
200
250
300
GenderWomenMen
2015 2016 2018201751 % 52 % 53 % 53 %49 % 48 % 47 % 47 %
201954 %46 %

28
The Olav Thon Group continuously strives to be an inclusive employer and to create diverse workplaces. This is reflected in the Group’s recruitment process, as well as through its collaborations with various actors who work to create inclusive workplaces.
RINGER I VANNETRinger i Vannet is a labour and inclusion project organised by the Confederation of Norwegian Enterprise (NHO). The aim of the project is to get people who have fallen out of the labour market back into work at NHO member companies. Ringer i Vannet is based on local cooperation between companies and labour and inclusion agencies operating in the local community.
Thon Hotels signed a group agreement with Ringer i Vannet in autumn 2017. Since then, 27 hotels have signed agreements with local labour and inclusion agencies. These agreements have resulted in 16 confirmed appointments in 2019. According to Ringer i Vannet’s reports, society saves NOK 10 million every time a person is helped back into work. This means that, through Ringer i Vannet, Thon Hotels has already saved society NOK 230 million since the Group agreement was signed in 2017.
COLLABORATION WITH NAV BJERKEThe Olav Thon Group has worked with NAV Bjerke in Oslo since 2013. Thon Hotels is at the forefront of this work, and contributes the work training for the target group in the collaboration. Since 2013, 70 people have been offered work experience at our hotels in Oslo.
The aim of the partnership is to help provide access to the labour market for people with an immigrant background. The partnership is a win-win situation for all parties – the candidates gain workplace training, language training and a network, the hotels gain contact with talented people who can quickly move into employment and Norwegian society benefits from the value creation the individual worker contributes.
In 2019, a total of 14 candidates were offered work experience in our hotels. Of these, four candidates have gained full-time or temporary jobs.
PØBELPROSJEKTETThe Olav Thon Group had an informal partnership with Pøbelprosjektet (an employment project) for quite some time. It all started with Thon Hotel Vettre in Asker, and has since spread to other hotels and shopping centres in the Oslo area. In 2017, the Olav Thon Group and Pøbelprosjektet formalised their collaboration through a partnership agreement.
ASSESSMENT AND EXPECTATIONSThe collaborations are working well and we consider the results to be positive. We anticipate that these collaborations will continue and that the Olav Thon Group will increase its commitment through participation in the “Vi Inkluderer” pilot project from and including 2020.
AGE DISTRIBUTION PER DIVISION
Under 30 30-49 50 and over Not stated
Thon Hotels Shopping Centre Division HQ Thon Bygg Resthon Other companies
0
10
20
30
40
50
60
An inclusive workplace

29
As part of the Group’s work on social conditions and employee rights, the Olav Thon Group works on employee development. Systematic training and education are offered and centrally followed up by the HR department.
TRAINING AND SKILLS DEVELOPMENTFacilitating training and skills development is important for the progress of the Group and is therefore one of the HR department’s most important focus areas. Information on training and enrolment is published via the Group’s activity calendar in the training administration system. 50 different training courses were arranged by the Group in 2019, in areas such as safety, food and beverages, HSE, IT systems, service, management and sales. A total of approximately 2,200 employees have participated in one or more training courses. These results are considered positive and the work continues. Training provisions are expected to be expanded if relevant.
In addition to training courses, a total of five seminars of various types were also arranged in 2019.
THE F&B SCHOOLThe F&B School arranged courses for the first time in 2016. This is an internal knowledge school focusing on food and beverages for the employees of Thon Hotels and Resthon. The school offers multiple levels and the elementary school was launched in 2016. The elementary school is a three-day course covering the basics of being a good service associate. Every day
has a focus area – wine, beer and spirits. This was continued in 2019 and a total of 55 employees of Thon Hotels and Resthon attended two sessions of the elementary school.
TRAINING GRANTSIn partnership with several of our suppliers, we are able to offer financial support/grants to our staff in Thon Hotels and Resthon, through the Training Fund. The grants are for people who want to learn more within a specific field they are working in and are enthusiastic about. This could mean a course in restaurant management, training as a bartender or sommelier, or a craft certificate.
APPRENTICESIt is becoming increasingly important for the hotel industry to attract apprentices, both to support professionalism in the industry and because the authorities are introducing ever more stringent requirements regarding the use of apprentices in connection with tenders. In Thon Hotels, it is the hotels themselves that decide to take on apprentices, although this is increasingly becoming a focus area for central management. In 2019, 47 of our hotels were approved apprenticeship companies and employed 71 apprentices training to be chefs, receptionists, waiters and waitresses, pastry chefs and in tourism. We consider these to be positive results and will continue focusing on the use of apprentices.
Employee development

30
The Olav Thon Group’s health, safety and environment work aims to create safe and secure places to work, with good working conditions and thriving employees and managers. This work is linked to the Group’s work on employee rights.
ABOUT THE WORKThe Group’s HSE vision is to maintain a “visible focus on health, safety and the environment.” The various divisions in the Group are working in different ways and on all levels of the organisation to achieve our vision:• The executive management
team holds four HSE meetings each year, in which the key guidelines for HSE are drawn up.
• It has been decided that HSE should be an agenda item in internal meetings.
• The HSE department attends internal meetings and talks about the HSE work.
• The HSE department attends internal HSE training courses and talks about HSE in the Group.
• News on health and safety issues is published on the intranet, and printed information sheets are distributed that can be posted on noticeboards to reach those who do not have their own PC.
To get more information out into the organisation, it has been decided to produce two HR & HSE newsletters each year. These will be sent out to managers in the Group. The idea is for the newsletters to be posted on noticeboards and thus be made available to employees.
HSE
OTG
WECATU
AKAN
Conrad Langaard
Thon Eiendom
Head-quartersTime ParkThon HotelsResthonAMFI
Follo Fjernvarme
Unger Fabrikker
HSE ORGANISATION

31
The executive management team is the supreme body for HSE matters. The central guidelines are then implemented via the working environment committees (WECs) in the various divisions and units.
HSEThe executive management team holds at least four HSE meetings each year in which key guidelines for HSE are drawn up. The Group HSE Director heads the health, safety and environment work, and has established a network of working environment committees (WECs) at a company level. Local unit managers are responsible for HSE in their unit, and have a duty to follow up statutory HSE requirements.
WORKING ENVIRONMENT COMMITTEE (WEC) A WEC is a decision-making and advisory body tasked with helping to implement working environment legislation in the enterprise. The committees take part in the planning of health, safety and environment work in the enterprise, and closely follow developments in the working environment. There are a total of 13 WECs in the Olav Thon Group.
There is a central WEC for hotels and restaurants. There are also 12 local WECs, nine of which are linked to Thon Hotels. Over 90% of our employees are represented via a formal WEC.
Organisation (incl. WEC)
HSE groupGroup
WECHotell&Rest
WECHeadquarters
WECCra�smen
WECSurnadal office
Units without own WEC
Hotels with own WECs
Other Businesses:Unger FabrikkerConrad LangaardFollo Fjernvarme
WEC ORGANISATION
WECOpera�ons personell

32
The figures in the table include self-certified and doctor-certified sick leave for our companies. In comparison, the national average was 5.8% in 2019.
Knowing the sick leave figures for a given period means we also know the attendance rate for the same period. The attendance rate tells us how many employees have been at work and is related to factors such as a sense of belonging, loyalty, team spirit, motivation, professional pride, responsibility, being able to use your skills, leadership, and caring for each other.
Sick leave is always on the agenda of each WEC, with the aim of increasing attendance in the Olav Thon Group. The occupational health service for Thon Hotels, Resthon and Thon Bygg AS follows up units whose attendance figures are too low, and helps to establish measures to improve them. Local social activities that promote better working environments are also organised.
One of the goals of the Olav Thon Group’s HSE work is to achieve lower sick leave than the national average.
Sick leave
22 11,92 %6 0,51 %
440 5,23 %2 086 9,26 %
476 4,09 %60 2,22 %68 4,98 %
115 5,70 %
306 3,93 %Division FTEs Sick leave 2019Amfi GroupConrad LangaardFollo FjernvarmeHeadquarter1Hotels2Shopping centres3Resthon ASThon Eiendomsservice ASUnger Fabrikker
1. Includes Thon Hotels AS/Thon Hotels Salg AS/Thon Holding AS/Time ParkAS/Time Park Services AS/Norsk Pantelotteri AS/ Norsk Underholdningsspill AS.
2. Includes all operating companies belonging to Thon Hotels AS (incl.Sweden, Belgium and the Netherlands) + Vettre Hotelldrift AS, Linne Hotell AS, and Hotel Bristol AS.
3. Includes Olav Thon Eiendomsselskap ASA/Gardermoen Park AS/ Bergen StorsenterAS/ Lagunen AS/ Amfi konsern/ Vestkanten AS/Sartor Senterforening AS/ØsteråsKjøpesenter AS/Åsane Storsenter DA/Thon Ski AS/ Thon Sverige AB konsern/ThonFastigheter AB konsern.

33
RISK ASSESSMENTThe Olav Thon Group’s risk picture has not really changed in recent years. This is especially true when it comes to ordinary incidents such as burglary and vandalism, where the number of incidents has actually dropped. However, there is an increase in the risk and likelihood of digital crime. We occasionally also experience increasing challenges associated with nuisance issues at shopping centres in city centres.
ANTI-CORRUPTIONAs part of the Group’s work on security, we systematically work on anti-corruption. We offer training courses in how to detect and handle embezzlement, the Security Manager reviews the annual financial statements together with the auditor each year, we have clear procedures in place for cash sales and we conduct annual inspections on how cash and card sales are carried out.
Experience indicates that the majority of those who are found to commit embezzlement (excluding cash sales) are randomly discovered. Notification of inappropriate circumstances is therefore a key element in exposing this type of crime. However, embezzlement in connection with cash sales is predominantly discovered through inspections and monitoring, emphasising the importance of clear procedures and the management of these.
THE DIGITAL THREATThe digital threat continued to grow in 2019 and we have experienced almost weekly scam attempts in Norway, Sweden, and Belgium. In addition to phishing attacks targeted at employees, we see that the theft of bonus points from members is increasing significantly. This is a general challenge across the industry.
EMERGENCY PREPAREDNESS DRILLSThe Olav Thon Group has a central emergency response team that manages incidents when our operating units need assistance. The emergency response team conducted four emergency preparedness drills in 2019, as well as several meetings to discuss actual incidents. The focus has been on reviewing actual incidents/cases to learn to become better. The Executive Management Team has also reviewed the incidents concerned with a focus on their responsibilities in connection with serious incidents. The majority of shopping centres and hotels have conducted their own training. The Olav Thon Group’s Security Manager has also participated in several of these training sessions.
EMERGENCY INCIDENTSAs a major industry player, the Olav Thon Group occasionally experiences incidents with varying security characteristics. The Olav Thon Group experienced no incidents categorised as very serious (incidents that resulted in a fatality) in 2019. The risk and threat situation in the Olav Thon Group is considered to be at an acceptable level, which has not changed significantly since 2018. Nevertheless, we still experienced several serious incidents of various natures at our properties in 2019:
- Threats made against shopping centres via social media
- Fall accidents on stairs, escalators and moving walkways (some fracture injuries)
- One rape - Five natural deaths at our
hotels - One suicide attempt - Minor fires - Attempted fraud targeted at the
Olav Thon Foundation - Misuse of Group CEO Olav
Thon’s name in an attempted fraud
- Misuse of the Group name and logo in an attempted fraud
- Flooding - Violent demonstrations in
Brussels
The Olav Thon Group focuses on the safety of both people and property. Digital attacks became increasingly common in 2019.
Security
34
Responsible procurement is part of the Olav Thon Group’s work to safeguard human rights, employee rights, social conditions, the external environment and to combat corruption. The Group integrates these considerations through a procurement policy and thorough procedures for supplier selection that include assessing numerous aspects of corporate social responsibility that are relevant within each category. We also have our own code of conduct requirements that impose strict requirements on all suppliers and subcontractors, including their focus on and continuous work with human rights, working conditions, the environment and anti-corruption. We follow up on these requirements through an annual supplier survey.
NEW SUPPLIER CODE OF CONDUCTIn 2019, the Olav Thon Group prepared a new code of conduct for suppliers. The new code of conduct is based on Ethical Trade Norway’s code of conduct template and references a substantial proportion of ILO conventions on the following topics: forced labour/slave labour, trade unionism and collective bargaining, child labour, discrimination, abusive behaviour, HSE, pay, working hours, decent work, marginalised populations, the environment, corruption and animal welfare. The new code of conduct was adopted at the end of 2019 and is continuously introduced in new agreements.
SUPPLY CHAIN CONTROLIn 2017, the Purchasing department carried out a project together with the sustainability advisor aimed at improving our control of the supply chain with regard to ethical purchasing. The Olav Thon Group has a code of conduct and the project worked to identify and assess the need to monitor risk more closely. As a control measure, a form was produced for further checks of suppliers within the purchasing categories that were considered to be most risky. The suppliers’ responses were used to follow up relevant points.
After having followed up this work in 2018, a need to systemise the work even further has been identified. An agreement was therefore entered into with Factlines in 2019 regarding broader and more systematic monitoring of the supply chain. An audit of the supply chain based on a risk assessment was conducted for the first time in Q2 2019.This survey was adapted to the Olav Thon Group’s Supplier Code of Conduct and the outcome shows that 93% of suppliers have adopted strategies for sustainability/corporate social responsibility, 90% have an overview of their supplier chain and 87% state that they have a system or procedures in place to follow up on their supplier chains. We consider these results to be positive and as a Group we have faith in our suppliers adhering to our code of conduct. At the same time, it is important to continue working on these areas. The Olav Thon Group will continue to carry out annual, risk-based surveys of
the supplier chain. We anticipate adapting the 2020 survey to the new code of conduct and the survey will be issued to around 100 suppliers.
SUSTAINABLE FOODThe Group is increasingly focusing on sustainable food. The key concepts are quality, safety and eco-friendly food.
The Olav Thon Group’s central Purchasing Department, on behalf of our hotels and other catering outlets, is constantly on the lookout for good ingredients in collaboration with our suppliers. The Group focuses heavily on quality at all stages, from buying to serving. Our food and beverage managers run regular training courses for chefs and encourage the maximum use of fresh, unprocessed products.
We are proud of our partnership with good Norwegian suppliers. We only buy food that can be traced back through the suppliers, so we know where the food comes from. We are concerned with good internal control and are regularly visited by supervisory authorities, which helps ensure a safe and clean environment for food preparation.
Thon Hotels has a policy whereby all hotels must seek to increase the number of organic products every year. In 2019, we assumed it would be possible to offer a minimum of 15 organic products at each hotel. Our hotels also focus on local food in the form of home-cooked dishes. A steadily increasing number of products are produced locally in the hotels.
The Olav Thon Group purchases goods and services worth NOK 3-5 billion each year and has a major responsibility as a purchaser.
Supplier chain


36
ORGANISATIONAL PROFILE102-1 Name of the organisation102-2 Activities, brands, products, and services102-3 Location of headquarters104-4 Location of operations102-5 Ownership and legal form102-6 Markets served102-7 Scale of the organisation102-8 Information on employees and other workers102-9 Supply chain102-10 Significant changes to the organisation and its supply chain102-11 Precautionary Principle or approach102-12 External initiatives102-13 Membership of associations
STRATEGY102-14 Statement from senior decision-maker
ETHICS AND INTEGRITY102-16 Values, principles, standards, and norms of behaviour
GOVERNANCE102-18 Governance structure
STAKEHOLDER ENGAGEMENT102-40 List of stakeholder groups102-41 Collective bargaining agreements102-42 Identifying and selecting stakeholders102-43 Approach to stakeholder engagement102-44 Key topics and concerns raised
REPORTING PRACTICE102-45 Entities included in the consolidated financial statements or equivalent documents102-46 Defining report content and topic boundaries102-47 List of material topics102-48 Restatements of information102-49 Significant changes from previous reporting periods in terms of scope and boundaries102-50 Reporting period102-51 Date of most recent report102-52 Reporting cycle102-53 Contact point for questions regarding the report102-54 Claims of reporting in accordance with the GRI Standards102-55 GRI content index102-56 External assurance
Page 3www.olavthon.nowww.olavthon.nowww.olavthon.no
Page 3Annual Report of the Olav Thon GroupAnnual Report of the Olav Thon GroupAnnual Report of the Olav Thon Group
Page 34No relevant significant changes
Page 30Pages 7-8, 14 and 16
Thon Hotels is a member of the Norwegian Hospitality Association. Otherwise, no such memberships.
Page 7
www.olavthon.no
Page 3
Page 14Around 70%
Page 14Page 14Page 14
www.olavthon.noPage 14
Pages 14-15 and 16Page 39-40
Page 14Page 14Page 14Page 14Page 42Page 14
Page 35-36The report is not audited by an
external party
The Olav Thon Group’s general disclosures are provided below. They are based the on a template from the Global Reporting Initiative (GRI).
General disclosures

37
ECONOMIC PERFORMANCEGRI 201-1 Direct economic value generated and distributedGRI 103 Management approach
ENVIRONMENTGRI 302-1 Energy consumption within the organisationGRI 306-3 Waste overviewGRI 307-1 Non-compliance with environmental laws and regulationsGRI 103 Management approach
SOCIAL EFFECTSLABOUR PRACTICES AND DECENT WORKGRI 403-1 Working environment committeeGRI 404-1 Education, training and counsellingGRI 405-1 Gender and age breakdownGRI 103 Management approach
HUMAN RIGHTSGRI 406-1 Incidents of discriminationGRI 407-1 Monitoring of suppliers (organisational freedom)GRI 408-1 Monitoring of suppliers (abolishing child labour)GRI 103 Management approach
Page 19Page 14, 16, 19
Page 24-26Page 21-23No instancesPage 14, 16, 20-26
Page 31Page 29Page 27-28Page 14, 16, 27-33
No known instancesPage 34Page 34Pages 12, 14, 31
The Olav Thon Group’s sustainability report for 2019 has been produced in accordance with the GRI’s guidelines for sustainability reporting. The Group’s reporting qualifies it for Core level use of the GRI Standards.
GRI Index

38
The Global Compact is a UN initiative for collaboration with businesses on sustainable development. The letter below was sent to the then Secretary-General of the UN, H.E. Ban Ki-moon, confirming that in supporting the Global Compact, the Olav Thon Group undertakes to integrate the ten basic principles into its strategy and day-to-day operations. The next letter confirms that the Olav Thon Group continues to be a Signatory of the UN Global Compact and that the Group’s work will be summarised in an annual report (Communication on Progress).
UN Global Compact

39

40
FINANCIAL FIGURESThe Olav Thon Group now reports in accordance with IFRS, which affects some of the reported figures concerning the Group’s financial contribution to society.
The 2018 figures in the table showing an overview of the Group’s income and expenditure have been updated in accordance with IFRS. This means that these figures have been modified slightly compared to last year’s report. The primary purpose of this is to improve comparability between 2018 and 2019.
The reported figures are distributed as follows:
1. Income: Compilation of the Olav Thon Group’s total operating income.
2. Operating expenses: Other operating expenses, product costs for residential properties.
3. Employee wages and benefits: Wages and benefits to employees, as well as employer’s national insurance contributions.
4. Payments to providers of capital: Provisions for dividends/dividends paid and interest expenses.
5. Payments to authorities: Tax payable, corrections to taxes for previous years and property tax.
6. Investments in society: see explanation below.
After once more reassessing GRI 201, we have concluded that “Investments in society” covers more of our business than was previously reported. This applies to Norsk Pantelotteri AS and its financial contributions to the Norwegian Red Cross. The activities
of the Pantelotteri help contribute to a steady stream of revenue for the Norwegian Red Cross. There are no commercial interests associated with the transfer of these values to the Norwegian Red Cross. Transfer to the Norwegian Red Cross is therefore included in this year’s reporting of investments in society. This has also been adjusted in the 2018 figures. In 2019, NOK 84 million were invested in society, distributed as follows: NOK 21.3 million was invested in local communities in connection with construction projects, NOK 62.7 million was transferred to the Norwegian Red Cross. The Olav Thon Foundation’s contributions to scientific research and non-profit causes can be linked to the Group’s activities, as the contributions are taken from the Olav Thon Group’s profits. These figures have therefore been accounted for in the chapter on finances, but have not been included in the calculation of the Group’s investments in society, as the reporting covers only the activities of the Olav Thon Group and not the Olav Thon Foundation.
BASE DATA FOR WASTEThe base data for waste was obtained from our waste management suppliers. This means that the figures were primarily obtained from Retura, Norsk Gjenvinning and Stena Recycling. Since the Olav Thon Group changed its main supplier of waste services in 2018, the figures are a collation of the services provided by both Retura and Norsk Gjenvinning in a Norwegian context. The figures from Retura were obtained via a contact person, while the figures from Stena Recycling and Norsk Gjenvinning
were obtained via customer portals. It is therefore possible that the incorrect use of a portal could represent a source of errors for waste figures, although none had been identified at the time the report was published.
All of the figures for waste were obtained for the full calendar year 2019. The sorting rate was calculated on the basis of the waste volume and is not an average of the various sorting rates per division/location. This is to ensure that the Group’s sorting rate represents the actual sorting rate. The specified sorting rates per division are calculated in the same way, although with the collation of the figures for the locations included in the division.
The overview of the waste management (material recovery, energy recovery, etc.) was obtained from Retura and only covers waste managed by Retura. This represented the majority of waste in 2019.
There are some uncertainties associated with the figures for Thon Hotels in Benelux. Among other things, there has been inadequate data collection as a result of the COVID-19 situation.
BASE DATA FOR ENERGYThe figures reported account for the Olav Thon Group’s overall activities in Norway, including the Group’s own district heating company, Follo Fjernvarme.
Explanation of the base data for the various types of energy consumption:
1. Non-renewable fuels: The
The appendix provides supplementary information about various elements of this year’s Sustainability Report.
Appendices
consumption comprises the sum of Follo Fjernvarme’s purchases of oil and gas (and others), and the consumption of fuels, obtained from the Olav Thon Group’s Purchasing Department. The figures from Follo Fjernvarme are considered precise, but the figures from the Purchasing Department represent a summary of the invoiced costs from typical fuel suppliers. Fuel consumption is calculated by dividing the total invoiced sum by the average cost per litre of fuel. Energy consumption is calculated using a factor of 9 kWh/L and an efficiency rate of 45. Follo Fjernvarme uses gas for peak loads as needed.
2. Renewable fuels: 3. The consumption comprises
Follo Fjernvarme use of pellets (biomass) and is considered precise.
4. Electricity consumption: 5. The consumption comprises
the sum of Follo Fjernvarme’s purchases of electricity and the electricity suppliers’ stated deliveries to the Olav Thon Group. Control numbers from Energinet indicate a slightly smaller volume. This is primarily due to the fact that some properties are not registered in Energinet. Energinet is a digital solution for continuously monitoring and reporting energy consumption. Consumption is automatically recorded via electricity meters in the properties.
6. District heating consumption: 7. The consumption comprises
the total consumption recorded in Energinet as well as Follo Fjernvarme’s district heating consumption. Control numbers have not been obtained from the Purchasing department.
8. District cooling consumption: The consumption is the registered consumption in Energinet. Control numbers have not been obtained from
the Purchasing Department.9. Sales of district heating: 10. Registered sales obtained from
Follo Fjernvarme.11. Sales of cooling: 12. Registered sales obtained from
Follo Fjernvarme.
The goal is to use statistics from Energinet. At the moment, only the consumption figures for district heating and district cooling can be read in Energinet, albeit with a supplement for district heating from Follo Fjernvarme. The numbers are still subject to some uncertainty.
In order to see the trend for specific consumption (kWh/ m2), we need a link between consumptions figures and space. As of today, the only place this exists is in Energinet. Energinet contains electricity, district heating and district cooling. This specifies the heated area, which means the area inclusive of tenants, while the consumption figures are stated exclusive of tenants. The figures will therefore not be correct. It would be best if we could compare consumption in shared facilities against our areas of the shared facilities, but we do not have these area figures available. However, using the suppliers’ figures for shared facilities and areas from Energinet, we are able to obtain a figure we can use for comparisons. However, we are aware that the area figures in Energinet are imprecise and not up to date. This affects the calculation of consumption per square metre.
GENDER AND AGESources:
• The Olav Thon Group’s HR system (Norway)
• The Olav Thon Group’s payroll system (Norway)
• Thon Hotels’ HR system (Benelux)
• Thon Hotels AB’s HR system (Sweden)
• Thon Property AB’s HR system (Sweden)
The age statistics provide an anonymous overview of the ages of employees from all of the sources. These have been collated per division and totalled. Age statistics for Thon Hotels in Benelux are the same as in 2018 as the COVID-19 situation has made it difficult to obtain the data prior to the publication of this report.
The gender statistics were obtained at an overarching level from the Olav Thon Group’s HR system in Norway. 85% of the Group’s employees are employed in Norway and are registered in the HR system.
The gender breakdown of managers was obtained from the Olav Thon Group’s payroll system in Norway. The system is able to differentiate between senior managers and middle managers. The number of these per gender has been collated so that simple percentage calculations of the gender breakdown can be made for the categories senior manager and middle manager, as well as the overall picture.

Stenersgata 2APostboks 489 Sentrum | 0105 Oslo
Telephone +47 23 08 00 [email protected] | olavthon.no
THE OLAV THON GROUP