Survival analysis
27
Where are we?
-
Upload
khangminh22 -
Category
Documents
-
view
2 -
download
0
Transcript of Survival analysis

Where are we?
Survival analysis

Problem • Do patients survive longer after treatment A than after treatment B?
• Possible solutions:
– ANOVA on mean survival time?
– ANOVA on median survival time?

Progressively censored
observations • Current life table
– Completed dataset
• Cohort life table
– Analysis “on the fly”
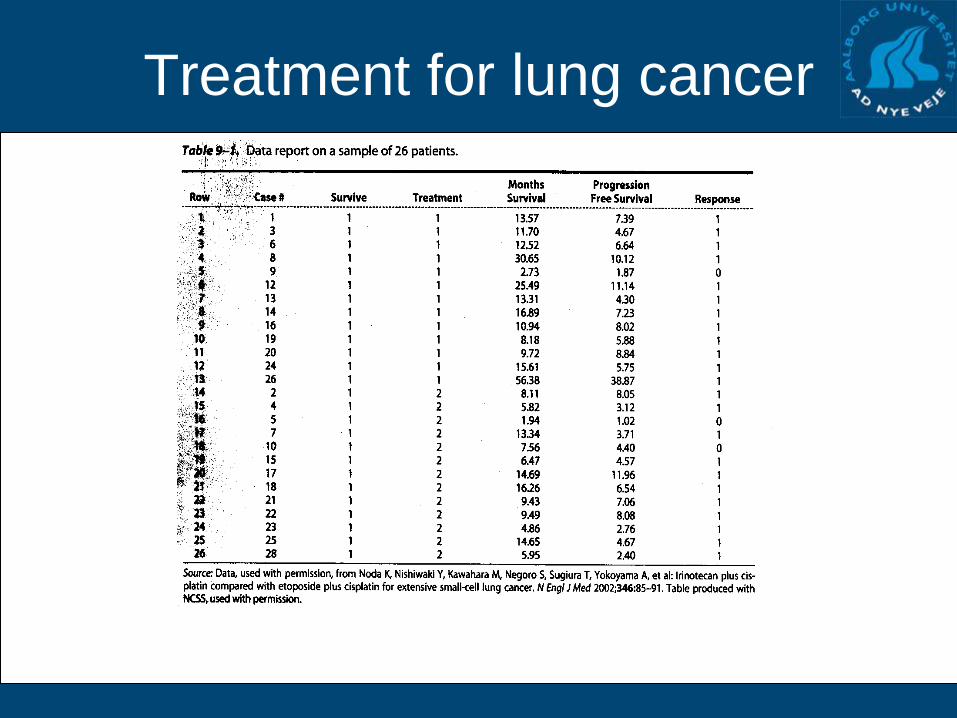
Treatment for lung cancer

Treatment for lung cancer • A sub-set of 13 patients undergoing the same treatment

Person-year of observation • In total: 68 months ~ 5.7y
• 2 patients terminated:
2/5.7y = 0.35 y-1
35 terminal events/100y
• 1000 patients in 1 y
or
• 100 patients in 10y

Mortality rates • 2 of 13 patients terminated
= 15%
• When is the analysis done?

3-month survival rate • 1 patient terminates the first 3 months
• 10 patients lasted more than 3 months without progression
• 1/11 = 9%
• Should the other patients count?
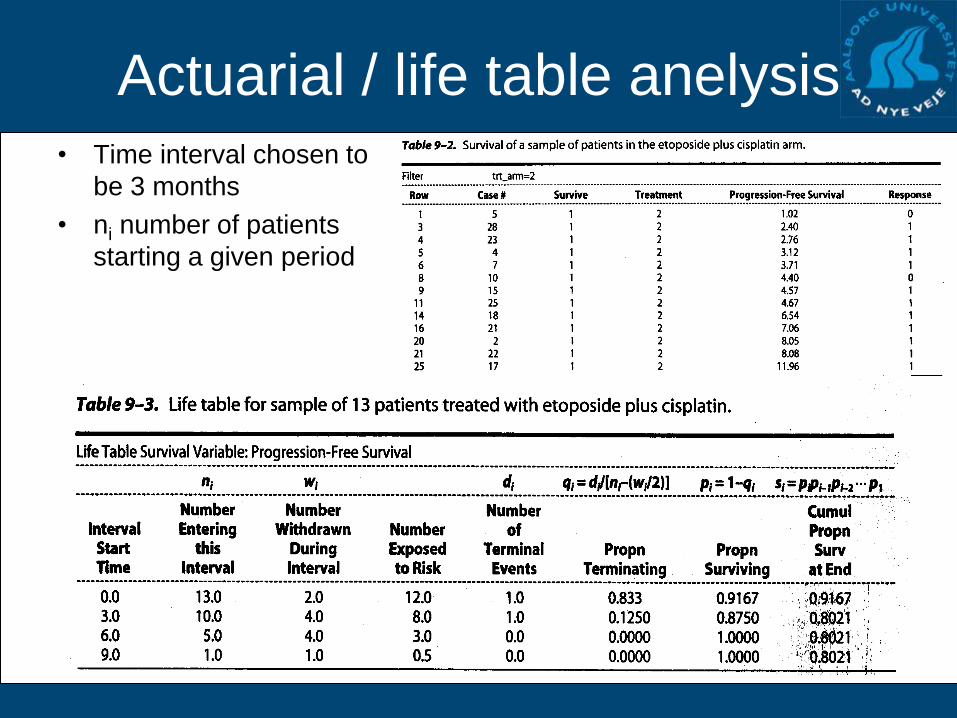
Actuarial / life table anelysis • Time interval chosen to
be 3 months
• ni number of patients
starting a given period

Actuarial / life table anelysis • di number of terminal
events, in this example;
progression/response
• wi number of patients that
have not yet been in the
study long enough to
finish this period
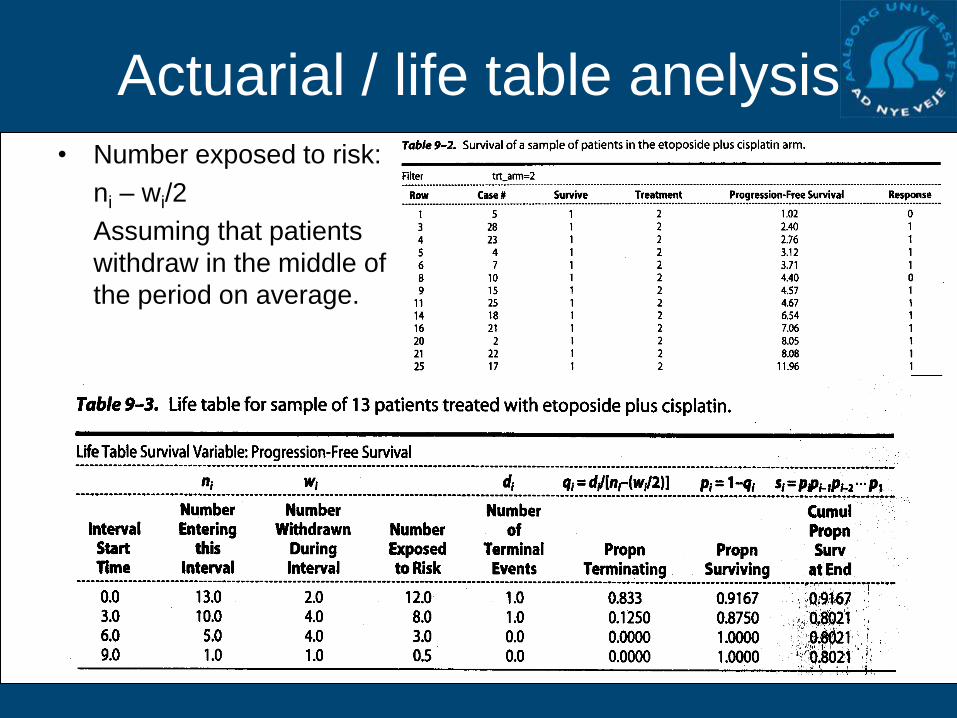
Actuarial / life table anelysis • Number exposed to risk:
ni – wi/2
Assuming that patients
withdraw in the middle of
the period on average.

Actuarial / life table anelysis • qi = di/(ni – wi/2)
Proportion of patients
terminating in the period

Actuarial / life table anelysis • pi = 1 - qi
Proportion of patients
surviving

Actuarial / life table anelysis • Si = pi pi-1 ...pi-N
Cumulative proportion of
surviving
Conditional probability

Survival curves
• How long will a lung cancer
patient keep having cancer
on this particular
treatment?
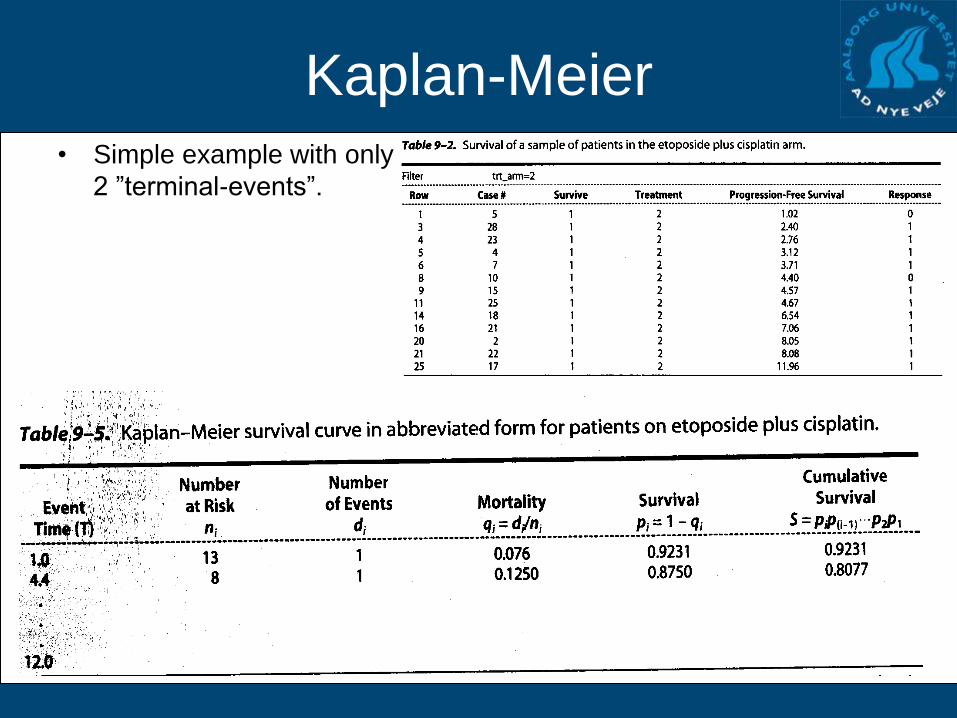
Kaplan-Meier • Simple example with only
2 ”terminal-events”.

Confidence interval of the Kaplan-
Meier method • Fx at first terminal event
( ) i
i i
i i i
dSE S S
n n d
0.0739
11313
19231.01
SSE

Confidence interval of the Kaplan-
Meier method • Survival plot for all data on
treatment 1
• Are there differences between the
treatments?

Comparing Two Survival Curves • One could use the confidence
intervals…
• But what if the confidence
intervals are not overlapping
only at some points?
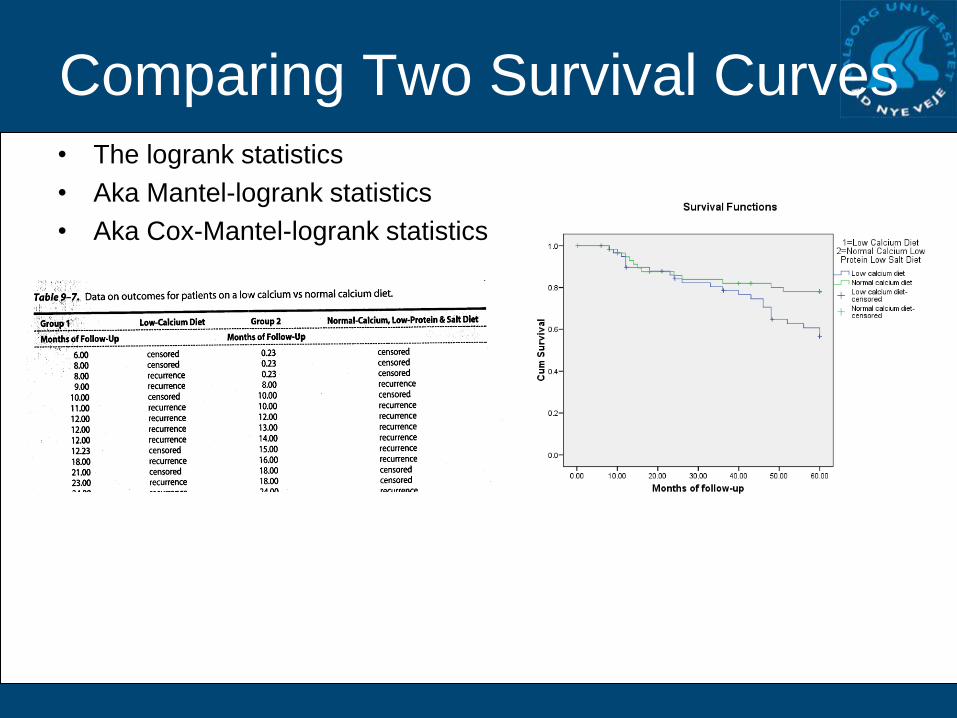
Comparing Two Survival Curves • The logrank statistics
• Aka Mantel-logrank statistics
• Aka Cox-Mantel-logrank statistics

Comparing Two Survival Curves
1. Divide the data into intervals (eg. 10 months)
2. Count the number of patients at risk in the groups and in total
3. Count the number of terminal events in the groups and in total
4. Calculate the expected numbers of terminal events
e.g. (31-40) 44 in grp1 and 46 in grp2, 4 terminal events.
expected terminal events 4x(44/90) and 4x(46/90)
5. Calculate the total

Comparing Two Survival Curves • Smells like Chi-Square statistics
2
2
all_treatments
O E
E
2 2
223 17.07 12 17.93
4.0217.07 17.93
1df 0.05p

Comparing Two Survival Curves • Hazard ratio
1 1
2 2
23 17.07Hazard ratio 2.01
12 17.93
O E
O E

Comparing Two Survival Curves • Mantel Haenszel test
• Is the OR significant
different from 1?
• Look at cell (1,1)
• Estimated value, E(ai)
• Variance, V(ai)
row total * column total
grand total
2
( )( )( )( )( )
1i
a c b d a b c dV a
n n
𝑂𝑅 = 𝑎 × 𝑑 /𝑛
𝑏 × 𝑐 /𝑛

Comparing Two Survival Curves • Mantel Haenszel test
• df = 1; p>0.05
2
( )1.12
( )
i i
i
a E aM H
V a
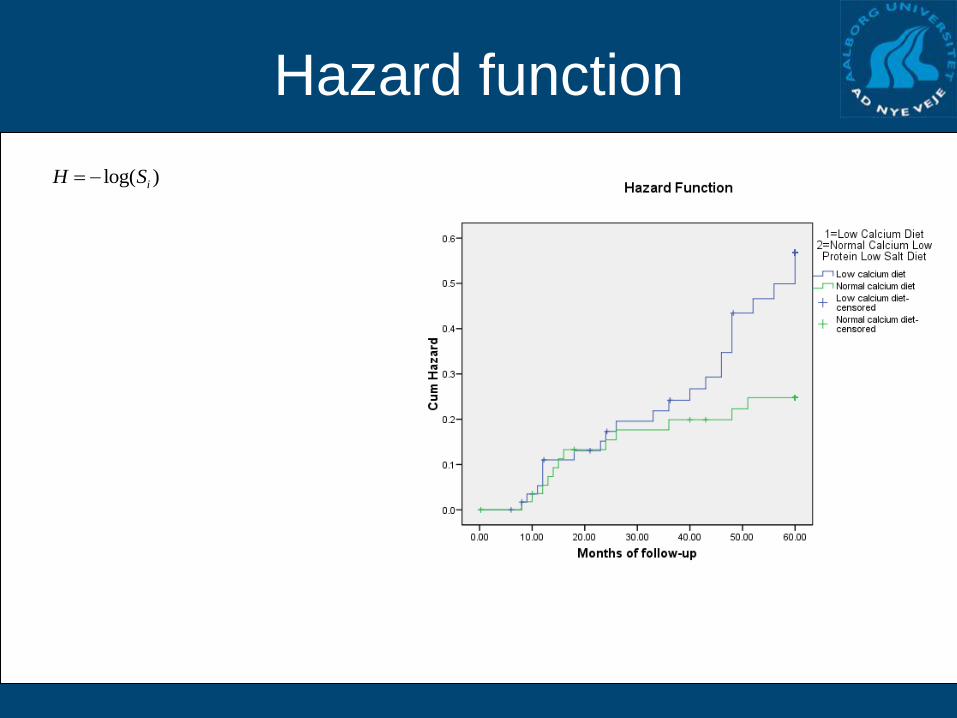
Hazard function
log( )iH S