
Survival Analysis in Tourism Demand: The length of stay in Latin American destinations
25
Survival Analysis in Tourism Demand: The length of stay in Latin American destinations Carlos Pestana Barros a and Antónia Correia b a Instituto Superior de Economia e Gestão (ISEG), Technical University of Lisbon, Department of Economics, Rua Miguel Lupi, 20, 1249-078 Lisbon, Portugal. [email protected] . b Faculty of Economics, University of the Algarve, Portugal, [email protected] Abstract: This article analyses the determinants of the length of stay of Portuguese tourists taking vacations in Latin America, based on a questionnaire distributed on flights of a Portuguese charter airline, Air Luxor. A survival model is adopted to measure the relationship between vacation length and covariates. It is concluded that the most affluent tourists, who are motivated by culture, climate and security, will have the longest stays. The policy implication is derived. Keywords: duration models, heterogeneity, tourism, Latin America. 1. Introduction The empirical study of tourism duration can benefit from the application of event history analysis, a technique that focuses on the effects of factors that determine the length of time until the occurrence of some event, such as the termination of the homeward-bound journey after a vacation. This technique has been previously used in tourism by Gokovali, Bahar & Kozak (2006) and is currently adopted elsewhere such as in labour economics (Carrasco, 1999), international relations (Box Steffensmeier, Reiter & Zorn, 2003; Barros, Alana & Passos, 2005), corporate finance (Holtz-Eakin, Joulfain & Rosen, 1994), etc.
Transcript of Survival Analysis in Tourism Demand: The length of stay in Latin American destinations
Survival Analysis in Tourism Demand: The length of stay in Latin American
destinations
Carlos Pestana Barrosa and Antónia Correiab
a Instituto Superior de Economia e Gestão (ISEG), Technical University of Lisbon, Department of Economics, Rua Miguel Lupi, 20, 1249-078 Lisbon, Portugal. [email protected]. b Faculty of Economics, University of the Algarve, Portugal, [email protected]
Abstract: This article analyses the determinants of the length of stay of Portuguese
tourists taking vacations in Latin America, based on a questionnaire distributed on
flights of a Portuguese charter airline, Air Luxor. A survival model is adopted to
measure the relationship between vacation length and covariates. It is concluded that
the most affluent tourists, who are motivated by culture, climate and security, will
have the longest stays. The policy implication is derived.
Keywords: duration models, heterogeneity, tourism, Latin America.
1. Introduction
The empirical study of tourism duration can benefit from the application of event
history analysis, a technique that focuses on the effects of factors that determine the
length of time until the occurrence of some event, such as the termination of the
homeward-bound journey after a vacation. This technique has been previously used
in tourism by Gokovali, Bahar & Kozak (2006) and is currently adopted elsewhere
such as in labour economics (Carrasco, 1999), international relations (Box
Steffensmeier, Reiter & Zorn, 2003; Barros, Alana & Passos, 2005), corporate finance
(Holtz-Eakin, Joulfain & Rosen, 1994), etc.

2
In this paper, we analyse the determinants of vacation travel length based on a data set
obtained from a questionnaire distributed in 2004 on board the planes of a Portuguese
tourist charter airline, Air Luxor.
The following motivations have inspired this research. First, travel duration is
of major interest in tourism management, since hotels aiming to maintain high rates of
occupancy wish to attract tourists who book the longest stays. Therefore, it is
important to ascertain the covariates which explain the decision related to the length
of vacations (Alegre & Pou, 2006). Second, while survival models are commonly
applied in several research fields such as labour and international relations, they are
rare in tourism, hence there is room to innovate in applied research is the field
(Gokovali et al., 2006). Finally, it is important for policy purposes to investigate if
different tourists react in the same way to the determinants of the length of stay in
different destinations. If the characteristics identifying the individual length of stay
were known, then one could better allocate resources used in managing such an event.
The paper contributes to the theme’s literature in three ways. First, by
adopting a questionnaire data framework, it uses a hazard models, previously used
only by Gokovali el al. (2006). Second, it specifically analyses length of vacations in
Latin America, a tourism destination rarely investigated (Sarigöllü & Huang, 2005).
Finally, it compares different survival models to identify the one which best fits the
questionnaire data, concluding that a Weibull survival model allowing for
heterogeneity is the one statistically chosen (Chesher, 1984; Chesher & Santos Silva,
2002).
This paper is organised as follows: After the introduction, in section 2, we present a
review of the literature relevant to the present research; in section 3, we present the
empirical framework of the analysis; in section 4, we present the model; in section 5,

3
presents the data gathering procedure; in section 6, the results are presented; in section
7, the results are discussed; and finally in section 8, we make our concluding remarks.
The main conclusion is that analysis of the length of vacation stays dependent on
questionnaire data must take into account the heterogeneity that is usually associated
with the individual characteristics of the sample. Failure to take such heterogeneity
into account may result in erroneous conclusions.
2. Literature Review
2.1 Theory
The work of Fishbein & Ajzen (1980), with their theory of reasoned action,
laid down theoretical foundations for the use of behavioural intentions as explanatory
variables of the regression models. This theory constitutes an extension of Fishbein’s
original model (Fishbein, 1967). The purchase intention is a function of the attitude
towards behaviour, as well as social norms. The attitude consists of perceived
expectations in terms of the possibility of adopting a certain form of behaviour, and
the evaluation of how the consumer feels towards this behaviour. The subjective
norms constitute a measure of the influence of the social environment on behaviour.
Its evaluation is carried out in terms of the motivation of the consumer to adopt the
attitude that social groups consider as being correct. The behavioural intention is
defined as a subjective probability to either adopt, or not adopt, a certain form of
behaviour (Baker & Crompton, 2000).

4
The conceptual problem consists of understanding the relationship between
vacation length of stay and expectations and attitudes in behavioural intentions, as
well as in the relationship between the intentions and the subsequent behaviour.
Fishbein (1967) defends that behavioural intentions are a function of the attitudes and
the subjective norms. The subjective norms represent the expectations of others with
regard to the behaviour of a certain individual. Although the selected variables could
be considered insufficient to explain consumer behaviour, the equation does not state
whether factors such as personality, social status, economic and demographic
variables are taken into account. Rather, their effect is contained in the two main
variables of the theory, i.e. attitudes and subjective norms.
The models studied, which are commonly referred to in the specialist literature
as multi-attribute, since they consider that a product possesses several self-
compensating attributes (compensatory), find their basis in the value-expectancy
theory (Baker & Crompton 2000).
The tourist decision-making process of Mathieson & Wall (1984) is also
adopted as a theoretical reference of this paper. According to their model, the tourist
decision process is affected by four factors: tourist profiles, trip features, travel
awareness and destination characteristics. Therefore these references serve as the
theoretical basis of the present research.
2.2 Empirical Research
Research adopting event history analysis in tourism is rare, due to the lack of data
suited to this type of analysis. The sole paper using this technique is Gokovali et al.
(2006), who analysed the length of stay of tourists in Bodrum, Turkey in the summer
of 2005 with two hazard models: the Cox and the Weibull models.

5
The theory of length of stay adopts traditional regression models and uses the length
of stay as an explanatory variable. Research in this tradition includes Alegre & Pou
(2006), who adopt a Tobit model to analyse the tourism length of stay, and Fleischer
& Pizam (2002), who use a logit model. Despite the fact that length of time is a
variable that, based on its characteristics, develops the survival models, the small
number of papers using different methods reach similar conclusions, with age and
income leading to an increase in the duration of vacations. This literature serves as the
reference for the present research.
3 Hypotheses
The focus of this paper is on the length of stay of Portuguese holidaymakers choosing
Latin America for their summer destination. The duration of tourism travel can be
explained by several factors: first, the budget and other specific characteristics of the
individuals who completed the questionnaire; second, destination attributes; third,
socio-demographic characteristics of the individuals; fourth, information relative to
the destination; fifth, returning to a destination; sixth, time constraints; seventh,
frequency of travel; and finally, the expectations prior to the vacations. These
characteristics enable the definition of the following hypotheses.
Hypothesis 1(budget): the length of vacation is determined by the income of the
individual. This is a traditional hypothesis in demand models, in which the price and
budget constraints determine the destination choice. Although most researchers use
price to explain the choice of destination (De la Vina & Ford, 2001), others consider
income (Hay & McConnel, 1979; Nicolau & Más, 2005).

6
Hypothesis 2 (destination attributes): the length of stay is determined by destination
attributes such as nature, culture, nightlife, climate, gastronomy, distance and ethnic
values. This is also a traditional hypothesis in tourism demand models (Costa &
Manente 1995). Woodside & Lysonski (1989), Woodside & MacDonald (1994) and
Goodrich (1980) proved that a destination’s image and its choice is influenced by
destination attributes.
Hypothesis 3 (socio-demographic characteristics): the length of stay is determined by
individual socio-demographic characteristics such as age, level of education, social
class, and the likelihood of being married and having children. This is also a
traditional hypothesis of demand models based on questionnaire data (Goodall &
Ashworth, 1988; Woodside & Lysonski, 1989; Weaver, McCleary, Lepisto &
Damonte, 1994; Zimmer, Brayley & Searle, 1995).
Hypothesis 4 (information): the length of stay is determined by the information
relative to the destination possessed by the individual. The perception formation
derives from information previously obtained, which helps the consumer to clarify
and to evaluate the destination alternatives (Um & Crompton, 1990). The information
processed and stocked from an image can be the combination between the cognitive
and the affective component. Therefore, it is the tourist’s perceptions which influence
his/her behaviour, rather than the real characteristics of the destination (Dann, 1981;
Pearce, 1982).

7
Hypothesis 5 (Return): the length of stay is determined by those who have previously
visited the region and would consequently be returning to their preferred tourist
destination. Festinger (1954) stated that satisfaction in relation to the destination
influences future choices. Beerli & Martín (2004) proved that sun-and-sand
destinations with a good image have a high level of repeat visitors. Kozak (2001)
demonstrated that overall satisfaction and the number of previous visits considerably
influences the intention to return, especially in mature destinations. Kozak (2003) also
concluded that destination attributes influence future behavioural intentions and
satisfaction.
Hypothesis 6 (Temporal constraints): the length of stay is determined by the
individual’s time constraints. Crompton (1979) suggests that the choice of destination
may be framed in the contextual setting as a function between money, time,
experience and image.
Hypothesis 7 (frequent traveller) The length of stay is greater for frequent travellers.
According to Pearce (1982), the individual tourist develops a tourism career, similar
to the working career. This implies that the individual starts by travelling abroad to
the nearest and cheapest destinations. Then as he/she climbs the occupational ladder,
the individual progressively becomes more demanding with regard to vacations.
Although this notion was first asserted in 1982, no research has thus far tested this
relation to the frequency of travel.
Hypothesis 8 (expectations): the length of stay is explained by the expectations of the
individual. Expectations are a major attribute in tourism destination choices.

8
Expectations appear in the literature as the probability that a certain attitude will lead
to positive or negative benefits, thus allowing the isolation of determining factors of
behaviour and furthermore, specifying how expectations and values can be combined
in order for choices to be made (Fishbein 1967). Expectations have been analysed by
Dalen (1989), Iso-Ahola & Mannel (1987), Muller (1991), Pitts & Woodside (1986)
and Shih (1986).
In order to test the hypotheses outlined above, we adopted survival models (Cox &
Oakes, 1984; Allison, 1984; Yamaguchi, 1991; Hosmer & Lemeshow, 1999;
Kalbfleich & Prentice, 2002; Cleeves, Gould & Gutierrez, 2002).
4. The Survival Model
In this study, the vacation length of stay of tourists is analysed with survival models.
Survival models, also known as duration models, measure the duration of a event. The
duration of an event is the time elapsed until a certain event occurs. The length of
vacations is an example of duration. Traditionally, the duration of interest in health
economics is the survival of a subject. The use of survival models to model time is
based on the fact that the distribution of the error in this context is traditionally
skewed to the right (Hosmer & Lemeshow, 1999).
Three issues must be addressed when modelling survival models: first, the
identification of the data set, i.e., cross-section vs. panel data; second, the censoring of
the data; and finally, the heterogeneity of the population analysed. Relative to the first
issue, the present paper adopts cross-section questionnaire data, therefore time-
invariant models, known as proportional hazard models, will be adopted (Wooldridge,
2002). Relative to the second issue, Gokovali et al. (2006) concluded that
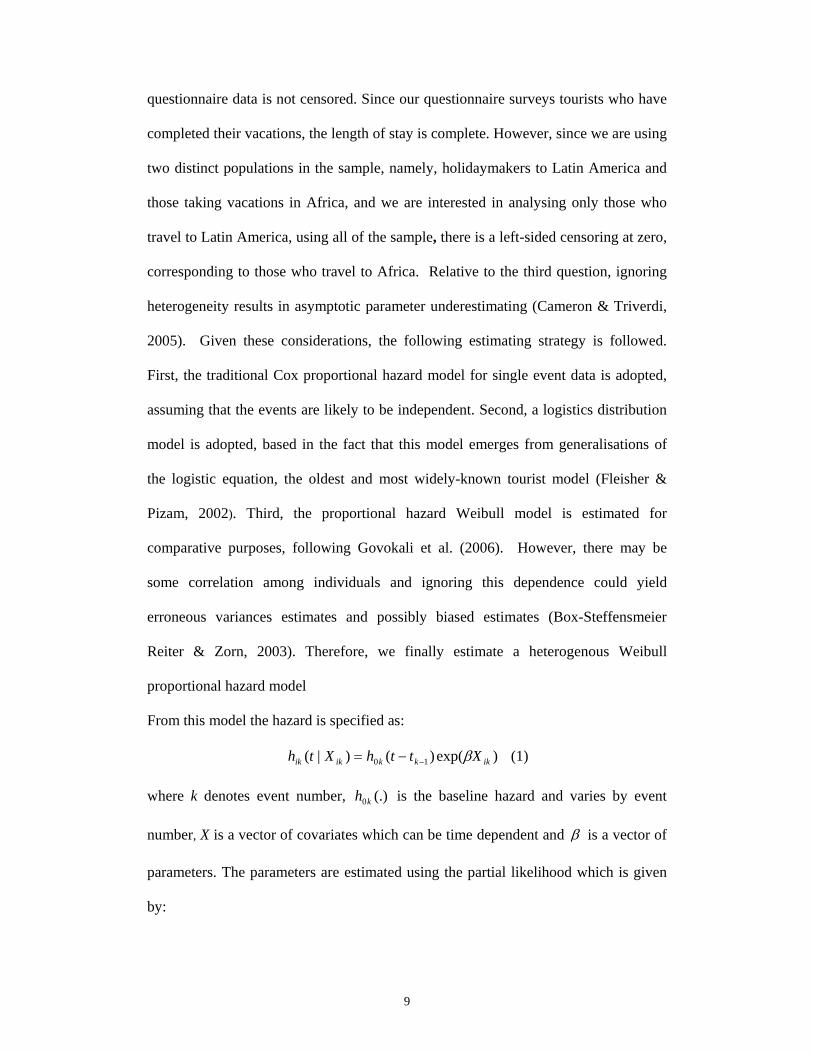
9
questionnaire data is not censored. Since our questionnaire surveys tourists who have
completed their vacations, the length of stay is complete. However, since we are using
two distinct populations in the sample, namely, holidaymakers to Latin America and
those taking vacations in Africa, and we are interested in analysing only those who
travel to Latin America, using all of the sample, there is a left-sided censoring at zero,
corresponding to those who travel to Africa. Relative to the third question, ignoring
heterogeneity results in asymptotic parameter underestimating (Cameron & Triverdi,
2005). Given these considerations, the following estimating strategy is followed.
First, the traditional Cox proportional hazard model for single event data is adopted,
assuming that the events are likely to be independent. Second, a logistics distribution
model is adopted, based in the fact that this model emerges from generalisations of
the logistic equation, the oldest and most widely-known tourist model (Fleisher &
Pizam, 2002). Third, the proportional hazard Weibull model is estimated for
comparative purposes, following Govokali et al. (2006). However, there may be
some correlation among individuals and ignoring this dependence could yield
erroneous variances estimates and possibly biased estimates (Box-Steffensmeier
Reiter & Zorn, 2003). Therefore, we finally estimate a heterogenous Weibull
proportional hazard model
From this model the hazard is specified as:
)exp()()|( 10 ikkkikik XtthXth β−−= (1)
where k denotes event number, (.)0kh is the baseline hazard and varies by event
number, X is a vector of covariates which can be time dependent and β is a vector of
parameters. The parameters are estimated using the partial likelihood which is given
by:

10
( )
( )∏∏
∑∑= =
= =
⎟⎟⎟⎟
⎠
⎞
⎜⎜⎜⎜
⎝
⎛
=n
i
K
kn
i
K
kikik
iki
ik
i
XY
XL
1 1
1 1exp
exp)(
δ
β
ββ (2)
whereδ is a censoring indicator equal to one if observed and zero if censored and Y is
a risk indicator which is equal to one if the individual is at risk for the current event
and zero otherwise.
We also consider two parametric specifications: the logistic and Weibull models. In
the logistic model the baseline hazard is stratified by event number and is constant at
each event k, with hazard rate,
)exp()()|( 1 ikkkkikik XttIXth βθ −−= (3)
In the Weibull model the baseline is defined by:
1110 )()( −−− −=− k
kkkk tttth αα (4)
where the time-dependent parameter, kα , is estimated separately for each event. Both
models are estimated through maximum likelihood.
5. Survey Methods
The empirical study was carried out by means of the previously-mentioned
questionnaire in August and September 2004, which was presented to a stratified,
random sample of Air Luxor passengers, with the central aim of determining their
reasons for choosing a specific destination. The definition of the sample was based on
the number of charter departures from Lisbon Airport in 2004, the country’s only
international airport from which there are charter flights operated by Portuguese
airlines. The charter departures totaled 114 in August and 81 in September. Charter
flights represented 39.25% of the total flight departures and 49.65% of the total
passenger departures, amounting to 36,652 passengers. Air Luxor was the leading

11
Portuguese charter company, flying tourists on behalf of almost all the tour operators,
with a market share of 36.68% of total passenger charters, corresponding to 13,080
passengers.
The sample was randomly stratified by destination, using Air Luxor passengers. On
the chosen fights, the flight attendants approached the tourist seated in the randomly-
chosen seat with the questionnaire, after the meals had been served. Because of
budgetary restrictions and the limited time available, it was decided to collect data
from 1,097 questionnaires. As each questionnaire cost a fixed amount and the funding
obtained from the Portuguese Research Foundation was fixed, the questionnaires had
to be restricted to the maximum allowed by the availability of the funds,
corresponding to 8.3% of the Air Luxor charter travellers. The questionnaires returned
totaled 792, from which 442 completed questionnaires were retained for the present
analysis, which represents a response rate of 40.3% of the sample chosen. This
corresponds to a sampling error of 2.7% with a confidence interval of 2.8%. The
remaining questionnaires received, but not considered for the present research, were
discarded because of uncompleted fields and incorrectly filled questionnaires. The
tourists who choose Latin America comprised 49% of the total.
5.1 Reliability, Validity and Generalisability
Several steps were taken to ensure the validity and reliability of the data. First,
the point of departure was a questionnaire already tested in tourism fields (Correia,
Barros & Silvestre, 2007), which was adapted for the present purpose, ensuring that
prior research in the field was considered and face validity established. Second, all
relevant literature was taken into consideration. Third, the questionnaire was pre-
tested on students of tourism economics at the University of the Algarve. Following

12
the administration of the final survey, a stratified random subset of 50 respondents
was contacted by phone a second time to check if any problem persisted, but none
were revealed. These procedures ensure the validity of the questionnaire, meaning
that it measures what it was intended to measure. Fourth, the questionnaire was
distributed to a random sample, with a response rate of 40.3%, which was considered
an acceptable sample of respondents (Dillman, 1978). This procedure ensures the
generalisability of the data, meaning that the findings are applicable to a more general
population. Fifth, the reliability of the data was examined, analysing it extensively
with alternative methods and reaching the same conclusions (Correia, Santos &
Barros, 2007). The extensive examination of the survey’s validity, reliability and
generalisability leads to the inference that there is nothing in the evaluation to suggest
that it is either invalid or unreliable.
5.2 Testing for Non-Response
The 40.3% response rate raises the question of non-response, for which we
therefore adopted a testing procedure, based on Dillman (1978). A first test for this
problem involved defining a sub-sample random choice group of respondent,
contacting them by phone again and suggesting testing the answers. The answers
maintained the declared values, ensuring the accuracy of the responses. A second test
involved contacting a random sub-sample of those who had not answered, to
understand the reasons for their non-response. As a result of this, several explanations
emerged. The first reason was the individual’s declared secrecy policy, which is a
common obstacle to questionnaires. The second reason was a lack of time available to
complete the questionnaire during the flight. The third reason was saturation,
associated with completing too many questionnaires. From these three reasons, it can

13
be asserted that the non-responses have the same characteristics as those who
responded, establishing the representativeness of the questionnaires that were
completed by tourists.
5.3 Data
The rate response does not differ significantly from the sample in terms of age
(chi-square=8.53, p=0.05), or gender (chi-square=7.55, p=0.05). Hence, it can be
assert that the 442 tourists who completed the questionnaire are representative of Air
Luxor tourist passengers and therefore, of Portuguese tourists to Latin America, since
they mostly travel on Air Luxor charter flights. The general characteristics of these
respondents were that they were male (52%), with an average age of 33. This profile
leads to an overall definition of the responding tourist as male, early middle-aged and
middle-class, with a family that includes one child. Other characteristics of the sample
are presented in Table 1. Our objective was to evaluate the length of stay of
Portuguese tourists who choose to take holidays in Latin America. To pursue this
objective the questionnaire was structured according to Table 1.
INSERT TABLE 1
The survey has three types of variables: dichotomous variables, continuous
variables and qualitative variables (7-item Likert scale). The set of explanatory

14
variables considered in this study sought to capture the key determinants of the tourist
decision process, based on the theoretical framework and the literature review.
6 Results Table 2 presents the results of the estimated duration models. We present several
duration models for comparative purposes. The dependent variable is the logarithm of
the length of stay, measured in days, of tourists travelling home from their vacations
in Latin American resorts and surveyed during their return flight. All the estimated
coefficients are in the proportional-hazard metric. Cox is the semi-parametric survival
model, while Logistis and Weibull are traditional survival models.
INSERT TABLE 2
In all the four models, the results are quite similar in the main effects, but the Weibull
with heterogeneity is the chosen model, on the basis of the log likelihhod statistics.
The coefficients of the variables give the effect of an increase in explanatory variables
on the conditional probability of ending a tourist stay. A negative sign means that as
the value of the variable increases, the hazard rate of tourist duration decreases and
the survival of their duration increases. A positive sign means that an increase in
explanatory variables has a decreasing impact on the length of stay.
It is verified that the variables have the same signs in different models. Based on the
log-likelihood statistic, the Weibull with heterogeneity is chosen to derive the
conclusion. What is the rationale for this result? Heterogeneity represents
characteristics that influence the conditional probability of ending a tourist stay in
Latin America, which are not measured or observed, nor are there measurement errors

15
in the variables. Unobserved heterogeneity has been a subject of concern and analysis
in Chesher (1984) and Chesher & Santos-Silva (2002). Heterogeneous behaviour is
commonly observed in individuals; not to take it into account is likely to lead to
inconsistent parameter estimates or more importantly, inconsistent fitted choice
probabilities. In the present study, this implies that different individuals can have
different preferences relative to the probability of ending a tourist stay. The variance
of unobserved individual specific parameters induces correlation across the
alternatives in the choice and therefore, survival models with heterogeneity are
required.
In this regard, the variable budget has a negative effect on the hazard, which means
that tourists with relatively high budgets tend to stay longer. This may result from the
attractiveness of the tourist resorts analysed. Tourists who value certain destination
attributes such as nature, climate or security tend to stay longer, a finding that is
intuitive, as they expect to consume all of these attributes available at the destination.
Younger, class status and group-travel have statistically significant negative effects,
meaning that these tourists tend to stay for more extended periods. To have previous
experience of the resort, to book the holiday in advance and to have higher
expectations give rise to a longer stay. All the positive variables that explain staying
for shorter periods are statistically insignificant.
7. Discussion
The paper has analysed the determinants of length of stay with a survival model. In
relation to the hypotheses, first, the null of Hypothesis 1 is accepted, because budget
is positive and statistically significant. Second, Hypothesis 2 is also accepted because
some destination attributes are positive and statistically significant. Third, Hypothesis

16
3 is accepted because there are some socio-economic characteristics that explain the
length of stay. Fourth, Hypothesis 4 is accepted because some information attributes
(word of mouth from friends) explain the length of stay. Fifth, Hypothesis 5 is
rejected since returning tourists tend to have shorter stays, but the parameter is
statistically insignificant, so no clear implication can be derived. Sixth, Hypothesis 6
is accepted because the time constraints of booking in advance explain the length of
stay. Seventh, Hypothesis 7 is accepted because frequent travellers tend to stay
longer. Finally, Hypothesis 8 is accepted because high expectations explain the
longer stay.
What is the significance of these results? They are intuitive, signifying that those with
more disposable wealth have a higher probability of staying longer in Latin American
tourist resorts. They are characterised as being early middle aged (younger),
subjectively from high social classes, with larger budgets, being frequent travellers,
who book in advance, with high expectations and enthusiastic about nature and
climate.
What is the policy implication of the present research? The implication is that tour
operators seeking to attract Portuguese tourists to Latin America for extended lengths
of stay should target the more affluent households. This market segment, consisting of
young families, with larger budgets, booking their holidays in advance and being
frequent travellers, is easily identified. Advertising campaigns should prioritise these
characteristics and develop a word-of-mouth marketing strategy to increase the length
of stay of the affluent young adults and their children. This is an unexpected result in
the internet age. Finally, they should adopt marketing strategies to increase
expectations.

17
How do these results compare with previous research? It is verified that age and
income increase the length of stay in all cited papers. Relative to Gokovali el al.
(2006), the paper which uses the same method, it is verified that the variables used by
the two papers are distinct, so no direct comparisons can be made. For example,
nationality is a main explanatory variable in Govokali’s paper, whereas the present
research considers a single nationality, therefore no comparison is possible. For
variables common to papers, age and security are common statistical variables
explaining the length of stay. Thus, the general conclusion is that tourists seem to
behave similarly in different contexts.
9. Conclusion
This paper has analysed the length of stay of Portuguese charter tourists taking
holidays in Latin America. Several duration models are presented for comparative
purposes, first, a Cox proportional hazard model; second, the parametric Weibull
model, third a Logistics model and finally a Weibull model with heterogeneity. The
Weibull with heterogeneity is chosen, due to the log likelihood statistics. It is
concluded that the length of stay is positive related to budget, age, class, friends,
publicity, Treserve, Ftrip and expectation. The length of stay is negatively related to
other variables, but with statistical insignificance. These results are intuitive, meaning
that economic affluence determines the length of stay. However, friend’s
recommendations and advertising have a positive impact on the length of stay, as do
booking in advance, the fact of being frequent travellers and having high expectations
of the resort. The general conclusion is first, that tourists seem to behave similarly in
different contexts; second, that heterogeneity is present in questionnaire data and
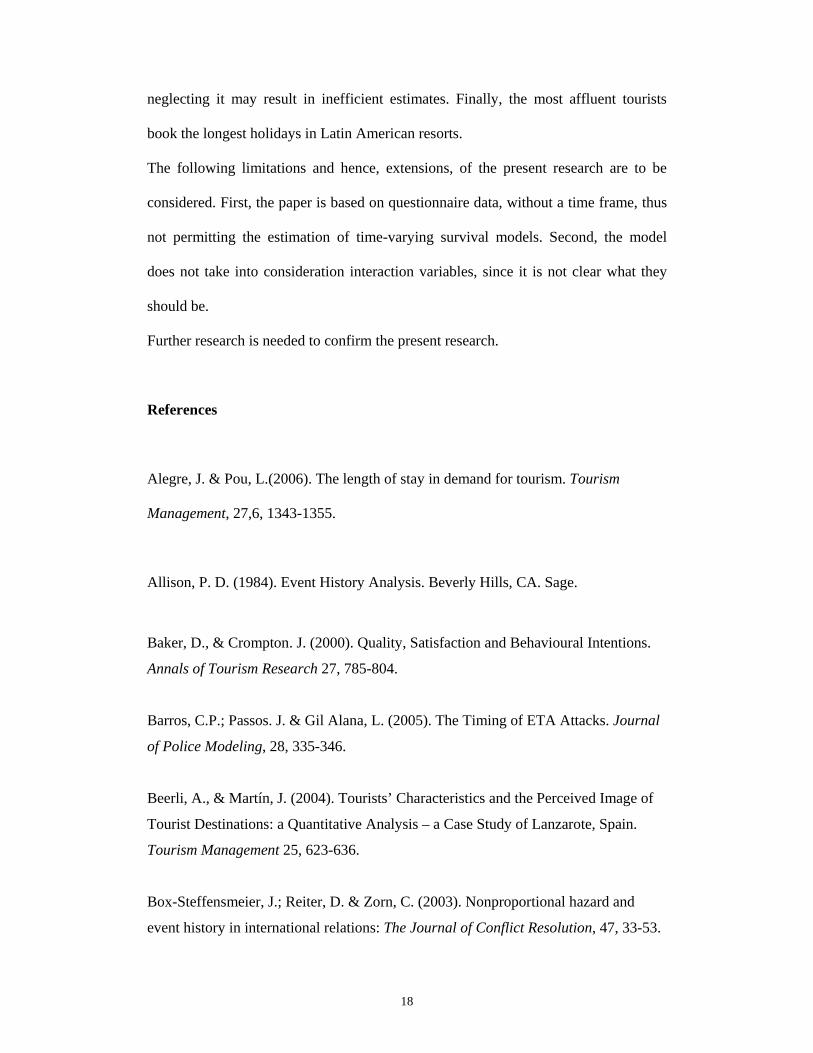
18
neglecting it may result in inefficient estimates. Finally, the most affluent tourists
book the longest holidays in Latin American resorts.
The following limitations and hence, extensions, of the present research are to be
considered. First, the paper is based on questionnaire data, without a time frame, thus
not permitting the estimation of time-varying survival models. Second, the model
does not take into consideration interaction variables, since it is not clear what they
should be.
Further research is needed to confirm the present research.
References
Alegre, J. & Pou, L.(2006). The length of stay in demand for tourism. Tourism
Management, 27,6, 1343-1355.
Allison, P. D. (1984). Event History Analysis. Beverly Hills, CA. Sage.
Baker, D., & Crompton. J. (2000). Quality, Satisfaction and Behavioural Intentions.
Annals of Tourism Research 27, 785-804.
Barros, C.P.; Passos. J. & Gil Alana, L. (2005). The Timing of ETA Attacks. Journal
of Police Modeling, 28, 335-346.
Beerli, A., & Martín, J. (2004). Tourists’ Characteristics and the Perceived Image of
Tourist Destinations: a Quantitative Analysis – a Case Study of Lanzarote, Spain.
Tourism Management 25, 623-636.
Box-Steffensmeier, J.; Reiter, D. & Zorn, C. (2003). Nonproportional hazard and
event history in international relations: The Journal of Conflict Resolution, 47, 33-53.

19
Cameron, A.C. & Triverdi, P.K. (2005). Microeconometrics: Methods and
Applications. Cambridge University Press, Cambridge, N.Y.
Carrasco, R. (1999). Transitions to and from self Employment in Spain: An Empirical
Analysis. Oxford Bulletin of Economics and Statistics, 61, 315-341.
Chesher, A. (1984). Testing for Neglected Heterogeneity. Econometrica 52, 865-872.
Chesher, A., & J. Santos-Silva. J. (2002). Taste Variation in Discrete Choice Models.
Review of Economic Studies 69, 147-68.
Cleves, M. A.; Gould, W.W. & Gutierrez, R.G. (2002) An introduction to survival
Analysis using stata. College Station TX. Stata Press.
Correia, A., Barros, C.P. and Silvestre , A.(2006) Golf Tourism Repeat Choice
Behaviour in the Algarve: A Mixed Logit Approach. Tourism Economics
(forthcoming).
Correia, A.C.; Santos, C.M. and Barros, C.P. (2007) Tourism in Latin America: A
Choice Analysis. Annals of Tourism Research (forthcoming).
Costa, P., & Manente, M. (1995). Venice and its Visitors: A Survey and a Model of
Qualitative Choice. Journal of Travel Research and Marketing 4, 45-69.
Cox, D. R. and Oakes, D. (1984) Analysis of Survival Data. London, UK, Chapman
and Hall/CRC Press.
Crompton, J. (1979) Motivations for Pleasure Vacations. Annals of Tourism Research
6, 408-424.
Dalen, E. (1989) Research into Values and Consumer Trends in Norway. Tourism
Management 10, 183-186.

20
Dann, G. (1981) Tourist Motivation: An Appraisal. Annals of Tourism Research 7,
187-219.
De la Vina, L., & Ford, J. (2001) Logistic Regression Analysis of Cruise Vacation
Market Potential: Demographic and Trip Attribute Perception Factors. Journal of
Travel Research 39(4), 406-410.
Dillman, D. (1978) Mail and telephone surveys: The total design method. New York,
Wiley.
Fishbein, M., (ed.) 1967 Readings in Attitude Theory and Measurement, John Wiley
and Sons, 1968, New York
Fishbein, M., &. Ajzen, I. (eds.)1980 Predicting and Understanding Consumer
Behaviour: Attitude Behaviour Correspondence, Prentice Hall, Upper Saddle River,
NJ: 1980.
Fleischer, A., & Pizam, A. (2002) Tourism Constraints Among Israeli Seniors. Annals
of Tourism Research 29, 106-123.
Gokovali, U.; Bahar, O. & Kozak, M. (2006) Determinants of Length of Stay: A
Practical Use of Survival Analysis. Tourism Management, in press.
Goodall, B., & Ashworth, G.(eds.) 1988 Marketing in the Tourism Industry. The
Promotion of Destination Regions, Routledge, London.
Goodrich, J. (1980) Segmentation of U.S. International Travelers: An Empirical Study
with American Express. In E. H. Tourism Marketing and Management Issues, L.
Donald, S. Elwood, and M. James, eds., 133-147. Washington, D.C: George
Washington University.
Hay, M., & McConnel, K. (1979) An Analysis of Participation in Nonconsumptive
Wildlife Recreation. Land Economics 55, 460-471.

21
Holtz Eakin, D.; Joulfain, D. & Rosen, H.S. (1994) Sticking it out: Entrepreneurial
Survival and Liquidity Constraints. Journal of Political Economy, 102, 53-75
Hosmer, D.W. & Lemeshow, S. (1999) Applied Survival Analysis: Regression
modeling of time to event data. John Wiley, N.Y.
Iso-Ahola, S., &. Mannel, R. (1987) Psychological Nature of Leisure and Tourism
Experience. Annals of Tourism Research 14, 314-331.
Kalbfleich, J. D. & Prentice, R.L. (2002) The Statistical Analysis of Failure Time
Data. 2nd edition, New York, John Wiley and Sons
Kozak, M. (2001) Repeaters’ Behaviour at Two Distinct Destinations. Annals of
Tourism Research 28(3), 784-807.
Kozak, M. (2003) Measuring Tourist Satisfaction with Multiple Destination
Attributes. Tourism Analysis 7, 229-240.
Mathieson, A. & Wall, G. (1984) Tourism: economic, physical and social impacts.
Third edition, Longman Group limited, N.Y, USA.
Muller, T. (1991) Using Personal Values to Define Segments in an International
Tourism Market. International Marketing Review 8, 57-70.
Nicolau, J., & Más, F. (2005) Stochastic Modelling: a Three-stage Tourist Choice
Process. Annals of Tourism Research 32, 49-69.
Pearce, P. (1982) Perceived Changes in Holiday Destinations. Annals of Tourism
Research 9, 45-164.

22
Pitts, R., & Woodside, A. (1986) Personal Values and Travel Decisions. Journal of
Travel Research 25, 20-25.
Sarigöllü, E. & Huang, R. (2005) Benefits segmentation of visitors to Latin America.
Journal of Travel Research, 43, 277-293.
Shih, D.(1986) Demand for Package Tours: A Mode Choice Model. Journal of Travel
Research 15, 3-17.
Um, S., & Crompton, J. (1990) Attitude Determinants in Tourism Destination Choice.
Annals of Tourism Research 17, 432-448.
Weaver, P., McCleary, K., Lepisto, L., & Damonte, L. (1994) The Relationship of
Destination Selection Attributes to Psychological, Behavioural and Demographic
Variables. Journal of Hospitality and Leisure Marketing 2, 93-109.
Woodside, A., & Lysonski, S. (1989) A General Model of Travel Destination Choice.
Journal of Travel Research 27(4), 8-14.
Woodside, A., & MacDonald, R. (1994) General System Framework of Customer
Choice Processes of Tourism Services. In Spoilt Lop Choice, R. Gasser and K.
Weiermair, eds.. Kultur Verlag, Austria.
Wooldridge, J.F. (2002) Econometric Analysis of Cross Section and Panel Data. MIT
Press, Cambridge, MA.
Zimmer, Z., Brayley, R. & Searle, M., (1995) Whether to Go and Where to Go:
Identification of Important Influences on Seniors' Decisions to Travel. Journal of
Travel Research 33(3), 3-10.
Yamaguchi, K. (1991) Event History Analysis. Newbury Park, CA, Sage.

23
Table 1. Characterisation of the Variables
Variable Description Mina Maxb Mean Std. Dev
Dependent variable Logavstay Logarithm of the average stay 0 23 4.115 4.440 Budget hypothesis Budget Travel budget (1-less than 1000 euro; 5- equal or
superior to 2500 euros) 1 5 1.981 1.140
Destination attributes hypothesis Nature What is the importance of nature in your decision? (1-
without importance; 7-extremely important) 1 7 5.776 1.379
Culture What is the importance of cultural attractions in your decision? (1-without importance; 7-extremely important)
1 7 5.454 1.465
Clime What is the importance of climate in your decision? (1-without importance; 7-extremely important) 1 7 5.923 1.368
Gastro What is the importance of gastronomy in your decision? (1-without importance; 7-extremely important)
1 7 5.470 1.532
Ethnic What is the importance of ethnic composition in your decision? (1-without importance; 7-extremely important)
1 7 4.542 1.728
Exotic What is the importance of exoticism in your decision? (1-without importance; 7-extremely important) 1 7 5.558 1.438
Security What is the importance of safety in your decision? (1-without importance; 7-extremely important) 1 7 5.959 1.402
Distance What was the importance of the distance from home in your decision? (1-without importance; 7-extremely important)
1 7 4.685 1.703
Socio-demographic characteristics hypothesis Age The age of the tourist interviewed 19 69 33.271 10.342 Class The tourist’s social class. (1-lower; 2- middle; 3- upper-
middle) 1 3 2.124 0.911
Civilstate Family composition. (1-single; 2-married; 3-with children ) 1 3 2.260 1.451
Group Number of persons with whom the individual travels. (unit: persons) 0 11 1.929 1.859
Information hypothesis Brochure Importance of brochures in travel decision. (1-without
importance; 7-extremely important) 1 7 4.766 1.524
Friends Importance of information from/recommendation of friends and family relative to the decision. (1-without importance; 7-extremely important)
1 7 4.945 1.661
Publicity Importance of advertising in travel decision. (1-without importance; 7-extremely important) 1 7 4.945 1.661
Movies Importance of movies in travel decision. (1-without importance; 7-extremely important) 1 7 4.038 1.483
Returning hypothesis Previous Had you visited this destination before? (0 – no; 1 –
yes) 0 1 0.083 ⎯
Time constraints hypothesis Treserve How long in advance did you book the vacation? (1- 1 4 2.036 1.018

24
less than 15 days; 2- 15 days or more, but less than a month; 3- 1 month or more; 4- three months or more)
Frequent traveller hypothesis Frequent traveler
Frequency of travelling. (1-one trip a year … 4-four trips a year) 1 4 2.457 0.796
Expectations hypothesis Expectations How did the destination meaure up to your
expectations? (1-worse than expected, 7- much better than expected )
1 7 5.305 1.152
a Min – Minimum; b Max – Maximum

25
Table 2: Results(1) Cox Model Weibull Logistics Weibull-Het Coef T-ratio Coef T-ratio Coef T-ratio Coef T-ratio Budget -0.079 -1.663 -0.082 -6.240* -0.047 -4.038* -0.041 -4.176* Nature -0.014 -0.277 -0.020 -1.023 -0.034 -2.301* -0.039 -2.778* Culture 0.011 0.241 0.019 1.017 0.020 1.500 0.008 2.715* Clime -0.010 -0.193 -0.008 -0.446 -0.021 -1.578 -0.032 -2.581* Gastro -0.038 -0.874 -0.002 -0.206 -0.018 -1.593 -0.013 -1.345 Ethnic 0.020 0.584 0.001 0.091 0.001 0.167 0.002 2.985* Exotic 0.014 0.316 0.030 1.049 0.013 1.065 0.005 3.498* Security -0.012 -0.269 -0.009 -0.563 -0.018 -1.557 -0.026 -2.285** Distance -0.020 -0.565 -0.008 -0.579 -0.0002 -0.026 -0.003 -0.454 Age 0.007 1.367 0.010 6.036* 0.008 6.309* 0.007 6.786* Class -0.011 -0.207 -0.076 -3.495* -0.064 -4.453* -0.046 -3.532* Civilsta -0.002 -0.076 -0.017 -1.241 -0.001 -0.130 -0.007 -0.835 Group -0.011 -0.452 -0.012 -0.900 -0.016 -2.267* -0.013 -2.355** brochure 0.006 0.179 0.150 1.130 0.019 2.086* 0.012 1.511 friends -0.035 -1.065 -0.034 -3.145* -0.019 -2.041* -0.018 -2.343** publicity 0.025 0.595 0.032 2.717* 0.004 0.444 -0.006 -0.715 movies -0.024 -0.588 -0.021 -1.384 -0.004 -0.458 -0.002 -0.359 previous -0.353 -1.882 -0.035 0.629 -0.039 -0.821 -0.025 -0.660 treserve -0.020 -0.412 -0.050 -2.675* -0.035 -1.819* -0.026 -1.096 Frequent treveler
-0.099 -1.440 -0.122 -5.352* -0.084 -5.024* -0.071 -5.310*
expectation -0.009 -0.219 -0.083 -6.548* -0.100 -10.691* -0.104 -10.412 sigma ⎯ ⎯ 0.342 27.909* 0.149 25.972* 0.070 8.424 Theta ⎯ ⎯ ⎯ ⎯ ⎯ ⎯ 3.713 5.897 LL -240.62 ⎯ -265.055 ⎯ -150.034 ⎯ -320.032 Nobs 442 442 442 442
(1) – All models were estimated in Stata 9 LL - Log of the Likelihood