SurR: a transcriptional activator and repressor controlling hydrogen and elemental sulphur...
47
1 SurR: A transcriptional activator and repressor controlling hydrogen and elemental sulfur metabolism in Pyrococcus furiosus Lipscomb, Gina L., 1 Annette M. Keese, 3 Darin M. Cowart, 2 Gerrit J. Schut, 1 Michael Thomm, 3 Michael W. W. Adams, 1 Robert A. Scott 1,2 * 1 Department of Biochemistry and Molecular Biology and 2 Department of Chemistry, University of Georgia, Athens, GA USA 30602. 3 Department of Microbiology, University of Regensburg, 93053 Regensburg, Germany. Running title: The SurR regulator in P. furiosus H 2 and S 0 metabolism Key words: regulatory transcription factor, archaea, Pyrococcus furiosus, sulfur response, hydrogen production, SurR *Address correspondence to: Robert A. Scott, Department of Biochemistry and Molecular Biology, University of Georgia, Athens, GA 30602. Tel.: 706-542-3739; Fax: 706-542-5901; E-mail: [email protected] Summary This work describes the identification and characterization of SurR, P. furiosus sulfur (S 0 ) response regulator. SurR was captured from cell extract using promoter DNA of a hydrogenase operon that is down-regulated in the primary response of P. furiosus to S 0 , as revealed by DNA microarray experiments. SurR was validated as a sequence-specific DNA binding protein, and characterization of the SurR DNA binding motif GTTn 3 AAC led to the identification of several target genes that contain an extended motif in their promoters. A number of these were validated to contain upstream SurR binding sites. These SurR targets strongly correspond with ORFs and operons both up- and down-regulated in the primary response to S 0 . In vitro transcription revealed that SurR is an activator for its own gene as well as for two hydrogenase operons whose expression is down-regulated during the primary S 0 response; it is also a repressor for two genes up-regulated
-
Upload
independent -
Category
Documents
-
view
2 -
download
0
Transcript of SurR: a transcriptional activator and repressor controlling hydrogen and elemental sulphur...

1
SurR: A transcriptional activator and repressor controlling hydrogen and elemental sulfur
metabolism in Pyrococcus furiosus
Lipscomb, Gina L.,1 Annette M. Keese,3 Darin M. Cowart,2 Gerrit J. Schut,1 Michael Thomm,3
Michael W. W. Adams,1 Robert A. Scott1,2*
1Department of Biochemistry and Molecular Biology and 2Department of Chemistry, University of
Georgia, Athens, GA USA 30602.
3Department of Microbiology, University of Regensburg, 93053 Regensburg, Germany.
Running title: The SurR regulator in P. furiosus H2 and S0 metabolism
Key words: regulatory transcription factor, archaea, Pyrococcus furiosus, sulfur response, hydrogen
production, SurR
*Address correspondence to: Robert A. Scott, Department of Biochemistry and Molecular Biology,
University of Georgia, Athens, GA 30602. Tel.: 706-542-3739; Fax: 706-542-5901; E-mail:
Summary
This work describes the identification and characterization of SurR, P. furiosus sulfur (S0)
response regulator. SurR was captured from cell extract using promoter DNA of a hydrogenase
operon that is down-regulated in the primary response of P. furiosus to S0, as revealed by DNA
microarray experiments. SurR was validated as a sequence-specific DNA binding protein, and
characterization of the SurR DNA binding motif GTTn3AAC led to the identification of several
target genes that contain an extended motif in their promoters. A number of these were validated to
contain upstream SurR binding sites. These SurR targets strongly correspond with ORFs and
operons both up- and down-regulated in the primary response to S0. In vitro transcription revealed
that SurR is an activator for its own gene as well as for two hydrogenase operons whose expression
is down-regulated during the primary S0 response; it is also a repressor for two genes up-regulated

2
during the primary S0 response, one of which encodes the primary S0-reducing enzyme NAD(P)H
sulfur reductase. Herein we give evidence for the role of SurR in both mediating the primary
response to S0 and controlling hydrogen production in P. furiosus.
Introduction
Archaeal organisms, while representing the third domain of life, have similarities to both bacteria and
eukarya. Of particular interest is their transcriptional apparatus that shares both eukaryal and bacterial
features. Transcription in archaea is carried out by a single type of RNA polymerase that is highly
homologous to the eukaryal RNA polymerase II, and basal transcription in archaea can be achieved in
vitro with a minimal complement of eukaryal-like transcription factors: TBP (TATA binding protein),
TFB (transcription factor B), and occasionally TFE (transcription factor E) (Cramer, 2002, Hickey et al.,
2002, Bartlett, 2005). Archaea also use eukaryal-like DNA promoter elements, TATA box and BRE (TFB
recognition element), to direct the binding of basal transcription factors for transcription initiation
(Bartlett, 2005). TBP and TFB bind cooperatively to the TATA box and BRE, respectively, and recruit
RNA polymerase (Bartlett, 2005). TFB and RNA polymerase together define the transcription start site
position, 25 to 30 bp downstream of the TATA box (Smale and Kadonaga, 2003, Kornberg, 2007). In
contrast to the eukaryal-like basal transcription apparatus, regulation of transcription appears to occur
predominantly along a bacterial theme, with bacterial-like transcriptional repressors dominating the group
of archaeal regulatory transcription factors (rTFs) characterized so far (Bell, 2005, Geiduschek and
Ouhammouch, 2005).
The hyperthermophile Pyrococcus furiosus is a model archaeal organism, and because of the
substantial information already known about its biology, investigation of transcriptional regulators in this
organism will shed light on mechanisms of archaeal transcriptional control as they relate to metabolic
pathways. P. furiosus, originally isolated by Fiala and Stetter from a hydrothermal vent community off
the coast of Italy (Fiala and Stetter, 1986), is a member of the genus Thermococcus which currently

3
contains 24 species of obligately organotrophic fermentative anaerobes (Miroshnichenko and Bonch-
Osmolovskaya, 2006). P. furiosus has an optimal growth temperature of 100°C and can utilize both
carbohydrates and peptides as carbon sources, via fermentation to organic acids, CO2 and H2 (Fiala and
Stetter, 1986). P. furiosus is somewhat unique among archaeal hyperthermophiles in that it can grow in
the presence or absence of elemental sulfur (S0), depending on the available carbon source (Fiala and
Stetter, 1986, Adams, 1994, Adams et al., 2001). This trait presents an opportunity to study the regulation
of S0 metabolism by investigating the changes that occur in the absence or presence of S0 in a growing
culture.
When maltose is used as the carbon source, P. furiosus growth is comparable both in the presence and
absence of S0 (Adams et al., 2001); however, significant changes in gene expression are evident from
DNA microarray analyses (Schut et al., 2001, Schut et al., 2007). A kinetic approach was used to identify
the genes directly affected by the presence of S0 (Schut et al., 2007). Ten min after S0 addition, a defined
‘primary’ response is observed, followed by a ‘secondary’ response occurring after 30 min which entails
up-regulation of many gene clusters involved in amino acid metabolism (Schut et al., 2007). A major part
of the primary response involves down-regulation of the three major hydrogenase operons, and thus the
response of P. furiosus to S0 is intimately connected with its ability to produce hydrogen. Concurrent with
the down-regulation of genes involved in hydrogen production is the up-regulation of the recently
characterized cytoplasmic NAD(P)H-dependent sulfur reductase (Schut et al., 2007). Identification of
transcription factors involved in mediating the response to S0 will improve our understanding of this
unique system and the associated transcriptional network.
The dramatic down-regulation of the operon that encodes the hydrogen-evolving membrane-bound
hydrogenase (Schut et al., 2001, Schut et al., 2007) led us to choose this gene cluster as a target for
transcription factor discovery utilizing a DNA-affinity protein capture approach. This approach brought
about the discovery of a protein that regulates ORFs and operons involved in primary S0 response, and we
have therefore named this protein SurR for sulfur response regulator. Herein we show the involvement of
this regulatory transcription factor in controlling the metabolism of both S0 and hydrogen by P. furiosus.

4
Results
Discovery of SurR. To identify transcription factors involved in the response of P. furiosus to S0, a
promoter DNA affinity capture method was employed. The P. furiosus membrane-bound hydrogenase
operon was selected as a target for transcription factor discovery because of its dramatic down-regulation
during the primary response to S0 observed in DNA microarray expression profiles (Schut et al., 2007).
The bait DNA was designed to contain ~200 bp of the membrane-bound hydrogenase operon promoter
and ~100 bp of the first ORF in the operon, mbh1 (PF1423). Incidentally, a divergently transcribed ORF,
PF1422, is located 150 bp upstream of the mbh1 ORF, and therefore the bait DNA most likely included
the promoter region of this ORF as well. DNA affinity protein capture with the mbh1 promoter bait DNA
was carried out using P. furiosus soluble cell extracts obtained from cultures grown in the presence and
absence of S0. SDS PAGE analysis of the eluted DNA-binding proteins is presented in Figure 1. Eleven
proteins were identified by mass spectrometry, and sequence analysis revealed that three of them (bands
8-10) were predicted transcriptional regulators: PF1827, PF0496 and PF0095. Of these, only PF0095 was
represented differentially in the captured proteins from the two cell extracts (band 10). PF0095 contains
an N-terminal helix-turn-helix domain related to the DNA-binding domain of the prokaryotic ArsR family
of transcriptional regulators, and it is also a member of a small cluster of uncharacterized archaeal
regulatory transcription factors (COG1777). The three other members of the Thermococcaceae family
with sequenced genomes contain homologs of PF0095 with high sequence identity: PH0180 (72%),
PAB0108 (72%), and TK1086 (65%). The PF0095 protein identified from the mbh1 bait DNA will
hereafter be referred to as SurR.
SurR binds mbh1 promoter DNA in a sequence-specific manner. EMSA was used to determine the
sequence specificity of the binding of recombinant SurR to an 81-bp region of the mbh1 promoter (+5 to -
76 bp relative to the translation start) compared to an 80-bp region of the mbh1 ORF (Fig. 2A). The
results indicate that SurR binds with sequence specificity to the mbh1 promoter DNA, completely shifting

5
the DNA at 1.2 µM protein (left panel, lane 5), whereas for the mbh1 ORF DNA, the DNA is still not
completely shifted at 2.4 µM (right panel, lane 7). Because a DNA-staining agent was used to visualize
the DNA in the EMSA experiments, the anionic polysaccharide heparin was used as a competitor in place
of DNA. Heparin has electrostatic properties similar to DNA so that it can be used as a non-specific
competitor in EMSA (Moxley and Jarrett, 2005). Addition of heparin revealed that the association of
SurR with promoter DNA was indeed sequence-specific while the binding to ORF DNA was of a
nonspecific nature. At heparin concentrations higher than 10 µg/mL (approximately 3-fold mass excess of
competitor over ORF DNA), the binding of SurR to the mbh1 ORF at 2.4 µM was completely blocked
(right panel, lanes 10-12). Given this finding, it is not surprising that at high protein concentrations, SurR
associates nonspecifically even with the mbh1 promoter DNA, as evidenced by the shift to very low
mobility complexes at 1.8 to 2.4 µM protein (left panel, lanes 6-7). Heparin is able to remove these non-
specific interactions of SurR with the promoter DNA at concentrations of 10 to 100 µg/mL (left panel,
lanes 10-11), corresponding to approximately 3 to 30-fold mass excess of competitor over promoter
DNA. It is also worth noting that heparin at sufficiently high concentrations can also challenge off
sequence-specific DNA binding as evidenced by its effect on the binding of SurR to the mbh1 promoter at
a concentration of 1 mg/mL, corresponding to a >270-fold higher mass concentration over the DNA (left
panel, lane 12). These data conclusively show that SurR is a sequence-specific DNA-binding protein, and
furthermore, that one of its targets appears to be in the promoter region upstream of mbh1.
To further define the region in the mbh1 promoter bound specifically by SurR, fluorescence-based
DNase I footprinting was performed. The DNA probe was labeled at the 5' ends with two distinct
fluorophores so that both strands from one footprinting experiment could be analyzed simultaneously
using a capillary electrophoreses automated DNA sequencer. The footprinting results of SurR (0.3 µM)
with mbh1 probe DNA clearly show two regions of DNase protection extending from approximately -8 to
-47 (length ~40 bp) and -106 to -164 (length ~59 bp) relative to the mbh1 translation start site (Fig. 2B,
C). These footprints are most visible at protein/DNA molar ratios of 20 to 30; however, the mbh1 distal
site is bound first by SurR as evidenced by footprinting experiments comparing SurR concentrations of 12

6
µM and 24 µM (see Supplementary Fig. S2A). At very high protein concentrations, all peaks disappear,
indicating that the protein is binding non-specifically along the entire length of the DNA, outside its
sequence-specific footprint site (data not shown). These results are consistent with the observation in
EMSA that non-specific association with DNA occurs at high protein concentrations, resulting in very
low-mobility protein-DNA complexes (see Fig. 2A). Furthermore, some peaks in the vicinity of the
footprints have increased fluorescence intensity in the presence of SurR, signifying that nucleotides at
these positions are hypersensitive to DNase when the protein is bound to the DNA (see asterisks, Fig.
2C).
SurR binds to its own promoter region shared with S0-regulated ORF PF0094. Interestingly, the surR
gene (PF0095) is positioned 132 bp downstream and is divergently oriented from pdo (PF0094), a gene
that is regulated in the primary response to S0. The pdo gene encodes a biochemically and structurally
characterized enzyme, protein disulfide oxidoreductase (Ren et al., 1998, Pedone et al., 2004). In contrast
to the down-regulation of the membrane-bound hydrogenase operon whose promoter was the target DNA
from which SurR was discovered, pdo expression is up-regulated in the presence of S0 in microarray
expression profiling experiments (Schut et al., 2007).
EMSA results with the pdo-surR intergenic DNA display a complete shift of the DNA probe at 1.2
µM protein (Fig. 3A, lane 6). As with the mbh1 promoter DNA, there are multiple bands of protein-DNA
complexes; however, the number of resulting bands differs (compare Figs. 2A left panel, lanes 3-5 and
3A, lanes 4-6). DNase footprinting results of SurR (0.3 µM) on the pdo-surR promoter region reveal one
large footprint (~85 bp) extending from approximately -5 to -89 relative to the pdo translation start site
(Fig. 3B, C), or -44 to -128 relative to the surR translation start site. Footprinting experiments comparing
different concentrations of SurR with the pdo-surR probe indicate that SurR does not bind preferentially
to one part of the large footprint region, but instead binds across the entire footprint region, to a fraction
of the probe DNA at 12 µM and to nearly all of the probe DNA at 24 µM (see Supplementary Fig. S2B).
DNase I hypersensitive sites are not as evident for this DNA probe as compared to the mbh1 probe.

7
The SurR DNA recognition site contains the palindrome GTTn3AAC. To determine the consensus
DNA motif recognized by SurR, the artificial selection method SELEX was employed (Oliphant et al.,
1989, Tuerk and Gold, 1990). Starting with a pool of synthetic DNA containing central 30-bp randomized
sequences, EMSA was used to select sequences bound with higher affinity by SurR. Each pool of selected
sequences was PCR-amplified and used in EMSA again for further selection. After six rounds of
selection, the consensus palindromic DNA sequence GTTn3AAC was uncovered from 19 total sequenced
SELEX DNAs (Fig. 4A).
To validate the GTTn3AAC motif as the necessary prerequisite for sequence-specific binding of DNA
by SurR, a series of DNA fragments were tested with EMSA. A 40-bp DNA probe was designed from
one of the selected SELEX DNA sequences containing the GTTn3AAC motif, along with three additional
DNA probes identical to the first except having the motif mutated as follows: ACAn3TTG, ACAn3AAC,
and GTTn3TTG (mutated bases in italics). As can be seen in Fig. 4B, SurR binds to the GTTn3AAC-
containing probe DNA with higher affinity than the DNA probes with mutated motifs. Furthermore,
adding heparin at a 4-fold mass excess over probe DNA does not remove the binding of SurR to the
GTTn3AAC-containing probe but completely removes the non-specific binding observed for the probes
with mutated sequences. The non-specific interactions of SurR with DNA can be generally distinguished
in EMSA by a less well-defined shift of low mobility (see also Fig. 2A). These results indicate that the
GTTn3AAC motif uncovered by SELEX is required for sequence-specific binding of DNA by SurR.
Each DNase footprint site in the mbh1 promoter was verified to contain one perfect GTTn3AAC
motif, and the 85-bp footprint in the pdo-surR intergenic region contained two perfect consensus motifs
(see underlined motifs in Figs. 2C and 3C). The presence of the GTTn3AAC motifs in the SurR footprint
regions confirmed that the consensus sequence derived from the synthetic SELEX library was
representative of the SurR recognition site in the P. furiosus genome.
The GTTn3AAC motif appears upstream of most ORFs involved in primary S0 response. All P.
furiosus ORF upstream regions of 200 bp in length were searched for other occurrences of the SurR
consensus motif GTTn3AAC, and a total of 123 unique motifs were found. Analysis of the sequence

8
regions surrounding the GTTn3AAC consensus motifs within the known SurR DNA footprints (Figs. 2C
and 3C) suggested the existence of an extended motif that included a second palindrome half-site with a
5-bp gap: GTTn3AACn5GTT. Searching all P. furiosus 200-bp ORF upstream regions with this string
returned only 16 unique motifs (in a total of 23 ORF upstream regions, Table 1). Over half of the
corresponding ORFs (14 out of 23) were part of divergently oriented gene pairs that presumably share the
same promoter region (including the pdo-surR divergent gene pair). For the ORFs predicted to be part of
operons (Tran et al., 2007), the ORF containing the upstream motif was first in its operon in all cases
except for one (PF0913).
Furthermore, the ORFs found to contain this motif in their upstream regions overlapped significantly
with ORFs involved in the primary S0 response. As can be seen in Table 2, nine out of twelve of the
ORFs/operons down-regulated 10 min after S0 addition have the extended motif within 200 bp upstream
of the ORF, and four out of five of the up-regulated ORFs/operons contain the GTTn3AAC consensus
motif in their upstream DNA regions (two of these also contain the extended motif). It is worth noting
that none of the ORFs which are up- or down-regulated after 30 min of S0 addition, those that are part of
the secondary response to S0 (Schut et al., 2007), have the extended motif in their upstream DNA. These
results clearly point to a relationship between SurR target genes and the primary response of P. furiosus
to the presence of S0.
To better understand the in vivo SurR binding site, MEME motif-finding software (Bailey and Elkan,
1994) was used to search for an extended motif in the forward and reverse strands of all the motif-
containing 200-bp upstream sequences of ORFs involved in the primary S0 response (listed in Table 2).
The resulting consensus motif found in all 13 input sequences is shown in Figure 4C and contains the
GTTn3AAC SELEX motif with adjacent palindrome half-sites spaced 5 bases away on either side. This
identified ‘genomic’ motif suggests that the GTTn3AAC motifs must occur in pairs or multiples at
defined intervals in order to direct specific high-affinity binding of SurR. Furthermore, the genomic motif
indicates the relevance of A/T tracts in the 5-bp gap regions. It is possible that the SELEX experiment

9
may have uncovered this extended motif if more selection rounds had been completed or if the artificial
selection DNA length had been greater than 30 bp.
SurR binds to promoter regions of other ORFs involved in primary S0 response. To verify that the
identified motifs upstream of S0-regulated ORFs represent bona fide SurR binding sites, several of the
putative promoter regions were selected as targets to test in EMSAs with SurR. Besides mbh1 (PF1423),
the upstream DNA of three additional S0 down-regulated ORFs were chosen: PF0891 (hydB1), PF0559,
and PF0531 (see Table 2). PF0891 is the first ORF in a four-ORF operon encoding soluble hydrogenase I
of P. furiosus (Ma et al., 1993, Ma and Adams, 2001) and was selected because the primary response to
S0 predominantly involves down-regulation of hydrogenase transcripts. The PF0559 ORF encodes a
potential hydrogenase maturation protein and was also the most highly down-regulated ORF in the batch
microarray experiment (Schut et al., 2001). PF0531 encodes a ‘cobalt transporter’ according to
annotation, and it is likely the start of a four-ORF operon; however, this putative operon currently has no
obvious connection with S0 metabolism.
With the exception of pdo (PF0094), which has already been shown to have a SurR binding site in its
promoter region, all of the remaining up-regulated ORFs that contain the upstream GTTn3AAC motif
were selected to test in EMSAs with SurR: PF1186 (nsr), PF1453, and PF2051 (see Table 2). The protein
product of PF1186 has recently been identified as the sulfur reductase of P. furiosus, termed NSR for
NAD(P)H sulfur reductase (Schut et al., 2007). PF1453 is the start of a 14-ORF operon (PF1453-PF1441)
encoding a putative membrane-bound oxidoreductase that likely serves as a replacement for the
membrane-bound hydrogenase when S0 is present (Silva et al., 2000, Schut, 2007 #144). PF2051 encodes
a probable transcriptional regulator that may function in the secondary response to S0 (Schut et al., 2007).
EMSA experiments confirmed that SurR binds to all of these promoter-ORF DNA probes, exhibiting
the characteristic multiple protein-DNA complexes for the DNA probes of both down- and up-regulated
primary S0 response ORFs (Fig. 5). The number of shifted bands representing protein-DNA complexes
varied for each probe, with approximately 3 bands observed for hydB1 (A, left panel), 4-5 for PF0559 (A,
middle panel), 2-3 for PF0531 (A, right panel), 2 for nsr (B, left panel), 5-6 for PF1453 (B, middle panel),

10
and 2 for PF2051 (B, right panel). The presence of multiple bands of protein-DNA complexes reinforces
the notion that multiple SurR copies may bind to adjacent recognition sites and that the various promoter
regions may have different numbers of these sites resulting in variability in the number of protein-DNA
complexes observed in EMSA.
The location of the SurR binding sites on hydB1 (PF0891), PF0559, nsr (PF1186) and PF1453 DNA
probes were determined by fluorescence DNase I footprinting using the protein to DNA ratio that resulted
in a nearly complete shift of the DNA probe in the corresponding EMSAs (see Fig. 5). A SurR footprint is
visible on each probe (Fig. 6); however, the sizes of each and their positions relative to ORF starts vary
greatly (for full-length footprints of these probes, see Supplementary Figs. S3 and S4). The SurR footprint
on the hydB1 probe covers ~48 bp and extends from -104 to -151 from the hydB1 translation start site
(Fig. 6A). The PF0559 footprint is ~75 bp in length and is located from -21 to -95 relative to the
translation start site, as defined by NCBI (the JCVI-CMR annotated start site lies 18 bp downstream)
(Fig. 6B). The footprints on the nsr and PF1453 probes extend from -1 to -54 (~54 bp) (Fig. 6C) and -37
to -131 (~95 bp) (Fig. 6D) from the translation start sites, respectively. The lengths of the SurR footprint
on each probe correspond to some extent with the number of shifted EMSA bands for the same probe:
essentially, the larger the footprint, the greater number of protein-DNA complexes observed in EMSA.
The conserved GTTn3AAC motif is present in each footprint (see underlined sequences in Fig. 6A-D);
however, its location within each footprint varies.
SurR is a transcriptional activator and repressor. To validate SurR as a regulatory transcription
factor, its direct effect on basal transcription was tested using a well-established in vitro transcription
system for P. furiosus (Hethke et al., 1996, Hethke et al., 1999). The in vitro transcriptional regulation
profile of SurR was determined for two down-regulated ORFs in the primary S0 response, mbh1 (PF1423)
and hydB1 (PF0891), and two up-regulated ORFs in the primary S0 response, pdo (PF0094) and nsr
(PF1186). Additionally, the in vitro transcription start site for each promoter was examined by primer
extension (sequencing gels are provided in Supplementary Fig. S5), and the regulatory effect of SurR on
transcription of its own gene was also investigated.

11
The transcription start site of mbh1 (PF1423) was found to be positioned -61 bp from the translation
start site, and therefore the SurR footprints on the mbh1 promoter do not overlap with either the
transcription start site or the TATA box (see promoter elements relative to footprint in Fig. 2C). The
BRE/TATA region matches the consensus sequence suggested by van de Werken
(VRAAAnnTTWWWAW (van de Werken et al., 2006)). The transcription start site for hydB1 (PF0891)
is also located some distance upstream from the translation start, at -73 bp. The SurR footprint is therefore
located upstream from the BRE/TATA region but slightly overlaps the BRE (see promoter elements
relative to footprint in Fig. 6A). The BRE and TATA sequences for this ORF also closely match the
consensus.
Basal transcription from the mbh1 probe produced a transcript only from mbh1 (PF1423) and not
from the divergent ORF, PF1422. Addition of SurR resulted in a 56% increase in transcript level,
demonstrating that SurR is a transcriptional activator for mbh1 (Fig. 7A). Transcription of hydB1 in the
presence of SurR resulted in a dramatic increase in hydB1 transcript, up to ~260% (Fig. 7B). In both
cases, SurR did not affect the basal transcription level from the gdh control template, indicating that SurR
is a transcriptional activator for both mbh1 and hydB1, and presumably both of the corresponding
operons, membrane-bound hydrogenase (14 ORFs) and soluble hydrogenase I (4 ORFs), respectively.
The transcription start site for nsr (PF1186) is located at -10 bp from the translation start, placing both
the transcription start and the BRE/TATA region within the SurR footprint for this promoter region (see
promoter elements within footprint in Fig. 6C). As expected, SurR repressed transcription from nsr,
resulting in a decrease in transcript level by nearly 70% (Fig. 7C).
The transcription start site for pdo (PF0094) is located at -71 bp from the translation start site and is
within the footprint region occupied by SurR; however, the BRE sequence and TATA box are located just
upstream from the footprint region (see promoter elements relative to footprint in Fig. 3C). Interestingly,
pdo and surR appear to share a TATA box region since the surR transcription start site is located only -16
bp from the translation start, placing the surR TATA box in the same region as the pdo TATA box. The

12
BRE and TATA box sequences for surR, however, appear to deviate substantially from the consensus and
are probably less than optimal for initiation of basal transcription.
The pdo-surR transcription template contained portions of divergent ORFs pdo (PF0094) and surR
(PF0095), and basal transcription produced transcripts from both ORFs, although the pdo transcript was
much more abundant in comparison with the surR transcript (Fig. 7D). Addition of SurR resulted in an
~80% reduction of the pdo transcript with concomitant increase in its own transcript by ~200%. To
determine if the increase in the surR transcript was the result of transcriptional activation or was simply
due to increased availability of basal transcription components because of the repression of pdo, the
transcriptional regulation of each ORF was examined independently using two templates. The first
contained the BRE/TATA region and SurR footprint for pdo (pdo template) and the second contained the
BRE/TATA region and part of the SurR footprint for surR (surR template). With the pdo template, SurR
repressed transcription by almost 60% (Fig. 7E), and for the surR template, activation was confirmed,
showing an increase in transcript level by approximately 90%, even though this template contained only
one-third of the SurR footprint site and only one of the two GTTn3AAC motifs (Fig. 7F). Transcription of
the gdh control template remained unaffected by SurR in each case.
Taken together, the in vitro transcription results show that SurR can both activate and repress
transcription, depending on the gene and promoter context. These results are consistent with the positions
of the core promoter elements relative to the SurR footprints in the promoter regions as summarized in
Figure 8.
Discussion
SurR is a sequence-specific DNA binding protein and most likely interacts with DNA via its
conserved helix-turn-helix motif located in the N-terminal ~60 amino acids of the protein. The purpose of
the C-terminal region (~170 residues) is not evident from sequence analysis; however, it may serve as a
dimerization domain, given that the protein recognizes a palindromic motif. EMSA and footprinting

13
results for different target ORFs show different numbers of protein-DNA complexes (2 to 6) and various
footprint lengths (40 to 95 bp), implying that SurR can bind to multiple adjacent sites that vary from the
GTTn3AAC consensus sequence determined by SELEX. The presence of at least one perfect GTTn3AAC
motif in each footprint suggests that this is the primary motif responsible for initial sequence recognition
and binding by SurR. Perhaps SurR first recognizes the consensus motif GTTn3AAC and then facilitates
binding of additional SurR proteins to adjacent, equally spaced degenerate motifs. Indeed, there is an
extended motif present in the GTTn3AAC-containing promoters of primary S0 response ORFs (Fig. 4C)
where motif elements repeat at 14-bp intervals, with A/T-rich tracts in the 5-bp gaps between the
GTTn3AAC motif and adjacent palindrome half-sites. Although some degenerate motifs occurring at
defined spacing (n3 and n5) near the conserved GTTn3AAC motifs can be found in several of the SurR
footprint regions, cooperativity is not evident from analysis of footprint occupation with different protein
concentrations on the mbh1 and pdo-surR promoter regions (Fig. S2)
SurR most likely serves as a transcriptional regulator of nearly all of the genes involved in the
primary response of P. furiosus to S0. Our data show that SurR binds with sequence-specificity to
promoters of ORFs for which the presence of S0 elicits either negative or positive transcriptional
responses in vivo, according to DNA microarray expression profiles (Schut et al., 2007). A total of 53
ORFs are significantly regulated within 10 min of S0 addition, and when operon predictions are taken into
account, the number of regulated gene clusters is reduced to 17 (Schut et al., 2007). Of these 17
ORFs/operons, only 4 of these do not contain the upstream GTTn3AAC motif within 200 bp of the
translation start, and most contain the extended motif GTTn3AACn5GTT (Table 2).
Furthermore, of the 16 GTTn3AACn5GTT motifs found from a search of 200-bp upstream DNA
sequences of all P. furiosus ORFs (Table 1), 12 occur in the upstream regions of ORFs and operons
involved in the primary S0 response. The four additional motifs occur in the upstream regions of PF1100
and PF1516 and in the intergenic regions of the divergently transcribed gene pairs PF0547-PF0548 and
PF0568-PF0569. Of these, all are annotated as ‘hypothetical proteins’ except for PF1516, which is
annotated as GMP synthase, and PF0548, a putative hydrogenase expression/formation protein

14
homologous to HypC. It is reasonable that the latter is a putative SurR target since PF0548 is likely
involved in regulation of hydrogenase formation in P. furiosus as its homolog HypC is responsible for Fe
insertion during hydrogenase maturation in E. coli and other organisms (Blokesch et al., 2004). A
relationship is not obvious for the other apparent regulatory targets of SurR that are not among those
genes part of the primary S0 response. It is possible that these genes have subtle transcriptional regulation
that was not detectable in the microarray experiments.
SurR appears to play an activating role for at least two of the S0 down-regulated ORFs, both of which
are part of hydrogenase operons. There are two SurR footprints in the mbh1 promoter region (of the
membrane-bound hydrogenase operon), an mbh1-proximal site extending ~40 bp and an mbh1-distal site
covering ~59 bp with a 59-bp ‘inter-footprint’ space in which the BRE/TATA region and the transcription
initiation site are located. The larger mbh1-distal site is located just upstream of the BRE/TATA region,
and presumably SurR activates transcription by recruiting TBP and/or TFB from this upstream site. The
small mbh1-proximal site does not interfere with the transcription start site of mbh1; we hypothesize that
it may serve to promote bending of the DNA, as suggested by the presence of DNase I hypersensitive
sites (see peaks marked by asterisks in Fig. 2C), to form a structure more favorable to binding by the
basal transcription apparatus or perhaps even aid in RNA polymerase recruitment. It is interesting that
Ptr2 of M. jannaschii activates transcription in vitro from the rb2 promoter by binding to sites both
upstream and downstream of the TATA box, even though the downstream site overlaps the transcription
start site (Ouhammouch et al., 2005).
In contrast to mbh1, the hydB1 promoter contains only one SurR footprint directly upstream from the
BRE/TATA region, and activation of this gene may be similar to the mechanism for mbh1 activation from
the mbh1-distal site. Regulation of hydrogenase gene expression appears to be a key role for SurR as the
recognition motif occurs in the promoter regions of all three P. furiosus hydrogenase operons, as well as
at least two genes involved in hydrogenase maturation (PF0559, hypF, and PF0548, hypC). It is also
likely involved in regulation of the handful of other genes that are down-regulated during primary S0
response, as most of these also contain SurR recognition motifs in their promoter regions (Table 2). The

15
expression of these genes as detected by DNA microarray becomes highly down-regulated as part of the
primary S0 response (Schut et al., 2007); therefore, the activation of these genes by SurR must be quickly
counteracted in some way as part of the response to S0.
SurR has also been shown to be a transcriptional repressor for at least two genes involved in the
primary S0 response of P. furiosus, nsr and pdo (Fig. 7C, D). We propose that SurR also functions as a
transcriptional repressor for the two of three remaining gene clusters involved in primary S0 response.
These are the 14-ORF membrane-bound oxidoreductase operon (mbx, PF1453-PF1441), thought to
functionally replace the membrane-bound hydrogenase, and the two-ORF operon of putative regulators
PF2051-PF2052, which may be involved in mediating the secondary response to S0. The consensus motif
GTTn3AAC occurs in the upstream DNA regions of all four of these ORFs/operons (Table 2), SurR has
been shown to bind to DNA probes of all of these in EMSAs (Figs. 3A and 5B), and a SurR footprint
location has been verified for three of these (Figs. 3B-C and 6C, D). Furthermore, the locations of the
SurR footprints upstream of nsr and pdo with respect to the identified transcription start sites indicate that
the mechanism by which SurR represses transcription of these ORFs is by blocking access to basal
promoter elements. In the case of nsr, the SurR footprint appears to overlap both the transcription start
site and the BRE/TATA region, and SurR would therefore prevent the binding of TBP and TFB as well as
the recruitment of RNA polymerase. The SurR binding site upstream of pdo overlaps just the
transcription start site, and SurR would therefore prevent RNA polymerase recruitment but might allow
simultaneous binding of TBP and TFB at the unobstructed BRE/TATA region. SurR regulation of pdo is
particularly interesting since the divergent surR gene shares with it a short intergenic space (132 bp), and
the two genes appear to share a TATA box region. We have demonstrated that SurR activates
transcription of its own gene while repressing that of pdo, and the position of the SurR binding site in this
promoter region sheds some light on this dual regulatory mechanism. SurR likely blocks RNA
polymerase from being recruited to the pdo transcription initiation site while simultaneously recruiting
TBP to the shared TATA region to allow the initiation of transcription from the surR transcription start
site 16 bases upstream of the gene. Although SurR activates its own gene in vitro, surR is not among the

16
genes regulated significantly during the primary or the secondary response to S0, as determined by
microarray expression profiles; therefore, the in vivo effects of SurR on transcription of its own gene may
presumably be more subtle.
The SurR footprint locations in relation to sequence elements give a good indication of the general
mechanism of regulation imposed by SurR on transcription of various ORFs (Fig. 8). In all three cases of
activation, the SurR footprint occurs just upstream from the BRE/TATA or slightly overlapping the distal
side of the BRE, suggestive of a role for SurR in recruitment of basal transcription factors to the
BRE/TATA elements to accelerate transcription. SurR may activate transcription by facilitating
recruitment of TBP specifically, perhaps similar to the activation mechanism determined for Ptr2
(Ouhammouch et al., 2003). Repression by SurR appears to occur through known mechanisms, by
blocking the binding of TBP and TFB as is the case for Lrs14 of S. solfataricus (Bell and Jackson, 2000)
and/or the recruitment of RNA polymerase as is the mechanism for both LrpA (Brinkman et al., 2000,
Dahlke and Thomm, 2002) and Phr (Vierke et al., 2003) of P. furiosus. Further experiments need to be
performed to fully understand the activation and repression mechanisms employed by SurR.
Considering the in vitro transcription results, SurR should exert its transcriptional effect in the
absence of S0, activating genes that are down-regulated during the primary S0 response and repressing
genes that are up-regulated during the primary S0 response. This is also consistent with results from the
DNA-affinity capture experiment in that the SurR protein band was present at a higher intensity in the –S0
extract lane (Fig. 1, band 10). A question that remains is how the transcriptional activity of SurR is itself
mediated during the response to S0 since it appears to exert regulation when S0 is absent. Other factors or
proteins may be involved in exerting an effect on SurR that would result in both the deactivation and
derepression of target ORFs necessary for the response of P. furiosus to the presence of S0. This is
currently under investigation.
Experimental Procedures

17
Cell growth and processing. P. furiosus (DSM 3638) was grown on maltose with and without S0, and
the soluble cell extract was obtained as in (Schut et al., 2001), except that no DNase I was added.
Aliquots of cell extract were stored in anaerobic vials at -80°C for use in DNA affinity protein capture
experiments.
DNA affinity protein capture. The 314-bp mbh1 DNA probe (genome coordinates 1337201-1337513)
used for protein capture was PCR-amplified from P. furiosus genomic DNA using the biotinylated primer
5'-ccctaacttggtggtgccta and the unlabeled primer 5'-ccagctatgagttcctgggta. To immobilize the bait DNA,
excess mbh1 probe was incubated with ~200 µg magnetic DynaBeads M-280 Streptavidin (Invitrogen)
per the manufacturer’s protocol (1 mg beads binds ~55 pmol DNA of length ~300 bp). The bead-bound
DNA was then incubated at 55°C for 30 min with 2.5 mg/mL P. furiosus soluble cell extract obtained
from cells grown either in the presence or absence of S0. Unbound proteins were removed by three
successive washes with buffer B (50 mM EPPs, 100 mM KCl, 1 mM EDTA, 5% glycerol, 0.1% triton-X,
1 mM DTT, pH 7.5). DNA-bound proteins were eluted at 95°C for 5 min with 1x Laemmli buffer
containing no ß-mercaptoethanol, as this tended to strip streptavidin from the bead surface. Eluted
proteins were analyzed by SDS-PAGE with silver staining.
In-gel digestion and peptide mass mapping. Bands of interest in SDS-PAGE lanes were excised and
subjected to in-gel tryptic digestion (Shevchenko et al., 1996, Gharahdaghi et al., 1999). Peptide mass
mapping was performed by the Chemical and Biological Sciences Mass Spectrometry Facility (University
of Georgia, Athens, GA) on a Bruker Autoflex (TOF) mass spectrometer (Bruker Daltonics Inc.,
Billerica, MA). Proteins were identified by peptide mass fingerprinting using the MASCOT online search
engine (www.matrixscience.com (Perkins et al., 1999)) to search the NCBI database of archaeal genomes
and a local server hosting ProteinProspector (Clauser et al., 1999) to search a P. furiosus genome
database.
Preparation of SurR clones. The PF0095 sequence encoding SurR (genome coordinates 103332 –
104030) was cloned into a pET24d vector modified to incorporate an N-terminal hexahistidine tag on the
expressed protein (pET24dBAM, e.g., (18)). To generate a His-tag cleavable SurR protein construct, the

18
PF0095 sequence was subcloned from pET24dBAM-PF0095 into a pET24dBAM-TEV vector modified
to encode a TEV protease site (5'-gaaaacctgtacttccaagga) between the N-terminal His-tag and the protein
sequence (His6-TEV-SurR). The pET24dBAM-PF0095 plasmid and the pET24dBAM-TEV vector were
kind gifts from Francis Jenney.
Expression and purification of SurR. BL21-CodonPlus(DE3)-RIPL cells (Stratagene) were used for
recombinant protein expression. His6-SurR was expressed in a 1-L culture induced with 0.4 mM IPTG at
OD600 ~0.9-1 according to standard protocols. His-tag cleavable SurR was expressed using the auto-
induction protein expression protocol established by Studier (Studier, 2005). Briefly, one 50-mL culture
grown for 8-10 h at 37°C in P-0.5G media was used to inoculate 1 L of ZYP-5052 media which was then
divided equally into two 2-L flasks. The large-scale cultures were grown for 18-20 h at 37°C. Cells were
harvested at 6,000g at 4°C for 15 min. and resuspended in Binding Buffer (20 mM sodium phosphate, 0.5
M NaCl, pH 7.4) containing a protease inhibitor cocktail (Sigma). Soluble cell extract was prepared by
sonication and centrifugation according to standard protocols. His6-SurR and His6-TEV-SurR were
purified over 1-mL HisTrap affinity columns (GE Healthcare) and eluted with a gradient of Eluting
Buffer (20 mM sodium phosphate, 0.5 M NaCl, 0.5 M imidazole, pH 7.4) using an ÄKTA system (GE
Healthcare). Protein-containing fractions were concentrated and buffer exchanged into 20 mM HEPES,
200 mM NaCl, pH 7.6, using an Amicon Ultra-15 centrifugal filter device with a 10 kDa molecular
weight cut-off (Millipore). The His6-TEV-SurR protein was subjected to His-tag cleavage using AcTEV
protease (Invitrogen) according to the manufacturer’s instructions, except that less protease was used in
conjunction with a longer incubation time. Following digestion, the protein sample was applied directly to
a fresh HisTrap column (GE Healthcare) equilibrated with 20 mM HEPES, 200 mM NaCl, pH 7.6, using
a 0.2 mL/min flow rate. The column flow-through containing the tagless protein was collected. Protein
concentrations were determined using a Bio-Rad DC Protein Assay kit, and aliquots of protein were
stored at -80°C.
Electromobility shift assay. DNA probes for EMSA were PCR-amplified from P. furiosus genomic
DNA or from pUC18-cloned promoter-ORF DNA (see below) using slightly extended M13 forward and

19
reverse sequencing primers (5'-ttgtaaaacgacggccagt and 5'-caggaaacagctatgaccatg, extended sequence in
italics), followed by either PCR purification using a Qiagen PCR Purification Kit, gel purification using a
Qiagen Qiaquick Gel Purification Kit, or ethanol precipitation. The 81-bp mbh1 promoter probe (genome
coordinates 1337338-1337418) was PCR-amplified from P. furiosus genomic DNA using primers 5'-
gccaatacgaatttggagagagg and 5'-gacattcgccaaacctcctt, the 80-bp mbh1 ORF probe (1337435-1337514)
was amplified using primers 5'-atatgggcttacttcctctgg and 5'-ccagctatgagttcctgggta, and the 138-bp pdo-
surR intergenic DNA probe (103197-103334) was amplified using primers 5'-cattttcctcacccctatc and 5'-
catattcatcacctacccatatc. The probe for testing the GTTn3AAC motif uncovered by SELEX was derived
from one of the selected SELEX DNAs and was prepared by annealing the following oligonucleotides: 5'-
gcttcatccgtgacGTTcacAACcaaatagattgaggatc and 5'-gatcctcaatctatttgGTTgtgAACgtcacggatgaagc
(selected 30-bp randomized region in italics with motif capitalized). Three additional probes were
designed with the GTTcacAAC motif mutated to ACAcacTTG, ACAcacAAC, and GTTcacTTG (mutated
bases in italics). EMSA reactions of probe DNA with varying amounts of protein were set up in 10-µL
volumes in EMSA buffer (20 mM HEPES, 200 mM KCl, 5% glycerol, 1 mM EDTA, pH 7.5). Heparin
was used as a non-specific competitor in some binding reactions. Reactions were incubated at 55 or 70°C
for 20 min and immediately loaded onto a non-denaturing 5% polyacrylamide gel (BioRad). The resulting
gel was stained with SYBR Green nucleic acid gel stain (Invitrogen) to stain the DNA followed by
SYPRO Ruby protein gel stain (Bio-Rad) to verify the presence of protein in the shifted bands.
Cloning of P. furiosus promoter-ORF DNA. Promoter-ORF DNA fragments were cloned from P.
furiosus genomic DNA into pUC18 (GenBank/EMBL accession number, L09136) for versatile PCR-
amplification of probes for EMSA, footprinting and in vitro transcription experiments. The design of the
DNA fragment to be cloned was optimized primarily for use as a transcription template, and secondarily
as a footprinting probe. For a transcription template, at least ~100 bp of the ORF was included to allow
for an adequate transcript in an in vitro transcription assay; for footprinting, the DNA length chosen was
~300 to 500 bp with the putative promoter region centered in the probe to allow for satisfactory
visualization of the footprint. DNA was PCR-amplified from P. furiosus genomic DNA using a high-

20
fidelity Pfu DNA polymerase (Stratagene) and cloned into pUC18 using standard procedures (see
Supplementary Table S1 for primer and sequence details). Positive clones were selected by blue/white
colony screening and verified by colony PCR and sequencing (Sequetech, Inc, Mountain View, CA).
Fluorescence DNase I footprinting. Fluorescence footprinting was performed as a modification from
(Wilson et al., 2001) based on the DNase I footprinting method (Galas and Schmitz, 1978). Footprinting
probes were PCR-amplified from pUC18-cloned promoter-ORF DNA (Table S1) using 5' 6FAM and
HEX labeled modified M13 primers for analysis on a 3730x1 automated DNA sequencer (Applied
Biosystems). The standard M13 forward primer was extended at the 5' end to ensure that the base
adjacent to the fluorophore was not a guanine, as guanine can quench fluorescence at close proximity.
Consequently, the slightly extended M13 forward and reverse primers used were 5'-ttgtaaaacgacggccagt
(6FAM-labeled) and 5'-caggaaacagctatgaccatg (HEX-labeled), respectively. PCR-amplified probes were
purified on non-denaturing 5% polyacrylamide gels (BioRad) using the crush-and-soak method
(Sambrook and Russel, 2001). Resulting probe DNA was concentrated by ethanol precipitation and
quantified using the Hoechst 33258 dye binding assay prior to use in footprinting reactions.
Footprinting reactions were composed of two parts, the protein-DNA binding reaction and the
cleavage reaction. The protein-DNA incubation solutions were similar to the EMSA reactions except the
reactions were set up in 50-µL volumes with ~150-200 ng DNA probe, incubations of individual
reactions were separated by 2 or 3-min intervals, and the final footprinting buffer composition (from a 5x
stock solution) was as follows: 20 mM HEPES, 100 mM KCl, 15 mM MgCl2, 5 mM CaCl2, 1 mM
EDTA, 1 mM DTT, 5% glycerol, pH 8. Protein-DNA solutions were incubated for 20 min at 55°C or
70°C. For the DNase I cleavage reaction, 0.03-0.05 U of DNase I (from a 0.01 U/µL dilution in 10 mM
Tris, pH 8.0) was added to each 50-µL protein-DNA mixture, and the solution was incubated for 1 min at
room temperature. The reaction was stopped by adding 145 µL of Stop Solution (130 mM NaCl, 20 mM
EDTA, 0.6% SDS) followed immediately by 200 µL of buffered phenol:chloroform:isoamyl alcohol
(25:24:1) with vigorous vortexing. After centrifugation, 180 µL of the aqueous phase was removed and
prepared for ethanol precipitation with 18 µL 3 M sodium acetate (pH 5.2), 1 µL glycogen (20 mg/mL,

21
Roche), and 500 µL 100% ethanol. Samples were stored at -20°C in precipitation solution until they were
prepared for analysis. DNA samples were precipitated, resuspended in 10 µL of HiDi deionized
formamide (Applied Biosystems) premixed with GS-500 internal size standard (Applied Biosystems) (0.2
µL per sample), and assembled into a 96-well reaction plate (Applied Biosystems). Fragment analysis
was performed at the Laboratory for Genomics and Bioinformatics (University of Georgia) using a
3730x1 automated DNA sequencer (Applied Biosystems) calibrated with the DS-30 dye set. Raw peak
data were extracted from the result files using the BatchExtract program available for download from
NCBI (ftp://ftp.ncbi.nih.gov/pub/forensics/BATCHEXTRACT). Raw peak data were analyzed, calibrated,
and visualized using the graphing and analysis software IGOR Pro (Wavemetrics, Inc.).
SELEX. The SELEX probe was designed with a 30-nt randomized region flanked by priming regions
each containing three restriction sites (XbaI, EcoRI, HindIII on the 5' side and BamHI, EcoRI, SalI on the
3' side of the ssDNA probe), ggtctagagaattcaagcttc-(n)30-ggatccgaattcgtcgac. The double-stranded SELEX
probe was PCR-amplified from the synthetic single-stranded oligonucleotide with primers that slightly
extended the original SELEX probe length (thereby eliminating the 3' self-complementary region at the
SalI site and improving the PCR specificity), 5'-actactgtcgacgaattcgga and 5'-gctcaggtctagagaattcaa. To
synthesize the dsDNA probe, 100 pmol of the single-stranded SELEX oligonucleotide was amplified with
2 nmol of each primer for a total of 5 PCR cycles. The PCR-amplified double-stranded SELEX probe was
polyacrylamide gel-purified using the crush-and-soak method (Sambrook and Russel, 2001). Selection
rounds were set up essentially as for the EMSA reactions, except for the amount of SELEX probe used.
For the first round of selection, 0.6 µM SELEX probe was used, and for all succeeding selection rounds,
0.1 µM was used; protein concentrations ranged from 0.6-1.2 µM. After each selection round, DNA was
purified from shifted protein-DNA complexes, amplified with the SELEX primers using 15 cycles of
PCR, and polyacrylamide gel-purified before proceeding to the next selection round. A total of 6 selection
rounds were performed in this manner. The selected DNA was digested with EcoRI, concatemerized, and
cloned into pUC18. Blue/white color screening and colony PCR were used to identify colonies that
contained plasmids with the largest concatemers, and plasmid DNA was then amplified and sequenced. A

22
total of 14 sequences were obtained from the 6th selection round, and a total of 5 sequences were obtained
from the 5th selection round. These sequences were searched using MEME online motif searching
software (Bailey and Elkan, 1994) to elucidate a common motif among the selected DNA.
Construction of a P. furiosus ORF upstream DNA database to be searched for the SELEX motif. A
database of all ORF upstream regions was prepared by extracting sequences upstream of each ORF in the
P. furiosus genome. First, all ORF definitions for P. furiosus from the REFSEQ, GENBANK, and JCVI-
CMR databases were amassed. ORF definitions from the three databases were correlated using the stop
position for each ORF definition as a unique identifier. An ORF corresponding to a given stop position
was redefined according to the ORF definition that yielded the shortest ORF. This was done to ensure that
the maximum length upstream sequence was used for searching. Next, 200-bp sequences just upstream of
each ORF were extracted and recorded in the database. Using a Python script (http://www.python.org/)
and regular expression functions, the resulting database was searched for candidate binding sites using
both forward and reverse strands of the discovered SELEX motif (GTTn3AAC and extended motif
GTTn3AACn5GTT, see Results).
In vitro transcription. The in vitro transcription was performed as described previously (Hethke et al.,
1996, Hethke et al., 1999). Templates were PCR-amplified from cloned probe DNA (Table S1) with M13
forward and reverse primers except for the templates used to show regulation of pdo and surR. The pdo-
surR template (408 bp) for in vitro transcription was amplified from the cloned pdo probe (Table S1) with
the internal primer 5'-gccacagcagttgatgac and the M13 forward primer to generate a template which
allowed for transcripts of different sizes. The two templates containing either only pdo and only surR
were PCR-amplified from the cloned pdo probe (Table S1) using the internal primer 5'-
ctgtggcgcaaagtttatatattg and the M13 forward primer for pdo (261 bp) and the internal primer 5'-
ctaggttgtcaaccttaggttg and the M13 reverse primer for surR (271 bp). Each transcription reaction was
assembled in a final volume of 50 µL. Transcription mixtures contained 40 mM HEPES buffer, pH 7.3;
2.5 mM MgCl2; 0.1 mM EDTA; 280 mM KCl; 0.44 mM each of ATP, GTP, CTP, 0.002 mM UTP and 2
µCi [α-32P]-UTP; 23 nM TFB (recombinant); 104 nM TBP (recombinant); 19 nM RNA polymerase; and

23
different amounts (0–400 nM) of recombinant SurR. The reaction was incubated for 30 min at 70°C. Run-
off transcripts were analysed on an 8% polyacrylamide urea gel in 1xTBE buffer. The transcription
products were quantified and visualized by phosphorimaging (FLA-5000, Fuji, Japan).
Primer extension analyses of transcription start sites. For analyses of the in vitro transcriptional start
sites, transcription reactions with unlabeled precursors (0.44 mM each) were performed. The end-labelled
primers used for the reactions were as follows: 5'-ggtaacttaacatacctcacac, complementary to nucleotides
+72 to +93 of hydB1 (PF0891); 5'-ctctagaagcggcactcattcc, complementary to nucleotides +53 to +74 of
PF1186; 5'-gctatgagttcctgggtactc, complementary to nucleotides +139 to +159 of mbh1 (PF1423); 5'-
ccttaattaccttcttgtcagc complementary to nucleotides +90 to +111 of pdo (PF0094); and 5'-
gcattccatacaagttagg, complementary to nucleotides +76 to + 94 of surR (PF0095). The primers were
annealed with RNA products from a transcription reaction and extended with reverse transcriptase. The
cDNA was analysed by electrophoresis on an 8% DNA sequencing gel. Primer extension products were
quantified and visualized using a PhosphorImager (FLA-500, Fuji, Japan).
References Adams, M. W. (1994) Biochemical diversity among sulfur-dependent, hyperthermophilic
microorganisms. FEMS Microbiol Rev 15: 261-277. Adams, M. W., Holden, J. F., Menon, A. L., Schut, G. J., Grunden, A. M., Hou, C., Hutchins, A. M.,
Jenney, Jr., F. E., Kim, C., Ma, K., Pan, G., Roy, R., Sapra, R., Story, S. V. and Verhagen, M. F. (2001) Key role for sulfur in peptide metabolism and in regulation of three hydrogenases in the hyperthermophilic archaeon Pyrococcus furiosus. J Bacteriol 183: 716-724.
Bailey, T. L. and Elkan, C. (1994) Fitting a mixture model by expectation maximization to discover motifs in biopolymers. Proc Int Conf Intell Syst Mol Biol 2: 28-36.
Bartlett, M. S. (2005) Determinants of transcription initiation by archaeal RNA polymerase. Curr Opin Microbiol 8: 677-684.
Bell, S. D. (2005) Archaeal transcriptional regulation--variation on a bacterial theme? Trends Microbiol 13: 262-265.
Bell, S. D. and Jackson, S. P. (2000) Mechanism of autoregulation by an archaeal transcriptional repressor. J Biol Chem 275: 31624-31629.
Blokesch, M., Albracht, S. P. J., Matzanke, B. F., Drapal, N. M., Jacobi, A. and Bock, A. (2004) The complex between hydrogenase-maturation proteins HypC and HypD is an intermediate in the supply of cyanide to the active site iron of [NiFe]-hydrogenases. J Mol Biol 344: 155-167.
Brinkman, A. B., Dahlke, I., Tuininga, J. E., Lammers, T., Dumay, V., de Heus, E., Lebbink, J. H., Thomm, M., de Vos, W. M. and van Der Oost, J. (2000) An Lrp-like transcriptional regulator from the archaeon Pyrococcus furiosus is negatively autoregulated. J Biol Chem 275: 38160-38169.

24
Clauser, K. R., Baker, P. and Burlingame, A. L. (1999) Role of accurate mass measurement (+/- 10 ppm) in protein identification strategies employing MS or MS/MS and database searching. Anal Chem 71: 2871-2882.
Cramer, P. (2002) Multisubunit RNA polymerases. Curr Opin Struct Biol 12: 89-97. Crooks, G. E., Hon, G., Chandonia, J. M. and Brenner, S. E. (2004) WebLogo: a sequence logo generator.
Genome Res 14: 1188-1190. Dahlke, I. and Thomm, M. (2002) A Pyrococcus homolog of the leucine-responsive regulatory protein,
LrpA, inhibits transcription by abrogating RNA polymerase recruitment. Nucleic Acids Res 30: 701-710.
Fiala, G. and Stetter, K. O. (1986) Pyrococcus-Furiosus Sp-Nov Represents a Novel Genus of Marine Heterotrophic Archaebacteria Growing Optimally at 100-Degrees C. Arch Microbiol 145: 56-61.
Galas, D. J. and Schmitz, A. (1978) DNAse footprinting: a simple method for the detection of protein-DNA binding specificity. Nucleic Acids Res 5: 3157-3170.
Geiduschek, E. P. and Ouhammouch, M. (2005) Archaeal transcription and its regulators. Mol Microbiol 56: 1397-1407.
Gharahdaghi, F., Weinberg, C. R., Meagher, D. A., Imai, B. S. and Mische, S. M. (1999) Mass spectrometric identification of proteins from silver-stained polyacrylamide gel: A method for the removal of silver ions to enhance sensitivity. Electrophoresis 20: 601-605.
Hethke, C., Bergerat, A., Hausner, W., Forterre, P. and Thomm, M. (1999) Cell-free transcription at 95 degrees: thermostability of transcriptional components and DNA topology requirements of Pyrococcus transcription. Genetics 152: 1325-1333.
Hethke, C., Geerling, A. C., Hausner, W., de Vos, W. M. and Thomm, M. (1996) A cell-free transcription system for the hyperthermophilic archaeon Pyrococcus furiosus. Nucleic Acids Res 24: 2369-2376.
Hickey, A. J., Conway de Macario, E. and Macario, A. J. (2002) Transcription in the archaea: basal factors, regulation, and stress-gene expression. Crit Rev Biochem Mol Biol 37: 537-599.
Kornberg, R. D. (2007) The molecular basis of eukaryotic transcription. Proc Natl Acad Sci U S A 104: 12955-12961.
Ma, K. and Adams, M. W. (2001) Hydrogenases I and II from Pyrococcus furiosus. Methods Enzymol 331: 208-216.
Ma, K., Schicho, R. N., Kelly, R. M. and Adams, M. W. (1993) Hydrogenase of the hyperthermophile Pyrococcus furiosus is an elemental sulfur reductase or sulfhydrogenase: evidence for a sulfur-reducing hydrogenase ancestor. Proc Natl Acad Sci USA 90: 5341-5344.
Ma, K., Weiss, R. and Adams, M. W. (2000) Characterization of hydrogenase II from the hyperthermophilic archaeon Pyrococcus furiosus and assessment of its role in sulfur reduction. J Bacteriol 182: 1864-1871.
Miroshnichenko, M. L. and Bonch-Osmolovskaya, E. A. (2006) Recent developments in the thermophilic microbiology of deep-sea hydrothermal vents. Extremophiles 10: 85-96.
Moxley, R. A. and Jarrett, H. W. (2005) Oligonucleotide trapping method for transcription factor purification systematic optimization using electrophoretic mobility shift assay. J Chromatogr 1070: 23-34.
Oliphant, A. R., Brandl, C. J. and Struhl, K. (1989) Defining the sequence specificity of DNA-binding proteins by selecting binding sites from random-sequence oligonucleotides: analysis of yeast GCN4 protein. Mol Cell Biol 9: 2944-2949.
Ouhammouch, M., Dewhurst, R. E., Hausner, W., Thomm, M. and Geiduschek, E. P. (2003) Activation of archaeal transcription by recruitment of the TATA-binding protein. Proc Natl Acad Sci USA 100: 5097-5102.
Ouhammouch, M., Langham, G. E., Hausner, W., Simpson, A. J., El-Sayed, N. M. and Geiduschek, E. P. (2005) Promoter architecture and response to a positive regulator of archaeal transcription. Mol Microbiol 56: 625-637.

25
Pedone, E., Ren, B., Ladenstein, R., Rossi, M. and Bartolucci, S. (2004) Functional properties of the protein disulfide oxidoreductase from the archaeon Pyrococcus furiosus: a member of a novel protein family related to protein disulfide-isomerase. Eur J Biochem 271: 3437-3448.
Perkins, D. N., Pappin, D. J., Creasy, D. M. and Cottrell, J. S. (1999) Probability-based protein identification by searching sequence databases using mass spectrometry data. Electrophoresis 20: 3551-3567.
Ren, B., Tibbelin, G., de Pascale, D., Rossi, M., Bartolucci, S. and Ladenstein, R. (1998) A protein disulfide oxidoreductase from the archaeon Pyrococcus furiosus contains two thioredoxin fold units. Nat Struct Biol 5: 602-611.
Sambrook, J. and Russel, D. W. (2001) Molecular Cloning. Cold Spring Harbor Laboratory Press, Cold Spring Harbor, NY.
Sapra, R., Verhagen, M. F. and Adams, M. W. (2000) Purification and characterization of a membrane-bound hydrogenase from the hyperthermophilic archaeon Pyrococcus furiosus. J Bacteriol 182: 3423-3428.
Schut, G. J., Bridger, S. L. and Adams, M. W. (2007) Insights into the Metabolism of Elemental Sulfur by the Hyperthermophilic Archaeon Pyrococcus furiosus: Characterization of a Coenzyme A- Dependent NAD(P)H Sulfur Oxidoreductase. J Bacteriol 189: 4431-4441.
Schut, G. J., Zhou, J. and Adams, M. W. (2001) DNA microarray analysis of the hyperthermophilic archaeon Pyrococcus furiosus: evidence for anNew type of sulfur-reducing enzyme complex. J Bacteriol 183: 7027-7036.
Shevchenko, A., Wilm, M., Vorm, O. and Mann, M. (1996) Mass spectrometric sequencing of proteins from silver stained polyacrylamide gels. Anal Chem 68: 850-858.
Silva, P. J., van den Ban, E. C. D., Wassink, H., Haaker, H., de Castro, B., Robb, F. T. and Hagen, W. R. (2000) Enzymes of hydrogen metabolism in Pyrococcus furiosus. Eur J Biochem 267: 6541-6551.
Smale, S. T. and Kadonaga, J. T. (2003) The RNA polymerase II core promoter. Annu Rev Biochem 72: 449-479.
Studier, F. W. (2005) Protein production by auto-induction in high density shaking cultures. Protein Expr Purif 41: 207-234.
Tran, T. T., Dam, P., Su, Z., Poole, 2nd, F. L., Adams, M. W., Zhou, G. T. and Xu, Y. (2007) Operon prediction in Pyrococcus furiosus. Nucleic Acids Res 35: 11-20.
Tuerk, C. and Gold, L. (1990) Systematic evolution of ligands by exponential enrichment: RNA ligands to bacteriophage T4 DNA polymerase. Science 249: 505-510.
van de Werken, H. J., Verhees, C. H., Akerboom, J., de Vos, W. M. and van der Oost, J. (2006) Identification of a glycolytic regulon in the archaea Pyrococcus and Thermococcus. FEMS Microbiol Lett 260: 69-76.
Vierke, G., Engelmann, A., Hebbeln, C. and Thomm, M. (2003) A novel archaeal transcriptional regulator of heat shock response. J Biol Chem 278: 18-26.
Wilson, D. O., Johnson, P. and McCord, B. R. (2001) Nonradiochemical DNase I footprinting by capillary electrophoresis. Electrophoresis 22: 1979-1986.

26
Table 1. GTTn3AACn5GTT motifs found in 200-bp ORF upstream DNA regions ORFa Strandb Motif Startc Stopc ORF Annotationd PF0094 – GTTGTCAACCTTAGGTT -82 -66 Protein disulfide oxidoreductase, pdo (Pedone et al., 2004) PF0095 + GTTGTCAACCTTAGGTT -67 -51 Sulfur response regulator, surR (this work) PF0531 – GTTGGTAACAAAATGTT -84 -68 cobalamin biosynthesis protein m PF0532 + GTTACCAACGTAAGGTT -100 -84 hypothetical protein PF0547 – GTTGAAAACTTCAAGTT -190 -174 hypothetical protein PF0548 + GTTGAAAACTTCAAGTT -67 -51 hydrogenase expression/formation protein PF0559 + GTTTCTAACTTTTGGTT -48 -32 hydrogenase expression/formation regulatory protein PF0568 – GTTTATAACGCTATGTT -24 -8 hypothetical protein PF0569 + GTTTATAACGCTATGTT -34 -18 hypothetical protein PF0891 + GTTTTTAACCTTTGGTT -142 -126 Hydrogenase I subunit beta, hydB1 (Ma et al., 1993) PF0913 – GTTCAAAACCAAAGGTT -197 -181 Mo formylmethanofuran dehydrogenase related PF0914 – GTTCAAAACCAAAGGTT -81 -65 Mo formylmethanofuran dehydrogenase related PF0915 – GTTAGAAACCTTAGGTT -58 -42 hypothetical protein PF0926 – GTTTGGAACCTATTGTT -81 -65 hypothetical protein PF1100 + GTTTGCAACTCGTAGTT -108 -92 hypothetical protein PF1186 – GTTTAAAACCTTTAGTT -34 -18 NAD(P)H sulfur reductase, nsr (Schut et al., 2007) PF1328 – GTTCAAAACCTAAGGTT -87 -71 hydrogenase gamma subunit PF1329 + GTTCAAAACCTAAGGTT -88 -72 Hydrogenase II subunit beta (Ma et al., 2000) PF1422 – GTTATAAACCAAAAGTT -19 -3 thioredoxin reductase PF1423 + GTTATAAACCAAAAGTT -146 -130 hypothetical protein PF1423 + GTTTCAAACCAAATGTT -31 -15 Membrane-bound hydrogenase subunit A, mbh1 (Sapra et al., 2000) PF1516 – GTTTACAACTTTATGTT -58 -42 GMP synthase subunit B PF1621 – GTTAGTAACTAAAAGTT -78 -62 hypothetical protein PF1622 + GTTAGTAACTAAAAGTT -196 -180 n-type ATP pyrophosphatase superfamily
a. The ORF from which the 200-bp upstream sequence was searched. b. The orientation of the ORF in the genome is indicated, either on the forward (+) or the reverse (–)
strand. c. Start and stop positions are relative to the sequence of the ORF upstream region where -1 corresponds
to the first nucleotide upstream from the ORF start. d. Annotations are from REFSEQ and JCVI-CMR. Genes that have been experimentally studied are listed
with the corresponding reference.

27
Table 2. Motifs found upstream of ORFs involved in the primary response to S0 ORF/operona ORF description/operon functionb GTTn3AACn5GTTc GTTn3AACc Up-regulated >5-fold 10 min after S0 addition (Schut et al., 2007) PF0094 Protein disulfide oxidoreductase (pdo) (Pedone et al., 2004) 1 2 PF0261-0262 unknown transporter 0 0 PF1186 NAD(P)H sulfur reductase (nsr) (Schut et al., 2007) 1 1 PF1453-1441 Membrane-bound oxidoreductase (mbx) (Silva et al., 2000) 0 2 PF2051-2052 putative transcriptional regulators 0 1 Down-regulated >5-fold 10 min after S0 addition (Schut et al., 2007) PF0450 Glutamine synthetase, catalytic region 0 0 PF0531-0529 Cobalt transport 1 1 PF0559 Hydrogenase maturation protein HypF 1 1 PF0736 Conserved hypothetical protein 0 0 PF0736.1 Conserved hypothetical protein 0 0 PF0891-0894 Hydrogenase I (PF0891: hydIB) (Ma et al., 1993) 1 1 PF0913 Formylmethanofuran dehydrogenase, subunit E 1 2 PF0915 Cytochrome c biogenesis protein 1 1 PF0926-0925 Unknown 1 1 PF1329-1332 Hydrogenase II (Ma et al., 2000) 1 1 PF1423-1436 Membrane-bound hydrogenase (PF1423: mbh1) (Sapra et al., 2000) 2 2 PF1621 Fibronectin, type III-like fold 1 1 a. Predicted operons are represented by hyphenated loci with the first ORF of the operon (from which the
motif was found upstream) listed first, followed by the last ORF of the operon. b. ORF descriptions and operon functions are essentially derived from (Schut et al., 2007). ORFs and
operons that have been previously described or characterized are listed with the corresponding reference.
c. Motifs were identified from a search of 200-bp ORF upstream DNA of all P. furiosus ORFs. The number of motifs present is indicated.

28
Figure legends
Fig. 1. Identification of SurR from cell extract with mbh1 bait DNA. Silver-stained denaturing gel of
eluted proteins from DNA affinity capture with mbh1 bait DNA incubated in soluble cell extracts with
(red) and without (black) S0 showing the corresponding densitometry scans of each lane. Arrows indicate
identified proteins (NCBI annotations): 1, reverse gyrase, PF0495; 2, DNA-directed RNA polymerase
subunit b, PF1564; 3, DNA-directed RNA polymerase subunit a', PF1563; 4, Cell division control protein
48, aaa family, PF0963; 5, methylmalonyl-CoA decarboxylase, subunit alpha, PF0671; 6, methionine
synthase vitamin B12-independent isozyme, PF1269; 7, conserved hypothetical protein, PF1268; 8,
conserved hypothetical protein, PF1827; 9, conserved hypothetical protein, PF0496; 10, conserved
hypothetical protein (SurR), PF0095; 11, conserved hypothetical protein, PF1572. Protein Bands 1, 6 and
7 can be challenged off with heparin, suggesting that they are likely non-specific DNA-binding proteins,
and bands 4 and 5 are bead-binding proteins not removed by DNase digestion. A control protein capture
experiment using a DNA probe from an ORF not regulated during the primary S0 response can be seen in
Supplementary Fig. S1.
Fig. 2. SurR binds to the membrane-bound hydrogenase promoter region. A, EMSA of SurR with
mbh1 promoter (81 bp, 75 nM in each lane) and ORF (80 bp, 75 nM in each lane) DNA probes using
heparin as a nonspecific DNA competitor (lanes 8-12 in each panel). Protein amounts are indicated at the
top of the gel. All samples were run on one gel (stained with SYBR Green I nucleic acid gel stain). The
horizontal dashed line suggests that nonspecifically bound SurR results in larger shifts. B, Fluorescence
DNase I footprint of SurR (0.3 µM) on mbh1 probe DNA (10 nM). The y-axes are shown in fluorescence
intensity units and the x-axis shows the base position relative to the mbh1 translation start site (+1).
Traces for both strands of undigested probe are shown in blue, and traces for digested probe with (red)
and without (black) protein are overlaid. The mbh1 coding strand is shown in the top two traces (5'-3') and
the noncoding strand in the bottom two traces (3'-5'). C, Expanded view of SurR footprint regions shown

29
in B with corresponding nucleotide sequence. The footprint regions for both strands are boxed,
GTTn3AAC motifs (see Fig. 4) are underlined, DNase I hypersensitive sites are marked by an asterisk (*),
transcription start site is marked with an arrow, and BRE/TATA region is boxed in blue (located in the
‘inter-footprint’ sequence shown above the trace for the mbh1 coding strand).
Fig. 3. SurR binds with sequence-specificity to the pdo-surR promoter region. A, EMSA of SurR with
pdo-surR promoter DNA (138 bp, 50 nM in each lane). Protein amounts are indicated at the top of the gel.
The gel was stained with SYBR Green I nucleic acid gel stain. B, Fluorescence DNase I footprint of SurR
(0.3 µM) on pdo-surR probe DNA (10 nM), with expanded view of footprint region shown in C. See
caption of Fig. 1B,C for further explanations of footprint traces and annotations.
Fig. 4. SurR recognizes the palindrome GTTn3AAC. A, SurR DNA recognition motif determined by
SELEX for 11 out of 19 selected sequences. B, EMSA of SurR with 40-bp DNA probes derived from one
of the selected SELEX sequences, either containing the GTTn3AAC motif or mutated motifs, as indicated
(mutated bases in red), at a concentration of 200 nM (~5 µg/mL). Heparin was used at a concentration of
20 µg/mL. Protein amounts are indicated at the top of the gel. Gel was stained with SYBR Green I nucleic
acid gel stain. C, Consensus motif present in 200-bp ORF upstream regions of 13 GTTn3AAC-containing
ORFs that are up- or down-regulated with S0. Motif diagrams were generated using WebLogo (Crooks et
al., 2004).
Fig. 5. Validation of GTTn3AAC-containing upstream DNA regions of primary S0 response ORFs as
SurR targets. EMSAs of SurR with probe DNA containing ORFs down-regulated (A) and up-regulated
(B) during primary S0 response. Probe DNA concentrations (in each lane) are as follows: hydB1, 50 nM
(326 bp); PF0559, 25 nM (282 bp); PF0531, 20 nM (488 bp); nsr, 25 nM (380 bp); PF1453, 20 nM (515
bp); PF2051, 20 nM (424 bp). Protein amounts are indicated at the top of the gel. Gel sizes were adjusted

30
according to DNA standards such that free DNA positions are comparable among gels. Gels were stained
with SYBR Green I nucleic acid gel stain.
Fig. 6. SurR footprints in promoters of primary S0 response ORFs. Expanded views of fluorescence
DNase I footprints of SurR on probe DNA of primary S0 response ORFs: A, His6-SurR (0.32 µM) on
hydB1 probe DNA (20 nM), B, His6-SurR (0.64 µM) on PF0559 probe DNA (20 nM), C, SurR (0.24 µM)
on nsr probe DNA (10 nM), D, SurR (0.48 µM) on PF1453 probe DNA (10 nM). See fluorescence
footprints of full-length undigested and digested probes in Supplementary Figs. S3 and S4. See caption of
Fig. 1B,C for further explanations of footprint traces and annotations.
Fig. 7. SurR regulates transcription of primary S0 response ORFs and its own ORF. In vitro
transcription results for SurR showing activation of down-regulated ORFs involved in the primary S0
response, mbh1 (A) and hydB1 (B), and repression of up-regulated ORFs involved in the primary S0
response, nsr (C) and pdo in pdo-surR template (D) and a template containing only pdo and associated
promoter elements (E). Activation of surR, divergently transcribed from and sharing a promoter region
with pdo, is shown in D with the pdo-surR template and in F with a template containing only surR with
associated promoter elements and part of the SurR binding site. The control gdh transcript (248 b) in each
gel image is marked by an open triangle. Template amounts used are as follows: mbh1, 10 nM; hydB1, 25
nM; nsr, 25 nM; pdo-surR, 25 nM; pdo, 25 nM; surR, 25 nM; gdh, 10 nM. The % activity shown at the
bottom of each gel was obtained by averaging the quantified transcripts (quantified with a Phosphor
Imager) from three transcription experiments. The % activity for the control gdh transcript varied by less
than 10% in each experiment.
Fig. 8. SurR footprint positions with respect to basal promoter elements indicate transcriptional
regulatory mechanisms. Summary of SurR footprint positions (light grey boxes with broken lines),
BRE/TATA regions (black boxes) and transcription initiation sites (open triangles) relative to target ORF

31
start sites for genes regulated by SurR in in vitro transcription experiments (see Fig. 7). Promoter regions
are aligned at the target ORF translation start position (dark grey box-arrows) and bent arrows indicate
divergently transcribed ORFs (dark grey boxes). Note that the footprints defined by DNase I cleavage are
likely larger than the actual protection region of SurR on the DNA due to the inability of the large DNase
I enzyme to access the DNA just outside of the SurR binding region.

32
Acknowledgements
We thank Dr. Francis E. Jenney for providing the recombinant PF0095 clone as well as the pET24dBAM-
TEV cloning vector. We also thank Dr. Mohamed Ouhammouch for his detailed protocols and useful
suggestions for the footprinting and SELEX work. This work was supported by the National Science
Foundation (MCB-9631093 to R. A. S.), the National Institutes of Health (GM042025 to R. A. S.), the
Department of Energy (FG05-95ER20175 to M. W. W. A.), and by the priority program of the Deutsche
Forschungsgemeinschaft for "Regulation of genome function and gene regulation in Archaea" (to M. T.).

33
Fig. 1

34
Fig. 2

35
Fig. 3

36
Fig. 4

37
Fig. 5

38
Fig. 6

39
Fig. 7

40
Fig. 8

S-1
Table S1. Cloned promoter-ORF DNA probes
Probe DNAa
Probe DNA genome
coordinates
Forward primer sequenceb
Reverse primer sequenceb
Cloning DNA length (bp)c
Probe DNA length (bp)d
pdo (PF0094) 103080-103499 cgtagaattcctgaag
aacaccttctctttcc tagtcaagcttctggtcacagtattgacagtg 441 480
PF0531 547577-547992 cgtagagctcgatttctaagtgagtacgctag
tagtcgcatgcttgaacttcttcctccctaac 437 488
PF0559 575393-575712 (575393-575620)e
cgtagaattcgtgaggcccagcaaataatag
tagtcaagcttaacgtatcccctcaagttg 341 282
hydB1 (PF0891)
863554-863873 (863554-863825)e
cgtagaattcactatattctatcctacttcaac
tagtcaagcttaatctccctgaagtcatagaac 341 326
nsr (PF1186) 1132759-1133078 cgtagaattcagcaaa
ggaagctgctcagg tagtcaagcttcacccactccgttgcctcg 341 380
mbh1 (PF1423) 1337173-1337562 cgtagaattccctaaa
ctgaacatgtcc tagtcaagctttccgataatgtttctggttg 411 450
PF1453 1359941-1360395 cgtgaattctcagttcttgaggatcaagac
tagtcaagctttccgtaacctcgatttgc 475 515
PF2051 1892585-1892936 cgtagagctcagaggaacatcgctatattctc
tagtcgcatgcaacctacttatctccttggag 373 424
a Probes contain ORF and upstream (putative promoter) DNA but are named for the SurR target ORF, although some contain DNA from divergently transcribed ORFs and their corresponding upstream DNA.
b DNA primers are listed in the 5' to 3' direction. c Length of PCR-amplified DNA used for cloning into pUC18. d Length of probe DNA amplified from pUC18 using slightly extended M13 Forward and Reverse sequencing primers (5'-ttgtaaaacgacggccagt and 5'-caggaaacagctatgaccatg, extended sequence in italics). Footprinting probes were amplified with fluorescent-tagged primers.
e These probes when amplified had internal cloning restriction sites; therefore the genome coordinates listed in parentheses represent the final cloned P. furiosus DNA present in the probe.

S-2
Fig. S1. DNA affinity protein capture for mbh1 probe DNA and control probe DNA, sipB. Silver-stained denaturing gel of eluted proteins from DNA affinity capture with mbh1 and sipB DNA probes incubated in soluble cell extracts with (red) and without (black) S0. The band identified as PF0095 (SurR) is only present among the eluted proteins from the mbh1 probe DNA.
Fig. S2. Fluorescence DNase I footprinting of SurR showing gradual binding site
occupation. A. Footprint of SurR on mbh1-coding strand of mbh1 probe DNA (10 nM) at SurR concentrations of 12 µM (top trace) and 24 µM (bottom trace). B. Footprint of SurR on surR-coding strand of pdo-surR probe DNA (10 nM) at SurR concentrations of 12 µM (top trace) and 24 µM (bottom trace). In both, the y-axes are shown in fluorescence intensity units and the x-axis shows the base position relative to the translation start sites of mbh1 (A) and surR (B). Traces for digested probe with (red) and without (black) protein are overlaid. Traces are shown in the 5'-3' direction.
Fig. S3. Fluorescence DNase I footprinting of SurR on probe DNA of ORFs down-regulated
during primary S0 response. A, Footprint of His6-SurR (0.32 µM) on hydB1 probe DNA (20 nM). B, Footprint of His6-SurR (0.64 µM) on PF0559 probe DNA (20 nM). In both, the y-axes are shown in fluorescence intensity units and the x-axis shows the base position relative to the translation start sites of hydB1 (A) and PF0559 (B). Traces for both strands of undigested probe are shown in blue, and traces for digested probe with (red) and without (black) protein are overlaid. The ORF coding strand is shown in the top two traces (5'-3') and the non-coding strand in the bottom two traces (3'-5').
Fig. S4. Fluorescence DNase I footprinting of SurR on probe DNA of ORFs up-regulated
during primary S0 response. A, Footprint of SurR (0.24 µM) on nsr probe DNA (10 nM). B, Footprinbt of SurR (0.48 µM) on PF1453 probe DNA (10 nM). In both, the y-axes are shown in fluorescence intensity units and the x-axis shows the base position relative to the translation start sites of nsr (A) and PF1453 (B). Traces for both strands of undigested probe are shown in blue, and traces for digested probe with (red) and without (black) protein are overlaid The ORF coding strand is shown in the top two traces (5'-3') and the non-coding strand in the bottom two traces (3'-5').
Fig. S5. Primer extension analysis of transcription start sites. Sequencing gels showing the
in vitro transcription start sites of mbh1 (A), hydB1 (B), nsr (C), pdo (D), and surR (E). A-E, The sequence surrounding the transcription start site is shown next to each gel. The start site nucleotide is shown in bold, and its position relative to the ORF start is indicated.
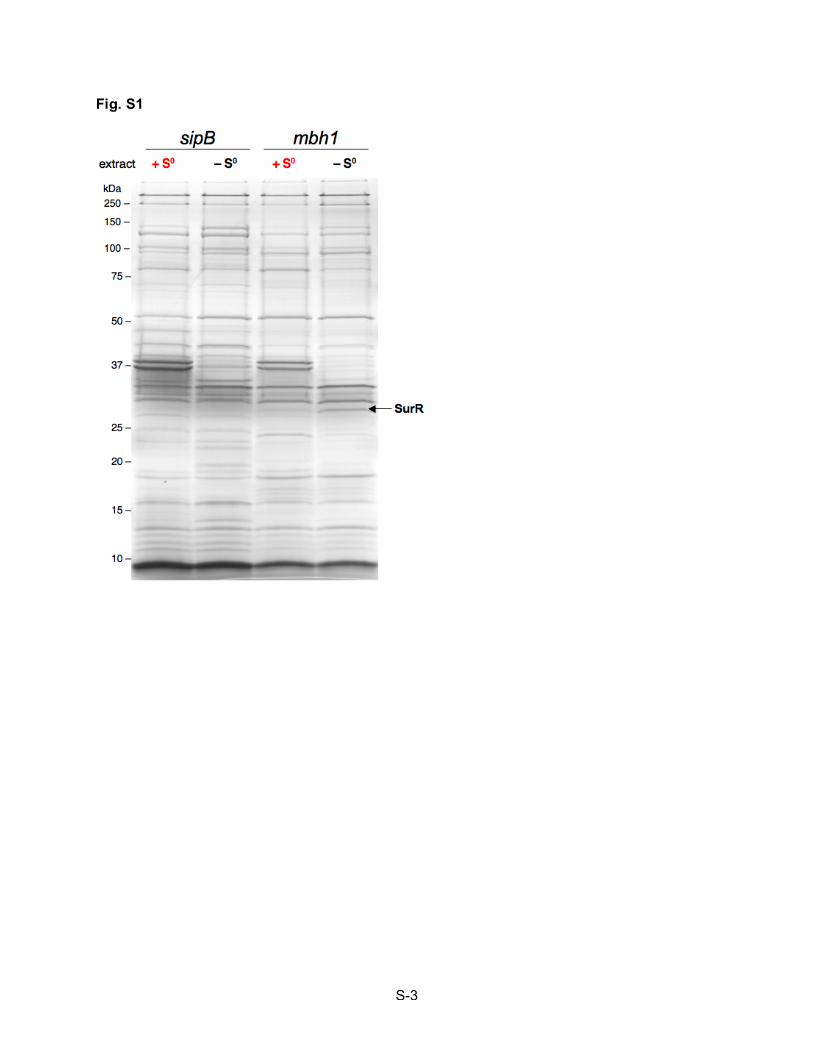
S-3
Fig. S1

S-4
Fig. S2

S-5
Fig. S3

S-6
Fig. S4

S-7
Fig. S5