Robot-Aided Neurorehabilitation: A Novel Robot for Ankle Rehabilitation
Upload
independentCategory
view
1download
0
ORIGINAL RESEARCH
Surface-enhanced Raman spectral biomarkers correlate withAnkle Brachial Index and characterize leg muscle biochemicalcomposition of patients with peripheral arterial diseaseKim Cluff1, Abby M. Kelly2, Panagiotis Koutakis3, Xiang N. He4, Xi Huang4, Yong Feng Lu4,Iraklis I. Pipinos3,5, George P. Casale3,* & Jeyamkondan Subbiah2,6,*
1 Bioengineering, Wichita State University, Wichita, Kansas
2 Biological Systems Engineering, University of Nebraska, Lincoln, Nebraska
3 Division of General Surgery, Department of Surgery, University of Nebraska Medical Center, Omaha, Nebraska
4 Department of Electrical Engineering, University of Nebraska, Lincoln, Nebraska
5 Department of Surgery and VA Research Service, VA Nebraska-Western Iowa Health Care System, Omaha, Nebraska
6 Food Science and Technology, University of Nebraska, Lincoln, Nebraska
Keywords
Linear discriminant analysis, muscle
biochemistry, partial least squares regression,
peripheral arterial disease, Raman
spectroscopy.
Correspondence
Jeyamkondan Subbiah, University of Nebraska,
212 L.W. Chase Hall, Lincoln, NE 68583-0726.
Tel: 1-402-4724944
Fax: 1-402-4726338
E-mail: [email protected]
and
George P. Casale, Department of Surgery,
983280 Nebraska Medical Center, Omaha,
NE 68198-3280.
Tel: 402-559-4623
Fax: 402-559-6732
E-mail: [email protected]
Funding Information
This work was supported in part by the
Nebraska Research Initiative grant from the
University of Nebraska-Lincoln, a grant from the
National Institutes of Health (R01AG034995),
the MRI grant from National Science
Foundation (CMMI 1126208), the Charles and
Mary Heider Fund for Excellence in Vascular
Surgery, and the Alexander S. Onassis Public
Benefit Foundation. Furthermore, this material
is the result of work supported in part with
resources and the use of facilities at the VA
Nebraska-Western Iowa Health Care System.
Received: 15 August 2014; Accepted: 18
August 2014
doi: 10.14814/phy2.12148
Physiol Rep, 2 (9), 2014, e12148,
doi: 10.14814/phy2.12148
*Senior authors.
Abstract
Peripheral arterial disease (PAD) is characterized by atherosclerotic blockages
of the arteries supplying the lower extremities, which cause a progressive accu-
mulation of ischemic injury to the skeletal muscles of the lower limbs. This
injury includes altered metabolic processes, damaged organelles, and compro-
mised bioenergetics in the affected muscles. The objective of this study was to
explore the association of Raman spectral signatures of muscle biochemistry
with the severity of atherosclerosis in the legs as determined by the Ankle Bra-
chial Index (ABI) and clinical presentation. We collected muscle biopsies from
the gastrocnemius (calf muscle) of five patients with clinically diagnosed clau-
dication, five patients with clinically diagnosed critical limb ischemia (CLI),
and five control patients who did not have PAD. A partial least squares
regression (PLSR) model was able to predict patient ABI with a correlation
coefficient of 0.99 during training and a correlation coefficient of 0.85 using a
full cross-validation. When using the first three PLS factor scores in combina-
tion with linear discriminant analysis, the discriminant model was able to cor-
rectly classify the control, claudicating, and CLI patients with 100% accuracy,
using a full cross-validation procedure. Raman spectroscopy is capable of
detecting and measuring unique biochemical signatures of skeletal muscle.
These signatures can discriminate control muscles from PAD muscles and
correlate with the ABI and clinical presentation of the PAD patient. Raman
spectroscopy provides novel spectral biomarkers that may complement exist-
ing methods for diagnosis and monitoring treatment of PAD patients.
ª 2014 The Authors. Physiological Reports published by Wiley Periodicals, Inc. on behalf of
the American Physiological Society and The Physiological Society.
This is an open access article under the terms of the Creative Commons Attribution License,
which permits use, distribution and reproduction in any medium, provided the original work is properly cited.
2014 | Vol. 2 | Iss. 9 | e12148Page 1
Physiological Reports ISSN 2051-817X
Introduction
Peripheral arterial disease (PAD), characterized by athero-
sclerotic blockages of the arteries supplying the lower
extremities in association with muscle damage and limb
dysfunction, produces a considerable public health burden
affecting 12–20% of Americans age 65 and older (Mahon-
ey et al. 2008, 2010; Roger et al. 2011). PAD decreases
the blood flow to the affected legs, causing an accumula-
tion of ischemic injury to the leg that is, reflected in
altered metabolic processes (mitochondrial dysfunction
and oxidative damage) and gradual worsening of the his-
tology of affected skeletal muscles (myofiber degeneration
and fibrosis), a condition identified as PAD myopathy
(Hedberg et al. 1988; Pipinos et al. 2008b; Cluff et al.
2013; Weiss et al. 2013). The principal clinical manifesta-
tions of PAD are claudication (exercise-induced leg pain
and dysfunction) and in severe cases critical limb ische-
mia (CLI) which includes foot pain at rest (ischemic rest
pain) and tissue loss (nonhealing ulcers and gangrene).
Ankle Brachial Index (ABI, a measure of limb hemody-
namics) is the standard, noninvasive method for diagnos-
ing presence and severity of atherosclerotic blockages in
arteries supplying the legs and for monitoring the hemo-
dynamic effects of treatment interventions for PAD. ABIs
are measured as the ratio of the systolic pressure in the
ankle to that in the arm. Stenoses and occlusions of the
arteries supplying the legs lower the ankle blood pressure
and yield a low ABI, which is the hemodynamic hallmark
of PAD. PAD is diagnosed by resting ABI values of <0.90,with values of 0.90–1.2 considered normal. Other more
detailed methods of arterial assessment, such as ultraso-
nography and angiography (based on computerized
tomography, magnetic resonance, or standard X-Ray-
based evaluation), also are used by clinicians to evaluate
patients with PAD. All of these methods, like ABI, focus
on the diseased arterial tree and their main limitation is
that they do not evaluate the effects of PAD on the
chronically ischemic end-organ which is the leg and its
muscles.
Recently, ultrastructural and biochemical studies have
sought to characterize the muscle damage (myopathy of
PAD) occurring secondary to the vascular disease (Pipi-
nos et al. 2008a,b,c; Cluff et al. 2013; Weiss et al. 2013).
These studies have demonstrated that long-term, leg
ischemia as well as repeated cycles of ischemia followed
by reperfusion, occurring with basic daily activities;
induce the generation of reactive oxygen species (ROS) in
the PAD muscle. ROS produce oxidative damage to the
tissues of the ischemic limb, leading to degeneration and
dysfunction of cells and their organelles (mitochondria)
and activation of inflammatory pathways (McDermott
et al. 2004; Pipinos et al. 2008a,c; Brevetti et al. 2010;
Weiss et al. 2013). Work from our group and others have
shown that precise determination of the degree and nat-
ure of damage in the ischemic muscles can be central to
clinical decision making (Brass and Hiatt 2000; Brass
et al. 2004; Pipinos et al. 2008a,c; Brevetti et al. 2010;
Berger and Hiatt 2012; Hiatt et al. 2012) first because it
can measure the severity of PAD at baseline, when the
patient first presents to the physician, and second because
it can help determine how effective and clinically relevant
a therapeutic intervention for PAD is based on the effects
of the intervention on the ischemic skeletal muscle.
Raman spectroscopy is a label-free analytical tool that
uses the scattering properties of light to characterize
molecular vibrations within a tissue sample, yielding a
molecular fingerprint. Raman spectroscopy provides
information-rich molecular profiles and has potentially
important clinical applications for real-time in situ evalu-
ation of living tissues (Hanlon et al. 2000). Raman spec-
tral analysis has produced distinct molecular profiles of
diseased bronchial tissue, brain tissue, stomach, and
breast tissue (Nijssen et al. 2002; Koljenovic et al. 2004;
Bonifacia et al. 2010; Kirsch et al. 2010). Other investiga-
tions have demonstrated that Raman spectroscopy allows
construction of chemical maps of subcellular structures
such as, the nucleus, and mitochondria (Bonnier et al.
2010; Miljkovi�c et al. 2010). Applications of Raman spec-
troscopy have been further broadened by making use of
metallic nanostructured surfaces that produce a multifold
increase in the Raman scattering signals, referred to as
surface-enhanced Raman spectroscopy (SERS; Sharma
et al. 2012).
The objective of this study was to correlate hemody-
namic limitation (determined as ABI) and clinical presen-
tation (claudication vs. CLI) of the PAD patient with
alterations in the biochemical profile of their chronically
ischemic leg muscle as determined by Raman spectros-
copy. Our central hypothesis is that SERS signatures from
human biopsy samples (gastrocnemius muscle) correlate
with hemodynamic limitation (ABI) and disease stage in
the legs of the evaluated subjects. The rationale that
underlies this research is that SERS signatures may
become valuable clinical biomarkers in the practice of
vascular surgery. Such biomarkers can be useful comple-
ments to new and expanded diagnostic methods that can
include (along with clinical and hemodynamic parame-
ters) direct measurements of tissue damage. These diag-
nostic methods can help to stratify patients based on the
degrees of damage present in their skeletal muscle.
Furthermore, these biomarkers can be used as surrogate
endpoints that can assess and predict the effectiveness of
a therapeutic intervention.
2014 | Vol. 2 | Iss. 9 | e12148Page 2
ª 2014 The Authors. Physiological Reports published by Wiley Periodicals, Inc. on behalf of
the American Physiological Society and The Physiological Society.
Raman Spectral Biomarkers of PAD Muscle K. Cluff et al.

Materials and Methods
Tissue samples
The tissue collection protocol was approved by the Insti-
tutional Review Board, and all subjects gave informed
consent. We collected muscle biopsies from the gastrocne-
mius (calf muscle) of five patients with clinically diag-
nosed critical limb ischemia (CLI), five patients with
clinically diagnosed claudication, and five control patients
(resting ABI > 0.9) who did not have lower limb impair-
ment. Demographic data, from these patients, including
ABI’s, and age are presented in Table 1. The biopsies
were acquired with a Bergstrom needle, fixed in metha-
carn, and embedded in paraffin. Two 4 lm cross sections,
from each biopsy, were mounted on slides for Raman
spectra acquisition. Prior to Raman spectral acquisition,
the slide specimens were deparaffinized with xylene, rehy-
drated through a series of ethanol washes, and allowed to
air dry.
Surface-enhanced Raman spectroscopy(SERS)
All tissue specimens were mounted on nanostructured
gold-slides (AU.1000.ALSI; Platypus Technologies, Madi-
son, WI) for SERS. Additionally, two control and two
PAD tissue specimens were mounted on conventional
glass slides for comparison of the nonenhanced Raman
signal with the SERS signal. An inVia Raman microscope
(Renishaw, Gloucestershire, UK) spectral imaging system
was used to acquire Raman and SERS spectra of human
muscle biopsy specimens. This system is a high-sensitivity
research grade system that supports multiple excitation
lasers and allows acquisition of information-rich spectral
images.
Confocal Raman spectral signatures were collected
within the finger print region (303–1901 cm�1) using a
514 nm excitation laser (with a spot size of ~20 lm),
with a 509 magnification objective. The tissue was
photo-bleached for 60 sec and then the spectrum was col-
lected with a 10 sec exposure time. From each tissue
specimen, approximately 10 spectra were collected from
the center of 10 individual myofibers and then averaged
(after data preprocessing) to represent the tissue speci-
men.
Data preprocessing
Data preprocessing of the raw SERS spectra included
baseline correction and normalization techniques. The
Raman spectra were baseline corrected using the Vancou-
ver Raman algorithm (Zhao et al. 2007) with a 5-point
boxcar smoothing and a 5th order polynomial fit, shown
in Figure 1. The Vancouver Raman algorithm is a robust
iteratively modified multi-polynomial fitting algorithm
that removes intrinsic autofluorescence background sig-
nals and improves signal-to-noise ratios (Lieber and Ma-
hadevan-Jansen 2003; Afseth et al. 2006; Zhao et al. 2007;
Beier and Berger 2009). Following baseline correction, the
spectra were normalized using the standard normal vari-
ate (SNV) technique. SNV normalization is a common
mathematical transformation for spectral data and is
designed to remove multiplicative error and preserve the
linear relationship between the spectral signal and sample
concentration (Barnes et al. 1989; Rinnan et al. 2009).
Model development
A partial least squares regression (PLSR) model was
developed using the entire spectral region from 303–1901 cm�1 to predict patient ABI. The PLSR algorithm
combines techniques used in principal component analy-
sis (PCA) and multiple linear regression and attempts to
quantify the strength of the relationship between the
response variable and a set of predictor variables (Geladi
and Kowalski 1986). PLSR searches for principal compo-
nents (called factors) that are orthogonal to each other
and tries to relate them to the response variable. The vari-
ation present in the response variable can be summarized
into a few PLS factors. The first PLS factors that explain
the most variance in the data can then be used to build a
regression model. An analysis of the b-coefficients on the
partial least squares regression model can identify which
Raman shifts had the most weight in the predictive PLSR
model. A full cross-validation procedure (a common sta-
tistical analysis technique for estimating model perfor-
mance) was performed on the data set to evaluate the
performance of the predictive model. Cross-validation is a
standard multivariate statistical technique often used on
small data sets to validate a model, assess stability, and
determine how well it will perform on future data sets
(Hastie et al. 2009). The cross-validation technique
Table 1. Demographics of patients with peripheral arterial disease
and control patients.
Control Claudication CLI
Number of subjects 5 5 5
Mean age
(years) � SD
63.2 � 6.02 67.8 � 9.58 58.4 � 2.82
Ankle Brachial
Index (ABI)
1.06 � 0.03 0.55 � 0.03 0.19 � 0.06
CLI, critical limb ischemia.
ª 2014 The Authors. Physiological Reports published by Wiley Periodicals, Inc. on behalf ofthe American Physiological Society and The Physiological Society.
2014 | Vol. 2 | Iss. 9 | e12148Page 3
K. Cluff et al. Raman Spectral Biomarkers of PAD Muscle

rotates the membership of the samples (during training)
to ensures that the results are not membership dependent
(i.e., training group and validation group) and to ensure
that the model is not overfitting the data.
In addition to the PLSR model, a discriminant model
was developed as well using the PLS factor scores from
the PLSR model to classify patients as control, claudicat-
ing, or CLI. The use of discriminant analysis in combina-
tion with PLS factor scores is a common multivariate
statistical method to establish a mathematical rule that
separates two or more classes from each other (Fisher
1936; Anderson 1984). Once the discriminant model has
been derived, it can be used to classify new observations
(Johnson and Wichern 2007). The discriminant model
performance was evaluated with a full cross-validation
procedure as well.
Results
Surface-enhanced Raman spectroscopy
Figure 2 shows the difference between standard Raman
spectroscopy (n = 143 myofibers mounted on glass slides
from two control and two PAD tissue specimens) and
SERS (n = 150 myofibers mounted on nanostructured
gold-slides from two control and two PAD tissue speci-
mens). The Raman effect deals with the inelastic scatter-
ing of light, resulting in a scattered photon that has a
shift in frequency from that of the excitation laser. In
general, Raman scattering produces a very weak signal
due to the fact that only a small fraction, approximately 1
in 10 million, of photons exhibit the Raman effect. SERS
is a surface-sensitive technique that can enhance the
Raman signal by 10 fold (Sharma et al. 2012). From Fig-
ure 2, it is readily apparent that SERS enhances the spec-
tral signature of myofibers mounted on nanostructured
gold-slides when compared to myofibers mounted on
glass slides. The tissue mounted on the nanostructured
gold-slides produced sharper and more intense Raman
peaks. Hence, all further analyses were performed based
on the tissue specimens mounted on gold-slides for SERS.
Partial least squares regression anddiscriminant analysis
Figure 3 presents the averaged baseline-corrected SNV
SERS for control, claudicating, and CLI patient speci-
mens, which were used to develop the PLSR model.
Nearly all of the variance (99%) in the response variable
(patient ABI) was accounted for by the first six PLS fac-
A B
Figure 1. (A) Raman spectra were baseline corrected using a 5th order polynomial with the Vancouver Raman algorithm. (B) The extracted
Raman signal after baseline correction.
Figure 2. Surface-enhanced Raman spectroscopy (SERS) enhances the spectral signature of myofibers mounted on nanostructured gold-slides
when compared to myofibers mounted on glass slides.
2014 | Vol. 2 | Iss. 9 | e12148Page 4
ª 2014 The Authors. Physiological Reports published by Wiley Periodicals, Inc. on behalf of
the American Physiological Society and The Physiological Society.
Raman Spectral Biomarkers of PAD Muscle K. Cluff et al.

tors, as shown in Figure 4. Using the first six PLS factors,
the PLSR model was trained and the predictive perfor-
mance was evaluated using a full cross-validation proce-
dure. The PLSR model was able to predict patient ABIs
with a correlation coefficient of 0.99 during training and
a correlation coefficient of 0.85 using a full cross-valida-
tion, show in Figure 5. The b-coefficients for the PLSR
model are presented in Figure 6, which can be used to
identify key wavenumbers that influence the PLSR model.
Further, a plot of the first three PLS factor scores
(Fig. 7) displays clear separation of controls, claudicating,
and CLI patients. When using the first three PLS factor
scores in combination with linear discriminant analysis a
discriminant model is able to correctly classify the con-
trol, claudicating, and CLI patients with 100% accuracy.
Evaluating the discriminant model performance and sta-
bility using a cross-validation procedure also yielded
100% accuracy in patient classification. Table 2 presents
the classification table for the discriminant model cross-
validation results. The combination of PLS factors 1 and
2 (Fig. 7A) clearly group and separate control patients
from claudicating and CLI patients, while, PLS factor 3
(Fig. 7B) clearly separates claudicating patients from CLI
patients.
Discussion
Raman spectroscopy is a powerful optical tool capable of
detecting biochemical composition within biological tis-
sue, without the use of labeling procedures. In this study,
we have demonstrated that Raman spectroscopy is capa-
ble of predicting the ABIs and disease stage of PAD
patients based on the biochemical fingerprint of their gas-
trocnemius. The PLSR model was able to correlate Raman
spectral information with patient ABIs with a high level
of correlation (R-value = 0.85). Moreover, when combin-
ing PLS factor scores with discriminant analysis, the
model is able to classify patients with 100% accuracy. To
our knowledge, this is the first study to produce a Raman
spectral profile of human PAD muscle. Further, very few
studies, using other techniques, have been able to corre-
late patient ABIs with biochemical biomarkers in the
serum or the ischemic limbs of PAD patients (Brevetti
et al. 2006; Daskalopoulou et al. 2008; Anderson et al.
2009; Syv€anen et al. 2011; Weiss et al. 2013). This study
is novel because it uses Raman spectroscopy to produce a
molecular profile of PAD muscle that accurately predicts
patient ABI and clinical presentation in a manner that
has not been done before.
0
20
40
60
80
100
120
0 2 4 6 8 10
Expl
aine
d va
rianc
e (%
)
PLS factors
TrainingCross valida on
Figure 4. Eigenvalues of partial least squares factors. The first six
PLS factors account for most of the variance (>75%).
Figure 3. Average control (CON), claudicating (MOD), and critical limb ischemia (SEV) patient SERS.
ª 2014 The Authors. Physiological Reports published by Wiley Periodicals, Inc. on behalf ofthe American Physiological Society and The Physiological Society.
2014 | Vol. 2 | Iss. 9 | e12148Page 5
K. Cluff et al. Raman Spectral Biomarkers of PAD Muscle
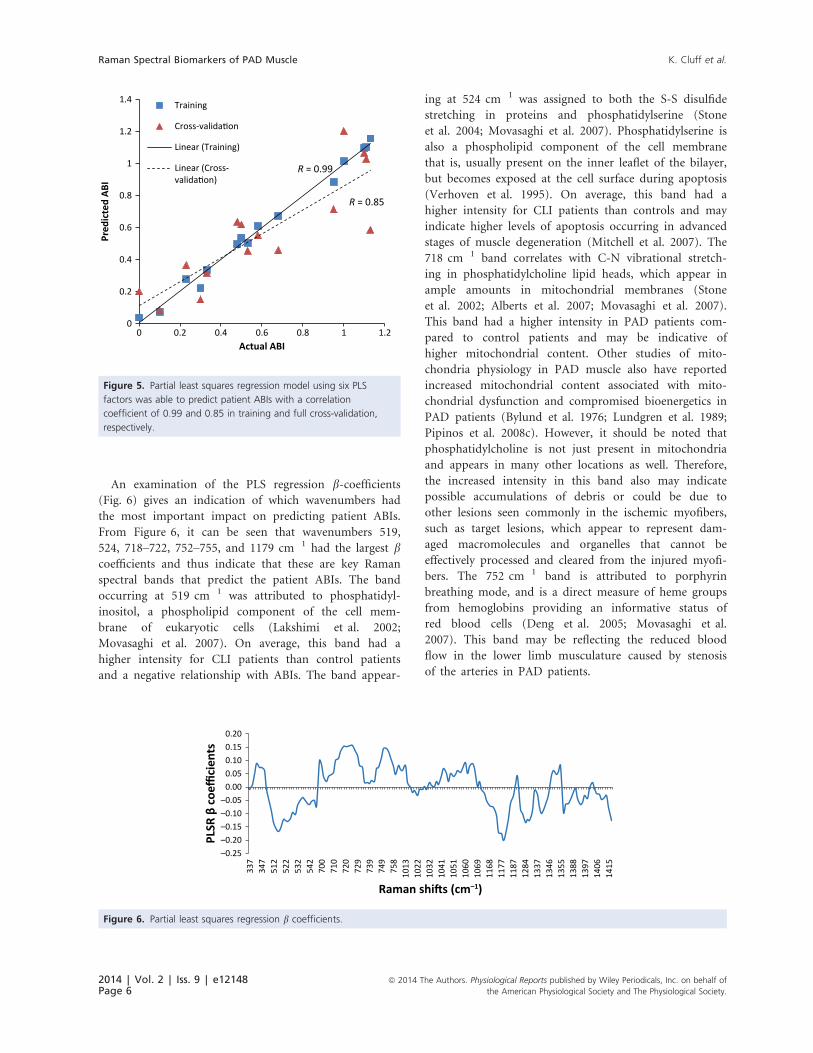
An examination of the PLS regression b-coefficients(Fig. 6) gives an indication of which wavenumbers had
the most important impact on predicting patient ABIs.
From Figure 6, it can be seen that wavenumbers 519,
524, 718–722, 752–755, and 1179 cm�1 had the largest bcoefficients and thus indicate that these are key Raman
spectral bands that predict the patient ABIs. The band
occurring at 519 cm�1 was attributed to phosphatidyl-
inositol, a phospholipid component of the cell mem-
brane of eukaryotic cells (Lakshimi et al. 2002;
Movasaghi et al. 2007). On average, this band had a
higher intensity for CLI patients than control patients
and a negative relationship with ABIs. The band appear-
ing at 524 cm�1 was assigned to both the S-S disulfide
stretching in proteins and phosphatidylserine (Stone
et al. 2004; Movasaghi et al. 2007). Phosphatidylserine is
also a phospholipid component of the cell membrane
that is, usually present on the inner leaflet of the bilayer,
but becomes exposed at the cell surface during apoptosis
(Verhoven et al. 1995). On average, this band had a
higher intensity for CLI patients than controls and may
indicate higher levels of apoptosis occurring in advanced
stages of muscle degeneration (Mitchell et al. 2007). The
718 cm�1 band correlates with C-N vibrational stretch-
ing in phosphatidylcholine lipid heads, which appear in
ample amounts in mitochondrial membranes (Stone
et al. 2002; Alberts et al. 2007; Movasaghi et al. 2007).
This band had a higher intensity in PAD patients com-
pared to control patients and may be indicative of
higher mitochondrial content. Other studies of mito-
chondria physiology in PAD muscle also have reported
increased mitochondrial content associated with mito-
chondrial dysfunction and compromised bioenergetics in
PAD patients (Bylund et al. 1976; Lundgren et al. 1989;
Pipinos et al. 2008c). However, it should be noted that
phosphatidylcholine is not just present in mitochondria
and appears in many other locations as well. Therefore,
the increased intensity in this band also may indicate
possible accumulations of debris or could be due to
other lesions seen commonly in the ischemic myofibers,
such as target lesions, which appear to represent dam-
aged macromolecules and organelles that cannot be
effectively processed and cleared from the injured myofi-
bers. The 752 cm�1 band is attributed to porphyrin
breathing mode, and is a direct measure of heme groups
from hemoglobins providing an informative status of
red blood cells (Deng et al. 2005; Movasaghi et al.
2007). This band may be reflecting the reduced blood
flow in the lower limb musculature caused by stenosis
of the arteries in PAD patients.
0
0.2
0.4
0.6
0.8
1
1.2
1.4
0 0.2 0.4 0.6 0.8 1 1.2
Pred
icte
d AB
I
Actual ABI
Training
Cross-valida on
Linear (Training)
Linear (Cross-valida on)
R = 0.99
R = 0.85
Figure 5. Partial least squares regression model using six PLS
factors was able to predict patient ABIs with a correlation
coefficient of 0.99 and 0.85 in training and full cross-validation,
respectively.
–0.25–0.20–0.15–0.10–0.05
0.000.050.100.150.20
337
347
512
522
532
542
700
710
720
729
739
749
758
1013
1022
1032
1041
1051
1060
1069
1168
1177
1187
1284
1337
1346
1355
1388
1397
1406
1415
PLSR
β c
oeffi
cien
ts
Raman shi s (cm–1)
Figure 6. Partial least squares regression b coefficients.
2014 | Vol. 2 | Iss. 9 | e12148Page 6
ª 2014 The Authors. Physiological Reports published by Wiley Periodicals, Inc. on behalf of
the American Physiological Society and The Physiological Society.
Raman Spectral Biomarkers of PAD Muscle K. Cluff et al.

Other prominent bands occurring at 1546 cm�1 and
1688 cm�1 are attributed to the reduced form of nicotin-
amide adenine dinucleotide (NADH; Deng et al. 1989).
The Raman scattering band occurring at 1032 cm�1 is
attributed to the oxidized form of NAD+ (Yue et al. 1986).
Based on the Raman spectra (Fig. 3), controls had higher
intensities in NADH bands (1546 and 1688 cm�1) com-
pared to PAD patients. This suggests that PAD patients
have reduced levels of NADH and increased levels of
NAD+. NADH is an essential coenzyme, within the mito-
chondria, and a key participant in the oxidative phosphor-
ylation process. The NAD:NADH ratio plays an important
role in the regulation of the intracellular redox state and is
considered as an indicator of the metabolic state of the cell
(Lin and Guarente 2003). Many metabolic pathways, espe-
cially the glycolytic and tricarboxylic acid pathways, have
enzymes that are regulated by the NAD:NADH ratio (Bel-
enky et al. 2007). Furthermore, cellular respiration studies
indicate that increased production of ROS is linked to oxi-
–0.8
–0.6
–0.4
–0.2
0
0.2
0.4
0.6
0.8
1
–4 –3 –2 –1 0 1 2 3 4
PLS
fact
or 2
PLS factor 1
Controls
Claudica ng
CLI
–0.8
–0.6
–0.4
–0.2
0
0.2
0.4
0.6
0.8
–4 –3 –2 –1 0 1 2 3 4
PLS
fact
or 3
PLS factor 1
Controls
Claudica ng
CLI
A
B
Figure 7. PLS factor scores plot. (A) PLS 1 and 2 grouped and separated control patients from claudicating and critical limb ischemia (CLI)
patients. (B) PLS 1 and 3 separated claudicating and CLI patients. These three PLS factors in a discriminant analysis with cross-validation,
classified patients with 100% accuracy.
Table 2. Patient classification with a discriminant model and
cross-validation results.
Predicted membership
Accuracy %Control Claudication CLI Total
Actual membership
Control 5 0 0 5 100
Claudication 0 5 0 5 100
CLI 0 0 5 5 100
Total 5 5 10 15 100
CLI, critical limb ischemia.
ª 2014 The Authors. Physiological Reports published by Wiley Periodicals, Inc. on behalf ofthe American Physiological Society and The Physiological Society.
2014 | Vol. 2 | Iss. 9 | e12148Page 7
K. Cluff et al. Raman Spectral Biomarkers of PAD Muscle

dation of NADH to NAD+ (Zuo and Clanton 2005; Srira-
moju et al. 2008). The finding therefore, of an increased
NAD:NADH ratio in PAD samples is likely reflective of a
compromised metabolic and redox state in the PAD mus-
cle (Pipinos et al. 2006; Makris et al. 2007; Weiss et al.
2013) and the particular band could be used as a Raman
spectral biomarker of altered energy metabolism and oxi-
dative stress in PAD limb musculature.
Raman scattering band observed at 1602 cm�1 has been
associated with human mitochondria (Huang et al. 2004;
Pully and Otto 2009). Figure 3, shows that PAD patients
have a higher 1602 cm�1 band than control patients and
suggests higher mitochondrial content in PAD patients.
Again this is in agreement with other PAD studies that
have demonstrated that PAD muscle has increased mito-
chondrial content (Brass and Hiatt 2000; Pipinos et al.
2008b). Although there is an increase in mitochondrial
content in PAD muscle, respiration or oxidative phos-
phorylation is still lower when compared to the controls
due to mitochondrial dysfunction (Makris et al. 2007;
Pipinos et al. 2008b). Mitochondrial dysfunction can pro-
duce reactive oxygen species, which in turn could damage
the phospholipid mitochondrial membrane system.
Although this study presents spectral biomarkers that
are in agreement with other PAD studies, this study does
have limitations. This study was performed using a small
sample set of only 15 patients and its results should be
further validated with a larger data set. As the severity of
PAD progresses in the effected limb, there are likely to be
intermediate states which may not have been captured in
this study due to the sample size. These intermediate
states could lead to misclassifications, thus decreasing the
accuracy of the model, although the current results are
promising. Likewise, only a cross-validation procedure
was implemented to assess the stability of the model as
opposed to a true validation. A true validation on a new
and larger data set will better ensure the accuracy of the
model. Finally, the Raman spectral signal is a complicated
mixed biochemical profile that can be difficult to inter-
pret. Researchers have developed Raman spectral libraries
of biological tissues to aid in the interpretation of Raman
spectra (Movasaghi et al. 2007). However, the interpreta-
tion should be validated with controlled studies that vary
concentration of the molecule and validate that the spec-
tral peak changes accordingly. Therefore, further bio-
chemical analysis should be performed to isolate and
validate the presence of the suspected biochemical profile
of PAD muscle tissue.
Perspectives and significance
In this study, we have demonstrated that Raman spectros-
copy is a powerful bioanalytical tool that identified bio-
chemical-based signatures unique to ischemic muscle.
These signals predicted compromised hemodynamics in
the legs of PAD patients and severity of clinical disease.
Raman spectroscopy provides novel spectral biomarkers
that may complement existing diagnostic and treatment
monitoring methods for patients with PAD. Confirmation
of the specificity and sensitivity of these spectral biomar-
kers may lead to novel techniques that can monitor PAD
progression in the affected legs of patients by providing
information that reflects the underlying pathophysiology
and allows the development of individualized therapy.
The long-term goal of this research is the noninvasive, in
vivo and in situ, quantification of progression or regres-
sion in PAD muscle degeneration as that would facilitate
patient-specific care and would have the greatest impact
on disease management.
Acknowledgments
The authors gratefully acknowledge Stanley Swanson and
Karen Dulany from the University of Nebraska Medical
Center for preparing tissue biopsy samples.
Conflict of Interest
None declared.
References
Afseth, N. K., V. H. Segtnan, and J. P. Wold. 2006. Raman
spectra of biological samples: a study of preprocessing
methods. Appl. Spectrosc. 60:1358–1367.
Alberts, B., A. Johnson, J. Lewis, M. Raff, K. Roberts, and
P. Walter, eds. 2007. Molecular biology of the cell. Garland
Science, New York, NY.
Anderson, T. W. 1984. An introduction to multivariate
statistical analysis. John Wiley & Sons, New York, NY.
Anderson, J. D., F. H. Epstein, C. H. Meyer, K. D. Hagspiel,
H. Wang, S. S. Berr, et al. 2009. Multifactorial determinants
of functional capacity in peripheral arterial disease:
uncoupling of calf muscle perfusion and metabolism. J. Am.
Coll. Cardiol. 54:628–635.
Barnes, R. J., M. S. Dhanoa, and J. L. Susan. 1989. Standard
normal variate transformation and de-trending of
near-infrared diffuse reflectance spectra. Appl. Spectrosc.
43:772–777.
Beier, B. D., and A. J. Berger. 2009. Method for automated
background subtraction from Raman spectra containing
known contaminants. Analyst 134:1198–1202.
Belenky, P., K. L. Bogan, and C. Brenner. 2007. NAD+metabolism in health and disease. Trends Biochem. Sci.
32:12–19.
Berger, J. S., and W. R. Hiatt. 2012. Medical therapy in
peripheral artery disease. Circulation 126:491–500.
2014 | Vol. 2 | Iss. 9 | e12148Page 8
ª 2014 The Authors. Physiological Reports published by Wiley Periodicals, Inc. on behalf of
the American Physiological Society and The Physiological Society.
Raman Spectral Biomarkers of PAD Muscle K. Cluff et al.

Bonifacia, A., C. Beleites, F. Vittur, E. Marsich, S. Semeraro,
S. Paoletti, et al. 2010. Chemical imaging of aticular
cartilage sections with Raman mapping, employing uni- and
multi-variate methods for data analysis. Analyst 135:3193–
3204.
Bonnier, F., P. Knief, B. Lim, A. D. Meade, J. Dorney,
K. Bhattacharya, et al. 2010. Imaging live cells grown on a
three dimensional collagen matrix using Raman
microspectroscopy. Analyst 135:3169–3177.
Brass, E., and W. Hiatt. 2000. Acquired skeletal muscle
metabolic myopathy in atherosclerotic peripheral arterial
disease. Vasc. Med. 5:55–59.
Brass, E. P., W. R. Hiatt, and S. Green. 2004. Skeletal muscle
metabolic changes in peripheral arterial disease contribute to
exercise intolerance: a point-counterpoint discussion. Vasc.
Med. 9:293–301.
Brevetti, G., V. Schiano, G. Sirico, G. Giugliano,
E. Laurenzano, and M. Chiariello. 2006. Metabolic
syndrome in peripheral arterial disease: relationship with
severity of peripheral circulatory insufficiency, inflammatory
status, and cardiovascular comorbidity. J. Vasc. Surg.
44:101–107.
Brevetti, G., G. Giugliano, L. Brevetti, and W. R. Hiatt. 2010.
Inflammation in peripheral artery disease. Circulation
122:1862–1875.
Bylund, A. C., J. Hammarsten, J. Holm, and T. Scherst�en.
1976. Enzyme activities in skeletal muscles from patients
with peripheral arterial insufficiency. Eur. J. Clin. Invest.
6:425–429.
Cluff, K., D. Miserlis, G. K. Naganathan, I. I. Pipinos,
P. Koutakis, A. Samal, et al. 2013. Morphometric analysis of
gastrocnemius muscle biopsies from patients with peripheral
arterial disease: objective grading of muscle degeneration.
Am. J. Physiol. Regul. Integr. Comp. Physiol. 305:R291–R299.
Daskalopoulou, S. S., M. Pathmarajah, S. K. Kakkos,
M. E. Daskalopoulos, P. Holloway, D. P. Mikhailidis, et al.
2008. Association between ankle-brachial index and risk
factor profile in patients newly diagnosed with intermittent
claudication. Circ. J. 72:441–448.
Deng, H., J. Zheng, D. Sloan, J. Burgner, and R. Callender.
1989. Classical Raman spectroscopic studies of NADH and
NAD+ bound to lactate dehydrogenase by difference
techniques. Biochemistry 28:1525–1533.
Deng, J. L., Q. Wei, M. H. Zhang, Y. Z. Wang, and Y. Q. Li.
2005. Study of the effect of alcohol on single human red
blood cells using near-infrared laser tweezers Raman
spectroscopy. J. Raman Spectrosc. 36:257–261.
Fisher, R. A. 1936. The use of multiple measurements in
taxonomic problems. Ann. Eugen. 7:179–188.
Geladi, P., and B. R. Kowalski. 1986. Partial least-squares
regression: a tutorial. Anal. Chim. Acta 185:1–17.
Hanlon, E. B., R. Manoharan, T. W. Koo, K. E. Shafer,
J. T. Motz, M. Fitzmaurice, et al. 2000. Prospects for in vivo
Raman spectroscopy. Phys. Med. Biol. 45:R1–R59.
Hastie, T., R. Tibshirani, and J. Friedman. 2009. P. 745 in The
elements of statistical learning: data mining, inference, and
prediction. 2nd edn. Springer, New York, NY.
Hedberg, B., K. Angquist, and M. Sjostrom. 1988. Peripheral
arterial insufficiency and the fine structure of the
gastrocnemius muscle. Int. Angiol. 7:50–59.
Hiatt, W. R., A. Zakharyan, E. T. Fung, G. Crutcher, A. Smith,
C. Stanford, et al. 2012. A validated biomarker panel to
identify peripheral artery disease. Vasc. Med. 17:386–393.
Huang, Y., T. Karashima, M. Yamamoto, T. Ogura, and
H. Hamaguchi. 2004. Raman spectroscopic signature of life
in a living yeast cell. J. Raman Spectrosc. 35:525–526.
Johnson, R., and D. Wichern. 2007. Applied multivariate
statistical analysis. Pearson Prentice Hall, Upper Saddle
River, NJ.
Kirsch, M., G. Schackert, R. Salzer, and C. Krafft. 2010. Raman
spectroscopic imaging for in vivo detection of cerebral brain
metastases. Anal. Bioanal. Chem. 398:1707–1713.
Koljenovic, S., T. C. B. Schut, J. P. Meerbeeck, A. Maat,
S. A. Burgers, P. E. Zondervan, et al. 2004. Raman
microspectroscopic mapping studies of human bronchial
tissue. J. Biomed. Opt. 9:1187–1197.
Lakshimi, R. J., V. B. Kartha, C. M. Krishna, J. G. R. Solomon,
G. Ullas, and P. Uma Devi. 2002. Tissue Raman
spectroscopy for the study of radiation damage: brain
irradiation of mice. Radiat. Res. 157:175–182.
Lieber, C. A., and A. Mahadevan-Jansen. 2003. Automated
method for subtraction of fluorescence from biological
Raman spectra. Appl. Spectrosc. 57:1363–1367.
Lin, S., and L. Guarente. 2003. Nicotinamide adenine
dinucleotide, a metabolic regulator of transcription,
longevity and disease. Curr. Opin. Cell Biol. 15:241–246.
Lundgren, F., A. G. Dahll€of, T. Scherst�en, and
A. C. Bylund-Fellenius. 1989. Muscle enzyme adaptation in
patients with peripheral arterial insufficiency: spontaneous
adaptation, effect of different treatments and consequences
on walking performance. Clin. Sci. (Lond.) 77:485–493.
Mahoney, E. M., K. Wang, D. J. Cohen, A. T. Hirsch,
M. J. Alberts, K. Eagle, et al. 2008. One-year costs in patients
with a history of or at risk for atherothrombosis in the
United States. Circ. Cardiovasc. Qual. Outcomes 1:38–45.
Mahoney, E. M., K. Wang, H. H. Keo, S. Duval, K. G.
Smolderen, D. J. Cohen, et al. 2010. Vascular hospitalization
rates and costs in patients with peripheral artery disease in
the United States. Circ. Cardiovasc. Qual. Outcomes 3:642–
651.
Makris, K. I., A. A. Nella, Z. Zhu, S. A. Swanson, G. P. Casale,
T. L. Gutti, et al. 2007. Mitochondriopathy of peripheral
arterial disease. Vascular 15:336–343.
McDermott, M. M., P. Greenland, J. M. Guralnik, L. Ferrucci,
D. Green, K. Liu, et al. 2004. Inflammatory markers,
D-dimer, pro-thrombotic factors, and physical activity levels
in patients with peripheral arterial disease. Vasc. Med.
9:107–115.
ª 2014 The Authors. Physiological Reports published by Wiley Periodicals, Inc. on behalf ofthe American Physiological Society and The Physiological Society.
2014 | Vol. 2 | Iss. 9 | e12148Page 9
K. Cluff et al. Raman Spectral Biomarkers of PAD Muscle

Miljkovi�c, M., T. Chernenko, M. J. Romeo, B. Bird,
C. Matth€aus, and M. Diem. 2010. Label-free imaging of
human cells: algorithms for image reconstruction of Raman
hyperspectral datasets. Analyst 135:2002–2013.
Mitchell, R. G., B. D. Duscha, J. L. Robbins, S. I. Redfern,
J. Chung, D. R. Bensimhon, et al. 2007. Increased levels of
apoptosis in gastrocnemius skeletal muscle in patients with
peripheral arterial disease. Vasc. Med. 12:285–290.
Movasaghi, Z., S. Rehman, and I. U. Rehman. 2007. Raman
spectroscopy of biological tissues. Appl. Spectrosc. Rev.
42:493–541.
Nijssen, A., T. C. B. Schut, F. Heule, P. J. Caspers,
D. P. Hayes, M. H. A. Neumann, et al. 2002. Discriminating
basal cell carcinoma from its surrounding tissue by Raman
spectroscopy. J. Invest. Dermatol. 119:64–69.
Pipinos, I. I., A. R. Judge, Z. Zhu, J. T. Selsby, S. A. Swanson,
J. M. Johanning, et al. 2006. Mitochondrial defects and
oxidative damage in patients with peripheral arterial disease.
Free Radic. Biol. Med. 41:262–269.
Pipinos, I. I., A. R. Judge, J. T. Selsby, Z. Zhu, S. A. Swanson,
A. A. Nella, et al. 2008a. The myopathy of peripheral
arterial occlusive disease: part 1. Functional and
histomorphological changes and evidence for mitochondrial
dysfunction. Vasc. Endovascular Surg. 41:481–489.
Pipinos, I. I., S. A. Swanson, Z. Zhu, A. A. Nella, D. J.
Weiss, T. L. Gutti, et al. 2008b. Chronically ischemic
mouse skeletal muscle exhibits myopathy in association
with mitochondrial dysfunction and oxidative damage.
Am. J. Physiol. Regul. Integr. Comp. Physiol. 295:R290–
R296.
Pipinos, I. I., A. Judge, J. Selsby, Z. Zhen, S. Swanson, A.
Nella, et al. 2008c. Basic science review: the myopathy of
peripheral arterial occlusive disease: part 2. Oxidative stress,
neuropathy, and shift in muscle fiber type. Vasc.
Endovascular Surg. 42:101–112.
Pully, V. V., and C. Otto. 2009. The intensity of the
1602 cm�1 band in human cells is related to mitochondrial
activity. J. Raman Spectrosc. 40:473–475.
Rinnan, �A., F. V. D. Berg, and S. B. Engelsen. 2009. Review of
the most common pre-processing techniques for
near-infrared spectra. Trends Anal. Chem. 28:1201–1222.
Roger, V. L., A. S. Go, D. M. Lloyd-Jones, R. J. Adams,
J. D. Berry, T. M. Brown, et al. 2011. Heart disease and
stroke statistics–2011 update: a report from the American
Heart Association. Circulation 123:e18–e209.
Sharma, B., R. R. Frontiera, A. Henry, E. Ringe, and R. P. Van
Duyne. 2012. SERS: materials, applications, and the future.
Mater. Today 15:16–25.
Sriramoju, V., A. Alimova, R. Chakraverty, A. Katz, S. K.
Gayen, L. Larsson, et al. 2008. Raman spectroscopic study of
acute oxidative stress induced changes in mice skeletal
muscles. Proc. SPIE 6853:685315-1–685315-4.
Stone, N., C. Kendell, N. Shepherd, P. Crow, and H. Barr.
2002. Near-infrared Raman spectroscopy for the
classification of epithelial pre-cancers and cancers. J. Raman
Spectrosc. 33:564–573.
Stone, N., C. Kendall, J. Smith, P. Crow, and H. Barr. 2004.
Raman spectroscopy for identification of epithelial cancers.
Faraday Discuss. 126:141–157.
Syv€anen, K., P. Korhonen, P. Jaatinen, T. Vahlberg, and
P. Aarnio. 2011. High-sensitivity C-reactive protein and
Ankle Brachial Index in a Finnish cardiovascular risk
population. Int. J. Angiol. 20:43–48.
Verhoven, B., R. A. Schlegel, and P. Williamson. 1995.
Mechanisms of phosphatidylserine exposure, a phagocyte
recognition signal, on apoptotic T lymphocytes. J. Exp.
Med. 182:1597–1601.
Weiss, D. J., G. P. Casale, P. Koutakis, A. A. Nella,
S. A. Swanson, Z. Zhu, et al. 2013. Oxidative damage and
myofiber degeneration in the gastrocnemius of patients with
peripheral arterial disease. J. Transl. Med. 11:230.
Yue, K. T., C. L. Martin, D. Chen, P. Nelson, D. L. Sloan, and
R. Callender. 1986. Raman spectroscopy of oxidized and
reduced nicotinamide adenine dinucleotides. Biochemistry
25:4941–4947.
Zhao, J., H. Lui, D. I. McLean, and H. Zeng. 2007. Automated
autofluorescence background subtraction algorithm for
biomedical Raman spectroscopy. Appl. Spectrosc. 61:1225–
1232.
Zuo, L., and T. L. Clanton. 2005. Reactive oxygen species
formation in the transition to hypoxia in skeletal muscle.
Am. J. Physiol. Cell Physiol. 289:C207–C216.
2014 | Vol. 2 | Iss. 9 | e12148Page 10
ª 2014 The Authors. Physiological Reports published by Wiley Periodicals, Inc. on behalf of
the American Physiological Society and The Physiological Society.
Raman Spectral Biomarkers of PAD Muscle K. Cluff et al.
Copyright © 2022 FDOKUMEN