Surface diurnal cycle and boundary layer structure over Rondônia during the rainy season
16
Surface diurnal cycle and boundary layer structure over Rondo ˆnia during the rainy season Alan K. Betts, 1 Jose D. Fuentes, 2 Michael Garstang, 2 and John H. Ball 1 Received 9 January 2001; revised 6 September 2001; accepted 11 September 2001; published 6 September 2002. [1] An integrated data set with simultaneous observations at the surface, from tethered balloons within the boundary layer and from rawinsonde ascents, was collected during the wet season experiment of the Large-Scale Biosphere-Atmosphere (LBA) Experiment in Amazonia during January and February of 1999 in support of the ground validation for the Tropical Rainfall Measuring Mission (TRMM). We analyze the surface diurnal cycles of temperature, humidity, lifting condensation level, equivalent potential temperature, andbx64the surface fluxes of sensible and latent heat, ground heat flux and net radiation, for easterly and westerly wind regimes in the lower troposphere. During the easterly wind regimes, the diurnal evolution of mixing ratio shows that the flux of water vapor through cloud base exceeds the large surface evaporation. There is a trend toward a wetter and cooler subcloud layer as the rainy season progresses. Daytime surface Bowen ratio for this pasture site is about 0.4, and falls slightly as the rainy season progresses. Typically in the afternoon, evaporatively driven downdrafts from convective rainbands transform the boundary layer. The fall of equivalent potential temperature in the boundary layer is similar for both regimes, but the boundary layer cooling by convective events during the westerly regimes is reduced, because the subcloud layer is shallower on average. Tethersonde ascents through the edges of gust fronts show that subcloud air is first cooled and moistened by rainfall evaporation before the arrival of downdraft air at the surface. These measurements provide a detailed observational basis for the validation and improvement of parameterizations for shallow and deep convection in numerical forecast models. INDEX TERMS: 3322 Meteorology and Atmospheric Dynamics: Land/atmosphere interactions; 3374 Meteorology and Atmospheric Dynamics: Tropical meteorology; 3314 Meteorology and Atmospheric Dynamics: Convective processes; 3307 Meteorology and Atmospheric Dynamics: Boundary layer processes; KEYWORDS: tropical convection, diurnal cycle, boundary layer processes, surface fluxes, Amazonia Citation: Betts, A. K., J. D. Fuentes, M. Garstang, and J. H. Ball, Surface diurnal cycle and boundary layer structure over Rondo ˆnia during the rainy season, J. Geophys. Res., 107, 8065, doi:10.1029/2001JD000356, 2002. 1. Introduction [2] During the rainy season of January and February of 1999, two campaigns were conducted in Rondo ˆ nia as part of the Large-Scale Biosphere-Atmosphere Experiment in Ama- zonia (LBA). One was called the Wet season Atmospheric Mesoscale Campaign (WETAMC), and the second was a ground validation study for the Tropical Rainfall Measuring Mission (TRMM). The collocation at several sites of surface flux and micrometeorological instrumentation, a boundary layer tethersonde and rawinsonde system within a Doppler radar network with associated raingage networks, afforded an excellent opportunity to study the interaction of the boundary layer with convection over land in the deep tropics as well as the structure of deep convection [Cifelli et al., 2002; Pereira Filho et al., 2002; Silva Dias et al., 2002a, 2002b]. This paper documents the key processes seen in Rondo ˆnia at one of the LBA/TRMM validation sites from the perspective of the land-surface-atmosphere interaction. This paper focuses on an observational perspective. One of our interests in LBA is to use observational analyses to improve the representation of both the land-surface, boun- dary layer (BL) and convective processes in global forecast models. The diurnal cycle of the BL over land in the tropics depends as much on the coupling between subcloud and cloud layers, as it does on the fluxes of sensible and latent heat at the surface-atmosphere interface. Mixing ratio and the equivalent potential temperature (or entropy) of air below cloud base are strongly regulated by the upward and downward transports by clouds, because the tropical atmosphere is nearly neutral (or even unstable) with respect to moist convection [e.g., Riehl, 1979]. [3] We will show how the diurnal cycle gives insight into these vertical transport processes by both shallow cumulus and precipitation convection, and the transition between the two, which occurs on most days near noon in Rondo ˆnia. Describing the thermodynamic and kinematic characteris- tics of the lower troposphere preceding, during, and after JOURNAL OF GEOPHYSICAL RESEARCH, VOL. 107, NO. D20, 8065, doi:10.1029/2001JD000356, 2002 1 Atmospheric Research, Pittsford, Vermont, USA. 2 Department of Environmental Sciences, University of Virginia, Charlottesville, Virginia, USA. Copyright 2002 by the American Geophysical Union. 0148-0227/02/2001JD000356$09.00 LBA 32 - 1
-
Upload
independent -
Category
Documents
-
view
1 -
download
0
Transcript of Surface diurnal cycle and boundary layer structure over Rondônia during the rainy season
Surface diurnal cycle and boundary layer structure over Rondonia
during the rainy season
Alan K. Betts,1 Jose D. Fuentes,2 Michael Garstang,2 and John H. Ball1
Received 9 January 2001; revised 6 September 2001; accepted 11 September 2001; published 6 September 2002.
[1] An integrated data set with simultaneous observations at the surface, from tetheredballoons within the boundary layer and from rawinsonde ascents, was collected during thewet season experiment of the Large-Scale Biosphere-Atmosphere (LBA) Experiment inAmazonia during January and February of 1999 in support of the ground validation forthe Tropical Rainfall Measuring Mission (TRMM). We analyze the surface diurnal cyclesof temperature, humidity, lifting condensation level, equivalent potential temperature,andbx64the surface fluxes of sensible and latent heat, ground heat flux and net radiation,for easterly and westerly wind regimes in the lower troposphere. During the easterly windregimes, the diurnal evolution of mixing ratio shows that the flux of water vapor throughcloud base exceeds the large surface evaporation. There is a trend toward a wetter andcooler subcloud layer as the rainy season progresses. Daytime surface Bowen ratio for thispasture site is about 0.4, and falls slightly as the rainy season progresses. Typically in theafternoon, evaporatively driven downdrafts from convective rainbands transform theboundary layer. The fall of equivalent potential temperature in the boundary layer issimilar for both regimes, but the boundary layer cooling by convective events during thewesterly regimes is reduced, because the subcloud layer is shallower on average.Tethersonde ascents through the edges of gust fronts show that subcloud air is first cooledand moistened by rainfall evaporation before the arrival of downdraft air at the surface.These measurements provide a detailed observational basis for the validation andimprovement of parameterizations for shallow and deep convection in numerical forecastmodels. INDEX TERMS: 3322 Meteorology and Atmospheric Dynamics: Land/atmosphere interactions;
3374 Meteorology and Atmospheric Dynamics: Tropical meteorology; 3314 Meteorology and Atmospheric
Dynamics: Convective processes; 3307 Meteorology and Atmospheric Dynamics: Boundary layer processes;
KEYWORDS: tropical convection, diurnal cycle, boundary layer processes, surface fluxes, Amazonia
Citation: Betts, A. K., J. D. Fuentes, M. Garstang, and J. H. Ball, Surface diurnal cycle and boundary layer structure over Rondonia
during the rainy season, J. Geophys. Res., 107, 8065, doi:10.1029/2001JD000356, 2002.
1. Introduction
[2] During the rainy season of January and February of1999, two campaigns were conducted in Rondonia as part ofthe Large-Scale Biosphere-Atmosphere Experiment in Ama-zonia (LBA). One was called the Wet season AtmosphericMesoscale Campaign (WETAMC), and the second was aground validation study for the Tropical Rainfall MeasuringMission (TRMM). The collocation at several sites of surfaceflux and micrometeorological instrumentation, a boundarylayer tethersonde and rawinsonde system within a Dopplerradar network with associated raingage networks, affordedan excellent opportunity to study the interaction of theboundary layer with convection over land in the deep tropicsas well as the structure of deep convection [Cifelli et al.,2002; Pereira Filho et al., 2002; Silva Dias et al., 2002a,
2002b]. This paper documents the key processes seen inRondonia at one of the LBA/TRMM validation sites fromthe perspective of the land-surface-atmosphere interaction.This paper focuses on an observational perspective. One ofour interests in LBA is to use observational analyses toimprove the representation of both the land-surface, boun-dary layer (BL) and convective processes in global forecastmodels. The diurnal cycle of the BL over land in the tropicsdepends as much on the coupling between subcloud andcloud layers, as it does on the fluxes of sensible and latentheat at the surface-atmosphere interface. Mixing ratio andthe equivalent potential temperature (or entropy) of airbelow cloud base are strongly regulated by the upwardand downward transports by clouds, because the tropicalatmosphere is nearly neutral (or even unstable) with respectto moist convection [e.g., Riehl, 1979].[3] We will show how the diurnal cycle gives insight into
these vertical transport processes by both shallow cumulusand precipitation convection, and the transition between thetwo, which occurs on most days near noon in Rondonia.Describing the thermodynamic and kinematic characteris-tics of the lower troposphere preceding, during, and after
JOURNAL OF GEOPHYSICAL RESEARCH, VOL. 107, NO. D20, 8065, doi:10.1029/2001JD000356, 2002
1Atmospheric Research, Pittsford, Vermont, USA.2Department of Environmental Sciences, University of Virginia,
Charlottesville, Virginia, USA.
Copyright 2002 by the American Geophysical Union.0148-0227/02/2001JD000356$09.00
LBA 32 - 1
convective storms is a key requirement to properly model-ing land-surface-atmosphere interactions in global forecastmodeling systems. Cloud resolving models [Tao et al.,1999] are also being used to derive vertical profiles ofdiabatic heating to validate and confirm the heating profilesderived from the TRMM satellite. These cloud resolvingmodels in turn need validation against data for the energyand water vapor fluxes at the surface, through the boundarylayer, and through the entrainment zone. Thus, the goals ofthis study are to document physical processes driving thedynamics of the convective boundary layer and to deriveassociated composites of the thermodynamics of the systemover the continental tropical atmosphere during the rainyseason. In addition, it became quite clear from radar studiesduring the LBA/TRMM/WETAMC [Rutledge et al., 2001;Rickenbach et al., 2002; Peterson et al., 2002], that quitedistinct precipitating convective regimes existed, based onthe lower tropospheric wind field. This suggests that morerefined convective parameterizations may be needed, sincemany that are used in global models represent only a singletype of parameterized convection [e.g., Betts, 1997].[4] The results presented here go beyond previous
convective experiments conducted in the Tropics. Theearly VIMHEX experiments in the rainy season in Ven-ezuela in 1969 and 1972 studied the atmosphere with onlya single rawinsonde, one radar, and primitive surfaceinstrumentation [Betts, 1976a, 1976b, 1998; Betts andSilva Dias, 1979], as did similar experiments over Brazil[Silva Dias and Silva Dias, 1983]. During the AmazonBoundary Layer Experiment (ABLE-2A [Harris et al.,1988]), near Manaus during the July to August 1985 dryseason, the structure and growth of the mixed layer overthe forest were studied using a tethered balloon and anairborne lidar [Martin et al., 1988], as well as surface fluxinstrumentation [Fitzgarrald et al., 1988]. The later dryseason data from the Rondonia Boundary Layer Experi-ment (RBLE) showed large differences between the deepBL over grassland, where evaporation was low, and overforest where evaporation has little seasonal variability[Nobre et al., 1996; G. Fisch et al., Convective boundarylayer over pasture and forest sites in Amazonia, submittedto Journal of Geophysical Research, 2001]. This studyfocuses on the rainy season over Rondonia at the pasturesite (part of the LBA/TRMM data collection), where
complementary instruments were located to measure sur-face fluxes and meteorological variables, BL and atmos-pheric structure within a Doppler radar network.
1.1. Site Description
[5] Our selection and deployment of measurement sys-tems was guided by the need to understand the link betweenthe exchange of energy and moisture at the surface-atmos-phere interface with the deeper atmosphere. The focus ofour investigation was on processes that occurred on theorder of seconds to hours, and on spatial scales rangingfrom few meters to 100 s of kilometers. The data for thisstudy were obtained at a pasture site located near Ouro Pretod’Oeste, Rondonia, Brazil (10�450S, 62�220W; about 30 kmnorthwest of Ji-Parana; see Silva Dias et al. [2002a]) duringthe wet season months of January and February 1999. Thesite is part of a large deforested area (>250 km2) dominatedby a short grass (Brachiaria brizantha) with isolated palmand hardwood trees scattered throughout the landscape. Thelandscape surrounding our measurement site is reasonablyflat and situated south of the forested regions of Amazonia.The unusual experimental set-up for our investigation wasthe colocation of several atmospheric observing systems tostudy processes ranging from turbulence in the atmosphericsurface layer to precipitation systems covering a wideregion.
1.2. Measurement Systems
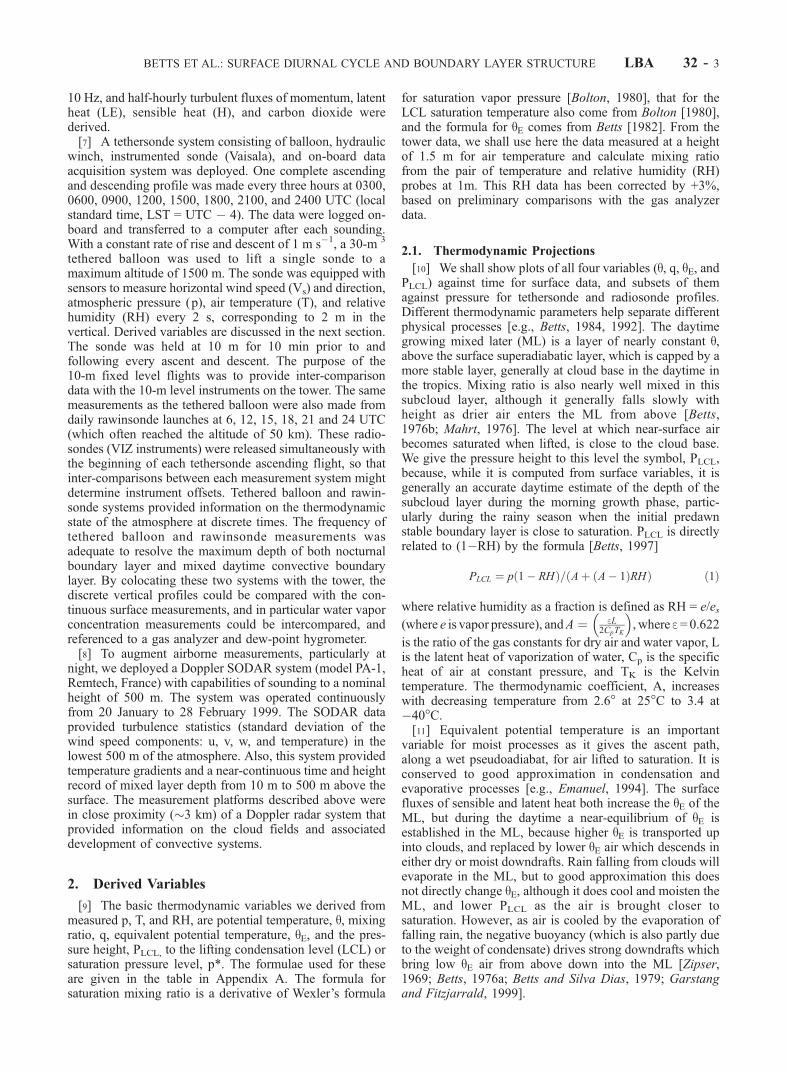
[6] Several complementary measurement systems weredeployed and operated during January to February 1999. A10-m flux tower was placed in the middle of the site tocharacterize the pasture micrometeorology; and the basictower instruments are listed in Table 1. All measurementswere acquired every 2 s, and data loggers (CampbellScientific models 21X and CR7) produced 1-min averages.Rainfall amount and intensity were also recorded. Thecomponents of the local energy balance components weremeasured, including the incoming and outgoing solar andthermal energy fluxes. The soil heat flux from flux plates at5 cm depth was extrapolated to the surface using soiltemperature and a representative thermal capacity for moistsoils (since soil moisture was not measured). An eddycovariance system, and a water vapor and carbon dioxideinfrared gas analyzer made fast-response measurements at
Table 1. Micrometeorological Measurements Made at the Pasture Site
Measurement Level Instrument
Tsoil 1, 5, 20, 50 cm depth ThermocoupleAtmospheric pressure 2 m Pressure transducerTair 0.5, 1.5, 3, 6, 9.5 m Ventilated thermistorTair, RH 1, 6 m Ventilated thermistor/hygristorVapor pressure, CO2 0.5, 1.5, 4, 10 m Gas analyzer (model LI-6262, LiCor)Dew point 6 m Chilled mirror hygrometer (General Eastern)Wind speed, direction 10 m Propeller anemometer (RM Young 05305)Wind speed (u, v, w) 6 m 3-D Sonic anemometer (model K12, Gill)Incoming solar radiation 1.5 m Pyranometer (model PSP, Eppley)Reflected solar radiation 1.5 m Pyranometer (model CM3, Kipp and Zonen)Incoming longwave radiation 1.5 m Pyrgeometer (model CG3, Kipp and Zonen)Outgoing longwave radiation 1.5 m Pyrgeometer (model CG3, Kipp and Zonen)Incoming PAR 1.5 m Quantum sensor (model LI-190SA, LiCor)Outgoing PAR 1.5 m Quantum sensor (model LI-190SA, LiCor)Soil Heat flux 5 cm depth Plates (model 2QS, REBS)Rainfall amount and intensity Ground level Tipping bucket (model TB4, Campbell Scientific)
LBA 32 - 2 BETTS ET AL.: SURFACE DIURNAL CYCLE AND BOUNDARY LAYER STRUCTURE
10 Hz, and half-hourly turbulent fluxes of momentum, latentheat (LE), sensible heat (H), and carbon dioxide werederived.[7] A tethersonde system consisting of balloon, hydraulic
winch, instrumented sonde (Vaisala), and on-board dataacquisition system was deployed. One complete ascendingand descending profile was made every three hours at 0300,0600, 0900, 1200, 1500, 1800, 2100, and 2400 UTC (localstandard time, LST = UTC � 4). The data were logged on-board and transferred to a computer after each sounding.With a constant rate of rise and descent of 1 m s�1, a 30-m 3
tethered balloon was used to lift a single sonde to amaximum altitude of 1500 m. The sonde was equipped withsensors to measure horizontal wind speed (Vs) and direction,atmospheric pressure (p), air temperature (T), and relativehumidity (RH) every 2 s, corresponding to 2 m in thevertical. Derived variables are discussed in the next section.The sonde was held at 10 m for 10 min prior to andfollowing every ascent and descent. The purpose of the10-m fixed level flights was to provide inter-comparisondata with the 10-m level instruments on the tower. The samemeasurements as the tethered balloon were also made fromdaily rawinsonde launches at 6, 12, 15, 18, 21 and 24 UTC(which often reached the altitude of 50 km). These radio-sondes (VIZ instruments) were released simultaneously withthe beginning of each tethersonde ascending flight, so thatinter-comparisons between each measurement system mightdetermine instrument offsets. Tethered balloon and rawin-sonde systems provided information on the thermodynamicstate of the atmosphere at discrete times. The frequency oftethered balloon and rawinsonde measurements wasadequate to resolve the maximum depth of both nocturnalboundary layer and mixed daytime convective boundarylayer. By colocating these two systems with the tower, thediscrete vertical profiles could be compared with the con-tinuous surface measurements, and in particular water vaporconcentration measurements could be intercompared, andreferenced to a gas analyzer and dew-point hygrometer.[8] To augment airborne measurements, particularly at
night, we deployed a Doppler SODAR system (model PA-1,Remtech, France) with capabilities of sounding to a nominalheight of 500 m. The system was operated continuouslyfrom 20 January to 28 February 1999. The SODAR dataprovided turbulence statistics (standard deviation of thewind speed components: u, v, w, and temperature) in thelowest 500 m of the atmosphere. Also, this system providedtemperature gradients and a near-continuous time and heightrecord of mixed layer depth from 10 m to 500 m above thesurface. The measurement platforms described above werein close proximity (�3 km) of a Doppler radar system thatprovided information on the cloud fields and associateddevelopment of convective systems.
2. Derived Variables
[9] The basic thermodynamic variables we derived frommeasured p, T, and RH, are potential temperature, q, mixingratio, q, equivalent potential temperature, qE, and the pres-sure height, PLCL, to the lifting condensation level (LCL) orsaturation pressure level, p*. The formulae used for theseare given in the table in Appendix A. The formula forsaturation mixing ratio is a derivative of Wexler’s formula
for saturation vapor pressure [Bolton, 1980], that for theLCL saturation temperature also come from Bolton [1980],and the formula for qE comes from Betts [1982]. From thetower data, we shall use here the data measured at a heightof 1.5 m for air temperature and calculate mixing ratiofrom the pair of temperature and relative humidity (RH)probes at 1m. This RH data has been corrected by +3%,based on preliminary comparisons with the gas analyzerdata.
2.1. Thermodynamic Projections
[10] We shall show plots of all four variables (q, q, qE, andPLCL) against time for surface data, and subsets of themagainst pressure for tethersonde and radiosonde profiles.Different thermodynamic parameters help separate differentphysical processes [e.g., Betts, 1984, 1992]. The daytimegrowing mixed later (ML) is a layer of nearly constant q,above the surface superadiabatic layer, which is capped by amore stable layer, generally at cloud base in the daytime inthe tropics. Mixing ratio is also nearly well mixed in thissubcloud layer, although it generally falls slowly withheight as drier air enters the ML from above [Betts,1976b; Mahrt, 1976]. The level at which near-surface airbecomes saturated when lifted, is close to the cloud base.We give the pressure height to this level the symbol, PLCL,because, while it is computed from surface variables, it isgenerally an accurate daytime estimate of the depth of thesubcloud layer during the morning growth phase, partic-ularly during the rainy season when the initial predawnstable boundary layer is close to saturation. PLCL is directlyrelated to (1�RH) by the formula [Betts, 1997]
PLCL ¼ p 1� RHð Þ= Aþ A� 1ð ÞRHð Þ ð1Þ
where relative humidity as a fraction is defined as RH = e/es
(where e is vapor pressure), andA ¼ eL2CpTK
� �, where e=0.622
is the ratio of the gas constants for dry air and water vapor, Lis the latent heat of vaporization of water, Cp is the specificheat of air at constant pressure, and TK is the Kelvintemperature. The thermodynamic coefficient, A, increaseswith decreasing temperature from 2.6� at 25�C to 3.4 at�40�C.[11] Equivalent potential temperature is an important
variable for moist processes as it gives the ascent path,along a wet pseudoadiabat, for air lifted to saturation. It isconserved to good approximation in condensation andevaporative processes [e.g., Emanuel, 1994]. The surfacefluxes of sensible and latent heat both increase the qE of theML, but during the daytime a near-equilibrium of qE isestablished in the ML, because higher qE is transported upinto clouds, and replaced by lower qE air which descends ineither dry or moist downdrafts. Rain falling from clouds willevaporate in the ML, but to good approximation this doesnot directly change qE, although it does cool and moisten theML, and lower PLCL as the air is brought closer tosaturation. However, as air is cooled by the evaporation offalling rain, the negative buoyancy (which is also partly dueto the weight of condensate) drives strong downdrafts whichbring low qE air from above down into the ML [Zipser,1969; Betts, 1976a; Betts and Silva Dias, 1979; Garstangand Fitzjarrald, 1999].
BETTS ET AL.: SURFACE DIURNAL CYCLE AND BOUNDARY LAYER STRUCTURE LBA 32 - 3
[12] We plot q against q, because slopes on a (q, q) plotcan be thought of as Bowen ratios [Betts, 1992]. These helpexplain the structure of the variability of the surfacevariables, and the relationship of the time rate of changeof the ML to the surface fluxes and entrainment fluxes. Theplot of qE against PLCL is also useful, as it helps separate BLevaporative cooling (which reduces PLCL but not qE) fromthe replacement of BL air by evaporatively driven down-draft air.
3. Surface Diurnal Cycle
[13] The variability in the surface diurnal cycle caused bysynoptic processes is less marked in the deep tropics than atmidlatitudes, although two distinctly different wind regimeswere noted in Rondonia, dominated by surface easterly orwesterly flow, as summarized in Table 2 (Day of Year isabbreviated DOY). Typically, the westerly regime wasassociated with a moister troposphere, and convection withweak vertical development and weak electrification, whilethe easterly regime had a slightly drier troposphere, strongerelectrified convection with greater vertical development[Rutledge et al., 2001; Cifelli et al., 2002; Rickenbach etal., 2002]. The larger scale associated synoptic structure ofthese wind regimes is explored further by Rickenbach et al.[2002], Silva Dias et al. [2002a], Peterson et al. [2002], andMarengo et al. [2002]. The westerly wind regime inRondonia is associated with the presence of a South AtlanticConvergence Zone (SACZ), extending north-westward intoBrazil, and the easterly regime with the absence of theSACZ. Herdies et al. [2002] discuss the bimodal nature ofthis summer circulation over South America.[14] The other chief causes of heterogeneity in the day-
time diurnal cycle in the rainy season are cloud cover, whichreduces the incoming solar radiation at the surface, andprecipitation events which sharply modify boundary layer(BL) air. We first show examples of the near surfacethermodynamic diurnal cycle from three days: one fromthe late January easterly regime with little precipitationduring most of the daytime diurnal cycle, one from thewesterly regime in late February, when precipitation wasmore extensive and started much earlier in the day, and onefrom a day when a propagating convective band passeddirectly over the mesonet site in the afternoon. Then weshow composites of the mean surface diurnal cycle fromfive classes: two easterly and two westerly surface windregimes (E2, E3, W2, and W3 for which we have data at the
Rondonia pasture site) and an afternoon convective bandgroup, which includes days from both regimes.
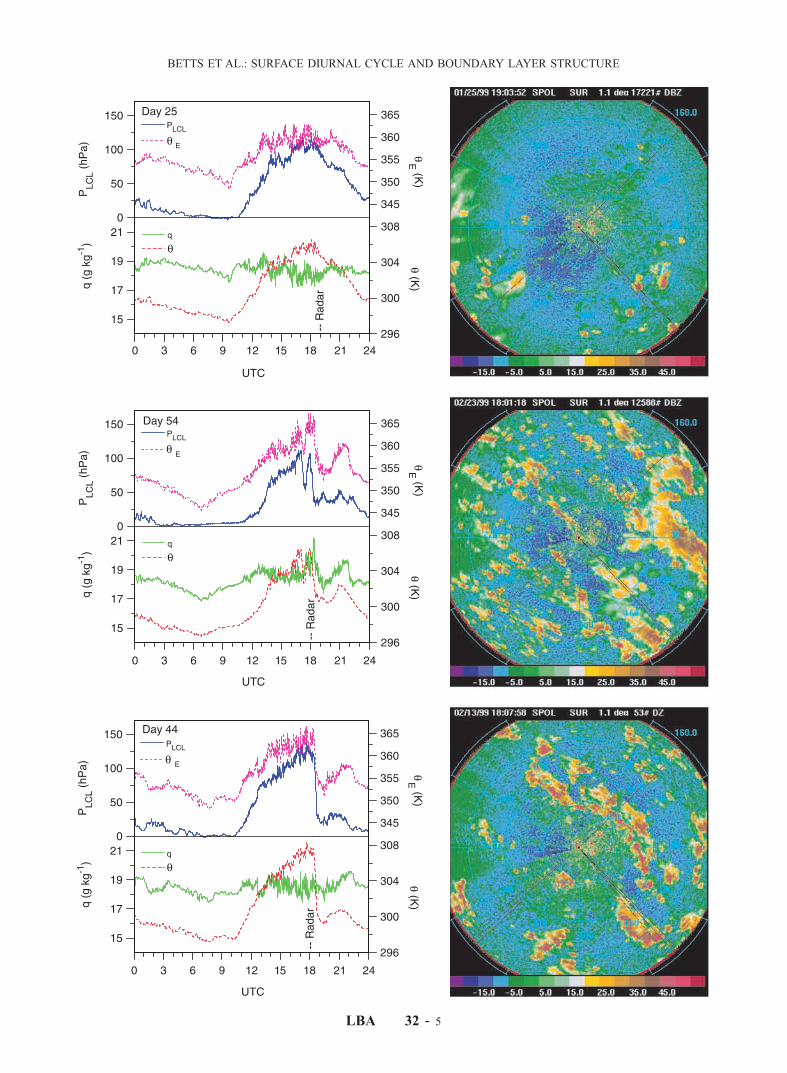
3.1. Less Disturbed Days
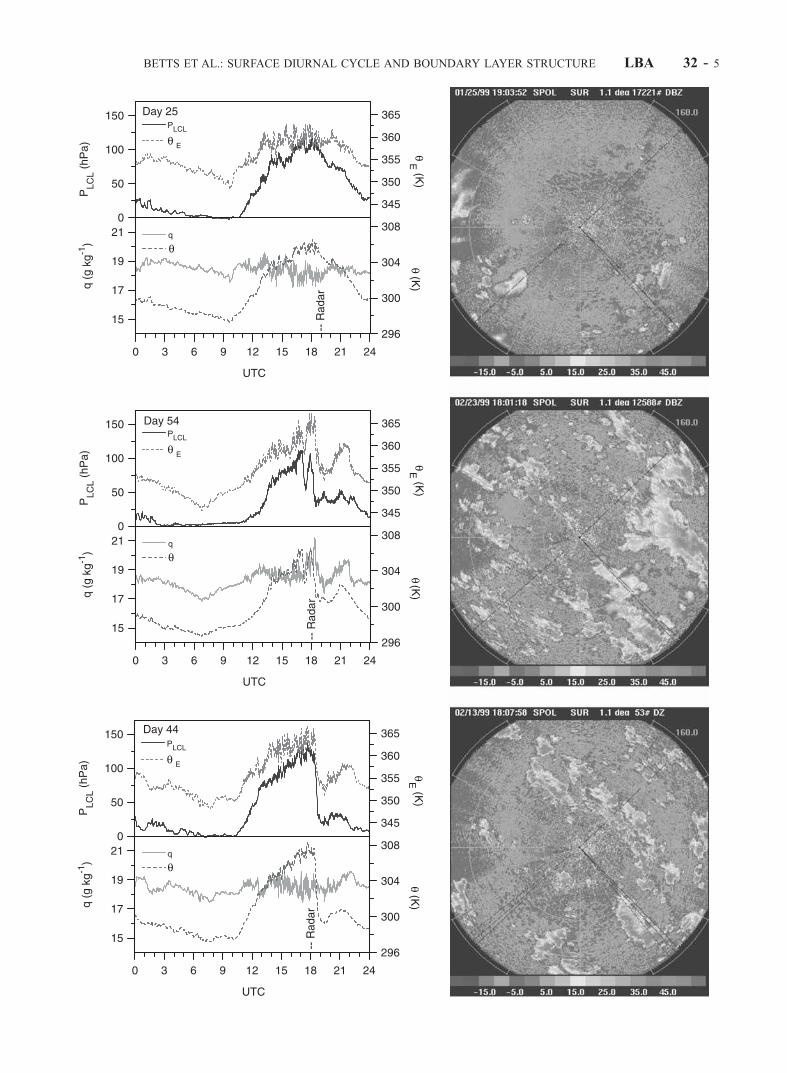
[15] Figure 1 (top) shows an example of the diurnal cycleof q, q, qE, and PLCL (left) on 25 January, a day with littledeep convection. On the right is an S-Pol radar scan at 1903UTC, 1503 LST, which shows only small widely scatteredconvective cells, none of which are close to our pasture siteobservations, located north-west of the S-Pol radar on abearing of 323� and at a range of 64 km (the maximum radarrange shown is 150 km). The time of this afternoon radarscan is marked on the left-hand plot. On this day, temper-ature and potential temperature (q) and the pressure height tothe lifting condensation level (PLCL) (which is cloud base, assoon as shallow cumulus form) start rising about 1030 UTC(0630 LST) to a midafternoon maximum. After sunrise,mixing ratio (q) first rises smoothly to about 19 g kg�1, assurface evaporation is trapped in a relatively shallow stablelayer. An hour or two after sunrise, a mixed boundary layerstarts to deepen from the surface, capped by shallow cumu-lus, and from midmorning, there is a steady fall of mixingratio with considerable fluctuations to a minimum of around17.5 g kg�1 at 1800 UTC (1400 LST), the time of the surfacetemperature maximum. This is because the upward transportof water vapor out of the mixed layer (ML) into the cumuluscloud field must exceed the large surface evaporation (seesection 3.4.2 later). After first rising from a minimum atsunrise, equivalent potential temperature (qE) fluctuates onlyabout ±2 K about 360 K, as ML qE is controlled quite closelyby the upward transport of warm moist air from the surfaceinto shallow cumulus clouds. ML qE is readily controlled bythe shallow cloud field in the tropics, because in the rainyseason the lower troposphere (up to the freezing level) isvery unstable to moist processes. This quasi-equilibrium inqE as q rises implies a fall of q, and in addition this rise of qand fall of q implies rising LCL. After the surface temper-ature maximum, q falls from 1800 to 2000 UTC, while qstarts to rise again, maintaining the same qE.[16] The growth of the morning ML can be understood
from Figure 2, which shows the predawn stable BL struc-ture. The heavy line is an average of the two pairs of ascentand descent q profiles from the tethersonde at about 0630and 0900 UTC, and the light line is the average of the tworadiosondes launched at 0606 and 0845 UTC. The q profilesfrom the two sonde systems agree well. (The radiosondemixing ratio is about 1.5 g kg�1 moister than the tether-sonde below 900 hPa, not shown). To give insight into theformation of the nocturnal BL structure, the reference wetadiabat of 360 K is shown, which intersects a dry adiabat ofq = 304 K near 900 mb. These two are representative of thedaytime ML dry adiabat, and the moist adiabat for ascent inthe previous day’s deep convection. Showers and down-drafts the previous day have transformed the lower tropo-sphere from 940 to 800 hPa into one which is between thewet adiabat and dry adiabat in stability. This is typical of thetransformation of the atmosphere by deep convection overland, both in the tropics and midlatitudes in summer [Betts,
Table 2. Easterly and Westerly Surface Wind Regimes
EasterlyE1 11 Jan. 00Z–14 Jan. 00Z (DOY: 11–13)E2 19 Jan. 00Z–29 Jan. 00Z (DOY: 19–28)E3 8 Feb. 00Z–22 Feb. 00Z (DOY: 39–52)WesterlyW1 14 Jan. 00Z–19 Jan. 00Z (DOY: 14–18)W2 29 Jan. 00Z–8 Feb. 00Z (DOY: 29–38)W3 22 Feb. 00Z–1 Mar. 00Z (DOY: 53–59)
Figure 1. (opposite) (Top) Diurnal cycle of q, q, qE, and PLCL on DOY = 25 (left) and (right) S-Pol radar scan at 1903UTC (1503 LST). (Middle) As top for DOY = 54 with S-Pol radar scan at 1801 UTC (1401 LST). (Bottom) As top forDOY = 44 and S-Pol radar scan at 1807 UTC (1407 LST). See color version of this figure at back of this issue.
LBA 32 - 4 BETTS ET AL.: SURFACE DIURNAL CYCLE AND BOUNDARY LAYER STRUCTURE
BETTS ET AL.: SURFACE DIURNAL CYCLE AND BOUNDARY LAYER STRUCTURE LBA 32 - 5
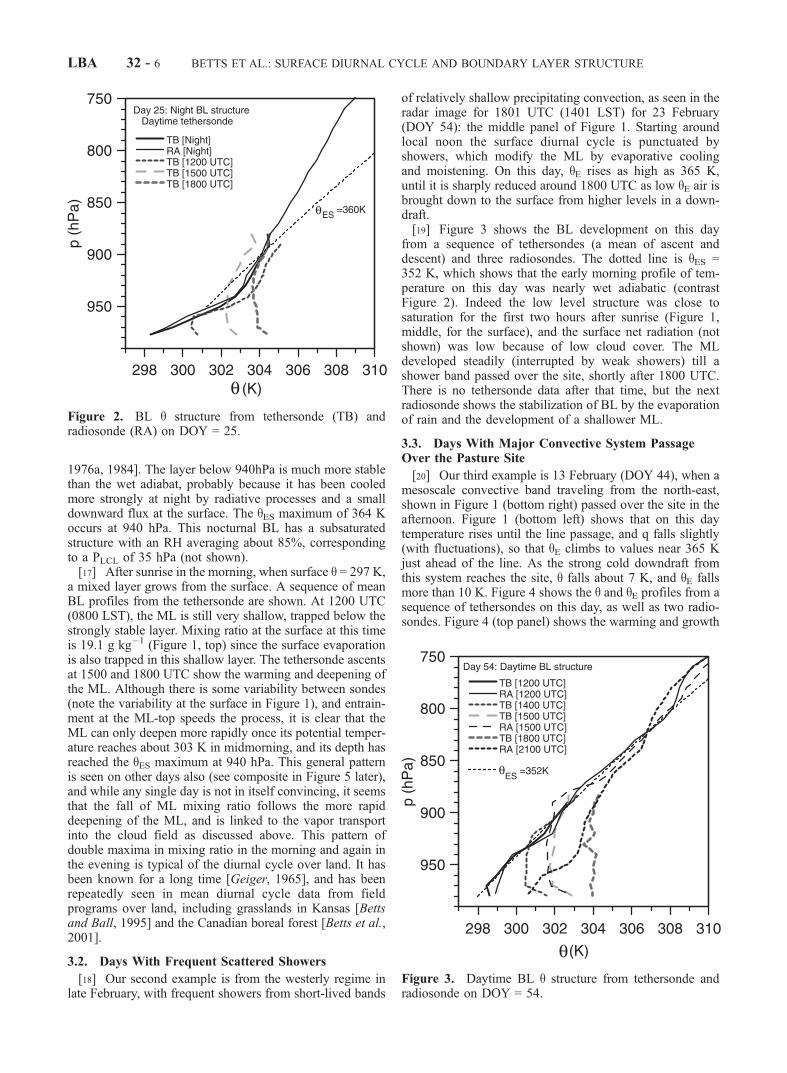
1976a, 1984]. The layer below 940hPa is much more stablethan the wet adiabat, probably because it has been cooledmore strongly at night by radiative processes and a smalldownward flux at the surface. The qES maximum of 364 Koccurs at 940 hPa. This nocturnal BL has a subsaturatedstructure with an RH averaging about 85%, correspondingto a PLCL of 35 hPa (not shown).[17] After sunrise in the morning, when surface q = 297 K,
a mixed layer grows from the surface. A sequence of meanBL profiles from the tethersonde are shown. At 1200 UTC(0800 LST), the ML is still very shallow, trapped below thestrongly stable layer. Mixing ratio at the surface at this timeis 19.1 g kg�1 (Figure 1, top) since the surface evaporationis also trapped in this shallow layer. The tethersonde ascentsat 1500 and 1800 UTC show the warming and deepening ofthe ML. Although there is some variability between sondes(note the variability at the surface in Figure 1), and entrain-ment at the ML-top speeds the process, it is clear that theML can only deepen more rapidly once its potential temper-ature reaches about 303 K in midmorning, and its depth hasreached the qES maximum at 940 hPa. This general patternis seen on other days also (see composite in Figure 5 later),and while any single day is not in itself convincing, it seemsthat the fall of ML mixing ratio follows the more rapiddeepening of the ML, and is linked to the vapor transportinto the cloud field as discussed above. This pattern ofdouble maxima in mixing ratio in the morning and again inthe evening is typical of the diurnal cycle over land. It hasbeen known for a long time [Geiger, 1965], and has beenrepeatedly seen in mean diurnal cycle data from fieldprograms over land, including grasslands in Kansas [Bettsand Ball, 1995] and the Canadian boreal forest [Betts et al.,2001].
3.2. Days With Frequent Scattered Showers
[18] Our second example is from the westerly regime inlate February, with frequent showers from short-lived bands
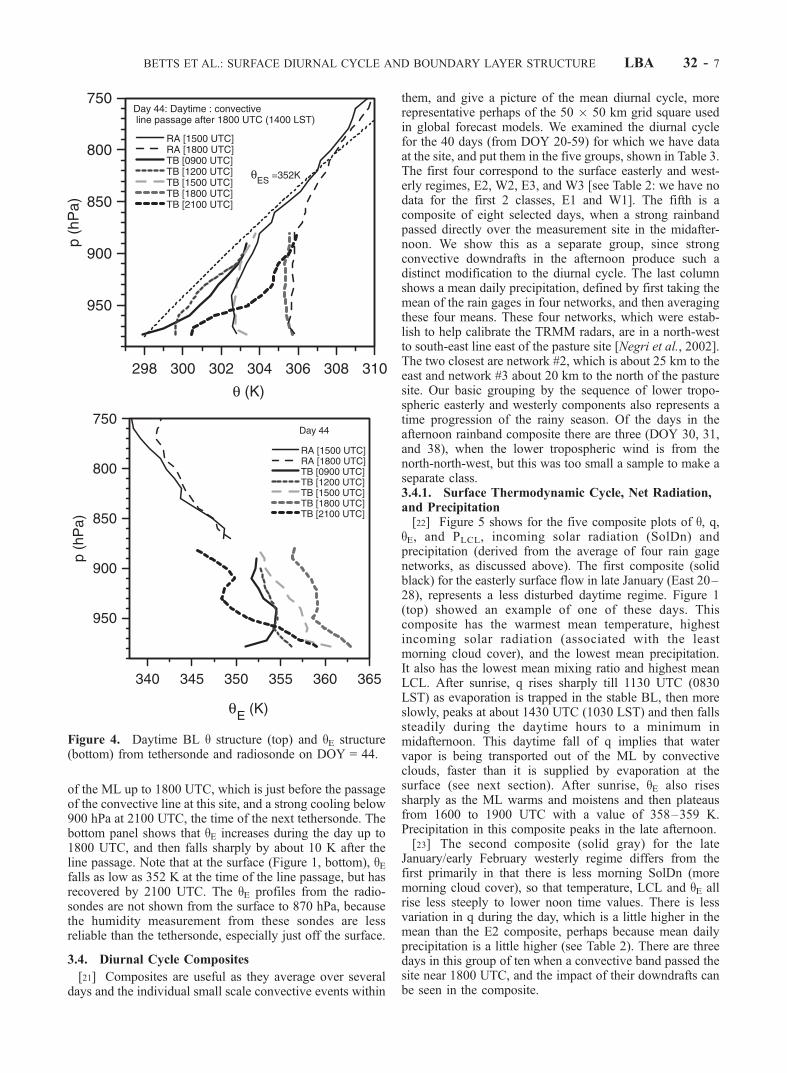
of relatively shallow precipitating convection, as seen in theradar image for 1801 UTC (1401 LST) for 23 February(DOY 54): the middle panel of Figure 1. Starting aroundlocal noon the surface diurnal cycle is punctuated byshowers, which modify the ML by evaporative coolingand moistening. On this day, qE rises as high as 365 K,until it is sharply reduced around 1800 UTC as low qE air isbrought down to the surface from higher levels in a down-draft.[19] Figure 3 shows the BL development on this day
from a sequence of tethersondes (a mean of ascent anddescent) and three radiosondes. The dotted line is qES =352 K, which shows that the early morning profile of tem-perature on this day was nearly wet adiabatic (contrastFigure 2). Indeed the low level structure was close tosaturation for the first two hours after sunrise (Figure 1,middle, for the surface), and the surface net radiation (notshown) was low because of low cloud cover. The MLdeveloped steadily (interrupted by weak showers) till ashower band passed over the site, shortly after 1800 UTC.There is no tethersonde data after that time, but the nextradiosonde shows the stabilization of BL by the evaporationof rain and the development of a shallower ML.
3.3. Days With Major Convective System PassageOver the Pasture Site
[20] Our third example is 13 February (DOY 44), when amesoscale convective band traveling from the north-east,shown in Figure 1 (bottom right) passed over the site in theafternoon. Figure 1 (bottom left) shows that on this daytemperature rises until the line passage, and q falls slightly(with fluctuations), so that qE climbs to values near 365 Kjust ahead of the line. As the strong cold downdraft fromthis system reaches the site, q falls about 7 K, and qE fallsmore than 10 K. Figure 4 shows the q and qE profiles from asequence of tethersondes on this day, as well as two radio-sondes. Figure 4 (top panel) shows the warming and growth
Figure 2. BL q structure from tethersonde (TB) andradiosonde (RA) on DOY = 25.
Figure 3. Daytime BL q structure from tethersonde andradiosonde on DOY = 54.
LBA 32 - 6 BETTS ET AL.: SURFACE DIURNAL CYCLE AND BOUNDARY LAYER STRUCTURE
of the ML up to 1800 UTC, which is just before the passageof the convective line at this site, and a strong cooling below900 hPa at 2100 UTC, the time of the next tethersonde. Thebottom panel shows that qE increases during the day up to1800 UTC, and then falls sharply by about 10 K after theline passage. Note that at the surface (Figure 1, bottom), qEfalls as low as 352 K at the time of the line passage, but hasrecovered by 2100 UTC. The qE profiles from the radio-sondes are not shown from the surface to 870 hPa, becausethe humidity measurement from these sondes are lessreliable than the tethersonde, especially just off the surface.
3.4. Diurnal Cycle Composites
[21] Composites are useful as they average over severaldays and the individual small scale convective events within
them, and give a picture of the mean diurnal cycle, morerepresentative perhaps of the 50 � 50 km grid square usedin global forecast models. We examined the diurnal cyclefor the 40 days (from DOY 20-59) for which we have dataat the site, and put them in the five groups, shown in Table 3.The first four correspond to the surface easterly and west-erly regimes, E2, W2, E3, and W3 [see Table 2: we have nodata for the first 2 classes, E1 and W1]. The fifth is acomposite of eight selected days, when a strong rainbandpassed directly over the measurement site in the midafter-noon. We show this as a separate group, since strongconvective downdrafts in the afternoon produce such adistinct modification to the diurnal cycle. The last columnshows a mean daily precipitation, defined by first taking themean of the rain gages in four networks, and then averagingthese four means. These four networks, which were estab-lish to help calibrate the TRMM radars, are in a north-westto south-east line east of the pasture site [Negri et al., 2002].The two closest are network #2, which is about 25 km to theeast and network #3 about 20 km to the north of the pasturesite. Our basic grouping by the sequence of lower tropo-spheric easterly and westerly components also represents atime progression of the rainy season. Of the days in theafternoon rainband composite there are three (DOY 30, 31,and 38), when the lower tropospheric wind is from thenorth-north-west, but this was too small a sample to make aseparate class.3.4.1. Surface Thermodynamic Cycle, Net Radiation,and Precipitation[22] Figure 5 shows for the five composite plots of q, q,
qE, and PLCL, incoming solar radiation (SolDn) andprecipitation (derived from the average of four rain gagenetworks, as discussed above). The first composite (solidblack) for the easterly surface flow in late January (East 20–28), represents a less disturbed daytime regime. Figure 1(top) showed an example of one of these days. Thiscomposite has the warmest mean temperature, highestincoming solar radiation (associated with the leastmorning cloud cover), and the lowest mean precipitation.It also has the lowest mean mixing ratio and highest meanLCL. After sunrise, q rises sharply till 1130 UTC (0830LST) as evaporation is trapped in the stable BL, then moreslowly, peaks at about 1430 UTC (1030 LST) and then fallssteadily during the daytime hours to a minimum inmidafternoon. This daytime fall of q implies that watervapor is being transported out of the ML by convectiveclouds, faster than it is supplied by evaporation at thesurface (see next section). After sunrise, qE also risessharply as the ML warms and moistens and then plateausfrom 1600 to 1900 UTC with a value of 358–359 K.Precipitation in this composite peaks in the late afternoon.[23] The second composite (solid gray) for the late
January/early February westerly regime differs from thefirst primarily in that there is less morning SolDn (moremorning cloud cover), so that temperature, LCL and qE allrise less steeply to lower noon time values. There is lessvariation in q during the day, which is a little higher in themean than the E2 composite, perhaps because mean dailyprecipitation is a little higher (see Table 2). There are threedays in this group of ten when a convective band passed thesite near 1800 UTC, and the impact of their downdrafts canbe seen in the composite.
Figure 4. Daytime BL q structure (top) and qE structure(bottom) from tethersonde and radiosonde on DOY = 44.
BETTS ET AL.: SURFACE DIURNAL CYCLE AND BOUNDARY LAYER STRUCTURE LBA 32 - 7
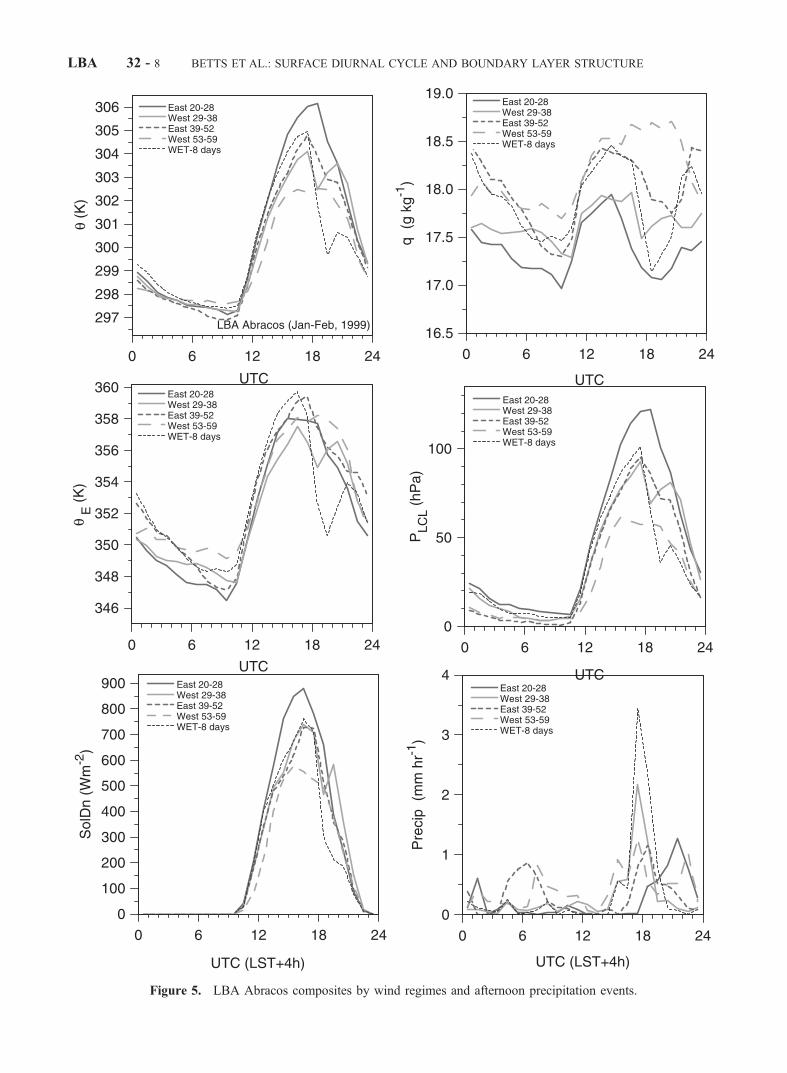
Figure 5. LBA Abracos composites by wind regimes and afternoon precipitation events.
LBA 32 - 8 BETTS ET AL.: SURFACE DIURNAL CYCLE AND BOUNDARY LAYER STRUCTURE
[24] The third composite (black dashed) for the easterlyregime in February (East 39–52) is similar to the firsteasterly composite, but SolDn is less (cloud cover is greater,following nighttime precipitation), so that mean temperatureand LCL are reduced. The diurnal cycle of q is similar to theE2 regime, with a marked daytime drop of q after amidmorning maximum, although the mean is moister,perhaps because there are more showers in February, whichincrease BL q by evaporation. DOY 44 (Figure 1, bottom)was one of these days.[25] This progression continues with the fourth composite
(dashed gray) for the westerly regime at the end of February.These days are characterized by extensive but relativelyshallow bands of showers. DOY 54 (Figure 1, middle)showed an example of one of these days. This compositeis markedly cooler and moister in the daytime, with a lowerLCL peaking at only 60 hPa, and there is no fall of mixingratio during the daytime. However, afternoon qE still reachesa similar mean value of 358 K. The daytime rise of qE islimited by the upward advection of water vapor into non-precipitating and precipitating cumulus into a conditionallyunstable atmosphere above, and the introduction of low qEinto the ML from downdrafts driven by evaporative coolingand condensate loading. Precipitation is greatest for thiscomposite (consistent with the highest mixing ratio): itoccurs both at night and in the day and starts by 1430UTC in the late morning, lasting throughout the daytimeperiod.[26] This sequence of four composites shows a distinct
progression toward a cooler, moister, shallower subcloudlayer (with little change in maximum qE) with an increase inmean precipitation as the rainy season progresses. Theeasterly regime composites, but not the westerly compo-sites, both show a daytime fall of q from 1400 to 2000 UTC.The WETAMC experiment was the beginning of long-termmonitoring of the surface diurnal cycle and the surfacefluxes at this pasture site. These data (which will be reportedelsewhere), show the slow transition in the six monthsfollowing the rainy season back to the much warmer, drierand deeper daytime BL, characteristic of the dry season inAugust [Nobre et al., 1996].[27] The final and distinct composite (black dotted) for
the 8 days with the afternoon passage of a rainband over thesite shows the impact of precipitation-driven downdrafts,which bring down cool, dry, low qE air into the BL. qE fallsnearly 10 K at the surface with the arrival of this downdraftair. Precipitation peaks between 1700 and 1900 UTC. Theafternoon rainband passage shown in Figure 1 (bottom) wasalso included in this group. We will explore the structurebefore and after downdraft passages at the site in moredetail in section 3.5.3.4.2. Surface Sensible Latent and Ground Heat Fluxes[28] The surface energy balance can be written
RN ¼ Hþ LEþ Gþ residual ð2Þ
where RN is the net radiation, H, LE, and G are themeasured sensible, latent, and ground heat fluxes.Measurement errors leave a small residual, which for adaily average is about 4% of the daily mean RN, and about5% for corresponding daytime averages. Figure 6 shows thefive composites for the same groups of days in Table 3
(except for the last westerly group (W3) for which we onlyhave flux data for the three days 54–56), with the surfacesensible and latent heat fluxes in the upper panels, and theground heat flux and Bowen ratio (lower panels). TheBowen ratio, BR, plotted for the daytime period only, isdefined as
BR ¼ H=LE ð3Þ
The upper panels for H and LE are similar, following thepattern of SolDn in Figure 5. The Bowen ratio, shown in thelower right panel, is relatively flat during the daytime, withH 0.4LE. Fluxes are highest for the earliest easterlycomposite and lowest for the last westerly composite. Theground heat flux, G, has a similar pattern. The dotted curvedips below zero in the afternoon for the convective bandcomposite, consistent with the sharp fall of temperature inFigure 5. The differences in BR are more subtle. The earlierand drier composites have a slightly higher BR than the twolater composites and the afternoon rainband composite (allof which have higher rainfall).[29] Note that the last westerly composite with the lowest
fluxes (SolDn, H and LE) also has the highest mean daytimemixing ratio. Thus, we see again that it is not the surfaceevaporation that is alone responsible for the BL equilibriumof q, but also the interaction with the cloud layer. In thiscase surface evaporation is lowest, but the subcloud layer isthe shallowest, since the evaporation of falling rain frommany weak downdrafts is maintaining a cooler moistersubcloud layer.[30] Figure 7 plots daytime (0600–1800 LST) averages
against the mean date of each composite. For the timeperiod we have data, there is a systematic downward trendof the mean fluxes, as the rainy season progresses, andmean BR also falls from the beginning to the end of theperiod. The average fluxes for the rainband ‘‘WET-8’’composite, which are selected days from the entire period,are plotted as the symbol W.
3.5. Rainband Passage Composites
[31] One of the composites in Figures 4–6 was that for 8days when a convective rainband passed in early afternoon.We can enlarge the sample by including all the rainbandpassages between 1730 and 2200 UTC and still depict thesharp transition by compositing centered on the arrival timeof the cold gust front. There are 18 well-defined events (allfrom different days: DOY = 20, 22, 23, 24, 26, 29, 30, 31,38, 40, 42, 44, 48, 50, 51, 54, 55, and 56) during the periodwe have data. Of these, 11 are in the easterly wind regimesand 7 in the westerly regimes, so we composite themseparately.3.5.1. Surface Downdraft Composite[32] Figure 8 shows the surface transformation from a
westerly composite (7 downdraft events) and the easterlycomposite (11 downdraft events) plotted on conservedvariable diagrams for (qE, PLCL), and (q, q). The compositeswere constructed by selecting 3 hours of the surface dataahead and after the arrival of the sharp temperature fallmarking the passage of a surface gust front. The oneminute micromet data has been averaged into sequential10-min blocks, so that blocks 1–18 (numbered on Figure 8)are ahead of the gust front, with time block = 18 being the
BETTS ET AL.: SURFACE DIURNAL CYCLE AND BOUNDARY LAYER STRUCTURE LBA 32 - 9
10 min just before the sharp fall of surface temperature. Theaverage end-time corresponding to point 18 is 1859 UTC forthe easterly composite and 1927 UTC for the westerly one.The figure shows that the fall of q, q, qE, and PLCL at thesurface lasts on average 30 min. For the easterly composite,conditions ahead of the gust front arrival are warmer and drierwith a higher cloud base, than for the westerly composite.
Conditions in the cold outflow air are much more similar forboth, with the result that while the fall of qE is about �10 Kfor both, PLCL falls by �70 hPa for the easterly composite,but only�50 hPa for the westerly one. Similarly, q falls morefor the easterly composite (about�6 K versus�5 K) while qfalls a little less (about �0.9 versus �1.3 g kg�1).Composites such as these are useful reference points,
Figure 6. Composite diurnal cycle of H, LE (upper panels); G and Bowen ratio (lower panels).
Table 3. Surface Diurnal Composites
Composite Name Days Included, UTC No. of Days Mean DailyPrecipitation, mm
1. East 20–28 (E2) 20–28 9 5.672. West 29–38 (W2) 29–38 10 6.943. East 39–52 (E3) 39–52 14 7.484. West 53–59 (W3) 53–59 7 10.145. WET-8 days 20, 24, 30, 31, 38, 42, 44, 48
(afternoon rainband)8 8.94
LBA 32 - 10 BETTS ET AL.: SURFACE DIURNAL CYCLE AND BOUNDARY LAYER STRUCTURE
because one of the key problems in convectiveparameterization for the tropics is the incorporation andproper calibration of convective downdraft models.Although the sample size for the westerly wind compositeis a little small to be satisfactory, the picture is consistent withthe westerly wind days having more frequent showers and alower mean cloud base. The tethersonde data in the nextsection gives a consistent vertical picture.3.5.2. BL Composite of Rainband Passage[33] For 13 of these 18 events, we have tethersonde
profiles before and after the convective system passedover the site in the afternoon. Figure 9 shows the changein the composite thermodynamic structure, associated withthe convective band passage, again separated into easterly(7 events: mean gust front arrival time 1920 UTC (1520LST) and westerly wind regimes (6 events: mean time 1903UTC (1503 LST)). The upper panel shows the mean drop ofq, as downdrafts bring down drier air, and the middle panelthe cooling and stabilization of the BL. These two show,consistent with Figure 8, that the inflow air for the westerlyregime is cooler and moister, but they also show that air onthe outflow side has somewhat similar properties for botheasterly and westerly regimes. Because the mean timeinterval (see middle panel legend) between these meantethersonde profiles is 5–6 hours (the ‘‘after’’ profile ison average 3–4 hours after the arrival of the gust front),some modification at the surface can be expected. Figure 8shows 1 g kg�1 of moistening in the three hours after linepassage. The LCL of surface air in the ‘‘before’’ compositesis shown in the middle panel. The layer that has beenthermally cooled appears to be a little deeper than thesubcloud layer, which is shallower for the westerlyregime. The bottom panel shows on the left that the fallof qE is about 6 K for both composites throughout the wholelayer, and extends above 900 hPa. On the right (with thelabel S) are the profiles of qES, corresponding to the middlepanel. Together the q and qES profiles show that the thermaltransformation near the surface is from approximatelyconstant q to approximately constant qES. This BL
transformation is very similar to that seen over Venezuelaand the Great Plains of the United States in summer [Betts,1976a, 1984], and for convective lines in the tropicalAtlantic [Barnes and Sieckman, 1984].3.5.3. Gust Front Transition[34] A number of the tethersonde profiles at 1800 UTC
(1400 LST), a standard radiosonde launch time, were justahead of the arrival of a convective band, so that the ascentwas in the inflow air, but the descent caught the initialarrival of the gust front. Figure 10 shows an average of threecases on DOY = 38, 40, and 48. The heavy solid curve (witha mean time of 1745 UTC) is just ahead of the arrival of thegust front, showing a subcloud layer with q 304 K(middle panel) and a wind speed, nearly constant in thevertical, of 3 m s�1 (top-left). The ascents reach only 920hPa, as they were terminated early with the approach of thegust-front. The mean descent sounding enters the cooledgust-front air at 1800 UTC, with wind speeds approaching
Figure 7. Trend of daytime average fluxes and Bowenratio (right-hand-scale) during rainy season.
Figure 8. Composite of surface passage of 7 downdraftevents in westerly regime (upper) and 11 events in easterlyregime (lower).
BETTS ET AL.: SURFACE DIURNAL CYCLE AND BOUNDARY LAYER STRUCTURE LBA 32 - 11
10 m s�1. Note however, that initially the cooled air ismoister with the same qE = 358 K, indicating subcloud layerair that has been cooled evaporatively. In fact, thetethersonde only encounters lower qE air as it approachesthe surface. On these three days, the surface qE dropped to amean minimum of 351.5 K by 1820 UTC. The tethersondeprofiles nearly four hours later at 2155 UTC (heavy dashes)show the typical cooler drier, stable outflow air profile withlower qE and a nearly constant wet adiabatic structure withqES 363 K.[35] This transition in the structure of outflow air has
been noticed in earlier studies [e.g., Betts, 1984]. RecentlyTompkins [2001], from a numerical simulation, has drawnattention to the fact that the triggering of new convection bycold pool outflows over the ocean appears to involve thelifting of this cooled but high qE air. However, land and searespond differently to a downdraft event. Over the ocean,the surface heat flux rapidly restores the temperature, whileover land, evaporation during the daylight hours increasesmixing ratio and qE, rather than temperature, as shown inFigure 9. Both processes though could lead to higher qE airalong gust front boundaries, where the initial evaporativemodification conserves qE in subcloud layer air.
4. Summary and Conclusions
[36] We have discussed the surface diurnal cycles oftemperature, humidity, lifting condensation level, equivalentpotential temperature, and the surface fluxes, for easterly
and westerly lower tropospheric wind regimes in Rondoniaduring the LBA wet season experiment of January andFebruary of 1999, using data collected in support of theground validation for TRMM. This is an important data set,as it is one of the first over land in the tropics, wheresimultaneous observations were intercompared at the sur-face, from tethered balloons within the boundary layer andfrom rawinsonde ascents though the troposphere. Thisanalysis raises several important issues for modeling theland-surface-atmosphere interaction in the tropics. We haveshown examples of different convective regimes seen dur-ing easterly and westerly flows in the lower troposphere,and discussed some of the differences in structure theyexhibited. We then composited surface and tethersondedatabased on these wind regimes. The easterly diurnalcomposites show a characteristic early morning maximumof q, followed by a fall to a minimum in the late afternoon,as cumulus clouds mix water vapor up and out of thesubcloud layer, keeping qE close to a mean value of358 K. There is a steady transition during the rainy seasontoward cloudier conditions, lower surface fluxes and aslightly lower Bowen ratio (although the rainy season day-time surface Bowen ratio remains close to 0.4 at this pasturesite). Composites of the surface and BL transitions associ-ated with the passage of convective bands, show thecharacteristic properties of convective downdraft air forthe different wind regimes. Typically qE falls by about
Figure 9. Composite BL profiles before and after thepassage of 13 convective systems.
Figure 10. Composite BL profiles ahead of, through gustfront and after convective lines.
LBA 32 - 12 BETTS ET AL.: SURFACE DIURNAL CYCLE AND BOUNDARY LAYER STRUCTURE
10 K at the surface and q by 4–5 K. The layer of coolingcorresponds roughly to the transformation of the subcloudlayer from a dry to wet adiabatic structure, consistent withearlier studies. However, the layer in which qE is reduced bydowndrafts appears to extend above the first 100 hPareached by the tethersondes. Since the mean cloud base islower for the westerly regime composite, the layer ofcooling is shallower for this group (and probably downdraftintensity is also). The shallower cloud base (that is a cooler,moister subcloud layer) is in itself probably caused by theevaporation in downdrafts from more frequent transientsystems, so that a different diurnal cycle of q and q results.Tethersonde ascents through the edges of gust fronts showthat subcloud air is first cooled and moistened by rainfallevaporation, before the arrival at the surface of lower qE airfrom higher levels.[37] Our analysis is quite limited in scope and addresses
the thermodynamic structure in only the lowest 100 hPa. Wehave not examined the detailed kinematic structure of thedifferent regimes in Rondonia. Several case studies of thestructure mesoscale systems are included in this specialissue [Cifelli et al., 2002; Silva Dias et al., 2002b], andcomparisons need to be made with convective systems fromother regions such as the tropical Pacific [LeMone et al.,1998; Lewis et al., 1998]. Modeling studies in progress ondifferent scales are providing sharply contrasting results.Nested nonhydrostatic models resolving down to a fewkilometers show the triggering of new convective cells fromcold downdraft outflows [Silva Dias et al., 2002b], butappear over Amazonia to overpredict development andprecipitation (P. Silva Dias, personal communication,2001). A companion paper [Betts and Jakob, 2002] showsthat the onset of precipitation in the ECMWF forecastmodel is much too early in the diurnal cycle, because themorning development of the shallow cumulus layer is notproperly represented. The model also does not represent thediurnal cycle differences between the easterly and westerlyregimes over Rondonia. As in many forecast models,shallow and deep cumulus convection are parameterizedseparately in the ECMWF model, but it is clear from thisLBA data that they are closely intertwined in their impactson the daytime evolution of the ML, particularly during thewesterly regime at the end of February. In addition, mostparameterization schemes for precipitating convection inlarge-scale models do not properly account at present for thedifferent dynamical and microphysical structure of theconvective bands in different wind regimes. The Rondoniawet season data will provide a further observational basisfor model development, but further synthesis will beneeded. Our thermodynamic composites show small differ-ences in the diurnal cycle: a trend toward a cooler moisterBL as the rainy season progresses, and a weaker diurnalcycle of mixing ratio in the westerly regime. In our tether-sonde composites it appears that the differences in cloudbase are associated with differences in downdraft intensity,frequency and structure, but in such a tightly coupledsystem in which the subcloud structure is strongly influ-enced by evaporation from the more frequent transientconvection bands in the westerly regime, cause and effectare not fully clear.
Appendix A: Thermodynamic Formulae
[38] Acknowledgments. This LBA data collection was supported bya NASA-TRMM grant to the University of Virginia. Alan Betts issupported by NASA under grant NAG5-8364, and by NSF under GrantATM-9988618. The S-Pol radar is operated by the Atmospheric Technol-ogy Division, National Center for Atmospheric Research, which is spon-sored by the National Science Foundation. We are grateful to the reviewersfor their careful reading of the text.
ReferencesBarnes, M., and K. Sieckman, The environment of fast- and slow-movingtropical convective cloud lines, Mon. Weather Rev., 112, 1782–1794,1984.
Betts, A. K., The thermodynamic transformation of the tropical subcloudlayer by precipitation and downdrafts, J. Atmos. Sci., 33, 1008–1020,1976a.
Betts, A. K., Modeling subcloud layer structure and interaction with shal-low cumulus layer, J. Atmos. Sci., 33, 2363–2382, 1976b.
Betts, A. K., Saturation point analysis of moist convective overturning,J. Atmos. Sci., 39, 1484–1505, 1982.
Betts, A. K., Boundary layer thermodynamics of a High Plains severestorm, Mon. Weather Rev., 112, 2199–2211, 1984.
Betts, A. K., FIFE atmospheric boundary layer budget methods, J. Geo-phys. Res., 97, 18,523–18,532, 1992.
Betts, A. K., The parameterization of deep convection, in The Physics andParameterization of Moist Atmospheric Convection, NATO ASI Ser. C,vol. 505, edited by R. K. Smith, chap. 10, pp. 255–279, Kluwer Acad.,Norwell, Mass., 498 pp., 1997.
Betts, A. K., Surface diurnal cycle over Venezuela, Meteorol. Atmos. Phys.,67, 213–216, 1998.
Betts, A. K., and J. H. Ball, The FIFE surface diurnal cycle climate,J. Geophys. Res., 100, 25,679–25,693, 1995.
Betts, A. K., and C. Jakob, Evaluation of the diurnal cycle of precipitation,surface thermodynamics and surface fluxes in the ECMWF model usingLBA data, J. Geophys. Res., 107, 10.1029/2001JD000427, in press,2002.
Betts, A. K., and M. F. Silva Dias, Unsaturated downdraft thermodynamicsin cumulonimbus, J. Atmos. Sci., 36, 1061–1071, 1979.
Betts, A. K., J. H. Ball, and J. H. McCaughey, Near-surface climate in theboreal forest, J. Geophys. Res., 106, 33,529–33,542, 2001.
Bolton, D., The computation of equivalent potential temperature, Mon.Weather Rev., 108, 1046–1053, 1980.
Cifelli, R., W. A. Petersen, L. D. Carey, S. A. Rutledge, and M. A. F. SilvaDias, Radar observations of the kinematic, microphysical, and precipita-tion characteristics of two MCSs in TRMM-LBA, J. Geophys. Res., 107,10.1029/2000JD000264, in press, 2002.
Emanuel, K., Atmospheric Convection, 580 pp., Oxford Univ. Press, NewYork, 1994.
Fitzgarrald, D. R., B. L. Stormwind, G. Fisch, and O. M. R. Cabral, Tur-bulent transport observed just above the Amazon forest, J. Geophys. Res.,93, 1551–1563, 1988.
Garstang, M., and D. R. Fitzjarrald, Observations of Surface to AtmosphereInteractions in the Tropics, Oxford Univ. Press, New York, 405 pp.,1999.
Geiger, R., The Climate Near the Ground, Harvard Univ. Press, Cambridge,Mass., 611 pp., 1965.
Variable Formula used
p [hPa] pressure [Measured]T [�C] temperature [Measured]RH [fraction] relative humidity [Measured]q [K] potential temperature (T + 273.15) *
(1000/p) ^ 0.286QS [g kg�1] saturation mixing ratio 622/(0.16361*p*EXP(�17.67*T/
(T + 243.5)) � 1)q [g kg�1] mixing ratio RH*QS/(1 + (QS/622)*(1�RH))T* [K]: LCL saturation temperature 55 + (2840/(3.5*LN(q)�LN(1000*q/
(622 + q)) � 4.805))p* [hPa]: LCL saturation pressure 1000 * (T*/q) ^ 3.4965PLCL [hPa] p* � pqE [K] equiv. pot. temperature q * EXP(2.67 * q/T*)
BETTS ET AL.: SURFACE DIURNAL CYCLE AND BOUNDARY LAYER STRUCTURE LBA 32 - 13
Harris, R. C., et al., The Amazon Boundary-Layer Experiment (Able-2a) -Dry season 1985, J. Geophys. Res., 93, 1351–1360, 1988.
Herdies, D. L., A. Da Silva, and M. A. F. Silva Dias, The bimodal pattern ofthe summer circulation over South America, J. Geophys. Res., 107,10.1029/2001JD000997, in press, 2002.
LeMone, A., J. Zipser, and B. Trier, The role of environmental shear andthermodynamic conditions in determining the structure and evolution ofmesoscale convective systems during TOGA COARE, J. Atmos. Sci., 23,3493–3518, 1998.
Lewis, A., A. LeMone, and P. Jorgensen, Evolution and dynamics of a late-stage squall line on 20 February 1993 during TOGA COARE, Mon.Weather Rev., 126, 3189–3212, 1998.
Mahrt, L., Mixed layer moisture structure, Mon. Weather Rev., 104, 1403–1407, 1976.
Martin, C. L., D. Fitzgarrald, M. Garstang, A. P. Oliveira, S. Greco, andE. Browell, Structure and growth of the mixing layer over the Amazonianrain forest, J. Geophys. Res., 93, 1361–1375, 1988.
Marengo, J., G. Fisch, I. Vendrame, P. Cervantes, and C. Morales, On thediurnal and day-to-day variability of rainfall in southwest Amazoniaduring the LBA-TRMM and LBA-WET AMC campaigns of summer1999, J. Geophys. Res., 107, 10.1029/2001JD001188, in press, 2002.
Negri, A. J., L. Xu, and R. F. Adler, A TRMM-calibrated infrared rainfallalgorithm applied over Brazil, J. Geophys. Res., 107, 10.1029/2000JD000265, 2002.
Nobre, C. A., G. Fisch, H. R. da Rocha, R. F. F. Lyra, E. P. da Rocha, andV. N. Ubarana, Observations of the atmospheric boundary layer in Ron-donia, in Amazonian Deforestation and Climate, edited by J. H. C. Gash,C. A. Nobre, J. M. Roberts, and R. L. Victoria, John Wiley, New York,pp. 413–424, 1996.
Pereira Filho, A. J., M.A. F. Silva Dias, R. I. Albrecht, L. G. P. Pereira,A. W. Gandu, O. Massambani, A. Tokay, and S. A. Rutledge, Multisensoranalysis of a squall line in the Amazon region, J. Geophys. Res., 107,10.1029/2001JD000305, in press, 2002.
Peterson, W. A., S. W. Nesbitt, R. J. Blakeslee, R. Cifelli, P. Hein, and S. A.Rutledge, TRMM observations of intraseasonal variability in convectiveregimes over the Amazon, J. Clim., 15, 1278–1294, 2002.
Rickenbach, T. M., R. N. Ferreira, J. Halverson, D. L. Herdies, and M. A. F.
Silva Dias, Modulation of convection in the southwestern Amazon Basinby extratropical stationary fronts, J. Geophys. Res., 107, 10.1029/2001JD000263, in press, 2002.
Riehl, H., Climate and Weather in the Tropics, Academic, San Diego,Calif., 609 pp., 1979.
Rutledge, S. A., W. A. Petersen, R. C. Cifelli, and L. D. Carey, Early resultsfrom TRMM-LBA: Kinematic and microphysical characteristics of con-vection in distinct meteorological regimes, paper presented at AMS 24thConference on Hurricanes and Tropical Meteorology, 29 May–2 June,2000, Ft. Lauderdale, Fla.2 pp., 2001.
Silva Dias, M. F., and P. L. Silva Dias, Observed thermodynamic structureof the sub-tropical atmosphere in the presence of precipitation, paperpresented at 1st Conference on Southern Hemisphere Meteorol., Sao Josedos Campos, SP, Brazil, 1–5 August, 1983.
Silva Dias, M. A. F., et al., Clouds and rain processes in a biosphereatmosphere interaction context in the Amazon Region, J. Geophys.Res., 107, 10.1029/2001JD000335, in press, 2002a.
Silva Dias, M. A. F., et al., A case study of convective organization intoprecipitating lines in the Southwest Amazon during the WETAMC ANDTRMM-LBA, J. Geophys. Res., 107, 10.1029/2001JD000375, in press,2002b.
Tao, W. K., J. Simpson, C. H. Sui, C. L. Shie, B. Zhou, K. M. Lau, andM. Moncrieff, Equilibrium states simulated by cloud-resolving models,J. Atmos. Sci., 56, 3128–3139, 1999.
Tompkins, A. M., The organization of tropical convection in low verticalwind shears: The role of cold pools, J. Atmos. Sci., 58, 1650–1672, 2001.
Zipser, E. J., The role of organized unsaturated convective downdrafts inthe structure and rapid decay of an equatorial disturbance, J. Appl. Me-teorol., 8, 799–814, 1969.
�����������A. K. Betts and J. H. Ball, Atmospheric Research, 58 Hendee Lane,
Pittsford, VT 05763, USA. ([email protected])J. D. Fuentes and M. Garstang, Department of Environmental Sciences,
University of Virginia, Charlottesville, VA, USA.
LBA 32 - 14 BETTS ET AL.: SURFACE DIURNAL CYCLE AND BOUNDARY LAYER STRUCTURE

Figure 1. (opposite) (Top) Diurnal cycle of q, q, qE, and PLCL on DOY = 25 (left) and (right) S-Pol radar scan at 1903UTC (1503 LST). (Middle) As top for DOY = 54 with S-Pol radar scan at 1801 UTC (1401 LST). (Bottom) As top forDOY = 44 and S-Pol radar scan at 1807 UTC (1407 LST).
BETTS ET AL.: SURFACE DIURNAL CYCLE AND BOUNDARY LAYER STRUCTURE
LBA 32 - 4
BETTS ET AL.: SURFACE DIURNAL CYCLE AND BOUNDARY LAYER STRUCTURE
LBA 32 - 5