Support Systems for Poor Readers: Empirical Data From Six EU Member States
19
http://ldx.sagepub.com/ Journal of Learning Disabilities http://ldx.sagepub.com/content/early/2010/07/06/0022219410374235 The online version of this article can be found at: DOI: 10.1177/0022219410374235 published online 8 July 2010 J Learn Disabil Vaessen, Valeria Csépe, Heikki Lyytinen, Alexandra Reis, Johannes C. Ziegler and Gerd Schulte-Körne Elena Ise, Leo Blomert, Daisy Bertrand, Luis Faísca, Anne Puolakanaho, Nina L. Saine, Zsuzsanna Surányi, Anniek Support Systems for Poor Readers: Empirical Data From Six EU Member States Published by: Hammill Institute on Disabilities and http://www.sagepublications.com can be found at: Journal of Learning Disabilities Additional services and information for http://ldx.sagepub.com/cgi/alerts Email Alerts: http://ldx.sagepub.com/subscriptions Subscriptions: http://www.sagepub.com/journalsReprints.nav Reprints: http://www.sagepub.com/journalsPermissions.nav Permissions: at UB Muenchen/Kontakstelle on July 12, 2010 ldx.sagepub.com Downloaded from
Transcript of Support Systems for Poor Readers: Empirical Data From Six EU Member States

http://ldx.sagepub.com/
Journal of Learning Disabilities
http://ldx.sagepub.com/content/early/2010/07/06/0022219410374235The online version of this article can be found at:
DOI: 10.1177/0022219410374235
published online 8 July 2010J Learn DisabilVaessen, Valeria Csépe, Heikki Lyytinen, Alexandra Reis, Johannes C. Ziegler and Gerd Schulte-Körne
Elena Ise, Leo Blomert, Daisy Bertrand, Luis Faísca, Anne Puolakanaho, Nina L. Saine, Zsuzsanna Surányi, AnniekSupport Systems for Poor Readers: Empirical Data From Six EU Member States
Published by:
Hammill Institute on Disabilities
and
http://www.sagepublications.com
can be found at:Journal of Learning DisabilitiesAdditional services and information for
http://ldx.sagepub.com/cgi/alertsEmail Alerts:
http://ldx.sagepub.com/subscriptionsSubscriptions:
http://www.sagepub.com/journalsReprints.navReprints:
http://www.sagepub.com/journalsPermissions.navPermissions:
at UB Muenchen/Kontakstelle on July 12, 2010ldx.sagepub.comDownloaded from

Journal of Learning DisabilitiesXX(X) 1 –18© Hammill Institute on Disabilities 2010Reprints and permission: sagepub.com/journalsPermissions.navDOI: 10.1177/0022219410374235http://journaloflearningdisabilities .sagepub.com
Support Systems for Poor Readers: Empirical Data From Six EU Member States
Elena Ise1, Leo Blomert2, Daisy Bertrand3, Luís Faísca4,Anne Puolakanaho5, Nina L. Saine5, Zsuzsanna Surányi6,Anniek Vaessen2, Valeria Csépe6, Heikki Lyytinen5,Alexandra Reis4, Johannes C. Ziegler3, and Gerd Schulte-Körne1
Abstract
This study surveyed and compared support systems for poor readers in six member states of the European Union (EU). The goal was to identify features of effective support systems. A large-scale questionnaire survey was conducted among mainstream teachers (n = 4,210) and remedial teachers (n = 2,395). Results indicate that the six support systems differed substantially, with effective support systems showing high performance on all variables measured. More specifically, effective support systems were characterized by (a) high levels of both teacher and student support and (b) frequent interactions between teachers and remedial teachers as well as between remedial teachers and diagnosticians. The high prevalence of poor reading ability in the current EU member states demonstrates that educational reforms are critically needed. The results of this study provide concrete starting points for improving support systems for poor readers.
Keywords
reading ability, poor reader, support, school, remedial teacher
Individuals who struggle to read face difficulties in many everyday-life situations. Children and adolescents with poor reading abilities are more likely to develop emotional and behavioral problems (Arnold et al., 2005; Fluss et al., 2009; Maughan, Rowe, Loeber, & Stouthamer-Loeber, 2003; Morgan, Farkas, Tufis, & Sperling, 2008) and have a greater chance of school dropout, low educational achievement, and unemployment (Daniel et al., 2006; Maughan, 1995; Maughan, Hagell, Rutter, & Yule, 1994). Poor readers are therefore con-sidered to be an at-risk group for failure in both academic and social life (e.g., Stanat et al., 2002).
Since 2000, the Program for International Student Assess-ment (PISA) of the Organisation for Economic Co-operation and Development (OECD) has been measuring 15-year-olds’ academic achievement across the world in a 3-year cycle. Nearly 400,000 students from 57 countries participated in the PISA 2006 assessment. Pencil-and-paper assessments (2 hr per student) were used to cover reading, mathematics, and science achievement (OECD, 2009). PISA results are typi-cally presented as a relative ranking of countries on the basis of students’ average achievement scores (e.g., OECD, 2001, 2007a). Regarding reading achievement, the publication of the first PISA results (OECD, 2001) has been an unpleasant
surprise for many countries, whose educational policy makers were astonished to find out that their students performed at or below the OECD average.
In addition to the relative ranking of countries, the PISA study provides information about the range of students’ per-formance in a given country. Students’ reading scores are categorized into five proficiency levels. The lowest profi-ciency level represents students who read at an elementary level but have difficulties comprehending even simple and well-structured texts. Therefore, students performing at or below Proficiency Level 1 are considered to be at-risk stu-dents. A reanalysis of the PISA 2003 data by the Danish
1University of Munich, Munich, Germany2Maastricht University, Maastricht, Netherlands3Aix-Marseille University and CNRS, Marseille, France4University of Algarve, Faro, Portugal5University of Jyväskylä, Jyväskylä, Finland6Hungarian Academy of Sciences, Budapest, Hungary
Corresponding Author:Gerd Schulte-Körne, University of Munich, Department of Child and Adolescent Psychiatry, Pettenkoferstrasse 8a, 80336 Munich, GermanyEmail: [email protected]
J Learn Disabil OnlineFirst, published on July 8, 2010 as doi:10.1177/0022219410374235
at UB Muenchen/Kontakstelle on July 12, 2010ldx.sagepub.comDownloaded from

2 Journal of Learning Disabilities XX(X)
Technological Institute (Haahr, Nielsen, Hansen, & Jacobsen, 2005) highlighted that variance in students’ reading perfor-mance is much higher within countries than between countries: Only one tenth of the total variance lies between countries; the remaining nine tenths of the variance occurs within coun-tries. Interestingly, a number of countries with relatively little variation in students’ reading achievement (e.g., relatively few at-risk students) are also countries where the average achievement is high. Policy makers are therefore recom-mended to reduce skill disparities and to focus their efforts toward at-risk students. The PROREAD research project aimed at supporting these efforts by providing information about national school-based support systems that are effective in terms of reducing the prevalence of students with poor reading ability (at-risk students; see Note 1).
The support systems for poor readers and their teachers that are provided by national educational systems differ con-siderably between countries. During the past decade, educa-tional policy makers have shown increased interest in learning about their organization and key elements. In 2003, a com-parison of support systems in six industrial countries that performed successfully in the PISA 2000 assessment (five European countries and Canada) was published by the German Federal Ministry of Education and Research. For each of the six countries, a working group of national experts completed a questionnaire on their national support systems. It was found that the six systems shared three important features. First of all, professional advice on the basis of a systematic evaluation of students’ performance is provided at various levels, such as school advisory services, administrative bodies, and inspec-tors. Second, priority is given to providing teachers with in-service training and/or coaching possibilities. Third, school leaders are given the opportunity to participate in leadership training (Bundesministerium für Bildung und Forschung, 2003; OECD, 2004). It is tempting to conclude that these features are characteristic of effective support systems. How-ever, because support systems of countries that performed poor in the PISA assessment were not included in the study, it cannot be ruled out that these features might also be char-acteristic of less effective support systems.
The objective of the PROREAD study was to survey and compare support systems for poor readers in six member states of the European Union (EU; Finland, France, Germany, Hungary, the Netherlands, and Portugal) using a large-scale questionnaire approach (see Note 2). The aim was to identify features that are characteristic of effective support systems. Because the prevalence of at-risk students that was found in the PISA 2006 assessment differed considerably among the six countries (OECD, 2007b), it was possible to classify the support systems as effective or less effective. Finland and the Netherlands were considered as having rather effective sup-port systems because the proportion of at-risk students was
fairly low (4.8% and 15.1%, respectively). Germany, Hungary, France, and Portugal were considered as having less effective support systems because the proportion of at-risk students was above 20% in each of these countries: Germany (20.1%), Hungary (20.6%), France (21.8%), and Portugal (24.9%).
Learning to Read in Different OrthographiesPhonological decoding is seen as the sine qua non of early reading development (Share, 1995). Phonological decoding is, at least partially, dependent on phonological awareness skills, which predict subsequent reading ability across lan-guages (Bradley & Bryant, 1983; Lundberg, Olofsson, & Wall, 1980; Muter, Hulme, Snowling, & Stevenson, 2004, Snowling, 1995; Wagner et al., 1997; Ziegler et al., 2010) and correlate moderately with concurrent real-word reading (Swanson, Trainin, Necoechea, & Hammill, 2003). However, phonologi-cal decoding is more than phonological awareness. It also requires insight into the alphabetic principle and the ability to generate alternative pronunciations and choose among them (Kirby, Desrochers, Roth, & Lai, 2008). As orthographies differ with regard to the consistency with which graphemes map onto phonemes, learning to read might proceed differently in different languages (Ziegler & Goswami, 2006).
Transparent orthographies have consistent grapheme–phoneme correspondences, whereas deep orthographies have ambiguous, partially inconsistent, or relatively com-plex grapheme–phoneme correspondences (e.g., Borgwaldt, Hellwig, & de Groot, 2005; Ziegler, Stone, & Jacobs, 1997). It has repeatedly been demonstrated that learning to read transparent orthographies progresses faster than learning to read less transparent orthographies (Aro & Wimmer, 2003; Seymour, Aro, & Erskine, 2003; also see Ziegler & Goswami, 2005, 2006). However, the influence of ortho-graphic transparency seems to be greatest during the initial phases of learning to read. For instance, Frith, Wimmer, and Landerl (1998) compared reading accuracy of children learning to read English (deep orthography) versus German (transparent orthography). Reading accuracy was lower for English than for German-speaking 8-year-olds. By the age of 12, however, the English fully caught up with the Germans in terms of word reading accuracy. A recent study (part of the present PROREAD research project) confirmed this pattern with respect to word reading speed (Vaessen et al., in press). The authors showed that although Portu-guese children lagged behind Dutch and Hungarian children during the first three grades, speed differences disappeared in Grade 4. It can be concluded that the influence of ortho-graphic transparency vanishes over time and is therefore unlikely to fully explain national differences in the preva-lence of at-risk students among 15-year-olds that were found in PISA 2006.
at UB Muenchen/Kontakstelle on July 12, 2010ldx.sagepub.comDownloaded from

Ise et al. 3
Learning to Read With Different Instructional Approaches
In English-speaking countries, reading is traditionally taught using phonics or whole-word instruction (Rayner, Foorman, Perfetti, Pesetsky, & Seidenberg, 2001). Phonics instruction emphasizes the relationship between graphemes and pho-nemes, whereas whole-word instructional approaches rely on teaching a sight vocabulary (“look–say” methods). A meta-analysis that was conducted by the National Reading Panel (2000) showed that “systematic phonics instruction makes a more significant contribution to children’s growth in read-ing than do alternative programs providing unsystematic or no phonics instruction” (Chapter 2, Part II, pp. 2–132; also see Ehri, Nunes, Stahl, & Willows, 2001). Almost all teaching programs in transparent languages include the teaching of letter–sound correspondences.
Interestingly, the impact of different teaching methods seems to be minor in comparison to the impact of ortho-graphic transparency (see Ziegler & Goswami, 2005, 2006). For example, Landerl (2000) investigated first grade students’ performance on a nonword reading task. She found that Eng-lish children who were being taught to read by phonics instruction did not differ significantly from children learning to read with a “standard” mixed method of phonics and whole-word instruction (error rates were 43% and 50%, respectively). In contrast, the error rate in a matched German sample who received phonics instruction was only 12%.
However, the PISA study showed that countries with com-parable reading instruction approaches and languages of com-parable orthographic transparency still differ widely in students’ reading achievement. As a case in point, take Finnish and Italian. Both scripts are highly transparent, and grapheme–phoneme (phonics) teaching is used exclusively in both lan-guages. Yet at the end of Grade 1, reading performance in Finland is far better than reading performance in Italy (Seymour et al., 2003), which clearly points to the importance of factors other than script transparency and teaching approaches.
Learning to Read in Different School SystemsAn extensive body of school effectiveness research has inves-tigated the relationship between classroom practices and student outcomes. It has been demonstrated that students’ achievement is correlated with instructional time engaged in academic tasks and certain patterns of classroom manage-ment and teacher–student interaction (Soar, 1973; Stallings, Robbins, Presbrey, & Scott, 1986). Haahr and colleagues (2005) investigated whether individualized reading instruction leads to better reading achievement than reading instruction as a whole-class activity. To address this issue, they analyzed data that were provided by the Progress in International
Reading Literacy Study (PIRLS 2001). In PIRLS, teachers described how they typically organized reading instruction. Countries were found to differ considerably in the percentage of students who were subjected to reading instruction as a whole-class activity versus individual instruction. Interest-ingly, Haahr et al. found that the different approaches to reading instruction did not significantly predict the students’ average reading scores. They concluded that “no single approach to instruction in reading [is] better than others” (Haahr et al., 2005, p. 178). This conclusion is supported by Whetton and Twist (2003), who analyzed the PIRLS 2001 data with respect to how classes are organized and how mate-rials are used in the teaching of reading in different countries. They came to the conclusion that there are no particular prac-tices in classrooms that differentiate between countries with relatively high proportions of at-risk students and those with relatively low proportions of at-risk students.
Another factor that differs between countries is the age at which children start learning to read. In some EU member states, primary education starts at the age of 7 (e.g., Bulgaria, Lithuania, Finland, and Sweden), whereas in most other EU countries primary education starts at age 6 (e.g., France, Germany, Hungary, the Netherlands; Education, Audiovisual and Cultural Executive Agency, 2009). However, there is no straightforward relationship between starting age and the prevalence of poor readers at age 15. High percentages of at-risk students are found in countries with starting age 7 (e.g., Bulgaria 51.1%, Lithuania 25.7%) as well as in countries with earlier starting ages (e.g., Hungary 20.6%, Luxembourg 22.8%). Similarly, relatively low percentages of at-risk stu-dents are found in countries with starting age 7 (e.g., Finland 4.8%, Sweden 15.3%) and in countries with starting age 6 (e.g., the Netherlands 15.1%; OECD, 2007b, Table 6.1a). Whetton and Twist (2003) made a similar comparison on the basis of the PIRLS 2001 data (measuring reading achievement in Grade 4). They observed that all English-speaking coun-tries have an early start to compulsory schooling, which might explain why they tend to show a wide range in students’ performance. However, the authors rejected this explanation because other countries with an early start of education showed narrow achievement ranges (e.g., the Netherlands).
Finally, European school systems differ in the degree of institutional differentiation. Some countries have compre-hensive, nonselective school systems, whereas other countries group students on the basis of their academic potential. Haahr and colleagues (2005) emphasize that all existing systems contain elements of differentiation and that the spectrum from comprehensive to differentiated systems is a continuous one. Analyzing data from PISA 2003, Haahr and colleagues (2005) found that there was no clear statistical relation between the degree of institutional differentiation of school systems and average student performance. There was, however, a clear
at UB Muenchen/Kontakstelle on July 12, 2010ldx.sagepub.comDownloaded from

4 Journal of Learning Disabilities XX(X)
statistical correlation between the degree of institutional dif-ferentiation and the variance in student performance: More differentiated school systems were associated with higher variance in student performance. That is, dividing students into tracks and streams does not increase average student performance. Instead, it promotes disparity “as weak students become weaker and strong students stronger” (p. 173).
The evidence reviewed above demonstrates that different classroom practices and starting ages for formal education might account for some of the variance in student performance but cannot fully explain the differences in 15-year-old stu-dents’ reading achievement between countries. A low degree of institutional differentiation seems to prevent skill disparity and might be a strong candidate for explaining differences in the prevalence of at-risk students.
The PROREAD studyThe PROREAD study aimed at expanding the current knowl-edge base by providing an investigation of national support systems for poor readers and their teachers. Support systems in Finland, France, Germany, Hungary, the Netherlands, and Portugal were surveyed using a large-scale questionnaire approach. On the basis of qualitative descriptions of the national support systems that were provided by researchers and experts in each of the six countries, three common features of the sup-port systems across the six PROREAD countries could be identified (see Figure 1): (a) mainstream teachers (MTs) typi-cally receive some sort of support from the school system to develop their expertise on poor reading ability, (b) MTs gener-ally play a dominant role in identifying children with poor reading ability, but a thorough diagnosis is usually performed by an external expert, and (c) schools usually provide remedial teachers (RTs) who offer remedial training to students with reading difficulties and/or offer extra reading lessons. Because these three features are shared by the support systems of all six countries, they were well suited to be targeted by the ques-tionnaires. We expected differences in these features to relate to the effectiveness of the support systems.
To collect empirical data about the workings of the different support systems, two questionnaires were constructed; one questionnaire aimed at MTs (teaching either Grade 3 or Grade 6), the other at RTs. The first variable of interest was the support for teachers. We were interested in how countries differ in the extent to which teachers are provided with in-service training and/or supervision and how they differ in the extent to which teachers are provided with a professional they can turn to for advice and coaching. We were further interested in find-ing out to what degree countries differ with regard to the fre-quency with which the teachers consult these professionals.
The second variable of interest was the identification of poor readers. We were interested in finding out how countries differ in the extent to which teachers rely on standardized tests as opposed to subjective judgments. We were further interested in the professional background of the expert per-forming reading assessment and how the experts communi-cate the results (“Are there feedback reports?”, “What is the quality of these feedback reports?”).
A third variable of interest was the support for poor readers. We were interested in finding out how countries differ con-cerning the professional background of the RT and their avail-ability (e.g., “How do remedial teachers work within the educational system?”, “How much time resources do remedial teachers have?”). Finally, we were interested in how countries differ regarding the kind of remedial support that poor readers most typically receive.
MethodParticipants
The survey was carried out in six EU member states: Finland, France, Germany, Hungary, the Netherlands, and Portugal. Questionnaires were sent to quasi-randomly selected public schools. Schools were asked to have one RT and one Grade 3 and/or Grade 6 MT fill out a questionnaire. Children in these grades are younger than the 15-year-olds targeted in PISA. The reason for this is that we were interested in evaluating poor reader support before children finish primary education, which—in most EU countries—encompasses the first 6 years of formal schooling. Participation of schools was optional and permission from the ministries of education was granted (if needed).
QuestionnairesTwo questionnaires were constructed, one to be filled out by the MT and one by the RT. On the front page of the question-naires, it was stated that the results of the questionnaire would be used only for scientific purposes and would be processed anonymously. In addition, respondents were informed that the term poor readers referred to all children with severe
(a) support for teachers-and supervision
-and coaching
(c) support for poor readers- professional background of
remedial teacher- availability of remedial teachers- provision of remedial support
(b) identification of poor readers- systematic evaluation of students’
performance- provision of thorough diagnosisby a trained expert
-
-
- provision of in-service trainings
- provision of professional for advice
effectivenesspoor reader
support system
-
--
-
--
-
-
-
-
Figure 1. Features of support systems that are common to the six participating countries
at UB Muenchen/Kontakstelle on July 12, 2010ldx.sagepub.comDownloaded from

Ise et al. 5
reading problems, with or without spelling problems. Each questionnaire took about 20 min to be completed. Question-naires were translated into the six languages, and preliminary versions were piloted in each country to verify the relevance of the selected issues and the specific wording of individual questions. The appendix contains the complete list of ques-tions that pertain to the variables of interest.
ProcedureThe survey was conducted between January and June 2008. The aim was to reach as many potential respondents as possible. The specific sampling procedure differed between countries. In Finland, all public primary schools were con-tacted by email and provided with a link to a website contain-ing online versions of the Finnish questionnaires. In France, paper-and-pencil questionnaires were sent to all public pri-mary and secondary schools in the Academie Aix-Marseille district, which is 1 of 26 regional districts. It is demographi-cally representative as it contains rural as well as urban areas. In Germany, educational ministries in 11 (of 16) districts granted permission. In these 11 districts, 35% of public pri-mary schools and 35% of public secondary schools (randomly selected) were first contacted by email (providing PDF ver-sions of the questionnaires and a link to the German online questionnaires) and later by mail (paper-and pencil question-naires enclosed) to enhance participation. In Hungary, the whole population of public primary schools was contacted by email providing a link to the Hungarian online question-naire. In the Netherlands, 50% of public primary schools (randomly selected) from all 12 provinces were contacted by mail and provided with paper-and-pencil questionnaires. In Portugal, there are 18 districts that are organized into five regional education directories (DREs). Within each DRE, schools are organized in clusters that are formed on a geo-graphical basis. Each cluster is composed of about eight schools. The presidents of all clusters were contacted by email and asked to send the questionnaires to two MTs teach-ing Grade 3, two MTs teaching Grade 6, and two RTs.
Sample SizeA total of 2,395 RTs and 4,210 MTs participated in the survey. Sample sizes are presented in Table 1. A substantial number of MTs reported that they also function as an RT and were therefore excluded from some analyses. The numbers of MTs who do not function as RT are printed in parentheses.
Data AnalysesAll analyses were performed using SPSS for Windows and Microsoft Excel. The different kinds of German secondary schools were not represented equally. German MT Grade 6
data were therefore weighted to make different kinds of secondary schools comparable.
ResultsPrevalence of Poor Reading Ability
MTs were asked to indicate the number of students in their class and to estimate the number of poor readers (defined as “all children with severe reading problems, with or without spelling problems”). The questions are listed in the appendix (see MT-1 and MT-2). The proportion of poor readers (PPR) was calculated by dividing the sum of all poor readers by the sum of all students. MTs who did not answer one of the ques-tions were excluded from the analysis. Some MTs reported surprisingly high proportions of poor readers in their class (even responses of more than 100% of poor readers were found). This suggests that some MTs might not have filled in the questions correctly. We therefore excluded MTs who reported more than 50% of poor readers in their class from the analyses. Results are presented in Figure 2. Interestingly, in all countries except the Netherlands, MTs reported an increase in PPR from Grade 3 to 6. Moreover, in each country, Grade 6 MTs’ estimation of the PPR was higher than the prevalence of at-risk students found in PISA 2006. In agree-ment with the PISA results, we found that Finnish Grade 6 MTs reported the lowest PPR, Dutch Grade 6 MTs the second lowest PPR, and German Grade 6 MTs the third lowest PPR.
Support for TeachersAre in-service training and/or supervision programs provided
by the educational system? MTs were asked to indicate whether their educational system provides in-service training and/or supervision on how to teach children with poor reading ability (see the appendix, MT-3). Figure 3 shows the results for each country and grade level. MTs who also function as RTs were excluded from all analyses in this section. Differences between countries were substantial. Finland was the only country in which more than 80% of the MTs were provided with
Table 1. Sample Size
RT MT Grade 3 MT Grade 6
Finland 372 188 (183) 222 (211)France 51 235 (234) 144 (139)Germany 596 501 (334) 322 (215)Hungary 532 463 (404) 583 (538)Netherlands 645 485 (461) 539 (508)Portugal 199 320 (315) 208 (203)
Note: Numbers in parentheses indicate the number of MTs who do not function as RTs. RT = remedial teacher; MT = mainstream teacher.
at UB Muenchen/Kontakstelle on July 12, 2010ldx.sagepub.comDownloaded from

6 Journal of Learning Disabilities XX(X)
in-service training and/or supervision possibilities. In the Netherlands, Germany, and Hungary, this percentage dropped to less than 80%. The lowest percentages were found in Portugal (39%) and France (26%).
Are there professionals to whom you can turn for advice? MTs were first asked whether there was a contact person (CP) at their school and if so how often they consulted the CP (see the appendix, MT-4 and MT-5). MTs who also function as
10.9%
15.5%
16.9%
24.4%
18.1%
21.0%
26.1%
29.6%
20.8%
18.4%
21.1%
27.7%
0% 10% 20% 30% 40% 50% 60% 70% 80% 90% 100%
3
6
3
6
3
6
3
6
3
6
3
6
Fran
ceG
erm
any
NL
Por
tuga
lF
inla
ndH
unga
ry
Figure 2. Proportion of poor readers for each country and grade level, as reported by mainstream teachers
80.9%
81.3%
27.3%
24.8%
77.4%
62.5%
74.9%
69.6%
76.1%
78.4%
42.3%
32.7%
0% 10% 20% 30% 40% 50% 60% 70% 80% 90% 100%
3
6
3
6
3
6
3
6
3
6
3
6
Fin
land
Fran
ceG
erm
any
Hun
gary
NL
Por
tuga
l
Figure 3. Proportion of mainstream teachers who are provided with in-service training and/or supervision on how to teach children with poor reading ability
at UB Muenchen/Kontakstelle on July 12, 2010ldx.sagepub.comDownloaded from

Ise et al. 7
RT were excluded from all analyses in this section. Countries differed considerably in the percentage of MTs who reported that there was no CP for advice available at their school (Figure 4). The highest percentage was found for French Grade 6 MTs (62.9%). In contrast, less than 5% of Finnish, Hungarian, and Dutch MTs reported having no CP available at school. Figure 4 also demonstrates that countries differed regarding the frequency with which CPs were consulted. The highest percentage of MTs who seek advice on a regular basis was found among Finnish MTs (> 60%).
The MT questionnaire also surveyed whether there was a specialized person outside the school (external expert) who MTs could consult concerning poor readers in their class and, if so, how often this external expert was consulted (see the appendix, MT-6 and MT-7). The results are shown in Figure 5. Countries differed considerably in the percentage of MTs who reported that there was no external expert available. The highest percentage was found in France (> 50%), followed by Portugal (> 30%), and German Grade 6 (25%). In the remaining countries, less than 15% of MTs reported that there was no external expert available.
There were further differences between countries regarding the frequency with which the external experts were consulted. The percentage of MTs who reported consulting the external expert regularly was highest among Hungarian MTs (29.2% of Grade 3 and 14.0% of Grade 6 MTs). In the remaining
countries, this percentage was relatively low (< 12%). In all countries, the percentage of MTs who consulted the external expert sometimes or regularly was higher among Grade 3 than Grade 6 MTs. This is remarkable because Grade 6 MTs report higher percentages of poor readers than Grade 3 MTs in most countries. Interestingly, two thirds of the French MTs reported that there was no external expert available or that they never (or only in exceptional cases) consulted this external expert.
Identification of Poor ReadersHow is poor reading ability identified? RTs were asked to
indicate whether, at their school, poor readers are generally signaled by means of standardized testing or by means of (remedial) teachers’ evaluation (see the appendix, RT-1). Results are presented in Figure 6. There were considerable differences between countries concerning the degree to which standardized tests were used. In the Netherlands and Hungary, more than 75% of RTs reported the use of standardized tests as the most common method. In Finland and France, still more than 60% of RTs chose this answer. In Germany and Portugal, more than 50% of the RTs reported that the use of standardized tests was not the most common method but that teachers’ judgments formed the basis for identifying poor readers.
0% 20% 40% 60% 80% 100%
3
6
3
6
3
6
3
6
3
6
3
6
Fin
land
Fra
nce
Ger
man
yH
unga
ryN
LP
ortu
gal
no professional available never / exceptional cases sometimes regularly
Figure 4. How often do mainstream teachers consult the contact person (CP) at their school?
at UB Muenchen/Kontakstelle on July 12, 2010ldx.sagepub.comDownloaded from

8 Journal of Learning Disabilities XX(X)
How are poor reading abilities diagnosed? The RT question-naire surveyed the professional background of the diagnosti-cian as well as the quality of the feedback report. RTs were
first asked to indicate the professional background of the trained expert to whom children were most typically referred for a thorough diagnosis (see the appendix, RT-2). In each
0% 10% 20% 30% 40% 50% 60% 70% 80% 90% 100%
3
6
36
36
3
6
3
6
3
6
Fin
land
Fran
ceG
erm
any
Hun
gary
NL
Por
tuga
l
no external expert available never / exceptional cases sometimes regularly
Figure 5. How often do mainstream teachers consult the external expert?
Finland
0%
10%
20%
30%
40%
50%
60%
70%
80%
90%
100%
France Germany Hungary Netherlands Portugal
standardized tests teacher’s judgement
Figure 6. The most typical method used for the identification of poor readersNote: Bars depict percentages of remedial teachers within a country.
at UB Muenchen/Kontakstelle on July 12, 2010ldx.sagepub.comDownloaded from

Ise et al. 9
country, less than 3% of the RTs reported that there was no trained expert available. However, countries differed regard-ing the professional background of the diagnostician. In Finland, the majority of RTs (70.7%) reported that the diag-nostician was a psychologist. Only 21.2% of the Finish RTs reported that the diagnostician was a special educator. The majority of French RTs (70.0%) reported that the diagnostician was a (remedial) teacher, and 27.5% reported that the diag-nostician was a speech therapist. In Germany, a thorough diagnosis was performed by a (remedial) teacher (37.4%), a psychologist (21.8%), or a special educator (16.3%). In Hungary, RTs reported that diagnosticians were trained as either special educators (49.9%) or speech therapists (27.0%). The majority of Dutch RTs reported that the diagnostician is a special educator (60.5%), but (remedial) teachers (18.9%) and psychologists (15.4%) were also common. In Portugal, most RTs reported that diagnostics were performed by a psy-chologist (64.8%) or a (remedial) teacher (13.6%).
RTs were further asked to indicate whether they receive a feedback report from the diagnostician and, if so, to rate the quality of this feedback report on a 5-point scale (1 = very poor, 5 = very good; see the appendix, RT-3). Results are presented in Table 2. In Finland, Hungary, the Netherlands, and Portugal, the majority of RTs (> 75%) reported that they received a feed-back report. In contrast, less than half of French and German RTs received a report. The majority of French RTs made the reports themselves. In Germany, about one third of RTs made the report themselves, but there was still a high percentage of RTs who did not receive a report. An ANOVA was performed to compare mean values of RTs’ ratings of the quality of the feedback report between countries. There was a significant main effect of country, F(5, 1678) = 5.86, p < .001. Post hoc tests (Tukey) revealed that Portuguese RTs rated the quality signifi-cantly lower than Finnish, German, Hungarian, and Dutch RTs.
Support for Poor ReadersWhat is the professional background of RTs? RTs were asked
to choose their professional training from a list of professions
(see the appendix, RT-4). Results demonstrate that within a given country, RTs often shared the same professional back-ground. In Finland, 91.4% of the RTs indicated that they were trained as a special educator. French RTs were also mostly trained as a special educator (81.2%). Only 16.7% of the French RT indicated that they were trained as teachers. In Germany, the Netherlands, and Portugal, the large majority of RTs were trained as teachers (92.2%, 96.3%, and 93.0%, respectively). In Hungary, 52.8% of the RT indicated that they were trained as special educators, whereas 34.5% were trained as teachers. Other response options, such as psycholo-gist and speech therapist, were chosen by less than 6% of MTs in a given country.
How available are RTs? RTs were asked to describe their work situation by choosing one of three response options: (a) “I am a regular teacher with additional hours for remedial activities,” (b) “remedial teaching is my main job at one school,” and (c) “remedial teaching is my main job at several schools” (see the appendix, RT-5). RTs were further asked to indicate how many hours a week they spend on remedial activities at one school (see the appendix, RT-6). The results are presented in Figure 7 and Table 3.
The ways in which RTs work within the educational sys-tem as well as their time resources differed substantially between countries. In Finland, RTs were usually special educators and remedial teaching was their main job at one or several schools. Finnish RTs who support only one school spent an average of 23.2 hr per week at one school, whereas Finnish RTs who support several schools reported an average of 11.2 hr per week. The majority of French RTs were special educators. In contrast to their Finnish colleagues, most of the French RTs (84%) worked at several schools, spending an average of 14.3 hr a week on remedial activities at one school. German RTs were mostly trained as a teacher and typi-cally worked at only one school, usually as a regular teacher with an average of 3.7 additional hr per week for remedial activities (82% of RT). A minority (12%) indicated that remedial teaching was their main job, spending on average 16.5 hr a week on remedial activities. Compared to the other
Table 2. Feedback Report From the Diagnostician
Quality of Reporta
(If Received)% of RTs Who
Receive a Report% of RTs Who Do
Not Receive a Report% of RTs Who Make
the Report M SD
Finland 77.1 7.6 15.3 3.8 0.8France 36.7 6.1 57.1 3.9 0.5Germany 45.1 22.4 32.5 3.8 0.9Hungary 86.5 4.2 9.3 3.8 0.7Netherlands 86.2 4.5 9.3 3.9 0.7Portugal 80.4 7.9 11.6 3.5 0.8
aMean rating of the quality of the feedback report (5-point scale: 1 = very poor, 5 = very good).
at UB Muenchen/Kontakstelle on July 12, 2010ldx.sagepub.comDownloaded from

10 Journal of Learning Disabilities XX(X)
countries, German RTs had a very limited amount of time available for remedial activities.
Hungarian RTs were usually either special educators (53%) or teachers (35%). They supported only one school, where they functioned as either a regular teacher (42%) with an average of 7.1 additional weekly hr or a RT (50%) with an average of 20.7 hr a week spent on remedial activities. In the Netherlands, most RTs were trained as a teacher (96%). Like the Hungarian RTs, they usually supported only one school. One third (33%) of Dutch RTs worked as regular
teachers and spent on average of 5.1 hr a week for remedial activities. Less than two thirds (59%) of RTs reported that remedial teaching was their main job at one school, spending on average 7.7 hr a week. Like the German RTs, they had limited time resources (compared to RT in the remaining countries). Portuguese RTs were usually trained as a teacher (93%), and they all reported that remedial teaching is their main job. RTs who supported only one school spent on aver-age 18.1 hr a week (SD = 7.8) on remedial activities. RTs who supported several schools spent on average 16.0 hr a week (SD = 7.3) on these tasks.
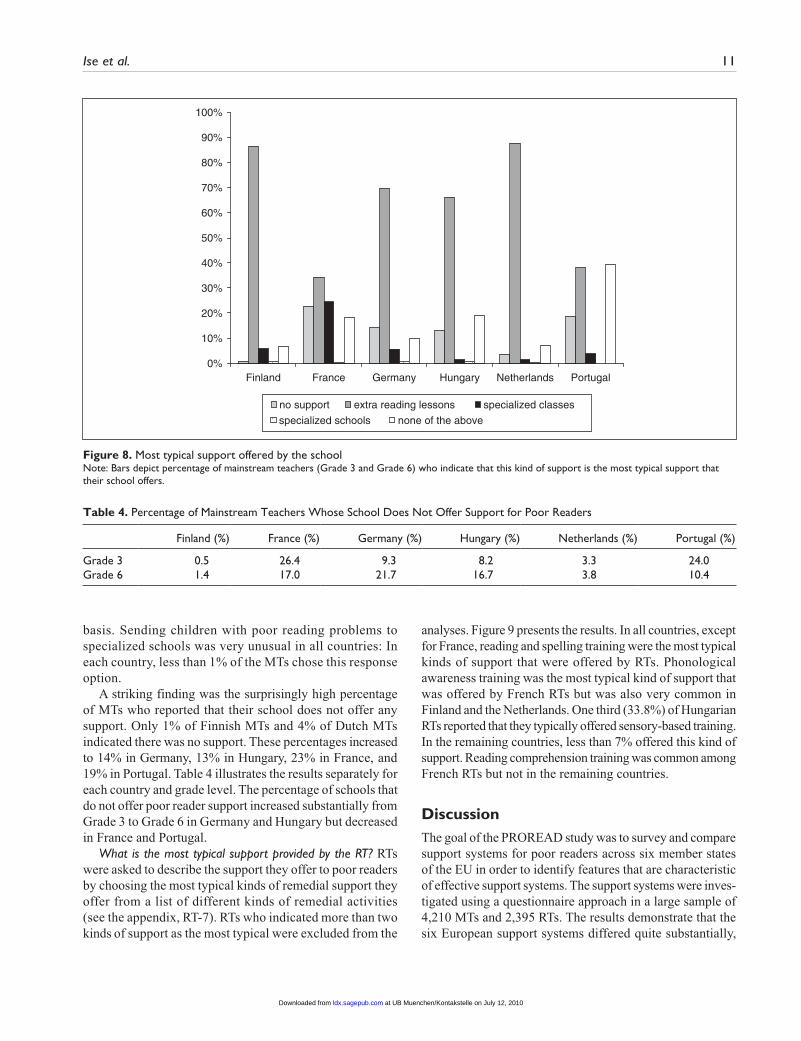
What is the most typical kind of support for readers provided by the school? MTs were asked to indicate the most typical form of poor reader support offered by their school. They could choose one of five response options: (a) there is no support available, (b) extra reading lessons, (c) cluster children with severe reading problems in special classes, (d) sending stu-dents to specialized schools, and (e) none of the above (see the appendix, MT-8). Results are presented in Figure 8.
In Finland, Germany, Hungary, and the Netherlands, the majority of schools supported poor readers by offering extra reading lessons. In contrast, in Portugal and France, fewer than half of the MTs indicated that their school typically offers extra reading lessons. Clustering students with reading problems in specialized classes was not a common practice in European school systems: Only one country, France, seemed to cluster students with reading problems on a regular
0%
10%
20%
30%
40%
50%
60%
70%
80%
90%
Finland France Germany Hungary Netherlands Portugal
regular teacher with additional hours RT is main job at one school
RT is main job at several schools
Figure 7. How do remedial teachers work within the school system?Note: Bars depict percentages of remedial teachers within a country.
Table 3. Hours per Week Spent on Remedial Activitiesat One School
Teacher With
Additional Hours
Main Job at One School
Main Job at Several Schools Total
M SD M SD M SD M SD
Finland — 23.2 5.2 11.2 6.5 18.3 8.2France — — 14.3 7.5 14.1 7.8Germany 3.7 3.5 16.5 9.3 8.5 5.0 5.6 6.3Hungary 7.1 5.3 20.7 6.8 14.2 9.2 14.2 9.1Netherlands 5.1 4.9 7.7 7.0 4.7 4.3 5.1 6.2Portugal — 18.1 7.8 16.0 7.3 17.2 7.7
Note: Cells representing fewer than 10 participants are not filled in.
at UB Muenchen/Kontakstelle on July 12, 2010ldx.sagepub.comDownloaded from
Ise et al. 11
basis. Sending children with poor reading problems to specialized schools was very unusual in all countries: In each country, less than 1% of the MTs chose this response option.
A striking finding was the surprisingly high percentage of MTs who reported that their school does not offer any support. Only 1% of Finnish MTs and 4% of Dutch MTs indicated there was no support. These percentages increased to 14% in Germany, 13% in Hungary, 23% in France, and 19% in Portugal. Table 4 illustrates the results separately for each country and grade level. The percentage of schools that do not offer poor reader support increased substantially from Grade 3 to Grade 6 in Germany and Hungary but decreased in France and Portugal.
What is the most typical support provided by the RT? RTs were asked to describe the support they offer to poor readers by choosing the most typical kinds of remedial support they offer from a list of different kinds of remedial activities (see the appendix, RT-7). RTs who indicated more than two kinds of support as the most typical were excluded from the
analyses. Figure 9 presents the results. In all countries, except for France, reading and spelling training were the most typical kinds of support that were offered by RTs. Phonological awareness training was the most typical kind of support that was offered by French RTs but was also very common in Finland and the Netherlands. One third (33.8%) of Hungarian RTs reported that they typically offered sensory-based training. In the remaining countries, less than 7% offered this kind of support. Reading comprehension training was common among French RTs but not in the remaining countries.
DiscussionThe goal of the PROREAD study was to survey and compare support systems for poor readers across six member states of the EU in order to identify features that are characteristic of effective support systems. The support systems were inves-tigated using a questionnaire approach in a large sample of 4,210 MTs and 2,395 RTs. The results demonstrate that the six European support systems differed quite substantially,
0%
10%
20%
30%
40%
50%
60%
70%
80%
90%
100%
Finland France Germany Hungary Netherlands Portugal
no support extra reading lessons specialized classes
specialized schools none of the above
Figure 8. Most typical support offered by the schoolNote: Bars depict percentage of mainstream teachers (Grade 3 and Grade 6) who indicate that this kind of support is the most typical support that their school offers.
Table 4. Percentage of Mainstream Teachers Whose School Does Not Offer Support for Poor Readers
Finland (%) France (%) Germany (%) Hungary (%) Netherlands (%) Portugal (%)
Grade 3 0.5 26.4 9.3 8.2 3.3 24.0Grade 6 1.4 17.0 21.7 16.7 3.8 10.4
at UB Muenchen/Kontakstelle on July 12, 2010ldx.sagepub.comDownloaded from

12 Journal of Learning Disabilities XX(X)
making it possible to search for features that are systemati-cally linked to reduced prevalence of poor reading ability.
Instead of concentrating on the average student’s reading achievement in a given country, the PROREAD study focused on the prevalence of students whose reading ability is so low that they are considered to be at risk for failure in academic and social life (at-risk students). The PISA 2006 study (OECD, 2007b) showed that among the six participating EU countries, Finland has the lowest prevalence of at-risk students (4.8%), indicating that the Finnish support system is very effective in terms of reducing the number of at-risk students. The Dutch support system is also considered to be effective (15% at-risk students). In the following discussion, the term effective sup-port systems is therefore used to refer to both the Finish and the Dutch support systems. Germany, Hungary, France, and Portugal have less effective support systems: more than 20% of the 15-year-olds in these countries are considered to be at risk.
On the basis of qualitative descriptions of the national support systems, we specified three features that might influ-ence system effectiveness: (a) the way teachers are supported, (b) the way poor reading skills are identified and diagnosed, and (c) the way poor readers are supported. Most importantly, we found that the six countries differed on all three variables and that these differences relate to the effectiveness of the support system.
More specifically, we found that effective support systems offer in-service training and/or coaching possibilities to the large majority of their teachers. They also provide external experts to the large majority of their teachers. However, most of these teachers do not consult the external expert on a regular basis. The reason hereof might be that virtually all teachers in effective support systems have a contact person (CP) at their school whom they can ask for advice concerning poor
reading ability. Interestingly, the most effective support system (Finland) was characterized by a large proportion of teachers (> 60%) who consulted this CP on a regular basis. These fre-quent interactions were probably facilitated by the high time resources of Finnish RTs: Finnish RTs typically worked for a single school where they spent a mean of 18 hrs per week.
High availability of RTs in effective support systems also seems to influence the quantity of support that is offered to poor readers. In effective support systems, more than 95% of schools offer support for poor readers (mostly extra reading lessons).
We also found that effective support systems most typically identify poor reading skills by standardized testing, followed by a thorough diagnosis by a trained expert (psychologist or special educator). Importantly, in effective support systems, there seems to be a well-functioning communication stream between diagnosticians and schools: In effective systems, RTs are regularly informed about the diagnosis by a feedback report.
One of the most important findings of our study is that there is not a single variable that differentiates between effective and less effective support systems. We found that countries with low percentages of at-risk students are char-acterized by high performance on all variables. In contrast, countries with a high prevalence of poor readers were found to perform well on some variables but not on others. Germany, for example, provided CPs to the large majority of teachers. However, the CPs (mostly RTs) had very limited time resources, which is likely to be the reason for the relatively low proportion of German teachers who consulted them regularly and the relatively high percentage of schools that did not provide support for poor readers. Another example is France. French RTs reported high time resources (14 hrs per week). However, relatively few teachers reported that
0%
20%
40%
60%
80%
100%
Finland France Germany Hungary Netherlands Portugal
phonological awareness training reading and spelling training
reading comprehension training sensory-based training
Figure 9. Kind of poor reader support offered by remedial teachersNote: Bars depict percentages of remedial teachers within a country who typically offer this kind of support (two answers were possible).
at UB Muenchen/Kontakstelle on July 12, 2010ldx.sagepub.comDownloaded from

Ise et al. 13
they had a CP (RT) at their school, and a high percentage of schools did not provide support for poor readers.
Our findings are consistent with and provide empirical support for an earlier comparison of support systems that was published by the German Federal Ministry of Education and Research (Bundesministerium für Bildung und Forschung, 2003). This study identified aspects of effective support systems, including the importance of in-service training and/or coaching possibilities and systematic evaluation of stu-dents’ performance.
Collaboration between MTs and special educators is grounded in the idea that each educator has a unique knowl-edge base and expertise that complement each other (e.g., Van Gaderen, Scheuermann, Jackson, & Hampton, 2009). Our results support the idea that teachers who have the pos-sibility to develop their expertise through consultation with professionals in the field of reading disabilities are better equipped to meet the needs of children with poor reading ability in their class.
Our results are also in line with current research on the accuracy of teacher judgments of student achievement. It has been demonstrated that teacher judgments correlate signifi-cantly with standardized achievement test scores (e.g., Hoge & Coladarci, 1989) and that teachers are accurate reporters of students reading performance (Feinberg & Shapiro, 2003). However, recent studies highlight that teachers tend to over-estimate the reading ability of low-achieving students (Bates & Nettelbeck, 2001), find it difficult to identify poor readers (Madeleine & Wheldall, 2005), and overestimate reading progress of low-performing students (Graney, 2008). These findings suggest that standardized tests yield more objective and accurate measures of reading ability and are better suited for the identification of poor readers. We did indeed find that effective support systems tended to rely on standardized tests as a means of signaling poor reading ability.
A potential limitation of the present study is the rather narrow focus on school-based support systems. It is widely accepted that students’ reading ability in different orthogra-phies is influenced by a number of variables on multiple levels. At the student level, for example, reading ability is related to phonological processing skills (Bradley & Bryant, 1983) and cognitive processes associated with automatic, rapid access to word representations (Wolf, Bowers, & Biddle, 2000). Students’ reading achievement has also been found to be related to home literacy experiences such as joint book reading (Bus, van IJzendoorn, & Pellegrine, 1995) and parent involve-ment in teaching about reading (Sénéchal & LeFevre, 2002). In addition, there are differences between countries that might influence the prevalence of poor readers, such as the degree of institutional differentiation and the funding of reading support. To investigate the complex interaction between the many different variables on multiple levels, objective data on students’ reading ability are needed. In the present study,
the effectiveness of a support system was determined by the prevalence of at-risk students that was found in the PISA 2006 study (OECD, 2007b), because—to our knowledge—no other study provides objective measures of the prevalence of poor readers for all six participating EU countries. We refrained from performing a regression analysis because using data from the PISA 2006 study as a dependent variable would mean that there is one and the same value for each teacher in a given country, which comes down to predicting six data points. An objective measure of students’ reading skills in each school would have enabled a more fine-grained analysis of the amount of variance contributed by each of the variables that we found to be systematically linked to the effectiveness of national support systems. Future research should ideally investigate students’ reading ability over the course of several years, so that it becomes clear how the different variables interact and how a decline in the prevalence of poor readers can best be predicted.
Another potential limitation of our study is the fact that teacher knowledge on reading was not included. A growing body of research demonstrates that kindergarten and early elementary grade teachers’ knowledge of the concept of phonological awareness is limited (Bos, Mather, Dickson, Podhajski, & Chard, 2001) and that teachers are not adequately prepared for systematic instruction in phonological awareness and letter–sound correspondences (Mather, Bos, & Babur, 2001; Moats, 1994). Several studies have shown that improv-ing teachers’ knowledge of word structure and reading-related concepts is related to improvements in students’ reading achievement (McCutchen et al., 2002; Spear-Swerling & Brucker, 2004). Unfortunately, the research literature on teacher knowledge has almost exclusively centered on U.S. teachers and is sparse for European countries. We refrained from investigating teacher knowledge and quality of teacher training in the present study because teachers tend to over-estimate their reading-related knowledge (Cunningham, Stanovich, & Stanovich, 2004) and teachers’ perception of adequate teacher training often does not match the actual quality of the training (Lyon, Vaassen, & Toomey, 1989). The results of the present study show that in countries with effective sup-port systems, the majority of teachers indicate that in-service trainings and/or supervision on how to teach children with poor reading ability are provided. However, we recognize the impor-tance of a more fine-grained investigation of the quality of teacher knowledge and teacher support. Future research is needed to investigate the role played by teacher knowledge in determining support system effectiveness.
ImplicationsPolicy makers have been encouraged to reduce skill disparities and focus their efforts toward at-risk students (Haahr et al., 2005). Unfortunately, concrete and empirically validated
at UB Muenchen/Kontakstelle on July 12, 2010ldx.sagepub.comDownloaded from

14 Journal of Learning Disabilities XX(X)
information about how educational reforms should be con-ducted has been rare. More differentiated school systems are associated with higher variance in student performance (Haahr et al., 2005), but reducing the degree of institutional differentiation would present a fundamental change in the educational system for many countries. Research focusing on the influence of different teaching methods, classroom practices, and starting ages for formal education has not been successful in identifying factors that relate to differences in reading achievement between countries (Haahr et al., 2005; Whetton & Twist, 2003). The PROREAD study is one of the first empirical studies to come up with concrete starting points for educational reforms.
Effective poor reader support systems are characterized by high levels of both teacher and student support. Less effec-tive support systems were found to provide high levels of support either for students or for teachers, but it was the com-bination of both kinds of support that was crucial for differ-entiating between effective and less effective support systems. Support systems can be improved (a) by providing more pos-sibilities for teachers to improve their expertise through in-service training, courses, coaching, and CPs and (b) by providing more support for students by offering more extra reading lessons. However, improving a support system may also call for some qualitative changes. Effective support sys-tems are characterized by frequent interactions both between teachers and RTs and between RTs and diagnosticians.
Initiating and sustaining changes in education is a complex undertaking. As Noell and Gansle (2009) have highlighted, ethical and pragmatic concerns tend to be barriers to positive change. Changes in behavioral patterns often require partici-pants to invest time. Voltz, Elliott, and Cobb (1994) showed that teachers collaborated less often with special educators than they would like to, indicating lack of time as a major barrier. However, some changes might be easier to implement than others. For example, Deno et al. (2009) demonstrated that it is possible to implement schoolwide screening and progress monitoring in reading without investing large amounts of time and resources. Even though educational reforms might be time-consuming and costly, the large pro-portions of children whose reading ability is so poor that they are at risk for failure in academic and social life show that improvement of current support systems is critically needed.
AppendixList of Relevant Questions
Mainstream Teacher (MT) Questionnaire
MT-1. How many students are in your class?If you teach more classes, please indicate the average
number of students per class!
MT-2. How many students in your class would you describe as “poor readers”?
If you teach more classes, please indicate the average number of “poor readers” per class!
MT-3. Does your school support service provide teacher training programs and/or supervision on how to teach children with poor reading abilities? Yes/No
MT-4. Is there a professional at your school that you can ask for advice concerning poor readers? Yes/No
MT-5. How often do you seek advice regarding poor reader support?
never or in exceptional cases/sometimes/regularly/no professional available
MT-6. Is there a specialized person outside your school that you can ask for advice regarding poor readers in your class? Yes/No
MT-7. How often do you seek advice from the external expert regarding poor reader support?
never or in exceptional cases/sometimes/regularly/no external expert available
MT-8. Please indicate the most typical form of poor reader’s support that your school offers to poor read-ers, in addition to your normal classroom support! Please choose only one answer!
• There is no support available • Extra reading lessons (group wise and/or
individually) • Cluster children with severe reading problems in
special classes • Sending students to specialized schools • None of the above
Remedial Teacher (RT) Questionnaire
RT-1. How are poor readers signaled/identified at your school(s)? Please specify the most common method!
• (Remedial) teacher’s evaluation/judgment, no stan-dardized testing
• (Remedial) teacher’s evaluation/judgment by means of standardized tests
RT-2. Who is the trained expert to whom poor readers are referred for diagnostics (most typically)? Please choose only one answer!
• No formal assessment/no trained expert available • Psychologist • Special educator • Speech therapist
Appendix (continued)
(continued)
at UB Muenchen/Kontakstelle on July 12, 2010ldx.sagepub.comDownloaded from

Ise et al. 15
• Specialized (remedial) teacher • School doctor • Child and adolescent psychiatrist • None of the above/don’t know
RT-3. Please rate the quality of feedback report from the diagnostician!
• I do not receive a feedback report • I make the feedback report • I receive feedback reports. • Their quality is: very poor 1 – 2 – 3 – 4 – 5 very good
RT-4. You were trained as a:
• Psychologist • Special educator • Teacher • Speech therapist • None of the above
RT-5. Please describe your work situation as remedial teacher!
• I am a regular teacher with additional hours for remedial activities
• Remedial teaching is my main job at one school • Remedial teaching is my main job at several schools
RT-6. Please indicate how many hours a week (on aver-age) you spend on remedial activities at one school!
RT-7. Which of the following describes best the support you offer to poor readers?
• Extra (regular) reading and spelling training • Phonological awareness training • Reading comprehension training • Sensory-based training • None of the above
Acknowledgments
The authors would like to thank the ministries of education and the teachers for their participation in this research.
Declaration of Conflicting Interests
The authors declared no potential conflicts of interests with respect to the authorship and/or publication of this article.
Financial Disclosure/Funding
The authors received the following financial support for the research and/or authorship of this article: This work was supported by Grant 2006-2789/001-001 SO2 61OBGE of the EU-SOCRATES program Action 6.1.2 and 6.2 awarded to Leo Blomert at Maastricht University.
Notes
1. PROREAD: Explaining Low Literacy Levels by Profiling Poor Readers and Their Support.
2. For an analysis of the cognitive determinants of poor reading in these countries, see Ziegler et al. (2010).
References
Arnold, E. M., Goldston, D. B., Walsh, A. K., Reboussin, B. A., Daniel, S. S., Hickman, E., & Wood, F. B. (2005). Severity of emotional and behavioral problems among poor and typical readers. Journal of Abnormal Child Psychology, 33, 205–217.
Aro, M., & Wimmer, H. (2003). Learning to read: English in com-parison to six more regular orthographies. Applied Psycholin-guistics, 24, 621–635.
Bates, C., & Nettelbeck, T. (2001). Primary teachers’ judgments of reading achievement. Educational Psychology, 21, 177–187.
Borgwaldt, S. R., Hellwig, F. M., & de Groot, A. M. B. (2005). Onset entropy matters—Letter-to-phoneme mappings in seven languages. Reading and Writing: An Interdisciplinary Journal, 18, 211–229.
Bos, C., Mather, N., Dickson, S., Podhajski, B., & Chard, D. (2001). Perceptions and knowledge of preservice and inservice educators about early reading instruction. Annals of Dyslexia, 51, 97–118.
Bradley, L., & Bryant, P. E. (1983). Categorising sounds and learning to read: A causal connection. Nature, 301, 419–521.
Bundesministerium für Bildung und Forschung [German Fed-eral Ministry of Education and Reserach]. (2003). Vertiefender Vergleich der Schulsysteme ausgewählter PISA-Teilnehmersta [Comparison of school systems in selected PISA-countries]. Retrieved from http://www.bmbf.de/pub/pisa-vergleichsstudie.pdf
Bus, A. G., van Ijzendoorn, M. H., & Pellegrine, A. D. (1995). Joint book reading makes success in learning to read: A meta-analysis on intergenerational transmission of literacy. Review of Educa-tional Research, 65, 1–21.
Cunningham, A. E., Stanovich, K. E., & Stanovich, P. J. (2004). Disciplinary knowledge of K–3 teachers and their knowledge calibration in the domain of early literacy. Annals of Dyslexia, 54, 139–167.
Daniel, S. S., Walsh, A. K., Goldston, D. B., Arnold, E. M., Reboussin, B. A., & Wood, F. B. (2006). Suicidality, school dropout, and reading problems among adolescents. Journal of Learning Disabilities, 39, 507–514.
Deno, S. L., Reschly, A. L., Lembke, E. S., Magnusson, D., Callender, S. A., Windram, H., & Stachel, N. (2009). Devel-oping a school-wide progress-monitoring system. Psychology in the Schools, 46, 44–55.
Education, Audiovisual and Cultural Executive Agency. (2009). P9 Eurydice: Key data on education in Europe 2009. Retrieved from http://www.eurydice.org
Ehri, L. C., Nunes, S. R., Stahl, S. A., & Willows, D. M. (2001). Systematic phonics instruction helps students learn to read:
Appendix (continued)
at UB Muenchen/Kontakstelle on July 12, 2010ldx.sagepub.comDownloaded from

16 Journal of Learning Disabilities XX(X)
Evidence from the National Reading Panel’s meta-analysis. Review of Educational Research, 71, 393–447.
Feinberg, A. B., & Shapiro, E. S. (2003). Accuracy of teacher judg-ments in predicting oral reading fluency. School Psychology Quarterly, 18, 52–65.
Fluss, J., Ziegler, J. C., Warszawski, J., Ducot, B., Richard, G., & Billard, C. (2009). Poor reading in French elementary school: The interplay of cognitive, behavioral and socioeconomic factors. Journal of Developmental & Behavioral Pediatrics, 30, 206–216.
Frith, U., Wimmer, H., & Landerl, K. (1998). Differences in pho-nological recoding in German- and English-speaking children. Scientific Studies of Reading, 2, 31–54.
Graney, S. B. (2008). General education teacher judgments of their low-performing students’ short-term reading progress. Psychol-ogy in the Schools, 45, 537–549.
Haahr, J. H., Nielsen, T. K., Hansen, M. E., & Jacobsen, S. T. (2005). Explaining student performance: Evidence from the international PISA, TIMSS and PIRLS surveys. Retrieved from http://www.pisa.oecd.org
Hoge, R. D., & Coladarci, T. (1989). Teacher-based judgments of academic achievement: A review of literature. Review of Educational Research, 59, 297–313.
Kirby, J. R., Desrochers, A., Roth, L., & Lai, S. S. V. (2008). Lon-gitudinal predictors of word reading development. Canadian Psychology, 49, 103–110.
Landerl, K. (2000). Influences of orthographic consistency and reading instruction on the development of nonword reading skills. European Journal of Psychology of Education, 15, 239–257.
Lundberg, I., Olofsson, A., & Wall, S. (1980). Reading and spelling skills in the first school years predicted from phonemic aware-ness skills in kindergarten. Scandinavian Journal of Psychology, 21, 159–173.
Lyon, G. R., Vaassen, M., & Toomey, F. (1989). Teacher percep-tions of their undergraduate and graduate training. Teacher Education and Special Education, 12, 164–169.
Madeleine, A., & Wheldall, K. (2005). Identifying low-progress readers: Comparing teacher judgment with a curriculum-based measurement procedure. International Journal of Disability Development and Education, 52, 3–42.
Mather, N., Bos, C., & Babur, N. (2001). Perceptions and knowl-edge of preservice and inservice teachers about early literacy instruction. Journal of Learning Disabilities, 34, 472–482.
Maughan, B. (1995). Annotation: Long-term outcomes of devel-opmental reading problems. Journal of Child Psychology and Psychiatry and Allied Disciplines, 36, 357–371.
Maughan, B., Hagell, A., Rutter, M., & Yule, W. (1994). Poor readers in secondary school. Reading and Writing: An Interdisciplinary Journal, 6, 125–150.
Maughan, B., Rowe, R., Loeber, R., & Stouthamer-Loeber, M. (2003). Reading problems and depressed mood. Journal of Abnormal Child Psychology, 31, 219–229.
McCutchen, D., Abbott, R. D., Green, L., Beretvas, S. N., Cox, S., Potter, N. S., . . . Gray, A. L. (2002). Beginning literacy: Links among teacher knowledge, teacher practice, and student learning. Journal of Learning Disabilities, 35, 69–86.
Moats, L. C. (1994). The missing foundation in teacher education: Knowledge of the structure of spoken and written language. Annals of Dyslexia, 44, 81–102.
Morgan, P. L., Farkas, G., Tufis, P. A., & Sperling, R. A. (2008). Are reading and behavior problems risk factors for each other? Journal of Learning Disabilities, 41, 417–436.
Muter, V., Hulme, C., Snowling, M. J., & Stevenson, J. (2004). Phonemes, rimes, vocabulary, and grammatical skills as founda-tions of early reading development: Evidence from a longitudi-nal study. Developmental Psychology, 40, 665–681.
National Reading Panel. (2000). Teaching children to read: An evidence-based assessment of the scientific research literature on reading and its implications for reading instruction (00-4769). Retrieved from http://www.nichd.nih.gov/publications/nrp/report.cfm
Noell, G. H., & Gansle, K. A. (2009). Moving from good ideas in educational systems change to sustainable program implemen-tation: Coming to terms with some of the realities. Psychology in the Schools, 46, 78–88.
Organisation for Economic Co-operation and Development. (2001). Knowledge and skills for life. First results from the OECD pro-gramme for international student assessment (PISA) 2000. Retrieved from http://www.pisa.oecd.org
Organisation for Economic Co-operation and Development. (2004). What makes school systems perform? Seeing school systems through the prism of PISA. Retrieved from http://www.pisa .oecd.org
Organisation for Economic Co-operation and Development. (2007a). PISA 2006 science competencies for tomorrow’s world. Executive summary. Retrieved from http://www.pisa.oecd.org
Organisation for Economic Co-operation and Development. (2007b). PISA 2006 volume 2: Data. Retrieved from http://www.pisa.oecd.org
Organisation for Economic Co-operation and Development. (2009). PISA 2006 technical report. Retrieved from http://www.oecd.org
Rayner, K., Foorman, B. R., Perfetti, C. A., Pesetsky, D., & Seidenberg, M. S. (2001). How psychological science informs the teaching of reading. Psychological Science in the Public Interest, 2(2), 31–74.
Sénéchal, M., & LeFevre, J.-A. (2002). Parental involvement in the development of children’s reading skill: A five-year longitudinal study. Child Development, 73, 445–460.
Seymour, P. H. K., Aro, M., & Erskine, J. M. (2003). Foundation literacy acquisition in European orthographies. British Journal of Psychology, 94, 143–174.
Share, D. L. (1995). Phonological recoding and self-teaching: Sine qua non of reading acquisition. Cognition, 55, 151–218.
at UB Muenchen/Kontakstelle on July 12, 2010ldx.sagepub.comDownloaded from

Ise et al. 17
Snowling, M. J. (1995). Phonological processing and developmental dyslexia. Journal of Research in Reading, 18, 132–138.
Soar, R. S. (1973). Accountability: Assessment problems and possibilities. Journal of Teacher Education, 24, 205–212.
Spear-Swerling, L., & Brucker, P. O. (2004). Preparing novice teachers to develop basic reading and spelling skills in children. Annals of Dyslexia, 54, 332–364.
Stallings, J., Robbins, P., Presbrey, L., & Scott, J. (1986). Effects of instruction based on the Madeline Hunter model on stu-dents’ achievement: Findings from a follow-through project. Elementary School Journal, 86, 571–587.
Stanat, P., Artelt, C., Baumert, J., Klieme, E., Neubrand, J., Prenzel, M., . . . Weiss, M. (2002). PISA 2000: Overview of the study. Design, methods and results. Berlin, Germany: Max Planck Institute for Human Development.
Swanson, H. L., Trainin, G., Necoechea, D. M., & Hammill, D. D. (2003). Rapid naming, phonological awareness, and reading: A meta-analysis of the correlation evidence. Review of Educa-tional Research, 73, 407–440.
Vaessen, A., Bertrand, D., Tóth, D., Csépe, V., Faísca, L., Reis, A., & Blomert, L. (in press). Cognitive development of fluent word reading does not qualitatively differ between transparent and opaque orthographies. Journal of Educational Psychology.
Van Gaderen, D., Scheuermann, A., Jackson, C., & Hampton, D. (2009). Supporting the collaboration of special educators and gen-eral educators to teach students who struggle with mathematics: An overview of the research. Psychology in the Schools, 46, 56–77.
Voltz, D. L., Elliott, R. N., Jr., & Cobb, H. B. (1994). Collaborative teacher roles: Special and general educators. Journal of Learning Disabilities, 27, 527–535.
Wagner, R. K., Torgesen, J. K., Rashotte, C. A., Hecht, S. A., Barker, T. A., Burgess, S. R., . . . Garon, T. (1997). Changing relations between phonological processing abilities and word-level reading as children develop from beginning to skilled readers: A five year longitudinal study. Developmental Psy-chology, 30, 73–78.
Whetton, C., & Twist, L. (2003, October). What determines the range of reading attainment in a country? Paper presented at the 29th International Association for Educational Assessment Conference, Manchester, UK.
Wolf, M., Bowers, P. G., & Biddle, K. (2000). Naming speed pro-cesses, timing, and reading: A conceptual review. Journal of Learning Disabilities, 33, 387–407.
Ziegler, J. C., Bertrand, D., Tóth, D., Csépe, V., Reis, A., Faísca, L., . . . Blomert, L. (2010). Orthographic depth and its impact on universal predictors of reading: A cross-language investigation. Psychological Science, 21, 551–559.
Ziegler, J. C., & Goswami, U. (2005). Reading acquisition, develop-mental dyslexia, and skilled reading across languages: A psycho-linguistic grain size theory. Psychological Bulletin, 131, 3–19.
Ziegler, J. C., & Goswami, U. (2006). Becoming literate in different languages: Similar problems, different solutions. Developmental Science, 9, 429–453.
Ziegler, J. C., Stone, G. O., & Jacobs, A. M. (1997). What is the pronunciation for -ough and the spelling for u/? A database for computing feedforward and feedback consistency in English. Behavior Research Methods, Instruments & Computers, 29, 600–618.
About the Authors
Elena Ise, is a PhD student at the Department of Child and Adolescent Psychiatry,University of Munich. Her research inter-ests include spelling development, orthographic knowledge and dyslexia.
Leo Blomert is professor of Cognitive Neuroscience, particularly Neurocognition of Literacy & Numeracy at Maastricht Univer-sity. His research interests are: brain models of literacy and numeracy development, dyslexia and dyscalculia.
Daisy Bertrand is an ERC postdoctoral fellow at the CNRS and Aix-Marseille University. Her interests include statistical model-ing of cognitive processes involved in reading, music and perception.
Luís Faísca is Assistant Professor at Universidade do Algarve. His main research interests include reading, language, memory and implicit learning.
Anne Puolakanaho, PhD, is a researcher and a clinical psychologist at the University of Jyväskylä and Niilo Mäki Institute. Her current interests include early predictive signs of dyslexia and intervention of dyslexia.
Nina L. Saine, is a researcher at the Department of Psychology, University of Jyväskylä. Her current interests include reading development of at-risk children and children with dyslexia, reading intervention methods and models.
Zsuzsanna Surányi is a PhD student in the field of cognitive psy-chology and teaches statistics and general psychology at Eötvös Loránd and at Károli Gáspár University of Budapest. She is inter-ested in using statistical and data mining methods to build predictive models, e.g. in the area of dyslexia.
Anniek Vaessen is a post-doc at the University of Maastricht, Faculty of Psychology, Department of Cognitive Neuroscience. Her research interests include cognitive development of reading, spelling and number processing, and dyslexia and dyscalculia.
Valeria Csépe is professor of cognitive psychology at the Eötvös University of Budapest and research professor of cognitive neuro-science at the Research Institute of Psychology of the Hungarian Academy of Sciences (HAS). She is the elected deputy secretary general of HAS.
at UB Muenchen/Kontakstelle on July 12, 2010ldx.sagepub.comDownloaded from

18 Journal of Learning Disabilities XX(X)
Heikki Lyytinen, PhD., is professor of developmental neuropsy-chology at the Department of Psychology,University of Jyväskylä,Finland. His current research interests include e.g. dys-lexia and preventive interventions of dyslexia.
Alexandra Reis is Associate Professor at Universidade do Algarve. Her research has focused on the cognitive neuroscience of reading & writing as well as literacy & illiteracy.
Johannes C. Ziegler is a Director of Research at the CNRS and Aix-Marseille University. His current interests include dyslexia, skilled reading, and modeling of normal and impaired reading.
Gerd Schulte-Körne, MD, is a professor of child and adolescent psychiatry and psychotherapy at the Ludwig-Maximilians-University of Munich. His current interests include learning disabilities, depres-sion, neurophysiology and genetics.
at UB Muenchen/Kontakstelle on July 12, 2010ldx.sagepub.comDownloaded from