Support system suggestion based on back-analysis results case study: Babolak water conveyance tunnel
12
1 23 Arabian Journal of Geosciences ISSN 1866-7511 Volume 5 Number 6 Arab J Geosci (2012) 5:1297-1306 DOI 10.1007/s12517-011-0288-5 Support system suggestion based on back- analysis results case study: Babolak water conveyance tunnel Ehsan Dadashi, Kaveh Ahangari, Ali Noorzad & Alireza Arab
-
Upload
independent -
Category
Documents
-
view
7 -
download
0
Transcript of Support system suggestion based on back-analysis results case study: Babolak water conveyance tunnel

1 23
Arabian Journal of Geosciences ISSN 1866-7511Volume 5Number 6 Arab J Geosci (2012) 5:1297-1306DOI 10.1007/s12517-011-0288-5
Support system suggestion based on back-analysis results case study: Babolak waterconveyance tunnel
Ehsan Dadashi, Kaveh Ahangari, AliNoorzad & Alireza Arab

1 23
Your article is protected by copyright and all
rights are held exclusively by Saudi Society
for Geosciences. This e-offprint is for personal
use only and shall not be self-archived in
electronic repositories. If you wish to self-
archive your work, please use the accepted
author’s version for posting to your own
website or your institution’s repository. You
may further deposit the accepted author’s
version on a funder’s repository at a funder’s
request, provided it is not made publicly
available until 12 months after publication.

ORIGINAL PAPER
Support system suggestion based on back-analysisresults case study: Babolak water conveyance tunnel
Ehsan Dadashi & Kaveh Ahangari & Ali Noorzad &
Alireza Arab
Received: 19 September 2010 /Accepted: 27 January 2011 /Published online: 16 February 2011# Saudi Society for Geosciences 2011
Abstract Determining in-situ soil or rock geotechnicalproperties is a difficult task for a design engineer. Backanalysis is a helpful technique for evaluating soil propertyby considering and measuring the convergence of anunderground opening. Back analysis was performed bymatching numerical modeling results with the measuredtunnel convergence. The main purpose of this study was todetermine optimum rock mass properties using backanalysis in order to suggest the best and most economicalsupport system. Accordingly, the difference between mea-sured and calculated convergence values was minimized byusing an error function (objective function). In this paper,through the parameters obtained from back analysis, asupport system based on a set consisting of shotcrete, wiremesh, and lattice girder was suggested for the Babolakwater conveyance tunnel in Mazandaran, Iran. Therefore,the suggested design was based on decreasing shotcretethickness from 25 to 20 cm and eliminating of rock bolts.
Keywords Back analysis . Babolak tunnel . Rock massproperties . Convergence . Support system
Introduction
Underground excavation design requires inputs in theform of in-situ stress, pore water pressure, rock massstrength, and deformation parameters. For tunnel shapeselection, stability analysis, and rock support systemdesign, these design input parameters are essential.Without them, the process of engineering design isnot possible. Traditionally, the design input parametersare obtained from in-situ rock mechanics testing andmeasurement. For example, the rock mass shearstrength parameters can be determined from in-situblock shear tests, and the deformation modulus can bedetermined from in-situ plate-loading tests. However,conducting these in-situ tests is expensive and time-consuming. In addition, they only represent rock massconditions at the testing spot. To obtain the overallrock mass properties, many researchers have used theback-analysis method in geotechnical engineering, es-pecially in tunneling and underground cavern construc-tion (Cai et al. 2007).
In line with classical stress analysis problems, the back-analysis procedures in geomechanics used to be dividedinto two categories: the inverse and direct approaches. Thefirst inverse algorithm based on the finite element methodwas proposed by Kavanagh and Clough (1971), and aninverse algorithm for identifying parameters of a non-linearhyperelastic solid was suggested by Iding et al. (1974). Theinverse algorithm suggested by Sakurai and Takeuchi(1983) made it possible to compute Young's modulustogether with the initial stress state. In this algorithm,Poisson's ratio and the vertical initial stress are assumed asknown. But the first inverse approach applicable toparameter identification in geotechniques was developedby Gioda (1985). It is used to search for elastic material
E. Dadashi :K. Ahangari (*) :A. ArabDepartment of Mining Engineering, Islamic Azad University,Science and Research Branch,Tehran, Irane-mail: [email protected]
E. Dadashie-mail: [email protected]
A. Arabe-mail: [email protected]
A. NoorzadWater Engineering Faculty,Power and Water University of Technology (PWUT),Tehran, Irane-mail: [email protected]
Arab J Geosci (2012) 5:1297–1306DOI 10.1007/s12517-011-0288-5
Author's personal copy

parameters B and G (B, bulk modulus; G, shear modulus)and can be modified to calculate the earth pressure actingon a tunnel lining. The Kalman filter algorithm wasintegrated into Gioda's inverse algorithm by Murakamiand Hasegawa (1987). This probabilistic procedureallows the use of measurement error information in theinverse calculation and evaluating the influence ofmeasurement error on the results of back analysis(Ladesma et al. 1991). In the inverse approach, thesystem of equations governing the problem is rewrittenin such a way that material parameters appear asunknowns and measured displacements or stresses appearas input data (Swoboda et al. 1999).
The direct approach employs the trial values of theunknown parameters as input data in the stress analysisalgorithm, until the discrepancy between measurements andnumerical results is minimized. This difference is common-ly expressed as the error function. In order to minimize thiserror function, which is highly non-linear algorithms knownas direct search methods, are used in mathematicalprogramming. The Simplex method, the Rosenbrockalgorithm, and the Powell method were recommended forthis purpose by Gioda and Maier (1980). The probabilisticBayesian approach was incorporated into the direct algo-rithm by Cividini et al. (1983). This approach permits us tomake use of both information on the unknown parameters(experience, engineering judgment) and information on the
measurement reliability, which are built into the objectivefunction. All the above methods have advantages andshortcomings.
The advantages of the inverse algorithm are: smoothand fast convergence and stable behavior, provided themeasurement data set is well selected. This is due toboundary control built in the algorithm. Points, whereboth the nodal forces and nodal displacements areknown, basically control the error-minimizing procedure.This ensures quick convergence for data of good quality,but can cause divergence of the procedure in the case ofill-selected measurement data. Direct formulation is veryflexible, and this approach is therefore used to back-analyses parameters for more complex constitutivemodels, where the inverse relations cannot be derivedin the simple direct way. Furthermore, development ofthe direct back analysis code is much less difficult thanthe development of the code based on an inversealgorithm, because the finite element solution can beused in direct methods as part of the optimizing programwithout any changes. On the other hand, the course ofconvergence is highly dependent on the number ofunknown parameters, the quality of their initial guess,and on the optimization strategy chosen (Swoboda et al.1999).
In this research, it is shown how it is possible to proposean economical support system by using back analysis.
Fig. 1 Geological section of Babolak water conveyance tunnel. a inlet, b outlet (Mahab Ghods Consulting Engineering Company 2009)
1298 Arab J Geosci (2012) 5:1297–1306
Author's personal copy

Review on the back-analysis technique
The purpose of back-analyzing measured displacementsand loads using a numerical method is usually to calibratethe initial estimations of the ground's geomechanicalparameters. Back analysis consists of determining whichrock mass parameters are able to reduce the differencebetween the in-situ monitoring data and the calculationresults. In order to carry out a back analysis, it is necessaryto choose (Oreste 2005):
(a) A representative calculation model that is able todetermine the stress and strain state in the rock mass,with the evolutions of the excavation phases;
(b) The error function;(c) An efficient algorithm that reduces the error (differ-
ence) between the calculation results of the numericalmodel and the observed in-situ measurements.
The problems in geotechnical studies are often compli-cated, and the answers are not unique. Data acquiring forthe uniqueness of the solution needs frequent minimizationsand comparing (Bonadaki 2001; Cividini et al. 1981) inorder to be assured of the back-analysis solution's unique-ness. To increase execution speed, parameters have to beselected by the following guidelines (Sakurai 1997a, b):
(1) Selecting parameters that have vast effect on under-ground environment stability.
(2) Selecting parameters that their determination withadequate accuracy is very difficult by other methods.
(3) If possible, decreasing the unknown parameters.
Introducing the Babolak water conveyance tunnel
The Babolak water conveyance system project is a part ofAlborz reservoir dam. It is considered to provide a portion
of the required water in the Alborz dam reservoir and islocated at 700 m upstream of Tamar village in theMazandaran province of Iran. This system includes adiversion dam, a calmness pool, an inlet channel with thelength of 59 m, a water conveyance tunnel with the lengthof nearly 2,600 m, and an outlet channel. This system willtransfer the Babolak river water to Babol River in theupstream location of Alborz main dam (Mahab GhodsConsulting Engineering Company 2009). In phase 1 of theBabolak water conveyance tunnel geological studies, 12boreholes with the total length of 800 m were excavated inwhich 9 of them (B4 to B12) with a total length of 734 mwere bored in the tunnel alignment area. The rocks whichform the tunnel alignment are mainly from marl, sandy marlwith green and gray color, weak to very weak siltstone,marl sandstone with micro conglomerate, and conglomeratemid-layers that relate to Miocene period. Figure 1 showsthe Babolak water conveyance tunnel geological section,(a) inlet, (b) outlet (Mahab Ghods Consulting EngineeringCompany 2009).
This tunnel is under construction with a circular profile(4.2 m in diameter), which is modified to a horseshoeprofile aligned to NW–SE with a dip of 0.00189 and alength of 2,580 m. Excavation is done by two boom typeroad-headers in both the inlet and the outlet. The Babolaktunnel will pass under overburden with different thickness,except in the inlet and outlet, which has the lowestoverburden thickness that is not enough for tunneling(120 and 100 m). The lowest and the highest overburdenthickness in the tunnel alignment are near 8 and 185 m. Thesupport system's main components include shotcrete, steelmesh, lattice girder, and injectional rock bolt. Because ofrock mass sensitivity to moisture variations, a 5-cm initiallayer of shotcrete is applied immediately to preventmoisture variations and weathering. Also, the installation
Table 1 Specifications of the Babolak Water conveyance tunnelsupport system
Supportsystem type
Support system characteristics
Lattice girder Diameter=32 mm, arc distance=1 m, Poisson'sratio=0.25, Young's Modulus=200 GPa, yieldstress=0.55, 4 bars, cross-section area=8×10⁻⁴.
Shotcrete Thickness=25 cm, compression strength=22 MPa,Poisson's ratio=0.15, Young's Modulus=20 GPa,thickness=25 cm, compression strength=22 MPa,density=2,400 Kg/m2.
Rock bolt Length=2 m, diameter=25 mm, H diameter=38 mm, intervals on the tunnel cross-section andthe axis=1×1 m, Poisson's ratio=0.25, Young'sModulus=200 GPa, tensile force=0.55 MN.
Fig. 2 Installation spot of the convergence meters at 0+603 km(Mahab Ghods Consulting Engineering Company 2009)
Arab J Geosci (2012) 5:1297–1306 1299
Author's personal copy
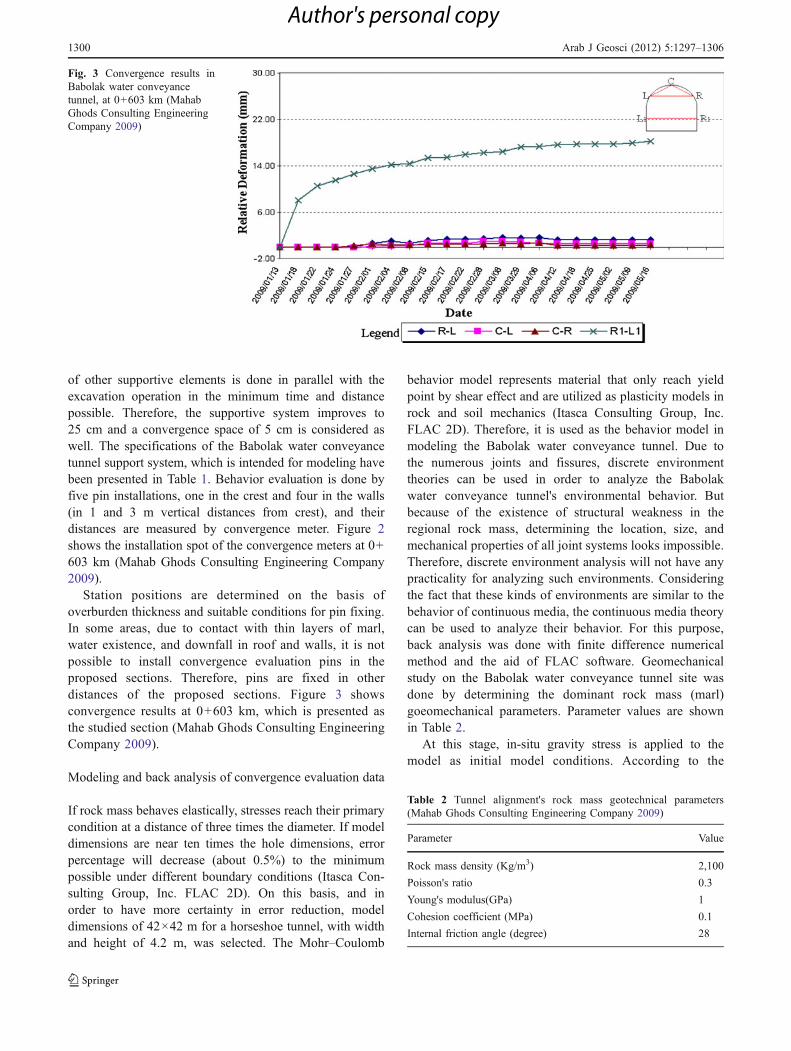
of other supportive elements is done in parallel with theexcavation operation in the minimum time and distancepossible. Therefore, the supportive system improves to25 cm and a convergence space of 5 cm is considered aswell. The specifications of the Babolak water conveyancetunnel support system, which is intended for modeling havebeen presented in Table 1. Behavior evaluation is done byfive pin installations, one in the crest and four in the walls(in 1 and 3 m vertical distances from crest), and theirdistances are measured by convergence meter. Figure 2shows the installation spot of the convergence meters at 0+603 km (Mahab Ghods Consulting Engineering Company2009).
Station positions are determined on the basis ofoverburden thickness and suitable conditions for pin fixing.In some areas, due to contact with thin layers of marl,water existence, and downfall in roof and walls, it is notpossible to install convergence evaluation pins in theproposed sections. Therefore, pins are fixed in otherdistances of the proposed sections. Figure 3 showsconvergence results at 0+603 km, which is presented asthe studied section (Mahab Ghods Consulting EngineeringCompany 2009).
Modeling and back analysis of convergence evaluation data
If rock mass behaves elastically, stresses reach their primarycondition at a distance of three times the diameter. If modeldimensions are near ten times the hole dimensions, errorpercentage will decrease (about 0.5%) to the minimumpossible under different boundary conditions (Itasca Con-sulting Group, Inc. FLAC 2D). On this basis, and inorder to have more certainty in error reduction, modeldimensions of 42×42 m for a horseshoe tunnel, with widthand height of 4.2 m, was selected. The Mohr–Coulomb
behavior model represents material that only reach yieldpoint by shear effect and are utilized as plasticity models inrock and soil mechanics (Itasca Consulting Group, Inc.FLAC 2D). Therefore, it is used as the behavior model inmodeling the Babolak water conveyance tunnel. Due tothe numerous joints and fissures, discrete environmenttheories can be used in order to analyze the Babolakwater conveyance tunnel's environmental behavior. Butbecause of the existence of structural weakness in theregional rock mass, determining the location, size, andmechanical properties of all joint systems looks impossible.Therefore, discrete environment analysis will not have anypracticality for analyzing such environments. Consideringthe fact that these kinds of environments are similar to thebehavior of continuous media, the continuous media theorycan be used to analyze their behavior. For this purpose,back analysis was done with finite difference numericalmethod and the aid of FLAC software. Geomechanicalstudy on the Babolak water conveyance tunnel site wasdone by determining the dominant rock mass (marl)goeomechanical parameters. Parameter values are shownin Table 2.
At this stage, in-situ gravity stress is applied to themodel as initial model conditions. According to the
Fig. 3 Convergence results inBabolak water conveyancetunnel, at 0+603 km (MahabGhods Consulting EngineeringCompany 2009)
Table 2 Tunnel alignment's rock mass geotechnical parameters(Mahab Ghods Consulting Engineering Company 2009)
Parameter Value
Rock mass density (Kg/m3) 2,100
Poisson's ratio 0.3
Young's modulus(GPa) 1
Cohesion coefficient (MPa) 0.1
Internal friction angle (degree) 28
1300 Arab J Geosci (2012) 5:1297–1306
Author's personal copy

equation presented by Hoek–Brown (Fahimifar 1998), theinitial value of regional stresses ratio (K) was estimatedbetween 1.47 and 18.15. On the other hand, the data fromconvergence meter indicated more wall convergence thanroof convergence (K>1). Therefore, K=1.5 was consideredin the constructed numerical method.
In comparison between measured displacement valuesand the obtained displacements from the numerical model,it is noted that some divisions of displacements are releasedinstantly after tunnel excavation and before convergencemeter installation, so practically it was not possible tomeasure them. Consequently, by using Fig. 4, which waspresented by Panet, the normalized displacement valuebased on distance from work face is calculated by Eq. 1(Carranza-Torres and Fairhurst 1999):
ur=u1r ¼ 1þ exp
�X=D
0:55
� ��1:7
ð1Þ
As shown in Fig. 4, in this equation, X is advancementand D is tunnel diameter. Because the environment aroundthe tunnel in the studied section was weak, the advance-ment value was considered 1, based on the implementationconditions. Hence, by calculating X/D and substituting it inPanet's equation, the corresponding value ofl ¼ ur=u1r isachieved. By this method, and by taking Fig. 4 into mind,stress liberation effect in tunnel wall before initial lining intwo-dimensional analysis was approximately considered at
43%. So, before lining, convergence occurrence is allowed.Furthermore, because the first reading of convergence in thestudy section has been done in different distances from theworking face for each set of pins on the basis of Table 3, thussome displacements have occurred in this time period.
In Fig. 5, the proportional convergence variation curvebased on the relative distance from the working face hasbeen plotted as a sample. In which an equation with themaximum correlation coefficient was presented at first andthen the tunnel wall's convergence was calculated frommoment zero to the first read moment and then was deducedfrom model displacements. According to the presented figureand equation, it is noted that by setting X=0 in the aboveequation an 8.91-mm displacement has occurred that has notbeen read in this distance.
In order to model the support system (shotcrete, latticegirder, and injection rock bolts), an equivalent thicknesswas considered for shotcrete and lattice girder set asreinforced concrete. Also, injection rock bolts were con-structed with rock bolts element in FLAC software.
If the stages were done completely and without anyprobable mistakes, the program starts to solve the problemwithout any errors, and different results are achieved at theend. Then the optimization algorithm minimizes thedifference between in-situ measured values and theachieved data from stress analysis. This difference isusually mentioned as an error function that is called thetarget function, and it is mentioned as below:
Fig. 4 Displacement trend var-iations based on distance fromworking face (Carranza-Torreset al. 1999)
Table 3 Distance of first reading for each set of pins
Pin set CR CL RL R1L1
First reading from working face At 20 m distance At 20 m distance At 20 m distance At 5 m distance
Arab J Geosci (2012) 5:1297–1306 1301
Author's personal copy

ERROR ¼XNi¼1
ui � u»
i
h i2=XNi¼1
u»
i ð2Þ
In this equation, i is the number of measuring pointandu
»i and ui are measured and calculated values from
numerical analysis in equivalent points. N is the number ofmeasured points (Jeon and Yang 2004).
Calculated and measured points substitution manner forthe studied convergence station in Babolak water convey-ance tunnel is presented in Eq. (3).
ERROR ¼ R1L1 � R1L1»
� �2þ RL� RL
»� �2
þ CL� CL»
� �2þ CR� CR
»� �2
� �= R1L1
» þ RL» þ CL
» þ CR»
h ið3Þ
In this equation, parameters are calculated as below:Wallconvergence:
R1L1 ¼ XL � XR ð4ÞRoof convergence versus right arch:
CR ¼ XC � XRð Þcosq þ YC � YRð Þsinq ð5ÞRoof convergence versus left arch:
CL ¼ XC � XLð Þcosq þ YC � YLð Þsinq ð6ÞRight arch convergence versus left arch:
RL ¼ffiffiffiffiffiffiffiffiffiffiffiffiffiffiffiffiffiffiffiffiffiffiffiffiffiffiffiffiffiffiffiffiffiffiffiffiffiffiffiffiffiffiffiffiffiffiffiffiffiXL � XRð Þ2 þ YL � YRð Þ2
qð7Þ
In order to do back analysis on the Babolak waterconveyance tunnel and find the optimum parameters for therock mass around the tunnel, direct back-analysis methodwas used. This method has been based on materialmechanical parameters optimization with the help of trial-and-error technique. The direct method utilizes experimen-tal unknown values as input data for stress analysisalgorithm. This process continues until the differencebetween measured values and achieved equivalent valuesfrom numerical analysis is minimized. It is emphasized thatthe problem's control factor is the correspondence ofoutputted data and the actualities recorded by convergencemeters. Generally, there are three different algorithms forthe direct search technique, which are: the univariatemethod, the pattern search method, and the alternativeunivariate method (Jeon et al. 2004). In order to reach the
most suitable back-analysis algorithm between the aboveoptimization methods, all three algorithms were used forsimilar samples and then their results were compared.Results showed that if the pattern search method was notsuccessful in some cases, the univariate method and thealternative univariate method can search optimum param-eter values successfully in spite of their initial values. Withattention to the abovementioned, the univariate method wasused to optimize the geomechanical parameters of the waterconveyance tunnel's rock mass.
Babolak water conveyance tunnel back-analysis results
Marl rock mass geomechanical characteristics
After examining the study section's convergence meterresults, two-dimensional back analysis was performed tofind rock mass mechanical parameters for Babolak tunnel,which includes the Young's modulus (E), cohesion coeffi-cient (C), internal friction angle (Φ), and Poisson's ratio (ν).Thus, models of different parameter composites werecreated and executed at each stage. Values obtained from
Fig. 5 Manner of determiningmissed convergence in tunnelwall
Table 4 Final results of back analysis for Marl rock mass mechanicalcharacteristics
Marl rock mass optimum parameters in 0+603 km
v=0.25 Φ=28 E=1.2 GPa C=0.09 GPa
1302 Arab J Geosci (2012) 5:1297–1306
Author's personal copy

the error function for each model were compared withvalues obtained from other models. Therefore, the bestmodel is the model that has the least errors and maximumcompliance with ground conditions. Any changes in theresulting mechanical parameters will cause an increase inerror value. Accordingly, changes in mechanical parame-ters, and the error value were plotted on an x–y coordinateaxis, and the desired point at the bottom of the curve orplotted surface was determined as the optimum value forthe considered parameter. The final back-analysis results ofthe Babolak tunnel's covering rock mass is presented inTable 4. As it can be seen, Young's modulus has the highesteffect and cohesion, internal friction angle, and Poisson'sratio have the lowest effect on the error function value, andtherefore, consequently on displacement values.
Region's stress ratio back analysis
In natural and virgin conditions, the K coefficient (region'shorizontal to vertical stress ratio) is one of the rock massparameters that its determination by preliminary studies isvery difficult and is determined by relying on back-analysisresults. Hence, after finding the study section's optimumgeomechanical parameter values and by using theseparameters, back-analysis operation was performed to findthe K coefficient optimum value. The results are presentedin Fig. 6.
The error function value was minimized at a stress ratio1.5. Stress ratio, has a significant effect on error functionvalue and horizontal displacement in tunnel wall willincrease with its rise.
Support system proposition based on results from backanalysis
Considering the time interval between tunneling andsupport system installation reduces the support neededsignificantly. It is because considerable rock mass defor-mation occurs at this time interval, and due to thisdeformation, a substantial part of the induced stresses is
released and pressure on support system decreases. Anacceptable response should not be expected if this timeinterval is not regarded in the numerical model. Problemsolving in FLAC is performed in time steps, and changes inthe parameters' initial values, such as tensions and displace-ments, can be clearly seen and controlled in terms of thetime steps increase. Thus, by controlling the number of timesteps and solving the problem by trial and error, the timedelay between support system installation and tunneladvancement can be modeled. The question here is thatwhat should the control parameter and its value be toincorporate suitable time delay?
Roof and floor displacement of an advancing tunnelstarts in the distance of one half of the diameter (in front ofworking face) and reaches to almost one third of the finalvalue at the working face and finally reaches to its finalvalue after a distance of approximately 1.5 times thediameter at the back of the working face (Hoek et al.1995). For that reason, displacement can be considered asthe time delay controlling parameter. It is evident that itsvalue must be determined in a manner that does not exceedthe acceptable displacement, which is calculated from theSakurai equations (Sakurai 1997a, b). Displacement extentdepends on the mechanical specifications of rock mass, thezone's stress condition and the shape of the undergroundspace. Based on this, in order to determine the necessaryinitial lining for maintaining the excavated space's stabilityand forming new balance in the ground, convergence-confinement method and ground reaction curve plotting hasbeen done with the help of FLAC software. Hence, the
Fig. 6 Error function minimiza-tion diagram for calculating theregion's stress ratio
Table 5 Suggested support system for Babolak water conveyancetunnel based on results of Back analysis
Support system type* Support system characteristics
Lattice girder Without change
Shotcrete Thickness=18 cm, the rest without change
*Regarding results from calculations and modeling, there is no needfor rock bolts to be suggested as an element of the support system
Arab J Geosci (2012) 5:1297–1306 1303
Author's personal copy
initial lining design stages based on back-analysis resultsare as followed:
(1) Selecting advancement range, workface distance fromlining, and stress-release enforcement equivalent to theformed convergence based on optimum parametersuntil lining is implemented; As mentioned before,considering the implementation conditions of thisplan, the advancement range and workface distancefrom lining was selected 1 and 0.75 m. By plotting theground's reaction curve based on the optimum param-eters, final displacement value in the tunnel roof, withattention to complete stress release was calculated at28.7 mm. Then, due to working face advancement andwith considering taux de deconfinement, the createddisplacement value was calculated 11.2 mm. Accord-ing to the numerical model's results, the equivalent11.2-mm displacement stress release enforced to themodel was determined as 88%.
(2) Excavation space stability study before initial lining;To evaluate excavation space stability, it is required tocompare the displacement results from the numericalmodel to the permitted displacements around theunderground space. To achieve stability, it is necessarythat the obtained displacements from the numericalmodel be less than the permitted displacement fromEq. (8), which is a design basis for underground spacesupport systems.
This equation expresses critical strain in theconfined pressure conditions around the tunnel as afunction of the zone's deformation modulus (Sakurai1997a, b).
log"c ¼ �0:25logE � 1:22 ð8Þ
In this equation, E is rock deformation modulus interms of kilogram per square centimeter and "c is
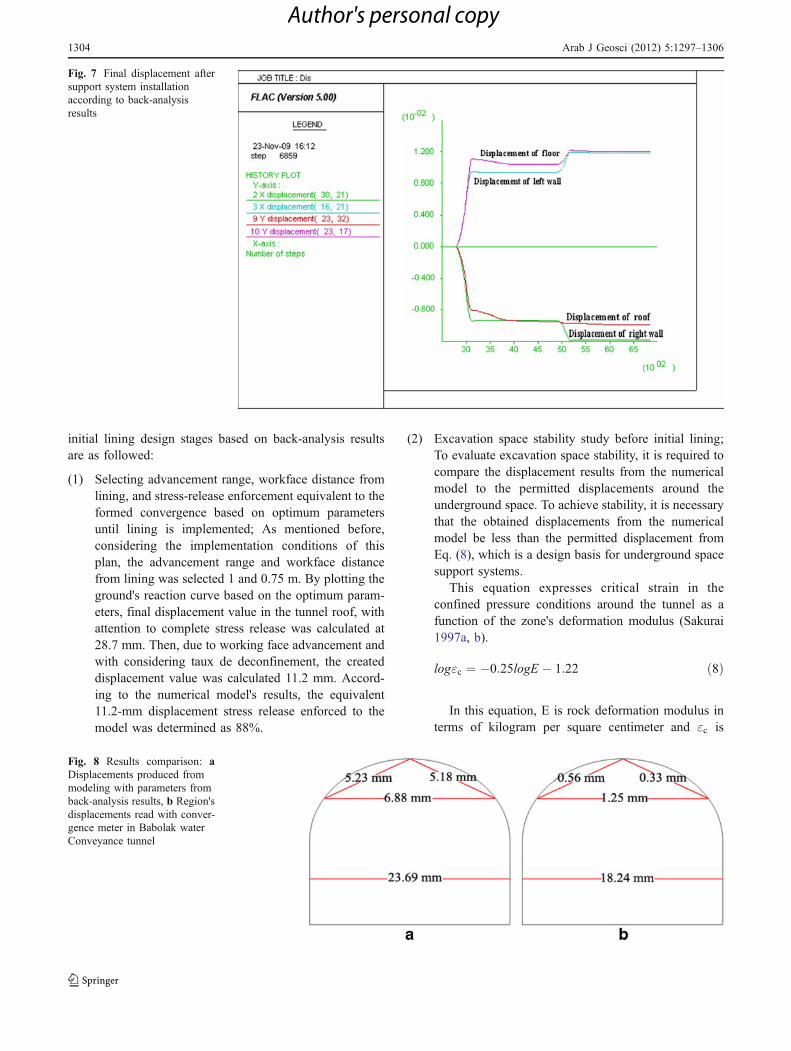
Fig. 7 Final displacement aftersupport system installationaccording to back-analysisresults
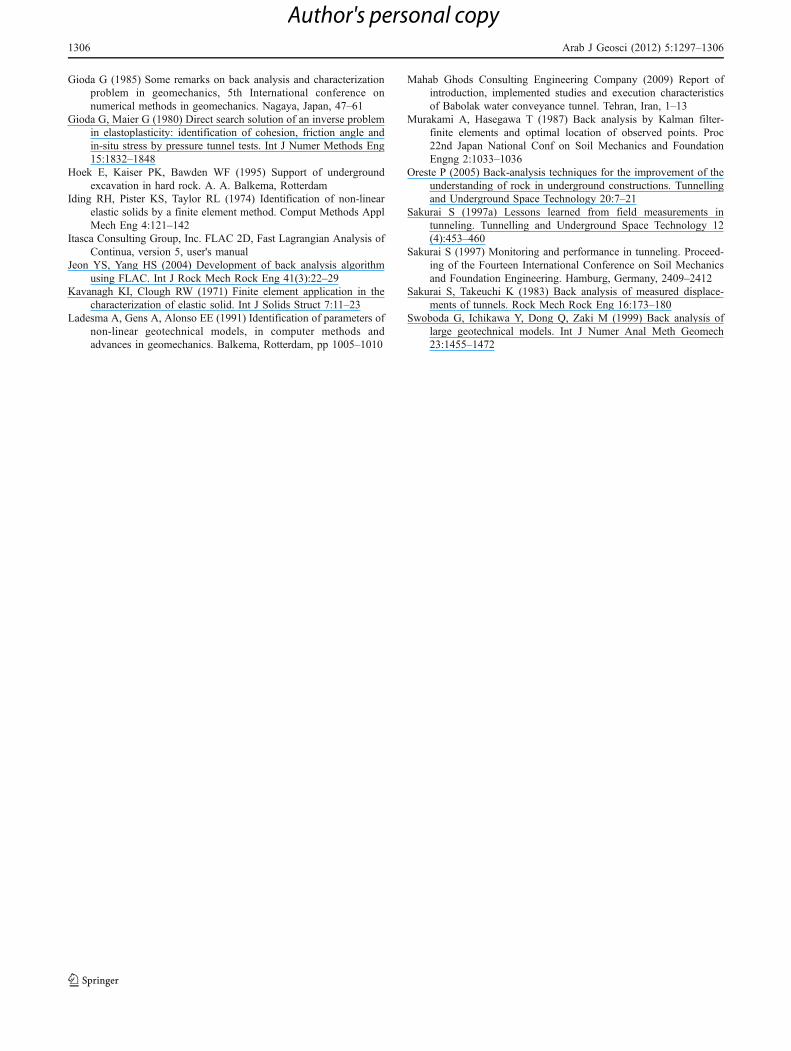
Fig. 8 Results comparison: aDisplacements produced frommodeling with parameters fromback-analysis results, b Region'sdisplacements read with conver-gence meter in Babolak waterConveyance tunnel
1304 Arab J Geosci (2012) 5:1297–1306
Author's personal copy

critical strain percent. By determining the permittedstrain, displacement is calculated. Also through Eq.(9), the permitted displacement is calculated.
"c ¼ uc=a ð9Þ
In this equation, uc is permitted displacement forthe created model and a is tunnel radius (Sakurai1997a, b). According to the above equation andoptimum parameters, the critical strain is equal to5.75*10−3and the permitted displacement is calculated12 mm. Therefore, that wall and roof displacement isneeded to be less than 12 mm.
(3) Lining installation based on rock mass optimumparameters and stability analysis; In this stage, thetunnel was stabilized by a 20-cm thick shotcrete layer.But, because the shotcrete fails to provide the neededtensile strength, a system based on shotcrete andlattice girder set according to Eq. (10) is presented inTable 5.
teq ¼ t þ Npd2=4D
» Es=Ecð Þ� � ð10Þ
In this equation, teq is equivalent shotcrete thick-ness, t is shotcrete thickness, d is bar diameter, N is thenumber of bars which was used in lattice girder, D isthe distance between arches in meters and Es Ec= is theratio of steel's Young's modulus to shotcretes, which isapproximately ten (Bagherzadeh 2008).
It must be mentioned that for preventing shot-crete failure due to tension, one row of Φ6 mm at10×10 cm steel mesh is suggested according tocarried out calculations. Based on the region's rockmass characteristics and the numerical model results,it can be said that the effect of rock bolt in reducingdisplacement and increasing the safety factor isnegligible. This conclusion is not unexpected, be-cause the main efficiency of the rock bolt forstabilizing unstable blocks is in jointed rock masses,and no significant performance can be expected incontinuous environments with structural weaknesses.The displacements resulted from the numerical modelaccording to the optimum parameters obtained fromback-analysis results and support system installationhas been presented in Fig. 7. As noted in the previoussection, for the tunnel to be stable, the calculateddisplacements have to be less than allowable dis-placement (obtained from Sakurai relations).
Finally, Fig. 8 shows the comparing of conver-gences from modeling by back parameters fromanalysis results and the zone's actual convergences,which have been read by convergence meters.
Conclusions
In this research, the support system for Babolak waterconveyance tunnel situated in the northern province of Iranwas suggested for the section located at 0+603 km.Suggestion was done on the basis of eliminating the rockbolts and reducing the armored shotcrete thickness. Thepreliminary suggestion for this section before the proposi-tion based on back analysis consisted of 2-m long rockbolts at 1-m distances and 25-cm thick armored shotcrete(shotcrete, wire mesh, and lattice girder). According to theresults from the convergence meters and the numericalmodeling, this section was stabilized by shotcrete equiva-lent to 20 cm in thickness. Therefore, consistent with therelations presented in the paper and the results obtained, 18-cm armored shotcrete lining was suggested as the supportsystem. Furthermore, comparison of predicted results bynumerical modeling and convergence meters installed in thetunnel's roof and walls shows an equal trend. This is aconfirmation on the accuracy of numerical modeling andback-analysis results. The reasons for the differencebetween in-situ measured values and results of backanalysis are due to the existence of delays in instrumenta-tion and reading of instruments. Initial and importantdisplacements have been missed as a result of these delaysand convergence meters have not been successful onrecording them. When determining geotechnical parame-ters, there are many sources for errors in rock-sampleexperiments, which cause uncertainty. It was shown that theback analysis presented is capable of reducing errors anddetermining design parameters, which are close to actualvalues.
References
Bagherzadeh A (2008) Stability analysis of Esfahan subway twintunnels at the location of tunnels conversion to one tunnel byusing numerical modeling. Department of Mine and Metallurgy,Sahand University, Tabriz
Bonadaki DM (2001) Convergence and it control in tunnels. ShahroudUniversity Publications, Shahroud, pp 70–90
Cai M, Morioka H, Kaiser PK, Tasaka Y, Kurose H, Minami M,Maejima T (2007) Back-analysis of rock mass strength param-eters using AE monitoring data. Int J Rock Mech Min Sci44:538–549
Carranza-Torres C, Fairhurst C (1999) The Elasto-plastic response ofunderground excavations in rock masses that satisfy the Hoek-Brown failure criterion. Int J Rock Mech Min Sci 36:777–809
Cividini A, Jurina L, Gioda G (1981) Some aspects of characterizationproblems in geomechanics. Int J Rock Mech Min Sci 18:487–503
Cividini A, Maier G, Nappi A (1983) Parameter estimation of a staticgeotechnical model using Bayes approach. Int J Rock Mech MinSci 20:215–226
Fahimifar A (1998) Underground structures in rock. Technical andSoil Mechanic Laboratory of Road and Transport MinistryPublications, Tehran, pp 70–120
Arab J Geosci (2012) 5:1297–1306 1305
Author's personal copy
Gioda G (1985) Some remarks on back analysis and characterizationproblem in geomechanics, 5th International conference onnumerical methods in geomechanics. Nagaya, Japan, 47–61
Gioda G, Maier G (1980) Direct search solution of an inverse problemin elastoplasticity: identification of cohesion, friction angle andin-situ stress by pressure tunnel tests. Int J Numer Methods Eng15:1832–1848
Hoek E, Kaiser PK, Bawden WF (1995) Support of undergroundexcavation in hard rock. A. A. Balkema, Rotterdam
Iding RH, Pister KS, Taylor RL (1974) Identification of non-linearelastic solids by a finite element method. Comput Methods ApplMech Eng 4:121–142
Itasca Consulting Group, Inc. FLAC 2D, Fast Lagrangian Analysis ofContinua, version 5, user's manual
Jeon YS, Yang HS (2004) Development of back analysis algorithmusing FLAC. Int J Rock Mech Rock Eng 41(3):22–29
Kavanagh KI, Clough RW (1971) Finite element application in thecharacterization of elastic solid. Int J Solids Struct 7:11–23
Ladesma A, Gens A, Alonso EE (1991) Identification of parameters ofnon-linear geotechnical models, in computer methods andadvances in geomechanics. Balkema, Rotterdam, pp 1005–1010
Mahab Ghods Consulting Engineering Company (2009) Report ofintroduction, implemented studies and execution characteristicsof Babolak water conveyance tunnel. Tehran, Iran, 1–13
Murakami A, Hasegawa T (1987) Back analysis by Kalman filter-finite elements and optimal location of observed points. Proc22nd Japan National Conf on Soil Mechanics and FoundationEngng 2:1033–1036
Oreste P (2005) Back-analysis techniques for the improvement of theunderstanding of rock in underground constructions. Tunnellingand Underground Space Technology 20:7–21
Sakurai S (1997a) Lessons learned from field measurements intunneling. Tunnelling and Underground Space Technology 12(4):453–460
Sakurai S (1997) Monitoring and performance in tunneling. Proceed-ing of the Fourteen International Conference on Soil Mechanicsand Foundation Engineering. Hamburg, Germany, 2409–2412
Sakurai S, Takeuchi K (1983) Back analysis of measured displace-ments of tunnels. Rock Mech Rock Eng 16:173–180
Swoboda G, Ichikawa Y, Dong Q, Zaki M (1999) Back analysis oflarge geotechnical models. Int J Numer Anal Meth Geomech23:1455–1472
1306 Arab J Geosci (2012) 5:1297–1306
Author's personal copy