Supply Chain Sustainability Progress Report 2020 - Dell
45
Supply Chain Sustainability Progress Report 2020
-
Upload
khangminh22 -
Category
Documents
-
view
0 -
download
0
Transcript of Supply Chain Sustainability Progress Report 2020 - Dell

Supply Chain Sustainability Progress Report 2020

2020 SUPPLY CHAIN SUSTAINABILITY PROGRESS REPORT / 2
03Introduction
04Our approach to sustainability
12Progress
Our progress in 2020 12
Key performance indicators 13
Bettering the lives of people in our supply chain 15
Reducing our supply chain’s impact on the planet 25
Driving supplier diversity beyond spend 31
Recognition 34
35By the numbers
43How we report
CONTENTS INTRODUCTION OUR APPROACH PROGRESS BY THE NUMBERS HOW WE REPORT

2020 SUPPLY CHAIN SUSTAINABILITY PROGRESS REPORT / 3
Letter From Kevin Brown
The pandemic spurred a global health and economic crisis in 2020 that few could have predicted. It created substantial disruptions in the way people lived, worked, and learned worldwide; it led to unprecedented challenges for governments, institutions and businesses across the globe, including Dell Technologies.
Despite this adversity, effectively navigating these challenges and continuing to manage our supply chain responsibly is what our customers, partners and other stakeholders expect from our company; it is what we expect from ourselves. Key to meeting these expectations is a long-term commitment to sustainability that helps maintain Dell Technologies’ trusted supply chain.
Our social and environmental responsibility (SER) programs — pursued in collaboration with our suppliers and industry organizations — enable us to continuously monitor our supply chain and drive meaningful progress as we work to champion the people in our supply chain, protect our planet and build diversity among our supply base.
This report details these programs and I’m proud to feature a few of Dell Technologies’ recent achievements:
• Ranked six out of the 49 largest information and communications technology companies in the 2020 KnowTheChain supply chain responsibility benchmark, which helps companies and investors to understand and address forced labor risks in their global supply chains.
• Named a Supplier Engagement Leader and an A List Company for Climate Change by the Carbon Disclosure Project (CDP).
• Ranked a Corporate Information Transparency Index Master for overall environmental management of our supply chain and SCTI Master for supplier initiatives on climate action from the Institute of Public and Environmental Affairs in China. Dell Technologies is one of only two brands to receive this recognition.
• Recognized for the 11th consecutive year as a member of the Billion Dollar Roundtable for spending at least $1 billion USD annually with minority- and women-owned businesses.
While we celebrate these milestones and other accomplishments shared in this report, we recognize we have more work to do. Whether we are helping suppliers achieve new levels of SER performance, driving responsible sourcing standards deep into our supply base, or collaborating with the industry to tackle widely held challenges, our goals are continuous improvement and proactive engagement strategies.
Looking forward, I am confident in the resilience and sustainability of our supply chain and the tenacity of the people who make our products. Trust, strong relationships and ethical business practices are foundational to how we operate at Dell Technologies. Just as we extend that foundation as an expectation to our suppliers, we know our customers, partners and other stakeholders require the same of us. We are proud to be a part of a better way of doing business.
Kevin BrownExecutive Vice President, Chief Supply Chain OfficerDell Technologies
CONTENTS INTRODUCTION OUR APPROACH PROGRESS BY THE NUMBERS HOW WE REPORT

2020 SUPPLY CHAIN SUSTAINABILITY PROGRESS REPORT / 4OUR APPROACH
Our approach to sustainability
CONTENTS INTRODUCTION OUR APPROACH PROGRESS BY THE NUMBERS HOW WE REPORT

2020 SUPPLY CHAIN SUSTAINABILITY PROGRESS REPORT / 5
Sustainability in our supply chain
Dell Technologies partners with thousands of companies in our global supply chain that help bring life to our purpose: to create technologies that drive human progress.
How we achieve that purpose matters, which is why operating our supply chain responsibly is a core part of our business. We embed sustainability and due diligence into all that we do, resulting in a resilient supply chain that enables our business to operate responsibly, protects our brand and strengthens our customer relationships.
In 2020, this resilience was tested in new ways as Dell Technologies and our suppliers were forced to confront unprecedented challenges brought about by the COVID-19 pandemic. Despite this, we continued our social and environmental due diligence efforts and maintained a high level of performance.
Working across the complexities inherent in a global supply chain, Dell Technologies operates one of the largest social and environmental responsibility (SER) assurance and engagement programs in the information and communications technology sector. Through our SER initiatives, we proactively identify and mitigate issues throughout the tiers of our supply chain, including final assembly, direct and sub-tier suppliers.
We focus our attention on the most salient human rights and environmental issues determined from insight gained through our own operations, collaboration with industry partners and engagement with stakeholders. Partnership with our suppliers is paramount in our efforts to drive responsible manufacturing practices and diversity and inclusion in our supply chain.
Our supplier expectations for responsible and ethical business practices are informed by international standards, including the U.N. Guiding Principles on Business and Human Rights, relevant U.N. Conventions, the U.N. Universal Declaration of Human Rights and the U.N. Convention on the Rights of the Child.
Adherence to our Supplier Principles is a condition of doing business with Dell Technologies. The Supplier Principles form the basis for our social and environmental due diligence programs and include the following:
• All applicable laws, regulations andpurchasing requirements
• Responsible Business Alliance Code of Conduct
• Dell Technologies Code of Conduct1
• Dell Responsible Sourcing Policy
• Dell Vulnerable Worker Policy
• Dell Human Rights and Labor Policy Statement
• Dell Statement Against Slavery and HumanTrafficking, compliant with the Australia ModernSlavery Act, the U.K. Modern Slavery Act and theCalifornia Transparency in Supply Chain Act
• Relevant International Labor Organization (ILO)conventions, including the eight fundamentalconventions and conventions 1, 102, 131, 155and 170
• Relevant International Organization forStandardization (ISO) management systems
• National Institute of Standards and Technology(NIST) Cybersecurity Framework
We work closely with our suppliers and their employees2 to help them develop the necessary insight and capabilities to meet these requirements. Over the past year, our supplier relationships and history of collaboration proved even more important as we worked together amid the pandemic to find new ways to address issues and help maintain and build SER capability.
Our annual Supply Chain Sustainability Progress Report presents a comprehensive view of the work we do to advance SER performance in our supply chain. Beyond this, Dell Technologies FY21 Progress Made Real Report captures our activities across our entire value chain to drive positive impact for people and the planet.
CONTENTS INTRODUCTION OUR APPROACH PROGRESS BY THE NUMBERS HOW WE REPORT
https://i.dell.com/sites/doccontent/corporate/corp-comm/en/Documents/dell-california-trafficking.pdf

Capability building
Risk assessment
Continuous Improvement
Model
Corrective action
Audit
2020 SUPPLY CHAIN SUSTAINABILITY PROGRESS REPORT / 6
Continuous Improvement Model
Our four-element approach to a sustainable supply chain
Dell Technologies works with suppliers that demonstrate varying levels of maturity in their own social and environmental responsibility (SER) programs. Recognizing this, we focus on building sustainable progress with our suppliers through an emphasis on continuous improvement.
While we apply principles of continuous improvement across our due diligence efforts, we use a specific four-element approach with our audit program. This Continuous Improvement Model is a framework for advancing supplier performance that includes risk assessment, supplier audits, corrective action plans and capability building. We refer to each activity in the model as an element rather than a phase or step because suppliers do not always move through the elements sequentially. For example, the results of a risk assessment may indicate an audit is not needed, but there is a need to drive improvement in a targeted area.
In addition, ongoing communication is critical to driving continuous improvement in supplier SER performance. This includes communication among our suppliers, SER specialists and auditors. We also share SER performance metrics alongside other key indicators like cost and quality as part of our supplier quarterly business reviews (QBRs). Key executives attend QBRs and help determine future business awards, supplier resources and policy, as well as address progress toward aligned goals.
We strive to work with our suppliers to improve their SER performance. However, in rare circumstances where it is evident that continued poor performance will not be resolved through further engagement, we may end our business relationship with the supplier.
CONTENTS INTRODUCTION OUR APPROACH PROGRESS BY THE NUMBERS HOW WE REPORT

2020 SUPPLY CHAIN SUSTAINABILITY PROGRESS REPORT / 7
CONTINUOUS IMPROVEMENT MODEL — 1ST ELEMENT
Risk assessment
Our engagement with suppliers at all tiers — including final assembly, direct and sub-tier3 — begins with an assessment of their social and environmental risks. We conduct initial risk assessments for our suppliers as part of their onboarding process before they begin to do business with Dell Technologies.
Suppliers complete a self-assessment questionnaire (SAQ) that enables us to determine risk level using the following criteria:
• Geographic location: This considers risks at the local level around areas such as water concerns, air pollution, child labor and human trafficking.
• Amount of spend with the supplier: This helps determine how strategic the supplier is to our business and is an indicator of our influence with the supplier.
• Commodity provided: This considers specific risks associated with manufacturing such as labor intensity and chemicals or minerals involved in the production of a commodity.
• Prior responsible manufacturing performance: This includes previous audit results and participation in our capability building efforts.
• Additional insight: This refers to information obtained by Dell Technologies social and environmental responsibility (SER) team members during regular factory visits or from independent sources such as regulatory and third-party organizations.
Based on the results of the SAQ and additional insight, we classify suppliers as low-, medium- or high-risk. Suppliers that are determined to be high-risk will be required to complete a third-party audit that looks at conformance to the Responsible Business Alliance Code of Conduct as part of our SER qualification process.
Our risk assessment efforts do not end here. We also monitor SER risk for our Dell Technologies factories and suppliers on an annual basis. Continuous improvement is important for our own operations as well as those of our suppliers.
CONTENTS INTRODUCTION OUR APPROACH PROGRESS BY THE NUMBERS HOW WE REPORT

Improvements in supplier factory audit performance, 2020
90°/o
Overall 70°/o of factories that went through at least their second
audit cycle improved their audit scores between cycles
67°/o 0%
Final assembly suppliers Direct suppliers Sub-tier suppliers
High-performing supplier factories, 2020
61°/o of factories were high-performing based on their
audit scores (at least 160 out of 200)
2020 SUPPLY CHAIN SUSTAINABILITY PROGRESS REPORT / 8
CONTINUOUS IMPROVEMENT MODEL — 2ND ELEMENT
Audit
Dell Technologies’ audit program is one of the largest in the technology sector — both in terms of number of audits conducted and its reach across the supply chain. It is designed to identify sustainability risks in our supply chain and enable suppliers to both mitigate issues and build their social and environmental responsibility (SER) capabilities. In addition, we engage our suppliers in targeted assessments and programs to drive more opportunities for improvement.
We expect our suppliers to adhere to the Responsible Business Alliance (RBA) Code of Conduct. Audits help monitor suppliers’ compliance to the RBA Code of Conduct and highlight any areas of concern, which in turn help Dell Technologies work with suppliers to take action and to improve their performance. (See pages 35-41 for 2020 audit results.)
Even as the COVID-19 pandemic disrupted business operations across the globe, we completed audits for 313 factories across 12 countries in 2020.
Typically, our audits are all completed on-site. However, due to COVID-19 restrictions, we conducted remote audits in some circumstances, as allowed by RBA guidance.
The temporary process initiated for remote audits enabled us to continue to protect the health and safety of the people in our supply chain, assure the responsible manufacturing of our products, and meet customer demands while adhering to recommended COVID-19 containment measures.
Third-party, RBA-certified auditors conduct our supplier audits, which cover more than 40 topics across the following five areas:
1. Labor (including risks of forced labor, child labor and nonconformance with weekly working hours)
2. Employee health and safety
3. Environment
4. Ethics
5. Management systems
As part of the audit process, auditors review documents, observe daily work practices and interview supplier management and employees independently to assess the implementation of the SER standards in the RBA Code of Conduct. In 2020, auditors conducted 11,699 feedback interviews.
Once an audit is complete, the auditors will issue a final report that identifies any areas of nonconformance with the RBA Code of Conduct. The number and severity of these audit “findings” — classified as priority, major, minor and risk of nonconformance — will impact a supplier’s overall audit score, which ranges from 0 to 200.
Audit findings can lead to the third and fourth elements of the Continuous Improvement Model — corrective action and capability building.
CONTENTS INTRODUCTION OUR APPROACH PROGRESS BY THE NUMBERS HOW WE REPORT

90%
76%
Corrective actions and findings closed, 2020
239 factories completed
corrective actions
of priority findings
overall were closed
at supplier factories
of priority and major findings
overall were closed at
supplier factories
141 closure audits were
completed to verify
corrective actions
100°/o at final assembly factories
85°/o at direct supplier factories
92°/o at sub-tier supplier factories
52°/o at final assembly factories
78 °/o at direct supplier factories
7 5 °/o at sub-tier factories
2020 SUPPLY CHAIN SUSTAINABILITY PROGRESS REPORT / 9
CONTINUOUS IMPROVEMENT MODEL — 3RD ELEMENT
Corrective action
The next element of our Continuous Improvement Model is corrective action. When areas of nonconformance with the Responsible Business Alliance (RBA) Code of Conduct are discovered through an audit, our Dell Technologies social and environmental responsibility (SER) specialists work with the supplier to create a corrective action plan (CAP) to resolve the issues within RBA-defined timelines. Through the CAP, our team supports the supplier in identifying root causes and implementing mitigations that support enduring improvement.
Audit findings are classified from most severe to least severe as follows: priority, major, minor and risk of nonconformance. The severity of priority and major findings require they are resolved quickly. Once the supplier addresses an audit finding, it must be closed either by a second audit or Dell Technologies SER specialists to validate that the issue has been resolved.
As part of our commitment to continuous improvement and transparency, we are sharing detailed information on our CAP closure rates in this report.
CONTENTS INTRODUCTION OUR APPROACH PROGRESS BY THE NUMBERS HOW WE REPORT

In 2020
1,439 unique participants
attended our capability
building programs
413 unique supplier factories
were represented
10, 760 hours of training on social and
environmental responsibility topics
were completed
2,350 hours online training
8,410 hours in-person training
sessions and webinars
2020 SUPPLY CHAIN SUSTAINABILITY PROGRESS REPORT / 10
CONTINUOUS IMPROVEMENT MODEL — 4TH ELEMENT
Capability building
For the final element of our Continuous Improvement Model, we engage with our suppliers to help build their knowledge and skills — in areas such as forced labor, health and safety, and energy efficiency — to proactively address social and environmental risks.
Dell Technologies provides numerous resources for suppliers to develop key skill sets to help ensure responsible manufacturing:
• Factory consultations: Our social and environmental responsibility (SER) specialists work directly with supplier factories to better monitor and reduce risk. Engagements are customized to support unique supplier requirements, with the goal of enabling long-term improvements. In previous years, consultations were primarily held on-site at factory locations. We conducted many of the factory consultations virtually in 2020 due to COVID-19 restrictions.
• Dell Technologies-led trainings and webinars: Despite the challenges of COVID-19 in 2020, we continued to offer training, roundtable sessions, interactive webinars and networking sessions, leaning on our experience using digital tools. Targeted to supplier management and SER professionals, these events offered many benefits,
including connecting suppliers with others working in the area of sustainability, discussing emerging trends and risks, and gaining insight into best practices.
• Self-paced, online trainings: Most supplier factories can access Dell Technologies’ online training platforms (either by computer or mobile phone), which offer digital learning opportunities for supplier management in a variety of languages. In 2020, 543 factories had access to more than 170 training sessions. We use our online trainings to both encourage proactive knowledge and performance growth and drive corrective action. Mobile access continues to make the use of this platform more convenient for training and interaction with our SER specialists.
• Front-line supplier employee training: We recognize that supplier employees are important partners for us, both in monitoring factories that may not meet Dell Technologies’ expectations and in participating in actions to help factories meet our standards. One example is the proper use of personal protective equipment. To ensure we can involve factory employees, we developed targeted training delivered through mobile phones (see page 21).
• Dell Technologies-developed tools: We share tools we have developed with factories, often to help automate monitoring areas of concern where the local team may not have the resources. Examples include our weekly working hour monitoring tool, which captures data from factories where employees are at-risk of working more hours than the 60-hours-per-week standard; and our water monitoring tool, which helps suppliers understand their freshwater use and wastewater discharge.
CONTENTS INTRODUCTION OUR APPROACH PROGRESS BY THE NUMBERS HOW WE REPORT
2020 SUPPLY CHAIN SUSTAINABILITY PROGRESS REPORT / 11
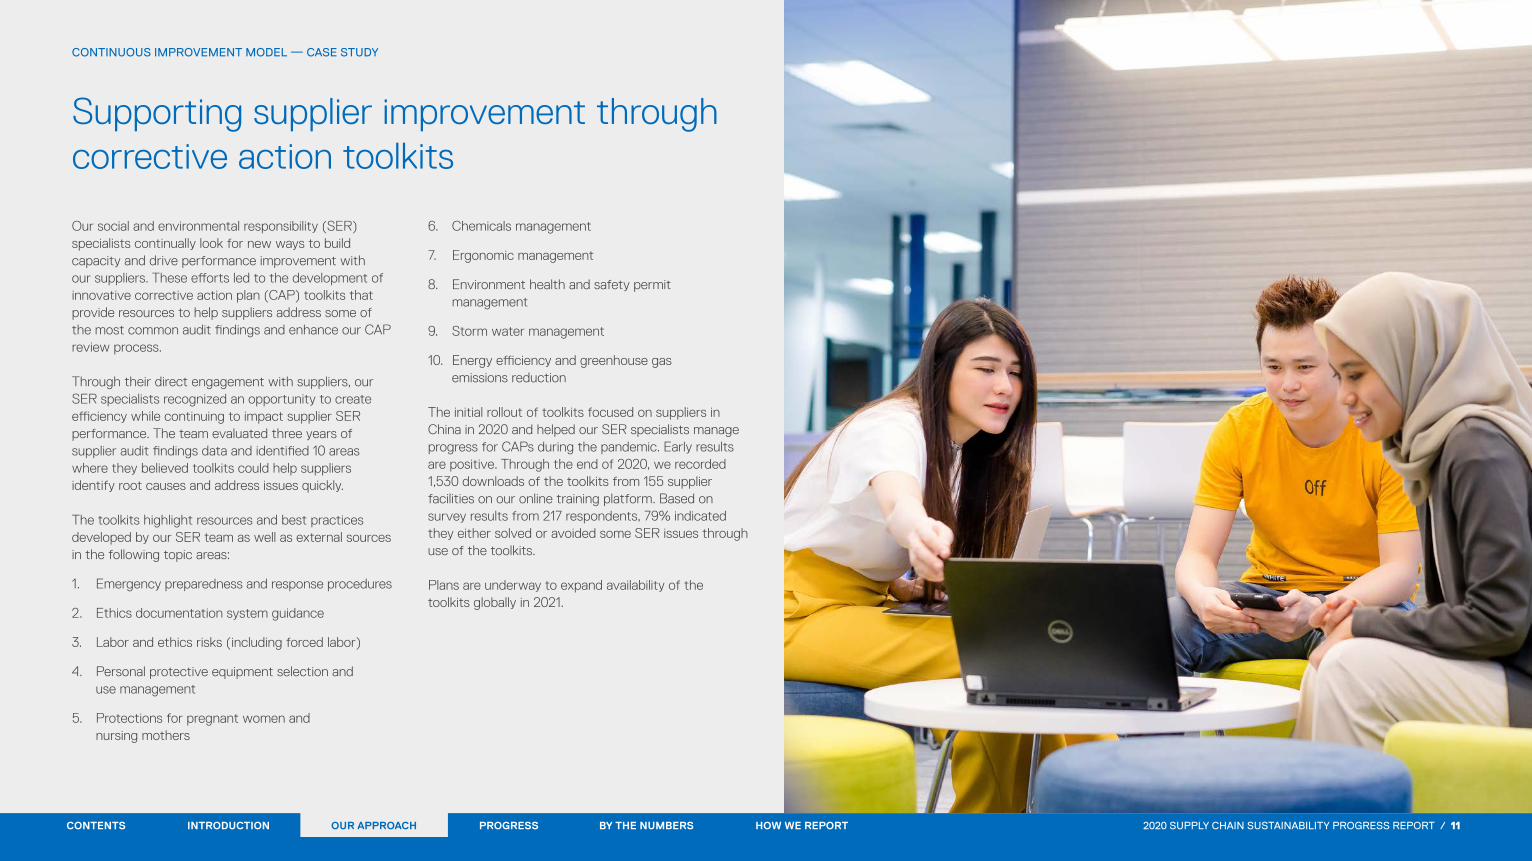
CONTINUOUS IMPROVEMENT MODEL — CASE STUDY
Supporting supplier improvement through corrective action toolkits
Our social and environmental responsibility (SER) specialists continually look for new ways to build capacity and drive performance improvement with our suppliers. These efforts led to the development of innovative corrective action plan (CAP) toolkits that provide resources to help suppliers address some of the most common audit findings and enhance our CAP review process.
Through their direct engagement with suppliers, our SER specialists recognized an opportunity to create efficiency while continuing to impact supplier SER performance. The team evaluated three years of supplier audit findings data and identified 10 areas where they believed toolkits could help suppliers identify root causes and address issues quickly.
The toolkits highlight resources and best practices developed by our SER team as well as external sources in the following topic areas:
1. Emergency preparedness and response procedures
2. Ethics documentation system guidance
3. Labor and ethics risks (including forced labor)
4. Personal protective equipment selection and use management
5. Protections for pregnant women and nursing mothers
6. Chemicals management
7. Ergonomic management
8. Environment health and safety permit management
9. Storm water management
10. Energy efficiency and greenhouse gas emissions reduction
The initial rollout of toolkits focused on suppliers in China in 2020 and helped our SER specialists manage progress for CAPs during the pandemic. Early results are positive. Through the end of 2020, we recorded 1,530 downloads of the toolkits from 155 supplier facilities on our online training platform. Based on survey results from 217 respondents, 79% indicated they either solved or avoided some SER issues through use of the toolkits.
Plans are underway to expand availability of the toolkits globally in 2021.
CONTENTS INTRODUCTION OUR APPROACH PROGRESS BY THE NUMBERS HOW WE REPORT

2020 SUPPLY CHAIN SUSTAINABILITY PROGRESS REPORT / 12
Our progress in 2020
CONTENTS INTRODUCTION OUR APPROACH PROGRESS BY THE NUMBERS HOW WE REPORT

2018 238
2019 194
2020 205
2018 195
2019 196
2020 141
2018 94%
2019 95%
2020 90%
2018 80%
2019 76%
2020 76%
2018 811
2019 1,079
2020 1,439
2018 252
2019 347
2020 413
205 Initial audits
We audit high-risk factories
on a two-year cycle. Selected
other sites, including new
supplier factories, are
also audited.
141 Closure audits
We work with suppliers
to correct audit findings
and arrange closure
audits to confirm findings
are remediated.
90°/o Priority audit
findings closed
or downgraded
The most severe findings
are prioritized for resolution.
Performance is tracked
cumulatively.
Audit findings closed
or downgraded
We collaborate with suppliers
to remediate priority and major
findings. Performance is
tracked cumulatively.
1,439 Unique participants
attending capability
building programs
Capability building engages
participants across final assembly,
direct and sub-tier suppliers who
can share the insights provided by
training throughout their factories.
413 Unique factories
participating in
capability building
programs
We track the reach of our
capability building programs by
the number of factories
participating in our training.
2020 SUPPLY CHAIN SUSTAINABILITY PROGRESS REPORT / 13
Key performance indicators
CONTENTS INTRODUCTION OUR APPROACH PROGRESS BY THE NUMBERS HOW WE REPORT
4
5

89%
Supplier employees
who do not exceed
60 working hours
per week
We monitored 203,211 supplier
employees in our supply chain,
of which 89% did not exceed
60 working hours per week.
2018 89%
2019 91%
2020 89%
84°/o Supplier employees
with one day of rest
per week
Of the 203,211 supplier
employees we monitored,
84% received at least one day
of rest per week.
2018 87%
2019 87%
2020 84%
236 Factories with
active water risk
mitigation plans
236 supplier factories in areas
of water stress or with water
intensive processes had active
water risk mitigation plans.
2018 N/A
2019 231
2020 236
48,842 MTCO2e*
Emissions avoided
through energy
reduction projects
We encourage our suppliers
to implement energy
reduction projects and
track their progress.
2018 N/A
2019 275,130
MTC02e
202048,842MTCO2e
·Metric tons of carbon dioxide equivalent
95%
Suppliers with
sustainability
reports
We encourage our suppliers
to publish annual sustainability
reports that meet Global Reporting
Initiative (GRI) requirements. This
represents suppliers by spend
with sustainability reports.
2018 94%
2019 93%
95% 2020
>$38 Diverse supplier
spend (USO)
Dell Technologies is committed
to spend $3 billion USO or more
annually with diverse suppliers.
2018 >$38
2019 >$38
2020 >$38
2020 SUPPLY CHAIN SUSTAINABILITY PROGRESS REPORT / 14
Key performance indicators
CONTENTS INTRODUCTION OUR APPROACH PROGRESS BY THE NUMBERS
8
HOW WE REPORT
6 7

2020 SUPPLY CHAIN SUSTAINABILITY PROGRESS REPORT / 15
Bettering the lives of people in our supply chain
It takes hundreds of thousands of people around the world to make our Dell Technologies products. We are committed to partnering with our suppliers to help protect human rights for all in our supply chain. This includes treating all people with respect and dignity, not tolerating forced labor in any form and consistently providing safe working conditions.
Our Progress Made Real Plan for 2030 demonstrates the focus Dell Technologies places in these areas. Promoting the well-being of people in our supply chain is imperative. We have set specific goals to support our work in this area, including:
• Providing safe and healthy work environments where people can thrive
• Delivering future-ready skills development for employees in our supply chain
• Engaging with the people who make our products
To learn more about these efforts, please view the Dell Technologies FY21 Progress Made Real Report.
The year presented new challenges as we continued to champion the people in our supply chain. Despite COVID-19, we maintained our ongoing initiatives while helping our suppliers address pandemic-related concerns.
Our initial response included surveying our suppliers to understand and help mitigate COVID-19 impacts. This information enabled us to adapt our ongoing practices and better support suppliers as they addressed heightened concerns around employee health and safety, labor rights, weekly working hours and employee well-being. One example included a series of Dell Technologies-hosted webinars that brought together subject matter experts from a variety of areas and provided an open forum where suppliers could ask questions and share best practices around COVID-19.
In addition, we collaborated across our industry to develop resources for suppliers. As an example, we worked with our industry peers through the Responsible Business Alliance (RBA) to develop Top Guidelines for Suppliers' Protection of Workers During COVID-19, which helped suppliers maintain resilience and plan for the future.
The due diligence efforts we undertake to better the lives of people in our supply chain are being recognized by the industry. In our first-ever inclusion in this assessment, Dell Technologies was ranked number six out of the 49 largest information communications and technology companies (based on market
capitalization) in the 2020 KnowTheChain supply chain responsibility benchmark. KnowTheChain is a coalition of nongovernmental organizations that use the U.N. Guiding Principles on Business and Human Rights to evaluate technology companies’ actions and commitments to responsibly produce products.
“Collaboration among Responsible Business Alliance members is key to driving progress and addressing challenges throughout international supply chains. This was especially true in 2020 as the industry faced a myriad of issues related to the pandemic. We greatly appreciated the collaborative efforts of members like Dell Technologies and their active participation on our board of directors, which helped ensure the continued impact of our responsible business efforts.”
ROB LEDERER, CEO, RESPONSIBLE BUSINESS ALLIANCE
CONTENTS INTRODUCTION OUR APPROACH PROGRESS BY THE NUMBERS HOW WE REPORT

2020 SUPPLY CHAIN SUSTAINABILITY PROGRESS REPORT / 16
BETTERING THE LIVES OF PEOPLE IN OUR SUPPLY CHAIN — CASE STUDY
Supporting business outcomes through employee engagement
Advancing sustainability is a pillar of our Progress Made Real strategy, which outlines how Dell Technologies will create a lasting, positive social impact on humankind and the planet — using our reach, technology and people.
As part of Progress Made Real, we are committed to ongoing engagement with the people who make our products. As one of just a few original equipment manufacturers continuing to operate our own factories, Dell Technologies is in a unique position to use our direct experience and knowledge to influence industry-wide practices. This perspective has shown us that listening to feedback and enlisting the insights from both supplier employees and Dell Technologies factory team members can help create better workplaces and drive business outcomes.
Our own efforts to build digital automation innovation — our vision for the next generation of manufacturing — across Dell Technologies’ global factories demonstrate the benefits of a culture that values engagement at all levels of the organization. Over a five-year period, culminating in 2020, we implemented a strategy that shifted away from traditional top-down direction to a bottom-up organizational structure that encourages feedback and decision-making from all team members to increase innovation and productivity.
Key elements included:
• People development: Led technical seminars and training to develop knowledge and capabilities across distinct areas, including
digitalization, productivity, finance and robotic process automation. This helped team members understand their roles in the overall context of the business and empowered them to look beyond their areas of direct responsibility to drive innovation and results.
• Ideation: Deployed an intentional approach to ideation that encouraged all team members, from frontline to management, to share ideas and best practices. Group brainstorming sessions were held at many of our factories to connect team members and spark innovation in operational excellence.
• Benchmarking: Encouraged team members to connect with outside organizations — customers, peers and others — to learn how they implemented innovative solutions to support business initiatives. This helped team members envision the possible, embrace ideation and build relationships across industries.
Team member engagement efforts across our Dell Technologies factories resulted in a 74% increase in productivity as compared to five years ago, growing the number of computers produced while maintaining the same amount of labor hours.9 Beyond these gains, our employee Net Promoter Score (eNPS), which measures and benchmarks employee satisfaction, increased from +43 to +81.10 This reflects an evolution of culture — one that values continuous improvement and innovation and where team members actively look for ways to help improve business outcomes.
CONTENTS INTRODUCTION OUR APPROACH PROGRESS BY THE NUMBERS HOW WE REPORT

Fees returned, 2020
$531,720 USO
in fees were returned to
supplier employees
2020 SUPPLY CHAIN SUSTAINABILITY PROGRESS REPORT / 17
BETTERING THE LIVES OF PEOPLE IN OUR SUPPLY CHAIN
Driving ethical recruitment practices
It is important to us that people working in our supply chain are treated fairly. In some cases, individuals who migrate away from their home countries for work are forced to pay for various aspects of their recruitment, including costs related to labor agents who facilitate their hiring, obtaining visas or undergoing required preemployment health exams. As a result, these employees find themselves indebted to their employers and at risk of falling victim to forced labor.
Dell Technologies does not tolerate forced labor of any kind and abides by the Responsible Business Alliance (RBA) Code of Conduct, which prohibits our suppliers from charging recruitment fees to their employees, even in locations where these practices are legal. Through our social and environmental responsibility (SER) specialists’ direct engagement with factories and our third-party audits, we work with supplier management and employees to identify and resolve potential issues around fees.
Due diligence efforts in this area include confidential interviews with supplier management and employees as part of regular audits. We also take immediate action to investigate any allegations related to recruitment fees that are received through our helpline (see page 22 for more information), media sources, or nongovernmental organization reports.
If we learn that a supplier is not following recruitment fee practices as required by the RBA Code of Conduct, we:
• Educate the supplier on why such fees are unacceptable.
• Coach the supplier on effective ways to return withheld fees. For instance, if fees are returned to affected employees through paychecks, it is important that non-affected employees understand why their pay does not change.
• Track the supplier’s progress in reimbursing fees to employees.
During the year, we trained suppliers that provide services in Dell Technologies factories in China, Malaysia and India on risks of forced labor, including recruitment fees. These suppliers, known as on-site service providers, deliver services like janitorial support, security and food management. Industry data shows that these suppliers may use labor brokers who charge fees or engage in other practices that do not meet our requirements.
As our suppliers’ understanding of these risks has increased, they have adjusted their practices. However, there are still some instances where we identify and rectify issues.
CONTENTS INTRODUCTION OUR APPROACH PROGRESS BY THE NUMBERS HOW WE REPORT

Weekly working hours compliance, 2020
203,211 employees were monitored at 126 supplier factories
Days of rest compliance, 2020
84°/o of these employees took at least one rest day per week
89%
of employees worked
60 hours or less
per week
2020 SUPPLY CHAIN SUSTAINABILITY PROGRESS REPORT / 18
BETTERING THE LIVES OF PEOPLE IN OUR SUPPLY CHAIN
Taking action to address weekly working hours challenges
Dell Technologies adheres to the social and environmental standards required through the Responsible Business Alliance (RBA) Code of Conduct. The RBA Code of Conduct limits factory line employees to a maximum of 60 working hours per week or the limit stipulated by local law (whichever is stricter) and requires that each employee has one rest day per week.
Breaches of working hours limits are the most common audit findings among supplier factories in our industry.11 Although this overtime is voluntary, excessive working hours impact work-life balance and, in some cases, increase health and safety risks. As such, this is an important area of focus for us, and we are committed to working with our suppliers to improve overall compliance with the industry standard.
Our strategy with suppliers includes the following actions:
• Weekly monitoring of factories with knownrisks of nonconformance based on past auditperformance. This provides an early indicator ofpotential deviation from the standard.
• Collaboration to address identified risks ofnonconformance, balance orders and confirmsupplier capacity.
• Capability building to provide suppliers withknowledge and tools to improve working hoursperformance through management systems.
Consistently meeting this standard is an ongoing challenge across manufacturing and is affected by a number of factors, including but not limited to fluctuations in customer demand, workers’ earning potential and unexpected issues such as the 2020 pandemic.
Over the last year, individuals and organizations around the world have faced numerous uncertainties and disruptions due to COVID-19; our suppliers were no exception. As a result, fewer of the suppliers we monitored for weekly working hours met the standard in 2020 as compared with 2019. In 2020, our tracking covered 203,211 employees at 126 supplier factories. The vast majority of these employees — almost 89% — worked 60 hours per week or less, compared with 91% in 2019. Additionally, just over 84% of these employees took at least one rest day per week.
To address these falling conformance rates, we partnered with 23 suppliers to better understand the root causes and help address the additional complexities related to weekly working hours compliance due to COVID-19. Specifically, we learned that some suppliers struggled to recruit enough employees to manage increased workload requirements in response to increased demand for computers as people around the world began transitioning to work-from-home and learn-from-home situations. We continue to target workforce management to help improve conformance rates.
CONTENTS INTRODUCTION OUR APPROACH PROGRESS BY THE NUMBERS HOW WE REPORT

2020 SUPPLY CHAIN SUSTAINABILITY PROGRESS REPORT / 19
BETTERING THE LIVES OF PEOPLE IN OUR SUPPLY CHAIN — CASE STUDY
Collaborating with suppliers on weekly working hours challenges during COVID-19
The COVID-19 pandemic created new challenges for suppliers in meeting weekly working hours requirements. A dramatic increase in emergency orders and recruitment issues led to one of our large stylus pen suppliers receiving a priority audit finding for excessive working hours in April 2020.
Dell Technologies’ social and environmental responsibility (SER) specialists immediately began work with the supplier to address weekly working hours issues and drive improvement. First, our SER specialists worked with the supplier to identify options to manage employees’ work time more effectively. This helped reduce the number of daily overtime hours for many supplier employees, enabling them to avoid exceeding the 60-hour weekly limit. Next, we worked with the supplier to implement an early warning system to identify potential issues. We then provided guidance to supplier management who built a training plan focused on developing cross-functional skills in their employees to support flexibility in scheduling across different lines. Finally, we collaborated with the supplier on a production plan to support more effective matching of working hours requirements with the business forecast.
As a result of these actions, the supplier’s audit finding was downgraded from priority to major during the first closure audit in October 2020. The April 2020 audit showed that 55% of the supplier employees exceeded the 60 hours per week standard; the October closure audit showed this had decreased to 17%. We continue to work with this supplier to drive long-term improvements with the goal of meeting the full requirements of the 60-hour weekly standard.
CONTENTS INTRODUCTION OUR APPROACH PROGRESS BY THE NUMBERS HOW WE REPORT

2020 SUPPLY CHAIN SUSTAINABILITY PROGRESS REPORT / 20
BETTERING THE LIVES OF PEOPLE IN OUR SUPPLY CHAIN
Helping ensure safe use of process chemicals
Our work with suppliers to improve health and safety in the workplace includes taking action on the use of process chemicals. We are reducing exposure to potentially harmful process chemicals through our Chemical Use Policy. We have also developed Guidelines for Management of Manufacturing Process Chemicals to help suppliers implement best practices for managing chemicals that pose risks for the environment or health. In addition, we survey key suppliers to understand and monitor chemical use in our supply chain.
Dell Technologies also collaborates with the Clean Electronics Production Network (CEPN) to further industry efforts to protect people in our supply chain from potentially harmful process chemicals. CEPN brings together stakeholders from across the industry to identify priority chemicals that could pose a high risk of harmful impacts. Our ongoing involvement with CEPN includes active participation in the Worker Engagement and Process Chemical Reporting workgroups. These efforts helped drive the development of the Toward Zero Exposure program, which Dell Technologies joined as a signatory at the beginning of 2021.
The Toward Zero Exposure program:
• Creates a roadmap for process chemical management informed by suppliers, nongovernmental organizations and subject matter experts.
• Supports companies in assessing use of process chemicals, strengthening the culture of worker safety and engagement, reducing worker exposure to identified priority chemicals, and substituting them with safer alternatives.
• Measures and reports outcomes, expands the impact and reaches into deeper supply chain tiers.
We will share more about our engagement with the Toward Zero Exposure program in the future.
CONTENTS INTRODUCTION OUR APPROACH PROGRESS BY THE NUMBERS HOW WE REPORT

Mobile phone training, 2020
50,364 training hours
completed through mobile
phone courses
83 Factories
participated in
mobile phone
training courses
(76 in 2019)
122,775 Supplier employees
completed mobile
phone training
courses
(106,685 in 2019)
2020 SUPPLY CHAIN SUSTAINABILITY PROGRESS REPORT / 21
BETTERING THE LIVES OF PEOPLE IN OUR SUPPLY CHAIN
Delivering health, safety and employee rights knowledge through mobile phones
Digital learning through mobile phones enables most supplier employees in our supply chain to have consistent access to important training. During 2020, we continued to work with suppliers to ensure their employees received training through their phones on areas such as health and safety protocols and awareness of labor rights.
This is a collaborative initiative between Dell Technologies and our suppliers. We cover the costs of developing the training modules; our suppliers make them available to their employees and cover the cost of Wi-Fi to ensure internet access. All supplier line employees, including direct, temporary, student and migrant, are eligible and encouraged to participate.
Ongoing training topics include:
• Labor rights: Policies banning recruitment fees (see page 17); contract requirements; pay structures; rules around voluntary overtime; requirements for factories to pay social insurance benefits; rights to paid leave and holidays; grievance mechanisms; and right to resign from work.
• Health and safety: Safety training; guidelines on the use of process chemicals (see page 20); how to use personal protective equipment; the importance of daily machine safety checks; and fire and emergency procedures.
• Personal development (these are optional for supplier employees): Financial literacy; career development; and communication skills.
As challenges caused by the pandemic emerged, Dell Technologies also introduced modules to support COVID-19 prevention in the workplace.
Mobile phone learning opportunities increase knowledge and skills and improve safety. In addition, supplier employees are empowered by ensuring their understanding of their rights and the availability of grievance mechanisms to help identify areas of nonconformance with standards in their factories.
CONTENTS INTRODUCTION OUR APPROACH PROGRESS BY THE NUMBERS HOW WE REPORT

2020 SUPPLY CHAIN SUSTAINABILITY PROGRESS REPORT / 22
BETTERING THE LIVES OF PEOPLE IN OUR SUPPLY CHAIN
Driving engagement through open communication
Supplier employees are in a unique position to provide insight on day-to-day factory operations. This feedback is critical in helping us validate supplier compliance with the Responsible Business Alliance Code of Conduct and build greater context around issues and how they are being addressed.
Dell Technologies maintains a free phone helpline to ensure the people in our supply chain, as well as individuals and organizations representing them, have a reliable, confidential communications channel through which to share concerns or suggestions.
A third-party, nongovernmental organization with expertise in supplier employee feedback channels manages the helpline on our behalf. Available 24 hours a day, seven days a week, supplier employees can access the helpline outside the workplace, reinforcing the confidentiality of their feedback.
In addition, supplier employees who participate in audit interviews are provided with information cards that include the helpline number and details as an alternative way to provide anonymous feedback.
Any allegations received through the helpline are investigated immediately and thoroughly by Dell Technologies. Methods to research allegations include unannounced visits by our social and environmental responsibility (SER) specialists and/or third-party auditors. Depending on the nature of any findings, SER specialists will work with suppliers to develop corrective action plans to address areas of nonconformance. In cases of severe (priority and/or major) findings, suppliers may be required to complete a third-party closure audit to resolve the issue.
CONTENTS INTRODUCTION OUR APPROACH PROGRESS BY THE NUMBERS HOW WE REPORT

2020 SUPPLY CHAIN SUSTAINABILITY PROGRESS REPORT / 23
BETTERING THE LIVES OF PEOPLE IN OUR SUPPLY CHAIN — CASE STUDY
Helpline supports employee engagement and drives supplier improvements
Dell Technologies is committed to acting on concerns raised by supplier employees. Last year, we received a complaint via the helpline from a supplier employee who works for one of our mechanical suppliers. The caller expressed concern that a number of supplier employees had not been paid for overtime hours worked during a one-month period.
Our social and environmental responsibility (SER) specialists immediately began an investigation into these allegations. While on-site visits to the factory were not possible during this time due to COVID-19, our SER specialists were still able to consult with factory management to confirm the overtime payment errors and assist the factory in determining the root cause of the issue.
Our investigation revealed that the problem was due to a manual miscalculation of wages. With this information, our SER specialists helped the supplier correct wage payments to impacted employees. We also assisted the supplier in establishing a system designed to prevent recurrences of similar issues in the future. In addition, our SER specialists reinforced the supplier’s responsibility to abide by local laws and the Responsible Business Alliance Code of Conduct requirements pertaining to wages and benefits.
CONTENTS INTRODUCTION OUR APPROACH PROGRESS BY THE NUMBERS HOW WE REPORT

2020 SUPPLY CHAIN SUSTAINABILITY PROGRESS REPORT / 24
BETTERING THE LIVES OF PEOPLE IN OUR SUPPLY CHAIN
Responsible sourcing of minerals in our supply chain
Minerals are used in many Dell Technologies products. For example, gold is used in circuit boards, and cobalt is used in lithium-ion batteries. Some of these minerals are mined in conflict-affected and high-risk areas. While we do not purchase minerals directly from mines, smelters or refiners, our expectations for responsible sourcing extend throughout our supply chain.
It is our goal to avoid purchasing materials containing minerals whose mining and sale are not aligned with our responsible sourcing commitments. This commitment is underscored in the Dell Responsible Sourcing Policy. We also work in full coordination with industry-wide groups such as the Responsible Minerals Initiative (RMI) to promote a common approach, tools and processes that support sourcing decisions that drive improved regulatory compliance.
Our responsible sourcing efforts focus on key "conflict minerals" (tin, tungsten, tantalum and gold — known as 3TG) and follow the recommendations established by the Organisation for Economic Co-operation and Development Due Diligence Guidance (OECD). These include risk assessment, assurance and transparent reporting. We also track other minerals of concern, including cobalt and mica to the extent that such other minerals are used within the Dell-branded finished products supply chain.
Emphasis is placed on the identification and assurance of smelters or refiners (SORs) used to process material
supplied by mines or mineral agents. This includes an independent, third-party assessment of management systems and sourcing practices to validate conformance with the Responsible Minerals Assurance Process (RMAP). The sector-wide RMAP standards meet the requirements of the OECD Due Diligence Guidance, the Regulation (EU) 2017/821 of the European Parliament and the U.S. Dodd-Frank Wall Street Reform and Consumer Protection Act. Dell Technologies annually files a Conflict Minerals Disclosure report with the U.S. Securities and Exchange Commission.
To track conformance rates, we require suppliers who use 3TG and/or cobalt within their supply chain to complete the Conflict Minerals Reporting Template12 or the Cobalt Reporting Template to report on SORs within their own supply chains.
Given the many supply chain tiers involved and the size of refining operations, multiple suppliers will likely include some of the same SORs in their reporting. We work with suppliers to remediate issues with nonconformant SORs to achieve conformance or remove them from their supply chains.
For our most recent reporting cycle, 81% of SORs in our supply chain achieved RMAP conformance.13 We continue to work with suppliers to develop their own capabilities as part of our efforts to drive RMAP conformance across all our suppliers.
CONTENTS INTRODUCTION OUR APPROACH PROGRESS BY THE NUMBERS HOW WE REPORT

2020 SUPPLY CHAIN SUSTAINABILITY PROGRESS REPORT / 25
Reducing our supply chain’s impact on the planet
Dell Technologies is committed to protecting our planet and collaborating with stakeholders to address the impacts of environmental change. We drive sustainability efforts through every aspect of our business and hold our suppliers to the same level of accountability.
Despite the challenges of the pandemic in 2020, we maintained our supply chain environmental programs and continued to see progress in the areas of greenhouse gas (GHG) emissions reduction, water stewardship and waste management through partnership with our suppliers.
To underscore the positive impact of our supply chain environmental practices, the Institute of Public and Environmental Affairs (IPE) in China ranked Dell Technologies as a Corporate Information Transparency Index (CITI) Master. We are one of only two brands to earn this recognition.
To qualify as a CITI Master, a company must:
• Rank as a top performance brand in the annual CITI ranking
• Maintain high performance standards in their supply chain environmental management14
• Show that all key suppliers track their environmental performance through data systems
“ In 2020, we recognized Dell Technologies as a CITI Master for its work with suppliers to improve environmental performance. This accolade acknowledges the company’s efforts to work with suppliers to continuously improve, track progress and monitor performance of their own suppliers to move oversight fully up its supply chain.”
INSTITUTE OF PUBLIC AND ENVIRONMENTAL AFFAIRS
CONTENTS INTRODUCTION OUR APPROACH PROGRESS BY THE NUMBERS HOW WE REPORT

Greenhouse gas emissions
reductions, 2020
48,842 metric tons of carbon dioxide equivalent were
reduced through energy consumption
reduction projects at supplier factories
Supply chain renewable
energy usage, 2020
2,144,830,636 kilowatt-hours
2020 SUPPLY CHAIN SUSTAINABILITY PROGRESS REPORT / 26
REDUCING OUR SUPPLY CHAIN’S IMPACT ON THE PLANET
Reducing greenhouse gas (GHG) emissions in our supply chain
Our carbon footprint includes emissions that suppliers generate as they provide products or services to us. As part of our Progress Made Real Plan for 2030, we are partnering with our direct suppliers to reduce GHG emissions by 60% per unit revenue by 2030.15 This target meets the Science Based Targets initiative (SBTi) criteria for ambitious value chain goals, meaning we are in line with current best practices. This goal is part of Dell Technologies’ recently released strategy to achieve net-zero GHG emissions by 2050.
To achieve this goal, we are building on work we started in 2017 to help suppliers reduce energy consumption, improve energy efficiency and source cleaner energy. Some of our 2020 initiatives included conducting an annual survey to understand energy management across our supply chain and hosting a training session for suppliers to learn more about energy efficiency.
In 2020, we also partnered with two suppliers to help them set their own emissions reduction targets aligned to the SBTi criteria. Key efforts focused on identifying factory energy usage, educating suppliers on renewable energy options and leveraging industry tools for the development of science-based targets. We are using our learnings over the past year to expand our efforts to four additional suppliers in 2021.
In our first year of tracking, our direct material suppliers achieved a 7.7% reduction in GHG emissions per unit revenue.
We continue to work with Dell Technologies teams around the globe to identify renewable energy options in areas where such sources are limited. As expected, this is proving to be a key challenge for our suppliers.
While there is still much to be done, we are proud of the recognition we have received over the past year for progress we are making through collaboration with our suppliers:
• Carbon Disclosure Project (CDP) Supplier Engagement Leader: Our efforts to cascade climate action across our supply chain helped Dell Technologies earn this ranking. This also contributed to Dell Technologies being named to the CDP A List 2020.
• SCTI Master: This Institute of Public and Environmental Affairs (IPE) ranking recognizes brands’ efforts toward supply chain GHG emissions reduction and engagement in global climate change governance. We are one of only two brands to receive this recognition.
CONTENTS INTRODUCTION OUR APPROACH PROGRESS BY THE NUMBERS HOW WE REPORT

Freshwater saved,
2019 to 2020
29.9 million meters3 (2019)
43.4 million meters3 (2020)
Water discharge reduced,
2019 to 2020
38.9m
26.2m
2019 2020
2020 SUPPLY CHAIN SUSTAINABILITY PROGRESS REPORT / 27
REDUCING OUR SUPPLY CHAIN’S IMPACT ON THE PLANET
Working with stakeholders to support water stewardship
Water stewardship — the responsible planning and management of resources16 — is vital to a sustainable future. In addition to water use considerations around the manufacturing of our products, a number of our suppliers operate in areas of water stress.
Dell Technologies partners with suppliers who have water-intensive processes or operate factories located in water-stressed areas where at least 20% of renewable surface and groundwater is withdrawn annually and insufficient for a region’s needs.17 For the last six years, we have worked closely with these suppliers to analyze their water use, offer training, and develop and implement water management plans to achieve reductions in water use and wastewater discharge.
In 2020, 236 of our supplier factories implemented water management plans. Through this work, these suppliers saved 43.4 million cubic meters of freshwater and reduced the amount of wastewater they discharged by 38.9 million cubic meters.
In addition to considering our own supply chain’s water use, we recognize the importance of understanding shared risk and engaging with stakeholders across the full catchment area. Reflective of this, factory water risk mitigation plans include engagement with stakeholders such as municipal water providers, local community members and wastewater treatment plants.
To further support these efforts, we leverage our partnership with the Alliance for Water Stewardship (AWS) to build supplier involvement at the water catchment level. A global organization, the AWS brings together businesses, nongovernmental organizations and the public sector to protect local water resources through the adoption and promotion of a universal framework for sustainable water use — the AWS International Water Stewardship Standard (AWS Standard). At the end of 2020, three Dell Technologies suppliers achieved this standard. We continue to work with other suppliers to achieve this high level of performance.
We also work with our information communications and technology (ICT) peers to support suppliers at varying levels of water stewardship maturity to achieve continuous improvement. Dell Technologies is a member of the ICT Water Stewardship Working Group, established by AWS and the Responsible Business Alliance, which is developing shared assessment criteria aligned to the AWS Standard to help suppliers understand their current performance level and build capacity going forward.
“Leading by example is crucial. By supporting the first three suppliers achieving AWS certification clearly shows Dell’s commitment and leadership. Water stewardship is a new way of managing water that systematically recognizes and secures the social, cultural, environmental and economic value of freshwater. This concept has been well embedded in the daily management of those demonstration sites, and will further benefit the catchments they are located in.”
ALLIANCE FOR WATER STEWARDSHIP
CONTENTS INTRODUCTION OUR APPROACH PROGRESS BY THE NUMBERS HOW WE REPORT

2020 SUPPLY CHAIN SUSTAINABILITY PROGRESS REPORT / 28
REDUCING OUR SUPPLY CHAIN’S IMPACT ON THE PLANET — CASE STUDY
Responsible water management in action
Dell Technologies social and environmental responsibility specialists collaborate with our suppliers and industry organizations to drive environmental improvements. In 2020, we worked closely with the Alliance for Water Stewardship Asia-Pacific (AWS Asia-Pacific) to help three suppliers, located in the Tai Lake Basin and Huai River Basin regions in China, in achieving the AWS International Water Stewardship Standard (AWS Standard). The AWS Standard is a framework for organizations to understand their water use and impacts, and drive collaboration for sustainable water management across the water catchment.
To meet the requirements of the standard, the suppliers mobilized their leadership and functional areas to conduct assessments and identify improvement actions in the areas of water balance, quality and governance, and safe drinking water, sanitation and hygiene. The suppliers also extended the scope of their corporate water management from an operations-only focus to include communities, watersheds and further upstream supply chains. After a year of hard work, the three suppliers achieved the AWS Standard.
CONTENTS INTRODUCTION OUR APPROACH PROGRESS BY THE NUMBERS HOW WE REPORT

2020 SUPPLY CHAIN SUSTAINABILITY PROGRESS REPORT / 29
REDUCING OUR SUPPLY CHAIN’S IMPACT ON THE PLANET
Addressing waste
Sustainable management of resources is critical to the long-term resiliency of our business and the overall health of the environment. As part of our efforts in this area, we collaborate with suppliers to identify alternatives to reduce or reuse waste that would otherwise be sent to landfills. In 2020, Dell Technologies expanded our successful pilot program designed to help reduce the amount of waste disposed of in landfills; 22 suppliers now participate in our Zero Waste Program.
As part of the Zero Waste Program, our social and environmental responsibility specialists provide expertise to help suppliers ensure safe disposal practices and reduce waste. Beyond following disposal standards for solid and hazardous waste, we help suppliers implement solutions that include reuse, recycling, composting, anaerobic digestion and incineration. Suppliers participating in these efforts diverted 91% of their solid waste from landfills, either through recycling or reuse, in 2020.
In 2021, we plan to continue our work with suppliers to further reduce waste going to landfills, which will help save money and resources, extend the useful life of products and materials, and continue efforts to move to a circular economy.
In addition to our Zero Waste Program, we expect our suppliers to demonstrate transparency about their environmental impacts by publishing sustainability reports in accordance with the Global Reporting Initiative. Last year, 95% of our direct material suppliers (by spend) published these reports. Based on this information, 67% of Dell Technologies’ direct material suppliers (by spend) reported progress in reducing waste from their operations.
CONTENTS INTRODUCTION OUR APPROACH PROGRESS BY THE NUMBERS HOW WE REPORT

2020 SUPPLY CHAIN SUSTAINABILITY PROGRESS REPORT / 30
REDUCING OUR SUPPLY CHAIN’S IMPACT ON THE PLANET — CASE STUDY
Building supplier waste management capabilities through the Zero Waste Program
Last year, one of our monitor suppliers joined Dell Technologies’ Zero Waste Program to help build sustainable waste management practices. As a first step, the supplier completed an 87-question self-assessment developed by Dell Technologies social and environmental responsibility (SER) specialists. The questionnaire aligns to local legal requirements around waste management, as well as the TRUE certification and UL waste diversion validation programs.
Next, the supplier began sharing monthly data on multiple types of waste through Dell Technologies’ online platform. Working with an external consulting company, we evaluated this data and information gathered from an on-site visit to identify gaps in the supplier’s performance.
The supplier’s waste management team and leadership worked with our SER specialists to develop actions for performance improvement. Progress highlights included:
• Reduction in hazardous waste through optimization of chemical use and recycling
• Reduction in waste generated by supplier employees through daily activities at the factory site
• Increase in supplier employee engagement in waste minimization activities
This collaborative effort resulted in closure of gaps by the end of 2020 and achievement of certification through Dell Technologies' Zero Waste Program.
CONTENTS INTRODUCTION OUR APPROACH PROGRESS BY THE NUMBERS HOW WE REPORT

2020 SUPPLY CHAIN SUSTAINABILITY PROGRESS REPORT / 31
Driving supplier diversity beyond spend
As part of our commitment to responsible business practices, Dell Technologies looks for opportunities to drive diversity within our supply chain. We have well-established initiatives to identify and support qualified businesses that are owned by individuals of diverse backgrounds to deliver products that meet the needs of our global customer base.
One key measurement of our success is how much we spend with diverse suppliers. In 2020, Dell Technologies spent more than $3 billion USD with diverse and small businesses — making this the ninth year we achieved this milestone. And for the 11th consecutive year, Dell Technologies also earned recognition through the Billion Dollar Roundtable (BDR). BDR recognizes and celebrates corporations that spend at least $1 billion USD annually with minority- and women-owned businesses.
In addition, we prioritize sourcing from suppliers that demonstrate a strong commitment to supplier diversity within their own organizations. To drive accountability in our supply chain, we monitor the amount our key suppliers spend with diverse suppliers themselves. Last year, our suppliers spent more than $600 million USD with diverse companies.
Spend is an important indicator of our engagement with our diverse suppliers. However, it is only one of the ways we work to drive meaningful impact and inclusion. We continually look for strategic
opportunities within our supply chain to promote diversity and inclusion beyond spend.
A foundational element of our diversity initiatives includes supporting skill development for diverse suppliers. Dell Technologies offers two opportunities for diverse suppliers to build their business competencies — our Supplier Diversity Development Program and our Women in Technology Program. Expanded capabilities enable suppliers participating in these programs to improve operational performance, which may position them to pursue new growth opportunities.
The Supplier Diversity Development Program focuses on refining skill sets for our diverse suppliers at multiple levels of maturity. The goal is to help drive overall operational effectiveness and better position them for success with Dell Technologies and other large corporations.
In March 2020, one of our Supplier Diversity Development Program alumni demonstrated growth and agility as it helped Dell Technologies navigate the aftermath of the tornado that struck our Nashville, Tennessee, fulfillment center. This supplier worked with Dell Technologies teams to redirect products and ensure we continued to meet customer demands. We recognized this supplier with the Best Overall Partner Award for their efforts.
“We are so thankful to work with such a great partner in Dell, which supports diverse businesses and empowers former service members. We were fortunate to attend Dell’s first Supplier Diversity Development Program. The program was instrumental in our increased success within Dell and externally as well. The Dell Supplier Diversity team cares and makes an appreciable impact!”
NATIONAL VETERAN BUSINESS DEVELOPMENT COUNCIL-CERTIFIED INTEGRATED TECHNOLOGY SOLUTIONS SUPPLIER
CONTENTS INTRODUCTION OUR APPROACH PROGRESS BY THE NUMBERS HOW WE REPORT

2020 SUPPLY CHAIN SUSTAINABILITY PROGRESS REPORT / 32
DRIVING SUPPLIER DIVERSITY BEYOND SPEND
Our Women in Technology Program aims to help women-owned businesses in the information and communications technology sector navigate engagement with large global companies. Through our ongoing partnership with the Women’s Business Enterprise National Council, we evolved this program in 2020 to ensure continued engagement during the pandemic. Using online platforms, we offered a number of programs to help our Women in Technology alumnae confront uncertainties and disruptions brought on by the pandemic. Topics included resiliency, leadership, technology trends and cybersecurity.
One of our suppliers participating in the Women in Technology Program was key in helping us address demand challenges created by COVID-19. This supplier quickly realigned its business to support the growth for technology, security and software products to enable work-from-home capabilities and infrastructure.
In addition, we continually look for opportunities to give equal access to and promote small and diverse businesses that are:
• Women-owned and enterprises certified by the Women’s Business Enterprise National Council
• Minority-owned and enterprises certified by the National Minority Supplier Development Council
• LGBT-owned and certified by the National LGBT Chamber of Commerce
• Disability-owned and certified by Disability:IN
• Veteran-owned and certified by the National Veteran Business Development Council
• Qualified under the Small Business Administration:• Small disadvantaged businesses• Historically Underutilized Business Zone
program • Women-owned businesses• Veteran-owned businesses• Service-disabled veteran-owned businesses
• International women-owned businesses certified by WEConnect International
• Chinese minority-owned businesses verified through Minority Supplier Development in China
“The Women in Technology Program Dell offers to support diverse suppliers has been very valuable in helping us navigate through the challenges of COVID-19 and plan our resources to support the uncertainties — while still aligning for growth in areas of cloud and cybersecurity. My team and I are also very thankful to Dell for a strong partnership.”
WOMEN IN TECHNOLOGY PROGRAM PARTICIPANT
CONTENTS INTRODUCTION OUR APPROACH PROGRESS BY THE NUMBERS HOW WE REPORT

2020 SUPPLY CHAIN SUSTAINABILITY PROGRESS REPORT / 33
DRIVING SUPPLIER DIVERSITY BEYOND SPEND — CASE STUDY
Supporting diversity and inclusion in legal services
Dell Technologies seeks innovative ways to advance diverse representation in the businesses that provide professional services to us. One example of this is our partnership with law firms to encourage the use of diverse attorneys when providing legal services to Dell Technologies.
For the past nine years, Dell Technologies has recognized external law firms through the Dell Technologies Legal Diversity Award. This award highlights the expectation that our large legal firms lead by example in attracting, retaining and promoting diverse talent.
The award criteria is based on:
• Overall diversity demographics
• Leadership opportunities available to diverse attorneys including women, minorities and LGBTQ+ individuals
• Demonstrated commitment to foster an inclusive culture and environment
• Utilization of diverse staffing and leadership among the teams handling legal matters on behalf of Dell Technologies
In 2020, we evaluated 41 law firms against our award criteria. The recipient exceeded our expectations by achieving 50% diversity on its executive board and had the highest percentage of women equity partners (49.5%) and minority equity partners (14.4%) as compared to its peers. Our honoree also ranked high
among finalists for attorneys on staff with disabilities and led the group of finalists in terms of veteran staffing on Dell Technologies matters and veteran attorneys at the firm, generally. We continue to explore options to validate our law firms’ commitment to staffing our matters with diverse lawyers using qualitative and quantitative data.
We are also working to build diversity in the broader legal profession. We understand these efforts must start early. For the last three years, we have partnered with high schools in Austin, Texas, and Boston,
Massachusetts, to support legal pathways curriculum and after-school clubs.
Our engagement included sharing information on the legal profession and education through presentations; participating in career panels; mentoring students; assisting with mock-trial preparation; and providing financial support for materials and field trips.
In addition, two years ago, we launched the Dell Technologies General Counsel Diversity Scholarship to encourage individuals from diverse backgrounds
to pursue the practice of law. We targeted schools with traditionally underprivileged student populations, including those who are children of immigrants, the first in their families to go to college and from economically disadvantaged areas. In addition to receiving cash awards, scholarship recipients are mentored by Dell Technologies’ legal team members and are invited to participate in networking events.
These efforts demonstrate Dell Technologies’ ongoing commitment to fostering diversity and inclusion with legal services providers.
CONTENTS INTRODUCTION OUR APPROACH PROGRESS BY THE NUMBERS HOW WE REPORT

2020 SUPPLY CHAIN SUSTAINABILITY PROGRESS REPORT / 34
Recognition
CDP CLIMATE A LIST
Score: AScored an A for Dell Technologies’ response in 2020 to CDP’s annual climate change questionnaire for the quality and comprehensiveness of information Dell provided. The disclosure score is a metric of good internal management, understanding of climate change issues, and company transparency on climate change.
CDP SUPPLY CHAIN LEADERBOARD
Leader statusRecognized as a leader among the top 7% of companies assessed for supplier engagement on climate change, based on our 2020 CDP disclosure. CDP’s Supplier Engagement Rating measures how effectively companies are engaging their suppliers on climate change.
INSTITUTE OF PUBLIC & ENVIRONMENTAL AFFAIRS
CITI MasterRecognized by the IPE in China for our work with suppliers to improve environmental performance.
INSTITUTE OF PUBLIC & ENVIRONMENTAL AFFAIRS
SCTI MasterRecognized by the IPE in China for our efforts toward supply chain greenhouse gas emissions reduction and engagement in global climate change governance.
KNOWTHECHAIN
Score: 6th out of 49 companiesRanked 6th in the Information and Communications Technology Sector. Began reporting to KnowTheChain in 2020 to operate more transparently and responsibly in addressing forced labor in global supply chains.
BILLION DOLLAR ROUNDTABLE
Achieved $3 billion in spendRecognized for the 11th straight year for spending at least $1 billion USD annually with minority- and women-owned businesses.
GARTNER POWER OF THE PROFESSION AWARDSTM
People Breakthrough of the YearRecognized for enabling people with disabilities (PwD) in our Brazil factory by implementing inclusivity best practices and training, ensuring physical accessibility and partnering with stakeholder groups to create and implement assistive technology. Twenty percent of the factory manufacturing workforce includes PwD. Learn more here.18
GLOBAL TOP 25 SUPPLY CHAIN
Ranked among the 2021 leadersThis ranking highlights integrated, purpose-driven organizations, customer-driven business transformation and digital first supply chain. Fifteen percent of the evaluation criteria is based on ESG measures.
CONTENTS INTRODUCTION OUR APPROACH PROGRESS BY THE NUMBERS HOW WE REPORT

2020 SUPPLY CHAIN SUSTAINABILITY PROGRESS REPORT / 35
By the numbers
CONTENTS INTRODUCTION OUR APPROACH PROGRESS BY THE NUMBERS HOW WE REPORT

* 15% in 2019
2020 SUPPLY CHAIN SUSTAINABILITY PROGRESS REPORT / 36
BY THE NUMBERS — AUDIT RESULTS
Labor and human rights
Percentage of audited factories in compliance, with breakdown of major and priority findings of noncompliance according to supply chain tier19
KeyP Priority Findings
M Major Findings
Results are based on audits of 313 factories. When an issue is found, we work with the factory to correct it.
At the end of 2020, 76% of priority and major findings (cumulatively) had been closed.
Dell & FinalAssembly
Direct
Sub-tier
88%86% in 2019
99%99% in 2019
78%73% in 2019
100%99% in 2019
99%98% in 2019
100%100% in 2019
13%*
1
14
22
0
1
1
0
0
0
0
2
1
15
104
153
0
5
12
0 5
1 30
0 33
0 0
0 1
0 0
0 0
0 1
0 310
0
0 0
0
0P
100
Tota
l % o
f fa
cilit
ies
in c
ompl
ianc
e in
20
20
M P M P M P M P M P M P M
Freely chosen employment
Young worker protections
Working hours and rest days
Wages and benefitsHumane treatment
Non-discriminationFreedom of association
Dell & FinalAssembly
Direct
Sub-tier
88%86% in 2019
99%99% in 2019
78%73% in 2019
100%99% in 2019
99%98% in 2019
100%100% in 2019
13%*
1
14
22
0
1
1
0
0
0
0
2
1
15
104
153
0
5
12
0 5
1 30
0 33
0 0
0 1
0 0
0 0
0 1
0 310
0
0 0
0
0P
100
Tota
l % o
f fa
cilit
ies
in c
ompl
ianc
e in
20
20
M P M P M P M P M P M P M
Freely chosen employment
Young worker protections
Non-discrimination Working hours and rest days
Wages and benefitstreatment
Non-discriminationFreedom of association
Dell & FinalAssembly
Direct
Sub-tier
88%86% in 2019
99%99% in 2019
78%73% in 2019
100%99% in 2019
99%98% in 2019
100%100% in 2019
13%*
1
14
22
0
1
1
0
0
0
0
2
1
15
104
153
0
5
12
0 5
1 30
0 33
0 0
0 1
0 0
0 0
0 1
0 310
0
0 0
0
0P
100
Tota
l % o
f fa
cilit
ies
in c
ompl
ianc
e in
20
20
M P M P M P M P M P M P M
Freely chosen employment
Young worker protections
Working hours and rest days
Wages and benefitsHum treatment
Freedom of association
Dell & FinalAssembly
Direct
Sub-tier
88%86% in 2019
99%99% in 2019
78%73% in 2019
100%99% in 2019
99%98% in 2019
100%100% in 2019
13%*
1
14
22
0
1
1
0
0
0
0
2
1
15
104
153
0
5
12
0 5
1 30
0 33
0 0
0 1
0 0
0 0
0 1
0 310
0
0 0
0
0P
100
Tota
l % o
f fa
cilit
ies
in c
ompl
ianc
e in
20
20
M P M P M P M P M P M P M
Freely chosen employment
Young worker protections
Working hours and rest days
Wages and benefitsHumane treatment
Non-discriminationFreedom of association
Dell & FinalAssembly
Direct
Sub-tier
88%86% in 2019
99%99% in 2019
78%73% in 2019
100%99% in 2019
99%98% in 2019
100%100% in 2019
13%*
1
14
22
0
1
1
0
0
0
0
2
1
15
104
153
0
5
12
0 5
1 30
0 33
0 0
0 1
0 0
0 0
0 1
0 310
0
0 0
0
0P
100
Tota
l % o
f fa
cilit
ies
in c
ompl
ianc
e in
20
20
M P M P M P M P M P M P M
Freely chosen employment
Young worker protections
Working hours and rest days
Wages and benefitsHumane treatment
Non-discriminationFreedom of association
CONTENTS INTRODUCTION OUR APPROACH PROGRESS BY THE NUMBERS HOW WE REPORT

2020 SUPPLY CHAIN SUSTAINABILITY PROGRESS REPORT / 37
BY THE NUMBERS — AUDIT RESULTS
Employee health and safety
Percentage of audited factories in compliance, with breakdown of major and priority findings of noncompliance according to supply chain tier20
KeyP Priority Findings
M Major Findings
Results are based on audits of 313 factories. When an issue is found, we work with the factory to correct it.
At the end of 2020, 76% of priority and major findings (cumulatively) had been closed.
Dell & FinalAssembly
Direct
Sub-tier
76%70% in 2019
76%73% in 2019
89%83% in 2019
100%98% in 2019 95%
96% in 2019
100%96% in 2019 95%
90% in 2019 88%85% in 2019
1
29
45
0
0
0
2
26
44
0
3
1
0
3
30
0
0
0
0 0
0 0
0 1
0 0
0 5
0 11
0 0
0 1
0 0
0
7
80
0
1
0 0
0 9
0 29
Occupational safety
Emergency preparedness
Occupational injury and illness prevention
Physically demanding work
Machine safeguarding
Health and safety communication
Food, sanitation and housing
Industrial hygiene
0
100
Tota
l % o
f fa
cilit
ies
in c
ompl
ianc
e in
20
20
P M P M P M P M P M P M P M P M
CONTENTS INTRODUCTION OUR APPROACH PROGRESS BY THE NUMBERS HOW WE REPORT

2020 SUPPLY CHAIN SUSTAINABILITY PROGRESS REPORT / 38
BY THE NUMBERS — AUDIT RESULTS
Environment
Percentage of audited factories in compliance, with breakdown of major and priority findings of noncompliance according to supply chain tier21
KeyP Priority Findings
M Major Findings
Results are based on audits of 313 factories. When an issue is found, we work with the factory to correct it.
At the end of 2020, 76% of priority and major findings (cumulatively) had been closed.
Dell & FinalAssembly
Direct
Sub-tier
100%100% in 2019 88%
87% in 2019
92%83% in 2019
100%97% in 2019 94%
89% in 2019
100%100% in 2019
97%97% in 2019
98%91% in 2019
1
23
0
0
0
15
0
0
1
0
0
0
1
8
15
0
0
0
0 0
0 0
0 0
0 0
0 3
0 17
0 0
0 0
0 1
0 0
0 4
0 4
0
4
30
0
0
Pollution prevention and resource reduction
Environmental permits and reporting
Hazardous substances
Solid waste Air emissions
Materials restrictions
Energy consumption and greenhouse gas emissions
Water management
0
100
Tota
l % o
f fa
cilit
ies
in c
ompl
ianc
e in
20
20
P M P M P M P M P M P M P M P M
Dell & FinalAssembly
Direct
Sub-tier
100%100% in 2019 88%
87% in 2019
92%83% in 2019
100%97% in 2019 94%
89% in 2019
100%100% in 2019
97%97% in 2019
98%91% in 2019
1
23
0
0
0
15
0
0
1
0
0
0
1
8
15
0
0
0
0 0
0 0
0 0
0 0
0 3
0 17
0 0
0 0
0 1
0 0
0 4
0 4
0
4
30
0
0
Pollution prevention and resource reduction
Environmental permits and reporting
Hazardous substances
Solid wasteemissions
Materials restrictions
Energy consumption and greenhouse gas emissions
Water management
0
100
Tota
l % o
f fa
cilit
ies
in c
ompl
ianc
e in
20
20
P M P M P M P M P M P M P M P M
Dell & FinalAssembly
Direct
Sub-tier
100%100% in 2019 88%
87% in 2019
92%83% in 2019
100%97% in 2019 94%
89% in 2019
100%100% in 2019
97%97% in 2019
98%91% in 2019
1
23
0
0
0
15
0
0
1
0
0
0
1
8
15
0
0
0
0 0
0 0
0 0
0 0
0 3
0 17
0 0
0 0
0 1
0 0
0 4
0 4
0
4
30
0
0
Pollution prevention and resource reduction
Environmental permits and reporting
Hazardous substances
Solid waste Air emissions
Materials restrictions
Energy consumption and greenhouse gas emissions
Water management
0
100
Tota
l % o
f fa
cilit
ies
in c
ompl
ianc
e in
20
20
P M P M P M P M P M P M P M P M
Dell & FinalAssembly
Direct
Sub-tier
100%100% in 2019 88%
87% in 2019
92%83% in 2019
100%97% in 2019 94%
89% in 2019
100%100% in 2019
97%97% in 2019
98%91% in 2019
1
23
0
0
0
15
0
0
1
0
0
0
1
8
15
0
0
0
0 0
0 0
0 0
0 0
0 3
0 17
0 0
0 0
0 1
0 0
0 4
0 4
0
4
30
0
0
Pollution prevention and resource reduction
Environmental permits and reporting
Hazardous substances
Solid waste Air emissions
Materials restrictions
Energy consumption and greenhouse gas emissions
Water management
0
100
Tota
l % o
f fa
cilit
ies
in c
ompl
ianc
e in
20
20
P M P M P M P M P M P M P M P M
CONTENTS INTRODUCTION OUR APPROACH PROGRESS BY THE NUMBERS HOW WE REPORT

2020 SUPPLY CHAIN SUSTAINABILITY PROGRESS REPORT / 39
BY THE NUMBERS — AUDIT RESULTS
Ethics
Percentage of audited factories in compliance, with breakdown of major and priority findings of noncompliance according to supply chain tier22
KeyP Priority Findings
M Major Findings
Results are based on audits of 313 factories. When an issue is found, we work with the factory to correct it.
At the end of 2020, 76% of priority and major findings (cumulatively) had been closed.
Dell & FinalAssembly
Direct
Sub-tier
100%100% in 2019
100% 100% 100% 100% 100% 100% 100%100% in 2019 100% in 2019 100% in 2019 100% in 2019 99% in 2019 99% in 201999% in 2019
0
0
0
0
0
0
0
0
0
0
0
0
0
0
0
0 0
0 0
0 0
0 0
0 0
0 0
0 0
0 0
0 0
0 0
0 0
0 0
0
0
10
0
0
0
0
0
0
100
Tota
l % o
f fa
cilit
ies
in c
ompl
ianc
e in
20
20
Protection of identity and non-retaliation
Intellectualproperty
Fair business, advertisingand competition
Businessintegrity
Responsible sourcingof minerals
No improperadvantage
Privacy Disclosure ofinformation
P M P M P M P M P M P M P M P M
Dell & FinalAssembly
Direct
Sub-tier
100% 100%100% in 2019
100% 100% 100% 100% 100% 100%100% in 2019 100% in 2019 100% in 2019 100% in 2019 99% in 2019 99% in 201999% in 2019
0
0
0
0
0
0
0
0
0
0
0
0
0
0
0
0 0
0 0
0 0
0 0
0 0
0 0
0 0
0 0
0 0
0 0
0 0
0 0
0
0
10
0
0
0
0
0
0
100
Tota
l % o
f fa
cilit
ies
in c
ompl
ianc
e in
20
20
Protection of identity and non-retaliation
Intellectualproperty
FFair business, advertisingand competition
air business, advertisingand competition
Businessintegrity
Responsible sourcingof minerals
No improperadvantage
Privacy Disclosure ofinformation
P M P M P M P M P M P M P M P M
Dell & FinalAssembly
Direct
Sub-tier
100% 100% 100% 100% 100% 100% 100% 100%100% in 2019 100% in 2019 100% in 2019 100% in 2019 100% in 2019 99% in 2019 99% in 201999% in 2019
0
0
0
0
0
0
0
0
0
0
0
0
0
0
0
0 0
0 0
0 0
0 0
0 0
0 0
0 0
0 0
0 0
0 0
0 0
0 0
0
0
10
0
0
0
0
0
0
100
Tota
l % o
f fa
cilit
ies
in c
ompl
ianc
e in
20
20
Protection of identity and non-retaliation
Intellectualproperty
Fair business, advertisingand competition
Businessintegrity
Responsible sourcingof minerals
No improperadvantage
Privacy Disclosure ofinformation
P M P M P M P M P M P M P M P M
Dell & FinalAssembly
Direct
Sub-tier
100% 100% 100% 100% 100%100% in 2019
100% 100% 100%100% in 2019 100% in 2019 100% in 2019 100% in 2019 99% in 2019 99% in 201999% in 2019
0
0
0
0
0
0
0
0
0
0
0
0
0
0
0
0 0
0 0
0 0
0 0
0 0
0 0
0 0
0 0
0 0
0 0
0 0
0 0
0
0
10
0
0
0
0
0
0
100
Tota
l % o
f fa
cilit
ies
in c
ompl
ianc
e in
20
20
Protection of identity and non-retaliation
Intellectualproperty
Fair business, advertisingand competition
Businessintegrity
Responsible sourcingof minerals
No improperadvantage
Privacy Disclosure ofinformation
P M P M P M P M P M P M P M P M
Dell & FinalAssembly
Direct
Sub-tier
100% 100% 100% 100% 100% 100%99% in 2019
100% 100%100% in 2019 100% in 2019 100% in 2019 100% in 2019 100% in 2019 99% in 201999% in 2019
0
0
0
0
0
0
0
0
0
0
0
0
0
0
0
0 0
0 0
0 0
0 0
0 0
0 0
0 0
0 0
0 0
0 0
0 0
0 0
0
0
10
0
0
0
0
0
0
100
Tota
l % o
f fa
cilit
ies
in c
ompl
ianc
e in
20
20
Protection of identity and non-retaliation
Intellectualproperty
Fair business, advertisingand competition
Businessintegrity
Responsible sourcingof minerals
No improperadvantage
Privacy Disclosure ofinformation
P M P M P M P M P M P M P M P M
Dell & FinalAssembly
Direct
Sub-tier
100% 100% 100% 100% 100% 100% 100%99% in 2019
100%100% in 2019 100% in 2019 100% in 2019 100% in 2019 100% in 2019 99% in 2019 99% in 2019
0
0
0
0
0
0
0
0
0
0
0
0
0
0
0
0 0
0 0
0 0
0 0
0 0
0 0
0 0
0 0
0 0
0 0
0 0
0 0
0
0
10
0
0
0
0
0
0
100
Tota
l % o
f fa
cilit
ies
in c
ompl
ianc
e in
20
20
Protection of identity and non-retaliation
Intellectualproperty
Fair business, advertisingand competition
Businessintegrity
Responsible sourcingof minerals
No improperadvantage
Privacy Disclosure ofinformation
P M P M P M P M P M P M P M P M
Dell & FinalAssembly
Direct
Sub-tier
100% 100% 100% 100% 100% 100% 100% 100%99% in 2019100% in 2019 100% in 2019 100% in 2019 100% in 2019 100% in 2019 99% in 2019 99% in 2019
0
0
0
0
0
0
0
0
0
0
0
0
0
0
0
0 0
0 0
0 0
0 0
0 0
0 0
0 0
0 0
0 0
0 0
0 0
0 0
0
0
10
0
0
0
0
0
0
100
Tota
l % o
f fa
cilit
ies
in c
ompl
ianc
e in
20
20
Protection of identity and non-retaliation
Intellectualproperty
Fair business, advertisingand competition
Businessintegrity
Responsible sourcingof minerals
No improperadvantage
Privacy Disclosure ofinformation
P M P M P M P M P M P M P M P M
CONTENTS INTRODUCTION OUR APPROACH PROGRESS BY THE NUMBERS HOW WE REPORT

2020 SUPPLY CHAIN SUSTAINABILITY PROGRESS REPORT / 40
BY THE NUMBERS — AUDIT RESULTS
Management systems
Percentage of audited factories in compliance, with breakdown of major and priority findings of noncompliance according to supply chain tier23
KeyP Priority Findings
M Major Findings
Results are based on audits of 313 factories. When an issue is found, we work with the factory to correct it.
At the end of 2020, 76% of priority and major findings (cumulatively) had been closed.
Dell & FinalAssembly
Direct
Sub-tier
98% in 2019100% in 2019 99% in 2019 99% in 2019 99% in 2019 99% in 2019 99% in 2019
100% 100% 100% 100% 100% 100% 100% 100%98% in 2019
0
0
1
0
0
0
0
0
0
0
0
0
0
0
0
0
0
1
0
0
0
0
0
0
0 0
0 0
0 1
0 0
0 0
0 1
0 0
0 0
0 1
0 0
0 0
0 0
0
100
Tota
l % o
f fa
cilit
ies
in c
ompl
ianc
e in
20
20
Legal and customerrequirements
P M
Documentationand records
Communication Companycommitment
Training Worker feedbackand participation
Correctiveaction process
Managementaccountability and
responsibility
P M P M P M P M P M P M P M
Dell & FinalAssembly
Direct
Sub-tier
98% in 2019100% in 2019 99% in 2019 99% in 2019 99% in 2019 99% in 2019 98% in 2019
100% 100% 100% 100%99% in 2019
100% 100% 100% 100%
0
0
1
0
0
0
0
0
0
0
0
0
0
0
0
0
0
1
0
0
0
0
0
0
0 0
0 0
0 1
0 0
0 0
0 1
0 0
0 0
0 1
0 0
0 0
0 0
0
100
Tota
l % o
f fa
cilit
ies
in c
ompl
ianc
e in
20
20
Legal and customerrequirements
P M
Documentationand records
Communication Companycommitment
Training Worker feedbackand participation
Correctiveaction process
Managementaccountability and
responsibility
P M P M P M P M P M P M P M
Dell & FinalAssembly
Direct
Sub-tier
98% in 2019100% in 2019 99% in 2019 99% in 2019 99% in 2019 99% in 2019 98% in 2019
100% 100% 100% 100% 100% 100%99% in 2019
100% 100%
0
0
1
0
0
0
0
0
0
0
0
0
0
0
0
0
0
1
0
0
0
0
0
0
0 0
0 0
0 1
0 0
0 0
0 1
0 0
0 0
0 1
0 0
0 0
0 0
0
100
Tota
l % o
f fa
cilit
ies
in c
ompl
ianc
e in
20
20
Legal and customerrequirements
P M
Documentationand records
Communication Companycommitment
Training Worker feedbackand participation
Correctiveaction process
Managementaccountability and
responsibility
P M P M P M P M P M P M P M
Dell & FinalAssembly
Direct
Sub-tier
98% in 2019100% in 2019 99% in 2019 99% in 2019 99% in 2019 99% in 2019 98% in 2019
100% 100%99% in 2019
100% 100% 100% 100% 100% 100%
0
0
1
0
0
0
0
0
0
0
0
0
0
0
0
0
0
1
0
0
0
0
0
0
0 0
0 0
0 1
0 0
0 0
0 1
0 0
0 0
0 1
0 0
0 0
0 0
0
100
Tota
l % o
f fa
cilit
ies
in c
ompl
ianc
e in
20
20
Legal and customerrequirements
P M
Documentationand records
Communication Companycommitment
Training Worker feedbackand participation
Correctiveaction process
Managementaccountability and
responsibility
P M P M P M P M P M P M P M
Dell & FinalAssembly
Direct
Sub-tier
100% in 2019 99% in 2019 99% in 2019 99% in 2019 99% in 2019 99% in 2019 98% in 2019
100% 100% 100% 100% 100% 100% 100%98% in 2019
100%
0
0
1
0
0
0
0
0
0
0
0
0
0
0
0
0
0
1
0
0
0
0
0
0
0 0
0 0
0 1
0 0
0 0
0 1
0 0
0 0
0 1
0 0
0 0
0 0
0
100
Tota
l % o
f fa
cilit
ies
in c
ompl
ianc
e in
20
20
Legal and customerrequirements
P M
Documentationand records
Communication Companycommitment
Training Worker feedbackand participation
Correctiveaction process
Managementaccountability and
responsibility
P M P M P M P M P M P M P M
Dell & FinalAssembly
Direct
Sub-tier
98% in 2019100% in 2019 99% in 2019 99% in 2019 99% in 2019 99% in 2019 98% in 2019
100% 100% 100% 100% 100%99% in 2019
100% 100% 100%
0
0
1
0
0
0
0
0
0
0
0
0
0
0
0
0
0
1
0
0
0
0
0
0
0 0
0 0
0 1
0 0
0 0
0 1
0 0
0 0
0 1
0 0
0 0
0 0
0
100
Tota
l % o
f fa
cilit
ies
in c
ompl
ianc
e in
20
20
Legal and customerrequirements
P M
Documentationand records
Communication Companycommitment
Training Worker feedbackand participation
Correctiveaction process
Managementaccountability and
responsibility
P M P M P M P M P M P M P M
Dell & FinalAssembly
Direct
Sub-tier
98% in 2019100% in 2019 99% in 2019 99% in 2019 99% in 2019 99% in 2019 98% in 2019
100% 100% 100%99% in 2019
100% 100% 100% 100% 100%
0
0
1
0
0
0
0
0
0
0
0
0
0
0
0
0
0
1
0
0
0
0
0
0
0 0
0 0
0 1
0 0
0 0
0 1
0 0
0 0
0 1
0 0
0 0
0 0
0
100
Tota
l % o
f fa
cilit
ies
in c
ompl
ianc
e in
20
20
Legal and customerrequirements
P M
Documentationand records
Communication Companycommitment
Training Worker feedbackand participation
Correctiveaction process
Managementaccountability and
responsibility
P M P M P M P M P M P M P M
Dell & FinalAssembly
Direct
Sub-tier
98% in 201999% in 2019 99% in 2019 99% in 2019 99% in 2019 99% in 2019 98% in 2019
100%100% in 2019
100% 100% 100% 100% 100% 100% 100%
0
0
1
0
0
0
0
0
0
0
0
0
0
0
0
0
0
1
0
0
0
0
0
0
0 0
0 0
0 1
0 0
0 0
0 1
0 0
0 0
0 1
0 0
0 0
0 0
0
100
Tota
l % o
f fa
cilit
ies
in c
ompl
ianc
e in
20
20
Legal and customerrequirements
P M
Documentationand records
Communication Companycommitment
Training Worker feedbackand participation
Correctiveaction process
Managementaccountability and
responsibility
P M P M P M P M P M P M P M
CONTENTS INTRODUCTION OUR APPROACH PROGRESS BY THE NUMBERS HOW WE REPORT

2020 SUPPLY CHAIN SUSTAINABILITY PROGRESS REPORT / 41
BY THE NUMBERS — AUDIT RESULTS
Management systems (continued)
Percentage of audited factories in compliance, with breakdown of major and priority findings of noncompliance according to supply chain tier
KeyP Priority Findings
M Major Findings
Results are based on audits of 313 factories. When an issue is found, we work with the factory to correct it.
At the end of 2020, 76% of priority and major findings (cumulatively) had been closed.
Dell & FinalAssembly
Direct
Sub-tier
89%84% in 2019
99%98% in 2019
100%97% in 2019
99%99% in 2019
0
1
0
0
0
1
0
0
1
0
0
0
0 2
0 10
1 21
0
1
10
0
0
Supplierresponsibility
Improvementobjectives
Audits andassessments
Risk assessment andrisk management
0
100
Tota
l % o
f fa
cilit
ies
in c
ompl
ianc
e in
20
20
P M P M P M P M
CONTENTS INTRODUCTION OUR APPROACH PROGRESS BY THE NUMBERS HOW WE REPORT
24

2020 SUPPLY CHAIN SUSTAINABILITY PROGRESS REPORT / 42
Endnotes
1 Dell Technologies Inc. is committed to responsible business practices and ethical behavior. This includes holding our suppliers to the same high standards of excellence to which we adhere, as set forth in Dell Technologies’ Code of Conduct, and as articulated in governing laws and regulations, recognized international standards and conventions, and global best practices.
2 Aligned to our tenet to treat everyone with dignity and respect, this report refers to people who work in our supplier factories as supplier management or supplier employees.
3 Known to be in Dell Technologies’ supply chain.
4 Cumulative represents the calculated closure rates for findings as of Dec. 31, 2020.
5 Cumulative represents the calculated closure rates for findings as of Dec. 31, 2020.
6 The way in which this is measured has changed since our 2018 Report and therefore cannot be compared to data for 2019 and 2020.
7 This was a new KPI for 2019 so a comparison figure is not available.
8 The COVID-19 pandemic limited our ability to engage directly with our suppliers on energy reduction projects in 2020.
9 Cumulative results achieved at the end of the five-year period 2015-2020 for Dell Technologies server and client factories.
10 Cumulative results achieved at the end of the five-year period 2015-2020 for Dell Technologies server and client factories.
11 According to data collected through the Responsible Business Alliance Validated Audit Program and reported in the RBA 2019 Annual Report, page 36.
12 The reporting period for the Conflict Minerals Reporting Template is August 2020 through February 2021 in accordance with industry standards.
13 The rate of smelters and refiners participating in the Responsible Minerals Assurance Program (RMAP) represents a point in time as of February 2021.
14 Efforts in this area include encouraging suppliers to report data to a pollutant release and transfer register (PRTR), which the Organisation for Economic Co-operation and Development considers a tool for governments to provide data to the public regarding the amount of chemicals and pollutants released to air, water and soil transferred offsite for treatment or
disposal. For 2020, 184 of our suppliers reported PRTR.
15 Per unit revenue is a financial allocation method using supplier reported performance data.
16 Definition from the United Nations Industrial Development Organization.
17 Definition is based on the World Resources Institute definition for areas of medium-high water stress or higher.
18 POWER OF THE PROFESSION is registered trademark of Gartner, Inc. and/or its affiliates and is used with permission. All rights reserved. Gartner does not endorse any vendor, product or service depicted in its research publications. Gartner research publications consist of the opinions of Gartner’s Research & Advisory organization and should not be construed as statements of fact. Gartner disclaims all warranties, expressed or implied, with respect to this research, including any warranties of merchantability or fitness for a particular purpose.
19 Factory compliance percentages are rounded to the nearest whole number. This accounts for instances of 100% compliance when the number of findings is greater than zero.
20 Factory compliance percentages are rounded to the nearest whole number. This accounts for instances of 100% compliance when the number of findings is greater than zero.
21 Factory compliance percentages are rounded to the nearest whole number. This accounts for instances of 100% compliance when the number of findings is greater than zero.
22 Factory compliance percentages are rounded to the nearest whole number. This accounts for instances of 100% compliance when the number of findings is greater than zero.
23 Factory compliance percentages are rounded to the nearest whole number. This accounts for instances of 100% compliance when the number of findings is greater than zero.
24 Factory compliance percentages are rounded to the nearest whole number. This accounts for instances of 100% compliance when the number of findings is greater than zero.
CONTENTS INTRODUCTION OUR APPROACH PROGRESS BY THE NUMBERS HOW WE REPORT

2020 SUPPLY CHAIN SUSTAINABILITY PROGRESS REPORT / 43
How we report
CONTENTS INTRODUCTION OUR APPROACH PROGRESS BY THE NUMBERS HOW WE REPORT

2020 SUPPLY CHAIN SUSTAINABILITY PROGRESS REPORT / 44
The Supply Chain Sustainability Report, combined with our FY21 Progress Made Real Report, Diversity & Inclusion Report, Global Reporting Initiative (GRI) Standards-based online index and the other reports listed below, provides customers and other stakeholders assurance that we manage our business responsibly and deliver on our commitments. View the current and archived copies of our reports.
How we report
About the 2020 Supply Chain Sustainability Progress Report
Unless otherwise noted, this report reflects progress during calendar year 2020 in the Dell Technologies supply chain and excludes the supply chains of strategically aligned businesses including RSA, Secureworks, Virtustream, Pivotal and Boomi. Information relating to supplier diversity spend reflects Dell Technologies and its strategically aligned businesses except for VMware and Secureworks.
For questions or feedback regarding this report, please contact us at [email protected].
FY21 Progress Made Real Report
Learn how we are creating a positive and lasting social impact on humankind and the planet — using our reach, technology and people.
FY21 Diversity & Inclusion Report
Learn how we are building a workforce that is inclusive and represents the diverse and global customers we serve.
Reporting Frameworks
View our framework reporting per GRI standards, standards by SASB and WEF’s core Stakeholder Capitalism Metrics. Our GRI Index provides mapping of GRI disclosures to the TCFD’s recommendations.
Responsible Minerals Sourcing Report
We support, respect and uphold the internationally recognized human rights of all people, and responsible sourcing of minerals is part of our global approach.
CDP Water Security Report
Dell Technologies regularly submits a CDP water security report that covers corporate efforts to help ensure a water-secure future.
CDP Climate Change Report
Dell Technologies regularly submits a CDP climate change report that covers corporate efforts to reduce climate risks.
CONTENTS INTRODUCTION OUR APPROACH PROGRESS BY THE NUMBERS HOW WE REPORT

DELL TECHNOLOGIES 2020 SUPPLY CHAIN SUSTAINABILITY PROGRESS REPORT
Operating a responsible supply chain is part of our commitment to advance sustainability.
Dell Technologies’ social and environmental responsibility programs — pursued in collaboration with our suppliers and industry organizations — enable us to continuously monitor our supply chain and drive meaningful progress as we work to champion the people in our supply chain, protect our planet and build diversity among our supply base.
Learn more at DellTechnologies.com/ProgressMadeReal.


![PURSUING SUSTAINABILITY: FRAMEWORKS, KNOWLEDGE, PLANNING AND PROGRESS [Sinclair Working Draft]](https://static.fdokumen.com/doc/165x107/632198d663847156ac063ad8/pursuing-sustainability-frameworks-knowledge-planning-and-progress-sinclair.jpg)