“Supply chain disruptions in the context of early stages of the ...
12
“Supply chain disruptions in the context of early stages of the global COVID-19 outbreak” AUTHORS Lenka Veselovská https://orcid.org/0000-0003-1867-2692 http://www.researcherid.com/rid/F-8379-2018 ARTICLE INFO Lenka Veselovská (2020). Supply chain disruptions in the context of early stages of the global COVID-19 outbreak. Problems and Perspectives in Management, 18(2), 490-500. doi:10.21511/ppm.18(2).2020.40 DOI http://dx.doi.org/10.21511/ppm.18(2).2020.40 RELEASED ON Monday, 06 July 2020 RECEIVED ON Monday, 20 April 2020 ACCEPTED ON Friday, 19 June 2020 LICENSE This work is licensed under a Creative Commons Attribution 4.0 International License JOURNAL "Problems and Perspectives in Management" ISSN PRINT 1727-7051 ISSN ONLINE 1810-5467 PUBLISHER LLC “Consulting Publishing Company “Business Perspectives” FOUNDER LLC “Consulting Publishing Company “Business Perspectives” NUMBER OF REFERENCES 52 NUMBER OF FIGURES 2 NUMBER OF TABLES 6 © The author(s) 2021. This publication is an open access article. businessperspectives.org
-
Upload
khangminh22 -
Category
Documents
-
view
1 -
download
0
Transcript of “Supply chain disruptions in the context of early stages of the ...
“Supply chain disruptions in the context of early stages of the global COVID-19outbreak”
AUTHORSLenka Veselovská https://orcid.org/0000-0003-1867-2692
http://www.researcherid.com/rid/F-8379-2018
ARTICLE INFO
Lenka Veselovská (2020). Supply chain disruptions in the context of early stages
of the global COVID-19 outbreak. Problems and Perspectives in Management,
18(2), 490-500. doi:10.21511/ppm.18(2).2020.40
DOI http://dx.doi.org/10.21511/ppm.18(2).2020.40
RELEASED ON Monday, 06 July 2020
RECEIVED ON Monday, 20 April 2020
ACCEPTED ON Friday, 19 June 2020
LICENSE
This work is licensed under a Creative Commons Attribution 4.0 International
License
JOURNAL "Problems and Perspectives in Management"
ISSN PRINT 1727-7051
ISSN ONLINE 1810-5467
PUBLISHER LLC “Consulting Publishing Company “Business Perspectives”
FOUNDER LLC “Consulting Publishing Company “Business Perspectives”
NUMBER OF REFERENCES
52
NUMBER OF FIGURES
2
NUMBER OF TABLES
6
© The author(s) 2021. This publication is an open access article.
businessperspectives.org

490
Problems and Perspectives in Management, Volume 18, Issue 2, 2020
http://dx.doi.org/10.21511/ppm.18(2).2020.40
Abstract
The world finds itself facing unprecedented conditions as the global pandemic of the COVID-19 virus has led to fundamental changes in the global supply chains. This pa-per aims to assess the initial response undertaken by Central European companies in the early stages of the outbreak. The survey was conducted as a research method to collect data from a large number of companies. Since it takes time to assess long-term effects of the pandemic and related measures, various changes in supply chains are examined as the early results of the COVID-19 crisis and measures implemented by companies. The study examines how different economy sectors were changed due to this situation. The changes in operating volumes were identified as the most commonly used measures to accommodate new market developments. However, developing the new supply chain partnership was the most successful measure. This measure corre-lates with an increase in revenues and an increase in the number of customers. In some cases, disruptions in supply chains had positive effects on revenues as a reaction to the COVID-19 epidemic outbreak. Cross-country examinations found that all Polish companies implemented at least one new measure to tackle this crisis. Nearly 20% of Slovak companies and nearly 30% of Czech companies made no changes in their operations during the early stages of the crisis. However, overall, the supply chains in Central European countries turned out to be quite resilient, since most companies managed to survive the supply chain disruptions and in some cases even show signs of overcoming them completely.
Lenka Veselovská (Slovak Republic)
Supply chain disruptions
in the context of early
stages of the global
COVID-19 outbreak
Received on: 20th of April, 2020Accepted on: 19th of June, 2020Published on: 6th of July, 2020
INTRODUCTION
The world has been in unprecedented conditions, since the global pan-demic of the COVID-19 virus brought fundamental changes in the global economy. This situation has highlighted the vulnerability and critical points of supply chains, many of which were not at all pre-pared to face such major disruptions. The reaction of companies in this context was also shaped with regard to the requirements of the chain restructuring. Although the recession that arose after the epi-demic and the actions taken in response affected it to such an extent that it threatened their existence, many companies were able to cope with this situation and react flexibly. These examples clearly show that companies that pay sufficient attention to risk management and the flexibility of their supply chains can adapt more quickly and even gain a competitive advantage.
The closest example of a global pandemic of such scale can be found at the beginning of the last century. The 1918 Spanish Influenza Pandemic killed millions worldwide and unprecedentedly changed the economies (Clay, Lewis, & Severnini, 2018; Matchim, 2019; Bristow,
© Lenka Veselovská, 2020
Lenka Veselovská, Dr., Institute of Managerial Systems, Faculty of Economics, Matej Bel University in Banská Bystrica, Slovak Republic.
This is an Open Access article, distributed under the terms of the Creative Commons Attribution 4.0 International license, which permits unrestricted re-use, distribution, and reproduction in any medium, provided the original work is properly cited.
www.businessperspectives.org
LLC “СPС “Business Perspectives” Hryhorii Skovoroda lane, 10, Sumy, 40022, Ukraine
BUSINESS PERSPECTIVES
JEL Classification F61, L21, O12, O52
Keywords COVID-19 implications, supply chain resilience, revenues, flexibility, Slovak Republic, Czech Republic, Hungary, Poland
Conflict of interest statement:
Author(s) reported no conflict of interest

491
Problems and Perspectives in Management, Volume 18, Issue 2, 2020
http://dx.doi.org/10.21511/ppm.18(2).2020.40
2013). The Spanish Influenza epidemic of 1918–1919 was the most horrible pandemic of contemporary era, claiming over 30 million lives in a few short months. The processes in societies were significantly disrupted. The magnitude of its impact on economic activities was massive. Some insights of its im-plications can be applied to many-sided complexity of a pandemic investigation (Hardy, 2006; Becker, 1981). However, the economies of developed states were not as interconnected as they are nowadays, and supply chains did not rely on the international trade on such a scale. Therefore, it can be concluded that there is no relevant precedence to current market conditions that can be used to draw comparisons and to rely on for guidance. On the other hand, much smaller and more localized disruptions had occurred in the past, and their effects on corresponding supply chains were examined and some conclusions can be used even nowadays as a foundation for research into the influence of the COVID-19 pandemic on the resilience and flexibility of supply chains.
Provided examples much in common in terms of the inevitable necessity to redesign supply chains to provide companies with much needed efficiency in the processes. Besides, the quick response of supply chains was identified as one of the key components of their survival. However, what is missing from the current pool of knowledge provided by literature so far is the role of the supply chain measures imple-mented as a response to this situation in overcoming such large-scale disruptions. This study seeks to provide answers to this question by examining the effects of COVID-19 measures on business activities and changes in supply chains using a risk management approach.
1. LITERATURE REVIEW
A new virus was noticed by the World Health Organization in the last month of 2019. In just two months, this infection has spread to all continents, except for Antarctica. Since then, information on the situation with COVID-19 has become daily news worldwide (McAleer, 2020; Danylyshyn, 2020). The COVID-19-related disruptions have the poten-tial to significantly affect global supply chains. Even during the early stages of the pandemic, the impact of COVID-19 on the global supply chains has al-ready become massive (Ivanov, 2020). The histori-cal records show that major crises, including wars, famines, and pandemics, always bring significant changes to supply chains and may create long-term consequences for countries and their people (Sarkis, Cohen, Dewick, & Schröder, 2020). Epidemic out-breaks are a particular example of supply chain risks, which is uniquely characterized by a long-term dis-ruption of continued existence and high uncertainty. Since an epidemic disease outbreak poses a severe treat to people’s existence, it always leads to a major crisis. To control the effects of such a crisis on the individual supply chain, the effective management must to quickly implement appropriate measures (Yu, Sun, Solvang, & Zhao, 2020).
The examples of more current disasters and there-fore scientific research can also be considered. The
main event of 21st century prior to the COVID-19 outbreak was the Fukushima Daiichi nuclear power plant disaster. Aside from the restoration costs, there were other implications for the local economy and international supply chains. Notably, consumers initially viewed harshly the food prod-ucts originating from the Fukushima area after the 2011 Fukushima incident resulting in eco-nomic failures caused by the damaged images of companies (Matsumoto & Hoang, 2019; Aruga, 2017). However, after disastrous supply chain dis-ruptions even positive effects can appear over time, such as energy market reorganization in Japan af-ter Fukushima (Goto & Sueyoshi, 2016). The les-sons from these analyses lie in knowing that fund-ing the development has significant financial pay-backs, and that retrospective effectiveness analy-sis can be used to study natural disaster responses undertaken by local governments and private companies (Vardon, Sassi, Zheng, & Birur, 2019; Choi & Lee, 2017; Managi & Guan, 2017; Rehdanz, Welsch, Narita, & Okubo, 2015).
The problem lies in identifying suitable measures and predicting their effectiveness since each such case is unique, and few similar examples can be found. Supply chain risks are multifaceted and can cause such disruptions that supply chains need to be completely redesigned (Chopra & Sodhi, 2004; Cantor, Blackhurst, & Cortes, 2014; Sodhi & Tang,

492
Problems and Perspectives in Management, Volume 18, Issue 2, 2020
http://dx.doi.org/10.21511/ppm.18(2).2020.40
2012; Bartková, 2019). A few examples can already be found in a current pool of literature in specific sectors of economy. Gray (2020) found that “…in Canada the widespread implementation of social distancing has greatly augmented the need for food pickup and delivery services”. The findings from his study include a significant need for constant supply chain assessment and the improvement of targeted policies to mitigate supply chain risks. Hobbs (2020) discovered that “…the COVID-19 pandemic will have longer-lasting impacts on the nature of food supply chains, including the ex-pansion of the online grocery delivery sector, and the extent to which consumers will prioritize “lo-cal” food supply chains”. Various authors (Bell & Blanchflower, 2020; Jribi, Ben Ismail, Doggui, & Debbabi, 2020) studied the effects on consumer behavior and labor markets. The COVID-19 dis-ease is mainly a public health issue that impacts the food waste prevention behavior and negatively effects the employment in some economy sectors. Ivanov (2020) studied the framework of pandem-ics as a source of distinctive supply chain risks.
Risk management and supply chain management offer a vast range of possibilities to mitigate the ef-fects of epidemic outbreak. However, such scenar-ios are yet to be tested in practices, especially their long-term effects. On the other hand, every example in practice shows that the key to overcome any ma-jor disruption is supply chain flexibility (Agarwal, Shankar, & Tiwari, 2006; Gaimon & Singhal, 1992; Das, 2011; Gong, 2008; Stevenson & Spring, 2007). According to Peidro, Mula, Jiménez, and Botella (2010), organizations are forced to deal with mul-tiple risks as a result of transformations that take place inside and around them. Implementing ap-propriate measures designed to adapt to these al-terations is vital for their continued existence and
key to discovering possible paths to success. In to-day’s world, this also means developing efficient supply chains that are flexible and resilient (Datta & Christopher, 2010). Different methods have been created to make supply chains more resilient and therefore more adaptable to changing environment (Lummus, Vokurka, & Duclos, 2005). Flexibility can be considered as the goal of making a supply chain able to alter conditions to meet an unantici-pated situation (Chuu, 2011). However, the resil-ience of supply chains during the COVID-19 crisis yet remains to be tested. This can be considered a research gap and an opportunity to develop consid-erable valuable information through research that can provide recommendations for both academics and managers in practice. This research study aims to contribute in such a way.
2. METHODS
The research study developed an evaluation of the COVID-19 outbreak changes and outcomes for supply chains of key sectors of economy. The main aim of this research was to exam-ine disruptions and changes in supply chains of Central European countries caused by the COVID-19 crises. A survey was conducted to examine managers’ opinions and their expe-riences in practice concerning the changes in supply chains due to either the COVID-19 pan-demic itself or measures taken by governments as a response to the threat of virus. A question-naire was send by e-mail to managers of 2,000 companies, 500 in each country. Nearly 11% of them provided a completed questionnaire. This research incorporated 211 international compa-nies from four central European countries. The structure of a sample file is shown in Table 1.
Table 1. Structure of a sample file
Sample file
Country of origin Business sector
Slo
va
k
Re
pu
bli
c
Cze
ch
Re
pu
bli
c
Po
lan
d
Hu
ng
ary
Gro
ceri
es
Se
rvic
es
Ind
ust
ria
l
prod
uctio
n
Ag
ricu
ltu
re
Cons
truc
tion
Tra
nsp
ort
of
ma
teri
al
Number of companies 61 54 47 49 14 51 79 6 27 34
Percentage (in %) 28.91 25.59 22.27 23.22 6.64 24.17 37.44 2.84 12.80 16.11

493
Problems and Perspectives in Management, Volume 18, Issue 2, 2020
http://dx.doi.org/10.21511/ppm.18(2).2020.40
Furthermore, 116 companies had less than 50 employees, which represents 54.98% of all com-panies in the sample file. On the other hand, 64 companies had more than 250 employees (30.33%). Even though this file does not con-sist of such number of companies to be a rep-resentative sample of all companies in Central Europe, both its size and diversity offer an in-teresting source of information on researched topic in a relatively short period of time, which is extremely important for examining business reality and drawing up action plans to mitigate crises.
Several statistical tests were used to evaluate data. Firstly, Factor analysis was used to assess collected data and find which data can be used to examine the variables, as well as to deter-mine the fundamental composition of the re-lationships among analyzed variables in a sam-ple file. Various authors had already used this test (Hedges, Pacheco, & Webber, 2014; Moretti, Anholon, Rampasso, Silva, Santa-Eulalia, & Ignacio, 2019; Pop & Pelau, 2017; Crede & Harms, 2019; Phogat & Gupta, 2019; Na-Nan, Chaiprasit, & Pukkeeree, 2018; Veselovská, Závadský, & Závadská, 2020) to cluster varia-bles, which are notably correlated into factors, which can then direct the creations of novel complex factors that incorporate all the data in a more detailed approach. Binomial test was al-so used to evaluate the most common variable in the sample file. Spearman’s Rank Correlation was calculated according to formula (1), where n is the number of customers and d represents the difference in the ranks:
2
3
61 .
S
dR
n n
⋅∑= − −
(1)
3. RESULTS
AND DISCUSSION
Firstly, the changes in various supply chain char-acteristics were examined. Up to five types of sup-ply chain structure were analyzed. Table 2 pro-vides data on detected changes in the supply chain structure from 2019 to 2020.
Table 2. Changes in the supply chain structure
Supply chain structure in 2019
Divergent Convergent Serial Dyadic Network
Divergent 21 3 2 0 0
Convergent 6 14 13 0 0
Serial 14 31 62 1 0
Dyadic 0 0 0 1 0
Network 1 1 0 0 41
According to Table 2, more than 65.87% of all com-panies have not observed any changes in their supply chain structure. On the other hand, most of changes were observed among divergent and convergent sup-ply chain structures. In 2019, all companies with the network supply structure remain with this structure in 2020. However, two companies transformed their structure to network in 2020, when they previous-ly had a different supply chain structure. Only two companies had a dyadic structure in 2019, out of which one remained unchanged, and the structure of the other one evolved to serial in 2020.
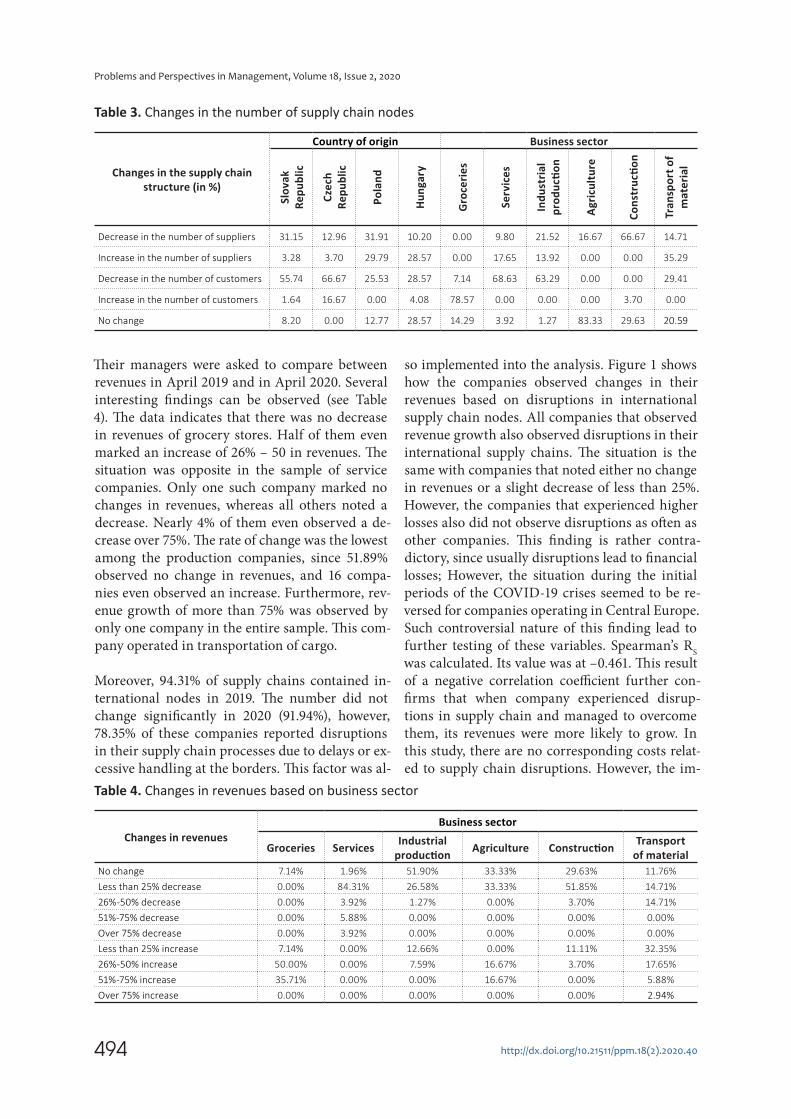
The other possibility to evaluate changes in the supply chain structure is through the number of its nodes, represented by the number of compa-nies involved in the supply chain. Table 3 provides the corresponding data structured by two factors
– country of origin and business sector. While the data based on the location did not prove any sig-nificant difference between the international sup-ply chains, the segmentation by business sectors proved otherwise. The majority of companies sell-ing groceries observed an increase in the number of their customers. On the other hand, almost no changes were observed in the supply chains of com-panies in the agricultural sector. Overall, most of all companies in the sample file (45.5%) observed a decrease in the number of their customers due to COVID-19 measures. Only 5.69% companies noted an increase in the number of their custom-ers, which represents only 12 companies, most of which (9) are located in the Czech Republic. Over 20% of all companies observed a decrease in the number of their suppliers with the majority of them located in Slovakia (19). Furthermore, the highest rate of a decrease in the number of suppli-ers was among construction companies (66.67%).
The changes in supply chains were also measured by changes in revenues of analyzed companies.
494
Problems and Perspectives in Management, Volume 18, Issue 2, 2020
http://dx.doi.org/10.21511/ppm.18(2).2020.40
Their managers were asked to compare between revenues in April 2019 and in April 2020. Several interesting findings can be observed (see Table 4). The data indicates that there was no decrease in revenues of grocery stores. Half of them even marked an increase of 26% – 50 in revenues. The situation was opposite in the sample of service companies. Only one such company marked no changes in revenues, whereas all others noted a decrease. Nearly 4% of them even observed a de-crease over 75%. The rate of change was the lowest among the production companies, since 51.89% observed no change in revenues, and 16 compa-nies even observed an increase. Furthermore, rev-enue growth of more than 75% was observed by only one company in the entire sample. This com-pany operated in transportation of cargo.
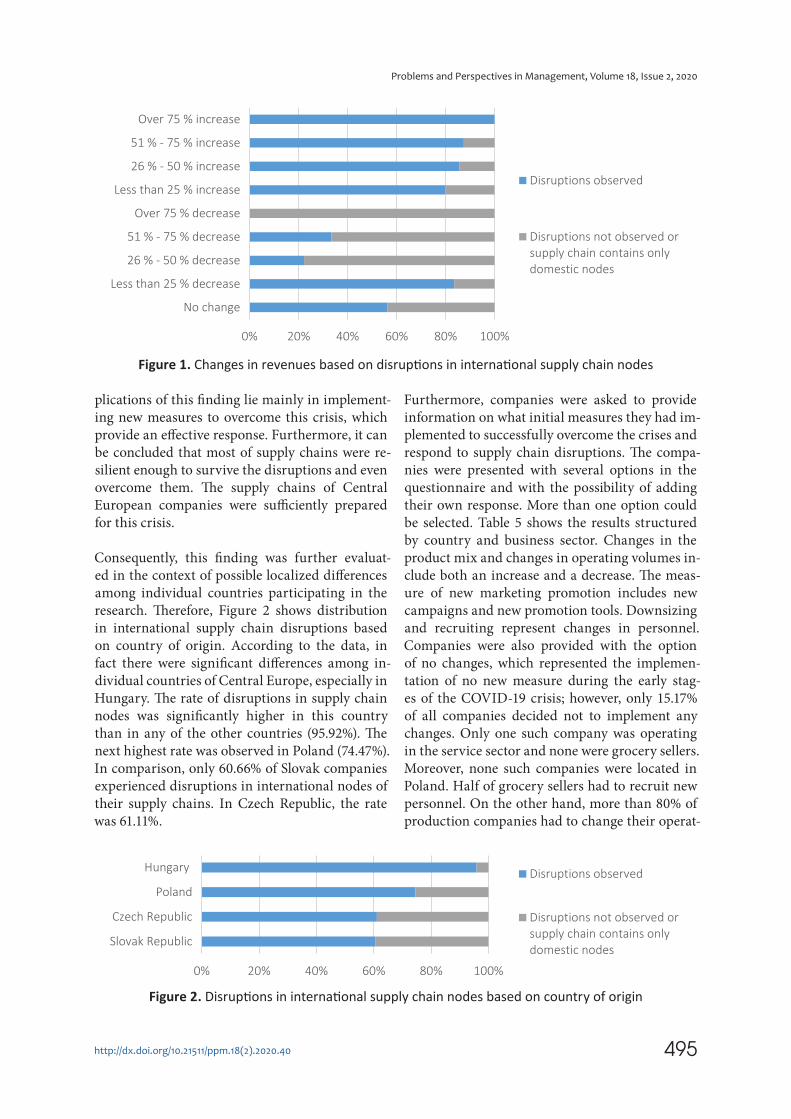
Moreover, 94.31% of supply chains contained in-ternational nodes in 2019. The number did not change significantly in 2020 (91.94%), however, 78.35% of these companies reported disruptions in their supply chain processes due to delays or ex-cessive handling at the borders. This factor was al-
so implemented into the analysis. Figure 1 shows how the companies observed changes in their revenues based on disruptions in international supply chain nodes. All companies that observed revenue growth also observed disruptions in their international supply chains. The situation is the same with companies that noted either no change in revenues or a slight decrease of less than 25%. However, the companies that experienced higher losses also did not observe disruptions as often as other companies. This finding is rather contra-dictory, since usually disruptions lead to financial losses; However, the situation during the initial periods of the COVID-19 crises seemed to be re-versed for companies operating in Central Europe. Such controversial nature of this finding lead to further testing of these variables. Spearman’s R
S
was calculated. Its value was at –0.461. This result of a negative correlation coefficient further con-firms that when company experienced disrup-tions in supply chain and managed to overcome them, its revenues were more likely to grow. In this study, there are no corresponding costs relat-ed to supply chain disruptions. However, the im-
Table 3. Changes in the number of supply chain nodes
Changes in the supply chain
structure (in %)
Country of origin Business sector
Slo
va
k
Re
pu
bli
c
Cze
ch
Re
pu
bli
c
Po
lan
d
Hu
ng
ary
Gro
ceri
es
Se
rvic
es
Ind
ust
ria
l
prod
uctio
n
Ag
ricu
ltu
re
Cons
truc
tion
Tra
nsp
ort
of
ma
teri
al
Decrease in the number of suppliers 31.15 12.96 31.91 10.20 0.00 9.80 21.52 16.67 66.67 14.71
Increase in the number of suppliers 3.28 3.70 29.79 28.57 0.00 17.65 13.92 0.00 0.00 35.29
Decrease in the number of customers 55.74 66.67 25.53 28.57 7.14 68.63 63.29 0.00 0.00 29.41
Increase in the number of customers 1.64 16.67 0.00 4.08 78.57 0.00 0.00 0.00 3.70 0.00
No change 8.20 0.00 12.77 28.57 14.29 3.92 1.27 83.33 29.63 20.59
Table 4. Changes in revenues based on business sector
Changes in revenues
Business sector
Groceries ServicesIndustrial
production Agriculture Construction Transport
of material
No change 7.14% 1.96% 51.90% 33.33% 29.63% 11.76%
Less than 25% decrease 0.00% 84.31% 26.58% 33.33% 51.85% 14.71%
26%-50% decrease 0.00% 3.92% 1.27% 0.00% 3.70% 14.71%
51%-75% decrease 0.00% 5.88% 0.00% 0.00% 0.00% 0.00%
Over 75% decrease 0.00% 3.92% 0.00% 0.00% 0.00% 0.00%
Less than 25% increase 7.14% 0.00% 12.66% 0.00% 11.11% 32.35%
26%-50% increase 50.00% 0.00% 7.59% 16.67% 3.70% 17.65%
51%-75% increase 35.71% 0.00% 0.00% 16.67% 0.00% 5.88%
Over 75% increase 0.00% 0.00% 0.00% 0.00% 0.00% 2.94%
495
Problems and Perspectives in Management, Volume 18, Issue 2, 2020
http://dx.doi.org/10.21511/ppm.18(2).2020.40
plications of this finding lie mainly in implement-ing new measures to overcome this crisis, which provide an effective response. Furthermore, it can be concluded that most of supply chains were re-silient enough to survive the disruptions and even overcome them. The supply chains of Central European companies were sufficiently prepared for this crisis.
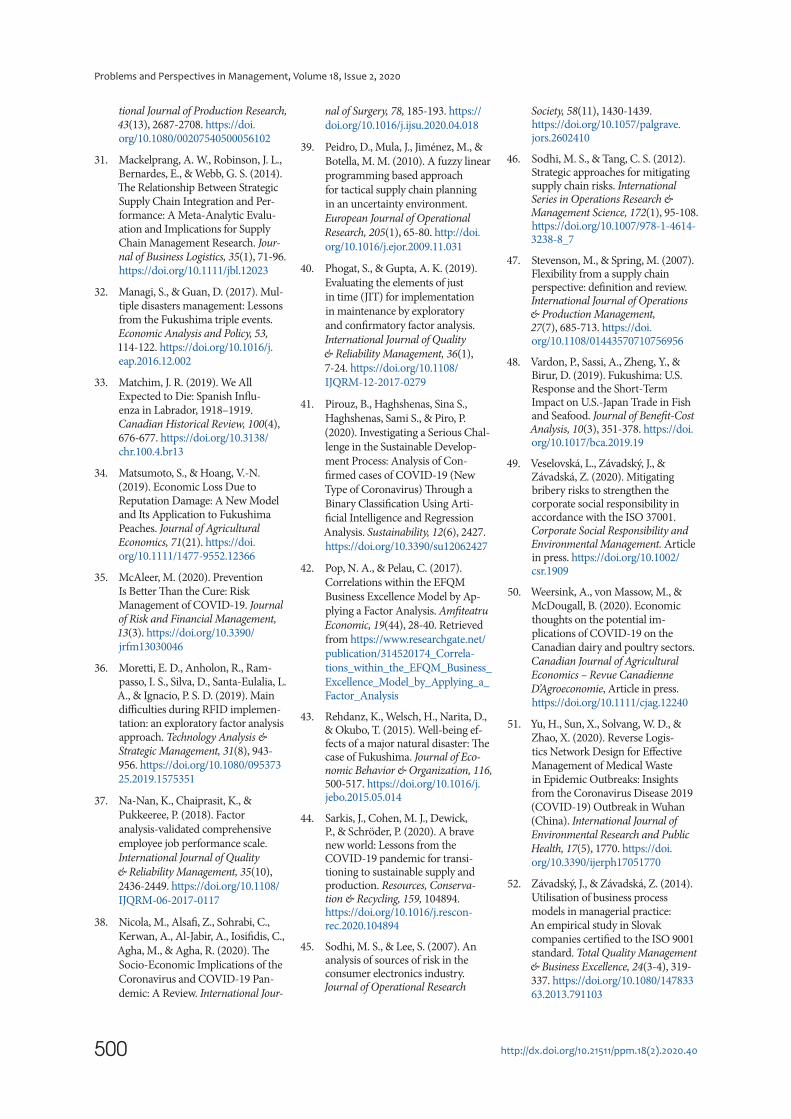
Consequently, this finding was further evaluat-ed in the context of possible localized differences among individual countries participating in the research. Therefore, Figure 2 shows distribution in international supply chain disruptions based on country of origin. According to the data, in fact there were significant differences among in-dividual countries of Central Europe, especially in Hungary. The rate of disruptions in supply chain nodes was significantly higher in this country than in any of the other countries (95.92%). The next highest rate was observed in Poland (74.47%). In comparison, only 60.66% of Slovak companies experienced disruptions in international nodes of their supply chains. In Czech Republic, the rate was 61.11%.
Furthermore, companies were asked to provide information on what initial measures they had im-plemented to successfully overcome the crises and respond to supply chain disruptions. The compa-nies were presented with several options in the questionnaire and with the possibility of adding their own response. More than one option could be selected. Table 5 shows the results structured by country and business sector. Changes in the product mix and changes in operating volumes in-clude both an increase and a decrease. The meas-ure of new marketing promotion includes new campaigns and new promotion tools. Downsizing and recruiting represent changes in personnel. Companies were also provided with the option of no changes, which represented the implemen-tation of no new measure during the early stag-es of the COVID-19 crisis; however, only 15.17% of all companies decided not to implement any changes. Only one such company was operating in the service sector and none were grocery sellers. Moreover, none such companies were located in Poland. Half of grocery sellers had to recruit new personnel. On the other hand, more than 80% of production companies had to change their operat-
Figure 1. Changes in revenues based on disruptions in international supply chain nodes
0% 20% 40% 60% 80% 100%
Over 75 % increase
51 % - 75 % increase
26 % - 50 % increase
Less than 25 % increase
Over 75 % decrease
51 % - 75 % decrease
26 % - 50 % decrease
Less than 25 % decrease
No change
Disruptions observed
Disruptions not observed orsupply chain contains onlydomestic nodes
Figure 2. Disruptions in international supply chain nodes based on country of origin
0% 20% 40% 60% 80% 100%
Hungary
Poland
Czech Republic
Slovak Republic
Disruptions observed
Disruptions not observed orsupply chain contains onlydomestic nodes

496
Problems and Perspectives in Management, Volume 18, Issue 2, 2020
http://dx.doi.org/10.21511/ppm.18(2).2020.40
ing volumes due to the situation with COVID-19 and more than half of them had to reduce their personnel. No recruitment of new employees was introduced during this time in production com-panies. Interestingly, over 40% of these companies develop new strategic partnerships in their sup-ply chains, which is by far the highest rate among companies from all business sectors, most of which were in Czech Republic (19 companies). The highest rate of changes in operating volumes was observed in Hungary since 91.84% of Hungarian companies introduced this measure. However, the utilization rates were also significant in other countries. Binomial test also confirmed that this was the most commonly introduced measure in the sample file. The results also show that the least affected industry of economy was the agricultur-al sector since half of companies operating in this sector did not need to implement new measures to cope with the crisis and the other half had to recruit new personnel. No other measures were introduced in this industry during the initial pe-riods of the COVID-19 pandemic. Companies transporting materials were also not significant-ly affected since 41.18% of them also implemented no changes.
The introduction of measures can also be ob-served in the context of changes and disruptions in supply chains (Table 6). After implementing no new measures, 15 companies did not observe
any changes in revenues and 12 companies did not observe any changes in supply chain structure. Interestingly, the companies with no new meas-ures implemented are the only set in which there are fewer companies with observed disruptions in international supply chains than companies with no disruptions. Every other set of companies had the proportion reversed, since there were always more companies with supply chain disruptions than those without. On the other hand, none of the companies that did not implement any new measures during the initial stage of COVID-19 crisis managed to reach any increase in the num-ber of their customers. Only 4.31% of companies that implemented cost reduction measures man-aged to achieve a revenue growth and 83.62% of them experienced a decrease, many of them si-multaneously experienced a decrease in the num-ber of suppliers and customers. Most of compa-nies that needed to recruit new personnel experi-enced no changes in revenues (80.65%) and none of them experienced any changes in the number of suppliers; as a matter of fact, more than one third of them observed an increase in the number of their customers. On the other hand, as expected, downsizing led mainly to negative results in reve-nues and in the number of supply chain partners. Despite implementing new promotion campaigns, 35.9% of companies observed a decrease in their revenues and 32.05% of them even a decrease in the number of their customers.
Table 5. Measures implemented as an initial response to the COVID-19 crisis
Implemented measure (in %)
Country of origin Business sector
Slo
va
k
Re
pu
bli
c
Cze
ch R
ep
ub
lic
Po
lan
d
Hu
ng
ary
Gro
ceri
es
Se
rvic
es
Ind
ust
ria
l
prod
uctio
n
Ag
ricu
ltu
re
Cons
truc
tion
Tra
nsp
ort
of
ma
teri
al
Changes in product mix 42.62 40.74 29.79 8.16 100.00 74.51 2.53 0.00 11.11 26.47
Changes in operating volumes 63.93 46.30 78.72 91.84 92.86 98.04 86.08 0.00 25.93 23.53
New marketing promotion 22.95 70.37 40.43 14.29 100.00 84.31 2.53 0.00 44.44 20.59
Downsizing 37.70 50.00 76.60 55.10 0.00 82.35 59.49 0.00 37.04 41.18
Recruiting 19.67 14.81 10.64 12.24 50.00 1.96 0.00 50.00 44.44 23.53
Cost reduction 40.98 62.96 65.96 53.06 7.14 62.75 51.90 0.00 85.19 55.88
New supply chain partnership development 18.03 35.19 14.89 0.00 14.29 0.00 41.77 0.00 0.00 5.88
Payments renegotiations and postponements 59.02 74.07 55.32 26.53 35.71 74.51 51.90 0.00 88.89 20.59
New discounts introduction 18.03 27.78 53.19 34.69 0.00 70.59 18.99 0.00 29.63 26.47
No changes 19.67 29.63 0.00 8.16 0.00 1.96 13.92 50.00 11.11 41.18

497
Problems and Perspectives in Management, Volume 18, Issue 2, 2020
http://dx.doi.org/10.21511/ppm.18(2).2020.40
CONCLUSION
The research conducted on a sample of Central European companies focused on examining the disrup-tions in supply chains caused by the COVID-19 global pandemic. The contribution of this study lies mainly in describing the specific measures taken during the early stages of the outbreak by companies in various countries, as well as their initial results in the form of changes in revenues and supply chain characteristics. The findings indicate that some companies were able to adapt their supply chains to modified conditions in the early stages of the COVID-19 crisis in such a way that even led to an increase in their revenues. However, other companies struggled more. There were no significant differences among countries concerning the supply chain disruptions with the exception of Hungarian companies, which clearly struggled more. More than a third of companies experienced such significant disruptions that forced them to redesign their supply chains, which even resulted in differences in structures.
For many companies, this crisis provided an opportunity to gain more customers and even develop a com-petitive advantage. Such companies were mostly from a pool of grocery sellers that benefited from initial closures of restaurants and gained customers who, instead of eating out, decided to buy raw materials and cook at home. Similarly, in Canada, COVID-19 created a new set of challenges in the agricultural and gro-cery sellers sectors. Almost instantly, nearly 30% of the money spent on food away from home shifted to grocery sellers (Goddard, 2020). Services suffered the most because this sector depended on direct contact with a customer, which was not possible on a large scale, since in many countries measures were taken regarding social distance. Other authors also focused on this sector and provided evidence similar to the results obtained in the current study (Higgins-Desbiolles, 2020). Agricultural sector in Central Europe was not as affected as other sectors of the economy. Even, Weersink, von Massow, and McDougall (2020) state that this supply management sector is more resilient and can better deal with negative effects and disruptions of COVID-19 than other sectors, since agricultural producers are usually more economically
Table 6. Measures implemented in the context of changes and disruptions in supply chains
Implemented measure
(in %)
Changes in revenues
Disruptions in international supply chain
nodes
Changes in supply chain structure
No
ch
an
ge
De
cre
ase
Incr
ea
se
Disr
uptio
ns o
bser
ved
Disr
uptio
ns n
ot o
bser
ved
or
sup
ply
ch
ain
co
nta
ins
on
ly
dom
estic
nod
es
No
ch
an
ge
De
cre
ase
in
th
e n
um
be
r o
f
sup
pli
ers
Incr
ea
se i
n t
he
nu
mb
er
of
sup
pli
ers
De
cre
ase
in
th
e n
um
be
r o
f
cust
om
ers
Incr
ea
se i
n t
he
nu
mb
er
of
cust
om
ers
Changes in product mix 7.58 46.97 45.45 98.48 1.52 10.61 36.36 42.42 9.09 1.52
Changes in operating volumes 34.93 51.37 13.70 88.36 11.64 17.12 28.77 8.22 37.67 8.22
New marketing promotion 17.95 35.90 46.15 73.08 26.92 17.95 11.54 23.08 32.05 15.38
Downsizing 10.62 85.84 3.54 94.69 5.31 15.93 23.89 2.65 52.21 5.31
Recruiting 80.65 3.23 16.13 93.55 6.45 48.39 0.00 0.00 16.13 35.48
Cost reduction 12.07 83.62 4.31 53.45 46.55 1.72 38.79 1.72 47.41 10.34
New supply chain partnership
development5.41 54.05 40.54 100.00 0.00 0.00 2.70 43.24 16.22 37.84
Payments renegotiations and postponements
40.87 48.70 10.43 68.70 31.30 4.35 12.17 6.09 77.39 0.00
New discounts introduction 17.65 61.76 20.59 85.29 14.71 35.29 25.00 20.59 5.88 13.24
No changes 46.88 21.88 31.25 34.38 65.63 37.50 18.75 9.38 34.38 0.00

498
Problems and Perspectives in Management, Volume 18, Issue 2, 2020
http://dx.doi.org/10.21511/ppm.18(2).2020.40
constant, and some management functions, such as marketing, are synchronized. Other authors focused on examining the effect of external disruptions on supply chain (Sodhi & Lee, 2007; Ivanov, 2020; Nicola, Alsafi, Sohrabi, Kerwan et al., 2020; Závadský & Závadská, 2014; Mackelprang, Robinson, Bernardes, & Webbl, 2014; Duginets, 2020). Some of them even drew conclusions similar to findings obtained in this research, however, none of them operated under the circumstances of global pandemic and, therefore, the comparison of research findings is possible only in a limited way.
Since this research and all other research studies (Ataguba, 2020; Pirouz, Haghshenas, Sina S., Haghshenas, Sami S., & Piro, 2020; Yu, Sun, Solvang, & Zhao, 2020; McAleer, 2020; Huynh, 2020; Sarkis, Cohen, Dewick, & Schröder, 2020) were conducted in the early stages of the crisis, the success of measures taken cannot be precisely quantified. The adequacy of each response has to be measured after a certain period of time, at least after one year, to provide correct findings regarding the success or failure of individual response taken by companies. However, it is clear that none of the companies that did not take any new measures in the in-itial stage of the COVID-19 crisis managed to reach an increase in the number of their customers. Therefore, it can be concluded that any response made by companies in the initial stages of the crisis will only be ben-eficial in the long term. The findings of this research can be used by managers in practice to identify and develop effective measures to be implemented during this crisis based on the experience of other companies and the initial impact of the COVID-19 outbreak on supply chains and related plans. This study may also help identify successful and effective risk management measures during epidemic outbreaks.
AUTHOR CONTRIBUTIONS
Conceptualization: Lenka Veselovská. Data curation: Lenka Veselovská. Formal analysis: Lenka Veselovská. Investigation: Lenka Veselovská. Methodology: Lenka Veselovská. Software: Lenka Veselovská. Validation: Lenka Veselovská. Visualization: Lenka Veselovská. Writing – original draft: Lenka Veselovská. Writing – review & editing: Lenka Veselovská.
ACKNOWLEDGEMENT
This contribution was supported by the project No. 1/0757/18, “Consumer behavior in buying goods of daily consumption with an emphasis placed different contents of goods offered on markets of selected EU countries”.
REFERENCES
1. Agarwal A., Shankar, R., & Tiwari, M. K. (2006). Modeling the metrics of lean, agile and leagile supply chain: An ANP-based approach. European Journal of Operational Research, 173(1), 211-225. https://doi.org/10.1016/j.ejor.2004.12.005
2. Ataguba, J. E. (2020). COVID-19 Pandemic, a War to be Won: Un-derstanding its Economic Implica-
tions for Africa. Applied Health
Economics and Health Policy, 18,
325-328. https://doi.org/10.1007/
s40258-020-00580-x
3. Atruga, K. (2017). Consumer
responses to food produced near
the Fukushima nuclear plant. En-
vironmental Economics and Policy
Studies, 19(4), 677-690. https://doi.
org/10.1007/s10018-016-0169-y
4. Bartková, L. (2019). How do
consumers perceive the dual
quality of goods and its economic
aspects in the European Union?
An empirical study. Problems and
Perspectives in Management, 17(3),
382-394. http://doi.org/10.21511/
ppm.17(3).2019.31
5. Becker, J. J. (1981). 20-million-
dead + worldwide epidemic

499
Problems and Perspectives in Management, Volume 18, Issue 2, 2020
http://dx.doi.org/10.21511/ppm.18(2).2020.40
– Spanish influenza took its toll. Histoire, 40, 82-83.
6. Bell, D. N. F., & Blanchflower, D. G. (2020). US and UK Labor Markets before and during the COVID-19 crash. National Institute Economic Review, 252, R52-R69. https://doi.org/10.1017/nie.2020.14
7. Bristow, N. K. (2013). Mark Os-borne Humphries, The Last Plague: Spanish Influenza and the Politics of Public Health in Canada. Social History of Medicine, 26(4), 782-783. https://doi.org/10.1093/shm/hkt056
8. Cantor, D. E., Blackhurst, J. V., & Cortes, J. D. (2014). The clock is ticking: The role of uncertainty, regulatory focus, and level of risk on supply chain disruption decision making behavior. Transportation Research Part E: Logistics and Transportation Review, 72, 159-172. https://doi.org/10.1016/j.tre.2014.10.007
9. Choi, J., & Lee, S. (2017). Manag-ing a crisis: A framing analysis of press releases dealing with the Fukushima nuclear power station crisis. Public Relations Review, 43(5), 1016-1024. https://doi.org/10.1016/j.pubrev.2017.09.004
10. Chopra S., & Sodhi, M. S. (2004). Managing Risk to Avoid Supply Chain Breakdown. MIT Sloan Management Review, 46(1), 53-61. Retrieved from https://www.researchgate.net/publica-tion/237646139_Managing_Risk_to_Avoid_Supply-Chain_Break-down
11. Chuu, S.-J. (2011). Interactive group decision-making using a fuzzy linguistic approach for evaluating the flexibility in a supply chain. European Journal of Operational Research, 213(1), 279-289. https://doi.org/10.1016/j.ejor.2011.03.022
12. Clay, K., Lewis, J., & Severnini, E. (2018). Pollution, Infectious Disease, and Mortality: Evidence from the 1918 Spanish Influenza Pandemic. Journal of Economic History, 78(4), 1179-1209. https://doi.org/10.1017/S002205071800058X
13. Crede, M., & Harms, P. (2019). Questionable research practices when using confirmatory factor analysis. Journal of Managerial
Psychology, 34(1), 18-30. https://doi.org/10.1108/JMP-06-2018-0272
14. Danylyshyn, B. (2020). The peculiarities of economic crisis due to COVID-19 pandemic in a developing country: case of Ukraine. Problems and Perspectives in Man-agement, 18(2), 13-22. https://doi.org/10.21511/ppm.18(2).2020.02
15. Das, K. (2011). Integrating effective flexibility measures into a strategic supply chain planning model. European Journal of Operational Research, 211(1), 170-183. https://doi.org/10.1016/j.ejor.2010.12.006
16. Datta, P. P., & Christopher, M. G. (2010). Information sharing and coordination mechanisms for managing uncertainty in supply chains: a simulation study. Inter-national Journal of Production Research, 49(3), 765-803. https://doi.org/10.1080/00207540903460216
17. Duginets, G. (2020). Global imperatives for development of international production networks: case of Ukraine. Problems and Perspectives in Management, 18(1), 57-69. https://doi.org/10.21511/ppm.18(1).2020.06
18. Gaimon, C., & Singhal, V. (1992). Flexibility and the choice of manu-facturing facilities under short prod-uct life cycles. European Journal of Operational Research, 60(2), 211-223. https://doi.org/10.1016/0377-2217(92)90094-P
19. Goddard, E. (2020). The impact of COVID-19 on food retail and food service in Canada: Preliminary assessment. Canadian Journal of Agricultural Economics – Revue Canadienne D’Agroeconomie, Article in press. https://doi.org/10.1111/cjag.12243
20. Gong, Z. (2008). An economic evaluation model of supply chain flexibility. European Journal of Operational Research, 184(2), 745-758. https://doi.org/10.1016/j.ejor.2006.11.013
21. Goto, M., & Sueyoshi, T. (2016). Electricity market reform in Japan after Fukushima. Economics of Energy & Environmental Policy, 5(1), 15-30. Retrieved from https://ideas.repec.org/a/aen/eeepjl/eeep5-1-goto.html
22. Gray, R.S. (2020). Agriculture, trans-portation, and the COVID-19 crisis. Canadian Journal of Agricultural Economics – Revue Canadienne D’Agroeconomie, Article in press. https://doi.org/10.1111/cjag.12235
23. Hardy, A. (2006). The Spanish influenza pandemic of 1918-19: New perspectives. European History Quarterly, 36(4), 641-643. https://doi.org/10.1177/0265691406068194
24. Hedges, M. R., Pacheco, G. A., & Webber, D. J. (2014). What determines students’ choices of elective modules? International Review of Economics Education, 17, 39-54. https://doi.org/10.1016/j.iree.2014.05.003
25. Higgins-Desbiolles, F. (2020). Socialising tourism for social and ecological justice after COVID-19. Tourism Geographies. Article in press. https://doi.org/10.1080/14616688.2020.1757748
26. Hobbs, J. E. (2020). Food sup-ply chains during the COVID-19 pandemic. Canadian Journal of Agricultural Economics – Revue Canadienne D’Agroeconomie, Article in press. https://doi.org/10.1111/cjag.12237
27. Huynh, T. L. D. (2020). The CO-VID-19 risk perception: A survey on socioeconomics and media attention. Economics Bulletin, 40(1), 758-764. Retrieved from http://www.accessecon.com/Pubs/EB/2020/Vol-ume40/EB-20-V40-I1-P64.pdf
28. Ivanov, D. (2020). Predicting the impacts of epidemic out-breaks on global supply chains: A simulation-based analysis on the coronavirus outbreak (COVID-19/SARS-CoV-2) case. Transportation Research Part E-Logistics and Trans-portation Review, 136. https://doi.org/10.1016/j.tre.2020.101922
29. Jribi, S., Ben Ismail, H., Doggui, D., & Debbabi, H. (2020). COVID-19 virus outbreak lockdown: What impacts on household food wast-age? Environment Development and Sustainability, 22(5), 3939-3955. https://doi.org/10.1007/s10668-020-00740-y
30. Lummus, R. R., Vokurka, R. J., & Duclos, L. K. (2005). Delphi study on supply chain flexibility. Interna-
500
Problems and Perspectives in Management, Volume 18, Issue 2, 2020
http://dx.doi.org/10.21511/ppm.18(2).2020.40
tional Journal of Production Research, 43(13), 2687-2708. https://doi.org/10.1080/00207540500056102
31. Mackelprang, A. W., Robinson, J. L., Bernardes, E., & Webb, G. S. (2014). The Relationship Between Strategic Supply Chain Integration and Per-formance: A Meta-Analytic Evalu-ation and Implications for Supply Chain Management Research. Jour-nal of Business Logistics, 35(1), 71-96. https://doi.org/10.1111/jbl.12023
32. Managi, S., & Guan, D. (2017). Mul-tiple disasters management: Lessons from the Fukushima triple events. Economic Analysis and Policy, 53, 114-122. https://doi.org/10.1016/j.eap.2016.12.002
33. Matchim, J. R. (2019). We All Expected to Die: Spanish Influ-enza in Labrador, 1918–1919. Canadian Historical Review, 100(4), 676-677. https://doi.org/10.3138/chr.100.4.br13
34. Matsumoto, S., & Hoang, V.-N. (2019). Economic Loss Due to Reputation Damage: A New Model and Its Application to Fukushima Peaches. Journal of Agricultural Economics, 71(21). https://doi.org/10.1111/1477-9552.12366
35. McAleer, M. (2020). Prevention Is Better Than the Cure: Risk Management of COVID-19. Journal of Risk and Financial Management, 13(3). https://doi.org/10.3390/jrfm13030046
36. Moretti, E. D., Anholon, R., Ram-passo, I. S., Silva, D., Santa-Eulalia, L. A., & Ignacio, P. S. D. (2019). Main difficulties during RFID implemen-tation: an exploratory factor analysis approach. Technology Analysis & Strategic Management, 31(8), 943-956. https://doi.org/10.1080/09537325.2019.1575351
37. Na-Nan, K., Chaiprasit, K., & Pukkeeree, P. (2018). Factor analysis-validated comprehensive employee job performance scale. International Journal of Quality & Reliability Management, 35(10), 2436-2449. https://doi.org/10.1108/IJQRM-06-2017-0117
38. Nicola, M., Alsafi, Z., Sohrabi, C., Kerwan, A., Al-Jabir, A., Iosifidis, C., Agha, M., & Agha, R. (2020). The Socio-Economic Implications of the Coronavirus and COVID-19 Pan-demic: A Review. International Jour-
nal of Surgery, 78, 185-193. https://doi.org/10.1016/j.ijsu.2020.04.018
39. Peidro, D., Mula, J., Jiménez, M., & Botella, M. M. (2010). A fuzzy linear programming based approach for tactical supply chain planning in an uncertainty environment. European Journal of Operational Research, 205(1), 65-80. http://doi.org/10.1016/j.ejor.2009.11.031
40. Phogat, S., & Gupta, A. K. (2019). Evaluating the elements of just in time (JIT) for implementation in maintenance by exploratory and confirmatory factor analysis. International Journal of Quality & Reliability Management, 36(1), 7-24. https://doi.org/10.1108/IJQRM-12-2017-0279
41. Pirouz, B., Haghshenas, Sina S., Haghshenas, Sami S., & Piro, P. (2020). Investigating a Serious Chal-lenge in the Sustainable Develop-ment Process: Analysis of Con-firmed cases of COVID-19 (New Type of Coronavirus) Through a Binary Classification Using Arti-ficial Intelligence and Regression Analysis. Sustainability, 12(6), 2427. https://doi.org/10.3390/su12062427
42. Pop, N. A., & Pelau, C. (2017). Correlations within the EFQM Business Excellence Model by Ap-plying a Factor Analysis. Amfiteatru Economic, 19(44), 28-40. Retrieved from https://www.researchgate.net/publication/314520174_Correla-tions_within_the_EFQM_Business_Excellence_Model_by_Applying_a_Factor_Analysis
43. Rehdanz, K., Welsch, H., Narita, D., & Okubo, T. (2015). Well-being ef-fects of a major natural disaster: The case of Fukushima. Journal of Eco-nomic Behavior & Organization, 116, 500-517. https://doi.org/10.1016/j.jebo.2015.05.014
44. Sarkis, J., Cohen, M. J., Dewick, P., & Schröder, P. (2020). A brave new world: Lessons from the COVID-19 pandemic for transi-tioning to sustainable supply and production. Resources, Conserva-tion & Recycling, 159, 104894. https://doi.org/10.1016/j.rescon-rec.2020.104894
45. Sodhi, M. S., & Lee, S. (2007). An analysis of sources of risk in the consumer electronics industry. Journal of Operational Research
Society, 58(11), 1430-1439. https://doi.org/10.1057/palgrave.jors.2602410
46. Sodhi, M. S., & Tang, C. S. (2012). Strategic approaches for mitigating supply chain risks. International Series in Operations Research & Management Science, 172(1), 95-108. https://doi.org/10.1007/978-1-4614-3238-8_7
47. Stevenson, M., & Spring, M. (2007). Flexibility from a supply chain perspective: definition and review. International Journal of Operations & Production Management, 27(7), 685-713. https://doi.org/10.1108/01443570710756956
48. Vardon, P., Sassi, A., Zheng, Y., & Birur, D. (2019). Fukushima: U.S. Response and the Short-Term Impact on U.S.-Japan Trade in Fish and Seafood. Journal of Benefit-Cost Analysis, 10(3), 351-378. https://doi.org/10.1017/bca.2019.19
49. Veselovská, L., Závadský, J., & Závadská, Z. (2020). Mitigating bribery risks to strengthen the corporate social responsibility in accordance with the ISO 37001. Corporate Social Responsibility and Environmental Management. Article in press. https://doi.org/10.1002/csr.1909
50. Weersink, A., von Massow, M., & McDougall, B. (2020). Economic thoughts on the potential im-plications of COVID-19 on the Canadian dairy and poultry sectors. Canadian Journal of Agricultural Economics – Revue Canadienne D’Agroeconomie, Article in press. https://doi.org/10.1111/cjag.12240
51. Yu, H., Sun, X., Solvang, W. D., & Zhao, X. (2020). Reverse Logis-tics Network Design for Effective Management of Medical Waste in Epidemic Outbreaks: Insights from the Coronavirus Disease 2019 (COVID-19) Outbreak in Wuhan (China). International Journal of Environmental Research and Public Health, 17(5), 1770. https://doi.org/10.3390/ijerph17051770
52. Závadský, J., & Závadská, Z. (2014). Utilisation of business process models in managerial practice: An empirical study in Slovak companies certified to the ISO 9001 standard. Total Quality Management & Business Excellence, 24(3-4), 319-337. https://doi.org/10.1080/14783363.2013.791103