An exploration of spiritual superiority: The paradox of self ...
www.elsevier.com/locate/jphotobiol
Journal of Photochemistry and Photobiology B: Biology 86 (2007) 207–218
Superiority of N-methyl pyrrolidone over albumin with hypericinfor fluorescence diagnosis of human bladder cancer cells implanted
in the chick chorioallantoic membrane model
Constance Lay Lay Saw a, Malini Olivo b, William Wei Lim Chin b,Khee Chee Soo b, Paul Wan Sia Heng a,*
a Department of Pharmacy, National University of Singapore, 18 Science Drive 4, Singapore 117543, Singaporeb Division of Medical Sciences, National Cancer Centre Singapore, 11 Hospital Drive, Singapore 169610, Singapore
Received 20 June 2006; received in revised form 19 October 2006; accepted 19 October 2006Available online 28 November 2006
Abstract
Formulations of hypericin (HY) with plasma protein have been conventionally used, but to date, no alternative pharmaceutical for-mulation has been developed for clinical use. Previously, it was reported that formulation of HY containing a biocompatible solvent andpenetration enhancer, N-methyl pyrrolidone (NMP) was found to be effective for the delivery of HY across in vivo chick chorioallantoicmembrane (CAM). This present study reports further investigations on the HY-NMP formulations in CAM implanted with human blad-der cancer cells as a potential fluorescence diagnostic agent of cancer. The conventional formulation of HY (HY-HSA 0.5%) wasincluded as control. The red-to-blue (I(R)/I(B)) intensity ratio of fluorescence images was used as a diagnostic algorithm, to differentiatethe uptake of HY between tumor and adjacent regions on CAM. Results indicated that HY-NMP 0.05% was significantly better thanHY-HSA 0.5%. The findings of the I(R)/I(B) ratios between tumor and adjacent tissues, indicated the potential of using NMP asan alternative to plasma protein in clinical fluorescence diagnosis with HY. The NMP formulations investigated were able to producesignificantly higher contrast for tumor tissues and at earlier time points than was possible with HY-HSA 0.5%.� 2006 Elsevier B.V. All rights reserved.
Keywords: Photosensitizer; Hypericin; N-methyl pyrrolidone; Fluorescence diagnosis; Chorioallantoic membrane; Formulation
1. Introduction
In the USA, cancer has surpassed cardiovascular dis-eases as the leading cause of mortality of people aged 85and below [1]. Of the 7 million deaths from cancer world-wide in 2001, an estimated 2.43 million (35%) were attrib-utable to nine potentially modifiable risk factors [2].Decades of biomedical research in developed nations haveresulted in many effective interventions that affect cancerincidence and mortality and clearly it was concluded that
1011-1344/$ - see front matter � 2006 Elsevier B.V. All rights reserved.
doi:10.1016/j.jphotobiol.2006.10.003
* Corresponding author. Tel.: +65 6516 2930; fax: +65 6775 2265.E-mail address: [email protected] (P.W.S. Heng).
early detection and diagnosis would help to reduce furtherthe burden associated with cancers [2].
At initial presentation of bladder cancer, 70–80% of thecases are superficial and limited to the urothelial lining ofthe bladder mucosa and submucosa [3]. Noninvasive neo-plasia of the bladder may present as papillary or flat neo-plasia; the latter may comprise dysplasia or carcinomain situ (CIS). Up to 24% of random biopsies from patientswith Ta and T1 superficial bladder carcinoma showed dys-plasia or CIS [4]. CIS is often multifocal in up to half of thecases and has a high possibility of progressing, if leftuntreated, with metastasize occurring up to 83% [5,6].Patients with CIS of the bladder are at significant risk ofcancer progression and death from bladder carcinoma [6].Flat lesions are difficult to visualize and may be missed
208 C.L.L. Saw et al. / Journal of Photochemistry and Photobiology B: Biology 86 (2007) 207–218
using conventional white light cystoscopy, particularlywhen there is ongoing cystitis or in over-distended andtrabeculated bladder. Thus, conventional white light cys-toscopy and biopsy are insufficient to detect all bladdercancer patients who have high risk of recurrent cancer [7].
Fluorescence diagnosis of cancer using photosensitizersis one of the major advances as a new technique for earlycancer detection. Although the clinical application ofhypericin (HY) in photodynamic diagnosis (PDD) of blad-der cancer has been demonstrated to be better than whitelight cystoscopy, further studies needed before the use ofHY in PDD can become more widely accepted [7].
A common problem with the development of hydropho-bic photosensitizers for clinical use is their difficulty to beformulated due to poor water solubilities. Hypericin isone such chemotherapeutic agent [8]. Conventionally, inthe clinical application of HY was with plasma protein asan ‘effective’ HY transporter/carrier [9] although an alter-native acceptable pharmaceutical solvent for HY wouldbe desirable.
The purpose of this study is to develop HY formulationwithout the use of plasma protein. Recently, spectroscopiccharacterization of N-methyl-pyrrolidone (NMP) formula-tions of HY was reported [10]. It was found that at lowconcentration of NMP, HY was predominantly presentas aggregates. The photobleaching rate of HY was lowestat the highest concentration of NMP. This is a continua-tion of previous studies on the use of NMP formulationsof HY tested in human bladder carcinoma cells (MGH)[10–13]. The use of NMP was approved by the US Foodand Drug Administration (FDA) in January 2002 and Sep-tember 1998 for ELIGARDe and ATRIDOXe topicaldelivery products, respectively [14]. The ELIGARDe andATRIDOXe products contain about 60% (w/w) ofNMP, used for prostate cancer treatment and subgingivalapplication respectively.
Based on these promising reports on the use of NMP,we envisage that the improved formulation of HY contain-ing NMP can offer patients a better alternative. Currently,the albumin formulation needs to be instilled in the bladderfor incubation over a period of at least 2 h [9]. With theimproved NMP formulation for more efficient HY deliv-ery, the incubation time can be shortened or contrastimproved. This will significantly reduce patient waitingtime and improve patient compliance and acceptance ofusing HY in clinical use [12].
2. Materials and methods
2.1. Materials
Hypericin was purchased from Molecular Probes,Eugene, OR, USA. NMP (Pharmasolve�) was suppliedby International Specialty Products, Wayne, NY, USA.Albumin (HSA; 5%, Human; Albutein� U.S.P.) was pur-chased from Alpha Therapeutic Corporation, Los Angeles,CA, USA. RPMI 1640 medium was used as the bulk med-
ium in in vitro studies. Phosphate buffer solution (PBS, pH7.4) was used as the medium for preparing HY formula-tions in in vivo studies.
2.2. Cell culture
Human bladder carcinoma cell line (MGH) was a giftfrom the Faculty of Medicine, National University of Sin-gapore [15]. MGH cells were grown in RPMI 1640 medium,containing 10% standard fetal bovine serum (Hyclone,Logan, UT, USA), 1 mM sodium pyruvate (JRH Biosci-ences, KS, USA), 0.1 mM nonessential amino acid solution(GIBCO, Grant Island, NY, USA), 100 units/ml penicillinG sodium, 100 lg/ml streptomycin sulfate and 292 lg/mlL-glutamine (GIBCO BRL, Grant Island, NY, USA) inan atmosphere of 5% CO2 and at 37 �C.
2.3. In vitro studies
2.3.1. Preparation of formulations in culture media for
in vitro uptake studies
Five HY formulations at 1 lM were prepared with co-solvent NMP or HSA. They were with NMP 0.05%,NMP 5%, NMP 20%, NMP 40% and HSA 0.0625%. ThepH (Model 440, Corning, NY, USA) measurements weredone in triplicates, and readings averaged.
2.3.2. Incubation and spectral measurements of HY in MGH
cells
One million cells, determined using a haemocytometer,were seeded in 60 mm tissue culture dish (Iwaki, Japan)and allowed to adhere overnight. The experiments wereconducted the following day. The medium in culture dishwas decanted and cells washed twice with 5 ml of PBS. Sub-sequently, the cells were incubated for 1 h in 5 ml of previ-ously prepared formulation-containing 1 lM HY. Theculture medium with HY was then removed and cells werewashed five times with 5 ml of PBS. Cells were collectedwith 2 ml of PBS by a cell scrapper and transferred to a cuv-ette. Triplicated samples were tested for all formulations.
A Shizmadzu RF-5301 (Kyoto, Japan) spectrofluoro-photometer (excitation, 460 nm; emission wavelength,465–900 nm) was used to record the HY-fluorescence spec-tra. Control samples without HY was also measured inorder to identify any autofluorescence from cells. Experi-ments were conducted in the dark.
2.3.3. Colony forming assay for cell survival studies
The tolerability of cells towards all formulations pre-pared for this study were tested using the colony formingassay based on the ability of cells to form colonies after sub-jecting them to test compounds. The five formulations testedfor uptake studies were evaluated. Four additional NMPconcentrations between the range of 0.5–5%, i.e. 1%, 2%,3% and 4% were also tested. Pre-confluent cells wereremoved from the 75 cm2 tissue culture flasks after 3 minincubation with 4 ml of 0.05% trypsin–ethylenediamine
C.L.L. Saw et al. / Journal of Photochemistry and Photobiology B: Biology 86 (2007) 207–218 209
tetra-acetic acid (EDTA, GIBCO BRL, Grant Island, NY,USA). After the cells were detached from the flask, 6 ml ofmedium was added before centrifuging at 1200 rpm for5 min. The cells collected were then enumerated using ahaemocytometer and re-suspended in a volume to obtain5 · 103 cells per 5 ml of medium. Five millilitres of this cellsuspension was transferred to a 60 mm diameter tissue cul-ture dish for overnight incubation to allow cell adhesion.
The toxicity of different formulations without HY wasevaluated by their incubation in the dark at 37 �C for 1 hwith adherent cells. Following the incubation period,detached cells were washed into a 50 ml test-tube. Eachplate of cells was washed at least five times with 5 mlPBS to remove residual formulation in cells, the washingvolumes were collected and mixed with the previously dec-anted medium containing un-adherent cells in the 50 mltest-tube. Three millilitres of fresh medium were added topetri dish, for the adherent cells to test their ability to growafter treatment with the various formulations.
Each collected PBS-medium in 50 ml test-tube was cen-trifugated at 1200 rpm for 5 min, and the supernatant dec-anted. Fresh 5 ml PBS was added to wash the un-adherentcells, residual at the bottom of the test-tube, to removeresidual formulations in cells. Following the wash, the tubewas centrifugated at 1200 rpm for 5 min. After decanting,another fresh 5 ml PBS were used to repeat the washing,spinning and decanting of the supernatant. Finally, 2 mlfresh medium were added to re-suspend the un-adherentcells, plated to 60 mm tissue culture dish that was pre-incu-bated with 3 ml of fresh medium, to test cell survival abil-ity. After 3 days of undisturbed growth in the dark, whenthe control dishes formed sufficient colonies, the assaywas terminated by staining with 0.25% methylene blue afterfixing with 2% formaldehyde.
2.3.4. Mammalian cell colony analysis
The developing colonies were counted, characterizedand analyzed (Mammalian Cell Colony Analysis, Mace60, Weiss Associates, Branford, CT, USA) by scannedimages (Scanjet APF, Hewlett-Packard DevelopmentCompany, USA) of 8-bit greyscale mode and at a resolu-tion of 200 pixels per inch.
2.4. In vivo studies
2.4.1. Preparation of CAM with transplanted MGH cellsThis preparation was carried out in the tissue culture
hood to avoid contamination of CAM prior experimenta-tion. The CAM was prepared as previously reported[12,13]. Fertilized eggs were disinfected with 70% alcoholbefore placing them in the egg incubator (Octagon 20,Brinsea, Somerset, UK) at 37 �C with 60% humidity. Onembryo age of day 6–7 (EA 6–7), a window was openedat the blunt end facing upwards using sterilized forceps.The opening was then covered with a parafilm to avoidcontamination and the eggs were returned to the incubator.
On the next day, 6–12 · 106 MGH cells were transplantedon each CAM [16]. MGH cells were washed with PBSand harvested with 0.05% trypsin–EDTA. Cells were col-lected by centrifugation at 1200 rpm for 5 min and thesupernatant was discarded. The counted cells were trans-ferred on CAM by a sterile pipette, avoiding contactbetween the pipette and the CAM. The window was againsealed with a parafilm and the eggs were further incubatedtill EA 12–13 when they were mature and ready for exper-imentation [17]. At least duplicated samples were tested foreach formulation.
2.4.2. Preparation of tested formulations
The stock of HY for NMP formulations was preparedby dissolving 1 mg of HY in 125 ll of NMP. This stockwas kept at �20 �C and protected from light until use.Freshly diluted HY with PBS and appropriate amountsof NMP were used to prepare 8 lM HY in NMP 0.05%and NMP 0.5% formulations.
The NMP formulations were compared against the HYformulation containing HSA. The HSA concentration wasprepared as 0.5% HSA with 8 lM HY (denoted as formu-lation HY-HSA 0.5%). The HSA formulation is the currentpreparation in clinical use [7,9].
2.4.3. Administration of HY formulations
On EA 12–13, eggs were assigned in HY-NMP 0.05%,HY-NMP 0.5% or HY-HSA 0.5% groups. Five hundredmicrolitres of formulation were applied on the entire sur-face of each CAM. The window was covered with sterilizedparafilm to prevent evaporation and incubated in the dark.Prior to PDD, the liquid formulation remaining on theCAM was removed by using micropipettes.
2.4.4. Fluorescence imaging
Fluorescence imaging of the CAM implanted withMGH cells was conducted using the fluorescence endos-copy system built on the Karl Storz system (Karl Storz,Tuttlingen, Germany) [18]. The light source was a xenonshort arc lamp, filtered by a band pass filter (370–450 nm). A color CCD video camera of high sensitivitywas connected to a modified endoscope integrated with along pass filter (cut-off wavelength at 560 nm). This systemwas able to excite HY and collect its fluorescence. Theimages were obtained at various time points. Prior to intro-duction of HY formulation, images of CAM were obtainedas baseline for any autofluorescence by implanted cells orCAM tissues. The imaging procedure was conducted inlow ambient lighting environment.
2.4.5. Fluorescence image data processing
The endoscope system captured both the intensities ofred fluorescence of HY and the back-scattered excitationblue light [16,18,19]. It was successfully demonstrated thatthe red-to-blue (I(R)/I(B)) intensity ratio of the fluorescence
210 C.L.L. Saw et al. / Journal of Photochemistry and Photobiology B: Biology 86 (2007) 207–218
endoscopic image can provide a good differentiationbetween the different stages of human oral premalignancyand malignancy [18]. The red-to-blue (I(R)/I(B)) intensityratio was shown to improve the diagnostic accuracy of5-aminolevulinic acid induced protoporphyrin fluorescencein clinical trials. The algorithm was effective in separatingbenign tissue from dysplasia, and carcinoma in situ/squa-mous cell carcinoma from dysplasia. By applying theI(R)/I(B) ratio as a diagnostic algorithm, the intensitiesof the red fluorescence of HY are determined as a functionof time for different formulations using the image process-ing software (MicroImage, Olympus, Germany). Suchalgorithm is independent of the geometries of excitation/collection of signals and the power of excitation duringthe fluorescence imaging process [18].
2.5. Data analysis
Comparisons of uptake fluorescence intensities in in vitro
studies and cell survival studies were carried out using para-metric ANOVA with post-hoc Bonferroni multiple test. Itwas performed using SPSS (USA) version 11.5 at p < 0.05.The Student’s t-test was used to compare the I(R)/I(B) ratioat each time point across different formulations.
3. Results
3.1. Light induced HY-fluorescence in MGH cells
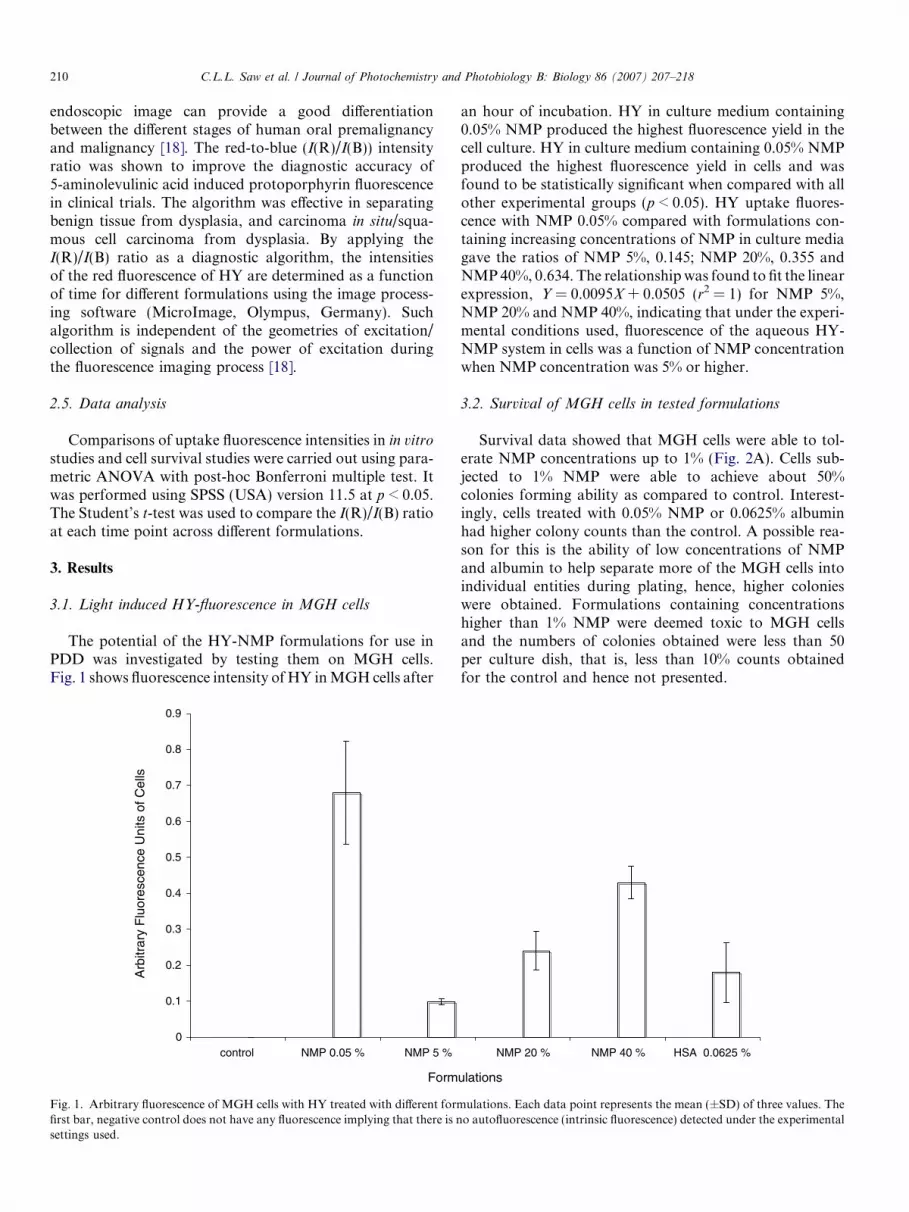
The potential of the HY-NMP formulations for use inPDD was investigated by testing them on MGH cells.Fig. 1 shows fluorescence intensity of HY in MGH cells after
0
0.1
0.2
0.3
0.4
0.5
0.6
0.7
0.8
0.9
control NMP 0.05 % NMP 5 %
Form
Arb
itrar
y F
luor
esce
nce
Uni
ts o
f Cel
ls
Fig. 1. Arbitrary fluorescence of MGH cells with HY treated with different formfirst bar, negative control does not have any fluorescence implying that there is nsettings used.
an hour of incubation. HY in culture medium containing0.05% NMP produced the highest fluorescence yield in thecell culture. HY in culture medium containing 0.05% NMPproduced the highest fluorescence yield in cells and wasfound to be statistically significant when compared with allother experimental groups (p < 0.05). HY uptake fluores-cence with NMP 0.05% compared with formulations con-taining increasing concentrations of NMP in culture mediagave the ratios of NMP 5%, 0.145; NMP 20%, 0.355 andNMP 40%, 0.634. The relationship was found to fit the linearexpression, Y = 0.0095X + 0.0505 (r2 = 1) for NMP 5%,NMP 20% and NMP 40%, indicating that under the experi-mental conditions used, fluorescence of the aqueous HY-NMP system in cells was a function of NMP concentrationwhen NMP concentration was 5% or higher.
3.2. Survival of MGH cells in tested formulations
Survival data showed that MGH cells were able to tol-erate NMP concentrations up to 1% (Fig. 2A). Cells sub-jected to 1% NMP were able to achieve about 50%colonies forming ability as compared to control. Interest-ingly, cells treated with 0.05% NMP or 0.0625% albuminhad higher colony counts than the control. A possible rea-son for this is the ability of low concentrations of NMPand albumin to help separate more of the MGH cells intoindividual entities during plating, hence, higher colonieswere obtained. Formulations containing concentrationshigher than 1% NMP were deemed toxic to MGH cellsand the numbers of colonies obtained were less than 50per culture dish, that is, less than 10% counts obtainedfor the control and hence not presented.
NMP 20 % NMP 40 % HSA 0.0625 %
ulations
ulations. Each data point represents the mean (±SD) of three values. Theo autofluorescence (intrinsic fluorescence) detected under the experimental

Fig. 2. (A) Representative colony survival bar chart as a function of the different formulations. The bars show the mean of a minimum of three plates,expressed as percentage of the control values for each formulation tested, using the equation, cell survival = (colonies in sample/colonies incontrol) · 100%. (B) Colony forming assay. A picture of the control MGH cells was taken using light microscopy; about 80 cells form this colony.
C.L.L. Saw et al. / Journal of Photochemistry and Photobiology B: Biology 86 (2007) 207–218 211
3.3. Semi-quantitative assessment of HY accumulation in
tumor by different formulations
Upon excitation by blue light, HY fluoresces as redspots in the tumor. This is the basis of diagnosis of cancerusing fluorescence. The red fluorescence indicates the loca-tion of HY. Fig. 3 displays fluorescence images (B–D andJ–L) of CAM implanted with MGH cells under the illumi-nation of the blue light. The greyscale images (F–H and N–P) show the white regions as the hot spots for the locationof HY, followed by grey and dark regions. It was observedthat the intensity of HY fluorescence was higher afterapplying HY-NMP 0.5% as compared to HY-HSA 0.5%formulation. Both NMP formulations were more effective
in producing HY fluorescence as early as 30 min post appli-cation. The HY fluorescence obtained by HY-HSA 0.5%was lower in intensity and took a longer time in buildingup sufficient intensity that was detectable. It was only after6 h (Fig. 3H) that a suitably large area on CAM was fluo-rescing upon excitation by the blue light.
3.4. Quantitative assessment of I(R)/I(B) ratio in normal
CAM tissue
Figs. 4 and 5 display the I(R)/I(B) ratios of the tumorcells and normal CAM tissues adjacent to the tumor, as afunction of time in all the experimental groups. This wasto assess whether HY was selectively localized in the

Fig. 3. The CAM implanted with MGH cells observed under blue light (A–D and I–L). At 0 h, before the application of HY formulations, tumor andadjacent normal CAM tissues did not fluoresce as red regions (A & I). The arrows in the images (I & M) are pointing the eggshell. Post application of HYformulations, intensity of red fluorescence due to HY is shown as linearly graded grayscale images (F-H & N-P). The ramp inserted in the grayscale imagepresents the intensity of HY fluorescence such that white is highest (scale of 255) and black is lowest (scale of 0) and rest gray values in between. Thenumbers in pictures are the relative fluorescence intensities at different spots on CAM implanted with MGH cells. Higher HY fluorescence was obtained byHY-NMP 0.05% as early as 0.5 h after administration. The arrow in H image indicates that only after 6 h of application HY-HSA 0.5% there was arelatively larger area on CAM fluorescing as a red spot with blue light. (For interpretation of the references in colour in this figure legend, the reader isreferred to the web version of this article.)
212 C.L.L. Saw et al. / Journal of Photochemistry and Photobiology B: Biology 86 (2007) 207–218
implanted tumor area. A good photosensitizer should beselectively taken up by the tumor and gives a higherI(R)/I(B) ratio for the tumor region as compared to thatof adjacent normal tissues. This selectivity of HY shouldnot be compromised when it is formulated to provide ahigher contrast in fluorescence between the tumor andadjacent normal tissues. Fig. 4 shows that the conventionalformulation, HY-HSA 0.5% could only produce a I(R)/I(B) ratio of tumor smaller than 1.5. However, NMP for-mulations were able to produce higher I(R)/I(B) ratio atthe tumor without increasing the I(R)/I(B) ratio of theadjacent tissue.
The I(R)/I(B) ratios in normal adjacent tissue treated byHY-NMP 0.05% and HY-HSA 0.5% were compared from2 h onwards to 10 h post application. There was no signif-icant difference between these two groups at every timepoint (Fig. 4). The similar analysis was performed forHY-NMP 0.05% and HY-NMP 0.5% groups (Fig. 5).Again, no significant difference between the groups wasdetected. The scatters plots of all these formulations alsoshow almost horizontal lines as a function of time. Thesefindings indicated that the I(R)/I(B) ratios at adjacent tis-sue remained constant over the time period studied. There-
fore, the baseline I(R)/I(B) ratios at adjacent tissue werecomparable between groups and not altered by the formu-lations. This allowed for a fair quantitative comparisonbetween the tumor I(R)/I(B) ratios effected by differentHY formulations studied.
3.5. Quantitative assessment of tumor I(R)/I(B) ratio for
HY-NMP 0.05% and HY-HSA 0.5% treated CAM
The I(R)/I(B) ratios at adjacent tissue treated by HY-NMP 0.05% and HY-HSA 0.5% were compared to theirrespective tumor I(R)/I(B) ratios at each time point from2 h onwards to 10 h post application. HY-NMP 0.05%gave its first significant difference at 2 h while significantdifference was only obtained at 7 h for HY-HSA 0.5% trea-ted CAM (Fig. 4). When the tumor I(R)/I(B) ratio wascompared between these two formulations, at 2 h, HY-NMP 0.05% had significantly higher ratio of 4.46 fold com-pared with the HY-HSA 0.5% formulation. This showsthat the HY-NMP 0.05% formulation was able to producea significantly higher contrast between the tumor and itsadjacent tissue in the CAM, at 5 h earlier than the conven-tional HY-HSA 0.5% formulation.

0.0
50.0
100.0
150.0
200.0
250.0
300.0
0 2 4 6 8 10 12
Post Application Time (h)
Arb
itrar
y R
ed F
luor
esce
nce
Uni
ts
A
B
0.0
0.5
1.0
1.5
2.0
2.5
3.0
3.5
4.0
0 2 4 6 8 10 12
I(R
)/I(
B)
Flu
ores
cenc
e In
tens
ity R
atio
Post Application Time (h)
Fig. 4. (A) Increase in red fluorescence in tumor (closed symbols) following application of HY-NMP 0.05% (m) and HY-HSA 0.5% (n). There is noincrease in red fluorescence in adjacent (open symbols) CAM tissue after treating by HY-NMP 0.05% (n, dark lines) and HY-HSA 0.5% (h, gray lines).Linear regression lines have been drawn for each tissue type of each formulation. Big and small symbols indicate different samples obtained from eachformulation. (B) I(R)/I(B) ratios as a function of time after the topical application of formulations. The linear regression lines of the average of the I(R)/I(B) tumor ratios (full lines) are higher than the normal adjacent tissue (dotted lines).
C.L.L. Saw et al. / Journal of Photochemistry and Photobiology B: Biology 86 (2007) 207–218 213
3.6. Quantitative assessment of tumor I(R)/I(B) ratio forHY-NMP 0.05% and HY NMP 0.5% treated CAM
The preliminary findings above and the effects of NMPat higher concentration were confirmed by another set ofexperiments with a larger number of eggs transplanted with12 · 106 MGH cells instead of 6 · 106 MGH cells used peregg previously. It was found that the HY-HSA 0.5% did
not produce better tumor I(R)/I(B) ratio, therefore, itwas suffice to just focus on the quantitative assessmentbetween HY-NMP 0.05% and HY-NMP 0.5%.
The I(R)/I(B) ratios at adjacent tissue treated by HY-NMP 0.05% and HY-NMP 0.5% were compared to theI(R)/I(B) ratios of the tumor at each time points from0.5 h to 6 h post application. There was a significant differ-ence between these two ratios at every time point (Fig. 5).
I(R
)/I(
B)
Flu
ores
cenc
e In
tens
ity R
atio
Post Application Time (h)
0.0
0.5
1.0
1.5
2.0
2.5
3.0
3.5
4.0
0 1 2 3 4 5 6 7
∗
∗∗
∗∗
∗
B
Post Application Time (h)
Arb
itrar
Red
Flu
ores
cenc
e U
nits
A
0.0
50.0
100.0
150.0
200.0
250.0
300.0
0 1 2 3 4 5 6 7
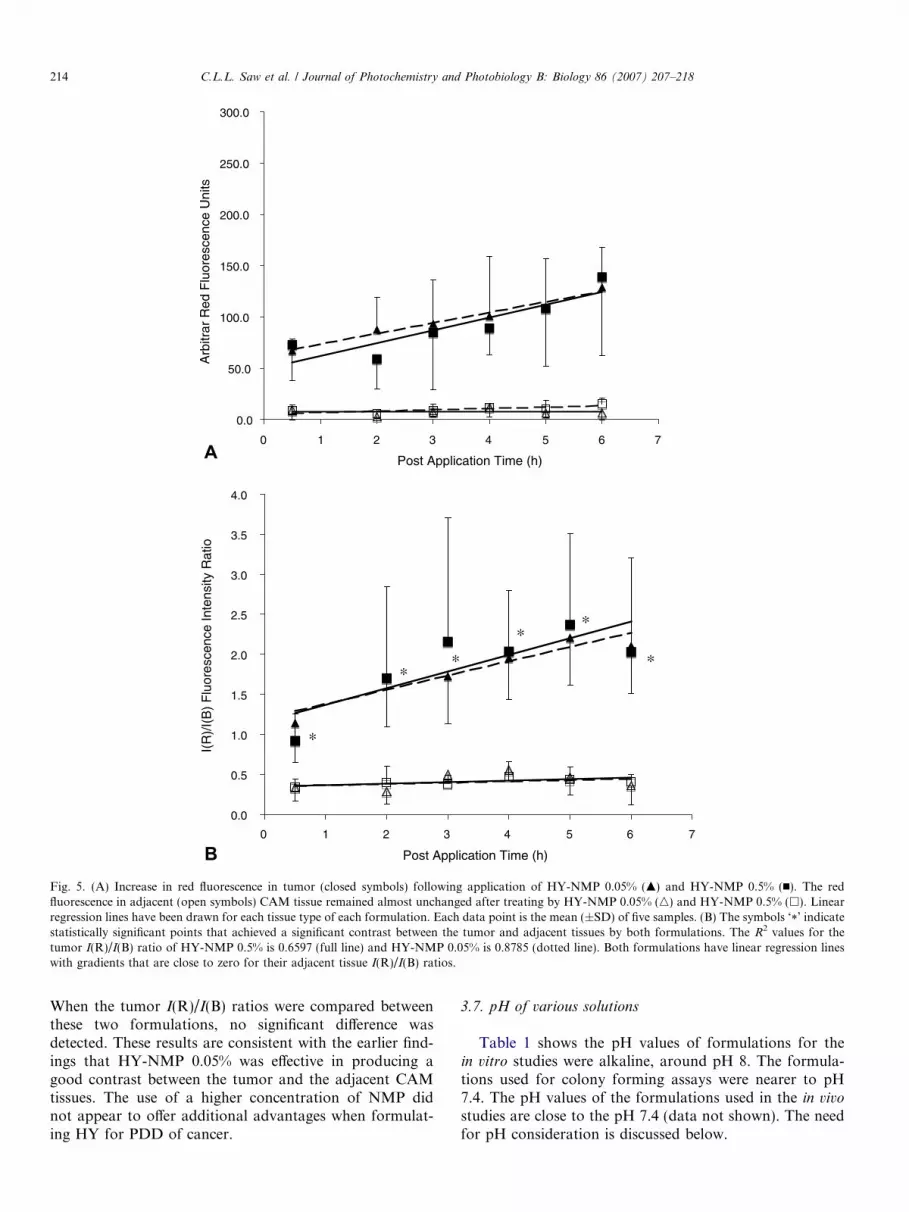
Fig. 5. (A) Increase in red fluorescence in tumor (closed symbols) following application of HY-NMP 0.05% (m) and HY-NMP 0.5% (n). The redfluorescence in adjacent (open symbols) CAM tissue remained almost unchanged after treating by HY-NMP 0.05% (n) and HY-NMP 0.5% (h). Linearregression lines have been drawn for each tissue type of each formulation. Each data point is the mean (±SD) of five samples. (B) The symbols ‘*’ indicatestatistically significant points that achieved a significant contrast between the tumor and adjacent tissues by both formulations. The R2 values for thetumor I(R)/I(B) ratio of HY-NMP 0.5% is 0.6597 (full line) and HY-NMP 0.05% is 0.8785 (dotted line). Both formulations have linear regression lineswith gradients that are close to zero for their adjacent tissue I(R)/I(B) ratios.
214 C.L.L. Saw et al. / Journal of Photochemistry and Photobiology B: Biology 86 (2007) 207–218
When the tumor I(R)/I(B) ratios were compared betweenthese two formulations, no significant difference wasdetected. These results are consistent with the earlier find-ings that HY-NMP 0.05% was effective in producing agood contrast between the tumor and the adjacent CAMtissues. The use of a higher concentration of NMP didnot appear to offer additional advantages when formulat-ing HY for PDD of cancer.
3.7. pH of various solutions
Table 1 shows the pH values of formulations for thein vitro studies were alkaline, around pH 8. The formula-tions used for colony forming assays were nearer to pH7.4. The pH values of the formulations used in the in vivostudies are close to the pH 7.4 (data not shown). The needfor pH consideration is discussed below.
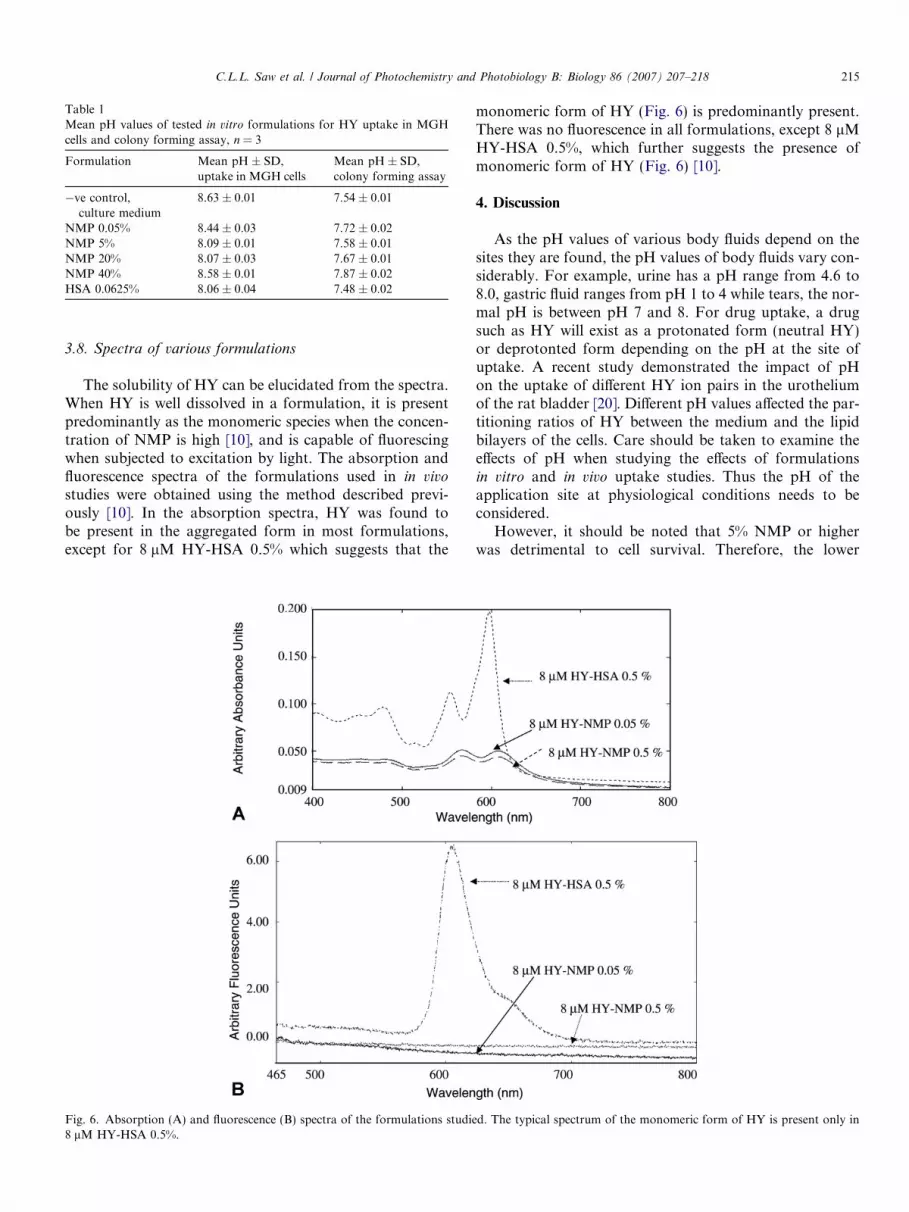
Table 1Mean pH values of tested in vitro formulations for HY uptake in MGHcells and colony forming assay, n = 3
Formulation Mean pH ± SD,uptake in MGH cells
Mean pH ± SD,colony forming assay
�ve control,culture medium
8.63 ± 0.01 7.54 ± 0.01
NMP 0.05% 8.44 ± 0.03 7.72 ± 0.02NMP 5% 8.09 ± 0.01 7.58 ± 0.01NMP 20% 8.07 ± 0.03 7.67 ± 0.01NMP 40% 8.58 ± 0.01 7.87 ± 0.02HSA 0.0625% 8.06 ± 0.04 7.48 ± 0.02
C.L.L. Saw et al. / Journal of Photochemistry and Photobiology B: Biology 86 (2007) 207–218 215
3.8. Spectra of various formulations
The solubility of HY can be elucidated from the spectra.When HY is well dissolved in a formulation, it is presentpredominantly as the monomeric species when the concen-tration of NMP is high [10], and is capable of fluorescingwhen subjected to excitation by light. The absorption andfluorescence spectra of the formulations used in in vivostudies were obtained using the method described previ-ously [10]. In the absorption spectra, HY was found tobe present in the aggregated form in most formulations,except for 8 lM HY-HSA 0.5% which suggests that the
Fig. 6. Absorption (A) and fluorescence (B) spectra of the formulations studie8 lM HY-HSA 0.5%.
monomeric form of HY (Fig. 6) is predominantly present.There was no fluorescence in all formulations, except 8 lMHY-HSA 0.5%, which further suggests the presence ofmonomeric form of HY (Fig. 6) [10].
4. Discussion
As the pH values of various body fluids depend on thesites they are found, the pH values of body fluids vary con-siderably. For example, urine has a pH range from 4.6 to8.0, gastric fluid ranges from pH 1 to 4 while tears, the nor-mal pH is between pH 7 and 8. For drug uptake, a drugsuch as HY will exist as a protonated form (neutral HY)or deprotonted form depending on the pH at the site ofuptake. A recent study demonstrated the impact of pHon the uptake of different HY ion pairs in the urotheliumof the rat bladder [20]. Different pH values affected the par-titioning ratios of HY between the medium and the lipidbilayers of the cells. Care should be taken to examine theeffects of pH when studying the effects of formulationsin vitro and in vivo uptake studies. Thus the pH of theapplication site at physiological conditions needs to beconsidered.
However, it should be noted that 5% NMP or higherwas detrimental to cell survival. Therefore, the lower
d. The typical spectrum of the monomeric form of HY is present only in
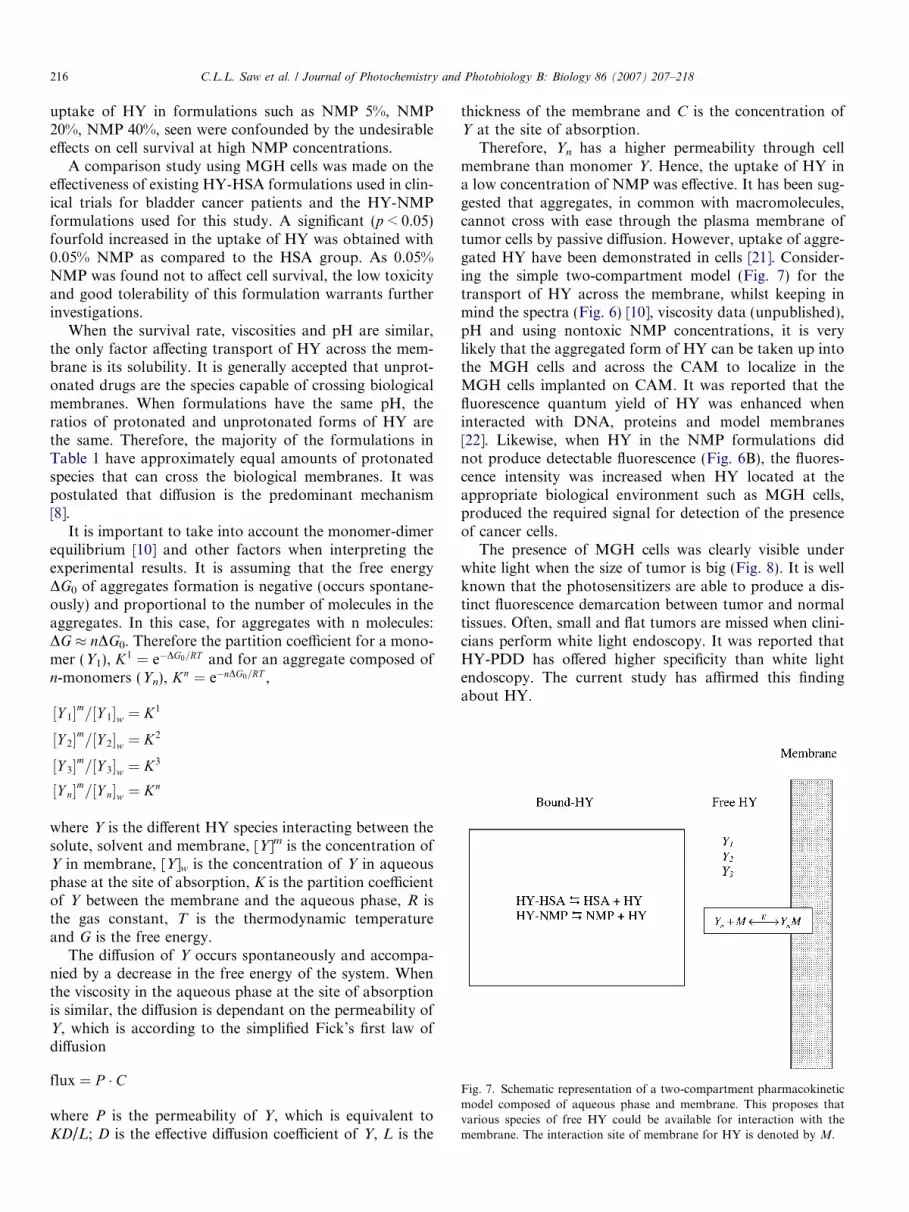
Fig. 7. Schematic representation of a two-compartment pharmacokineticmodel composed of aqueous phase and membrane. This proposes thatvarious species of free HY could be available for interaction with themembrane. The interaction site of membrane for HY is denoted by M.
216 C.L.L. Saw et al. / Journal of Photochemistry and Photobiology B: Biology 86 (2007) 207–218
uptake of HY in formulations such as NMP 5%, NMP20%, NMP 40%, seen were confounded by the undesirableeffects on cell survival at high NMP concentrations.
A comparison study using MGH cells was made on theeffectiveness of existing HY-HSA formulations used in clin-ical trials for bladder cancer patients and the HY-NMPformulations used for this study. A significant (p < 0.05)fourfold increased in the uptake of HY was obtained with0.05% NMP as compared to the HSA group. As 0.05%NMP was found not to affect cell survival, the low toxicityand good tolerability of this formulation warrants furtherinvestigations.
When the survival rate, viscosities and pH are similar,the only factor affecting transport of HY across the mem-brane is its solubility. It is generally accepted that unprot-onated drugs are the species capable of crossing biologicalmembranes. When formulations have the same pH, theratios of protonated and unprotonated forms of HY arethe same. Therefore, the majority of the formulations inTable 1 have approximately equal amounts of protonatedspecies that can cross the biological membranes. It waspostulated that diffusion is the predominant mechanism[8].
It is important to take into account the monomer-dimerequilibrium [10] and other factors when interpreting theexperimental results. It is assuming that the free energyDG0 of aggregates formation is negative (occurs spontane-ously) and proportional to the number of molecules in theaggregates. In this case, for aggregates with n molecules:DG � nDG0. Therefore the partition coefficient for a mono-mer (Y1), K1 ¼ e�DG0=RT and for an aggregate composed ofn-monomers (Yn), Kn ¼ e�nDG0=RT ,
½Y 1�m=½Y 1�w ¼ K1
½Y 2�m=½Y 2�w ¼ K2
½Y 3�m=½Y 3�w ¼ K3
½Y n�m=½Y n�w ¼ Kn
where Y is the different HY species interacting between thesolute, solvent and membrane, [Y]m is the concentration ofY in membrane, [Y]w is the concentration of Y in aqueousphase at the site of absorption, K is the partition coefficientof Y between the membrane and the aqueous phase, R isthe gas constant, T is the thermodynamic temperatureand G is the free energy.
The diffusion of Y occurs spontaneously and accompa-nied by a decrease in the free energy of the system. Whenthe viscosity in the aqueous phase at the site of absorptionis similar, the diffusion is dependant on the permeability ofY, which is according to the simplified Fick’s first law ofdiffusion
flux ¼ P � C
where P is the permeability of Y, which is equivalent toKD/L; D is the effective diffusion coefficient of Y, L is the
thickness of the membrane and C is the concentration ofY at the site of absorption.
Therefore, Yn has a higher permeability through cellmembrane than monomer Y. Hence, the uptake of HY ina low concentration of NMP was effective. It has been sug-gested that aggregates, in common with macromolecules,cannot cross with ease through the plasma membrane oftumor cells by passive diffusion. However, uptake of aggre-gated HY have been demonstrated in cells [21]. Consider-ing the simple two-compartment model (Fig. 7) for thetransport of HY across the membrane, whilst keeping inmind the spectra (Fig. 6) [10], viscosity data (unpublished),pH and using nontoxic NMP concentrations, it is verylikely that the aggregated form of HY can be taken up intothe MGH cells and across the CAM to localize in theMGH cells implanted on CAM. It was reported that thefluorescence quantum yield of HY was enhanced wheninteracted with DNA, proteins and model membranes[22]. Likewise, when HY in the NMP formulations didnot produce detectable fluorescence (Fig. 6B), the fluores-cence intensity was increased when HY located at theappropriate biological environment such as MGH cells,produced the required signal for detection of the presenceof cancer cells.
The presence of MGH cells was clearly visible underwhite light when the size of tumor is big (Fig. 8). It is wellknown that the photosensitizers are able to produce a dis-tinct fluorescence demarcation between tumor and normaltissues. Often, small and flat tumors are missed when clini-cians perform white light endoscopy. It was reported thatHY-PDD has offered higher specificity than white lightendoscopy. The current study has affirmed this findingabout HY.

Fig. 8. (A) MGH cells implanted on the CAM, scale bar = 1 mm. (B) MGH cells implanted on CAM after four days. The picture was taken just beforeexperimentation. Under white light, only sufficiently large tumors can be seen. (C) Before the application of HY, the picture of CAM implanted withtumors was taken under excitation by blue light.
C.L.L. Saw et al. / Journal of Photochemistry and Photobiology B: Biology 86 (2007) 207–218 217
The promising effects of the penetration enhancer,NMP, to efficaciously deliver HY had led the investigatorsto this current study. It was postulated that with properformulation of HY with NMP, the delivery of HY couldbe improved by increasing the contrast or shorten theadministration time of HY formulation when used clini-cally. The findings support the potential use of NMP asan alternative solubilizer for plasma protein. The formula-tions used in the in vivo studies (8 lM HY-HSA 0.5%) isthe currently used formulation for PDD of bladder can-cers. The formulation used in the in vitro studies (1 lMHY-HSA 0.0625%) is the 1/8 both the concentrations ofHY and HSA of the 8 lM HY-HSA 0.5% formulation.The HY-NMP formulations tested in both the in vitro
(1 lM HY-NMP 0.05%) and in vivo (8 lM HY-NMP0.05%) studies were found to be superior to the HY-HSAformulations. The effects could be a combination due topresence of NMP and/or due to absence of albumin. Thelatter has been shown in many articles [8].
As discussed, CAM tissue may not mimic the true phys-iological conditions of normal bladder urothelium. HY iscurrently used for bladder cancer detection. It is preferablefor HY to be prepared as a bladder instillation fluid orintravesical instillation than administration by the intrave-nous route. Application of HY-NMP formulation to blad-der for cancer detection can be studied by administrationof the formulation to CAM implanted with human cancercells. It is also possible to carry out similar studies usingother animal models such as the orthotopic bladder carci-noma murine model but these studies are relatively morecomplicated to conduct and do not necessary produce thedesired advantageous outcomes.
The HY-NMP formulations have potential in the clini-cal setting but further work is warranted to verify the effi-cacy. The approach outlined in this study should be testedin a pilot clinical trial on patients to confirm the actual clin-ical efficacy of HY-NMP formulation.
The significance of the present work is that HY-NMP for-mulation was shown to be a good alternative formulation tothe currently used HY-HSA 0.5% formulation. When prop-erly formulated, HY can produce a good contrast betweennormal and tumor regions at earlier time point post drug
administration. It has the potential to reduce patient’s wait-ing time and resulting in improving patient quality of life.
Acknowledgements
The authors sincerely thank GEA-NUS PharmaceuticalProcessing Research Laboratory, National University ofSingapore and Laboratory of Photodynamic Therapy, Na-tional Cancer Centre Singapore for supporting this project.The authors would like to thank Dr Nikolai Kocherginskyfrom the Division of Bioengineering, National Universityof Singapore, for his invaluable discussion. Ms. C.L.L.Saw is a recipient of a postgraduate scholarship from Na-tional University of Singapore. Thanks to Ms. R. Bhuv-aneswari, Mr. C.J.H. Chua and Mr. R.J.X. Zhang forassistance in experiments. Thanks to Ms S.L.M. Tay forassistance in editing the manuscript.
References
[1] A. Jemal, T. Murray, E. Ward, A. Samuels, R.C. Tiwari, A. Ghafoor,E.J. Feuer, M.J. Thun, Cancer statistics, 2005, CA Cancer J. Clin. 1(2005) 10–30.
[2] G. Danaei, S. Vander Hoorn, A.D. Lopez, C.J. Murray, M. Ezzati,Causes of cancer in the world: comparative risk assessment of ninebehavioural and environmental risk factors, Lancet 9499 (2005) 1784–1793.
[3] L.S. Borden, P.E. Clark, M.C. Hall, Bladder cancer, Curr. Opin.Oncol. 3 (2003) 227–233.
[4] D.G. Bostwick, D. Ramnani, L. Cheng, Diagnosis and grading ofbladder cancer and associated lesions, Urol. Clin. North Am. 3 (1999)493–507.
[5] M.A. Hudson, H.W. Herr, Carcinoma in situ of the bladder, J. Urol.3 (Part 1) (1995) 564–572.
[6] L. Cheng, J.C. Cheville, R.M. Neumann, B.C. Leibovich, K.S. Egan,B.E. Spotts, D.G. Bostwick, Survival of patients with carcinomain situ of the urinary bladder, Cancer 11 (1999) 2469–2474.
[7] H.G. Sim, W.K.O. Lau, M. Olivo, P.H. Tan, C.W.S. Cheng, Isphotodynamic diagnosis using hypericin better than white-lightcystoscopy for detecting superficial bladder carcinoma? BJU Int. 9(2005) 1215–1218.
[8] C.L.L. Saw, M. Olivo, K.C. Soo, P.W.S. Heng, Delivery of hypericinfor photodynamic applications, Cancer Lett. 1 (2006) 23–30.
[9] M.A. D’Hallewin, A.R. Kamuhabwa, T. Roskams, P.A. De Witte, L.Baert, Hypericin-based fluorescence diagnosis of bladder carcinoma,BJU Int. 7 (2002) 760–763.

218 C.L.L. Saw et al. / Journal of Photochemistry and Photobiology B: Biology 86 (2007) 207–218
[10] C.L.L. Saw, M. Olivo, K.C. Soo, P.W.S. Heng, Spectroscopiccharacterization and photobleaching kinetics of hypericin-N-methylpyrrolidone formulations, Photochem. Photobiol. Sci. 11 (2006)1018–1023.
[11] W. Chin, W. Lau, S.L. Lay, K.K. Wei, M. Olivo, Photody-namic-induced vascular damage of the chick chorioallantoicmembrane model using perylenequinones, Int. J. Oncol. 4(2004) 887–891.
[12] C.L.L. Saw, M. Olivo, W.W. Chin, K.C. Soo, P.W.S. Heng,Transport of hypericin across chick chorioallantoic membrane andphotodynamic therapy vasculature assessment, Biol. Pharm. Bull. 6(2005) 1054–1060.
[13] C.L.L. Saw, P.W.S. Heng, W.W. Chin, K.C. Soo, M. Olivo,Enhanced photodynamic activity of hypericin by penetrationenhancer N-methyl pyrrolidone formulations in the chick chorioa-llantoic membrane model, Cancer Lett. 1 (2006) 104–110.
[14] FDA, Approved Drug Products, 26th ed., <www.fda/cder/orange/obannual.pdf> (accessed 29.03.06).
[15] S.W. Seow, J.N. Rahmat, A.A. Mohamed, R. Mahendran, Y.K. Lee,B.H. Bay, Lactobacillus species is more cytotoxic to human bladdercancer cells than Mycobacterium Bovis (bacillus Calmette-Guerin), J.Urol. 5 (2002) 2236–2239.
[16] W.W. Chin, W.K. Lau, R. Bhuvaneswari, P.W. Heng, M. Olivo,Chlorin e6-polyvinylpyrrolidone as a fluorescent marker for fluores-cence diagnosis of human bladder cancer implanted on the chick
chorioallantoic membrane model, Cancer Lett., doi:10.1016/j.canlet.2005.12.041.
[17] M. Richardson, G. Singh, Observations on the use of the avianchorioallantoic membrane (CAM) model in investigations intoangiogenesis, Curr. Drug Targets Cardiovasc. Haematol. Disord. 2(2003) 155–185.
[18] W. Zheng, M. Olivo, K.C. Soo, The use of digitized endoscopicimaging of 5-ALA-induced PPIX fluorescence to detect and diagnoseoral premalignant and malignant lesions in vivo, Int. J. Cancer 2(2004) 295–300.
[19] W.W. Chin, W.K. Lau, P.W.S. Heng, R. Bhuvaneswari, M. Olivo,Fluorescence imaging and phototoxicity effects of new formulation ofchlorin e6-polyvinylpyrrolidone, J. Photochem. Photobiol. B 84(2006) 103–110.
[20] A. Huygens, A.R. Kamuhabwa, B. van Cleynenbreugel, H. vanPoppel, T. Roskams, P.A. De Witte, In vivo accumulation of differenthypericin ion pairs in the urothelium of the rat bladder, BJU Int. 3(2005) 436–441.
[21] T. Theodossiou, M.D. Spiro, J. Jacobson, J.S. Hothersall, A.J.Macrobert, Evidence for intracellular aggregation of hypericin andthe impact on its photocytotoxicity in PAM 212 murine keratino-cytes, Photochem. Photobiol. 3 (2004) 438–443.
[22] P. Miskovsky, F. Sureau, L. Chinsky, P.Y. Turpin, Subcellulardistribution of hypericin in human cancer cells, Photochem. Photo-biol. 3 (1995) 546–549.
Copyright © 2022 FDOKUMEN