Supercritical AntiSolvent micronization of PVA by semi-continuous and batch processing
11
J. of Supercritical Fluids 42 (2007) 288–298 Supercritical AntiSolvent micronization of PVA by semi-continuous and batch processing Renata Adami a,b , Libero Sesti Oss´ eo b , Rainer Huopalahti a , Ernesto Reverchon b,∗ a Department of Biochemistry & Food Chemistry, University of Turku, FIN-20014 Turku, Finland b Department of Chemical & Food Engineering, University of Salerno, I-84084 Fisciano, Italy Received 18 January 2007; received in revised form 11 April 2007; accepted 17 April 2007 Abstract The biocompatible polymer polyvinyl alcohol (PVA) was successfully micronized by Supercritical AntiSolvent technique in batch (GAS) and semi-continuous (SAS) mode. Using the GAS technique, submicro- and microparticles with mean sizes between 0.4 and 2 m, depending on the pressurization rate, were obtained. Using SAS technique nanoparticles, microparticles, balloons and filaments were produced. Nanoparticles presented size distributions as small as about 50–250 nm, microparticles were perfectly spherical, with diameter ranging between 1 and 20 m, empty balloons showed diameters up to several tenth of microns and filaments had a length of several hundreds of microns. The reproducibility of the process on different plants was verified: SAS showed immediate reproducibility, GAS for different precipitator volumes requires a control of pressurization times. We also studied the correlation among phase equilibria, jet-break up and morphology of the particles produced by SAS with the aid of the direct visual observation of the process in a windowed precipitator. The observation of the fluid during the precipitation confirmed that nanoparticles were formed in supercritical conditions, microparticles at near critical conditions, and balloons were formed at subcritical single phase conditions. The windowed precipitator also allowed to study the expansion of the liquid phase in the case of the batch process. © 2007 Elsevier B.V. All rights reserved. Keywords: Supercritical AntiSolvent; Batch; Semi-continuous; Biopolymer; PVA 1. Introduction Supercritical AntiSolvent micronization is known with dif- ferent acronyms, but the process is essentially the same in all cases; the differences are mainly related to the feed mode of solvent and antisolvent, that can be in co-current or counter- current and to the kind of injector used. The only significant differences are obtained when the process is performed in batch or semi-continuous mode. Indeed, though the principle of the precipitation process is the same, batch and semi-continuous processes can produce totally different results in terms of mor- phology and particle size distributions of the processed material. In batch conditions, which we will refer as Gas AntiSolvent (GAS), the solution is put in the vessel; then, the antisolvent is loaded into the vessel with the outlet valve closed and pre- cipitation is obtained from the expanded liquid; finally pure ∗ Corresponding author. Fax: +39 089 964057. E-mail address: [email protected] (E. Reverchon). antisolvent is feed in order to wash away the solvent. The semi-continuous Supercritical AntiSolvent process (SAS) is characterized by the continuous delivery of solvent and anti- solvent in the precipitator. SAS process has been widely applied in many fields: phar- maceuticals, superconductors, colouring matters, explosives, polymers, biopolymers. Different particle morphologies have been produced: nanometric and micrometric particles, amor- phous particles or crystals. Reviews can be found in literature that collect and comment the results presented by the various authors [1–5]. Some authors tried to study the process mechanisms, to give an interpretation of the results [6–9]. The process is very com- plex and not easy to be modelled, because it depends on the interactions among thermodynamics, mass-transfer, jet hydro- dynamics and nucleation kinetics. Werling and Debenedetti [6,7] proposed a mathematical model based on the mass transfer between solvent and antisolvent, considering the influence of density and diffusivity. Two cases were analysed: in the first case, at subcritical conditions, the formation of particles was 0896-8446/$ – see front matter © 2007 Elsevier B.V. All rights reserved. doi:10.1016/j.supflu.2007.04.002
Transcript of Supercritical AntiSolvent micronization of PVA by semi-continuous and batch processing
A
s
osuv
vw
©
K
1
fcscdopppI(ic
0d
J. of Supercritical Fluids 42 (2007) 288–298
Supercritical AntiSolvent micronization of PVA bysemi-continuous and batch processing
Renata Adami a,b, Libero Sesti Osseo b, Rainer Huopalahti a, Ernesto Reverchon b,∗a Department of Biochemistry & Food Chemistry, University of Turku, FIN-20014 Turku, Finland
b Department of Chemical & Food Engineering, University of Salerno, I-84084 Fisciano, Italy
Received 18 January 2007; received in revised form 11 April 2007; accepted 17 April 2007
bstract
The biocompatible polymer polyvinyl alcohol (PVA) was successfully micronized by Supercritical AntiSolvent technique in batch (GAS) andemi-continuous (SAS) mode.
Using the GAS technique, submicro- and microparticles with mean sizes between 0.4 and 2 �m, depending on the pressurization rate, werebtained. Using SAS technique nanoparticles, microparticles, balloons and filaments were produced. Nanoparticles presented size distributions asmall as about 50–250 nm, microparticles were perfectly spherical, with diameter ranging between 1 and 20 �m, empty balloons showed diametersp to several tenth of microns and filaments had a length of several hundreds of microns. The reproducibility of the process on different plants waserified: SAS showed immediate reproducibility, GAS for different precipitator volumes requires a control of pressurization times.
We also studied the correlation among phase equilibria, jet-break up and morphology of the particles produced by SAS with the aid of the direct
isual observation of the process in a windowed precipitator. The observation of the fluid during the precipitation confirmed that nanoparticlesere formed in supercritical conditions, microparticles at near critical conditions, and balloons were formed at subcritical single phase conditions.The windowed precipitator also allowed to study the expansion of the liquid phase in the case of the batch process.2007 Elsevier B.V. All rights reserved.A
ascs
mpbpta
a
eywords: Supercritical AntiSolvent; Batch; Semi-continuous; Biopolymer; PV
. Introduction
Supercritical AntiSolvent micronization is known with dif-erent acronyms, but the process is essentially the same in allases; the differences are mainly related to the feed mode ofolvent and antisolvent, that can be in co-current or counter-urrent and to the kind of injector used. The only significantifferences are obtained when the process is performed in batchr semi-continuous mode. Indeed, though the principle of therecipitation process is the same, batch and semi-continuousrocesses can produce totally different results in terms of mor-hology and particle size distributions of the processed material.n batch conditions, which we will refer as Gas AntiSolvent
GAS), the solution is put in the vessel; then, the antisolvents loaded into the vessel with the outlet valve closed and pre-ipitation is obtained from the expanded liquid; finally pure∗ Corresponding author. Fax: +39 089 964057.E-mail address: [email protected] (E. Reverchon).
pidpbdc
896-8446/$ – see front matter © 2007 Elsevier B.V. All rights reserved.oi:10.1016/j.supflu.2007.04.002
ntisolvent is feed in order to wash away the solvent. Theemi-continuous Supercritical AntiSolvent process (SAS) isharacterized by the continuous delivery of solvent and anti-olvent in the precipitator.
SAS process has been widely applied in many fields: phar-aceuticals, superconductors, colouring matters, explosives,
olymers, biopolymers. Different particle morphologies haveeen produced: nanometric and micrometric particles, amor-hous particles or crystals. Reviews can be found in literaturehat collect and comment the results presented by the variousuthors [1–5].
Some authors tried to study the process mechanisms, to given interpretation of the results [6–9]. The process is very com-lex and not easy to be modelled, because it depends on thenteractions among thermodynamics, mass-transfer, jet hydro-ynamics and nucleation kinetics. Werling and Debenedetti [6,7]
roposed a mathematical model based on the mass transferetween solvent and antisolvent, considering the influence ofensity and diffusivity. Two cases were analysed: in the firstase, at subcritical conditions, the formation of particles was
ritica
hdtcts
oplti
d[dstt
aipiipsfosaCba
cb[deisS
stsf
ot[(atet
attdiasp
ca
2
2
vadMtdimt
dscoiipastt
wctaTlstaGqdc
R. Adami et al. / J. of Superc
ypothesised to be the consequence of saturation of the singleroplet due to the CO2 antisolvent effect [6]. In the second case,he model considered that solvent and antisolvent are fully mis-ible at supercritical conditions; therefore, there is no surfaceension and the difference in their densities controls the dropletswelling or shrinking [7].
Perez et al. [10,11] in the case of polymers, at conditionsf complete miscibility between the organic solvent and CO2,roposed that droplets are the result of the formation of aiquid–liquid phase split. The morphology of the sphere-like par-icles was explained by the formation of polymer-rich dropletsn a continuous medium.
Only few authors considered the influence of the thermo-ynamics of the system on particles morphology and size12–14] and, due to the difficulties in the construction of ternaryiagrams, they considered the corresponding binary diagramsolvent-CO2, neglecting the influence of the solute in the sys-em [15]. However, such approximation is not applicable whenhe presence of the solute largely modifies the VLEs [12–14].
The influence of fluid dynamics on particles morphology islso a relevant aspect in the SAS process, because the atom-zation produces large surfaces between the liquid and the fluidhase. Lengsfeld et al. [8] studied the change of surface tensionn a fluid injected into compressed CO2 to determine the atom-zation mechanism. They observed a long jet-break up time inartially miscible systems. In miscible systems, the jet length ishorter and the surface tension goes rapidly to zero. Particles areormed by a gas-phase nucleation and growth within the plumef gas injected in the precipitator, producing a very large contacturface between the solvent and the antisolvent [16]. Dukhin etl. [17] showed that when ethanol is injected into compressedO2, if the pressure is lower than the critical pressure of theinary mixture, the solution is atomized in droplets, if it is larger,gas-like jet is observed.
The GAS process, when successfully performed, producesrystals or spherical particles depending on the compound toe micronized and on the rate of pressurization of the system9,18–21]. The absence of the atomization step simplifies theescription of the mechanism of particles formation. Warwickt al. [22] found that the size of the particles produced by GASs dominated by the rate of expansion of the solution and thatmaller particles could be produced at higher expansion rates.imilar trends were also found by other authors [18,21].
Though the similitude and the differences between batch andemi-continuous antisolvent are interesting and can contributeo a better understanding of the process mechanism, only fewtudies focused on the comparison of the two processes can beound in the literature [22,23].
The micronization of polymers and biopolymers has beenne of the earliest applications of Supercritical AntiSolventechnique, both in batch and in semi-continuous conditions10,11,24–27]. Among the biopolymers, polyvinyl alcoholPVA) is widely recommended for pharmaceutical applications
s carrier of active compounds, such as in the case of produc-ion of capsules or spheres for medical purposes. Up to now, noxamples of micronization of PVA by Supercritical AntiSolventechnique have been proposed in the literature.fst
l Fluids 42 (2007) 288–298 289
Therefore, the aim of this work is to evaluate the process-bility of PVA using batch and semi-continuous antisolventechnique and to produce controlled particles size and dis-ributions of the precipitates. The results obtained using theifferent operative mode will be compared and the precip-tation mechanism will be investigated. The study will belso supported by the use of a windowed precipitation ves-el that allows the direct observation of the precipitationrocess.
In the case of the semi-continuous process, we will verify if aorrelation exists between the vapour–liquid-equilibria (VLEs)nd the morphology of the particles produced.
. Materials and methods
.1. Apparatuses
The laboratory apparatus used for semi-continuous antisol-ent precipitation, consists of an HPLC pump equipped withpulse dampener (Gilson, model 805, Gilson, USA) used to
eliver the liquid solution, and a diaphragm high-pressure pumpilton Roy (model Milroyal B, France, max flow rate 5 dm3/h)
o deliver supercritical CO2. An AISI 316 stainless steel cylin-rical high-pressure vessel with an internal volume of 500 mLs used as precipitation chamber. Thin band heaters (Watlow,
odel STB3J2J1, Watlow, USA) ensure a uniform heating ofhis vessel during the process.
In SAS experiments, the liquid solution containing PVA iselivered to the precipitator through 60 or 200 �m diametertainless steel nozzle. Supercritical CO2, pre-heated to the pro-ess temperature, is delivered through another inlet port locatedn the top of the chamber. A SAS experiment begins by feed-ng CO2 to the precipitation chamber until the desired pressures reached, and antisolvent steady flow is established. Then,ure liquid solvent is sent through the nozzle to the chambert the operating flow rate. This procedure is aimed at obtainingteady-state composition conditions during the solute precipita-ion. Then, the liquid solution is delivered through the nozzle athe same flow rate.
The produced powder is collected on a stainless steel fritith a 1 �m equivalent porosity, located at the bottom of the
hamber, that allows the passage of the CO2–liquid solvent solu-ion. The pressure in the precipitation vessel is regulated bymicrometering valve (Hoke, model 1335G4J, Chemit, Italy).he liquid solvent is recovered in a second collection chamber
ocated downstream, at lower pressure, regulated by a backpres-ure valve (Tescom, model 26-1723-44, Germany). At the exit ofhe second chamber, a rotameter (asa, model NB-2500, Italy) anddry test meter (Schlumberger model GALLUS 1000, Actaris,ermany) are used to measure the CO2 flow rate and the totaluantity of antisolvent delivered, respectively. A more detailedescription of the plant and of the procedure of SAS experimentsan be found elsewhere [28,29].
The windowed SAS apparatus differs from the other one onlyor the precipitator (NWA, Germany), that consists of a stainlessteel cylindrical vessel with an internal volume of 375 mL, withwo quartz windows put along two longitudinal sections. It is
290 R. Adami et al. / J. of Supercritical Fluids 42 (2007) 288–298
Table 1PVA tests performed by SAS using the stainless steel precipitator
Test p (bar) T (◦C) XCO2 Concentration (wt%) ρCO2 (kg/m3) Morphology
1.1 150 35 0.98 1 815
Coalescing nanoparticles1.2 150 40 0.97 1 7801.3 150 40 0.98 1 7801.4 200 35 0.98 1 8661.5 200 45 0.98 1 815
1.6 120 60 0.97 1 437 Microparticles + solid cake
ppca[
ouatlstiifl
Suf
2
9wI
tai
2
owbuPmaUo
TtbAtPar
3
3
pgb
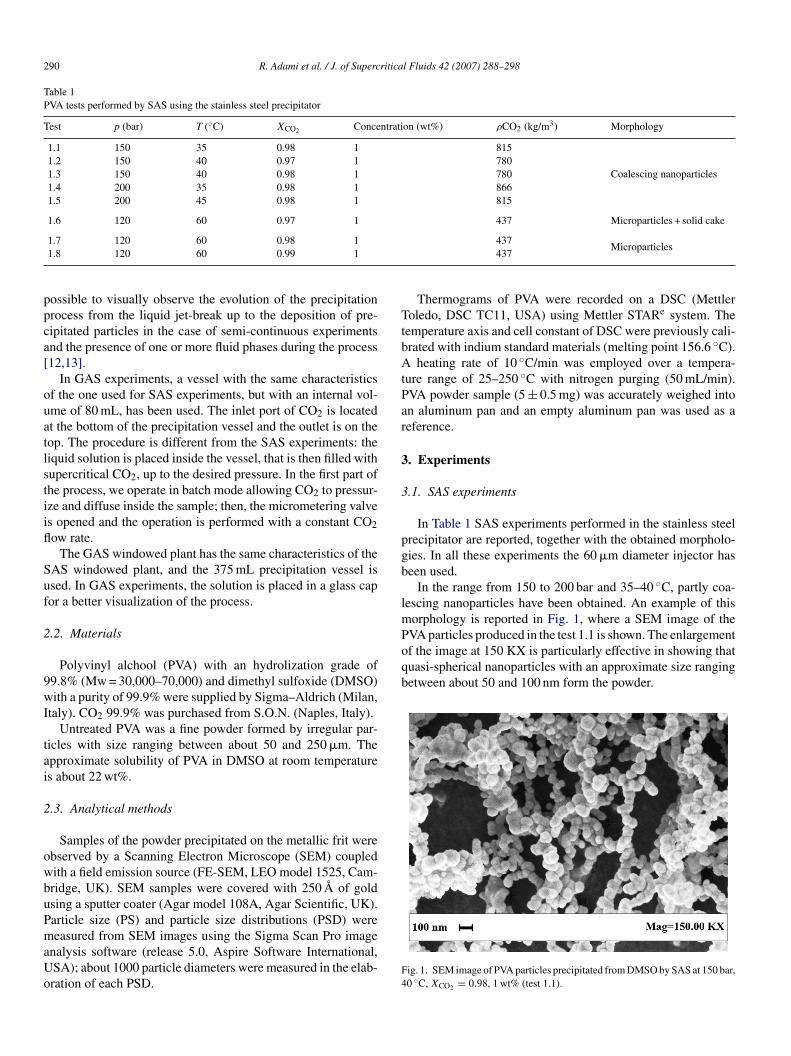
lmPVA particles produced in the test 1.1 is shown. The enlargementof the image at 150 KX is particularly effective in showing thatquasi-spherical nanoparticles with an approximate size rangingbetween about 50 and 100 nm form the powder.
1.7 120 60 0.98 11.8 120 60 0.99 1
ossible to visually observe the evolution of the precipitationrocess from the liquid jet-break up to the deposition of pre-ipitated particles in the case of semi-continuous experimentsnd the presence of one or more fluid phases during the process12,13].
In GAS experiments, a vessel with the same characteristicsf the one used for SAS experiments, but with an internal vol-me of 80 mL, has been used. The inlet port of CO2 is locatedt the bottom of the precipitation vessel and the outlet is on theop. The procedure is different from the SAS experiments: theiquid solution is placed inside the vessel, that is then filled withupercritical CO2, up to the desired pressure. In the first part ofhe process, we operate in batch mode allowing CO2 to pressur-ze and diffuse inside the sample; then, the micrometering valves opened and the operation is performed with a constant CO2ow rate.
The GAS windowed plant has the same characteristics of theAS windowed plant, and the 375 mL precipitation vessel issed. In GAS experiments, the solution is placed in a glass capor a better visualization of the process.
.2. Materials
Polyvinyl alchool (PVA) with an hydrolization grade of9.8% (Mw = 30,000–70,000) and dimethyl sulfoxide (DMSO)ith a purity of 99.9% were supplied by Sigma–Aldrich (Milan,
taly). CO2 99.9% was purchased from S.O.N. (Naples, Italy).Untreated PVA was a fine powder formed by irregular par-
icles with size ranging between about 50 and 250 �m. Thepproximate solubility of PVA in DMSO at room temperatures about 22 wt%.
.3. Analytical methods
Samples of the powder precipitated on the metallic frit werebserved by a Scanning Electron Microscope (SEM) coupledith a field emission source (FE-SEM, LEO model 1525, Cam-ridge, UK). SEM samples were covered with 250 A of goldsing a sputter coater (Agar model 108A, Agar Scientific, UK).article size (PS) and particle size distributions (PSD) were
easured from SEM images using the Sigma Scan Pro imagenalysis software (release 5.0, Aspire Software International,SA); about 1000 particle diameters were measured in the elab-ration of each PSD.
F4
437Microparticles
437
Thermograms of PVA were recorded on a DSC (Mettleroledo, DSC TC11, USA) using Mettler STARe system. The
emperature axis and cell constant of DSC were previously cali-rated with indium standard materials (melting point 156.6 ◦C).
heating rate of 10 ◦C/min was employed over a tempera-ure range of 25–250 ◦C with nitrogen purging (50 mL/min).VA powder sample (5 ± 0.5 mg) was accurately weighed inton aluminum pan and an empty aluminum pan was used as aeference.
. Experiments
.1. SAS experiments
In Table 1 SAS experiments performed in the stainless steelrecipitator are reported, together with the obtained morpholo-ies. In all these experiments the 60 �m diameter injector haseen used.
In the range from 150 to 200 bar and 35–40 ◦C, partly coa-escing nanoparticles have been obtained. An example of this
orphology is reported in Fig. 1, where a SEM image of the
ig. 1. SEM image of PVA particles precipitated from DMSO by SAS at 150 bar,0 ◦C, XCO2 = 0.98, 1 wt% (test 1.1).
R. Adami et al. / J. of Supercritical Fluids 42 (2007) 288–298 291
F6
tdasi
bI2
s(at
F4p
p5
stoaptt
TP
T
222222
222
222
222
2222
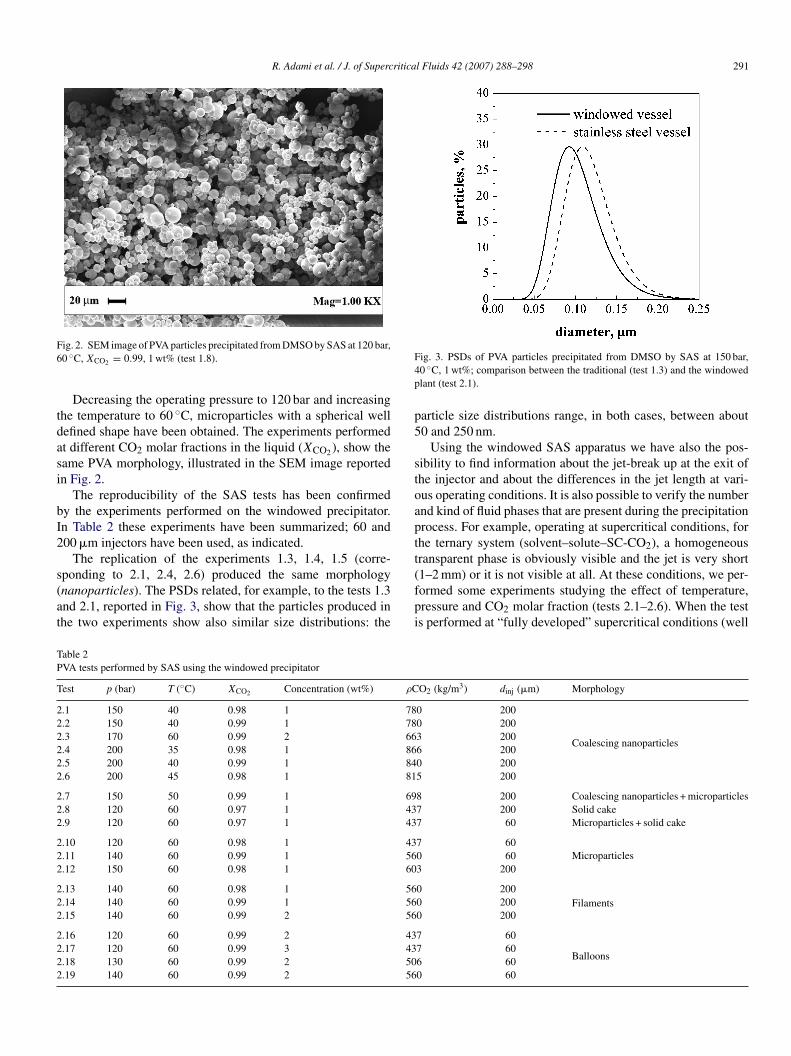
ig. 2. SEM image of PVA particles precipitated from DMSO by SAS at 120 bar,0 ◦C, XCO2 = 0.99, 1 wt% (test 1.8).
Decreasing the operating pressure to 120 bar and increasinghe temperature to 60 ◦C, microparticles with a spherical wellefined shape have been obtained. The experiments performedt different CO2 molar fractions in the liquid (XCO2 ), show theame PVA morphology, illustrated in the SEM image reportedn Fig. 2.
The reproducibility of the SAS tests has been confirmedy the experiments performed on the windowed precipitator.n Table 2 these experiments have been summarized; 60 and00 �m injectors have been used, as indicated.
The replication of the experiments 1.3, 1.4, 1.5 (corre-
ponding to 2.1, 2.4, 2.6) produced the same morphologynanoparticles). The PSDs related, for example, to the tests 1.3nd 2.1, reported in Fig. 3, show that the particles produced inhe two experiments show also similar size distributions: the(fpi
able 2VA tests performed by SAS using the windowed precipitator
est p (bar) T (◦C) XCO2 Concentration (wt%) ρC
.1 150 40 0.98 1 78
.2 150 40 0.99 1 78
.3 170 60 0.99 2 66
.4 200 35 0.98 1 86
.5 200 40 0.99 1 84
.6 200 45 0.98 1 81
.7 150 50 0.99 1 69
.8 120 60 0.97 1 43
.9 120 60 0.97 1 43
.10 120 60 0.98 1 43
.11 140 60 0.99 1 56
.12 150 60 0.98 1 60
.13 140 60 0.98 1 56
.14 140 60 0.99 1 56
.15 140 60 0.99 2 56
.16 120 60 0.99 2 43
.17 120 60 0.99 3 43
.18 130 60 0.99 2 50
.19 140 60 0.99 2 56
ig. 3. PSDs of PVA particles precipitated from DMSO by SAS at 150 bar,0 ◦C, 1 wt%; comparison between the traditional (test 1.3) and the windowedlant (test 2.1).
article size distributions range, in both cases, between about0 and 250 nm.
Using the windowed SAS apparatus we have also the pos-ibility to find information about the jet-break up at the exit ofhe injector and about the differences in the jet length at vari-us operating conditions. It is also possible to verify the numbernd kind of fluid phases that are present during the precipitationrocess. For example, operating at supercritical conditions, forhe ternary system (solvent–solute–SC-CO2), a homogeneousransparent phase is obviously visible and the jet is very short
1–2 mm) or it is not visible at all. At these conditions, we per-ormed some experiments studying the effect of temperature,ressure and CO2 molar fraction (tests 2.1–2.6). When the tests performed at “fully developed” supercritical conditions (wellO2 (kg/m3) dinj (�m) Morphology
0 200
Coalescing nanoparticles
0 2003 2006 2000 2005 200
8 200 Coalescing nanoparticles + microparticles7 200 Solid cake7 60 Microparticles + solid cake
7 60Microparticles0 60
3 200
0 200Filaments0 200
0 200
7 60
Balloons7 606 600 60
292 R. Adami et al. / J. of Supercritical Fluids 42 (2007) 288–298
F1
asaMlvfp
mttFt1pt
2tvtfl(tmt2p
X
2ta6w2
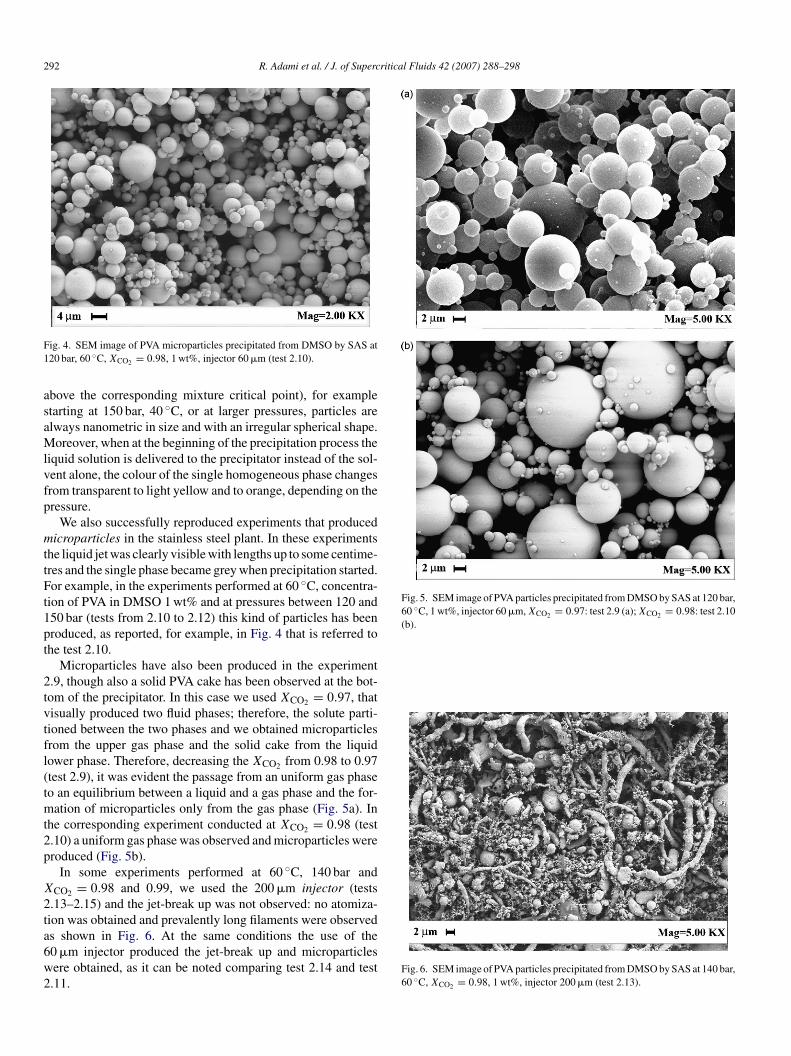
Fig. 5. SEM image of PVA particles precipitated from DMSO by SAS at 120 bar,60 ◦C, 1 wt%, injector 60 �m, XCO2 = 0.97: test 2.9 (a); XCO2 = 0.98: test 2.10(b).
ig. 4. SEM image of PVA microparticles precipitated from DMSO by SAS at20 bar, 60 ◦C, XCO2 = 0.98, 1 wt%, injector 60 �m (test 2.10).
bove the corresponding mixture critical point), for exampletarting at 150 bar, 40 ◦C, or at larger pressures, particles arelways nanometric in size and with an irregular spherical shape.oreover, when at the beginning of the precipitation process the
iquid solution is delivered to the precipitator instead of the sol-ent alone, the colour of the single homogeneous phase changesrom transparent to light yellow and to orange, depending on theressure.
We also successfully reproduced experiments that producedicroparticles in the stainless steel plant. In these experiments
he liquid jet was clearly visible with lengths up to some centime-res and the single phase became grey when precipitation started.or example, in the experiments performed at 60 ◦C, concentra-
ion of PVA in DMSO 1 wt% and at pressures between 120 and50 bar (tests from 2.10 to 2.12) this kind of particles has beenroduced, as reported, for example, in Fig. 4 that is referred tohe test 2.10.
Microparticles have also been produced in the experiment.9, though also a solid PVA cake has been observed at the bot-om of the precipitator. In this case we used XCO2 = 0.97, thatisually produced two fluid phases; therefore, the solute parti-ioned between the two phases and we obtained microparticlesrom the upper gas phase and the solid cake from the liquidower phase. Therefore, decreasing the XCO2 from 0.98 to 0.97test 2.9), it was evident the passage from an uniform gas phaseo an equilibrium between a liquid and a gas phase and the for-ation of microparticles only from the gas phase (Fig. 5a). In
he corresponding experiment conducted at XCO2 = 0.98 (test.10) a uniform gas phase was observed and microparticles wereroduced (Fig. 5b).
In some experiments performed at 60 ◦C, 140 bar andCO2 = 0.98 and 0.99, we used the 200 �m injector (tests
.13–2.15) and the jet-break up was not observed: no atomiza-ion was obtained and prevalently long filaments were observed
s shown in Fig. 6. At the same conditions the use of the0 �m injector produced the jet-break up and microparticlesere obtained, as it can be noted comparing test 2.14 and test.11.Fig. 6. SEM image of PVA particles precipitated from DMSO by SAS at 140 bar,60 ◦C, XCO2 = 0.98, 1 wt%, injector 200 �m (test 2.13).

R. Adami et al. / J. of Supercritical Fluids 42 (2007) 288–298 293
F6
wopwVt2gttmgo
p(FTea
maTa
Fa1
at
3
pCaea3ep8w
mFs
Pd
TP
T
G
G
ig. 7. SEM image of PVA balloons precipitated from DMSO by SAS at 130 bar,0 ◦C, XCO2 = 0.99, 2 wt%, injector 60 �m (test 2.18).
In tests 2.8 and 2.9, when at the beginning of the experimente sent the pure solvent to the precipitator, we immediatelybserved the formation of a liquid phase at the bottom of therecipitator, separated from the upper gas phase by a meniscus:e were operating in the two phase region of the binary systemLE diagram, i.e. at subcritical conditions. During the injec-
ion of the solution, when we used the 200 �m injector (test.8), large droplets of liquid fall along the vessel through theas phase and the final product was a solid cake of PVA onhe bottom of the precipitation vessel; using the 60 �m injec-or (test 2.9) a jet at the outlet of the injector was formed and
icroparticles were obtained, by precipitation from the upperas phase; whereas, from the liquid phase a solid cake was againbtained.
In the tests 2.18 and 2.19 the grey colour of the gaseoushase became darker and we obtained expanded microparticlesballoons), i.e. larger micrometric hollow particles, as shown inig. 7, where the balloons obtained in the test 2.18 are reported.he same behaviour was observed in the test 2.16, in whichmpty crashed particles have been obtained and in the test 2.17t 3 wt% PVA concentration.
Systematic DSC analyses have been performed on the
icronized powders. In Fig. 8 examples of the thermograms rel-tive to different morphologies of the precipitates are reported.he first endothermic peak at low temperature is the humiditybsorbed by the material, that is slightly hygroscopic; the peak
pti
able 3VA tests performed by GAS
est P (bar) T (◦C) Concentration (wt%) tbatch (min) twash
AS in the stainless steel plant3.1 200 45 1 30 303.2 200 35 1 30 303.3 100 35 2 30 303.4 200 35 2 30 30
AS in the windowed plant3.5 200 45 1 30 453.6 200 35 1 30 60
ig. 8. DSC of the PVA micronized by SAS. Nanoparticles obtained at 200 barnd 40 ◦C (test 2.5), microparticles at 120 bar and 60 ◦C (test 2.10), balloons at40 bar and 60 ◦C (test 2.19).
t 180–190 ◦C represents the melting point of PVA, indicatinghat the polymer is semicrystalline.
.2. GAS experiments
All the GAS tests, in the stainless steel and the windowedlant, have been performed using the maximum flow rate of theO2 delivering pump during the pressurization step (5 dm3/h)nd a CO2 flow rate of 3.5 kg/h during the washing step. In all thexperiments 0.25 mL of liquid solution were loaded in the vesselnd the operating conditions were in the range 100–200 bar and5–45 ◦C. The depressurizing time has been constant in all thexperiments: 10 min from the operating pressure to atmosphericressure. The only difference is the volume of the precipitator:0 mL for the stainless steel precipitator and 375 mL for theindowed one. The experiments are summarized in Table 3.In all the experiments in the stainless steel plant, sub-
icrometric particles have been obtained. The SEM image inig. 9 shows that they are well separated and have a regularpherical shape.
Increasing the temperature from 35 to 45 ◦C the mode of theSD does not sensibly change (0.4 �m) and the range of particlesiameters slightly enlarges from 0.1–0.9 to 0.2–1.2 �m.
In the GAS experiments in the windowed vessel, during theressurization, the expected volumetric expansion of the solu-ion has been visually observed, due to the dissolution of CO2n the liquid solution. In this plant the particles are larger than
ing (min) �P/�tpress (bar/min) Morphology
180
Microparticles + sub-microparticles200145200
65Microparticles + sub-microparticles
95

294 R. Adami et al. / J. of Supercritica
Fig. 9. SEM image of PVA particles precipitated from DMSO by GAS usingthe stainless steel vessel at 100 bar, 35 ◦C, 2 wt% (test 3.3).
Fig. 10. SEM image of PVA particles precipitated from DMSO by GAS at1 wt%, 200 bar, 45 ◦C using the windowed vessel (test 3.5).
Fig. 11. PSDs of PVA particles precipitated from DMSO by GAS at 1 wt%,200 bar, 45 ◦C, in the windowed vessel (IV = 375 mL, test 3.5) and in the stainlesssteel vessel (IV = 80 mL, test 3.1).
tripw
4
io
npdcooph[atlaistsWaP
ofi
4
wcsitwtao(Ctv
bgia
l Fluids 42 (2007) 288–298
hose produced with the smaller vessel as shown in Fig. 10. PSDseported in Fig. 11 show that, at the same operating conditionsn the stainless steel vessel, submicrometric particles have beenroduced; whereas, using the windowed vessel, microparticlesith a broader distribution have been produced.
. Discussion of results
GAS micronization has been successful, but different resultsn terms of particles size have been obtained in the reproductionf the experiments on the windowed vessel.
PVA has also been successfully micronized using SAS tech-ique and the results have also been reproduced on the windowedlant, demonstrating that the results of this process arrangemento not depend on the specific apparatus used. However, the pro-ess is very complex and, in particular, which is the influencef atomization, mass transfer, phase equilibria on the morphol-gy and size of the precipitates? Some attempts have beenerformed to take into account and modelling the influence ofydrodynamics, kinetics and thermodynamics on SAS process6–8,12,16,30,31], but limited information have been obtainedbout morphology and size of the powder produced. Limitinghe analysis to SAS hydrodynamic information that we have col-ected in this work, the observed differences in the jet formationnd length (Fig. 12) are indicative of the efficiency of the atom-zation process and of the related precipitation conditions. Atupercritical conditions the jet is very short or not detectable andhe liquid immediately dissolves in SC-CO2. At near-critical orubcritical gas conditions the jet becomes increasingly longer.
hen biphasic conditions are obtained, liquid droplets travellong the whole precipitator. If jet-break up is not successfulVA filaments are formed.
An explanation can also be found for the formation of thebserved morphologies: nanoparticles, microparticles, balloons,laments.
.1. Nanoparticles (SAS)
The experiments showed that PVA nanoparticles are formedhen the fluid phase contained in the precipitator is at super-
ritical conditions well above the mixture critical point of theystem. The colour of the fluid phase during the precipitations another confirmation of this observation; indeed, the colourransition from transparent to orange, that has been observedhen the precipitation starts, is related to the sudden change of
he refractive index that is characteristic of the passage throughcritical point. Moreover, the intensity of the colour, depends
n how close the conditions are to the mixture critical pointMCP). The same phenomenon can be observed also for pureO2 [32]. We observed the same behaviour for the binary sys-
em DMSO-CO2, when we performed some experiments with aariable volume cell [33].
Since no droplets are formed at these conditions, a possi-
le mechanism for particles generation is the nucleation androwth from the gaseous phase. The formation of a gas plumenstead of liquid droplets has also been observed by variousuthors [8,16,17]. This hypothesis is in accordance with the
R. Adami et al. / J. of Supercritical Fluids 42 (2007) 288–298 295
F bsencl
sisndg
4
osttwot
Ittsttbtdtaurca
apsabfrbga
oIdaitimt
a2c1coo
ig. 12. Jet-break up at different conditions: (a) droplets of liquid solution in aong spray visible at subcritical conditions.
hape of nanoparticles that are irregularly spherical (see Fig. 1):n this process the shape is not influenced by the surface ten-ion that normally acts when droplets are formed. In the case ofanoparticles, the size of the injector does not influence the finalistribution of the particles, due to the fact that no droplets areenerated.
.2. Microparticles (SAS)
Perfectly spherical sub-micro- and microparticles have beenbtained by SAS in the region near the MCP of the processedystem. The powder precipitated again from a homogeneousransparent gas phase, but in this case during the precipitationhe fluid became dark. A liquid jet was visible near the injectorhen this kind of precipitation took place and the large quantityf particles that move in the system is probably responsible ofhe obscuration of the fluid phase.
In this case the atomization step plays an important role.ndeed, the particles are produced by droplets formation andhe subsequent elimination of the solvent due to the fast massransfer of CO2 in the liquid. The resulting particles are perfectlypherical (see Figs. 2, 4 and 5), since this shape is imposed tohe droplets by the action of the surface tension, and it is main-ained by the solid material that nucleates and grows within theoundaries of the original droplet. The diameter of the injec-or influences the distribution size of droplets and, thus, theiameter of the particles. If there is no jet-break up, such inhe case of the tests 2.13, 2.14, 2.15, droplets are not formednd long filaments are produced (Fig. 6). However, the jet-break
p can be also obtained using the larger injector, if CO2 flowate is increased, thus increasing the inertial forces. Indeed, theompetition between cohesive and inertial forces controls thetomization of the liquid jet.cola
e of atomization; (b) short spray merely visible at supercritical conditions; (c)
Microparticles can also be produced in the case of the oper-ting point located in the region in which a liquid and a gashase coexist immediately below the MCP. In this case theolute is partitioned between the two phases in relation to itsffinity with them. The precipitation of PVA was observed fromoth phases in the tests 1.6 and 2.9 and microparticles wereormed from the gas phase, whereas, a cake of material waseleased by the liquid phase. No differences in shape haveeen observed between the particles precipitated from homo-eneous phase and two-phases, gas side, conditions (see Fig. 5and b).
These experiments are also an example of how the presencef PVA influences the VLEs of the binary system DMSO/CO2.ndeed, if we consider the binary system at these operating con-itions, a homogenous gaseous subcritical region is expectednd, indeed, in the windowed vessel a uniform transparent phases observed when DMSO alone is pumped. When PVA is addedo the liquid solvent, the formation of two phases in the precip-tator is observed. The addition of the third component, thus,
odifies the vapour–liquid equilibria with respect to those ofhe binary system.
The influence of PVA concentration in the liquid solutionlso influences the VLE of the ternary system: experiments 1.8,.16 and 2.17 are identical (120 bar, 60 ◦C) except for the con-entration of PVA, that is 1, 2 and 3 wt%, respectively. In test.8 microparticles were observed; i.e., we worked at near criti-al conditions; whereas in the tests 2.16 and 2.17 balloons werebserved; i.e., we worked at subcritical gas conditions: the MCPf the ternary system moved to higher pressures when the third
omponent concentration was increased. Indeed, the presencef a non-volatile third component which has affinity with theiquid solvent, can decrease the affinity of CO2 with the liquid,s a consequence the two phase region is enlarged and the con-
2 ritica
dc
4
dutso
ptPbmsbfptppIp3oipnoitt
tse
(tcoti
Fotot
4
c
swod
[imv
4
ptmAddodifimDs
iof
sippnfitsPhrtm
ts
5
96 R. Adami et al. / J. of Superc
itions at which the mixture CO2–solvent–solute is supercriticalan be obtained at higher pressures.
.3. Microparticles (GAS)
In this case, the mechanism of microparticles formation isifferent. First of all, there is no atomization; instead, SC-CO2niformly disperses into the liquid solution already present inhe precipitation vessel and the system is subjected to the pres-urization process due to the pumping of CO2 in the system. Inther words, a CO2 expanded, liquid solution is formed.
The pressurization corresponds to a pathway of the operatingoint that starts from atmospheric pressure and CO2 concen-ration increases with pressure. Therefore, the precipitation ofVA is obtained by supersaturation of the expanded liquid. It cane described as the formation of a disperse phase rich in poly-er, in an expanded liquid continuous phase. The mechanism is
imilar to the one sometimes observed during polymeric mem-ranes formation [34–36] and has also been proposed [10,11]or the semi-continuous Supercritical AntiSolvent process. Anyrocess parameter that changes the degree of supersaturation inhe solution can influence the nucleation and growth rate and thearticles characteristics. The consequence is the formation of aowder with a PSD as uniform as faster is the diffusion process.n the case of the GAS performed in the 80 mL vessel, smallerarticles have been obtained and with a very narrow PSD; in the75 mL vessel, larger particles with a broader PSD have beenbtained (Fig. 11). The particles in this case are spherical asn the SAS precipitation of microparticles, since the dispersehase is organized in droplets. The size is affected by the timeeeded to reach the operating conditions, equivalent to the ratef expansion of the solution. To confirm this observation, if wencrease the CO2 addition rate in the larger vessel, we can obtainhe same pressurization rate produced in the smaller vessel andherefore the similar particles.
The formation of particles with a narrow PSD, is related tohe absence of the typical droplets distribution obtained in apray and to the stability of the growth environment during thexpansion.
Particles have been obtained only at low concentrations1–2 wt%). When larger concentrations have been used, a con-inuous porous structure has been formed, since in this case aontinuous polymeric phase is formed, whereas, the discontinu-us phase is gaseous. The mechanism is similar to the one usedo produce polymeric membranes by supercritical CO2 phasenversion process [34–36].
As a confirmation of the differences between SAS and GAS,usaro et al. [37] calculated, using a mathematical model devel-ped by Lin et al. [38], that the largest characteristic massransfer time in the semi-continuous process is at least tworder of magnitude smaller than the smallest characteristic massransfer time in the batch process.
.4. Fibres (SAS)
We have visually observed that fibres are produced in thease of unsuccessful jet-break up, in the conditions in which the
Aeaf
l Fluids 42 (2007) 288–298
ystem is at near critical conditions. If there is not jet-break up,ires and fibres are formed, since a continuous liquid flux isbtained and the polymer has the possibility to grow along theirection of the liquid jet.
Our observations also agree with the results of Dixon et al.39] and Randolph et al. [24], which proposed that, at givennjection velocity, pressure and temperature, the transition from
icroparticles to microfibres occurs with an increase in solutioniscosity, or atomization time.
.5. Balloons (SAS)
Expanded hollow microparticles, called balloons, have beenroduced in the subcritical gaseous region by SAS. In this casehe liquid surface tension is maintained and produces the for-
ation of the droplets that expand during the diffusion of CO2.“droplet confined” liquid expanded solution is obtained. The
roplet expands until the solute reaches the saturation on theroplet surface and starts the precipitation. The remaining partf the solute in the bulk of the droplet moves towards the surfaceue to natural convective movements activated by CO2 diffusionn the droplet. At the end of the process all solid solute is con-ned near the dried surface of the expanded droplet. A similarechanism has been mathematically described by Werling andebenedetti [6] for a single liquid droplet formed only by the
olvent at subcritical conditions.It is interesting to note that during the precipitation the fluid
s grey also in this case, as observed in the case of formationf microparticles, but the colour is darker, maybe due to theormation of larger particles.
Though the precipitates show different size distributions andhape depending on the operating conditions, no modificationsn the crystalline form has been observed. The micronizationrocess modified the PVA morphology from irregular crystallinearticles, with a planar shape, to uniform spherical particles,evertheless, the crystalline form is substantially not modi-ed. Indeed, DSC traces show that the polymer remains of
he same degree of crystallinity after the precipitation, both inupercritical and subcritical conditions: untreated and processedVA show the endothermic peak at low temperature related theumidity absorbed by the material, and the peak at 180–190 ◦C,epresenting the melting point of PVA. The last peaks showhat the polymer maintain its semicrystalline structure after the
icronization process.An explanation of these results might be that the crystalliza-
ion time of the PVA in DMSO at the operating temperatures ismaller than the characteristic times of the SAS process.
. Conclusions
PVA has been successfully micronized using Supercritical
ntiSolvent technique in batch and semi-continuous mode. Thexperiments have been reproduced in a plant equipped withwindowed precipitation vessel. SAS results are independent
rom the plant used and the morphologies of the particles can be

ritica
rahicsf
llt
dwfimEsc
A
hfet
R
[
[
[
[
[
[
[
[
[
[
[
[
[
[
[
[
[
[
[
[
[
[
R. Adami et al. / J. of Superc
eproduced at the same operating conditions in different plants,s already demonstrated in previous works [12–14]. On the otherand, to reproduce the GAS results using different vessels it ismportant to reproduce the same pressurization rate. We con-lude that, though the principle of the two processes is theame, they cannot produce the same results, because the particleormation pathway is different.
The SAS process is more flexible and can be used to producearge quantity of product. The productivity of the GAS process isimited by the SC-CO2 flow and the pressurization rate necessaryo remove the amount of solvent loaded in the bulk.
The addition of visual evidences obtained using the win-owed vessel, directly indicates the region of the VLE diagram inhich the various morphologies have been generated and con-rms the complex interaction among atomization, VLEs andass transfer in the generation of the observed morphologies.xperimental evidences that the phase equilibria of the binaryystem DMSO-CO2 are modified by the addition of the thirdomponent (PVA) have been also produced.
cknowledgments
The authors gratefully acknowledge Dr. Daniela Rossi for theelp in performing the experiments and Dr. Carmine Rapuanoor his contribution to this research. Renata Adami acknowl-dges the MiUR (Italian Ministry of Scientific Research) andhe Academy of Finland for the financial support.
eferences
[1] E. Reverchon, Supercritical antisolvent precipitation of micro- and nano-particles, J. Supercrit. Fluids 15 (1999) 1.
[2] J. Jung, M. Perrut, Particle design using supercritical fluids: literature andpatent survey, J. Supercrit. Fluids 20 (2001) 179.
[3] A. Shariati, C.J. Peters, Recent developments in particle design using super-critical fluids, Curr. Opin. Solid St. M. 7 (2003) 371.
[4] S.-D. Yeo, E. Kiran, Formation of polymer particles with supercriticalfluids: a review, J. Supercrit. Fluids 34 (2005) 287.
[5] E. Reverchon, R. Adami, Nanomaterials and supercritical fluids, J. Super-crit. Fluids 37 (2006) 1.
[6] J.O. Werling, P.G. Debenedetti, Numerical modeling of mass transfer inthe supercritical antisolvent process, J. Supercrit. Fluids 16 (1999) 167.
[7] J.O. Werling, P.G. Debenedetti, Numerical modeling of mass transfer in thesupercritical antisolvent process: miscible conditions, J. Supercrit. Fluids18 (2000) 11.
[8] C.S. Lengsfeld, J.P. Delplanque, V.H. Barocas, T.W. Randolph, Mechanismgoverning microparticle morphology during precipitation by a compressedantisolvent: atomization vs. nucleation and growth, J. Phys. Chem. B 104(2000) 2725.
[9] N. Elvassore, M. Baggio, P. Pallado, A. Bertucco, Production of differentmorphologies of biocompatible polymeric materials by supercritical CO2
antisolvent techniques, Biotechnol. Bioeng. 73 (2001) 449.10] Y. Perez, F.E. Wubbolts, G.J. Witkamp, P.J. Jansens, Th.W. de Loos,
Improved PCA process for the production of nano- and microparticles ofpolymers, AIChE J. 50 (2004) 2408.
11] Y. Perez de Diego, H.C. Pellikaan, F.E. Wubbolts, G.J. Witkamp, P.J.Jansens, Operating regimes and mechanism of particle formation during
the precipitation of polymers using the PCA process, J. Supercrit. Fluids35 (2005) 147.12] E. Reverchon, G. Caputo, I. De Marco, Role of phase behavior and atom-ization in the supercritical antisolvent precipitation, Ind. Eng. Chem. Res.42 (2003) 6406.
[
[
l Fluids 42 (2007) 288–298 297
13] E. Reverchon, I. De Marco, Supercritical antisolvent micronization ofcefonicid: thermodynamic interpretation of results, J. Supercrit. Fluids 31(2004) 207.
14] E. Reverchon, I. De Marco, Supercritical antisolvent precipitation ofcephalosporins, Powder Technol. 164 (2006) 139.
15] S. Palakodaty, P. York, Phase behavioral effects on particle for-mation processes using supercritical fluids, Pharm. Res. 16 (1999)976.
16] M. Sarkari, I. Darrat, B.L. Knutson, Generation of microparticles usingCO2 and CO2-philic antisolvents, AIChE J. 46 (2000) 1850.
17] S.S. Dukhin, Y. Shen, R. Dave, R. Pfeffer, Droplet mass transfer,intradroplet nucleation and submicron particle production in two-phaseflow of solvent-supercritical antisolvent emulsion, Colloids Surf. A-Physicochem. Eng. Asp. 261 (2005) 163.
18] F. Fusaro, M. Mazzotti, G. Muhrer, Gas antisolvent recrystallization ofparacetamol from acetone using compressed carbon dioxide as antisolvent,Crystal Growth Des. 4 (2004) 881.
19] G. Muhrer, M. Mazzotti, Precipitation of lysozyme nanoparticles fromdimethyl sulfoxide using carbon dioxide as antisolvent, Biotechnol. Progr.19 (2003) 549.
20] G. Muhrer, M. Mazzotti, M. Muller, Gas antisolvent recrystallization ofan organic compound. Tailoring product PSD and scaling-up, J. Supercrit.Fluids 27 (2003) 195.
21] M. Mueller, U. Meier, A. Kessler, M. Mazzotti, Experimental study of theeffect of process parameters in the recrystallization of an organic compoundusing compressed carbon dioxide as antisolvent, Ind. Eng. Chem. Res. 39(2000) 2260.
22] B. Warwick, F. Dehghani, N.R. Foster, J.R. Biffin, H.L. Regtop, Microniza-tion of copper indomethacin using gas antisolvent processes, Ind. Eng.Chem. Res. 41 (2002) 1993.
23] G. Muhrer, U. Meier, F. Fusaro, S. Albano, M. Mazzotti, Use of compressedgas precipitation to enhance the dissolution behavior of a poorly water-soluble drug: generation of drug microparticles and drug-polymer soliddispersions, Int. J. Pharm. 308 (2006) 69.
24] T.W. Randolph, A.D. Randolph, M. Mebes, S. Yeung, Sub-micrometer-sized biodegradable particles of poly(l-lactic acid) via the gasantisolvent spray precipitation process, Biotechnol. Progr. 9 (1993)429.
25] S. Mawson, S. Kanakia, K.P. Johnston, Coaxial nozzle for control of particlemorphology in precipitation with a compressed fluid antisolvent, J. Appl.Polym. Sci. 64 (1997) 2105.
26] S. Mawson, K.P. Johnston, D.E. Betts, J.B. McClain, J.M. DeSimone,Stabilized polymer microparticles by precipitation with a compressedfluid antisolvent. 1. Poly(fluoro acrylates), Macromolecules 30 (1997)71.
27] E. Reverchon, G. Della Porta, I. De Rosa, P. Subra, D. Letourneur, Super-critical antisolvent micronization of some biopolymers, J. Supercrit. Fluids18 (2000) 239.
28] E. Reverchon, G. Della Porta, A. Di Trolio, S. Pace, Supercritical antisol-vent precipitation of nanoparticles of superconductor precursors, Ind. Eng.Chem. Res. 37 (1998) 952.
29] E. Reverchon, C. Celano, G. Della Porta, A. Di Trolio, S. Pace, Supercrit-ical antisolvent precipitation: a new technique for preparing submicronicyttrium powders to improve YBCO superconductors, J. Mater. Res. 13(1998) 284.
30] F. Chavez, P.G. Debenedetti, J.J. Luo, R.N. Dave, R. Pfeffer, Estimation ofthe characteristic time scales in the supercritical antisolvent process, Ind.Eng. Chem. Res. 42 (2003) 3156.
31] I. Kikic, M. Lora, A. Bertucco, A thermodynamic analysis of three-phaseequilibria in binary and ternary systems for applications in rapid expansionof a supercritical solution (RESS), particles from gas-saturated solutions(PGSS), and supercritical antisolvent (SAS), Ind. Eng. Chem. Res. 36(1997) 5507.
32] K.J. Laidler, J.H. Meiser, Physical Chemistry, Benjamin/Cummings, MenloPark, California, 1982.
33] S. Gentile, Thermodynamic analysis of supercritical antisolvent microniza-tion process using view cells, MSc Thesis, University of Salerno, Salerno,Italy, 2003.

2 ritica
[
[
[
[
98 R. Adami et al. / J. of Superc
34] E. Reverchon, S. Cardea, Formation of cellulose acetate membranesusing a supercritical fluid assisted process, J. Membr. Sci. 240 (2004)187.
35] E. Reverchon, S. Cardea, Formation of polysulfone membranes by super-critical CO2, J. Supercrit. Fluids 35 (2005) 140.
36] E. Reverchon, S. Cardea, PVDF-HFP membrane formation by supercriticalCO2 processing: elucidation of formation mechanisms, Ind. Eng. Chem.Res. 45 (2006) 8939.
[
[
l Fluids 42 (2007) 288–298
37] F. Fusaro, M. Haenchen, M. Mazzotti, G. Muhrer, B. Subramaniam, Densegas antisolvent precipitation: a comparative investigation of the gas andPCA techniques, Ind. Eng. Chem. Res. 44 (2005) 1502.
38] C. Lin, G. Muhrer, M. Mazzotti, B. Subramaniam, Vapor–liquid mass trans-fer during gas antisolvent recrystallization: modeling and experiments, Ind.Eng. Chem. Res. 42 (2003) 2171.
39] D.J. Dixon, K.P. Johnston, R.A. Bodmeier, Polymeric materials formed byprecipitation with a compressed fluid antisolvent, AIChE J. 39 (1993) 127.