Summary of Medipix Technology's 3-Years in Space…and ...
82
VCI-2016 – Medipix In Space Pinsky – Feb. 17, 2016 – Vienna 1 Summary of Medipix Technology’s 3-Years in Space…and Plans for Future Developments Lawrence Pinsky Physics Department University of Houston
-
Upload
khangminh22 -
Category
Documents
-
view
0 -
download
0
Transcript of Summary of Medipix Technology's 3-Years in Space…and ...

VCI-2016 – Medipix In Space Pinsky – Feb. 17, 2016 – Vienna
1
Summary of Medipix Technology’s 3-Years in Space…and
Plans for Future Developments Lawrence Pinsky
Physics Department University of Houston

VCI-2016 – Medipix In Space Pinsky – Feb. 17, 2016 – Vienna
The Full Author List…
A. Bahadori2,4, T. Campbell-Ricketts1, A. Empl1, R. Garza2,3, M. Kroupa2,3, R. Moore2, R. Rios2,3,
D. Fry2, E. J. Semones2, H. M. Son1, N. Stoffle2,3, D. Turecek1,6, S. A. Wheeler2, J. Jakubek5,6,
S. George1, Z. Vykydal5, S. Pospisil5 & L. S. Pinsky1
1 Physics Department, University of Houston, Houston, TX, USA
<[email protected]> 2 NASA Johnson Space Center, Houston, TX, USA 3 Lockheed-Martin Aerospace, Houston, TX, USA 4 Current address: Kansas State University, Manhattan, KS, USA 5 Institute for Experimental and Applied Physics, Czech Technical
University in Prague, Czech Republic 6 Current address: Advacam/Czech, Prague, Czech Republic.
2
VCI-2016 – Medipix In Space Pinsky – Feb. 17, 2016 – Vienna
3
All Medipix Devices are Hybrid Pixel Detectors
Detector and electronics readout are optimized separately !

VCI-2016 – Medipix In Space Pinsky – Feb. 17, 2016 – Vienna
4
Schematic Cross Section of a Hybrid Pixel Detector for
Penetrating Charged Particles

VCI-2016 – Medipix In Space Pinsky – Feb. 17, 2016 – Vienna
5
Charge Clusters
TimePix!
Incident!Particle!
The electron-hole pairs liberated by traversing charged particles drift in the bias voltage, and also diffuse laterally during the process, including effects from d-ray energies and Coulomb repulsion, creating a multi-pixel cluster.!
“PIXELMAN”!Image!

VCI-2016 – Medipix In Space Pinsky – Feb. 17, 2016 – Vienna
Medipix Genealogy
There are currently 3 “generations” of Medipix Collaborations, and a 4th is currently forming…
Medipix2 and Medipix3 have produced 2 distinct types of devices, Multi-Threshold Counting Chips, and Multi-Mode Encoding Chips. The latter chips are all called “Timepixes.”
This talk will focus on the TImepix class of chips.
All Timepix class chips can separately encode in each pixel the accumulated charge using the Time-Over-Threshold (TOT) and/or the time of arrival (TOA), as well as having counting modes.
6

VCI-2016 – Medipix In Space Pinsky – Feb. 17, 2016 – Vienna
Medipix 2 Timepix Architectures
The Medipix2 Collaboration’s Timepixes: The “Timepix” chip (~2007) IBM 250 nm technology
Frame-Based Readout Only Either 14-bit (pseudorandom) TOT or TOA (10 ns max resolution) or Hit
counts 1 Threshold (w/4-bit per pixel Equalization Offset) “Bias-Agnostic” FEE. 256 x 256 55 µm square pixels Wire-bond pad shelf on one edge
The “Timepix2” chip (~2017) TSMC 130 nm technology (Design in Progress…)
Close to “Plug-n-Play” control compatibility with Timepix… Frame-based Readout Only, but with re-designed FEE & zero suppression 1 Threshold (w/4-bit per pixel Equalization Offset) 256 x 256 55 µm square pixels Simultaneous TOT and TOA in each pixel w/1.6 ns time resolution. TSV capable or wire-bond pad shelf on one edge. TOT “Ghost” track suppression and post-frame-closing continuation. First-
hit only or “Summing ADC” Modes 7

VCI-2016 – Medipix In Space Pinsky – Feb. 17, 2016 – Vienna
800 MeV/A Si @ 85 degree Tracks (Data taken at HIMAC in Chiba, Japan
The tracks are from particles diving downward from left to right.
As they pass though the solder-bumps and into the underlying chip after leaving the Si detector layer.
Some of the high energy δ-rays from the chip enter the overlying detector layer…
8!

VCI-2016 – Medipix In Space Pinsky – Feb. 17, 2016 – Vienna
Medipix3 and Medipix4 TImepix Architectures
The Medipix3 Collaboration’s Timepix3: The Timepix3 chip (~2014) IBM 130nm DM 4-1 Technology
BOTH Continuous DATA-DRIVEN “SuperPixel” readout and Frame-Based Readout…
Simultaneous (10-bit) TOT and (14+4+… bit) TOA (~1.6 ns max resolution)
1 Threshold (w/4-bit per pixel Equalization Offset) 256 x 256 55 µm square pixels High-charge input “clamping” FEE. TSV capable or wire-bond pad shelf on one edge.
The (“Projected”) Forming Medipix4 Collaboration’s TImepix4 capabilities;
The TImepix4 chip (!2018-2020) TSMC 65 nm Technology Larger size and Smaller Pixels Both Data-Driven and Frame-based readouts >> 1 ns time resolution Fungible output registers w/zero suppression
9

VCI-2016 – Medipix In Space Pinsky – Feb. 17, 2016 – Vienna
Data-Driven Readout Works Very Well
10

VCI-2016 – Medipix In Space Pinsky – Feb. 17, 2016 – Vienna
Radiation Environment Monitor (“REM”) NASA ISS SDTO Flight Hardware!
11 Interfaces supplied by IEAP/CTU Prague!
All Space Applications To Date Use!Medipix2 Timepixes!

VCI-2016 – Medipix In Space Pinsky – Feb. 17, 2016 – Vienna
S/N 1007 On ISS since 2012
12
VCI-2016 – Medipix In Space Pinsky – Feb. 17, 2016 – Vienna
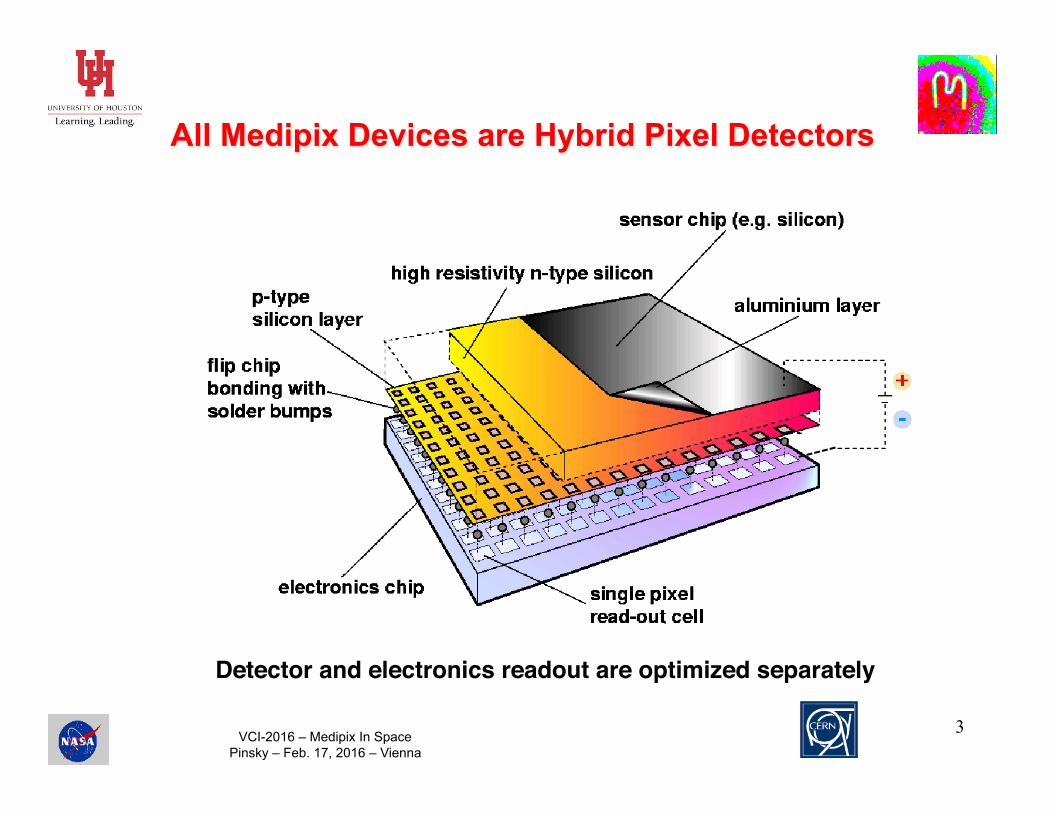
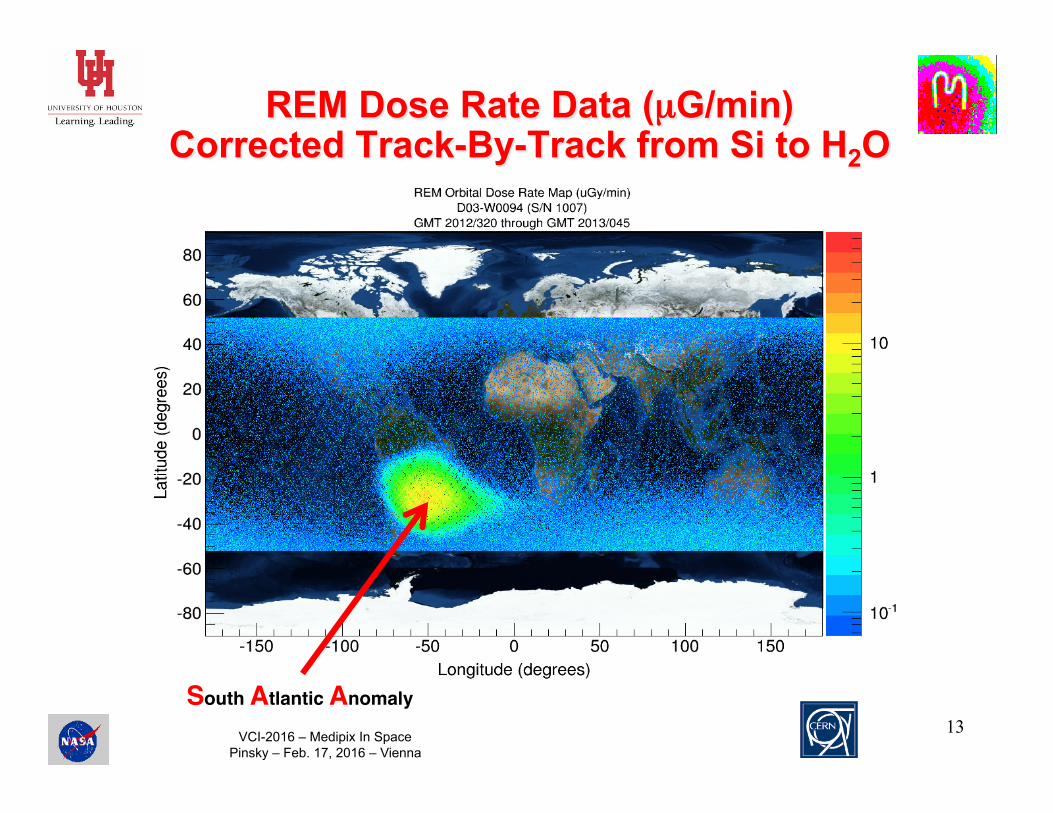
REM Dose Rate Data (µG/min) Corrected Track-By-Track from Si to H2O
13 South Atlantic Anomaly!

VCI-2016 – Medipix In Space Pinsky – Feb. 17, 2016 – Vienna
Trapped Radiation AND the South Atlantic Anomaly (SAA)
14

VCI-2016 – Medipix In Space Pinsky – Feb. 17, 2016 – Vienna
REM v. TEPC Dose Equivalent Rates
15
TEPC Tissue-Equivalent Proportional Counter!

VCI-2016 – Medipix In Space Pinsky – Feb. 17, 2016 – Vienna
16

VCI-2016 – Medipix In Space Pinsky – Feb. 17, 2016 – Vienna
17

VCI-2016 – Medipix In Space Pinsky – Feb. 17, 2016 – Vienna
18

VCI-2016 – Medipix In Space Pinsky – Feb. 17, 2016 – Vienna
EFT-1 Mission December 5, 2014
19
1.1.1 Exploration Flight Test 1
The EFT-1 mission was the first opportunity to fly a Timepix-based detec-tion system on the Orion MPCV. The Orion MPCV was launched from theKennedy Space Center (KSC) atop a Delta IV Heavy rocket on 5 December2014. The EFT-1 trajectory (shown in Figure 2) included two orbits: one lowaltitude orbit, and one highly eccentric orbit with an apogee of almost 6000km. Although the primary mission objectives were to test the thermal protec-tion system, hardware separation events, and the parachute system [17], theOrion MPCV passed through trapped electron regions and encountered intenseregions of the trapped proton belts as a result of this flight profile. Radiationmeasurements in these regions are key to understanding astronaut radiation ex-posure in the Orion MPCV during trapped proton belt transit and comparingthe trapped proton belt models with measurements.
Figure 2: EFT-1 Overview [18]
5

VCI-2016 – Medipix In Space Pinsky – Feb. 17, 2016 – Vienna
20
4 Hours & 36 Minutes Later!

VCI-2016 – Medipix In Space Pinsky – Feb. 17, 2016 – Vienna
“BIRD”
The Timepix device (BIRD—Battery-powered Independent Radiation Detector) on the Orion test flight (EFT-1) appears to be totally successful.
Both independent detectors onboard turned on as planned with the accelerometer switches…
AND… the data looks ~ to the simulations using AE9 & AP9 Model inputs…
21
Timepix!

VCI-2016 – Medipix In Space Pinsky – Feb. 17, 2016 – Vienna
BIRD inside EFT-1 Orion
22
During EFT-1, the BIRD operated as a stand-alone device. The measure-ments began after the BIRD accelerometer registered the required number ofsamples above a pre-defined acceleration value [19, 20]. The power was pro-vided by internal batteries, and data were stored on the BIRD SD cards.
2.1.3 Integration with Orion
The AES RadWorks REM Team was engaged with the NASA Orion Programand Lockheed Martin throughout the design, testing, installation, flight, and de-installation of BIRD. The BIRD was officially accepted, having met all leviedrequirements, by Lockheed Martin on October 21, 2013 [21]. Procedures andassociated NASA Task Performance Sheets (TPS) were delivered to LockheedMartin to ensure a smooth integration process.
The BIRD S/N 1001 and S/N 1002 units were delivered to KSC on Oc-tober 7, 2014. The pre-flight functional check-out at KSC was performed onBIRD S/N 1001 on November 26, 2014, at which time the BIRD was placedin sleep mode. The RAMs were installed on the BIRD and then the BIRD wasinstalled in the Orion MPCV on November 28, 2014, as shown in Figure 5. Forreference, a CAD image of the installation is shown in Figure 6.
Figure 5: Image of BIRD installation.
8

VCI-2016 – Medipix In Space Pinsky – Feb. 17, 2016 – Vienna
BIRD (Stand-Alone) Hardware
23
The two identical subsystems are separated by an aluminum partition andfunctioned similarly throughout the EFT-1 mission. Each instrument containsa battery assembly, a processor board, a power board and a Timepix carrierboard. The processor board consists of a digital signal processor, a SecureDigital (SD) memory card, an accelerometer, and other supporting electronicsrequired to receive and store the radiation data from the Timepix assembly. TheTimepix assembly is mounted permanently to the carrier board and connects tothe processor board through a small connector. The serial peripheral bus pro-vides primary communication between the signal processor and the Timepixassembly. The power board consists of a voltage boosting regulator and diodeprotection circuitry. The regulator receives the dynamic voltage input from thebattery assembly and converts it into a steady and stable power source for allthe other electronics. The carrier board is the interface to the Timepix. It hasa small rear mount connector that plugs into the processor board. This boardallows for easy installation and removal of the Timepix assemblies and servesas a test interface board, allowing for integration with a Fitpix (a previously-developed Timepix data acquisition system). Each instrument is equipped witha Military Specification (MIL spec) circular connector that can be used to inter-face with the outside world in order to perform system health and status checksbefore the flight. An exploded model of the device is shown in Figure 4.
Figure 4: BIRD schematics
7

VCI-2016 – Medipix In Space Pinsky – Feb. 17, 2016 – Vienna
Accelerometer Data
24 Figure 7: Acceleration as measured by BIRD
14
Launch!Delta-IV Heavy!
Upper Stage!Burns!
RCS!Maneuverings!
Reentry!
Parachutes!In the water (waves)!
Zero g!(Rotating)!

VCI-2016 – Medipix In Space Pinsky – Feb. 17, 2016 – Vienna
25
(a) Dose rate in water for the left detector.
(b) Dose rate in water for the right detector.
Figure 12: Dose rate in silicon and water (H2O) for each frame (dots) andcomputed using equation 3, where the sum is over a one minute period (solidline).
19
Dose!Rates!
(Si & H2O)!µGy/min!
Preliminary!

VCI-2016 – Medipix In Space Pinsky – Feb. 17, 2016 – Vienna
26
(a) Dose equivalent rate in water for the left detector.
(b) Dose equivalent rate in water for the right detector.
Figure 13: Dose equivalent rate for each frame (dots) and computed usingequation 3, where the sum is over a one minute period (solid line).
20
Dose!Equivalent!
Rates!µSv/min!
!(Based on!NCRP 132)!
Preliminary!
1 mSv/min!
16.6 Hours = 1 Sv!
Current Estimates suggest that corrections might cause reductions of ~5-10%!
VCI-2016 – Medipix In Space Pinsky – Feb. 17, 2016 – Vienna
27
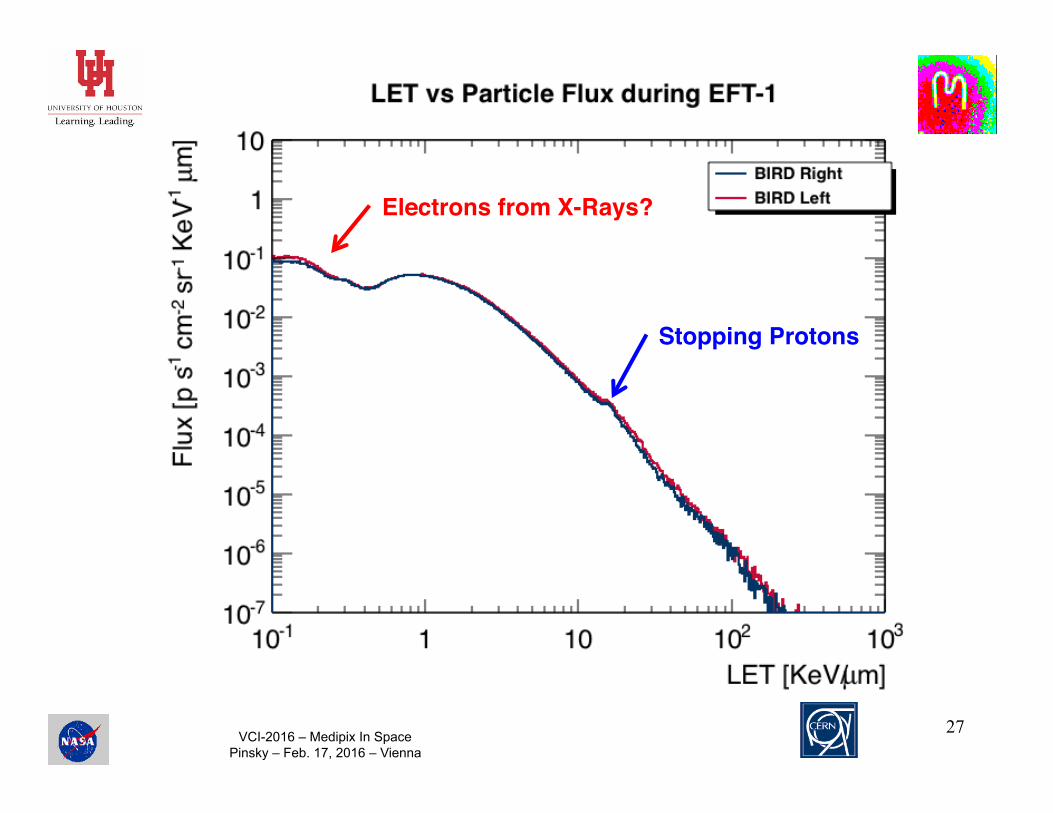
4.6 LET Spectra
Linear Energy Transfer (LET) spectra are generated for each BIRD subunitbased on calculation of individual ion energy deposition and track length throughthe detector. Because these calculations rely on the ability to separate individ-ual ion tracks, the results below exclude portions of the trajectory where thepixel occupancy exceeds 8 percent, corresponding to removal of frames with alarge number of overlapping tracks.
The results, shown in Figure 22 for both BIRD units for the full missionduration but excluding the high occupancy frames, display characteristics andoverall shapes consistent with one another, and similar to spectra generated byRadiation Environment Monitor units aboard ISS. This includes a small peakat approximately 14 keV/µm which corresponds to protons with energies lowenough to stop within the detector volume.
Figure 22: Number of particles as a function of LET.
29
Stopping Protons!
Electrons from X-Rays?!

VCI-2016 – Medipix In Space Pinsky – Feb. 17, 2016 – Vienna
Time Dependence in the Azimuthal
Distribution in the φ Direction During the
First Peak
28
(a) Azimuthal angle - f distributions as a function of time in the left detector.
(b) Azimuthal angle - f distributions during the first peak in dose for the leftdetector.
(c) Azimuthal angle - f distributions before the second peak in dose for theleft detector.
Figure 25: Azimuthal angle - f distributions during different periods of EFT-1for the left detector.
33
4.7.1 Directionality
The BIRD coordinate system is illustrated in Figure 23. The azimuthal angle -f and polar angle - q respectively correspond to the angle between the X andY axes (e.g. in the sensor plane) and Z and X axes (normal to the sensor plane).
Figure 23: BIRD coordinate system.
31
in the Left Detector !
VCI-2016 – Medipix In Space Pinsky – Feb. 17, 2016 – Vienna
29
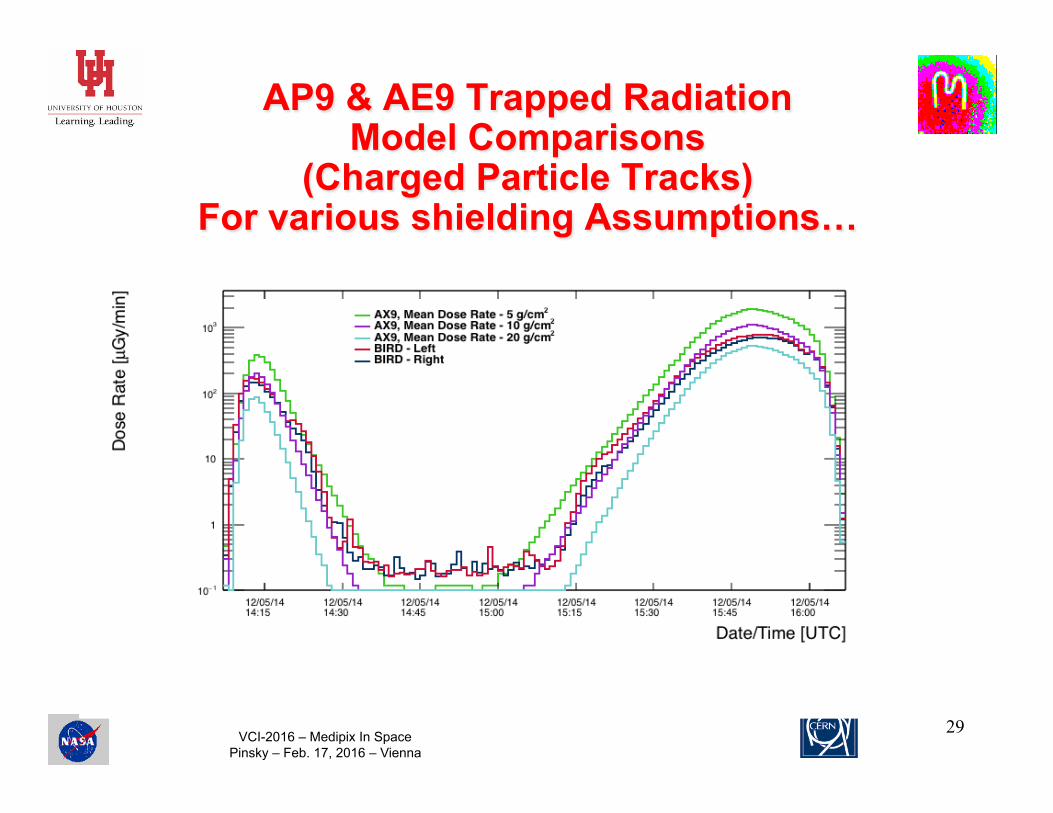
AP9 & AE9 Trapped Radiation Model Comparisons
(Charged Particle Tracks) For various shielding Assumptions…
4.2.3 Model Comparisons
The AP (energetic proton) and AE (energetic electron) models have been de-veloped to specify the radiation environment for modern spacecraft design ap-plications. The latest generations of these models - AP9 and AE9 - offer un-precedented coverage in particles and energies which address the major spaceenvironmental hazards and include uncertainties and dynamics that have neverbeen available for use in design [32]. Figure 14 shows data-model compar-isons between BIRD and AP9/AE9. Initial comparisons between BIRD dataand AP9/AE9 (AX9) show very good agreement for an estimated shieldingthickness of 10 g/cm2 of aluminum. In the future, we will use the as-flowntrajectory to account for Orion’s rotation along its flight path. We will alsoray trace the detector locations to fully characterize the surrounding vehicularshielding distribution. These modifications will lead to more informative dataanalyses and model comparisons.
Figure 14: BIRD dose rates and AX9 mean dose rates at varying thicknesses.
21

VCI-2016 – Medipix In Space Pinsky – Feb. 17, 2016 – Vienna
Photons From Electrons (Analysis From Martin Kroupa)
30
PRELIMINARY!

VCI-2016 – Medipix In Space Pinsky – Feb. 17, 2016 – Vienna
Photons v. Dose & AE Flux Analysis by Martin Kroupa
31
PRELIMINARY!
VCI-2016 – Medipix In Space Pinsky – Feb. 17, 2016 – Vienna
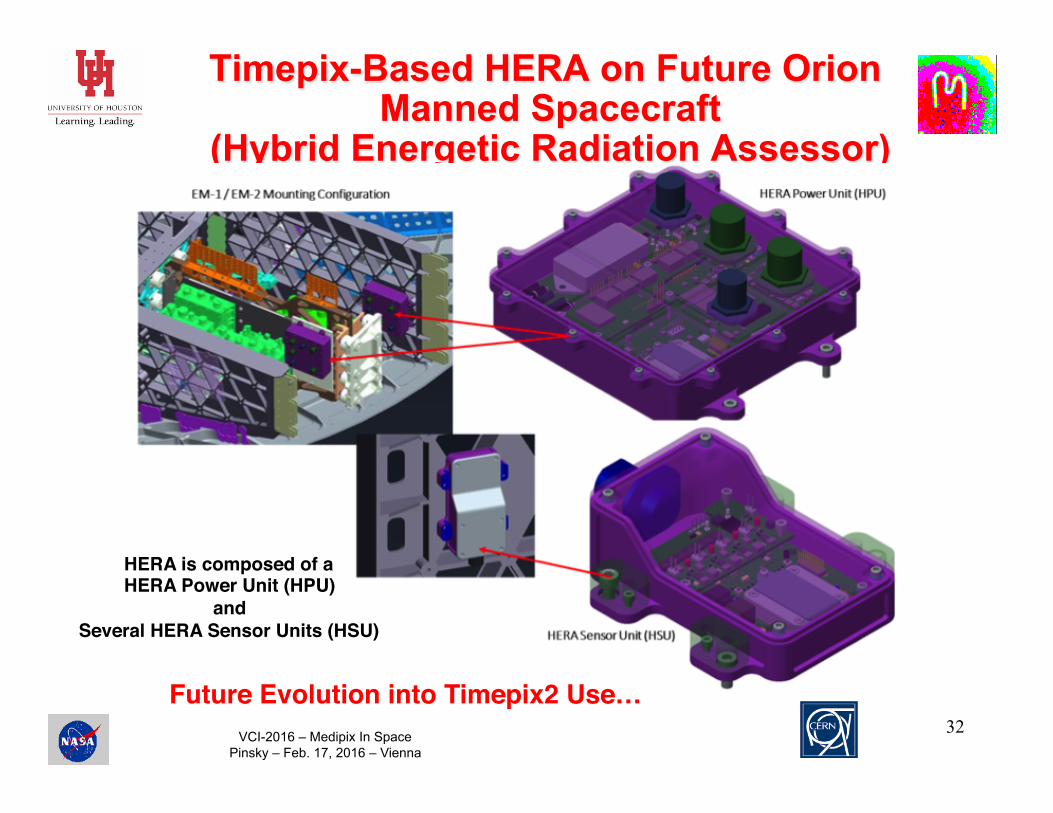
Timepix-Based HERA on Future Orion Manned Spacecraft
(Hybrid Energetic Radiation Assessor)
32
HERA is composed of a!HERA Power Unit (HPU)!
and!Several HERA Sensor Units (HSU)!
Future Evolution into Timepix2 Use…!

VCI-2016 – Medipix In Space Pinsky – Feb. 17, 2016 – Vienna
Some Issues and Observations
&
Recent Results
33
VCI-2016 – Medipix In Space Pinsky – Feb. 17, 2016 – Vienna
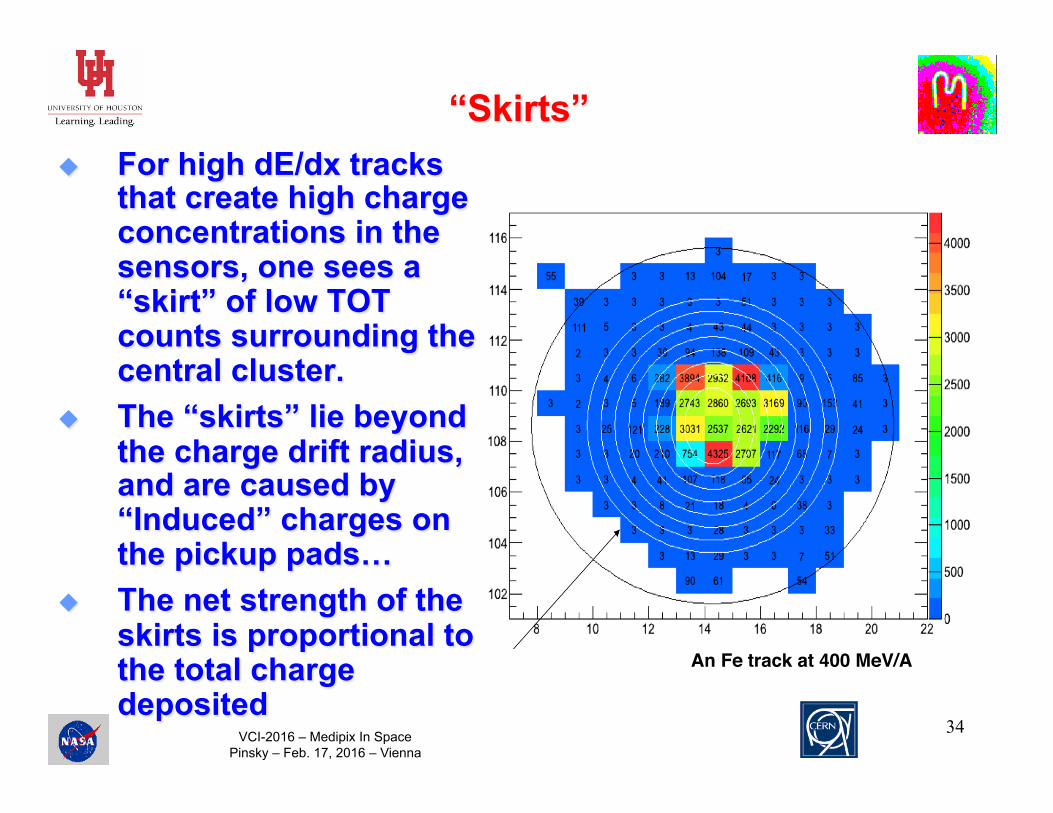
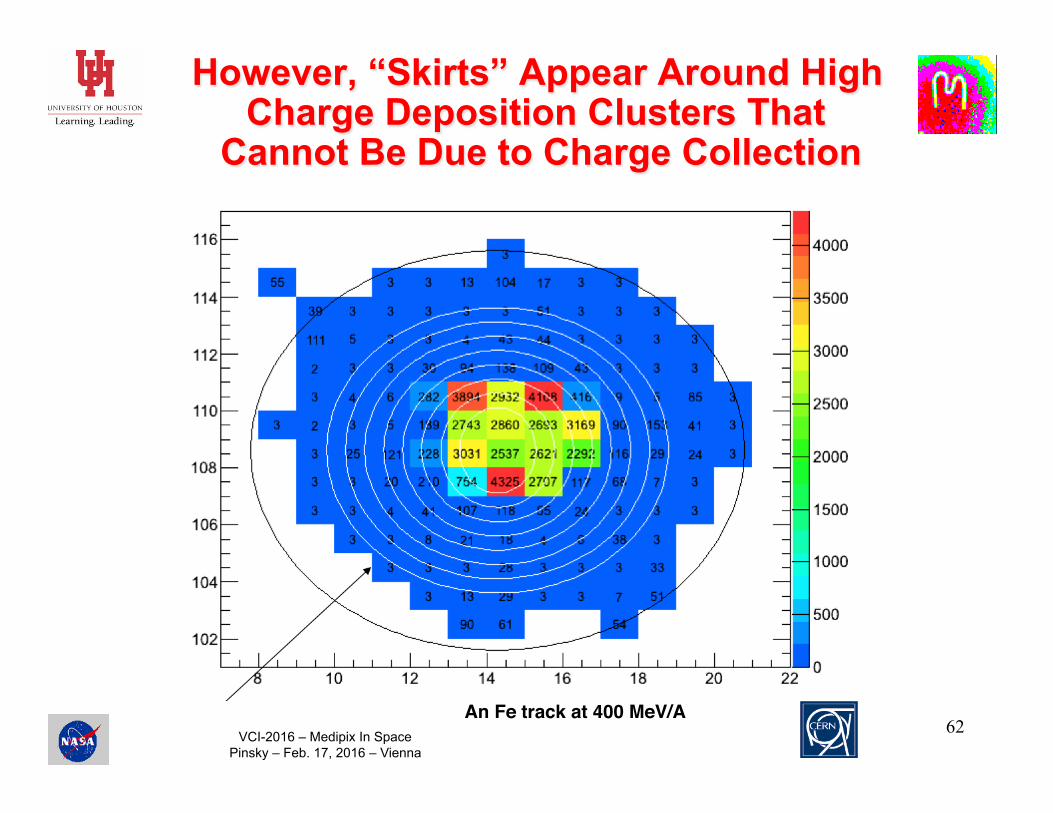
“Skirts” For high dE/dx tracks
that create high charge concentrations in the sensors, one sees a “skirt” of low TOT counts surrounding the central cluster.
The “skirts” lie beyond the charge drift radius, and are caused by “Induced” charges on the pickup pads…
The net strength of the skirts is proportional to the total charge deposited
34
An Fe track at 400 MeV/A!

VCI-2016 – Medipix In Space Pinsky – Feb. 17, 2016 – Vienna
The Origin of the “Skirt”
What the Front-End Electronics sees is NOT a current from the physical collection of the drifting charge in the sensor…
RATHER, it is an Induced Current in the Front-End that is due to the formation of the Image Charge in the conducting surface on the bottom edge of the Sensor…
In fact, the Image Charge can extend beyond the range of the drifting charges that are actually collected… Those pixels form the “Skirt” (Why are they are not “0”?)
35
+!-!
VCI-2016 – Medipix In Space Pinsky – Feb. 17, 2016 – Vienna
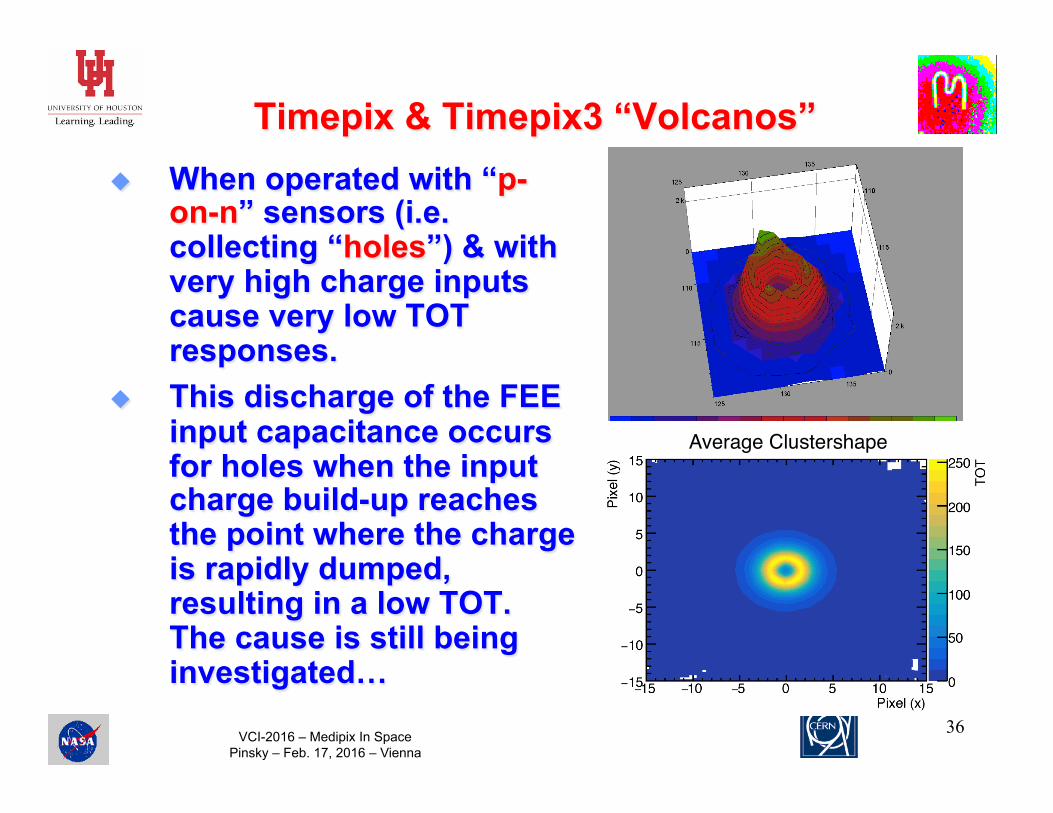
Timepix & Timepix3 “Volcanos” When operated with “p-
on-n” sensors (i.e. collecting “holes”) & with very high charge inputs cause very low TOT responses.
This discharge of the FEE input capacitance occurs for holes when the input charge build-up reaches the point where the charge is rapidly dumped, resulting in a low TOT. The cause is still being investigated…
36
B09-W005 (p on n) - IKrum 5, 0 DegreesAverage Clustershape x Projection Through y = 0
y Projection Through x = 0 x,y Projection (Log Scale)

VCI-2016 – Medipix In Space Pinsky – Feb. 17, 2016 – Vienna
Timepix3’s Input Charge v. TOT Design Plateau Response
37
Region 2
40
0 100 200 300 400 500 600 700 8000
0.1
0.2
0.3
0.4
0.5
0.6
0.7
0.8
0.9
1x 10⁻⁶
Qin (ke-)
ToT
(s)
1 2 3 4

VCI-2016 – Medipix In Space Pinsky – Feb. 17, 2016 – Vienna
Timepix3 P-on-N v. N-on-P
38
Collecting HOLES!
Collecting!ELECTRONS!

VCI-2016 – Medipix In Space Pinsky – Feb. 17, 2016 – Vienna
Overlaps – Timepix v. Timepix3
a
39
Timepix3 peak offset for comparison!

VCI-2016 – Medipix In Space Pinsky – Feb. 17, 2016 – Vienna
Up v. Down in the Timepix3
40
Track Enters top of the sensor…!
…and, Exits at the bottom of the sensor.!
Note: Direction of Motion along the track is not determined by TOA…!

VCI-2016 – Medipix In Space Pinsky – Feb. 17, 2016 – Vienna
TOT v. TOA in Timepix3
41
~210 MeV/A O ion…!
δ-ray!δ-rays are more easily seen in TOA!
δ-ray!
Statistically the co-moving δ-rays should predominate!(This is from a “downward” moving particle…) !

VCI-2016 – Medipix In Space Pinsky – Feb. 17, 2016 – Vienna
Timepix3 Data Rates
2 interfaces are currently available: FitPix3 (USB 2.0) Advacam/Czech
(Prague) Vertical proton tracks up to 2 x 105 cm2 s
with negligible losses (Tested up to 5 x 10⁵ /cm2 s.
SPYDR (10Gig E or Fiber) NIKHEF (Amsterdam)
Theoretically up to 8.1 x 10⁷ Pixels/s (Random hits)
42

VCI-2016 – Medipix In Space Pinsky – Feb. 17, 2016 – Vienna
Summary and Future Plans Since 2012 we have continuously flown Timepix
Based Detectors on the ISS, and will do so for the foreseeable future…
Single REM units will be used to evaluate the BEAM Inflatable module starting later this year…
New USB2.0 devises are being prepared for deployment. Timepix “Stacks” and “Cubes” are being designed for both
external and internal use…
Following on the BIRD project, NASA is designing the next generation Radiation Monitor for baseline use in Orion as part of the HERA project.
Initial HERA Flight hardware (w/4 Timepix sensors) will be delivered For the 2020 EM-1 trans-lunar mission in 2017.
Timepix2, Timepix3 and eventually Timepix4 are all slated to play crucial roles in NASA’s future active radiation monitoring for manned space flight…
43

VCI-2016 – Medipix In Space Pinsky – Feb. 17, 2016 – Vienna
44
Thank You for Your Attention

VCI-2016 – Medipix In Space Pinsky – Feb. 17, 2016 – Vienna
Timepix3 TOArt
45

VCI-2016 – Medipix In Space Pinsky – Feb. 17, 2016 – Vienna
Timepix3 TOArt
46

VCI-2016 – Medipix In Space Pinsky – Feb. 17, 2016 – Vienna
Direct Dose (Track-by-Track) Calculation Issues…
47
!
!
“Stopping Power” (dE/dx) of Human Tissue with respect to Silicon…!
Dose Equivalent = Dose x Quality Factor!(Dose = Energy Deposited per gm of tissue)!
NCRP 142!Quality Factors!

VCI-2016 – Medipix In Space Pinsky – Feb. 17, 2016 – Vienna
Frame Rate & Pixel Occupancy
48
4.2 Rates
4.2.1 Frame Occupancy and Rate
Figure 11 provides the frame occupancy and recorded frame rate per minute.Note that around 15:20 UTC, the frame rate rapidly increases and saturates ataround 180 frames/minute while the frame occupancy sextuples3. This demon-strates the instrument’s ability to accurately sample complex environments withmany particles. Here, occupancy is defined as the number of pixels with en-ergy deposition normalized by the number of pixels in the sensor. The largestoccupancy spike (c.f. Figure 11) occurs between 15:40 and 16:00 UTC andcontains a high number of overlapping particle tracks.
(a) Occupancy and frame rate for the left detector.
(b) Occupancy and frame rate for the right detector.
Figure 11: Frame occupancy and the number of recorded frames per minutefor BIRD during EFT-1
3The observed saturation is driven by the speed of the SD-card used to store data.
17
The Frame-Length Adjustment algorithm was set to allow a minimum frame duration of 100 ms. That value was too conservative. The effect is that the algorithm was unable to keep the pixel occupancy to < 5%.!The decrease in number of frames for the highest fluences is due to the increased dead-time processing the larger data buffers incurred.!!
Note that, a frame duration of 10 ms was possible, and would have fully accommodated the < 5% limit for the highest rates experienced.!
VCI-2016 – Medipix In Space Pinsky – Feb. 17, 2016 – Vienna
Left v. Right Dose Rate and Dose Equivalent Dose Rate Comprisons
49
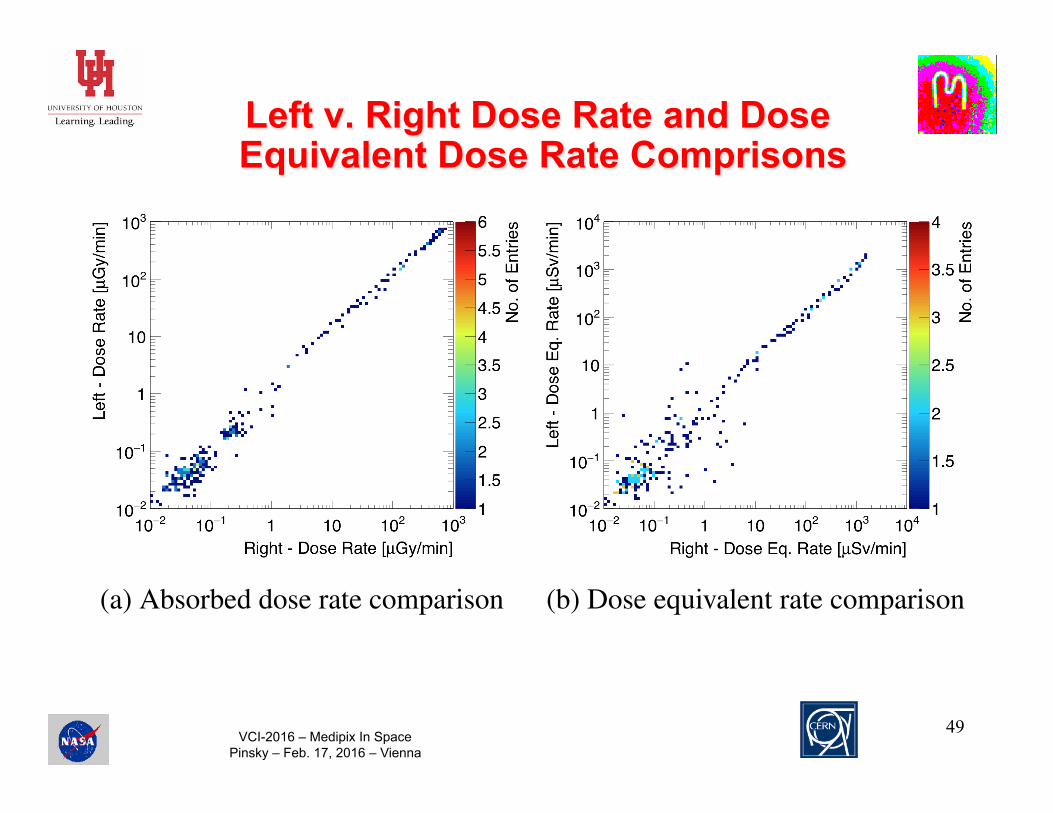
4.2.4 Dosimetry Comparisons in BIRD
Dosimetry rate comparisons between the left and right detectors of BIRD areshown in Figure 15. The agreement between the absorbed and equivalent dosesis nearly linear; some deviation is expected since each detector sees a slightlydifferent radiation environment. For example, one side may observe heavy ionsor interactions, while the other may not. This is also evident in Table 1, whichpresents the total dose accumulated by the BIRD and RAM instruments duringEFT-1.
(a) Absorbed dose rate comparison (b) Dose equivalent rate comparison
Figure 15: Absorbed dose rate and dose equivalent rate comparisons betweenthe Left and Right BIRD subunits
22

VCI-2016 – Medipix In Space Pinsky – Feb. 17, 2016 – Vienna
Cumulative Absorbed Dose
50
4.3 Accumulated Dose
Cumulative absorbed dose during EFT-1 is provided in Figure 16; the totals forthe mission are located in Table 1.
Figure 16: Cumulative absorbed dose (in water) for BIRD during EFT-1
4.3.1 Total Dose Comparisons
The total absorbed dose for EFT-1 as measured by BIRD subunits and the as-sociated RAMs are located in Table 1. The RAM absorbed doses representthe average for the individual TL/OSL dosimeters corresponding to each of thetwo RAM flight units, together with the standard error of the mean. The LeftRAM and Right RAM TL/OSL dosimeter individual absorbed dose values hadstandard deviations of 5% and 4%, respectively.
Table 1: Total absorbed dose for BIRD and RAMs aboard Orion MPCV andISS-TEPC during EFT-1 on December 5, 2014 between 12:07 and 16:30 UTC.
BIRD [mGy] RAM [mGy] ISS-TEPC [mGy]Left 17.9 15.1 ± 0.3 0.015Right 15.7 13.5 ± 0.2
23

VCI-2016 – Medipix In Space Pinsky – Feb. 17, 2016 – Vienna
Lest We Forget The GCR is Still there in the BIRD Data…
51
(a) Frame from the left detectorcorresponding to tag A in Figure27.
(b) Frame from the right detectorcorresponding to tag B in Figure27.
Figure 28: Example frames from the BIRD prior to the first increase in doserates.
(a) Frame from the left detectorcorresponding to tag C in Figure27.
(b) Frame from the left detectorcorresponding to tag D in Figure27.
(c) Frame from the left detectorcorresponding to tag E in Figure27.
Figure 29: Example frames from the left detector during the first increase indose rates.
36

VCI-2016 – Medipix In Space Pinsky – Feb. 17, 2016 – Vienna
Landau-Vavilov v. Timepix3 Energy Loss Distributions
52
“Grazing” Incidence (Thick Target)!Vertical Incidence (Thin Target)!
Expected “Thin Target” Deviation!

VCI-2016 – Medipix In Space Pinsky – Feb. 17, 2016 – Vienna
One SAA Pass, April 1st, 2014 Illustrating the Directionality of
the Trapped Radiation
Altitude (Deg)!
Azu
mith
(Deg
)!
Altitude (Deg)!
Azu
mith
(Deg
)!D
ose
Rat
e (u
Sv/h
r)!
Latit
ude!
Longitude (Deg)!
From Stuart George!

VCI-2016 – Medipix In Space Pinsky – Feb. 17, 2016 – Vienna
Altitude (Deg)!
Azu
mith
(Deg
)!
Altitude (Deg)!
Azu
mith
(Deg
)!D
ose
Rat
e (u
Sv/h
r)!
Latit
ude!
Longitude (Deg)!
From Stuart George!
One SAA Pass, April 1st, 2014 Illustrating the Directionality of
the Trapped Radiation

VCI-2016 – Medipix In Space Pinsky – Feb. 17, 2016 – Vienna
Altitude (Deg)!
Azu
mith
(Deg
)!
Altitude (Deg)!
Azu
mith
(Deg
)!D
ose
Rat
e (u
Sv/h
r)!
Latit
ude!
Longitude (Deg)!
From Stuart George!
One SAA Pass, April 1st, 2014 Illustrating the Directionality of
the Trapped Radiation

VCI-2016 – Medipix In Space Pinsky – Feb. 17, 2016 – Vienna
Altitude (Deg)!
Azu
mith
(Deg
)!
Altitude (Deg)!
Azu
mith
(Deg
)!D
ose
Rat
e (u
Sv/h
r)!
Latit
ude!
Longitude (Deg)!
From Stuart George!
One SAA Pass, April 1st, 2014 Illustrating the Directionality of
the Trapped Radiation

VCI-2016 – Medipix In Space Pinsky – Feb. 17, 2016 – Vienna
Altitude (Deg)!
Azu
mith
(Deg
)!
Altitude (Deg)!
Azu
mith
(Deg
)!D
ose
Rat
e (u
Sv/h
r)!
Latit
ude!
Longitude (Deg)!
From Stuart George!
One SAA Pass, April 1st, 2014 Illustrating the Directionality of
the Trapped Radiation

VCI-2016 – Medipix In Space Pinsky – Feb. 17, 2016 – Vienna
Altitude (Deg)!
Azu
mith
(Deg
)!
Altitude (Deg)!
Azu
mith
(Deg
)!D
ose
Rat
e (u
Sv/h
r)!
Latit
ude!
Longitude (Deg)!
From Stuart George!
One SAA Pass, April 1st, 2014 Illustrating the Directionality of
the Trapped Radiation

VCI-2016 – Medipix In Space Pinsky – Feb. 17, 2016 – Vienna
Altitude (Deg)!
Azu
mith
(Deg
)!
Altitude (Deg)!
Azu
mith
(Deg
)!D
ose
Rat
e (u
Sv/h
r)!
Latit
ude!
Longitude (Deg)!
From Stuart George!
One SAA Pass, April 1st, 2014 Illustrating the Directionality of
the Trapped Radiation

VCI-2016 – Medipix In Space Pinsky – Feb. 17, 2016 – Vienna
Altitude (Deg)!
Azu
mith
(Deg
)!
Altitude (Deg)!
Azu
mith
(Deg
)!D
ose
Rat
e (u
Sv/h
r)!
Latit
ude!
Longitude (Deg)!
From Stuart George!
One SAA Pass, April 1st, 2014 Illustrating the Directionality of
the Trapped Radiation

VCI-2016 – Medipix In Space Pinsky – Feb. 17, 2016 – Vienna
The SAA
61
VCI-2016 – Medipix In Space Pinsky – Feb. 17, 2016 – Vienna
However, “Skirts” Appear Around High Charge Deposition Clusters That
Cannot Be Due to Charge Collection
62 An Fe track at 400 MeV/A!

VCI-2016 – Medipix In Space Pinsky – Feb. 17, 2016 – Vienna
63
EFT-1 Dose-Rate (µG/min) Along the Trajectory!
Courtesy of Ryan Rios, NASA, JSC!Space Radiation Analysis Group!

VCI-2016 – Medipix In Space Pinsky – Feb. 17, 2016 – Vienna
64
Altitude!In Km!
(Log Scale)!
4.4 Altitude and Time Profiles
In this subsection, dosimetric quantities are presented as a function of altitudeand time. The highest observed dose rates did not occur at the peak altitude,but instead occurred before and just after the peak altitude. This observation isexplained by the changes in the spectral characteristics of the trapped radiationfield along the trajectory; while still within the trapped belt region, the spectrumwas comprised of lower-energy protons in the lower dose region between thetwo dose rate peaks.
(a) Absorbed dose rate as a function of altitude and time for the left detector of BIRD
(b) Absorbed dose rate as a function of altitude and time for the right detector of BIRD
Figure 17: Altitude as a function of time, weighted by the measured dose ratein EFT-1 trajectory.
24
10!
100!
1,000!
10,000!
10!
100!
1,000!
10,000!
Mission Elapsed Time!
Left!
Right!

VCI-2016 – Medipix In Space Pinsky – Feb. 17, 2016 – Vienna
65

VCI-2016 – Medipix In Space Pinsky – Feb. 17, 2016 – Vienna
66

VCI-2016 – Medipix In Space Pinsky – Feb. 17, 2016 – Vienna
Monte Carlo Simulation of the Detector Response
We cannot simulate actual frames at accelerators…
We need to validate our analysis codes on realistic simulations…
We need to separate the sensor effects from the electronic response characteristics of the detector chips…
See talk from Dec. 2014 FLUKA Collaboration Mtg.
We need to measure the light fragment cross sections for transport simulation…
We need to be able to simulate the shielding of the spacecraft in detail to select monitoring locations intelligently…
67

VCI-2016 – Medipix In Space Pinsky – Feb. 17, 2016 – Vienna
Initial FLUKA Results
Fe beam at normal incidence. Several Fe beam events per 'time frame' - X and Y
axis here give the pixel coordinate system.
68
DATA! FLUKA Simulation!
From Toni Empl!

VCI-2016 – Medipix In Space Pinsky – Feb. 17, 2016 – Vienna
Initial FLUKA Results
400 MeV/A Fe beam at 60 degree incidence Similar agreement is found for inclined Fe tracks
through the Timepix-3 sensor. The approach seems to work rather well given the
extremely naive ansatz. 69
DATA! FLUKA!Simulation!
From Toni Empl!

VCI-2016 – Medipix In Space Pinsky – Feb. 17, 2016 – Vienna
A Nuclear Interaction In A Solder-Bump From An Upward-Moving Primary
70
Interaction!Fragments!Seen in the!
ISS REM!

VCI-2016 – Medipix In Space Pinsky – Feb. 17, 2016 – Vienna
Cross Section Measurement Configurations
71
Tilted Quad!
Simple In Line!

VCI-2016 – Medipix In Space Pinsky – Feb. 17, 2016 – Vienna
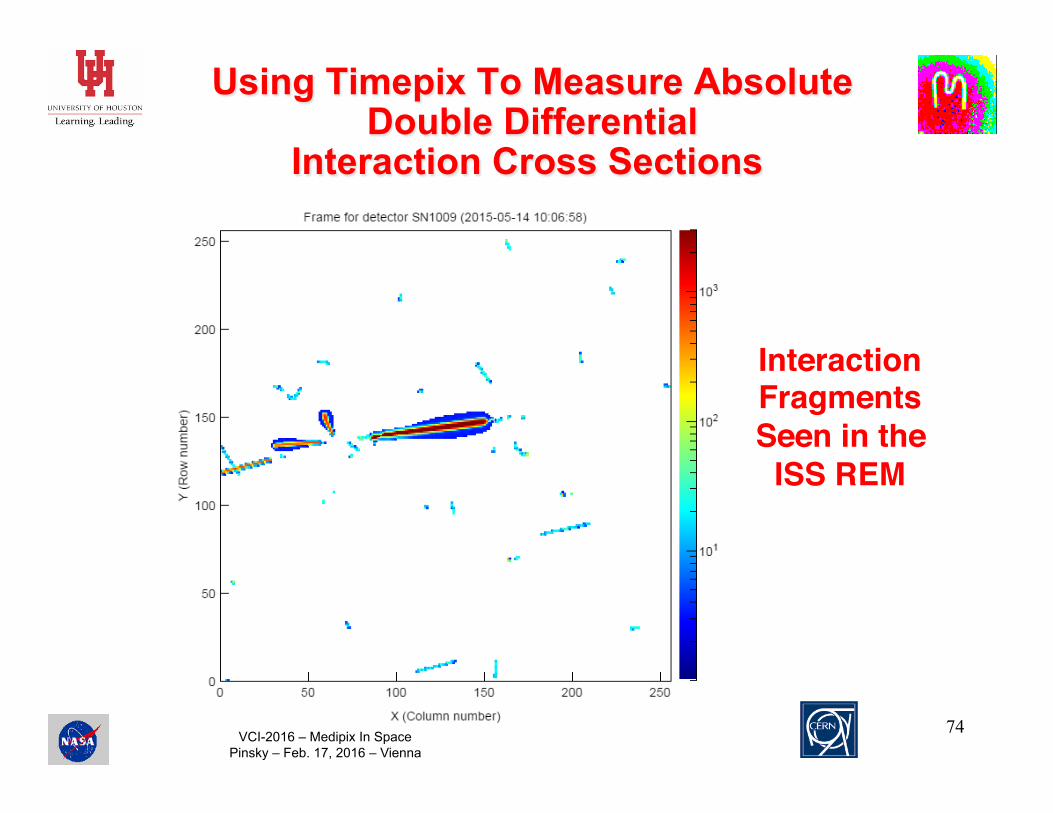
Double Differential Nuclear Interaction Cross Section
Measurements Place a thin target ~ 1 cm in front of a Timepix
centered on a small incident heavy ion beam spot. One would see all of the non-interacting beam
particles to determine the absolute incident flux. Using the angular information in the cluster images
caused by the fragments from interacting incident beam particles, one can estimate the vertex location.
From that, it is possible to determine the emitted angle of each fragment.
Since the “projectile” fragments typically have velocities close to that if the incident beam, one can determined the individual charges of each fragment…
72

VCI-2016 – Medipix In Space Pinsky – Feb. 17, 2016 – Vienna
https://dl.dropboxusercontent.com/u/46291346/SAA_20_4_2013.mp4!
From Stuart George!
VCI-2016 – Medipix In Space Pinsky – Feb. 17, 2016 – Vienna
Using Timepix To Measure Absolute Double Differential
Interaction Cross Sections
74
Interaction!Fragments!Seen in the!
ISS REM!
VCI-2016 – Medipix In Space Pinsky – Feb. 17, 2016 – Vienna
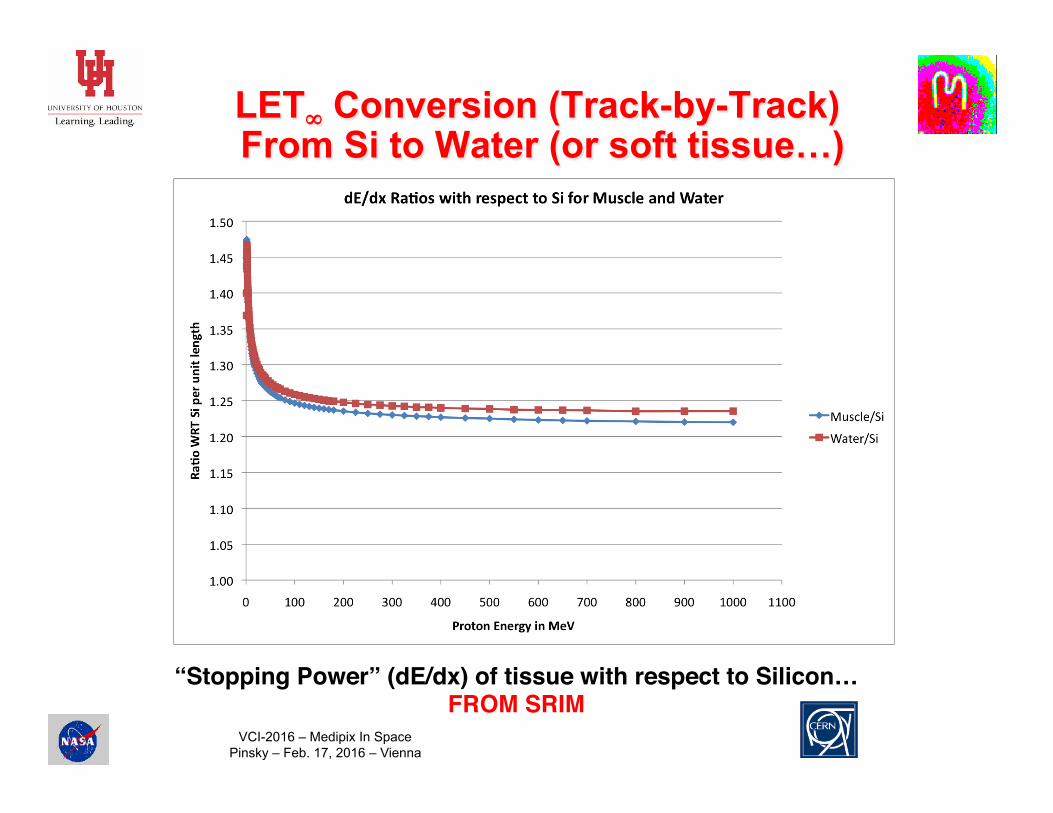
LET∞ Conversion (Track-by-Track) From Si to Water (or soft tissue…)
75
!“Stopping Power” (dE/dx) of tissue with respect to Silicon…!
FROM SRIM!

VCI-2016 – Medipix In Space Pinsky – Feb. 17, 2016 – Vienna
76
Solder Bumps – Close Up

VCI-2016 – Medipix In Space Pinsky – Feb. 17, 2016 – Vienna
77
Solder Bumps on Both the Chip and the Sensor…

VCI-2016 – Medipix In Space Pinsky – Feb. 17, 2016 – Vienna
TOT Calibration in the Timepix3
78
Seems to work OK!

VCI-2016 – Medipix In Space Pinsky – Feb. 17, 2016 – Vienna
79
Energy
TOT
Timepix and its TOT mode (A Wilkinson-Type ADC)
Input charge is discharged with a constant current source, giving rise to a triangular voltage pulse shape.
If the pulse shape is triangular then Time over Threshold is proportional to collected charge i.e. to energy.
Due to limited bandwidth the pulse can be NEVER perfectly triangular.
Non-linear TOT to energy dependence Threshold
Time
Ener
gy
Calibration curve
Counter in each pixel can be used as " Timer to measure detection time => TOF experiments, TPC detectors, … " Wilkinson type ADC to measure energy of each particle detected.
Time"

VCI-2016 – Medipix In Space Pinsky – Feb. 17, 2016 – Vienna
Another Image…
80 ~210 MeV/A O ion…!
TOT! TOA!
δ-ray!
…However, electrons scatter and can be produced at any point
along the track…!
…But they are still easier to see in TOA!

VCI-2016 – Medipix In Space Pinsky – Feb. 17, 2016 – Vienna
Lower Bias Voltage Elongated Clusters
a
81
230 MeV/u O with 40 V Bias Voltage w/ 500 um sensor…!The effect goes away at a 100 V Bias Voltage…!

VCI-2016 – Medipix In Space Pinsky – Feb. 17, 2016 – Vienna
EFT-1 Launch (As Seen by my iPad @ 10 km)
82 > 800,000 Kg at Launch!