Summary - UMOA-Titres
126
-
Upload
khangminh22 -
Category
Documents
-
view
1 -
download
0
Transcript of Summary - UMOA-Titres

Summary
2

SummaryACRONYMS...................................................................................................................................................................5
EXECUTIVE SUMMARY..................................................................................................................................................9
BRIEF OVERVIEW OF THE COUNTRY.............................................................................................................................10
1 GENERAL PRESENTATION OF THE COUNTRY..................................................................................................11
1.1 Political system 111.2 Administrative organisation 151.3 Geographical location 151.4 Population 161.5 Education 201.6 Health 241.7 Health data 261.8 Employment 301.9 Reminder of the main aggregates 33
2 RECENT ECONOMIC SITUATION AND OUTLOOK.............................................................................................36
2.1 Evaluation of gross domestic product 36
3 ANALYSIS OF THE NATIONAL DEVELOPMENT PLAN......................................................................................42
3.1 Recent Achievements and Accomplishments 423.2 Future projects 44
4 MONETARY SYSTEM AND FINANCIAL MARKETS...........................................................................................46
4.1 Structural elements 464.2 Banking system and �nancial markets 494.3 In�ation rate 574.4 Exchange rates 584.5 Foreign reserves 58
5 FOREIGN TRADE AND BALANCE OF PAIMENTS.............................................................................................60
5.1 Balance of paiments 605.2 Regional trade 625.3 International trade 675.4 Foreign Direct Investment 785.5 Regional integration 80
6 CREDIT QUALITY............................................................................................................................................83
6.1 Business Climate 836.2 Financial Governance 876.3 Financial ratings 88
7 GOVERNMENT FINANCES..............................................................................................................................90
7.1 Budget 907.2 Tax Policy 94
8 RISK FACTORS..............................................................................................................................................99
8.1 Political and security risks 998.2 Social risks 998.3 Macroeconomic risks 998.4 Risks relating the mobilisation of public and private �nancial resources 1008.5 Health Risks 1018.6 Environmental Risks 102
9 DEBT SITUATION.........................................................................................................................................103
9.1 General Description of the Public Debt 1039.2 Indebtedness Strategy and Debt Sustainability 1099.3 External Debt 1109.4 Domestic Debt 1159.5 Viability and Sustainability 118
10 APPENDICES...............................................................................................................................................120
11 GLOSSARY..................................................................................................................................................124
3

4
ACRONYMS...................................................................................................................................................................5
EXECUTIVE SUMMARY..................................................................................................................................................9
BRIEF OVERVIEW OF THE COUNTRY.............................................................................................................................10
1 GENERAL PRESENTATION OF THE COUNTRY..................................................................................................11
1.1 Political system 111.2 Administrative organisation 151.3 Geographical location 151.4 Population 161.5 Education 201.6 Health 241.7 Health data 261.8 Employment 301.9 Reminder of the main aggregates 33
2 RECENT ECONOMIC SITUATION AND OUTLOOK.............................................................................................36
2.1 Evaluation of gross domestic product 36
3 ANALYSIS OF THE NATIONAL DEVELOPMENT PLAN......................................................................................42
3.1 Recent Achievements and Accomplishments 423.2 Future projects 44
4 MONETARY SYSTEM AND FINANCIAL MARKETS...........................................................................................46
4.1 Structural elements 464.2 Banking system and �nancial markets 494.3 In�ation rate 574.4 Exchange rates 584.5 Foreign reserves 58
5 FOREIGN TRADE AND BALANCE OF PAIMENTS.............................................................................................60
5.1 Balance of paiments 605.2 Regional trade 625.3 International trade 675.4 Foreign Direct Investment 785.5 Regional integration 80
6 CREDIT QUALITY............................................................................................................................................83
6.1 Business Climate 836.2 Financial Governance 876.3 Financial ratings 88
7 GOVERNMENT FINANCES..............................................................................................................................90
7.1 Budget 907.2 Tax Policy 94
8 RISK FACTORS..............................................................................................................................................99
8.1 Political and security risks 998.2 Social risks 998.3 Macroeconomic risks 998.4 Risks relating the mobilisation of public and private �nancial resources 1008.5 Health Risks 1018.6 Environmental Risks 102
9 DEBT SITUATION.........................................................................................................................................103
9.1 General Description of the Public Debt 1039.2 Indebtedness Strategy and Debt Sustainability 1099.3 External Debt 1109.4 Domestic Debt 1159.5 Viability and Sustainability 118
10 APPENDICES...............................................................................................................................................120
11 GLOSSARY..................................................................................................................................................124

ACRONYMS
NFA
SIDE
NA
APRODAT
ARV
ASEA
APDS
ADB
BCEAO
UCS
ICP
BOAD
BRVM
HTC
SMU-MSCI
BCU
ECOWAS
EMCCA
CCPE
AFCF
BFC
NPDC
CNY
EDPP
ASD
DB
PDFB
DGESA
DGTPA
ADR
EUR
ADF
ECF
IFAD
IMF
HAPFACRO
FDI
HDI
HICP
IIAG
FMT
NISEDS
PITI
CIT
LMD
IMAF
PMDD
MCR
NTC
TIN
SDO
WTO
TRO
PADP
REP
GDP
PIP
SMEs
NHDP
PNDS
NAIFSP
PPP
HIPC
PNVT
ESP
NSPYE
TFP
GPHC
SAGEP
DFS
TLS
SPT
CET
SBT
VAT
WAEMU
WAMU
UAA
UFC
UNIR
USD
: Net foreign assets
: Support for the integration and development of Employment
: National assembly
: Agency for the promotion and development of
agropoles in Togo
: Anti rétro viral
: African Stock Exchanges Association
: Analysis of public debt sustainability
: African Development Bank
: Central Bank of West African States
: Undergraduate certi�cate of study
: Industrial and commercial pro�t
: West African Development Bank
: Regional Securities Exchange
: Higher technician certi�cate
: Support and monitoring unit for mutual or cooperative
savings and credit institutions
: Business Climate Unit
: Economic Community of West African States
: Economic and Monetary Community of Central Africa
: Certi�cate of completion of primary education
: African Financial Community Francs
: Business Formalities Center
: National Public Debt Committee
: CHINA Yuan
: Excise duties on petroleum products
: Annual salary declaration
: Doing business
: Public Debt and Financing Branch
: Directorate General of Economic Studies and Analysis
: Directorate General of the Treasury and Public Accounting
: Special drawing right
: Euro
: African Development Fund
: Extended credit facility
: International Fund for Agricultural Development
: International Monetary Fund
: High authority for the prevention and �ght against
corruption and related offences
: Foreign direct investment
: Human Development Index
: Harmonized Index of Consumer Prices
: Ibrahim Index of Governance in Africa
: Flat-rate minimum tax
: National Institute of Statistics, Economic and
Demographic Studies
: Personal income tax for individuals
: Corporate income tax
: Licence-master-doctorat
: Incentive mechanism for agricultural �nancing
: Patriotic Movement for Development and Democracy
: Movement of centrist republicans
: New Togolese commitment
: Tax Identi�cation Number
: Sustainable development goals
: World Trade Organisation
: Togolese Revenue Of�ce
: Pan-African Democratic Party
: Regional Economic Programme
: Gross Domestic Product
: Public Investment Programme
: Small and medium enterprises/industries
: National Health Development Plan
: National Health Development Plan
: National Agricultural Investment and Food
Security Programme
: Public Private Partnership
: Heavily indebted poor country
: Promotion of national volunteering in Togo
: Education Sector Plan
: National Strategic Plan for Youth Employment
: Technical and �nancial partners
: General population and habitat census
: Strategy for accelerated growth and employment promotion
: Decentralized �nancial system
: Trade liberalization scheme
: Supplementary protection tax
: Common external rate
: Single business tax
: Value Added Tax
: West African Economic and Monetary Union
: West African Monetary Union
: Unit of Account ADF
: Union of forces for change
: Union for the Republic
: United States Dollars
5

6
NFA
SIDE
NA
APRODAT
ARV
ASEA
APDS
ADB
BCEAO
UCS
ICP
BOAD
BRVM
HTC
SMU-MSCI
BCU
ECOWAS
EMCCA
CCPE
AFCF
BFC
NPDC
CNY
EDPP
ASD
DB
PDFB
DGESA
DGTPA
ADR
EUR
ADF
ECF
IFAD
IMF
HAPFACRO
FDI
HDI
HICP
IIAG
FMT
NISEDS
PITI
CIT
LMD
IMAF
PMDD
MCR
NTC
TIN
SDO
WTO
TRO
PADP
REP
GDP
PIP
SMEs
NHDP
PNDS
NAIFSP
PPP
HIPC
PNVT
ESP
NSPYE
TFP
GPHC
SAGEP
DFS
TLS
SPT
CET
SBT
VAT
WAEMU
WAMU
UAA
UFC
UNIR
USD
: Net foreign assets
: Support for the integration and development of Employment
: National assembly
: Agency for the promotion and development of
agropoles in Togo
: Anti rétro viral
: African Stock Exchanges Association
: Analysis of public debt sustainability
: African Development Bank
: Central Bank of West African States
: Undergraduate certi�cate of study
: Industrial and commercial pro�t
: West African Development Bank
: Regional Securities Exchange
: Higher technician certi�cate
: Support and monitoring unit for mutual or cooperative
savings and credit institutions
: Business Climate Unit
: Economic Community of West African States
: Economic and Monetary Community of Central Africa
: Certi�cate of completion of primary education
: African Financial Community Francs
: Business Formalities Center
: National Public Debt Committee
: CHINA Yuan
: Excise duties on petroleum products
: Annual salary declaration
: Doing business
: Public Debt and Financing Branch
: Directorate General of Economic Studies and Analysis
: Directorate General of the Treasury and Public Accounting
: Special drawing right
: Euro
: African Development Fund
: Extended credit facility
: International Fund for Agricultural Development
: International Monetary Fund
: High authority for the prevention and �ght against
corruption and related offences
: Foreign direct investment
: Human Development Index
: Harmonized Index of Consumer Prices
: Ibrahim Index of Governance in Africa
: Flat-rate minimum tax
: National Institute of Statistics, Economic and
Demographic Studies
: Personal income tax for individuals
: Corporate income tax
: Licence-master-doctorat
: Incentive mechanism for agricultural �nancing
: Patriotic Movement for Development and Democracy
: Movement of centrist republicans
: New Togolese commitment
: Tax Identi�cation Number
: Sustainable development goals
: World Trade Organisation
: Togolese Revenue Of�ce
: Pan-African Democratic Party
: Regional Economic Programme
: Gross Domestic Product
: Public Investment Programme
: Small and medium enterprises/industries
: National Health Development Plan
: National Health Development Plan
: National Agricultural Investment and Food
Security Programme
: Public Private Partnership
: Heavily indebted poor country
: Promotion of national volunteering in Togo
: Education Sector Plan
: National Strategic Plan for Youth Employment
: Technical and �nancial partners
: General population and habitat census
: Strategy for accelerated growth and employment promotion
: Decentralized �nancial system
: Trade liberalization scheme
: Supplementary protection tax
: Common external rate
: Single business tax
: Value Added Tax
: West African Economic and Monetary Union
: West African Monetary Union
: Unit of Account ADF
: Union of forces for change
: Union for the Republic
: United States Dollars

7
NFA
SIDE
NA
APRODAT
ARV
ASEA
APDS
ADB
BCEAO
UCS
ICP
BOAD
BRVM
HTC
SMU-MSCI
BCU
ECOWAS
EMCCA
CCPE
AFCF
BFC
NPDC
CNY
EDPP
ASD
DB
PDFB
DGESA
DGTPA
ADR
EUR
ADF
ECF
IFAD
IMF
HAPFACRO
FDI
HDI
HICP
IIAG
FMT
NISEDS
PITI
CIT
LMD
IMAF
PMDD
MCR
NTC
TIN
SDO
WTO
TRO
PADP
REP
GDP
PIP
SMEs
NHDP
PNDS
NAIFSP
PPP
HIPC
PNVT
ESP
NSPYE
TFP
GPHC
SAGEP
DFS
TLS
SPT
CET
SBT
VAT
WAEMU
WAMU
UAA
UFC
UNIR
USD
: Net foreign assets
: Support for the integration and development of Employment
: National assembly
: Agency for the promotion and development of
agropoles in Togo
: Anti rétro viral
: African Stock Exchanges Association
: Analysis of public debt sustainability
: African Development Bank
: Central Bank of West African States
: Undergraduate certi�cate of study
: Industrial and commercial pro�t
: West African Development Bank
: Regional Securities Exchange
: Higher technician certi�cate
: Support and monitoring unit for mutual or cooperative
savings and credit institutions
: Business Climate Unit
: Economic Community of West African States
: Economic and Monetary Community of Central Africa
: Certi�cate of completion of primary education
: African Financial Community Francs
: Business Formalities Center
: National Public Debt Committee
: CHINA Yuan
: Excise duties on petroleum products
: Annual salary declaration
: Doing business
: Public Debt and Financing Branch
: Directorate General of Economic Studies and Analysis
: Directorate General of the Treasury and Public Accounting
: Special drawing right
: Euro
: African Development Fund
: Extended credit facility
: International Fund for Agricultural Development
: International Monetary Fund
: High authority for the prevention and �ght against
corruption and related offences
: Foreign direct investment
: Human Development Index
: Harmonized Index of Consumer Prices
: Ibrahim Index of Governance in Africa
: Flat-rate minimum tax
: National Institute of Statistics, Economic and
Demographic Studies
: Personal income tax for individuals
: Corporate income tax
: Licence-master-doctorat
: Incentive mechanism for agricultural �nancing
: Patriotic Movement for Development and Democracy
: Movement of centrist republicans
: New Togolese commitment
: Tax Identi�cation Number
: Sustainable development goals
: World Trade Organisation
: Togolese Revenue Of�ce
: Pan-African Democratic Party
: Regional Economic Programme
: Gross Domestic Product
: Public Investment Programme
: Small and medium enterprises/industries
: National Health Development Plan
: National Health Development Plan
: National Agricultural Investment and Food
Security Programme
: Public Private Partnership
: Heavily indebted poor country
: Promotion of national volunteering in Togo
: Education Sector Plan
: National Strategic Plan for Youth Employment
: Technical and �nancial partners
: General population and habitat census
: Strategy for accelerated growth and employment promotion
: Decentralized �nancial system
: Trade liberalization scheme
: Supplementary protection tax
: Common external rate
: Single business tax
: Value Added Tax
: West African Economic and Monetary Union
: West African Monetary Union
: Unit of Account ADF
: Union of forces for change
: Union for the Republic
: United States Dollars

8
ISSUER CERTIFICATE

9
The Togolese economy has recorded an average increase in GDP per capita over the pe-
riod 2015-2019 of 5% supported by the Strategy for Accelerated Growth and Employment
Promotion (SAGEP), the implementation of the National Development Plan, the execution
of agricultural sector projects through the National Agricultural Investment and Food Secu-
rity Program (NAIFSP) and the execution of major construction and economic infrastructure
strengthening works. This growth was achieved in a non-inflationary environment marked
by the availability of local food products, particularly food crops, due to the cereal surpluses
recorded during the agricultural seasons.
In terms of government finances, revenue mobilisation in 2019 stood at 23.4% of GDP
against 21.8% in 2015. The execution of public expenditure was marked by prudent mana-
gement in connection with the implementation of the economic program with the Internatio-
nal Monetary Fund. Thus, public expenditure increased from 31% of GDP in 2016 to 25% of
GDP in 2019.
On the debt side, the debt-to-GDP ratio stood at 68.7% in 2019, below the EU threshold of
70%, thanks to the implementation of a prudent debt policy contained in the debt strategy.
During the year 2020, Togo, like all the economies of the world, is confronted with the Coro-
navirus pandemic. Togo registered its first case in March 2019 and 13.452 laboratory tests
have been carried out as of 18 May 2020, 330 cases of COVID-19 have been confirmed,
106 people have been cured and 212 cases remain active. There have also been 12 deaths.
Overall, the overall financing needs to deal with the pandemic are estimated at about CFA
Francs 70 billion (about $130 million, or 2% of GDP).
Due to the covid-19 crisis, the observed dynamism in economic growth is expected to slow
down in 2020, with an expected growth rate of 3% compared to 5.3% in 2019.
EXECUTIVE SUMMARY

Nominal GDP in 2019
3 199.1 billion ofCFAF(Source : BCEAO andnational services)
Economy based on agriculture,
Growth rate in 2019 : 5.3% of GDP
Debt ratio in 2019 : 68.7% of GDP
Inflation rate in 2019 : -0.7% of GDP
fishing, tourisme and services
Republic of
Capital
LoméPopulation in 2019
8 082 359 Area
56 785 km2
Currency
CFA Francs FrenchOfficial language
75%
50%
45%
30%
Political System
Presidentialand pluralist
Togo
September 2020 AUT - Information Note
BRIEF OVERVIEW OF THE COUNTRY
10

1 GENERAL PRESENTATION OF THE COUNTRY
1.1 Political system
Togo is a democratic and secular republic. It gained independence on 27 April 1960 and lives under the Fourth Republic. The fundamental law currently in force is the constitution of 19 May 2019. In Togo, the regime is presidential and pluralist.
French is the official language. There are a variety of national languages, including Ewe, Kabye, Kotokoli, Mina and Fulani.
1.1.1 Executif power
The President of the Republic is elected by universal, free, direct, equal and secret suffrage for a term of five (05) years renewable only once1. The President of the Republic remains in office until his elected successor takes office. He is be elected by an ab-solute majority of the votes cast. If this majority is not obtained in the first round of voting, a second round is held on the 15th day after the proclamation of the final results of the first round. Only the two (02) candidates having received the highest number of votes in the first ballot may stand in the second ballot. In the event of withdrawal or death of either of the two (02) candidates, between the two (02) rounds, the next candidates will be presented in the order of their ranking. In the second round, the can-didate who received the highest number of votes is declared elected.
Eligible candidates must be exclusively of Togolese nationality by birth, be at least 35 years of age on the date of submission of the application ; enjoy all their civil and political rights ; have a general state of physical and mental well-being duly certified by three sworn doctors appointed by the Constitutional Court and have been resident on national territory for at least 12 months.
The Constitutional Court is the court responsible for ensuring compliance with the provisions of the Constitution. The Constitutional Court judges the re-gularity of referendum consultations, presidential, le-
11
gislative and senatorial elections. It rules on disputes arising from these consultations and elections. It is the judge of the constitutionality of laws.
The President of the Republic is the Head of State, the guarantor of national independence and unity, territorial integrity, respect for the Constitution and international treaties and agreements, as well as the continuity of the State and the institutions of the Republic. It appoints the Prime Minister and, on the proposal of the latter, appoints the other members of the Government and puts an end to their office.
Under the authority of the President of the Republic, the Government, composed of the Prime Minister and Ministers, determines and conducts the policy of the Nation and directs the civil and military admi-nistration. It disposes of the administration, the ar-med forces and the security forces.
The initiative for legislation belongs concurrently to the deputies and the Government. The President of the Republic promulgates laws within fifteen days following the transmission to the Government of the law finally passed by the National Assembly. During this period, he may request that the law or some of its articles be re-discussed, the request must be subs-tantiated. The new deliberation cannot be refused. The Prime Minister ensures the execution of laws. He may delegate some of his powers to ministers.
In the event of a vacancy in the office of President of the Republic by death, resignation or permanent incapacity, the office of President exercised provisio-nally by the President of the National Assembly. The vacancy is established by the Constitutional Court on a referral from the Government. The Government convenes the electorate within one hundred (100) days of the opening of the vacancy for the election of a new President of the Republic.
If the President of the Republic is unable to attend due to illness or absence from the national territory,
1 The mandate limitation was introduced following the constitutional amendment of 19 May 2019.

12
his interim is handled by the Prime Minister.
Since 2005, Togo has had four (4) presidential elec-tions, notably in 2005, 2010, 2015, and 2020 sanc-tioned by the election of President Faure Gnassing-bé. The 2020 elections mark the beginning of a new democratic era, as they are part of the implementa-tion of the provisions of the new constitution which enshrine the limitation of the number of presidential terms. Thus, on the basis of those provisions, the newly elected President will not be able to serve more than two terms.
1.1.2 Legislatif power
Legislative power is exercised by a Parliament com-posed of two assemblies : the National Assembly (NA) and the Senate. The latter is not yet operatio-nal. The National Assembly controls the action of the Government.
The deputies are elected by direct and secret uni-versal suffrage for a term of six (06) years renewable two (02) times. Each deputy is the representative of the entire Nation. Any imperative mandate is null and void.
The National Assembly meets as of right in two (02) ordinary sessions per yeaCFAr : the first session opens on the first Tuesday of March and the second session opens on the first Tuesday of September.
As stated at the executive level, the initiative for le-gislation is shared between the deputies and the Go-vernment. Proposals and draft laws are submitted to the Bureau of the National Assembly, which sends them for examination to specialized committees whose composition and powers are set by the Na-tional Assembly's rules of procedure. At least eight days before deliberation and voting, bills are notified to the Government for information. Bills are delibe-rated in the Council of Ministers. The National As-sembly votes on the law as a last resort.
The number of deputies in the National Assembly rose to 91 from 81 between 1994 and 2013. The le-gislative elections of 20 December 2018 ended the 5th legislature. The 6th legislature was installed in January 2019. It is composed as follows : 59 depu-ties for the Union for the Republic (UNIR), 14 depu-
ties for the opposition (7 for the UFC, 3 for the NET, 2 for the MPDD, 1 for the PDP and 1 for the CRM) and 18 independents. The UNIR represents the pre-sidential majority.
1.1.3 Judiciary power
The judiciary, as the guarantor of individual liber-ties and the fundamental rights of citizens, is inde-pendent of the legislative and executive branches. Judges, in the exercise of their functions, are subject only to the authority of the law. The President of the Republic is the guarantor of the independence of the judiciary. He ensures the impartiality, professiona-lism, probity, integrity and dignity of the judiciary. To this end, he is assisted by the Higher Council of the Judiciary.
In addition, according to articles 20, 21 and 22 of Act No. 2019-015 of 30 October 2019 on the Judi-cial Organisation Code, justice is dispensed by or-dinary and specialized courts. The ordinary courts of law are: the Supreme Court, the courts of appeal and the criminal courts of appeal, the courts of first instance and the criminal courts, the courts of first instance with criminal and civil jurisdiction and the courts of first instance with civil jurisdiction. Specia-lized courts are : labour courts, commercial courts, juvenile judges and juvenile courts, and the military court and the military court of appeal.
1.1.3.1. The supreme court
The Supreme Court is the highest court of the State in judicial and administrative matters. It is composed of two chambers : the judicial chamber and the admi-nistrative chamber. Each of these chambers consti-tutes an autonomous jurisdiction within the Supreme Court and is composed of a president of chamber and councillors.
The Judicial Chamber of the Supreme Court is com-petent to hear and determine :
• Appeals to the Supreme Court of Cassation against final decisions handed down by the ci-vil, commercial, social and criminal courts;
• The proceedings against the magistrates of the Court of Appeal in accordance with the

13
provisions of the Code of Civil Procedure;
• Criminal proceedings against magistrates of the Court of Appeal according to the condi-tions determined by the Code of Criminal Procedure ;
• Applications for review and judge's rules.
• As for the Administrative Chamber of the Su-preme Court, it is competent to hear and de-termine the following :
• Appeals in cassation lodged against decisions rendered in administrative litigation ;
• Appeals for abuse of power lodged against the administrative acts of national authorities and administrations ;
• Litigation in local elections ;
• Appeals in cassation against the decisions of bodies and institutions ruling on disciplinary matters.
1.1.3.2. The High Court of Justice
It is composed of the President and the presidents of the chambers of the Supreme Court and four de-puties elected by the National Assembly. The High Court of Justice is the only court with jurisdiction to hear offences committed by the President of the Re-public and former Presidents of the Republic. The political responsibility of the President of the Repu-blic is engaged only in cases of high treason.
The High Court of Justice hears crimes and offenses committed by members of the Government and members of the Supreme Court. The High Court of Justice is bound by the definition of crimes and mis-demeanours and by the determination of penalties as they result from the criminal laws in force at the time of their commission.
The decision to prosecute as well as the indictment of the President of the Republic and the members of the Government is voted a four-fifths majority of the members of each of the two Assemblies compo-sing the Parliament, according to the procedure laid
down by an organic law. In the event of conviction, they are stripped of their responsibilities.
1.1.3.3. Courts of Appeal
The seat and jurisdiction of each court of appeal is determined by decree in the Council of Ministers.
The Court of Appeal is competent to hear : appeals against decisions handed down at first instance by the lower courts, appeals against orders of the in-vestigating judge and any other cases provided for by law. The court of appeal decides immediately, in accordance with the principle of adversarial proce-dure, on the dismissal of the appeal.
1.1.3.4. Criminal Courts of Appeal
The Criminal Court of Appeal is a permanent for-mation of the Court of Appeal, competent to hear appeals against judgments rendered by the criminal courts. It is composed of three (03) judicial magis-trates and a jury of six (06) jurors. The Criminal Court of Appeal is constituted and seized in accordance with the provisions of the Code of Criminal Proce-dure.
1.1.3.5. The courts of first instance
The seat and jurisdiction of each High Court are de-termined by decree in the Council of Ministers. The tribunal of first instance is a court of general jurisdic-tion in criminal, civil and administrative matters.
In criminal matters, the tribunal de first instance hears all offences under ordinary law, requests for release made by any person detained and prosecuted be-fore it, actions for compensation for damage caused by the offence, unless otherwise provided, and the application of penalties.
In civil matters, the tribunal of first instance has first and last instance jurisdiction over shares up to the value of five hundred thousand (500.000) CFA francs in capital or fifty thousand (50.000) CFA francs in an-nual income, calculated either by annuity or by lease price. It rules in the first instance at the expense of appeal for shares exceeding these sums as well as for those for which the rate cannot be assessed in money. The First Instance Court, having jurisdiction

14
over the main action, is also competent to rule on counterclaims, whatever the amount.
1.1.3.6. The criminal courts
The Criminal Court is a permanent formation of the High Court with jurisdiction to try all offences clas-sified as crimes under the provisions of the Criminal Code. It is composed of three (03) magistrates of the judiciary and a jury of four (04) jurors. The criminal court is constituted and seized in accordance with the provisions of the Code of Criminal Procedure.
1.1.3.7. Courts of first instance with criminal and civil jurisdiction
The court of first instance with criminal and civil ju-risdiction is the common law judge in criminal and civil matters.
In criminal matters, it deals with all offences classi-fied as offenses or contraventions, regardless of the penalties incurred, subject to the exceptions provi-ded for by law, in particular, in cases of connected-ness, requests for release made by any person de-tained and prosecuted before it and the enforcement of penalties.
In civil matters, it has first and last resort jurisdiction over shares up to the value of five hundred thou-sand (500.000) CFA francs in capital or fifty thou-sand (50.000) CFA francs in annual income calcu-lated either by annuity or by lease price. It rules in in the first instance at the appeal court for shares exceeding these sums, as well as for those whose rate cannot be assessed in money. The court of first instance with criminal and civil jurisdiction, having jurisdiction over the main action. It is also competent to rule on counterclaims, whatever the amount.
1.1.3.8. Courts of first instance with civil jurisdiction.
The court of first instance with civil jurisdiction is the common law judge in civil matters. It has first and last instance jurisdiction over shares up to the va-lue of five hundred thousand (500.000) CFA francs in capital or fifty thousand (50.000) CFA francs in annual income calculated either by annuity or by lease price. It rules in the first instance at the appeal
court for shares exceeding these sums, as well as for those whose rate cannot be evaluated in money. The court of first instance with civil jurisdiction have jurisdiction over the main action. It is also competent to rule on counterclaims, whatever the amount.
1.1.3.9. Labour courts
The Organisation, functioning and procedure to be followed before the labour courts are provided for in the Act establishing the Labour Code. The President of the Labour Court is competent to : (i) rule on sum-mary proceedings; (ii) issue orders on motions; (iii) sit as a member of the arbitration board for the settle-ment of collective disputes; (iv) organize and distri-bute jurisdictional tasks among the members of the tribunal in the light of the conclusions of the mee-tings; (v) appoint the presidents of the sections; and (vii) administer the tribunal.
1.1.3.10. Commercial courts
The commercial courts operate in accordance with the provisions of Law No. 2020-002 of January 7, 2020 amending Law No. 2018-028 of December 10, 2018 establishing the commercial courts in the To-golese Republic. The commercial courts have juris-diction :
• Disputes relating to commitments and tran-sactions between traders and non-traders wit-hin the meaning of the Uniform Act on General Commercial Law ;
• Disputes between any persons relating to commercial acts and negotiable instruments within the meaning of the Uniform Act on Ge-neral Commercial Law, with the exception of mixed acts in which the non-trading party may bring an action before the ordinary law courts ;
• Disputes relating to commercial companies and economic interest groups
• Collective procedures for the settlement of lia-bilities ;
• Disputes between partners of a commercial company or an economic interest grouping ;

15
• Disputes relating to security interests and pri-vileges granted to secure the performance of commercial obligations ;
• Disputes relating to competition, distribution, industrial property and accounting operations ;
• Consumer disputes and consumer protection and, more generally, the application of com-mercial legislation whatever the nature of the persons concerned ;
• Disputes relating to leases for professional use;
• Disputes relating to land, air and sea transport;
• Disputes relating to commercial intermediaries in respect of acts performed in the course of or for the purposes of their trade and disputes concerning their commercial relations
• Disputes relating to registration in the Trade and Personal Property Credit Register (TP-PCR).
The Commercial Court decides in the first and last instance on all claims whose rate of dispute does not exceed one million (1 000 000) CFA francs in capital or one hundred thousand (100 000) CFA francs in an-nual income calculated either by annuity or by lease price, in the first instance on all claims where the rate of dispute is higher than the amounts below.
1.1.3.11. Juvenile judges and juvenile courts
One or more juvenile judges and a juvenile court is established in each High Court and Magistrates' Court. The Organisation and functioning of the ju-venile courts are provided for in the Act establishing the Children's Code.
1.1.3.12. The military court and the military court of ap-peal.
Military courts specialize in the trial of military cases. The Organisation, jurisdiction and procedure to be followed before the military courts are provided for in the new Code of Military Justice. This code dis-
tinguishes between two military courts : the Military Tribunal and the Military Court of Appeal.
The Military Tribunal has jurisdiction over the entire national territory. It is the court of first instance for cases within its jurisdiction. It comprises a public prosecutor's office, one or more military examining magistrates, one or more correctional chambers, one or more criminal chambers and a military registry.
The Military Court of Appeal is the second level of jurisdiction in matters of military justice. It comprises a military prosecutor's office, an examining magis-trate's chamber, one or more correctional appeal chambers, one or more criminal chambers and a re-gistry.
1.2 Administrative organisation
According to Law n°2019-006 of 26 June 2019 amen-ding Law n°2007-011 of 13 March 2007 relating to decentralisation and local liberties as amended by Law n°2018- 003 of 31 January 2018, the national territory is divided into local authorities with legal per-sonality and financial autonomy. These territorial au-thorities are : regions and municipalities. The region is a legal entity under public law with financial auto-nomy. It is composed of prefectures. The commune is the basic local authority with legal personality and financial autonomy. It brings together the inhabitants of a continuous territorial space. It consists of one or more cantons. It may also be divided into cantons. The territorial communities are freely administered by elected councils under the conditions provided for by law.
Togo is divided into five (5) administrative regions, themselves divided into thirty-nine (39) prefectures. The prefectures are subdivided into communes. Overall, Togo has 116 communes. From South to North, the 5 administrative regions are : Maritime re-gion (chief town Lomé), Plateaux region (chief town Atakpamé), Central region (chief town Sokodé), Kara region (chief town Kara) and Savannah region (chief town Dapaong).
1.3 Geographical location
Located in West Africa, on the coast of the Gulf of Guinea, Togo covers an area of 56.785 km2. It

16
stretches over a length of 600 km and a width varying between 50 and 150 km. It is bordered to the north by Burkina Faso, to the south by the Atlantic Ocean, to the east by Benin and to the west by Ghana. The Togolese relief is mainly composed of two (2) plains covered with savannas separated by the Togo chain (Atakora), oriented from North-East to South-West.
There are several lakes in Togo, the largest of which is Lake Togo. The country enjoys a tropical climate subdivided into two (2) major zones: a Guinean-type zone in the south with two (2) dry seasons (from No-vember to March and from July to August) and two (2) rainy seasons (from March to July and from Sep-tember to October), a second Sudanian-type zone covering the northern half and characterized by a single rainy season (from May to October) and a dry season (from November to April).
1.4 Population
1.4.1. Demographic trend
According to the 4th General Census of Population and Housing, the Togolese population amounted to 6.191.155 inhabitants in 2010. It was 48.6% male and 51.4% female in 2010.
In 2019, according to World Bank statistics, the po-pulation is estimated at 8.082.359 with a density of 148.6 inhabitants/km2. Women outnumber men. Indeed, they represent 50.25% against 49.75% for men. Life expectancy at birth was 60.8 years in 2018 against 59.9 in 2015. The total fertility rate was 4.3 children per woman in 2018 compared to 4.5 child-ren in 2015. The AAGR2 of the population was 2.3 % between 2010 and 2019. It will be around 2.4 % by 2025.
Table 1 . Evolution of the Togolese population from 2010 to 2019(in millions of inhabitants)
Source : World Population Prospects 2019, United Nations
2010 2011 2012 2013 2014 2015 2016 2017 2018 2019
Total population 6.42 6.60 6.77 6.95 7.14 7.32 7.51 7.70 7.89 8.08
Men 3.19 3.27 3.36 3.45 3.55 3.64 3.73 3.83 3.92 4.02 Women 3.24 3.32 3.41 3.50 3.59 3.68 3.78 3.87 3.97 4.06
Proportion Male
/ Female (%) 98.4 98.5 98.6 98.6 98.7 98.8 98.8 98.9 98.9 99.0
Demographic
growth rate (%) 2.7 2.7 2.7 2.6 2.6 2.6 2.5 2.5 2.4 2.4
2 Calculate on the basis of the formula Power (Pop2019/Pop 2010 ;1/10) -1
The age pyramid of the Togolese population has a broad base reflecting a preponderance of youth. In-deed, the structure by major age groups shows that
60.6 % of the population is under 25 years of age, 52 % under 20 years of age, 41 % under 15 years of age and only 4.7 % over 60 years of age.

17
Figure 1. Age pyramid in 2019
Source : based on data from World Population Prospects 2019, United Nations
In terms of projection, the Togolese population would reach 18.03 million in 2050 against 8.28 million in 2020. The structure would undergo a slight change
in 2050. Indeed, the proportion of people under 25 years old would be 51% against 57.5% in 2030 and 60.6% in 2019.

18
Table 2 . Evolution of Togolese population projections from 2020 to 2050(in millions of inhabitants)
Source : World Population Prospects 2019, United Nations
2020 2025 2030 2035 2040 2045 2050
Men 4.12 4.68 5.34 6.10 6.95 7.91 8.99
Women 4.16 4.72 5.38 6.13 6.98 7.95 9.04
Total
population 8.28 9.40 10.72 12.23 13.93 15.85 18.03
Figure 2. Age pyramid in 2030
Source : World Population Prospects 2019, United Nations

19
Figure 3. Age pyramid in 2050
Source : World Population Prospects 2019, United Nations
The Togolese population is predominantly rural. In 2019, the rural population accounted for 57.3 % of the total population compared to 43.7 % for the urban population.

20
Table 3 . Evolution of the Togolese rural and urban population from 2010 to 2019(in millions of inhabitants)
Source : World Bank. * World Urbanization Prospects 2018, United Nations
2010 2011 2012 2013 2014 2015 2016 2017 2018 2019*
RuralPopulation
4.01 4.09 4.16 4.24 4.31 4.39 4.46 4.53 4.60 4.7
UrbanPopulation
2.41 2.51 2.61 2.72 2.83 2.94 3.05 3.17 3.29 3.5
Total 6.42 6.60 6.77 6.95 7.14 7.32 7.51 7.70 7.89 8.2
In terms of projection, the higher weight of the rural population is expected to continue until 2030. From 2035 onwards, Togo's population is expected to be
predominantly urban. In fact, the urban population would represent 61% of the total population in 2050 against 39% for the rural population.
Table 4 . Evolution of rural and urban Togolese population projections from 2020 to 2050 (in % of total population)
Source : World Urbanisation Prospects 2018, United Nations
2020 2025 2030 2035 2040 2045 2050
Rural
57% 54% 51% 48% 45% 42% 39%
Urban
43% 46% 49% 52% 55% 58% 61%
Total 100% 100% 100% 100% 100% 100% 100%
1.4.2 Religion
According to article 25 of the Constitution, everyone has the right to freedom of thought, conscience, reli-gion, worship, opinion and expression. The exercise of these rights and freedoms is subject to respect for the freedoms of others, public order and the stan-dards established by law and regulations. The orga-nisation and practice of religious beliefs are freely exercised in accordance with the law. The same ap-plies to philosophical orders.
The exercise of worship and the expression of be-liefs are done carried out with respect for the secular nature of the State. Religious denominations have
the right to organize themselves and freely exercise their activities in accordance with the law. The re-ligions practised in Togo include Christianity, Islam and traditional religions. In terms of distribution, in 2018, the Togolese population was composed of Christians (47.7 %), animists (33.2 %), Muslims (18.3 %) and other beliefs (0.8 %)3.
1.5 Education
To meet the challenge of developing and moderni-zing its education system, the country has adopted an Education Sector Plan (ESP 2010-2020), which was adopted in March 2010 and revised in De-cember 2013 for the period 2014-2025. This plan
3 Source : https://www.liberte-religieuse.org/togo/

21
4 Source : Togo First5 Source : Unicef Country Office Annual Report 2018.
aims to balance the national education pyramid while correcting disparities, improve the efficiency and quality of the education service, develop an ef-fective partnership with the various members of so-ciety and improve the management and governance of the sector.
Organisation of school cycles
The formal school system begins with preschool, which lasts two years and is for children aged 4 to 5 years. Entry into primary school is at the age of 6 and lasts 6 years, the end of primary school being sanc-tioned by a certificate of completion of the first le-vel (CCFL) which gives access to secondary school. General secondary education consists of a four-year first cycle which leads to undergraduate studies cer-tificat (USC) and a three-year second cycle which leads to the baccalaureate. Pupils who choose the
pro-fessional route after the USC can continue their studies in a technical and vocational college.
Higher education lasts from two to seven years and is open to baccalaureate holders. It provides aca-demic and professional training. In July 2008, the Bachelor-Master-Doctorate (BMD) system was intro-duced in higher education. BTS training is provided by the private sector.
Pre-school education
The gross pre-school enrolment rate1 for 4-5 year-olds was 22.8% in 2018, up from 13.7% in 2013. Between 2013 and 2018, there will be an average annual increase of 12 % in enrolment, bringing the number of pupils to more than 155,739 in 2018, compared with just over 86,680 in 20134 .
Source : World Bank, April 2020
Table 5 . Evolution in the gross enrolment ratio in kindergarten (%) 2013 2014 2015 2016 2017 2018
Pre -School
gross Rate 13.7 15.0 17.6 Nd 21.3 22.8
Variation - 1,3 2,5 - - 1.5
Male Sex 13.4 14.8 17.3 Nd 20.9 22.5
Variation - 1,4 2,5 - - 1.6
Female Sex 14.0 15.3 17.8 Nd 21.8 23.2
Variation - 1.3 2.5 - - 1.4
Enrolment
rate girls /
boys
103.96 103.12 102.86 - 103.95 102.92
The performance recorded in pre-school education has been boosted by several actions, including sup-port from UNICEF5. In order to promote pre-school education, UNICEF has built 70 classrooms, provi-ded equipment for 475 kindergartens and trained 1.302 educators for the benefit of an estimated mini-mum of 52.080 children, including 27.602 girls.
Primary education
The gross primary school enrolment rate was 123.8% in 2018, compared to 124.4% in 2017, a slight de-cline of 0.6 percentage points.

22
Source : World Bank, April 2020
Table 6 . Gross primary school enrolment ratio (%) 2013 2014 2015 2016 2017 2018
Gross schooling rate
127.4 123.9 128.0 125.1 124.4 123.8
Variation (%) - -3.5 4.1 -2.9 -0.8 -0.6
Male Sex 131.7 127.6 131.2 128.2 127.3 126.0
Variation (%) - -4.0 3.6 -3.0 -0.9 -1.3
Female Sex 123.2 120.3 124.9 122.0 121.4 121.5
Variation (%) - -2.9 4.6 -2.9 -0.6 0.1
Enrolment
rate girls /
boys
93.6 94.2 95.2 95.2 95.4 96.4
The authorities justify the importance of the gross enrolment rate by the government's initiatives to in-crease the presence of young pupils at school, and to improve schooling as a whole, including school canteens and School assur6.
These performances do not only concern gross en-rolment at the primary level, other indicators also seem to respond positively. Thus, over a more re-cent period, improvements have been observed in the primary completion rate, which rose from 84.2 % in 2014 to 89.7 % in 2018. Similarly, the net enrol-ment rate, which was 90.31 % in 2014, increased to 90.7 % in 2018.
The adjusted net enrolment rate for children aged 6 to 11 years was 89,5 %7 in 2017 at the national le-vel, with differences according to background and region of residence. Grand Lomé, other urban areas and rural areas have net primary school enrolment rates of 95.3 %, 94.9 % and 86.7 % respectively. The regions with the highest net enrolment rates are Grand Lomé (95.3 %), Maritime (92.4 %) and Central (92.8 %). The gap in the net enrolment rate between boys (90%) and girls (89%) has narrowed conside-rably and is now only 1.1 points.
Secondary education
At the secondary level, the gross enrolment rate was 61.69% in 2017 against 55.01% in 2011.
Table 7 . Evolution in the gross secondary school enrolment ratio (%) 2003 2004 2005 2006 2007 2011 2017
Enrolment
rate 41.64 43.43 46.15 48.39 45.41 55.76 61.84
Variation 5.77 3.94 6.02 4.7 -6.12 24.28 12.02
Source : World Bank, April 2020
6 Launched on 1 September 2017, School Assur aims to provide insurance coverage for primary and secondary school children in Togo's public sector.7 Integrated Regional Survey of Employment and the Informal Sector, 2017, NISEDS

23
8 Integrated Regional Survey of Employment and the Informal Sector, 2017, NISEDS
The net secondary school enrolment rate was 57.4 %8 in 2017. Depending on the area of residence, this rate was 69.2 % in Grand Lomé and 67.7 % in
other urban areas, while in rural areas it was 50.4 %. The Savannah region has the lowest net attendance rate (47.3%).
Source : Integrated Regional Employment and Informal Sector Survey, 2017, NISEDS
Table 8 . Net secondary school enrolment ratio in 2017by region and residence (%)
Man Woman Total
Region Maritime 58.0 55.4 56.8
Plateaux 61.2 42.7 53.0
Central 60.3 54.0 57.6
Kara 60.1 53.5 57.3
Savanes 51.4 42.4 47.3
Grand Lomé 74.6 64.0 69.2
Residence
Environmen
Grand Lomé 74.6 64.0 69.2
Other Urban 70.9 64.4 67.7
Rural 55.3 43.8 50.4
Togo 61.5 52.5 57.4
Higher education
As regards higher education and scientific research, according to the analysis made in the National De-velopment Plan 2018-2025, they remain poorly de-veloped. The sub-sector is confronted with several difficulties related to the massification of enrolments, the obsolescence and inadequacy of reception in-frastructures, the inadequacy of pedagogical equip-ment, the lack of teachers, the weakness of financial resources, etc. The sub-sector is confronted with se-veral difficulties related to the massification of enrol-ments, the obsolescence and inadequacy of recep-tion infrastructures, the inadequacy of pedagogical equipment, the lack of teachers, the weakness of fi-nancial resources, etc. The sub-sector is confronted
with several difficulties related to the massification of enrolments, the obsolescence and inadequacy of re-ception infrastructures, the inadequacy of pedagogi-cal equipment, the lack of teachers, the weakness of financial resources, etc. These difficulties affect the quality of teaching and the internal and external ef-fectiveness of training. Research results are not very competitive, and the field remains marked by little innovation and progress. The government is aware that research and development is a priority area and must be encouraged and supported in Togo to make it a lever for economic growth.
The gross enrolment ratio stood at 14.5% in 2018 compared to 11.0% in 2013. It was higher for boys than for girls.

24
Source : World Bank, April 2020
Table 9 . Evolution of the gross enrolment ratioin tertiary education 2013 to 2018 (%)
2013 2014 2015 2016 2017 2018
Gross schooling rate
11 10.5 11.0 12.5 13.1 14.5
Variation -0.6 0.5 1.5 0.6 1.5
Male Sex 14.8 15.4 17.4 18.0 19.2
Variation 14.8 0.6 2.1 0.5 1.2
Female Sex 6.1 6.6 7.5 8.1 9.8
Variation 6.1 0.4 1.0 0.6 1.7
Enrolment
rate girls /
boys
41.6 42.7 43.1 45.2 51.0
Literacy
With regard to literacy and non-formal education, despite the actions taken by the State and civil so-ciety Organisations, adult illiteracy and the lack of schooling for young people remain a daily reality that penalizes many individuals within the population. The illiteracy rate for individuals aged 15 and over
was 36.7% in 2015 (QUIBB 2015 Survey)9 . This pro-portion of individuals does not have the skills to ac-cess, in particular, the vocational training and quality apprenticeships needed for entrepreneurship and employment. However, the literacy rate is constantly improving. It rose from 53.18 % in 2000 to 67.7 % in 2017 according to the World Bank.
2000 2006 2009 2011 2015 2017*
Values
53.18 56.89 57.09 60.41 63.75 67.7
Variations - 3.71 0.2 3.32 3.34 3.95
Source : World Bank, *Statistical Yearbook 2018 BCEAO
Table 10 . Evolution of the literacy rate from 2000 to 2017 (%)
9 The QUIBB survey numbers differ slightly from those of the World Bank.
1.6 Health
The vision of health policy is to "ensure the highest attainable standard of health for the entire popu-
lation by making every effort to develop a system based on public and private, individual and collec-tive, accessible and equitable initiatives, capable of satisfying the right to health of all, particularly the

25
most vulnerable". Health policy remains based on primary health care and takes into account Togo's international commitments to subregional, regional and global Organisations in the field of health.
Architecture of the Health system
Togo's health system is organized into six (6) health
regions : Savanes region, Kara region, Central re-gion, Plateaux region, Maritime region and Lomé Commune region. The administrative management of the health system is ensured by a pyramidal Or-ganisation at three levels : central, intermediate and peripheral.
Figure 4. Diagram of the pyramidal organisation of the health system in Togo
Source : National Health Development Plan 2017-2022
The central level is represented by the minister's office, the general secretariat, the two (2) general directorates and ten (10) central directorates with their divisions and sections. The intermediate level includes six (6) regional health directorates (RHD) and the peripheral level is represented by the health district which constitutes the operational entity. The administration of the health districts is ensured by forty (40) health district directorates.
According to the results of the health map drawn up in 2015, the State is the main provider of care with 59% of the supply. The private sector (41% of the health care supply) is mostly liberal and is concen-trated in the major urban centres, mainly in Lomé,
where demand is more solvent. However, it is poor-ly regulated, especially in its geographical location, and is not always taken into account in the planning of the supply of services. To this supply must be added the presence of a fairly influential traditional sector, especially in rural areas.
In terms of social protection in health in Togo, in ad-dition to the financing of public health care through budgetary allocations, there are several mecha-nisms for covering health risks. These include free mechanisms (partial or total subsidy of the cost of care for indigent persons in health facilities), free preventive care for certain vulnerable groups, free ARVs for PLHIV decreed by the Government in No-

26
vember 2008, subsidies for Caesarean sections ef-fective since 2 May 2011, free or subsidized care for certain diseases (dialysis, treatment of tubercu-losis, simple malaria, leprosy, etc.), and free access to health care for persons living with HIV/AIDS. and insurance mechanisms to protect against financial risk such as: coverage of occupational risks by the National Social Security Fund, compulsory health insurance for civil servants and their dependents ef-fective since 1 March 2012, insurance for pupils in public schools (School Assur) since October 2017, insurance for beneficiaries of the National Fund for Inclusive Finance (NFIF) in 2017, community mutual health insurance companies, private for-profit health insurance companies.
Notwithstanding the many efforts made in the area of social health protection, 45.7 % of the Togolese
population is currently covered by a health insurance scheme. This indicates that the majority of the po-pulation continues to bear the cost of health care through direct paiment and runs the risk of having to bear high costs that contribute to keeping them in poverty.
1.7 Health data
Togo's health system has improved in recent years. This has resulted in an improvement in the well-being of the population. For example, life expectancy at birth has increased from 53.5 years in 2000 to 60.8 years in 2018. Women live longer than men. Indeed, they had a life expectancy of 61.6 years compared to 59.9 years for men in 2018.
Table 11 . Evolution of life expectancy at birth (years)
2000 2010 2018
Men 52.7
56.8
59.9
Women 54.3 58.1 61.6
Total 53.5 57.5 60.8
Source : World Bank, April 2020
Child and maternal mortality
As part of the implementation of the health policy, the government has undertaken to bring care clo-ser to the communities through the rehabilitation, construction and equipment of health structures. It has developed initiatives to provide free health care and targeted subsidies. In addition, it has under-taken sector reform aimed at increasing interven-tions in the poorest areas and among the poorest and most vulnerable populations by redirecting re-sources towards the implementation of interventions
with a high impact on the health of the population. This reform and the measures to provide free edu-cation have produced significant results in terms of reducing infant mortality. In fact, the infant mortality rate fell from 78 ‰ in 2010 (MICS4) to 49 ‰ of live births in 2014 (DHST-III), and the infant and child mortality rate from 123 ‰ to 88 ‰ during the same period. According to World Bank data, the under-five mortality rate was 69.8 ‰ in 2018 and the neonatal mortality rate (per 1.000 live births) was 24.9 ‰ in 2018 compared to 28.8 ‰ in 2010.

27
Table 12 . Evolution in neonatal, infant and maternal mortality rates
2010 2011 2012 2013 2014 2015 2016 2017 2018
Neonatal
mortality rate
(per 1,000 live
births)
29.4 28.8 28.2 27.7 27.2 26.7 26.3 25.8 25.3 24.9
Infant mortality
rate, under 5
years, boys (per
1.000)
96.1 82.7 75.3
Infant mortality
rate, under 5
years, girls (per
1000 live births)
82.7 70.6 63.9
Infant mortality
rate, under 5
years (per
1.000)
92.3 89.6 86.9 84.3 81.8 79.3 76.8 74.4 72.1 69.8
Maternal
mortality rate
(100.000 births)
459 440 422 410 404 401 398 396
2009
Source : World Bank, WHO.
The maternal mortality ratio was estimated at 401 deaths per 100.000 live births in 2014. From 2015, it declined to 396 deaths per 100.000 live births in 2017. According to the results of EDST-III (2013-2014), ¾ of maternal deaths are related to direct obstetric causes such as haemorrhage (36.4 %), eclampsia (23.5 %), abortion complications (16.9 %), postpartum infections (14 %) and dystocia (22.3 %).
Prevalence of diseases
Malaria was the number one reason for consulting patients in 2018. In 2018, Togo recorded 2.002.87710 cases of malaria, including 76.870 severe cases. Among them, 30.534 are received at the referral. There were also 905 deaths related to this disease, i.e. a specific lethality of 3% (905/30 534). The fi-ght undertaken by Togo for decades has continued throughout the national territory through several
10 Source: MHPH Annual Performance Report 2018. Page 9.

28
strategies : (i) prevention, which includes vector control through the use of LLINs, prevention of ma-laria in pregnant women through Intermittent Pre-ventive Treatment (IPT) and Seasonal Malaria Che-mo-Prevention (SMC) ; (ii) diagnosis and treatment of cases according to national guidelines at the community and health facility levels ; and (iii) preven-tive treatment.
According to the 2016 yearbook of health statistics, after malaria as the first reason for consultation, there is respiratory tract infection and wounds and trauma with morbidity rates of 7 % and 6 %11 respectively.
With regard to HIV/AIDS, in 2018, the National Pro-gramme to Combat AIDS and Sexually Transmitted Infections (NPCA-STI) showed an overall improve-ment in almost all indicators. The HIV/AIDS preva-
lence rate was 2.3 %in 2018, compared with 2.4 per cent since 2016. The incidence of the disease has also declined to 1.06 in 2018 compared to 1.16 in 2017. The number of new cases has also declined significantly. The number of new cases was 5.000 in 2018 compared to 5.300 in 2017. The prevalence of the disease among young people aged 15 to 24 years has stabilized, particularly among males at 0.5% and females at 1 %. The percentage of HIV-po-sitive pregnant women who received antiretrovirals during pregnancy to reduce mother-to-child trans-mission of HIV increased from 71 % in 2017 to 80 % in 2018. With regard to antiretroviral (ARV) treatment, the number of people living with HIV on antiretroviral treatment increased from 59.752 in 2017 to 64.842 in 2018. The availability of ARVs made it possible to achieve this performance.
11 Yearbook of Health Statistics of Togo, 2016
Table 13 . Evolution of HIV AIDS indicators(in millions of inhabitants)
Source : UNAIDS 2019
2009 2010 2011 2012 2013 2014 2015 2016 2017 2018
HIV prevalence
(% of
population aged
15 -49)
2.9 2.9 2.8 2.7 2.7 2.6 2.5 2.4 2.4 2.3
HIV incidence
(% of
population aged
15 -49)
1.85 1.79 1.68 1.59 1.51 1.45 1.36 1.28 1,16 1,06
New cases of
HIV infection in
adults (15
years and
older) and
children (0 - 14
years)
7 400 7 200 6 700 6 500 6 300 6 100 5 700 5 500 5 300 5 000
New cases of
HIV infection in
children (0 - 14
years)
2 500 2 400 2 000 2 000 1 800 1 700 1 400 1 300 1 300 1 200
New Cases of
HIV Infection in
Adults (15
years and
older)
4 900 4 900 4 700 4 600 4 500 4 400 4 300 4 200 3 900 3 700
Antiretroviral
therapy
coverage (% of
people living
with HIV)
16 23 26 26 31 34 38 48 56 60
HIV prevalence,
men (% of men
aged 15 - 24) 0.4 0.4 0.5 0.5 0.5 0.5 0.5 0.5 0.5 0.5
HIV prevalence,
women (% of
women aged
15 -24)
1.2 1.2 1.1 1.1 1.1 1.1 1 1 1 1
Children (0 - 14)
living with HIV 16 000 16 000 16 000 16 000 15 000 15 000 14 000 14 000 13 000 12 000
Antiretroviral
treatment
coverage
among
pregnant
women (% of
HIV - positive
pregnant
women)
11 16 61 66 69 73 79 87 71 80

29
12 MHPH ANNUAL PERFORMANCE REPORT YEAR 2018
Table 13 . Evolution of HIV AIDS indicators(in millions of inhabitants)
Source : UNAIDS 2019
2009 2010 2011 2012 2013 2014 2015 2016 2017 2018
HIV prevalence
(% of
population aged
15 -49)
2.9 2.9 2.8 2.7 2.7 2.6 2.5 2.4 2.4 2.3
HIV incidence
(% of
population aged
15 -49)
1.85 1.79 1.68 1.59 1.51 1.45 1.36 1.28 1,16 1,06
New cases of
HIV infection in
adults (15
years and
older) and
children (0 - 14
years)
7 400 7 200 6 700 6 500 6 300 6 100 5 700 5 500 5 300 5 000
New cases of
HIV infection in
children (0 - 14
years)
2 500 2 400 2 000 2 000 1 800 1 700 1 400 1 300 1 300 1 200
New Cases of
HIV Infection in
Adults (15
years and
older)
4 900 4 900 4 700 4 600 4 500 4 400 4 300 4 200 3 900 3 700
Antiretroviral
therapy
coverage (% of
people living
with HIV)
16 23 26 26 31 34 38 48 56 60
HIV prevalence,
men (% of men
aged 15 - 24) 0.4 0.4 0.5 0.5 0.5 0.5 0.5 0.5 0.5 0.5
HIV prevalence,
women (% of
women aged
15 -24)
1.2 1.2 1.1 1.1 1.1 1.1 1 1 1 1
Children (0 - 14)
living with HIV 16 000 16 000 16 000 16 000 15 000 15 000 14 000 14 000 13 000 12 000
Antiretroviral
treatment
coverage
among
pregnant
women (% of
HIV - positive
pregnant
women)
11 16 61 66 69 73 79 87 71 80
Within the context of the fight against tuberculosis, 2,501 cases of all forms of tuberculosis have been notified, compared with 2.176 cases expected in 2018. The percentage of new cases of bacteriolo-gically confirmed tuberculosis successfully treated (cure and treatment completed) declined from 83 % in 2017 to 80.7 %in 2018 against a target of 89.7 %.
With regard to epidemic cases, in 2018, no epide-mics were recorded12. No district remained silent in the detection and reporting of cases of diseases with
epidemic potential (DEP). All detected cases of DEP and public health events were adequately responded to within 14 days, i.e. 100%.
Since December 2019, like most countries in the world, Togo has been affected by the Covid-19 pan-demic. To cope with this pandemic, Togo has set up a prevention and warning system against the coro-navirus. The country has taken all possible measures to be a modern country in the response to the coro-navirus epidemic. Teams have been set up with the

30
necessary equipment at the borders to detect sus-picious cases by examining all passengers entering the country. Logistically, medical ambulances have been mobilized in the country's major hospitals. The first case was detected on 06 March 2020. Imme-diate measures under a three-pronged action plan aimed at strengthening the public health system, containing the spread of the virus and mitigating its humanitarian and social effects have been taken.
Firstly, preventive measures include closing land borders, improving airport and border controls, as well as social barriers and distances. The latter mea-sures include restrictions on mobility throughout the country, temporary closure of schools and universi-ties and temporary bans on religious, cultural and other public events. Second, detection measures involve testing and identification of potential cases of COVID-19. Third, treatment measures include containment, dedicated hotels and hospitals, and mobile clinics.
The authorities plan to further strengthen the health system to increase resilience against pandemics and chronic diseases Overall, the overall financing needs are estimated at about CFA FRANCS 70 billion (about $130 million or 2% of GDP). Discussions with development partners to help meet these financing needs have been held and about CFA FRANCS 7 bil-lion from the State and the World Bank have already been made available. The 2020 budget framework is being expanded by 1.7 percentage points to include expenditure requirements for the fight against CO-VID-19 (1.3 per cent of GDP) and revenue losses (0.4 % of GDP). As of 18 May 2020, 13.452 laboratory tests have been carried out, 330 cases of COVID-19 have been confirmed, 106 people have been cured
and 212 cases remain active. There have also been 12 deaths.
1.8 Employment
According to the National Development Plan, em-ployment is a concern for the government because of the growing gap between the evolution of the la-bour force and the number of jobs created, and the weak short-term capacity of the economic system to generate sustainable, productive and decent jobs. To address these constraints and provide adequate solutions to the crucial issue of rising unemployment and underemployment, a national employment po-licy and a national strategic plan for youth employ-ment (NSPYE) were adopted in 2014. Similarly, a national coalition for youth employment (NCYE) has been set up. Strengthening the employability and reducing underemployment of young people, pro-moting entrepreneurship and improving the coordi-nation mechanism are the main thrusts of National Strategic Plan for Youth Employment.
Labour force
According to the 201713 integrated regional survey on employment and the informal sector, the available jobs represented 60.7% of people of working age (15 years or older). This proportion was higher among males (62.5%), those with no more than primary education (68.2% with no education and 69.1% with primary education), in rural areas (62.8%) and in the Maritime (66.7%) and Plateaux (68.5%) regions. In terms of numbers, the working population was es-timated in 2019 at 3.699.587 inhabitants, compared to 3.315.730 inhabitants in 2015, an increase of 11.6 %. The male/female ratio shows that the male popu-lation is more active than the female population.
13 NISEDS

31
Table 14 . Evolution of the labour force from 2015 to 2019
Source : World Bank, April 2020
2015 2016 2017 2018 2019
Men 1 671 293 1 715 808 1 760 980 1 806 420 1 861 311
Women 1 644 437 1 691 608 1 740 113 1 790 135 1 838 276
Total 3 315 730 3 407 416 3 501 093 3 596 555 3 699 587
Men / Women(%)
101.6 101.4 101.2 100.9 101.3
Employment remains dominated by the informal sector. Indeed, in 2017, more than nine out of ten jobs (91.6%) were provided by the informal sector, regardless of the sector of activity. This level even reaches 98% in the private sector and 3.4% in the public sector. The dominance of informal employ-ment is more marked in the agricultural institutio-
nal sector with 99.7 % of jobs, including the private agricultural sector (100 %) and the public agricul-tural sector (23.1 %). This can be explained by the traditional and family-oriented nature of agriculture in Africa. The non-agricultural institutional sector is also dominated by informal employment (87.9 %) and more particularly the private sector (96.9 %).
Table 15 . Employment balance sheet 2017
Source : Integrated Regional Survey on Employment and the Informal Sector (ERSI_ESI) Togo 2017, June 2019
Formal Informal Total Numbers
Non-agricultural
institutional sector (%)
Public Sector 96.9 3.1 100 150 570
Private Sector 3.1 96.9 100 331 555
Households 0 100 100 10 758
Total 12.1 87.9 100 492 882
Agricultural institutional
sector
Public Sector 76.9 23.1 100 2659
Private Sector 0 100 100 17 501
Households 0 0 0 0
Total 0.3 99.7 100 20 159
All together
Public Sector 96.6 3.4 100 153 229
Private Sector 2.0 98.0 100 349 056
Households 0 100 100 10 758
Total 8.4 91.6 100 513 042

32
Unemployment
In terms of employment, unemployment as defined by the International Labour Office (ILO) was 3.9 %14 of the labour force in 2017, compared to 3.4 % in 2015. However, it is higher in urban areas, at 6.3 % compared to 2.0 % in rural areas. Moreover, the unemployment rate is higher among men (5 %) than among women (2.9 %). According to place of residence, the Lomé agglomeration has the highest unemployment rate at 7.8 %, a rate significantly hi-gher than that recorded in other urban areas (3.1 %). Unemployment affects young people and women even more, especially those aged 25-34, who make up 46.5 % of the unemployed, 51.7 % of whom are women and 43.2 % men. Persons in the 15-24 age group account for 32 % of the unemployed, with 35.8 % of women and 29.6 % of men.
According to ILOStat's estimates, the unemployment rate for people aged 15 and over would be 2.0 % in 2019 compared to 2.1% in 2018. It would remain higher in urban areas than in rural areas. Indeed, in urban areas, the unemployment rate in 2019 would be 4.4% compared to 4.5% in 2018. In rural areas, the unemployment rate would be 0.3 % in both 2018 and 2019.
With regard to underemployment, according to NISEDS data, it remains high at the national level. It is estimated at 26.8 % in 2017, compared to 24.9 % in 2015. Men are less underemployed (23.6 % in 2017 as against 25.8 % in 2015) than women (29.5 % in 2017 as against 24.1 per cent in 2015). The un-deremployment rate is lower in rural areas (24.7 %) than in urban areas (29.3 %).
Employment policy
Since 2011, Togo has undertaken a policy of pro-moting youth employment through the programme for the Promotion of National Volunteerism in Togo (PNVT) and the programme of Support for Integra-tion and Development of Employment (SIDE) aimed at providing a first professional experience to gra-duates.
14 Integrated Regional Survey on Employment and the Informal Sector (ERSI_ESI) Togo 2017, juin 2019.14 QUIBB 2015 Survey, National Institute of Statistics and Economic and Demographic Studies.
Thus, several mechanisms have been implemented with the support of technical and financial partners. These mechanisms include the project to support the employability and integration of young people in promising sectors (PSEIY-PS), the Youth Economic Initiatives Support Fund (YEISF), the Grassroots De-velopment Support Programme (GDSP), the Youth Entrepreneurship Promotion Programme (YEPP) and the Vulnerable Youth Employment Opportunities Project (VYOP).
The PSEIY-PS aims to create the conditions for more inclusive economic growth by strengthening the em-ployability of young people and promoting entrepre-neurship in promising sectors. It intends to provide a short-term response to the integration needs of young people through support for entrepreneurship, particularly in the agricultural value chain (AVC). EISF, GDSP and YEPP were initiated to strengthen the en-trepreneurial capacities of young women and men through training and access to financial and non-fi-nancial services, and to significantly increase young entrepreneurs' access to microfinance through va-rious supply activities. The EOVYP includes a com-mitment to community services and training to pro-vide vulnerable youth with a qualification, a job or to accompany them on the path to entrepreneurship.
Employment dynamics
The various mechanisms put in place have enabled Togo to achieve commendable results in promoting youth employment. Indeed, the number of young people who found new job opportunities through vo-luntary work was 4.292 in 2018 and 5.063 in 2019, corresponding to an integration rate of 77.06 % and 68.34 % respectively. The number of young people trained in entrepreneurship and financed was 4.567 in 2018 and 9.921 in 2019, corresponding to a pro-portion of young people financed in entrepreneurship of 56.2 % and 44.36 % respectively. In terms of bu-siness creation, 2.148 businesses were created in 2018 and 1.856 in 2019.

33
Source : Citizen's Budget 2020
2018 2019
Number of young people placed as volunteers 5 570 7 409
Number of volunteers inserted 4 292 5 063
Rate of integration of young people placed involuntary work
77.06%
68.34%
Number of young people trained in entrepreneurship 8 127 22 365
Number of youth trained in entrepreneurship funded 4 567 9 921
Proportion of youth funded in entrepreneurship byGrassroots Development (PSEIY-PS, GDSP, YEISF andEOVYP)
56.2%
44.36%
Number of enterprises created by young people 2 148 1 856
Table 16 . Evolution of the main employment indicators
In terms of job creation, the number of jobs created was 15.863 in 2018 and 13.602 in 2019. The Plateaux region benefited from most of the jobs created.
Table 17 . Number of jobs created by region in 2018 and 2019
Source : Citizen's Budget 2020
2018 2019
Achievement Forecast Achievement
Lomé Commune 108 242 186
Maritime 621 723 713
Plateaux 11 071
7 721 7 998
Central 1 528 1 094 1 127
Kara 2 348 1 737 1 783
Savanes 187 2 283 1 795
Total 15 863 13 800 13 602
1.9 Reminder of the main aggregates
1.9.1 Level of development
The Human Development Index
Togo's human development index (HDI) stood at 0.513 in 2018, compared to 0.45 in 2009, indica-ting an improvement in the population's standard of
living. This HDI level places Togo 167th in the world out of 189 countries. Its HDI level is higher than the average human development index of low human development countries (0.507) and lower than the average human development index of Sub-Saha-ran African countries (0.541). The improvement in the HDI is the result of reforms in the education and health sectors.

34
Table 18 . Evolution of the Human Development Index
Source : World Bank
2009 2010 2011 2012 2013 2014 2015 2016 2017 2018
IDH 0.45 0.46 0.46 0.47 0.47 0.48 0.49 0.5 0.5 0.513
Variation(%)
2.2 0.0 2.2 0.0 2.1 2.1 2.0 0.0 2.6
Table 19 . Evolution of the Gini index
Source : NISEDS : POVERTY PROFILE 2006-2011-2015-2017 Togo
2006 2007 2011 2015 2017
Indice 0.361 0.335 0.393 0.38 0.427
Variation(%)
-7.2 17.3 -3.3 12.4
Table 20 . Evolution of GDP Per Capita in CFA Francs
Source : World Bank, April 2020, * Calculations based on estimates of GDP (IMF) and WPP 2010 (United Nations).
GDP per capita (constant local currencyunits)
GDP per capita (current local currencies)
2014 265 067.5 316 481.9
2015 273 203.0 337 528/8
2016 281 217.5 354 064/7
2017 286 284.7 363 54.2
2018 293 084.7 377 123.5
2019 * 336 758.9 395 812.7
Gini Index
The Gini index is an indicator that measures inequa-lity in per capita spending. Between 2015 and 2017,
there will be an increase in inequality in the distribu-tion of household consumption expenditure. Indeed, at the national level, the Gini index stood at 0.427 in 2017 as against 0.38 in 201516, an increase of 12.4%.
Gross Domestic Product per capita
Togo's GDP per capita is constantly improving. In current terms, it rose from CFA Francs 316.482.9 in
2014 to CFA Francs 395.812.7 in 2018, an increase of 25.1%. It is estimated at CFA Francs 336 758.9 in 2019.
16 The index calculated by the World Bank is 0.431 in 2015 and 0.46 in 2011. Its evolution reflects a reduction in inequalities as the national data.

35
Table 21 . Main economic aggregates (billions of FCFA for values)
Source : DGBF/ DGESA, NISEDS, BCEAO, IMF
2014 2015 2016 2017 2018 2019
National Economy
Nominal GDP 2 259.05 2 471.78 2 618.08 2 774.19 2 975.16 3 199.06
Real GDP growth (%) 5.9 5.7 4.9 4.4 4.9 5.3
Investment rate (%
of GDP) 27.9 32.2 28.7 24.1 25.3 24.1
Inflation rate (in %) 0.2 1.8 0.9 -0.2 0.9 0.7
Balance of paiments
Exports of goods 655.5 597.7 614.2 591.5 600.4 631.9
Imports of goods 1 093.9 1 208.5 1 185.9 965.3 1 035.1 1 110.9
Balance -438.40 -610.80 -571.70 -373.80 -434.70 -479.00
Current balance -226.4 -272.6 -258.7 -56.1 -102.7 -135.9
Government
Finances
Income and grants 466.8 539.5 571.3 595.8 710.8 747.0
Expenses 621.9 760.5 823.9 603.6 733.8 783.9
Balance -155.1 -220.9 -252.7 -7.8 -23.0 -36.9
Public Debt 1 439.32 1745.89 2092.67 2020.26 2191.04 2196.64
Domestic Debt 1 018.5 1 218.7 1 528.55 1 470.1 1 590.28 1 446.4
External debt 420.82
527.19 564.12 550.16 600.76 750.2
Domestic debt as %
of nominal GDP 45.1 49.3 58.4 53.0 53.6 45.2
Budgetary balance
In value terms -155.1 -220.9 -252.7 -7.8 -23.0 -36.9
As a percentage ofnominal GDP (%)
- 6.9 - 8.9 - 9.5 - 0.3 - 0.8 - 1.2
1.9.2 Summary table
The following table presents the main economic aggregates observed over the last five years. It is expressed in billions of CFA Francs for the values and in % for the rates, unless otherwise indicated.

36
2 RECENT ECONOMIC SITUATION AND OUTLOOK
2.1 Evaluation of gross domestic product
Economic activity in Togo over the 2014-2019 period was marked mainly by the implementation of the Strategy for Accelerated Growth and Employ-ment Promotion (SAGEP), the execution of agricultu-ral sector projects through the National Agricultural
Investment and Food Security Programme (NAIFSP) and the implementation of major construction and economic infrastructure strengthening works. The Togolese economy recorded an average annual growth rate of 5.2% over the 2014-2019 period.
Figure 5. Evolution of the economic growth rate and nominal GDP from 2015 to 2024
Source: NISEDS, IMF Country Report No. 20/107
For 2020, macroeconomic performance is negatively affected by the spread of COVID-19. The real GDP growth forecast for 2020 has been revised downward from 5.5% to 1.0%. Economic activity will continue to grow at a rate of 5.5% by 2024.
2.1.1 Level of GDP
In nominal terms, the gross domestic product would amount to CFA Francs 3.199.06 billion in 2019 against CFA Francs 2.259.05 billion in 2014, i.e. an average growth of 7.2% largely driven by the tertiary sector. Nominal GDP is expected to follow an upward trend to reach CFA Francs 4.789.0 billion in 2024.

37
Table 22. Evolution of the Gross Domestic Product (in billions of CFA Francs)
Source : NISEDS/DGESA
2014 2015 2016 2017 2018 2019
Est
Primarysector
580.2 602.5 691.0 654.9 696.7 735.4
Secondarysector
365.4 385.4 422.9 471.3 460.0 497.6
Tertiary sector
1 313.5 1 483.9 1 504.2 1 648.0 1 818.4 1 966.1
TOTALGDP
2 259.0 2 471.8 2 618.1 2 774.2 2 975.2 3 199.1
2.1.2 Real GDP growth
The growth rate would be 5.3% in 2019 and 5.9% in 2014. Despite the slight decline in the growth rate observed compared to 2014, overall activity is hol-ding up well, with an increase in the value added of the various sectors. The revival of growth would be favoured by the vigour of phosphate extraction acti-vities and cotton production, as well as by the good performance of the tertiary sector, especially airport activities, and by duties and taxes.
The economy is expected to benefit from the large public investments made in recent years and from increased foreign direct investment (FDI) flows. Thanks to the improved business environment and
public infrastructure, the private sector is expected to play an increasing role as an engine of growth. In 2020, the COVID-19 crisis will induce a slowdown in growth in line with the measures taken by the Go-vernment to curb the spread of the pandemic. Thus, growth would be 1.0% in 2020 but will consolidate in 2021 to reach 4% according to IMF estimates.
The analysis by sector shows that the Value Added (VA) of the primary sector, after a slowdown in its growth rate in 2017, consolidated from 2018 onwar-ds to reach 5.2% in 2019. At the level of the seconda-ry sector, average growth was 1.6% over the 2014-2019 period. For the commercial tertiary sector, the average annual growth rate over the period is 6.3%.
Table 23. Evolution of the real GDP growth rate
Source : NISEDS/DGESA, BCEAO, IMF forecasts
2014 2015 2016 2017 2018 2019(Est)
total GDP 5.9 5.7 4.9 4.4 4.9 5.3
Primarysector
7.4 0.0
5.4
1.3
3.4
5.2
Secondarysector
1.0 1.6 3.4 1.3 0.5 4.2
Tertiarysector
6.8 6.7 5.6 4.8 7.4 4.9
non-marketGDP
8.4 13.3 12.9 12.4 11.5 4.5
Duties andtaxes
7.6 18.3 - 0.8 0.1 0.5 4.8

38
Table 23. Evolution of the real GDP growth rate
Source : NISEDS/DGESA, BCEAO, IMF forecasts
2014 2015 2016 2017 2018 2019(Est)
total GDP 5.9 5.7 4.9 4.4 4.9 5.3
Primarysector
7.4 0.0
5.4
1.3
3.4
5.2
Secondarysector
1.0 1.6 3.4 1.3 0.5 4.2
Tertiarysector
6.8 6.7 5.6 4.8 7.4 4.9
non-marketGDP
8.4 13.3 12.9 12.4 11.5 4.5
Duties andtaxes
7.6 18.3 - 0.8 0.1 0.5 4.8
Table 24. Share of different sectors in GDP by value
Source : NISEDS/DGESA, BCEAO
2014 2015 2016 2017 2018 2019
Primarysector
25.7% 24.4% 26.4% 23.6% 23.4% 23.0%
Secondarysector
16.2% 15.6% 16.2% 17.0% 15.5% 15.6%
Tertiarysector
58.1% 60.0% 57.5% 59.4% 61.1% 61.5%
2.1.3 Structural decomposition of GDP
GDP growth was driven to a large extent by the ter-tiary and primary sectors throughout the 2014-2019 period. Indeed, the share of the tertiary17 sector in GDP increased from 58.1 % in 2014 to 61.5 % in 2019, averaging 59.6 % over the period 2014-2019.
The share of the primary sector increased from 25.7 % to 26.4 % in 2016 before declining slightly to sta-bilize at around 23.0 % in 2019. The share of the secondary sector increased from 16.2 % in 2014 to 17.0 % in 2017 before stabilizing at around 15.6 % in 2019.
17 Here the tertiary sector takes into account non-market GDP.
2.1.4 GDP by value, sector detail
The structure of Togo's economy shows a predo-minance of the tertiary and primary sectors in the formation of GDP. At the level of the primary sector, it appears in particular that agriculture plays an im-portant role in economic activity. Indeed, the value added of the agricultural sector increased from CFA
Francs 452.10 billion in 2014 to CFA Francs 520.70 billion in 2017. It represents on average 80% of the added value of the primary sector. In the tertiary sector, trade and transport and communications are the branches that create the most wealth. Indeed, the value added of the Transport, Warehouses and Communications branch increased from CFA Francs 248.70 billion in 2014 to CFA Francs 293.0 billion in

39
Table 25. GDP by value and its components
Source : NISEDS/ DGESA, BCEAO
Wording 2014 2015 2016 2017 2018(est)
2019(est)
Primary sector (i) 580.204 602.471 690.991 654.903 696.744 735.4
Agriculture 452.10 463,80 552,80 520.70 - -
Secondary sector (ii) 365.353 385.418 422.89 471.255 459.988 497.6
Gas, water, electricity 52.678 61.042 62.321 59.437 64.11 73
Buildings and publicworks 89.706 89.913 105.834 135.196 140.025 159
Extraction Sector 55.303 66.209 62.738 50.676 60.102 54.6
Industries 167.666 168.254 191.997 225.946 195.751 211
Tertiary sector (iii) 1313.49 1483.888 1504.196 1648.028 1818.431 1966.1
Trade 199.701 187.016 189.81 212.595 229.923 185.3
Transport, Warehousingand Communications 248.739 263.21 285.789 293.004 320.88 327.2
Banking and Insurance 73.60 91.80 90.60 89.10 - -
Other market services 239.267 292.825 327.268 351.93 383.857 406.7
market GDP 1960.992 2128.794 2214.404 2304.586 2469.875 2586.8
Public services 173.90 225.90 272.80 339.20 348.60 -
non - market GDP 298.055 342.983 403.673 469.599 505.288 612.3
NOMINAL GDP 2259.047 2471.777 2618.077 2774.185 2975.163 3199.1
2017. It represents on average over the 2014-2017 period, 24.6% of the value added of the tertiary sector.
As regards the trade branch, its value added fell from CFA Francs 175.0 billion in 2014 to CFA Francs 170.0 billion in 2017, thus marking a slight decline.
With regard to the secondary sector, it is noted that manufacturing industries have an important share in wealth creation. Indeed, the value added of the ma-nufacturing industries branch increased from CFA Francs 167.70 billion in 2014 to CFA Francs 225.90 billion in 2017. Its share is close to 50% of the wealth produced by the secondary sector.
2.1.5 GDP in composition
Since 2010, thanks to information and communi-cation technologies, the tertiary sector (excluding non-market GDP) has played a major role in the crea-tion of national wealth. Its weight in GDP in nominal terms was 42.3% in 2019 against 44.9% in 2014. The share of the Transport, Warehousing and Com-munications branch accounted for 10.8% of GDP in 2018 against 11.0% in 2014.
The primary sector accounted for 23.0% of GDP in 2019 and 25.7% in 2014. It is dominated by the agriculture sector with a share of around 18% of GDP between 2014 and 2017. As for the secondary sector, it is driven by the manufacturing industries branch whose share in GDP amounted to 8.1% in 2017 against 7.4% in 2014.

40
Source : NISEDS/ DGESA, BCEAO
Wording 2014 2015 2016 2017 2018 2019
(est) (est)
Primary sector (i)
257% 24.4% 26.4% 23.6% 23.4% 23.0%
Agriculture 20.0% 18.8% 21.1% 18.8%
Secondary sector (ii)
16.2% 15.6% 16.2% 17.0% 15.5% 15.6%
Gas, water,electricity
2.3% 2.5% 2.4% 2.1% 2.2% 2.3%
Buildings andpublic works
4.0% 3.6% 4.0% 4.9% 4.7% 5.0%
ExtractionSector
2.4% 2.7% 2.4% 1.8% 2.0% 1.7%
Industries 7.4% 6.8% 7.3% 8.1% 6.6% 6.6%
Tertiary sector (iii)
58.1% 60.0% 57.5% 59.4% 61.1% 61.5%
Trade 8.8% 7.6% 7.2% 7.7% 7.7% 5.8%
Transport,Warehousing andCommunications
11.0% 10.6% 10.9% 10.6% 10.8% 10.2%
Banking andInsurance
3.3% 3.7% 3.5% 3.2%
Other market services
10.6% 11.8% 12.5% 12.7% 12.9% 12.7%
market GDP 86.8% 86.1% 84.6% 83.1% 83.0% 80.9%
Public services 7.7% 9.1% 10.4% 12.2% 11.7%
non-market
GDP 13.2% 13.9% 15.4% 16.9% 17.0% 19.1%
NOMINAL GDP 100.0% 100.0% 100.0% 100.0% 100.0% 100.0%
Table 26. GDP in composition (%)
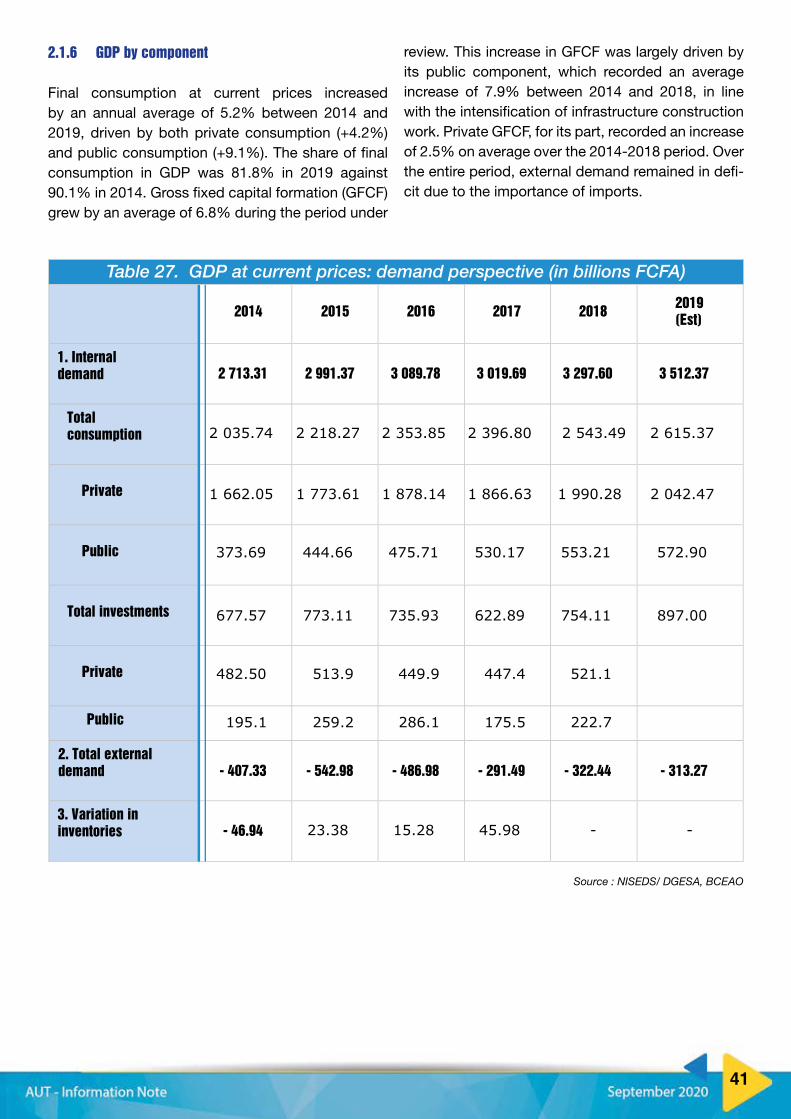
41
2.1.6 GDP by component
Final consumption at current prices increased by an annual average of 5.2% between 2014 and 2019, driven by both private consumption (+4.2%) and public consumption (+9.1%). The share of final consumption in GDP was 81.8% in 2019 against 90.1% in 2014. Gross fixed capital formation (GFCF) grew by an average of 6.8% during the period under
review. This increase in GFCF was largely driven by its public component, which recorded an average increase of 7.9% between 2014 and 2018, in line with the intensification of infrastructure construction work. Private GFCF, for its part, recorded an increase of 2.5% on average over the 2014-2018 period. Over the entire period, external demand remained in defi-cit due to the importance of imports.
Source : NISEDS/ DGESA, BCEAO
2014 2015 2016 2017 2018 2019(Est)
1. Internaldemand
2 713.31 2 991.37 3 089.78 3 019.69 3 297.60 3 512.37
Totalconsumption
2 035.74 2 218.27 2 353.85 2 396.80 2 543.49 2 615.37
Private 1 662.05 1 773.61 1 878.14 1 866.63 1 990.28 2 042.47
Public 373.69 444.66 475.71 530.17 553.21 572.90
Total investments 677.57 773.11 735.93 622.89 754.11 897.00
Private 482.50 513.9 449.9 447.4 521.1
Public 195.1 259.2 286.1 175.5 222.7
2. Total externaldemand
- 407.33 - 542.98 - 486.98 - 291.49 - 322.44 - 313.27
3. Variation ininventories
- 46.94
23.38
15.28
45.98 - -
Table 27. GDP at current prices: demand perspective (in billions FCFA)

42
3 ANALYSIS OF THE NATIONAL DEVELOPMENT PLAN
3.1 Recent Achievements and Accomplishments
3.1.1 Presentation of the national development plan
In order to find appropriate responses to the dete-rioration of macroeconomic and social indicators, a consequence of several years of socio-political crises, Togo embarked in 2006 on a process of struc-tural reforms and macroeconomic policies through the implementation of national poverty reduction strategies, the latest of which was the Strategy for Accelerated Growth and Promotion of Employment (SAGPE) 2013-2017. This process made it possible to conduct, at both local and central levels, a pros-pective reflection on the strategic issues of sustai-nable development, particularly the economic and social challenges facing the country.
The implementation of various development policies has enabled Togo to make progress in economic recovery through regular real GDP growth of 5 % on average per annum over the period 2013-2017, reflecting an improvement in macroeconomic stabi-lity. The incidence of poverty fell by 3.6 percentage points between 2011 and 2015, from 58.7 % to 55.1 % of the total population. Employment increased between 2011 and 2015 as evidenced by the reduc-tion in unemployment by 3.1 percentage points, from 6.5 % in 2011 to 3.4 % in 2015. However, in 2017, the unemployment rate worsened by 0.5 percentage points to 3.9%. The underemployment rate also re-mains high (26.7% in 2017).
Despite the significant progress made over the past decade or so, significant challenges persist in terms of social and spatial inequalities, the weakness of the national productive system, human resources and governance. With the implementation of the SAGPE having been completed, Togo has adopted a National Development Plan (NDP) for the period 2018-2022. The NDP draws on the lessons learned from the implementation of the various successive poverty reduction strategies and takes into account
the residual challenges arising from the SAGPE re-views and the results of the prioritization of Sustai-nable Development Goals (SDGs) targets at the cen-tral and regional levels. It also draws inspiration from the African Union's Agenda 2063 and the Economic Community of West African States (ECOWAS) Vision 2020.
The NDP intends to reconcile and translate the am-bitions of emergence and sustainable development through the structural transformation of the economy and the professionalization of the various sectors of the value chains, the acceleration of growth, the re-duction of poverty and inequality and the preserva-tion of the environment. To achieve this ambition, the actions are centred on three (03) Strategic axis 1: Set up a logistics hub of excellence and a first-rate bu-siness center in the sub-region.
• Strategic axis 2 : develop poles of agricultural processing, manufacturing and extractive in-dustries.
• Strategic axis 3 : consolidate social develop-ment and strengthen inclusion mechanisms.
The overall cost of investments registered in the NDP amounts to CFA Francs 4.622.2 billion over the pe-riod 2018-2022 with an expected contribution of the private sector of 65%, i.e. an amount of CFA Francs 2.999.1 billion. Public investment expenditure in this plan is estimated at CFA Francs 1.623.1 billion, re-presenting 35% of the overall cost.
The structural transformation should make it pos-sible to achieve real GDP growth of 7.6 %18 by 2022, leading to an acceleration in the level of human de-velopment and, above all, an improvement in Togo's world HDI ranking by at least ten (10) places. Thanks to the support of the private sector and development partners, resources will be devoted to the agricul-
18 Il This is the optimistic scenario. The results of the macroeconomic framework carried out according to a reference scenario assumes average growth of 5.2% over the period 2018-2022. Also with the advent of COVID-19, the expected growth for 2022 is 5.5%.

43
18 Source : TOGO NDP 2018-2022
ture sector with innovative and adapted financing mechanisms that will be used as a priority to moder-nize agriculture. This includes improving agricultural yield through the development of adapted mecha-nization, control of water use and strengthening of cooperatives linked to the processing sector.
There are also plans to set up agropoles around high value-added commodity chains (including rice, pineapple and poultry) and to install a major pro-cessing plant for each targeted high value-added commodity chain. The manufacturing and extractive industries are identified19 as key pillars for significant economic growth that creates jobs. To this end, Togo will set up a manufacturing and extractive industries cluster.
The NDP will place particular emphasis on : (i) voca-tional training, which is a central element in impro-ving the productivity of the economy, accelerating youth employment and reducing social inequalities; (ii) social protection, in order to gradually broaden in-clusion to all strata of the population and strengthen the contribution of the social sector to wealth crea-tion; (iii) corporate social responsibility, in order to increase citizen accountability for the protection of rights; and (iv) continued efforts to improve the qua-lity of and access to basic social services, including general education, health, nutrition, energy services, water and sanitation.
The monitoring mechanism for the implementation of the NDP is based on a very adequate intentio-nal framework. It is planned to set up an agency dedicated to the implementation of the NDP. All the ministries making up the government architecture, public bodies, local public administrations and de-centralized local authorities are the institutional ac-tors in the implementation of the NDP. The private sector and civil society, as partners of the State, will be strongly involved in the definition and implemen-tation of certain specific components. The develop-ment partners will also be called upon to provide the State and other national development actors with appropriate technical and financial assistance in ac-cordance with the needs expressed.
The operationalization of the NDP is also based on the implementation of the Priority Action Matrix
(PAM), which contains the major actions and strate-gic investment measures needed to achieve the targets. A framework for measuring performance in-dicators and monitoring-evaluation is also defined. The three-year public investment program (PIP) aligned with the strategic guidelines of the NDP re-mains a tool for operationalizing the plan, the annual instalment of which constitutes the investment part of the general budget. In addition, it is planned to strengthen the capacity of the national statistical system to meet the challenges of strengthening the coordination of the activities of the national statis-tical system between NISEDS and the sectoral mi-nistries, the regular production of reliable statistics, particularly those from administrative sources, and the non-systematically sustainable financing of ma-jor statistical activities.
3.1.2 Structural reforms related to the National Deve-lopment Plan
In order to give impetus to a new economic dynamic based on the structural transformation of the natio-nal economy, Togo has opted for a new agricultural policy based on the development and promotion of agropoles. This new agricultural policy benefits from financing estimated at nearly CFA FRANCS 64 bil-lion. This new strategy for the promotion of agro-poles, launched in 2017, aims on the one hand at the transformation of agricultural, fishing and lives-tock products into manufactured products through the promotion of SME/SMIs and the strengthening of relations between the production, processing and marketing activities of these products. On the other hand, it aims to create synergy between most of the players and to promote social inclusion with a view to improving the living conditions of the rural popu-lation.
For the next five years, the implementation of this policy should focus on pilot agropoles: i) in the Kara basin centred around the sesame, poultry and be-verage (fruit juice) value chains, ii) in the Oti basin around the rice, poultry and livestock/meat value chains, and iii) on the support of private stakeholders in the cashew nut sector with a view to creating an agropole in the Haut-Mono. The overall cost of the project, piloted by the Agence de Promotion et de Développement des Agropoles au Togo (APRODAT),

44
is estimated at CFA FRANCS 64 billion, of which CFA FRANCS 35 billion will be financed by the AfDB and BOAD. It is expected to invest in research, in-novation, training and capacity building of the va-rious stakeholders in the agricultural world in order to have more qualified human resources capable of making this new policy a success with concrete and sustainable positive impacts. The implementation of the agropoles will contribute to poverty reduction, mainly in rural areas, with a reduction of more than 15% over the next five years, and to job creation. It will also contribute to wealth creation in rural areas and to reducing the agricultural trade balance deficit.To definitively solve the problem of access to bank credits and financing for the agricultural sector, Togo launched the Incentive Mechanism for Agricul-tural Financing (IMAF) in June 2018. It is a project based on risk sharing which aims to be a driving force for the granting of more generous agricultural loans from the banking sector and to lower interest rates on credits granted to this sector. Through this mechanism, the aim is to develop policies adapted to the agricultural sector, to apply risk management tools to attract key skills and actors through effec-tive mechanisms and to consolidate the links of the different value chains. By adopting it, Togo wants to finance the agricultural sector differently and lead its green revolution. In total, more than one million pro-ducers should be favourably impacted by 2021. This mechanism receives financial support from the In-ternational Fund for Agricultural Development (IFAD) and the African Development Bank (ADB).
As part of the implementation of the Togolese govern-ment's commitments to sustainable development objectives, particularly SDO7 on universal access to reliable and affordable energy services, Togo has also adopted a new national electrification strategy. In 2018, 45 % of Togolese had access to electricity, of which only 8 % were in rural areas. The electrifi-cation strategy is based on an optimal technologi-cal combination to provide access to electricity to all Togolese by 2030. The country hopes to install 300 mini-solar power stations in PPP (public-private partnership) mode and to strengthen off-grid cove-rage by connecting 555 000 remote households via individual kits. In addition, the electricity grid will be extended to nearly 1.000 localities.
The implementation of a national biometric identifi-cation system (e-ID) through the definition of the le-gal and regulatory framework was approved by the Council of Ministers on Thursday 6 March 2020. This project, with a total cost of 40 million US dollars, is mainly aimed at establishing a system of identifica-tion and authentication of natural persons, in order to offer, among other things, better public and social services.
3.2 Future projects
Togo is aware that the development of the railway network is essential to strengthen its role as a tran-sit and export country for mining and industrial pro-ducts. Thanks to its more competitive tariffs com-pared to road tariffs and its loading capacity, the rail network could considerably improve the mobility of goods on the national territory. Togo's ambition is to significantly increase rail traffic. To this end, the reha-bilitation and construction of the Lomé-Cinkassé line on the border with Burkina Faso and the modernisa-tion of the existing network are projects.
These are based on the anticipation of an increase in potential traffic, both internal and external. The Lomé Cinkassé railway will link the Autonomous Port of Lomé to the border with Burkina Faso to serve Burkina Faso, Mali and Niger. It will thus promote the fluidity of trade between Togo and these countries. Almost 700 km long, this project aims not only to support the development and growth of the Togolese economy, but also to stimulate cross-border trade and the growth of hinterland economies. Entrusted to the state holding company Togo Invest, the pro-ject, for which pre-feasibility studies have already been carried out, will also make it possible to deve-lop effective and efficient logistics systems around the port and the railway line, speed up container transport to the Sahel countries, and create several jobs.
In the mining sector, the Government of Togo signed two important partnerships with DIL (Dangote Indus-tries Limited) in November 2019. With a total cost of US$2.6 billion, these agreements are in line with the NDP. These partnerships are aimed at : (i) the valo-

45
rization and transformation of phosphate into phos-phate fertilizers in order to supply the entire West African sub-region ; (ii) the establishment of a new
cement plant on Togolese soil, with the Togolese and Nigerian clincker as raw material.

46
4 MONETARY SYSTEM AND FINANCIAL MARKETS
4.1 Structural elements
4.1.1. Description of the Franc zone
The Franc zone is characterized by four (4) founding principles. These principles were set out in the mo-netary cooperation agreement between the Member States of the Bank of Central African States' issuing zone and France of 23 November 1972, as well as in the cooperation agreement between the Member States of the West African Monetary Union and France of 4 December 1973.
The 4 main principles of the Franc zone are:
• A guarantee from the French Treasury for the unlimited convertibility of the Central Bank cur-rency: currencies issued by issuing institutions in the Franc zone have unlimited convertibility guaranteed by the French Treasury. To ensure the free convertibility of each of the sub-areas, an operations account is opened with the French Treasury by each Central Bank of the zone and on which the Central Banks have an unlimited drawing right in case of exhaustion of their foreign currency reserves;
• A fixed parity with the Euro of 1 Euro for 655.957 CFAF: the parity of the zone's cur-rency with the Euro is fixed and defined for each subzone. The currencies of the zone are convertible between them, at fixed parities, wi-thout limitation of amounts. The changeover to the euro resulted in a simple substitution of the peg to the French franc by the peg to the euro, at an equivalent parity, i.e. 655.957 CFAF = 1 euro (the parity being identical for the West and Central African sub-areas)
• Free and unlimited transfer of reserves: trans-fers are, in principle, free within the Zone.
• Centralization of reserves: The States centra-lize their foreign exchange reserves in their Central Banks, while in return for the unlimited
convertibility guaranteed by France, the Cen-tral Banks of the franc zone are required to de-posit a share of their net foreign assets (foreign exchange reserves) with the French Treasury in the operations account opened in the name of each of them. Since the reform of September 2005, BCEAO has been required to deposit 50% of its foreign assets on its operations ac-count.
A new monetary agreement was signed in December 2019 by WAEMU member states and France to re-form the CFAF. It lays the foundations for the ac-cession of member countries to the ECO, the single currency project of ECOWAS. In order to enable WAEMU economies to prepare for the ECO, the monetary cooperation agreements linking member states of the zone to France have been profoundly revised. Three decisions were taken:
• The change of the name of the currency from CFA Franc to ECO, when the WAEMU coun-tries join the new ECOWAS ECO zone;
• The end of the centralization of foreign ex-change reserves at the French Treasury, the closure of the operations account and the transfer to BCEAO of the resources available in the account;
• The withdrawal of all French representatives in the decision-making and management organs of WAMU (BCEAO Board of Directors, Banking Commission and Monetary Policy Committee).
Two key elements of monetary stability have been retained:
• Maintaining the fixed exchange rate against the euro (which ensures the current parity).
• The guarantee of unlimited convertibility of the currency by France.

47
In May 2020, the bill ratifying the end of the CFA franc was adopted by France in the Council of Minis-ters. It validates the transformation of the CFA franc, which will become the ECO, by maintaining a fixed parity with the Euro and the end of the centralization of foreign exchange reserves of West African states with the French Treasury.
4.1.2. Description of BCEAO
WAEMU Treaty Article 41 designates the Central Bank of West African States (BCEAO) as an au-tonomous specialized institution of the Union. In complete independence, BCEAO contributes to the achievement of the objectives of the Treaty.
Members
The eight (8) Member States of WAEMU are members of BCEAO. They are Benin, Burkina Faso, Côte d'Ivoire, Guinea-Bissau, Mali, Niger, Senegal and Togo.
Organs
The organs of the Central Bank are: The Governor, the Monetary Policy Committee, the Board of Direc-tors, the Audit Committee, the National Credit Coun-cils, with one Council in each of the WAMU Member States
Functioning
The Central Bank, its organs, any member of its or-gans or its staff may not seek or receive instructions or directives from Community institutions or organs, from the governments of WAEMU Member States, from any other body or from any other person. Com-munity institutions and bodies and the governments of WAEMU member states undertake to respect this principle.
The main objective of the Central Bank's monetary policy is to ensure price stability. Without prejudice to this objective, the Central Bank supports the eco-nomic policies of the West African Economic and Monetary Union (WAEMU) with a view to achieving sound and sustainable growth.
Roles
The Central Bank is entrusted with the following fun-damental tasks:
• Defining and implementing monetary policy within WAEMU;
• Ensure the stability of the WAEMU banking and financial system;
• Promote the smooth functioning and ensure the supervision and security of payment sys-tems in WAMU;
• Implement WAEMU's exchange rate policy in accordance with the conditions laid down by the Council of Ministers;
• Manage the official foreign exchange reserves of WAEMU member states.
The Central Bank may carry out, while respecting the monetary balance, specific missions or projects that contribute to improving the monetary policy en-vironment, diversifying and strengthening the WAE-MU financial system and technical and professional capacities in the banking and financial sector.
The main objective of the Central Bank's monetary policy is to ensure price stability. To this end, it de-fines the monetary policy that makes it possible to maintain the external coverage rate of the currency at a satisfactory level and to support the economic activity of the member countries without inflationary pressure20.
BCEAO oversees the monetary policy of each member country through the elaboration of mo-ney supply and credit targets set on an annual ba-sis. Statutory advances to the national treasuries of member states were suspended in 2001 and aboli-shed as from 2010.
For the management of the common monetary po-licy, BCEAO relies on market mechanisms and indi-rect instruments for regulating liquidity, in particular the steering of interest rates and the system of com-pulsory reserves.
20 The Monetary Policy Committee of BCEAO, at its first meeting held on 14 September 2010 in Dakar, defined the operational objective of price stability as an annual inflation rate in the Union within a margin of ± one percentage point (1%) around 2%, with a horizon of twenty-four (24) months.

48
4.1.3. Monetary policy
BCEAO benefits from the exclusive privilege to issue money in all member states of the West African Mo-netary Union. It issues monetary signs, banknotes and coins, which are legal tender and have the power of discharge in all member states of the Union. The creation, issue and cancellation of monetary signs are decided by the Council of Ministers.
The management of the monetary policy of the Member States of the Union by the Central Bank consists of adjusting the overall liquidity of the eco-nomy in accordance with the evolution of the eco-nomic situation in order to ensure price stability on the one hand and to promote economic growth on the other.
The current money and credit management system relies on market mechanisms and indirect instru-ments to regulate liquidity, including interest rates and the reserve requirement system.
The functioning of BCEAO is based on:
Open market operations: seven-day and twenty-eight-day refinancing (respectively every week and every month for banks subject to compulsory re-serves) allocated at variable rates; the minimum bid rate considered by BCEAO as its key rate (currently 2.0%). Planned auctions are generally calibrated ac-cording to BCEAO's forecasts of liquidity needs over the maturity of the operations;
Permanent lending windows: refinancing for 1 to 7 days or 90 to 360 days against government securi-ties and credit applications with maturities ranging from 5 to 20 years, at the request of banks (margi-nal lending window). The rates of these windows are above the key rate of 200 basis points. As of June 2017, recourse to the lending window has been cap-ped at twice the counterparty's own funds.
The minimum interest rate for bidding in open mar-ket operations (tenders) and the interest rate appli-cable on the marginal lending window (repo rate), the levels of which are set by the Monetary Policy Committee, are 2.00% and 4.00% respectively, and constitute the two main key rates of BCEAO.
Money supply (Monetary supply)
The monetary supply has steadily increased over the period under review from CFA Francs 1 057.69 billion in 2014 to CFA Francs 1 804.03 billion in 2019. This progression results from the increase in both domes-tic and foreign assets. However, it should be noted that national assets recorded a decline of 6.2% in 2019 compared to their 2018 level. Deposits repre-sented on average 82.2% of the money supply du-ring the period under review, compared with 17.8% for currency in circulation.
Domestic assets rose over the 2014-2018 period be-fore declining by 6.2% in 2019 from their 2018 level. The decline in 2019 is driven by a 78.7 % decline in the Government's net debtor position compared with 2018.
Table 28. Evolution of money supply aggregates (in Billion of CFA Francs)
Source : BCEAO
2014 2015 2016 2017 2018 2019
Foreign Assets 309.65 455.63 530.75 546.85 562.20 730.98
Foreign Assets 30.86 158.38 90.60 83.49 68.14 248.94
In the Banks 278.79 297.25 440.15 463.35 494.06 482.04
Domestic assets 943.43 1 118.40 1 183.40 1 345.60
To the credit of
the State 81.69 59.90 30.95 164.93 208.41 44.26
Central Bank 36.15 51.86 -
13.37
-
11.84 25.83
-
115.38
Bank 45.55 8.04 44.32 176.77 182.58 159.64
To the credit of
the economy 861.74 1 058.46 1 152.48 1 176.87 1 225.69 1 301.29
Others
- 195.38
- 296.52
- 278.45
- 309.98
- 272.20 - 272.51
Money supply
(M2) 1 057.70 1 277.47 1 435.72 1 578.67 1 724.09 1 804.03
Currencies in
circulation 146.26 240.49 245.23 298.25 335.21 338.70
Deposit 911.44 1 036.98 1 190.49 1 280.42 1 388.88 1 465.33
% increase observed at 31. Dec from n - 1 to n
Net foreign assets - 47.1 16.5 3.0 2.8 30.0
Net domestic
assets - 18.5 5.8 13.4 6.9 -6.2
Credit to the State - - 26.7 - 48.4 433.7 26.4 -78.7
Central Bank - 43.6 - 125.8 - 11.9 - 318.6 -547.3
Banks - - 82.4 453.8 299.1 3.3 - 12.6
Credit to the
Economy - 22.8 8.9 2.1 4.1 6.2
Money supply
(M2) - 20.8 12.4 10.0 9.2 4.6
1341.80 1 434.10

49
Table 28. Evolution of money supply aggregates (in Billion of CFA Francs)
Source : BCEAO
2014 2015 2016 2017 2018 2019
Foreign Assets 309.65 455.63 530.75 546.85 562.20 730.98
Foreign Assets 30.86 158.38 90.60 83.49 68.14 248.94
In the Banks 278.79 297.25 440.15 463.35 494.06 482.04
Domestic assets 943.43 1 118.40 1 183.40 1 345.60
To the credit of
the State 81.69 59.90 30.95 164.93 208.41 44.26
Central Bank 36.15 51.86 -
13.37
-
11.84 25.83
-
115.38
Bank 45.55 8.04 44.32 176.77 182.58 159.64
To the credit of
the economy 861.74 1 058.46 1 152.48 1 176.87 1 225.69 1 301.29
Others
- 195.38
- 296.52
- 278.45
- 309.98
- 272.20 - 272.51
Money supply
(M2) 1 057.70 1 277.47 1 435.72 1 578.67 1 724.09 1 804.03
Currencies in
circulation 146.26 240.49 245.23 298.25 335.21 338.70
Deposit 911.44 1 036.98 1 190.49 1 280.42 1 388.88 1 465.33
% increase observed at 31. Dec from n - 1 to n
Net foreign assets - 47.1 16.5 3.0 2.8 30.0
Net domestic
assets - 18.5 5.8 13.4 6.9 -6.2
Credit to the State - - 26.7 - 48.4 433.7 26.4 -78.7
Central Bank - 43.6 - 125.8 - 11.9 - 318.6 -547.3
Banks - - 82.4 453.8 299.1 3.3 - 12.6
Credit to the
Economy - 22.8 8.9 2.1 4.1 6.2
Money supply
(M2) - 20.8 12.4 10.0 9.2 4.6
1341.80 1 434.10
Foreign assets increased over the entire period un-der review from CFA Francs 309.6 billion in 2014 to CFA Francs 730.9 billion in 2019. In 2019, the in-crease in foreign assets stood at 30.0%, driven by Central Bank assets, against 2.8% in 2018 driven by primary bank assets.
4.2 Banking system and financial markets
4.2.1 The banking environment
The Togolese banking landscape had 14 banks21 in 2019 :
• International Bank for Africa in Togo (IBA-TO-GO) ;
• Togolese Bank for Trade and Industry (TBTI),
• Togolese Bank Union (TBU), • Inter-African Bank Corporation (IABC), • Ecobank - Togo, • Orabank CI TOGO Branch• Bank Atlantic TOGO• Sahelo-Saharan Bank for Investment and
Trade TOGO (SBIT– TOGO),• Popular Bank for Savings and Credit (PBSC),• NSIA BANK TOGO, • Bank Of Africa TOGO, • Post Office Corporation (POC),
• Coris Bank International- TOGO (CBI-TO-GO),
• Benin Societe Generale - TOGO branch.
Net foreign assets of commercial banks followed an upward trend over the 2014-2018 period be-
21 Source : TOGO NDP 2018-2022

50
fore declining by 2.4% in 2019 compared to 2018. The decline in 2019 is related to a 25.4% increase in liabilities to non-residents. Indeed, commitments to non-residents amounted to CFA Francs 318.64 billion in 2019 against CFA Francs 254.11 billion in 2018.
With regard to credit to the Central Bank, they in-creased overall during the period under review to CFA Francs 137.74 billion in 2019 against CFA Francs 110.10 billion in 2014. However, it should be noted that in 2017, credit to the Central Bank recorded a 41.1% decline compared to 2016. This decline can be explained by both deposits and cash. During the period under review, deposits averaged 69.4% as against 30.6% in cash, reflecting the financial health of commercial banks.
The net credit to central government amounted to CFA Francs 159.64 billion in 2019 against CFA
Francs 45.55 billion in 2014 in connection with a fas-ter progression of credits compared to that of com-mitments.
Credit to the economy increased to CFA Francs 1.298.37 billion in 2019 against CFA Francs 858.77 billion in 2014. Over the entire period under review, private sector financing was higher, averaging 92%. In fact, credit to the private sector increased from CFA Francs 801.23 billion in 2014 to CFA Francs 1 127.61 billion in 2019.
Other deposits and transferable deposits included in the broad money supply, and commitments to the Central Bank, constitute the three (3) largest compo-nents of commercial bank liabilities. Over the period under review, all liabilities were on an upward trend.
Table 29. Situation of commercial banks (Billion of CFA Francs)
Source : BCEAO, 2020
2014 2015 2016 2017 2018 2019
ASSETS
Net foreign assets 278.79 297.25 440.15 463.35 494.06 482.04
Credit to non-residents 482.79 600.34 773.48 773.84 748.17 800.68
Liabilities to non-residents - 204.00 -303.08 -333.34 -310.49 -254.11 -318.64
Credits to the Central Bank 110.10 119.51 160.48 94.45 128.75 137.74
Numeric 34.28 37.21 35.25 32.54 38.02 48.39
Deposits 75.82 82.31 125.23 61.86 90.72 89.35
Other Credit to the centralbank
0 0 0 0.1 0 0
Net Credit to the centralgovernment
45.55 8.04 44.32 176.77 182.58 159.64
Credit to the Headquarters 227.78 207.62 287.71 393.64 474.07 515.26
Commitments to theHeadquarters
-182.24
-199.59 -243.39 -216.87 -291.49 -355.62
Credit to the economy 858.77 1055.82 1150.07 1174.15 1222.78 1298.37
Credit to the other �nancialcompanies
6.43 6.45 7.50 19.86 16.10 10.87
Credit to the state and localgovernments
0.00 0.00 0.00 0.00 5.24 0.00
Credit to public non-�nancialcorporations
51.11 59.27 50.62 57.70 118.69 159.89
Credit to the private sector 801.23 990.09 1091.94 1096.59 1082.74 1127.61
Liabilities
Commitments to the central bank
185.55 174.94 341.78 316.21 350.11 351.90
Transferable deposits included inbroad money
395.96 426.66 511.71 534.68 554.34 595.60
Other deposits included in broadmoney supply
499.79 590.80 659.22 721.94 809.49 841.30
Securities other than shares includedin broad money
0 0 0 0 0 0
Deposits excluded from broad moneysupply
27.33 29.90 39.85 45.59 59.29 75.73
Securities other than shares excludedfrom the broad money supply
0.00 0.00 0.00 0.00 0.00 0.00
Loans
7.00 6.38 6.89 9.92 11.88 22.20
Financial derivatives 0.00 0.00 0.00 0.00 0.00 0.00
Technical insurance reserves 0.00 0.00 0.00 0.00 0.00 0.00
Shares and other investments 91.47 108.06 127.78 134.57 131.46 142.11
Other posts (net) 86.11 143.88 107.79 145.80 111.58 48.94

51
Table 29. Situation of commercial banks (Billion of CFA Francs)
Source : BCEAO, 2020
2014 2015 2016 2017 2018 2019
ASSETS
Net foreign assets 278.79 297.25 440.15 463.35 494.06 482.04
Credit to non-residents 482.79 600.34 773.48 773.84 748.17 800.68
Liabilities to non-residents - 204.00 -303.08 -333.34 -310.49 -254.11 -318.64
Credits to the Central Bank 110.10 119.51 160.48 94.45 128.75 137.74
Numeric 34.28 37.21 35.25 32.54 38.02 48.39
Deposits 75.82 82.31 125.23 61.86 90.72 89.35
Other Credit to the centralbank
0 0 0 0.1 0 0
Net Credit to the centralgovernment
45.55 8.04 44.32 176.77 182.58 159.64
Credit to the Headquarters 227.78 207.62 287.71 393.64 474.07 515.26
Commitments to theHeadquarters
-182.24
-199.59 -243.39 -216.87 -291.49 -355.62
Credit to the economy 858.77 1055.82 1150.07 1174.15 1222.78 1298.37
Credit to the other �nancialcompanies
6.43 6.45 7.50 19.86 16.10 10.87
Credit to the state and localgovernments
0.00 0.00 0.00 0.00 5.24 0.00
Credit to public non-�nancialcorporations
51.11 59.27 50.62 57.70 118.69 159.89
Credit to the private sector 801.23 990.09 1091.94 1096.59 1082.74 1127.61
Liabilities
Commitments to the central bank
185.55 174.94 341.78 316.21 350.11 351.90
Transferable deposits included inbroad money
395.96 426.66 511.71 534.68 554.34 595.60
Other deposits included in broadmoney supply
499.79 590.80 659.22 721.94 809.49 841.30
Securities other than shares includedin broad money
0 0 0 0 0 0
Deposits excluded from broad moneysupply
27.33 29.90 39.85 45.59 59.29 75.73
Securities other than shares excludedfrom the broad money supply
0.00 0.00 0.00 0.00 0.00 0.00
Loans
7.00 6.38 6.89 9.92 11.88 22.20
Financial derivatives 0.00 0.00 0.00 0.00 0.00 0.00
Technical insurance reserves 0.00 0.00 0.00 0.00 0.00 0.00
Shares and other investments 91.47 108.06 127.78 134.57 131.46 142.11
Other posts (net) 86.11 143.88 107.79 145.80 111.58 48.94
The rates charged by commercial banks vary according to the nature of the loan or deposit, whether short, medium or long-term. They also vary according to the time of year.

52
Table 30. Evolution in interest rates charged by commercial banks bytype of loan or deposit in 2019
Source : BCEAO, 2020
Average interest rate on loans granted
Average
less
than a
month
between
1 et 3
mois
between
3 et 6
mois
between
6 mois
et 1 an
between
1 et 2
ans
between
2 et 5
ans
between
5 et 10
ans
more
than
10
years
January 8.35 9.26 7.17 8.28 9.23 8.01 8.44 8.23 4.94
February 8.59 9.28 8.44 7.21 8.09 8.23 8.56 8.99 3.62
March 7.23 8.94 7.77 8.54 9.22 7.31 6.09 7.08 7.30
April 8.00 9.52 8.38 8.42 9.48 6.79 8.65 8.42 3.71
May 7.27 8.98 5.40 8.36 7.45 7.51 6.85 8.06 4.12
June 7.68 6.30 8.33 7.76 8.52 7.82 7.86 8.90 5.15
July 8.14 9.27 8.19 8.64 6.73 7.18 8.05 8.47 3.89
August 7.75 9.13 6.01 8.80 7.88 9.50 8.14 7.47 4.85
September 7.58 6.92 7.74 8.32 8.34 6.42 8.87 8.49 6.01
October 7.37 9.46 5.78 9.19 7.80 7.71 6.79 7.51 5.80
November 7.54 6.90 8.07 7.71 7.57 8.48 7.30 8.20 4.78
December 7.54 6.91 5.93 8.33 8.36 9.62 7.50 8.10 4.27
Average rate of return on deposits
Average
less
than 1
month
between
1 and 3
months
between
3 and 6
months
6
months
and 1
year
between
1 and 2
years
between
2 and 5
between
5 and
10 years
more
than
10
years
January 5.76 5.34 5.71 5.85 5.91 5.67 6.11 nd 6.12
February 5.45 5.37 5.21 5.72 5.84 4.69 5.37 nd 5.26
March 5.64 5.31 5.19 5.87 5.36 5.06 5.94 nd 6.53
April 5.57 5.27 5.88 6.01 5.49 3.42 5.57 nd 4.91
May 5.40 5.36 5.32 5.80 5.55 3.13 5.50 nd 5.26
June 5.46 5.24 5.20 6.17 5.52 5.04 5.89 nd 5.36
July 5.68 5.34 5.97 5.71 5.64 3.95 5.95 nd 4.31
August 5.39 5.31 4.89 5.80 6.38 6.19 4.81 nd 3.84
September 5.78 5.36 5.25 6.06 6.23 6.09 6.10 nd 6.03
October 5.64 5.44 5.51 5.72 6.16 5.86 5.79 nd 5.67
November 5.47 5.38 5.24 6.26 5.67 4.54 5.72 nd 4.48
December 5.46 5.35 5.19 5.80 5.48 5.67 5.51 nd 5.13

53
Microfinance
In Togo, the demographic penetration rate of micro-finance services was 1.3 % in 2018 and 1.1 % in 2014. The rate of use of microfinance services by the adult population (15 years and older) increased from 44.8 % in 2014 to 58.6 % in 2019.
As of September 30, 2019, the total number of De-centralized Financial Structures in Togo was 77 compared to 75 one year earlier. The number of de-positors increased from 2.48 million at September
30, 2018 to 2.8 million at September 30, 2019. The amount of deposits increased from CFA Francs 188 009 million as at 30 September 2018 to CFA Francs 209 523 million as at 30 September 2019. Outstan-ding loans increased by 8.03% between the two pe-riods. Indeed, the amount of outstanding loans in-creased from 161 272 million CFA Francs to 174 230 million CFA Francs. As at September 30, 2019, the amount of outstanding loans was CFA Francs 12.9 billion and the rate of deterioration of the portfolio was 7.40%.
Table 31. Microfinance indicators in Togo
Source : BCEAO’s Economic and Financial Database 2020
1T
2018
2T
2018
3T
2018
4T
2018
1T
2019
2T
2019
3T
2019
Number of members/ customers
2 296
892
2 379
985
2 483
190
2 559
933
2 615
380
2 706
712
2 864
379
Number of service
points 476 496 515 520 526 518 519
Total number of SFDs 75 75 75 76 76 73 77
Amounts of deposits
(in millions CFA Francs)
170
690
178
189
188
009
186
677
198
009
203
490
209
523
Outstanding credits (in
millions CFA Francs)
140
324
146
275
161
272
164
942
161
834
163
226
174
230
Amounts of outstandingreceivables (in millionsCFA Francs)
11 534 12 949 13 709 11 789 11 335 12 232 12 954
Rate of portfolio
deterioration 8.22% 8.85% 8.50% 7.15% 7.00% 7.49% 7.40%
4.2.2 Financial markets
The WAEMU financial market is structured around the debt securities market (public and private bonds) and the equity market. The regional public securities market has two (2) components: the auction market and the syndication market.
The public securities auction market is organized and regulated by BCEAO through Agence UMOA-Titres ; while the public securities syndication mar-ket, private bonds and shares are regulated by the Regional Council for Public Savings and Financial Markets (CREPMF) and organized by the Regional Stock Exchange (BRVM) and the Central Custodian/Settlement Bank (CC/BS).

54
4.2.2.1 Regional Stock Exchange
The Regional Stock Exchange (BRVM) is a specia-lized financial institution created on 18 December 1996, in accordance with a decision of the Council of Ministers of the West African Economic and Mo-netary Union (WAEMU) taken in December 1993.
BRVM is a public limited company with a commu-nity public service mission. It is common to the 8 countries of West Africa. BRVM/CC/SB started its activities on 16 September 1998 in Abidjan. Its main missions are the following:
• The organization of the stock market;• The publication of stock exchange transac-
tions;• Dissemination of information on the stock
exchange;• The promotion and development of the
market.
Evolution of BRVM bond and equity market
Since 2016, the WAEMU stock market (BRVM) has been experiencing successive declines that accele-rate until 2018 and then slowdown in 2019. It fell from -3.8% in 2016 to -16.81% in 2017 and -29.14% in 2018. However, the decline slows to -3.4% in 2019.This underperformance shows that the WAEMU market did not fully withstand the general downward trend that gripped the world's financial markets. BRVM's decline in 2018 is particularly marked. The stocks preferred in 2015, oriented towards the food
and beverage as well as agribusiness, consumer, au-tomobile and equipment and banking sectors, have experienced a decline.
The fall in BRVM prices could be explained, on the one hand, by the profit-taking of several large inves-tors who had made significant capital gains on their investment. The drop also comes from the readjust-ment (rectification) after four (4) years of intensive market increases (2012 to 2015) and, on the other hand, from the misunderstanding of the different splits made on the market. New investors are specu-lating and most listed companies have not reacted to the fall in their capitalization.
During the 2019 financial year, BRVM Composite Index rose from 172.2 on 31/12/2018 to 159.2 on 31/12/2019. The market capitalization of the stock market fell from CFAF 4.845 billion at the end of 2018 to CFAF 4.741 billion at the end of 2019, a drop of 2%.
BRVM also reached the CFAF 236 billion mark in transactions in 2018 and 117.303.543 shares were exchanged for a value of CFAF 174.449.217.023.
Concerning the bond compartment, 6.359.442 bonds were traded for a value of CFAF 61.767.647.783 in 2018. The market capitalization of bonds amounted to CFAF 4.233 billion as at 31 December 2019 against CFAF 3.444 billion the previous year, an increase of 23%. This improvement was driven by the appetite of WAEMU member states to use the regional finan-cial market to support their respective economies.

55
Table 32. Evolution of BRVM financial market
Source : BRVM
2013 2014 2015 2016 2017 2018 2019
BRVM 10 index 246 268 290 262 220 154 149
BRVM compositeindex 232 258 304 292 243 172 159
Composite marketcapitalization(shares and bonds)in billions of CFAfrancs
6 706 7 459 9 079 10 216 9 806 8 289 8 973
Equity Market 5 634 6 320 7 500 7 706 6 836 4 845 4 741
Bond Market 1 073 1 139 1 579 2 509 2 970 3 444 4 233
Number of listed companies 37 38 39 43 45 45 46
4.2.2.2 Bond market
In 2019, Togo issued seventeen (17) government securities, including fourteen (14) ATBs (Assimilable Treasury Bonds) with maturities ranging from 24 to 60 months and three (03) TABs (Treasury Assimi-lable Bonds) with a maturity of 12 months. On 11
May 2020, Togo had issued ten (10) bonds, inclu-ding eight (08) ATBs and two (02) ATBs. Assimilable Treasury Bonds (ATBs) are short-term debt securities issued by the government by auction. ATBs (Assi-milable Treasury Bonds are medium- and long-term debt securities issued by the government by auction.
Source : WAMU Security Agency
INSTRUMENT
TRANSACTIONDATE VALUE DATE MATURITY MATURITY
(MONTHS)
AMOUNT
(MILLIONSOF CFA
Francs)
AMOUNT
RETAINED (MILLIONS OFCFA Francs)
MARGINALRATE
WEIGHTEDAVERAGE
RATE
ATB 08/05/2020 11/05/2020 13/03/2023 36 35 000 22 383.40 6.15
ATB 08/05/2020 11/05/2020 02/03/2025 60 35 000 16 116,60 6.4
BAT 17/04/2020 20/04/2020 18/04/2021 12 20 000 22 000.00 5.25 5.04
ATB 13/03/2020 16/03/2020 16/03/2023 36 50 000 31 610.30 6.87 6.81
ATB 13/03/2020 16/03/2020 02/03/2025 60 50 000 10 819.72 6.76 6.51
ATB 13/03/2020 16/03/2020 16/03/2027 84 50 000 12 528.45 6.17 6.15
ATB 28/02/2020 02/03/2020 02/03/2025 60 25 000 27 500.00 6.4 6.37
ATB 14/02/2020 17/02/2020 03/02/2023 36 25 000 27 500.00 6.15 6.14
ATB 31/01/2020 03/02/2020 03/02/2023 36 25 000 27 500.00 6.15 6.11
BAT 17/01/2020 20/01/2020 17/01/2021 12 25 000 27 500.00 4.99 4.95
ATB 04/10/2019 07/10/2019 07/09/2022 36 20 000 22 000.00 6.53 6.39
ATB 06/09/2019 09/09/2019 09/09/2024 60 20 000 22 000.00 6.73 6.62
ATB 09/08/2019 13/08/2019 15/07/2022 36 20 000 22 000.00 6.82 6.55
ATB 26/07/2019 29/07/2019 11/03/2024 60 20 000 22 000.00 6.74 6.68
ATB 12/07/2019 15/07/2019 15/07/2022 36 20 000 22 6.62 6.52
ATB 28/06/2019 01/07/2019 03/06/2022 36 20 000 22 000.00 7.01 6.62
BAT 14/06/2019 17/06/2019 14/06/2020 12 20 000 15 729.00 6 5.83
ATB 31/05/2019 03/06/2019 03/06/2022 36 15 000 16 500.00 6.6 6.29
ATB 17/05/2019 20/05/2019 11/03/2024 60 20 000 22 000.00 6.73 6.62
BAT 19/04/2019 23/04/2019 20/04/2020 12 20 000 22 000.00 5.75 5.63
ATB 05/04/2019 08/04/2019 11/03/2022 36 20 000 22 000.00 7.22 7.17
ATB 08/03/2019 11/03/2019 11/03/2022 36 20 000 16 587.71 7.39 7.26
ATB 08/03/2019 11/03/2019 11/03/2024 60 20 000 5 412.29 7.48 7.34
ATB 22/02/2019 25/02/2019 23/04/2021 24 15 000 13 000.00 8 7.88
ATB 08/02/2019 11/02/2019 11/02/2022 36 20 000 20 000.00 7.99 7.57
ATB 25/01/2019 28/01/2019 28/01/2022 36 20 000 22 000.00 7.58 7.38
BAT 10/01/2019 11/01/2019 09/01/2020 12 20 000 13 625.00 6.5 6.44
Table 33. Evolution of BRVM financial market

56
22 Automated Securities and Liquidity Management System of the West African Monetary Union.23 All other investors wishing to participate will have to go through the approved participants.24 The operationalisation of primary dealers in the WAEMU started on 1 March 2016.
Source : WAMU Security Agency
INSTRUMENT
TRANSACTIONDATE VALUE DATE MATURITY MATURITY
(MONTHS)
AMOUNT
(MILLIONSOF CFA
Francs)
AMOUNT
RETAINED (MILLIONS OFCFA Francs)
MARGINALRATE
WEIGHTEDAVERAGE
RATE
ATB 08/05/2020 11/05/2020 13/03/2023 36 35 000 22 383.40 6.15
ATB 08/05/2020 11/05/2020 02/03/2025 60 35 000 16 116,60 6.4
BAT 17/04/2020 20/04/2020 18/04/2021 12 20 000 22 000.00 5.25 5.04
ATB 13/03/2020 16/03/2020 16/03/2023 36 50 000 31 610.30 6.87 6.81
ATB 13/03/2020 16/03/2020 02/03/2025 60 50 000 10 819.72 6.76 6.51
ATB 13/03/2020 16/03/2020 16/03/2027 84 50 000 12 528.45 6.17 6.15
ATB 28/02/2020 02/03/2020 02/03/2025 60 25 000 27 500.00 6.4 6.37
ATB 14/02/2020 17/02/2020 03/02/2023 36 25 000 27 500.00 6.15 6.14
ATB 31/01/2020 03/02/2020 03/02/2023 36 25 000 27 500.00 6.15 6.11
BAT 17/01/2020 20/01/2020 17/01/2021 12 25 000 27 500.00 4.99 4.95
ATB 04/10/2019 07/10/2019 07/09/2022 36 20 000 22 000.00 6.53 6.39
ATB 06/09/2019 09/09/2019 09/09/2024 60 20 000 22 000.00 6.73 6.62
ATB 09/08/2019 13/08/2019 15/07/2022 36 20 000 22 000.00 6.82 6.55
ATB 26/07/2019 29/07/2019 11/03/2024 60 20 000 22 000.00 6.74 6.68
ATB 12/07/2019 15/07/2019 15/07/2022 36 20 000 22 6.62 6.52
ATB 28/06/2019 01/07/2019 03/06/2022 36 20 000 22 000.00 7.01 6.62
BAT 14/06/2019 17/06/2019 14/06/2020 12 20 000 15 729.00 6 5.83
ATB 31/05/2019 03/06/2019 03/06/2022 36 15 000 16 500.00 6.6 6.29
ATB 17/05/2019 20/05/2019 11/03/2024 60 20 000 22 000.00 6.73 6.62
BAT 19/04/2019 23/04/2019 20/04/2020 12 20 000 22 000.00 5.75 5.63
ATB 05/04/2019 08/04/2019 11/03/2022 36 20 000 22 000.00 7.22 7.17
ATB 08/03/2019 11/03/2019 11/03/2022 36 20 000 16 587.71 7.39 7.26
ATB 08/03/2019 11/03/2019 11/03/2024 60 20 000 5 412.29 7.48 7.34
ATB 22/02/2019 25/02/2019 23/04/2021 24 15 000 13 000.00 8 7.88
ATB 08/02/2019 11/02/2019 11/02/2022 36 20 000 20 000.00 7.99 7.57
ATB 25/01/2019 28/01/2019 28/01/2022 36 20 000 22 000.00 7.58 7.38
BAT 10/01/2019 11/01/2019 09/01/2020 12 20 000 13 625.00 6.5 6.44
Table 33. Evolution of BRVM financial market
4.2.2.3 Stock market
Two companies based in Togo are listed on the Bourse Régionale des Valeurs Mobilières. They are Ecobank Transnational Incorporated (ETI) and ORAGROUP. Ecobank Transnational Incorporated, a bank founded in 1985, joined BRVM on 11 Sep-tember 2006. It is present in 36 African countries and is currently the second largest bank in Africa. As for the ORAGROUP banking group, it joined BRVM on 16 April 2019. The group is present in twelve coun-tries in West and Central Africa.
4.2.3 Debt underwriting mechanisms
Any investor based in or outside the WAEMU may invest in public securities issued by auction or syndi-cation. Orders are placed through authorized market participants: an underwriting syndicate or any MIC operating in the Union in the case of issues by syn-dication, and credit institutions based in the Union or MICs having an account in the books of the Central Bank in the case of issues by auction. Transactions on BRVM share market are carried out through stock exchange intermediaries, in particular MIC.
Organization of market by auction
The auction market is a segment of the public se-curities market, on which WAEMU member states issue Treasury bills and bonds following an auction procedure in order to finance their budgets.
Unlike the syndication market, the auction market is led by the following players:
• The Central Bank of West African States (BCEAO), which is the regulator of this market. As such, it enacts the applicable provisions, intervenes in the organization of auctions of public securities, acts as Central Custodian / Settlement Bank, clearing, settlement and deli-very of transactions between participants with an account in its books, through its electronic platform SAGETIL-UMOA22 ;
• States which are the issuers of public debt se-curities on the Union's money market, under the responsibility of the Minister of Finance;
• Agence UMOA-Titres, a regional structure in charge of issuing and managing public debt securities, materially organises issues and, in this capacity, provides assistance to Member States in mobilizing resources on the capital markets and managing their debt;
• Investors which are credit institutions, IMS and regional financial bodies with a settlement ac-count in the books of the Central Bank23 ;
• Specialists in Treasury Securities (STSs) which are credit institutions and IMSs that have ob-tained the approval of the Ministers in charge of Finance of WAEMU Member States to act in this capacity and thus benefit from the status of privileged partners of one or more Treasuries of Member States on transactions on public debt securities issued on the regional market.24

57
Securities issued by auction are traded on the se-condary market, following an over-the-counter procedure.
Organization of the markets by syndication
The WAEMU regional financial market is charac-terized by a mixed organization. Indeed, it is com-posed of a public sector consisting of the Regional Council for Public Savings and Financial Markets (CREPMF) and a private sector which includes the central structures of the Regional Stock Exchange (BRVM) and the Central Custodian/Bank of Settle-ment (CC/BS) on the one hand, and the commercial players on the other.
CREPMF is the WAEMU's regional financial market regulator (FMR). Its missions are, among others, to :
• To ensure the authorization and control of pu-blic offering procedures;
• Authorize market management structures and approve commercial operators;
• Approve the tariffs of commercial operators;• Regulating the operation of the market;• Ensure the supervision of the regularity of
stock exchange operations.
BRVM is organized at a central site based in Abi-djan (Côte d'Ivoire) and represented in each member state by a National Stock Exchange Antenna (NSEA). The main responsibilities of BRVM are:
• Authorization of the scholarship holders to carry out their activity;
• The management of the market, in particular ensuring the centralization of buy or sell or-ders, the management of the coast, the dis-semination of market information, as well as the promotion and popularization of financial culture within the WAEMU;
• The management of unsettled transactions.
The Central Custodian/Settlement Bank (CC/BS) is a financial institution whose role is to:
• To clear applicants for the position of account keeper;
• Ensuring the settlement of negotiations and the management of the financial service of se-curities;
• Ensure the maintenance of current accounts for securities opened by Management and In-termediation Companies (MIC) in its books;
• To ensure the safekeeping and the scriptural circulation of securities;
• Proceed to the payment in cash, in its capacity as settlement bank, of the balances of stock exchange transactions.
When organizing issues by syndication, the States entrust the process of placing the securities to an un-derwriting syndicate, whose members are MICs ap-proved by CREPMF. In addition, the issuer chooses a lead manager from among the syndicate's members to carry out specific tasks in the issuance process.
Since its creation, the main products present on the regional financial market have been equities and bonds. In recent years, several new products such as mortgage refinancing and securitization (Sukuk Debt Securitization Fund) have been introduced. Se-curities issued by syndication are traded on the se-condary market on BRVM's electronic trading plat-form.
4.3 Inflation rate
Since 2015, the inflation is contained within the 3% limit prescribed by the WAEMU. The average infla-tion rate was 0.8% over the period 2015 to 2019. In 2019, the inflation rate stood at 0.7% compared to 1.8% in 2018. This control of inflation is mainly driven by the availability of local food products, especially food crops, due to the cereal surpluses recorded during the agricultural seasons. In perspective, the fall in prices should fade from 2020 onwards. The rise in inflation in 2020 and 2021 would result from the expected recovery of oil25 and food prices on the international market, as well as the increase in the price of local cereals, after the decline noted in 2019. Inflation is expected to be 0.8% in 2020 and 0.9% in 2021.
25 This forecast does not take into account the impact of COVID-19 on petroleum product prices.

58
Figure 6. Evolution of USD/XOF and CNY/XOF exchange rates
Source : BCEAO
26 Report on Consumer Price Trends in the WAEMU in 2019 and Outlook, March 2020
4.4 Exchange rates
The dollar/ CFA Francs exchange rate did not fluc-tuate significantly. It increased between 2014 and
2016 but did not reach the 600 CFA Francs per dollar mark. In 2017 and 2018, there was a slight deprecia-tion of the dollar against the CFA Francs followed by a rise in 2019.
Source : BCEAO and NISEDS Togo, * central scenario forecasting
Table 34. Inflation rates in Togo and the WAEMU 2015 2016 2017 2018 2019 2020* 2021*
TOGO 1.8 0.9 -0.2 0.9 0.7 0.8 0.9
WAEMU 1.0 0.3 1.2 1.2 -0.7 0.8 1.4
26
The Chinese currency appreciated from 80.11 CFA Francs per CNY in 2014 to 94.13 CFA Francs in 2015. From 2016, the CNY currency depreciated to reach CFA Francs 84.87 at the end of 2019.
4.5 Foreign reserves
Togo's reserve assets showed a surplus of CFA Francs 106.8 billion in 2019 against CFA Francs 77.7 billion in 2018. Official assets are drawn by the Spe-cial Drawing Rights and the IMF reserve position.
Source : BCEAO
Table 35. Togo's official reserve assets (in millions of CFA Francs)
2015 2016 2017 2018 2019
Credit to non- residents 462.7 4512 522.8 428.3 781.1
Official reserve assets 45.4 32.4 45.1 77.7 106.8
Foreign Currencies 4.2 3.8 2.4 0.4 1.3
Reserve position inthe IMF
1.4 18.6 9.2 17.2 13.7
Assets in SDRs 39.8 10.0 33.5 60.2 91.7
Other foreign assets 417.3 418.8 477.7 350.6 674.3

59
Source : BCEAO
Table 35. Togo's official reserve assets (in millions of CFA Francs)
2015 2016 2017 2018 2019
Credit to non- residents 462.7 4512 522.8 428.3 781.1
Official reserve assets 45.4 32.4 45.1 77.7 106.8
Foreign Currencies 4.2 3.8 2.4 0.4 1.3
Reserve position inthe IMF
1.4 18.6 9.2 17.2 13.7
Assets in SDRs 39.8 10.0 33.5 60.2 91.7
Other foreign assets 417.3 418.8 477.7 350.6 674.3

60
5 FOREIGN TRADE AND BALANCE OF PAIMENTS
5.1 Balance of paiments
Togo's trade balance is structurally in deficit due to the importance of imports of goods in relation to ex-ports. The trade deficit stood at CFA Francs 347.7 billion in 2018 against CFA Francs 407.3 billion in 2014. Thus, a faster progression of imports in rela-tion to exports is noted. Indeed, over the 2014-2018 period, imports experienced an average increase of 1.4% against 0.15% for exports. Estimates for 2019 forecast a trade deficit of CFA Francs 479.0 billion, up 10.2% from its 2018 level. In 2020, it is expec-ted, in connection with the Covid-19 crisis, a 3% decline in exports against a 2% increase in imports. The trade deficit would remain on an upward trend throughout the period 2020-2024 due to the impor-tance of imports compared to exports.
The balance of the primary income account re-mained in surplus throughout the period under re-view, coming out at CFA Francs 10.7 billion in 2018 against CFA Francs 22.8 billion in 2014, mainly driven by the excess of salaries27 and other primary incomes. Investment income28, for its part, recorded a deficit of CFA Francs 14.5 billion, against a deficit of CFA Francs 16.7 billion in 2017. This evolution is mainly related to the increase observed in portfolio investment income received from abroad. For 2019, the estimated primary income balance was CFA Francs 12.1 billion, up 13.0% compared to 2018. In 2020, the income balance would increase slightly CFA Francs 12.5 billion. In 2024, it would reach CFA Francs 14.1 billion.
The balance of the secondary income account showed a surplus and an increase over the entire period under review in line with the increase in se-condary income of other sectors, including transfers between individuals or between institutions outside government, remittances from migrant workers other than for investment purposes, including current consumption, health, education, family and religious events, etc. The balance of the secondary income
account showed a surplus and an increase over the entire period under review in line with the increase in secondary income of other sectors, including trans-fers between individuals or between institutions out-side government, remittances from migrant workers other than for investment purposes, including current consumption, health, education, family and religious events, etc. The balance of the secondary income account showed a surplus and an increase over the entire period under review in line with the increase in secondary income of other sectors, including trans-fers between individuals or between institutions out-side government, remittances from migrant workers other than for investment purposes, including cur-rent consumption, health, education, family and reli-gious events. The balance of the secondary income account stood at CFA Francs 234.3 billion in 2018 against CFA Francs 158.16 billion in 2014. Estimates for the year 2019 indicate a secondary income ba-lance of CFA Francs 240.1 billion. The balance of secondary incomes would maintain its upward trend until 2024 when it would stand at CFA Francs 364.5 billion.
In line with the evolution of the trade balance and the primary and secondary income balance, the current account showed a deficit of CFA Francs 102.7 billion in 2018 against CFA Francs 226.4 billion in 2014. As a percentage of GDP, the current account balance re-presented 3.5% in 2018 compared to 3.5% in 2014. Estimates for 2019 point to a current account defi-cit of CFA Francs 135.9 billion, representing 4.2% of GDP. In perspective, for 2020, the current deficit is expected to deteriorate to CFA Francs 169.3 billion (4.9% of GDP) in line with the deterioration of the trade deficit. On the basis of projections, the current deficit would reach CFA Francs 194.4 billion in 2024. The capital account remained in surplus over the en-tire period under review at CFA Francs 175.7 billion against CFA Francs 157.5 billion in 2018. It would be CFA Francs 162.5 billion in 2019, down 7.5% com-
27 Compensation of employees consists mainly of salaries, wages and other benefits paid, on the one hand, to resident staff of diplomatic missions and international organisations and, on the other hand, to non-resident agents by resident entities.28 Investment income is dividends paid to shareholders in respect of foreign investment income as well as interest paid on other investments and government debt.

61
pared to 2018. In 2020, a 37.6% increase in the sur-plus of the capital account is expected in connec-tion, among other things, with the increase in capital transfers as part of support for the management of the Covid-19 crisis. On the basis of projections, the capital account surplus would reach CFA Francs 270.4 billion in 2024 against CFA Francs 223.6 bil-lion in 2020.
The balance of the financial account showed contrasting trends over the period driven by direct and portfolio investment. It amounted to CFA Francs 99.1 billion in 2018 against CFA FRANCS 9.8 billion in 2014. It would be CFA Francs 95.5 billion in 2019 and would increase by 42.7% in 2020 to reach CFA Francs 136.1 billion in line with the increase in direct and portfolio investments. In projection, a contrac-
tion of direct investments and portfolio investments is expected, resulting in a contraction of the balance of the financial account. The latter would emerge in 2024 at CFA Francs 50.5 billion against CFA Francs 136.1 billion in 2020.
The overall balance of paiments showed a deficit in 2018 compared to a surplus in 2017 and 2016. The deficit of the overall balance in 2018 was CFA Francs 23 billion. Estimates for 2019 indicate a worsening of the deficit, which would amount to CFA Francs 68.8 billion. In 2020, in connection with the deterioration of the current balance, the deficit of the overall ba-lance would reach CFA Francs 81.8 billion. Projec-tions forecast a surplus in the overall balance from 2021 onwards.
Source : BCEAO, IMF country report, april 2020
Table 36. Balance of Paiments Situation (Billion of CFA Francs)ITEM (billionsCFA francs)
2014 2015 2016 2017 2018 2019 2020 2021 2022 2023 2024
Est Projections
Current accountbalance
-226.4 -272.6 -258.7 -56.1 -102.7 -135.9 -169.3 -161.6 -179.7 -190.7 -194.4
Balance oftrade in goodsand services
-407.3 -543.0 -487.0 -291.5 -347.7 -388.0 -444.2 -458.4 -501.4 -539.6 -573.0
Exports of thegoods
655.5 597.7 614.2 591.5 600.4 631.9 612.9 665.5 724.0 792.0 868.4
Imports of thegoods
1 093.9 1 208.5 1 185.9 965.3 1 035.1 1 110.9 1 134.3 1 211.0 1 319.5 1 434.6 1 555.2
Net Services 31.1 67.8 84.7 82.3 86.9 91.0 77.2 87.1 94.1 103.0 113.8
Primaryincome balance
22.8 83.1 25.8 2.9 10.7 12.1 12.5 12.0 12.5 13.1 14.1
Secondaryincome balance(transfer)
158.2 187.3 202.4 232.5 234.3 240.1 262.3 284.8 309.2 335.7 364.5
Capital inaccount
157.5 159.4 163.6 141.4 175.7 162.5 223.6 234.1 245.4 257.4 270.4
Financialaccount
9.8 -225.5 -159.8 117.8 99.1 95.5 136.2 72.9 49.8 40.3 50.5
Directinvestments
150.6 53.7 179.7 -70.3 139.5 114.0 128.3 114.5 81.4 88.4 96.0
Portfolioinvestments
68.4 -75.5 -160.5 176.6 91.9 59.0 62.5 58.7 55.3 52.2 49.5
Otherinvestments
-209.1 -203.7 -179.1 11.6 -132.4 -77.5 -54.6 -100.3 -86.9 -100.3 -95.0
Statistical errors and omissions
2.2 2.7 2.5 2.2 3.0 0.0 0.0 0.0 0.0 0.0 0.0
Overall balance -76.5 115.0 67.2 -30.2 -23.0 -68.8 -81.8 -0.4 15.84 26.4 25.5

62
Source : BCEAO, IMF country report, april 2020
Table 36. Balance of Paiments Situation (Billion of CFA Francs)ITEM (billionsCFA francs)
2014 2015 2016 2017 2018 2019 2020 2021 2022 2023 2024
Est Projections
Current accountbalance
-226.4 -272.6 -258.7 -56.1 -102.7 -135.9 -169.3 -161.6 -179.7 -190.7 -194.4
Balance oftrade in goodsand services
-407.3 -543.0 -487.0 -291.5 -347.7 -388.0 -444.2 -458.4 -501.4 -539.6 -573.0
Exports of thegoods
655.5 597.7 614.2 591.5 600.4 631.9 612.9 665.5 724.0 792.0 868.4
Imports of thegoods
1 093.9 1 208.5 1 185.9 965.3 1 035.1 1 110.9 1 134.3 1 211.0 1 319.5 1 434.6 1 555.2
Net Services 31.1 67.8 84.7 82.3 86.9 91.0 77.2 87.1 94.1 103.0 113.8
Primaryincome balance
22.8 83.1 25.8 2.9 10.7 12.1 12.5 12.0 12.5 13.1 14.1
Secondaryincome balance(transfer)
158.2 187.3 202.4 232.5 234.3 240.1 262.3 284.8 309.2 335.7 364.5
Capital inaccount
157.5 159.4 163.6 141.4 175.7 162.5 223.6 234.1 245.4 257.4 270.4
Financialaccount
9.8 -225.5 -159.8 117.8 99.1 95.5 136.2 72.9 49.8 40.3 50.5
Directinvestments
150.6 53.7 179.7 -70.3 139.5 114.0 128.3 114.5 81.4 88.4 96.0
Portfolioinvestments
68.4 -75.5 -160.5 176.6 91.9 59.0 62.5 58.7 55.3 52.2 49.5
Otherinvestments
-209.1 -203.7 -179.1 11.6 -132.4 -77.5 -54.6 -100.3 -86.9 -100.3 -95.0
Statistical errors and omissions
2.2 2.7 2.5 2.2 3.0 0.0 0.0 0.0 0.0 0.0 0.0
Overall balance -76.5 115.0 67.2 -30.2 -23.0 -68.8 -81.8 -0.4 15.84 26.4 25.5
5.2 Regional trade
5.2.1 Regional trade policy
West African countries are engaged in numerous trade negotiations at the regional (integration pro-cess), bilateral (Interim Economic Partnership Agree-ment - IEPAi) and multilateral (World Trade Organisa-tion - WTO and regional EPAs) levels.
Good articulation between the various negotiations at regional and international level (CET; EPAs; WTO, AGOA, etc.) is essential to achieve the trade perfor-mance objectives of WAEMU member states.National and regional trade policies in West Africa depend on different spaces. Indeed, the regional ne-gotiating space is articulated around the following elements :
• The finalization of the Common External Tariff (CET) at ECOWAS level, and thus the constitu-tion of a Customs Union ;
• A space for bilateral negotiations, particular-ly between the West African region and the union, on the EPA ;
• A multilateral negotiating space, which refers to the rules of the WTO, of which all West Afri-can states are members (with the exception of Liberia, which has observer status). It should be noted that each country negotiates indivi-dually and that WAEMU and ECOWAS have only ad hoc observer status in the WTO Trade and Development Commission.
With regard specifically to the WAEMU, it has a com-mon commercial policy based in particular on :
• A common market was established on 1 July 1996 for local and unprocessed products (ani-mal, mineral and plant products of the Union) and traditional crafts, and until 1 January 2000 for approved industrial products. This com-mon market was extended to all ECOWAS countries in 2004 ;
• A customs union set up on 1 January 2000, based on a CET applicable to all WAEMU member countries, comprising four categories of products, taxed from 0 to 20%, in force until 1 january 2015, the date on which the WAE-MU CET was replaced by the ECOWAS CET, which enshrines the enlargement of the cus-toms union to the 15 ECOWAS countries.
• Common rules of origin and competition, har-monization of VAT and excise duties, harmo-nization and mutual recognition of standards, common safeguards and protection measures (degressive protection tax (DPT), cyclical ex-port tax (CET), reference values and anti-dum-ping duty)
WAEMU also has a regional trade promotion pro-gramme, a "Regional Strategy for the Implementa-tion of the WAEMU Aid for Trade Programme" and a "Logical Framework for the Implementation of the WAEMU Aid for Trade Programme".
The overall objective of the Aid for Trade strategy is to help Member States increase their exports of goods. The logical framework provides the basis for a programme that involves international donors, as well as national and regional financial institutions. It identifies five specific objectives corresponding to the categories of Aid for Trade :

63
• Ensuring ownership and control of trade poli-cies and regulations by experts from Member States and the Commission ;
• To develop intra-regional and international trade of the Member States ;
• Strengthen trade-related infrastructure in the sub-region ;
• Diversify and increase the production capaci-ties of Member States ;
• Make necessary adjustments and take into ac-count other trade-related needs.
The needs and priorities were identified on the basis of the Regional Economic Programme (REP) which constitutes the reference framework for the WAEMU integration process, as well as existing capacity buil-ding programmes in the States.
• The Common External Tariff
The rules in force at ECOWAS borders in terms of customs policy are those laid down in the ECOWAS Common External Tariff (CET). The applicable rules of origin are defined by the Trade Liberalization Scheme (TLS).
The CET aims to harmonize customs duties and taxes with a view to deepening economic integra-tion through the establishment of a Customs Union, providing a platform for building the common trade
policy and regional trade negotiations such as the EPA ; boosting regional production and investment capacity, and consolidating the regional market.
The CET is organized around an architecture inclu-ding :
(i) A Tariff and Statistical Nomenclature (TNS), i.e. a common customs nomenclature based on the Harmonized System for the Descrip-tion and Coding of Goods (HS) of the World Customs Organization (WCO) adopted by the Community ;
(ii) A schedule of duties and taxes applicable to imported products and which includes : cus-toms duty (CD), statistical fee (SF) and the ECOWAS Community Levy (ECOWAS CL) ;
(iii) Trade defence measures or additional protec-tive measures, where appropriate, which may generate duties which may affect the final price of products imported into the Community from third countries ;
(iv) The statistical royalty rate set at 1% applicable equally to all imported products, whether exempt or not ;
(v) The tax base for the application of the Com-mon External Tariff is ad valorem.
The tariff structure of the CET is presented in the fol-lowing table :
Category Description Rate
0 Essential social goods 0 %
1 Basic raw materials and capital goods 5 %
2 Intermediate products 10 %
3 Final consumer goods 20 %
4 Speci�c goods for economic development 35 %

64
The CET has been established in accordance with the requirements of the World Customs Organiza-tion’s (WCO) Harmonized System and those of the World Trade Organization (WTO) relating to Regional Trade Agreements (Article 24 of the GATT).
• Specific rules applicable to external trade in goods of ECOWAS countries
Several trade regimes are in force within ECOWAS. The following table presents the existing regimes ac-cording to trading partners.
PARTNERS SPECIFIC REGIMES
European Union (EU) IEPA, GSP, GSP +, TSA
ECOWAS CET, TLS
Rest of AFRICA Bilateral agreements
USA AGOA
ASIA Bilateral Agreements
Other industrialized countries Generalized System of Preferences (GSP)
Rest of the world Bilateral agreements, GSP
Pending the implementation of the EPA, different tariff regimes apply depending on the status of the coun-tries in the framework of trade between ECOWAS and the union:
• Côte d'Ivoire and Ghana ratified interim EPAs in 2016. Côte d'Ivoire's EPA has been in pro-visional application since 4 September 2016 and Ghana's EPA applies since 15 December 2016. These IEPAs guarantee both countries full access to the European market and pro-vide for the eventual liberalization of 80% of tariff lines by Côte d'Ivoire and Ghana over a period of 15 years.29 ;
• Under the GSP, Nigeria benefits from a reduc-tion of the union customs duties on about 1/3 of tariff lines and total exemption from customs duties on an additional 1/3 of tariff lines.
• Cape Verde benefits from the GSP+ which grants exemption from European customs du-ties on about 2/3 of the tariff lines;
• The other 12 countries (including the seven WAEMU countries outside Côte d'Ivoire), be-cause of their LDC status, benefit from the Everything but Arms GSP, which gives them access to the European market for all their ex-ports to the union without duties or quotas.
5.2.2 Regional trade in value terms
Since 2016, more than half of Togo's exports are des-tined for the WAEMU. In 2018, exports to member countries of the Union accounted for 52.7 % of total exports by value, compared to 53.6 % in 2017. In ab-solute terms, exports in 2018 are up by CFA Francs 9.2 billion. This increase is driven by exports to Côte d'Ivoire, Mali and Niger. Togo's trade balance with WAEMU member countries is in surplus over the pe-riod 2014 to 2018.
29 Over 11 years (2019-2029) currently for Côte d'Ivoire.

65
Figure 7. Value of exports and imports between Togo and the 7 other WAEMU countries
Figure 8. Share of Togo's exports to each WAEMU country
Source : BCEAO
Source : BCEAO
5.2.3 Regional trade by partner
Togo's exports are mainly to Burkina Faso, Benin, Niger, Côte d’ivoire and Mali. Burkina Faso is the first WAEMU country to receive products from Togo with a share of 32% in 2018 against 30% in 2017. It is fol-lowed by Benin with a share of 22% in 2018 against 24% in 2017. It should be noted that Benin and Bur-
kina Faso are two countries bordering Togo. Niger has been the 3rd country of destination for Togolese products within the WAEMU with an average of 17% of exports over the last two years. It is followed by Côte d’ivoire with 16% of Togolese exports in 2018 against 15% in 2017. As for Mali, it receives on ave-rage 11% of Togolese exports to WAEMU countries.

66
Togo's main supplier within WAEMU is Côte d’ivoire (49% on average during the period under review). Imports of Ivorian products amounted to CFA Francs 17.4 billion in 2018 against CFA Francs 21.0 billion
in 2017 and CFA Francs 31.7 billion in 2016, marking a decline for the second consecutive year. The other secondary suppliers are Senegal (17%), Guinea Bis-sau (15%), Benin (13%) and Burkina Faso (6%).6 %).
Figure 9. Share of Togo's imports from WAEMU countries
Source : BCEAO
5.2.4 Regional trade by type
Togo's exports to WAEMU member countries are made up of manufactured products, minerals, and agricultural products. More specifically, in 2018, Togo exported to :
• Burkina Faso: hydraulic cements, articles for transport or packaging, milk and cream, flat-rolled products of iron or non-alloy steel, wine from fresh grapes, tableware and other household articles, wigs and similar articles of hair, plaits and similar articles of plaiting ma-terials, motorcycles (including mopeds) and cycles fitted with an auxiliary motor, petroleum or bituminous mineral oils, mineral or chemical fertilisers, bulldozers and angledozers, sacks and bags for packaging, wheat or meslin flour, beauty or make-up products, mineral and car-bonated waters, and ice cream;
• Benin : cosmetics, transport or packaging
articles, hydraulic cements (including unpul-verized cements known as "clinkers"), motor vehicles for transporting goods, malt beers, palm oil and its fractions, sacks and bags for packaging, flat-rolled products, water (mine-ral and aerated) and non-alcoholic beverages, tubes, pipes and fittings of plastics, crude pe-troleum or bituminous mineral oils, wigs, plai-ting materials and braids, and edible ice ;
• Niger: palm oil and its fractions, articles for transport or packing, motorcycles (including mopeds), hydraulic cements, plaits and similar articles of plaiting materials, worn clothing and worn textile articles, sugar confectionery (not containing cocoa), wheat or meslin flour, milk and cream, bars, tubes and pipes and their fit-tings of plastics, and pasta.
• Côte d’ivoire : cotton cloth, parts of appliances, motorcycles, wine of fresh grapes, milk and cream, cosmetics or make-up, other articles of

67
Source : UN Comtrade
plastics and articles of other materials, sugar confectionery, not containing cocoa, and ma-chines and apparatus for sorting, sifting, sepa-rating, washing, crushing, grinding, mixing or kneading earth ;
• Mali: motorcycles (including mopeds), articles for transport or packing, tableware, petroleum
oils or oils obtained from bituminous minerals, plaits and similar articles of plaiting materials, beer made from malt, cane or beet sugar and chemically pure sucrose, mineral and aerated waters, and other articles of plastics and articles of other materials.
Figure 10. Value of exports and imports between Togo and the 7 other WAEMU countries according toproduct categories (FAFFrancs billion)
Togo's imports from WAEMU countries consist of minerals, manufactured goods, agricultural products and chemicals to a lesser extent. More specifically, in 2018, Togo imported dried and salted fish, frozen fish, soaps, cigars and cigarettes, wire, cables and other insulated conductors for electricity, boxes, bags, pouches and other packaging made of paper or cardboard, crude petroleum oils or bituminous minerals, preparations for soups or broths, cotton fabrics, sacks and bags for packaging, and iron or steel bars.
5.3 International trade
5.3.1 Trade policy
With regard to customs measures, Togo applies the WAEMU rules of origin, most of which are harmo-nized with those of ECOWAS. On the basis of the information available, in 2017, 43 enterprises and 233 Togolese products are approved under the pre-ferential regime for intra-Community trade30. In addi-tion, Togo has been applying the ECOWAS Common External Tariff (CET) since January 2015, as well as
30 WEAMU Commission, 2017 report on commercial surveillance in WEAMU space.

68
other community duties and taxes (excise duties, va-lue added tax). The rate also respects the commit-ments made to the World Trade Organisation (WTO),
of which it has been a member since 31 May 1995. The customs rules which this implies for the country are set out in the attached table.
Source : WTO
Table 37. Specific rules that apply to imports, exports and partners
Section A Tariffs and imports by product group
Product groups
Final consolidated duties Applied MFN duties Imports
Average Exempt
en %
Max.
Consolidation Average Exempt
in % Max. Share Exempt
in %
in % in %
Products of animal
origin
80.0 0 80 100
24.5 0 35
0.8 0
Milk products 80.0 0 80 100 17.0 0 35 1.3 0
Fruits, vegetables,
plants 80.0 0 80 100 17.9 0 35 1.0 0
Coffee, tea 80.0 0 80 100 18.5 0 35 0.2 0
Cereals & other
preparations 80.0 0 80 100 13.6 0 35 6.1 0
Oilseeds, fats & oils
80.0 0 80 98,8
11.1 0 35
3.7 0
Sugar and candy 80.0 0 80 100 12.6 0 35 2.2 0
Beverages and
tobacco 80.0 0 80 100 17.3 0 35 2.4 0
Cotton 80.0 0 80 100 5.0 0 5 0.0 0
Other agricultural
products 80.0 0 80 100 9.6 0 20 0.2 0
Fisheries and
�shery products 80.0 0 80 0,9 15.6 0 20 2.2 0
Metals & Minerals 80.0 0 80 2,8 11.6 1.9 20 16.9 7.8
Oil - - - 0 7.7 19.0 10 6.2 0
Chemical products 80.0 0 80 0.4 7.4 3.8 35 19.8 34.6
Wood, paper, etc. - - - 0
11.3 5.1 20
2.4 4.4
Textiles - - - 0 16.1 0.3 35 9.2 1.6
Clothing - - - 0
20.0
0 20
0.8
0
Leather, shoes, etc. 80.0 0 80 4.4 12.3 1.3 20 2.2 2.8
Non-electrical
machinery - - - 0 6.8
0 20 5.2
0
Electrical Machines 80.0 0 80 0.4 11.2 0.4 20 4.8 1.3
Transport
equipment - - - 0 8.1 2.5 20 10.6 0.1
Other
manufactured
articles, n.e.s.
- - - 0 14.2 2.1 20 1.9 0.5
Section B Exports to major partners and applicable duties
Main partners
Import.
Blateral Diversification MFN Average Margin
Import.
Exempt
in
million
95% trade in nb
SH of trade in LT Prefer. LT Value
US$ 2
numbers
6
numbers
Simple Weighted Weighted in % in %
Agricultural
Products
1. European Union 2017 67 8 11 11.7 2.2 2.2 100.0 100.0
2. China
2017 65 3 3 13.3 12.6 7.8 85.7 88.0
3. Vietnam 2017 58 2 2 2.5 4.3 0.0 50.0 14.3
4. India 2017 29 2 4 24.5 29.0 28.8 72.7 99.3
5. Ghana
2017 21 11 20 19.0 28.0 28.0 100.0 100.0
Non-agricultural
products
1. United Arab
Emirates 2016 409 1 1 3.3 0.0 0.0 33.3 100.0
2. Côte d’ivoire 2017 203 1 2 13.7 0.4 0.4 100.0 100.0
3. Benin 2017 195 19 42 14.1 7.8 7.8 100.0 100.0
4. LebaneseRepublic 2017 175 1 1 1.7 0.0 0.0 66.7 100.0
5. India 2017 117 6 7 5.8 4.7 4.5 92.0
95.0

69
Source : WTO
Table 37. Specific rules that apply to imports, exports and partners
Section A Tariffs and imports by product group
Product groups
Final consolidated duties Applied MFN duties Imports
Average Exempt
en %
Max.
Consolidation Average Exempt
in % Max. Share Exempt
in %
in % in %
Products of animal
origin
80.0 0 80 100
24.5 0 35
0.8 0
Milk products 80.0 0 80 100 17.0 0 35 1.3 0
Fruits, vegetables,
plants 80.0 0 80 100 17.9 0 35 1.0 0
Coffee, tea 80.0 0 80 100 18.5 0 35 0.2 0
Cereals & other
preparations 80.0 0 80 100 13.6 0 35 6.1 0
Oilseeds, fats & oils
80.0 0 80 98,8
11.1 0 35
3.7 0
Sugar and candy 80.0 0 80 100 12.6 0 35 2.2 0
Beverages and
tobacco 80.0 0 80 100 17.3 0 35 2.4 0
Cotton 80.0 0 80 100 5.0 0 5 0.0 0
Other agricultural
products 80.0 0 80 100 9.6 0 20 0.2 0
Fisheries and
�shery products 80.0 0 80 0,9 15.6 0 20 2.2 0
Metals & Minerals 80.0 0 80 2,8 11.6 1.9 20 16.9 7.8
Oil - - - 0 7.7 19.0 10 6.2 0
Chemical products 80.0 0 80 0.4 7.4 3.8 35 19.8 34.6
Wood, paper, etc. - - - 0
11.3 5.1 20
2.4 4.4
Textiles - - - 0 16.1 0.3 35 9.2 1.6
Clothing - - - 0
20.0
0 20
0.8
0
Leather, shoes, etc. 80.0 0 80 4.4 12.3 1.3 20 2.2 2.8
Non-electrical
machinery - - - 0 6.8
0 20 5.2
0
Electrical Machines 80.0 0 80 0.4 11.2 0.4 20 4.8 1.3
Transport
equipment - - - 0 8.1 2.5 20 10.6 0.1
Other
manufactured
articles, n.e.s.
- - - 0 14.2 2.1 20 1.9 0.5
Section B Exports to major partners and applicable duties
Main partners
Import.
Blateral Diversification MFN Average Margin
Import.
Exempt
in
million
95% trade in nb
SH of trade in LT Prefer. LT Value
US$ 2
numbers
6
numbers
Simple Weighted Weighted in % in %
Agricultural
Products
1. European Union 2017 67 8 11 11.7 2.2 2.2 100.0 100.0
2. China
2017 65 3 3 13.3 12.6 7.8 85.7 88.0
3. Vietnam 2017 58 2 2 2.5 4.3 0.0 50.0 14.3
4. India 2017 29 2 4 24.5 29.0 28.8 72.7 99.3
5. Ghana
2017 21 11 20 19.0 28.0 28.0 100.0 100.0
Non-agricultural
products
1. United Arab
Emirates 2016 409 1 1 3.3 0.0 0.0 33.3 100.0
2. Côte d’ivoire 2017 203 1 2 13.7 0.4 0.4 100.0 100.0
3. Benin 2017 195 19 42 14.1 7.8 7.8 100.0 100.0
4. LebaneseRepublic 2017 175 1 1 1.7 0.0 0.0 66.7 100.0
5. India 2017 117 6 7 5.8 4.7 4.5 92.0
95.0

70
The tariffs applied by Togo vary according to the pro-ducts. At the import level, average final bound tariffs are around 80 %. With regard to applied most-fa-voured-nation (MFN) tariffs, average tariffs range from 5 % for cotton to 24.5 % for animal products with a maximum tariff of 35 %.
In terms of exports, Togo's main partners differ ac-cording to the nature of the product. For agricultural products, they are India, Vietnam, Ghana and Chi-na. Simple average MFN tariffs range from 2.5% for Vietnam to 24.5% for India.
For non-agricultural products, the main partners are the United Arab Emirates, Côte d'Ivoire, Benin, the Lebanese Republic and India. Simple average MFN tariffs range from 1.7% for the Republic of Lebanon to 14.1% for Benin.
5.3.2 International trade in value and by destination31
Togo's exports increased overall during the period under review, rising from CFA Francs 336.33 billion
in 2014 to CFA Francs 510.780 billion in 2018, but fell back in 2017 compared to 2016. The drop in ex-ports in 2017 is mainly linked to exports to the WAE-MU and more specifically to Benin and Mali. Indeed, exports to the WAEMU recorded a 4.5% decline in 2017 compared to 2016. In 2018, the increase in ex-ports is driven by products destined for Asia, Europe and Africa, in particular WAEMU. The main recipients of Togolese exports are : (i) in Asia, India followed by Malaysia ; (ii) in Africa, Burkina Faso followed by Be-nin, Niger and Côte d’ivoire ; (iii) in Europe, France and the United States.
At the continental level, Africa is the leading desti-nation for Togolese exports, accounting for 68.6% of total exports in 2018 against 77.9% in 2014. It is followed by Asia with 18.2% in 2018 against 11.6% in 2014 and Europe (9.8% in 2018 against 10.0% in 2014).
Source : BCEAO
Table 38. Repartition of exports and imports in millions FCFAby geographical area
2014 2015 2016 2017 2018
COUNTRIES OF
DESTINATION EXPORTS OF GOODS (millions CFA Francs)
EUROPE 33 479 48 037 40 668 42 853 50 132
EUROPEAN UNION 31 254 46 425 39 489 41 399 49 196
EURO ZONE 28 922 44 299 36 247 40 983 48 377
Germany 1 803 1 917 1 104 535 3 685
Belgium 3 107 12 578 5 914 3 951 3 002
Spain 960 2 214 2 673 2 664 2 289
France 12 944 15 753 17 415 25 441 31 993
Irland 12 24 0 0 0
Italy 611 2 676 2 613 2 747 1 416
The Netherlands 8 900 6 861 4 081 4 294 3 423
Other Eurozone
countries 585
2 276 2 447 1 351 2 568
OTHER EU COUNTRIES 2 332 2 126 3 243 417 819
Denmark 0 167 109 15 0
Poland 1 577 12 2 002 0 0
United Kingdom 755 1 945 1 094 316 761
Others 0 2 38 86 58
OTHER EUROPEAN
COUNTRIES 2 225 1 612 1 178 1 454 936
Norway 0 0 5 7 0
Russia 3 0 29 515 0
Switzerland 873 1 576 1 060 791 592
Ukraine 47 32 84 140 321
Others 1 302 4 0 0 24
AFRICA 262 027 300 029 362 042 348 083 350 549
WAEMU 148 872 204 309 272 331 259 945 269 184
Benin 41 758 59 069 74 600 62 545 59 768
Burkina 38 421 64 334 76 902 78 241 85 684
Côte d’ivoire 13 538 15 814 37 394 38 778 43 204
Guinea-Bissau 1 277 413 151 173
Mali 15 435 21 664 32 940 27 513 30 622
Niger 37 513 38 856 44 821 44 666 44 508
Senegal 2 208 3 294 5 261 8 051 5 224
ECOWAS (excluding
WAEMU) 82 407 59 914 69 925 72 295 69 252
Ghana 35 781 32 264 41 635 33 515 38 454
Guinea 457 1 300 3 578 3 447 2 557
Nigeria 44 748 25 248 23 511 34 131 26 747
Other ECOWAS
(excluding WAEMU) 1 422
1 101 1 200 1 201 1 494
EMCCA (CEMAC) 27 479 24 220 13 081 5 262 7 155
Cameroon 4 869 3 459 1 391 1 456 1 135
Congo (Brazzaville) 1 450 2 043 5 116 314 1 423
Gabon 19 354 17 528 5 329 1 804 2 474
Equatorial Guinea 557 444 442 507 422
Central African Republic 776 335 206 314 522
Chad 473 411 597 867 1 180
OTHER AFRICAN
COUNTRIES 3 268
11 586 6 706 10 582 4 957
South Africa 215 382 296 140 253
Angola 400 127 49 143 100
Marocco 571 7 991 3 285 1 266 929
Democratic Republic of
Congo 1 695
570 1 716 2 133 780
Tunisia 97 308 95 291 126
Others 290 2 209 1 264 6 609 2 770
AMERICA 1 783 16 692 13 679 9 712 9 293
Netherlands Antilles 30 0
Brazil 4 4
Canada 85 9 224 10 806 5 883 6 048
Cuba 33 0
USA 1 662 3 038 2 859 3 638 3 117
Other countries in the
Americas 37 4 430 14 124 123
ASIA 39 048 87 821 68 948 70 941 92 720
China 7 112 4 527 5 538 8 630 4 856
India 10 004 38 870 32 540 26 708 39 873
Indonesia 5 405 9 545 4 000 5 765 2 790
Lebanon 133 252 321 402 589
Malaysia 2 510 9 907 9 981 3 994 25 167
Pakistan 666 321 2 588 8 952 1 192
Taïwan 882 57 309 322 675
Vietnam 5 621 7 527 3 020 2 300 6 658
Other Asian countries 6 717 16 815 10 650 13 867 10 922
OCEANIA 0 642 3 665 13 812 8 086
Australia 0 0 3 664 13 791 8 086
Other countries in
Oceania 0 642 1 21 0
TOTAL EXPORT 336 336 453 222 489 002 485 401 510 780
COUNTRY OF ORIGIN IMPORTS OF GOODS (millions CFA Francs)
EUROPE 382 904 365 549 378 616 324 889 312 400
EUROPEAN UNION 328 534 334 268 322 015 289 446 265 327
EURO ZONE 297 990 292 157 279 168 250 687 228 199
Germany 32 987 37 646 39 948 29 418 27 403
Belgium 44 217 38 969 41 150 30 251 24 397
Spain 40 771 39 481 18 444 16 770 18 448
France 79 510 95 915 94 908 101 347 89 261
Italy 16 429 15 206 13 207 11 518 13 490
The Netherlands 41 660 20 721 45 068 46 590 35 710
Other Eurozone
countries 42 416
44 219 26 444 14 792 19 491
OTHER EU COUNTRIES 30 543 42 111 42 847 38 759 37 127
Denmark 1 165 2 986 3 217 4 566 3 376
Latvia 15 171 17 633 7 757 17 377 8 616
United Kingdom 5 638 9 012 8 263 5 595 14 596
Sweden 689 4 569 3 688 1 486 2 946
Others 7 880 7 909 19 923 9 736 7 593
OTHER EUROPEAN
COUNTRIES 54 370 31 281 56 601 35 443 47 073
Iceland 61 569 1 41 46
Norway 370 325 239 6 876 2 205
Russiea 35 939 23 904 28 907 17 488 33 912
Switzerland 3 068 3 513 13 320 4 802 3 663
Ukraine 1 607 2 610 14 024 5 517 6 511
Others 878 360 111 719 736
AFRICA 109 149 181 360 146 495 161 460 163 228
WAEMU 39 924 47 889 57 993 43 830 40 364
Benin 6 775 4 876 8 356 5 597 3 840
Burkina 579 3 020 2 569 4 291 3 566
Côte d’ivoire 20 085 23 670 31 739 21 044 17 437
Guinea-Bissau 6 774 8 242 6 334 4 471 7 079
Mali 54 545 119 322 222
Niger 68 56 29 55 8
Senegal 5 590 7 480 8 848 8 050 8 212
ECOWAS (excluding
waemu) 37 417 42 397 54 115 67 008 66 927
Ghana 31 095 34 528 36 036 38 782 29 230
Nigeria 6 317 7 840 17 844 28 166 37 645
Other ECOWAS
(excluding WAEMU) 4 29 235 59 51
EMCCA (CEMAC) 290 839 1 419 323 174
Cameroon 274 781 462 59 71
Congo (Brazzaville) 0 2 55 1 0
Other EMCCA 15 57 902 263 103
OTHER AFRICAN
COUNTRIES 31 519 90 235 32 968 50 299 55 763
South Africa 15 204 50 339 10 714 24 282 16 346
Egypt 3 206 3 514 3 014 5 383 9 803
Marocco 9 006 23 172 10 385 5 846 13 559
Mauritania 1 723 5 982 4 688 7 025 10 437
Mozambique 0 0 1 652 5 569 38
Seychelles 0 0 0 0 0
Tunisia 1 595 2 217 1 720 1 382 1 658
Others 786 5 012 796 811 3 923
AMERICA 49 261 52 410 51 496 43 448 71 398
Netherlands Antilles 3 870 1 606 0 0 0
Brazil 9 973 12 990 9 062 14 120 10 455
Canada 5 543 7 430 9 004 5 422 5 954
Cuba 0 1 198
Mexico 829 2 247 1 767 1 401 2 306
USA 25 951 25 279 20 335 18 854 44 948
Other countries in the
Americas 3 095 2 858 11 328 3 650 7 537
ASIA 317 188 426 627 510 012 407 906 425 902
Saudi Arabia 19 309 25 061 30 514 29 662 20 914
China 151 984 205 805 299 902 184 195 202 173
South Korea 11 914 11 637 13 524 10 702 9 814
United Arab Emirates 8 102 14 945 16 786 13 166 21 637
India 27 766 39 378 34 696 33 426 40 481
Japan 33 302 41 780 46 213 47 561 42 198
Lebanon 3 535 2 456 2 239 1 401 2 152
Malaysia 7 842 10 049 11 105 14 723 14 998
Thaïlande 18 839 17 248 10 127 12 459 11 253
Turkey 13 399 15 744 15 447 19 649
Other Asian countries 34 596 44 870 29 163 45 163 40 634
OCEANIA 637 88 380 474 429
Australia 557 55 379 474 429
Other countries in
Oceania 79 33 1 0 0
TOTAL IMPORTS 859 139 1 026 033 1 086 999 938 177 973 358
31 This trade does not take into account uncontrolled trade.

71
Source : BCEAO
Table 38. Repartition of exports and imports in millions FCFAby geographical area
2014 2015 2016 2017 2018
COUNTRIES OF
DESTINATION EXPORTS OF GOODS (millions CFA Francs)
EUROPE 33 479 48 037 40 668 42 853 50 132
EUROPEAN UNION 31 254 46 425 39 489 41 399 49 196
EURO ZONE 28 922 44 299 36 247 40 983 48 377
Germany 1 803 1 917 1 104 535 3 685
Belgium 3 107 12 578 5 914 3 951 3 002
Spain 960 2 214 2 673 2 664 2 289
France 12 944 15 753 17 415 25 441 31 993
Irland 12 24 0 0 0
Italy 611 2 676 2 613 2 747 1 416
The Netherlands 8 900 6 861 4 081 4 294 3 423
Other Eurozone
countries 585
2 276 2 447 1 351 2 568
OTHER EU COUNTRIES 2 332 2 126 3 243 417 819
Denmark 0 167 109 15 0
Poland 1 577 12 2 002 0 0
United Kingdom 755 1 945 1 094 316 761
Others 0 2 38 86 58
OTHER EUROPEAN
COUNTRIES 2 225 1 612 1 178 1 454 936
Norway 0 0 5 7 0
Russia 3 0 29 515 0
Switzerland 873 1 576 1 060 791 592
Ukraine 47 32 84 140 321
Others 1 302 4 0 0 24
AFRICA 262 027 300 029 362 042 348 083 350 549
WAEMU 148 872 204 309 272 331 259 945 269 184
Benin 41 758 59 069 74 600 62 545 59 768
Burkina 38 421 64 334 76 902 78 241 85 684
Côte d’ivoire 13 538 15 814 37 394 38 778 43 204
Guinea-Bissau 1 277 413 151 173
Mali 15 435 21 664 32 940 27 513 30 622
Niger 37 513 38 856 44 821 44 666 44 508
Senegal 2 208 3 294 5 261 8 051 5 224
ECOWAS (excluding
WAEMU) 82 407 59 914 69 925 72 295 69 252
Ghana 35 781 32 264 41 635 33 515 38 454
Guinea 457 1 300 3 578 3 447 2 557
Nigeria 44 748 25 248 23 511 34 131 26 747
Other ECOWAS
(excluding WAEMU) 1 422
1 101 1 200 1 201 1 494
EMCCA (CEMAC) 27 479 24 220 13 081 5 262 7 155
Cameroon 4 869 3 459 1 391 1 456 1 135
Congo (Brazzaville) 1 450 2 043 5 116 314 1 423
Gabon 19 354 17 528 5 329 1 804 2 474
Equatorial Guinea 557 444 442 507 422
Central African Republic 776 335 206 314 522
Chad 473 411 597 867 1 180
OTHER AFRICAN
COUNTRIES 3 268
11 586 6 706 10 582 4 957
South Africa 215 382 296 140 253
Angola 400 127 49 143 100
Marocco 571 7 991 3 285 1 266 929
Democratic Republic of
Congo 1 695
570 1 716 2 133 780
Tunisia 97 308 95 291 126
Others 290 2 209 1 264 6 609 2 770
AMERICA 1 783 16 692 13 679 9 712 9 293
Netherlands Antilles 30 0
Brazil 4 4
Canada 85 9 224 10 806 5 883 6 048
Cuba 33 0
USA 1 662 3 038 2 859 3 638 3 117
Other countries in the
Americas 37 4 430 14 124 123
ASIA 39 048 87 821 68 948 70 941 92 720
China 7 112 4 527 5 538 8 630 4 856
India 10 004 38 870 32 540 26 708 39 873
Indonesia 5 405 9 545 4 000 5 765 2 790
Lebanon 133 252 321 402 589
Malaysia 2 510 9 907 9 981 3 994 25 167
Pakistan 666 321 2 588 8 952 1 192
Taïwan 882 57 309 322 675
Vietnam 5 621 7 527 3 020 2 300 6 658
Other Asian countries 6 717 16 815 10 650 13 867 10 922
OCEANIA 0 642 3 665 13 812 8 086
Australia 0 0 3 664 13 791 8 086
Other countries in
Oceania 0 642 1 21 0
TOTAL EXPORT 336 336 453 222 489 002 485 401 510 780
COUNTRY OF ORIGIN IMPORTS OF GOODS (millions CFA Francs)
EUROPE 382 904 365 549 378 616 324 889 312 400
EUROPEAN UNION 328 534 334 268 322 015 289 446 265 327
EURO ZONE 297 990 292 157 279 168 250 687 228 199
Germany 32 987 37 646 39 948 29 418 27 403
Belgium 44 217 38 969 41 150 30 251 24 397
Spain 40 771 39 481 18 444 16 770 18 448
France 79 510 95 915 94 908 101 347 89 261
Italy 16 429 15 206 13 207 11 518 13 490
The Netherlands 41 660 20 721 45 068 46 590 35 710
Other Eurozone
countries 42 416
44 219 26 444 14 792 19 491
OTHER EU COUNTRIES 30 543 42 111 42 847 38 759 37 127
Denmark 1 165 2 986 3 217 4 566 3 376
Latvia 15 171 17 633 7 757 17 377 8 616
United Kingdom 5 638 9 012 8 263 5 595 14 596
Sweden 689 4 569 3 688 1 486 2 946
Others 7 880 7 909 19 923 9 736 7 593
OTHER EUROPEAN
COUNTRIES 54 370 31 281 56 601 35 443 47 073
Iceland 61 569 1 41 46
Norway 370 325 239 6 876 2 205
Russiea 35 939 23 904 28 907 17 488 33 912
Switzerland 3 068 3 513 13 320 4 802 3 663
Ukraine 1 607 2 610 14 024 5 517 6 511
Others 878 360 111 719 736
AFRICA 109 149 181 360 146 495 161 460 163 228
WAEMU 39 924 47 889 57 993 43 830 40 364
Benin 6 775 4 876 8 356 5 597 3 840
Burkina 579 3 020 2 569 4 291 3 566
Côte d’ivoire 20 085 23 670 31 739 21 044 17 437
Guinea-Bissau 6 774 8 242 6 334 4 471 7 079
Mali 54 545 119 322 222
Niger 68 56 29 55 8
Senegal 5 590 7 480 8 848 8 050 8 212
ECOWAS (excluding
waemu) 37 417 42 397 54 115 67 008 66 927
Ghana 31 095 34 528 36 036 38 782 29 230
Nigeria 6 317 7 840 17 844 28 166 37 645
Other ECOWAS
(excluding WAEMU) 4 29 235 59 51
EMCCA (CEMAC) 290 839 1 419 323 174
Cameroon 274 781 462 59 71
Congo (Brazzaville) 0 2 55 1 0
Other EMCCA 15 57 902 263 103
OTHER AFRICAN
COUNTRIES 31 519 90 235 32 968 50 299 55 763
South Africa 15 204 50 339 10 714 24 282 16 346
Egypt 3 206 3 514 3 014 5 383 9 803
Marocco 9 006 23 172 10 385 5 846 13 559
Mauritania 1 723 5 982 4 688 7 025 10 437
Mozambique 0 0 1 652 5 569 38
Seychelles 0 0 0 0 0
Tunisia 1 595 2 217 1 720 1 382 1 658
Others 786 5 012 796 811 3 923
AMERICA 49 261 52 410 51 496 43 448 71 398
Netherlands Antilles 3 870 1 606 0 0 0
Brazil 9 973 12 990 9 062 14 120 10 455
Canada 5 543 7 430 9 004 5 422 5 954
Cuba 0 1 198
Mexico 829 2 247 1 767 1 401 2 306
USA 25 951 25 279 20 335 18 854 44 948
Other countries in the
Americas 3 095 2 858 11 328 3 650 7 537
ASIA 317 188 426 627 510 012 407 906 425 902
Saudi Arabia 19 309 25 061 30 514 29 662 20 914
China 151 984 205 805 299 902 184 195 202 173
South Korea 11 914 11 637 13 524 10 702 9 814
United Arab Emirates 8 102 14 945 16 786 13 166 21 637
India 27 766 39 378 34 696 33 426 40 481
Japan 33 302 41 780 46 213 47 561 42 198
Lebanon 3 535 2 456 2 239 1 401 2 152
Malaysia 7 842 10 049 11 105 14 723 14 998
Thaïlande 18 839 17 248 10 127 12 459 11 253
Turkey 13 399 15 744 15 447 19 649
Other Asian countries 34 596 44 870 29 163 45 163 40 634
OCEANIA 637 88 380 474 429
Australia 557 55 379 474 429
Other countries in
Oceania 79 33 1 0 0
TOTAL IMPORTS 859 139 1 026 033 1 086 999 938 177 973 358

72
Source : BCEAO
Table 38. Repartition of exports and imports in millions FCFAby geographical area
2014 2015 2016 2017 2018
COUNTRIES OF
DESTINATION EXPORTS OF GOODS (millions CFA Francs)
EUROPE 33 479 48 037 40 668 42 853 50 132
EUROPEAN UNION 31 254 46 425 39 489 41 399 49 196
EURO ZONE 28 922 44 299 36 247 40 983 48 377
Germany 1 803 1 917 1 104 535 3 685
Belgium 3 107 12 578 5 914 3 951 3 002
Spain 960 2 214 2 673 2 664 2 289
France 12 944 15 753 17 415 25 441 31 993
Irland 12 24 0 0 0
Italy 611 2 676 2 613 2 747 1 416
The Netherlands 8 900 6 861 4 081 4 294 3 423
Other Eurozone
countries 585
2 276 2 447 1 351 2 568
OTHER EU COUNTRIES 2 332 2 126 3 243 417 819
Denmark 0 167 109 15 0
Poland 1 577 12 2 002 0 0
United Kingdom 755 1 945 1 094 316 761
Others 0 2 38 86 58
OTHER EUROPEAN
COUNTRIES 2 225 1 612 1 178 1 454 936
Norway 0 0 5 7 0
Russia 3 0 29 515 0
Switzerland 873 1 576 1 060 791 592
Ukraine 47 32 84 140 321
Others 1 302 4 0 0 24
AFRICA 262 027 300 029 362 042 348 083 350 549
WAEMU 148 872 204 309 272 331 259 945 269 184
Benin 41 758 59 069 74 600 62 545 59 768
Burkina 38 421 64 334 76 902 78 241 85 684
Côte d’ivoire 13 538 15 814 37 394 38 778 43 204
Guinea-Bissau 1 277 413 151 173
Mali 15 435 21 664 32 940 27 513 30 622
Niger 37 513 38 856 44 821 44 666 44 508
Senegal 2 208 3 294 5 261 8 051 5 224
ECOWAS (excluding
WAEMU) 82 407 59 914 69 925 72 295 69 252
Ghana 35 781 32 264 41 635 33 515 38 454
Guinea 457 1 300 3 578 3 447 2 557
Nigeria 44 748 25 248 23 511 34 131 26 747
Other ECOWAS
(excluding WAEMU) 1 422
1 101 1 200 1 201 1 494
EMCCA (CEMAC) 27 479 24 220 13 081 5 262 7 155
Cameroon 4 869 3 459 1 391 1 456 1 135
Congo (Brazzaville) 1 450 2 043 5 116 314 1 423
Gabon 19 354 17 528 5 329 1 804 2 474
Equatorial Guinea 557 444 442 507 422
Central African Republic 776 335 206 314 522
Chad 473 411 597 867 1 180
OTHER AFRICAN
COUNTRIES 3 268
11 586 6 706 10 582 4 957
South Africa 215 382 296 140 253
Angola 400 127 49 143 100
Marocco 571 7 991 3 285 1 266 929
Democratic Republic of
Congo 1 695
570 1 716 2 133 780
Tunisia 97 308 95 291 126
Others 290 2 209 1 264 6 609 2 770
AMERICA 1 783 16 692 13 679 9 712 9 293
Netherlands Antilles 30 0
Brazil 4 4
Canada 85 9 224 10 806 5 883 6 048
Cuba 33 0
USA 1 662 3 038 2 859 3 638 3 117
Other countries in the
Americas 37 4 430 14 124 123
ASIA 39 048 87 821 68 948 70 941 92 720
China 7 112 4 527 5 538 8 630 4 856
India 10 004 38 870 32 540 26 708 39 873
Indonesia 5 405 9 545 4 000 5 765 2 790
Lebanon 133 252 321 402 589
Malaysia 2 510 9 907 9 981 3 994 25 167
Pakistan 666 321 2 588 8 952 1 192
Taïwan 882 57 309 322 675
Vietnam 5 621 7 527 3 020 2 300 6 658
Other Asian countries 6 717 16 815 10 650 13 867 10 922
OCEANIA 0 642 3 665 13 812 8 086
Australia 0 0 3 664 13 791 8 086
Other countries in
Oceania 0 642 1 21 0
TOTAL EXPORT 336 336 453 222 489 002 485 401 510 780
COUNTRY OF ORIGIN IMPORTS OF GOODS (millions CFA Francs)
EUROPE 382 904 365 549 378 616 324 889 312 400
EUROPEAN UNION 328 534 334 268 322 015 289 446 265 327
EURO ZONE 297 990 292 157 279 168 250 687 228 199
Germany 32 987 37 646 39 948 29 418 27 403
Belgium 44 217 38 969 41 150 30 251 24 397
Spain 40 771 39 481 18 444 16 770 18 448
France 79 510 95 915 94 908 101 347 89 261
Italy 16 429 15 206 13 207 11 518 13 490
The Netherlands 41 660 20 721 45 068 46 590 35 710
Other Eurozone
countries 42 416
44 219 26 444 14 792 19 491
OTHER EU COUNTRIES 30 543 42 111 42 847 38 759 37 127
Denmark 1 165 2 986 3 217 4 566 3 376
Latvia 15 171 17 633 7 757 17 377 8 616
United Kingdom 5 638 9 012 8 263 5 595 14 596
Sweden 689 4 569 3 688 1 486 2 946
Others 7 880 7 909 19 923 9 736 7 593
OTHER EUROPEAN
COUNTRIES 54 370 31 281 56 601 35 443 47 073
Iceland 61 569 1 41 46
Norway 370 325 239 6 876 2 205
Russiea 35 939 23 904 28 907 17 488 33 912
Switzerland 3 068 3 513 13 320 4 802 3 663
Ukraine 1 607 2 610 14 024 5 517 6 511
Others 878 360 111 719 736
AFRICA 109 149 181 360 146 495 161 460 163 228
WAEMU 39 924 47 889 57 993 43 830 40 364
Benin 6 775 4 876 8 356 5 597 3 840
Burkina 579 3 020 2 569 4 291 3 566
Côte d’ivoire 20 085 23 670 31 739 21 044 17 437
Guinea-Bissau 6 774 8 242 6 334 4 471 7 079
Mali 54 545 119 322 222
Niger 68 56 29 55 8
Senegal 5 590 7 480 8 848 8 050 8 212
ECOWAS (excluding
waemu) 37 417 42 397 54 115 67 008 66 927
Ghana 31 095 34 528 36 036 38 782 29 230
Nigeria 6 317 7 840 17 844 28 166 37 645
Other ECOWAS
(excluding WAEMU) 4 29 235 59 51
EMCCA (CEMAC) 290 839 1 419 323 174
Cameroon 274 781 462 59 71
Congo (Brazzaville) 0 2 55 1 0
Other EMCCA 15 57 902 263 103
OTHER AFRICAN
COUNTRIES 31 519 90 235 32 968 50 299 55 763
South Africa 15 204 50 339 10 714 24 282 16 346
Egypt 3 206 3 514 3 014 5 383 9 803
Marocco 9 006 23 172 10 385 5 846 13 559
Mauritania 1 723 5 982 4 688 7 025 10 437
Mozambique 0 0 1 652 5 569 38
Seychelles 0 0 0 0 0
Tunisia 1 595 2 217 1 720 1 382 1 658
Others 786 5 012 796 811 3 923
AMERICA 49 261 52 410 51 496 43 448 71 398
Netherlands Antilles 3 870 1 606 0 0 0
Brazil 9 973 12 990 9 062 14 120 10 455
Canada 5 543 7 430 9 004 5 422 5 954
Cuba 0 1 198
Mexico 829 2 247 1 767 1 401 2 306
USA 25 951 25 279 20 335 18 854 44 948
Other countries in the
Americas 3 095 2 858 11 328 3 650 7 537
ASIA 317 188 426 627 510 012 407 906 425 902
Saudi Arabia 19 309 25 061 30 514 29 662 20 914
China 151 984 205 805 299 902 184 195 202 173
South Korea 11 914 11 637 13 524 10 702 9 814
United Arab Emirates 8 102 14 945 16 786 13 166 21 637
India 27 766 39 378 34 696 33 426 40 481
Japan 33 302 41 780 46 213 47 561 42 198
Lebanon 3 535 2 456 2 239 1 401 2 152
Malaysia 7 842 10 049 11 105 14 723 14 998
Thaïlande 18 839 17 248 10 127 12 459 11 253
Turkey 13 399 15 744 15 447 19 649
Other Asian countries 34 596 44 870 29 163 45 163 40 634
OCEANIA 637 88 380 474 429
Australia 557 55 379 474 429
Other countries in
Oceania 79 33 1 0 0
TOTAL IMPORTS 859 139 1 026 033 1 086 999 938 177 973 358

73
Source : BCEAO
Table 38. Repartition of exports and imports in millions FCFAby geographical area
2014 2015 2016 2017 2018
COUNTRIES OF
DESTINATION EXPORTS OF GOODS (millions CFA Francs)
EUROPE 33 479 48 037 40 668 42 853 50 132
EUROPEAN UNION 31 254 46 425 39 489 41 399 49 196
EURO ZONE 28 922 44 299 36 247 40 983 48 377
Germany 1 803 1 917 1 104 535 3 685
Belgium 3 107 12 578 5 914 3 951 3 002
Spain 960 2 214 2 673 2 664 2 289
France 12 944 15 753 17 415 25 441 31 993
Irland 12 24 0 0 0
Italy 611 2 676 2 613 2 747 1 416
The Netherlands 8 900 6 861 4 081 4 294 3 423
Other Eurozone
countries 585
2 276 2 447 1 351 2 568
OTHER EU COUNTRIES 2 332 2 126 3 243 417 819
Denmark 0 167 109 15 0
Poland 1 577 12 2 002 0 0
United Kingdom 755 1 945 1 094 316 761
Others 0 2 38 86 58
OTHER EUROPEAN
COUNTRIES 2 225 1 612 1 178 1 454 936
Norway 0 0 5 7 0
Russia 3 0 29 515 0
Switzerland 873 1 576 1 060 791 592
Ukraine 47 32 84 140 321
Others 1 302 4 0 0 24
AFRICA 262 027 300 029 362 042 348 083 350 549
WAEMU 148 872 204 309 272 331 259 945 269 184
Benin 41 758 59 069 74 600 62 545 59 768
Burkina 38 421 64 334 76 902 78 241 85 684
Côte d’ivoire 13 538 15 814 37 394 38 778 43 204
Guinea-Bissau 1 277 413 151 173
Mali 15 435 21 664 32 940 27 513 30 622
Niger 37 513 38 856 44 821 44 666 44 508
Senegal 2 208 3 294 5 261 8 051 5 224
ECOWAS (excluding
WAEMU) 82 407 59 914 69 925 72 295 69 252
Ghana 35 781 32 264 41 635 33 515 38 454
Guinea 457 1 300 3 578 3 447 2 557
Nigeria 44 748 25 248 23 511 34 131 26 747
Other ECOWAS
(excluding WAEMU) 1 422
1 101 1 200 1 201 1 494
EMCCA (CEMAC) 27 479 24 220 13 081 5 262 7 155
Cameroon 4 869 3 459 1 391 1 456 1 135
Congo (Brazzaville) 1 450 2 043 5 116 314 1 423
Gabon 19 354 17 528 5 329 1 804 2 474
Equatorial Guinea 557 444 442 507 422
Central African Republic 776 335 206 314 522
Chad 473 411 597 867 1 180
OTHER AFRICAN
COUNTRIES 3 268
11 586 6 706 10 582 4 957
South Africa 215 382 296 140 253
Angola 400 127 49 143 100
Marocco 571 7 991 3 285 1 266 929
Democratic Republic of
Congo 1 695
570 1 716 2 133 780
Tunisia 97 308 95 291 126
Others 290 2 209 1 264 6 609 2 770
AMERICA 1 783 16 692 13 679 9 712 9 293
Netherlands Antilles 30 0
Brazil 4 4
Canada 85 9 224 10 806 5 883 6 048
Cuba 33 0
USA 1 662 3 038 2 859 3 638 3 117
Other countries in the
Americas 37 4 430 14 124 123
ASIA 39 048 87 821 68 948 70 941 92 720
China 7 112 4 527 5 538 8 630 4 856
India 10 004 38 870 32 540 26 708 39 873
Indonesia 5 405 9 545 4 000 5 765 2 790
Lebanon 133 252 321 402 589
Malaysia 2 510 9 907 9 981 3 994 25 167
Pakistan 666 321 2 588 8 952 1 192
Taïwan 882 57 309 322 675
Vietnam 5 621 7 527 3 020 2 300 6 658
Other Asian countries 6 717 16 815 10 650 13 867 10 922
OCEANIA 0 642 3 665 13 812 8 086
Australia 0 0 3 664 13 791 8 086
Other countries in
Oceania 0 642 1 21 0
TOTAL EXPORT 336 336 453 222 489 002 485 401 510 780
COUNTRY OF ORIGIN IMPORTS OF GOODS (millions CFA Francs)
EUROPE 382 904 365 549 378 616 324 889 312 400
EUROPEAN UNION 328 534 334 268 322 015 289 446 265 327
EURO ZONE 297 990 292 157 279 168 250 687 228 199
Germany 32 987 37 646 39 948 29 418 27 403
Belgium 44 217 38 969 41 150 30 251 24 397
Spain 40 771 39 481 18 444 16 770 18 448
France 79 510 95 915 94 908 101 347 89 261
Italy 16 429 15 206 13 207 11 518 13 490
The Netherlands 41 660 20 721 45 068 46 590 35 710
Other Eurozone
countries 42 416
44 219 26 444 14 792 19 491
OTHER EU COUNTRIES 30 543 42 111 42 847 38 759 37 127
Denmark 1 165 2 986 3 217 4 566 3 376
Latvia 15 171 17 633 7 757 17 377 8 616
United Kingdom 5 638 9 012 8 263 5 595 14 596
Sweden 689 4 569 3 688 1 486 2 946
Others 7 880 7 909 19 923 9 736 7 593
OTHER EUROPEAN
COUNTRIES 54 370 31 281 56 601 35 443 47 073
Iceland 61 569 1 41 46
Norway 370 325 239 6 876 2 205
Russiea 35 939 23 904 28 907 17 488 33 912
Switzerland 3 068 3 513 13 320 4 802 3 663
Ukraine 1 607 2 610 14 024 5 517 6 511
Others 878 360 111 719 736
AFRICA 109 149 181 360 146 495 161 460 163 228
WAEMU 39 924 47 889 57 993 43 830 40 364
Benin 6 775 4 876 8 356 5 597 3 840
Burkina 579 3 020 2 569 4 291 3 566
Côte d’ivoire 20 085 23 670 31 739 21 044 17 437
Guinea-Bissau 6 774 8 242 6 334 4 471 7 079
Mali 54 545 119 322 222
Niger 68 56 29 55 8
Senegal 5 590 7 480 8 848 8 050 8 212
ECOWAS (excluding
waemu) 37 417 42 397 54 115 67 008 66 927
Ghana 31 095 34 528 36 036 38 782 29 230
Nigeria 6 317 7 840 17 844 28 166 37 645
Other ECOWAS
(excluding WAEMU) 4 29 235 59 51
EMCCA (CEMAC) 290 839 1 419 323 174
Cameroon 274 781 462 59 71
Congo (Brazzaville) 0 2 55 1 0
Other EMCCA 15 57 902 263 103
OTHER AFRICAN
COUNTRIES 31 519 90 235 32 968 50 299 55 763
South Africa 15 204 50 339 10 714 24 282 16 346
Egypt 3 206 3 514 3 014 5 383 9 803
Marocco 9 006 23 172 10 385 5 846 13 559
Mauritania 1 723 5 982 4 688 7 025 10 437
Mozambique 0 0 1 652 5 569 38
Seychelles 0 0 0 0 0
Tunisia 1 595 2 217 1 720 1 382 1 658
Others 786 5 012 796 811 3 923
AMERICA 49 261 52 410 51 496 43 448 71 398
Netherlands Antilles 3 870 1 606 0 0 0
Brazil 9 973 12 990 9 062 14 120 10 455
Canada 5 543 7 430 9 004 5 422 5 954
Cuba 0 1 198
Mexico 829 2 247 1 767 1 401 2 306
USA 25 951 25 279 20 335 18 854 44 948
Other countries in the
Americas 3 095 2 858 11 328 3 650 7 537
ASIA 317 188 426 627 510 012 407 906 425 902
Saudi Arabia 19 309 25 061 30 514 29 662 20 914
China 151 984 205 805 299 902 184 195 202 173
South Korea 11 914 11 637 13 524 10 702 9 814
United Arab Emirates 8 102 14 945 16 786 13 166 21 637
India 27 766 39 378 34 696 33 426 40 481
Japan 33 302 41 780 46 213 47 561 42 198
Lebanon 3 535 2 456 2 239 1 401 2 152
Malaysia 7 842 10 049 11 105 14 723 14 998
Thaïlande 18 839 17 248 10 127 12 459 11 253
Turkey 13 399 15 744 15 447 19 649
Other Asian countries 34 596 44 870 29 163 45 163 40 634
OCEANIA 637 88 380 474 429
Australia 557 55 379 474 429
Other countries in
Oceania 79 33 1 0 0
TOTAL IMPORTS 859 139 1 026 033 1 086 999 938 177 973 358

74
Source : BCEAO
Table 38. Repartition of exports and imports in millions FCFAby geographical area
2014 2015 2016 2017 2018
COUNTRIES OF
DESTINATION EXPORTS OF GOODS (millions CFA Francs)
EUROPE 33 479 48 037 40 668 42 853 50 132
EUROPEAN UNION 31 254 46 425 39 489 41 399 49 196
EURO ZONE 28 922 44 299 36 247 40 983 48 377
Germany 1 803 1 917 1 104 535 3 685
Belgium 3 107 12 578 5 914 3 951 3 002
Spain 960 2 214 2 673 2 664 2 289
France 12 944 15 753 17 415 25 441 31 993
Irland 12 24 0 0 0
Italy 611 2 676 2 613 2 747 1 416
The Netherlands 8 900 6 861 4 081 4 294 3 423
Other Eurozone
countries 585
2 276 2 447 1 351 2 568
OTHER EU COUNTRIES 2 332 2 126 3 243 417 819
Denmark 0 167 109 15 0
Poland 1 577 12 2 002 0 0
United Kingdom 755 1 945 1 094 316 761
Others 0 2 38 86 58
OTHER EUROPEAN
COUNTRIES 2 225 1 612 1 178 1 454 936
Norway 0 0 5 7 0
Russia 3 0 29 515 0
Switzerland 873 1 576 1 060 791 592
Ukraine 47 32 84 140 321
Others 1 302 4 0 0 24
AFRICA 262 027 300 029 362 042 348 083 350 549
WAEMU 148 872 204 309 272 331 259 945 269 184
Benin 41 758 59 069 74 600 62 545 59 768
Burkina 38 421 64 334 76 902 78 241 85 684
Côte d’ivoire 13 538 15 814 37 394 38 778 43 204
Guinea-Bissau 1 277 413 151 173
Mali 15 435 21 664 32 940 27 513 30 622
Niger 37 513 38 856 44 821 44 666 44 508
Senegal 2 208 3 294 5 261 8 051 5 224
ECOWAS (excluding
WAEMU) 82 407 59 914 69 925 72 295 69 252
Ghana 35 781 32 264 41 635 33 515 38 454
Guinea 457 1 300 3 578 3 447 2 557
Nigeria 44 748 25 248 23 511 34 131 26 747
Other ECOWAS
(excluding WAEMU) 1 422
1 101 1 200 1 201 1 494
EMCCA (CEMAC) 27 479 24 220 13 081 5 262 7 155
Cameroon 4 869 3 459 1 391 1 456 1 135
Congo (Brazzaville) 1 450 2 043 5 116 314 1 423
Gabon 19 354 17 528 5 329 1 804 2 474
Equatorial Guinea 557 444 442 507 422
Central African Republic 776 335 206 314 522
Chad 473 411 597 867 1 180
OTHER AFRICAN
COUNTRIES 3 268
11 586 6 706 10 582 4 957
South Africa 215 382 296 140 253
Angola 400 127 49 143 100
Marocco 571 7 991 3 285 1 266 929
Democratic Republic of
Congo 1 695
570 1 716 2 133 780
Tunisia 97 308 95 291 126
Others 290 2 209 1 264 6 609 2 770
AMERICA 1 783 16 692 13 679 9 712 9 293
Netherlands Antilles 30 0
Brazil 4 4
Canada 85 9 224 10 806 5 883 6 048
Cuba 33 0
USA 1 662 3 038 2 859 3 638 3 117
Other countries in the
Americas 37 4 430 14 124 123
ASIA 39 048 87 821 68 948 70 941 92 720
China 7 112 4 527 5 538 8 630 4 856
India 10 004 38 870 32 540 26 708 39 873
Indonesia 5 405 9 545 4 000 5 765 2 790
Lebanon 133 252 321 402 589
Malaysia 2 510 9 907 9 981 3 994 25 167
Pakistan 666 321 2 588 8 952 1 192
Taïwan 882 57 309 322 675
Vietnam 5 621 7 527 3 020 2 300 6 658
Other Asian countries 6 717 16 815 10 650 13 867 10 922
OCEANIA 0 642 3 665 13 812 8 086
Australia 0 0 3 664 13 791 8 086
Other countries in
Oceania 0 642 1 21 0
TOTAL EXPORT 336 336 453 222 489 002 485 401 510 780
COUNTRY OF ORIGIN IMPORTS OF GOODS (millions CFA Francs)
EUROPE 382 904 365 549 378 616 324 889 312 400
EUROPEAN UNION 328 534 334 268 322 015 289 446 265 327
EURO ZONE 297 990 292 157 279 168 250 687 228 199
Germany 32 987 37 646 39 948 29 418 27 403
Belgium 44 217 38 969 41 150 30 251 24 397
Spain 40 771 39 481 18 444 16 770 18 448
France 79 510 95 915 94 908 101 347 89 261
Italy 16 429 15 206 13 207 11 518 13 490
The Netherlands 41 660 20 721 45 068 46 590 35 710
Other Eurozone
countries 42 416
44 219 26 444 14 792 19 491
OTHER EU COUNTRIES 30 543 42 111 42 847 38 759 37 127
Denmark 1 165 2 986 3 217 4 566 3 376
Latvia 15 171 17 633 7 757 17 377 8 616
United Kingdom 5 638 9 012 8 263 5 595 14 596
Sweden 689 4 569 3 688 1 486 2 946
Others 7 880 7 909 19 923 9 736 7 593
OTHER EUROPEAN
COUNTRIES 54 370 31 281 56 601 35 443 47 073
Iceland 61 569 1 41 46
Norway 370 325 239 6 876 2 205
Russiea 35 939 23 904 28 907 17 488 33 912
Switzerland 3 068 3 513 13 320 4 802 3 663
Ukraine 1 607 2 610 14 024 5 517 6 511
Others 878 360 111 719 736
AFRICA 109 149 181 360 146 495 161 460 163 228
WAEMU 39 924 47 889 57 993 43 830 40 364
Benin 6 775 4 876 8 356 5 597 3 840
Burkina 579 3 020 2 569 4 291 3 566
Côte d’ivoire 20 085 23 670 31 739 21 044 17 437
Guinea-Bissau 6 774 8 242 6 334 4 471 7 079
Mali 54 545 119 322 222
Niger 68 56 29 55 8
Senegal 5 590 7 480 8 848 8 050 8 212
ECOWAS (excluding
waemu) 37 417 42 397 54 115 67 008 66 927
Ghana 31 095 34 528 36 036 38 782 29 230
Nigeria 6 317 7 840 17 844 28 166 37 645
Other ECOWAS
(excluding WAEMU) 4 29 235 59 51
EMCCA (CEMAC) 290 839 1 419 323 174
Cameroon 274 781 462 59 71
Congo (Brazzaville) 0 2 55 1 0
Other EMCCA 15 57 902 263 103
OTHER AFRICAN
COUNTRIES 31 519 90 235 32 968 50 299 55 763
South Africa 15 204 50 339 10 714 24 282 16 346
Egypt 3 206 3 514 3 014 5 383 9 803
Marocco 9 006 23 172 10 385 5 846 13 559
Mauritania 1 723 5 982 4 688 7 025 10 437
Mozambique 0 0 1 652 5 569 38
Seychelles 0 0 0 0 0
Tunisia 1 595 2 217 1 720 1 382 1 658
Others 786 5 012 796 811 3 923
AMERICA 49 261 52 410 51 496 43 448 71 398
Netherlands Antilles 3 870 1 606 0 0 0
Brazil 9 973 12 990 9 062 14 120 10 455
Canada 5 543 7 430 9 004 5 422 5 954
Cuba 0 1 198
Mexico 829 2 247 1 767 1 401 2 306
USA 25 951 25 279 20 335 18 854 44 948
Other countries in the
Americas 3 095 2 858 11 328 3 650 7 537
ASIA 317 188 426 627 510 012 407 906 425 902
Saudi Arabia 19 309 25 061 30 514 29 662 20 914
China 151 984 205 805 299 902 184 195 202 173
South Korea 11 914 11 637 13 524 10 702 9 814
United Arab Emirates 8 102 14 945 16 786 13 166 21 637
India 27 766 39 378 34 696 33 426 40 481
Japan 33 302 41 780 46 213 47 561 42 198
Lebanon 3 535 2 456 2 239 1 401 2 152
Malaysia 7 842 10 049 11 105 14 723 14 998
Thaïlande 18 839 17 248 10 127 12 459 11 253
Turkey 13 399 15 744 15 447 19 649
Other Asian countries 34 596 44 870 29 163 45 163 40 634
OCEANIA 637 88 380 474 429
Australia 557 55 379 474 429
Other countries in
Oceania 79 33 1 0 0
TOTAL IMPORTS 859 139 1 026 033 1 086 999 938 177 973 358

75
Source : BCEAO
Table 38. Repartition of exports and imports in millions FCFAby geographical area
2014 2015 2016 2017 2018
COUNTRIES OF
DESTINATION EXPORTS OF GOODS (millions CFA Francs)
EUROPE 33 479 48 037 40 668 42 853 50 132
EUROPEAN UNION 31 254 46 425 39 489 41 399 49 196
EURO ZONE 28 922 44 299 36 247 40 983 48 377
Germany 1 803 1 917 1 104 535 3 685
Belgium 3 107 12 578 5 914 3 951 3 002
Spain 960 2 214 2 673 2 664 2 289
France 12 944 15 753 17 415 25 441 31 993
Irland 12 24 0 0 0
Italy 611 2 676 2 613 2 747 1 416
The Netherlands 8 900 6 861 4 081 4 294 3 423
Other Eurozone
countries 585
2 276 2 447 1 351 2 568
OTHER EU COUNTRIES 2 332 2 126 3 243 417 819
Denmark 0 167 109 15 0
Poland 1 577 12 2 002 0 0
United Kingdom 755 1 945 1 094 316 761
Others 0 2 38 86 58
OTHER EUROPEAN
COUNTRIES 2 225 1 612 1 178 1 454 936
Norway 0 0 5 7 0
Russia 3 0 29 515 0
Switzerland 873 1 576 1 060 791 592
Ukraine 47 32 84 140 321
Others 1 302 4 0 0 24
AFRICA 262 027 300 029 362 042 348 083 350 549
WAEMU 148 872 204 309 272 331 259 945 269 184
Benin 41 758 59 069 74 600 62 545 59 768
Burkina 38 421 64 334 76 902 78 241 85 684
Côte d’ivoire 13 538 15 814 37 394 38 778 43 204
Guinea-Bissau 1 277 413 151 173
Mali 15 435 21 664 32 940 27 513 30 622
Niger 37 513 38 856 44 821 44 666 44 508
Senegal 2 208 3 294 5 261 8 051 5 224
ECOWAS (excluding
WAEMU) 82 407 59 914 69 925 72 295 69 252
Ghana 35 781 32 264 41 635 33 515 38 454
Guinea 457 1 300 3 578 3 447 2 557
Nigeria 44 748 25 248 23 511 34 131 26 747
Other ECOWAS
(excluding WAEMU) 1 422
1 101 1 200 1 201 1 494
EMCCA (CEMAC) 27 479 24 220 13 081 5 262 7 155
Cameroon 4 869 3 459 1 391 1 456 1 135
Congo (Brazzaville) 1 450 2 043 5 116 314 1 423
Gabon 19 354 17 528 5 329 1 804 2 474
Equatorial Guinea 557 444 442 507 422
Central African Republic 776 335 206 314 522
Chad 473 411 597 867 1 180
OTHER AFRICAN
COUNTRIES 3 268
11 586 6 706 10 582 4 957
South Africa 215 382 296 140 253
Angola 400 127 49 143 100
Marocco 571 7 991 3 285 1 266 929
Democratic Republic of
Congo 1 695
570 1 716 2 133 780
Tunisia 97 308 95 291 126
Others 290 2 209 1 264 6 609 2 770
AMERICA 1 783 16 692 13 679 9 712 9 293
Netherlands Antilles 30 0
Brazil 4 4
Canada 85 9 224 10 806 5 883 6 048
Cuba 33 0
USA 1 662 3 038 2 859 3 638 3 117
Other countries in the
Americas 37 4 430 14 124 123
ASIA 39 048 87 821 68 948 70 941 92 720
China 7 112 4 527 5 538 8 630 4 856
India 10 004 38 870 32 540 26 708 39 873
Indonesia 5 405 9 545 4 000 5 765 2 790
Lebanon 133 252 321 402 589
Malaysia 2 510 9 907 9 981 3 994 25 167
Pakistan 666 321 2 588 8 952 1 192
Taïwan 882 57 309 322 675
Vietnam 5 621 7 527 3 020 2 300 6 658
Other Asian countries 6 717 16 815 10 650 13 867 10 922
OCEANIA 0 642 3 665 13 812 8 086
Australia 0 0 3 664 13 791 8 086
Other countries in
Oceania 0 642 1 21 0
TOTAL EXPORT 336 336 453 222 489 002 485 401 510 780
COUNTRY OF ORIGIN IMPORTS OF GOODS (millions CFA Francs)
EUROPE 382 904 365 549 378 616 324 889 312 400
EUROPEAN UNION 328 534 334 268 322 015 289 446 265 327
EURO ZONE 297 990 292 157 279 168 250 687 228 199
Germany 32 987 37 646 39 948 29 418 27 403
Belgium 44 217 38 969 41 150 30 251 24 397
Spain 40 771 39 481 18 444 16 770 18 448
France 79 510 95 915 94 908 101 347 89 261
Italy 16 429 15 206 13 207 11 518 13 490
The Netherlands 41 660 20 721 45 068 46 590 35 710
Other Eurozone
countries 42 416
44 219 26 444 14 792 19 491
OTHER EU COUNTRIES 30 543 42 111 42 847 38 759 37 127
Denmark 1 165 2 986 3 217 4 566 3 376
Latvia 15 171 17 633 7 757 17 377 8 616
United Kingdom 5 638 9 012 8 263 5 595 14 596
Sweden 689 4 569 3 688 1 486 2 946
Others 7 880 7 909 19 923 9 736 7 593
OTHER EUROPEAN
COUNTRIES 54 370 31 281 56 601 35 443 47 073
Iceland 61 569 1 41 46
Norway 370 325 239 6 876 2 205
Russiea 35 939 23 904 28 907 17 488 33 912
Switzerland 3 068 3 513 13 320 4 802 3 663
Ukraine 1 607 2 610 14 024 5 517 6 511
Others 878 360 111 719 736
AFRICA 109 149 181 360 146 495 161 460 163 228
WAEMU 39 924 47 889 57 993 43 830 40 364
Benin 6 775 4 876 8 356 5 597 3 840
Burkina 579 3 020 2 569 4 291 3 566
Côte d’ivoire 20 085 23 670 31 739 21 044 17 437
Guinea-Bissau 6 774 8 242 6 334 4 471 7 079
Mali 54 545 119 322 222
Niger 68 56 29 55 8
Senegal 5 590 7 480 8 848 8 050 8 212
ECOWAS (excluding
waemu) 37 417 42 397 54 115 67 008 66 927
Ghana 31 095 34 528 36 036 38 782 29 230
Nigeria 6 317 7 840 17 844 28 166 37 645
Other ECOWAS
(excluding WAEMU) 4 29 235 59 51
EMCCA (CEMAC) 290 839 1 419 323 174
Cameroon 274 781 462 59 71
Congo (Brazzaville) 0 2 55 1 0
Other EMCCA 15 57 902 263 103
OTHER AFRICAN
COUNTRIES 31 519 90 235 32 968 50 299 55 763
South Africa 15 204 50 339 10 714 24 282 16 346
Egypt 3 206 3 514 3 014 5 383 9 803
Marocco 9 006 23 172 10 385 5 846 13 559
Mauritania 1 723 5 982 4 688 7 025 10 437
Mozambique 0 0 1 652 5 569 38
Seychelles 0 0 0 0 0
Tunisia 1 595 2 217 1 720 1 382 1 658
Others 786 5 012 796 811 3 923
AMERICA 49 261 52 410 51 496 43 448 71 398
Netherlands Antilles 3 870 1 606 0 0 0
Brazil 9 973 12 990 9 062 14 120 10 455
Canada 5 543 7 430 9 004 5 422 5 954
Cuba 0 1 198
Mexico 829 2 247 1 767 1 401 2 306
USA 25 951 25 279 20 335 18 854 44 948
Other countries in the
Americas 3 095 2 858 11 328 3 650 7 537
ASIA 317 188 426 627 510 012 407 906 425 902
Saudi Arabia 19 309 25 061 30 514 29 662 20 914
China 151 984 205 805 299 902 184 195 202 173
South Korea 11 914 11 637 13 524 10 702 9 814
United Arab Emirates 8 102 14 945 16 786 13 166 21 637
India 27 766 39 378 34 696 33 426 40 481
Japan 33 302 41 780 46 213 47 561 42 198
Lebanon 3 535 2 456 2 239 1 401 2 152
Malaysia 7 842 10 049 11 105 14 723 14 998
Thaïlande 18 839 17 248 10 127 12 459 11 253
Turkey 13 399 15 744 15 447 19 649
Other Asian countries 34 596 44 870 29 163 45 163 40 634
OCEANIA 637 88 380 474 429
Australia 557 55 379 474 429
Other countries in
Oceania 79 33 1 0 0
TOTAL IMPORTS 859 139 1 026 033 1 086 999 938 177 973 358
Imports increased between 2014 and 2016 before declining in 2017. The decline in imports in 2017 is due to imports from Asia, particularly China, and from Europe, especially Belgium and Germany. In 2018, an upturn in imports was noted, driven by products from the United States of America, China, Russia, Morocco and Nigeria. Togo's main partners in terms of imports are (i) in Asia, China ; (ii) in Europe, France and (iii) in Africa, Nigeria, Ghana and Côte d'Ivoire.
Asia remains the first continent of origin of Togo's im-ports in 2018, with 43.8%, followed by Europe with 32.1%. China is Togo's main partner. It is followed by France. Africa's share of imports was 16.8%. In Afri-ca, Nigeria is Togo's main supplier. In the WAEMU zone, Côte d’ivoire is Togo's main supplier.
5.3.3 International trade in value and by product
In terms of structure, exports have diversified, with a decline in the relative share of traditional products
such as cement and phosphates, although there is a slight increase in 2018 compared to 2017 for these products. The importance of cotton has increased and exports of coffee, cocoa, chemicals and steel products have picked up.
Overall, the increase that began in 2017 in the share of agricultural products, industrial products, and pe-troleum products (for re-export) continued. Mining products also increased in 2018 after a decline in 2017. Industrial products were Togo's largest export item, accounting for 45.7% in 2018, compared with 47.2% in 2017. They mainly consist of machinery and transport equipment, food products, chemicals and other manufactured products. The second item is agricultural products, which accounted for 19.5% of total exports in 2018 against 18.2% in 2017. Mi-ning products accounted for 19.5% in 2018 against 18.7% in 2017. They consist mainly of phosphate and clinker.

76
Table 39. Value of exports and imports in millions CFA Francs by product
Source : BCEAO
2014
2 015 2 016
2 017 2 018
EXPORTS OF GOODS 335 396 453 221 489 001 485 401 510 794
Agricultural Products 62 273 92 829 68 172 88 579
101
197
Cacao 14 443 14 551 8 128 3 125 5 084
Coffe 7 844 11 540 4 638 1 482 6 679
Cotton Fiber 28 615 37 393 30 224 42 281 49 075
Other agricultural raw
materials 1 551 1 396 1 641 4 711 1 208
Other Products of
Plant Origin 9 820 27 949 23 541 36 980 39 151
Oilseed 6 877 25 741 21 275 30 694 27 197
Cereals and flours 837 319 146 1 579 2 756
Chillies and Spices 383 8 9 1 3
Vegetables and fruits 1 430 1 643 1 808 4 578 9 062
Flowers and cuttings - 25 47 14 15
Other products of plant
origin 293 212 256 114 117
Mining products 86 355 98 781 100 119 90 707 99 522
Phosphates 55 056 59 249 46 869 39 603 46 211
Clinker 28 371 38 237 53 250 51 104 53 311
Iron minerals 2 928 1 295 - - -
Petroleum Products 35 299 21 737 25 210 41 897 46 205
Industrial Products 146 166 207 935 270 335 229 190 233 563
Cement 19 105 7 860 6 373 4 000 4 497
Steel products 19 191 16 162 13 607 12 413 17 078
Food products 24 862 43 131 57 969 42 659 36 090
Textiles and articles of
clothing 27 316 27 426 21 393 22 901 22 637
Chemical products 22 113 41 087 46 917 38 435 43 149
Machinery and
equipment for
transport 14 097 35 003 61 108 50 873 52 061
Other manufactured
products 19 483 37 266 62 968 57 909 58 051
Other products 5 303 31 939 25 165 35 028 30 307
IMPORTS 859 139 1 026 033 1 086 999 938 177 973 358
Consumer Goods 258 169 315 041 349 043 342 444 335 975
Food products 100 868 117 436 117 793 123 684
132
643
Beverages 6 075 7 573 7 644 10 544 11 048
Tobacco 6 093 5 057 5 053 4 952 5 727
Pharmaceutical products 44 097 59 171 60 276 65 005 52 990
Chemical products 30 606 35 948 37 332 36 029 37 005
Other manufactured
products 70 429 89 856 120 944 102 230 96 562
Energy and lubricants 160 178 145 522 142 260 145 716 166 873
Lamp oil 5 978 4 830 2 623 2 727 2 860
Gasoline 44 789 36 909 42 836 40 375 56 321
Diesel and fuel oil 68 614 60 132 63 366 62 735 62 011
Lubricating oils 10 707 9 337 11 928 10 737 13 168
Butane and other gases 6 175 6 068 6 346 6 452 9 655
Bitumen and bitumen
products 19 671 26 296 13 223 20 433 22 686
Others 4 244 1 949 2 257 173
Raw Materials and
Semi-finished Products 213 856 287 701 272 361 247 555 260 891
Raw materials 59 270 45 123 36 034 47 757 51 032
Including Wheat 16 565 17 072 21 790 21 028 22 135
Semi-finished products 154 587 242 579 236 327 199 798 209 859
Including steel
products 124 146 177 303 163 486 158 648
160
370
Other materialsof construction
11 368 22 437 13 974 9 151 8 011
Capital Goods 226 937 277 769 323 336 202 462 209 619
Finished products for
agriculture 2 065 6 868 3 474 2 138 2 005
Finished products for
industry 224 871 270 901 319 862 200 324
207
614
1 938

77
Table 39. Value of exports and imports in millions CFA Francs by product
Source : BCEAO
2014
2 015 2 016
2 017 2 018
EXPORTS OF GOODS 335 396 453 221 489 001 485 401 510 794
Agricultural Products 62 273 92 829 68 172 88 579
101
197
Cacao 14 443 14 551 8 128 3 125 5 084
Coffe 7 844 11 540 4 638 1 482 6 679
Cotton Fiber 28 615 37 393 30 224 42 281 49 075
Other agricultural raw
materials 1 551 1 396 1 641 4 711 1 208
Other Products of
Plant Origin 9 820 27 949 23 541 36 980 39 151
Oilseed 6 877 25 741 21 275 30 694 27 197
Cereals and flours 837 319 146 1 579 2 756
Chillies and Spices 383 8 9 1 3
Vegetables and fruits 1 430 1 643 1 808 4 578 9 062
Flowers and cuttings - 25 47 14 15
Other products of plant
origin 293 212 256 114 117
Mining products 86 355 98 781 100 119 90 707 99 522
Phosphates 55 056 59 249 46 869 39 603 46 211
Clinker 28 371 38 237 53 250 51 104 53 311
Iron minerals 2 928 1 295 - - -
Petroleum Products 35 299 21 737 25 210 41 897 46 205
Industrial Products 146 166 207 935 270 335 229 190 233 563
Cement 19 105 7 860 6 373 4 000 4 497
Steel products 19 191 16 162 13 607 12 413 17 078
Food products 24 862 43 131 57 969 42 659 36 090
Textiles and articles of
clothing 27 316 27 426 21 393 22 901 22 637
Chemical products 22 113 41 087 46 917 38 435 43 149
Machinery and
equipment for
transport 14 097 35 003 61 108 50 873 52 061
Other manufactured
products 19 483 37 266 62 968 57 909 58 051
Other products 5 303 31 939 25 165 35 028 30 307
IMPORTS 859 139 1 026 033 1 086 999 938 177 973 358
Consumer Goods 258 169 315 041 349 043 342 444 335 975
Food products 100 868 117 436 117 793 123 684
132
643
Beverages 6 075 7 573 7 644 10 544 11 048
Tobacco 6 093 5 057 5 053 4 952 5 727
Pharmaceutical products 44 097 59 171 60 276 65 005 52 990
Chemical products 30 606 35 948 37 332 36 029 37 005
Other manufactured
products 70 429 89 856 120 944 102 230 96 562
Energy and lubricants 160 178 145 522 142 260 145 716 166 873
Lamp oil 5 978 4 830 2 623 2 727 2 860
Gasoline 44 789 36 909 42 836 40 375 56 321
Diesel and fuel oil 68 614 60 132 63 366 62 735 62 011
Lubricating oils 10 707 9 337 11 928 10 737 13 168
Butane and other gases 6 175 6 068 6 346 6 452 9 655
Bitumen and bitumen
products 19 671 26 296 13 223 20 433 22 686
Others 4 244 1 949 2 257 173
Raw Materials and
Semi-finished Products 213 856 287 701 272 361 247 555 260 891
Raw materials 59 270 45 123 36 034 47 757 51 032
Including Wheat 16 565 17 072 21 790 21 028 22 135
Semi-finished products 154 587 242 579 236 327 199 798 209 859
Including steel
products 124 146 177 303 163 486 158 648
160
370
Other materialsof construction
11 368 22 437 13 974 9 151 8 011
Capital Goods 226 937 277 769 323 336 202 462 209 619
Finished products for
agriculture 2 065 6 868 3 474 2 138 2 005
Finished products for
industry 224 871 270 901 319 862 200 324
207
614
1 938

78
Table 39. Value of exports and imports in millions CFA Francs by product
Source : BCEAO
2014
2 015 2 016
2 017 2 018
EXPORTS OF GOODS 335 396 453 221 489 001 485 401 510 794
Agricultural Products 62 273 92 829 68 172 88 579
101
197
Cacao 14 443 14 551 8 128 3 125 5 084
Coffe 7 844 11 540 4 638 1 482 6 679
Cotton Fiber 28 615 37 393 30 224 42 281 49 075
Other agricultural raw
materials 1 551 1 396 1 641 4 711 1 208
Other Products of
Plant Origin 9 820 27 949 23 541 36 980 39 151
Oilseed 6 877 25 741 21 275 30 694 27 197
Cereals and flours 837 319 146 1 579 2 756
Chillies and Spices 383 8 9 1 3
Vegetables and fruits 1 430 1 643 1 808 4 578 9 062
Flowers and cuttings - 25 47 14 15
Other products of plant
origin 293 212 256 114 117
Mining products 86 355 98 781 100 119 90 707 99 522
Phosphates 55 056 59 249 46 869 39 603 46 211
Clinker 28 371 38 237 53 250 51 104 53 311
Iron minerals 2 928 1 295 - - -
Petroleum Products 35 299 21 737 25 210 41 897 46 205
Industrial Products 146 166 207 935 270 335 229 190 233 563
Cement 19 105 7 860 6 373 4 000 4 497
Steel products 19 191 16 162 13 607 12 413 17 078
Food products 24 862 43 131 57 969 42 659 36 090
Textiles and articles of
clothing 27 316 27 426 21 393 22 901 22 637
Chemical products 22 113 41 087 46 917 38 435 43 149
Machinery and
equipment for
transport 14 097 35 003 61 108 50 873 52 061
Other manufactured
products 19 483 37 266 62 968 57 909 58 051
Other products 5 303 31 939 25 165 35 028 30 307
IMPORTS 859 139 1 026 033 1 086 999 938 177 973 358
Consumer Goods 258 169 315 041 349 043 342 444 335 975
Food products 100 868 117 436 117 793 123 684
132
643
Beverages 6 075 7 573 7 644 10 544 11 048
Tobacco 6 093 5 057 5 053 4 952 5 727
Pharmaceutical products 44 097 59 171 60 276 65 005 52 990
Chemical products 30 606 35 948 37 332 36 029 37 005
Other manufactured
products 70 429 89 856 120 944 102 230 96 562
Energy and lubricants 160 178 145 522 142 260 145 716 166 873
Lamp oil 5 978 4 830 2 623 2 727 2 860
Gasoline 44 789 36 909 42 836 40 375 56 321
Diesel and fuel oil 68 614 60 132 63 366 62 735 62 011
Lubricating oils 10 707 9 337 11 928 10 737 13 168
Butane and other gases 6 175 6 068 6 346 6 452 9 655
Bitumen and bitumen
products 19 671 26 296 13 223 20 433 22 686
Others 4 244 1 949 2 257 173
Raw Materials and
Semi-finished Products 213 856 287 701 272 361 247 555 260 891
Raw materials 59 270 45 123 36 034 47 757 51 032
Including Wheat 16 565 17 072 21 790 21 028 22 135
Semi-finished products 154 587 242 579 236 327 199 798 209 859
Including steel
products 124 146 177 303 163 486 158 648
160
370
Other materialsof construction
11 368 22 437 13 974 9 151 8 011
Capital Goods 226 937 277 769 323 336 202 462 209 619
Finished products for
agriculture 2 065 6 868 3 474 2 138 2 005
Finished products for
industry 224 871 270 901 319 862 200 324
207
614
1 938
In contrast, the structure of imports remained re-latively stable. Imports consist largely of manufac-tured goods (84% on average over the period un-der review) and primary materials and semi-finished products to a lesser extent (26%). Manufactured products are made up of capital goods, consumer goods and energy and lubricants.
Consumer goods are the first item with 34.5% of total imports in 2018 against 36.5% in 2017. They are followed by raw materials and semi-finished pro-ducts (26.8% in 2018 against 26.4% in 2017), capital goods (21.5% in 2018 against 21.6% in 2017) and energy and lubricants (17.1% in 2018 against 15.5% in 2017).
With the National Development Plan 2018-2022 cur-rently being implemented, imports of capital goods are expected to increase thanks to the establishment of production units in the manufacturing sector, par-ticularly for the processing of agricultural products (agri-foodstuffs) but also with the strengthening of energy capacity. Eventually, Togo will see an increase in exports of food products.
5.4 Foreign Direct Investment
FDI in Togo is only allowed in certain sectors. Fo-reign ownership of land is restricted and capital transactions are subject to government controls or approval. FDI flows into Togo have been particularly low and unstable in recent years. An improved bu-siness environment and the launching of power plant construction projects should facilitate an increase in FDI in the coming years.
Togo's outward FDI flows have been higher since 2014. Thus, the stock of outward FDI has signi-ficantly increased over the period 2014 to 2018. It rose from CFA Francs 861.88 billion in 2014 to CFA Francs 1.383.95 billion in 2018, an average annual increase of 9%. The incoming stock, for its part, in-creased from CFA Francs 724.16 billion in 2014 to CFA Francs 994.49 billion in 2018 after reaching CFA Francs 1 031.35 billion. The incoming stock essen-tially finances financial activities and services.

79
Source : UNCTADSTAT
Table 40. Foreign direct investments 2014-2018 (in billions FCFA)
2014 2015 2016 2017 2018
Incoming flow 26.61 152.48 -27.46 51.39 56.67
Outgoing
Flow 176.97 206.12 152.28 -18.92 144.17
Incoming
Stock 724.16 927.39 874.09 1 031.35 994.49
Outgoing
Stock 861.88 1 128.49 1 240.57 1 365.43 1 383.95
France, the United States, Canada, Brazil and China are the main providers of FDI in Togo. It should also be noted that FDI comes from some African coun-tries, especially from WAEMU countries, but also Nigeria.
Based on the results of the Coordinated Direct In-vestment Survey (CDIS) for 2018, net capital out-flows mainly concerned the "Financial Intermedia-tion, Insurance and Retirement" branch. The main country responsible for these net outflows is Nigeria.
Source : BCEAO
Table 41. Foreign direct investments by country of origin (in millions of FCFA)
2014 2015 2016 2017 2018
Amount
share
(%)
Amount
share
(%) Amount
share
(%) Amount
share
(%)
Amount
share
(%) Stock of financial
assets 1 617.33 100% 1 894.21 100% 2 107.59 100% 1 892.56 100% 1 997.96 100%
Other WAEMU
countries 260.61 16% 238.80 13% 244.03 12% 198.31 10% 231.95 12%
Euro Zone 35.61 2% 44.71 2% 185.65 9% 41.84 2% 42.90 2% Other countries 1 321.11 82% 1 610.70 85% 1 677.91 80% 1 652.41 87% 86%
Stock of financial
liabilities 539.72 100% 703.41 100% 1 477.23 100% 1 167.32 100% 1 180.39 100% Other WAEMU
countries 101.66 19% 137.93 20% 96.15 7% 206.37 18% 287.08 24%
Euro zone 147.46 27% 146.43 21% 30.80 2% 81.85 7% 365.93 31% Other countries 290.60 54% 419.05 60% 1 350.28 91% 879.10 75% 527.38 45%
1 723.11
It should also be noted that two important partnerships have been signed between the To-golese state and DIL (Dangote Industries Limited) in the mining sector in 2019. These agreements amount to a total of US$2.6 billion. These two agreements are in line with the NDP (National Development Plan, 2018-2022), which has the great ambition to revive the Togolese economy from a structural point of view and to establish it as an essential financial hub in the sub-region.
The projects focus on : (i) the valorization and trans-formation of Togolese phosphate (the main mineral wealth of this West African State) into phosphate fertilizers in order to supply the entire West African sub-region, and (ii) the establishment of a new ce-ment plant on Togolese soil with Togolese and Nige-rian clinker as raw material.

80
5.4.1 FDI by sector
The main sectors of the economy benefiting from fo-reign direct investment in Togo are cotton, infrastruc-ture, coffee and cocoa, manufacturing and extractive industries (phosphates), trade, telecommunications and the financial sector.Investment projects have focused on : i) the construction of a third quay by Bolloré for 72.0 million euros in 2013-2014, ii) the construction of a container terminal and a new dock at the autonomous port of Lomé by Lomé Contai-ner Terminal for 250.0 million euros over the period 2013-2016; 250.0 million over the period 2013-2016; (iii) the construction of a 100 MW power plant by Contour Global at a cost of $195.0 million; and (iv) the extension of the Lomé International Airport, as well as the construction and renovation of hotels.
The cost of the airport extension amounted to EUR 131.0 million financed by Eximbank China. With re-gard to hotels, two major investments have been made since 2012 and have made it possible to make up for the deficit in world-class hotels in Lomé. These are the renovation of the February 2 hotel at an estimated cost of 37.0 billion CFA Francs and the construction of a 120-room hotel by the Ono-mo Group. In the mining sector, Scan Togo-mines, a subsidiary of the German company Heidelberg Ce-ment, has invested US$258 million in the construc-tion of two plants, one for the production of clinker and the other for the production of cement in the northern part of Togo.
5.5 Regional integration
5.5.1 WAEMU convergence criteria
The WAEMU Convergence, Stability, Growth and Solidarity Pact comprises five (05) criteria divided
into first-tier and second-tier criteria.
The First-tier criteria
Ratio of the budget balance including grants to no-minal GDP (key criterion) : should be greater than or equal to -3%.
• Average annual inflation rate : should be main-tained at a maximum of 3% per year.
• Ratio of domestic and external debt stock to nominal GDP : should not exceed 70%.Le res-pect des critères de premier rang permet de passer à la phase de stabilité.
The second-tier criteria
• Ratio of the wage bill to tax revenue : should not exceed 35%.
• Tax burden ratio : should be 20% or more.
Togo's performance in meeting the convergence cri-teria has been inconsistent.
At the level of the primary criteria, only the criterion on the inflation rate has been met from 2014 to 2019. The key criterion on the budget balance has been met only in the last three years. The criterion on do-mestic and external debt was met in 2019.
As regards the second-tier criteria, they are not met in 2014 and 2019. For the year, 2020, it is expected that the balance criterion will not be met in relation to the increase in public expenditure resulting from the implementation of the covid-19 pandemic-related expenditure.

81
Source : WAEMU-NEPC Commission Togo, IMF country report April 2020
Table 42. Evolution of the TOGO convergence criteria
2014 2015 2016 2017 2018 2019 2020
First row
Overall �scal balance,including grants, on GDP(%)
≥-3% -6.9% -8.9% -9.5% -0.3% -0.8% -1.2% -3.6
Annual in�ation rate (%change in average indices)
≤3% 0.2 1.8 0.9 -0.2 0.9 0.7 2.0
Total public debtoutstanding in relation tonominal GDP (in %)
≤ 70% 60.8 70.6 79.9 72.8 73.9 68.7 65.3
Second row
Wages and salaries as %of tax revenues (R.F.)
≤35% 38.8 40.2 41.1 42.9 40.7 38.9 39.6
Tax revenues on GDP (in%)
≥20 16.36 17.30 16.8 16.1 16.5 17.2 17.5
5.5.2 Review of regional integration
In December 1999, an additional act to the treaty creating WAEMU, dealing with the convergence of member states was adopted. This was the birth of the Convergence, Stability, Growth and Solidarity Pact (CSGP). It is composed of four first-tier and four second-tier criteria. Failure to comply with the first-rank criteria leads to the explicit formulation of guidelines by the Council of Ministers requesting the member country concerned to draw up and imple-ment a programme of corrective measures. The se-cond-tier criteria, on the other hand, are treated as indicative structural benchmarks that are rigorously monitored because of their crucial role in achieving the objective of internal and external sustainability of the economies. However, there are no explicit re-commendations for their non-compliance.
The deadline for achieving the various criteria de-fined in the CSGP was initially set at 31 December 2002. In the long run, the convergence objective was
not achieved. This led to an extension of the dead-line first in 2005, then to 2008 and finally to 2013. In 2013, almost fifteen years after the adoption of the convergence pact, the balance sheet reveals unsa-tisfactory results leading to the revision of the CSSP and the definition of a new pact in 2015 by the Addi-tional Act N°01/2015/CCEG/WAEMU expiring on 31 December 2019.
In terms of evaluation of Community projects and programmes, in 2019, significant progress was noted in the implementation of one hundred and thirteen (113) Community reforms examined in particular in three areas: economic governance and convergence, the common market and sectoral policies. Overall in 2019, Togo recorded a rate of 71% in terms of trans-position and implementation of reforms compared to 64% in 2018, an increase of 7 points.
With regard to economic governance and conver-gence, WAEMU has evaluated twenty-five (25) texts. An average rate of 73% was raised in 2019 against

82
50% in 2018, i.e. an increase of 23 points. With re-gard to the common market, the evaluation covered thirty-nine (39) texts and the average implementation rate stabilised at around 63% between 2018 and 2019.
For sectoral reforms, forty-nine (49) texts were eva-luated. The implementation rate rose from 73% in 2018 to 77% in 2019, an increase of 4 points.
The analysis of convergence achievements over the period 2014-2018 shows that, for each year, Togo has not met all the criteria. Only one criterion was
met throughout the period under review. This is the criterion relating to the inflation rate, compliance with which is linked to the good performance of the agri-cultural sector. The criterion on the budget balance has been met over the last three years. As regards the debt criterion, from 2015 Togo's debt ratio has exceeded the 70 percent standard set by the CSGP and has been maintained until 2018 due to signifi-cant investments. Since 2017, Togo has concluded a programme with the IMF aimed at stabilising the macroeconomic framework, consolidating govern-ment finances and thereby reducing the debt ratio. In 2019, the debt ratio fell below 70%.

83
6 CREDIT QUALITY
6.1 Business Climate
The business environment has been considerably reformed in Togo. For the second consecutive year, the country is among the ten economies that have reformed their regulations for business facilitation the most. Togo has thus become the first reforming country in sub-Saharan Africa and the 3rd in the world according to the Doing Business 2020 report.
It ranks 97th out of 190 countries, with a score of 62.3 points compared to 55.3 points in the 2019 ranking. This reflects a good performance with an improve-ment in the score obtained in absolute terms of 7 points and an increase of 40 places compared to the previous report.
Source : Doing Business Reports, World Bank
Table 43. Ranking Doing Business Togo
2015 2016 2017 2018 2019 2020
(Number of countries
classified) (189)
(189)
(190)
(190)
(190)
(190)
Overall Rank 149 150 154 156 137 97
Starting a business 134 133 123 121 74 15
Obtaining of a building
permit 170 179
180 173 133 127
Electricity connection 134 109 147 142 105 99
Transfer of property 182 182 183 182 127 56
Obtaining credit 131 133 139 142 144 48
Protection of minority
investors 122 155
145 146 149 120
Paiment of taxes and duties 163 163 169 173 172 174
Cross - border trade 112 126 117 121 129 131
Enforcement of contracts 134 125 145 143 137 140
Regulation of Insolvency 93 93 87 81 86 88
Togo is one of the economies with the greatest impro-vement in the ease of conducting business activities in West Africa. Indeed, it has continued its initiatives aimed at improving the business climate. Since Sep-tember 2017, the Business Climate Unit was created with the aim of establishing optimal conditions for the effective implementation of reforms. Thanks to it,
Togo has accelerated the implementation of impor-tant reforms in five areas :
• The creation of a company has been faci-litated by the abolition of the obligation to have documents authenticated and by the shortening of the registration period.

84
Togo recorded a 6.4 point jump in the DB 2020 com-pared to the Doing Business 2019 index. Indeed, the deadline for obtaining a business creation card at the Center for Business Formalities (CBF) has been reduced to 7 hours since February 28, 2019 with the possibility of submitting the business creation application online with mobile paiment since March 6, 2019. In addition, the possibility offered to create Limited Liability Companies (LLC) by private deed without recourse to a notary has made it possible to drastically increase the creation of LLCs, which now represent more than 85% of the companies created since 2018.
• Costs and delays in obtaining building per-mits have been reduced through lower fees and the implementation of an online portal for filing applications.
Togo recorded an increase of 3.6 points in the DB 2020 compared to the previous year. The most de-cisive reform was the digitalisation of the building permit application. In addition, World Bank experts noted an improvement in the transparency of the building permit process, with the publication of the circular requiring the documents required for the is-suance of the permit, prior approval and fees to be posted online.
• The cost of connecting to electricity has decreased as a result of the lower cost of connection work and the security deposit for new connections.
The margin of progression in the DB 2020 is 2.6 points. This improvement is driven by the efforts of the Togolese authorities to further reduce the cost of connection to the medium-voltage electricity network by 50%.
• The transfer of property has been simplified and costs have been reduced.
Togo has made significant progress on this indicator. The increase is 17.2 points compared to DB 2019 and reflects the improvement in the transfer of ownership in the country. This progress is driven, among other things, by the reduction of registration fees, the di-gitisation of land titles, the significant reduction in the time required for total transfer, the creation of a property transfer office, the creation and online avai-lability of the Guichet Unique du Titre Foncier and freedom of access to land information for all.
• Togo has improved access to credit infor-mation by expanding the coverage of the credit bureau and starting to report utility data.
Access to credit information is the only indicator where the step forward is remarkable, a gain of 40 points over the DB 2019 Index. The notable impro-vement noted is due to the expansion of the Credit Bureau's coverage and the start of reporting of utility company data.

85
Source : Business Climate Unit-TOGO / National Services
Table 44. Doing Business Indicators
Indicator Regulation Metric (indicate those
available)
Starting a business
2018 Finance Law: abolition of
registration fees and stamps, exemption
from the Single Business Tax for
companies registered with the Centre de
Formalité des Entreprises (Business
Formalities Centre) for the creation of
privately-owned companies. Decree
n°2014-119/PR of May 19, 2014: for
limited liability companies, the share
capital and the company share are freely
determined by the articles of
association.
Deadline for issuing the
Single Business Start-up
Card is 24 hours.
Building Permit
Memorandum n°001/LNBTP/DG/2018 of
10 January 2018 relating to the
reduction of the costs of the soil study
for the construction of a warehouse (1 -
2 level)
The cost increases from
900.000 CFA Francs to
350.000 CFA Francs For
households, the cost is
250,000 CFA Francs.
Access to electricity
Decision n°001/DG/CEET/2017 of 07
December 2017 of the Compagnie
Energie Electrique du Togo : Reduces
the cost of works to connect medium
voltage to the public service distribution
network
Connection fees reduced by
30% with the possibility to
pay on a schedule of up to
6 months.
Property registration
Reduction of registration fees (art. 598
LF 2018)
Land Titles Digitization Project
Memorandum No. 400/MEF/SG/DADA
of 14 December 2017 establishing a
Transfer of Ownership Office
The total cost of transferring
ownership increases from
9.3% of the value of the land
in 2017 to 6.3% in 2018.
As of April 3, 2018, 98% of
the land titles have been
digitized. Reduction of the
time required to issue
descriptive statements
(copies of land titles) from 07
to 02 days
Access to Credit
Uniform Law n°2016 -005 of March
14, 2016 relating to the regulation
of credit information bureaus
(CIBs) as amended
Decree n°2018 -109/PR of
25/05/2018 authoris ing the
implementation of automated
processing of personal data to bring
major invoicing companies to
integrate the platform.
Average time to get
paid
Protection of minority
investors
Level of taxes
Ease of paying taxes
Launch of electronic tax filing for large
businesses in 2016 and for SMEs in
January 2017. Instruction 174 of the
Commissariat des Impôts of December
28, 2017: request the services to issue
tax exemption certificates within 8 hours
at the latest, upon receipt of the
request.
Export facility
Enforcing contract law Average processing time is
100 days.
Court of First Instance of Lomé by Order No 2699/2017 of 22 December 2017 setting up special commercial chambers to deal with small claims with disputed interest between 0 and 1.000.000 FCFA. Court of Appeal of Lomé, by order n°1294/2017 of 26 December 2017, recomposing the chambers of the Court of Appeal of Lomé: it sets up special-ized commercial chambers with magis-trates assigned for this purpose in order to speed up the handling of com-mercial disputes.

86
Source : Business Climate Unit-TOGO / National Services
Table 44. Doing Business Indicators
Indicator Regulation Metric (indicate those
available)
Starting a business
2018 Finance Law: abolition of
registration fees and stamps, exemption
from the Single Business Tax for
companies registered with the Centre de
Formalité des Entreprises (Business
Formalities Centre) for the creation of
privately-owned companies. Decree
n°2014-119/PR of May 19, 2014: for
limited liability companies, the share
capital and the company share are freely
determined by the articles of
association.
Deadline for issuing the
Single Business Start-up
Card is 24 hours.
Building Permit
Memorandum n°001/LNBTP/DG/2018 of
10 January 2018 relating to the
reduction of the costs of the soil study
for the construction of a warehouse (1 -
2 level)
The cost increases from
900.000 CFA Francs to
350.000 CFA Francs For
households, the cost is
250,000 CFA Francs.
Access to electricity
Decision n°001/DG/CEET/2017 of 07
December 2017 of the Compagnie
Energie Electrique du Togo : Reduces
the cost of works to connect medium
voltage to the public service distribution
network
Connection fees reduced by
30% with the possibility to
pay on a schedule of up to
6 months.
Property registration
Reduction of registration fees (art. 598
LF 2018)
Land Titles Digitization Project
Memorandum No. 400/MEF/SG/DADA
of 14 December 2017 establishing a
Transfer of Ownership Office
The total cost of transferring
ownership increases from
9.3% of the value of the land
in 2017 to 6.3% in 2018.
As of April 3, 2018, 98% of
the land titles have been
digitized. Reduction of the
time required to issue
descriptive statements
(copies of land titles) from 07
to 02 days
Access to Credit
Uniform Law n°2016 -005 of March
14, 2016 relating to the regulation
of credit information bureaus
(CIBs) as amended
Decree n°2018 -109/PR of
25/05/2018 authoris ing the
implementation of automated
processing of personal data to bring
major invoicing companies to
integrate the platform.
Average time to get
paid
Protection of minority
investors
Level of taxes
Ease of paying taxes
Launch of electronic tax filing for large
businesses in 2016 and for SMEs in
January 2017. Instruction 174 of the
Commissariat des Impôts of December
28, 2017: request the services to issue
tax exemption certificates within 8 hours
at the latest, upon receipt of the
request.
Export facility
Enforcing contract law Average processing time is
100 days.
Court of First Instance of Lomé by Order No 2699/2017 of 22 December 2017 setting up special commercial chambers to deal with small claims with disputed interest between 0 and 1.000.000 FCFA. Court of Appeal of Lomé, by order n°1294/2017 of 26 December 2017, recomposing the chambers of the Court of Appeal of Lomé: it sets up special-ized commercial chambers with magis-trates assigned for this purpose in order to speed up the handling of com-mercial disputes.

87
In terms of governance, the Ibrahim Index of Afri-can Governance (IIAG) shows that Togo has made progress. Thus, according to the IIAG 2018, Togo ranked 30th out of 54 countries with a score of 49.1 out of 100 in global governance. The trend over the last ten years (2008-2017) is +5.2, an improvement driven by the implementation of reforms in strategic sectors, including the modernisation of the justice system, the consolidation of government finances, the improvement of business climates and invest-ment in economic infrastructure, etc. The IIAG 2018 shows that Togo has made progress.
Togo, aware that corruption is a real obstacle to good governance and economic development, has rati-fied the international instruments on the fight against corruption. These are the United Nations Conven-tion against Corruption, the African Union Conven-tion on Preventing and Combating Corruption and the ECOWAS Protocol on the fight against corrup-tion. Despite the legal framework in place, the results are not yet encouraging. Togo scored 29 points in 2019, one point lower than in 2018. The score was 32 points between 2015 and 2017. The country thus finds itself in 130th place out of 180 countries in the world. Nevertheless, awareness-raising campaigns have been launched by the High Authority for the Prevention and Fight against Corruption and Related Offences HAPFACRO (HAPLUCIA) and efforts are continuing to combat the scourge of corruption.
6.2 Financial Governance
Togo's performance under the economic program supported by the extension of the Extended Credit Facility (ECF) was generally satisfactory. Indeed, an IMF review carried out in December 2019 revealed that the economic recovery was strengthening. Economic growth is estimated to have accelerated from 4.9% in 2018 to 5.3% in 2019. Construction activity accelerated as cement production and sales increased. Traffic at the port and airport continued to grow ; electricity consumption increased by 27% in December 2019 compared to the same period in 2018. Credit to the private sector increased by 4% at the end of 2019. Meanwhile, there are signs of weakness in export-oriented sectors : coffee and phosphate production has been significantly lower since the second quarter of 2019 compared to the same period in 2018. The trade balance is expected
to deteriorate slightly in 2019 due to less dynamic exports and sustained imports linked to the Natio-nal Development Plan. Headline inflation declined to -0.3 % in December 2019 mainly due to an abundant supply of agricultural products and lower communi-cations costs, while core inflation fell to 0.1 %.
Macroeconomic outcomes in 2020 will be signifi-cantly impacted by the COVID-19 pandemic. The baseline economic growth forecast for 2020 has been revised downwards from 5.5% prior to the pandemic to 3%. This lower forecast is supported by the decline in airport traffic hampered by various bans and the decline in economic activity. Private consumption is expected to decrease significantly in 2020, affecting the poor more severely given their already low level of consumption. The budget deficit and external financing gap for 2020 are also larger in the current baseline scenario compared to previous projections.
Although the decline in exports of goods may be off-set by a decline in imports of goods (especially as the effects on oil prices are favourable for oil impor-ters), the decline in exports of services and inflows of foreign direct investment and portfolio invest-ment is expected to be significant, thereby increa-sing the need for external financing. More broadly, COVID -19 could impede the continuation of econo-mic activity due to confidence effects, containment efforts, supply disruptions and behavioural changes (such as social distancing). These macroeconomic projections are subject to a high degree of uncer-tainty given the rapidly changing impacts of COVID -19.
The 2020 budget approved by Parliament on 18 December 2019 targets an overall budget deficit of 1.9% of GDP. This target is supported by revenue and expenditure measures. On the revenue side, the authorities expect significant returns (around 0.4% of GDP) from the recently introduced property tax, motor vehicle tax and flat rate import deposits.
In addition, stricter customs controls and the collec-tion of tax arrears will support tax revenues. On the expenditure side, the recently completed expendi-ture review suggested potential long-term savings (up to 1.1% of GDP) through the review of unduly paid wages and pensions, better prioritisation of

88
subsidies and expenditure on goods and services, and reduction in the prices of goods and services. Strengthening public procurement, with the support of World Bank technical assistance, could also ge-nerate fiscal savings. The 2020 fiscal target reflects continued fiscal consolidation efforts and is expec-ted to keep public debt below 70 percent of GDP in 2020.
The Togolese authorities have implemented impor-tant structural reforms. Several measures related to revenue administration have been implemented, in-cluding the creation and harmonisation of tax identi-fication numbers, the introduction of tele-procedures to reduce compliance costs, withholding taxes and provisional guarantees to ensure revenue collection, internal controls to combat corruption and the re-duction of tax exemptions.
Important steps are being taken to promote voluntary consent to the paiment of taxes. All cus-toms clearance procedures will be progressively au-tomated to reduce the potential for revenue losses and improve services to private sector operators.
The evaluation and selection of public investment projects has become more rigorous; all new projects must undergo a cost-benefit analysis before they can be included in the public investment programme. It is planned to switch to a programme budget from 2021 onwards. Continued implementation of these reforms will improve the efficiency of public spen-ding.
Financial sector reforms are progressing and dis-cussions continue. A pre-qualification notice for the privatisation of the two state-owned banks was announced in the international financial press. The privatization tender has still not been issued be-cause the global financial uncertainty arising from COVID-19 is deemed unfavourable to such a tender. The authorities sent a confidentiality agreement to pre-qualified buyers in March 2020 allowing access to the data room.
This approach allows the process to move forward while mitigating risks in the current global environ-ment. In collaboration with BCEAO and the WAEMU Banking Commission, it would be essential to ensure
that the selected buyer is suitable and appropriate ; the liquidity situation of the banks should also be closely monitored ; and the senior management of the two public banks should keep all stakeholders informed of developments.
6.3 Financial ratings
The US financial rating agency, Standard & Poor's, gave Togo its first long and short-term sovereign cre-dit ratings in foreign and local currency on 3 June 2019. Togo is rated "B/B" with a stable outlook. In an update issued on 24 April 2020, the agency pre-dicted that Togo's real GDP growth will slow to 1% in 2020 (the rate initially adopted by the IMF, but sub-sequently revised to 3%) due to the adverse effects of the Covid-19 pandemic. According to the agency, these projections are uncertain, as they depend on the evolution of the pandemic. Moreover, according to the agency, the fact that the "large informal eco-nomy" is not included in official data also makes the economic impact particularly difficult to estimate.
Standard & Poor's projections are based on the fact that the Togolese economy is sensitive to de-mand from its main trading partners : "The port of Lomé is a transport hub between Asian economies, Togo and neighbouring landlocked countries. The importance of Togo's export sectors, mainly agri-culture (cotton, coffee and cocoa), which accounts for about two-thirds of employment, and minerals (phosphate, cement and clinker), makes the eco-nomy very vulnerable to the pandemic. However, the agency maintains its "B/B" rating and stable outlook and forecasts "a strong recovery in 2021 with fiscal consolidation that will gradually resume". Similarly, Togo's membership of the West African Economic and Monetary Union (WAEMU) is a reassuring factor.Following Standard & Poor's, the US agency Moo-dy's, in its update of 27 April 2020, maintained Togo at B3 with a stable outlook, one notch below S&P. Togo's stable B3 credit profile, according to the agency, is limited by "its undiversified and uncom-petitive economy, with very low income levels, and weak policy effectiveness and fiscal management. The high public debt, which accounts for 68.7% of GDP, limits the country's capacity to absorb shocks. Regarding growth prospects, Moody's remains more pessimistic and expects the Togolese economy to

89
stagnate in 2020. While the US agency acknowledges that the programme with "the IMF has helped to an-chor fiscal and economic policy", it is less optimistic and expresses reservations. Moody's is concerned that these recent improvements will be reversed as soon as the programme ends. Similarly, Moody's
says "fiscal management remains weak, with signifi-cant slippages under the IMF programme" and says it is closely monitoring new developments in Togo and will not hesitate to update again if there are any changes.

90
7 GOVERNMENT FINANCES
7.1 Budget
7.1.1 Expenditure and revenue
State revenues have been increasing since 2015. They rose from CFA Francs 539.54 billion in 2015 to CFA Francs 747.0 billion in 2019, an average in-crease of 38.5%. This revenue is made up of tax revenue, non-tax revenue and grants. The level of revenue mobilisation compared to 2015 is induced by the various reforms undertaken by the Togolese
Revenue Office (TRO). These reforms relate to the strengthening of the fight against fraud, corruption and smuggling, revenue collection by banks, the strengthening of risk analysis, the computerisation of services and increased efforts to raise awareness. In 2020, despite the Covid-19 crisis, revenue is ex-pected to increase to CFA Francs 818.4 billion. In perspective, revenues will continue to rise to CFA Francs 1.172.8 billion in 2024.
Figure 11. Evolution in State revenue and expenditure
Source : CP-SPRPF -IMF
Budgetary expenditure amounted to CFA Francs 783.9 billion in 2019 against CFA Francs 760.48 bil-lion in 2015, an increase of 3.1% over the period. This low level of increase is attributable to the de-cline in expenditure in 2017. Expenditure is made up of current and capital expenditure. As a percentage of GDP, budgetary expenditure represented 24.5% in 2019 against 30.8% in 2015. Public expenditure is expected to rise in 2020 to CFA Francs 943.6 billion in line with the increase in capital, social and health
expenditure devoted to the response to the Co-vid-19 pandemic. Public expenditure would repre-sent 27.4% of GDP in 2020. By 2020, public expen-diture would amount to CFA Francs 1.233.1 billion, representing 25.8% of GDP.
7.1.2 Detailed presentation of expenditure and income
Tax revenues constitute the largest share of the State's income. Between 2015 and 2019, they ac-

91
counted for an average of 75% of total revenue against 11% for non-tax revenue and 14% for grants. Tax revenues increased from CFA Francs 427.6 bil-lion in 2015 to CFA Francs 551.4 billion in 2019. Tax revenue is made up of domestic taxes (taxes) and
taxes on foreign trade (customs). Domestic taxes accounted on average for 53% of tax revenue com-pared to 47% for taxes on foreign trade. In 2020, tax revenue is expected to increase by 9.4% compared to 2019.
Source : CP-SPRPF-IMF
Table 45. Table of State financial operations (in billions of FCFA)WORDING 2014 2015 2016 2017 2018 2019 2020 2021 2022 2023 2024 Est Prévisions
Total revenue and grants (R1) 466.8 539.5 571.3 595.8 710.8 747 818.4 895.1 977.4 1 072.10
1 172 .80
Total revenue excluding grants (R2) 413.9 482.3 495.7 507.2 604.9 624.5 679.8 744.6 814 894.7 980.2 CURRENT REVENUE (R3) 413.9 482.3 495.7 507.2 604.9 624.5 679.8 744.6 814 894.7 980.2 Tax revenues 369.6 427.6 444.7 449 491.9 551.4 603 661.2 722.6 793.2 868.4 Income Tax Revenues 175 213.6 238 247.2 259.8 292.5 327.2 363.8 399.7 442.6 487.8 Customs revenue 194.6 214 206.8 201.8 232.1 258.9 275.8 297.4 322.9 350.6 380.6 Including Oil revenues 16.9 18 19.9 20.3 23 - - - - - - Non-tax revenues 44.3 54.7 50.9 58.2 113.1 73.1 76.8 83.4 91.4 101.5 111.8
1. Including dividends 13.2 16.2 11.3 27.1 31.6 - - - - - - GRANTS 52.9 57.2 75.6 88.5 105.9 122.5 138.6 150.5 163.4 177.4 192.6 Programmes 0 9.7 11.3 48.3 33.2 62.1 16.5 17.9 19.4 21.1 22.9 Projects 52.9 47.5 64.3 40.2 72.7 60.4 122.1 132.6 144 156.3 169.7
Total expenditure and net lending (D1) 621.9 760.5 823.9 603.6 733.8 783.9 943.6 951.9 1 036 .60
1 136.20
1 233 .10
TOTAL EXPENDITURE (D2) 621.5 759.1 824 603.5 733.8 783.8 943.6 951.9 1036.6 1136.2 1233.1 current expenditure (D3) 365.3 436.1 456.7 429 532.1 549 614.2 603.2 652.2 708.2 759.6 Wages and salaries 143.4 171.7 182.7 192.8 200.4 214.6 239.1 260 282.3 306.5 332.8 Procurement of goods and services 63.4 89.4 100.3 84.3 144.9 125.9 143.9 106.3 115.4 125.3 136 Transfers and grants 124.6 115.9 110.8 103.3 116.5 122.6 131.3 142.7 155 168.3 182.7 Interest on Public Debt (D4) 33.9 59.1 62.9 48.6 70.4 85.9 99.9 94.2 99.5 108.1 108.1 Interest on domestic debt 25.1 44.9 54.1 38.7 61.6 77 89.8 81.6 85.4 92.2 90.7 Interest on external debt 8.8 14.2 8.8 9.9 8.8 8.9 10.1 12.6 14.2 15.8 17.4 CAPITAL EXPENDITURES (D5) 256.2 319.6 367.3 174.5 201.7 234.8 329.4 348.7 384.4 428 473.5 Internally financed (D51) 152.9 181.1 220.8 104.4 70.8 112.3 134.9 127.4 144.1 167.1 190.3 On external financing (D52) 103.2 138.5 146.5 70 130.9 122.5 194.5 221.3 240.3 260.9 283.2 OTHER EXPENSES (miscellaneous) 0 0 0 0 0 - - - - - - LOANS LESS RECOVERIES 0.4 1.4 -0.1 0.1 0 0.1 0 0 0 0 0
Primary balance 32 -70.4 -75.8 -119 22.4 72.3 49.1 30.6 108.2 117.2 127.5 138.4
32 Revenue (excluding grants) minus expenditure (excluding interest and future investments).
Non-tax revenue consists mainly of dividends from government shareholdings in companies, adminis-trative fees and charges, domain and company re-venues, and levies for the clearance of the oil sector debt. They increased from CFA Francs 54.7 billion in 2015 to CFA Francs 113.0 billion in 2018. They are expected to decline in 2019 to CFA Francs 73.1 billion. The strong increase between 2017 and 2018 is explained in particular by the 4G licence royalties paid by TOGOCEL and MOOV for a total amount of CFA Francs 23.0 billion.
Composed of programme grants (budget support) and project grants, grants amounted to CFA Francs 122.5 billion in 2019 against CFA Francs 57.2 billion in 2015, an average increase of 21.1%. Grants are drawn by project grants in line with the dialogue with development partners under the Extended Credit Facility (ECF) programme with the IMF and efforts to stabilize the macroeconomic framework. Grants are expected to increase in 2020 to CFA Francs 138.6 billion, mainly driven by project grants (CFA Francs 122.1 billion).

92
Current expenditure represented on average 65.3% of budgetary expenditure between 2015 and 2019 compared to 34.6% for capital expenditure and 0.1% for net lending.
Current expenditure is made up of personnel expen-diture, acquisition of goods and services, current transfers, financial charges and debt. Overall, they increased from CFA Francs 436.1 billion in 2015 to CFA Francs 549.0 billion in 2019. That is to say, an increase of 25.9% driven in particular by personnel expenditure and expenditure on the purchase of goods and services.
Capital expenditure amounted to CFA Francs 234.8 billion in 2019 against CFA Francs 319.6 billion in 2015. The budgetary contribution to investment re-presented on average 52% of investments over the
period under review.
The primary balance is in deficit, going from CFA Francs 75.8 billion in 2015 to CFA FRANCS 119.0 billion in 2016 due to the importance of capital ex-penditure and the acquisition of goods and services. From 2017 onwards, the primary balance remained in surplus at 49.1 billion CFA francs in 2019 against 22.4 billion CFA francs in 2017 and 72.3 billion CFA francs in 2018.
7.1.3 General presentation of the budget
The expenditure planned in the 2020 budget is 2.4% lower than that forecast in the Amending Budget Act, Management 2019. The main sectors that re-corded budget cuts include agriculture, justice, the army and, to a lesser extent, social protection.
Source : Directorate General of the Budget and Finance * Amending Budget Act 2019
Table 46. Evolution of the State Budget by major item in value and structurefrom 2015 to 2020 (in billions FCFA)
2015 2016 2017 2018 2019* 2020
Val
ue
(CF
A
F )
Struc
ture
(%)
Val
ue
(CF
A
F)
Struc
ture
(%)
Val
ue
(F
CFA
F)
Struc
ture
(%)
Val
ue
(CF
A F
Struc
ture
(%)
Valu
e
(CF
A F)
Struc
ture
(%)
Valu
e
(CF
A F)
Struc
ture
(%)
Education
88.4
10.7
102.810.3
102.97.2
113.38.7
123.559.0
138.01
9.4
Higher
Education
35.42
8.2 36.001
2.5
Health 44.8 5.4 56 5.6 55.6 3.9 56.7 4.3 58.117 2.4 81.712 5.6
Housing
8.9 1.1 2.54 0.3 1.7 0.1 2.1 0.2 5.34 3.9 6.108 0.4
Social 2.85 0.3 3.4 0.3 3.3 0.2 3 0.2 3.22 0.4 3.172 0.2
Agricul-
ture 55.4 6.7 70.7 7.1 45.7 3.2 45.5 3.5 38.82 0.2 35.149 2.4
Energy 11.7 1.4 12.3 1.2 13.9 1.0 14.7 1.1 18.17 2.6 39.86 2.7
Interior
11.8 1.4 13.3 1.3 13.4 0.9 12.5 1.0 14.47 1.2 16.18 1.1
Justice 7.0 0.9 6.2 0.6 5.2 0.4 5.7 0.4 7.23 1.0 6.44 0.4
Army 41.4 5.0 48.64 4.9 51.8 3.6 58 4.4 99.94 0.5 66.93 4.6
Enviro-
nment 3.8 0.5 6.5 0.6 11.9 0.8 5 0.4 10.38 6.7 11.7 0.8
Total 827.2
1002.2
1433.4
1307.6
1378.68
1466.16

93
Source : Directorate General of the Budget and Finance * Amending Budget Act 2019
Table 46. Evolution of the State Budget by major item in value and structurefrom 2015 to 2020 (in billions FCFA)
2015 2016 2017 2018 2019* 2020
Val
ue
(CF
A
F )
Struc
ture
(%)
Val
ue
(CF
A
F)
Struc
ture
(%)
Val
ue
(F
CFA
F)
Struc
ture
(%)
Val
ue
(CF
A F
Struc
ture
(%)
Valu
e
(CF
A F)
Struc
ture
(%)
Valu
e
(CF
A F)
Struc
ture
(%)
Education
88.4
10.7
102.810.3
102.97.2
113.38.7
123.559.0
138.01
9.4
Higher
Education
35.42
8.2 36.001
2.5
Health 44.8 5.4 56 5.6 55.6 3.9 56.7 4.3 58.117 2.4 81.712 5.6
Housing
8.9 1.1 2.54 0.3 1.7 0.1 2.1 0.2 5.34 3.9 6.108 0.4
Social 2.85 0.3 3.4 0.3 3.3 0.2 3 0.2 3.22 0.4 3.172 0.2
Agricul-
ture 55.4 6.7 70.7 7.1 45.7 3.2 45.5 3.5 38.82 0.2 35.149 2.4
Energy 11.7 1.4 12.3 1.2 13.9 1.0 14.7 1.1 18.17 2.6 39.86 2.7
Interior
11.8 1.4 13.3 1.3 13.4 0.9 12.5 1.0 14.47 1.2 16.18 1.1
Justice 7.0 0.9 6.2 0.6 5.2 0.4 5.7 0.4 7.23 1.0 6.44 0.4
Army 41.4 5.0 48.64 4.9 51.8 3.6 58 4.4 99.94 0.5 66.93 4.6
Enviro-
nment 3.8 0.5 6.5 0.6 11.9 0.8 5 0.4 10.38 6.7 11.7 0.8
Total 827.2
1002.2
1433.4
1307.6
1378.68
1466.16
In line with the government's vision of achieving the MDGs, the budgets allocated to the health and edu-cation sectors are expected to increase by 11.6% and 40.6% respectively in 2020 compared to 2019. The same will be true of the housing and internal se-curity sectors, which will also see increases.
In addition to the above-mentioned sectors, the en-ergy sector has seen its allocation more than double. In fact, its budget rose from CFA Francs 18.11 billion in 2019 to CFA Francs 39.86 billion in 2020, an in-crease of 120.1%. The increase in the budget of the energy sector is justified by the Government's desire to bring the country to an electrification rate of 50% by 2020 and 75% by 2025 to finally reach 100% by 2030. In order to achieve this objective, it is planned to develop more than 300 mini-solar power plants,
to connect 800.000 households via individual solar kits by 2030 and to electrify 550,000 others. Experts have estimated the overall cost of the project at CFA Francs 1.000 billion, or 1.5 billion euros of invest-ment, 50% of which will come from the private sec-tor. An electrification project that is divided into three phases, including the so-called "demonstration" phase, is underway and will be completed in 2020.
7.1.4 Detailed presentation budget by item of expenditure
The 2020 finance bill balances resources and charges at the sum of CFA Francs 1 466.16 billion against CFA Francs 1 501.86 billion in 201933. The 2020 finance bill is thus down by 2.4% compared to the 2019 provisional budget.
33 Amending Finance Act, management 2019.
Source : Directorate General for Budget and Finance
Table 47. Situation of the 2020 budget compared to the 2019 budget
FORECAST
2019 COLLECTIF
2019 FORECAST
2020 Variation
2020/2019
BUDGETARY EXPENDITURES 894 969 620 935 800 941 959 092 573 2.5
Ordinary expenditure 601 268 496 611 237 095 629 735 373 3.0
Personnal 215 260 452 211 734 320 239 080 723 12.9
Goods and Services 98 777 676 161 338 717 98 571 733 -38.9
Current transfers 124 817 432 125 720 510 131 253 016 4.4
Financial expenses of thedebt
78 148 936 78 148 936 99 929 901 27.9
Interiors 66 807 302 66 807 302 89 827 057 34.5
Exteriors 11 341 634 11 341 634 10 102 844 -10.9
Expenditures in RevenueMitigation
84 264 000 84 264 000 60 900 000 -27.7
Capital in Expenditures 293 701 124 274 594 458 329 357 200 19.9
Internal Resources 95 275 167 94 144 769 123 835 116 31.5
External Resources 198 425 957 180 449 689 205 522 084 13.9
Amortisation of Public Debt 562 882 918 562 882 918 504 740 630 -10.3
Special Account Expenditures 3 180 436 3 180 436 2 323 868 -26.9
Total Budget 1 461 032 974 1 501 864 295 1 466 157 071 -2.4

94
The decrease in the 2019 budget was driven by operating expenditures (goods and services and re-venue mitigation) and expenditures related to debt amortization. On the basis of the voted budget, staff expenditure and transfers would increase in 2020 by 12.9% and 4.4% respectively compared to the 2019 budget. Capital expenditure is also expected to rise by 19.9%, due to the increase in the budge-tary contribution, but also to the increase in external financing.
7.2 Tax Policy
7.2.1 General budget revenue broken down by source
Since 2012, Togo has undertaken a series of reforms aimed at restructuring its fiscal policy and financial management. These reforms led to the operationali-sation of the Togolese Revenue Office (TRO) in 2014.
The TRO has a dual function : to collect tax resources and to ensure the country's future by creating an en-vironment conducive to the sustainability of the tax base. After four years of existence, the TRO has im-proved resource mobilization.
Reforms are continuing and focus on putting in place the fundamentals of a modern tax system geared to promoting the economy and taking social parame-ters into account. Tax policy now aims to remove the constraints faced by economic operators in the pai-ment of taxes.
Over the 2014-2019 period, gross revenue, exclu-ding grants, of the general budget increased by an average of 6.3%, driven by an increase in tax reve-nue of 6.7% and in non-tax revenue of 15.0% on average per year.
Source : Directorate General for Budget and Finance
Table 47. Situation of the 2020 budget compared to the 2019 budget
FORECAST
2019 COLLECTIF
2019 FORECAST
2020 Variation
2020/2019
BUDGETARY EXPENDITURES 894 969 620 935 800 941 959 092 573 2.5
Ordinary expenditure 601 268 496 611 237 095 629 735 373 3.0
Personnal 215 260 452 211 734 320 239 080 723 12.9
Goods and Services 98 777 676 161 338 717 98 571 733 -38.9
Current transfers 124 817 432 125 720 510 131 253 016 4.4
Financial expenses of thedebt
78 148 936 78 148 936 99 929 901 27.9
Interiors 66 807 302 66 807 302 89 827 057 34.5
Exteriors 11 341 634 11 341 634 10 102 844 -10.9
Expenditures in RevenueMitigation
84 264 000 84 264 000 60 900 000 -27.7
Capital in Expenditures 293 701 124 274 594 458 329 357 200 19.9
Internal Resources 95 275 167 94 144 769 123 835 116 31.5
External Resources 198 425 957 180 449 689 205 522 084 13.9
Amortisation of Public Debt 562 882 918 562 882 918 504 740 630 -10.3
Special Account Expenditures 3 180 436 3 180 436 2 323 868 -26.9
Total Budget 1 461 032 974 1 501 864 295 1 466 157 071 -2.4

95
Figure 12. Evolution of budget revenue by type of tax
Source : CP-SPRPF
In terms of tax revenue, value added tax (VAT) re-mains the main tax source. It is followed by import duties. Their relative shares are 39.0% and 15.3% of total revenue on average over the period under re-view. Other taxes and duties, whose contribution is not negligible, are : profit, industrial and commercial/corporate tax and the flat-rate minimum tax (PIC/
CT+FMT ; 9.4%), personal income tax (PIT ; 5.7%) and excise duties on petroleum products (EDPP ; 3.3%).
Non-tax revenues averaged 10.6% of revenues. They are derived from dividend income.
Source : CP-SPRPF
Table 48. Level and progression of revenue items from 2014 to 2019in Billion of CFA Francs
2014 2015 2016 2017 2018 2019
gross receipts excluding grants
Level 516.3 571.0 619.4 621.4 660.0 699.3
Progression 10.6 8.5 0.3 6.2 5.9
Gross TAX RECEIPTS
Level 458.2 516.3 568.5 563.2 546.9 626.2
Progression
12.7 10.1 -0.9 -2.9 14.5
BIC other/IS+IMF (Companies)
Level 37.0 42.5 52.6 59.4 73.5 87.1
Progressi
15.0 23.7 12.8 23.7 18.5
Personal income tax
Level 23.1 24.5 29.1 42.1 45.6 49.8
Progression
6.0 18.9 44.5 8.5 9.1
Value Added Tax (VAT)
Level 196.3 236.7 247.1 258.8 223.9 273.2
Progression
20.6 4.4 4.7 -13.5 22.0
Excise duty on petroleumproducts (EDPP)
Level 16.9 18 19.9 20.3 23 20.7
Progression
6.5 10.6 2.0 13.3 -10.0
Import duties
Level 83.2 101.7 98.0 86.4 87.2 103.5
Progression
22.2 -3.6 -11.9 1.0 18.7
Other Tax Revenue
Level 101.8 92.9 120.7 96.2 93.7 91.9
Progression -8.7 29.9 -20.3 -2.6 -1.9
NON-TAX REVENUES
Level 44.3 54.7 50.9 58.2 113.1 73.1
Progression
23.5 -6.9 14.3 94.3 -35.4

96
Source : CP-SPRPF
Table 48. Level and progression of revenue items from 2014 to 2019in Billion of CFA Francs
2014 2015 2016 2017 2018 2019
gross receipts excluding grants
Level 516.3 571.0 619.4 621.4 660.0 699.3
Progression 10.6 8.5 0.3 6.2 5.9
Gross TAX RECEIPTS
Level 458.2 516.3 568.5 563.2 546.9 626.2
Progression
12.7 10.1 -0.9 -2.9 14.5
BIC other/IS+IMF (Companies)
Level 37.0 42.5 52.6 59.4 73.5 87.1
Progressi
15.0 23.7 12.8 23.7 18.5
Personal income tax
Level 23.1 24.5 29.1 42.1 45.6 49.8
Progression
6.0 18.9 44.5 8.5 9.1
Value Added Tax (VAT)
Level 196.3 236.7 247.1 258.8 223.9 273.2
Progression
20.6 4.4 4.7 -13.5 22.0
Excise duty on petroleumproducts (EDPP)
Level 16.9 18 19.9 20.3 23 20.7
Progression
6.5 10.6 2.0 13.3 -10.0
Import duties
Level 83.2 101.7 98.0 86.4 87.2 103.5
Progression
22.2 -3.6 -11.9 1.0 18.7
Other Tax Revenue
Level 101.8 92.9 120.7 96.2 93.7 91.9
Progression -8.7 29.9 -20.3 -2.6 -1.9
NON-TAX REVENUES
Level 44.3 54.7 50.9 58.2 113.1 73.1
Progression
23.5 -6.9 14.3 94.3 -35.4
The rate of VAT is a single rate of 18% applicable to all activities and all products except those that are exempt. In addition to VAT, there is the tax on finan-cial activities (TAF). The TAF is based and liquidated on the gross amount of profits made on transactions relating to banking, financial activities and, in gene-ral, trade in securities and money. The rate of this tax is set at 10%.
Excise duties (EDPP) are levied on petroleum pro-ducts on entry into the national territory. The amount is included in the selling price of petroleum products at the pump. DAPP rates are as follows : CFA Francs 57.76 per litre of unleaded premium grade fuel, CFA Francs 48.06 per litre of diesel, CFA Francs 59.99 per litre of petroleum, aviation gasoline and jet fuel, CFA Francs 15 per litre for fuel oil, CFA Francs 50 per
litre of lubricating oil and CFA Francs 60 per kilogram of grease.34
In the case of the PIT, a single annual personal in-come tax known as income tax is levied on the tax-payer's overall net income. It is mainly levied on sa-laries, wages, allowances, emoluments, pensions and life annuities ; industrial, commercial and arti-sanal profits and farm profits. Tax rates are progres-sive. They range from 7% (for an overall net income between 900.001 and 4.000.000 CFA francs) to 35% for an overall net income of more than 15.000.000 CFA francs.
Natural persons liable to income tax on account of their industrial, commercial or non-commercial ac-tivities are subject, regardless of their operating re-
34 A grease is a more or less consistent pasty product used as a lubricant. Grease forms a film that reduces friction and promotes sliding.

97
sults, to paiment of the flat-rate minimum tax. The annual amount of the said tax is fixed at CFA Francs 50.000 for companies whose turnover is less than CFA Francs 5.000.000. It is capped at 500.000.000 CFA Francs for any enterprise with an annual turno-ver of more than 50.000.000 CFA Francs.
For the SI, it is established on all the profits or inco-me made by companies and other legal entities. The corporate income tax rate is set at 29.0% of taxable profit.
7.2.2 Presentation of the 2020 tax change
The Finance Management Act 2020 renewed three old measures, introduced several new measures and revised certain articles of the General Tax Code and the Book of Criminal Procedures.
The renewed measures concern the continuation under the 2020 Management Finance Act of the collection of the African Union Levy (AUL), the Pass Tax (PT), the National Solidarity Levy (NSL) and the application of the provisions of Article 5 of Act No. 2018-020 of 20 November 2019 on the Finance Act, Management 2019, relating to the special tax regime applicable to restructuring operations of companies in difficulty.
The new measures relate to :
(i) Investment promotion and improvement of the business climate. In addition to the pro-visions of Articles 3 and 19 of the National Customs Code, Article 4 of the 2019 Finance and Management Act, Article 175 of the Ge-neral Tax Code and Articles 102 and 103 of the Tax Procedure Book (TPB), the release for consumption on Togolese territory of vehicles for the transport of goods and persons bene-fits from the following customs and tax advan-tages from 1 January to 31 December 2020
• Allowance on the value for duty of : 100% for new electric or hybrid vehicles ; 90% for new vehicles ; 50% for vehicles between one (1) and two (2) years old ; 35% for vehicles between three (3) and five (5) years old.
• Exemption from the National Solidarity Levy (NSL) ;
• Exemption from value added tax (VAT) le-vied at the customs cordon ;
• Exemption from CT-PITI advance levy, cate-gory of business income received at the customs cordon.
(ii) Reduction of the tax burden of the private sec-tor through the amendment of Articles 120 443 and 115 of the General Tax Code. The provi-sions of article 120 of the General Tax Code, which set the minimum flat-rate tax at CFA Francs 600,000, have been amended. The amendment consists in reducing the floor from six hundred thousand (600 000) CFA Francs to twenty thousand (20 000) CFA Francs.This floor is henceforth applicable to all. The amendment of article 443 has made it possible to insert the measure taken by the Government to facilitate the transfer of registered buildings. This provision stipulates that for total transfers of registered immovable property, transfer du-ties and land registration duties are merged and gives rise to the levying of a fixed duty of CFA Francs 35.000. The provision linked to Article 115 of the General Tax Code provides that where the amount of the instalments paid exceeds the tax definitively due, the excess is refunded after deduction of any other taxes, duties and direct taxes which may be due by the taxpayer. Henceforth, the excess of the mi-nimum flat-rate tax can be charged later or be reimbursed.
(iii) The strengthening of control measures and the fight against tax fraud and tax evasion through the amendment of Articles 104 of the CGI and 206 of the Tax Procedure Book. Indeed, the measures establishing the obligation for com-panies to produce the documentation neces-sary for the control of their intra-group tran-sactions (transfer pricing) are reinforced. They further specify the conditions and relevant in-formation required from these companies.
(iv) Preservation of public health, in particular by increasing excise duties on tobacco from 45%

98
to 50% in 2019 and from 50% to 150% in 2020. This increase in excise duties will make it possible to influence prices and discourage the consumption of these products that are harmful to health, in accordance with the new Directive N°01/2017/CM/WAEMU.
(v) Technical adjustments and simplification of tax procedures through :
• The institution of a system of withholding tax or deduction of VAT at source in order to limit the risks of wastage with regard to the declaration and paiment of Value Added Tax (VAT). Under the conditions defined by regulation, the purchasers of goods or re-cipients of services concerned by the said
measure are obliged to make the withhol-ding tax or deduction at source of the VAT invoiced to them;
Alignment of the advance paiments of the SBT (Single Business Tax) according to the declaratory regime (Art 133 CGI & 57 TPB). According to the new provisions, the SBT gives rise to the paiment of four (04) installments each rounded down to the nearest thousand francs and equal to a quarter of the contri-butions payable by taxpayers for the last fiscal year. The installments are paid no later than January 31, May 31, July 31 and October 31 of each year to the tax collector's office. From now on, the balance of the tax is paid spontaneously when the financial sta-tements are filed.

99
8 RISK FACTORS
8.1 Political and security risks
The risks related to the electoral process are real in Togo. The lack of consensus in the management of socio-political issues. Street demonstrations gene-rated by socio-political crises have a negative im-pact on economic activity. The political risk is above all that of disruptions likely to hamper the smooth functioning of the economy and the Government in the event of a sudden rise in social protest against President Faure Gnassingbé, who has been in power since 2005. The strengthening of social dialogue and the promotion of political dialogue should help to li-mit these risks.
The security situation in the WAEMU zone is threate-ned mainly in the Sahelian countries, particularly Niger, Mali and Burkina Faso. The fact that Togo shares a border with Burkina Faso means that it is not exempt from possible terrorist attacks. In addi-tion to those threats, we must add those of mari-time piracy in the Gulf of Guinea, as a result of the political crises in neighbouring countries and the development of large-scale banditry, particularly in market areas and on the waterfront, by gangs ar-med with edged weapons. Cross-border coopera-tion between security services, raising awareness of terrorist threats, strengthening public confidence in the defence and security forces and reinforcing the regulatory framework for combating maritime piracy should help to mitigate these risks.
8.2 Social risks
The labour market is characterized by a high rate of underemployment due to an education system oriented towards low-professionalization training. Under these conditions, the much sought-after eco-nomic dynamism could come up against a skills de-ficit in certain areas. It is necessary for the State to work for the adequacy of training and employment.Moreover, very few Togolese have access to a for-mal social protection system, especially those living in rural areas and in the urban informal sector. The State must implement programmes to strengthen
social protection in order to ensure that the largest possible number of people benefit from it.
8.3 Macroeconomic risks
Togo is a country with important mining resources (limestone, phosphate, gold etc.). In West Africa, it is one of the main producers of cotton, cocoa, dairy products, mineral water and palm oil. In recent years, these products are mainly exported to its main cus-tomers, which are Burkina Faso, Benin, Ghana, Ni-ger, India, Mali, Côte d’ivoire, Nigeria, United Arab Emirates and Australia. Jihadist threats in the Sahel, Islamist attacks in Nigeria and the volatility of the prices of exported raw materials (cotton, coffee, co-coa, etc.) constitute risks for the sale of Togolese products.
In terms of product procurement, Togo's main im-ports are petroleum oils or bituminous minerals, me-dicines, ethylene polymers, motorcycles, passenger cars, cotton fabrics, coal, frozen fish and iron or steel wire rod. Its main suppliers are China, France, Ja-pan, the Netherlands, Ghana, India, Belgium, Saudi Arabia, Germany and Nigeria. Any shock to the eco-nomies of the latter countries could lead to higher prices for imported goods, a widening of the trade deficit, thus jeopardizing macroeconomic perfor-mance and, in turn, economic policy objectives.
On the other hand, Togo's risk of external vulnera-bility is considered "very low (+)" despite relatively large current account deficits (estimated at 8% of GDP in 2018), thanks to its membership of the WAE-MU, which includes an agreement under which the French Treasury guarantees the convertibility of the CFA franc into euros, thus limiting the risks of a ba-lance of paiments crisis.
The CoVID-19 pandemic also poses a significant risk to Togo mainly due to its position as a regional logistical hub, its close trade links with China and its lack of preparedness in the response. Indeed, a

100
local outbreak of the pandemic will weaken econo-mic activity on both the supply and demand side. On the supply side, activities in the service sectors, mainly those related to the airport, port and tourism, will be most affected. Lomé is the hub of a major pan-African airline ; traffic at Lomé airport is likely to decline as a result of travel bans throughout the re-gion and across continents. The port of Lomé is also an important transit point for goods to neighbouring landlocked countries ; reduced trade flows around the world will hamper port activity.
The retail industry sector will also be affected as Chi-na is the main source of Togolese imports, accoun-ting for about a quarter of total imports ; the current disruptions in China will undermine the ability of To-golese importers to supply local markets. On the de-mand side, the resulting loss of income and the un-certain business environment will affect the private sector through lower consumption and investment. More generally, COVID-19 could further disrupt eco-nomic activity through a combination of confidence effects, containment efforts, supply disruptions and behavioural changes (such as social distancing). In the health sector, according to the Global Health Security Index, Togo is ranked among the least pre-pared countries for outbreaks such as COVID-19. An outbreak will widen the budget deficit and worsen the balance of paiments.
Macroeconomic risk mitigation measures include : diversifying the base of exported raw materials ; strengthening and broadening local production and promoting the consumption of local products ; in-tensifying phytosanitary research to anticipate crop attacks ; strengthening investments to support the economy, particularly in the field of energy and transport, including air and sea transport. Under CO-VID-19, the risk mitigation measure would be to real-locate public expenditure to the health sector and to call on additional concessional external financing.
8.4 Risks relating the mobilisation of public and pri-vate financial resources
Domestic resource mobilisation is generally based on the evolution of economic activity. The latter takes place in a social, political, legal, regional and inter-national environment that significantly influences it.
The main risk for internal resource mobilisation is the low level of fiscal citizenship of most economic ope-rators and the potential for corruption within the fi-nancial authorities. This situation leads to tax evasion and fraud despite the implementation of reforms.
In addition to the risk related to fiscal incivility, there is also the risk related to the low mobilisation of door revenues in connection with the fluctuation of raw material prices, particularly the price of petroleum products.
Appropriate measures to ensure optimal mobilisa-tion of internal resources should help to mitigate these risks. These measures include broadening the tax base and combating tax evasion and avoidance through the strengthening of tax controls.
The risk associated with the banking sector in the form of contingent liabilities for the government is considered "low (+)" given the relatively modest size of the Togolese banking sector despite the recapita-lisation needs of the two public banks, Union Togo-laise de Banque and Banque Togolaise pour le Com-merce et l'Industrie.
Risks related to the mobilisation of external re-sources include the weak control of disbursement procedures by Technical and Financial Partners (TFPs), all of which leads to the late implementation of external financing; the reluctance of TFPs to im-plement the principles of the Paris Declaration on Aid Effectiveness, which is a major handicap for the proper implementation of programmed projects; and the rise in borrowing costs, which could restrict ca-pital inflows and slow growth in many emerging mar-kets and developing economies.
The government's liquidity risk stems from the large gross financing requirements - of the order of 15% of GDP (2018 estimate) - mainly related to domestic debt maturities, while external debt presents a much more limited risk. All other things being equal, the government's gross financing requirements will in-crease in 2020 and 2021 due to a peak in the repai-ment of domestic debt during these two years. To-go's membership of the WAEMU gives it access to the regional financial market which, although small compared to international markets and allowing ac-

101
cess to relatively short-term financing, is significant in relation to Togo's financing needs.
The measures to mitigate these various risks are : operationalization of the aid management platform (AMP) ; improvement of the capacity to absorb bud-getary resources ; strengthening of the framework for dialogue between the government and technical and financial partners ; establishment of a mechanism to mobilize resources from the diaspora ; and capacity building of actors on TFP disbursement procedures.On the other hand, socio-political movements can also undermine consumer and investor confidence and thus have an impact on macroeconomic perfor-mance. Electoral deadlines are also risks that could affect economic activity and, consequently, the mo-bilization of internal resources.
8.5 Health Risks
The global news in terms of health risk at the begin-ning of 2020 the COVID-19 pandemic which is ra-ging and has already caused several hundred deaths worldwide. TOGO, like several countries, has already recorded several cases of covid-19. As of May 18, 2020, 330 cases of COVID-19 have been confirmed, 106 people have been cured and 212 cases remain active. There have also been 12 deaths. To deal with the pandemic, the Togolese authorities have set up a committee and drawn up an action plan to tackle COVID-19. The plan aims mainly at reorganising the health system and containing/mitigating the spread of the virus. At this stage, the direct cost of this plan is estimated at 21 billion CFA francs (about $35 mil-lion or 0.6 percent of GDP).
Source : IMF country report April 2020
Table 49. TOGO COVID -19 Measures Estimated
costs (billionFCFA)
Monitoring 0.13
Laboratory 0.99
Entry Points 0.37
Communication 0.23
Cases Management 2.63
Infection prevention and control 0.14
Coordination 0.3
Rehabilitation of hospitals in major cities to build resilience against pandemicsand chronic diseases
16.06
Total 20.69

102
Including other costs, such as strengthening the re-silience of the health system and negative effects on economic activity, the authorities estimate the ove-rall financing needs at around CFA FRANCS 70 bil-lion (about USD 130 million or 2 percent of GDP).
Furthermore, Togo remains exposed to health threats, including epidemics (Ebola, Lassa fever, meningitis, etc.). The main measures to mitigate these epide-mics include the continuation of the fight against epidemiological diseases and border surveillance.
8.6 Environmental Risks
Togo, like several countries in the world, remains exposed to the impact of climate change with the corollary of repeated floods. Coastal erosion is also a reality in Togo. The agricultural sector, which em-ploys the vast majority of the labour force, is the
most exposed to climatic hazards (droughts, floods). Togolese agriculture is highly dependent on rainfall. The country has a low capacity to adapt to climate change and the planned adaptation programmes re-ceive very little funding. Water control therefore re-mains a matter of concern. All these risks could lead to a decline in water production.
Mitigation measures include intensifying the refo-restation of the flora; combating the indiscriminate felling of trees; modernizing the agricultural sector in order to limit the impact of climatic hazards on pro-duction (building water reservoirs, setting up modern irrigation systems); strengthening public support for sustainable production and consumption patterns; strengthening the early warning system and effective coordination of responses; and identifying and deve-loping risk areas for better management of potential natural disasters.

103
9 DEBT SITUATION
9.1 General Description of the Public Debt
Togo's outstanding public debt has followed an upward trend, rising from CFA Francs 1745.89 bil-lion in 2015 to CFA Francs 2196.64 billion in 2019, an average increase of 6.3%. It should be noted, however, that the rate of increase literally dropped in 2019 compared to 2018, thus bringing the outstan-ding debt below the community standard of 70% re-commended by WAEMU. Indeed, the debt-to-GDP
ratio stood at 68.7% in 2019 against 73.9% in 2018. The performance noted in 2019 is induced by the im-plementation of the three-year program (2017-2019) under the Extended Fund Facility with the IMF. This program aims, among other things, at significantly reducing the overall budget deficit at the beginning of the period in order to ensure debt sustainability.
Figure 13. Evolution of public debt-to-GDP stock from 2015 to 2024
Source : Ministry of Finance, IMF April 2020
In 2020, the debt ratio should be further reduced by about 4 percentage points. This is mainly due to the early repaiment of domestic loans, including through the reprofiling operation, and to GDP growth, des-pite the adverse impact of the Coronavirus epidemic on growth. The external debt ratio is projected to in-crease in 2020 from 23.7 % of GDP at the end of 2019 to 25.2 % of GDP at the end of 2020.
The projected increase in official external financing (including additional financing from the IMF) would be partly offset by a reduction in external borrowing
from commercial banks, assuming no further repro-filing operations are implemented in 2020. Since the Government borrowed externally in December 2019 to repay domestic loans in January 2020, the proceeds of the external loan would have been sa-ved as financial assets in 2019, with repaiment fi-nanced by a reduction in financial assets in 2020. Any further accumulation of financial assets would contribute to an increase in the debt ratio, relative to projections. By 2024, continued fiscal consolidation is expected to significantly reduce domestic debt and total publicly and publicly guaranteed debt.

104
9.1.1 Overall image
Source : Minister of the Economy and Finance
Table 50. Public debt and its components (in billions of CFA Francs)
2015 2016 2017 2018 2019
Total debt 70.6 79.9 72.8 73.9 68.7
(% of GDP) 1 745.89 2 092.67 2 020.26 2 191.04 2 196.64
External debttotal
527.19 564.12 550.16 600.76 750.20
Domestic Debttotal
1 218.70 1 528.55 1 470.10 1 590.28 1 446.40
nominal GDP(current price)
2 471.78 2 618.08 2 774.19 2 975.91 3 199.06
Public debt is driven more by domestic debt, which averaged 70.8% of total debt compared to 29.2% for external debt over the entire period under review. In 2019, the share of domestic debt in total debt was 65.8% against 72.6% in 2018. This decline is due to the partial early repurchase of some loans as part of the debt reprofiling operation.
External debt increased by 24.9 % in 2019 from its 2018 level. It accounted for 34.2 % of total debt in 2019 compared to 27.4 % a year earlier. This upward variation is justified by drawings for CFA Francs 182.51 billion, repaiments for CFA Francs 38.81 bil-lion and exchange rate fluctuations for about CFA Francs 6.20 billion.
Figure 14. Distribution of public debt from 2015 to 2020
Source : Minister of the Economy and Finance

105
Figure 15. Distribution of public debt by type of creditor from 2017 to 2019 (in billions of CFA Francs)
Source : Minister of the Economy and Finance
In terms of residence, the public debt contracted with residents amounted to CFA Francs 1446.44 billion in 2019 against CFA Francs 1590.28 billion in 2018. The debt contracted with non-residents was CFA Francs 750.20 billion in 2019 against CFA Francs 600.76 billion a year earlier.
9.1.2 Time profile of the debt to be repaid
In terms of time profile, the stock of public debt is do-minated by long-term debt. It accounted for 71.7% of total debt in 2019 compared with 56.7% in 2015. Medium-term debt stood at 20.9% in 2019 com-pared to 23.7% in 2015. It had been on a downward
trend in 2016 and 2017 before rising again from 2018 onwards.
Short-term debt followed a downward trend during the period under review. In 2019, it represented 7.4% of total debt compared to 19.7% in 2015.

106
Source : Minister of the Economy and Finance
2015 2016 2017 2018 2019
Short term (< 1 year) 19.7 16.5 17.0 16.1 7.4
Medium term (1 to 5
years)23.7 22.4 11.0 13.7 20.9
Long term (> 5 years) 56.7 61.1 72.0 70.2 71.7
Total 100 100 100 100 100
Table 51. Time Profile of Public Debt.
9.1.3 Amount of debt to be repaid in the short term
Short-term debt to be repaid consists mainly of do-mestic debt over the period 2015-2019. It amounted to CFA Francs 161.80 billion in 2019 against CFA Francs 352.10 billion in 2018, a decrease of 54.0%
related, among other things, to the clearance of do-mestic arrears. The breakdown of the debt to be repaid in 2019 shows that it is composed of CFA Francs 85.44 billion35 in arrears to be paid immedia-tely, CFA Francs 51.35 billion on debt securities and CFA Francs 25 billion in credit.
Table 52. Evolution of the debt to be repaid in the short term (in billions of CFA Francs)
Source : Minister of the Economy and Finance
2015 2016 2017 2018 2019
External debt 0 0 0 0 0
Domestic Debt 343.39 345.60 343.55 352.10 161.80
Debt securities 96.00 30.00 52.31 126.61 51.35
Credits - - - - 25.00
Other accounts to be paid 247.39 315.60 291.24 225.49 85.44
35 Arrears to be released immediately

107
36 A yield graph shows the yield offered for an issuer's debt securities at different maturities.
As of May 8, 2020, the one-year zero coupon rate stood at 5.38% compared to 6.25% as of December 27, 2019. After smoothing, it stood at 7.16% on May 8, 2020 compared with 7.57% on December 27, 2019. The 2-year zero coupon rate is the highest,
with a value of 11.22% on both May 8, 2020 and December 27, 2019. Overall, the zero-coupon curve has shown some stability over the two periods. The following figures show the yield curves36 at the end of December 2019 and at 8 May 2020.
Figure 16. Rate graph as of December 27, 2019
Figure 17. Rate graph as at 08 May 2020
Source : AUT
Source : AUT

108
9.2 Indebtedness Strategy and Debt Sustainability
9.2.1. Description of the strategy
Togo's debt and public debt management are go-verned by international, Community and national le-gislation.
At the international level, the Bretton Woods insti-tutions, in particular the World Bank (WB) and the International Monetary Fund (IMF), have defined gui-delines and standards for debt and public debt ma-nagement. These are mainly the "Guidelines for Pu-blic Debt Management" jointly developed by these two institutions, which constitute an international regulatory reference for public debt management.
At Community level, two regulations and two instruc-tions have been issued by the West African Econo-mic and Monetary Union (WAEMU) and the Central Bank of West African States (BCEAO) respectively. These are Regulation No. 09/2007/CM/WAEMU of 4 July 2007 on the reference framework for public debt policy and public debt management in its Member States and Regulation No. 06/2013/CM/WAEMU of 28 June 2013 on treasury bills and bonds issued by auction or syndication with the assistance of the WAMU Securities Agency. For the instructions, we note : instruction n°011-09-2015 relating to auction procedures for treasury bills and bonds and instruc-tion n°01209-2015 of September 11, 2015 relating to the registration and circulation of treasury bills and bonds issued by auction with the assistance of the WAMU Securities Agency.
At the national level, debt management is governed by the organic law n°2014-013 of 27 June 2014 rela-ting to finance laws. The same applies to the annual finance laws which authorise the Minister in charge of finance to contract internal and external loans. In addition, Decree No. 2008-067/PR of 21 July 2008 on the creation, powers and organisation of the Na-tional Public Debt Committee (NPDC) and Order No. 338/MEF/DGTCP/CAB of 2 December 2008 laying down the procedures for referring matters to the NPDC provide a framework for debt management. Decree 2011-056/PR of 4 May 2011 sets the condi-
tions for granting and managing State guarantees and endorsements.
The Togolese State will therefore reaffirm its commit-ment to the three-year programme concluded with the IMF in 2017. In line with the orientations of the said program and those of the Government aimed at mobilizing concessional resources, while contri-buting to the development of the WAEMU govern-ment securities market, the 2020-2024 debt strategy adopted aims to mobilize resources from conces-sional external creditors and issue government se-curities with a relatively long maturity on the regio-nal financial market. The government will therefore pursue the implementation of reforms with a view to preserving the gains of the programme with the IMF, improve the quality of its policies and institu-tions to benefit from the new IDA1937 (2021-2023) and ADF-1538 (2020-2023) facilities and grants from other partners.
Domestic debt will be mobilized on the regional go-vernment securities market with instruments with maturities ranging from 3 years to 5 years or more, taking into account the constraints that exist on this market. The Government will continue to mobilize financial resources from semi-concessional external creditors such as Eximbank India, the Kuwait Fund and the Saudi Fund.
This strategy does not fully reduce the refinancing risk associated with domestic debt because the substitute borrowing is from external sources. The reprofiling operation and the chosen strategy would still make it possible to extend the average maturity of the total debt and thus reduce refinancing risk. Indeed, the average maturity of the total debt portfo-lio would increase from 5.4 years in 2019 to 7 years by 2024. The average maturity of the total portfolio would be mainly influenced by the average matu-rity of external debt, which would increase from 8.3 years in 2019 to 11 years in 2024. On the other hand, the average maturity of domestic debt would be re-duced from 3.2 years in 2018 to 2.7 years in 2024 as the government continues to issue on the regional fi-nancial market government securities with short and medium-term maturities of 1 year and 3 years.
37 IDA19: Ten Years to 2030: Growth, People, Resilience38 Fifteenth Reconstitution of the ADF (ADF-15)

109
The reprofiling operation also made it possible to in-crease the proportion of external debt in relation to total debt. Indeed, the external debt in relation to the total debt would rise from 42.3% in 2019 to 51.7% by 2024. The debt maturing in one year would be between 16.3% in 2024 against 13.2% in 2019 ta-king into account the reprofiling operation whose re-paiment would start from 2024.
To extend the maturity of domestic debt, the Trea-sury will have to issue securities by auction and syn-dication with maturities ranging from 7 to 10 years. Controlling refinancing risk beyond 2020 requires the Treasury to actively manage the debt through buyback and exchange mechanisms. Buybacks will take place when the Treasury has cash surpluses. The exchange of securities will enable the Treasury to issue long-maturity securities to replace certain securities maturing in the short term and thus reduce the refinancing risk of the debt portfolio.
9.2.2 Debt Sustainability (according to the World Bank and IMF)
The Sustainability Framework was developed jointly by the World Bank and the IMF for low-income coun-tries. The framework was adopted in April 2005 and is subject to periodic review. It analyses both ex-ternal and public sector debt. A rate of 5 per cent is used to calculate the present value of external debt. To measure debt sustainability, debt indicators are compared to indicative thresholds over a projection period.
The April 2020 update of the debt sustainability ana-lysis (DSA) confirms Togo's moderate risk of external debt distress and the high risk of global debt distress - unchanged from the previous DSA published in November 2019. Although the mechanical results indicate a low risk of external debt distress, this jud-gement has been applied in view of the vulnerabi-lity of domestic debt. The external debt overhang
is therefore considered moderate. The overall risk of debt distress is assessed as high, given that the PV of the total public debt-to-GDP ratio exceeds the debt distress benchmark until 2021 in the reference scenario. This analysis highlights the need for sus-tained fiscal consolidation, better debt management and sound macroeconomic policies to reduce public debt to prudent levels over the medium term.
The debt sustainability analysis still points to a low risk of external debt distress, as none of the indi-cators cross their thresholds below the baseline or under the most extreme shock scenario. The VA of external debt is projected to reach 19.5% of GDP in 2020 and will decrease to about 12.8% of GDP in 2030, under the baseline scenario. The VA of exter-nal debt in relation to exports is projected to reach 68.6% of GDP in 2020 and decrease to 43.5% of GDP in 2030, well below its indicative threshold. Similarly, debt service indicators remain well below their threshold.
With regard to public debt, the overall risk of over-in-debtedness remains high, as the PV of total public debt remains above the indicative benchmark until 2022. In the reference scenario, overall public debt is projected to reach 67.1% of GDP in 2020, fal-ling below 70%. By 2040, continued fiscal conso-lidation (primary surplus assumed to be around 1% of GDP until 2029) coupled with favourable growth rates should significantly reduce domestic debt and guaranteed debt. In the most extreme shock sce-nario, the ratio of the VA of overall public debt to GDP would rise rapidly in 2021 and fall below the indicative reference index in 2025. In the historical scenario, this ratio would remain above the indica-tive threshold throughout the projection period. The analysis points to the need for sustainable fiscal consolidation and better debt management aimed at reducing the level of public debt to prudent levels over the medium term.

Scenario of reprofiling of the debt
VA of Foreign debt
(%)
Service VA of Foreign
debt
(%)
VA of Public debt
(%)
GDP Exports Exports Revenues GDP
Average Policy 40 180 15 18 55
2019 18.4 58.9 4.9 7.8 65.7
2020 19.5 68.6 4.8 6.9 61.4
2021 19.0 67.0 4.4 6.2 57.6
2022 18.5 65.1 5.1 7.2 54.1
2023 17.8 62.3 5.8 8.1 50.8
2024 17.0 59.0 6.3 8.9 47.6
2025 16.1 55.5 6.7 9.3 44.6
2030 12.8 43.5 4.6 5.7 30.6
2040 14.0 48.3 5.7 4.5 24.3
Source : Country report IMF, april 2020
Table 53. DSF debt threshold and benchmarks
IMF and World Bank staff are of the view that the risk of external debt distress should be kept at a mo-derate level, unchanged from the rating at the last DSA in November 2019. All external debt sustaina-bility indicators are projected to remain below their indicative thresholds throughout the projection pe-riod (2020-2040) under the baseline scenario, with the most extreme stress test. However, although these mechanical results indicate a low risk of exter-nal debt distress, the judgement took into account vulnerabilities resulting from high domestic debt leading to the assessment of a moderate risk of ex-ternal debt distress. Such vulnerabilities could arise because of the risks associated with local currency debt owed to non-residents (currently included as
domestic debt - defined on a monetary basis), pos-sible debt revaluation operations or the need to incur fiscal costs to facilitate the privatisation of the two state-owned banks.
9.3 External Debt
9.3.1. Holders
At the end of December 2019, outstanding external public debt stood at CFA Francs 750.2 billion. It re-presented 23.5% of nominal GDP and was made up of 51.6% commercial debt, 44.1% multilateral debt and 4.3% bilateral debt.
110

Figure 18. External debt by type of creditor in 2019
Source : Ministry of Economy and Finance
In 2019, commercial debt accounted for more than half of the external debt portfolio, i.e. 51.6%. It ac-counted for 12.1% of nominal GDP. Eximbank China (77.6%) is the largest creditor, followed by BANK OF TOKYO-MUFG (17.6%) and Eximbank India (4.8%).
Eximbank's financing enabled major infrastructure works to be carried out, including the construction and rehabilitation of the airport and the development of bypass roads.
Table 54. Distribution of public external debtby type of creditor in 2019
Total debt in
billions of
FCFA)
in % of total
external debt
in % of nominal
GDP
Total external debt 750.2 10.0 23.5
Commercial debt 387.28 51.6 12.1
EXIMBANK China 300.67 40.1 9.4
EXIMBANK India 18.64 2.5 0.6
Bank of Tokyo 67.97 9.1 2.1
Bilateral 32.31 4.3 1.0
FDA 0.07 0.01 0.002
Belgium 5.83 0.8 0.2
Saudi Fund 6.12 0.8 0.2
Kuwait Fund 20.29 2.7 0.6
Multilateral 330.61 44.1 10.3
ABEDA 9.81 1.3 0.3
EIB 1.47 0.2 0.0
IDB 53.36 7.1 1.7
EBID 21.39 2.9 0.7
FAD 21.87 2.9 0.7
IFAD 6.58 0.9 0.2
IMF 126.97 16.9 4.0
IDA 81.41 10.9 2.5
OPEC 7.75 1.0 0.2
Source : Ministry of Economy and Finance
111

Table 54. Distribution of public external debtby type of creditor in 2019
Total debt in
billions of
FCFA)
in % of total
external debt
in % of nominal
GDP
Total external debt 750.2 10.0 23.5
Commercial debt 387.28 51.6 12.1
EXIMBANK China 300.67 40.1 9.4
EXIMBANK India 18.64 2.5 0.6
Bank of Tokyo 67.97 9.1 2.1
Bilateral 32.31 4.3 1.0
FDA 0.07 0.01 0.002
Belgium 5.83 0.8 0.2
Saudi Fund 6.12 0.8 0.2
Kuwait Fund 20.29 2.7 0.6
Multilateral 330.61 44.1 10.3
ABEDA 9.81 1.3 0.3
EIB 1.47 0.2 0.0
IDB 53.36 7.1 1.7
EBID 21.39 2.9 0.7
FAD 21.87 2.9 0.7
IFAD 6.58 0.9 0.2
IMF 126.97 16.9 4.0
IDA 81.41 10.9 2.5
OPEC 7.75 1.0 0.2
Source : Ministry of Economy and Finance
Multilateral debt comes in second place with 44.1% of the external debt portfolio and 10.3% of GDP. In terms of proportion, IMF debt represents the largest share with 16.9%, followed by IDA (10.9%) and IDB (7.1%).
Bilateral debt has a small share of 4.3% of the exter-nal debt portfolio. It accounted for 1.0% of GDP. The main bilateral creditor with which the Togolese go-vernment has commitments is the Kuwait Fund, ac-counting for 2.7% of total external debt and 62.9% of bilateral debt.
9.3.2 External debt paiment situation
External debt service comprises principal and inte-rest plus commissions. It evolved erratically over the period under review. At the end of 2019, debt service stood at CFA Francs 47.2 billion against CFA Francs 42.3 billion one year earlier, an increase of 11.8% largely due to the principal of the debt. Indeed, the principal in 2019 recorded a 14.0% increase to CFA Francs 38.4 billion against CFA Francs 33.7 billion in 2018. Interests plus commissions recorded an increase of 3.1% to CFA Francs 8.8 billion against CFA Francs 8.5 billion a year earlier. It is important to note that the figures refer to debt service paiments actually paid, including early repaiments.
11.5
Table 55. Actual paiments of external debtservice39
by type of creditor (Billion of CFA Francs)
2015 2016 2017 2018 2019
Creditors P IC Total P IC Total P IC Total P IC Total P IC Total
official
bilaterals 9.7 0.6 10.3 9.7 0.5 10.3 9.3 1.7 11.0 3.4 0.9 4.3 9.4 0.7 10.0
Multilateralcreditors 2.1 13.6 18.0 2.1 20.2 20.6 1.8 22.5 19.2 1.7 20.8 14.6 1.9 16.6
0.5 5.0 5.5 3.8 6.2 10.0 10.4 6.4 16.8 11.1 6.0 17.1 14.4 6.2 20.6
Securities
Receivables 0.0 0.0 0.0 0.0 0.0 0.0 0.0 0.0 0.0 0.0 0.0 0.0 0.0 0.0 0.0
TOTAL 21.7 7.7 29.4 31.5 8.9 40.4 40.3 9.9 50.2 33.7 8.5 42.3 38.4 8.8 47.2
Source : Ministry of Economy and Finance
Bank Commercial
39 Exchange rate on the day of the transaction
112

11.5
Table 55. Actual paiments of external debtservice39
by type of creditor (Billion of CFA Francs)
2015 2016 2017 2018 2019
Creditors P IC Total P IC Total P IC Total P IC Total P IC Total
official
bilaterals 9.7 0.6 10.3 9.7 0.5 10.3 9.3 1.7 11.0 3.4 0.9 4.3 9.4 0.7 10.0
Multilateralcreditors 2.1 13.6 18.0 2.1 20.2 20.6 1.8 22.5 19.2 1.7 20.8 14.6 1.9 16.6
0.5 5.0 5.5 3.8 6.2 10.0 10.4 6.4 16.8 11.1 6.0 17.1 14.4 6.2 20.6
Securities
Receivables 0.0 0.0 0.0 0.0 0.0 0.0 0.0 0.0 0.0 0.0 0.0 0.0 0.0 0.0 0.0
TOTAL 21.7 7.7 29.4 31.5 8.9 40.4 40.3 9.9 50.2 33.7 8.5 42.3 38.4 8.8 47.2
Source : Ministry of Economy and Finance
Bank Commercial
In terms of projections, external debt service is expected to reach CFA Francs 54.74 billion in 2021, of which CFA Francs 40.55 billion in principal and CFA Francs 14.18 billion in interest and commissions.
113
Table 56. Annual projection40 of external debt service of Central administration by type of creditor (in billions of CFA Francs)
2021 2022 2023 2024
Official bilateral
creditors 3.77 4.58 5.60 7.22
Principal 2.85 3.61 4.43 5.94
Interest /Commission 0.92 0.97 1.17 1.28
Multilateral credits 14.57 5.10 30.23 39.82
Principal 11.01 1.23 26.12 35.77
Interest/Commission 3.56 3.87 4.11 4.05
Credit security holder n.a n.a n.a n.a
Commercial Banks 36.39 45.29 45.96 48.00
Principal 26.69 36.24 37.54 40.41
Interest /Commission 9.70 9.05 8.42 7.59
TOTAL 54.74 54.97 81.79 95.05
Total Principal 40.55 41.08 68.09 82.12
Total Interest
/Commission 14.18
13.70 13.70 12.92
Source : Ministry of Economy and Finance
By 2024, the external debt service would amount to CFA Francs 95.05 billion. It will consist of the prin-cipal up to CFA Francs 82.12 billion, i.e. a share of
86.4% and CFA Francs 12.92 billion (13.6%) in inte-rests and commissions.

9.3.3 Debt Currencies
The distribution of external debtby currency shows that the US dollar is the first currency in which this debt is denominated. Indeed, 24.9% of the exter-
nal debt is denominated in US dollars, followed by the debt denominated in yuan renminbi (22.3%) and special drawing rights (20.8%). The Euro is the four-th major currency in which external debtis denomi-nated, with a share of 18.1%.
Source : Ministry of Economy and Finance *SYGADE 6.0 ** https://fxtop.com/
Total debt
originally
denominated
in this
currency
CFA
Francs
exchange
rates as
at 31
December
2019*
Total debt
expressed in
CFA Francs
Exchange
rates in
EURO as
at 31
December
2019**
Total debt
expressed in
EURO
Debt
distribution
by
currency
CNY 2 001 897
937 83.7003 167 559 550 000 0.13
255
442 887.26 22.3
EUR 207 160 591 655.9570 135 888 440 000 1.00 207
160 591.32 18.1
IDI 58 874 334 808.6962 47 611 450 000 72 583 187.62 6.3
KWD 10 512 023 1 929.7618 20 285 700 000 2.94 30 925 350.29 2.7
SAR 39 229 375 155.9505 6 117 840 000 0.24 9 326 586.96 0.8
SDR 193 061 795 808.6962 156 128 340 000 1.24 238
016 119.96 20.8
UCF 36 539 407 808.6962 29 549 280 000 1.24 45 047 586.96 3.9
USD 319 861 269 584.8143 187 059 450 000 0.89 285
170 293.17 24.9
TOTAL - 750 200 050 000 1 143 672 603.54 100
Table 57. Outstanding foreign public debt by currency as at 31 December 2019
In total, 81.9% of the external debt is influenced by the fluctuation of currencies outside the Euro. A 30% depreciation of the dollar against the euro would lead
to a 3.8 point increase in the ratio of outstanding pu-blic debt to GDP in 2021 and 3.3 points in 202441.
41 2020-2024 Debt Strategy
114

Figure 19. Distribution of Debt by Currency in 2019 (%)
Source : Ministry of Economy and Finance
9.4 Domestic Debt
The outstanding domestic public debt has followed an upward trend, rising from CFA Francs 1.218.7 bil-lion in 2015 to CFA Francs 1.446.44 billion in 2019, i.e. an increase of 18.7%. As a percentage of no-minal GDP, the outstanding domestic debt in 2019 represented 45.2%.
9.4.1. Presentation of the situation as at December 31, 2019
Domestic debt outstanding in 2019 was down 9.0% from its level in 2018 as a result of the debt repro-
filing operation. Indeed, in 2019, an initial resche-duling operation made it possible to settle in ad-vance four (04) government debts, including three (03) contracted with BOAD and one (01) bond issue through Bank of Japan financing in the amount of 103.625.000 euros and 56.100.000 euros of IDA financing. 159.725.000, corresponding to FCFA 104.772.731.825.
115

Table 58. Details of Domestic Public Debt Stock as at December 31, 2019
Domestic debt
expressed in
value (Billion of
CFA Francs)
Domestic debt as
a % of total
domestic debt
Domestic debt expressed
as a % of nominal GDP
for the year 2018
Total domestic
debt 1 446.44
100
45.2
Government
securities 1 120.88
77.5
35.0
Treasury Bills 51.53 3.6 1.6
Treasury Bonds 1 069.52 73.9 33.4
Bank Loans 240.13 16.6 7.5
SDR allocations 0.82 0.1 0.0
BOAD
Ecobank et
IBBANK
239.31
16.5
7.5
Arrears 85.44 5.9 2.7
Source : DDPF
Outstanding domestic debt is composed of 77.5% of debt securities, notably treasury bonds (73.9%) and treasury bills (3.6%). As a percentage of GDP, debt securities accounted for 35.0%. Loans from the banking sector amounted to CFA Francs 240.13 billion in 2019, i.e. 16.6% of outstanding domes-tic debt and 7.5% of GDP. Paiment arrears fell by 62.1% from their 2018 level to CFA Francs 85.44 bil-lion. They accounted for only 5.9% of domestic debt in 2019 against 14.1% in 2018.
9.4.2 Evolution of the composition of domestic debt
Domestic debt can be divided into two broad cate-gories of debt. Arrears and so-called "conventional" debt. Domestic debt is dominated by conventional debt throughout the period under review. The latter includes debt securities, bank loans and corporate debt and restructured debt. Over the period under review, debt securities dominate conventional debt, i.e. 82.4% in 2019 against 51.4% in 2015. In nominal value, debt securities, dominated by treasury bonds, increased from CFA Francs 492.48 billion in 2015 to CFA Francs 1 120.88 billion in 2019.
116

Figure 20. Evolution of domestic public debt stock from 2015 to 2019
Source : Ministry of Economy and Finance
Bank loans are the second largest contributor to conventional debt. But unlike debt securities, bank loans have been falling steadily since 2015. They accounted for 17.6% of conventional debt in 2019 compared to 48.6% in 2015.
Arrears are estimated at CFA Francs 85.44 billion as at December 2019 against CFA Francs 198.13 billion in 2015. These are arrears of commercial debt, social
debt and commitments and risks.
9.4.3 Domestic debt paiments situation
The paiment of the domestic debt for 2019 amounted to CFA Francs 470.4 billion, up 18.5% compared to 2018. The principal of the debt was CFA Francs 393.4 billion representing 83.6% of debt service against 16.4% for interest.
Table 59. Paiments for servicing the domestic public debt of the central government by type of instrument (in billions of CFA Francs)
Wordings 2016 2017 2018 2019
P IC Total P IC Total P IC Total P IC Total
Loans 39.98263.36 303.33 461.09 41.48 502.56 16.38 9.72 26.1 74.3 9.6 83.9
Debt securities
191.67 21.18 212.85 248.87 24.46 273.33 252.93 52.1 305.02 284.6 67.4 352.1
Other
accounts to be
paid
53.39 0 53.39 24.37 0 24.37 65.74 0 65.74 34.5 0 34.5
TOTAL 508.42 61.16 569.57 734.33 65.94 800.26 335.05 61.82 396.86 393.4 77.1 470.4
Source : Ministry of Economy and Finance
117

Debt instruments, notably Treasury bonds and trea-sury bills, account for the bulk of debt servicing. In fact, these securities accounted for 74.8% of total debt service in 2019 compared with 17.4% and 7.3% respectively for loans and other accounts payable.
9.5 Viability and Sustainability
Togo's fiscal balance deteriorated after 2010 when it emerged in surplus at 1.0% of GDP. From 2012 to 2016, the deficit remained above the EU norm
of 3.0% set by the Convergence Pact. In 2016, the deficit reached 9.5% of GDP. In 2017, it improved to 0.3% of GDP below the EU norm. It deteriorated slightly from 0.8% of GDP in 2018 to 1.2% of GDP in 2019, still below the EU norm of 3%.
At the same time, the years of deficit deterioration were also marked by a rapid increase in the debt ratio, which stood at 80.0% in 2016. From 2017 onwards, the debt ratio declined to 68.7% in 2019, below the WAEMU community norm of 70%.
Figure 21. Evolution of the budget deficit and debt stock as a percentage of GDP
Source : CP-SPRPF, Ministry of Economy and Finance
118
The comparative analysis of Togo's public debt with that of its WAEMU peers highlights Togo as the most indebted country after Guinea Bissau.

Figure 22. Situation of Public debt-to-GDP ratio in the WAEMU in 2019
Source : IMF April 2020
119

120
10 APPENDICES
Figure 23. Detailed country emissions from 2017 to 2019
Figure 24. Value of Securities outstanding at December 31, 2019
Source : AUT
Source : AUT

121
Source : Agence UMOA-Titres
Table 61. Details of securities outstanding at the end of December 2019
ISSUER INSTRUMENT TRANSACTIONDATE
VALUEDATE DEADLINE MATURITY DEFERRED
(YEAR)
AMOUNT (MILLIONSOF CFAfrancs)
AMOUNTSUBMITTED (MILLIONSOF CFAfrancs)
MOUNTWITHHELD(MILLIONSOF CFAfrancs)
ISIN
Togo OAT 08/05/2020 11/05/2020 13/03/2023 36 -- 35 000,00 22 383,40 22 383,40 TG0000001346
Togo OAT 08/05/2020 11/05/2020 02/03/2025 60 -- 35 000,00 22 349,00 16 116,60 TG0000001338
Togo BAT 17/04/2020 20/04/2020 18/04/2021 12 -- 20 000,00 29 003,00 22 000,00 TG0000001361
Togo OAT 13/03/2020 16/03/2020 16/03/2023 36 -- 50 000,00 48 080,30 31 610,30 TG0000001346
Togo OAT 13/03/2020 16/03/2020 02/03/2025 60 -- 50 000,00 11 819,72 10 819,72 TG0000001338
Togo OAT 13/03/2020 16/03/2020 16/03/2027 84 -- 50 000,00 15 866,91 12 528,45 TG0000001353
Togo OAT 28/02/2020 02/03/2020 02/03/2025 60 -- 25 000,00 56 185,61 27 500,00 TG0000001338
Togo OAT 14/02/2020 17/02/2020 03/02/2023 36 -- 25 000,00 52 838,00 27 500,00 TG0000001320
Togo OAT 31/01/2020 03/02/2020 03/02/2023 36 -- 25 000,00 74 052,50 27 500,00 TG0000001320
Togo BAT 17/01/2020 20/01/2020 17/01/2021 364 -- 25 000,00 69 134,00 27 500,00 TG0000001312
Togo OAT 04/10/2019 07/10/2019 07/09/2022 36 -- 20 000,00 47 340,88 22 000,00 TG0000001296
Togo OAT 06/09/2019 09/09/2019 09/09/2024 60 -- 20 000,00 48 465,59 22 000,00 TG0000001288
Togo OAT 09/08/2019 13/08/2019 15/07/2022 36 -- 20 000,00 29 557,29 22 000,00 TG0000001270
Togo OAT 26/07/2019 29/07/2019 11/03/2024 60 -- 20 000,00 37 525,45 22 000,00 TG0000001197
Togo OAT 12/07/2019 15/07/2019 15/07/2022 36 -- 20 000,00 43 060,35 22 000,00 TG0000001270
Togo OAT 28/06/2019 01/07/2019 03/06/2022 36 -- 20 000,00 40 205,30 22 000,00 TG0000001254
Togo BAT 14/06/2019 17/06/2019 14/06/2020 12 -- 20 000,00 21 354,00 15 729,00 TG0000001262
Togo OAT 31/05/2019 03/06/2019 03/06/2022 36 -- 15 000,00 41 788,81 16 500,00 TG0000001254
Togo OAT 17/05/2019 20/05/2019 11/03/2024 60 -- 20 000,00 62 070,29 22 000,00 TG0000001197
Togo BAT 19/04/2019 23/04/2019 20/04/2020 12 -- 20 000,00 77 135,00 22 000,00 TG0000001247
Togo OAT 05/04/2019 08/04/2019 11/03/2022 36 -- 20 000,00 77 238,84 22 000,00 TG0000001205
Togo OAT 08/03/2019 11/03/2019 11/03/2022 36 -- 20 000,00 19 780,21 16 587,71 TG0000001205
Togo OAT 08/03/2019 11/03/2019 11/03/2024 60 -- 20 000,00 5 814,65 5 412,29 TG0000001197
Togo OAT 22/02/2019 25/02/2019 23/04/2021 24 -- 15 000,00 35 678,71 13 000,00 TG0000001064
Togo OAT 08/02/2019 11/02/2019 11/02/2022 36 -- 20 000,00 27 846,75 20 000,00 TG0000001189
Togo OAT 25/01/2019 28/01/2019 28/01/2022 36 -- 20 000,00 36 093,77 22 000,00 TG0000001171
Togo BAT 10/01/2019 11/01/2019 09/01/2020 12 -- 20 000,00 18 625,00 13 625,00 TG0000001163
Togo OAT 26/10/2018 29/10/2018 20/09/2020 36 -- 50 000,00 23 259,30 21 030,00 TG0000000900
Togo OAT 26/10/2018 29/10/2018 20/09/2022 60 -- 50 000,00 4 047,59 4 047,59 TG0000000918
Togo BAT 12/10/2018 15/10/2018 13/10/2019 12 -- 25 000,00 25 534,00 24 134,00 TG0000001155
Togo BAT 28/09/2018 01/10/2018 29/09/2019 12 -- 20 000,00 16 925,00 16 925,00 TG0000001148
Togo OAT 31/08/2018 03/09/2018 03/09/2021 36 -- 20 000,00 29 318,00 21 218,00 TG0000001122
Togo OAT 17/08/2018 20/08/2018 21/04/2020 51 -- 20 000,00 17 096,70 14 452,00 TG0000000785
Togo OAT 20/07/2018 23/07/2018 23/07/2021 36 -- 50 000,00 51 040,72 48 550,00 TG0000001114
Togo OAT 20/07/2018 23/07/2018 23/07/2023 60 -- 50 000,00 6 450,00 6 450,00 TG0000001106
Togo BAT 22/06/2018 25/06/2018 23/06/2019 12 -- 20 000,00 22 536,00 21 536,00 TG0000001098
Togo OAT 08/06/2018 06/11/2018 06/11/2021 36 -- 20 000,00 14 565,60 14 565,60 TG0000001080
Togo BAT 04/05/2018 07/05/2018 05/05/2019 12 -- 20 000,00 24 737,00 22 000,00 TG0000001072
Togo OAT 20/04/2018 23/04/2018 23/04/2021 36 -- 15 000,00 17 215,25 15 715,25 TG0000001064
Togo OAT 30/03/2018 03/04/2018 03/04/2023 60 -- 20 000,00 21 718,18 21 604,50 TG0000001049
Togo BAT 16/03/2018 19/03/2018 17/03/2019 12 -- 20 000,00 17 820,00 17 820,00 TG0000001031
Togo BAT 16/02/2018 19/02/2018 17/02/2019 12 -- 20 000,00 19 063,00 19 063,00 TG0000001023
Togo OAT 26/01/2018 29/01/2018 29/01/2021 36 -- 15 000,00 16 092,94 16 040,01 TG0000001015
Togo BAT 12/01/2018 15/01/2018 13/01/2019 12 -- 15 000,00 5,13 5,13 TG0000001007
Togo OAT 29/11/2017 30/11/2017 15/11/2020 36 -- 15 000,00 12 221,00 12 221,00 TG0000000967
Togo BAT 29/11/2017 30/11/2017 28/11/2018 12 -- 15 000,00 3 150,00 2 925,00 --
Togo BAT 20/11/2017 21/11/2017 29/05/2018 6 -- 15 000,00 7 000,00 7 000,00 TG0000000835
Togo OAT 20/11/2017 21/11/2017 15/11/2020 36 -- 15 000,00 6 845,00 6 845,00 --
Togo BAT 14/11/2017 15/11/2017 13/02/2018 3 -- 25 000,00 21 532,00 18 418,00 --
Togo OAT 09/11/2017 15/11/2017 15/11/2020 36 -- 25 000,00 10 757,59 9 081,59 --
Togo BAT 03/11/2017 06/11/2017 10/10/2018 12 -- 25 000,00 1 000,00 1 000,00 TG0000000942
Togo OAT 03/11/2017 06/11/2017 06/11/2020 36 -- 25 000,00 10 571,43 10 571,43 --
Togo BAT 11/10/2017 12/10/2017 10/10/2018 12 -- 25 000,00 14 262,00 13 402,00 TG0000000942
Togo OAT 19/09/2017 20/09/2017 20/09/2024 84 -- 30 000,00 2 421,50 2 421,50 --
Togo OAT 19/09/2017 20/09/2017 20/09/2022 60 -- 30 000,00 9 000,00 9 000,00 --
Togo OAT 14/09/2017 20/09/2017 20/09/2020 36 -- 30 000,00 4 925,00 4 924,00 --
Togo OAT 08/08/2017 09/08/2017 09/08/2024 84 -- 166 000,00 182 051,15 181 051,15 TG0000000892
Togo BAT 17/07/2017 18/07/2017 16/10/2017 3 -- 25 000,00 37 820,00 27 500,00 TG0000000884
Togo OAT 04/07/2017 05/07/2017 05/07/2022 60 -- 30 000,00 9 656,01 8 656,01 --
Togo BAT 30/05/2017 31/05/2017 29/05/2018 12 -- 60 000,00 9 565,00 9 565,00 TG0000000835
Togo BAT 22/05/2017 23/05/2017 20/11/2017 6 -- 25 000,00 18 000,00 18 000,00 TG0000000827
Togo OAT 20/04/2017 21/04/2017 21/04/2020 36 -- 20 000,00 7 466,00 7 466,00 TG0000000785
Togo OAT 08/02/2017 09/02/2017 09/02/2020 36 -- 25 000,00 12 255,50 10 055,50 TG0000000777
Togo BAT 05/01/2017 06/01/2017 06/07/2017 6 -- 20 000,00 24 914,00 22 000,00 TG0000000769
Togo OAT 15/12/2016 05/02/2016 05/02/2021 60 -- 30 000,00 34 547,00 33 000,00 TG0000000660
Togo OAT 20/10/2016 21/10/2016 15/07/2023 84 -- 30 000,00 37 012,20 33 000,00 TG0000000728
Togo BAT 29/09/2016 30/09/2016 27/09/2018 24 -- 35 000,00 35 375,00 35 000,00 TG0000000736
Togo OAT 14/07/2016 15/07/2016 15/07/2023 84 -- 30 000,00 65 612,00 33 000,00 TG0000000728
Togo BAT 25/05/2016 26/05/2016 23/05/2018 24 -- 20 000,00 30 020,00 22 000,00 TG0000000710
Togo OAT 25/04/2016 26/04/2016 26/04/2019 36 -- 30 000,00 27 695,00 27 695,00 TG0000000702
Togo BAT 30/03/2016 31/03/2016 28/03/2018 24 -- 35 000,00 39 076,00 38 500,00 TG0000000694
Togo BAT 16/03/2016 17/03/2016 14/09/2016 6 -- 25 000,00 23 131,00 20 131,00 TG0000000686
Togo OAT 04/02/2016 05/02/2016 05/02/2021 60 -- 30 000,00 91 534,60 33 000,00 TG0000000660
Togo BAT 13/01/2016 14/01/2016 11/01/2017 12 -- 30 000,00 30 086,00 30 000,00 TG0000000611
Togo BAT 03/12/2015 04/12/2015 30/11/2017 24 -- 30 000,00 30 500,00 30 000,00 --
Togo OAT 19/11/2015 20/11/2015 20/11/2020 60 -- 30 000,00 80 864,62 30 000,00 TG0000000595
Togo BAT 08/10/2015 09/10/2015 06/10/2016 12 -- 30 000,00 42 745,00 33 000,00 TG0000000587
Togo BAT 23/07/2015 24/07/2015 20/07/2017 24 -- 30 000,00 43 650,00 33 000,00 TG0000000579
Togo OAT 09/07/2015 10/07/2015 10/07/2020 60 -- 30 000,00 115 703,24 33 000,00 TG0000000561
Togo BAT 08/04/2015 09/04/2015 06/04/2016 12 -- 30 000,00 57 711,00 33 000,00 TG0000000553
Togo OAT 03/03/2015 04/03/2015 04/03/2020 60 -- 30 000,00 47 712,00 30 000,00 --
Togo BAT 11/02/2015 12/02/2015 10/02/2016 12 -- 30 000,00 34 600,00 30 000,00 --
Togo OAT 29/01/2015 30/01/2015 30/01/2018 36 -- 30 000,00 31 983,00 30 000,00 --
Togo BAT 14/01/2015 15/01/2015 15/07/2015 6 -- 30 000,00 40 785,00 33 000,00 --

122
Source : Agence UMOA-Titres
Table 61. Details of securities outstanding at the end of December 2019
ISSUER INSTRUMENT TRANSACTIONDATE
VALUEDATE DEADLINE MATURITY DEFERRED
(YEAR)
AMOUNT (MILLIONSOF CFAfrancs)
AMOUNTSUBMITTED (MILLIONSOF CFAfrancs)
MOUNTWITHHELD(MILLIONSOF CFAfrancs)
ISIN
Togo OAT 08/05/2020 11/05/2020 13/03/2023 36 -- 35 000,00 22 383,40 22 383,40 TG0000001346
Togo OAT 08/05/2020 11/05/2020 02/03/2025 60 -- 35 000,00 22 349,00 16 116,60 TG0000001338
Togo BAT 17/04/2020 20/04/2020 18/04/2021 12 -- 20 000,00 29 003,00 22 000,00 TG0000001361
Togo OAT 13/03/2020 16/03/2020 16/03/2023 36 -- 50 000,00 48 080,30 31 610,30 TG0000001346
Togo OAT 13/03/2020 16/03/2020 02/03/2025 60 -- 50 000,00 11 819,72 10 819,72 TG0000001338
Togo OAT 13/03/2020 16/03/2020 16/03/2027 84 -- 50 000,00 15 866,91 12 528,45 TG0000001353
Togo OAT 28/02/2020 02/03/2020 02/03/2025 60 -- 25 000,00 56 185,61 27 500,00 TG0000001338
Togo OAT 14/02/2020 17/02/2020 03/02/2023 36 -- 25 000,00 52 838,00 27 500,00 TG0000001320
Togo OAT 31/01/2020 03/02/2020 03/02/2023 36 -- 25 000,00 74 052,50 27 500,00 TG0000001320
Togo BAT 17/01/2020 20/01/2020 17/01/2021 364 -- 25 000,00 69 134,00 27 500,00 TG0000001312
Togo OAT 04/10/2019 07/10/2019 07/09/2022 36 -- 20 000,00 47 340,88 22 000,00 TG0000001296
Togo OAT 06/09/2019 09/09/2019 09/09/2024 60 -- 20 000,00 48 465,59 22 000,00 TG0000001288
Togo OAT 09/08/2019 13/08/2019 15/07/2022 36 -- 20 000,00 29 557,29 22 000,00 TG0000001270
Togo OAT 26/07/2019 29/07/2019 11/03/2024 60 -- 20 000,00 37 525,45 22 000,00 TG0000001197
Togo OAT 12/07/2019 15/07/2019 15/07/2022 36 -- 20 000,00 43 060,35 22 000,00 TG0000001270
Togo OAT 28/06/2019 01/07/2019 03/06/2022 36 -- 20 000,00 40 205,30 22 000,00 TG0000001254
Togo BAT 14/06/2019 17/06/2019 14/06/2020 12 -- 20 000,00 21 354,00 15 729,00 TG0000001262
Togo OAT 31/05/2019 03/06/2019 03/06/2022 36 -- 15 000,00 41 788,81 16 500,00 TG0000001254
Togo OAT 17/05/2019 20/05/2019 11/03/2024 60 -- 20 000,00 62 070,29 22 000,00 TG0000001197
Togo BAT 19/04/2019 23/04/2019 20/04/2020 12 -- 20 000,00 77 135,00 22 000,00 TG0000001247
Togo OAT 05/04/2019 08/04/2019 11/03/2022 36 -- 20 000,00 77 238,84 22 000,00 TG0000001205
Togo OAT 08/03/2019 11/03/2019 11/03/2022 36 -- 20 000,00 19 780,21 16 587,71 TG0000001205
Togo OAT 08/03/2019 11/03/2019 11/03/2024 60 -- 20 000,00 5 814,65 5 412,29 TG0000001197
Togo OAT 22/02/2019 25/02/2019 23/04/2021 24 -- 15 000,00 35 678,71 13 000,00 TG0000001064
Togo OAT 08/02/2019 11/02/2019 11/02/2022 36 -- 20 000,00 27 846,75 20 000,00 TG0000001189
Togo OAT 25/01/2019 28/01/2019 28/01/2022 36 -- 20 000,00 36 093,77 22 000,00 TG0000001171
Togo BAT 10/01/2019 11/01/2019 09/01/2020 12 -- 20 000,00 18 625,00 13 625,00 TG0000001163
Togo OAT 26/10/2018 29/10/2018 20/09/2020 36 -- 50 000,00 23 259,30 21 030,00 TG0000000900
Togo OAT 26/10/2018 29/10/2018 20/09/2022 60 -- 50 000,00 4 047,59 4 047,59 TG0000000918
Togo BAT 12/10/2018 15/10/2018 13/10/2019 12 -- 25 000,00 25 534,00 24 134,00 TG0000001155
Togo BAT 28/09/2018 01/10/2018 29/09/2019 12 -- 20 000,00 16 925,00 16 925,00 TG0000001148
Togo OAT 31/08/2018 03/09/2018 03/09/2021 36 -- 20 000,00 29 318,00 21 218,00 TG0000001122
Togo OAT 17/08/2018 20/08/2018 21/04/2020 51 -- 20 000,00 17 096,70 14 452,00 TG0000000785
Togo OAT 20/07/2018 23/07/2018 23/07/2021 36 -- 50 000,00 51 040,72 48 550,00 TG0000001114
Togo OAT 20/07/2018 23/07/2018 23/07/2023 60 -- 50 000,00 6 450,00 6 450,00 TG0000001106
Togo BAT 22/06/2018 25/06/2018 23/06/2019 12 -- 20 000,00 22 536,00 21 536,00 TG0000001098
Togo OAT 08/06/2018 06/11/2018 06/11/2021 36 -- 20 000,00 14 565,60 14 565,60 TG0000001080
Togo BAT 04/05/2018 07/05/2018 05/05/2019 12 -- 20 000,00 24 737,00 22 000,00 TG0000001072
Togo OAT 20/04/2018 23/04/2018 23/04/2021 36 -- 15 000,00 17 215,25 15 715,25 TG0000001064
Togo OAT 30/03/2018 03/04/2018 03/04/2023 60 -- 20 000,00 21 718,18 21 604,50 TG0000001049
Togo BAT 16/03/2018 19/03/2018 17/03/2019 12 -- 20 000,00 17 820,00 17 820,00 TG0000001031
Togo BAT 16/02/2018 19/02/2018 17/02/2019 12 -- 20 000,00 19 063,00 19 063,00 TG0000001023
Togo OAT 26/01/2018 29/01/2018 29/01/2021 36 -- 15 000,00 16 092,94 16 040,01 TG0000001015
Togo BAT 12/01/2018 15/01/2018 13/01/2019 12 -- 15 000,00 5,13 5,13 TG0000001007
Togo OAT 29/11/2017 30/11/2017 15/11/2020 36 -- 15 000,00 12 221,00 12 221,00 TG0000000967
Togo BAT 29/11/2017 30/11/2017 28/11/2018 12 -- 15 000,00 3 150,00 2 925,00 --
Togo BAT 20/11/2017 21/11/2017 29/05/2018 6 -- 15 000,00 7 000,00 7 000,00 TG0000000835
Togo OAT 20/11/2017 21/11/2017 15/11/2020 36 -- 15 000,00 6 845,00 6 845,00 --
Togo BAT 14/11/2017 15/11/2017 13/02/2018 3 -- 25 000,00 21 532,00 18 418,00 --
Togo OAT 09/11/2017 15/11/2017 15/11/2020 36 -- 25 000,00 10 757,59 9 081,59 --
Togo BAT 03/11/2017 06/11/2017 10/10/2018 12 -- 25 000,00 1 000,00 1 000,00 TG0000000942
Togo OAT 03/11/2017 06/11/2017 06/11/2020 36 -- 25 000,00 10 571,43 10 571,43 --
Togo BAT 11/10/2017 12/10/2017 10/10/2018 12 -- 25 000,00 14 262,00 13 402,00 TG0000000942
Togo OAT 19/09/2017 20/09/2017 20/09/2024 84 -- 30 000,00 2 421,50 2 421,50 --
Togo OAT 19/09/2017 20/09/2017 20/09/2022 60 -- 30 000,00 9 000,00 9 000,00 --
Togo OAT 14/09/2017 20/09/2017 20/09/2020 36 -- 30 000,00 4 925,00 4 924,00 --
Togo OAT 08/08/2017 09/08/2017 09/08/2024 84 -- 166 000,00 182 051,15 181 051,15 TG0000000892
Togo BAT 17/07/2017 18/07/2017 16/10/2017 3 -- 25 000,00 37 820,00 27 500,00 TG0000000884
Togo OAT 04/07/2017 05/07/2017 05/07/2022 60 -- 30 000,00 9 656,01 8 656,01 --
Togo BAT 30/05/2017 31/05/2017 29/05/2018 12 -- 60 000,00 9 565,00 9 565,00 TG0000000835
Togo BAT 22/05/2017 23/05/2017 20/11/2017 6 -- 25 000,00 18 000,00 18 000,00 TG0000000827
Togo OAT 20/04/2017 21/04/2017 21/04/2020 36 -- 20 000,00 7 466,00 7 466,00 TG0000000785
Togo OAT 08/02/2017 09/02/2017 09/02/2020 36 -- 25 000,00 12 255,50 10 055,50 TG0000000777
Togo BAT 05/01/2017 06/01/2017 06/07/2017 6 -- 20 000,00 24 914,00 22 000,00 TG0000000769
Togo OAT 15/12/2016 05/02/2016 05/02/2021 60 -- 30 000,00 34 547,00 33 000,00 TG0000000660
Togo OAT 20/10/2016 21/10/2016 15/07/2023 84 -- 30 000,00 37 012,20 33 000,00 TG0000000728
Togo BAT 29/09/2016 30/09/2016 27/09/2018 24 -- 35 000,00 35 375,00 35 000,00 TG0000000736
Togo OAT 14/07/2016 15/07/2016 15/07/2023 84 -- 30 000,00 65 612,00 33 000,00 TG0000000728
Togo BAT 25/05/2016 26/05/2016 23/05/2018 24 -- 20 000,00 30 020,00 22 000,00 TG0000000710
Togo OAT 25/04/2016 26/04/2016 26/04/2019 36 -- 30 000,00 27 695,00 27 695,00 TG0000000702
Togo BAT 30/03/2016 31/03/2016 28/03/2018 24 -- 35 000,00 39 076,00 38 500,00 TG0000000694
Togo BAT 16/03/2016 17/03/2016 14/09/2016 6 -- 25 000,00 23 131,00 20 131,00 TG0000000686
Togo OAT 04/02/2016 05/02/2016 05/02/2021 60 -- 30 000,00 91 534,60 33 000,00 TG0000000660
Togo BAT 13/01/2016 14/01/2016 11/01/2017 12 -- 30 000,00 30 086,00 30 000,00 TG0000000611
Togo BAT 03/12/2015 04/12/2015 30/11/2017 24 -- 30 000,00 30 500,00 30 000,00 --
Togo OAT 19/11/2015 20/11/2015 20/11/2020 60 -- 30 000,00 80 864,62 30 000,00 TG0000000595
Togo BAT 08/10/2015 09/10/2015 06/10/2016 12 -- 30 000,00 42 745,00 33 000,00 TG0000000587
Togo BAT 23/07/2015 24/07/2015 20/07/2017 24 -- 30 000,00 43 650,00 33 000,00 TG0000000579
Togo OAT 09/07/2015 10/07/2015 10/07/2020 60 -- 30 000,00 115 703,24 33 000,00 TG0000000561
Togo BAT 08/04/2015 09/04/2015 06/04/2016 12 -- 30 000,00 57 711,00 33 000,00 TG0000000553
Togo OAT 03/03/2015 04/03/2015 04/03/2020 60 -- 30 000,00 47 712,00 30 000,00 --
Togo BAT 11/02/2015 12/02/2015 10/02/2016 12 -- 30 000,00 34 600,00 30 000,00 --
Togo OAT 29/01/2015 30/01/2015 30/01/2018 36 -- 30 000,00 31 983,00 30 000,00 --
Togo BAT 14/01/2015 15/01/2015 15/07/2015 6 -- 30 000,00 40 785,00 33 000,00 --
Source : Agence UMOA-Titres
Source : Agence UMOA-Titres
WORDING Identify Outstanding (inbillions of CFA Francs)
BJ – 6.5% - 7 years - 10.october.21 BJ0000000535 23
BJ – 6.5% - 7 years - 19.March.22 BJ0000000576 46
BJ – 6.25% - 5 years - 31.july.20 BJ0000000618 28
BJ – 6.5% - 7 years -
03.december.22 BJ0000000626 99
BJ – 6.25% - 5 years -
18.december.20 BJ0000000634 28
BJ – 6.1% - 7 years - 29.june.23 BJ0000000683 150
BJ – 5.5% - 5 years -
05.september.21 BJ0000000709 30
BJ - 6% - 5 years - 14.october.21 BJ0000000717 69
BJ - 6% - 3 years - 11.may.20 BJ0000000790 31
BJ – 6.15% - 5 years - 26.july.22 BJ0000000824 65
BJ - 6% - 3 years - 10.august.20 BJ0000000832 16
BJ - 6% - 3 years - 31. august.20 BJ0000000840 2
BJ – 6.3% - 7 years - 31. august.24 BJ0000000857 13
BJ – 6.15% - 5 years - 31.
august.22 BJ0000000865 13
BJ - 6% - 3 years -
22.september.20 BJ0000000881 16
BJ – 6.15% - 5 years -
22.september.22 BJ0000000899 5
BJ – 6.3% - 7 years -
22.september.24 BJ0000000907 8
BJ – 6.5% - 10 years -
22.september.27 BJ0000000915 4
BJ - 6% - 3 years - 08.december.20 BJ0000000972 19
BJ - 6% - 3 years - 02.february.21 BJ0000000998 12
BJ - 6% - 3 years - 16.march.21 BJ0000001004 18
BJ – 6.15% - 5 years - 16.march.23 BJ0000001012 10
BJ - 6% - 3 years - 27.april.21 BJ0000001046 22
BJ – 6.15% - 5 years - 27.april.23 BJ0000001053 4
BJ - 6% - 3 years - 09.july.21 BJ0000001095 36
BJ – 6.3% - 5 years -
07.september.23 BJ0000001145 18
BJ – 6.1% - 3 years -
07.september.21 BJ0000001152 35
BJ – 6.1% - 3 years -
19.september.21 BJ0000001160 30
BJ – 6.1% - 3 years -
30.november.21 BJ0000001178 17
BJ -BT - 12 month - 09.january.20 BJ0000001186 22
BJ – 6.1% - 3 years -
25.january.22 BJ0000001194 44
BJ – 6.3% - 5 years - 08.march.24 BJ0000001210 13
BJ – 6.3% - 5 years - 19.april.24 BJ0000001228 18
BJ – 6.4% - 7 years - 19.april.26 BJ0000001236 15
Table 61. Details of securities outstanding at the end of December 2019

123
Source : Agence UMOA-Titres
WORDING Identify Outstanding (inbillions of CFA Francs)
BJ – 6.5% - 7 years - 10.october.21 BJ0000000535 23
BJ – 6.5% - 7 years - 19.March.22 BJ0000000576 46
BJ – 6.25% - 5 years - 31.july.20 BJ0000000618 28
BJ – 6.5% - 7 years -
03.december.22 BJ0000000626 99
BJ – 6.25% - 5 years -
18.december.20 BJ0000000634 28
BJ – 6.1% - 7 years - 29.june.23 BJ0000000683 150
BJ – 5.5% - 5 years -
05.september.21 BJ0000000709 30
BJ - 6% - 5 years - 14.october.21 BJ0000000717 69
BJ - 6% - 3 years - 11.may.20 BJ0000000790 31
BJ – 6.15% - 5 years - 26.july.22 BJ0000000824 65
BJ - 6% - 3 years - 10.august.20 BJ0000000832 16
BJ - 6% - 3 years - 31. august.20 BJ0000000840 2
BJ – 6.3% - 7 years - 31. august.24 BJ0000000857 13
BJ – 6.15% - 5 years - 31.
august.22 BJ0000000865 13
BJ - 6% - 3 years -
22.september.20 BJ0000000881 16
BJ – 6.15% - 5 years -
22.september.22 BJ0000000899 5
BJ – 6.3% - 7 years -
22.september.24 BJ0000000907 8
BJ – 6.5% - 10 years -
22.september.27 BJ0000000915 4
BJ - 6% - 3 years - 08.december.20 BJ0000000972 19
BJ - 6% - 3 years - 02.february.21 BJ0000000998 12
BJ - 6% - 3 years - 16.march.21 BJ0000001004 18
BJ – 6.15% - 5 years - 16.march.23 BJ0000001012 10
BJ - 6% - 3 years - 27.april.21 BJ0000001046 22
BJ – 6.15% - 5 years - 27.april.23 BJ0000001053 4
BJ - 6% - 3 years - 09.july.21 BJ0000001095 36
BJ – 6.3% - 5 years -
07.september.23 BJ0000001145 18
BJ – 6.1% - 3 years -
07.september.21 BJ0000001152 35
BJ – 6.1% - 3 years -
19.september.21 BJ0000001160 30
BJ – 6.1% - 3 years -
30.november.21 BJ0000001178 17
BJ -BT - 12 month - 09.january.20 BJ0000001186 22
BJ – 6.1% - 3 years -
25.january.22 BJ0000001194 44
BJ – 6.3% - 5 years - 08.march.24 BJ0000001210 13
BJ – 6.3% - 5 years - 19.april.24 BJ0000001228 18
BJ – 6.4% - 7 years - 19.april.26 BJ0000001236 15
Table 61. Details of securities outstanding at the end of December 2019

11 GLOSSARY
Adjudication (for government securities): auction of securities issued by the central government. In the WAEMU zone, it is organised by BCEAO and only banks and other regional financial institutions that have accounts with BCEAO may participate. Other entities can only subscribe to auctions through WAEMU banks.
Amortization or maturity : period between the dis-bursement of a loan and its final repaiment, consis-ting of the grace period and the repaiment period.
Public offering: competitive bidding on the financial market for government securities through an IMS. It is open to all investors.
Net Foreign Assets (NFA) : Net foreign assets: net credits or liabilities of monetary institutions (Central Bank and banks) on the outside world. This item corresponds to all the headings of the positions of the Central Bank and banks relating to their external operations. It is obtained by deducting from gross foreign assets the total foreign liabilities, including medium- and long-term liabilities.
Need for government funding : the overall amount required to cover the primary budget deficit and the interest and amortization charges associated with the debt.
Treasury Bills : short-term government securities with a maturity of between 7 days and 2 years, is-sued by a WAEMU Member State.
Paris Club : an informal group of creditor countries (usually OECD countries) that meets in Paris to ne-gotiate debt restructuring agreements with debtor countries experiencing debt service problems.
Bilateral creditors : governments, central banks, agencies and export credit agencies, which lend to a debtor government on an intergovernmental basis.
Multilateral creditors : International institutions that lend funds on concessional and/or non-concessio-nal terms, such as the IMF, World Bank and regional development banks.
124
Credits to the economy (CE) : all assistance granted to the economy by banks (refinanced or not), finan-cial institutions (part refinanced by the Central Bank) and the Treasury (through the acceptance of cus-toms drafts).
Domestic credit = Credit to the economy + Net po-sition of the Government (see PNG).
Disbursement : paiment of all or part of the amount contracted under a loan.
Budgetary deficit : difference between total reve-nue and total expenditure and net lending.
Current account deficit : current account deficit balance of the balance of paiments.
Primary deficit : negative difference between reve-nue and expenditure, excluding interest paiments.
Public foreign debt : central government borrowing from non-residents.
Domestic public debt : central government bor-rowing from residents.
Non-concessional debt : debt contracted at market conditions.
Public Debt : sum of all central government debts (external and internal).
Grant element : difference between the nominal va-lue (NV) and the present value (PV) of the debt ser-vice expressed as a percentage of the nominal value of the loan ((NV-VA)/VN).
Concessional loan : loans and credits that have a long amortization period and/or below-market inte-rest rates, such that they have a grant element of at least 35 %.
Eurobond (or Eurobond) : obligation en dollar au niveau du marché financier de Londres.
Inflation : widespread rise in consumer prices. This

125
results in a loss of purchasing power of money.
Multilateral Debt Relief Initiative (MDRI) The Millennium Development Goals (MDGs): an initiative launched in June 2005 to accelerate progress towar-ds the Millennium Development Goals (MDGs).
HIPC Initiative : framework adopted by the World Bank and the IMF in 1996 to address the external debt problems of Heavily Indebted Poor Countries, which aims to provide comprehensive debt relief suf-ficient to achieve debt sustainability.
Money supply (MS) : all credits held by the rest of the economy on monetary institutions. It comprises cash in hand (banknotes in circulation + overnight deposits) and quasi-monetary assets (savings ac-counts and time deposits).
Treasury Bonds : medium- or long-term govern-ment securities issued through auctions or public offerings.
Contingent liabilities Debt contracted by other pu-blic entities with the exception of central government (local authorities and the para-public sector).
Net Government Position (NGP) : net credits or lia-bilities of the Treasury vis-à-vis the rest of the eco-nomy. The Government's net position is made up of the difference between the Treasury's debts and its credits on the Central Bank, banks and individuals and companies. By convention, a crediting PNG is
preceded by the sign (-) while a debit PNG is prece-ded by the sign (+).
Fiscal pressure : the ratio of tax revenues to GDP.
Refinancing risk : risk related to the renewal of ma-turing debt. It may relate to the cost of refinancing or the impossibility of obtaining the desired amounts.
Interest rate risk : Interest rate risk refers to the vulnerability of the government's debt portfolio and the cost of the government's debt to high market in-terest rates, to the point where maturing fixed-rate and floating-rate debt are revalued.
Exchange rate risks : risks related to exchange rate fluctuations.
Debt service : any paiment to be made on the prin-cipal, interest and fees of a loan.
Primary balance : (see primary deficit).
Base primary balance Total revenue excluding grants - current expenditure + interest on public debt - capital expenditure on own resources.
Gross enrolment ratio : The gross enrolment ratio is the ratio of children in school to all children.
Net enrolment ratio : The gross enrolment ratio is the ratio of children in school to school-age children (of school age).