Subtropical coral-reef associated sedimentary facies characterized by molluscs (Northern Bay of...
26
FACIES 38 229-254 PI. 56-57 14 Figs. 16 Tab. ERLANGEN 1998 i Subtropical Coral-reef Associated Sedimentary Facies Characterized by Molluscs (Northern Bay of Safaga, Red Sea, Egypt) Martin Zuschin and Johann Hohenegger, Vienna KEYWORDS: MICROMOLLUSCS- ASSEMBLAGES - DIVERSITY - FEEDING STRATEGIES - SUBSTRATE RELATIONS - TAPHONOMY - PALAEOECOLOGY - RECENT Summary The shallow marine subtropical Northern Bay of Safaga is composed of a complex pattern of sedimentary facies that are generally rich in molluscs. Thirteen diver- taken bulk-samples from various sites (reef slopes, sand between coral patches, muddy sand. mud, sandy seagrass, muddy seagrass, mangrove channel) at water depths ranging from shallow subtidal to 40m were investigated with regard to their mollusc fauna >lmm, which was separated into fragments and whole individuals. Fragments make up more than 88% of the total mollusc remains of the samples, and their proportions correspond to characteristics of the sedimentary, facies. The whole individuals were differentiated into 622 taxa. The most common taxon, Rissoina cerithiiformis, represented more than 5 % of the total mollusc content in the samples. The main part of the fauna consists of micromolluscs, including both small adults and juveni- les. Based on the results of cluster-, correspondence-, and factor analyses the fauna was grouped into several associations, each characterizing a sedimentary facies: (1) "Rhinoclavis sordidula - Corbula ervthraeensis - Pseudominolia nedyma association" characterizes mud. (2) "Mierocirce sp. - Leptomyaria sp. association" characterizes muddy sand. (3) "Smaragdia spp. - Perrilfia stellata - Anachis exilis - assemblage" characterizes sandy seagrass. (4) "Crenella striatissima - Rastafaria calypso - Cardites akabana - assemblage" characterizes muddy seagrass. (5) "Glycymeris spp. - Pamicardium sueziensis - Diala spp. - assemblage" characterizes sand between coral patches. (6) "Rissoina spp. - Triphoridae - Ostreoidea - assemblage" characterizes reef slopes. (7) "Potamides conicus - Siphonaria sp. 2 - assemblage" characterizes the mangrove. The seagrass fauna is related to those of sand between coral patches and reef slopes with respect to gastropod assemblages, numbers oftaxa and diversity indices, and to the muddy sand fauna on the basis of bivalve assemblages and feeding strategies of bivalves. The mangrove assemblage is related to those of sand between coral patches and the reef slope with respect to taxonomic composition and feeding strategies of bivalves, but has a strong relationship to those of the fine-grained sediments when considering diversity indices. Reef slope assemblages are closely related to that of sand between coral patches in all respects, except life habits of bivalves, which distinctly separates the reef slope facies from all others. Introduction [ndo-Pacific molluscan studies are generally rare be- cause investigations on ecology or facies distributions mainly focus on corals or coral communities. Moreover, most pub- lished molluscan studies concentrate on hard substrates and/ or easily accessible intertidal areas (e.g., Ale4OUD & THO~,tASSJN, 1990; AUSTINet al. 1980; AVaL & SAVmEL, 1981; FRANK, 1969; HADFIELD,1976; Kt_EEMANN,1990, 1992, 1995; LEE& MORTON, 1985; SAFRIELet al., 1980; SCHUHMACHER, 1993; TAYLOR, 1971, 1976; TAYLOR & REID, 1984; ZUSCHtN & PILLER, 1997a, b, c). Modern marine death assemblages in sediments comprise mostly molluscan remains (PoWELL et al., 1989) and, in most sediments, molluscs comprise the most abundant and diver- se of the geologically preservable macrofaunal remains e ~, EKDALE,1977). To date, however, only a few Indo- Pacific studies have treated the mollusc fauna of subtidal sediments (e.g., BaNDEL, 1991a; KAY & SWITZER, 1974; M.-XSTaLLER, 1978; SHEPPARD, 1984; TAYLOR, 1968); tO our knowledge none of the previously published studies dealt quantitatively with the total mollusc fauna of various sedimentary environments. Molluscs and their fragments are by far the most domi- nant particles > 250 btm in the Northern Bay of Safaga, generally comprising more than 50% (PmLER & MaNsoua, 1990). They range third among sediment constituents of a thin-section analysis including all grain size fractions (PIncER, 1994). Most of the mollvscs in our samples are "micro- Address: Dr. M. Zuschin, Prof. Dr. J. Hohenegger, Geozentrum, lnstitut for Palaontologie, Althanstr. 14, A- 1090 Wien; Fax: 0043-1 - 31336-784, E-mail: [email protected]
Transcript of Subtropical coral-reef associated sedimentary facies characterized by molluscs (Northern Bay of...
FACIES 38 229-254 PI. 56-57 14 Figs. 16 Tab. ERLANGEN 1998 i
Subtropical Coral-reef Associated Sedimentary Facies Characterized by Molluscs (Northern Bay of Safaga, Red Sea, Egypt)
Martin Zuschin and Johann Hohenegger, Vienna
KEYWORDS: MICROMOLLUSCS - ASSEMBLAGES - DIVERSITY - FEEDING STRATEGIES - SUBSTRATE RELATIONS - TAPHONOMY - PALAEOECOLOGY - RECENT
Summary
The shallow marine subtropical Northern Bay of Safaga is composed of a complex pattern of sedimentary facies that are generally rich in molluscs. Thirteen diver- taken bulk-samples from various sites (reef slopes, sand between coral patches, muddy sand. mud, sandy seagrass, muddy seagrass, mangrove channel) at water depths ranging from shallow subtidal to 40m were investigated with regard to their mollusc fauna >lmm, which was separated into fragments and whole individuals.
Fragments make up more than 88% of the total mollusc remains of the samples, and their proportions correspond to characteristics of the sedimentary, facies. The whole individuals were differentiated into 622 taxa. The most common taxon, Ris so ina cer i th i i f o rmi s ,
represented more than 5 % of the total mollusc content in the samples. The main part of the fauna consists of micromolluscs, including both small adults and juveni- les. Based on the results of cluster-, correspondence-, and factor analyses the fauna was grouped into several associations, each characterizing a sedimentary facies: (1) "Rhinoc lav i s sordidula - Corbula ervthraeensis -
Pseudomino l ia nedyma association" characterizes mud. (2) " M i e r o c i r c e sp. - L e p t o m y a r i a sp. association" characterizes muddy sand. (3) "Smaragdia spp. - Perrilfia
s tel lata - Anach i s exilis - assemblage" characterizes sandy seagrass. (4) "Crene l la s tr ia t iss ima - Rastafaria
calypso - Cardi tes akabana - assemblage" characterizes muddy seagrass. (5) "Glycymer i s spp. - P a m i c a r d i u m
suez iens is - Diala spp. - assemblage" characterizes sand between coral patches. (6) "Rissoina spp. - Triphoridae - Ostreoidea - assemblage" characterizes reef slopes. (7) " P o t a m i d e s conicus - S iphonaria sp. 2 - assemblage" characterizes the mangrove.
The seagrass fauna is related to those of sand between coral patches and reef slopes with respect to gastropod assemblages, numbers oftaxa and diversity indices, and to the muddy sand fauna on the basis of bivalve assemblages
and feeding strategies of bivalves. The mangrove assemblage is related to those of sand between coral patches and the reef slope with respect to taxonomic composition and feeding strategies of bivalves, but has a strong relationship to those of the fine-grained sediments when considering diversity indices. Reef slope assemblages are closely related to that of sand between coral patches in all respects, except life habits of bivalves, which distinctly separates the reef slope facies from all others.
Introduction
[ndo-Pacific molluscan studies are generally rare be- cause investigations on ecology or facies distributions mainly focus on corals or coral communities. Moreover, most pub- lished molluscan studies concentrate on hard substrates and/ or easily accessible intertidal areas (e.g., Ale4OUD & THO~,tASSJN, 1990; AUSTIN et al. 1980; AVaL & SAVmEL, 1981; FRANK, 1969; HADFIELD, 1976; Kt_EEMANN, 1990, 1992, 1995; LEE& MORTON, 1985; SAFRIEL et al., 1980; SCHUHMACHER, 1993; TAYLOR, 1971, 1976; TAYLOR & REID, 1984; ZUSCHtN & PILLER, 1997a, b, c).
Modern marine death assemblages in sediments comprise mostly molluscan remains (PoWELL et al., 1989) and, in most sediments, molluscs comprise the most abundant and diver- se of the geologically preservable macrofaunal remains e ~, EKDALE, 1977). To date, however, only a few Indo-
Pacific studies have treated the mollusc fauna of subtidal sediments (e.g., BaNDEL, 1991a; KAY & SWITZER, 1974; M.-XSTaLLER, 1978; SHEPPARD, 1984; TAYLOR, 1968); tO our knowledge none of the previously published studies dealt quantitatively with the total mollusc fauna of various sedimentary environments.
Molluscs and their fragments are by far the most domi- nant particles > 250 btm in the Northern Bay of Safaga, generally comprising more than 50% (PmLER & MaNsoua, 1990). They range third among sediment constituents of a thin-section analysis including all grain size fractions (PIncER, 1994). Most of the mollvscs in our samples are "micro-
Address: Dr. M. Zuschin, Prof. Dr. J. Hohenegger, Geozentrum, lnstitut for Palaontologie, Althanstr. 14, A- 1090 Wien; Fax: 0043-1 - 31336-784, E-mail: [email protected]

2 3 0
Fig. 1. Location map and general bathymetry of the study area (after PILLER & MANSOUR, 1990). Dense stippled fields in the right map are intertidal areas. AM = Aerial mast, H = "Safaga Hotel".
molluscs", which we loosely define as adult individuals of small-sized species and juveniles of larger ones not ex- ceeding 10 mm in greatest dimension (modified after BANDEL, 1991a and KAY & SWITZER, 1974). The main goal of this study is to investigate the potential of molluscs to characterize sedimentary facies and to extract facies-de- scriptive mollusc-associations from an enormous number of encountered taxa. A second important point is to test various taxonomic, ecologic and taphonomic assemblage t~eatures (individual numbers, numbers of taxa, numbers of fragments, diversity indices, feeding strategies and sub- strate relations) regarding their potential for facies de- scription. Special emphasis will be placed on evaluating the preservation potential of the studied death assemblages due to the dominance of micromolluscs.
Study area and sample locations
Within an integrated project in the Northern Safaga Bay (Red Sea, Egypt; Fig. 1), bottom facies (PmLER & PERVESLER, 1989), sediments (PmLER & MANSOUR, 1990, 1994; PmLER, 1994; MAr~SOUR et al., 1995), burrows (DwoRSCHAK & PERVESLER, 1988) and organisms with considerable fossilization potential were studied. These include foraminifera (HAuNOLD et al., 1997), corals (RmCL
PILLER, 1997), coral-boring bivalves (KLEEMANN, 1990, 1992, 1995), coralline algae (P1LLER & RASSER, 1996; RASSER & PILLER, 1997), echinoids (NEBELSICK, 1992a, 1992b, 1995a, 1995b, 1996; NEBELSICK 8Z KAMPFER 1994), and molluscs (ZUSCHIN & PILLER, 1997a, b, c).
The Northern Bay of Safaga is a shallow-water area

231
Fig. 2. Sample locations. AM = Aerial mast, H = "Safaga Hotel". See Table 3 for designation of facies
with highly structured bottom topography reaching down to more than 50 m (fig. 1). The annual water temperature ranges between 21 - 29~ salinity between 40- 46 %0, both without any obvious depth gradient due to complete water mixing. The tidal range is < 1 m. Terrigenous (thus nutri- ent) input occurs mainly along the coast and is due to fluvial transport during flash floods, local erosion of im- pure carbonate rocks and aeolian transport by the prevail- ing northerly winds (PmLER & MANSOUR, 1994). Water energy is relatively weak, but a complex current pattern influences facies development (PILLER & PERVESt.ER, 1989)
and bottom facies and sedimentary facies generally show a good correspondence (PILLER & MANSOUR, 1990; PmLER, 1994). In this paper the terminology of sedimentary facies (PILLER & MANSOUR, 1990) is replaced by the terminology for bottom facies (modified after PILLER & PERVESLER, 1989), because the latter gives a better view on the origin of the samples and in most cases also provides information on sedimentologicat features (e.g. mud, muddy sand, sandy seagrass) (tab. I).
All studied sedimentary facies except the mangrove channel are represented by more than one sample (tab. l ). In some sedimentary facies, samples were taken only a few meters from each other (mud, muddy sand, and sand between coral patches), tn contrast the two samples from the reef slope and from seagrass come from completely different areas of the bay (fig. 2). The mud, muddy sand and sand between coral patches facies are very uniformly developed over wide areas of the bay; differences between these sedimentary facies are very well expressed by distinct differences in grain size distributions (PILLER & MANSOUR, 1990). Both seagrass samples come from areas dominated by the seagrass species Halophila stipulacea; in the shallower setting, Halodule mfinervis and Cymodocea rotundata also occur in subordinate quantities. The two samples differ mainly in water depth (6m vs. 4Ore), grain size ("sandy" seagrass vs. "muddy" seagrass) and seagrass density (dense seagrass coverage in sandy seagrass vs. sparse coverage in muddy seagrass).
The two fringing reef samples come from areas with very different coral assemblages, steepness of the slope, and sedimentological features. The sample from Ras Abu Soma was taken on a very steep slope with comparatively high scleractinian diversity, dominated by Acropora spp. and the hydrozoan Millepora dichotoma among a variety of cooccurring faviid and poritid corals. The sediment is gravelly to sandy and very poorly sorted. In contrast the sample from Tubya AI-Hamra comes from a fiat morphol- ogy with a clear dominance of Porites spp. The sediment is a comparatively well sorted sand.
The mangrove consists exclusively of Avicennia marina and the mangrove sediment is moderately to poorly sorted sand (PILLER & PERVESLER, 1989; PILLER & MANSOUR, 1990).
sample 1 2 3 4 5 6 7 8 9 10 11 12 13
n o . actual sample no. 94/1/a 94/1/b 9411/c 94/1/d 94/3/a 94/3/b 94/4/a 94/4/b 94/5 94/6
95/31 B5/8 Cl/3
water depth lOm lOm lOre lOm 23m 23m 39m 39m 19m <lm 12m 6m
40m
bottom facies sand between coral patches sand between coral patches sand between coral patches sand between coral patches muddy sand muddy sand nud mud reef slope mangrove-channel reef slope sandy seagrass muddy sand with seagrass
sedimentary facies coralgal facies Icoralgal facies coralgal facies coralgal facies molluscan facies molluscan facies mud facies mud facies coralgal facies terrigenous facies coralgal facies soritid facies molluscan facies
microfacies coralgal facies coralgal facies coralgal facies coralgal facies foraminiferan sand facies ~foraminiferan sand facies mud facies mud facies coralgal facies terrigenous facies coralgal facies soritid facies foraminiferan sand facies
Tab. 1. Basic sample data: information on bottom facies slightly modified after Pu.l>:R & P~RVESt.~R (1989), information on sedimentary facies after PILLER & MANSOt)r (1990), information on micro facies after Pa.l.~R (19941.

2 3 2
Material and methods
Thirteen standardized bulk samples of various sedimentary environments and bottom facies ranging from shallow subtidal to 40 m water depth were taken by scuba diving (fig. 2; tab. 1). A steel cylinder (diameter 35 cm) was pushed into the sediment and the uppermost 30cm, with a volume of 29 dm 3 was collected into a lmm- mesh net. The sediment was air-dried and molluscs > 2cm were removed before splitting the samples using a modified sample splitter as described by KENNARD and SMITH (1961). Living molluscs were extremely rare and are estimated to contribute far less than 1% to the total mollusc content. Therefore the studied mollusc associations are treated as death assemblages (sensu KIDWELL & BOSENCE, 1991).
Whole shells > l mm were used for facies analysis based on taxonomic composition. A whole shell is defined as having > 90% of the original form (DAvms et al., 1990). Because it is not feasible to perform percentage measurements on the large amount of material, the 90% criterion was evaluated visually. Accuracy may be low, but precision is considered to be high because estimations were performed by one person only. Shells that did not match the 90% criterion were considered as fragments and excluded from the taxonomic part of the study for two reasons: 1) the enormous number of fragments in the studied size range made a practicable taxonomic treatment impossible. 2) For fragments, although of great taphonomic value (DAVIES et al., 1989a), in most cases a taxonomic identification was possible at the family level only, and would therefore reduce the taxonomic potential for recognizing sedimentary facies. For example, DAVIES et al. (1989a) were able to show that unbroken shells more accurately reflected the local fauna than did fragments. The fragments were counted however, and treated as taphonomic features of the studied sedimentary facies.
Disarticulated skeletal elements of molluscs, such as single valves of bivalves and plates of polyplacophorans, were treated as whole individuals for several reasons: 1) a consistent differentiation between left and right valves was not possible for the very abundantj uvenile glycymerids, especially G. arabicus and G. lividus, 2) molluscs and their
body parts were considered as sedimentary particles rather than "ecological individuals" for the facies approach, 3) the sample size is small relative to the size of the sampling domain and therefore counting each body part as a unique individual ("maximum likelihood estimate") is a very reasonable estimate of the number of unique individuals (for a detailed review of estimating individuals from body parts see GrL~NSKV & BENN~GTON, 1994), 4) maximum likelihood estimates are the most common methods of estimating the relative abundance of species in fossil assemblages (HOLTZMAN, 1979).
Bivalve identification is primarily based on OLrVER'S (1992) Red Sea monograph. For gastropods no compre- hensive monograph of Red Sea taxa is available, and their identification is therefore based on a large number of revisions of major taxonomic groups (e.g. HOUBRICK, 1992; BRATCHER & CERNOHORSKY, 1987; CERNOHORSKY, 1984) and monographs of various Indo-Pacific regions (e.g. KAy, 1979; SHARABATI, 1984; BOSCH et al., 1995). For scaphopod identification, SCARABINO (1995) was used; because it is difficult to identify the exclusively isolated polyplacophoran plates, an estimated number of 20 polyplacophoran species was summarized into one taxon. The quantitative treatment of molluscs is based on their abundance (number of individuals); statistical analyses were carried out with the SPSS 6.1.3 program package.
Diversity was measured in several ways. The Margalefo Index was used to quantify species richness (MAGORRAN, 1988). For heterogeneity we used the Simpson Diversity Index in comparison to the Shannon-Wiener function (MAGURRAN, 1988; KREBS, 1989). The latter index was also used to determine the evenness in frequencies between taxa within sites (PIELOU, 1969; KREBS, 1989).
Samples were grouped on the basis of taxa proportions using the 'Minimum Variance'-approach (WARD, 1963; ORLOCl, 1967). Transformation of proportions was per- formed using the arcsine-root method (LINDER & BERCHTOLD, 1976) to gain linear data, which are necessary for most hierarchical cluster analyses.
Cluster analyses on absolute frequencies of taxa were carried out with (1) combined bivalves, gastropods, scaphopods and polyplacophorans; (2) bivalves only; and
P l a t e 56
Fig. 1. Fig. 2. Fig. 3. Fig. 4. Fig. 5. Fig. 6. Fig. 7. Fig. 8. Fig. 9. Fig. 10. Fig. 11. Fig. 12.
The most abundant character taxa of the studied assemblages in the Northern Bay of Safaga, Red Sea, Egypt
Pseudominolia nedyma, x 5.5 Corbuta erythraeensis, right valve, internal view, x 12 Corbula erythraeensis, right valve, external view, x 13 Microcirce sp., right valve, external view, x 18 Microcirce sp., left valve, internal view, x 21 Leptomyaria sp. right valve, external view, x 26 Crenella striatissima, right valve, external view, x 29 Crenella striatissima, right valve, internal view, x 24 Leptomyaria sp. right valve, internal view, x 36 Rhinoclavis sordidula, x 5 Rastafaria calypso, right valve, internal view, x 2.5 Rastafaria calypso, left valve, external view, x 2.5

P l a t e 56 233
234
%
21
191
13
reef slope sample 9 22 taxa >1%=65.92% 155 taxa <1%=34.08%
11
9
7
3
1
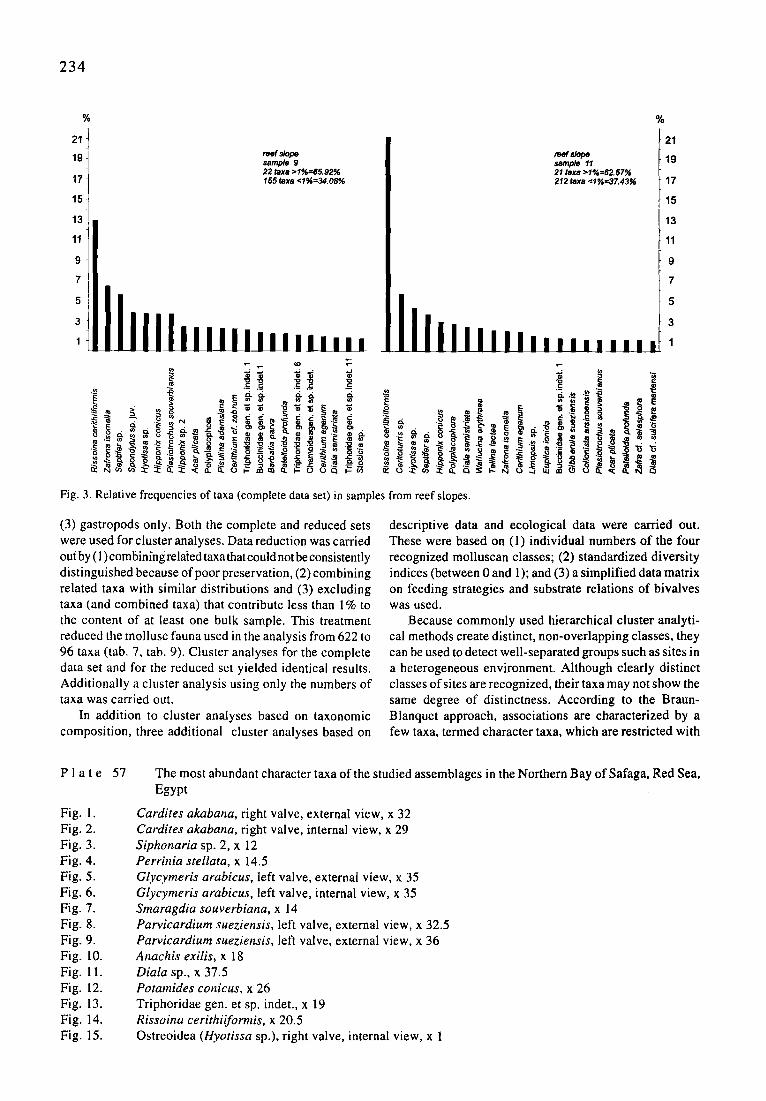
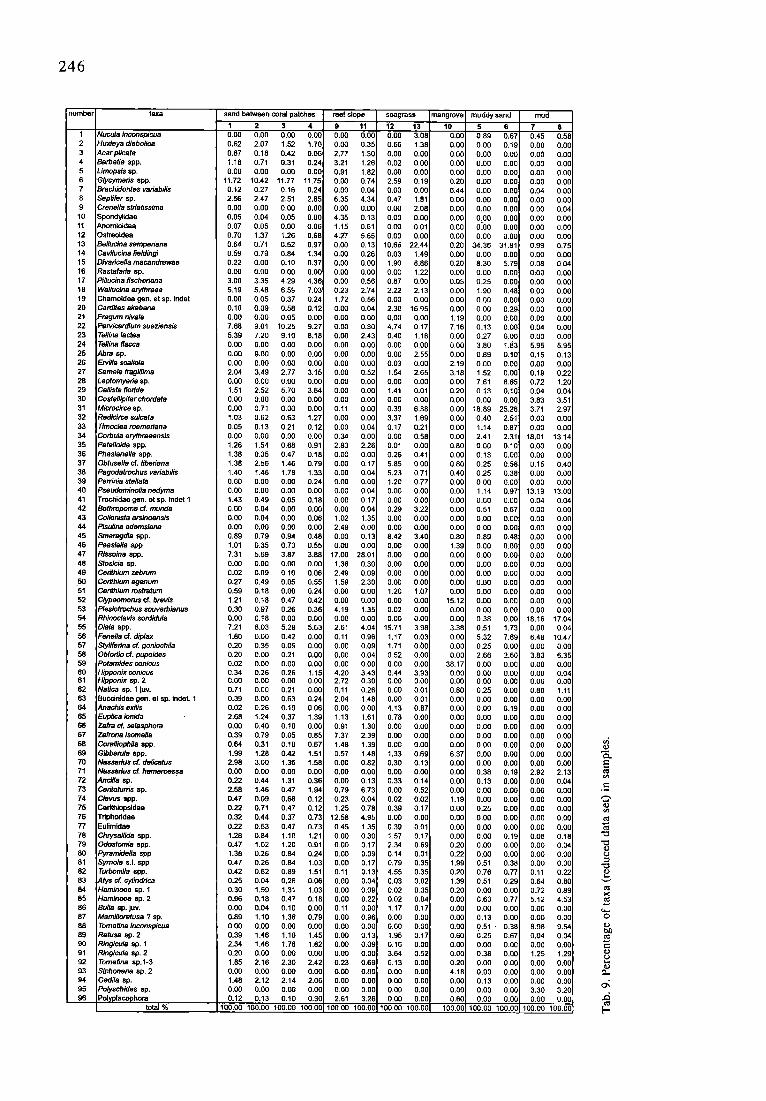
Fig. 3. Relative frequencies of taxa (complete data set) in samples
(3) gastropods only. Both the complete and reduced sets were used for cluster analyses. Data reduction was carried out by (I) combinfng relaied taxa that could not be consistently distinguished because of poor preservation, (2) combining related taxa with similar distributions and (3) excluding taxa (and combined taxa) that contribute less than 1% to the content of at least one bulk sample. This treatment reduced the mollusc Nuna used in the analysis from 622 to 96 taxa (tab. 7, tab. 9). Cluster analyses for the complete data set and for the reduced set yielded identical results. Additionally a cluster analysis using only the numbers of taxa was carried out.
In addition to cluster analyses based on taxonomic composition, three additional cluster analyses based on
sample ~1 21 taxa >1%:62.57% 212 taxa <1%=37.43%
i i l l l l l l i , , , , , , , , , , :~ .~o~ ~
%
21
19
17
15
13
11
9
7
5
3
1
from reef slopes.
descriptive data and ecological data were carried out. These were based on (1) individual numbers of the four recognized molluscan classes; (2) standardized diversity indices (between 0 and 1); and (3) a simplified data matrix on feeding strategies and substrate relations of bivalves was used.
Because commonly used hierarchical cluster analyti- cal methods create distinct, non-overlapping classes, they can be used to detect well-separated groups such as sites in a heterogeneous environment. Although clearly distinct classes of sites are recognized, their taxa may not show the same degree of distinctness. According to the Braun- Blanquet approach, associations are characterized by a few taxa, termed character taxa, which are restricted with
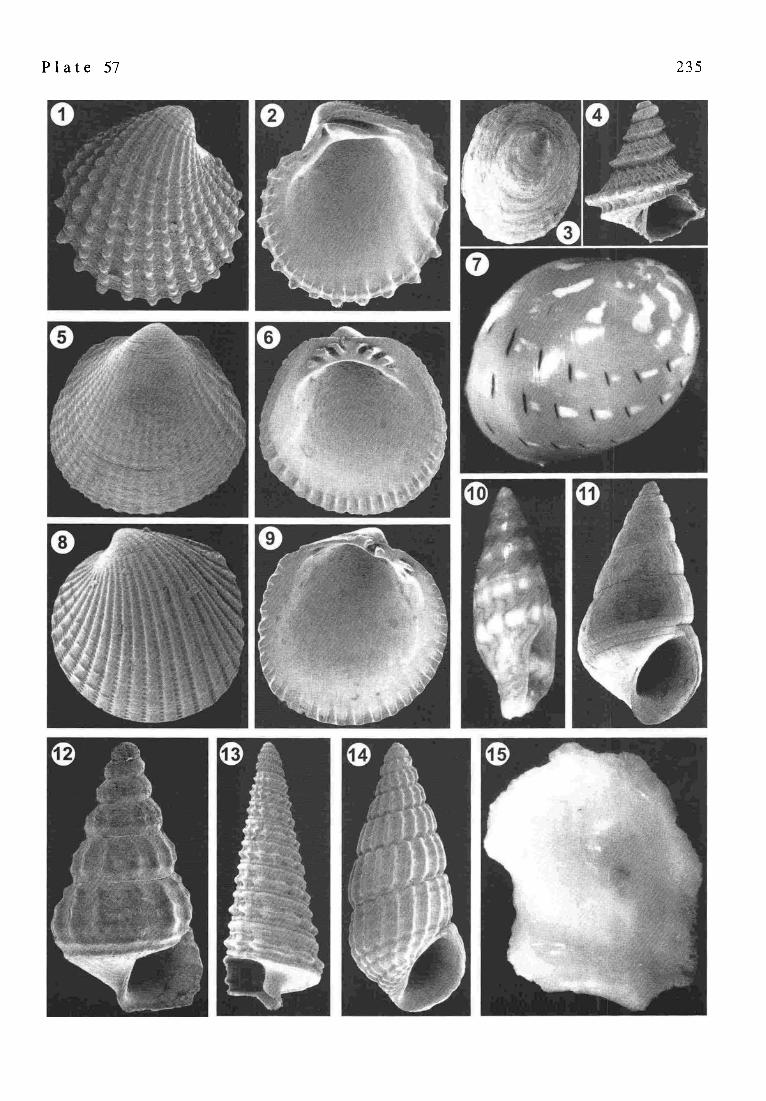
P l a t e 57
Fig. 1. Fig. 2. Fig. 3. Fig. 4. Fig. 5. Fig. 6. Fig. 7. Fig. 8. Fig. 9. Fig. 10. Fig. 11. Fig. 12. Fig. 13. Fig. 14. Fig. 15.
The most abundant character taxa of the studied assemblages in the Northern Bay of Safaga, Red Sea, Egypt
Cardites akabana, right valve, external view, x 32 Cardites akabana, right valve, internal view, x 29 Siphonaria sp. 2, x 12 Perrinia stellata, x 14.5 Glycymeris arabicus, left valve, external view, x 35 Glycymeris arabicus, left valve, internal view, x 35 Smaragdia souverbiana, x 14 Parvicardium sueziensis, left valve, external view, x 32.5 Parvicardium sueziensis, left valve, external view, x 36 Anachis exilis, x 18 Diala sp., x 37.5 Potamides conicus, x 26 Triphoridae gen. et sp. indet., x 19 Rissoina cerithiiformis, x 20.5 Ostreoidea (Hyotissa sp.), right valve, internal view, x 1
P l a t e 57 235

2 3 6
%
8
7
6
5
4
3
2
1
~3
coral sand sample 1 24 taxa >1%=63.55% 183 taxa <1%=36.45%
o
,n , ~ - ._~,~o~._~~_, ,,.~
~ ~. ~
coral sand sample 2 23 taxa >1%=64.91% 184 taxa <1%=35.09%
lllllltlil ..,. t 'o
r
,, ~ e E ~ .e
%
8
7
6
5
4
3
2
1
%
9 ,
%
9
7
6
5
4
3
2
1
coral sand coral sand 8
6
5 I[ll 4 3
IIIIl l l [llll ll _ 1 _ 1 1 1 . . . . . . . ! ! 1 1 'd
"~ e
~ ~.~-
�9 ~- . ~ ~ ~ ~ - ~ .~.~
~ ~ ~ . ~ = . ~ ,0,,
Fig. 4. Relative frequencies of taxa (complete data set) in samples from coral sand.
a high degree of fidelity to these associations (WESTHOFF & VAN DZR MAAREL, 1973) but are not necessarily the preva- lent taxa (e.g., CALEF & HANCOCK, 1974) or the trophic nucleus (e.g., WALKER, 1972; ANTIA, 1977; FORSlCH, 1977). Most taxa within anyone association are present in other associations as well. These intermediate forms cannot be detected by non-overlapping cluster analyses. Therefore, ordination methods were used to clarify the relations between taxa and sites. Also, they may help to evaluate the reality of groups delineated by clusters. Because fre-
quency data are represented in a contingency table, corre- spondence analysis as an ordination method was used for data reduction (BENZECRI, 1973; HILL, 1973). The advan- tage of this method is the direct derivation of frequencies without transformations and the simultaneous representa- tion of sites and taxa within the same system of axes in the form of biplots (GABRIEL, 1971).
In order to detect ecological and environmental fac- tors, which cannot be directly observed, latent structure methods were developed (e.g. JORESKOC et al., 1976;

237
taxon
1 Rissoina cerithiiformis 2 Parvicardium sueziensis 3 Diala semistriata 4 Glycymeris arabicus 5 Tellina lactea 6 Wallucina erythraea 7 Bellucina semperiana 8 Septifer sp. 9 Pillucina fischeriana
10 Ceritoturris sp. 11 Callista florida 12 Semele fragillima 13 Microcirce sp. 14 Hyotissa sp.
15 Nassarius cf. delicatus 16 Glycymeris pectunculus 17 Fenella cf. diplax 18 Obtusella cf, tiberiana 19 Tornatina sp. 1"
20 Hipponix conicus 21 Euplica ionida
' 22 Pagodatrochus variabilis 23 Zafrona isomella 24 Gibberula sueziensis 25 Gadila sp. 26 Ringicula sp. 1
27 Huxleya diabolica 28 Corbula erythraeensis 29 Divaricella macandrewae 30 Smara~ldia rangiana
%
6,64 4.68 4.46 4.10 3.96 3.50 3.14
2.26 1.92 1.78 1 6 5
1.65 1.63 1.29 1.24 1.19 1.16 1.12 1.11
1.03 1.02 1.01 0.99 0.97 0.94 0.91 0.83 0.75 0.71 0.71
Tab. 2. The 30 most abundant taxa of the 13 bulk samples.
KRZANOWSK[ & MARRtO'Cr, 1995). Factor analysis based on correlation matrix, with principal components as initial factor configuration, and subsequent varimax rotation, was performed on bivalve and gastropod abundance within sites, where the latter were treated as variables for factor extraction.
Results Taxonomic composition
The 26382 whole individuals picked from 13 samples were assigned to 622 taxa. Most of the taxa are gastropods (444), followed by bivalves (171) and scaphopods (6). A
single species, Rissoina cerithiiformis, contributed more than 5 % to the total mollusc content of the 13 samples (tab. 2); only 22 taxa comprised more than 1% (tab. 2); and only 151 taxa, more than 0.1%.
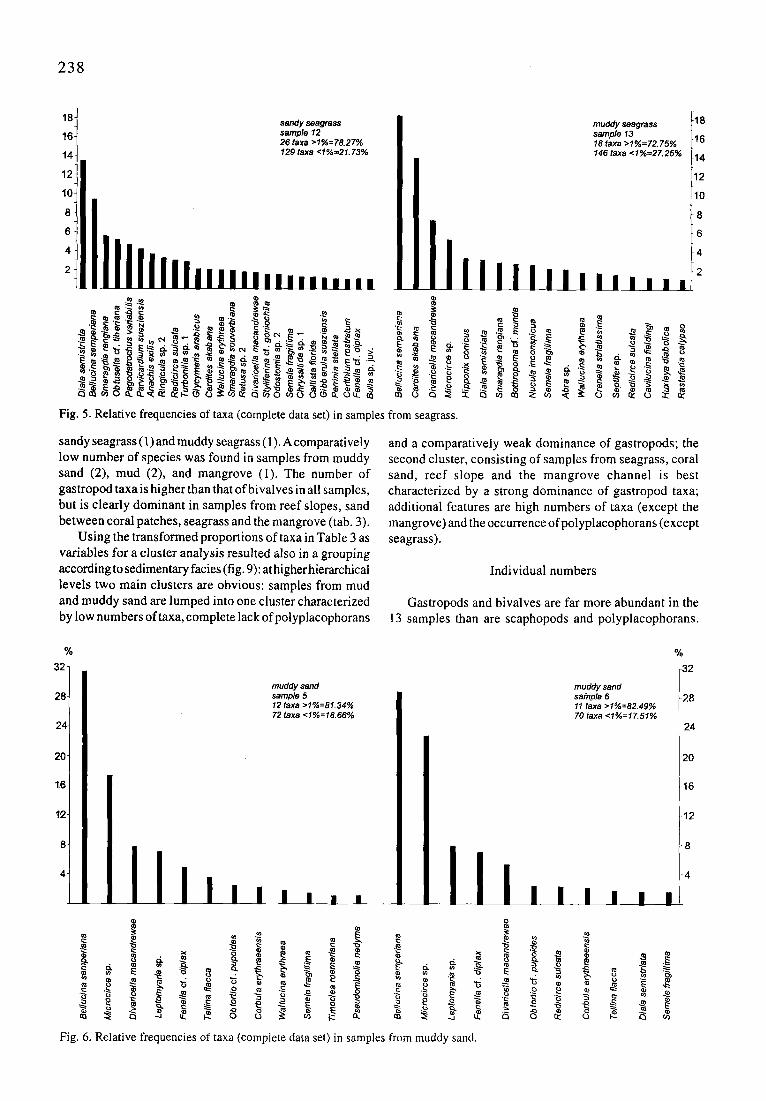
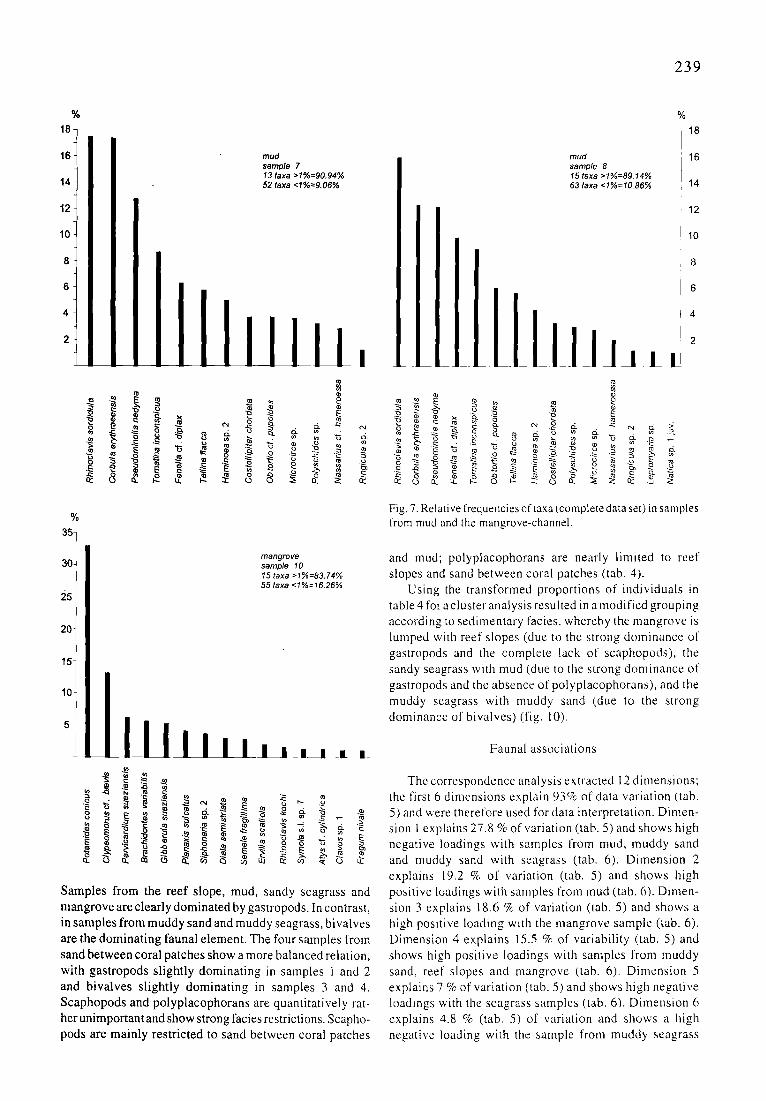
Looking at the individual samples reveals a rather distinct pattern of dominant species: Rissoina cerithiiformis strongly dominates the samples from reef slopes: it contributes nearly 13% to the sample from the Acropora - Millepora dominated reef slope, and more than 21% to the sample from the Porites dominated reef slope; all other taxa contribute less than 7% each to the total number of individuals in either of the two samples (fig. 3). The four samples from sand between coral patches are dominated by several taxa, with G lycymeris arabicus, Parvicardium sueziensis, Diala semistriata, Tellina lactea and Wallucina erythraea being among the most important; each of these taxa contributes less than 9% to each sample (fig. 4). The sample from sandy seagrass is strongly dominated by Diala semistriata (>13%) and Bell,cilia semperiana (>9%) (fig. 5), the sample from muddy seagrass by Bellucina semperiana (> 18%), Cardites akabana (> 13%) and Divaricella mac- andrewae (>7%) (fig. 5). All other taxa contribute less than 6% each to each of the two samples. The two samples from muddy sand are strongly dominated by Bellucina semperiana (>28 % and > 31%) and Microcirce sp. (> 17% and 28%) (fig. 6); all other taxa contribute less than 8% to each of the two samples. The two samples from mud are dominated by Rhinoclavis sordidula, Corbula eo'thraeensis and Pseudominolia nedvma each of which contributes between 12 and 18% to each sample (fig. 7). The mangrove- sample is strongly dominated by Potamides conicus (>32%) (fig. 7).
The cluster analyses based on all taxa, on gastropods only and on bivalves only are nearly identical and correspond to a clustering of samples according to sedimentary facies (fig. 8). The grouping of mollusc associations at a higher hierarchical level reflects different relationships to the sedimentary facies: on the basis of bivalves, seagrass associations are similar to those of muddy sands and muds, whereas the gastropods of the seagrass association are similar to those of the reef slope and sand between coral patches. The mangrove association is distinct, with a close relation to the associations of the coarse-grained sediments (bivalves only) and seagrass (gastropods only).
The number of taxa is very high in the samples from reef slopes (2 samples), sand between coral patches (4),
facies samp e no.
sand between coral patches muddy sand 1 2 3 4 5 6
mud reef slope man~lr, sea~lrass 9 11 10 12 13 7 8
bivalves 66 62 53 63 38 36 26 32 47 55 23 47 60 gastropods 135 140 140 125 44 43 37 48 129 177 46 107 104
number oftaxa scaphopods 4 4 3 4 2 2 2 2 0 0 0 1 1 polyplacophora 1 1 1 1 0 0 0 0 t 1 1 0 0
total 206 207 197 193 84 81 65 82 177 233 70 155 165
diversity indices 18.19 18.10 17.50 17.72 8 . 7 1 8.14 6.88 8.83 16.93 20,46 8.16 15.04 17.5T 0.97 0.97 0.97 0.97 0.86 0.85 0.90 0.92 0.96 0.94 0,86 0.96 0.93 4.25 4.20 4 . 1 1 4.19 2.77 2.67 2.71 2.89 4.06 4.05 2.81 3.74 3.54 0.80 0.79 0.77 0.79 0.52 0.50 0.51 0.54 0.76 0.76 0.53 0.70 0.67
Margalef Simpson Information evenness
Tab. 3. Number of taxa and diversity indices of samples.
2 3 8
t 8 t sandy seagrass muddy saagrass 118 16 t sample 12 sample 13 116
26 taxa >1%=78.27% 18 taxa >1%=72.75% 14 = . 146taxa <1%=27.25% 114
12~ :12
~0~ i~0 8 18 6 1 6
4 14
_lllllli,,,,, t~ ~
~ ~.~= ~=
~o~
E
~ ~ .~
Fig. 5. Relative frequencies of taxa (complete data set) in samples
sandy seagrass (1) and muddy seagrass (1). A comparatively low number of species was found in samples from muddy sand (2), mud (2), and mangrove (1). The number of gastropod taxa is higher than that of bivalves in all samples, but is clearly dominant in samples from reef slopes, sand between coral patches, seagrass and the mangrove (tab. 3).
Using the transformed proportions of taxa in Table 3 as variables for a cluster analysis resulted also in a grouping according to sedimentary facies (fig. 9): at higher hierarchical levels two main clusters are obvious: samples from mud and muddy sand are lumped into one cluster characterized by low numbers oftaxa, complete lack ofpolyplacophorans
II)
~ ~ ~ "~
from seagrass.
and a comparatively weak dominance of gastropods; the second cluster, consisting of samples from seagrass, coral sand, reef slope and the mangrove channel is best characterized by a strong dominance of gastropod taxa; additional features are high numbers of taxa (except the mangrove) and the occurrence of polyplacophorans (except seagrass).
Individual numbers
Gastropods and bivalves are far more abundant in the 13 samples than are scaphopods and polyplacophorans.
%
32-
28-
24
20-
1,6-
12-
8-
4-
muddy sand sample 5 12 taxa >1%=81.34% 72 taxa <t%=18.66%
lli,,,,,..
muddy sand safnple 6 11 taxa >1%=82.49% 70 taxa <1%=1"L51%
!!! , , , , , _
Fig. 6. Relative frequencies of taxa (complete data set) in samples from muddy sand.
%
32
28
24
20
16
12
8
4
Q
"6
239
%
18- 2
1 6 -
1 4
1 2
~ol 8
6
4
2
%
18
mud mud 16 samp/e 7 samp/e 8 13 taxa >1%=90.94% 15 taxa >1%=89.14% 52 taxa <1%=9.06% 63 taxa <1%=10.86% 14
12
10
I I I I_m lli , , , 110
" I, " a
% 3 5 �84
Fig. 7. Relative frequencies of taxa (complete data set) in samples from mud and the mangrove-channel.
30
20
15
10
5 I l l i i ,
mangrove sample 10 15 taxa >1%=83.74% 55 taxa <1%=16.26%
J _ L i i J
Samples from the reef slope, mud, sandy seagrass and mangrove are clearly dominated by gastropods. In contrast, in samples from muddy sand and muddy seagrass, bivalves are the dominating faunal element. The four samples from sand between coral patches show a more balanced relation, with gastropods slightly dominating in samples 1 and 2 and bivalves slightly dominating in samples 3 and 4. Scaphopods and polyplacophorans are quantitatively rat- her unimportant and show strong facies restrictions. Scapho- pods are mainly restricted to sand between coral patches
and mud; polyplacophorans are nearly limited to reef slopes and sand between coral patches (tab. 4).
Using the transformed proportions of individuals in table 4 for acluster analysis resulted in a modified grouping according to sedimentary facies, whereby the mangrove is lumped with reef slopes (due to the strong dorninance of gastropods and the complete lack of scaphopods), the sandy seagrass with mud (due to the strong dominance of gastropods and the absence of polyplacophorans), and the muddy seagrass with muddy sand (,clue to the strong donfinance of bivalves) (fig. 10).
Faunal associations
The correspondence analysis extracted 12 dimensions; the first 6 dimensions explain 93% of data variation (tab. 5) and were therefore used for data interpretation. Dimen- sion 1 explains 27.8 % of variation (tab. 5) and shows high negative loadings with samples fiom mud, muddy sand and muddy sand with seagrass (tab. 6). Dimension 2 explains 19.2 % of variation (tab. 5) and shows high positive loadings with samples from mud (tab. 6). Dimen- sion 3 explains 18.6 % of variation (lab. 5) and shows a high positive loading with the mangrove sample (tab. 6). Dimension 4 explains 15.5 % of variability (tab. 5) and shows high positive loadings with samples front muddy sand, reef slopes and mangrove (tab. 6). Dimension 5 explains 7 % of variation (tab. 5) and shows high negative loadings with the seagrass samples (tab. 6). Dimension 6 explains 4.8 % (tab. 5) of variation and shows a high negative loading with the sample from muddy seagrass

240
Resceled Distance Cluster C o m b i n e
0 5 10 15 20 25 I i I I I I
Sedimentary Sample No. Facies
mud 7 , J [ 5
muddy sand 6 --J I 12
saag ru~ 13 ~ J
9 reef slope 1 1 2 3 _ ] - - I I coral sand 3
4 1
mangrove 10
al l t a x a
7 mud 8
5 muddy sand 6
12 seagrass 13
9 reef slope 11
2 3
coral sand 4 I
mangrove 10
mud 7 8
muddy sand 5 6
reef slope :1
2
coral sand 3 4 1
12 seagrass 13
mangrove 10
" I m I
J I _._l
b i v a l v e s
gastropods
Fig. 8. Cluster analyses dendrograms (Ward's method) based on absolute frequencies of taxa.
and a significant positive loading with the sample from sandy seagrass (tab. 6). Samples from sand between coral patches are not explained explicitly by a single dimension, but show intermediate loadings with most dimensions (tab. 6).
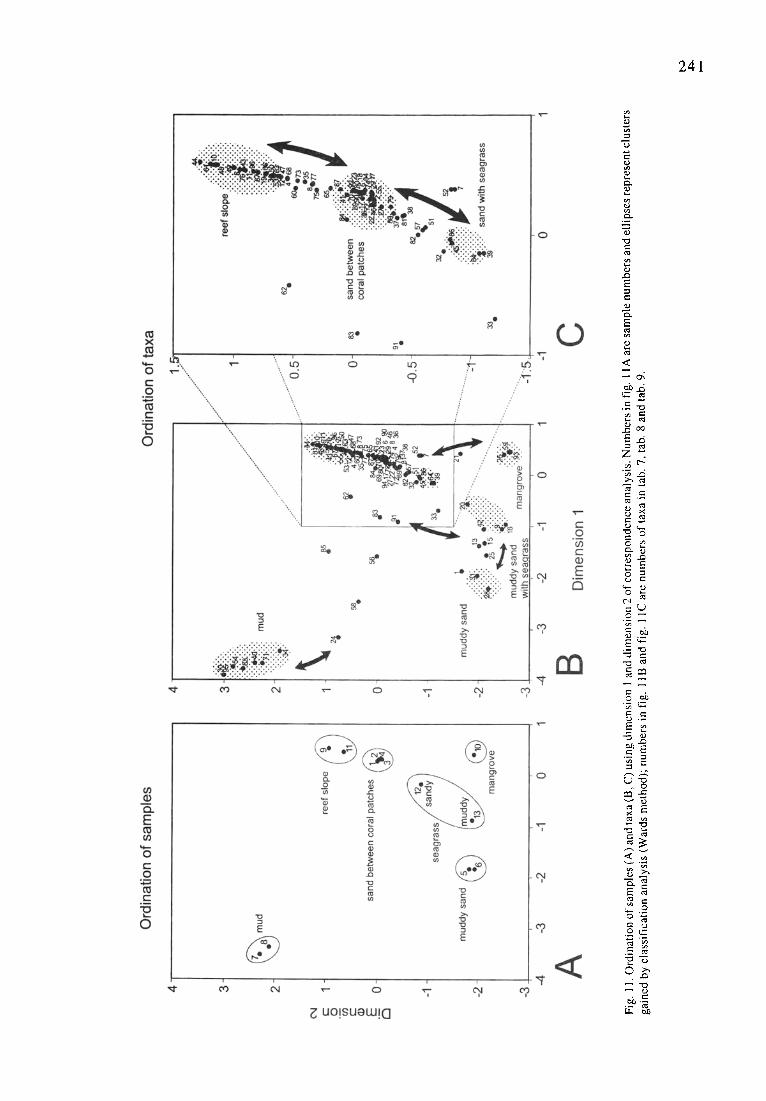
The ordination of samples in the coordinate system of first two dimensions shows the distinct separation of classes, consistent with the cluster analyses (fig. 11). The diverse position of the seagrass communities, as demonstrated by the different cluster analysis, is caused by an intermediate position between muddy sand, mangrove, and sand between
Rescaled Distance Cluster Combine
0 5 10 15 20 25 I ! I I I I
Sedimentary Sample No. Facies
muddy sand 5 ~ n u m b e r of taxli 6
mud 7 $
reef slope 11
mangrove 10 t2
seegrass 13
1
coral sand 4 2 3
Fig. 9. Cluster analyses dendrograms (Ward's method) based on numbers of taxa.
Rescaled Distance Cluster Combine
0 5 10 15 20 25 I I ! I I !
Sedimentary Sample No. Facies
reef slope 11
mangrove 10 number of Individuals 7
mud 8
seagrass 12 3
coral sand 4 1 2
muddy sand 6 --I seegrass 13 l muddy sand 5
Fig. 10. Cluster analyses dendrograms (Ward's method) based on numbers of individuals.
coral patches. Additionally, the seagrass cluster does not show the same degree of homogeneity as other clusters, as indicated by the large distance between sandy seagrass and muddy seagrass (fig. 11 A).
The ordination of taxa shows two distinct groups (fig. 11): One closely coincides with the sample clusters (shaded areas in fig. 11 B, C), indicating a strong relationship between taxa and samples, the other, located between the sample clusters, demonstrates the degree of relationships to the cluster centroids (indicated by arrows in fig. 11 B, C).
counted calculated individuals individuals
facies no./sample bivalves gastropods scaphopods
sand between coralpatches
muddy sand mud
reefslope
mangrove seagrass
sample no. 1 2 3 4 5 6 7 8 9 11 10 11 13
1880 1694 1464 1488 740 898
2748 2412 1137 2766
626 3361 5168
32857 40972 39850 34030 11148 14390 3796 2808 7876
21094 989
9238 8266
43781 43918 31268 27531
2607 4155 6844 6532
24021 64832
3666 18778 3046
1770 2532 1985 2051
64 2
352 308
0 0 0 2 6
pol~lacophorans 80 96 64
160 0 0 0 O
736 2400
24 0 0
no./sample 78488 87518 73167 63772 13819 18547 10992 9648
32633 88326 4679
28018 11318
total no. 26382 227314 280979 9072 3560 520925
Tab. 4. Counted and calculated individual numbers of samples.
241
e-,
r
E ,-.1
E
,<
Z ~ �9 t " " .
~ ..d
e",
% . ,
,--~ .Z.Z
2 4 2
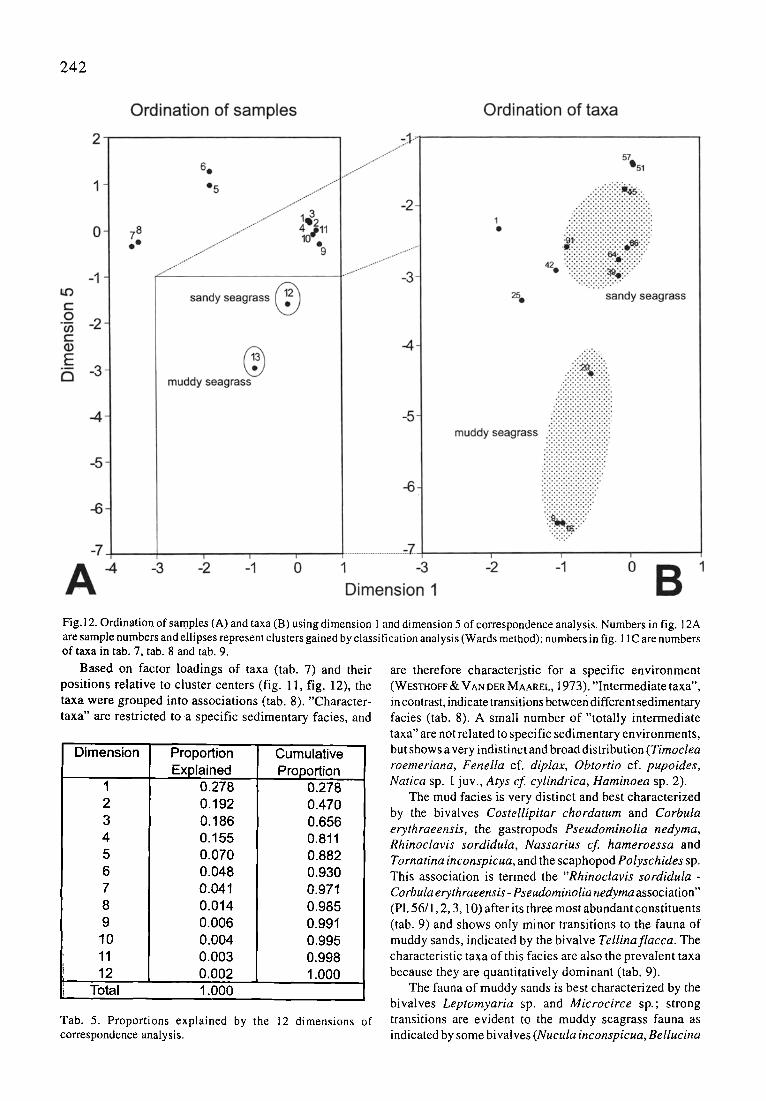
Fig.12. Ordination of samples (A) and taxa (B) using dimension 1 and dimension 5 of correspondence analysis. Numbers in fig. 12A are sample numbers and ellipses represent clusters gained by classification analysis (Wards method); numbers in fig. 11C are numbers of taxa in tab. 7, tab. 8 and tab. 9.
Based on factor loadings of taxa (tab. 7) and their positions relative to cluster centers (fig. 11, fig. 12), the taxa were grouped into associations (tab. 8). "Character- taxa" are restricted to a specific sedimentary facies, and
Dimension
1 2 3 4 5 6 7 8 9 10 11 12
Total
Proportion Explained
0.278 0.192 0.186 0.155 0.070 0.048 0.041 0.014 0.006 0.004 0.003 0.002
Cumulative Proportion
0.278 0.470 0.656 0.811 0.882 0.930 0.971 0.985 0.991 0.995 0.998 1.000
1.000
Tab. 5. Proportions explained by the 12 dimensions of correspondence analysis.
are therefore characteristic for a specific environment (WESTHOFF • VAN DER MAAREL, 1973). "Intermediate taxa", in contrast, indicate transitions between different sedimentary facies (tab. 8). A small number of "totally intermediate taxa" are not related to specific sedimentary environments, but shows a very indistinct and broad distribution (Timoclea roemeriana, Fenella cf. diplax, Obtortio cf. pupoides, Natica sp. I. juv., Atys cf cylindrica, Haminoea sp. 2).
The mud facies is very distinct and best characterized by the bivalves Costellipitar chordatum and Corbula erythraeensis, the gastropods Pseudominolia nedyma, Rhinoclavis sordidula, Nassarius cf. hameroessa and Tornatina inconspicua, and the scaphopod Polyschides sp. This association is termed the "Rhinoclavis sordidula - Corbula erythraeensis- Pseudominolia nedyma association" (PI. 56/1,2, 3, 10) after its three most abundant constituents (tab. 9) and shows only minor transitions to the fauna of muddy sands, indicated by the bivalve Tellinaflacca. The characteristic taxa of this facies are also the prevalent taxa because they are quantitatively dominant (tab. 9).
The fauna of muddy sands is best characterized by the bivalves Leptomyaria sp. and Microcirce sp.; strong transitions are evident to the muddy seagrass fauna as indicated by some bivalves (NucuIa inconspicua, Bellucina

243
o !
Sedimentary Sample No. Fackm
2 �9 - 1 coral sand 4 - - I
1 3 9
s e a g r l s 12 13
muddy sand 5 mangrove 10 muddy sand 6
7 mud 8
Rescaled Distance Cluster Combine
5 10 15 20 25 i i I i !
divemdy Indices
Fig. 13. Dendrograms of cluster analyses (Ward's method) on diversity indices.
semperiana, Divaricella macandrewae, Abra sp.) and only one gastropod (Bothropoma cf. munda). This association is termed the "Microcirce sp. - Leptomyaria sp. association" (P1.56/4, 5, 6, 9), after its characteristic constituents, but is quantitatively dominated by Bellucina semperiana (tab. 9).
The seagrass fauna is characterized by the bivalves Crenella striatissima, Rastafaria calypso, and Cardites akabana, which typically occur in muddy seagrass, and the gastropods Perrinia stellata, Smaragdia spp., Anachis exilis, Bulla sp. juv., and Ringicula sp. 2, which typically occur in sandy seagrass. Considering the most abundant characteristic representatives, the association in sandy seagrass is termed the "Smaragdia spp. - Perrinia stellata - Anachis exilis - association" (PI. 57/4, 7, 10), which is quantitatively dominated by Diala spp., Bellucina semperiana ~nd Smaragdia spp. (tab. 9). This association in muddy seagrass is termed the "Crenella striatissima - Rastafaria calypso - Cardites akabana association" (P1.56/7, 8, 11, 12; P1. 57/1, 2), which is quantitatively dominated by Bellucina semperiana and Cardites akabana (tab. 9). A broad transition from sandy seagrass to the "sand between coral patches association" is indicated by various gastropods ( Obtusella cf. tiberiana, Pagodatrochus variabilis, Cerithium rostratum, Styliferina cf goniochila, Syrnola s.l. spp. and Turbonilla spp.) and the bivalve Redicirce sulcata.
The fauna in sand between coral patches is characterized by an enormous number of bivalves (Huxleya diabolica, Glycymerididae, Pillucina fische riana, WaIlucina e rythraea, Parvicardium sueziensis, Semelefragillima, Callistaflorida)
Rescaled Distance Cluster Combine
0 5 10 15 20 25 i ! i ( i i
Sedimentary Sample No, Facial
3 coral sand 4
1 mangrove 10
7 7 - mud 8 muddy sand 6 "7
12 J seagrass 13
muddy sand 5
I reef slops 11
Fig. 14. Cluster analysis (Ward's method) on bivalve feeding strategies and substrate relations.
and gastropods (Phasianella spp., Trochidae gen. et sp. indet. 1, Peasiella spp., Diala spp., Euplica ionida, G ibberula spp., Nassarius cf delicatus, Ancilla sp., Clavus spp., Odostomia spp,, Pyramidella spp., Haminoea sp. 1, Mamilloretusa ? sp., Retusa sp. 3., Ringicula sp. 1, Tornatina sp. 1-3.) and the scaphopod Gadila sp. The association is termed the "Glycymeris spp. - Parvicardium sueziensis - Diala spp. association" (P1, 57/5, 6, 8, 9, 11) after its most abundant characteristic representatives, which are also the prevalent taxa (tab. 9).
The bi valves Barbatia spp., Septifersp. and the gastropods Patelloida spp., Hipponix conicus, Coralliophila spp., Cerithiopsidae and Eulimidae show strong transitions from sand between coral patches to the reel" slope. The bivalves Bracfiidontes variabilis, Fragum nivale and the gastropod Clypeomorus cf. brevis show a weak transition to the mangrove.
The reef slope fauna is best characterized by the bivalves Acar plicata, Limopsis sp., Spondylidae, Anomioidea, Ostreoidea, Chamoidea, the gastropods Colhmista arsino- ensis, Pisulina adamsiana, Rissoina spp., Stosicia sp., Cerithium zebrum, Cerithium egenunh Plesiotrochus souverbiam~s, Hippolfix sp. 2, Buccinidae gen. et sp. indet. 1, Zafra cf selasphora, Zafrona isomella, and Triphoridae and Polyplacophora. The association on reef slopes is termed the "Rissoina spp. - Triphoridae - Ostreoidea association" (P1. 57/13-15) according to the three most abundant characteristic representatives, which are also the prevalent taxa (tab. 9).
The "mangrove association" is best characterized by
sample no. 1 2 3 4 5 6 7 8 9 10 11 12 13
Tab. 6.
bottom facies sand between coral patches sand between coral patches sand between coral patches sand between coral patches muddy sand i muddy sand mud mud reef slope mangrove reef slope sand with seagrass muddy sand with sea~lrass -0.871
Loadings of samples by dimensions 1-6.
Dim 1 Dim2 Dim 3 Dim4 Dim 5 Dim 6 0.293 -0.012 -0.073 -0.451 0,203 -0,094 0.330 -0.055 -0.008 -0.519 0,158 -0.027 0.322 -0.102 -0.055 -0,685 0,201 -0.168 0.343 -0.084 -0.028 -0.568 0.186 -0.149
-1.817 -1.827 0.67 0.983 0.962 0.105 -1.828 -1.940 0.722 1.070 1.273 0.304 -3.509 2.281 -0.732 -0,629 -0.345 -0.098 -3,364 2.098 -0.671 -0.571 -0.239 -0.018 0.538 0.940 0.338 1.674 -0.299 0.590 0.414 -1.914 -8.359 2.049 -0.080 0,016 0.474 0,648 0.228 0.962 0.014 -0.210
-0.155 -0.867 0.184 -0.473 - 1.588 1.793 -1.884 0.672 0.617 -2.970 -2.630
244
no. laxa
1 Vucula inconspicua 2 ~uxleya dtabolica 3 Acar plice/a 4 Barbat/a Spp. 5 IJmopsis sp. 6 Glycymeds app. 7 Blachidontes variabill~ 8 Sep~far sp, 9 Cmnella attfalissima
10 Spo~dyfldae 11 Anomloidea 12 Oslmoklea 13 Be/lucdna set'npetiana 14 Cav#uck~afie/dingi 15 Divatice/la rnacandrewae 16 RastafatYa sp. 17 P~ludnaf~cha~ana 16 Wa~lucina eq~hraea 19 Chamoide8 gen, el sp, indel 20 C ~ akabatm 21 Fragumnlve/e 22 Pa~icardlum suaidensis 23 Te/lina/ectea 24 Te/lina flacca 25 Abm sp. 26 Em#ia ~cal~a 27 S ~ frag~#ma 26 Leptomyena sp. 29 Cafilsta florida 30 CoMe/I/p~arsp. 31 Microcitce sp. 32 Redicifee sulcata 33 7imor Ionmerfana 34 Corbula eryihraeensis 35 Pate~/aide spp. 36 Phae/ana#a spp. 37 Obluse/la cf. tibedana 38 Pa�odab~chus vanabRis 39 Perrinia ste#ata 40 P s e u d ~ / a rmdyma 41 Trcchidae gen. el sp. indel 1 42 Bothmporna cf. munda 43 Collonista aralnoensi$ 44 Pisullna adamsiBna 45 Smara�d/a spp, 46 Pea.~/ta spp 47 Rissolna spp. 46 Stosicia sp. 49 BMium cf. zebrum 50 Cerithium egsnurn 51 Cetithium rostratum 52 Clypeomorus cf, bmvis 53 Ples~ottochus souverbianus 54 Rh~nocla~s sor~dula 55 Di~a app. 56 Fenella d . d/p/ax 57 Sty#farina c~ goniochlla 58 Obtorbo cf. pupoidas 59 Pol~'nides conicus 60 Hipponix conictls 61 Hipp~dx sp. 2 62 Natica sp. 1 jtN. 63 9uccinldae 9en. elsp. inde/. 1 64 4n~hi~ exllis 65 Euphca Ionida 86 Zafra Of. selasphora 67 Zafrona isome/la 68 Coratl~ph#a app. 69 Gfbbere/a spp, 70 ~lassarius cs delicatus 71 Nassar/uscs hameroessa 72 : 4ndlla sp, 73 J Ce~olur~s sp. 74 ! C}avus spp. 75 ~erithiopsldae 76 Triphoridae 77 EulimidBe 78, Chrysa#ida spp. 70 Odostornia spp. 80 PyramMella spp 61 Symo/a s.L spp 82 Funbonilla app. 83 Mys c'f. cyllnddca 84 i ~taminoea sp. 1 85 ! Hammoea sp, 2 86 ~u//a sp.juv. 87 ~arrd#oretusa ? SO. 88 Tomafiaa k~conspicua 69 rCatusa sp. 2 60 ~ingicula sp. 1 91 r?i~icula sp. 2 92 Tomatina sp. l-3 63 ~'/phonan~ s,p. 2 94 3a~/a sp. 95 Do/ysch/des sp. 96 ~ol~lacophora
Dim 1 Dim 2 Dim 3 Dim 4 Dim 5 Dim 6
-1.861 -1.659 0.631 6.862 -2.313 -3.176 0.302 -0.17 0.026 -0.642 0.041 -0.29 0:498 0.692 0.232 1.039 -0.047 0.176
0.47 0.548 6.179 0.701 0.023 0.165 0.549 0.946 0.34 1.632 -0.081 -0.224 0.355 -0 092 -6.046 -0.793 0.323 -0.19 0.367 -0.858 -3.806 0.544 0.193 -0.175 0.424 0.34I 0.142 0.326 0.007 -0.123
-1.045 -2.460 0.893 0.899 -6.567 -7.027 0.588 1.163 0.421 2-235 -0.56 1.330 0.539 0.904 0.324 1.567 -0.184 0.258 0.493 0.526 0.22 0.873 0,048 -0.142
-I.369 -2.007 0.709 0.836 0.121 0.184 0.306 -0.157 0.032 -0.576 -0.015 -0.685
-1.327 -2.107 0.722 0.669 -0.626 -0.706 "0.964 -2.528 0.913 0.863 -6.569 -7.055 0.354 -0.082 -0.032 -6.747 0.323 -0201 0.312 -(].079 0.025 -0.518 0.21 -0.229 0.515 0.731 0&~6 1.139 -6.113 0.299
-6.555 -1.763 0.589 0-243 -4.402 -3.140 0.428 -1.623 -6.980 1.449 0.072 -0.157 0.339 -0.164 "0.171 -0.774 0.213 -0.047 0.368 -6.03 -0.014 -0.645 0.332 -0.334
-3.163 0764 -0.198 0.075 0.583 0.101 -1.546 -2.153 0.796 0.99 -3.341 -4.215 0.415 -2+493 -10.696 2.789 -0.484 0+449
0.24 -0.241 -0A46 -0.574 0,~I -0.238 -2.196 -2.101 0.834 1.394 2.3.58 0.559 0.334 .0.167 -0.051 -0.679 0.268 -0.124
-3.906 3.003 -0.977 -0.916 -0.672 -0.171 -1.657 -1.972 0.75 1.172 1.492 0.036 -0.131 -0.768 0.101 -0.41 -0.491 6.727 "0.693 -1203 6.428 6.261 0.83 0.159 -3.439 1616 -0.578 -0.374 -0.199 -0.1 0.447 0.404 0.075 043 0.132 -0.06 0.274 -0.161 -0.031 -6.715 0.132 -0.223 0.145 -0.373 -0.014 -0.677 -0.547 1.045 0.172 -0.434 0.016 -0.724 -6.612 0.907
-0.146 -1.106 0.276 -0.518 -2.990 1.784 -3.661 2.386 -0.757 -0.628 -0,323 -0.093 0.341 0.052 -0.045 -0.65 0.39 -0.254
-1.053 -2.102 0.783 0.865 -2.917 -2.791 0.545 0.621 0.332 1.580 -0.105 -0.086
0.61 1.263 0.468 2.540 -0.673 1.606 -0 .~ i l -0.834 0.116 -0.486 -1.750 1.570 0.361 -0.159 -0.446 -0.6o~ 0A13 -0.297 0.485 0.605 0-266 0.815 0.077 -0.195 0.583 1.136 0.412 2.142 -6.413 0.805
0.56 0.996 0.362 1.826 -0.423 1.106 0.591 0.671 0.237 0.98 0.031 -6.152 0.073 -0.614 0.118 -0.574 -1.386 0.654 0.387 -0.625 -3.520 0.374 0.255 -0.2
0,5 0.668 0.24 1 002 -6.0EN 0.322 -3.729 2.820 -0.917 -0.679 -0.597 -0.16 0.254 -0.18 0.019 -0.35~ -0.351 0.464
-1.880 0.004 0.085 0.24 0.611 0.273 0.047 -0.587 0.149 -0.513 -1.363 2.t06
-2.450 0.357 -0.082 0.025 0.465 0.367 0.467 -2.585 -11.464 3.068 -0.174 0.042 0.396 0.483 0.308 1.110 -0.566 -6.373 0.593 1.193 0.434 2.286 -0.514 1.116
-0.417 0532 -0.469 -0101 0.16 -0.244 0.497 0.866 0.226 0.973 -0.006 0.Q01
-0.148 -1.062 0.249 -0.6 -3.766 3.044. 0.393 0.192 0.064 -0.1)69 0.125 -0.026 0.512 0.731 0.264 1 121 -0.007 -6.121 0.524 0 8 6.287 1.320 -0.159 0.394 0.475 0.547 0.182 0.69 0.079 -0.066
0.36 -0.053 -0.501 0.008 -6.0fl7 -0.01 0.369 0002 -6.014 -0.584 0.317 -0.223
-3.860 2.248 -0.714 -0.581 -0.253 -0.068 0.305 -0142 -0.007 -6.738 0.167 -0.149 0.454 0A62 0.159 0.5(~i 0149 -0.415 0.376 -6.1DI "0.578 -0.30 0~296 -0.203 0.382 0.307 0.178 0.419 -0.064 0.176 0545 0.921 0.331 t.606 -0.216 0.394
0.43 0.334 0.142 0.270 0.035 -0.103 0.255 -0.157 0.008 -0.642 -6.068 0.244 0,239 -0.316 0.012 -0.696 -0.512 0.533 0.346 -0,068 -0.115 -6.713 0.346 -0.222 0.184 -0421 -0.367 -0.386 0.033 0.082 0.007 -0.652 0.097 -0.554 -0.762 1.302
-0.815 -0.044 -0.943 -0.091 0.414 -0.116 0,134 0.051 -0.104 -0.761 6.256 -0.336
-1,486 0.862 -6.309 -0.496 0.146 -0.193 -0.027 -0.616 0.227 -6.468 -2~586 3,040 0.389 0.104 0.027 -6358 0.345 -0.346
-3.778 2.626 -0.846 -0.749 -6A53 -6.115 0.187 -0.342 -0.027 -6.642 -0.692 0.43 0.359 -0.075 -0.054 -0.796 0.386 -0.254
-0.896 -0.411 0.046 -0.515 -2.580 2.907 0.38 -0.001 -0.031 -0.611 0.351 -6.266
0.469 -2.612 -11.582 3.108 -0.181 0.046 0.356 -0097 -6.049 -0.844 6.421 -0.285
-3.9~3 3000 -0.976 -0.916 -0.669 -0.168 0.533 0.833 0.226 1.436 -0.072 -0.088
Diversity
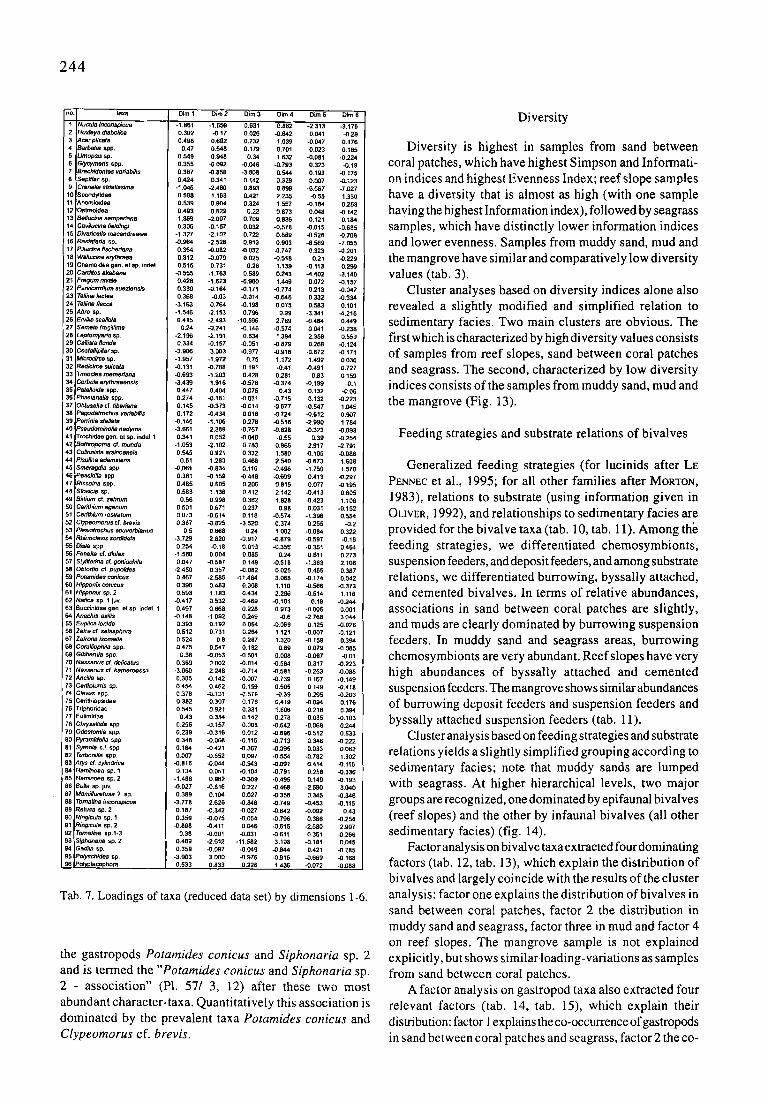
Diversity is highest in samples from sand between coral patches, which have highest Simpson and Informati- on indices and highest Evenness Index; reef slope samples have a diversity that is almost as high (with one sample having the highest Information index), followed by seagrass samples, which have distinctly lower information indices and lower evenness. Samples from muddy sand, mud and the mangrove have similar and comparatively low diversity values (tab. 3).
Cluster analyses based on diversity indices alone also revealed a slightly modified and simplified relation to sedimentary facies. Two main clusters are obvious. The first which is characterized by high diversity values consists of samples from reef slopes, sand between coral patches and seagrass. The second, characterized by low diversity indices consists of the samples from muddy sand, mud and the mangrove (Fig. 13).
Feeding strategies and substrate relations of bivalves
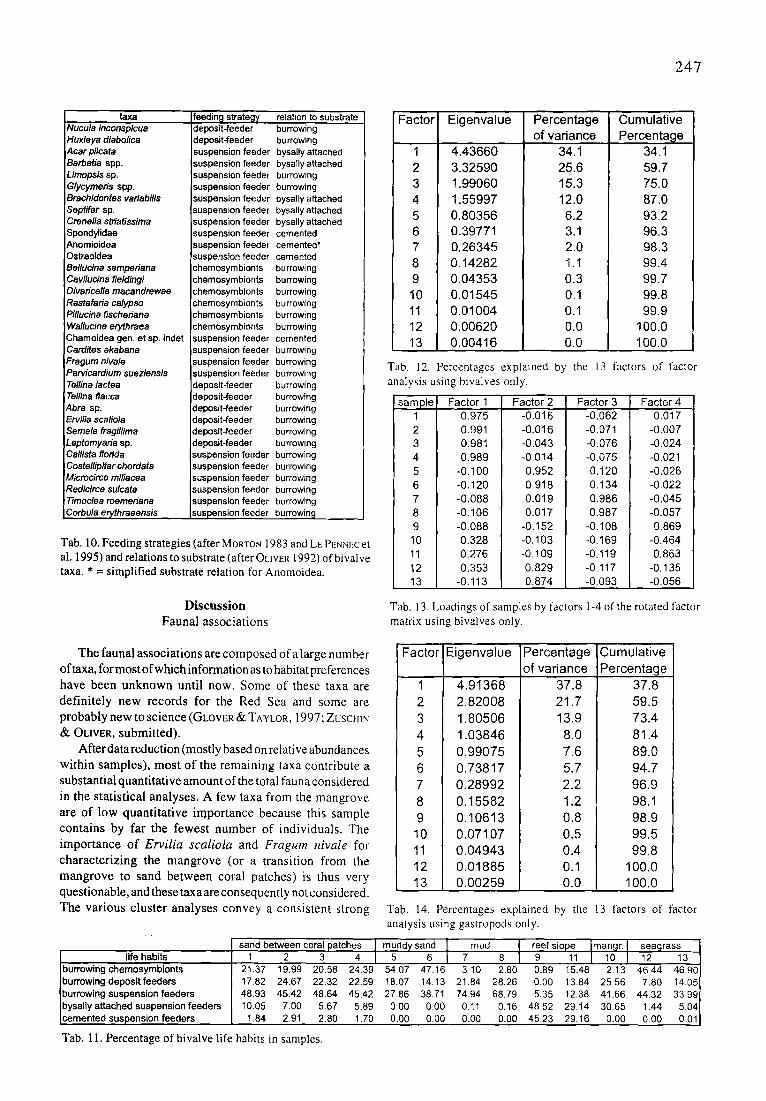
Generalized feeding strategies (for lucinids after LE PENNEC et al., 1995; for all other families after MORTON, 1983), relations to substrate (using information given in OLIVER, 1992), and relationships to sedimentary facies are provided for the bivalve taxa (tab. 10, tab. 11). Among th~ feeding strategies, we differentiated chemosymbionts, suspension feeders, and deposit feeders, and among substrate relations, we differentiated burrowing, byssally attached, and cemented bivalves. In terms of relative abundances, associations in sand between coral patches are slightly, and muds are clearly dominated by burrowing suspension feeders. In muddy sand and seagrass areas, burrowing chemosymbionts are very abundant. Reef slopes have very high abundances of byssally attached and cemented suspension feeders. The mangrove shows similar abundances of burrowing deposit feeders and suspension feeders and byssaily attached suspension feeders (tab. 11).
Cluster analysis based on feeding strategies and substrate relations yields a slightly simplified grouping according to sedimentary facies; note that muddy sands are lumped with seagrass. At higher hierarchical levels, two major groups are recognized, one dominated by epifaunal bivalves (reef slopes) and the other by infaunal bivalves (all other sedimentary facies) (fig. 14).
Factor analysis on bivalve taxa extracted four dominating factors (tab. 12, tab. 13), which explain the distribution of bivalves and largely coincide with the results of the cluster
Tab. 7. Loadings of taxa (reduced data set) by dimensions 1-6. analysis: factor one explains the distribution of bivalves in sand between coral patches, factor 2 the distribution in muddy sand and seagrass, factor three in mud and factor 4 on reef slopes. The mangrove sample is not explained
the gastropods Potamides conicus and Siphonaria sp. 2 explicitly, but shows similartoading-variations as samples and is termed the "Potamides conicus and Siphonaria sp. from sand between coral patches. 2 - association" (PI. 57/ 3, 12) after these two most A factor analysis on gastropod taxa also extracted four abundant character-taxa. Quantitatively this association is relevant factors (tab. 14, tab. 15), which explain their dominated by the prevalent taxa Potamides conicus and distribution:factor I explainstheco-occurrenceofgastropods Clypeomorus cf. brevis, in sand between coral patches and seagrass, factor 2 the co-

245
E
o
~ ~ " ~ .
" ~ E ~ ~ ~
.~| ~ g
.~.~ -
0 0
" ~ c o
occurrence in sand between coral patches and reef slopes, factor 3 the distribution of gastropods in muddy sand and factor 4 the distribution of gastropods in mud.
Fragmentation
Fragments are far more numerous than whole individuals, contributing more than 88% to the total mollusc remains of the investigated samples (tab. 16). Nevertheless differences in the sedimentary facies are evident: the number of fragments is highest in samples from sand between coral patches, sandy seagrass and the Porites dominated reef slope, and lowest in samples from mud and the mangrove; it is intermediate in samples from muddy sand, muddy sand with seagrass and theAcropora - Millepora dominated reef slope (tab. 16). The proportion of fragments is lowest in samples from mud and the mangrove and highest in samples from muddy sand and sandy seagrass. This ratio is rather intermediate in samples from sand between coral patches, the reef slope and muddy sand with seagrass (tab. 16).
~ ' ~ .
m c o c o
m r i,,i
' 0.- ~ 0.. eO ~ e . "~ .J-' .~. e ' ~
x~ o~ ~- . ~ _ _ ~ .~.w ~ , ~ - ~ x ~ o . ~
O ~ 0 ~ ' - -
_ , ~ ~ , 3 ~
ra ,,..: te ~1.
r u3 t o
• c
~ "~ 0
~ o E o E
m
0
.C
r ,~I ~ .M "0 "0
.~ .-=
m
5. ~ ~o
I ~ 0') U {D ::I:: rn N N ~ - n 0
Tab. 8. Taxa assemblages according to their factor loadings and positions to cluster centres. For special status of Cerithium rostratum, Bothropoma cf. munda, Phasianella spp., Ervilia scaliola and Fragum nivale refer to the discussion in the text. (m) = character taxa for muddy seagrass, (s) = character taxa for sandy seagrass. Bold taxa define assemblages.
246
number rata
1 Nucula inconspicua 2 Huxleya diaboltca 3 Acar plicata 4 BarbatJa app. 5 LJmopsis sp. 6 G/ycymans spp. 7 Brachidontes vadabilis 8 Septiler sp. 9 Crenella strlatJssima 10 Spondylidae 11 Anomioidea 12 Ostmoldea 13 Bellucina semperlena 14 Cavtluctna fieldingi 15 Divaricella macandmwae 16 Rastafaria sp. 17 PiUucJna fischer~ana 18 Wallucina eryfhraea 19 Chamoidea gen. at sp. inda! 20 Catdites akabana 21 Fragum nivale 22 Parvicard]um suatlensts 23 Te/lina leclea 24 Tetlina flacca 25 Abra sp. 26 Erv~a sca/io/a 27 Semele fragillima 28 Leptornyarle ap. 29 Callista florida 30 Coatetlipitar chordata 31 Microcirce sp. 32 Redlcirce sulcata 33 Timoclea toemerlana 34 Corbula erythraeensis 35 Patelloida spp. 36 Phaslenella spp. 37 Obtusella cf. ttber~ana 38 Pagodatrochus vadabtlls 39 Petrinia stellale 40 Pseudominolia nedyma 41 Trochidae gen. et sp. indet 1 42 Bothropome cf. munda 43 Collontsta arsinoensis 44 PisLdina adamsiana 45 Smaragdle spp. 46 Peaslella spp 47 Rissoina app. 48 Stos/cla sp. 49 Cerithium zebrum 50 Ceffthium egenum 51 Cer~hium rostratum 52 Clypeomorus cf. brevis 53 Plesletrochus souverbianus 54 Rhinoclav~s aordldula 55 Diala spp. 56 Fenella cf. dip/at 57 Styllferina cf. goniochile 58 Obtortio of. pupoides 59 Potamides conicus 60 Hipponix conicus 61 HIpponix sp. 2 62 Natica sp. 1 Juv. 63 Buccinidae gen. et sp. IndeL 1 64 Anachis exilis 65 Eup#ca ionida 66 Zafra cf. selesphom 67 Zafrona isomelia 68 CoralliophJla spp. 69 G/bben~a spp. 70 Nassarius c~. delicatus 71 Nassarius cf hameroessa 72 Anc//ta sp. 73 Cer/toturns sp. 74 Clevus app. 75 Cedthlopsidae 76 Tdphoddae 77 Eulimldae 78 Chtysadlida spp. 79 Odostomle spp. 80 Pyramidelle spp 81 Syrnole s.I. spp 82 Turbonilla app. 83 Ab/s cK cylinddca 84 Haminoea sp. 1 85 Haminoea ap. 2 86 Bulle sp. juv. 87 MamUloretusa ? sp. 88 Tomatina inconspicua 89 Retusa sp. 2 90 Ringicu/a sp. 1 91 PJngicula ap. 2 92 Tomatina ap.l-3 93 Siphonaria sp, 2 94 Gadila sp. 95 Polyschides sp. 96 Polyplacophora
total %
sand betweencoralpatches
1 2 3 4 0.00 0.00 0,00 0.00 0.62 2.07 1.52 1.70 0.67 0.18 0.42 0.06 1.18 0.71 0.31 0.24 0.00 0.00 0.00 0.00
11.72 10.42 11.77 11,75 0.12 0.27 0.16 0.24 2.56 2.47 2.51 2.85 0,0O 0.00 0.00 0.00 0,05 0.04 0.05 0.00 0.07 0.05 0.00 0.06 0.70 1.37 1.26 0.68 0.64 0.71 0.52 0.97 0.59 0.79 0.84 1.34 0.22 0 .0O 0.10 0.37 0.00 0.00 0.00 O.O0 3.00 3.35 4.29 4.36 5.19 5.48 6.5~, 7.03 0.00 0.05 0.37 0.24 0.10 0.09 0.58 0.12 0.00 0.00 0.05 0.00 7.68 9.01 10.25 9.27 5.39 7.20 9.10 8.18 0.00 0.00 0.00 0.00 0.00 0.00 0.00 0.00 0.00 0.00 0.00 0,00 2,04 3.49 2.77 3.15 0.00 0,00 0.00 0.00 1.51 2,52 5.70 3.64 0.O0 0.00 0,00 0.00 0.00 0.71 0.00 0.00 1.03 0.62 0.63 1.27 0,05 0.13 6.21 0.12 0.00 0.0O 0,00 0.00 1.26 1.54 0.68 0.91 1.38 0.35 0.47 0.18 1.38 2.56 1 A6 0.79 1.40 1.46 1.78 1.33 0.00 0.00 0.00 0.24 0.00 0.00 6,00 0.00 1.43 0.49 0.05 0.18 O.00 0.04 0.00 0.0O 0.00 0.04 O .00 0.06 0.00 0.00 0.00 0.00 0.89 0.79 0.94 0.4B 1.01 0.35 0.73 0.55 7.31 5.69 3.87 3.88 0.00 0.00 0.00 0.00 0.02 0.09 0.10 0.06 0.27 0.49 0.05 0.55 0.59 0.18 0,00 0.24 1.21 0.18 0.47 0.42 0.30 0.97 0.26 0.36 0.00 0.18 0,00 0.00 7.21 8.03 5.28 5.63 1.80 0.00 0.42 0.00 0.20 0.35 0.05 0.00 0,20 0.00 0.21 0.00 0.02 0.00 0.00 0.00 0.34 0.26 0.26 1.15 0.00 0.00 0.00 0.00 0.71 0.O0 0.21 0.00 0.39 0.00 0.63 0.24 0.02 0.26 0.10 0.06 2.68 1.24 0.37 1.39 0.00 0.40 0.10 0.00 0.39 0.79 0.05 0.85 0.64 0.31 0.10 0.67 1.99 1.28 0.42 1.51 2.98 3.00 1.36 1.58 0.00 0,00 0.00 0.00 0.22 0.44 1.31 0.36 2.58 1.46 0.47 1.94 0.47 0.09 0.68 0.12 0.22 0.71 0.47 0.12 0.32 0.44 0.37 0.73 0.22 0.53 0.47 0.73 1.28 0.84 1.10 1.21 0,47 1.02 1.20 0.91 1,38 0.26 0.84 0.24 0.47 0.26 0.84 1.03 0.42 0.62 0.89 1.51 0.25 0.04 0.26 0.06 0.30 1.59 1.31 1.03 0.96 0,18 0.47 0.18 0.00 0.04 0.10 0.00 0.89 1.10 1.36 0.79 0.00 0.00 0.00 0.0O 0.39 1.46 1.10 1.45 2.34 1 A6 1.78 1.82 0.20 0.00 0.00 0.0O 1.85 2.16 2.30 2.42 0.00 0.00 0.00 0.00 1.48 2.12 2.14 2.06 O.00 0.00 0.00 0.00 0.12 0.13 0.10 0.30
100.00 100.00 100,00 100.00
reef slope seagmss mangrove muddy sand mud
9 11 12 13 10 5 6 7 8 0.00 9.00 0.00 3.08 0.00 0.89 0.67 0.45 0.58 0.00 0.35 0.66 1.38 O.00 0.00 0.19 0.00 0.00 2.77 1.30 0.00 0.00 0.0O 0.00 0.00 0.00 0.00 3.21 1.26 0.02 0.00 0.00 6.00 0.00 0.00 0.00 0.91 1.82 0.00 0.00 0.00 0.00 0.00 0.00 0.00 0.00 0.74 2.59 0.19 0.20 6.00 0.00 0.00 0.00 0.00 0.04 0.00 0.00 6.44 0.00 0.00 0.04 0.00 6.35 4.34 0.47 1.81 0.00 0 . O 0 0.00 0.00 0.90 0.00 0.00 0.00 2.08 0.00 0.00 0,00 O.O0 0.04 4.35 0.13 0.00 0.0( 0.00 0 . 0 O 0.00 0.00 0.00 1.15 0.61 0.00 0.01 0.00 0~00 0.00 0.00 0.90 4.27 5.65 0.00 0.00 0.00 0.00 0.00 O . 0 0 0.00 0.00 0.13 19.66 22.44! 0.20 34.36 31.91 0.99 0.75 0.00 0,26 0.03 1.49; O.00 0.00 0.00 0.00 0,00 0.00 0.00 1,90 8.86 0.20 8,30 5.79 0.08 0.04 0.00 0.00 0.00 1.22 6.00 0,00 0.00 0;00 0.00 0.00 0.56 0 . 8 7 0.90 0.05 0.25 0.00 0.00 0.00 0.23 2.74 2,22 2.13 0.00 1,90 0.48 0.00 0.00 1.72 0,56 0.00 0.00 0.00 0.00 0.00 0,00 0.00 0.00 0.04 2.30 16.95 0,00 0.00 0.29 0.00 0,00 0.00 0.00 0,00 0.00 1.19 0.00 0.00 0.00 0.00 0.00 0.30 4.74 0.17 7.16 0.13 0,00 0.04 0.00 0,00 2.43 0.40 1.16 0,00 0.27 0.00 0.00 0,00 0.00 0.00 O .00 O.00 0.0(3 3.80 1.83 5.95 5,95 0.00 0.00 0.00 2.55 0.00 0.89 0.10 0,15 0.13 0.00 0.09 0.03 0,00 2.19 0.00 0.00 0.00 0.00 0.00 0,52 1.54 2.65 3.18 1.52 0.00 0.19 0.22 0.00 0,60 0.00 0.00 0.00 7.61 8.65 0.72 1.20 0.00 0.00 1.41 0.01 0.20 0.13 0.10 0.04 0.04 0,00 0 .0O 0.00 0.00 0.00 0.00 0.00 3.83 3.51 0,11 0.00 0.39 6.38 0.00 18.89 25.28 3.71 2.97 0.00 0.00 3.37 1.69 0.00 0.40 2.51 0.00 0.00 0,00 9.04 0.17 0.21 0.00 1.14 0.87 0.00 0.00 0.34 0,00 0.00 0.58 0.00 2.41 2.31 18.01 13.14 2.83 2.26 0.01 0.00 0.80 0.00 0.10 0.00 0.09 0.00 0.00 0.26 0.41 0.00 0.13 0.00 0.00 0.00 0.0O 0.17 5.85 0,00 0.80 0.25 0.58 0.15 0.40 0.00 0.04 5.23 0.71 0A0 0.25 0.38 0.00 0.00 0.00 0.00 1.20 0,77 0.00 0.00 0.00 0.00 0.00 0.00 0.04 0.00 0.00 0,00 1,14 0.97 13.19 13.00 0.00 0.17 0.00 0.00 0.O0 0.00 O .00 0.04 0.04 0.00 0.04 0.29 3.22 0.00 0,51 0.67 0.00 O.00 1.02 1.35 O .00 0.00 0.00 O.0O 0.60 0.00 0.00 2.49 0,00 0.00 0.00 0.00 0.00 0.00 0.00 9.00 0.00 0.13 8.42 3,40 0.80 0.89 0.48 0.00 0,00 0.00 0.00 0.00 0.(30 1.39 0.00 0.00 0.00 O.00
17.00 28.01 0.00 0.00 O.O0 O . 0 0 0.00 0.00 0.09 1.36 0.30 0.00 0.00 0.00 0.00 0.00 0.00 0.00 2.49 0.09 0.00 0,00 0.00 0.00 0.00 0.00 0.00 1.59 2,30 0.00 0.00 0.00 6.00 0.00 0.09 0.00 0.00 0.00 1.20 1,07 0.00 0.00 0.00 0.00 0.00 0.00 0.00 0.00 0.00 15.12 0.00 0.00 0.00 0.00 4.19 1.35 9.02 0.00 0.00 0.00 0.00 0.00 0.00 0.00 0.00 0.00 0.00 0.00 0.38 0.00 18.16 17,04 2.61 4.04 15.71 3.98 3.38 0.51 1.73 0.00 0.64 0.11 0.96 1,17 0.03 0.00 5.32 7.69 6.48 10,47 0.00 0.09 1.71 0.00 0.00 0.25 0.00 0.00 0.00 0.00 0.04 0.52 0.00 0.00 2.66 2.60 3.83 6.35 0.00 0.00 0.00 0.00 38,17 0.0O 0.O0 0.00 0.0O 4.20 3.43 0.44 3.93 0.00 0.00 0.00 0.00 0.04 2.72 0.30 0.00 0.00 O.00 0.00 0.00 0 .0O 0.00 0,11 0.26 0.00 0.01 0.80 0.25 0.00 0.80 1.11 2.04 1.48 0.00 0.01 0.O0 0 . 0 O 0.00 0.00 0.00 0.00 0.00 4.13 0.87 0,00 0,00 0.19 0.00 0,00 1.13 1.61 0.78 0.00 0.O0 0.00 0.00 0.00 0.00 0.91 1.30 0.00 0.00 0,(30 0.00 0.00 O .00 0.00 7,37 2.39 0.00 0.00 0.00 0.00 0.00 0.00 0.00 1.48 1.39 0.00 0.0O 0.00 0 .O0 0.00 0.00 0.00 0,57 1.48 1.33 0.69 6,37 0.00 0.00 0.00 0.00 0.00 0.82 0.30 0.13 0.00 0.00 0.00 0,00 0.00 0.00 0.00 0.00 0.00 0.00 0.38 0.19 2.92 2.13 0.00 0.13 0.33 0,14 0.00 0.13 0.00 0.00 0.04 0,79 6,73 0.00 0.52 0.00 0.00 0.00 0.00 0.00 0,23 0.04 0.02 0.02 1.19 0.00 0.00 0.00 0.00 1.25 0,78 0.39 0.17 0.8,0 0.25 0.00 0.00 0.00
12.58 4.95 0.00 0.00 0.00 0.00 0.00 0.00 0,00 0.45 1,35 0.39 0.01 0.00 0.00 0.00 0.00 0.00 0.O0 0.30 1,57 0.17 0.00 0.00 0.19 0.08 0.18 0.00 0.17 2.34 0.69 0.20 0 . O 0 0.00 0.00 0.04 0.00 0.09 0,14 0.01 0.22 0.00 0.00 0.00 0.0O 0.00 0,17 0.79 0.35 1,99 0.51 0.38 0.00 0,00 0.11 0,13 4.55 0.35 0.20 0.76 0,77 0.11 0.22 0.00 0.04 0.03 0.02 1.39 0 . 5 1 0.29 0.64 0.80 0.00 0.09 0 . 0 2 0.35 0.20 0.00 0.00 0.72 0.89 0.00 0.22 0.02 0.04 0.00 0.63 0.77 5.12 4.53 0.11 0.00 1.17 0.17 0.00 0.00 0.00 0 .0O 0.00 0.00 0.96 0.00 0.00 0.00 0.13 0.00 9.00 0.OO 0.00 0.00 0.00 0.00 0.O0 0.51 �9 0.38 8.98 9.54 0.00 0.13 1,95 0.17 0.60 0.25 0.67 0.04 0.04 0.00 0.09 0.16 0.00 0.00 0.00 0.00 0.00 0.00 0.00 0.00 3 . 6 4 0.52 0.00 0.38 0.00 1.25 1.29 0.23 0,69 0.13 0.00 0.20 0.00 0.00 0.00 0.00 0.00 0.00 0.00 0.00 4.18 0.00 0.00 0.00 0,00 0.00 O .00 0,00 0.00 0.00 0.13 0.00 0.00 0,00 0.00 0.06 0,00 0.00 0.00 0.00 0.00 3.30 3.20 2.61 3.26 0.00 0.00 0.60 0.00 0.00 0.00 0,00
100.00 100.00 100.00 100.00 100.00 100.00 100.00 100.00 100.00
E
~3
O
e=
o~ .d [.--
247
taxa Nucula inconspicua Huxleya dlabolica Acar plicata Barbatia spp. Limopsis sp. Glycymeris spp. Brachidontes variabilis Septffer sp. Crenella striatissima Spondytidae Anomioidea Ostreotdea Belluc/na semperiana Cavilucina fieldingi Divaricella macandrewae Rastafada calypso Pillucina fischeriana Wa//ucina erythraea Chamoidea gen. et sp. indet Cardites akabana Fragum niva/e Parvicardium sueziensis Te/lina /actea Tellina flacca Abra sp. Ervi/ia scalio/a Semele fragi/lima Leptomyada sp. Ca/lista florida Costa/lip/tar chordata Microcirce miliacea Redicirce sulcata Timoclea roemeriana Corbula er~hraeensis
reedin~l strates deposit-feeder deposit-feeder suspension feeder suspension feeder suspension feeder suspension feeder suspension feeder suspension feeder suspension feeder suspension feeder suspension feeder suspension feeder chemosymbionts chemosymbionts chemosymbionts chemosymbionts chemosymbionts chemosymNonts suspension feeder suspension feeder suspension feeder suspension feeder :leposit-feeder deposit=feeder deposit-feeder deposit-feeder deposit-feeder deposit-feeder suspension feeder suspension feeder suspension feeder suspension feeder suspension feeder suspension feeder
relation to substrate burrowing burrowing bysally attached bysally attached burrowing burrowing bysally attached bysally attached bysally attached cemented cemented* cemented burrowing burrowing burrowing burrowing burrowing burrowing cemented burrowing burrowing burrowing burrowing burrowing burrowing burrowing burrowing burrowing burrowing burrowing burrowing burrowing burrowing burrowing
Tab. l 0. Feeding strategies (after MORTON 1983 and LE PENNEC et al. 1995) and relations to substrate (after OLIVER 1992) of bivalve taxa. * = simplified substrate relation for Anomoidea.
Discussion Faunal associations
Factor Eigenvalue Percentage Cumulative of variance Percenta~le
1 4.43660
2 3.32590 3 t .99060 4 1.55997 5 0.80356 6 0.39771 7 0.26345 8 0.14282 9 0.04353
10 0.01545 11 0.01004 12 0.00620 13 O.00416
34.1 25.6 15.3 12.0 6.2 3,1 2.0 1.1
0,3 0.1 0.1 0.0 0.0
34.1
59.7 75.0 87.0 93.2 96.3 98.3 99.4 99.7 99.8 99.9
100.0 100.0
Tab, 12. Percentages explained by the 13 factors of factor analysis using bivalves only.
sample 1 0,975 2 0.991 3 0.981 4 0.989 5 -0.100 6 -0.120 7 -0.088 8 -0.106 9 -0,088 10 0.328 11 0.276 12 0,353 13 -0.113
Factor 1 Factor 2 Factor 3 Factor 4 -0.016 -0.016 -0.043 -0.014 0.952 0,918 0.019 0.017
-0.152 -0.103 -0.109 0.829 0.874
-0.062 -0.971 -0.076 -0.075 Q120 0.134 0.986 0.987
-0.108 -0.169 -0.1t9 -0.117 -0.093
0.017 -0,007 -0.024 -0.021 -0.026 -0.022 -0.045 -0.057 0.869
-0.464 0.863
-0.135 -0.056
Tab. 13. Loadings of samples by factors 1-4 of the rotated factor matrix using bivalves only.
The faunal associations are composed of a large n umber oftaxa, for most of which information as to habitat preferences have been unknown until now. Some of these taxa are definitely new records for the Red Sea and some are probably new to science (GLOVER &: TAYLOR, 1997; ZUSCHIN & OLIVER, submitted).
After data reduction (mostly based on relative abundances within samples), most of the remaining taxa contribute a substantial quantitative amount of the total fauna considered in the statistical analyses. A few taxa from the mangrove are of low quantitative importance because this sample contains by far the fewest number of individuals. The importance of Ervilia scaliola and Fragum nivale for characterizing the mangrove (or a transition from the mangrove to sand between coral patches) is thus very questionable, and these taxa are consequently not considered. The various cluster analyses convey a consistent strong
sand between coral patches life habits 1 2 3 4
burrowing chemosymbionts burrowing deposit feeders burrowing suspension feeders bysally attached suspension feeders cemented suspension feeders
Factor Eigenvalue
1 4.91368
2 2.82008
3 1.80506
4 1.03846
5 0.99075
6 0.73817
7 0.28992
8 0.15582
9 0.10613
10 0,07107 11 0.04943
12 0.01885
13 0.O0259
Percentage
of variance
37.8 21.7 13.9
8.0 7.6 5.7 2.2 1.2 0.8 0.5 0.4 0.1
0.0
Cumulat ive
Percentage
37.8
59.5
73.4
81.4
89.0
94.7
96.9
98.1
98.9
99.5
99.8
100.0 100.0
Tab. 14. Percentages explained by the analysis using gastropods only.
muddy sand mud 5 6 7 8
21.37 19.99 20.58 24.39 54.07 47.16 3.10 2.80 17.82 24.67 22.32 22.59 t8,07 14.13 2184 28,26 48.93 45,42 48.64 45.42 27.86 38.71 74,94 68.79 10.05 7.00 5.67 5.89 0.00 0.00 0.11 0,16 1.84 2.91 2.80 1,70 0,00 0.00 0.00 0.00
13 factors of factor
reef s lope9 11 malo~r. I seagrass12 13 ~
0.89 15,48 2,13 46.44 46,90 0.00 13.84 25.56 7,80 14,05 5.35 12.38 41.66 44.32 33,99
48.52 29.14 30,65 1.44 5.04 45.23 29.16 0 .00 0.00 0.01
Tab. 11. Percentage of bivalve life habits in samples.
248
sample 1 0.615 2 0.753 3 0.761 4 0.741 5 0.001 6 0.112 7 -0.142 8 -0.149 9 -0.104 10 -0.049 11 0.062 12 0.898 13 0.705
Factor1 Factor2 Factor3 Factor4 0.701 0.602 0.534 0.590
-0.064 0.000
-0.117 -0.108 0.856
-0.069 0.938
-0.096 -0.157
0.092 -0.048 0.004
-0.072 0.972 0.977 0.271 0.436
-0.086 0.088
-0.025 0.118 0.015
-0.002 0.019
-0.011 -0.027 0.164 0.081 0.919 0.862
-0,039 -0.346 0.021
-0.038 -0.076
Tab. 15. Loadings of samples by factors 1-4 of the rotated factor matrix using gastropods only.
dependence of associations on sedimentary facies and slightly varying relations between associations: The seagrass associations mark a transition from sand between coral patches to muddy sand as far as absolute frequencies of taxa are concerned. They are closely related to muddy sand associations with respect to bivalve life habits, but show similar high individual numbers, numbers of taxa and diversity indices as associations from sand between coral patches and reef slopes. The mangrove association in contrast is related to associations in sand between coral patches with respect to taxonomic composition and bivalve life habits, but shows similar low individual numbers, numbers of taxa and diversity indices as the muddy sand and mud associations.
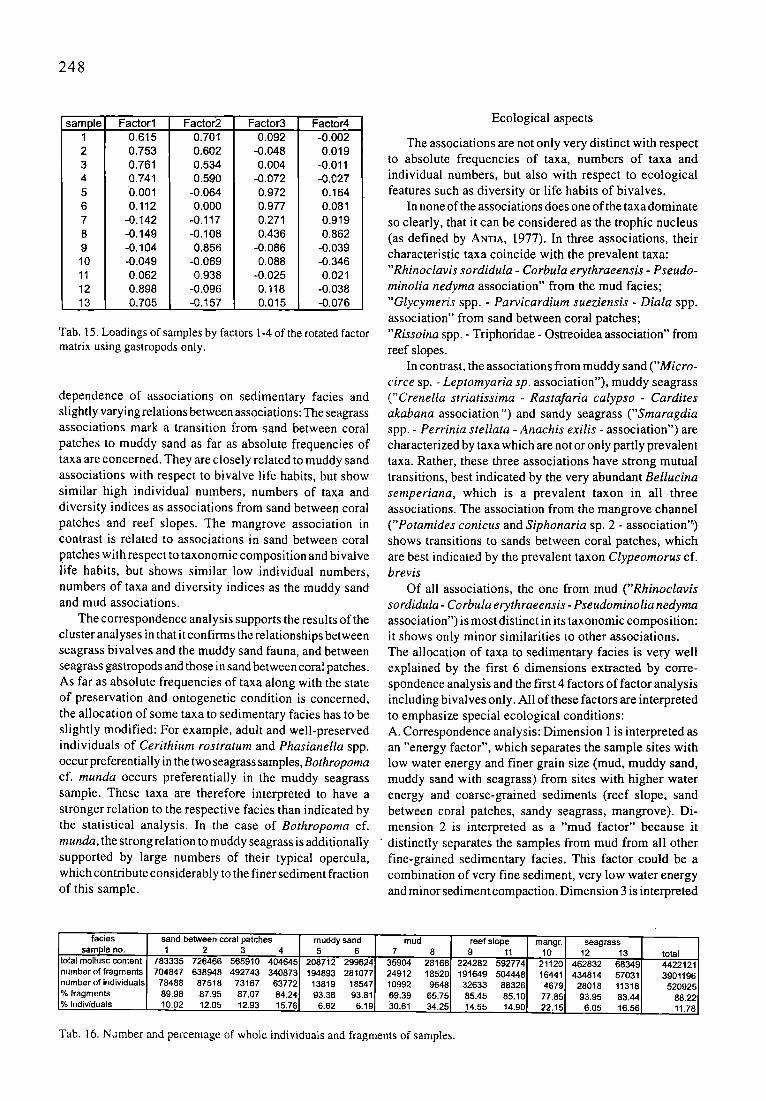
The correspondence analysis supports the results of the cluster analyses in that it confirms the relationships between seagrass bivalves and the muddy sand fauna, and between seagrass gastropods and those in sand between coral patches. As far as absolute frequencies of taxa along with the state of preservation and ontogenetic condition is concerned, the allocation of some taxa to sedimentary facies has to be slightly modified: For example, adult and well-preserved individuals of Cerithium rostratum and Phasianella spp. occur preferentially in the two seagrass samples, Bothropoma cf. munda occurs preferentially in the muddy seagrass sample. These taxa are therefore interpreted to have a stronger relation to the respective facies than indicated by the statistical analysis. In the case of Bothropoma cf. munda, the strong relation to muddy seagrass is additionally supported by large numbers of their typical opercula, which contribute considerably to the finer sediment fraction of this sample.
Ecological aspects
The associations are not only very distinct with respect to absolute frequencies of taxa, numbers of taxa and individual numbers, but also with respect to ecological features such as diversity or life habits of bivalves.
In none of the associations does one of the taxa dominate so clearly, that it can be considered as the trophic nucleus (as defined by ArrrIA, 1977). In three associations, their characteristic taxa coincide with the prevalent taxa: "Rhinoclavis sordidula - Corbula erythraeensis - Pseudo- minolia nedyma association" from the mud facies; "Glycymeris spp. - Parvicardiurn sueziensis - Diata spp. association" from sand between coral patches; "Rissoina spp. - Triphoridae - Ostreoidea association" from reef slopes.
In contrast, the associations from muddy sand ("Micro- circe sp. - Leptomyaria sp. association"), muddy seagrass ("Crenella striatissima - Rastafaria calypso - Cardites akabana association ") and sandy seagrass ("Smaragdia spp. - Perrinia stellata - Anachis exilis - association") are characterized by taxa which are not or only partly prevalent taxa. Rather, these three associations have strong mutual transitions, best indicated by the very abundant Bellucina semperiana, which is a prevalent taxon in all three associations. The association from the mangrove channel ("Potamides conicus and Siphonaria sp. 2 - association'") shows transitions to sands between coral patches, which are best indicated by the prevalent taxon Clypeomorus cf. brevis
Of all associations, the one from mud ("Rhinoclavis sordidula - Corbula erythraeensis - Pseudominolia nedyma association") is most distinct in its taxonomic composition: it shows only minor similarities to other associations. The allocation of taxa to sedimentary facies is very well explained by the first 6 dimensions extracted by corre- spondence analysis and the first 4 factors of factor analysis including bivalves only. All of these factors are interpreted to emphasize special ecological conditions: A. Correspondence analysis: Dimension 1 is interpreted as an "energy factor", which separates the sample sites with low water energy and finer grain size (mud, muddy sand, muddy sand with seagrass) from sites with higher water energy and coarse-grained sediments (reef slope, sand between coral patches, sandy seagrass, mangrove). Di- mension 2 is interpreted as a "mud factor" because it
" distinctly separates the samples from mud from all other fine-grained sedimentary facies. This factor could be a combination of very fine sediment, very low water energy and minor sediment compaction. Dimension 3 is interpreted
facies sand between coral patches muddy sand sample no. 1 2 3 4 5 6
total mollusccontent 783335 726466 565910 404645 208712 299624 nurnberoffragments 704847 638948 492743 340873 194893 281077 number of individuals 78488 87518 73167 63772 13819 18547 % fragments 89.98 87 .95 87 .07 84.24 93 .38 93.81 % individuals 10.02 12 .05 12 .93 15.7E 6,62 6.19
mud reef slope mangr, seagrass 7 8 9 11 10 12 13 total
35904 28168 224282 592774 21120 462832 6 8 3 4 9 4422121 24912 18520 191649 504448 16441 434814 5 7 0 3 1 3901196 10992 9648 32633 88326 4 6 7 9 28018 1 1 3 1 8 520925 69.39 65 .75 85 .45 85 .10 77 .85 93 .95 83.44 88.22 30.61 3 4 . 2 5 14 .55 14.90 22.15 6.05 16.5E 11.78
Tab. 16. Number and percentage of whole individuals and fragments of samples.

249
as a "mangrove factor" because it separates the mangrove channel from all other sedimentary facies. This factor might be a combination of extreme environmental conditions (e.g., strong variations in temperature and salinity) and a high supply of particulate organic matter provided by the mangrove plants. Dimension 4 is difficult to interpret with regard to samples; considering taxa also, dimension 4 can be interpreted as an "environment factor of reef slopes and the mangrove": taxa showing significant loadings have strong restrictions to these sedimentary facies, are very well suited to characterize it (especially in contrast to the association from sand between coral patches) and are thereforeinterpretedtoemphasizeits environmentconditions. Dimension 5 is interpreted as a "seagrass factor", because it separates this sedimentary facies from all others. The occurrence of taxa showing high loadings is primarily dependent on the occurrence of seagrass. In contrast, dimension 6 is interpreted as a "discriminating factor within seagrass", because it separates sandy seagrass and muddy seagrass. The'reasons for this might be differences in water energy, grain size, seagrass density or taxonomic seagrass composition at the two sites.
B. Factor analysis on bivalve samples: Factor one of the factor analysis based on bivalves correlates with the large amount of burrowing suspension feeders in sand between coral patches. This factor is therefore interpreted to summarize substrate preferences for coarse-grained sediments and sufficient suspension load in the water column. Factor 2 correlates with the dominance of in fam~al chemosymbionts and deposit-feeders in muddy sands and seagrass and is interpreted to reflect a substrate preference for strongly compacted soft bottoms with high organic enrichment. Factor 3 correlates with the dominance of infaunal suspension-feeders in mud and probably summarizes the substrate preference for very poorly compacted soft bottoms and for a nutrient rich water column. Factor 4 correlates with the dominance o f epifaunal (byssate and cemented) suspension feeders on reef slopes and is interpreted to reflect primarily the preference for hard substrates but also for sufficient food supply in the water column.
Overall, bivalve life habits show a strong dependence on sedimentary facies, which can be attributed to strong correlation between substrates and feeding strategies. In contrast a generalization of feeding strategies and even substrate relations cannot be done for gastropods because only limited information is available on the ecology (e.g., TAYLOr: &REtD, 1984) of many taxa. This is especially true for most microgastropods and particularly for the abun- dant opisthobranchs (KoHN, 1983). Even for seemingly well known groups like trochids, a generalization is very questionable: most authors consider them to be algal grazers, but there is strong evidence that at least some trochids feed as grazing predators on hydroids and other sessile invertebrates (e.g., PERRON, 1975) and the members of the subfamily Umboniinae, like Pseudomi~tolia rwdyma, are known for their suspension-feeding mode of life (e.g. FRErrER, 1975; HtCKMAN, 1985).
For some important gastropod taxa, however, information on feeding strategies can be provided: On reef slopes, triphorids, which are parasitic on sponges (Marshall 1983), and rissoids, which feed on algal-filaments and diatoms (PONDER, 1985), are very important. In sand between coral patches, the dialids, closely related to cerithiids, are most likely algal-detritus feeders, as are the abundant Smaragdia spp. in seagrass (KAY, 1979). In the mangrove, Potamides conicus probably feeds on particulate organic matter (Bosch et al., 1995) provided by the mangrove plants. In mud, the very abundant Rhinoclavis sordidula are well known algal- detritus feeders (HouBRtC~, 1978).
All in all, the gastropod life habits tend to show a facies-dependent distribution; because gastropods are predominantly vagile, this dependence probably reflects feeding strategies more than substrate relations.
Taphonomic and palaeoecologieal aspects
We believe that the associations (death assemblages) are produced by the local fauna because they correlate so strongly with sedilnentary facies, and because there is no sedimentological evidence for considerable transport that would produce allochthonous assemblages (compare also NEBELSlCK, 1992b). Moreover, the ecological properties of the associations match so well with the sedimentary facies, that the species distributions are very unlikely a consequence of the behavior of shetls as sedimentary particles. We have no data on the time-scale (sensu FORSICH & ABERHAN, 1990) oi" significance (sensu KOWALEWSKt, 1996) of time- averaging of the death assemblages. They may be simple parautochthonous assemblages (sensu KLDWELL et al., 1986) o{'a few cr eeneratlons, which probably would yield a more accurate picture of the whole benthic molluscan community than one-time observations of the life assemblages (e.g., EKDALE, 1977; CAWrHEw & BOSENCE, 1986), because of the short-term fluctuations and patchy distributions characteristic of life benthic communities (McCALL & TEVESZ, 1983). Or it may also be a multi-habitat time averaged assemblage (sensu KIDWELL & BOSENCE, 1991 ) from ecologically distinct communities. Considering also data of NEBELSICK' S (1992b) investigation on echinoids in the Northern Bay of Safaga, insignificant shor t - term t ime-averag ing seems to predominate: live and dead faunal elements show good correspondence and the taphonomic signatures of the fragments he investigated show only minor differences. Interpreting these data, the studied molluscan assemblages could reflect the original biocoenosis quite well. Unfortunately echinoids have comparitively fragile skeletons and are therefore certainly less prone to time-averaging than molluscs (KOWALEWSKI, 1997), for which long-term and significant time-averaging seems to be a universal occurrence (FLESSA ,1993: KtDWELL, 1993: FLESSA & KOWALEWSK1, 1994; MELDAHI_ et al., 1997).
However, due to time-averaging of the accumulating death assemblage (C.aRrHEW & BOSENC~/, 1986), the origi- nal diversity of the preservable fauna tends to be overestimated

250
(e.g., ANTra, 1977; STAFF et al., 1986), particularly in environmentally variable habitats (S'rA~F & POWELL, 1988). The sampled upper tens of centimeters of the sedimentary column is the taphonomically active zone, where most taphonomic processes (dissolution, fragmentation, disarticulation) take place and which contains the significantly or insignificantly, short-term or long-term, time-averaged parautochthonous death assamblage (FORsICH, 1978; POWELL et al., 1989; FORSICI-I & ABERHAN, 1990; KIDWELL t~ BOSENCE, 1991; FLESSA & KOWALEWSKr, 1994; KOWALEWSKI, 1996). Therefore the studied faunas are not considered to be the potential fossil assemblage, but rather associations where taphonomic disintegration is still ongoing. The number of fragments for example is much higher than the number of whole individuals, and different abundances in the various sedimentary environments were recognized. Our sampling method and post-collection transport (FLESSA et al., 1992) surely contributed to the high numbers of fragments. However, because the samples from mud, with the highest proportion of fragile specimens, have by far the lowest proportion of fragments, we are confident that postcollection effects are minor. The different abundances of fragments point to different taphonomic processes or at least to differences in the effectiveness of taphonomic processes in the studied environments, which thus affect the absolute frequencies of faunal composition. Shell breakage is well known from high-energy environments (for a review see KmWELL & BOSENCE, 1991), but is also extremely common in low-energy habitats (POWELL et al., 1989) like the studied ones and occurs either at death, by predation, or after death when dissolution, abrasion, and transportation take their toll (PoWELL 8Z DAVIES, 1990). Some authors suggest that biogenic interactions (e.g., predation) considerably contribute to breakage (e.g., TREWtY & WELSH, 1976; VERMEO, 1983; MELDAHL • FLESSA, 1990; CADfZE, 1994). However, to reduce taphonomic losses like frag- mentation, the studied fauna must be buried in the zone of accumulation, which contains a rather stable death assemblage (the long-term death assemblage sensu POWELL et al., 1989), perhaps a potential fossil assemblage.
The present study emphasizes the importance of micromolluscs for facies analyses of modem sediments. Other studies have shown that most shells in modern environments are generally neither large (e.g., SALAZAR- JIMENEZ et al., 1982) nor adult (e.g., CUMMINS et al., 1986). Moreover, small but numerically abundant species seem to be the (palaeo)persistent part of communities (PoWELL & STArCrON, 1995). Generally the preservation potential of molluscs is high, but due to size-selective taphonomic disintegration larger size classes and adults tend to be preserved preferentially in the death assemblage (CUMMINS et al., 1986; POWELL et al., 1992). The potential fossil assemblage thus should contain proportionally more large individuals than the short-term death assemblage studied here. These larger individuals preserve most of a community's biomass and palaeoproduction and are therefore of special palaeoecologieal interest (POWELL 8~ STANTON, 1985; 1996). Studies providing data on dissolution rates, shell ages and processes responsible for shell preservation in modern
marine environments are rare: Some authors suggest that dissolution rates are usually high enough that nothing would be preserved in most habitats (ALLER, 1982; POWELL et al., 1989) and that physical reworking is usually necessary for shell net accumulation (DAVIES et al., 1989b). Others emphasize the great age of many shells at or near the surface (FLESSA & KOWALEWSKI, 1994; FLESSA et al., 1993) and the role of biogenic reworking for shell burial (MELDAHL, 1987; MVRICK & FLESSA, 1996). However, at least the number of species seems to be well preserved, because some individuals of nearly all preservable taxa are usually present in death assemblages of modern marine environments (e.g., WARME, 1969; STAFF et al., 1986), commonly even in correct rank order (review see KmWELL & FLESSA, 1995)
Studies comparing modern marine molluscan assemb- lages with their neighbouring Pleistocene counterparts are also rare. Generally coral reef faunas in uplifted Pleistocene terraces along the Red Sea coast tend to be diagenetically reduced in numbers compared to modern sediments from the same area. The reduction of biota is due to the widespread vadose diagenetic environments in the Pleistocene sediments and is especially expressed for aragonitic molluscs (Dullo, 1983; 1984; 1990). The faunal reduction increases with age of the Pleistocene terraces and only thick-shelled Tridacna and Strombus shells are well preserved, whereas smaller shells are not recorded (Dullo, 1984). The diagenetic environment seems to govern shell preservation as the latter is very good (even primary colouration of molluscs is preserved) in uplifted terraces with slightly different climatic factors and geological settings along the Red Sea coast (Dullo, 1984). A comparison of Pleistocene and modern marine molluscan assemblages from coral reefs of the Kenya coast reveals significant faunal differences: surprisingly modern molluscan assemblages show a considerably lower species diversity, which is directly attributed to a marked reduction in habitat diversity due to sea-level changes since the late Pleistocene;' the total species list, however, has been little altered (Crame, 1986). A good correspondence regarding numbers of taxa of modem and Pleistocene molluscs is also reported from the California coast, where living species not found as fossils are also rare today (VALENTINE, 1989).
Information on the occurrence of fossil micromolluscs is available not only for the Pleistocene, but also for older periods (e.g., JANSSEN, 1981 ; BANDEL, 1991b, 1993; Runnegar, 1996), and fossil micromolluscs have even been successfully used for facies and paleoecological analyses (STANTON et al., 1981; MAXWELL, 1988, 1992). Therefore we suspect that the poor state of knowledge on fossil smaller molluscs is not only due to a poor preservation potential; they are also largely ignored by both (paleo)malacology and micropalaeontology, which is typically restricted to foraminifers and ostracods.
Conclusion
1. The sedimentary facies investigated here are not only characterized by distinct mollusc associations based on taxonomic composition; they show also clear differences
251
regarding descriptive features like individual abundance and numbers oftaxa, taphonomic features like numbers of fragments, and ecological features such as diversity indices, feeding strategies and substrate relations.
2. The recognized associations are the result of mollusc distributions that reflect a variety of environmental parameters like water energy, grain size and food supply and are affected by taphonomic processes like fragmentation, which are variably efficient in the different environments. 3. The studied death assemblages probably do not reflect the original biocoenoses, but are rather long-term time- averaged assemblages from the taphonomically active zone. Therefore taphonomic processes continue to affect the death assemblages; to increase theirpreservation potential, they must be buried in the zone of accumulation.
4. The death assemblages from the taphonomically active zone provide an opportunity to quantify taphonomic loss by comparing them to long-term death assemblages from deeper parts of the sedimentary column and fossil assemblages from similar habitats. The number of species should be well preserved in fossil assemblages. The taphonomic loss of individual numbers in Pleistocene deposits must be cautiously assessed under consideration of the diagenetic environment and potential habitat changes due to sea-level fluctuations.
5. The poor state of knowledge on fossil micromolluscs is probably not only due to a rather low preservation potential; they are also largely ignored by both classical (palaeo)malacology and micropalaeontology.
Acknowledgements
The authors are grateful to Abbas Mansour (South Valley University, Qena), Werner E. Piller, Rosa Piller and Michael Russet (Institute of Palaeontology, University of Vienna) for help with field work. Ute Sattler, Sascha Salek (both Institute of Geology, University of Vienna) and Osman Abdelghany (Ain Shams University, Cairo) supported the sample preparation. Ronald Janssen, Eike Neubert (both Senckenberg Museum Frankfurt), P. Graham Oliver (National Museum of Wales, Cardiff) and Gerhard Steiner (Institute of Zoology, University of Vienna) decisively supported the taxonomic part of this study. Our thanks are also due to Michal Kowalewski, Jimmy Nebelsick (both Insitute of Geology and Palaeontology, University of Ttibingen), Emily A. Glover and John D. Taylor (both Department of Zoology, Natural History Museum, Lon- don) for intensive and fruitful discussions on the first draft of this paper. Michael Stachowitsch (Institute of Zoology, University of Vienna) improved the English and provided helpful comments on the manuscript. We are very grateful to the useful comments made by reviewers Karl W. Flessa (Department of Geosciences, University of Arizona, Tucson) and Robert J. Stanton, Jr. (Department of Geology and Geophysics, Texas A & M University, College Station). This study was supported by the ,,Hochschuljubil~iums- stiftung der Stadt Wien" and by Project P10715-GEO of the"Fonds zur F0rderung der wissenschafllichen Forschung" (FWF).
References
ANTIA, D.D.J. (1977): A comparison of diversity and trophic nuclei of live and dead molluscan faunas from the Essex Chenier plain, England.- Paleobiology 3,404-414, 3 Fig., 3 Tabs., Chicago
ALLER, R.C. (1982): Carbonate dissolution in nearshore terrigenous muds: the role of physical and biological reworking.- Journal of Geology 90, 79-95, 11 Figs., Chicago
Am'4OUD, P.M. & THO~aASSIN, B.A. ( 1990): Habits and morphological adaptations of mytilids (Mollusca: Bivalvia) from coastal and reefal environments in south-west Malagasia (Indian Ocean). In: BRIAN MORTOr~ (ed.): The Bivalvia-Proceedings of a Memorial Symposium in Honour of Sir Charles Maurice Yonge, Edinburgh, 1986.- 333-344, 4 Figs., Hong Kong (Hong Kong Univ. Press)
AUSTIN, A.D., AUSTIN, S.A. AND SALE P.F. (1980): Community structure of the fauna associated with the coral Pocillopora damicornis (L.) on the Great Barrier Reef. Aust. J. Mar. Freshwater Res. 31, 163-174, Melbourne
AYAL, Y. & S,,d:Rt~L, U.N. (198 I): Species composition, geographical distribution and habitat characteristics of rocky intertidal Cerithiidae (Gastropoda; Prosobranchia) along the Red Sea shores of Sinai. Argamon 7(5), 53-72, 2 Figs., 3 Tabs., Haifa
BANDEL, K. (1991 a): Character of a microgastropod fauna from a carbonate sand of Cebu (Philippines).- Mitteilungen aus dem Geologisch-Pal~.ontologischen Institut der Universit~it Hamburg 71,441-485, 8 Pts., 36 Figs., Hamburg
-- (1991b): Schlitzbandschnecken mit perlmutteriger Schale aus den triassischen St. Cassian - Schichten der Dolomiten.- Ann. Naturhist. Mus. Wien 92(A), 1-53, 17 Pls., I0 Figs, Wien
-- (I 993): Trochomorpha aus der triassischen St. Cassian-Forr mation (Gastropoda, Dolomiten). Ann. Naturhist. Mus. Wien 95(A), 1-99, 16 Pls., Wien
B~!NZr-CR~, P.J. (l 973): L" analyse de correspondances. L' Analyse de Donnees, 2, Paris (Dunodl
BoscH, D.T.. DANCI< S.P.. MOOI.I-NBLEK, R.G. & OI.IVI:~R, P.G. ( t995): Seashells of Eastern Arabia.- 296pp., Dubai (Motiv- ate Publishing)
BRATCHER, T. & C~RYOHOaSKY, W. O. ( 1987): Living Terebras of the World. A Monograph of the Recent Terebridae of the World. Melbourne (Florida), Burlington {Mass.). American Malacologists,
CADGE, G.C. (I994): Eider, shelduck, and other predators, the main producers of shell fragments m the Wadden Sea.- Palaeontology 37/1,181-202, 1 PI., 13 Figs, 3 Tabs., London
CAL~:, C.E. & HANCOCK, N.J. (1974): Wenlock and Lludlow marine communities in Wales and the Welsh borderland.- Palaeontology 17, 779-810, 1 PI.. 7 Figs., 13 Tabs., London
CARTHkW. R. & BOSLNCE, D. ( 1986): Community preservation in recent shell-gravels. English Channel.- Palaeontology 29(2), 243-268, 7 Figs., 4 Tabs., 2 Apps., London
Ct~RNOHORSKY, W. O. ( 1984): Systematics of the Family Nassariidae (Mollusca: Gastropoda).- Bull, Auckland Inst. Mus. 14, 51 PIs., 173 Figs., Auckland
CRAME, J. A. (1986): Late Pleistocene molluscan assemblages from the coral reefs of the Kenya coast. - Coral reefs 4, 183- 196, 6 Figs., 2 Tabs., Berlin
CUMMINS, H., POWELL, E. N., SrANTON, R. J. JR., & STAJq:, G. (1986): The size-frequency distribution in Palaeoecology: effects o f taphonomic processes during formation of molluscan death assemblages in Texas bays. - Palaeontology 29(3), 495-518; 12 Figs., 7 Tab., London
D,wlt;s, D.J., PowEt.r., E.N., Sr.~,xTox, R.J.Jt~. ( 1989a): Taphonomic signature as a function of environmental process: shells and shell beds in a hurricane-influenced inlet on the Texas coast.- Palaeogeography, Palaeoclimatology, Palaeoecology 72, 317- 356, Fig. 11, Tab. 26, Amsterdam
DAVIES, D.J., POWELL, E.N., STANTON, R.J.JR. (1989b): Relative
252
rates of shell dissolution and net sediment accumulation - a commentary: can shell beds form by the gradual accumula- tion of biogenic debris on the sea floor?.- Lethaia 22, 207- 212, 1 Fig., Oslo
DAVIES, D.J., STAFF, G.M., CALLENDER, W.R., POWELL, E.N. (1990): Description of a Quantitative Approach to Taphonomy and Taphofacies Analysis: All Dead Things Are Not Created Equal.-In: MILLER, W. (ed.): Paleocommunity temporal dy- namics: The long-term development of multispecies assem- blies.- The Paleontological Society Special Publication 5, 328-350, 5 Pls., 1 Fig., 1 Tab., Knoxville (The University of Tennessee)
DULLO, W. Chr. (1983): Diagenesis of fossils of the miocene Leitha Limestone of the Paratethys, Austria: an example for faunal modifications due to the changing diagenetic environment. -Facies 8, 1-112, 15 PI., 22 Fig., 2 Tab., Erlangen
-- (1984): Progressive diagenetic sequence ofaragonite structures: Pleistocene coral reefs and their modern counterparts on the eastern Red Sea coast, Saudi Arabia. -Palaeontographica Americana 54, 254-260, 5 Figs., Ithaca
-- (1990): Facies, fossil record, and age of Pleistocene reefs from the Red Sea. -Facies 22, 1-46, 13 PI., 21 Fig., 1 Tab., Erlangen
DWORSCHAK, P.C. & PERVESLER, P. (1988): Burrows of Callianassa bouvieri NOBILI 1904 from Safaga (Egypt, Red Sea) with some remarks on the Biology of the species.- Senckenbergiana marit. 20(1/2): 1-17, 2 Pls., 5 Figs., 1 Tabs., Frankfurt.
EKDALE, A.A. (1977): Quantitative Paleoecological Aspects of Modern Marine Mollusk Distribution, Northeast Yucatan Coast, Mexico.- In: FROST, S.H., WEISS, M.P. & SAUNDERS, J.P (eds.): Reefs and related carbonates - ecology and sedimentology.- Studies in Geology 4, 195-207, 12 FigsTulsa
FLESSA, K.W. ( 1993): Time-averaging and temporal resolution in Recent marine shelly faunas.- In: K1DWELL, S.M. & BEHRENSMEYER, A.K. (eds.): Taphonomic approaches to time resolution in fossil assemblages.- The Paleontological Society Special Publication 6, 9-33, 3 Figs., I Tab., Knoxville (The University of Tennessee)
FLESSA K.W. & KOWALEWSK! M. (1994): Shell survival and time- averaging in nearshore and shelf environments: estimates from the radiocarbon literature.- Lethala 27, 153-165, 4 Figs., 3 Tabs., Oslo
FLESSA, K.W., CUTLER, A.H. & MELDAHL, K.H. (1993): Time and taphonomy: quantitative estimates of time-averaging and stratigraphic disorder in a shallow marine habitat.- Paleobiology 19(2): 266-286, 7 Figs., 3 Tabs., Chicago
FLESSA, K.W., KOWALEWSK!, M. & WALKER, S.E. (1992): Post- collection taphonomy: shell destruction and the chevrolet.- Palaios 7, 553-554, 1 Tab., Tulsa
FRANK, P.W. (1969): Growth rates and longevity of some gastro- pod molluscs on the coral reef at Heron Island. Oecologia 2, 232-250, 3 Figs., 3 Tabs., Berlin
FRET'r~R, V. (1975): Umbonium vestiarium, a filter-feeding trochid. Journal of Zoology 177, 541-552, 4 Figs., London
F~3RSlCH, F.T. ( 1977): Corallian (Upper Jurassic) marine benthic associations from England and Normandy.- Palaeontology 20, 337-386, London
-- (1978): The influence of faunal condensation and mixing on the preservation of fossil benthic communities.- Lethaia 11, 243-250, 7 Figs., Oslo
FORSICH, F.T. & Aberhan, M. (1990): Significance of time- averaging for palaeocommunity analysis.- Lethaia 23, 143- 152, 6 Figs., Oslo
GABRIEL, K.R. (1971): The biplot - graphic display of matrices with application to principal component analysis. Biometrika 58, 435-467, London
GILINSKY, N.L. & BENNINGTON, J.B. (1994): Estimating numbers of whole individuals from collections of body parts: a taphonomic limitation of the paleontological record.-
Paleobiology 20(2), 245-258, 5 Figs., 1 Tab., Chicago GLOVER, E.A. & TAYLOR, J.D. (1997): New species and records of
Rastafaria and Megaxinus (Bivalvia: Lucinidae) from the Western Indian Ocean and Red Sea, with reappraisal of Megaxinus.- Journal of Conchology 36 (1). 1-18, 7 Figs., London
HADFIELD, M.G. (1976): Molluscs associated with living corals.- Micronesica 12, 133-148, 1 Tab., Agafia (Guam)
HAUNTED, T.G., BAAL, C. & PILLER, W.E. (1997): Benthic Fora- miniferan Associations in the Northern Bay of Safaga, Red Sea, Egypt.- Marine Micropaleontology 29, 185-210, 16 Figs., 2 Tabs., New York
HICKMAN, C. S. (1985): Comparative morphology and ecology of free-living suspension-feeding gastropods from Hong Kong.- In: MORTON, B. & DUDGEON, D. (eds.): Proceedings of the Second International Workshop on the Malacofauna of Hong Kong and Southern China, Hong Kong, 1983.- 217-234, 1 Pl., 4 Figs., Hong Kong, (Univ. Press)
HILL, M. O. (1973): Reciprocal averaging: an eigenvector method of ordination. Journal of Ecology, 61, 237-249, 2 Figs., Cambridge
HOLTZMANN, R.C. (1979): Maximum likelihood estimation of fossil assemblage composition. Paleobiology 5(2), 77-89, 5 Figs., 1 Tab., Chicago
HOUBRICK, R. S. (1978): The family Cerithiidae in the Indo- Pacific. Part 1: The genera Rhinoclavis, Pseudovertagus and Clavocerithium.- Monographs of Marine Mollusca, 1 : 1 - 130, 98 Pls., American Malacologists, Inc; Greenville, Delaware
-- (1992): Monograph of the Genus Cerithium Brugui~re in the Indo-Pacific (Cerithiidae: Prosobranchia).- Smithsonian Contribution to Zoology 510, 211pp. 145 Figs.45 Tabs., Washington
JANSSEN, R. (1981): Mollusken-Assoziationen und Biotope im norddeutschen Oberoligoz~in.- Natur und Museum 111, 70- 78, 8 Figs., Frankfurt a. M.
JO~SKOO, K.G., KLOVAN, J.E. AND REYMENT, R.A. (I976): Geo- logical Factor Analysis.- XII + 178 pp., Amsterdam (Elsevier)
KAY, E. A. (1979): Hawaiian marine shells. Reef and shore fauna of Hawaii, section 4: Mollusca.- 653 pp, 195 Figs., Honolulu
KAY, E.A. & SWITZER, M.F. (1974): Molluscan distribution patterns in Fanning Island Lagoon and a comparison of the mollusks of the lagoon and the seaward reefs.- Pac. Sci. 28(3), 275- 295, 6 Figs., 5 Tabs., Hawaii
KENNARO, M.C. & SMITH, A.J. (1961): A simple micro-sample splitter.- Journal of Paleontology 35,396-397, 2 Figs. 1 Tab., Tulsa
KIDWELL, S.M. (1993): Patterns of time-averaging in the shallow marine fossil record.- In: KIDWELL, S.M. & BEHRENSMEYER, A.K. (eds.): Taphonomic approaches to time resolution in fossil assemblages.- The Paleontological Society Special Publication 6, 275-300, 6 Figs., 1 Tab., Knoxville (The University of Tennessee)
KIDWELL, S.M. & BOSENCE, D.W.J. (1991): Taphonomy and time- averaging of marine shelly faunas. In: ALLISON, P.A. & BmGGS, D.E.G. (eds.): Taphonomy. Releasing the data locked in the fossil record.- 115-209, 10 Figs., 9 Tabs., New York (Plenum)
KIDWELL, S.M. & FLESSA, K.W. (1995): The quality of the fossil record: Populations, species, and communities.- Annu. Rev. Ecol. Syst. 26, 269-299, 2 Figs., Palo Alto
KIDWELL, S.M., FORSICH, F.T. & AIGNER, T. (1986): Conceptual framework for the analysis of fossil concentrations.- Palaios 1,228-238, 5 Figs., 1 Tab., Tulsa
KLEEMANN, K. (1990): Coral Associations, Biocorrosion, and Space Competition in Pedum spondyloideum (GMELIN) (Pectinacea, Bivalvia): Pubbl. Staz. zool. NapoliI: Marine Ecology 11, 77-94, 19 Figs., 1 Tab., Berlin
KLEEMANN, K. (1992): Coral Communities and Coral-Bivalve Associations in the Northern Red Sea at Safaga, Egypt: Facies 26, 1-I0, 3 PI., 1 Fig., 1 Tab., Erlangen

253
KLEEMANN, K. (1995): Associations of coral and coral boring bivalves: Lizard Island (Great Barrier Reef, Australia) versus Safaga iN Red Sea).- Beitr~ge zur PaDontologie 20, 31-39, 1 PI., 2 Figs., 1 Tab., 1 App., Wien
KOHN, A.J. (1983): Feeding Biology of Gastropods.- In: SALEUDDIN, A.S.M. and WtLBUR, K.M. (eds.): The Mollusca. Vol. 5 Physiology, Part 2.- 1-63, 2 Figs., 2 Tabs., New York (Aca- demic Press)
KOWALEWSKt, M. (1996): Time-averaging, overcompleteness, and the geological record.- The Journal of Geology 104:317- 326, 3 Figs., Chicago
-- (1997): The reciprocal taphonomic model.- Lethaia 30, 86- 88, 1 Tab., Oslo
K~Bs, Ch.J. (1989): Ecological Methodology.- X + 654 pp., New York (Harper & Row)
KRTaNOWSKt, W.J. & F.H.C. MARRtO'r'r ( 1995): Multi variate Analy- sis, Part 2. Kendall's Library of Statistics 2. VIII + 280 pp. 17 Figs., London (Arnold)
LEE, S.Y. MO~TON, B. (1985): The Hong Kong Mytilidae. In: MORTOn, B. & DUDGEON, D. (eds.): Proceedings of the Second International Workshop on the Malacofauna of Hong Kong and Southern China, Hong Kong, i983.- 49-76, 3 Figs., 5 Pls., 3 Tabs., Hong Kong, tHong Kong Univ. Press)
LE PENNec,.M. BENINGgR, P.G. & HERRY, A. ( 1995): Feeding and digestive adaptations of bivalve molluscs to sulphide-rich habitats.- Comparative Biochemistry and Physiology 111 A: 183-189, London,
LtNDER, A. & BE~CHTOLD, W. (1976): Statistische Auswertung yon Prozentzahlen.- 232pp., Basel (Birkh~iuser)
MAGORRAN, A.E. (1988): Ecological Diversity and Its Measure- merit.- X + 179 pp., London - Sydney (Croom Helm)
MANSOU~, A.M., PXLt.Ea, W.E. & LENGAt;~R, C.L. (1995): Quan- titative mineralogical analyses of carbonate rich sediments by X-ray powder diffraction.- Powder Diffraction 10 (2}: 112-116, 2 Figs., 4 Tabs., Woodbury
MARSHALL, B.A. (1983): A Revision of the Recent Triphoridae of Southern Australia (Mollusca: Gastropoda).- Records of the Australian Museum, Supplement 2, 119 pp., 33 Figs., 44 Tabs., I App., Sydney
MASTALLER, M. (1978): The marine molluscan assamblages of Port Sudan, Red Sea. Zoologische Mededelingen 53. !17- I44, 1 Fig., 1 Tab., Leiden
-- (1988): Late Miocenedeep-water Mollusca from the Sti[hvatcr Mudstone atGraymouth, Westland, New Zealand: Paleoecology, and systematics.- New Zealand Geological Survey Paleonto- logical Bulletin55, 120pp., 13 Pls.. 3 Figs.. 11 Tab~ . Lower Hutt
MAXWELL, P.A. (1992): Eocene mollusca from the vicinity of McCulloch's Bridge, Waihao Rive:, South Canterbury, New Zealand: Paleoecology and systematics.- New Zealand Geological Survey Paleontological Bulletin 65.280pp., Lower Hutt
MCCALL, P.L. & TEVESZ, M.J.S. (1983): Soft-bottum succession and the fossil record.- In: T~.vEsz, MJ.S. & b,'lcCar t. P.L. (eds.): Biotic interactions in recent and fossil benthic communities.- 157-196, New York (Plenum Press)
MELDAHL, K.H. (1987): Sedimentologic and taphonomic implications of biogenic stratification.- Palaios, 2, 350-358, 7 Figs., Tulsa
MELDAHL, K.H. & FLESSA, K.W. (1990): Taphonomic pathways and comparative bio facies and taphofacies in a recent intertidal / shallow shelf environment.- Lethaia 23, 43-60, 11 Figs., i Tab., Oslo
MELDAHI_, K.H., FLESSA, K.W, & CUTI.ER, A.H. (1997): Time- averaging and postmortem skeletal survival in benthic fossil assemblages: quantitative comparisons among Holocene environments.- Paleobiology 23(2): 207-229, 7 Figs., 3 Tabs.. Chicago
MORTON, B. ( 1983): Feeding and digestion in Bivatvia. In: Saz.E uc~i)Ix, A.S.M. & Wn.Bua, K.M. (eds.): ]"he Moliu~ca. Vo]. 5
Physiology, Part 2.-, 65-147, 22 Figs., New York (Academic Press)
MYRICK, J.L. & FLESSA, K.W. (1996): Bioturbation rates in Bahia La Choya, Sonora, Mexico.- Ciencias Marinas, 22(1): 23-46, 10 Figs., 2 Tabs., Mexico
NEBEI.S~CK, J.H. ( 1992a): The Northern Bay of Safaga (Red Sea, Egypt): an actuopalaeontological approach. III. Distribution of echinoids. Beitrgge zur Palfiontologie yon Osterreich 17, 5-79, 8 Pls., 37 Figs., 6 Tables, Wien
-- (1992b): Echinoid Distribution by Fragment Identification in the Northern Bay of Safaga, Red Sea, Egypt. - Palaios 7(2): 316-328, 8 Figs., 2 Tabs., Tulsa
-- (19954): Comparative taphonomy ofClypeasteroids.- Eclogae geol. Holy. 88/3: 685-693, 7 Figs., Basel
-- (1995b): Uses and limitations of actuopalaeontological in- vestigations on echinoids.- Geobios 18, 329-336, 7 Figs., Lyon
-- (1996): Biodiversity of shallow-water Red Sea echinoids: Implications for the fossil record. - J.mar. biol. Ass. U.K. 76, 185-194, 4 Figs., 1 Tab., London
N~Jt~t.SlCK, J.H. & KA~,WF~.R, S. ( 1994): Taphonomy of Clypeaster humilis and Echinodiscus auritas (Echinoidea, Clypeasteroidea) from the Red Sea.- In: DAVID, B., GUmLE, A., FERAl. J.-P. & RoUX, M. (eds.): Echinoderms through time, 803-808, 1 PI., 4 Figs., Rotterdam (Balkema)
Or.EVER, P.G. (1992): Bivalved Seashells of the Red Sea.- 330pp., Wiesbaden (Hemmen)
ORLOCI, L. ( I967): Geometric models in ecology. The theory and application of some ordination methods.- Journal of Ecology 54, 193-215, 15 Figs., 2 Tabs., Cambridge
PERaON, F.E. (1975): Carnivorous Calliostoma (Prosobranchia: Trochidae) from the northeastern Pacific.- Veliger 18, 52-54, I Pl., Berkeley
PII.I.EI,,, W.E. (1994): The Northern Bay of Safaga (Red Sea, Egypt): an actuopalaeontological approach. IV. Thin section analysis. Beitrage zur Palaontologie 18. 1-73, 18 Pls., 19 Figs., 5 Tables, Wien
Pu cf!a, W.E. & MANSC~t'I< A. ( 1990): The Northern Bay of Safaga (Red Sea, Egypt): an actuopalaeontological approach, lI. Sediment analyses and sedimentary facies.- Beitr~ige zur Pali~ontologie yon Osterreich 16, 1-102, 55 Figs,, 19 Tabs., Wien
f'n Is W.E. & Maxsoul< A. ( 1994): Origin and transport of non- carbonate sediments in a carbonate-dominated environment ~Nortlttcrn Safaga Bay', Egypt) .- Abhandlungen der Geologischen Bundesanstalt 50, 369-379, 1 Pl , 6 Figs., 3 Tabs., Wien.
Pn.I.FR, W.E. & PI~I~\q-SI.VR. P, (1989): The Northern Bay or' Safaga (Red Sea, Egypt): An Actuopalaeontotogical Ap- proach. I. Topography and Bottom Facies.- Beitrage zur Pal~Jontologie yon Osterreich 15,103-147, I0 Pis., 8 Figs., 1 Table, Wien
Pm~.ER. W.E. & RASS~:I< M. (1996): Rhodolith formation induced by reef erosion in the Red Sea, Egypt.- Coral Reefs 15. 191- 198, 6 Figs., Berlin
P>L()t:, EC. (1969): An Introduction to Mathematical Ecology. VIII + 286 pp., New York (Wiley)
POr:I)FR W. F. (1985): A review of the genera of the Rissoidae (Mollusca: Mesogastropoda: Rissoacea).- Rec. Austr, Mus., Suppl. 4, 1-22l, 153 Figs., Sydney.
POWELL, E.N. & Daw~.s. DJ. (1990): When isan "old" shell really "old'"?.- Journal of Geology 98,823-844.15 Figs., Chicago
POWELL, E, N., STAFF, G. M., DAVIES, D. J. & CALLENDER, W. R. (1989): Macrobenthic Death Assemblages in Modern Mari- ne Environments: Fornmtion, Interpretation, and Application. - Aquatic sciences 1/4, 555-589, 2 Figs., 8 Tabs., London
POW~LL, E.N. & STANTON, R.J., Jr. (1985): Estimating biomass and energy flow of molluscs in palaeo-communities.- Palaeontology 28, 1-34, 14 Figs., 6 Tabs., London
-- & -- (1995): The application of guild and tier structure and
254
energy flow in paleoecologic analysis: an example using parautochthonous death assemblages from a variable salinity bay. -Historical Biology 10, 281-327, 12 Fig., 5 Tab., Am- sterdam
-- & -- (1996): The application of siz-frequency distribution and energy flow in paleoecological analysis: An example using parautochthonous death assemblages from a variable salinity bay.- Palaeogeography, Palaeoclimatology, Palaeoecology 124, 195-231, 26 Figs., 3 Tabs., Amsterdam,
POWELL, E.N., STANTON, R.J. JR., LOGAN, A. & CRAIG, M.A. ( 1992): Preservation of Mollusca in Copano Bay, Texas. The long-term record.- Palaeogeography, Palaeoclimatology, Palaeoecology 95, 209-228, 20 Figs., Amsterdam
RASSER, M. & PILLER, W.E. (1997): Depth distribution of calcar- eous encrusting associations in the northern Red Sea (Safaga, Egypt) and their geological implications.- Proceedings of the 8 'h International Coral Reef Symposium 1,743-748, 9 Figs., Panama
RIEGL, B. & PILLER, W.E. (1997): Distribution of coral associa- tions in Northern Safaga Bay (Red Sea, Egypt).- Facies 36, 141-162, 8 Pls., 3 Figs., 1 Tab., Erlangen
RUNNEGAR, B. (1996): Early evolution of the mollusca: the fossil record. -In: TAYLOR, J. D (ed.): Origin and evolutionary radiation of the mollusca. - 77-87, 5 Figs. Oxford (Oxford Univ. Press)
SALAZAR-JIMENEZ, A. FREY, R.W. & HOWARD J.D. (1982): Con- cavity orientations of bivalve shells in estuarine and nearshore shelf sediments, Georgia.- J. Sediment. Petrol. 52, 565-586, 12 Figs., 2 Tabs., Tulsa
SAFR1EL, U.N., FELSENBURG,T. & G1LBOA A. (1980): The distribution of Brachidontes variabilis (Krauss) along the Red Sea coasts of Sinai.- Argamon 7/3, 31-43, 5 Tabs., Haifa
SCARABINO, V. (1995): Scaphopoda of the tropical Pacific and Indian Oceans, with description of 3 new genera and 42 new species.- In: BOUCHET, P. (ed.): R6sultats des Campagnes MUSORSTOM, Vol. 14.- M6m. Mus.natn. Hist. nat. 167, 189-397, 175 Figs., 2 Tabs., Paris
SCHUHMACHER, H. (1993): Impact of Some Corallivorous snails on Stony Corals in the Red Sea: Proceedings of the Seventh International Coral Reef Symposium, Guam 1992, 2, 840- 846, 3 Figs., 2 Tabs., Guam
SHARABATk D. (1984): Red Sea Shells.-127pp, 49 Pls., London (Routledge & Keegan)
SHEPPARD, A.L.S. (1984): The molluscan fauna of Chagos (Indian Ocean) and an analysis of its broad distribution patterns.- Coral Reefs 3, 43-50, 3 Figs., 1 Tab., 1 App., Berlin
STAFF, G.M. & POWELL, E.N. (1988): The paleoecological significance of diversity: the effect of time averaging and differential preservation on macroinvertebrate species richness in death assemblages.- Palaeogeography, Palaeocli matology, Palaeoecotogy 63, 73-89, 11 Figs., 2 Tabs., Amsterdam
STAFF, G.M., STANTON, R.J. JR., POWELL, E.N. & CUMMINS, H. (1986): Time-averaging, taphomomy, and their impact on paleocommunity reconstruction: Death assemblages in Te- xas bays.- Geological Society of America Bulletin 97, 428- 443, 14 Figs., 2 Tabs., Boulder
STANTON, R.J. JR., POWELL, E.N. & NELSON, P.C. (1981): The role of carnivorous gastropods in the trophic analysis of a fossil community.- Malacologia, 20/2, 451-469, 14 Figs., 2 Tabs., Ann Arbor
TAYLOR, J.D. (1968): Coral reef and associated invertebrate communities (mainly molluscan) around Mah6, Seychelles.- Phil. Trans. R. Soc. London 254 (Ser. B), 129-206, 20 Figs., London
-- (1971): Intertidal zonation of Aldabra Atoll.- Philosophical Transactions of the Royal Society, 260 (Ser. B), 173-213, London
-- (1976): Habitats, abundance and diets of Muricacean gastro- pods at Aldabra Atoll.- Zoological Journal of the Linnean Society 59, 155-193, 16 Figs., 12 Tabs., London
TAYLOR, J.D., & REID, D.G. (1984): The abundance and trophic classification of molluscs upon coral reefs in the Sudanese Red Sea: Journal of Natural History 18, 175-209, 11 Figs., 7 Tabs., 1 App., London
TREWIN N.H. & WELSH W. (1976): Formation and composition of a graded estuarine shell bed.- Palaeogeogr., Palaeoclimatol., Palaeoecol. 19, 219-230, 5 Figs., Amsterdam
VALENTINE, J. W. (1989): HOW god was the fossil record? Clues from the Californian Pleistocene. - Paleobiology 15/2, 83-94, 1 Fig., 1 Tab., Chicago
VERMEIJ, G.J. ( 1983): Traces and trends of predation, with special reference to bivalved animals.- Palaeontology 26, 455-465, I Fig., London
WALKER, K.R. (1972): Trophic analysis: a method for studying the function of ancient communities.- J. Paleontol. 46, 82-93, 11 Tabs., Tulsa
WARD, J.H. (1963): Hierarchical grouping to optimize an objec- tive function.- J. Amer. Stat. Assoc. 58, 236-244, 3 Figs., Washington, D.C.
WARME, J. E. (1969) Live and dead molluscs in a coastal lagoon.- Journal of Paleontology 43/1, 141-150, 2 Figs., 2 Tabs., Tulsa
WESTHOFF, V. • VAN DER MAAREL, E. ( t 973): The Braun-Blanquet approach.- In: R.H. WHITTAKER ted.): Handbook of vegetation science 5, Ordination and Classification of Communities.- 619-726, 6 Figs., 7 Tabs., The Hague (Junk)
Zuschin, M. & Oliver, P.G. (submitted): Additions to the bivalve fauna of the Red Sea with descriptions of new species of Limopsidae, Limidae, Semelidae and Veneridae.-Journal of conchology, London
ZUSCHIN, M. & PILLER, W.E., (1997a): Gastropod shells recycled - an example from a rocky tidal flat in the Northern Bay of Safaga (Red Sea, Egypt).- Lethaia 30, 127-134, 6 Figs., 4 Tabs., Oslo
-- & -- (1997b): Bivalve distribution on coral carpets in the northern Bay of Safaga (Red Sea, Egypt) and its relation to environmental parameters.- Facies 37, 183-194, 2 PIs., 5 Figs., 6 Tabs., Erlangen
-- & -- (1997c): Molluscan hard-substrate associations in the northern Red Sea.- Pubbl. Staz zool. Napoli: Marine Ecol- ogy, 18/4, 361-378, 3 Figs., 3 Tabs., Berlin
Manuscript received November 30, 1997 Revised manuscript received February 2"0, 1998