Sub-target effect in film analysis using TEA CO 2 laser-induced plasma
7
Sub-target effect in film analysis using TEA CO 2 laser-induced plasma Yong-Inn Lee a, * , Nasrullah Idris b , Koo Hendrik Kurniawan c , Tjung Jie Lie c , Kenichiro Tsuyuki d , Satoru Miura d , Kiichiro Kagawa e a Department of Physics, Research Institute of Physics and Chemistry, Chonbuk National University, Chonju 561-756, Republic of Korea b Department of Physics, Faculty of Mathematics and Natural Sciences, Syiah Kuala University, Banda Aceh, Nanggroe Aceh Darussalam (NAD) 23111, Indonesia c Research Centre of Maju Makmur Mandiri, Srengseng Raya No. 40, Jakarta Barat 11630, Indonesia d Kajima Technical Research Institute, Kajima Corporation, Tokyo 182-0036, Japan e Department of Physics, Faculty of Education and Regional Studies, University of Fukui, Fukui 910-8507, Japan Received 26 July 2005 Available online 26 January 2007 Abstract A TEA CO 2 laser beam (500 mJ, 200 ns) was focused on film samples, under low pressure surrounding gas at around 1 Torr. It has been found that to generate the laser plasma for the sample of oil or powder, the sample should be attached in the form of thin film on the surface of a metal, such as copper plate, which acts as a sub-target. The plasma has favorable characteristics for spectrochemical analysis due to its low background and sharp line spectrum, and hence an optical multichannel analyzer (OMA) without gated function can be used for spec- trum acquisition. Using the sub-target effect we have performed for analyses on water molecular layer and water impurities, where the water was condensed by heating process or electrolysis process on the sub-target so that impurities in the water were attached to the metal surface. It should be emphasized that in this case the sub-target itself has never been ablated and no any damaged on its surface. Another application of the sub-target effect is used for the analysis of oil contamination in soils. We have succeeded to detect clearly the emission line of C I 247.9 nm from the carbon as a major constituent of the oil. To derive the carbon emission intensity coming only from oil, compensation was made to cancel the contribution from other organic species using the emission of Ca, which inherently contains in other organic species in soil. As result, a good linear relationship between carbon emission intensity and oil concentration was obtained. Ó 2006 Elsevier B.V. All rights reserved. PACS: 52.50.jm Keywords: Laser-induced plasma; TEA CO 2 laser; Laser-induced low pressure plasma; Film samples; Sub-target effect 1. Introduction Generally speaking, the characteristics of a laser-gener- ated plasma depend on many factors involved in the pro- cess. Aside from the fact that it is influenced by the properties of the target material, the characteristics of the plasma can be affected by the type of laser used and various parameters of the laser itself, such as its wavelength, pulse width, total energy and power density. Also the surround- ing gas, gas kinds and pressure, give influences to the plasma [1–3]. Usually, in laser ablation emission spectro- chemical analysis (LAESA), a Q-sw Nd-YAG laser is mostly used as the exciting light source for plasma genera- tion. However, depending on sample properties we should search for what type of laser is most suited. In our previous study, we have reported that plasma produced by the bombardment of TEA CO 2 laser has favorable characteristics for spectrochemical analysis even though it is produced at atmospheric pressure [4,5]. Based on a series of our works on the generation mechanism of the laser-induced plasmas [6,7], we concluded that shock waves play an important role in exciting the atoms. 1567-1739/$ - see front matter Ó 2006 Elsevier B.V. All rights reserved. doi:10.1016/j.cap.2006.11.035 * Corresponding author. E-mail address: [email protected] (Y.-I. Lee). www.elsevier.com/locate/cap www.kps.or.kr Current Applied Physics 7 (2007) 540–546
Transcript of Sub-target effect in film analysis using TEA CO 2 laser-induced plasma

www.elsevier.com/locate/cap
www.kps.or.kr
Current Applied Physics 7 (2007) 540–546
Sub-target effect in film analysis using TEA CO2 laser-induced plasma
Yong-Inn Lee a,*, Nasrullah Idris b, Koo Hendrik Kurniawan c, Tjung Jie Lie c,Kenichiro Tsuyuki d, Satoru Miura d, Kiichiro Kagawa e
a Department of Physics, Research Institute of Physics and Chemistry, Chonbuk National University, Chonju 561-756, Republic of Koreab Department of Physics, Faculty of Mathematics and Natural Sciences, Syiah Kuala University, Banda Aceh,
Nanggroe Aceh Darussalam (NAD) 23111, Indonesiac Research Centre of Maju Makmur Mandiri, Srengseng Raya No. 40, Jakarta Barat 11630, Indonesia
d Kajima Technical Research Institute, Kajima Corporation, Tokyo 182-0036, Japane Department of Physics, Faculty of Education and Regional Studies, University of Fukui, Fukui 910-8507, Japan
Received 26 July 2005Available online 26 January 2007
Abstract
A TEA CO2 laser beam (500 mJ, 200 ns) was focused on film samples, under low pressure surrounding gas at around 1 Torr. It has beenfound that to generate the laser plasma for the sample of oil or powder, the sample should be attached in the form of thin film on the surfaceof a metal, such as copper plate, which acts as a sub-target. The plasma has favorable characteristics for spectrochemical analysis due to itslow background and sharp line spectrum, and hence an optical multichannel analyzer (OMA) without gated function can be used for spec-trum acquisition. Using the sub-target effect we have performed for analyses on water molecular layer and water impurities, where the waterwas condensed by heating process or electrolysis process on the sub-target so that impurities in the water were attached to the metal surface.It should be emphasized that in this case the sub-target itself has never been ablated and no any damaged on its surface. Another applicationof the sub-target effect is used for the analysis of oil contamination in soils. We have succeeded to detect clearly the emission line of C I247.9 nm from the carbon as a major constituent of the oil. To derive the carbon emission intensity coming only from oil, compensationwas made to cancel the contribution from other organic species using the emission of Ca, which inherently contains in other organic speciesin soil. As result, a good linear relationship between carbon emission intensity and oil concentration was obtained.� 2006 Elsevier B.V. All rights reserved.
PACS: 52.50.jm
Keywords: Laser-induced plasma; TEA CO2 laser; Laser-induced low pressure plasma; Film samples; Sub-target effect
1. Introduction
Generally speaking, the characteristics of a laser-gener-ated plasma depend on many factors involved in the pro-cess. Aside from the fact that it is influenced by theproperties of the target material, the characteristics of theplasma can be affected by the type of laser used and variousparameters of the laser itself, such as its wavelength, pulsewidth, total energy and power density. Also the surround-
1567-1739/$ - see front matter � 2006 Elsevier B.V. All rights reserved.
doi:10.1016/j.cap.2006.11.035
* Corresponding author.E-mail address: [email protected] (Y.-I. Lee).
ing gas, gas kinds and pressure, give influences to theplasma [1–3]. Usually, in laser ablation emission spectro-chemical analysis (LAESA), a Q-sw Nd-YAG laser ismostly used as the exciting light source for plasma genera-tion. However, depending on sample properties we shouldsearch for what type of laser is most suited.
In our previous study, we have reported that plasmaproduced by the bombardment of TEA CO2 laser hasfavorable characteristics for spectrochemical analysis eventhough it is produced at atmospheric pressure [4,5]. Basedon a series of our works on the generation mechanism ofthe laser-induced plasmas [6,7], we concluded that shockwaves play an important role in exciting the atoms.

Y.-I. Lee et al. / Current Applied Physics 7 (2007) 540–546 541
In this paper, we demonstrate a TEA CO2 laser is supe-rior to other lasers for analyzing certain samples such asthin film attached on a metal surface. It should be stressedthat the metal surface has never been ablated under thelaser bombardment. Because the threshold of power den-sity in plasma generation is higher for the metal surfacethan that for the film attached to the metal surface. Thus,the film material can be effectively atomized to producelaser plasma, and as a result a high sensitive analysis canbe potentially realized. We concluded that this metal platesurface works only as a sub-target. It is assumed that whenthe hard sub-target is placed on the back in tight contactwith the thin soft film sample, the forward momentum ofthe gushed atoms is enhanced by repulsion force supportedby the hard sub-target, inducing a strong shock wave. As aresult, the ablated atom from the film is excited effectively.On the other hand, it was observed that when the thicknessof the soft sample becomes large, the plasma is very weak.It is probably due to the fact that for the thick soft sample,the expulsion of atoms by the surface is weakened becausethe softened surface absorbs the recoil energy and theatoms gushing from the primary plasma do not acquire suf-ficient speed to form a shock wave, by which atoms areexcited. In this paper we present several applications of filmanalysis using the sub-target effect.
2. Experimental procedure
Fig. 1 is the experimental setup used in this study toobserve the plasma emission. The TEA CO2 laser is a Shi-buya SQ-2000 laser, commercially produced for lasermarking. The laser light from the TEA CO2 laser (pulseenergy 3 J, wavelength 10.6 lm, pulse duration 200 ns infull width half maximum, beam cross section 30 mm ·30 mm) was focused through a ZnSe window, on a sampleusing a ZnSe lens with a focal length of 100 mm after thelaser energy was reduced to 500 mJ by inserting an aperture
Fig. 1. Experim
in front of the focusing lens. The spot size was0.5 mm · 0.5 mm for the tight focus, which results in apower density of 1.6 · 108 W/cm2. The laser was operatedat 5 Hz, and depending on experiment, in some cases thelaser was operated at 1 Hz for shot-by-shot data acquisi-tions. Depending on experiment, laser irradiation wasmade under tight focus condition. The shot-to-shot fluctu-ation of the laser pulses energy was about 3%.
The samples were placed in a vacuum tight metal cham-ber (12 cm · 12 cm · 12 cm), which could be evacuatedwith a vacuum pump and could be filled with air and highpurity He gas (99.999%). The pressure in the chamber wascontrolled at the desired gas pressure. Gas flow through thechamber was regulated by a needle valve in the gas line anda valve in the pumping line. The chamber pressure wasmeasured precisely with the use of a digital pressure gauge.The pressure used in this experiment was 1 Torr during thisstudy unless stated elsewhere. The sample, together withthe entire chamber and ZnSe lens, could be moved in twodirections by the use of a step motor for movement inthe laser beam direction and a micrometer for movementperpendicular to the laser beam direction. Depending onexperiment, the film sample was rotated during the laserbombardment, so that the analysis was always made on anew position. While the emission intensities of the plasmawere detected through an optical window of the chamberat right angle of the laser beam.
In order to obtain a plasma emission spectrum, plasmaradiation was detected by an OMA system (Atago Macs-320) consisting of a 0.32 m focal-length spectrograph witha grating of 1200 groves/mm, a 1024-channel photodiodedetector array, and a micro-channel plate image intensifier.The spectral resolution of the OMA system is 0.18 nm. Thelight emitted from the laser plasma was collected by anoptical fiber (h = 27� in solid angle) and fed into the OMAsystem. One end of the fiber was placed 15 cm apart fromthe focusing point of the laser light and set perpendicular
ental setup.

0
5000
10000
15000
20000
25000
30000
35000
400 500 600 700 800 900 1000
Wavelength (nm)
Em
issi
on I
nten
sity
(co
unts
)
Hα 656.2 nm
OI 777.4nm
Laser energy : 500mJSample : WaterPressure : 1Torr
Fig. 3. Hydrogen and oxygen emission spectra taken from watermolecular layer on a copper plate, exposed to room atmospherebeforehand.
542 Y.-I. Lee et al. / Current Applied Physics 7 (2007) 540–546
to the direction of the laser beam. In this experiment theOMA system was used in the time integrated mode by set-ting the exposure time 1 s.
3. Results and discussion
3.1. Water molecular layer analysis
It is well known that a metal surface is always coveredby a molecular layer of water coming from the atmosphereunder an ordinary condition. Therefore, it is naturallyexpected that hydrogen emission and oxygen emissioncan be detected from such layer because the water mole-cules has a high absorbance at wavelength of TEA CO2
laser light. In fact, a strong Ha emission is easily obtainedwhen a TEA CO2 laser is focused on a metal plate surfacesuch as copper. This measurement was conducted at thelow pressure regime of around 1 Torr, because as alreadyreported elsewhere at atmospheric pressure Ha undergoesa severe line broadening and drastic diminishing in emis-sion efficiency [8–10].
Fig. 2 shows a series of the photographs of the laserplasma due to the water molecular layer on a copper platetaken for the 1st, 2nd, and 3rd shots, consecutively. Thecopper plate used in this experiment was exposed before-hand to the atmosphere in a room for a certain period.At the first shot, the plasma is very bright with a red color,which is mainly due to Ha emission, and with a plasma sizeof around 15 mm in diameter. At the second shot, theplasma becomes weak because the surface water wasalmost removed by the first shot of laser irradiation. Forthe third shot, the plasma is already negligibly weak. How-ever, if we shift the sample to a new surface position, astrong and bright plasma is produced again in the samefeatures as observed before. It should be mentioned thatin this case, the copper plate itself has never been ablatedand had no damage on the surface. It means the copperplate acts only as a sub-target to generate the plasma.
Fig. 3 shows the spectra taken from the copper plateexposed to air for 30 min in a room with a humidity of77% and a temperature of 15 �C. The spectra were takenby accumulating from one shot to five shots using the laserpulse with an energy of 500 mJ. The spectra were taken
Fig. 2. Photographs of the laser plasma taken from the water molecula
using the low resolution grating (150 grooves per mm) inOMA system to detect hydrogen and oxygen simulta-neously. The sensitivity of the OMA system at the wave-length region of oxygen is lower than that of thehydrogen region. It can be seen that Ha (656.2 nm) emis-sion appears together with O I 777.1 nm.
Fig. 4 shows how the hydrogen emission intensity variesdepending with the time for the copper plate to be exposedto the surrounding air. Prior to the experiment, the copperplate surface was cleaned in the vacuum tight chamber bydelivering 100 shots of laser irradiation. As illustrated inthe inserted figure, the lid of the vacuum tight chamber isremoved and the copper plate surface was exposed to theatmosphere in the room for a certain time. The hydrogenemission from the copper surface was then measured at1 Torr. This experiment was repeated by changing theexposure time. It can be seen that the hydrogen emissionincreases with the exposure time and reaches a saturationstate with a typical growth curve. This experiment wasmade under two different sets of conditions of humidityand temperature. One is a humidity of 70% and a temper-ature of 13 �C. The other is 77% and 14 �C, respectively.This kind measurement might be used for the detectionof humidity.
r layer on a copper plate at 1st, 2nd, and 3rd shots, consecutively.

0
10000
20000
30000
40000
380 390 400 410 420 430Wavelength (nm)
Em
issi
on I
nten
sity
(co
unts
)
Pb I 405.8 nm
Fig. 6. Pb emission spectra Pb I 405.8 nm taken from water containingPbCl2 in a concentration of 0.01%.
0
500
1000
1500
2000
2500
3000
0 10 20 30 40Time (min.)
Em
issi
on I
nten
sity
(co
unts
)
Temperature of 14 oC
Humidity of 77%
Temperature of 13 oC
Humidity of 70%
Fig. 4. Growth curve of the hydrogen emission intensity against exposuretime.
Y.-I. Lee et al. / Current Applied Physics 7 (2007) 540–546 543
3.2. Water impurity analysis
The surface analysis described above can be applied towater impurity analysis by a employing very simple proce-dure. As show in Fig. 5, a small amount of water to be ana-lyzed, about 1 cc, is put on a copper plate surface. Afterheating process, water impurities attaches to the copperplate surface, and then the copper plate was placed in thevacuum chamber for analysis. Laser bombardment wasmade at 2 Torr. The experiment was conducted under defo-cus condition of 8 mm.
Fig. 6 is the spectra taken from the film on the copperplate condensed by heating up from the water sample con-taining 0.01% PbCl2. It can be seen that a strong Pb emis-sion line (Pb I 405.7 nm) can be observed. Besides Pbemission line, other strong lines were also observed. Thoselines are due to Ca in the water because tap water was usedin this experiment. It should be stressed that the back-ground emission is very low; nevertheless we used anOMA without gated mode. We observed no Cu emissionlines, indicating that the Cu plate is never ablated or dam-aged, and it works only as a sub-target.
We also have introduced another method for depositingthe film of water impurities on the Cu plate sub-target,
Fig. 5. Schematic diagram explaining the procedure for preparing a filmsample of a water impurity.
namely electrodeposition method. As we reported in a pre-vious paper, it is very effective to analyze the impuritiescontained in water by the electrolysis method, utilizingthe sub-target effect [11]. We have devised a new electrodeconfiguration to realize a high sensitive elemental analysison relatively pure water sample using the electro-depositionmethod. In order to increase sensitivity, the density ofdeposited material should be increased. For this purposewe employed a thin rod electrode with a diameter of2 mm as a cathode as depicted in Fig. 7. While a nickel pipewith a diameter of 32 mm was used as an anode as alsoshown in Fig. 7. By this method it is supposed that the
Fig. 7. Schematic diagram for electrolysis method with a cylindricalelectrode configuration.
0
100
200
300
400
500
600
700
800
265 270 275 280 285 290 295 300 305Wavelength (nm)
Em
issi
on I
nten
sity
(co
unts
)
Mg II 280.26 nm
Fig. 8. The emission spectrum of Mg I 405.8 nm taken from a film on acopper plate, electrodeposited from a high purity water, melted from snowcollected from Hokuriku region in Japan during a winter season.
0
10000
20000
30000
40000
210 220 230 240 250 260 270 280Wavelength (nm)
Em
issi
on I
nten
sity
(co
unts
) C I 247.85 nm
0
10000
20000
30000
40000
370 380 390 400 410 420 430 440Wavelength (nm)
Em
issi
on I
nten
sity
(co
unts
)
no Ca emission lines
Ca II 393.36 nm
Ca II 396.84 nm
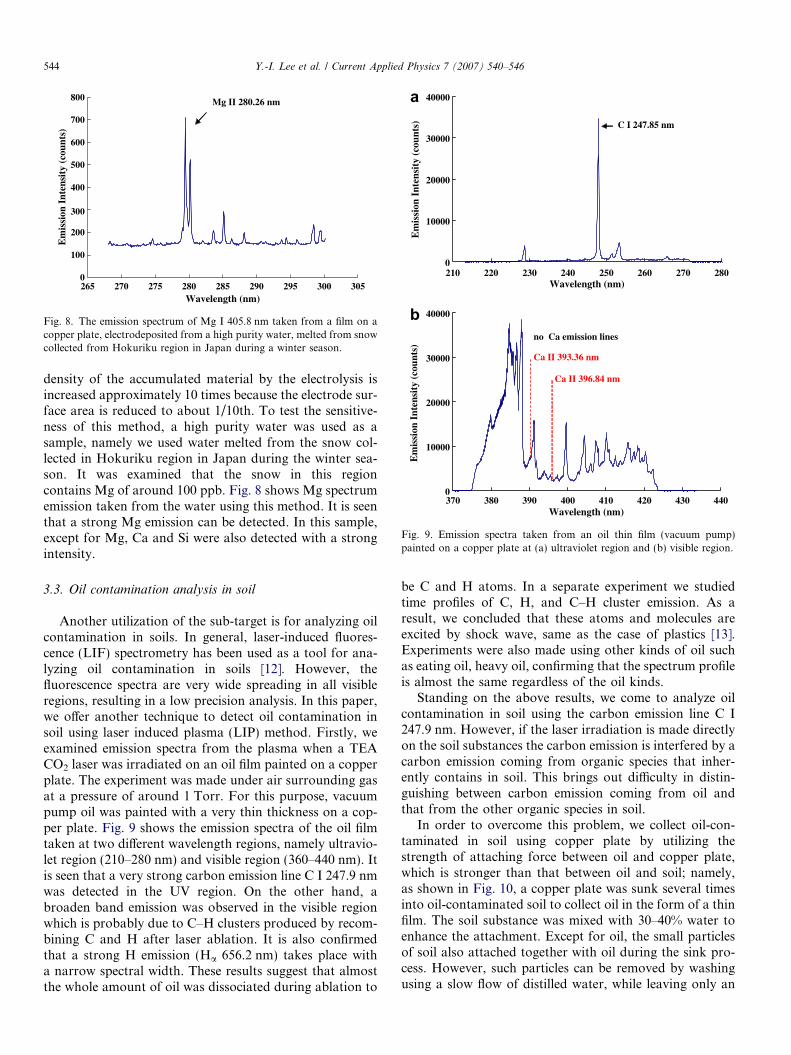
Fig. 9. Emission spectra taken from an oil thin film (vacuum pump)painted on a copper plate at (a) ultraviolet region and (b) visible region.
544 Y.-I. Lee et al. / Current Applied Physics 7 (2007) 540–546
density of the accumulated material by the electrolysis isincreased approximately 10 times because the electrode sur-face area is reduced to about 1/10th. To test the sensitive-ness of this method, a high purity water was used as asample, namely we used water melted from the snow col-lected in Hokuriku region in Japan during the winter sea-son. It was examined that the snow in this regioncontains Mg of around 100 ppb. Fig. 8 shows Mg spectrumemission taken from the water using this method. It is seenthat a strong Mg emission can be detected. In this sample,except for Mg, Ca and Si were also detected with a strongintensity.
3.3. Oil contamination analysis in soil
Another utilization of the sub-target is for analyzing oilcontamination in soils. In general, laser-induced fluores-cence (LIF) spectrometry has been used as a tool for ana-lyzing oil contamination in soils [12]. However, thefluorescence spectra are very wide spreading in all visibleregions, resulting in a low precision analysis. In this paper,we offer another technique to detect oil contamination insoil using laser induced plasma (LIP) method. Firstly, weexamined emission spectra from the plasma when a TEACO2 laser was irradiated on an oil film painted on a copperplate. The experiment was made under air surrounding gasat a pressure of around 1 Torr. For this purpose, vacuumpump oil was painted with a very thin thickness on a cop-per plate. Fig. 9 shows the emission spectra of the oil filmtaken at two different wavelength regions, namely ultravio-let region (210–280 nm) and visible region (360–440 nm). Itis seen that a very strong carbon emission line C I 247.9 nmwas detected in the UV region. On the other hand, abroaden band emission was observed in the visible regionwhich is probably due to C–H clusters produced by recom-bining C and H after laser ablation. It is also confirmedthat a strong H emission (Ha 656.2 nm) takes place witha narrow spectral width. These results suggest that almostthe whole amount of oil was dissociated during ablation to
be C and H atoms. In a separate experiment we studiedtime profiles of C, H, and C–H cluster emission. As aresult, we concluded that these atoms and molecules areexcited by shock wave, same as the case of plastics [13].Experiments were also made using other kinds of oil suchas eating oil, heavy oil, confirming that the spectrum profileis almost the same regardless of the oil kinds.
Standing on the above results, we come to analyze oilcontamination in soil using the carbon emission line C I247.9 nm. However, if the laser irradiation is made directlyon the soil substances the carbon emission is interfered by acarbon emission coming from organic species that inher-ently contains in soil. This brings out difficulty in distin-guishing between carbon emission coming from oil andthat from the other organic species in soil.
In order to overcome this problem, we collect oil-con-taminated in soil using copper plate by utilizing thestrength of attaching force between oil and copper plate,which is stronger than that between oil and soil; namely,as shown in Fig. 10, a copper plate was sunk several timesinto oil-contaminated soil to collect oil in the form of a thinfilm. The soil substance was mixed with 30–40% water toenhance the attachment. Except for oil, the small particlesof soil also attached together with oil during the sink pro-cess. However, such particles can be removed by washingusing a slow flow of distilled water, while leaving only an

Chemical vessel (~500 ml)
Soil Sample
Copper Plate
Washing Out
Drying
Oil Attaching
Drier
Flowing Water
Fig. 10. Schematic diagram showing procedure for preparation of the oilfilm sample on a copper plate.
Em
issi
on I
nten
sity
(co
unts
)E
mis
sion
Int
ensi
ty (
coun
ts)
Em
issi
on I
nten
sity
(co
unts
)
Wavelength (nm)
Wavelength (nm)
Wavelength (nm)
210 230 250 270
210
10000
230 250 270
210 230 250 270
8000
6000
4000
2000
0
10000
8000
6000
4000
2000
0
10000
8000
6000
4000
2000
0
Fig. 11. Carbon emission spectra taken from soil contaminated by oil inconcentration of (a) 1000 ppm, (b) 500 ppm and (c) 50 ppm, respectively.
Y.-I. Lee et al. / Current Applied Physics 7 (2007) 540–546 545
oil film on the copper plate surface. Because the oil attachesto the copper plate surface more tightly rather than thesmall soil particles. The copper plate with the oil film wasthen dried up and placed in a vacuum chamber to be irra-diated with TEA CO2 laser. The laser irradiation was con-ducted at a surrounding gas pressure of about 1 Torr undertight focus condition with rotating sample so that laserirradiation is always made on the new position.
Fig. 11 shows the emission spectra taken from copperplate, which sunk into a sandy soil containing oil of1000 ppm, 500 ppm and 50 ppm, respectively. Since forsandy soil the amount of organic species is rather less, wesucceeded to make a calibration curve by this simplemethod, resulting in a good linear relationship betweencarbon emission intensity and oil concentration in soil ina range from 2000 to 50 ppm. At this experimental stage,the detection limit is estimated to be approximately20 ppm for the sandy soil.
However, in more actual soil samples, it containsorganic species in high concentration. It is found that forsuch soil substances, organic species still remains embed-ded in the film on the copper plate surface even after thewashing out process, bringing about a severe interferenceto the analytical results. To avoid such an interference,we compensate contribution carbon emission coming fromother organic species using Ca emission lines becauseorganic species containing in the soil mostly comes fromspoilt leaves and trees and they inherently contain Ca ina high concentration of about 2%. On the other hand,the oil does not contain Ca, therefore, the Ca line can beused for compensation to obtain the actual carbon emis-sion only from the oil.
To know the emission intensity ratio between carbonand calcium coming from organic species we used greentea leaves powder thinly painted on a copper plate.Fig. 12a shows C emission spectra taken from the sample,while Ca emission lines are shown in Fig. 12b. It was con-firmed that the ratio between carbon emission and calciumemission intensities is almost constant regardless of leafkinds. We also checked this ratio on organic contained inthe soil substance, confirming that the result is the same
as observed for the green tea leave powder. Based on theseresults we developed an equation to compensate theorganic interference, as follows
ICðoilÞ ¼ I ðobsÞ � aICaðobsÞ ð1Þ
where IC(oil) is the actual carbon emission intensity due tothe oil, IC(obs) is the observed carbon emission from theoil-contaminated-soil substance, and ICa(obs) is the ob-served Ca emission from the oil-contaminated-soil sub-stance, and a is IC/ICa; namely, the ratio between Caemission intensity (ICa) and C emission intensity (IC) taken

Wavelength (nm)
Em
issi
on I
nten
sity
(a.
u.)
0
8000
16000
24000
32000
370 380 390 400 410 420 430 440Wavelength (nm)
Em
issi
on I
nten
sity
(a.
u.) Ca II 393.36 nm
Ca II 393.84 nm
16000
12000
8000
6000
220 230 240 250 2600
C I 247.85 nm
Fig. 12. Emission spectra taken from green tea leave powder painted on acopper plate in (a) ultraviolet region and (b) visible region.
546 Y.-I. Lee et al. / Current Applied Physics 7 (2007) 540–546
from the green tea leave powder and the value was 0.6 inthis experiment.
Fig. 13 is a calibration curve taken from a soil samplemade by mixing sandy soil and black soil (garden soil) ina proportion of 3:1. As shown in curve a there is no linearrelationship between C emission intensity, and the oil con-centration in soil, however, by employing compensation
0
5000
10000
15000
20000
0 500 1000 1500 2000Oil Concentration (ppm)
Em
issi
on I
nten
sity
(co
unts
) a
b
Fig. 13. Calibration curve taken from a sample substance prepared bymixing sandy soil and black soil (garden soil) in a proportion 3:1; (a)without compensation and (b) with compensation.
method using the above Eq. (1), the curve becomes linearas shown in curve b.
We also attempted to make an analysis on heavy oilscontained in soils. As a result, it was found that due toits higher viscosity, the attaching force of the oil is ratherlow. Consequently, analytical sensitivity becomes worsethan for other oils.
One of the weak points of this method is that dependingon the type of soil, the attaching efficiency of oil to the cop-per plate sub-target is different. Therefore, we shouldderive a factor for taking into account the difference inthe attaching force. For this purpose, the soil substanceshould be mixed intentionally with a certain concentrationof oil prior to actual oil contamination analysis.
4. Conclusions
It is confirmed that a TEA CO2 laser is well suited tomake the elemental analysis on the thin film on a metal sur-face. The metal surface has no ablation and no damage andit acts only as a sub-target to induce strong shock waves.As practical application of this technique, it was conductedsome experiments on water analysis, and oil analysis insoils. Although further study is required, it is believed thatthis technique will be used as a rapid elemental quantitativeanalysis on film samples.
Acknowledgement
This paper was supported by the international collabo-rative research funds of Chonbuk National University(ICR-2006), 2006.
References
[1] E. Tognoni, V. Palleschi, M. Corsi, G. Cristoforetti, Spectrochim.Acta B 57 (2002) 1115–1130.
[2] J.M. Vadillo, J.J. Laserna, Spectrochim. Acta B 59 (2004) 147–161.[3] K. Niemax, Fresenius J. Anal. Chem. 370 (2001) 332–340.[4] W. Hardjoutomo, H. Munechika, H. Kurniawan, I. Hattori, T.
Kobayashi, K. Kagawa, Opt. Laser Tech. 24 (1992) 273–277.[5] K. Kagawa, N. Idris, M. Wada, H. Kurniawan, K. Tsuyuki, S.
Miura, Appl. Spectrosc. 58 (2004) 887–896.[6] K. Kagawa, K. Kawai, M. Tani, T. Kobayashi, Appl. Spectrosc. 48
(1994) 198.[7] W.S. Budi, H. Suyanto, H. Kurniawan, M.O. Tjia, K. Kagawa, Appl.
Spectrosc. 53 (1999) 719–730.[8] N. Idris, S. Terai, T.J. Lie, H. Kurniawan, T. Kobayashi, K. Kagawa,
T. Maruyama, Appl. Spectrosc. 59 (1) (2005) 115–120.[9] H. Kurniawan, T.J. Lie, N. Idris, T. Kobayashi, H. Suyanto, T.
Maruyama, K. Kagawa, J. Appl. Phys. 96 (3) (2004) 1301–1309.[10] N. Idris, H. Kurniawan, T.J. Lie, M. Pardede, H. Suyanto, R.
Hedwig, T. Kobayashi, K. Kagawa, T. Maruyama, Jpn. J. Appl.Phys. 43 (2004) 4221–4228.
[11] M. Pardede, H. Kurniawan, M.O. Tjia, K. Ikezawa, T. Maruyama,K. Kagawa, Appl. Spectrosc. 55 (2001) 1229–1236.
[12] S. Svanberg, Molecular and Molecular Spectroscopy, SpringerVerlag, Berlin, 1992.
[13] M.M. Suliyanti, S. Sardy, A. Kusnowo, R. Hedwig, S.N. Abdulma-djid, K.H. Kurniawan, T.J. Lie, M. Pardede, K. Kagawa, M.O. Tjia,J. Appl. Phys. 97 (1–9) (2005) 053305.


![Synthesis and Characterization of LiFePO[sub 4] and LiTi[sub 0.01]Fe[sub 0.99]PO[sub 4] Cathode Materials](https://static.fdokumen.com/doc/165x107/631dae063dc6529d5d079742/synthesis-and-characterization-of-lifeposub-4-and-litisub-001fesub-099posub.jpg)