SU P P LY O F B LO O D FO R TR A N SFU SIO N IN TH ...
190
-
Upload
khangminh22 -
Category
Documents
-
view
5 -
download
0
Transcript of SU P P LY O F B LO O D FO R TR A N SFU SIO N IN TH ...
SUPPLY O
F BLOO
D FO
R TRAN
SFUSIO
N IN
THE CA
RIBBEAN
AN
D LATIN
AM
ERICAN
COU
NTRIES
2006, 2007, 2008, AN
D 2009
NDIN
A LUTS
O
R
OPS
AHO
NDIN
P
E
O V I M U
P
NDIN
A LUTS
O
R
OPS
AHO
NDIN
P
E
O V I M U
P
PAHO HQ Library Cataloguing-in-Publication
Pan American Health Organization. Area of Health System Based on Primary Health Care. Medicines and HealthTechnologies.
“Supply of Blood for Transfusion in the Caribbean and Latin American Countries in 2006, 2007, 2008, and 2009:Progress since 2005 of the Regional Plan of Action for Transfusion Safety”.
Washington, D.C.: PAHO, © 2010.
(Technical Documents, Monitoring and Evaluation (HSS/MT/2010/01ENG).
ISBN 978-92-75-33159-6
I. Title
1. BLOOD BANKS – supply and distribution2. BLOOD TRANSFUSION – trends3. REGIONAL STRATEGIES4. LATIN AMERICA5. CARIBBEAN REGION
NLM WB356
Data compiled by José Ramiro CruzSupport in the preparation Sonia M. JamesLayout Quyen Nguyen
The Pan American Health Organization welcomes requests for permission to reproduce or translate its publica-tions, in part or in full. Applications and inquiries should be addressed to Editorial Services, Area of KnowledgeManagement and Communications (KMC), Pan American Health Organization, Washington, D.C., U.S.A., which willbe glad to provide the latest information on any changes made to the text, plans for new editions, and reprintsand translations already available.
©Pan American Health Organization, 2010
Publications of the Pan American Health Organization enjoy copyright protection in accordance with the provi-sions of Protocol 2 of the Universal Copyright Convention. All rights are reserved.
The designations employed and the presentation of the material in this publication do not imply the expressionof any opinion whatsoever on the part of the Secretariat of the Pan American Health Organization concerning thestatus of any country, territory, city or area or of its authorities, or concerning the delimitation of its frontiers orboundaries.
The mention of specific companies or of certain manufacturers' products does not imply that they are endorsedor recommended by the Pan American Health Organization in preference to others of a similar nature that arenot mentioned. Errors and omissions excepted, the names of proprietary products are distinguished by initialcapital letters.
INTRODUCTION . . . . . . . . . . . . . . . . . . . . . . . . . . . . . . . . . . . . . . . . . . . . . . . . . . . . . . . . . . . . . . . . . . . . . . . . . . . . . . . . . . . . . . .7
COUNTRY CODES AND ABBREVIATIONS . . . . . . . . . . . . . . . . . . . . . . . . . . . . . . . . . . . . . . . . . . . . . . . . . . . . . . . . . . . . . .11
2006SUMMARY . . . . . . . . . . . . . . . . . . . . . . . . . . . . . . . . . . . . . . . . . . . . . . . . . . . . . . . . . . . . . . . . . . . . . . . . . . . . . . . . . . . . . . . . . . .14
CARIBBEAN COUNTRIES
1. Blood collection . . . . . . . . . . . . . . . . . . . . . . . . . . . . . . . . . . . . . . . . . . . . . . . . . . . . . . . . . . . . . . . . . . . . . . . . . . . . . . . . . . . . .152. Blood collection from allogeneic donors . . . . . . . . . . . . . . . . . . . . . . . . . . . . . . . . . . . . . . . . . . . . . . . . . . . . . . . . . . . . .163. Selection of allogeneic donors (Number) . . . . . . . . . . . . . . . . . . . . . . . . . . . . . . . . . . . . . . . . . . . . . . . . . . . . . . . . . . . . .164. Selection of allogeneic donors (Percentage) . . . . . . . . . . . . . . . . . . . . . . . . . . . . . . . . . . . . . . . . . . . . . . . . . . . . . . . . . .175. Efficiency of blood processing . . . . . . . . . . . . . . . . . . . . . . . . . . . . . . . . . . . . . . . . . . . . . . . . . . . . . . . . . . . . . . . . . . . . . . .176. Coverage (%) of screening for infectious markers . . . . . . . . . . . . . . . . . . . . . . . . . . . . . . . . . . . . . . . . . . . . . . . . . . . .187. Number of units not tested for infectious markers . . . . . . . . . . . . . . . . . . . . . . . . . . . . . . . . . . . . . . . . . . . . . . . . . . .188. Proportion (%) of reactive/positive units . . . . . . . . . . . . . . . . . . . . . . . . . . . . . . . . . . . . . . . . . . . . . . . . . . . . . . . . . . . .199. Availability of blood components (Number) . . . . . . . . . . . . . . . . . . . . . . . . . . . . . . . . . . . . . . . . . . . . . . . . . . . . . . . . . .1910. Availability of blood components (Percentage) . . . . . . . . . . . . . . . . . . . . . . . . . . . . . . . . . . . . . . . . . . . . . . . . . . . . . .2011. Organization of the national blood system . . . . . . . . . . . . . . . . . . . . . . . . . . . . . . . . . . . . . . . . . . . . . . . . . . . . . . . . . . .2112. Countries with 100% screening for infectious markers . . . . . . . . . . . . . . . . . . . . . . . . . . . . . . . . . . . . . . . . . . . . . .23
LATIN AMERICAN COUNTRIES
1. Blood collection . . . . . . . . . . . . . . . . . . . . . . . . . . . . . . . . . . . . . . . . . . . . . . . . . . . . . . . . . . . . . . . . . . . . . . . . . . . . . . . . . . . . .242. Blood collection from allogeneic donors . . . . . . . . . . . . . . . . . . . . . . . . . . . . . . . . . . . . . . . . . . . . . . . . . . . . . . . . . . . . .243. Selection of allogeneic donors (Number) . . . . . . . . . . . . . . . . . . . . . . . . . . . . . . . . . . . . . . . . . . . . . . . . . . . . . . . . . . . . .254. Selection of allogeneic donors (Percentage) . . . . . . . . . . . . . . . . . . . . . . . . . . . . . . . . . . . . . . . . . . . . . . . . . . . . . . . . . .255. Efficiency of blood processing . . . . . . . . . . . . . . . . . . . . . . . . . . . . . . . . . . . . . . . . . . . . . . . . . . . . . . . . . . . . . . . . . . . . . . .266. Coverage (%) of screening for infectious markers . . . . . . . . . . . . . . . . . . . . . . . . . . . . . . . . . . . . . . . . . . . . . . . . . . . .267. Number of units not tested for infectious markers . . . . . . . . . . . . . . . . . . . . . . . . . . . . . . . . . . . . . . . . . . . . . . . . . . .278. Proportion (%) of reactive/positive units . . . . . . . . . . . . . . . . . . . . . . . . . . . . . . . . . . . . . . . . . . . . . . . . . . . . . . . . . . . .279. Availability of blood components (Number) . . . . . . . . . . . . . . . . . . . . . . . . . . . . . . . . . . . . . . . . . . . . . . . . . . . . . . . . . .2810. Availability of blood components (Percentage) . . . . . . . . . . . . . . . . . . . . . . . . . . . . . . . . . . . . . . . . . . . . . . . . . . . . . .2911. Organization of the national blood system . . . . . . . . . . . . . . . . . . . . . . . . . . . . . . . . . . . . . . . . . . . . . . . . . . . . . . . . . . .2912. Countries with 100% screening for infectious markers . . . . . . . . . . . . . . . . . . . . . . . . . . . . . . . . . . . . . . . . . . . . . .31
NATIONAL STAFF WHO SUMBITTED OFFICIAL REPORTS TO THE PAN AMERICAN HEALTH
ORGANIZATION . . . . . . . . . . . . . . . . . . . . . . . . . . . . . . . . . . . . . . . . . . . . . . . . . . . . . . . . . . . . . . . . . . . . . . . . . . . . . . . . . . . . . .32
2007SUMMARY . . . . . . . . . . . . . . . . . . . . . . . . . . . . . . . . . . . . . . . . . . . . . . . . . . . . . . . . . . . . . . . . . . . . . . . . . . . . . . . . . . . . . . . . . . .38
CARIBBEAN COUNTRIES
1. Blood collection . . . . . . . . . . . . . . . . . . . . . . . . . . . . . . . . . . . . . . . . . . . . . . . . . . . . . . . . . . . . . . . . . . . . . . . . . . . . . . . . . . . . .392. Blood collection from allogeneic donors . . . . . . . . . . . . . . . . . . . . . . . . . . . . . . . . . . . . . . . . . . . . . . . . . . . . . . . . . . . . .403. Selection of allogeneic donors (Number) . . . . . . . . . . . . . . . . . . . . . . . . . . . . . . . . . . . . . . . . . . . . . . . . . . . . . . . . . . . . .404. Selection of allogeneic donors (Percentage) . . . . . . . . . . . . . . . . . . . . . . . . . . . . . . . . . . . . . . . . . . . . . . . . . . . . . . . . . .415. Efficiency of blood processing . . . . . . . . . . . . . . . . . . . . . . . . . . . . . . . . . . . . . . . . . . . . . . . . . . . . . . . . . . . . . . . . . . . . . . .416. Coverage (%) of screening for infectious markers . . . . . . . . . . . . . . . . . . . . . . . . . . . . . . . . . . . . . . . . . . . . . . . . . . . .427. Number of units not tested for infectious markers . . . . . . . . . . . . . . . . . . . . . . . . . . . . . . . . . . . . . . . . . . . . . . . . . . .42
TABLE OF CONTENTS
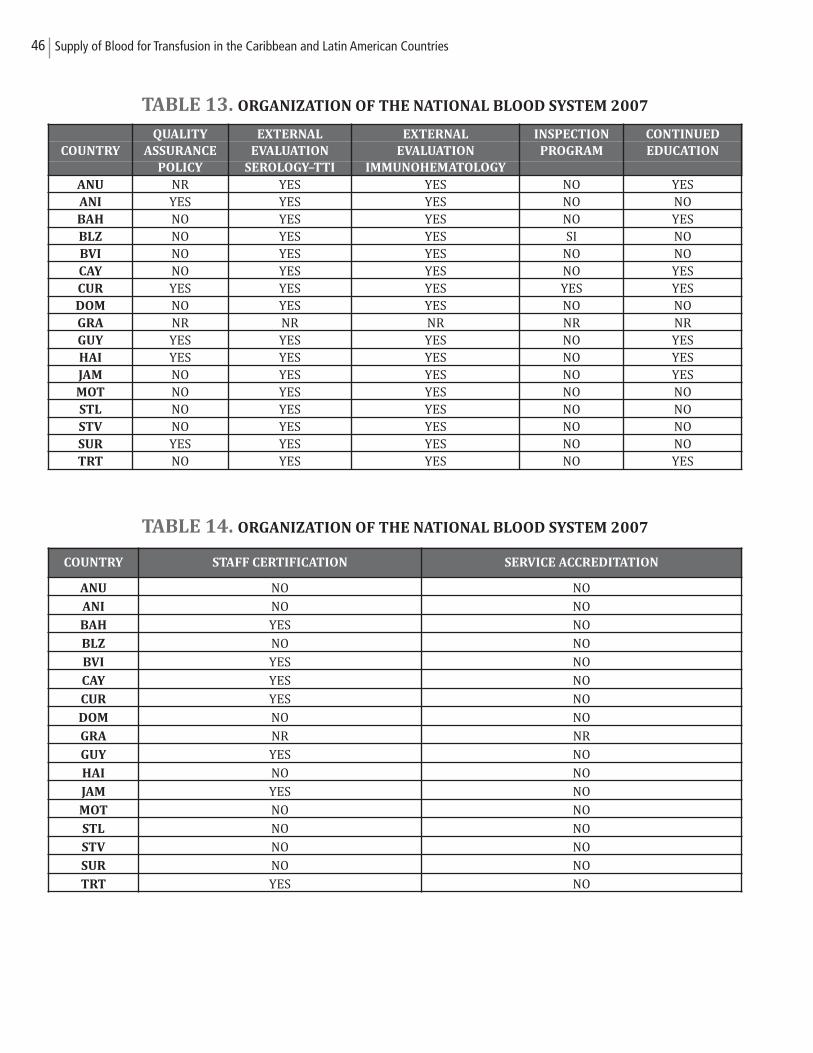
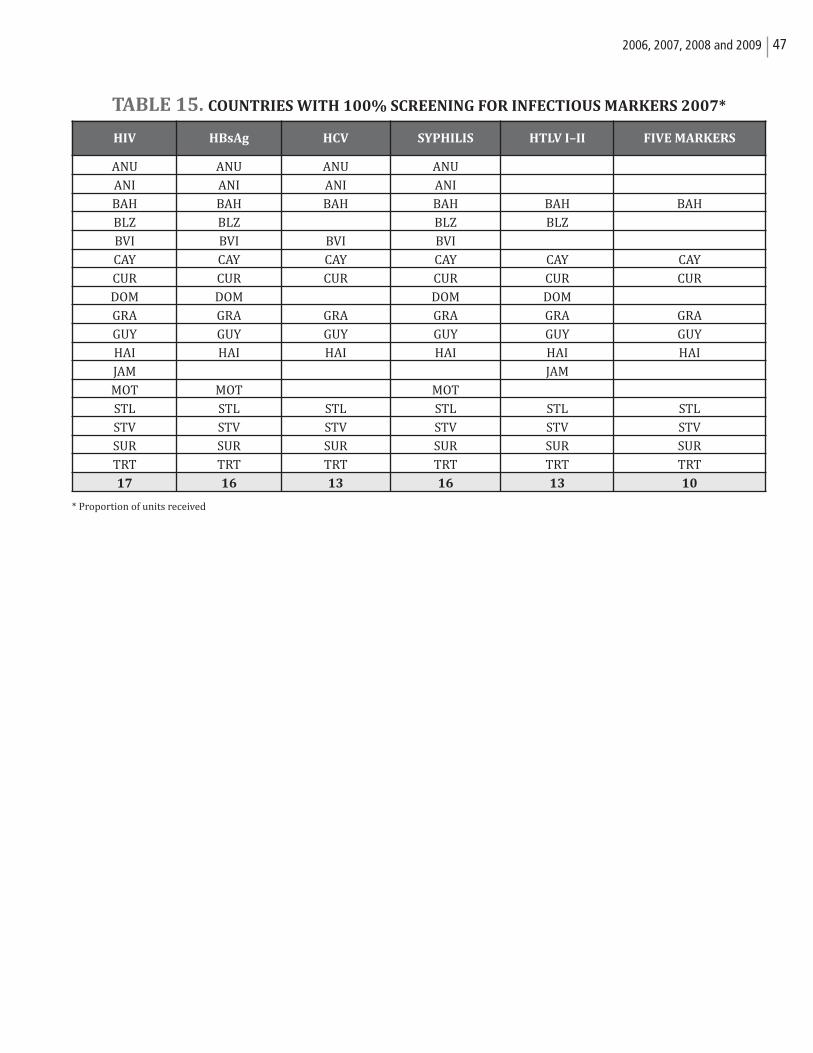
8. Proportion (%) of reactive/positive units . . . . . . . . . . . . . . . . . . . . . . . . . . . . . . . . . . . . . . . . . . . . . . . . . . . . . . . . . . . .439. Availability of blood components (Number) . . . . . . . . . . . . . . . . . . . . . . . . . . . . . . . . . . . . . . . . . . . . . . . . . . . . . . . . . .4310. Availability of blood components (Percentage) . . . . . . . . . . . . . . . . . . . . . . . . . . . . . . . . . . . . . . . . . . . . . . . . . . . . . .4411. Organization of the national blood system . . . . . . . . . . . . . . . . . . . . . . . . . . . . . . . . . . . . . . . . . . . . . . . . . . . . . . . . . . .4512. Countries with 100% screening for infectious markers . . . . . . . . . . . . . . . . . . . . . . . . . . . . . . . . . . . . . . . . . . . . . .47
LATIN AMERICAN COUNTRIES
1. Blood collection . . . . . . . . . . . . . . . . . . . . . . . . . . . . . . . . . . . . . . . . . . . . . . . . . . . . . . . . . . . . . . . . . . . . . . . . . . . . . . . . . . . . .482. Blood collection from allogeneic donors . . . . . . . . . . . . . . . . . . . . . . . . . . . . . . . . . . . . . . . . . . . . . . . . . . . . . . . . . . . . .483. Selection of allogeneic donors (Number) . . . . . . . . . . . . . . . . . . . . . . . . . . . . . . . . . . . . . . . . . . . . . . . . . . . . . . . . . . . . .494. Selection of allogeneic donors (Percentage) . . . . . . . . . . . . . . . . . . . . . . . . . . . . . . . . . . . . . . . . . . . . . . . . . . . . . . . . . .495. Efficiency of blood processing . . . . . . . . . . . . . . . . . . . . . . . . . . . . . . . . . . . . . . . . . . . . . . . . . . . . . . . . . . . . . . . . . . . . . . .506. Coverage (%) of screening for infectious markers . . . . . . . . . . . . . . . . . . . . . . . . . . . . . . . . . . . . . . . . . . . . . . . . . . . .507. Number of units not tested for infectious markers . . . . . . . . . . . . . . . . . . . . . . . . . . . . . . . . . . . . . . . . . . . . . . . . . . .518. Proportion (%) of reactive/positive units . . . . . . . . . . . . . . . . . . . . . . . . . . . . . . . . . . . . . . . . . . . . . . . . . . . . . . . . . . . .519. Availability of blood components (Number) . . . . . . . . . . . . . . . . . . . . . . . . . . . . . . . . . . . . . . . . . . . . . . . . . . . . . . . . . .5210. Availability of blood components (Percentage) . . . . . . . . . . . . . . . . . . . . . . . . . . . . . . . . . . . . . . . . . . . . . . . . . . . . . .5311. Organization of the national blood system . . . . . . . . . . . . . . . . . . . . . . . . . . . . . . . . . . . . . . . . . . . . . . . . . . . . . . . . . . .5312. Countries with 100% screening for infectious markers . . . . . . . . . . . . . . . . . . . . . . . . . . . . . . . . . . . . . . . . . . . . . .55
NATIONAL STAFF WHO SUMBITTED OFFICIAL REPORTS TO THE PAN AMERICAN HEALTH
ORGANIZATION . . . . . . . . . . . . . . . . . . . . . . . . . . . . . . . . . . . . . . . . . . . . . . . . . . . . . . . . . . . . . . . . . . . . . . . . . . . . . . . . . . . . . .56
2008SUMMARY . . . . . . . . . . . . . . . . . . . . . . . . . . . . . . . . . . . . . . . . . . . . . . . . . . . . . . . . . . . . . . . . . . . . . . . . . . . . . . . . . . . . . . . . . . .62
CARIBBEAN COUNTRIES
1. Blood collection . . . . . . . . . . . . . . . . . . . . . . . . . . . . . . . . . . . . . . . . . . . . . . . . . . . . . . . . . . . . . . . . . . . . . . . . . . . . . . . . . . . . .632. Blood collection from allogeneic donors . . . . . . . . . . . . . . . . . . . . . . . . . . . . . . . . . . . . . . . . . . . . . . . . . . . . . . . . . . . . .643. Selection of allogeneic donors (Number) . . . . . . . . . . . . . . . . . . . . . . . . . . . . . . . . . . . . . . . . . . . . . . . . . . . . . . . . . . . . .644. Selection of allogeneic donors (Percentage) . . . . . . . . . . . . . . . . . . . . . . . . . . . . . . . . . . . . . . . . . . . . . . . . . . . . . . . . . .655. Efficiency of blood processing . . . . . . . . . . . . . . . . . . . . . . . . . . . . . . . . . . . . . . . . . . . . . . . . . . . . . . . . . . . . . . . . . . . . . . .656. Coverage (%) of screening for infectious markers . . . . . . . . . . . . . . . . . . . . . . . . . . . . . . . . . . . . . . . . . . . . . . . . . . . .667. Number of units not tested for infectious markers . . . . . . . . . . . . . . . . . . . . . . . . . . . . . . . . . . . . . . . . . . . . . . . . . . .668. Proportion (%) of reactive/positive units . . . . . . . . . . . . . . . . . . . . . . . . . . . . . . . . . . . . . . . . . . . . . . . . . . . . . . . . . . . .679. Availability of blood components (Number) . . . . . . . . . . . . . . . . . . . . . . . . . . . . . . . . . . . . . . . . . . . . . . . . . . . . . . . . . .6710. Availability of blood components (Percentage) . . . . . . . . . . . . . . . . . . . . . . . . . . . . . . . . . . . . . . . . . . . . . . . . . . . . . .6811. Organization of the national blood system . . . . . . . . . . . . . . . . . . . . . . . . . . . . . . . . . . . . . . . . . . . . . . . . . . . . . . . . . . .6912. Countries with 100% screening for infectious markers . . . . . . . . . . . . . . . . . . . . . . . . . . . . . . . . . . . . . . . . . . . . . .71
LATIN AMERICAN COUNTRIES
1. Blood collection . . . . . . . . . . . . . . . . . . . . . . . . . . . . . . . . . . . . . . . . . . . . . . . . . . . . . . . . . . . . . . . . . . . . . . . . . . . . . . . . . . . . .722. Blood collection from allogeneic donors . . . . . . . . . . . . . . . . . . . . . . . . . . . . . . . . . . . . . . . . . . . . . . . . . . . . . . . . . . . . .723. Selection of allogeneic donors (Number) . . . . . . . . . . . . . . . . . . . . . . . . . . . . . . . . . . . . . . . . . . . . . . . . . . . . . . . . . . . . .734. Selection of allogeneic donors (Percentage) . . . . . . . . . . . . . . . . . . . . . . . . . . . . . . . . . . . . . . . . . . . . . . . . . . . . . . . . . .735. Efficiency of blood processing . . . . . . . . . . . . . . . . . . . . . . . . . . . . . . . . . . . . . . . . . . . . . . . . . . . . . . . . . . . . . . . . . . . . . . .746. Coverage (%) of screening for infectious markers . . . . . . . . . . . . . . . . . . . . . . . . . . . . . . . . . . . . . . . . . . . . . . . . . . . .747. Number of units not tested for infectious markers . . . . . . . . . . . . . . . . . . . . . . . . . . . . . . . . . . . . . . . . . . . . . . . . . . .758. Proportion (%) of reactive/positive units . . . . . . . . . . . . . . . . . . . . . . . . . . . . . . . . . . . . . . . . . . . . . . . . . . . . . . . . . . . .759. Availability of blood components (Number) . . . . . . . . . . . . . . . . . . . . . . . . . . . . . . . . . . . . . . . . . . . . . . . . . . . . . . . . . .7610. Availability of blood components (Percentage) . . . . . . . . . . . . . . . . . . . . . . . . . . . . . . . . . . . . . . . . . . . . . . . . . . . . . .77
2006, 2007, 2008 and 2009 5
11. Organization of the national blood system . . . . . . . . . . . . . . . . . . . . . . . . . . . . . . . . . . . . . . . . . . . . . . . . . . . . . . . . . . .7712. Countries with 100% screening for infectious markers . . . . . . . . . . . . . . . . . . . . . . . . . . . . . . . . . . . . . . . . . . . . . .79
NATIONAL STAFF WHO SUMBITTED OFFICIAL REPORTS TO THE PAN AMERICAN HEALTH
ORGANIZATION . . . . . . . . . . . . . . . . . . . . . . . . . . . . . . . . . . . . . . . . . . . . . . . . . . . . . . . . . . . . . . . . . . . . . . . . . . . . . . . . . . . . . .80
2009SUMMARY . . . . . . . . . . . . . . . . . . . . . . . . . . . . . . . . . . . . . . . . . . . . . . . . . . . . . . . . . . . . . . . . . . . . . . . . . . . . . . . . . . . . . . . . . . .86
CARIBBEAN COUNTRIES
1. Blood collection . . . . . . . . . . . . . . . . . . . . . . . . . . . . . . . . . . . . . . . . . . . . . . . . . . . . . . . . . . . . . . . . . . . . . . . . . . . . . . . . . . . . .872. Blood collection from allogeneic donors . . . . . . . . . . . . . . . . . . . . . . . . . . . . . . . . . . . . . . . . . . . . . . . . . . . . . . . . . . . . .883. Selection of allogeneic donors (Number) . . . . . . . . . . . . . . . . . . . . . . . . . . . . . . . . . . . . . . . . . . . . . . . . . . . . . . . . . . . . .884. Selection of allogeneic donors (Percentage) . . . . . . . . . . . . . . . . . . . . . . . . . . . . . . . . . . . . . . . . . . . . . . . . . . . . . . . . . .895. Efficiency of blood processing . . . . . . . . . . . . . . . . . . . . . . . . . . . . . . . . . . . . . . . . . . . . . . . . . . . . . . . . . . . . . . . . . . . . . . .896. Coverage (%) of screening for infectious markers . . . . . . . . . . . . . . . . . . . . . . . . . . . . . . . . . . . . . . . . . . . . . . . . . . . .907. Number of units not tested for infectious markers . . . . . . . . . . . . . . . . . . . . . . . . . . . . . . . . . . . . . . . . . . . . . . . . . . .908. Proportion (%) of reactive/positive units . . . . . . . . . . . . . . . . . . . . . . . . . . . . . . . . . . . . . . . . . . . . . . . . . . . . . . . . . . . .919. Availability of blood components (Number) . . . . . . . . . . . . . . . . . . . . . . . . . . . . . . . . . . . . . . . . . . . . . . . . . . . . . . . . . .9110. Availability of blood components (Percentage) . . . . . . . . . . . . . . . . . . . . . . . . . . . . . . . . . . . . . . . . . . . . . . . . . . . . . .9211. Organization of the national blood system . . . . . . . . . . . . . . . . . . . . . . . . . . . . . . . . . . . . . . . . . . . . . . . . . . . . . . . . . . .9312. Countries with 100% screening for infectious markers . . . . . . . . . . . . . . . . . . . . . . . . . . . . . . . . . . . . . . . . . . . . . .95
LATIN AMERICAN COUNTRIES
1. Blood collection . . . . . . . . . . . . . . . . . . . . . . . . . . . . . . . . . . . . . . . . . . . . . . . . . . . . . . . . . . . . . . . . . . . . . . . . . . . . . . . . . . . . .962. Blood collection from allogeneic donors . . . . . . . . . . . . . . . . . . . . . . . . . . . . . . . . . . . . . . . . . . . . . . . . . . . . . . . . . . . . .963. Selection of allogeneic donors (Number) . . . . . . . . . . . . . . . . . . . . . . . . . . . . . . . . . . . . . . . . . . . . . . . . . . . . . . . . . . . . .974. Selection of allogeneic donors (Percentage) . . . . . . . . . . . . . . . . . . . . . . . . . . . . . . . . . . . . . . . . . . . . . . . . . . . . . . . . . .975. Efficiency of blood processing . . . . . . . . . . . . . . . . . . . . . . . . . . . . . . . . . . . . . . . . . . . . . . . . . . . . . . . . . . . . . . . . . . . . . . .986. Coverage (%) of screening for infectious markers . . . . . . . . . . . . . . . . . . . . . . . . . . . . . . . . . . . . . . . . . . . . . . . . . . . .987. Number of units not tested for infectious markers . . . . . . . . . . . . . . . . . . . . . . . . . . . . . . . . . . . . . . . . . . . . . . . . . . .998. Proportion (%) of reactive/positive units . . . . . . . . . . . . . . . . . . . . . . . . . . . . . . . . . . . . . . . . . . . . . . . . . . . . . . . . . . . .999. Availability of blood components (Number) . . . . . . . . . . . . . . . . . . . . . . . . . . . . . . . . . . . . . . . . . . . . . . . . . . . . . . . .10010. Availability of blood components (Percentage) . . . . . . . . . . . . . . . . . . . . . . . . . . . . . . . . . . . . . . . . . . . . . . . . . . . . .10111. Organization of the national blood system . . . . . . . . . . . . . . . . . . . . . . . . . . . . . . . . . . . . . . . . . . . . . . . . . . . . . . . . . .10112. Countries with 100% screening for infectious markers . . . . . . . . . . . . . . . . . . . . . . . . . . . . . . . . . . . . . . . . . . . . .103
NATIONAL STAFF WHO SUMBITTED OFFICIAL REPORTS TO THE PAN AMERICAN HEALTH
ORGANIZATION . . . . . . . . . . . . . . . . . . . . . . . . . . . . . . . . . . . . . . . . . . . . . . . . . . . . . . . . . . . . . . . . . . . . . . . . . . . . . . . . . . . .104
INDIVIDUAL COUNTRY SUMMARIES
Caribbean countries . . . . . . . . . . . . . . . . . . . . . . . . . . . . . . . . . . . . . . . . . . . . . . . . . . . . . . . . . . . . . . . . . . . . . . . . . . . . . . . . . . .110Latin American countries . . . . . . . . . . . . . . . . . . . . . . . . . . . . . . . . . . . . . . . . . . . . . . . . . . . . . . . . . . . . . . . . . . . . . . . . . . . . . .131
SUB-REGIONAL SUMMARIES
Blood collected –Caribbean and Latin American countries . . . . . . . . . . . . . . . . . . . . . . . . . . . . . . . . . . . . . . . . . . . . .155Screened units –Caribbean and Latin American countries . . . . . . . . . . . . . . . . . . . . . . . . . . . . . . . . . . . . . . . . . . . . . .156Availability of components –Caribbean and Latin American countries . . . . . . . . . . . . . . . . . . . . . . . . . . . . . . . . . .157
ANNEX
Improving blood availability and transfusion safety in the Americas, CD48/11. Resolution CD48.R7. PAHO 48TH Directing Council, 2008 . . . . . . . . . . . . . . . . . . . . . . . . . . . . . . . . . . . . . . . . . . . . . . . . . . . . . . . . . . . . . . . . . . . .159

6 Supply of Blood for Transfusion in the Caribbean and Latin American Countries
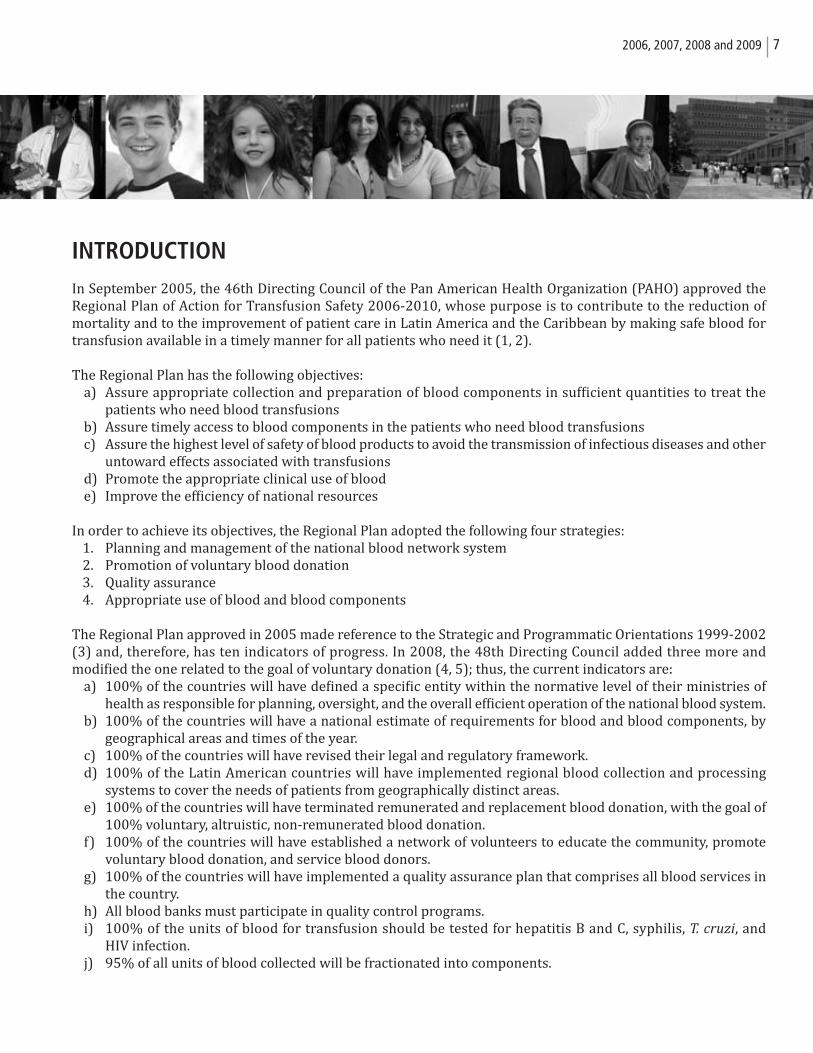
INTRODUCTIONIn September 2005, the 46th Directing Council of the Pan American Health Organization (PAHO) approved theRegional Plan of Action for Transfusion Safety 2006-2010, whose purpose is to contribute to the reduction ofmortality and to the improvement of patient care in Latin America and the Caribbean by making safe blood fortransfusion available in a timely manner for all patients who need it (1, 2).
The Regional Plan has the following objectives:a) Assure appropriate collection and preparation of blood components in sufficient quantities to treat the
patients who need blood transfusionsb) Assure timely access to blood components in the patients who need blood transfusionsc) Assure the highest level of safety of blood products to avoid the transmission of infectious diseases and other
untoward effects associated with transfusionsd) Promote the appropriate clinical use of bloode) Improve the efficiency of national resources
In order to achieve its objectives, the Regional Plan adopted the following four strategies: 1. Planning and management of the national blood network system2. Promotion of voluntary blood donation3. Quality assurance4. Appropriate use of blood and blood components
The Regional Plan approved in 2005 made reference to the Strategic and Programmatic Orientations 1999-2002(3) and, therefore, has ten indicators of progress. In 2008, the 48th Directing Council added three more and modified the one related to the goal of voluntary donation (4, 5); thus, the current indicators are:
a) 100% of the countries will have defined a specific entity within the normative level of their ministries of health as responsible for planning, oversight, and the overall efficient operation of the national blood system.
b) 100% of the countries will have a national estimate of requirements for blood and blood components, by geographical areas and times of the year.
c) 100% of the countries will have revised their legal and regulatory framework. d) 100% of the Latin American countries will have implemented regional blood collection and processing
systems to cover the needs of patients from geographically distinct areas. e) 100% of the countries will have terminated remunerated and replacement blood donation, with the goal of
100% voluntary, altruistic, non-remunerated blood donation. f) 100% of the countries will have established a network of volunteers to educate the community, promote
voluntary blood donation, and service blood donors. g) 100% of the countries will have implemented a quality assurance plan that comprises all blood services in
the country. h) All blood banks must participate in quality control programs. i) 100% of the units of blood for transfusion should be tested for hepatitis B and C, syphilis, T. cruzi, and
HIV infection. j) 95% of all units of blood collected will be fractionated into components.
72006, 2007, 2008 and 2009
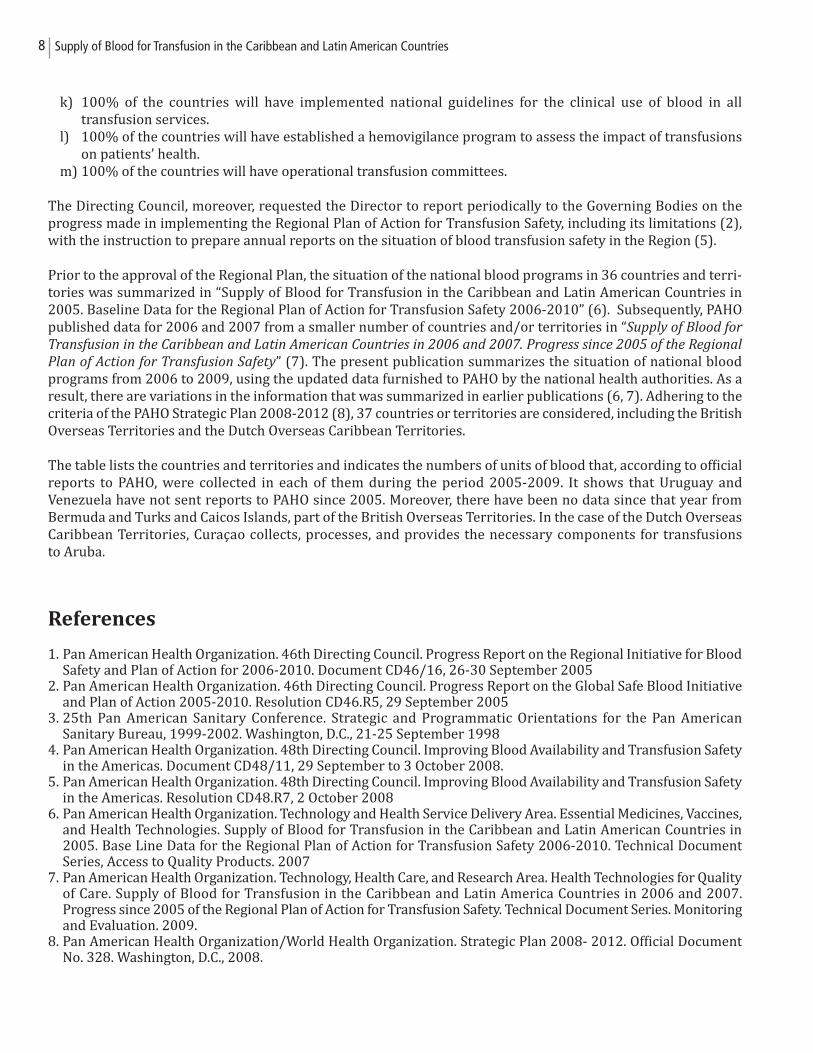
k) 100% of the countries will have implemented national guidelines for the clinical use of blood in all transfusion services.
l) 100% of the countries will have established a hemovigilance program to assess the impact of transfusions on patients’ health.
m) 100% of the countries will have operational transfusion committees.
The Directing Council, moreover, requested the Director to report periodically to the Governing Bodies on theprogress made in implementing the Regional Plan of Action for Transfusion Safety, including its limitations (2),with the instruction to prepare annual reports on the situation of blood transfusion safety in the Region (5).
Prior to the approval of the Regional Plan, the situation of the national blood programs in 36 countries and terri-tories was summarized in “Supply of Blood for Transfusion in the Caribbean and Latin American Countries in2005. Baseline Data for the Regional Plan of Action for Transfusion Safety 2006-2010” (6). Subsequently, PAHOpublished data for 2006 and 2007 from a smaller number of countries and/or territories in “Supply of Blood for
Transfusion in the Caribbean and Latin American Countries in 2006 and 2007. Progress since 2005 of the Regional
Plan of Action for Transfusion Safety” (7). The present publication summarizes the situation of national blood programs from 2006 to 2009, using the updated data furnished to PAHO by the national health authorities. As aresult, there are variations in the information that was summarized in earlier publications (6, 7). Adhering to thecriteria of the PAHO Strategic Plan 2008-2012 (8), 37 countries or territories are considered, including the BritishOverseas Territories and the Dutch Overseas Caribbean Territories.
The table lists the countries and territories and indicates the numbers of units of blood that, according to officialreports to PAHO, were collected in each of them during the period 2005-2009. It shows that Uruguay andVenezuela have not sent reports to PAHO since 2005. Moreover, there have been no data since that year fromBermuda and Turks and Caicos Islands, part of the British Overseas Territories. In the case of the Dutch OverseasCaribbean Territories, Curaçao collects, processes, and provides the necessary components for transfusions to Aruba.
References
1. Pan American Health Organization. 46th Directing Council. Progress Report on the Regional Initiative for Blood Safety and Plan of Action for 2006-2010. Document CD46/16, 26-30 September 2005
2. Pan American Health Organization. 46th Directing Council. Progress Report on the Global Safe Blood Initiative and Plan of Action 2005-2010. Resolution CD46.R5, 29 September 2005
3. 25th Pan American Sanitary Conference. Strategic and Programmatic Orientations for the Pan American Sanitary Bureau, 1999-2002. Washington, D.C., 21-25 September 1998
4. Pan American Health Organization. 48th Directing Council. Improving Blood Availability and Transfusion Safety in the Americas. Document CD48/11, 29 September to 3 October 2008.
5. Pan American Health Organization. 48th Directing Council. Improving Blood Availability and Transfusion Safety in the Americas. Resolution CD48.R7, 2 October 2008
6. Pan American Health Organization. Technology and Health Service Delivery Area. Essential Medicines, Vaccines, and Health Technologies. Supply of Blood for Transfusion in the Caribbean and Latin American Countries in 2005. Base Line Data for the Regional Plan of Action for Transfusion Safety 2006-2010. Technical Document Series, Access to Quality Products. 2007
7. Pan American Health Organization. Technology, Health Care, and Research Area. Health Technologies for Quality of Care. Supply of Blood for Transfusion in the Caribbean and Latin America Countries in 2006 and 2007. Progress since 2005 of the Regional Plan of Action for Transfusion Safety. Technical Document Series. Monitoringand Evaluation. 2009.
8. Pan American Health Organization/World Health Organization. Strategic Plan 2008- 2012. Official Document No. 328. Washington, D.C., 2008.
Supply of Blood for Transfusion in the Caribbean and Latin American Countries8
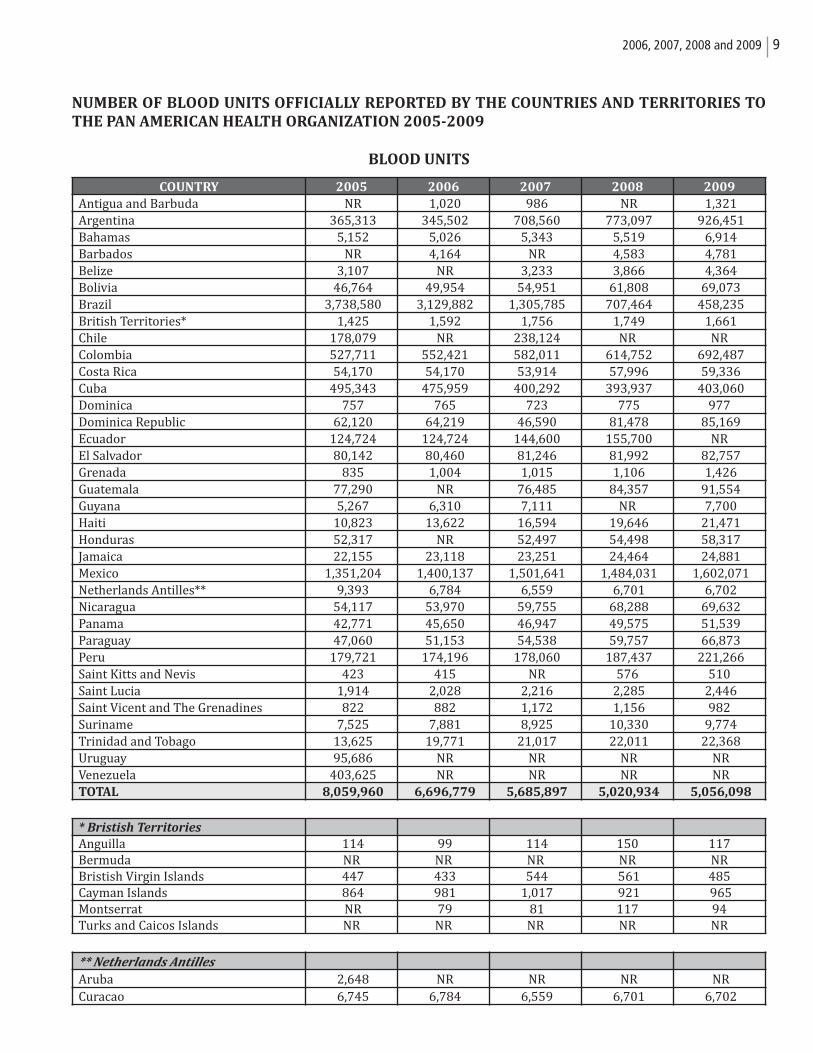
NUMBER OF BLOOD UNITS OFFICIALLY REPORTED BY THE COUNTRIES AND TERRITORIES TO
THE PAN AMERICAN HEALTH ORGANIZATION 2005-2009
BLOOD UNITS
COUNTRY 2005 2006 2007 2008 2009
Antigua and Barbuda NR 1,020 986 NR 1,321 Argentina 365,313 345,502 708,560 773,097 926,451 Bahamas 5,152 5,026 5,343 5,519 6,914 Barbados NR 4,164 NR 4,583 4,781 Belize 3,107 NR 3,233 3,866 4,364 Bolivia 46,764 49,954 54,951 61,808 69,073 Brazil 3,738,580 3,129,882 1,305,785 707,464 458,235 British Territories* 1,425 1,592 1,756 1,749 1,661 Chile 178,079 NR 238,124 NR NRColombia 527,711 552,421 582,011 614,752 692,487 Costa Rica 54,170 54,170 53,914 57,996 59,336 Cuba 495,343 475,959 400,292 393,937 403,060 Dominica 757 765 723 775 977Dominica Republic 62,120 64,219 46,590 81,478 85,169 Ecuador 124,724 124,724 144,600 155,700 NREl Salvador 80,142 80,460 81,246 81,992 82,757 Grenada 835 1,004 1,015 1,106 1,426 Guatemala 77,290 NR 76,485 84,357 91,554 Guyana 5,267 6,310 7,111 NR 7,700 Haiti 10,823 13,622 16,594 19,646 21,471 Honduras 52,317 NR 52,497 54,498 58,317 Jamaica 22,155 23,118 23,251 24,464 24,881 Mexico 1,351,204 1,400,137 1,501,641 1,484,031 1,602,071 Netherlands Antilles** 9,393 6,784 6,559 6,701 6,702 Nicaragua 54,117 53,970 59,755 68,288 69,632 Panama 42,771 45,650 46,947 49,575 51,539 Paraguay 47,060 51,153 54,538 59,757 66,873 Peru 179,721 174,196 178,060 187,437 221,266 Saint Kitts and Nevis 423 415 NR 576 510Saint Lucia 1,914 2,028 2,216 2,285 2,446 Saint Vicent and The Grenadines 822 882 1,172 1,156 982Suriname 7,525 7,881 8,925 10,330 9,774 Trinidad and Tobago 13,625 19,771 21,017 22,011 22,368 Uruguay 95,686 NR NR NR NR Venezuela 403,625 NR NR NR NR TOTAL 8,059,960 6,696,779 5,685,897 5,020,934 5,056,098
* Bristish Territories
Anguilla 114 99 114 150 117Bermuda NR NR NR NR NRBristish Virgin Islands 447 433 544 561 485Cayman Islands 864 981 1,017 921 965 Montserrat NR 79 81 117 94Turks and Caicos Islands NR NR NR NR NR
** Netherlands Antilles
Aruba 2,648 NR NR NR NR Curacao 6,745 6,784 6,559 6,701 6,702
2006, 2007, 2008 and 2009 9

Supply of Blood for Transfusion in the Caribbean and Latin American Countries10
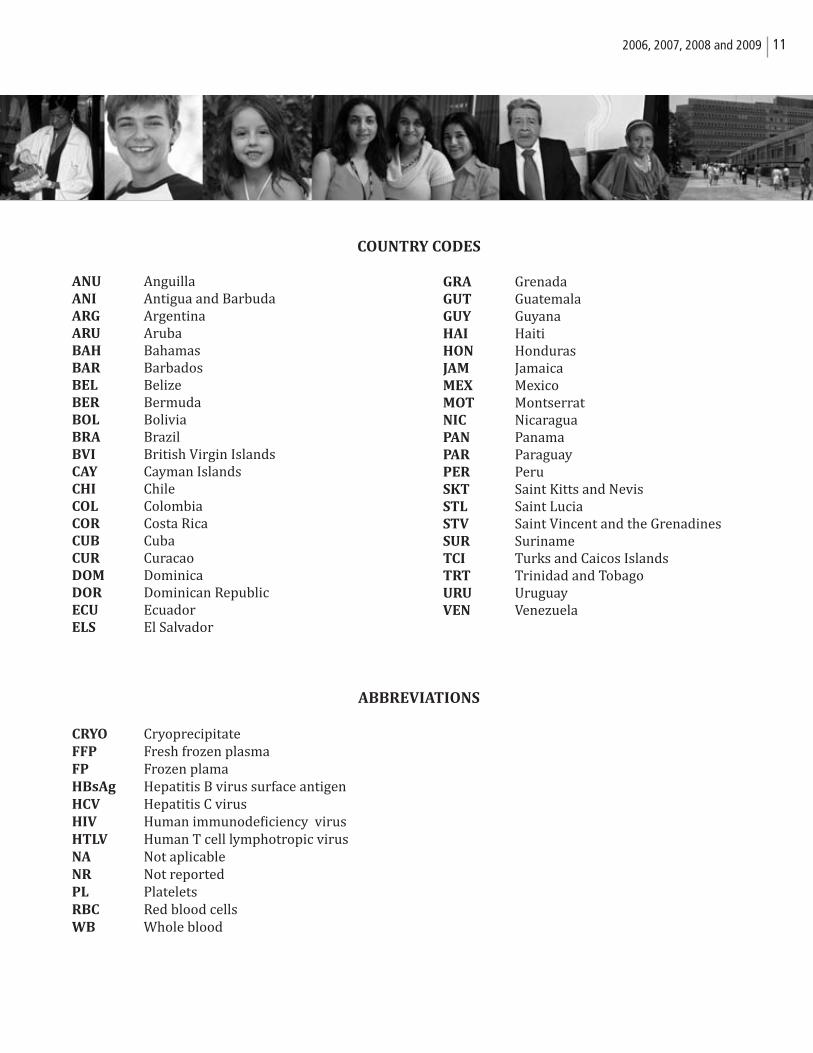
COUNTRY CODES
ANU AnguillaANI Antigua and BarbudaARG ArgentinaARU ArubaBAH BahamasBAR BarbadosBEL BelizeBER BermudaBOL BoliviaBRA BrazilBVI British Virgin IslandsCAY Cayman IslandsCHI ChileCOL ColombiaCOR Costa RicaCUB CubaCUR CuracaoDOM DominicaDOR Dominican RepublicECU EcuadorELS El Salvador
ABBREVIATIONS
CRYO CryoprecipitateFFP Fresh frozen plasmaFP Frozen plamaHBsAg Hepatitis B virus surface antigenHCV Hepatitis C virusHIV Human immunodeficiency virusHTLV Human T cell lymphotropic virusNA Not aplicableNR Not reportedPL PlateletsRBC Red blood cellsWB Whole blood
GRA GrenadaGUT GuatemalaGUY GuyanaHAI HaitiHON HondurasJAM JamaicaMEX MexicoMOT MontserratNIC NicaraguaPAN PanamaPAR ParaguayPER PeruSKT Saint Kitts and NevisSTL Saint LuciaSTV Saint Vincent and the GrenadinesSUR SurinameTCI Turks and Caicos IslandsTRT Trinidad and TobagoURU UruguayVEN Venezuela
2006, 2007, 2008 and 2009 11

Supply of Blood for Transfusion in the Caribbean and Latin American Countries12

2006
2006, 2007, 2008 and 2009 13

REGIONAL SUMMARY 2006
14 Supply of Blood for Transfusion in the Caribbean and Latin American Countries
VARIABLE
CARIBBEAN
COUNTRIES
LATIN AMERICAN
COUNTRIES
CARIBBEAN AND LATIN
AMERICAN COUNTRIES
Blood units collected 94,382 6,602,397 6,696,779
Voluntary, non remunerated donors 28,416 2,826,123 2,854,539
30.11% 42.80% 42.63%
Remunerated donors 0 14,328 14,328 0% 0.22% 0.21%
Screening for HIV (%) 100 97.52 97.58
Screening for HBsAg (%) 100 97.32 97.39
Screening for HCV (%) 98.56 97.45 97.39
Screening for SYPHILIS (%) 100 95.64 95.75
Screening for T. cruzi (%) NA 60.68 NA
Screening for HTLV I-II (%) 97.71 29.04 30.85
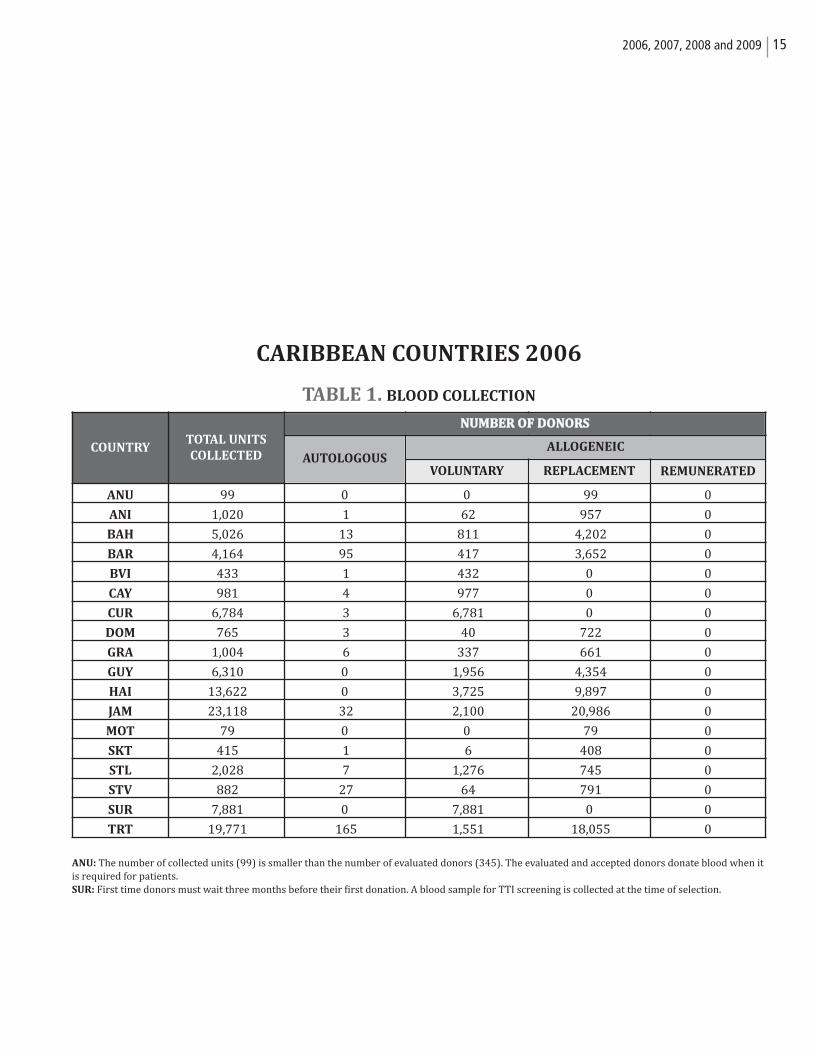
CARIBBEAN COUNTRIES 2006
TABLE 1. BLOOD COLLECTION
ANU: The number of collected units (99) is smaller than the number of evaluated donors (345). The evaluated and accepted donors donate blood when itis required for patients.SUR: First time donors must wait three months before their first donation. A blood sample for TTI screening is collected at the time of selection.
152006, 2007, 2008 and 2009
COUNTRYTOTAL UNITS
COLLECTED
ANU 99 0 0 99 0
ANI 1,020 1 62 957 0
BAH 5,026 13 811 4,202 0
BAR 4,164 95 417 3,652 0
BVI 433 1 432 0 0
CAY 981 4 977 0 0
CUR 6,784 3 6,781 0 0
DOM 765 3 40 722 0
GRA 1,004 6 337 661 0
GUY 6,310 0 1,956 4,354 0
HAI 13,622 0 3,725 9,897 0
JAM 23,118 32 2,100 20,986 0
MOT 79 0 0 79 0
SKT 415 1 6 408 0
STL 2,028 7 1,276 745 0
STV 882 27 64 791 0
SUR 7,881 0 7,881 0 0
TRT 19,771 165 1,551 18,055 0
NUMBER OF DONORS
AUTOLOGOUSALLOGENEIC
VOLUNTARY REPLACEMENT REMUNERATED
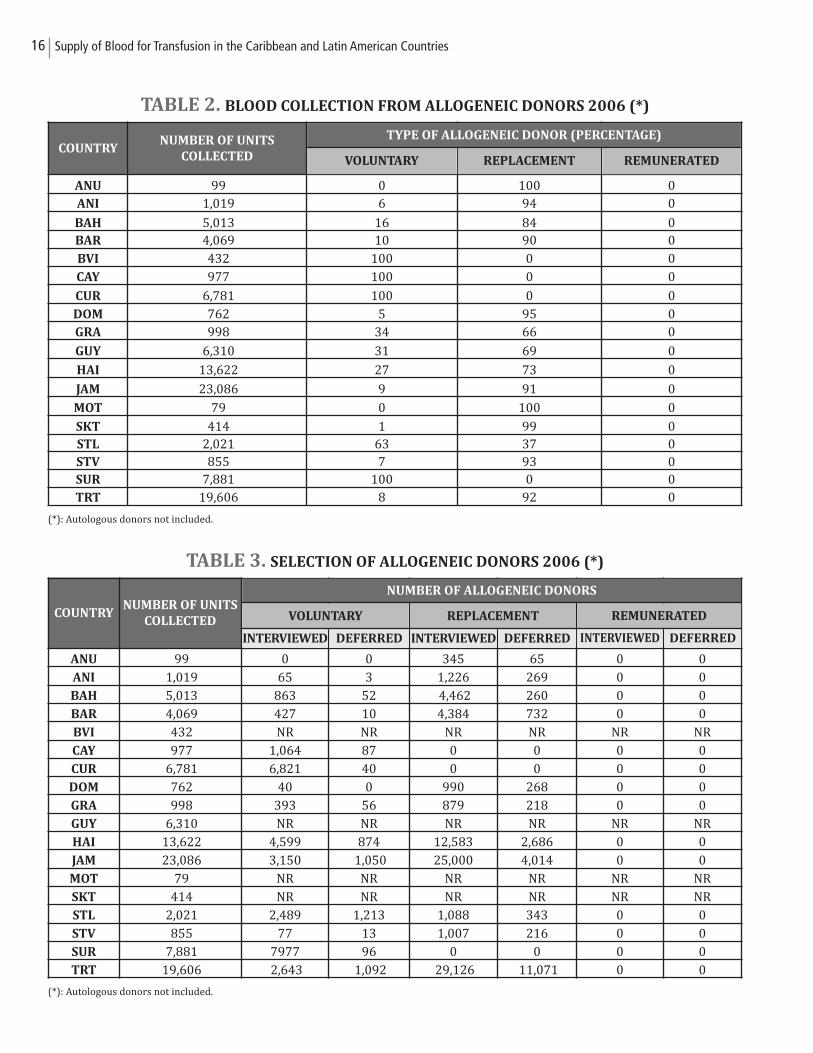
TABLE 2. BLOOD COLLECTION FROM ALLOGENEIC DONORS 2006 (*)
(*): Autologous donors not included.
TABLE 3. SELECTION OF ALLOGENEIC DONORS 2006 (*)
(*): Autologous donors not included.
COUNTRYNUMBER OF UNITS
COLLECTED
ANU 99 0 0 345 65 0 0ANI 1,019 65 3 1,226 269 0 0BAH 5,013 863 52 4,462 260 0 0BAR 4,069 427 10 4,384 732 0 0BVI 432 NR NR NR NR NR NRCAY 977 1,064 87 0 0 0 0CUR 6,781 6,821 40 0 0 0 0DOM 762 40 0 990 268 0 0GRA 998 393 56 879 218 0 0GUY 6,310 NR NR NR NR NR NRHAI 13,622 4,599 874 12,583 2,686 0 0JAM 23,086 3,150 1,050 25,000 4,014 0 0MOT 79 NR NR NR NR NR NRSKT 414 NR NR NR NR NR NRSTL 2,021 2,489 1,213 1,088 343 0 0STV 855 77 13 1,007 216 0 0SUR 7,881 7977 96 0 0 0 0TRT 19,606 2,643 1,092 29,126 11,071 0 0
NUMBER OF ALLOGENEIC DONORS
VOLUNTARY REPLACEMENT REMUNERATED
INTERVIEWED DEFERRED DEFERRED DEFERREDINTERVIEWED INTERVIEWED
Supply of Blood for Transfusion in the Caribbean and Latin American Countries16
COUNTRYNUMBER OF UNITS
COLLECTED
ANU 99 0 100 0 ANI 1,019 6 94 0
BAH 5,013 16 84 0 BAR 4,069 10 90 0 BVI 432 100 0 0 CAY 977 100 0 0
CUR 6,781 100 0 0 DOM 762 5 95 0 GRA 998 34 66 0
GUY 6,310 31 69 0
HAI 13,622 27 73 0
JAM 23,086 9 91 0
MOT 79 0 100 0
SKT 414 1 99 0 STL 2,021 63 37 0 STV 855 7 93 0 SUR 7,881 100 0 0 TRT 19,606 8 92 0
TYPE OF ALLOGENEIC DONOR (PERCENTAGE)
VOLUNTARY REPLACEMENT REMUNERATED
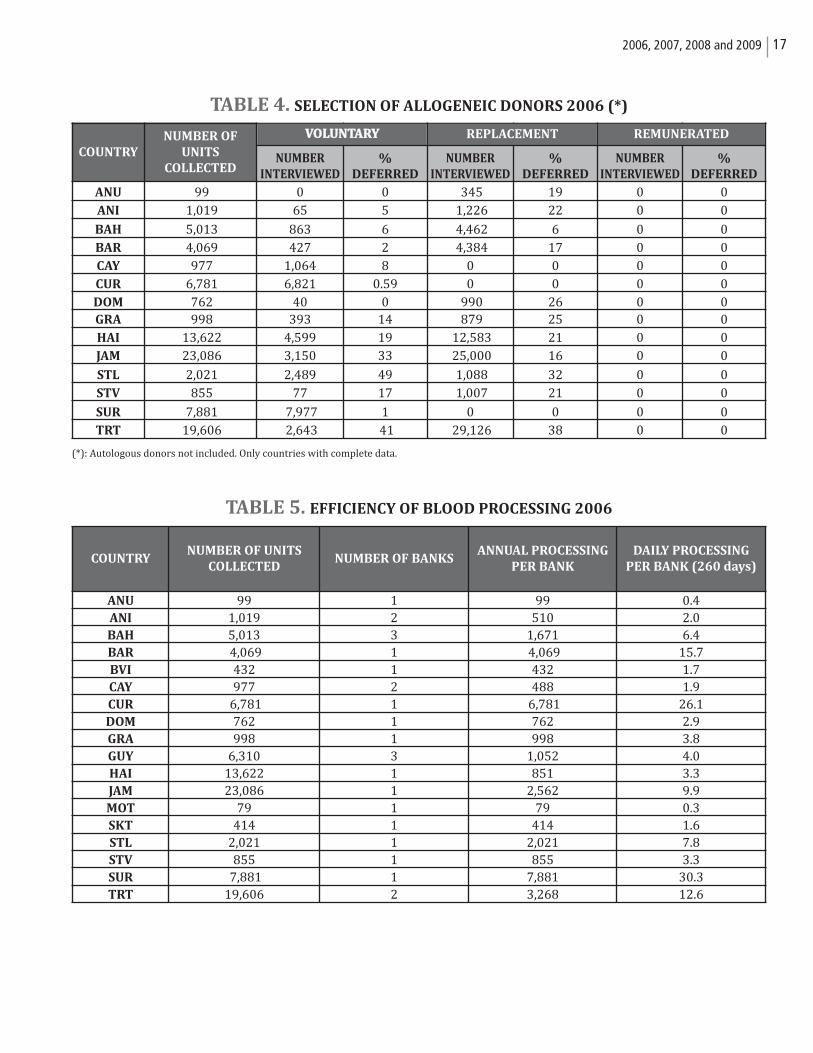
TABLE 4. SELECTION OF ALLOGENEIC DONORS 2006 (*)
(*): Autologous donors not included. Only countries with complete data.
TABLE 5. EFFICIENCY OF BLOOD PROCESSING 2006
172006, 2007, 2008 and 2009
COUNTRY
NUMBER OF
UNITS
COLLECTEDNUMBER
INTERVIEWED
%
DEFERRED
NUMBER
INTERVIEWED
%
DEFERRED
NUMBER
INTERVIEWED
%
DEFERRED
ANU 99 0 0 345 19 0 0ANI 1,019 65 5 1,226 22 0 0
BAH 5,013 863 6 4,462 6 0 0BAR 4,069 427 2 4,384 17 0 0CAY 977 1,064 8 0 0 0 0CUR 6,781 6,821 0.59 0 0 0 0DOM 762 40 0 990 26 0 0GRA 998 393 14 879 25 0 0HAI 13,622 4,599 19 12,583 21 0 0JAM 23,086 3,150 33 25,000 16 0 0
STL 2,021 2,489 49 1,088 32 0 0STV 855 77 17 1,007 21 0 0
SUR 7,881 7,977 1 0 0 0 0TRT 19,606 2,643 41 29,126 38 0 0
VOLUNTARY REPLACEMENT REMUNERATED
COUNTRYNUMBER OF UNITS
COLLECTEDNUMBER OF BANKS
ANNUAL PROCESSING
PER BANK
DAILY PROCESSING
PER BANK (260 days)
ANU 99 1 99 0.4ANI 1,019 2 510 2.0BAH 5,013 3 1,671 6.4BAR 4,069 1 4,069 15.7BVI 432 1 432 1.7CAY 977 2 488 1.9CUR 6,781 1 6,781 26.1DOM 762 1 762 2.9GRA 998 1 998 3.8GUY 6,310 3 1,052 4.0HAI 13,622 1 851 3.3JAM 23,086 1 2,562 9.9MOT 79 1 79 0.3SKT 414 1 414 1.6STL 2,021 1 2,021 7.8STV 855 1 855 3.3SUR 7,881 1 7,881 30.3TRT 19,606 2 3,268 12.6
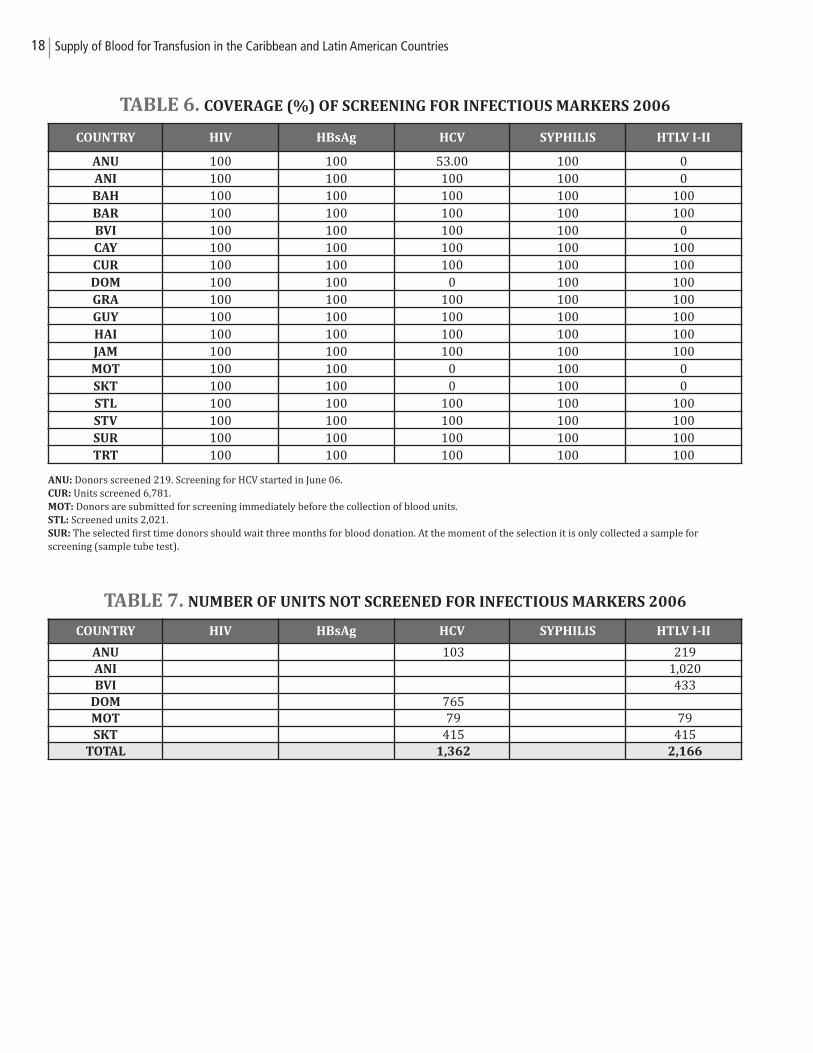
TABLE 6. COVERAGE (%) OF SCREENING FOR INFECTIOUS MARKERS 2006
ANU: Donors screened 219. Screening for HCV started in June 06.CUR: Units screened 6,781.MOT: Donors are submitted for screening immediately before the collection of blood units.STL: Screened units 2,021.SUR: The selected first time donors should wait three months for blood donation. At the moment of the selection it is only collected a sample for screening (sample tube test).
TABLE 7. NUMBER OF UNITS NOT SCREENED FOR INFECTIOUS MARKERS 2006
18 Supply of Blood for Transfusion in the Caribbean and Latin American Countries
COUNTRY HIV HBsAg HCV SYPHILIS HTLV I-II
ANU 100 100 53.00 100 0ANI 100 100 100 100 0BAH 100 100 100 100 100BAR 100 100 100 100 100BVI 100 100 100 100 0CAY 100 100 100 100 100CUR 100 100 100 100 100DOM 100 100 0 100 100GRA 100 100 100 100 100GUY 100 100 100 100 100HAI 100 100 100 100 100JAM 100 100 100 100 100MOT 100 100 0 100 0SKT 100 100 0 100 0STL 100 100 100 100 100STV 100 100 100 100 100SUR 100 100 100 100 100TRT 100 100 100 100 100
COUNTRY HIV HBsAg HCV SYPHILIS HTLV I-II
ANU 103 219 ANI 1,020 BVI 433
DOM 765 MOT 79 79 SKT 415 415
TOTAL 1,362 2,166
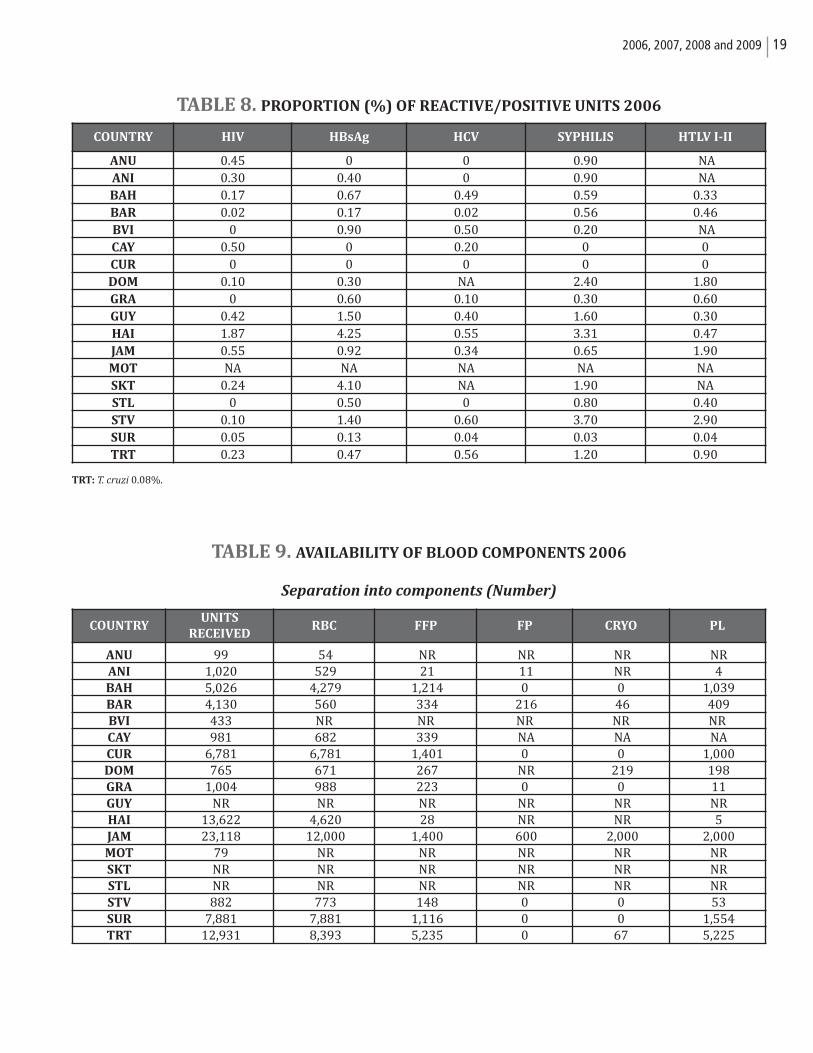
TABLE 8. PROPORTION (%) OF REACTIVE/POSITIVE UNITS 2006
TRT: T. cruzi 0.08%.
TABLE 9. AVAILABILITY OF BLOOD COMPONENTS 2006
Separation into components (Number)
192006, 2007, 2008 and 2009
COUNTRY HIV HBsAg HCV SYPHILIS HTLV I-II
ANU 0.45 0 0 0.90 NA ANI 0.30 0.40 0 0.90 NA BAH 0.17 0.67 0.49 0.59 0.33BAR 0.02 0.17 0.02 0.56 0.46BVI 0 0.90 0.50 0.20 NA CAY 0.50 0 0.20 0 0CUR 0 0 0 0 0DOM 0.10 0.30 NA 2.40 1.80GRA 0 0.60 0.10 0.30 0.60GUY 0.42 1.50 0.40 1.60 0.30HAI 1.87 4.25 0.55 3.31 0.47JAM 0.55 0.92 0.34 0.65 1.90MOT NA NA NA NA NASKT 0.24 4.10 NA 1.90 NASTL 0 0.50 0 0.80 0.40STV 0.10 1.40 0.60 3.70 2.90SUR 0.05 0.13 0.04 0.03 0.04TRT 0.23 0.47 0.56 1.20 0.90
COUNTRYUNITS
RECEIVEDRBC FFP FP CRYO PL
ANU 99 54 NR NR NR NR ANI 1,020 529 21 11 NR 4 BAH 5,026 4,279 1,214 0 0 1,039 BAR 4,130 560 334 216 46 409 BVI 433 NR NR NR NR NRCAY 981 682 339 NA NA NA CUR 6,781 6,781 1,401 0 0 1,000 DOM 765 671 267 NR 219 198 GRA 1,004 988 223 0 0 11 GUY NR NR NR NR NR NR HAI 13,622 4,620 28 NR NR 5 JAM 23,118 12,000 1,400 600 2,000 2,000 MOT 79 NR NR NR NR NR SKT NR NR NR NR NR NR STL NR NR NR NR NR NR STV 882 773 148 0 0 53 SUR 7,881 7,881 1,116 0 0 1,554 TRT 12,931 8,393 5,235 0 67 5,225
20 Supply of Blood for Transfusion in the Caribbean and Latin American Countries
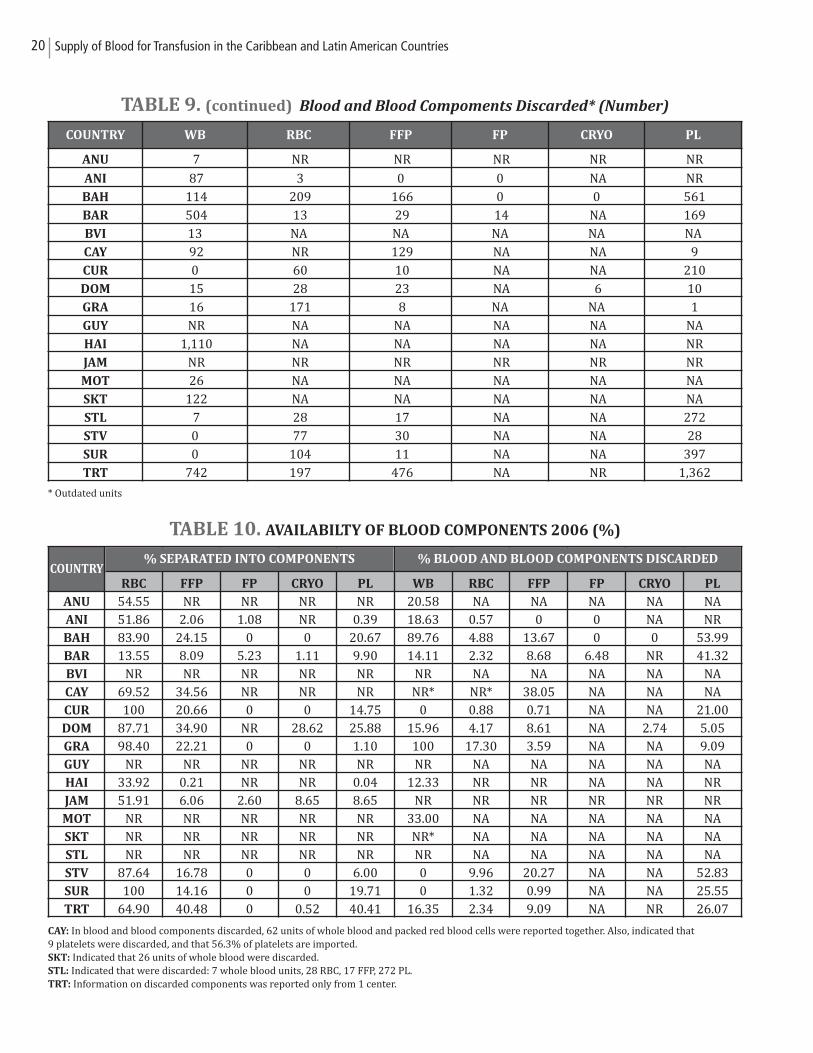
TABLE 9. (continued) Blood and Blood Compoments Discarded* (Number)
* Outdated units
TABLE 10. AVAILABILTY OF BLOOD COMPONENTS 2006 (%)
CAY: In blood and blood components discarded, 62 units of whole blood and packed red blood cells were reported together. Also, indicated that 9 platelets were discarded, and that 56.3% of platelets are imported.SKT: Indicated that 26 units of whole blood were discarded.STL: Indicated that were discarded: 7 whole blood units, 28 RBC, 17 FFP, 272 PL.TRT: Information on discarded components was reported only from 1 center.
COUNTRY WB RBC FFP FP CRYO PL
ANU 7 NR NR NR NR NR
ANI 87 3 0 0 NA NR
BAH 114 209 166 0 0 561
BAR 504 13 29 14 NA 169
BVI 13 NA NA NA NA NA
CAY 92 NR 129 NA NA 9
CUR 0 60 10 NA NA 210
DOM 15 28 23 NA 6 10
GRA 16 171 8 NA NA 1
GUY NR NA NA NA NA NA
HAI 1,110 NA NA NA NA NR
JAM NR NR NR NR NR NR
MOT 26 NA NA NA NA NA
SKT 122 NA NA NA NA NA
STL 7 28 17 NA NA 272
STV 0 77 30 NA NA 28
SUR 0 104 11 NA NA 397
TRT 742 197 476 NA NR 1,362
COUNTRYRBC FFP FP CRYO PL WB RBC FFP FP CRYO PL
ANU 54.55 NR NR NR NR 20.58 NA NA NA NA NAANI 51.86 2.06 1.08 NR 0.39 18.63 0.57 0 0 NA NRBAH 83.90 24.15 0 0 20.67 89.76 4.88 13.67 0 0 53.99BAR 13.55 8.09 5.23 1.11 9.90 14.11 2.32 8.68 6.48 NR 41.32BVI NR NR NR NR NR NR NA NA NA NA NACAY 69.52 34.56 NR NR NR NR* NR* 38.05 NA NA NACUR 100 20.66 0 0 14.75 0 0.88 0.71 NA NA 21.00DOM 87.71 34.90 NR 28.62 25.88 15.96 4.17 8.61 NA 2.74 5.05GRA 98.40 22.21 0 0 1.10 100 17.30 3.59 NA NA 9.09GUY NR NR NR NR NR NR NA NA NA NA NAHAI 33.92 0.21 NR NR 0.04 12.33 NR NR NA NA NRJAM 51.91 6.06 2.60 8.65 8.65 NR NR NR NR NR NRMOT NR NR NR NR NR 33.00 NA NA NA NA NASKT NR NR NR NR NR NR* NA NA NA NA NASTL NR NR NR NR NR NR NA NA NA NA NASTV 87.64 16.78 0 0 6.00 0 9.96 20.27 NA NA 52.83SUR 100 14.16 0 0 19.71 0 1.32 0.99 NA NA 25.55TRT 64.90 40.48 0 0.52 40.41 16.35 2.34 9.09 NA NR 26.07
% SEPARATED INTO COMPONENTS % BLOOD AND BLOOD COMPONENTS DISCARDED
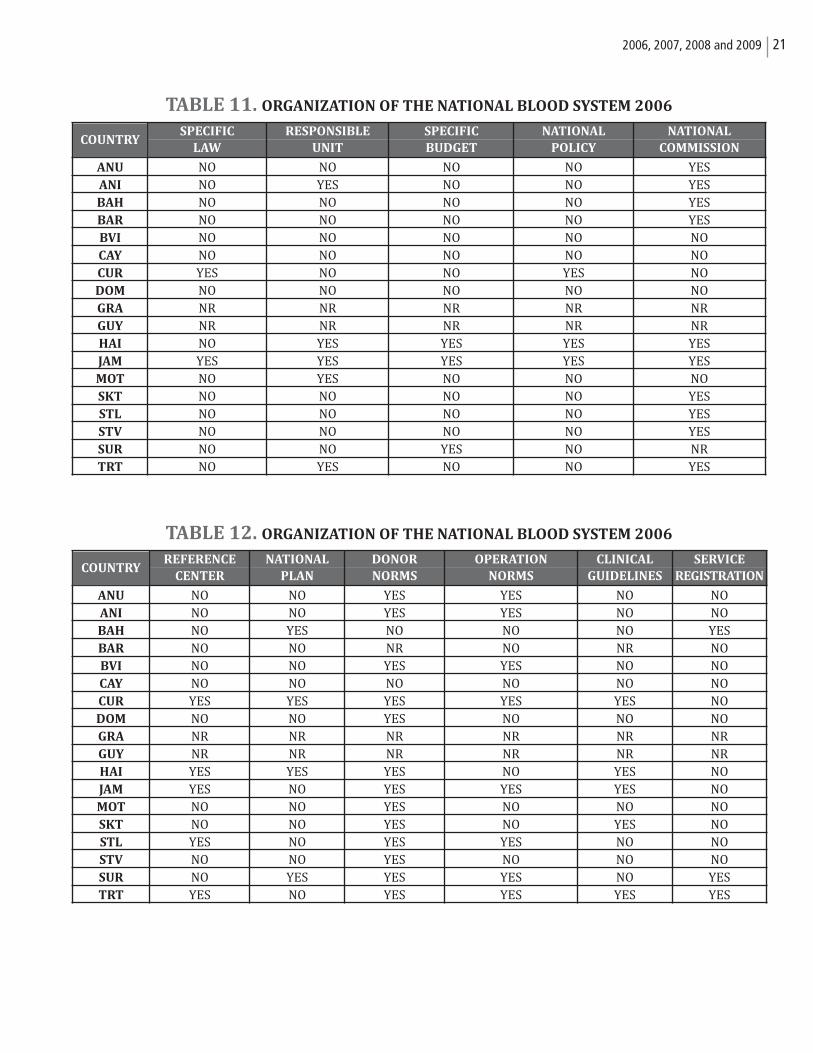
TABLE 11. ORGANIZATION OF THE NATIONAL BLOOD SYSTEM 2006
TABLE 12. ORGANIZATION OF THE NATIONAL BLOOD SYSTEM 2006
212006, 2007, 2008 and 2009
SPECIFIC RESPONSIBLE SPECIFIC NATIONAL NATIONAL
LAW UNIT BUDGET POLICY COMMISSION
ANU NO NO NO NO YESANI NO YES NO NO YESBAH NO NO NO NO YESBAR NO NO NO NO YESBVI NO NO NO NO NOCAY NO NO NO NO NOCUR YES NO NO YES NODOM NO NO NO NO NOGRA NR NR NR NR NRGUY NR NR NR NR NRHAI NO YES YES YES YESJAM YES YES YES YES YESMOT NO YES NO NO NOSKT NO NO NO NO YESSTL NO NO NO NO YESSTV NO NO NO NO YESSUR NO NO YES NO NRTRT NO YES NO NO YES
COUNTRY
REFERENCE NATIONAL DONOR OPERATION CLINICAL SERVICE
CENTER PLAN NORMS NORMS GUIDELINES REGISTRATION
ANU NO NO YES YES NO NOANI NO NO YES YES NO NOBAH NO YES NO NO NO YESBAR NO NO NR NO NR NOBVI NO NO YES YES NO NOCAY NO NO NO NO NO NOCUR YES YES YES YES YES NODOM NO NO YES NO NO NOGRA NR NR NR NR NR NRGUY NR NR NR NR NR NRHAI YES YES YES NO YES NOJAM YES NO YES YES YES NOMOT NO NO YES NO NO NOSKT NO NO YES NO YES NOSTL YES NO YES YES NO NOSTV NO NO YES NO NO NOSUR NO YES YES YES NO YESTRT YES NO YES YES YES YES
COUNTRY
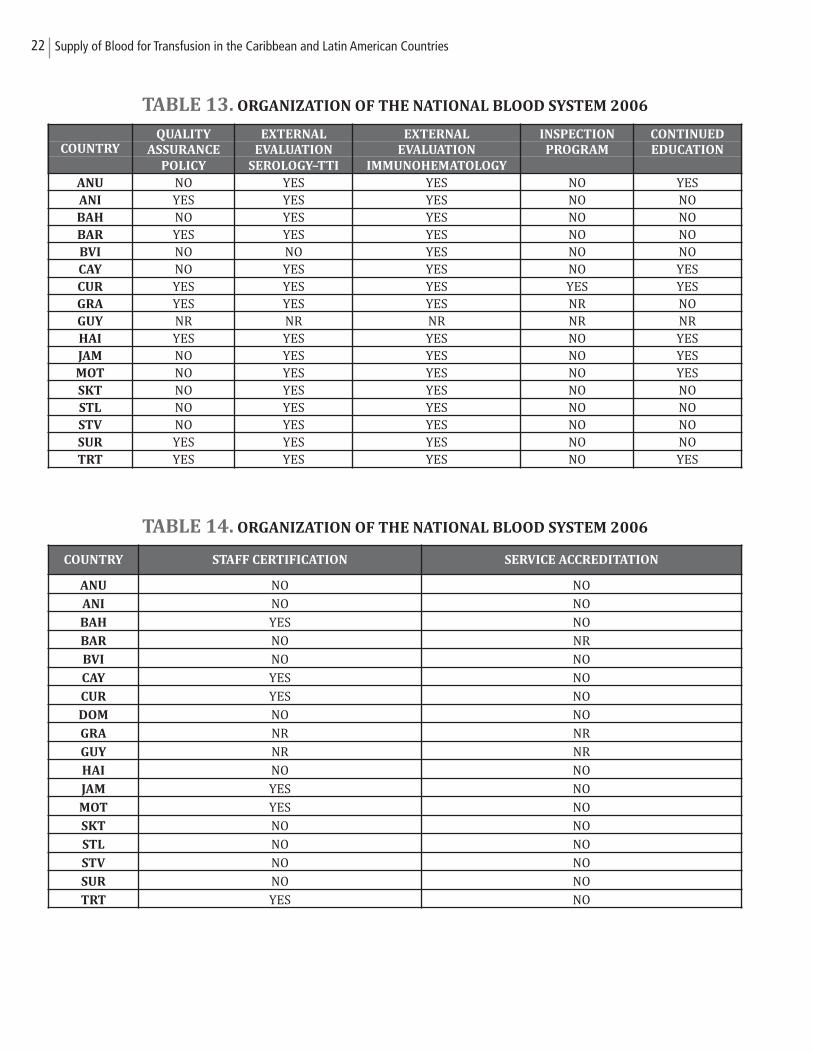
TABLE 13. ORGANIZATION OF THE NATIONAL BLOOD SYSTEM 2006
TABLE 14. ORGANIZATION OF THE NATIONAL BLOOD SYSTEM 2006
22 Supply of Blood for Transfusion in the Caribbean and Latin American Countries
QUALITY EXTERNAL EXTERNAL INSPECTION CONTINUEDCOUNTRY ASSURANCE EVALUATION EVALUATION PROGRAM EDUCATION
POLICY SEROLOGY–TTI IMMUNOHEMATOLOGY
ANU NO YES YES NO YESANI YES YES YES NO NOBAH NO YES YES NO NOBAR YES YES YES NO NOBVI NO NO YES NO NOCAY NO YES YES NO YESCUR YES YES YES YES YESGRA YES YES YES NR NOGUY NR NR NR NR NRHAI YES YES YES NO YESJAM NO YES YES NO YESMOT NO YES YES NO YESSKT NO YES YES NO NOSTL NO YES YES NO NOSTV NO YES YES NO NOSUR YES YES YES NO NOTRT YES YES YES NO YES
COUNTRY STAFF CERTIFICATION SERVICE ACCREDITATION
ANU NO NO
ANI NO NO
BAH YES NO
BAR NO NR
BVI NO NO
CAY YES NO
CUR YES NO
DOM NO NO
GRA NR NR
GUY NR NR
HAI NO NO
JAM YES NO
MOT YES NO
SKT NO NO
STL NO NO
STV NO NO
SUR NO NO
TRT YES NO
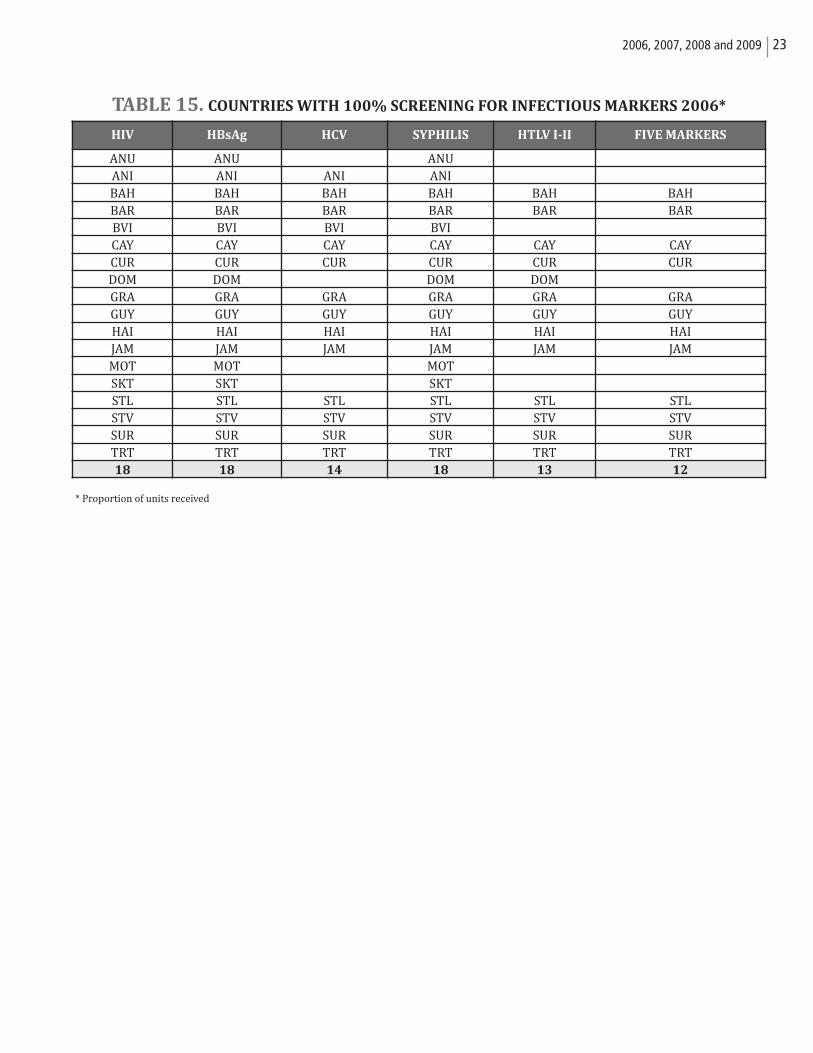
TABLE 15. COUNTRIES WITH 100% SCREENING FOR INFECTIOUS MARKERS 2006*
* Proportion of units received
232006, 2007, 2008 and 2009
HIV HBsAg HCV SYPHILIS HTLV I-II FIVE MARKERS
ANU ANU ANUANI ANI ANI ANIBAH BAH BAH BAH BAH BAHBAR BAR BAR BAR BAR BARBVI BVI BVI BVICAY CAY CAY CAY CAY CAYCUR CUR CUR CUR CUR CURDOM DOM DOM DOMGRA GRA GRA GRA GRA GRAGUY GUY GUY GUY GUY GUYHAI HAI HAI HAI HAI HAIJAM JAM JAM JAM JAM JAMMOT MOT MOTSKT SKT SKTSTL STL STL STL STL STLSTV STV STV STV STV STVSUR SUR SUR SUR SUR SURTRT TRT TRT TRT TRT TRT18 18 14 18 13 12
LATIN AMERICAN COUNTRIES 2006
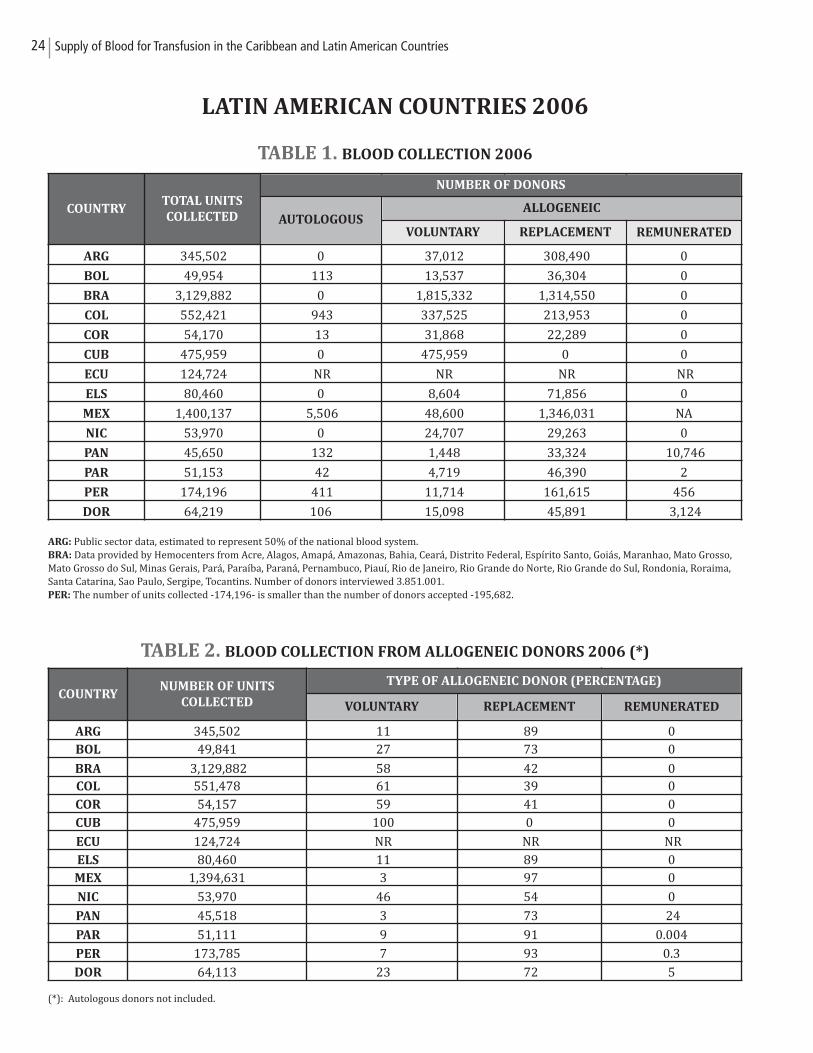
TABLE 1. BLOOD COLLECTION 2006
ARG: Public sector data, estimated to represent 50% of the national blood system.BRA: Data provided by Hemocenters from Acre, Alagos, Amapá, Amazonas, Bahia, Ceará, Distrito Federal, Espírito Santo, Goiás, Maranhao, Mato Grosso,Mato Grosso do Sul, Minas Gerais, Pará, Paraíba, Paraná, Pernambuco, Piauí, Rio de Janeiro, Rio Grande do Norte, Rio Grande do Sul, Rondonia, Roraima,Santa Catarina, Sao Paulo, Sergipe, Tocantins. Number of donors interviewed 3.851.001.PER: The number of units collected -174,196- is smaller than the number of donors accepted -195,682.
TABLE 2. BLOOD COLLECTION FROM ALLOGENEIC DONORS 2006 (*)
(*): Autologous donors not included.
24 Supply of Blood for Transfusion in the Caribbean and Latin American Countries
COUNTRYTOTAL UNITS
COLLECTED
ARG 345,502 0 37,012 308,490 0
BOL 49,954 113 13,537 36,304 0
BRA 3,129,882 0 1,815,332 1,314,550 0
COL 552,421 943 337,525 213,953 0
COR 54,170 13 31,868 22,289 0
CUB 475,959 0 475,959 0 0
ECU 124,724 NR NR NR NR
ELS 80,460 0 8,604 71,856 0
MEX 1,400,137 5,506 48,600 1,346,031 NA
NIC 53,970 0 24,707 29,263 0
PAN 45,650 132 1,448 33,324 10,746
PAR 51,153 42 4,719 46,390 2
PER 174,196 411 11,714 161,615 456
DOR 64,219 106 15,098 45,891 3,124
NUMBER OF DONORS
AUTOLOGOUSALLOGENEIC
VOLUNTARY REPLACEMENT REMUNERATED
COUNTRYNUMBER OF UNITS
COLLECTED
ARG 345,502 11 89 0BOL 49,841 27 73 0
BRA 3,129,882 58 42 0COL 551,478 61 39 0COR 54,157 59 41 0CUB 475,959 100 0 0
ECU 124,724 NR NR NR ELS 80,460 11 89 0MEX 1,394,631 3 97 0
NIC 53,970 46 54 0
PAN 45,518 3 73 24
PAR 51,111 9 91 0.004
PER 173,785 7 93 0.3
DOR 64,113 23 72 5
TYPE OF ALLOGENEIC DONOR (PERCENTAGE)
VOLUNTARY REPLACEMENT REMUNERATED
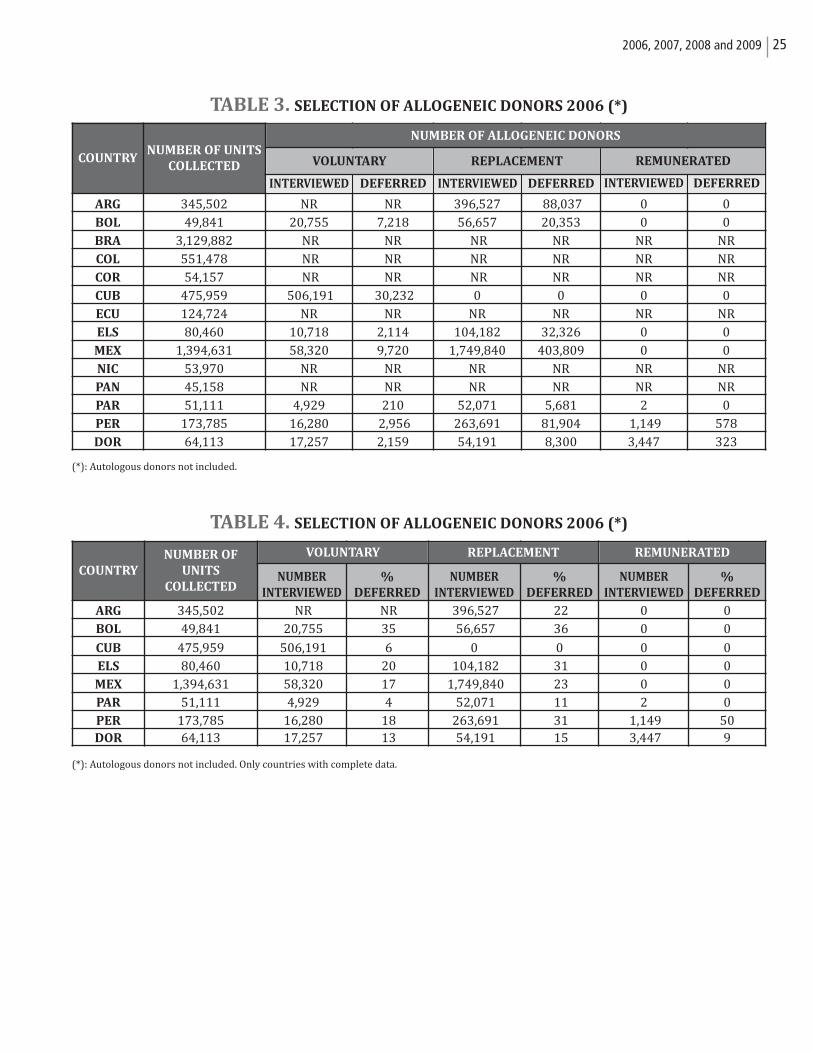
TABLE 3. SELECTION OF ALLOGENEIC DONORS 2006 (*)
(*): Autologous donors not included.
TABLE 4. SELECTION OF ALLOGENEIC DONORS 2006 (*)
(*): Autologous donors not included. Only countries with complete data.
252006, 2007, 2008 and 2009
COUNTRYNUMBER OF UNITS
COLLECTED
ARG 345,502 NR NR 396,527 88,037 0 0BOL 49,841 20,755 7,218 56,657 20,353 0 0BRA 3,129,882 NR NR NR NR NR NRCOL 551,478 NR NR NR NR NR NRCOR 54,157 NR NR NR NR NR NRCUB 475,959 506,191 30,232 0 0 0 0ECU 124,724 NR NR NR NR NR NRELS 80,460 10,718 2,114 104,182 32,326 0 0MEX 1,394,631 58,320 9,720 1,749,840 403,809 0 0NIC 53,970 NR NR NR NR NR NRPAN 45,158 NR NR NR NR NR NRPAR 51,111 4,929 210 52,071 5,681 2 0PER 173,785 16,280 2,956 263,691 81,904 1,149 578DOR 64,113 17,257 2,159 54,191 8,300 3,447 323
NUMBER OF ALLOGENEIC DONORS
VOLUNTARY REPLACEMENT REMUNERATED
INTERVIEWED DEFERRED DEFERRED DEFERREDINTERVIEWED INTERVIEWED
COUNTRY
NUMBER OF
UNITS
COLLECTEDNUMBER
INTERVIEWED
%
DEFERRED
NUMBER
INTERVIEWED
%
DEFERRED
NUMBER
INTERVIEWED
%
DEFERRED
ARG 345,502 NR NR 396,527 22 0 0BOL 49,841 20,755 35 56,657 36 0 0
CUB 475,959 506,191 6 0 0 0 0ELS 80,460 10,718 20 104,182 31 0 0MEX 1,394,631 58,320 17 1,749,840 23 0 0PAR 51,111 4,929 4 52,071 11 2 0PER 173,785 16,280 18 263,691 31 1,149 50DOR 64,113 17,257 13 54,191 15 3,447 9
VOLUNTARY REPLACEMENT REMUNERATED
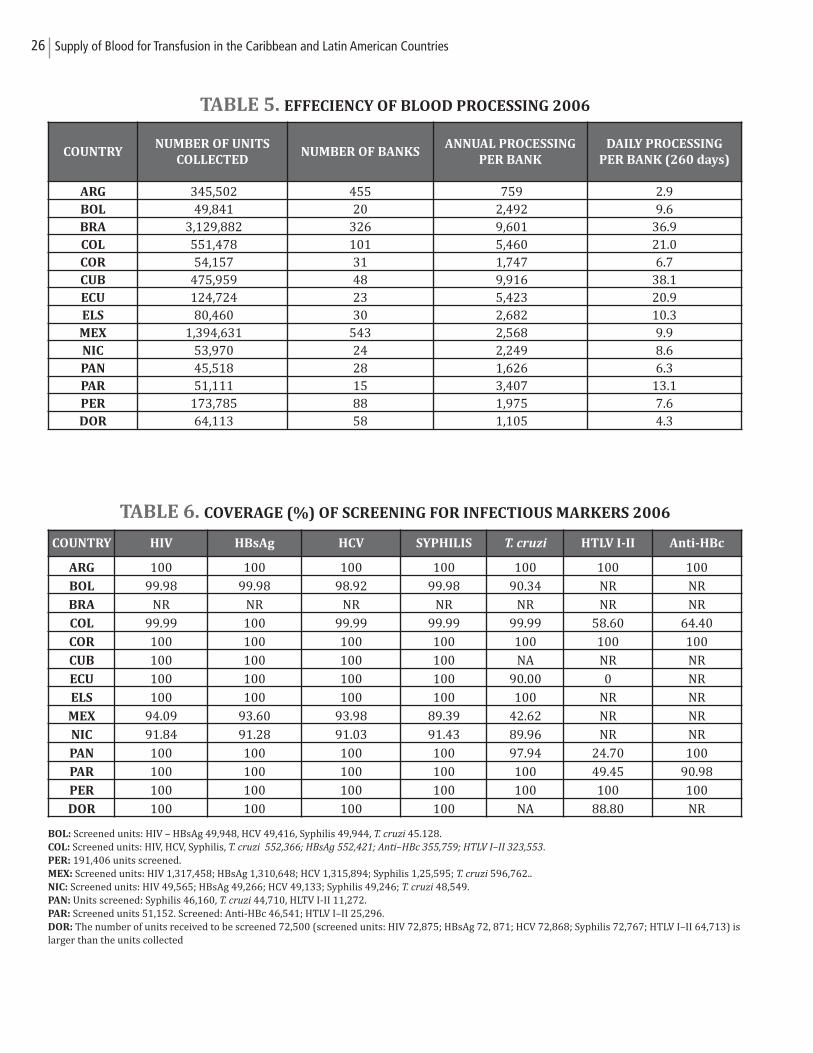
TABLE 5. EFFECIENCY OF BLOOD PROCESSING 2006
TABLE 6. COVERAGE (%) OF SCREENING FOR INFECTIOUS MARKERS 2006
BOL: Screened units: HIV – HBsAg 49,948, HCV 49,416, Syphilis 49,944, T. cruzi 45.128.COL: Screened units: HIV, HCV, Syphilis, T. cruzi 552,366; HBsAg 552,421; Anti–HBc 355,759; HTLV I–II 323,553. PER: 191,406 units screened. MEX: Screened units: HIV 1,317,458; HBsAg 1,310,648; HCV 1,315,894; Syphilis 1,25,595; T. cruzi 596,762.. NIC: Screened units: HIV 49,565; HBsAg 49,266; HCV 49,133; Syphilis 49,246; T. cruzi 48,549.PAN: Units screened: Syphilis 46,160, T. cruzi 44,710, HLTV I-II 11,272. PAR: Screened units 51,152. Screened: Anti-HBc 46,541; HTLV I–II 25,296.DOR: The number of units received to be screened 72,500 (screened units: HIV 72,875; HBsAg 72, 871; HCV 72,868; Syphilis 72,767; HTLV I–II 64,713) islarger than the units collected
26 Supply of Blood for Transfusion in the Caribbean and Latin American Countries
COUNTRYNUMBER OF UNITS
COLLECTEDNUMBER OF BANKS
ANNUAL PROCESSING
PER BANK
DAILY PROCESSING
PER BANK (260 days)
ARG 345,502 455 759 2.9BOL 49,841 20 2,492 9.6BRA 3,129,882 326 9,601 36.9COL 551,478 101 5,460 21.0COR 54,157 31 1,747 6.7CUB 475,959 48 9,916 38.1ECU 124,724 23 5,423 20.9ELS 80,460 30 2,682 10.3MEX 1,394,631 543 2,568 9.9NIC 53,970 24 2,249 8.6PAN 45,518 28 1,626 6.3PAR 51,111 15 3,407 13.1PER 173,785 88 1,975 7.6DOR 64,113 58 1,105 4.3
COUNTRY HIV HBsAg HCV SYPHILIS T. cruzi HTLV I-II Anti-HBc
ARG 100 100 100 100 100 100 100
BOL 99.98 99.98 98.92 99.98 90.34 NR NR
BRA NR NR NR NR NR NR NR
COL 99.99 100 99.99 99.99 99.99 58.60 64.40
COR 100 100 100 100 100 100 100
CUB 100 100 100 100 NA NR NR
ECU 100 100 100 100 90.00 0 NR
ELS 100 100 100 100 100 NR NR
MEX 94.09 93.60 93.98 89.39 42.62 NR NR
NIC 91.84 91.28 91.03 91.43 89.96 NR NR
PAN 100 100 100 100 97.94 24.70 100
PAR 100 100 100 100 100 49.45 90.98
PER 100 100 100 100 100 100 100
DOR 100 100 100 100 NA 88.80 NR
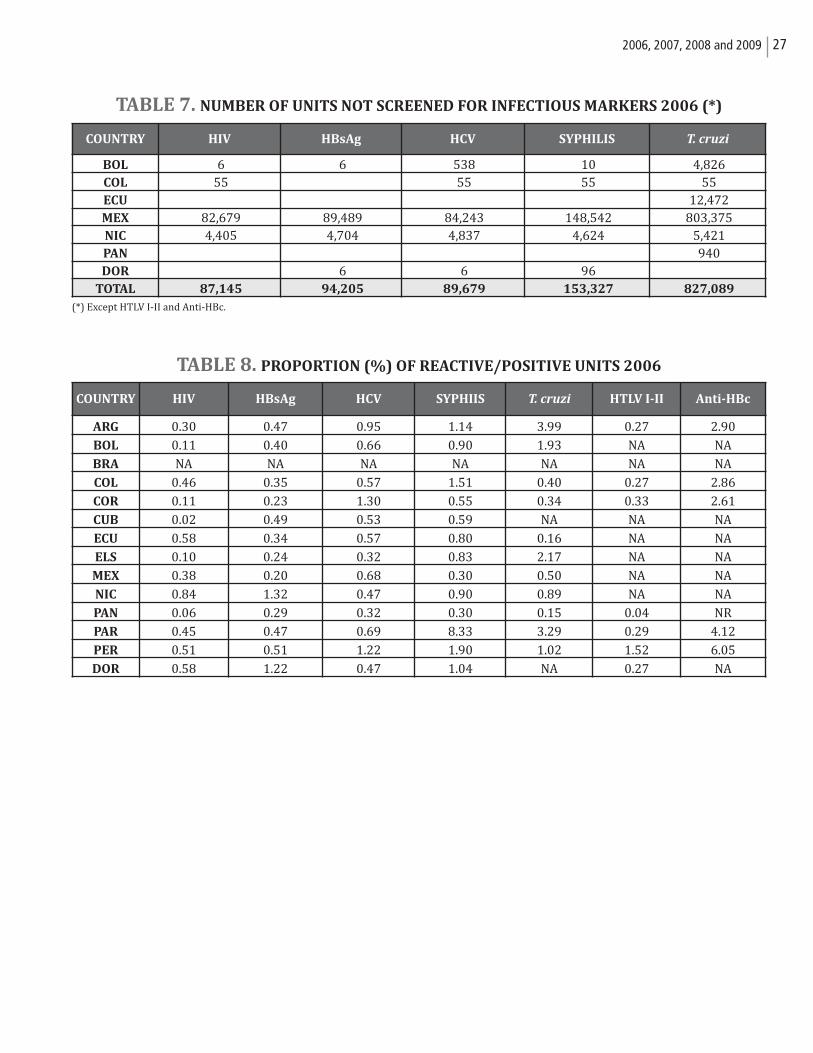
TABLE 7. NUMBER OF UNITS NOT SCREENED FOR INFECTIOUS MARKERS 2006 (*)
(*) Except HTLV I-II and Anti-HBc.
TABLE 8. PROPORTION (%) OF REACTIVE/POSITIVE UNITS 2006
272006, 2007, 2008 and 2009
COUNTRY HIV HBsAg HCV SYPHILIS T. cruzi
BOL 6 6 538 10 4,826 COL 55 55 55 55 ECU 12,472 MEX 82,679 89,489 84,243 148,542 803,375 NIC 4,405 4,704 4,837 4,624 5,421 PAN 940 DOR 6 6 96
TOTAL 87,145 94,205 89,679 153,327 827,089
COUNTRY HIV HBsAg HCV SYPHIIS T. cruzi HTLV I-II Anti-HBc
ARG 0.30 0.47 0.95 1.14 3.99 0.27 2.90
BOL 0.11 0.40 0.66 0.90 1.93 NA NA
BRA NA NA NA NA NA NA NA
COL 0.46 0.35 0.57 1.51 0.40 0.27 2.86
COR 0.11 0.23 1.30 0.55 0.34 0.33 2.61
CUB 0.02 0.49 0.53 0.59 NA NA NA
ECU 0.58 0.34 0.57 0.80 0.16 NA NA
ELS 0.10 0.24 0.32 0.83 2.17 NA NA
MEX 0.38 0.20 0.68 0.30 0.50 NA NA
NIC 0.84 1.32 0.47 0.90 0.89 NA NA
PAN 0.06 0.29 0.32 0.30 0.15 0.04 NR
PAR 0.45 0.47 0.69 8.33 3.29 0.29 4.12
PER 0.51 0.51 1.22 1.90 1.02 1.52 6.05
DOR 0.58 1.22 0.47 1.04 NA 0.27 NA
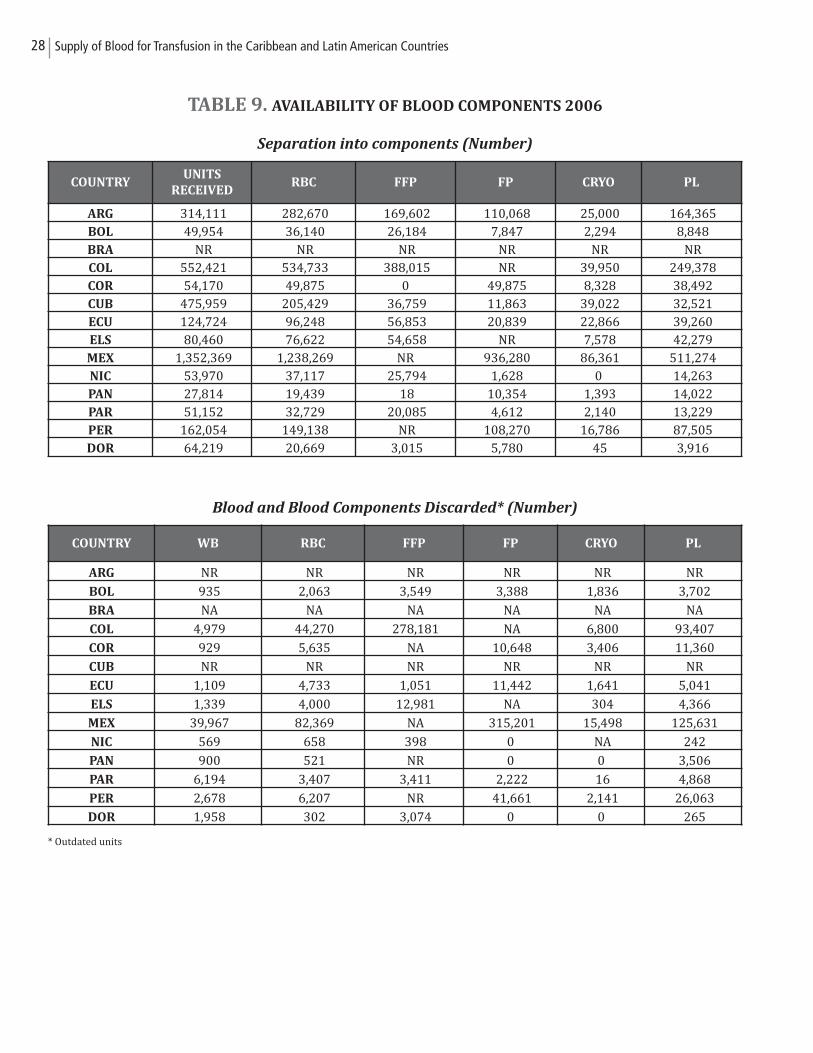
TABLE 9. AVAILABILITY OF BLOOD COMPONENTS 2006
Separation into components (Number)
Blood and Blood Components Discarded* (Number)
* Outdated units
28 Supply of Blood for Transfusion in the Caribbean and Latin American Countries
COUNTRYUNITS
RECEIVEDRBC FFP FP CRYO PL
ARG 314,111 282,670 169,602 110,068 25,000 164,365 BOL 49,954 36,140 26,184 7,847 2,294 8,848 BRA NR NR NR NR NR NR COL 552,421 534,733 388,015 NR 39,950 249,378 COR 54,170 49,875 0 49,875 8,328 38,492 CUB 475,959 205,429 36,759 11,863 39,022 32,521 ECU 124,724 96,248 56,853 20,839 22,866 39,260 ELS 80,460 76,622 54,658 NR 7,578 42,279 MEX 1,352,369 1,238,269 NR 936,280 86,361 511,274 NIC 53,970 37,117 25,794 1,628 0 14,263 PAN 27,814 19,439 18 10,354 1,393 14,022 PAR 51,152 32,729 20,085 4,612 2,140 13,229 PER 162,054 149,138 NR 108,270 16,786 87,505 DOR 64,219 20,669 3,015 5,780 45 3,916
COUNTRY WB RBC FFP FP CRYO PL
ARG NR NR NR NR NR NR
BOL 935 2,063 3,549 3,388 1,836 3,702
BRA NA NA NA NA NA NA
COL 4,979 44,270 278,181 NA 6,800 93,407
COR 929 5,635 NA 10,648 3,406 11,360
CUB NR NR NR NR NR NR
ECU 1,109 4,733 1,051 11,442 1,641 5,041
ELS 1,339 4,000 12,981 NA 304 4,366
MEX 39,967 82,369 NA 315,201 15,498 125,631
NIC 569 658 398 0 NA 242
PAN 900 521 NR 0 0 3,506
PAR 6,194 3,407 3,411 2,222 16 4,868
PER 2,678 6,207 NR 41,661 2,141 26,063
DOR 1,958 302 3,074 0 0 265
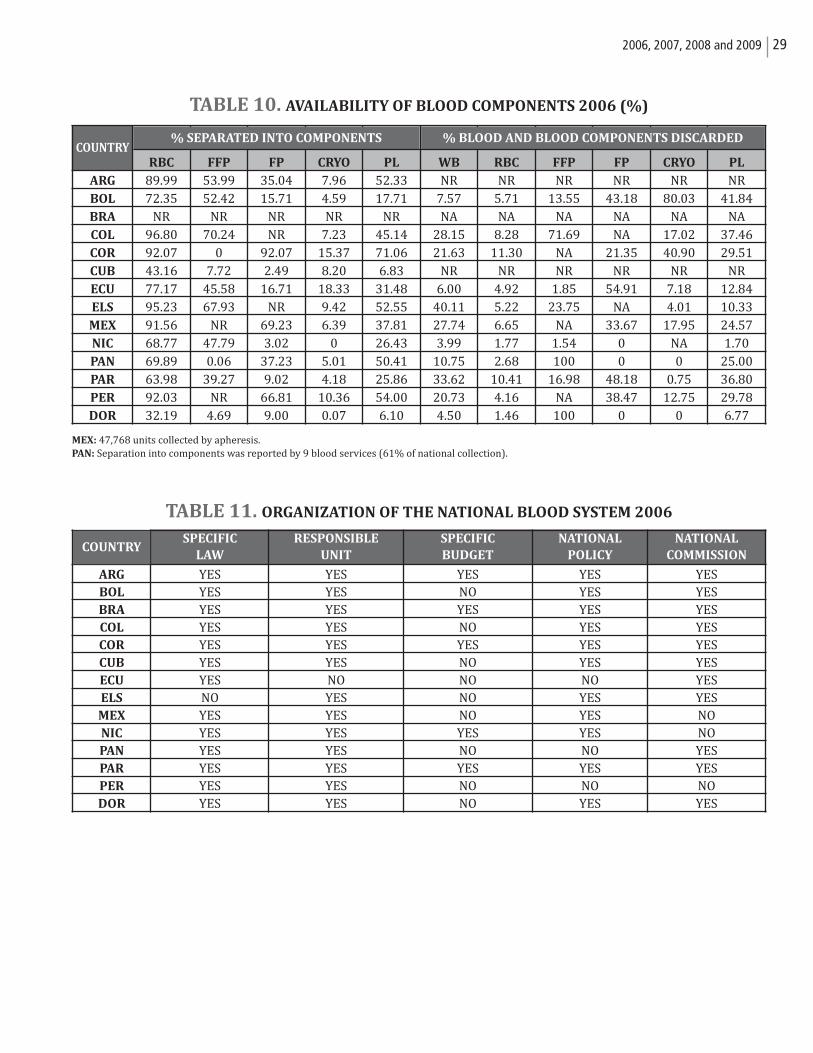
TABLE 10. AVAILABILITY OF BLOOD COMPONENTS 2006 (%)
MEX: 47,768 units collected by apheresis.PAN: Separation into components was reported by 9 blood services (61% of national collection).
TABLE 11. ORGANIZATION OF THE NATIONAL BLOOD SYSTEM 2006
292006, 2007, 2008 and 2009
COUNTRYRBC FFP FP CRYO PL WB RBC FFP FP CRYO PL
ARG 89.99 53.99 35.04 7.96 52.33 NR NR NR NR NR NRBOL 72.35 52.42 15.71 4.59 17.71 7.57 5.71 13.55 43.18 80.03 41.84BRA NR NR NR NR NR NA NA NA NA NA NACOL 96.80 70.24 NR 7.23 45.14 28.15 8.28 71.69 NA 17.02 37.46COR 92.07 0 92.07 15.37 71.06 21.63 11.30 NA 21.35 40.90 29.51CUB 43.16 7.72 2.49 8.20 6.83 NR NR NR NR NR NRECU 77.17 45.58 16.71 18.33 31.48 6.00 4.92 1.85 54.91 7.18 12.84ELS 95.23 67.93 NR 9.42 52.55 40.11 5.22 23.75 NA 4.01 10.33MEX 91.56 NR 69.23 6.39 37.81 27.74 6.65 NA 33.67 17.95 24.57NIC 68.77 47.79 3.02 0 26.43 3.99 1.77 1.54 0 NA 1.70PAN 69.89 0.06 37.23 5.01 50.41 10.75 2.68 100 0 0 25.00PAR 63.98 39.27 9.02 4.18 25.86 33.62 10.41 16.98 48.18 0.75 36.80PER 92.03 NR 66.81 10.36 54.00 20.73 4.16 NA 38.47 12.75 29.78DOR 32.19 4.69 9.00 0.07 6.10 4.50 1.46 100 0 0 6.77
% SEPARATED INTO COMPONENTS % BLOOD AND BLOOD COMPONENTS DISCARDED
SPECIFIC RESPONSIBLE SPECIFIC NATIONAL NATIONAL
LAW UNIT BUDGET POLICY COMMISSION
ARG YES YES YES YES YESBOL YES YES NO YES YESBRA YES YES YES YES YESCOL YES YES NO YES YESCOR YES YES YES YES YESCUB YES YES NO YES YESECU YES NO NO NO YESELS NO YES NO YES YESMEX YES YES NO YES NONIC YES YES YES YES NOPAN YES YES NO NO YESPAR YES YES YES YES YESPER YES YES NO NO NODOR YES YES NO YES YES
COUNTRY
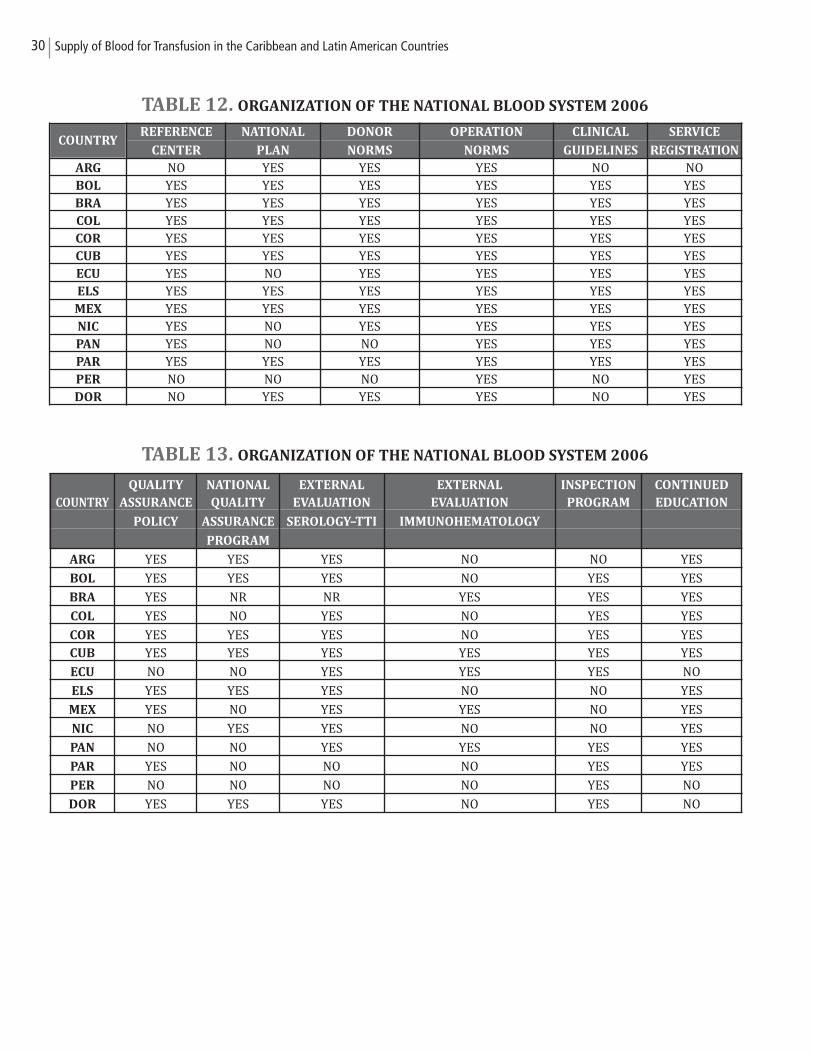
TABLE 12. ORGANIZATION OF THE NATIONAL BLOOD SYSTEM 2006
TABLE 13. ORGANIZATION OF THE NATIONAL BLOOD SYSTEM 2006
30 Supply of Blood for Transfusion in the Caribbean and Latin American Countries
REFERENCE NATIONAL DONOR OPERATION CLINICAL SERVICE
CENTER PLAN NORMS NORMS GUIDELINES REGISTRATION
ARG NO YES YES YES NO NOBOL YES YES YES YES YES YESBRA YES YES YES YES YES YESCOL YES YES YES YES YES YESCOR YES YES YES YES YES YESCUB YES YES YES YES YES YESECU YES NO YES YES YES YESELS YES YES YES YES YES YESMEX YES YES YES YES YES YESNIC YES NO YES YES YES YESPAN YES NO NO YES YES YESPAR YES YES YES YES YES YESPER NO NO NO YES NO YESDOR NO YES YES YES NO YES
COUNTRY
QUALITY NATIONAL EXTERNAL EXTERNAL INSPECTION CONTINUED
COUNTRY ASSURANCE QUALITY EVALUATION EVALUATION PROGRAM EDUCATION
POLICY ASSURANCE SEROLOGY–TTI IMMUNOHEMATOLOGY
PROGRAM
ARG YES YES YES NO NO YES
BOL YES YES YES NO YES YES
BRA YES NR NR YES YES YES
COL YES NO YES NO YES YES
COR YES YES YES NO YES YESCUB YES YES YES YES YES YES
ECU NO NO YES YES YES NO
ELS YES YES YES NO NO YES
MEX YES NO YES YES NO YES
NIC NO YES YES NO NO YES
PAN NO NO YES YES YES YES
PAR YES NO NO NO YES YES
PER NO NO NO NO YES NO
DOR YES YES YES NO YES NO
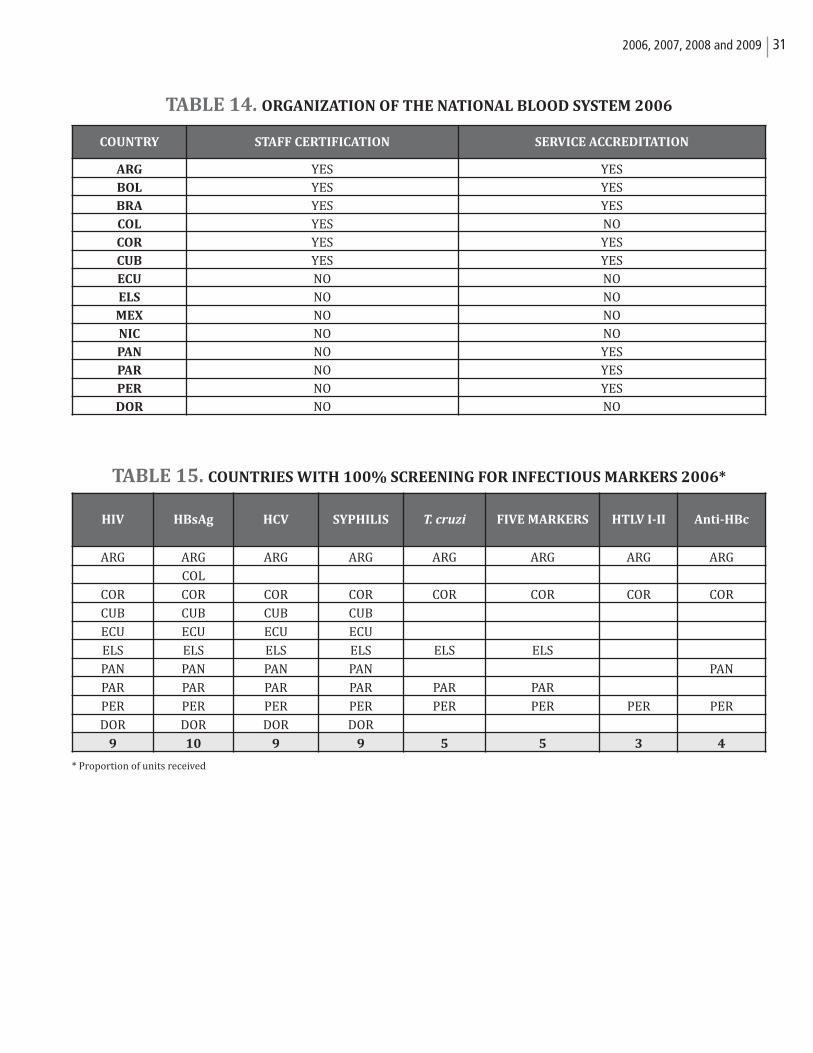
TABLE 14. ORGANIZATION OF THE NATIONAL BLOOD SYSTEM 2006
TABLE 15. COUNTRIES WITH 100% SCREENING FOR INFECTIOUS MARKERS 2006*
* Proportion of units received
312006, 2007, 2008 and 2009
COUNTRY STAFF CERTIFICATION SERVICE ACCREDITATION
ARG YES YESBOL YES YESBRA YES YESCOL YES NOCOR YES YESCUB YES YESECU NO NOELS NO NOMEX NO NONIC NO NOPAN NO YESPAR NO YESPER NO YESDOR NO NO
HIV HBsAg HCV SYPHILIS T. cruzi FIVE MARKERS HTLV I-II Anti-HBc
ARG ARG ARG ARG ARG ARG ARG ARG
COL
COR COR COR COR COR COR COR COR
CUB CUB CUB CUB
ECU ECU ECU ECU
ELS ELS ELS ELS ELS ELS
PAN PAN PAN PAN PAN
PAR PAR PAR PAR PAR PAR
PER PER PER PER PER PER PER PER
DOR DOR DOR DOR
9 10 9 9 5 5 3 4
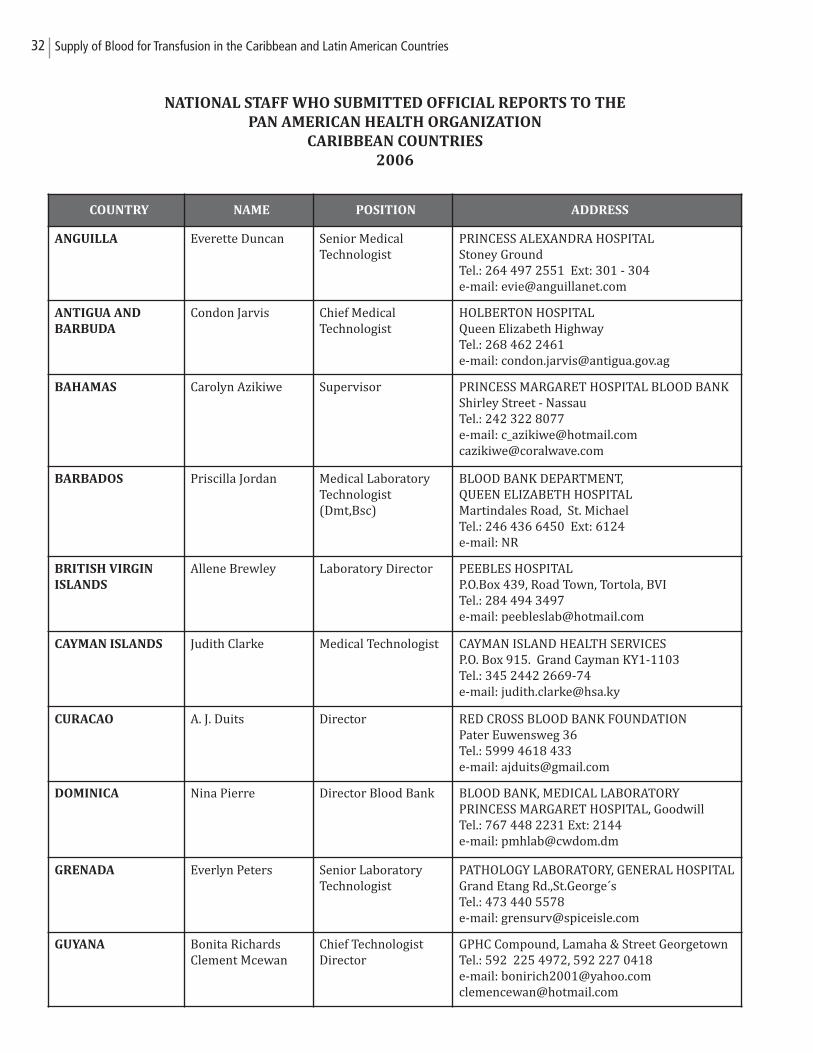
NATIONAL STAFF WHO SUBMITTED OFFICIAL REPORTS TO THE
PAN AMERICAN HEALTH ORGANIZATION
CARIBBEAN COUNTRIES
2006
32 Supply of Blood for Transfusion in the Caribbean and Latin American Countries
COUNTRY NAME POSITION ADDRESS
ANGUILLA Everette Duncan Senior Medical Technologist
PRINCESS ALEXANDRA HOSPITALStoney GroundTel.: 264 497 2551 Ext: 301 - 304e-mail: [email protected]
ANTIGUA AND
BARBUDA
Condon Jarvis Chief Medical Technologist
HOLBERTON HOSPITALQueen Elizabeth HighwayTel.: 268 462 2461e-mail: [email protected]
BAHAMAS Carolyn Azikiwe Supervisor PRINCESS MARGARET HOSPITAL BLOOD BANKShirley Street - NassauTel.: 242 322 8077e-mail: [email protected]@coralwave.com
BARBADOS Priscilla Jordan Medical LaboratoryTechnologist(Dmt,Bsc)
BLOOD BANK DEPARTMENT, QUEEN ELIZABETH HOSPITALMartindales Road, St. MichaelTel.: 246 436 6450 Ext: 6124e-mail: NR
BRITISH VIRGIN
ISLANDS
Allene Brewley Laboratory Director PEEBLES HOSPITALP.O.Box 439, Road Town, Tortola, BVITel.: 284 494 3497e-mail: [email protected]
CAYMAN ISLANDS Judith Clarke Medical Technologist CAYMAN ISLAND HEALTH SERVICESP.O. Box 915. Grand Cayman KY1-1103 Tel.: 345 2442 2669-74e-mail: [email protected]
CURACAO A. J. Duits Director RED CROSS BLOOD BANK FOUNDATIONPater Euwensweg 36Tel.: 5999 4618 433e-mail: [email protected]
DOMINICA Nina Pierre Director Blood Bank BLOOD BANK, MEDICAL LABORATORYPRINCESS MARGARET HOSPITAL, GoodwillTel.: 767 448 2231 Ext: 2144e-mail: [email protected]
GRENADA Everlyn Peters Senior LaboratoryTechnologist
PATHOLOGY LABORATORY, GENERAL HOSPITALGrand Etang Rd.,St.George´sTel.: 473 440 5578e-mail: [email protected]
GUYANA Bonita RichardsClement Mcewan
Chief TechnologistDirector
GPHC Compound, Lamaha & Street GeorgetownTel.: 592 225 4972, 592 227 0418e-mail: [email protected]@hotmail.com
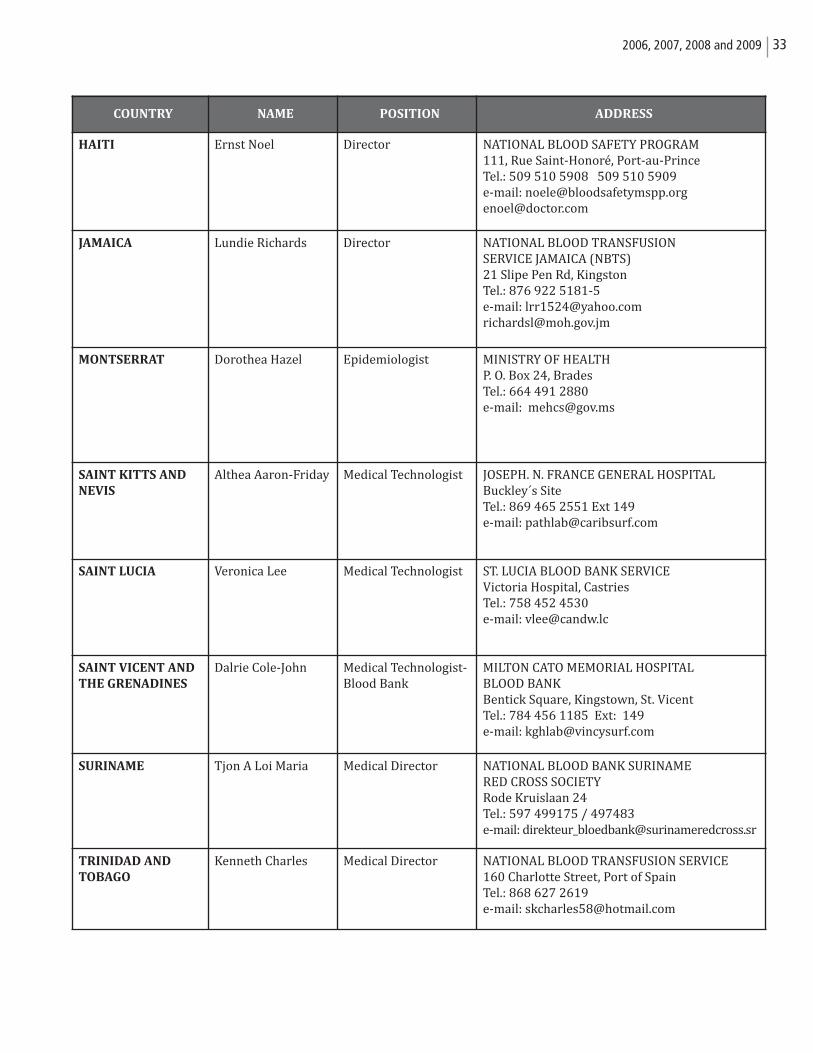
332006, 2007, 2008 and 2009
COUNTRY NAME POSITION ADDRESS
HAITI Ernst Noel Director NATIONAL BLOOD SAFETY PROGRAM111, Rue Saint-Honoré, Port-au-PrinceTel.: 509 510 5908 509 510 5909e-mail: [email protected]@doctor.com
JAMAICA Lundie Richards Director NATIONAL BLOOD TRANSFUSION SERVICE JAMAICA (NBTS)21 Slipe Pen Rd, KingstonTel.: 876 922 5181-5e-mail: [email protected]@moh.gov.jm
MONTSERRAT Dorothea Hazel Epidemiologist MINISTRY OF HEALTHP. O. Box 24, BradesTel.: 664 491 2880e-mail: [email protected]
SAINT KITTS AND
NEVIS
Althea Aaron-Friday Medical Technologist JOSEPH. N. FRANCE GENERAL HOSPITALBuckley´s SiteTel.: 869 465 2551 Ext 149e-mail: [email protected]
SAINT LUCIA Veronica Lee Medical Technologist ST. LUCIA BLOOD BANK SERVICEVictoria Hospital, Castries Tel.: 758 452 4530e-mail: [email protected]
SAINT VICENT AND
THE GRENADINES
Dalrie Cole-John Medical Technologist-Blood Bank
MILTON CATO MEMORIAL HOSPITAL BLOOD BANKBentick Square, Kingstown, St. VicentTel.: 784 456 1185 Ext: 149e-mail: [email protected]
SURINAME Tjon A Loi Maria Medical Director NATIONAL BLOOD BANK SURINAME RED CROSS SOCIETYRode Kruislaan 24Tel.: 597 499175 / 497483e-mail: [email protected]
TRINIDAD AND
TOBAGO
Kenneth Charles Medical Director NATIONAL BLOOD TRANSFUSION SERVICE160 Charlotte Street, Port of SpainTel.: 868 627 2619e-mail: [email protected]
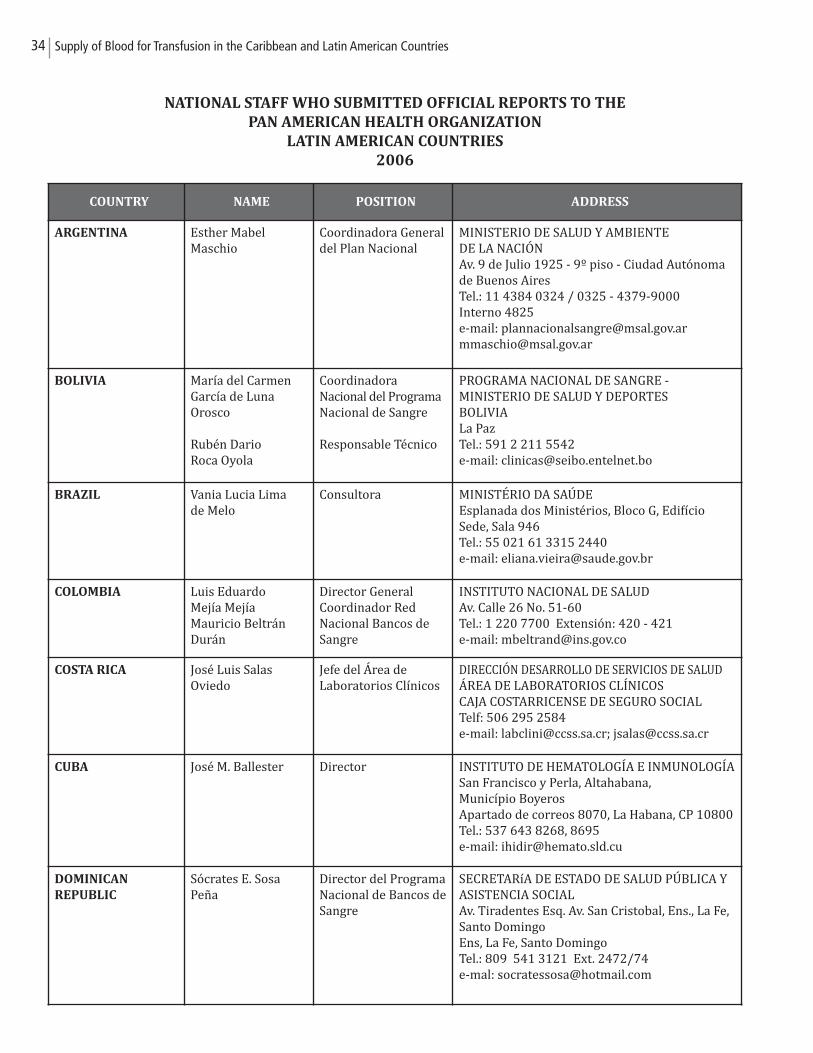
34 Supply of Blood for Transfusion in the Caribbean and Latin American Countries
NATIONAL STAFF WHO SUBMITTED OFFICIAL REPORTS TO THE
PAN AMERICAN HEALTH ORGANIZATION
LATIN AMERICAN COUNTRIES
2006
COUNTRY NAME POSITION ADDRESS
ARGENTINA Esther Mabel Maschio
Coordinadora Generaldel Plan Nacional
MINISTERIO DE SALUD Y AMBIENTE DE LA NACIÓNAv. 9 de Julio 1925 - 9º piso - Ciudad Autónomade Buenos AiresTel.: 11 4384 0324 / 0325 - 4379-9000 Interno 4825e-mail: [email protected]@msal.gov.ar
BOLIVIA María del CarmenGarcía de LunaOrosco
Rubén Dario Roca Oyola
Coordinadora Nacional del ProgramaNacional de Sangre
Responsable Técnico
PROGRAMA NACIONAL DE SANGRE - MINISTERIO DE SALUD Y DEPORTES BOLIVIALa PazTel.: 591 2 211 5542e-mail: [email protected]
BRAZIL Vania Lucia Lima de Melo
Consultora MINISTÉRIO DA SAÚDEEsplanada dos Ministérios, Bloco G, EdifícioSede, Sala 946Tel.: 55 021 61 3315 2440e-mail: [email protected]
COLOMBIA Luis Eduardo Mejía Mejía Mauricio BeltránDurán
Director GeneralCoordinador Red Nacional Bancos deSangre
INSTITUTO NACIONAL DE SALUDAv. Calle 26 No. 51-60Tel.: 1 220 7700 Extensión: 420 - 421e-mail: [email protected]
COSTA RICA José Luis SalasOviedo
Jefe del Área de Laboratorios Clínicos
DIRECCIÓN DESARROLLO DE SERVICIOS DE SALUDÁREA DE LABORATORIOS CLÍNICOSCAJA COSTARRICENSE DE SEGURO SOCIALTelf: 506 295 2584e-mail: [email protected]; [email protected]
CUBA José M. Ballester Director INSTITUTO DE HEMATOLOGÍA E INMUNOLOGÍASan Francisco y Perla, Altahabana, Município BoyerosApartado de correos 8070, La Habana, CP 10800Tel.: 537 643 8268, 8695e-mail: [email protected]
DOMINICAN
REPUBLIC
Sócrates E. SosaPeña
Director del ProgramaNacional de Bancos deSangre
SECRETARíA DE ESTADO DE SALUD PÚBLICA Y ASISTENCIA SOCIALAv. Tiradentes Esq. Av. San Cristobal, Ens., La Fe,Santo DomingoEns, La Fe, Santo Domingo Tel.: 809 541 3121 Ext. 2472/74e-mal: [email protected]
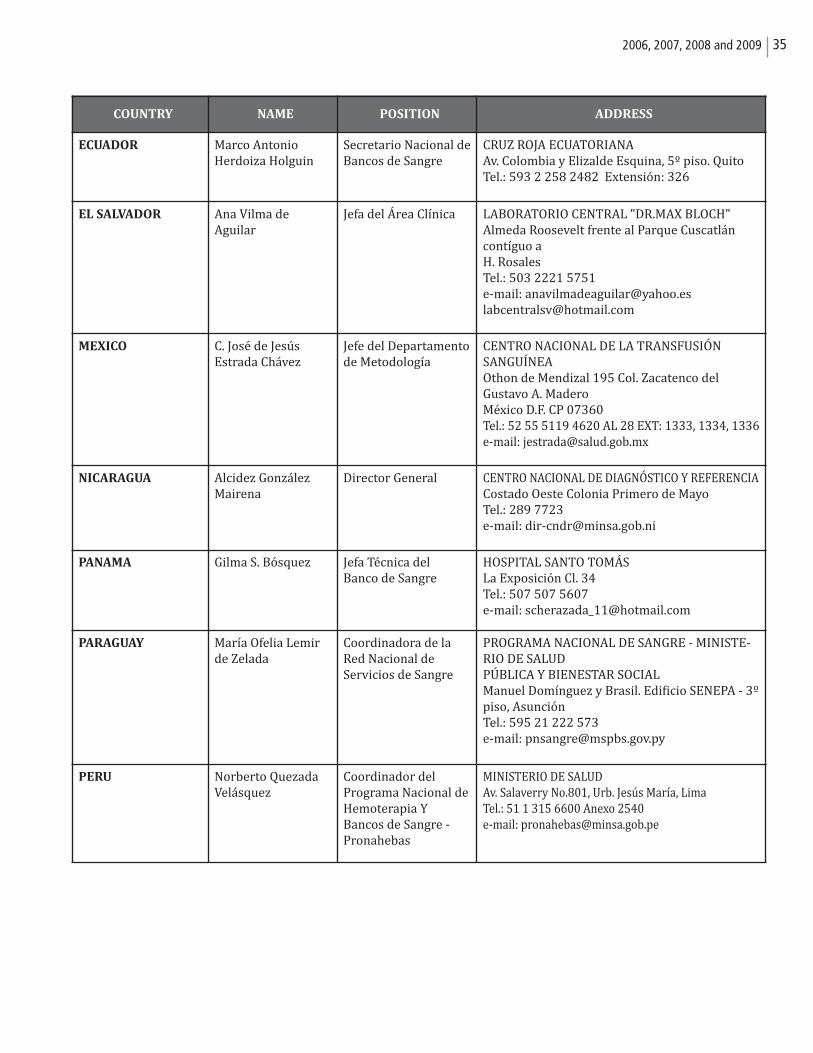
352006, 2007, 2008 and 2009
COUNTRY NAME POSITION ADDRESS
ECUADOR Marco Antonio Herdoiza Holguin
Secretario Nacional deBancos de Sangre
CRUZ ROJA ECUATORIANAAv. Colombia y Elizalde Esquina, 5º piso. QuitoTel.: 593 2 258 2482 Extensión: 326
EL SALVADOR Ana Vilma deAguilar
Jefa del Área Clínica LABORATORIO CENTRAL "DR.MAX BLOCH"Almeda Roosevelt frente al Parque Cuscatláncontíguo a H. RosalesTel.: 503 2221 5751e-mail: [email protected]@hotmail.com
MEXICO C. José de JesúsEstrada Chávez
Jefe del Departamentode Metodología
CENTRO NACIONAL DE LA TRANSFUSIÓN SANGUÍNEAOthon de Mendizal 195 Col. Zacatenco del Gustavo A. MaderoMéxico D.F. CP 07360Tel.: 52 55 5119 4620 AL 28 EXT: 1333, 1334, 1336e-mail: [email protected]
NICARAGUA Alcidez GonzálezMairena
Director General CENTRO NACIONAL DE DIAGNÓSTICO Y REFERENCIACostado Oeste Colonia Primero de MayoTel.: 289 7723e-mail: [email protected]
PANAMA Gilma S. Bósquez Jefa Técnica del Banco de Sangre
HOSPITAL SANTO TOMÁSLa Exposición Cl. 34Tel.: 507 507 5607e-mail: [email protected]
PARAGUAY María Ofelia Lemirde Zelada
Coordinadora de laRed Nacional deServicios de Sangre
PROGRAMA NACIONAL DE SANGRE - MINISTE-RIO DE SALUDPÚBLICA Y BIENESTAR SOCIALManuel Domínguez y Brasil. Edificio SENEPA - 3ºpiso, AsunciónTel.: 595 21 222 573e-mail: [email protected]
PERU Norberto QuezadaVelásquez
Coordinador del Programa Nacional deHemoterapia Y Bancos de Sangre -Pronahebas
MINISTERIO DE SALUD Av. Salaverry No.801, Urb. Jesús María, LimaTel.: 51 1 315 6600 Anexo 2540 e-mail: [email protected]

36 Supply of Blood for Transfusion in the Caribbean and Latin American Countries
372006, 2007, 2008 and 2009
2007

38 Supply of Blood for Transfusion in the Caribbean and Latin American Countries
REGIONAL SUMMARY 2007
VARIABLE
CARIBBEAN
COUNTRIES
LATIN AMERICAN
COUNTRIES
CARIBBEAN AND LATIN
AMERICAN COUNTRIES
Blood units collected 99,901 5,585,996 5,685,897
Voluntary, non remunerated donors 36,939 2,003,021 2,039,960
36.98% 35.86% 35.88%
Remunerated donors 0 11,509 11,509 0% 0.21% 0.20%
Screening for HIV (%) 100 90.93 91.10
Screening for HBsAg (%) 100 89.81 90.00
Screening for HCV (%) 98.39 89.96 90.12
Screening for SYPHILIS (%) 100 88.89 89.10
Screening for T. cruzi (%) NA 75.40 NA
Screening for HTLV I-II (%) 98.00 28.19 29.50
392006, 2007, 2008 and 2009
CARIBBEAN COUNTRIES 2007
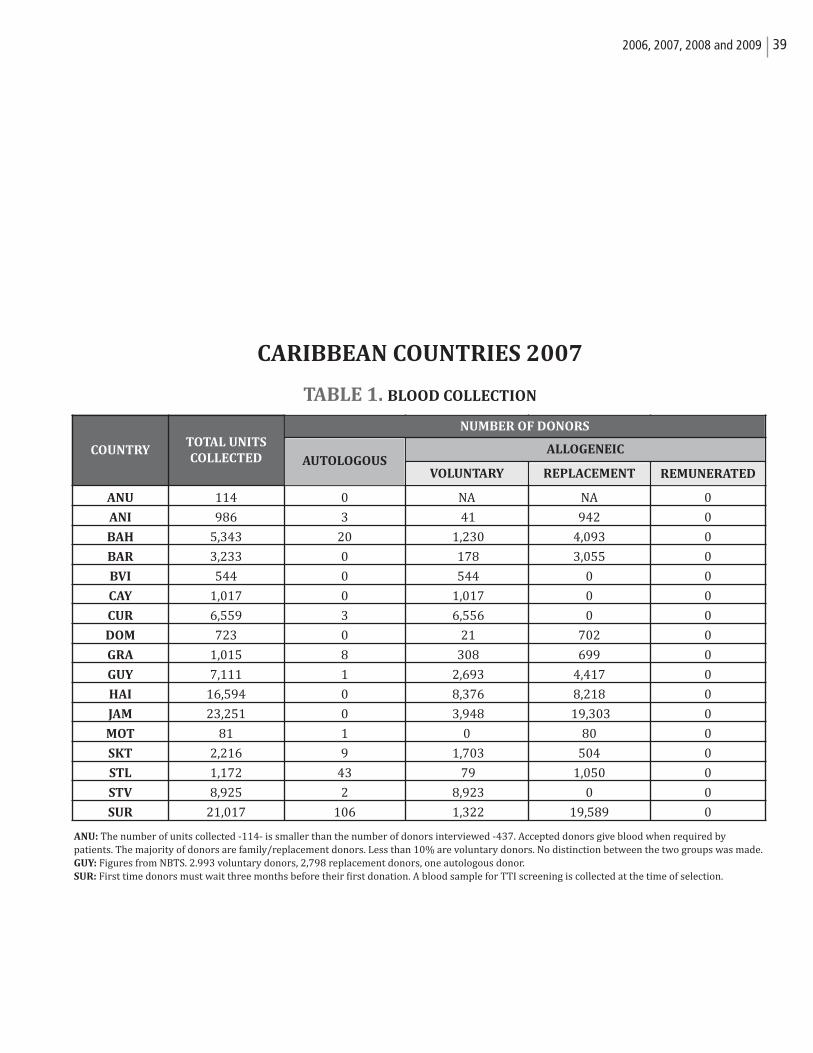
TABLE 1. BLOOD COLLECTION
ANU: The number of units collected -114- is smaller than the number of donors interviewed -437. Accepted donors give blood when required by patients. The majority of donors are family/replacement donors. Less than 10% are voluntary donors. No distinction between the two groups was made.GUY: Figures from NBTS. 2.993 voluntary donors, 2,798 replacement donors, one autologous donor.SUR: First time donors must wait three months before their first donation. A blood sample for TTI screening is collected at the time of selection.
COUNTRYTOTAL UNITS
COLLECTED
ANU 114 0 NA NA 0
ANI 986 3 41 942 0
BAH 5,343 20 1,230 4,093 0
BAR 3,233 0 178 3,055 0
BVI 544 0 544 0 0
CAY 1,017 0 1,017 0 0
CUR 6,559 3 6,556 0 0
DOM 723 0 21 702 0
GRA 1,015 8 308 699 0
GUY 7,111 1 2,693 4,417 0
HAI 16,594 0 8,376 8,218 0
JAM 23,251 0 3,948 19,303 0
MOT 81 1 0 80 0
SKT 2,216 9 1,703 504 0
STL 1,172 43 79 1,050 0
STV 8,925 2 8,923 0 0
SUR 21,017 106 1,322 19,589 0
NUMBER OF DONORS
AUTOLOGOUSALLOGENEIC
VOLUNTARY REPLACEMENT REMUNERATED
40 Supply of Blood for Transfusion in the Caribbean and Latin American Countries
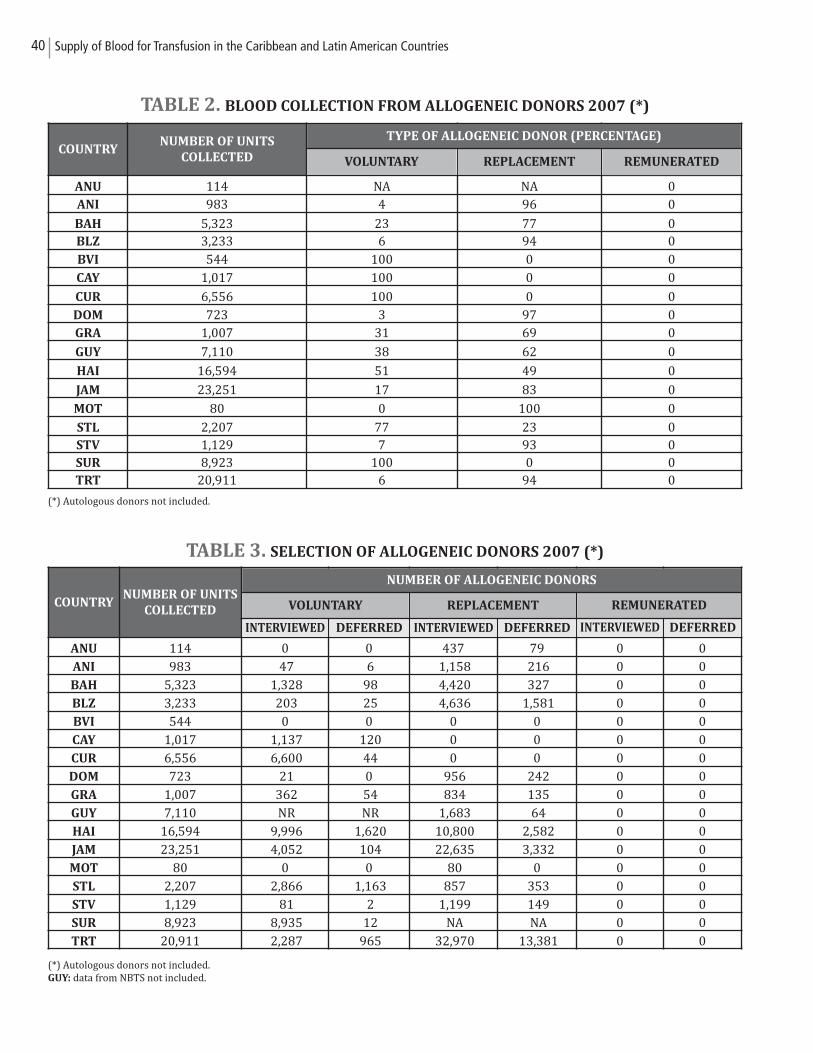
TABLE 2. BLOOD COLLECTION FROM ALLOGENEIC DONORS 2007 (*)
(*) Autologous donors not included.
TABLE 3. SELECTION OF ALLOGENEIC DONORS 2007 (*)
(*) Autologous donors not included.GUY: data from NBTS not included.
COUNTRYNUMBER OF UNITS
COLLECTED
ANU 114 0 0 437 79 0 0ANI 983 47 6 1,158 216 0 0BAH 5,323 1,328 98 4,420 327 0 0BLZ 3,233 203 25 4,636 1,581 0 0BVI 544 0 0 0 0 0 0CAY 1,017 1,137 120 0 0 0 0CUR 6,556 6,600 44 0 0 0 0DOM 723 21 0 956 242 0 0GRA 1,007 362 54 834 135 0 0GUY 7,110 NR NR 1,683 64 0 0HAI 16,594 9,996 1,620 10,800 2,582 0 0JAM 23,251 4,052 104 22,635 3,332 0 0MOT 80 0 0 80 0 0 0STL 2,207 2,866 1,163 857 353 0 0STV 1,129 81 2 1,199 149 0 0SUR 8,923 8,935 12 NA NA 0 0TRT 20,911 2,287 965 32,970 13,381 0 0
NUMBER OF ALLOGENEIC DONORS
VOLUNTARY REPLACEMENT REMUNERATED
INTERVIEWED DEFERRED DEFERRED DEFERREDINTERVIEWED INTERVIEWED
COUNTRYNUMBER OF UNITS
COLLECTED
ANU 114 NA NA 0ANI 983 4 96 0
BAH 5,323 23 77 0BLZ 3,233 6 94 0BVI 544 100 0 0CAY 1,017 100 0 0
CUR 6,556 100 0 0DOM 723 3 97 0GRA 1,007 31 69 0
GUY 7,110 38 62 0
HAI 16,594 51 49 0
JAM 23,251 17 83 0
MOT 80 0 100 0
STL 2,207 77 23 0STV 1,129 7 93 0SUR 8,923 100 0 0TRT 20,911 6 94 0
TYPE OF ALLOGENEIC DONOR (PERCENTAGE)
VOLUNTARY REPLACEMENT REMUNERATED
412006, 2007, 2008 and 2009
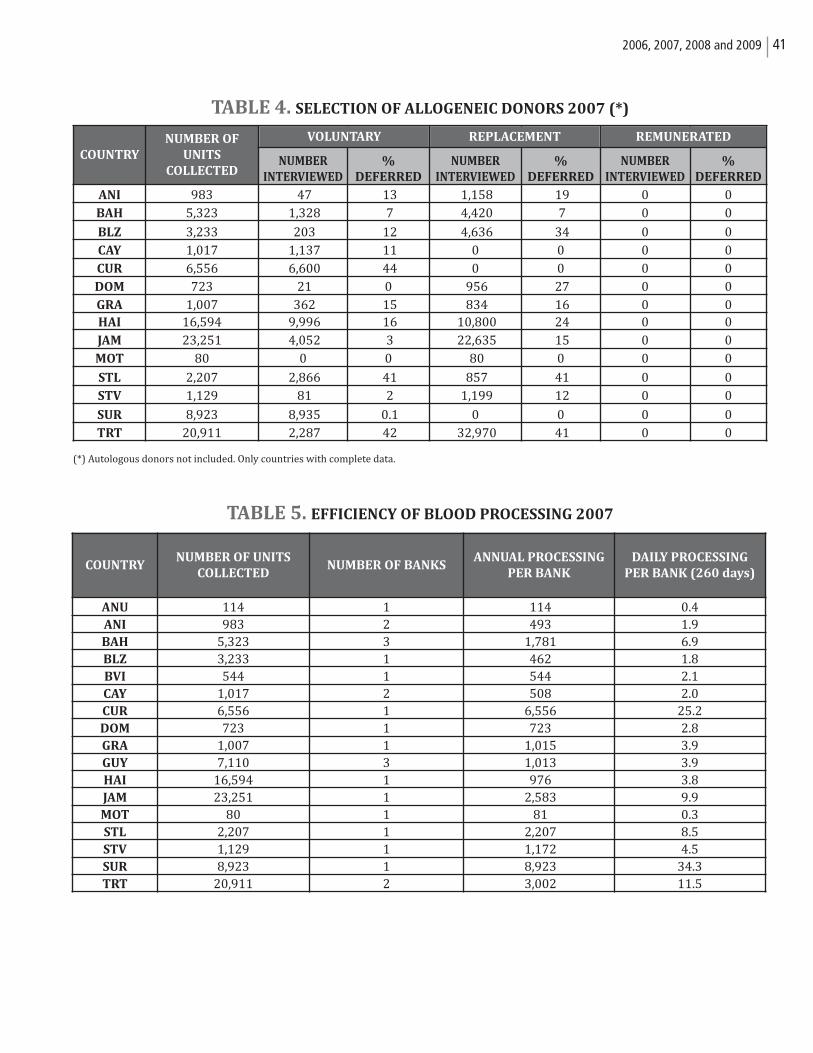
TABLE 4. SELECTION OF ALLOGENEIC DONORS 2007 (*)
(*) Autologous donors not included. Only countries with complete data.
TABLE 5. EFFICIENCY OF BLOOD PROCESSING 2007
COUNTRY
NUMBER OF
UNITS
COLLECTEDNUMBER
INTERVIEWED
%
DEFERRED
NUMBER
INTERVIEWED
%
DEFERRED
NUMBER
INTERVIEWED
%
DEFERRED
ANI 983 47 13 1,158 19 0 0BAH 5,323 1,328 7 4,420 7 0 0
BLZ 3,233 203 12 4,636 34 0 0CAY 1,017 1,137 11 0 0 0 0CUR 6,556 6,600 44 0 0 0 0DOM 723 21 0 956 27 0 0GRA 1,007 362 15 834 16 0 0HAI 16,594 9,996 16 10,800 24 0 0JAM 23,251 4,052 3 22,635 15 0 0MOT 80 0 0 80 0 0 0
STL 2,207 2,866 41 857 41 0 0STV 1,129 81 2 1,199 12 0 0
SUR 8,923 8,935 0.1 0 0 0 0TRT 20,911 2,287 42 32,970 41 0 0
VOLUNTARY REPLACEMENT REMUNERATED
COUNTRYNUMBER OF UNITS
COLLECTEDNUMBER OF BANKS
ANNUAL PROCESSING
PER BANK
DAILY PROCESSING
PER BANK (260 days)
ANU 114 1 114 0.4ANI 983 2 493 1.9BAH 5,323 3 1,781 6.9BLZ 3,233 1 462 1.8BVI 544 1 544 2.1CAY 1,017 2 508 2.0CUR 6,556 1 6,556 25.2DOM 723 1 723 2.8GRA 1,007 1 1,015 3.9GUY 7,110 3 1,013 3.9HAI 16,594 1 976 3.8JAM 23,251 1 2,583 9.9MOT 80 1 81 0.3STL 2,207 1 2,207 8.5STV 1,129 1 1,172 4.5SUR 8,923 1 8,923 34.3TRT 20,911 2 3,002 11.5
42 Supply of Blood for Transfusion in the Caribbean and Latin American Countries
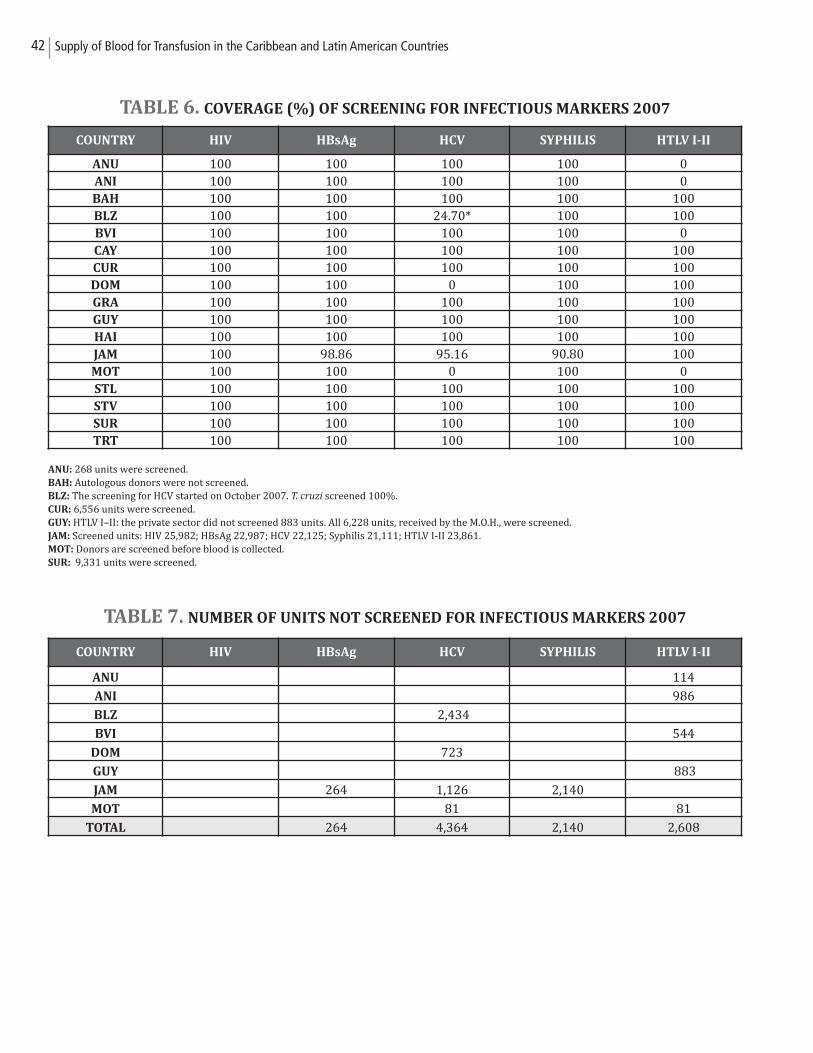
TABLE 6. COVERAGE (%) OF SCREENING FOR INFECTIOUS MARKERS 2007
ANU: 268 units were screened.BAH: Autologous donors were not screened.BLZ: The screening for HCV started on October 2007. T. cruzi screened 100%.CUR: 6,556 units were screened.GUY: HTLV I–II: the private sector did not screened 883 units. All 6,228 units, received by the M.O.H., were screened.JAM: Screened units: HIV 25,982; HBsAg 22,987; HCV 22,125; Syphilis 21,111; HTLV I-II 23,861.MOT: Donors are screened before blood is collected.SUR: 9,331 units were screened.
TABLE 7. NUMBER OF UNITS NOT SCREENED FOR INFECTIOUS MARKERS 2007
COUNTRY HIV HBsAg HCV SYPHILIS HTLV I-II
ANU 100 100 100 100 0ANI 100 100 100 100 0BAH 100 100 100 100 100BLZ 100 100 24.70* 100 100BVI 100 100 100 100 0CAY 100 100 100 100 100CUR 100 100 100 100 100DOM 100 100 0 100 100GRA 100 100 100 100 100GUY 100 100 100 100 100HAI 100 100 100 100 100JAM 100 98.86 95.16 90.80 100MOT 100 100 0 100 0STL 100 100 100 100 100STV 100 100 100 100 100SUR 100 100 100 100 100TRT 100 100 100 100 100
COUNTRY HIV HBsAg HCV SYPHILIS HTLV I-II
ANU 114
ANI 986
BLZ 2,434
BVI 544
DOM 723
GUY 883
JAM 264 1,126 2,140
MOT 81 81
TOTAL 264 4,364 2,140 2,608
432006, 2007, 2008 and 2009
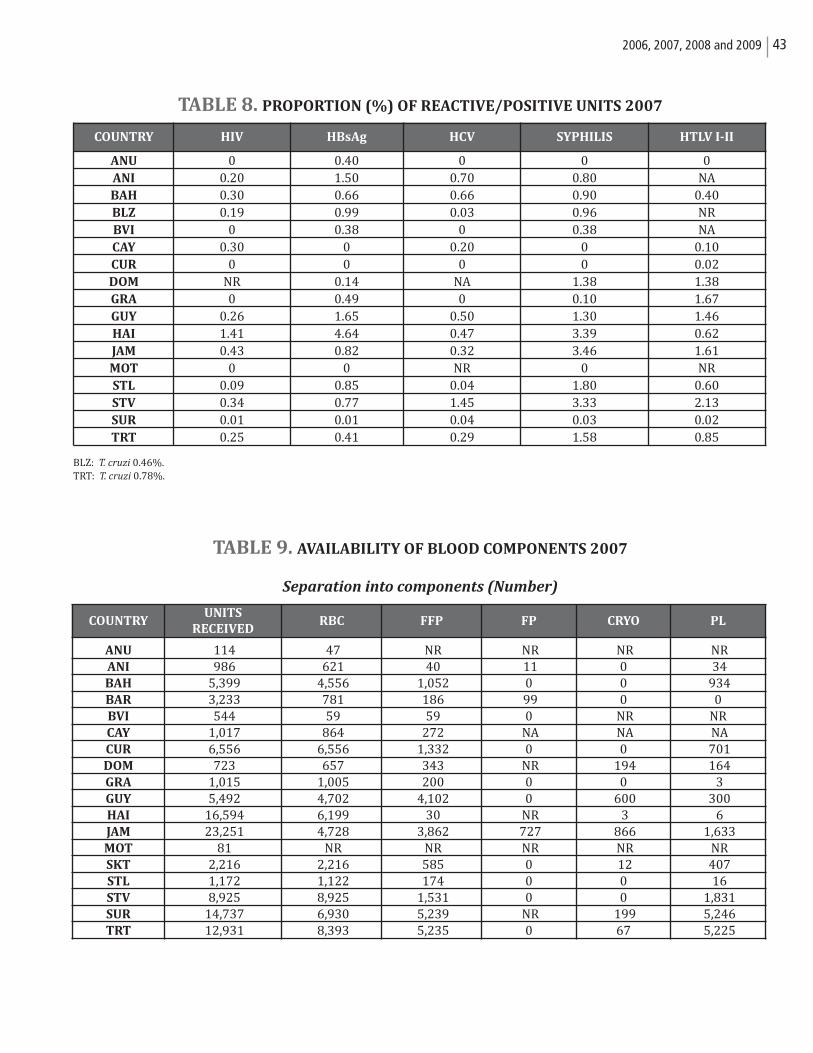
TABLE 8. PROPORTION (%) OF REACTIVE/POSITIVE UNITS 2007
BLZ: T. cruzi 0.46%.TRT: T. cruzi 0.78%.
TABLE 9. AVAILABILITY OF BLOOD COMPONENTS 2007
Separation into components (Number)
COUNTRY HIV HBsAg HCV SYPHILIS HTLV I-II
ANU 0 0.40 0 0 0ANI 0.20 1.50 0.70 0.80 NABAH 0.30 0.66 0.66 0.90 0.40BLZ 0.19 0.99 0.03 0.96 NRBVI 0 0.38 0 0.38 NACAY 0.30 0 0.20 0 0.10CUR 0 0 0 0 0.02DOM NR 0.14 NA 1.38 1.38GRA 0 0.49 0 0.10 1.67GUY 0.26 1.65 0.50 1.30 1.46HAI 1.41 4.64 0.47 3.39 0.62JAM 0.43 0.82 0.32 3.46 1.61MOT 0 0 NR 0 NRSTL 0.09 0.85 0.04 1.80 0.60STV 0.34 0.77 1.45 3.33 2.13SUR 0.01 0.01 0.04 0.03 0.02TRT 0.25 0.41 0.29 1.58 0.85
COUNTRYUNITS
RECEIVEDRBC FFP FP CRYO PL
ANU 114 47 NR NR NR NR ANI 986 621 40 11 0 34 BAH 5,399 4,556 1,052 0 0 934 BAR 3,233 781 186 99 0 0BVI 544 59 59 0 NR NRCAY 1,017 864 272 NA NA NA CUR 6,556 6,556 1,332 0 0 701 DOM 723 657 343 NR 194 164 GRA 1,015 1,005 200 0 0 3 GUY 5,492 4,702 4,102 0 600 300 HAI 16,594 6,199 30 NR 3 6 JAM 23,251 4,728 3,862 727 866 1,633 MOT 81 NR NR NR NR NR SKT 2,216 2,216 585 0 12 407 STL 1,172 1,122 174 0 0 16 STV 8,925 8,925 1,531 0 0 1,831 SUR 14,737 6,930 5,239 NR 199 5,246 TRT 12,931 8,393 5,235 0 67 5,225
44 Supply of Blood for Transfusion in the Caribbean and Latin American Countries
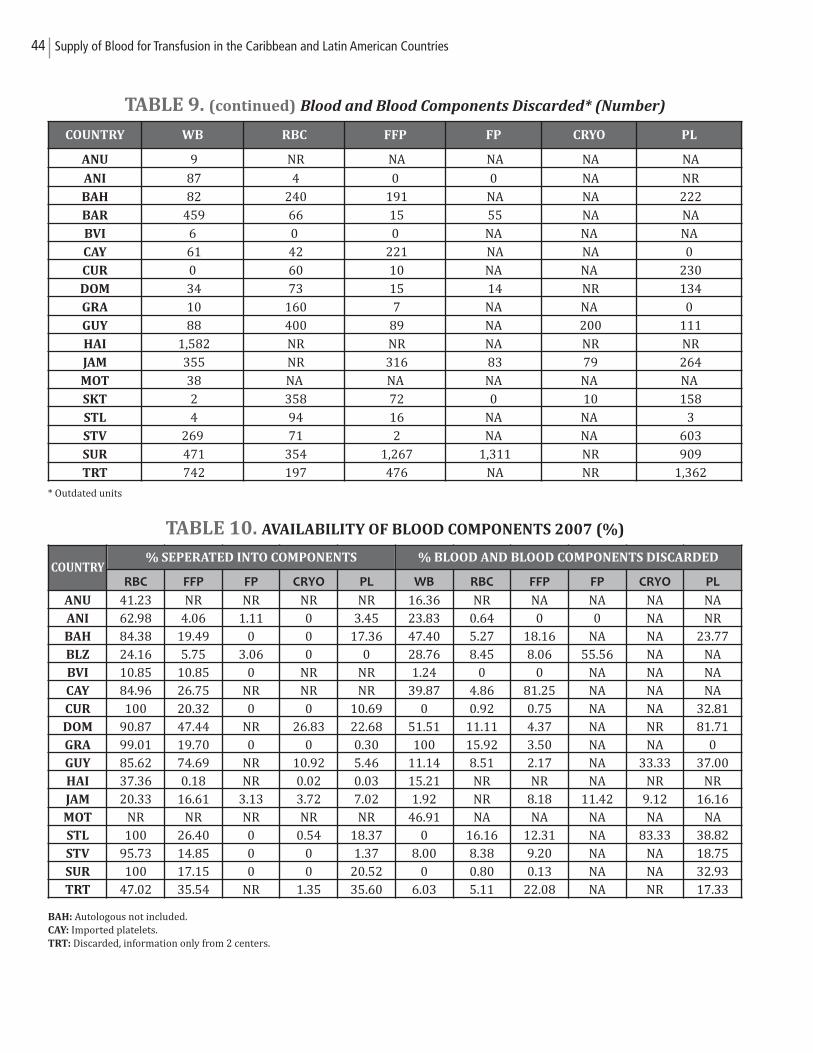
TABLE 9. (continued) Blood and Blood Components Discarded* (Number)
* Outdated units
TABLE 10. AVAILABILITY OF BLOOD COMPONENTS 2007 (%)
BAH: Autologous not included.CAY: Imported platelets.TRT: Discarded, information only from 2 centers.
COUNTRY WB RBC FFP FP CRYO PL
ANU 9 NR NA NA NA NA
ANI 87 4 0 0 NA NR
BAH 82 240 191 NA NA 222
BAR 459 66 15 55 NA NA
BVI 6 0 0 NA NA NA
CAY 61 42 221 NA NA 0
CUR 0 60 10 NA NA 230
DOM 34 73 15 14 NR 134
GRA 10 160 7 NA NA 0
GUY 88 400 89 NA 200 111
HAI 1,582 NR NR NA NR NR
JAM 355 NR 316 83 79 264
MOT 38 NA NA NA NA NA
SKT 2 358 72 0 10 158
STL 4 94 16 NA NA 3
STV 269 71 2 NA NA 603
SUR 471 354 1,267 1,311 NR 909
TRT 742 197 476 NA NR 1,362
COUNTRYRBC FFP FP CRYO PL WB RBC FFP FP CRYO PL
ANU 41.23 NR NR NR NR 16.36 NR NA NA NA NAANI 62.98 4.06 1.11 0 3.45 23.83 0.64 0 0 NA NRBAH 84.38 19.49 0 0 17.36 47.40 5.27 18.16 NA NA 23.77BLZ 24.16 5.75 3.06 0 0 28.76 8.45 8.06 55.56 NA NABVI 10.85 10.85 0 NR NR 1.24 0 0 NA NA NACAY 84.96 26.75 NR NR NR 39.87 4.86 81.25 NA NA NACUR 100 20.32 0 0 10.69 0 0.92 0.75 NA NA 32.81DOM 90.87 47.44 NR 26.83 22.68 51.51 11.11 4.37 NA NR 81.71GRA 99.01 19.70 0 0 0.30 100 15.92 3.50 NA NA 0GUY 85.62 74.69 NR 10.92 5.46 11.14 8.51 2.17 NA 33.33 37.00HAI 37.36 0.18 NR 0.02 0.03 15.21 NR NR NA NR NRJAM 20.33 16.61 3.13 3.72 7.02 1.92 NR 8.18 11.42 9.12 16.16MOT NR NR NR NR NR 46.91 NA NA NA NA NASTL 100 26.40 0 0.54 18.37 0 16.16 12.31 NA 83.33 38.82STV 95.73 14.85 0 0 1.37 8.00 8.38 9.20 NA NA 18.75SUR 100 17.15 0 0 20.52 0 0.80 0.13 NA NA 32.93TRT 47.02 35.54 NR 1.35 35.60 6.03 5.11 22.08 NA NR 17.33
% SEPERATED INTO COMPONENTS % BLOOD AND BLOOD COMPONENTS DISCARDED
452006, 2007, 2008 and 2009
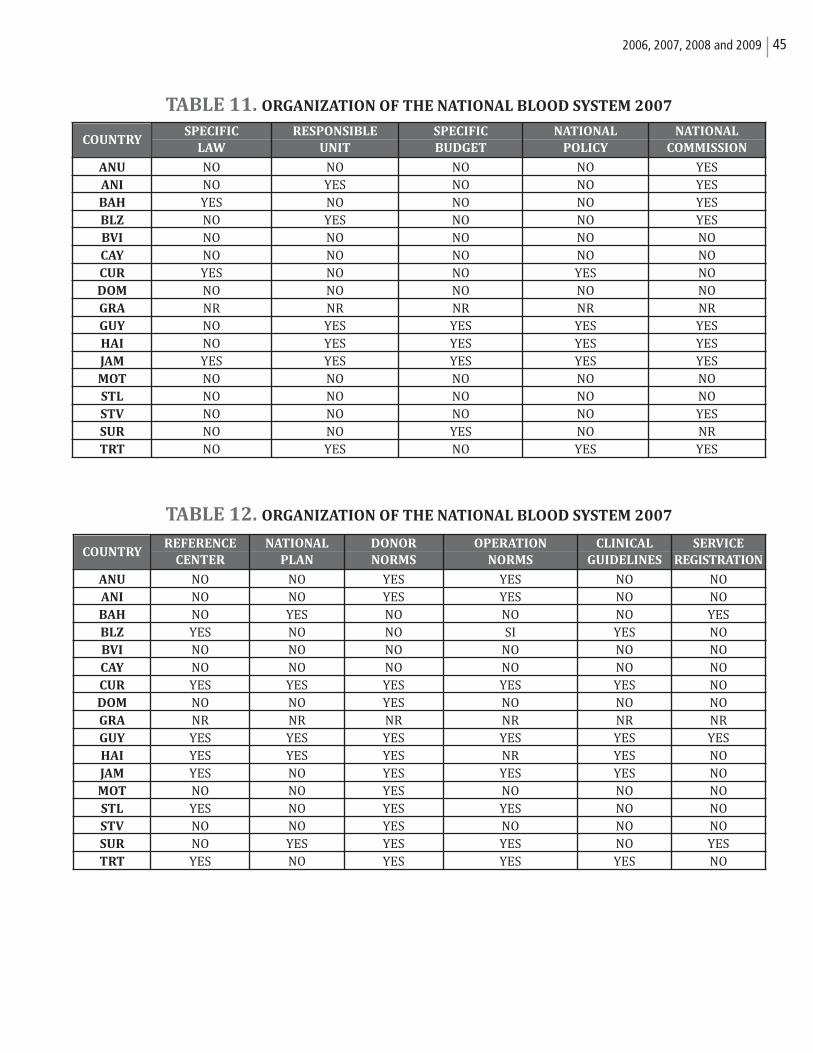
TABLE 11. ORGANIZATION OF THE NATIONAL BLOOD SYSTEM 2007
TABLE 12. ORGANIZATION OF THE NATIONAL BLOOD SYSTEM 2007
SPECIFIC RESPONSIBLE SPECIFIC NATIONAL NATIONAL
LAW UNIT BUDGET POLICY COMMISSION
ANU NO NO NO NO YESANI NO YES NO NO YESBAH YES NO NO NO YESBLZ NO YES NO NO YESBVI NO NO NO NO NOCAY NO NO NO NO NOCUR YES NO NO YES NODOM NO NO NO NO NOGRA NR NR NR NR NRGUY NO YES YES YES YESHAI NO YES YES YES YESJAM YES YES YES YES YESMOT NO NO NO NO NOSTL NO NO NO NO NOSTV NO NO NO NO YESSUR NO NO YES NO NRTRT NO YES NO YES YES
COUNTRY
REFERENCE NATIONAL DONOR OPERATION CLINICAL SERVICE
CENTER PLAN NORMS NORMS GUIDELINES REGISTRATION
ANU NO NO YES YES NO NOANI NO NO YES YES NO NOBAH NO YES NO NO NO YESBLZ YES NO NO SI YES NOBVI NO NO NO NO NO NOCAY NO NO NO NO NO NOCUR YES YES YES YES YES NODOM NO NO YES NO NO NOGRA NR NR NR NR NR NRGUY YES YES YES YES YES YESHAI YES YES YES NR YES NOJAM YES NO YES YES YES NOMOT NO NO YES NO NO NOSTL YES NO YES YES NO NOSTV NO NO YES NO NO NOSUR NO YES YES YES NO YESTRT YES NO YES YES YES NO
COUNTRY
46 Supply of Blood for Transfusion in the Caribbean and Latin American Countries
TABLE 13. ORGANIZATION OF THE NATIONAL BLOOD SYSTEM 2007
TABLE 14. ORGANIZATION OF THE NATIONAL BLOOD SYSTEM 2007
QUALITY EXTERNAL EXTERNAL INSPECTION CONTINUED
COUNTRY ASSURANCE EVALUATION EVALUATION PROGRAM EDUCATION
POLICY SEROLOGY–TTI IMMUNOHEMATOLOGY
ANU NR YES YES NO YESANI YES YES YES NO NOBAH NO YES YES NO YESBLZ NO YES YES SI NOBVI NO YES YES NO NOCAY NO YES YES NO YESCUR YES YES YES YES YESDOM NO YES YES NO NOGRA NR NR NR NR NRGUY YES YES YES NO YESHAI YES YES YES NO YESJAM NO YES YES NO YESMOT NO YES YES NO NOSTL NO YES YES NO NOSTV NO YES YES NO NOSUR YES YES YES NO NOTRT NO YES YES NO YES
COUNTRY STAFF CERTIFICATION SERVICE ACCREDITATION
ANU NO NO
ANI NO NO
BAH YES NO
BLZ NO NO
BVI YES NO
CAY YES NO
CUR YES NO
DOM NO NO
GRA NR NR
GUY YES NO
HAI NO NO
JAM YES NO
MOT NO NO
STL NO NO
STV NO NO
SUR NO NO
TRT YES NO
472006, 2007, 2008 and 2009
TABLE 15. COUNTRIES WITH 100% SCREENING FOR INFECTIOUS MARKERS 2007*
* Proportion of units received
HIV HBsAg HCV SYPHILIS HTLV I–II FIVE MARKERS
ANU ANU ANU ANU
ANI ANI ANI ANI
BAH BAH BAH BAH BAH BAH
BLZ BLZ BLZ BLZ
BVI BVI BVI BVI
CAY CAY CAY CAY CAY CAY
CUR CUR CUR CUR CUR CUR
DOM DOM DOM DOM
GRA GRA GRA GRA GRA GRA
GUY GUY GUY GUY GUY GUY
HAI HAI HAI HAI HAI HAI
JAM JAM
MOT MOT MOT
STL STL STL STL STL STL
STV STV STV STV STV STV
SUR SUR SUR SUR SUR SUR
TRT TRT TRT TRT TRT TRT
17 16 13 16 13 10
48 Supply of Blood for Transfusion in the Caribbean and Latin American Countries
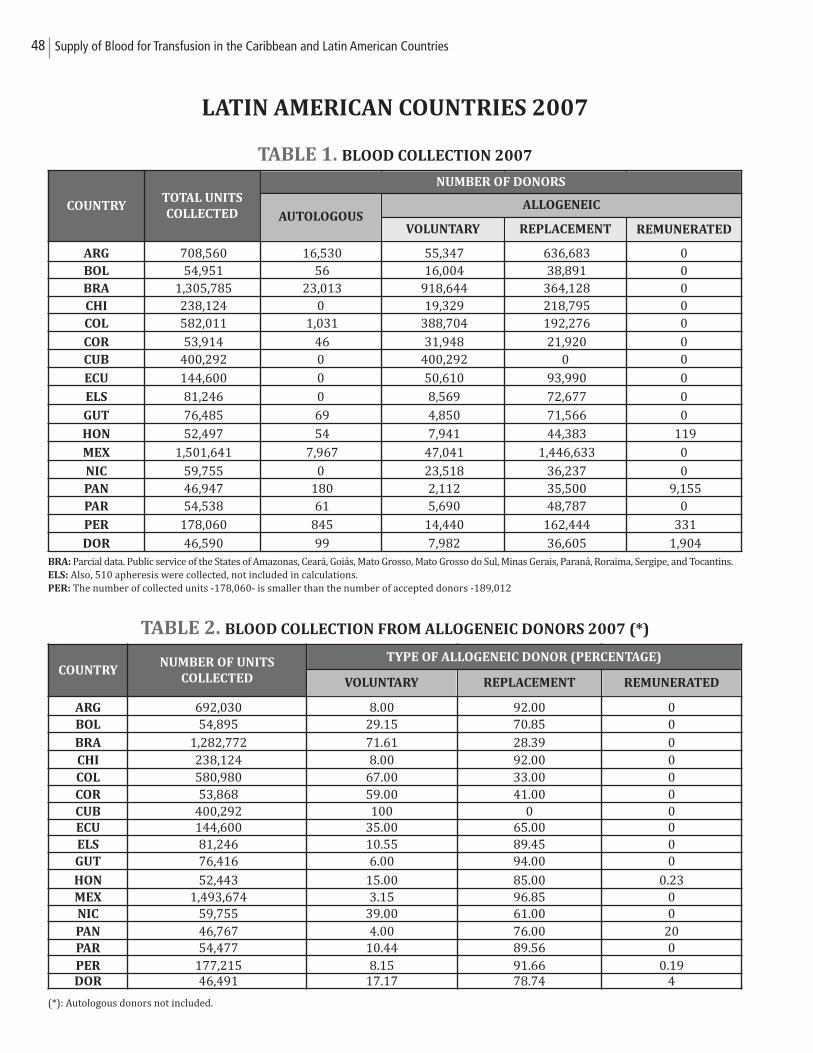
LATIN AMERICAN COUNTRIES 2007
TABLE 1. BLOOD COLLECTION 2007
BRA: Parcial data. Public service of the States of Amazonas, Ceará, Goiás, Mato Grosso, Mato Grosso do Sul, Minas Gerais, Paraná, Roraima, Sergipe, and Tocantins.ELS: Also, 510 apheresis were collected, not included in calculations.PER: The number of collected units -178,060- is smaller than the number of accepted donors -189,012
TABLE 2. BLOOD COLLECTION FROM ALLOGENEIC DONORS 2007 (*)
(*): Autologous donors not included.
COUNTRYTOTAL UNITS
COLLECTED
ARG 708,560 16,530 55,347 636,683 0BOL 54,951 56 16,004 38,891 0BRA 1,305,785 23,013 918,644 364,128 0CHI 238,124 0 19,329 218,795 0COL 582,011 1,031 388,704 192,276 0
COR 53,914 46 31,948 21,920 0CUB 400,292 0 400,292 0 0
ECU 144,600 0 50,610 93,990 0
ELS 81,246 0 8,569 72,677 0
GUT 76,485 69 4,850 71,566 0
HON 52,497 54 7,941 44,383 119
MEX 1,501,641 7,967 47,041 1,446,633 0
NIC 59,755 0 23,518 36,237 0PAN 46,947 180 2,112 35,500 9,155 PAR 54,538 61 5,690 48,787 0
PER 178,060 845 14,440 162,444 331
DOR 46,590 99 7,982 36,605 1,904
NUMBER OF DONORS
AUTOLOGOUSALLOGENEIC
VOLUNTARY REPLACEMENT REMUNERATED
COUNTRYNUMBER OF UNITS
COLLECTED
ARG 692,030 8.00 92.00 0BOL 54,895 29.15 70.85 0BRA 1,282,772 71.61 28.39 0CHI 238,124 8.00 92.00 0COL 580,980 67.00 33.00 0COR 53,868 59.00 41.00 0CUB 400,292 100 0 0ECU 144,600 35.00 65.00 0ELS 81,246 10.55 89.45 0GUT 76,416 6.00 94.00 0
HON 52,443 15.00 85.00 0.23MEX 1,493,674 3.15 96.85 0NIC 59,755 39.00 61.00 0PAN 46,767 4.00 76.00 20PAR 54,477 10.44 89.56 0PER 177,215 8.15 91.66 0.19DOR 46,491 17.17 78.74 4
TYPE OF ALLOGENEIC DONOR (PERCENTAGE)
VOLUNTARY REPLACEMENT REMUNERATED
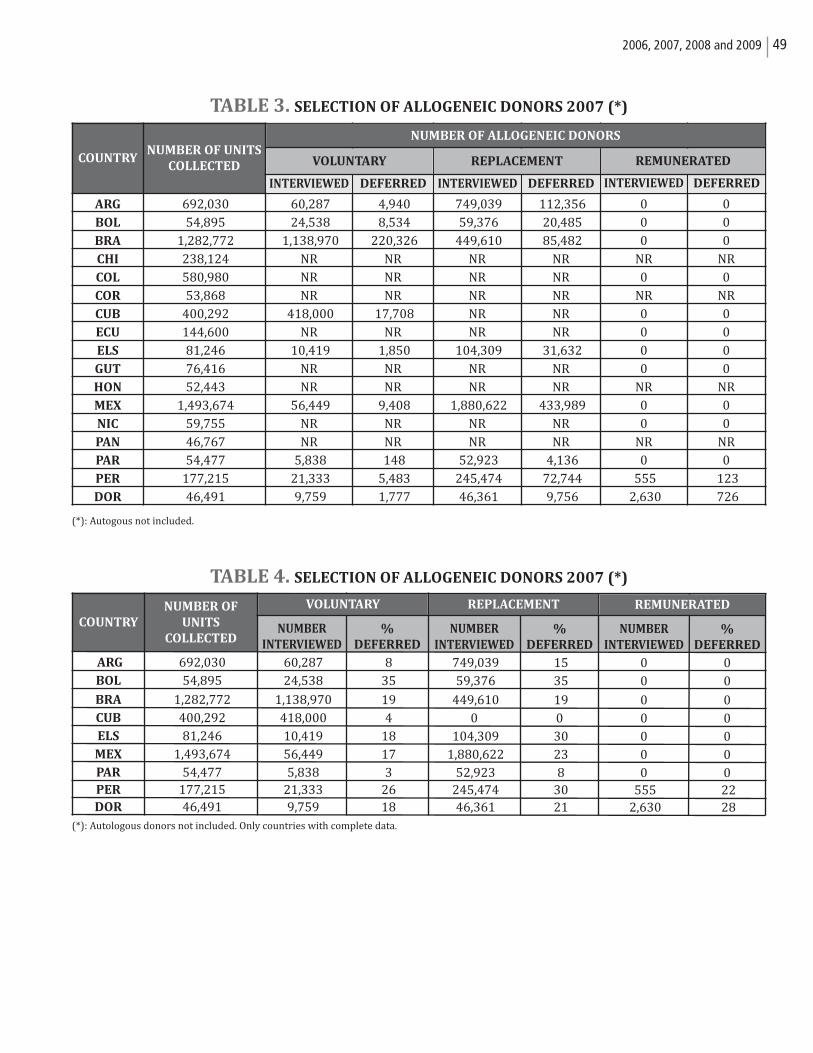
492006, 2007, 2008 and 2009
TABLE 3. SELECTION OF ALLOGENEIC DONORS 2007 (*)
(*): Autogous not included.
TABLE 4. SELECTION OF ALLOGENEIC DONORS 2007 (*)
(*): Autologous donors not included. Only countries with complete data.
COUNTRYNUMBER OF UNITS
COLLECTED
ARG 692,030 60,287 4,940 749,039 112,356 0 0BOL 54,895 24,538 8,534 59,376 20,485 0 0BRA 1,282,772 1,138,970 220,326 449,610 85,482 0 0CHI 238,124 NR NR NR NR NR NRCOL 580,980 NR NR NR NR 0 0COR 53,868 NR NR NR NR NR NRCUB 400,292 418,000 17,708 NR NR 0 0ECU 144,600 NR NR NR NR 0 0ELS 81,246 10,419 1,850 104,309 31,632 0 0GUT 76,416 NR NR NR NR 0 0HON 52,443 NR NR NR NR NR NRMEX 1,493,674 56,449 9,408 1,880,622 433,989 0 0NIC 59,755 NR NR NR NR 0 0PAN 46,767 NR NR NR NR NR NRPAR 54,477 5,838 148 52,923 4,136 0 0PER 177,215 21,333 5,483 245,474 72,744 555 123 DOR 46,491 9,759 1,777 46,361 9,756 2,630 726
NUMBER OF ALLOGENEIC DONORS
VOLUNTARY REPLACEMENT REMUNERATED
INTERVIEWED DEFERRED DEFERRED DEFERREDINTERVIEWED INTERVIEWED
COUNTRY
NUMBER OF
UNITS
COLLECTEDNUMBER
INTERVIEWED
%
DEFERRED
NUMBER
INTERVIEWED
%
DEFERRED
NUMBER
INTERVIEWED
%
DEFERRED
ARG 692,030 60,287 8 749,039 15 0 0BOL 54,895 24,538 35 59,376 35 0 0
BRA 1,282,772 1,138,970 19 449,610 19 0 0CUB 400,292 418,000 4 0 0 0 0ELS 81,246 10,419 18 104,309 30 0 0MEX 1,493,674 56,449 17 1,880,622 23 0 0PAR 54,477 5,838 3 52,923 8 0 0PER 177,215 21,333 26 245,474 30 555 22 DOR 46,491 9,759 18 46,361 21 2,630 28
VOLUNTARY REPLACEMENT REMUNERATED
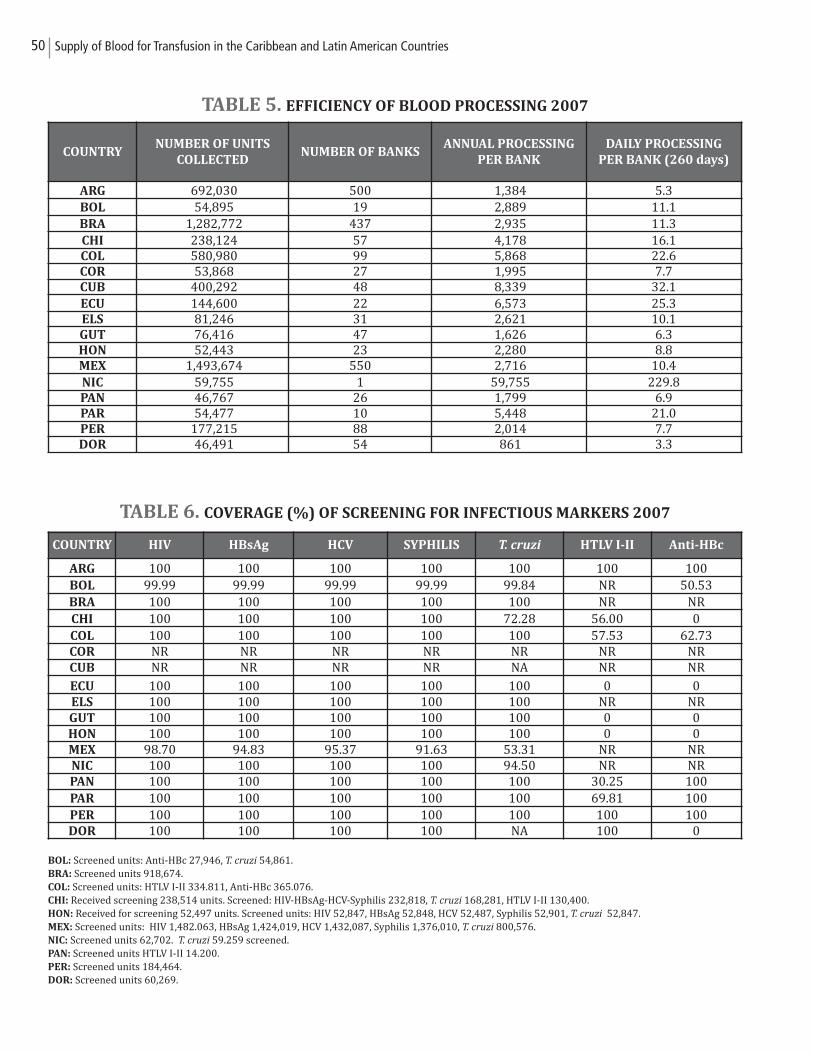
50 Supply of Blood for Transfusion in the Caribbean and Latin American Countries
TABLE 5. EFFICIENCY OF BLOOD PROCESSING 2007
TABLE 6. COVERAGE (%) OF SCREENING FOR INFECTIOUS MARKERS 2007
BOL: Screened units: Anti-HBc 27,946, T. cruzi 54,861.BRA: Screened units 918,674.COL: Screened units: HTLV I-II 334.811, Anti-HBc 365.076. CHI: Received screening 238,514 units. Screened: HIV-HBsAg-HCV-Syphilis 232,818, T. cruzi 168,281, HTLV I-II 130,400. HON: Received for screening 52,497 units. Screened units: HIV 52,847, HBsAg 52,848, HCV 52,487, Syphilis 52,901, T. cruzi 52,847.MEX: Screened units: HIV 1,482.063, HBsAg 1,424,019, HCV 1,432,087, Syphilis 1,376,010, T. cruzi 800,576. NIC: Screened units 62,702. T. cruzi 59.259 screened. PAN: Screened units HTLV I-II 14.200. PER: Screened units 184,464.DOR: Screened units 60,269.
COUNTRYNUMBER OF UNITS
COLLECTEDNUMBER OF BANKS
ANNUAL PROCESSING
PER BANK
DAILY PROCESSING
PER BANK (260 days)
ARG 692,030 500 1,384 5.3BOL 54,895 19 2,889 11.1BRA 1,282,772 437 2,935 11.3CHI 238,124 57 4,178 16.1COL 580,980 99 5,868 22.6COR 53,868 27 1,995 7.7CUB 400,292 48 8,339 32.1ECU 144,600 22 6,573 25.3ELS 81,246 31 2,621 10.1GUT 76,416 47 1,626 6.3HON 52,443 23 2,280 8.8MEX 1,493,674 550 2,716 10.4NIC 59,755 1 59,755 229.8PAN 46,767 26 1,799 6.9PAR 54,477 10 5,448 21.0PER 177,215 88 2,014 7.7DOR 46,491 54 861 3.3
COUNTRY HIV HBsAg HCV SYPHILIS T. cruzi HTLV I-II Anti-HBc
ARG 100 100 100 100 100 100 100BOL 99.99 99.99 99.99 99.99 99.84 NR 50.53BRA 100 100 100 100 100 NR NRCHI 100 100 100 100 72.28 56.00 0COL 100 100 100 100 100 57.53 62.73COR NR NR NR NR NR NR NRCUB NR NR NR NR NA NR NR
ECU 100 100 100 100 100 0 0ELS 100 100 100 100 100 NR NRGUT 100 100 100 100 100 0 0HON 100 100 100 100 100 0 0MEX 98.70 94.83 95.37 91.63 53.31 NR NRNIC 100 100 100 100 94.50 NR NRPAN 100 100 100 100 100 30.25 100PAR 100 100 100 100 100 69.81 100PER 100 100 100 100 100 100 100DOR 100 100 100 100 NA 100 0
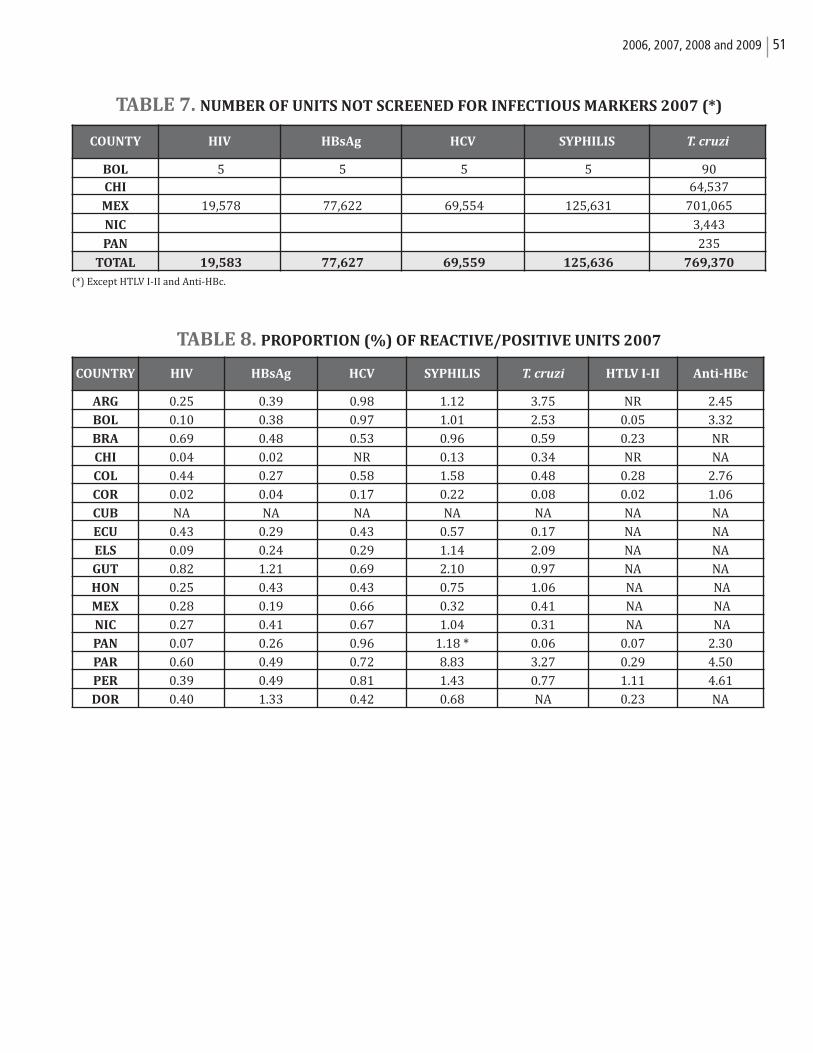
512006, 2007, 2008 and 2009
TABLE 7. NUMBER OF UNITS NOT SCREENED FOR INFECTIOUS MARKERS 2007 (*)
(*) Except HTLV I-II and Anti-HBc.
TABLE 8. PROPORTION (%) OF REACTIVE/POSITIVE UNITS 2007
COUNTY HIV HBsAg HCV SYPHILIS T. cruzi
BOL 5 5 5 5 90 CHI 64,537
MEX 19,578 77,622 69,554 125,631 701,065
NIC 3,443
PAN 235
TOTAL 19,583 77,627 69,559 125,636 769,370
COUNTRY HIV HBsAg HCV SYPHILIS T. cruzi HTLV I-II Anti-HBc
ARG 0.25 0.39 0.98 1.12 3.75 NR 2.45
BOL 0.10 0.38 0.97 1.01 2.53 0.05 3.32
BRA 0.69 0.48 0.53 0.96 0.59 0.23 NR
CHI 0.04 0.02 NR 0.13 0.34 NR NA
COL 0.44 0.27 0.58 1.58 0.48 0.28 2.76
COR 0.02 0.04 0.17 0.22 0.08 0.02 1.06
CUB NA NA NA NA NA NA NA
ECU 0.43 0.29 0.43 0.57 0.17 NA NA
ELS 0.09 0.24 0.29 1.14 2.09 NA NA
GUT 0.82 1.21 0.69 2.10 0.97 NA NA
HON 0.25 0.43 0.43 0.75 1.06 NA NA
MEX 0.28 0.19 0.66 0.32 0.41 NA NA
NIC 0.27 0.41 0.67 1.04 0.31 NA NA
PAN 0.07 0.26 0.96 1.18 * 0.06 0.07 2.30
PAR 0.60 0.49 0.72 8.83 3.27 0.29 4.50
PER 0.39 0.49 0.81 1.43 0.77 1.11 4.61
DOR 0.40 1.33 0.42 0.68 NA 0.23 NA
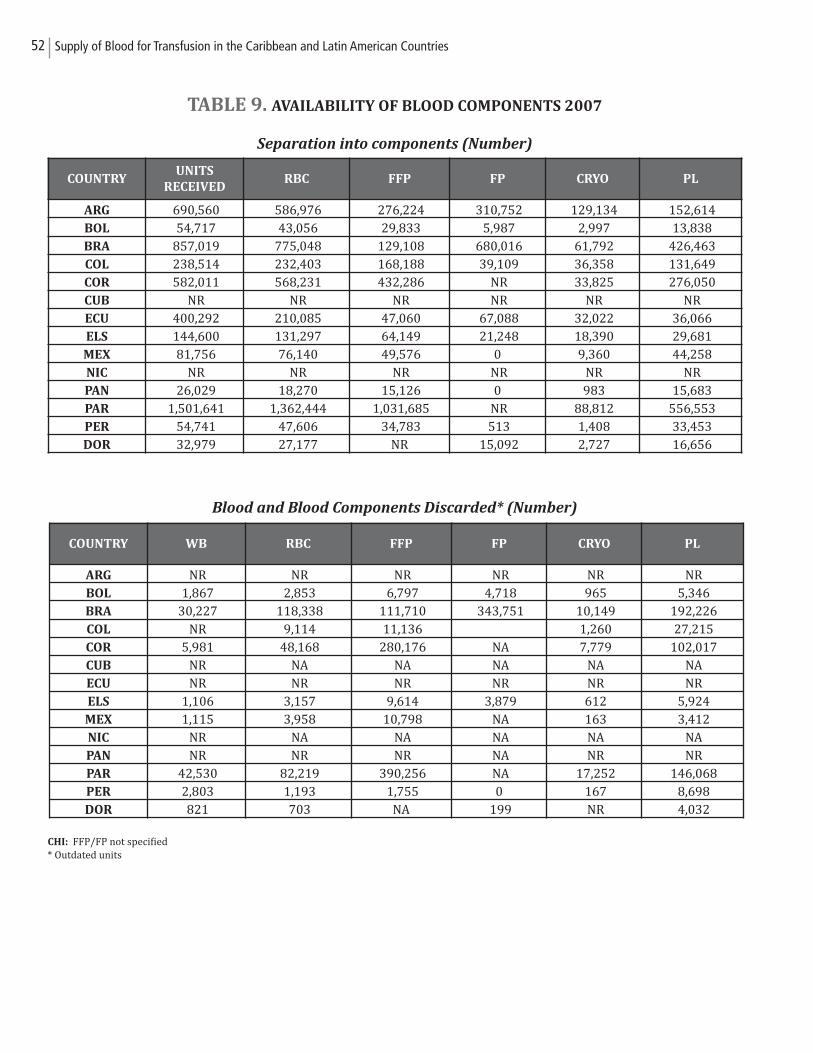
52 Supply of Blood for Transfusion in the Caribbean and Latin American Countries
TABLE 9. AVAILABILITY OF BLOOD COMPONENTS 2007
Separation into components (Number)
Blood and Blood Components Discarded* (Number)
CHI: FFP/FP not specified* Outdated units
COUNTRYUNITS
RECEIVEDRBC FFP FP CRYO PL
ARG 690,560 586,976 276,224 310,752 129,134 152,614 BOL 54,717 43,056 29,833 5,987 2,997 13,838 BRA 857,019 775,048 129,108 680,016 61,792 426,463 COL 238,514 232,403 168,188 39,109 36,358 131,649 COR 582,011 568,231 432,286 NR 33,825 276,050 CUB NR NR NR NR NR NR ECU 400,292 210,085 47,060 67,088 32,022 36,066 ELS 144,600 131,297 64,149 21,248 18,390 29,681 MEX 81,756 76,140 49,576 0 9,360 44,258 NIC NR NR NR NR NR NR PAN 26,029 18,270 15,126 0 983 15,683 PAR 1,501,641 1,362,444 1,031,685 NR 88,812 556,553 PER 54,741 47,606 34,783 513 1,408 33,453 DOR 32,979 27,177 NR 15,092 2,727 16,656
COUNTRY WB RBC FFP FP CRYO PL
ARG NR NR NR NR NR NR BOL 1,867 2,853 6,797 4,718 965 5,346 BRA 30,227 118,338 111,710 343,751 10,149 192,226 COL NR 9,114 11,136 1,260 27,215 COR 5,981 48,168 280,176 NA 7,779 102,017 CUB NR NA NA NA NA NA ECU NR NR NR NR NR NR ELS 1,106 3,157 9,614 3,879 612 5,924 MEX 1,115 3,958 10,798 NA 163 3,412 NIC NR NA NA NA NA NA PAN NR NR NR NA NR NR PAR 42,530 82,219 390,256 NA 17,252 146,068 PER 2,803 1,193 1,755 0 167 8,698 DOR 821 703 NA 199 NR 4,032
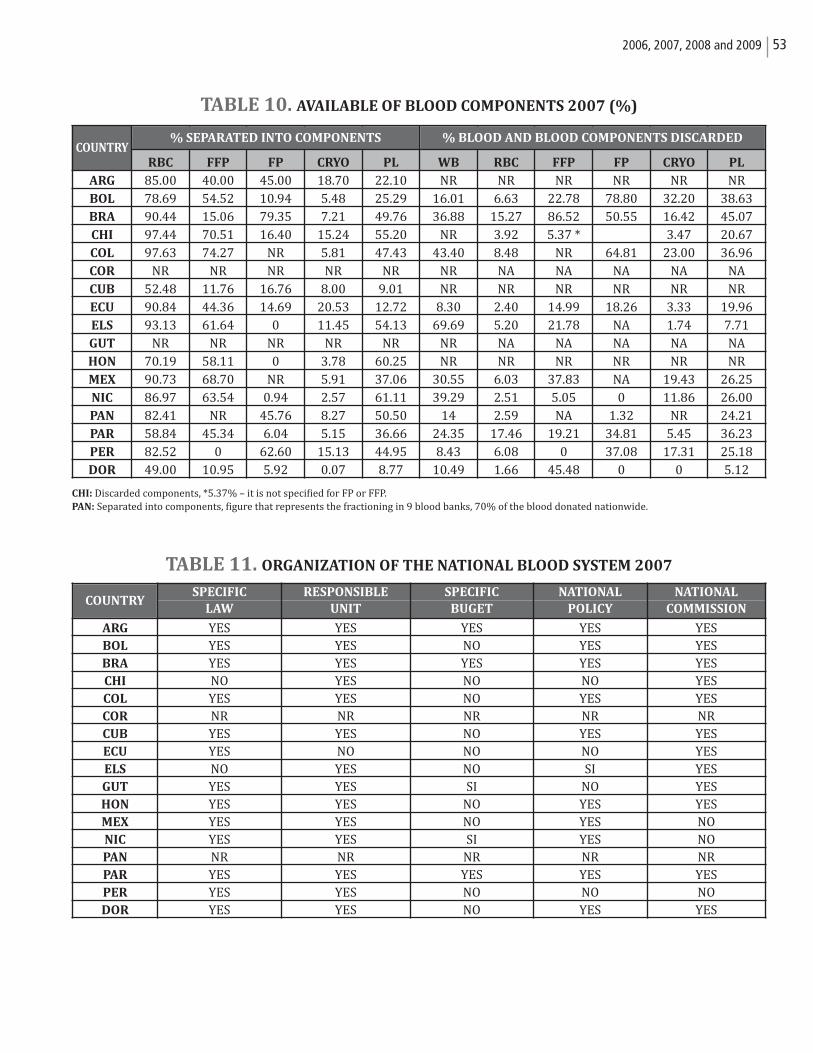
532006, 2007, 2008 and 2009
TABLE 10. AVAILABLE OF BLOOD COMPONENTS 2007 (%)
CHI: Discarded components, *5.37% – it is not specified for FP or FFP. PAN: Separated into components, figure that represents the fractioning in 9 blood banks, 70% of the blood donated nationwide.
TABLE 11. ORGANIZATION OF THE NATIONAL BLOOD SYSTEM 2007
COUNTRYRBC FFP FP CRYO PL WB RBC FFP FP CRYO PL
ARG 85.00 40.00 45.00 18.70 22.10 NR NR NR NR NR NRBOL 78.69 54.52 10.94 5.48 25.29 16.01 6.63 22.78 78.80 32.20 38.63BRA 90.44 15.06 79.35 7.21 49.76 36.88 15.27 86.52 50.55 16.42 45.07CHI 97.44 70.51 16.40 15.24 55.20 NR 3.92 5.37 * 3.47 20.67COL 97.63 74.27 NR 5.81 47.43 43.40 8.48 NR 64.81 23.00 36.96COR NR NR NR NR NR NR NA NA NA NA NACUB 52.48 11.76 16.76 8.00 9.01 NR NR NR NR NR NRECU 90.84 44.36 14.69 20.53 12.72 8.30 2.40 14.99 18.26 3.33 19.96ELS 93.13 61.64 0 11.45 54.13 69.69 5.20 21.78 NA 1.74 7.71GUT NR NR NR NR NR NR NA NA NA NA NAHON 70.19 58.11 0 3.78 60.25 NR NR NR NR NR NRMEX 90.73 68.70 NR 5.91 37.06 30.55 6.03 37.83 NA 19.43 26.25NIC 86.97 63.54 0.94 2.57 61.11 39.29 2.51 5.05 0 11.86 26.00PAN 82.41 NR 45.76 8.27 50.50 14 2.59 NA 1.32 NR 24.21PAR 58.84 45.34 6.04 5.15 36.66 24.35 17.46 19.21 34.81 5.45 36.23PER 82.52 0 62.60 15.13 44.95 8.43 6.08 0 37.08 17.31 25.18DOR 49.00 10.95 5.92 0.07 8.77 10.49 1.66 45.48 0 0 5.12
% SEPARATED INTO COMPONENTS % BLOOD AND BLOOD COMPONENTS DISCARDED
SPECIFIC RESPONSIBLE SPECIFIC NATIONAL NATIONAL
LAW UNIT BUGET POLICY COMMISSION
ARG YES YES YES YES YESBOL YES YES NO YES YESBRA YES YES YES YES YESCHI NO YES NO NO YESCOL YES YES NO YES YESCOR NR NR NR NR NRCUB YES YES NO YES YESECU YES NO NO NO YESELS NO YES NO SI YESGUT YES YES SI NO YESHON YES YES NO YES YESMEX YES YES NO YES NONIC YES YES SI YES NOPAN NR NR NR NR NRPAR YES YES YES YES YESPER YES YES NO NO NODOR YES YES NO YES YES
COUNTRY
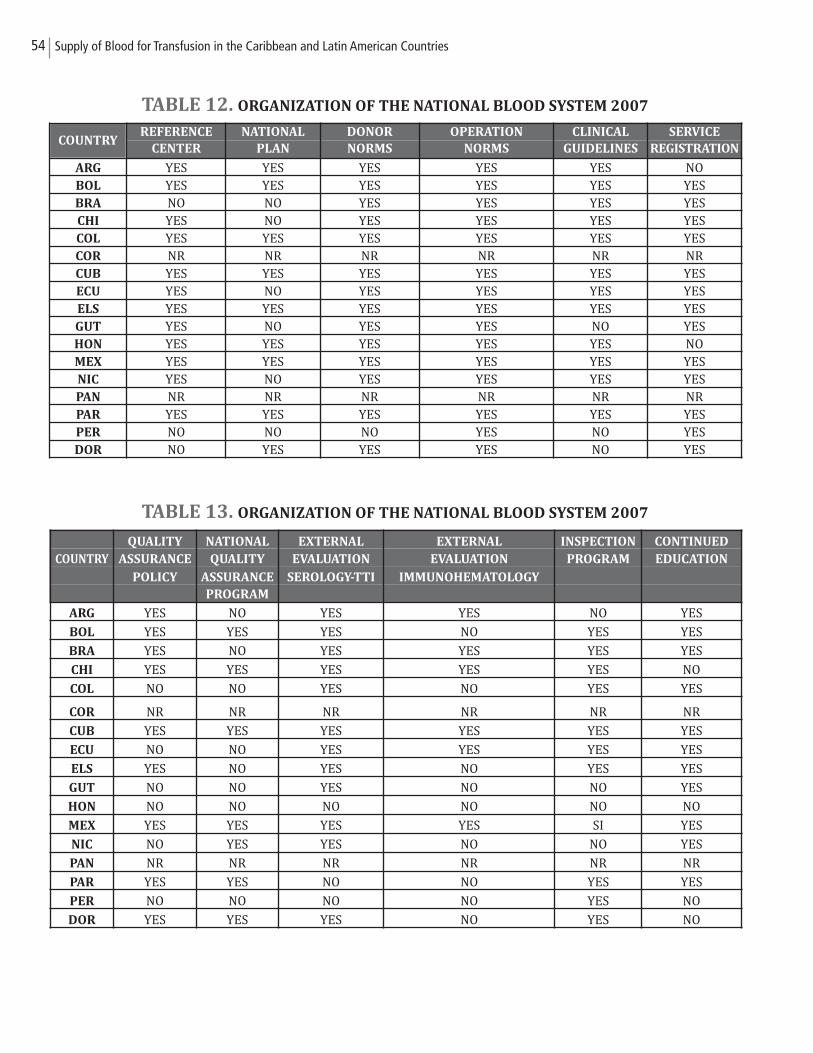
54 Supply of Blood for Transfusion in the Caribbean and Latin American Countries
TABLE 12. ORGANIZATION OF THE NATIONAL BLOOD SYSTEM 2007
TABLE 13. ORGANIZATION OF THE NATIONAL BLOOD SYSTEM 2007
REFERENCE NATIONAL DONOR OPERATION CLINICAL SERVICE
CENTER PLAN NORMS NORMS GUIDELINES REGISTRATION
ARG YES YES YES YES YES NOBOL YES YES YES YES YES YESBRA NO NO YES YES YES YESCHI YES NO YES YES YES YESCOL YES YES YES YES YES YESCOR NR NR NR NR NR NRCUB YES YES YES YES YES YESECU YES NO YES YES YES YESELS YES YES YES YES YES YESGUT YES NO YES YES NO YESHON YES YES YES YES YES NOMEX YES YES YES YES YES YESNIC YES NO YES YES YES YESPAN NR NR NR NR NR NRPAR YES YES YES YES YES YESPER NO NO NO YES NO YESDOR NO YES YES YES NO YES
COUNTRY
QUALITY NATIONAL EXTERNAL EXTERNAL INSPECTION CONTINUED
COUNTRY ASSURANCE QUALITY EVALUATION EVALUATION PROGRAM EDUCATION
POLICY ASSURANCE SEROLOGY-TTI IMMUNOHEMATOLOGY
PROGRAM
ARG YES NO YES YES NO YES
BOL YES YES YES NO YES YES
BRA YES NO YES YES YES YES
CHI YES YES YES YES YES NO
COL NO NO YES NO YES YES
COR NR NR NR NR NR NR
CUB YES YES YES YES YES YES
ECU NO NO YES YES YES YES
ELS YES NO YES NO YES YES
GUT NO NO YES NO NO YES
HON NO NO NO NO NO NO
MEX YES YES YES YES SI YES
NIC NO YES YES NO NO YES
PAN NR NR NR NR NR NR
PAR YES YES NO NO YES YES
PER NO NO NO NO YES NO
DOR YES YES YES NO YES NO
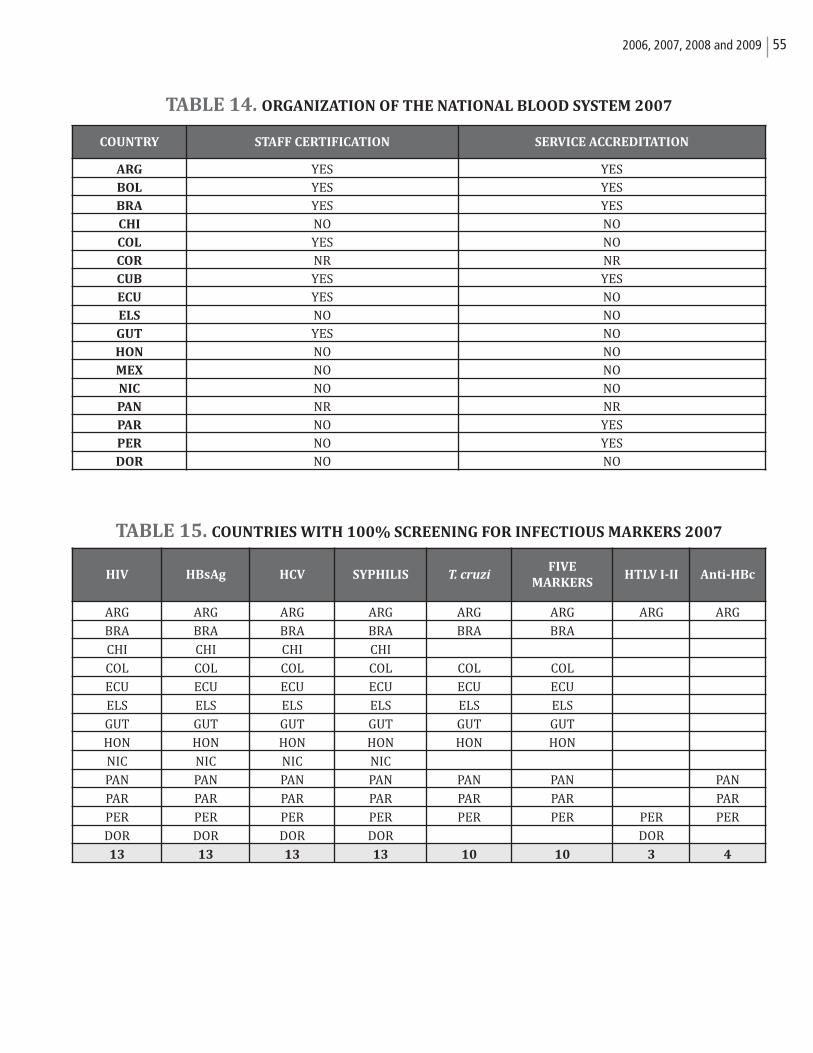
552006, 2007, 2008 and 2009
TABLE 14. ORGANIZATION OF THE NATIONAL BLOOD SYSTEM 2007
TABLE 15. COUNTRIES WITH 100% SCREENING FOR INFECTIOUS MARKERS 2007
COUNTRY STAFF CERTIFICATION SERVICE ACCREDITATION
ARG YES YESBOL YES YESBRA YES YESCHI NO NOCOL YES NOCOR NR NRCUB YES YESECU YES NOELS NO NOGUT YES NOHON NO NOMEX NO NONIC NO NOPAN NR NRPAR NO YESPER NO YESDOR NO NO
HIV HBsAg HCV SYPHILIS T. cruziFIVE
MARKERSHTLV I-II Anti-HBc
ARG ARG ARG ARG ARG ARG ARG ARG
BRA BRA BRA BRA BRA BRA
CHI CHI CHI CHI
COL COL COL COL COL COL
ECU ECU ECU ECU ECU ECU
ELS ELS ELS ELS ELS ELS
GUT GUT GUT GUT GUT GUT
HON HON HON HON HON HON
NIC NIC NIC NIC
PAN PAN PAN PAN PAN PAN PAN
PAR PAR PAR PAR PAR PAR PAR
PER PER PER PER PER PER PER PER
DOR DOR DOR DOR DOR
13 13 13 13 10 10 3 4
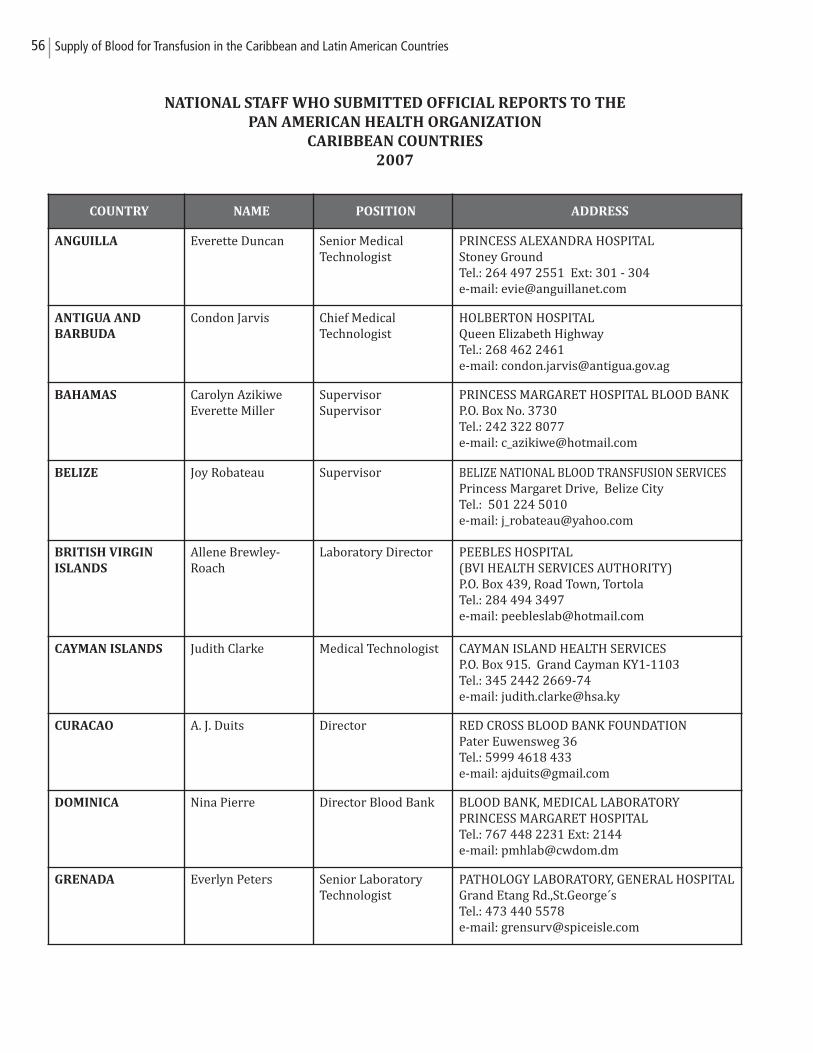
56 Supply of Blood for Transfusion in the Caribbean and Latin American Countries
NATIONAL STAFF WHO SUBMITTED OFFICIAL REPORTS TO THE
PAN AMERICAN HEALTH ORGANIZATION
CARIBBEAN COUNTRIES
2007
COUNTRY NAME POSITION ADDRESS
ANGUILLA Everette Duncan Senior Medical Technologist
PRINCESS ALEXANDRA HOSPITALStoney GroundTel.: 264 497 2551 Ext: 301 - 304e-mail: [email protected]
ANTIGUA AND
BARBUDA
Condon Jarvis Chief Medical Technologist
HOLBERTON HOSPITALQueen Elizabeth HighwayTel.: 268 462 2461e-mail: [email protected]
BAHAMAS Carolyn AzikiweEverette Miller
SupervisorSupervisor
PRINCESS MARGARET HOSPITAL BLOOD BANKP.O. Box No. 3730Tel.: 242 322 8077e-mail: [email protected]
BELIZE Joy Robateau Supervisor BELIZE NATIONAL BLOOD TRANSFUSION SERVICESPrincess Margaret Drive, Belize City Tel.: 501 224 5010e-mail: [email protected]
BRITISH VIRGIN
ISLANDS
Allene Brewley-Roach
Laboratory Director PEEBLES HOSPITAL (BVI HEALTH SERVICES AUTHORITY)P.O. Box 439, Road Town, TortolaTel.: 284 494 3497e-mail: [email protected]
CAYMAN ISLANDS Judith Clarke Medical Technologist CAYMAN ISLAND HEALTH SERVICESP.O. Box 915. Grand Cayman KY1-1103 Tel.: 345 2442 2669-74e-mail: [email protected]
CURACAO A. J. Duits Director RED CROSS BLOOD BANK FOUNDATIONPater Euwensweg 36Tel.: 5999 4618 433e-mail: [email protected]
DOMINICA Nina Pierre Director Blood Bank BLOOD BANK, MEDICAL LABORATORYPRINCESS MARGARET HOSPITALTel.: 767 448 2231 Ext: 2144e-mail: [email protected]
GRENADA Everlyn Peters Senior LaboratoryTechnologist
PATHOLOGY LABORATORY, GENERAL HOSPITALGrand Etang Rd.,St.George´sTel.: 473 440 5578e-mail: [email protected]
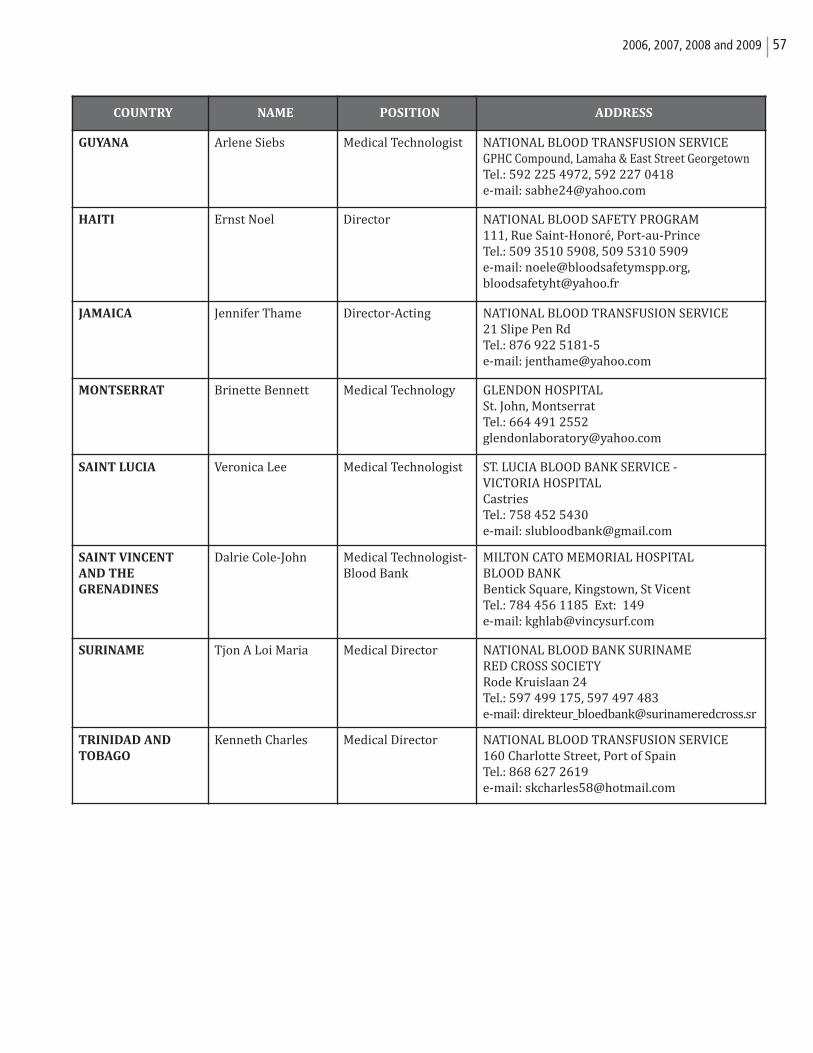
572006, 2007, 2008 and 2009
COUNTRY NAME POSITION ADDRESS
GUYANA Arlene Siebs Medical Technologist NATIONAL BLOOD TRANSFUSION SERVICEGPHC Compound, Lamaha & East Street GeorgetownTel.: 592 225 4972, 592 227 0418e-mail: [email protected]
HAITI Ernst Noel Director NATIONAL BLOOD SAFETY PROGRAM111, Rue Saint-Honoré, Port-au-PrinceTel.: 509 3510 5908, 509 5310 5909e-mail: [email protected], [email protected]
JAMAICA Jennifer Thame Director-Acting NATIONAL BLOOD TRANSFUSION SERVICE 21 Slipe Pen RdTel.: 876 922 5181-5e-mail: [email protected]
MONTSERRAT Brinette Bennett Medical Technology GLENDON HOSPITALSt. John, MontserratTel.: 664 491 [email protected]
SAINT LUCIA Veronica Lee Medical Technologist ST. LUCIA BLOOD BANK SERVICE - VICTORIA HOSPITALCastriesTel.: 758 452 5430e-mail: [email protected]
SAINT VINCENT
AND THE
GRENADINES
Dalrie Cole-John Medical Technologist-Blood Bank
MILTON CATO MEMORIAL HOSPITAL BLOOD BANKBentick Square, Kingstown, St VicentTel.: 784 456 1185 Ext: 149e-mail: [email protected]
SURINAME Tjon A Loi Maria Medical Director NATIONAL BLOOD BANK SURINAME RED CROSS SOCIETYRode Kruislaan 24Tel.: 597 499 175, 597 497 483e-mail: [email protected]
TRINIDAD AND
TOBAGO
Kenneth Charles Medical Director NATIONAL BLOOD TRANSFUSION SERVICE160 Charlotte Street, Port of SpainTel.: 868 627 2619e-mail: [email protected]
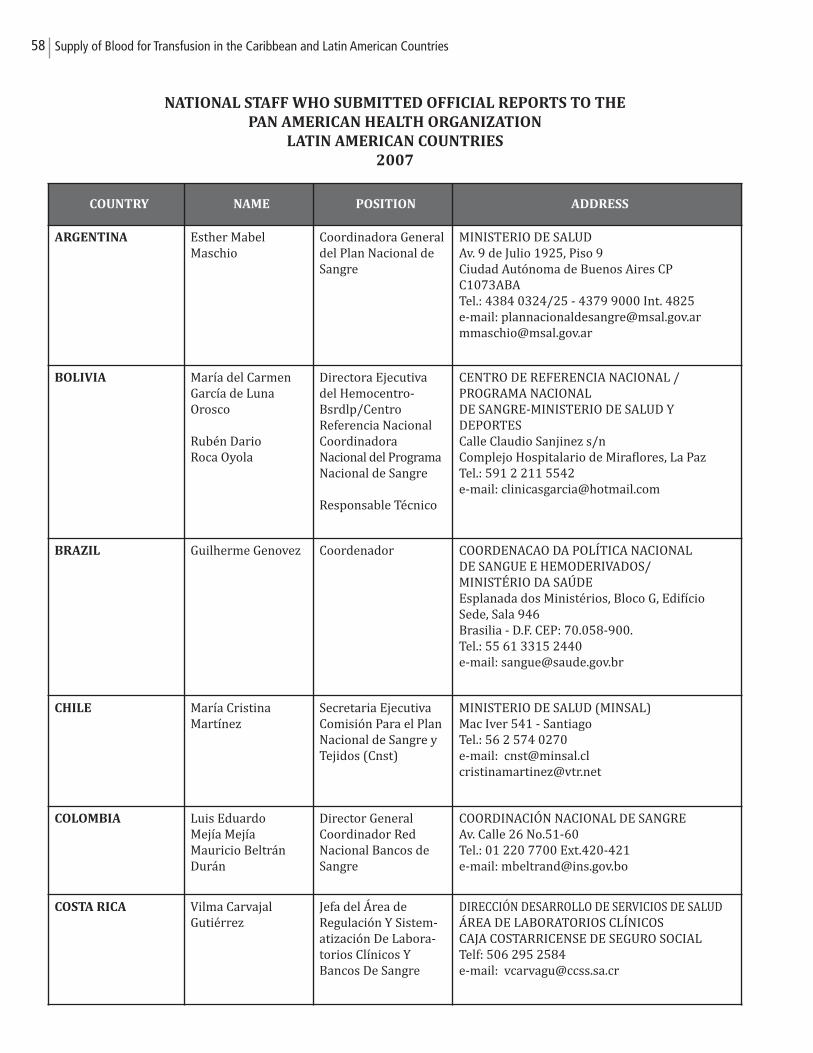
58 Supply of Blood for Transfusion in the Caribbean and Latin American Countries
NATIONAL STAFF WHO SUBMITTED OFFICIAL REPORTS TO THE
PAN AMERICAN HEALTH ORGANIZATION
LATIN AMERICAN COUNTRIES
2007
COUNTRY NAME POSITION ADDRESS
ARGENTINA Esther Mabel Maschio
Coordinadora Generaldel Plan Nacional deSangre
MINISTERIO DE SALUDAv. 9 de Julio 1925, Piso 9Ciudad Autónoma de Buenos Aires CPC1073ABATel.: 4384 0324/25 - 4379 9000 Int. 4825e-mail: [email protected]@msal.gov.ar
BOLIVIA María del CarmenGarcía de LunaOrosco
Rubén Dario Roca Oyola
Directora Ejecutivadel Hemocentro-Bsrdlp/Centro Referencia NacionalCoordinadora Nacional del ProgramaNacional de Sangre
Responsable Técnico
CENTRO DE REFERENCIA NACIONAL / PROGRAMA NACIONAL DE SANGRE-MINISTERIO DE SALUD Y DEPORTESCalle Claudio Sanjinez s/nComplejo Hospitalario de Miraflores, La PazTel.: 591 2 211 5542e-mail: [email protected]
BRAZIL Guilherme Genovez Coordenador COORDENACAO DA POLÍTICA NACIONAL DE SANGUE E HEMODERIVADOS/MINISTÉRIO DA SAÚDE Esplanada dos Ministérios, Bloco G, EdifícioSede, Sala 946Brasilia - D.F. CEP: 70.058-900.Tel.: 55 61 3315 2440e-mail: [email protected]
CHILE María CristinaMartínez
Secretaria EjecutivaComisión Para el PlanNacional de Sangre yTejidos (Cnst)
MINISTERIO DE SALUD (MINSAL)Mac Iver 541 - SantiagoTel.: 56 2 574 0270e-mail: [email protected] [email protected]
COLOMBIA Luis Eduardo Mejía Mejía Mauricio BeltránDurán
Director GeneralCoordinador Red Nacional Bancos deSangre
COORDINACIÓN NACIONAL DE SANGREAv. Calle 26 No.51-60Tel.: 01 220 7700 Ext.420-421e-mail: [email protected]
COSTA RICA Vilma CarvajalGutiérrez
Jefa del Área de Regulación Y Sistem-atización De Labora-torios Clínicos YBancos De Sangre
DIRECCIÓN DESARROLLO DE SERVICIOS DE SALUDÁREA DE LABORATORIOS CLÍNICOSCAJA COSTARRICENSE DE SEGURO SOCIALTelf: 506 295 2584e-mail: [email protected]
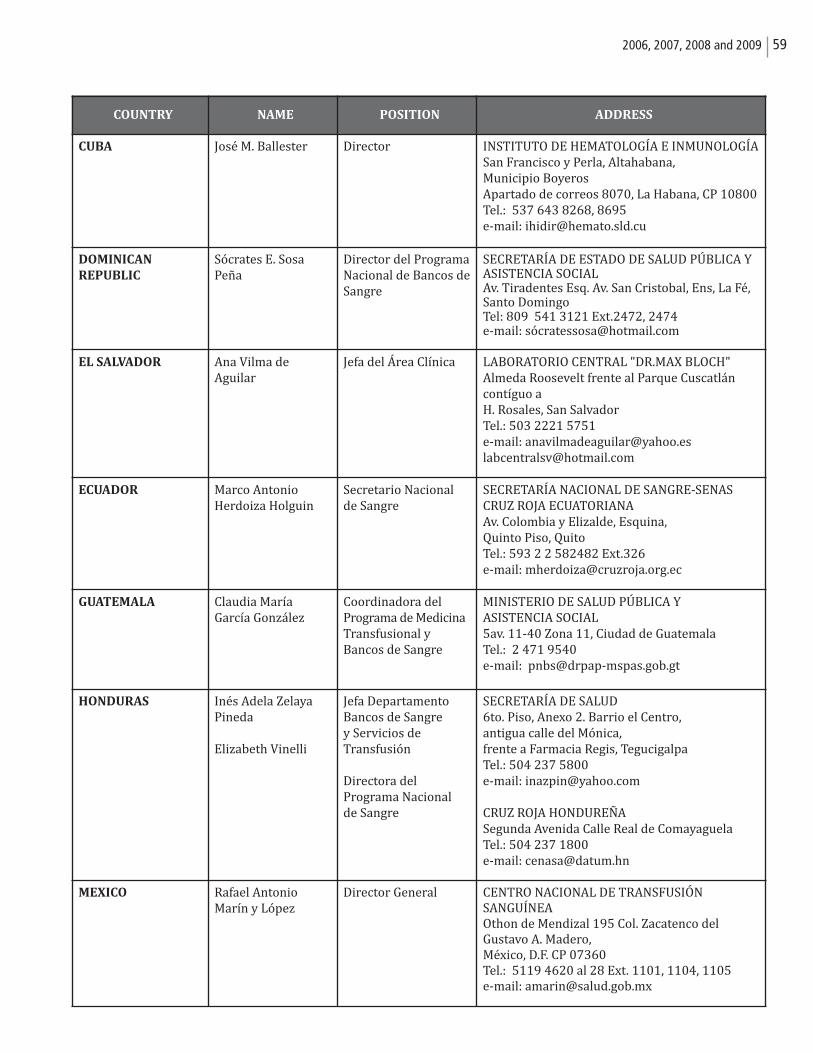
592006, 2007, 2008 and 2009
COUNTRY NAME POSITION ADDRESS
CUBA José M. Ballester Director INSTITUTO DE HEMATOLOGÍA E INMUNOLOGÍASan Francisco y Perla, Altahabana, Municipio BoyerosApartado de correos 8070, La Habana, CP 10800Tel.: 537 643 8268, 8695e-mail: [email protected]
DOMINICAN
REPUBLIC
Sócrates E. SosaPeña
Director del ProgramaNacional de Bancos deSangre
SECRETARÍA DE ESTADO DE SALUD PÚBLICA YASISTENCIA SOCIALAv. Tiradentes Esq. Av. San Cristobal, Ens, La Fé,Santo DomingoTel: 809 541 3121 Ext.2472, 2474e-mail: só[email protected]
EL SALVADOR Ana Vilma deAguilar
Jefa del Área Clínica LABORATORIO CENTRAL "DR.MAX BLOCH"Almeda Roosevelt frente al Parque Cuscatláncontíguo a H. Rosales, San SalvadorTel.: 503 2221 5751e-mail: [email protected]@hotmail.com
ECUADOR Marco Antonio Herdoiza Holguin
Secretario Nacional de Sangre
SECRETARÍA NACIONAL DE SANGRE-SENASCRUZ ROJA ECUATORIANAAv. Colombia y Elizalde, Esquina, Quinto Piso, QuitoTel.: 593 2 2 582482 Ext.326e-mail: [email protected]
GUATEMALA Claudia María García González
Coordinadora del Programa de MedicinaTransfusional y Bancos de Sangre
MINISTERIO DE SALUD PÚBLICA Y ASISTENCIA SOCIAL5av. 11-40 Zona 11, Ciudad de GuatemalaTel.: 2 471 9540e-mail: [email protected]
HONDURAS Inés Adela ZelayaPineda
Elizabeth Vinelli
Jefa DepartamentoBancos de Sangrey Servicios de Transfusión
Directora del Programa Nacional de Sangre
SECRETARÍA DE SALUD6to. Piso, Anexo 2. Barrio el Centro, antigua calle del Mónica, frente a Farmacia Regis, TegucigalpaTel.: 504 237 5800e-mail: [email protected]
CRUZ ROJA HONDUREÑASegunda Avenida Calle Real de ComayaguelaTel.: 504 237 1800e-mail: [email protected]
MEXICO Rafael AntonioMarín y López
Director General CENTRO NACIONAL DE TRANSFUSIÓN SANGUÍNEAOthon de Mendizal 195 Col. Zacatenco del Gustavo A. Madero, México, D.F. CP 07360Tel.: 5119 4620 al 28 Ext. 1101, 1104, 1105e-mail: [email protected]
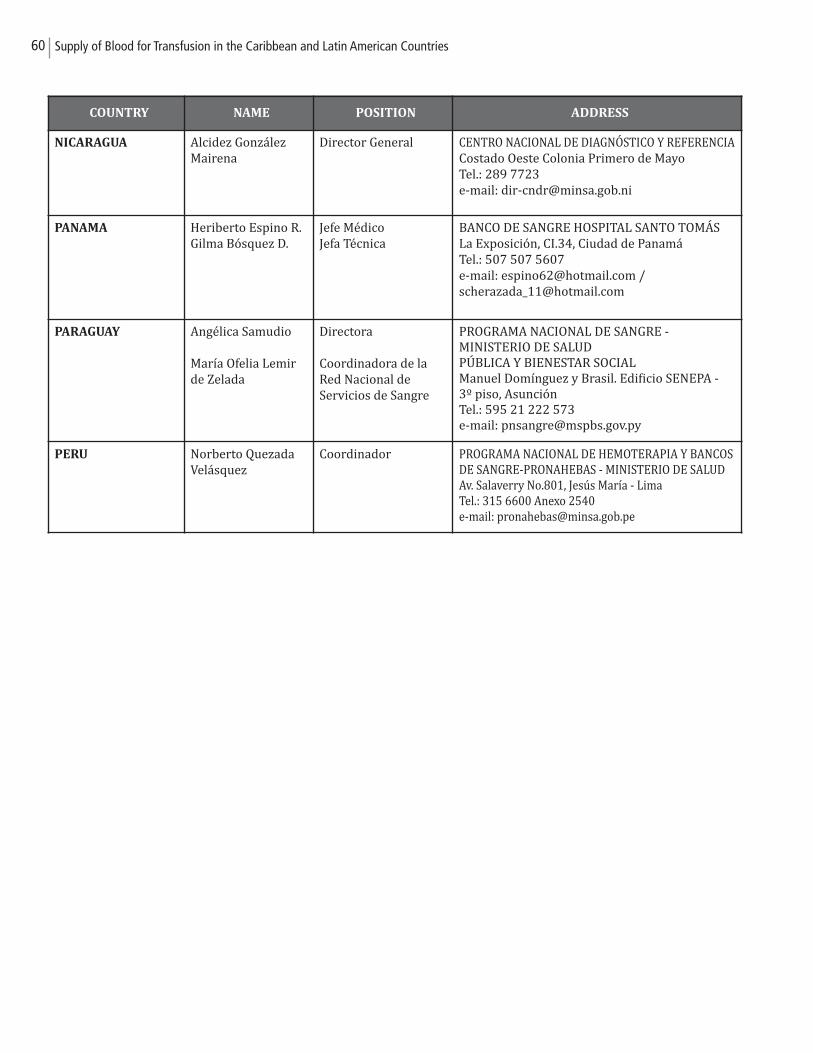
60 Supply of Blood for Transfusion in the Caribbean and Latin American Countries
COUNTRY NAME POSITION ADDRESS
NICARAGUA Alcidez GonzálezMairena
Director General CENTRO NACIONAL DE DIAGNÓSTICO Y REFERENCIACostado Oeste Colonia Primero de MayoTel.: 289 7723e-mail: [email protected]
PANAMA Heriberto Espino R.Gilma Bósquez D.
Jefe MédicoJefa Técnica
BANCO DE SANGRE HOSPITAL SANTO TOMÁSLa Exposición, CI.34, Ciudad de PanamáTel.: 507 507 5607e-mail: [email protected] / [email protected]
PARAGUAY Angélica Samudio
María Ofelia Lemirde Zelada
Directora
Coordinadora de laRed Nacional deServicios de Sangre
PROGRAMA NACIONAL DE SANGRE - MINISTERIO DE SALUDPÚBLICA Y BIENESTAR SOCIALManuel Domínguez y Brasil. Edificio SENEPA - 3º piso, AsunciónTel.: 595 21 222 573e-mail: [email protected]
PERU Norberto QuezadaVelásquez
Coordinador PROGRAMA NACIONAL DE HEMOTERAPIA Y BANCOSDE SANGRE-PRONAHEBAS - MINISTERIO DE SALUDAv. Salaverry No.801, Jesús María - LimaTel.: 315 6600 Anexo 2540e-mail: [email protected]

612006, 2007, 2008 and 2009
2008

62 Supply of Blood for Transfusion in the Caribbean and Latin American Countries
REGIONAL SUMMARY 2008
VARIABLE
CARIBBEAN
COUNTRIES
LATIN AMERICAN
COUNTRIES
CARIBBEAN AND LATIN
AMERICAN COUNTRIES
Blood units collected 104,767 4,916,097 5,020,864
Voluntary, non remunerated donors 40,309 1,554,051 1,594,360
38.47% 31.61% 31.75%
Remunerated donors 0 12,849 12,849 0% 0.26% 0.26%
Screening for HIV (%) 100 100 100
Screening for HBsAg (%) 100 100 100
Screening for HCV (%) 98.69 100 99.97
Screening for SYPHILIS (%) 100 99.93 99.93
Screening for T. cruzi (%) NA 80.01 NA
Screening for HTLV I-II (%) 98.50 31.26 32.66
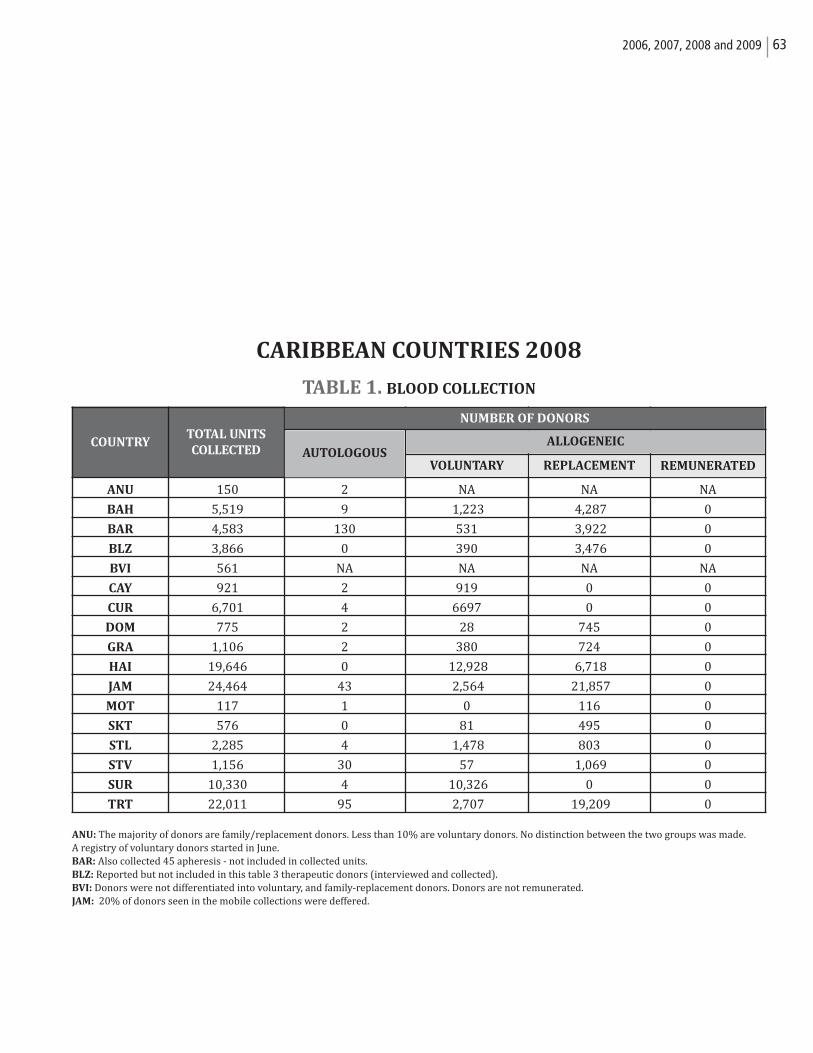
632006, 2007, 2008 and 2009
CARIBBEAN COUNTRIES 2008
TABLE 1. BLOOD COLLECTION
ANU: The majority of donors are family/replacement donors. Less than 10% are voluntary donors. No distinction between the two groups was made. A registry of voluntary donors started in June.BAR: Also collected 45 apheresis - not included in collected units. BLZ: Reported but not included in this table 3 therapeutic donors (interviewed and collected).BVI: Donors were not differentiated into voluntary, and family-replacement donors. Donors are not remunerated.JAM: 20% of donors seen in the mobile collections were deffered.
COUNTRYTOTAL UNITS
COLLECTED
ANU 150 2 NA NA NA
BAH 5,519 9 1,223 4,287 0
BAR 4,583 130 531 3,922 0
BLZ 3,866 0 390 3,476 0
BVI 561 NA NA NA NA
CAY 921 2 919 0 0
CUR 6,701 4 6697 0 0
DOM 775 2 28 745 0
GRA 1,106 2 380 724 0
HAI 19,646 0 12,928 6,718 0
JAM 24,464 43 2,564 21,857 0
MOT 117 1 0 116 0
SKT 576 0 81 495 0
STL 2,285 4 1,478 803 0
STV 1,156 30 57 1,069 0
SUR 10,330 4 10,326 0 0
TRT 22,011 95 2,707 19,209 0
NUMBER OF DONORS
AUTOLOGOUSALLOGENEIC
VOLUNTARY REPLACEMENT REMUNERATED
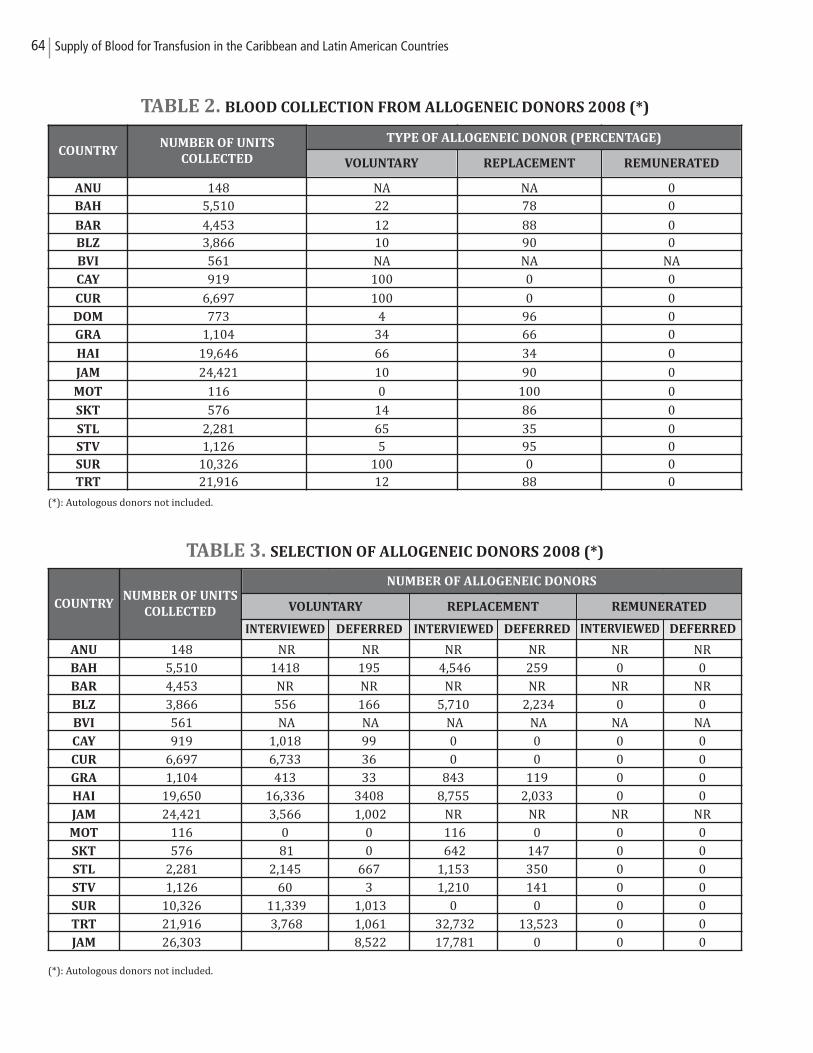
64 Supply of Blood for Transfusion in the Caribbean and Latin American Countries
TABLE 2. BLOOD COLLECTION FROM ALLOGENEIC DONORS 2008 (*)
(*): Autologous donors not included.
TABLE 3. SELECTION OF ALLOGENEIC DONORS 2008 (*)
(*): Autologous donors not included.
COUNTRYNUMBER OF UNITS
COLLECTED
ANU 148 NR NR NR NR NR NRBAH 5,510 1418 195 4,546 259 0 0BAR 4,453 NR NR NR NR NR NRBLZ 3,866 556 166 5,710 2,234 0 0BVI 561 NA NA NA NA NA NACAY 919 1,018 99 0 0 0 0CUR 6,697 6,733 36 0 0 0 0GRA 1,104 413 33 843 119 0 0HAI 19,650 16,336 3408 8,755 2,033 0 0JAM 24,421 3,566 1,002 NR NR NR NRMOT 116 0 0 116 0 0 0SKT 576 81 0 642 147 0 0STL 2,281 2,145 667 1,153 350 0 0STV 1,126 60 3 1,210 141 0 0SUR 10,326 11,339 1,013 0 0 0 0TRT 21,916 3,768 1,061 32,732 13,523 0 0JAM 26,303 8,522 17,781 0 0 0
NUMBER OF ALLOGENEIC DONORS
VOLUNTARY REPLACEMENT REMUNERATED
INTERVIEWED DEFERRED DEFERRED DEFERREDINTERVIEWED INTERVIEWED
COUNTRYNUMBER OF UNITS
COLLECTED
ANU 148 NA NA 0BAH 5,510 22 78 0
BAR 4,453 12 88 0BLZ 3,866 10 90 0BVI 561 NA NA NACAY 919 100 0 0
CUR 6,697 100 0 0DOM 773 4 96 0GRA 1,104 34 66 0
HAI 19,646 66 34 0
JAM 24,421 10 90 0
MOT 116 0 100 0
SKT 576 14 86 0
STL 2,281 65 35 0STV 1,126 5 95 0SUR 10,326 100 0 0TRT 21,916 12 88 0
TYPE OF ALLOGENEIC DONOR (PERCENTAGE)
VOLUNTARY REPLACEMENT REMUNERATED

652006, 2007, 2008 and 2009
TABLE 4. SELECTION OF ALLOGENEIC DONORS 2008 (*)
(*): Autologous donors not included. Only countries with complete data.
TABLE 5. EFFICIENCY OF BLOOD PROCESSING 2008
COUNTRY
NUMBER OF
UNITS
COLLECTEDNUMBER
INTERVIEWED
%
DEFERRED
NUMBER
INTERVIEWED
%
DEFERRED
NUMBER
INTERVIEWED
%
DEFERRED
ANU 148 NR NR NR NR NR NRBAH 5,510 1,418 13.75 4,546 5.70 0 0
BAR 4,453 NR NR NR NR 0 0BLZ 3,866 556 30.00 5,710 39.00 0 0BVI 561 NA NA NA NA NA NA CAY 919 1,018 9.72 0 0 0 0CUR 6,697 6,733 0.53 0 0 0 0DOM 773 28 0 1,102 32.40 0 0GRA 1,104 413 7.99 843 14.12 0 0HAI 19,646 16,336 20.86 8,755 23.27 0 0
JAM 24,421 3,566 28.10 NR NR NR NRMOT 116 0 0 116 0 0 0
SKT 576 81 0 642 22.90 0 0STL 2,281 2,145 31.10 1,153 30.36 0 0STV 1,126 60 5.00 1,210 11.65 0 0SUR 10,326 11,339 8.93 0 0 0 0TRT 21,916 3,768 28.16 32,732 41.31 0 0
VOLUNTARY REPLACEMENT REMUNERATED
COUNTRYNUMBER OF UNITS
COLLECTED
NUMBER COLLECT
BLOOD CENTERS
ANNUAL PROCESSING
PER BANK
DAILY PROCESSING
PER BANK (260 days)
ANU 148 1 148 0.6BAH 5,510 3 1,837 7.1BAR 4,453 1 4,453 17.1BLZ 3,866 1 3,866 14.9BVI 561 1 561 2.2CAY 919 2 460 1.8CUR 6,697 1 6,697 25.8DOM 773 1 773 3.0GRA 1,104 1 1,104 4.2HAI 19,646 1 19,646 75.6JAM 24,421 1 24,421 93.9MOT 116 1 116 0.4SKT 576 1 576 2.2STL 2,281 1 2,281 8.8STV 1,126 1 1,126 4.3SUR 10,326 1 10,326 39.7TRT 21,916 2 10,958 42.1
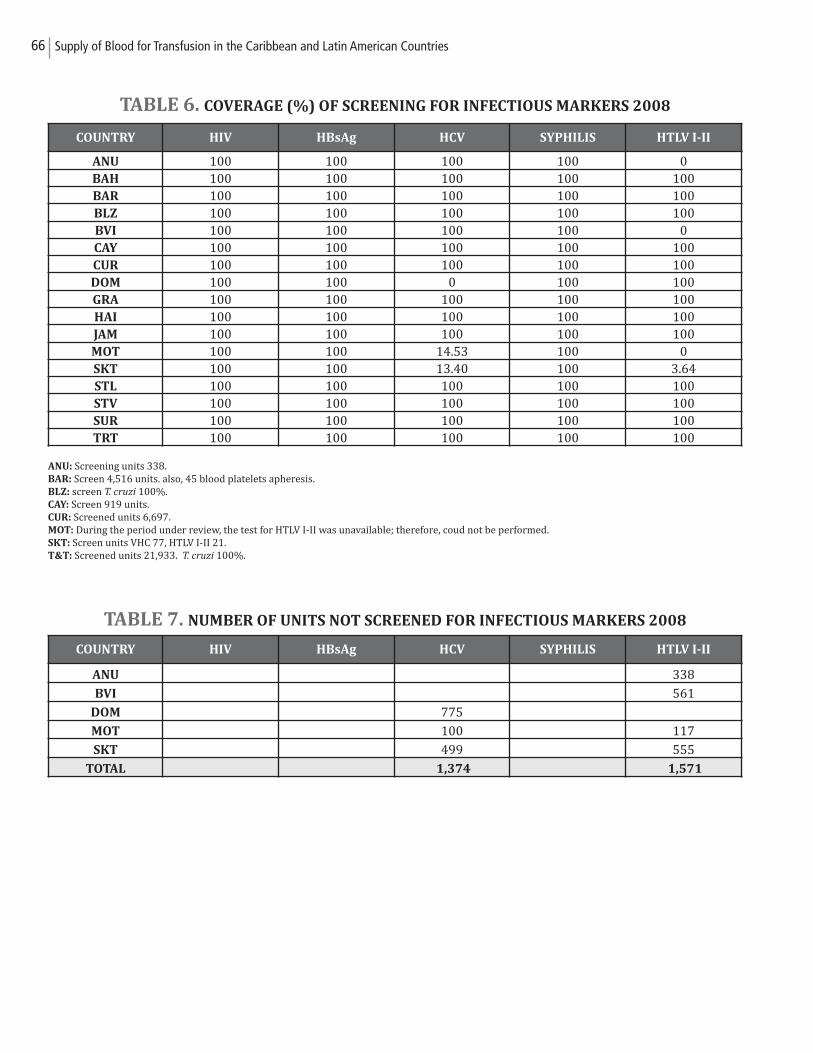
66 Supply of Blood for Transfusion in the Caribbean and Latin American Countries
TABLE 6. COVERAGE (%) OF SCREENING FOR INFECTIOUS MARKERS 2008
ANU: Screening units 338.BAR: Screen 4,516 units. also, 45 blood platelets apheresis. BLZ: screen T. cruzi 100%.CAY: Screen 919 units.CUR: Screened units 6,697.MOT: During the period under review, the test for HTLV I-II was unavailable; therefore, coud not be performed.SKT: Screen units VHC 77, HTLV I-II 21.T&T: Screened units 21,933. T. cruzi 100%.
TABLE 7. NUMBER OF UNITS NOT SCREENED FOR INFECTIOUS MARKERS 2008
COUNTRY HIV HBsAg HCV SYPHILIS HTLV I-II
ANU 100 100 100 100 0BAH 100 100 100 100 100BAR 100 100 100 100 100BLZ 100 100 100 100 100BVI 100 100 100 100 0CAY 100 100 100 100 100CUR 100 100 100 100 100DOM 100 100 0 100 100GRA 100 100 100 100 100HAI 100 100 100 100 100JAM 100 100 100 100 100MOT 100 100 14.53 100 0SKT 100 100 13.40 100 3.64STL 100 100 100 100 100STV 100 100 100 100 100SUR 100 100 100 100 100TRT 100 100 100 100 100
COUNTRY HIV HBsAg HCV SYPHILIS HTLV I-II
ANU 338
BVI 561
DOM 775
MOT 100 117
SKT 499 555
TOTAL 1,374 1,571
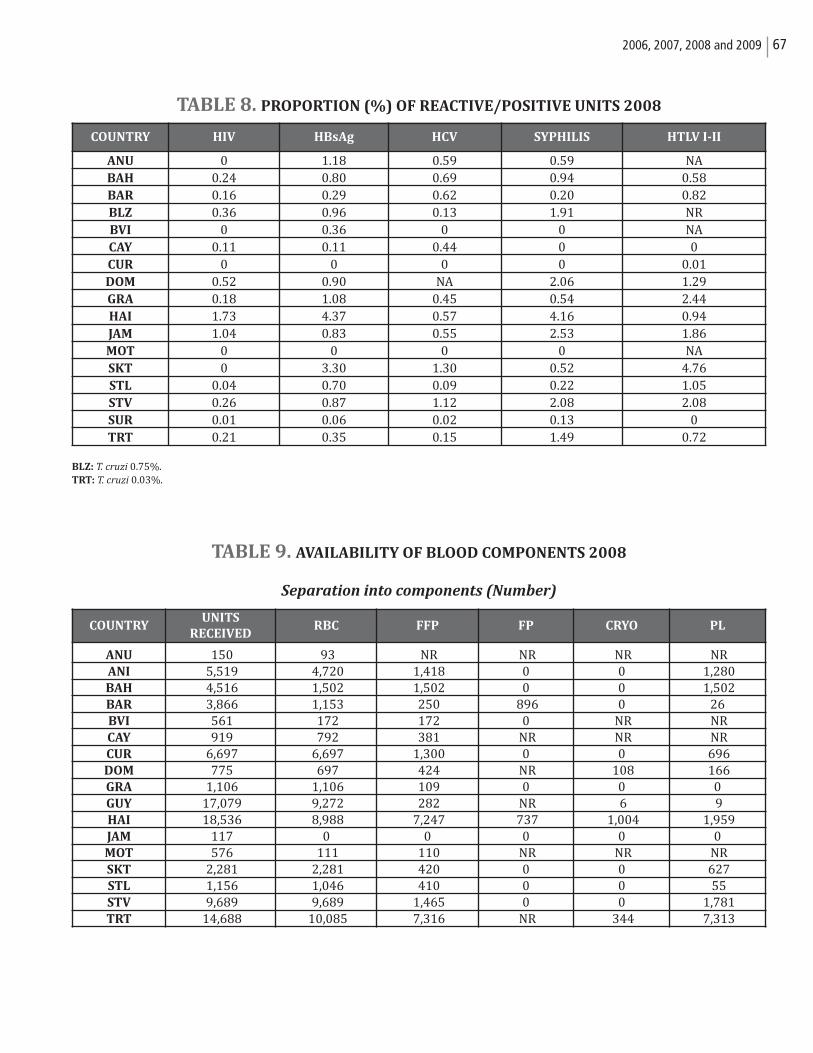
672006, 2007, 2008 and 2009
TABLE 8. PROPORTION (%) OF REACTIVE/POSITIVE UNITS 2008
BLZ: T. cruzi 0.75%.TRT: T. cruzi 0.03%.
TABLE 9. AVAILABILITY OF BLOOD COMPONENTS 2008
Separation into components (Number)
COUNTRY HIV HBsAg HCV SYPHILIS HTLV I-II
ANU 0 1.18 0.59 0.59 NABAH 0.24 0.80 0.69 0.94 0.58BAR 0.16 0.29 0.62 0.20 0.82BLZ 0.36 0.96 0.13 1.91 NRBVI 0 0.36 0 0 NACAY 0.11 0.11 0.44 0 0CUR 0 0 0 0 0.01DOM 0.52 0.90 NA 2.06 1.29GRA 0.18 1.08 0.45 0.54 2.44HAI 1.73 4.37 0.57 4.16 0.94JAM 1.04 0.83 0.55 2.53 1.86MOT 0 0 0 0 NASKT 0 3.30 1.30 0.52 4.76STL 0.04 0.70 0.09 0.22 1.05STV 0.26 0.87 1.12 2.08 2.08SUR 0.01 0.06 0.02 0.13 0TRT 0.21 0.35 0.15 1.49 0.72
COUNTRYUNITS
RECEIVEDRBC FFP FP CRYO PL
ANU 150 93 NR NR NR NR ANI 5,519 4,720 1,418 0 0 1,280 BAH 4,516 1,502 1,502 0 0 1,502 BAR 3,866 1,153 250 896 0 26BVI 561 172 172 0 NR NR CAY 919 792 381 NR NR NR CUR 6,697 6,697 1,300 0 0 696 DOM 775 697 424 NR 108 166 GRA 1,106 1,106 109 0 0 0GUY 17,079 9,272 282 NR 6 9 HAI 18,536 8,988 7,247 737 1,004 1,959 JAM 117 0 0 0 0 0MOT 576 111 110 NR NR NR SKT 2,281 2,281 420 0 0 627 STL 1,156 1,046 410 0 0 55 STV 9,689 9,689 1,465 0 0 1,781 TRT 14,688 10,085 7,316 NR 344 7,313
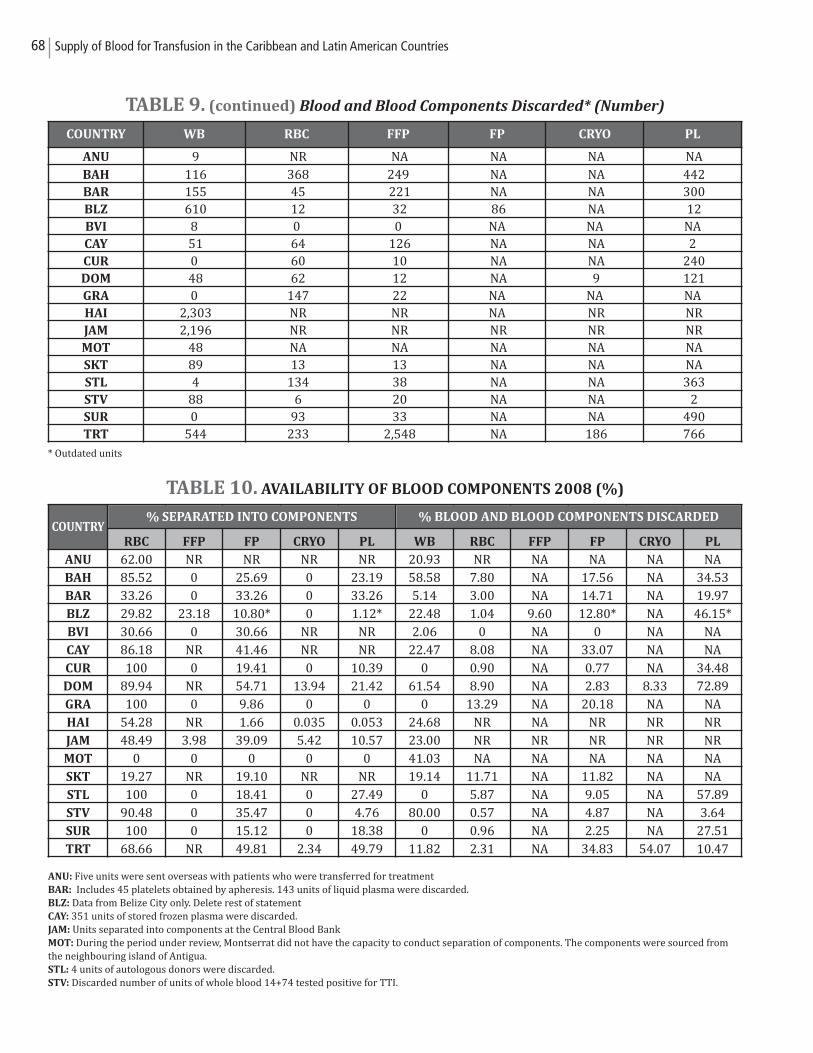
68 Supply of Blood for Transfusion in the Caribbean and Latin American Countries
TABLE 9. (continued) Blood and Blood Components Discarded* (Number)
* Outdated units
TABLE 10. AVAILABILITY OF BLOOD COMPONENTS 2008 (%)
ANU: Five units were sent overseas with patients who were transferred for treatment BAR: Includes 45 platelets obtained by apheresis. 143 units of liquid plasma were discarded.BLZ: Data from Belize City only. Delete rest of statementCAY: 351 units of stored frozen plasma were discarded.JAM: Units separated into components at the Central Blood BankMOT: During the period under review, Montserrat did not have the capacity to conduct separation of components. The components were sourced fromthe neighbouring island of Antigua.STL: 4 units of autologous donors were discarded.STV: Discarded number of units of whole blood 14+74 tested positive for TTI.
COUNTRY WB RBC FFP FP CRYO PL
ANU 9 NR NA NA NA NA BAH 116 368 249 NA NA 442 BAR 155 45 221 NA NA 300 BLZ 610 12 32 86 NA 12 BVI 8 0 0 NA NA NACAY 51 64 126 NA NA 2CUR 0 60 10 NA NA 240 DOM 48 62 12 NA 9 121 GRA 0 147 22 NA NA NAHAI 2,303 NR NR NA NR NR JAM 2,196 NR NR NR NR NR MOT 48 NA NA NA NA NA SKT 89 13 13 NA NA NA STL 4 134 38 NA NA 363 STV 88 6 20 NA NA 2 SUR 0 93 33 NA NA 490 TRT 544 233 2,548 NA 186 766
COUNTRYRBC FFP FP CRYO PL WB RBC FFP FP CRYO PL
ANU 62.00 NR NR NR NR 20.93 NR NA NA NA NABAH 85.52 0 25.69 0 23.19 58.58 7.80 NA 17.56 NA 34.53BAR 33.26 0 33.26 0 33.26 5.14 3.00 NA 14.71 NA 19.97BLZ 29.82 23.18 10.80* 0 1.12* 22.48 1.04 9.60 12.80* NA 46.15*BVI 30.66 0 30.66 NR NR 2.06 0 NA 0 NA NACAY 86.18 NR 41.46 NR NR 22.47 8.08 NA 33.07 NA NACUR 100 0 19.41 0 10.39 0 0.90 NA 0.77 NA 34.48DOM 89.94 NR 54.71 13.94 21.42 61.54 8.90 NA 2.83 8.33 72.89GRA 100 0 9.86 0 0 0 13.29 NA 20.18 NA NAHAI 54.28 NR 1.66 0.035 0.053 24.68 NR NA NR NR NRJAM 48.49 3.98 39.09 5.42 10.57 23.00 NR NR NR NR NRMOT 0 0 0 0 0 41.03 NA NA NA NA NASKT 19.27 NR 19.10 NR NR 19.14 11.71 NA 11.82 NA NASTL 100 0 18.41 0 27.49 0 5.87 NA 9.05 NA 57.89STV 90.48 0 35.47 0 4.76 80.00 0.57 NA 4.87 NA 3.64SUR 100 0 15.12 0 18.38 0 0.96 NA 2.25 NA 27.51TRT 68.66 NR 49.81 2.34 49.79 11.82 2.31 NA 34.83 54.07 10.47
% SEPARATED INTO COMPONENTS % BLOOD AND BLOOD COMPONENTS DISCARDED
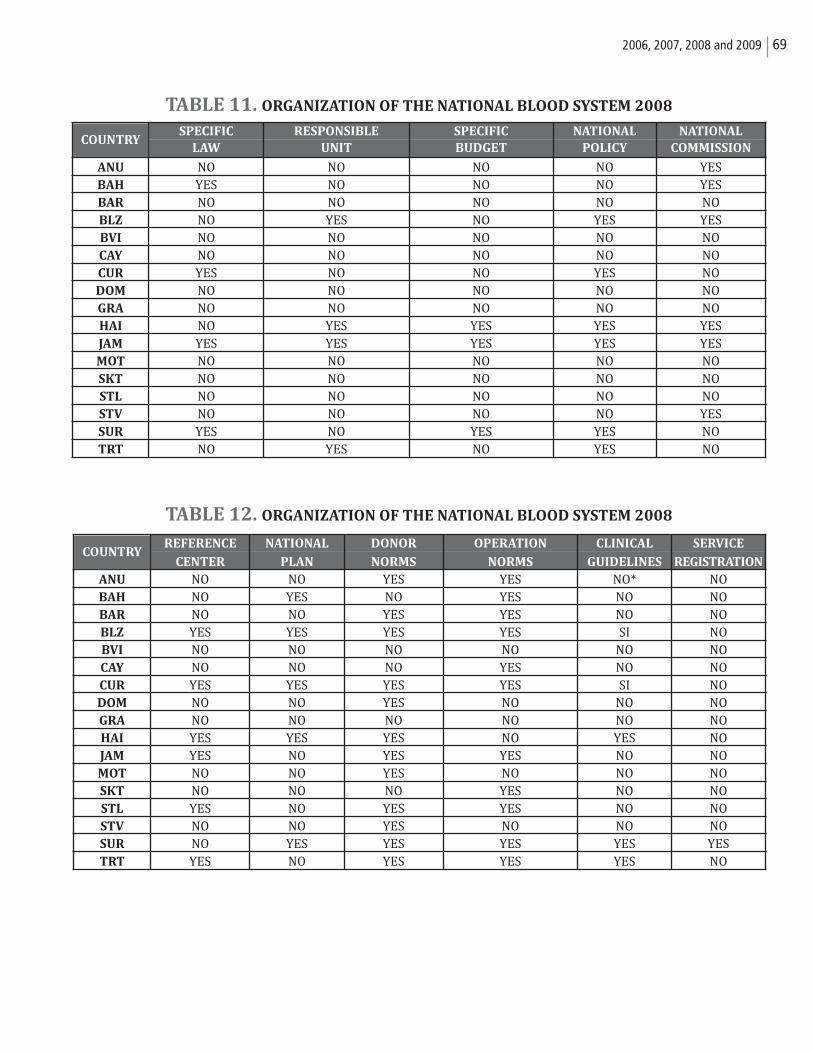
692006, 2007, 2008 and 2009
TABLE 11. ORGANIZATION OF THE NATIONAL BLOOD SYSTEM 2008
TABLE 12. ORGANIZATION OF THE NATIONAL BLOOD SYSTEM 2008
SPECIFIC RESPONSIBLE SPECIFIC NATIONAL NATIONAL
LAW UNIT BUDGET POLICY COMMISSION
ANU NO NO NO NO YESBAH YES NO NO NO YESBAR NO NO NO NO NOBLZ NO YES NO YES YESBVI NO NO NO NO NOCAY NO NO NO NO NOCUR YES NO NO YES NODOM NO NO NO NO NOGRA NO NO NO NO NOHAI NO YES YES YES YES JAM YES YES YES YES YESMOT NO NO NO NO NOSKT NO NO NO NO NOSTL NO NO NO NO NOSTV NO NO NO NO YESSUR YES NO YES YES NOTRT NO YES NO YES NO
COUNTRY
REFERENCE NATIONAL DONOR OPERATION CLINICAL SERVICE
CENTER PLAN NORMS NORMS GUIDELINES REGISTRATION
ANU NO NO YES YES NO* NOBAH NO YES NO YES NO NOBAR NO NO YES YES NO NOBLZ YES YES YES YES SI NOBVI NO NO NO NO NO NOCAY NO NO NO YES NO NOCUR YES YES YES YES SI NODOM NO NO YES NO NO NOGRA NO NO NO NO NO NOHAI YES YES YES NO YES NOJAM YES NO YES YES NO NOMOT NO NO YES NO NO NOSKT NO NO NO YES NO NOSTL YES NO YES YES NO NOSTV NO NO YES NO NO NOSUR NO YES YES YES YES YESTRT YES NO YES YES YES NO
COUNTRY
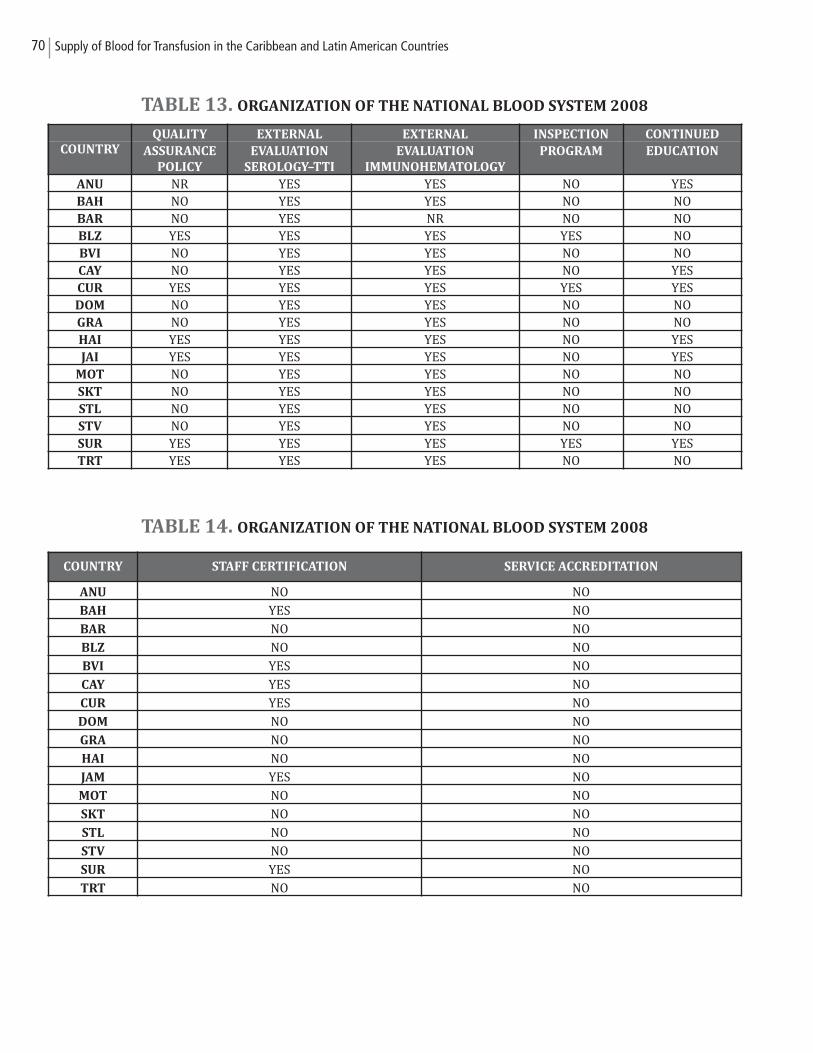
70 Supply of Blood for Transfusion in the Caribbean and Latin American Countries
TABLE 13. ORGANIZATION OF THE NATIONAL BLOOD SYSTEM 2008
TABLE 14. ORGANIZATION OF THE NATIONAL BLOOD SYSTEM 2008
QUALITY EXTERNAL EXTERNAL INSPECTION CONTINUEDCOUNTRY ASSURANCE EVALUATION EVALUATION PROGRAM EDUCATION
POLICY SEROLOGY–TTI IMMUNOHEMATOLOGY
ANU NR YES YES NO YESBAH NO YES YES NO NOBAR NO YES NR NO NOBLZ YES YES YES YES NOBVI NO YES YES NO NOCAY NO YES YES NO YES CUR YES YES YES YES YESDOM NO YES YES NO NOGRA NO YES YES NO NOHAI YES YES YES NO YES JAI YES YES YES NO YES
MOT NO YES YES NO NOSKT NO YES YES NO NOSTL NO YES YES NO NOSTV NO YES YES NO NOSUR YES YES YES YES YES TRT YES YES YES NO NO
COUNTRY STAFF CERTIFICATION SERVICE ACCREDITATION
ANU NO NO
BAH YES NO
BAR NO NO
BLZ NO NO
BVI YES NO
CAY YES NO
CUR YES NO
DOM NO NO
GRA NO NO
HAI NO NO
JAM YES NO
MOT NO NO
SKT NO NO
STL NO NO
STV NO NO
SUR YES NO
TRT NO NO
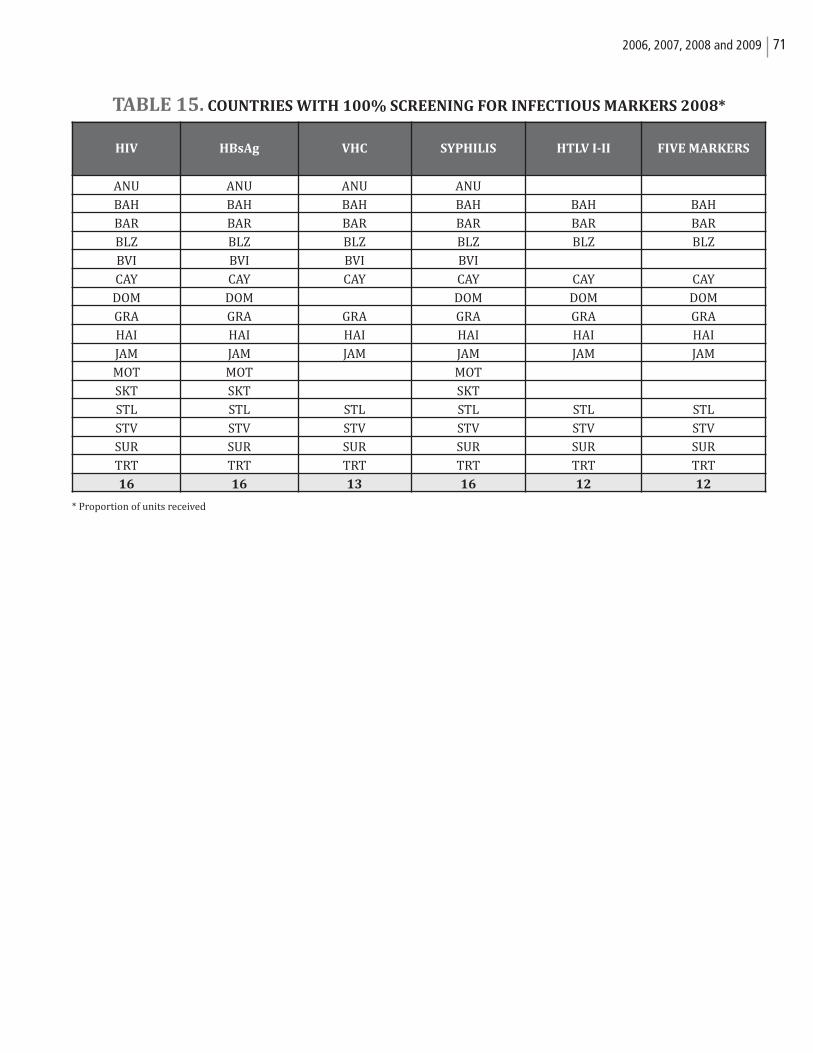
712006, 2007, 2008 and 2009
TABLE 15. COUNTRIES WITH 100% SCREENING FOR INFECTIOUS MARKERS 2008*
* Proportion of units received
HIV HBsAg VHC SYPHILIS HTLV I-II FIVE MARKERS
ANU ANU ANU ANU
BAH BAH BAH BAH BAH BAH
BAR BAR BAR BAR BAR BAR
BLZ BLZ BLZ BLZ BLZ BLZ
BVI BVI BVI BVI
CAY CAY CAY CAY CAY CAY
DOM DOM DOM DOM DOM
GRA GRA GRA GRA GRA GRA
HAI HAI HAI HAI HAI HAI
JAM JAM JAM JAM JAM JAM
MOT MOT MOT
SKT SKT SKT
STL STL STL STL STL STL
STV STV STV STV STV STV
SUR SUR SUR SUR SUR SUR
TRT TRT TRT TRT TRT TRT
16 16 13 16 12 12
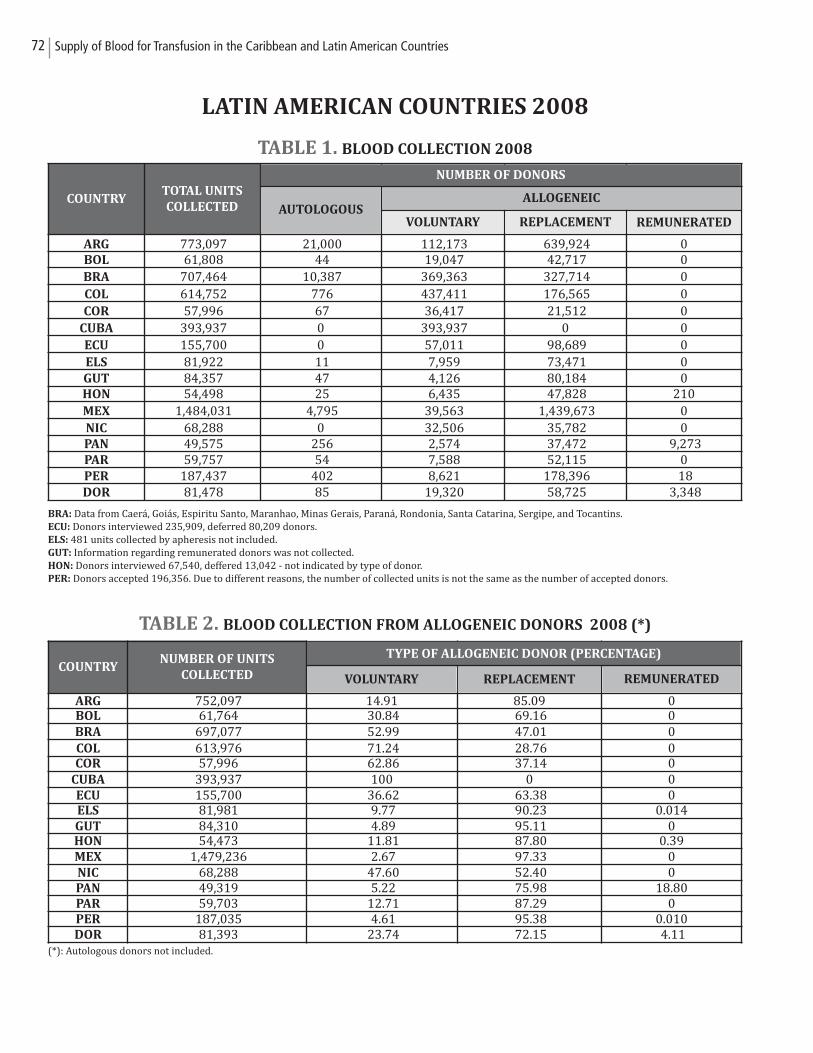
72 Supply of Blood for Transfusion in the Caribbean and Latin American Countries
LATIN AMERICAN COUNTRIES 2008
TABLE 1. BLOOD COLLECTION 2008
BRA: Data from Caerá, Goiás, Espiritu Santo, Maranhao, Minas Gerais, Paraná, Rondonia, Santa Catarina, Sergipe, and Tocantins. ECU: Donors interviewed 235,909, deferred 80,209 donors.ELS: 481 units collected by apheresis not included.GUT: Information regarding remunerated donors was not collected.HON: Donors interviewed 67,540, deffered 13,042 - not indicated by type of donor.PER: Donors accepted 196,356. Due to different reasons, the number of collected units is not the same as the number of accepted donors.
TABLE 2. BLOOD COLLECTION FROM ALLOGENEIC DONORS 2008 (*)
(*): Autologous donors not included.
COUNTRYTOTAL UNITS
COLLECTED
ARG 773,097 21,000 112,173 639,924 0BOL 61,808 44 19,047 42,717 0BRA 707,464 10,387 369,363 327,714 0COL 614,752 776 437,411 176,565 0COR 57,996 67 36,417 21,512 0
CUBA 393,937 0 393,937 0 0ECU 155,700 0 57,011 98,689 0ELS 81,922 11 7,959 73,471 0GUT 84,357 47 4,126 80,184 0HON 54,498 25 6,435 47,828 210MEX 1,484,031 4,795 39,563 1,439,673 0NIC 68,288 0 32,506 35,782 0PAN 49,575 256 2,574 37,472 9,273 PAR 59,757 54 7,588 52,115 0PER 187,437 402 8,621 178,396 18 DOR 81,478 85 19,320 58,725 3,348
NUMBER OF DONORS
AUTOLOGOUSALLOGENEIC
VOLUNTARY REPLACEMENT REMUNERATED
COUNTRYNUMBER OF UNITS
COLLECTED
ARG 752,097 14.91 85.09 0BOL 61,764 30.84 69.16 0BRA 697,077 52.99 47.01 0COL 613,976 71.24 28.76 0COR 57,996 62.86 37.14 0
CUBA 393,937 100 0 0ECU 155,700 36.62 63.38 0ELS 81,981 9.77 90.23 0.014GUT 84,310 4.89 95.11 0HON 54,473 11.81 87.80 0.39MEX 1,479,236 2.67 97.33 0NIC 68,288 47.60 52.40 0PAN 49,319 5.22 75.98 18.80PAR 59,703 12.71 87.29 0PER 187,035 4.61 95.38 0.010DOR 81,393 23.74 72.15 4.11
TYPE OF ALLOGENEIC DONOR (PERCENTAGE)
VOLUNTARY REPLACEMENT REMUNERATED
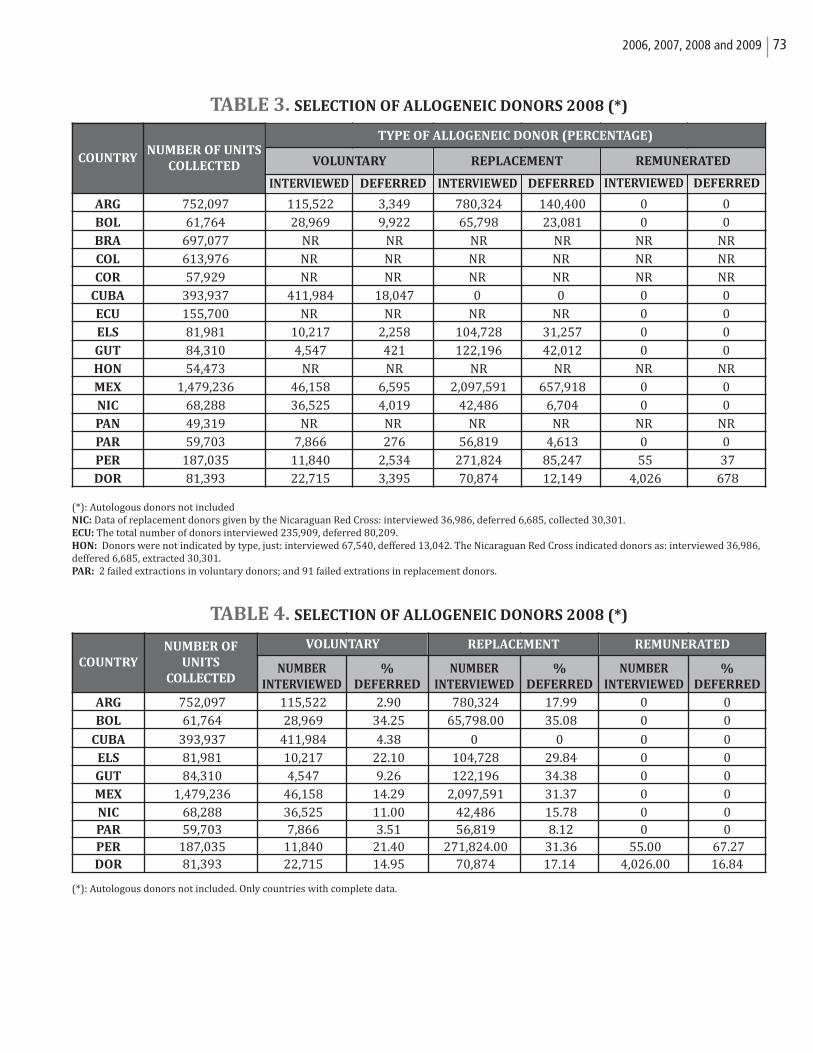
732006, 2007, 2008 and 2009
TABLE 3. SELECTION OF ALLOGENEIC DONORS 2008 (*)
(*): Autologous donors not includedNIC: Data of replacement donors given by the Nicaraguan Red Cross: interviewed 36,986, deferred 6,685, collected 30,301.ECU: The total number of donors interviewed 235,909, deferred 80,209. HON: Donors were not indicated by type, just: interviewed 67,540, deffered 13,042. The Nicaraguan Red Cross indicated donors as: interviewed 36,986,deffered 6,685, extracted 30,301. PAR: 2 failed extractions in voluntary donors; and 91 failed extrations in replacement donors.
TABLE 4. SELECTION OF ALLOGENEIC DONORS 2008 (*)
(*): Autologous donors not included. Only countries with complete data.
COUNTRYNUMBER OF UNITS
COLLECTED
ARG 752,097 115,522 3,349 780,324 140,400 0 0BOL 61,764 28,969 9,922 65,798 23,081 0 0BRA 697,077 NR NR NR NR NR NRCOL 613,976 NR NR NR NR NR NRCOR 57,929 NR NR NR NR NR NR
CUBA 393,937 411,984 18,047 0 0 0 0ECU 155,700 NR NR NR NR 0 0ELS 81,981 10,217 2,258 104,728 31,257 0 0GUT 84,310 4,547 421 122,196 42,012 0 0HON 54,473 NR NR NR NR NR NRMEX 1,479,236 46,158 6,595 2,097,591 657,918 0 0NIC 68,288 36,525 4,019 42,486 6,704 0 0PAN 49,319 NR NR NR NR NR NRPAR 59,703 7,866 276 56,819 4,613 0 0PER 187,035 11,840 2,534 271,824 85,247 55 37 DOR 81,393 22,715 3,395 70,874 12,149 4,026 678
TYPE OF ALLOGENEIC DONOR (PERCENTAGE)
VOLUNTARY REPLACEMENT REMUNERATED
INTERVIEWED DEFERRED DEFERRED DEFERREDINTERVIEWED INTERVIEWED
COUNTRY
NUMBER OF
UNITS
COLLECTEDNUMBER
INTERVIEWED
%
DEFERRED
NUMBER
INTERVIEWED
%
DEFERRED
NUMBER
INTERVIEWED
%
DEFERRED
ARG 752,097 115,522 2.90 780,324 17.99 0 0BOL 61,764 28,969 34.25 65,798.00 35.08 0 0
CUBA 393,937 411,984 4.38 0 0 0 0ELS 81,981 10,217 22.10 104,728 29.84 0 0GUT 84,310 4,547 9.26 122,196 34.38 0 0MEX 1,479,236 46,158 14.29 2,097,591 31.37 0 0NIC 68,288 36,525 11.00 42,486 15.78 0 0PAR 59,703 7,866 3.51 56,819 8.12 0 0PER 187,035 11,840 21.40 271,824.00 31.36 55.00 67.27 DOR 81,393 22,715 14.95 70,874 17.14 4,026.00 16.84
VOLUNTARY REPLACEMENT REMUNERATED
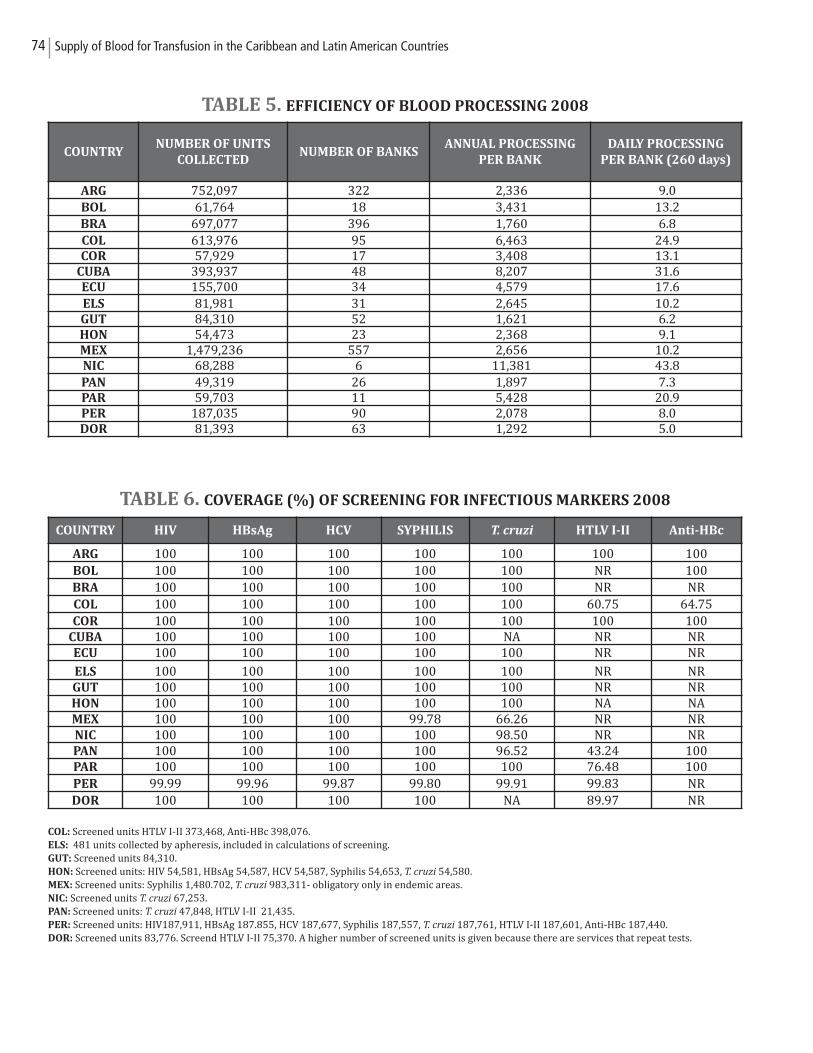
74 Supply of Blood for Transfusion in the Caribbean and Latin American Countries
TABLE 5. EFFICIENCY OF BLOOD PROCESSING 2008
TABLE 6. COVERAGE (%) OF SCREENING FOR INFECTIOUS MARKERS 2008
COL: Screened units HTLV I-II 373,468, Anti-HBc 398,076.ELS: 481 units collected by apheresis, included in calculations of screening.GUT: Screened units 84,310. HON: Screened units: HIV 54,581, HBsAg 54,587, HCV 54,587, Syphilis 54,653, T. cruzi 54,580. MEX: Screened units: Syphilis 1,480.702, T. cruzi 983,311- obligatory only in endemic areas. NIC: Screened units T. cruzi 67,253. PAN: Screened units: T. cruzi 47,848, HTLV I-II 21,435.PER: Screened units: HIV187,911, HBsAg 187.855, HCV 187,677, Syphilis 187,557, T. cruzi 187,761, HTLV I-II 187,601, Anti-HBc 187,440.DOR: Screened units 83,776. Screend HTLV I-II 75,370. A higher number of screened units is given because there are services that repeat tests.
COUNTRYNUMBER OF UNITS
COLLECTEDNUMBER OF BANKS
ANNUAL PROCESSING
PER BANK
DAILY PROCESSING
PER BANK (260 days)
ARG 752,097 322 2,336 9.0 BOL 61,764 18 3,431 13.2 BRA 697,077 396 1,760 6.8 COL 613,976 95 6,463 24.9 COR 57,929 17 3,408 13.1
CUBA 393,937 48 8,207 31.6 ECU 155,700 34 4,579 17.6 ELS 81,981 31 2,645 10.2 GUT 84,310 52 1,621 6.2 HON 54,473 23 2,368 9.1 MEX 1,479,236 557 2,656 10.2 NIC 68,288 6 11,381 43.8 PAN 49,319 26 1,897 7.3 PAR 59,703 11 5,428 20.9 PER 187,035 90 2,078 8.0 DOR 81,393 63 1,292 5.0
COUNTRY HIV HBsAg HCV SYPHILIS T. cruzi HTLV I-II Anti-HBc
ARG 100 100 100 100 100 100 100BOL 100 100 100 100 100 NR 100BRA 100 100 100 100 100 NR NRCOL 100 100 100 100 100 60.75 64.75COR 100 100 100 100 100 100 100
CUBA 100 100 100 100 NA NR NRECU 100 100 100 100 100 NR NR
ELS 100 100 100 100 100 NR NRGUT 100 100 100 100 100 NR NRHON 100 100 100 100 100 NA NAMEX 100 100 100 99.78 66.26 NR NRNIC 100 100 100 100 98.50 NR NRPAN 100 100 100 100 96.52 43.24 100PAR 100 100 100 100 100 76.48 100PER 99.99 99.96 99.87 99.80 99.91 99.83 NRDOR 100 100 100 100 NA 89.97 NR
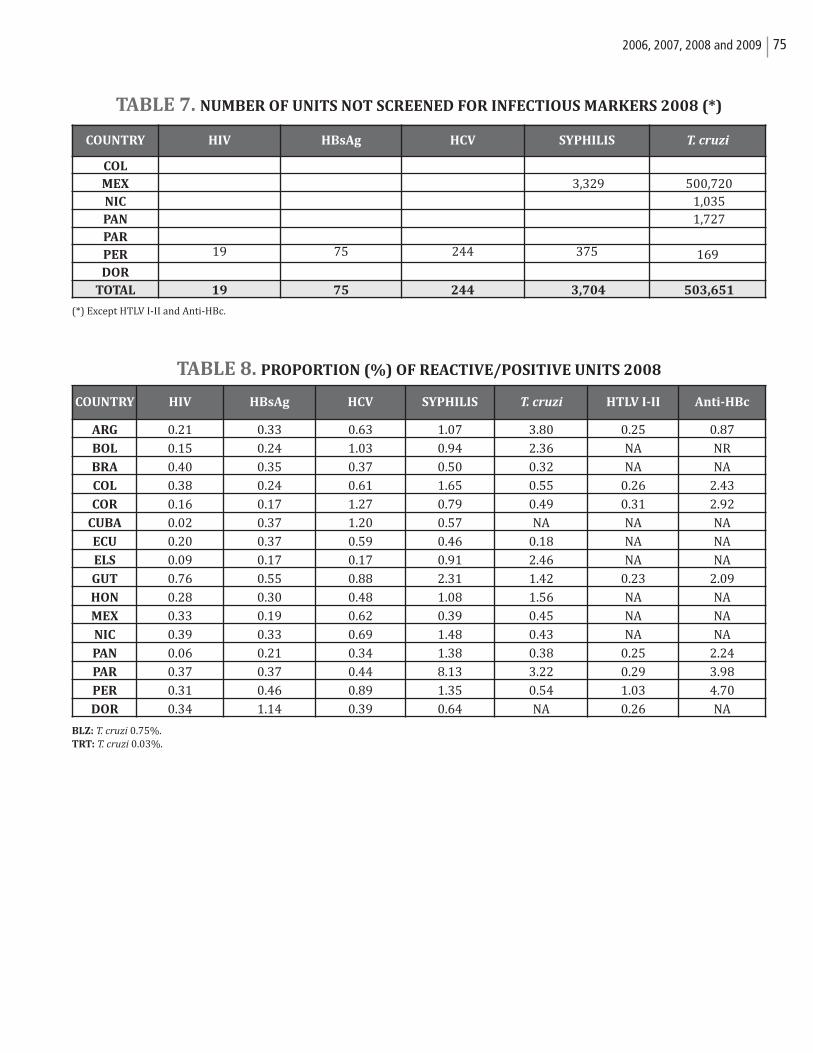
752006, 2007, 2008 and 2009
TABLE 7. NUMBER OF UNITS NOT SCREENED FOR INFECTIOUS MARKERS 2008 (*)
(*) Except HTLV I-II and Anti-HBc.
TABLE 8. PROPORTION (%) OF REACTIVE/POSITIVE UNITS 2008
BLZ: T. cruzi 0.75%.TRT: T. cruzi 0.03%.
COUNTRY HIV HBsAg HCV SYPHILIS T. cruzi
COL
MEX 3,329 500,720 NIC 1,035 PAN 1,727 PAR
PER 19 75 244 375 169DOR
TOTAL 19 75 244 3,704 503,651
COUNTRY HIV HBsAg HCV SYPHILIS T. cruzi HTLV I-II Anti-HBc
ARG 0.21 0.33 0.63 1.07 3.80 0.25 0.87
BOL 0.15 0.24 1.03 0.94 2.36 NA NR
BRA 0.40 0.35 0.37 0.50 0.32 NA NA
COL 0.38 0.24 0.61 1.65 0.55 0.26 2.43
COR 0.16 0.17 1.27 0.79 0.49 0.31 2.92
CUBA 0.02 0.37 1.20 0.57 NA NA NA
ECU 0.20 0.37 0.59 0.46 0.18 NA NA
ELS 0.09 0.17 0.17 0.91 2.46 NA NA
GUT 0.76 0.55 0.88 2.31 1.42 0.23 2.09
HON 0.28 0.30 0.48 1.08 1.56 NA NA
MEX 0.33 0.19 0.62 0.39 0.45 NA NA
NIC 0.39 0.33 0.69 1.48 0.43 NA NA
PAN 0.06 0.21 0.34 1.38 0.38 0.25 2.24
PAR 0.37 0.37 0.44 8.13 3.22 0.29 3.98
PER 0.31 0.46 0.89 1.35 0.54 1.03 4.70
DOR 0.34 1.14 0.39 0.64 NA 0.26 NA
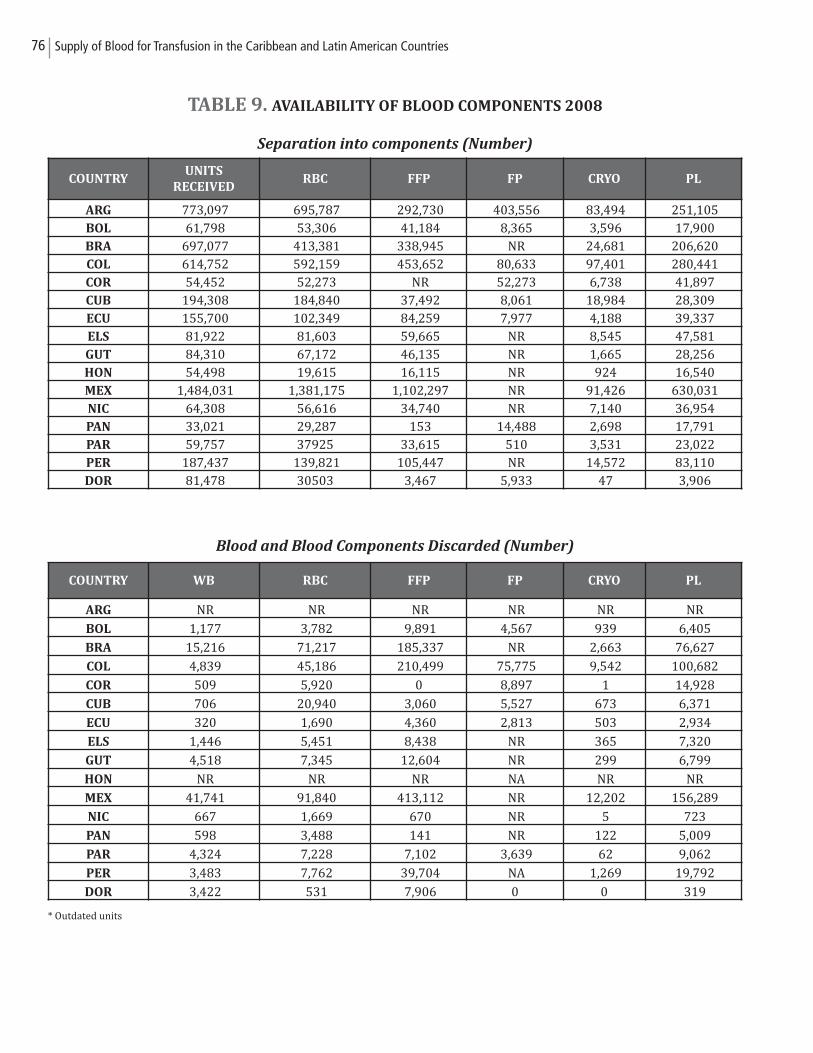
76 Supply of Blood for Transfusion in the Caribbean and Latin American Countries
TABLE 9. AVAILABILITY OF BLOOD COMPONENTS 2008
Separation into components (Number)
Blood and Blood Components Discarded (Number)
* Outdated units
COUNTRYUNITS
RECEIVEDRBC FFP FP CRYO PL
ARG 773,097 695,787 292,730 403,556 83,494 251,105 BOL 61,798 53,306 41,184 8,365 3,596 17,900 BRA 697,077 413,381 338,945 NR 24,681 206,620 COL 614,752 592,159 453,652 80,633 97,401 280,441 COR 54,452 52,273 NR 52,273 6,738 41,897 CUB 194,308 184,840 37,492 8,061 18,984 28,309 ECU 155,700 102,349 84,259 7,977 4,188 39,337 ELS 81,922 81,603 59,665 NR 8,545 47,581 GUT 84,310 67,172 46,135 NR 1,665 28,256 HON 54,498 19,615 16,115 NR 924 16,540 MEX 1,484,031 1,381,175 1,102,297 NR 91,426 630,031 NIC 64,308 56,616 34,740 NR 7,140 36,954 PAN 33,021 29,287 153 14,488 2,698 17,791 PAR 59,757 37925 33,615 510 3,531 23,022 PER 187,437 139,821 105,447 NR 14,572 83,110 DOR 81,478 30503 3,467 5,933 47 3,906
COUNTRY WB RBC FFP FP CRYO PL
ARG NR NR NR NR NR NR
BOL 1,177 3,782 9,891 4,567 939 6,405
BRA 15,216 71,217 185,337 NR 2,663 76,627
COL 4,839 45,186 210,499 75,775 9,542 100,682
COR 509 5,920 0 8,897 1 14,928
CUB 706 20,940 3,060 5,527 673 6,371
ECU 320 1,690 4,360 2,813 503 2,934
ELS 1,446 5,451 8,438 NR 365 7,320
GUT 4,518 7,345 12,604 NR 299 6,799
HON NR NR NR NA NR NR
MEX 41,741 91,840 413,112 NR 12,202 156,289
NIC 667 1,669 670 NR 5 723
PAN 598 3,488 141 NR 122 5,009
PAR 4,324 7,228 7,102 3,639 62 9,062
PER 3,483 7,762 39,704 NA 1,269 19,792
DOR 3,422 531 7,906 0 0 319
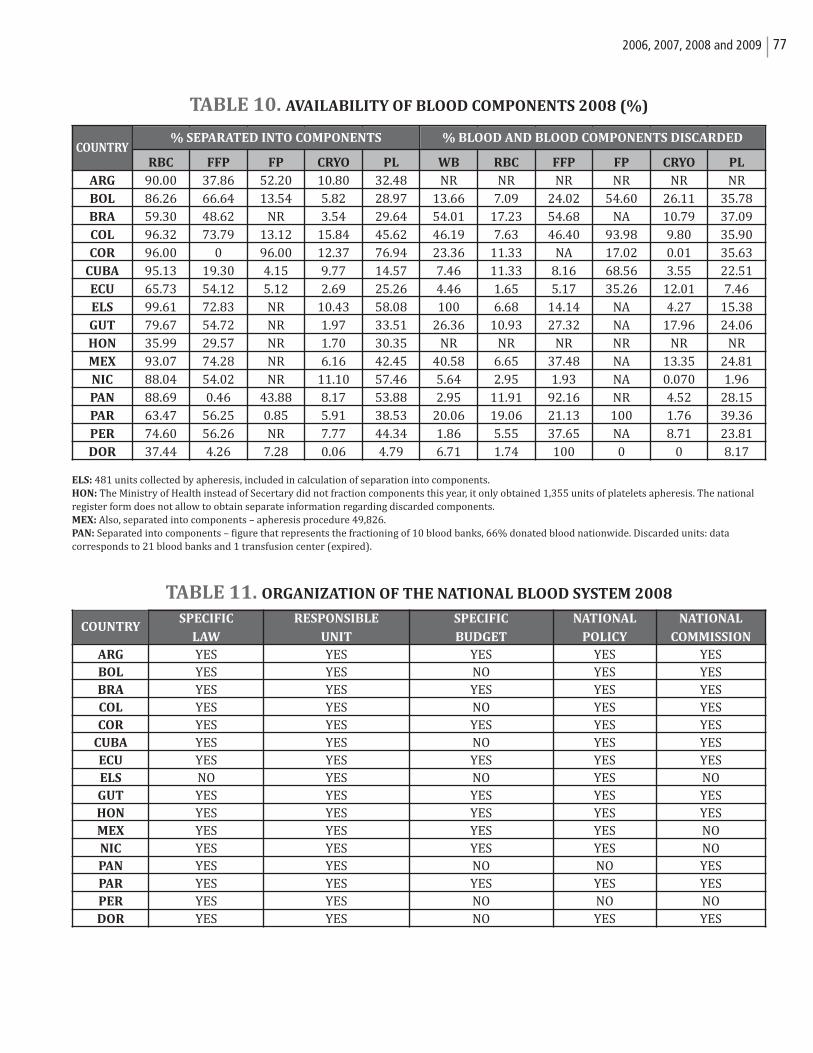
772006, 2007, 2008 and 2009
TABLE 10. AVAILABILITY OF BLOOD COMPONENTS 2008 (%)
ELS: 481 units collected by apheresis, included in calculation of separation into components.HON: The Ministry of Health instead of Secertary did not fraction components this year, it only obtained 1,355 units of platelets apheresis. The nationalregister form does not allow to obtain separate information regarding discarded components. MEX: Also, separated into components – apheresis procedure 49,826. PAN: Separated into components – figure that represents the fractioning of 10 blood banks, 66% donated blood nationwide. Discarded units: data corresponds to 21 blood banks and 1 transfusion center (expired).
TABLE 11. ORGANIZATION OF THE NATIONAL BLOOD SYSTEM 2008
COUNTRYRBC FFP FP CRYO PL WB RBC FFP FP CRYO PL
ARG 90.00 37.86 52.20 10.80 32.48 NR NR NR NR NR NRBOL 86.26 66.64 13.54 5.82 28.97 13.66 7.09 24.02 54.60 26.11 35.78BRA 59.30 48.62 NR 3.54 29.64 54.01 17.23 54.68 NA 10.79 37.09COL 96.32 73.79 13.12 15.84 45.62 46.19 7.63 46.40 93.98 9.80 35.90COR 96.00 0 96.00 12.37 76.94 23.36 11.33 NA 17.02 0.01 35.63
CUBA 95.13 19.30 4.15 9.77 14.57 7.46 11.33 8.16 68.56 3.55 22.51ECU 65.73 54.12 5.12 2.69 25.26 4.46 1.65 5.17 35.26 12.01 7.46ELS 99.61 72.83 NR 10.43 58.08 100 6.68 14.14 NA 4.27 15.38GUT 79.67 54.72 NR 1.97 33.51 26.36 10.93 27.32 NA 17.96 24.06HON 35.99 29.57 NR 1.70 30.35 NR NR NR NR NR NRMEX 93.07 74.28 NR 6.16 42.45 40.58 6.65 37.48 NA 13.35 24.81NIC 88.04 54.02 NR 11.10 57.46 5.64 2.95 1.93 NA 0.070 1.96PAN 88.69 0.46 43.88 8.17 53.88 2.95 11.91 92.16 NR 4.52 28.15PAR 63.47 56.25 0.85 5.91 38.53 20.06 19.06 21.13 100 1.76 39.36PER 74.60 56.26 NR 7.77 44.34 1.86 5.55 37.65 NA 8.71 23.81DOR 37.44 4.26 7.28 0.06 4.79 6.71 1.74 100 0 0 8.17
% SEPARATED INTO COMPONENTS % BLOOD AND BLOOD COMPONENTS DISCARDED
SPECIFIC RESPONSIBLE SPECIFIC NATIONAL NATIONAL
LAW UNIT BUDGET POLICY COMMISSION
ARG YES YES YES YES YES BOL YES YES NO YES YESBRA YES YES YES YES YES COL YES YES NO YES YESCOR YES YES YES YES YES
CUBA YES YES NO YES YESECU YES YES YES YES YES ELS NO YES NO YES NOGUT YES YES YES YES YES HON YES YES YES YES YESMEX YES YES YES YES NONIC YES YES YES YES NOPAN YES YES NO NO YES PAR YES YES YES YES YESPER YES YES NO NO NODOR YES YES NO YES YES
COUNTRY
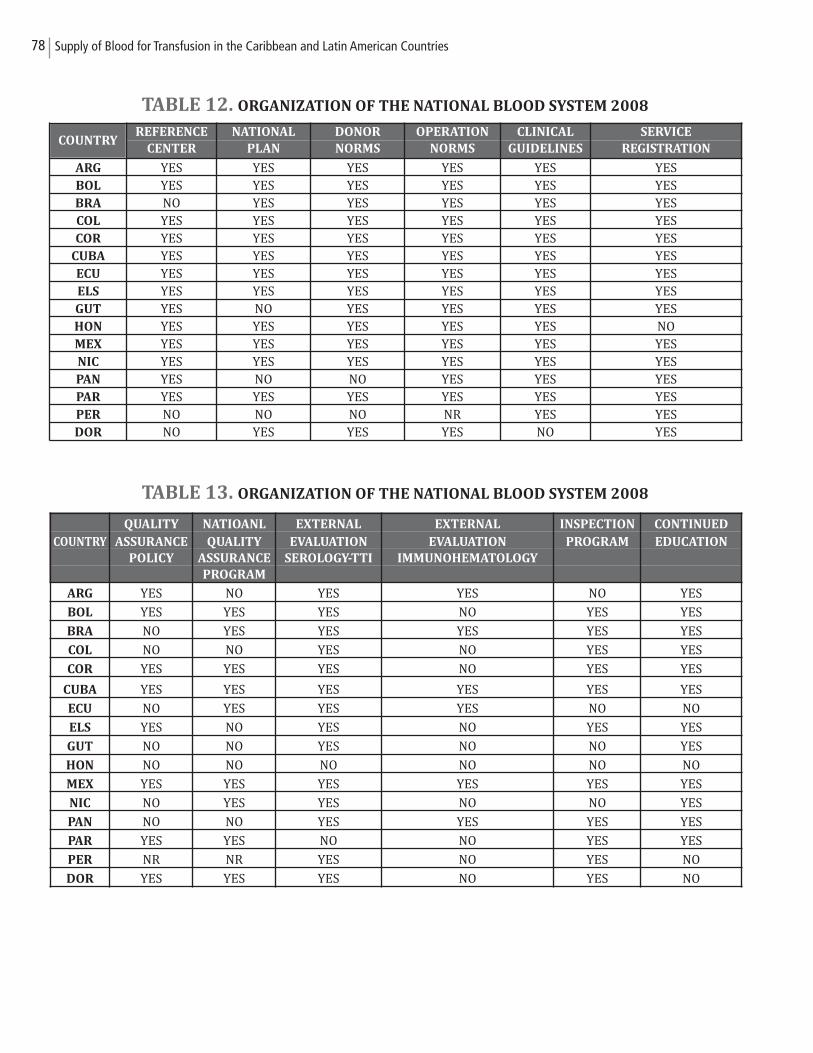
78 Supply of Blood for Transfusion in the Caribbean and Latin American Countries
TABLE 12. ORGANIZATION OF THE NATIONAL BLOOD SYSTEM 2008
TABLE 13. ORGANIZATION OF THE NATIONAL BLOOD SYSTEM 2008
REFERENCE NATIONAL DONOR OPERATION CLINICAL SERVICE
CENTER PLAN NORMS NORMS GUIDELINES REGISTRATION
ARG YES YES YES YES YES YES BOL YES YES YES YES YES YESBRA NO YES YES YES YES YES COL YES YES YES YES YES YESCOR YES YES YES YES YES YES
CUBA YES YES YES YES YES YESECU YES YES YES YES YES YES ELS YES YES YES YES YES YESGUT YES NO YES YES YES YESHON YES YES YES YES YES NOMEX YES YES YES YES YES YES NIC YES YES YES YES YES YESPAN YES NO NO YES YES YES PAR YES YES YES YES YES YESPER NO NO NO NR YES YES DOR NO YES YES YES NO YES
COUNTRY
QUALITY NATIOANL EXTERNAL EXTERNAL INSPECTION CONTINUED
COUNTRY ASSURANCE QUALITY EVALUATION EVALUATION PROGRAM EDUCATION
POLICY ASSURANCE SEROLOGY-TTI IMMUNOHEMATOLOGY
PROGRAM
ARG YES NO YES YES NO YES
BOL YES YES YES NO YES YES
BRA NO YES YES YES YES YES
COL NO NO YES NO YES YES
COR YES YES YES NO YES YES
CUBA YES YES YES YES YES YES
ECU NO YES YES YES NO NO
ELS YES NO YES NO YES YES
GUT NO NO YES NO NO YES
HON NO NO NO NO NO NO
MEX YES YES YES YES YES YES
NIC NO YES YES NO NO YES
PAN NO NO YES YES YES YES
PAR YES YES NO NO YES YES
PER NR NR YES NO YES NO
DOR YES YES YES NO YES NO
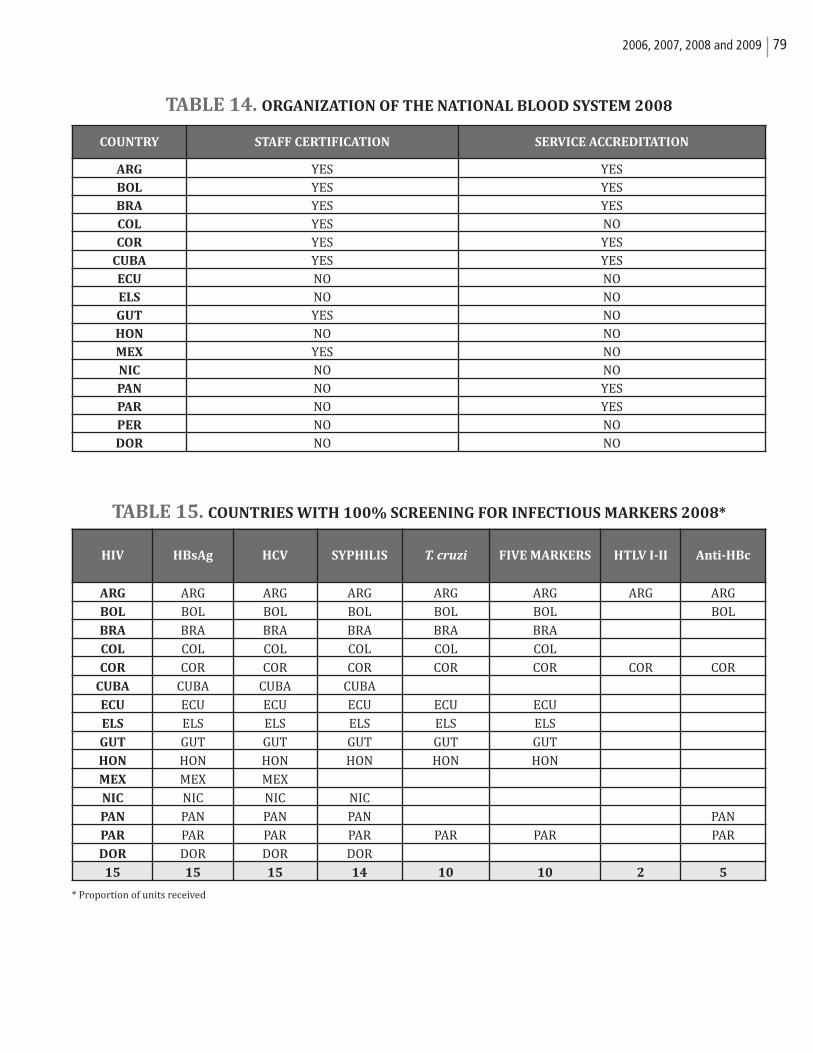
792006, 2007, 2008 and 2009
TABLE 14. ORGANIZATION OF THE NATIONAL BLOOD SYSTEM 2008
TABLE 15. COUNTRIES WITH 100% SCREENING FOR INFECTIOUS MARKERS 2008*
* Proportion of units received
COUNTRY STAFF CERTIFICATION SERVICE ACCREDITATION
ARG YES YES BOL YES YESBRA YES YES COL YES NOCOR YES YES
CUBA YES YESECU NO NOELS NO NOGUT YES NOHON NO NOMEX YES NONIC NO NOPAN NO YES PAR NO YESPER NO NODOR NO NO
HIV HBsAg HCV SYPHILIS T. cruzi FIVE MARKERS HTLV I-II Anti-HBc
ARG ARG ARG ARG ARG ARG ARG ARG
BOL BOL BOL BOL BOL BOL BOL
BRA BRA BRA BRA BRA BRA
COL COL COL COL COL COL
COR COR COR COR COR COR COR COR
CUBA CUBA CUBA CUBA
ECU ECU ECU ECU ECU ECU
ELS ELS ELS ELS ELS ELS
GUT GUT GUT GUT GUT GUT
HON HON HON HON HON HON
MEX MEX MEX
NIC NIC NIC NIC
PAN PAN PAN PAN PAN
PAR PAR PAR PAR PAR PAR PAR
DOR DOR DOR DOR
15 15 15 14 10 10 2 5
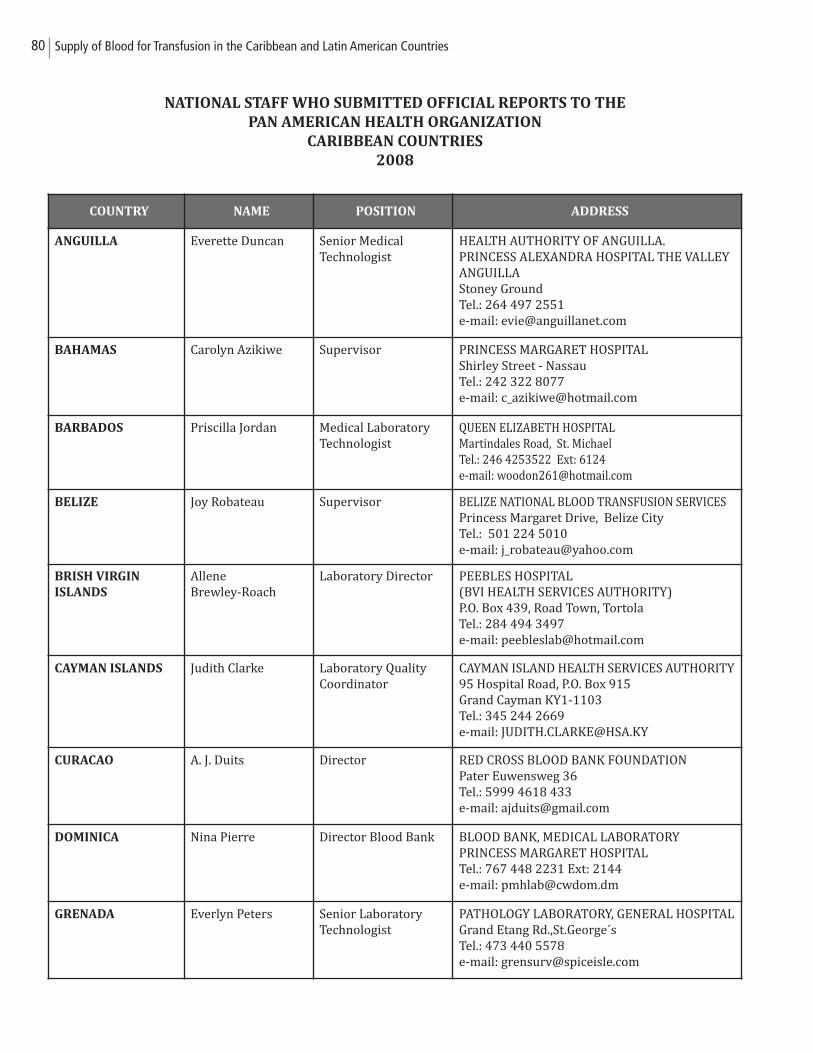
80 Supply of Blood for Transfusion in the Caribbean and Latin American Countries
NATIONAL STAFF WHO SUBMITTED OFFICIAL REPORTS TO THE
PAN AMERICAN HEALTH ORGANIZATION
CARIBBEAN COUNTRIES
2008
COUNTRY NAME POSITION ADDRESS
ANGUILLA Everette Duncan Senior Medical Technologist
HEALTH AUTHORITY OF ANGUILLA. PRINCESS ALEXANDRA HOSPITAL THE VALLEYANGUILLAStoney GroundTel.: 264 497 2551 e-mail: [email protected]
BAHAMAS Carolyn Azikiwe Supervisor PRINCESS MARGARET HOSPITALShirley Street - NassauTel.: 242 322 8077e-mail: [email protected]
BARBADOS Priscilla Jordan Medical LaboratoryTechnologist
QUEEN ELIZABETH HOSPITALMartindales Road, St. MichaelTel.: 246 4253522 Ext: 6124e-mail: [email protected]
BELIZE Joy Robateau Supervisor BELIZE NATIONAL BLOOD TRANSFUSION SERVICESPrincess Margaret Drive, Belize City Tel.: 501 224 5010e-mail: [email protected]
BRISH VIRGIN
ISLANDS
Allene Brewley-Roach
Laboratory Director PEEBLES HOSPITAL (BVI HEALTH SERVICES AUTHORITY)P.O. Box 439, Road Town, TortolaTel.: 284 494 3497e-mail: [email protected]
CAYMAN ISLANDS Judith Clarke Laboratory QualityCoordinator
CAYMAN ISLAND HEALTH SERVICES AUTHORITY95 Hospital Road, P.O. Box 915 Grand Cayman KY1-1103 Tel.: 345 244 2669e-mail: [email protected]
CURACAO A. J. Duits Director RED CROSS BLOOD BANK FOUNDATIONPater Euwensweg 36Tel.: 5999 4618 433e-mail: [email protected]
DOMINICA Nina Pierre Director Blood Bank BLOOD BANK, MEDICAL LABORATORYPRINCESS MARGARET HOSPITALTel.: 767 448 2231 Ext: 2144e-mail: [email protected]
GRENADA Everlyn Peters Senior LaboratoryTechnologist
PATHOLOGY LABORATORY, GENERAL HOSPITALGrand Etang Rd.,St.George´sTel.: 473 440 5578e-mail: [email protected]
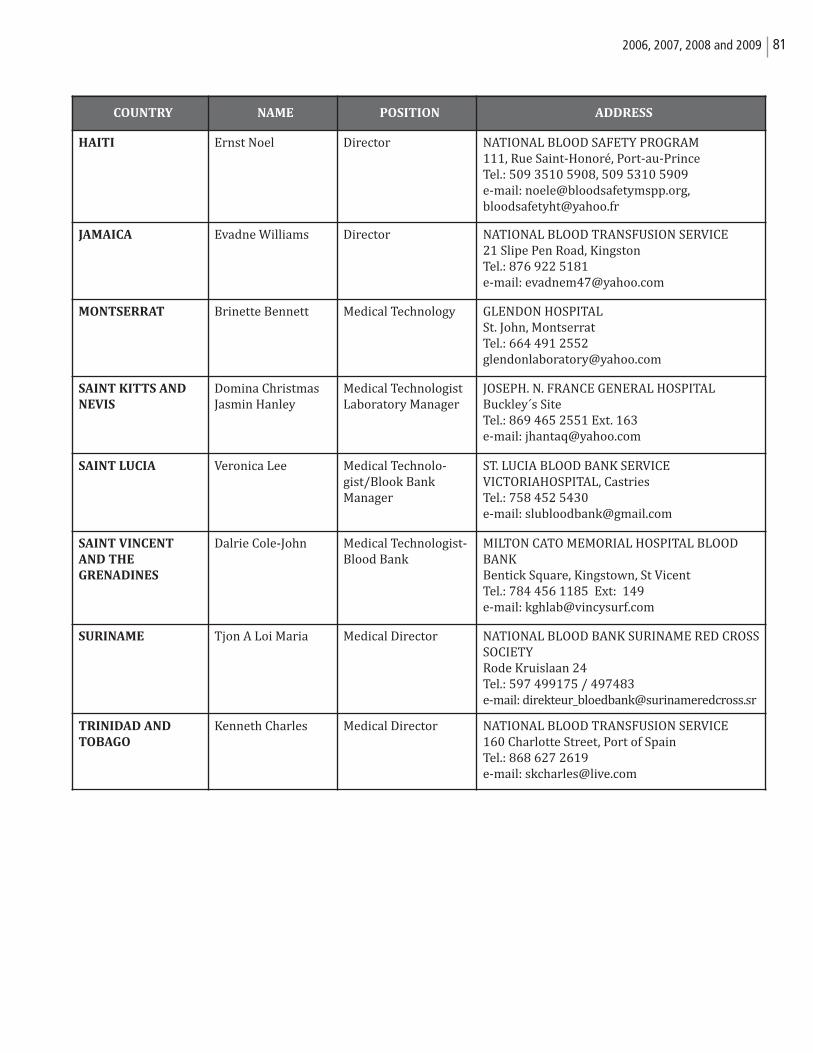
812006, 2007, 2008 and 2009
COUNTRY NAME POSITION ADDRESS
HAITI Ernst Noel Director NATIONAL BLOOD SAFETY PROGRAM111, Rue Saint-Honoré, Port-au-PrinceTel.: 509 3510 5908, 509 5310 5909e-mail: [email protected], [email protected]
JAMAICA Evadne Williams Director NATIONAL BLOOD TRANSFUSION SERVICE 21 Slipe Pen Road, KingstonTel.: 876 922 5181e-mail: [email protected]
MONTSERRAT Brinette Bennett Medical Technology GLENDON HOSPITALSt. John, MontserratTel.: 664 491 [email protected]
SAINT KITTS AND
NEVIS
Domina ChristmasJasmin Hanley
Medical TechnologistLaboratory Manager
JOSEPH. N. FRANCE GENERAL HOSPITALBuckley´s SiteTel.: 869 465 2551 Ext. 163e-mail: [email protected]
SAINT LUCIA Veronica Lee Medical Technolo-gist/Blook Bank Manager
ST. LUCIA BLOOD BANK SERVICE VICTORIAHOSPITAL, CastriesTel.: 758 452 5430e-mail: [email protected]
SAINT VINCENT
AND THE
GRENADINES
Dalrie Cole-John Medical Technologist-Blood Bank
MILTON CATO MEMORIAL HOSPITAL BLOODBANKBentick Square, Kingstown, St VicentTel.: 784 456 1185 Ext: 149e-mail: [email protected]
SURINAME Tjon A Loi Maria Medical Director NATIONAL BLOOD BANK SURINAME RED CROSSSOCIETYRode Kruislaan 24Tel.: 597 499175 / 497483e-mail: [email protected]
TRINIDAD AND
TOBAGO
Kenneth Charles Medical Director NATIONAL BLOOD TRANSFUSION SERVICE160 Charlotte Street, Port of SpainTel.: 868 627 2619e-mail: [email protected]
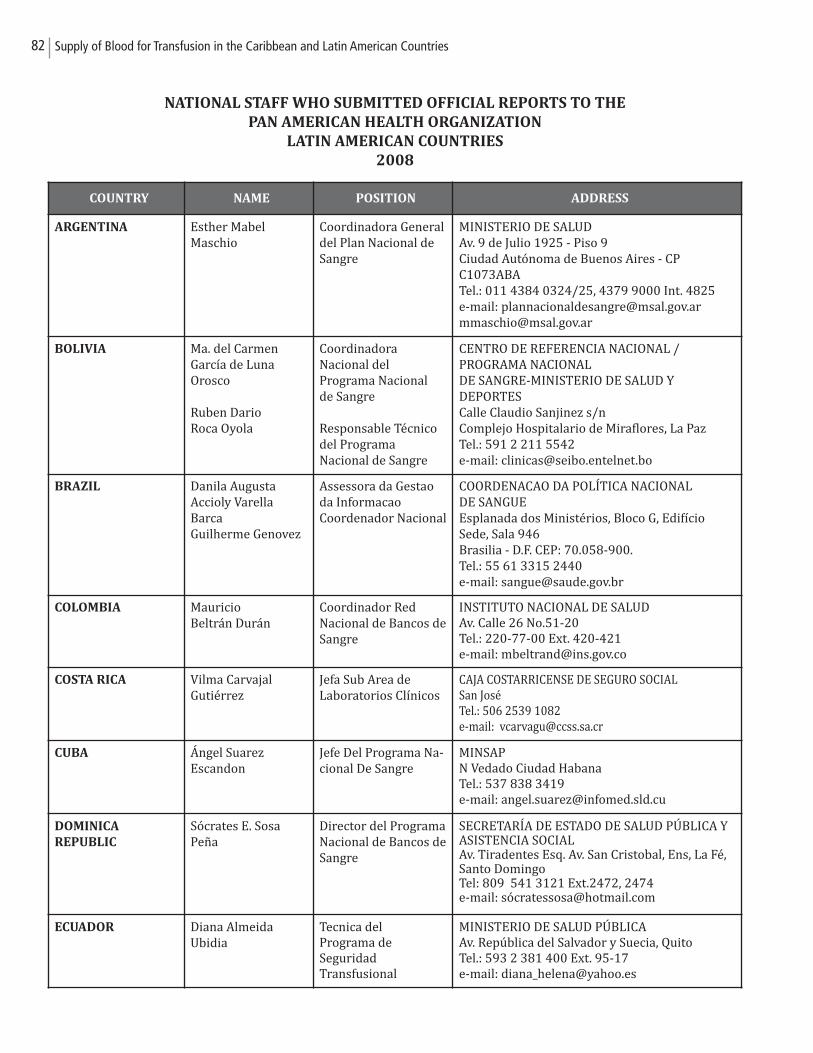
82 Supply of Blood for Transfusion in the Caribbean and Latin American Countries
NATIONAL STAFF WHO SUBMITTED OFFICIAL REPORTS TO THE
PAN AMERICAN HEALTH ORGANIZATION
LATIN AMERICAN COUNTRIES
2008
COUNTRY NAME POSITION ADDRESS
ARGENTINA Esther Mabel Maschio
Coordinadora Generaldel Plan Nacional deSangre
MINISTERIO DE SALUDAv. 9 de Julio 1925 - Piso 9Ciudad Autónoma de Buenos Aires - CPC1073ABATel.: 011 4384 0324/25, 4379 9000 Int. 4825e-mail: [email protected]@msal.gov.ar
BOLIVIA Ma. del Carmen García de LunaOrosco
Ruben Dario Roca Oyola
Coordinadora Nacional del Programa Nacional de Sangre
Responsable Técnicodel Programa Nacional de Sangre
CENTRO DE REFERENCIA NACIONAL / PROGRAMA NACIONAL DE SANGRE-MINISTERIO DE SALUD Y DEPORTESCalle Claudio Sanjinez s/nComplejo Hospitalario de Miraflores, La PazTel.: 591 2 211 5542e-mail: [email protected]
BRAZIL Danila Augusta Accioly VarellaBarcaGuilherme Genovez
Assessora da Gestaoda InformacaoCoordenador Nacional
COORDENACAO DA POLÍTICA NACIONAL DE SANGUEEsplanada dos Ministérios, Bloco G, EdifícioSede, Sala 946Brasilia - D.F. CEP: 70.058-900.Tel.: 55 61 3315 2440e-mail: [email protected]
COLOMBIA Mauricio Beltrán Durán
Coordinador Red Nacional de Bancos deSangre
INSTITUTO NACIONAL DE SALUDAv. Calle 26 No.51-20Tel.: 220-77-00 Ext. 420-421e-mail: [email protected]
COSTA RICA Vilma CarvajalGutiérrez
Jefa Sub Area de Laboratorios Clínicos
CAJA COSTARRICENSE DE SEGURO SOCIALSan JoséTel.: 506 2539 1082e-mail: [email protected]
CUBA Ángel Suarez Escandon
Jefe Del Programa Na-cional De Sangre
MINSAPN Vedado Ciudad HabanaTel.: 537 838 3419e-mail: [email protected]
DOMINICA
REPUBLIC
Sócrates E. SosaPeña
Director del ProgramaNacional de Bancos deSangre
SECRETARÍA DE ESTADO DE SALUD PÚBLICA YASISTENCIA SOCIALAv. Tiradentes Esq. Av. San Cristobal, Ens, La Fé,Santo DomingoTel: 809 541 3121 Ext.2472, 2474e-mail: só[email protected]
ECUADOR Diana AlmeidaUbidia
Tecnica del Programa de Seguridad Transfusional
MINISTERIO DE SALUD PÚBLICAAv. República del Salvador y Suecia, QuitoTel.: 593 2 381 400 Ext. 95-17e-mail: [email protected]
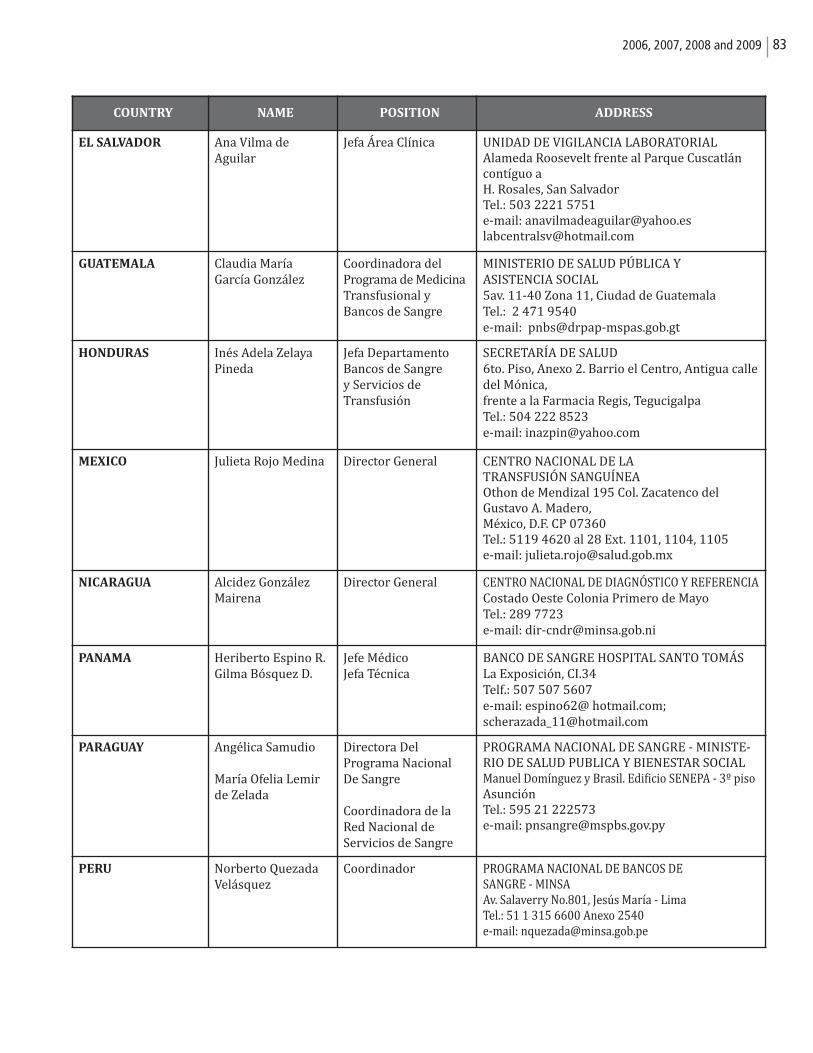
832006, 2007, 2008 and 2009
COUNTRY NAME POSITION ADDRESS
EL SALVADOR Ana Vilma deAguilar
Jefa Área Clínica UNIDAD DE VIGILANCIA LABORATORIALAlameda Roosevelt frente al Parque Cuscatláncontíguo a H. Rosales, San SalvadorTel.: 503 2221 5751e-mail: [email protected]@hotmail.com
GUATEMALA Claudia María García González
Coordinadora del Programa de MedicinaTransfusional y Bancos de Sangre
MINISTERIO DE SALUD PÚBLICA Y ASISTENCIA SOCIAL5av. 11-40 Zona 11, Ciudad de GuatemalaTel.: 2 471 9540e-mail: [email protected]
HONDURAS Inés Adela ZelayaPineda
Jefa DepartamentoBancos de Sangrey Servicios de Transfusión
SECRETARÍA DE SALUD6to. Piso, Anexo 2. Barrio el Centro, Antigua calledel Mónica, frente a la Farmacia Regis, TegucigalpaTel.: 504 222 8523e-mail: [email protected]
MEXICO Julieta Rojo Medina Director General CENTRO NACIONAL DE LA TRANSFUSIÓN SANGUÍNEAOthon de Mendizal 195 Col. Zacatenco del Gustavo A. Madero, México, D.F. CP 07360Tel.: 5119 4620 al 28 Ext. 1101, 1104, 1105e-mail: [email protected]
NICARAGUA Alcidez GonzálezMairena
Director General CENTRO NACIONAL DE DIAGNÓSTICO Y REFERENCIACostado Oeste Colonia Primero de MayoTel.: 289 7723e-mail: [email protected]
PANAMA Heriberto Espino R.Gilma Bósquez D.
Jefe MédicoJefa Técnica
BANCO DE SANGRE HOSPITAL SANTO TOMÁSLa Exposición, CI.34Telf.: 507 507 5607e-mail: espino62@ hotmail.com; [email protected]
PARAGUAY Angélica Samudio
María Ofelia Lemirde Zelada
Directora Del Programa Nacional De Sangre
Coordinadora de laRed Nacional deServicios de Sangre
PROGRAMA NACIONAL DE SANGRE - MINISTE-RIO DE SALUD PUBLICA Y BIENESTAR SOCIALManuel Domínguez y Brasil. Edificio SENEPA - 3º pisoAsunciónTel.: 595 21 222573e-mail: [email protected]
PERU Norberto QuezadaVelásquez
Coordinador PROGRAMA NACIONAL DE BANCOS DE SANGRE - MINSAAv. Salaverry No.801, Jesús María - LimaTel.: 51 1 315 6600 Anexo 2540e-mail: [email protected]

84 Supply of Blood for Transfusion in the Caribbean and Latin American Countries
852006, 2007, 2008 and 2009
2009
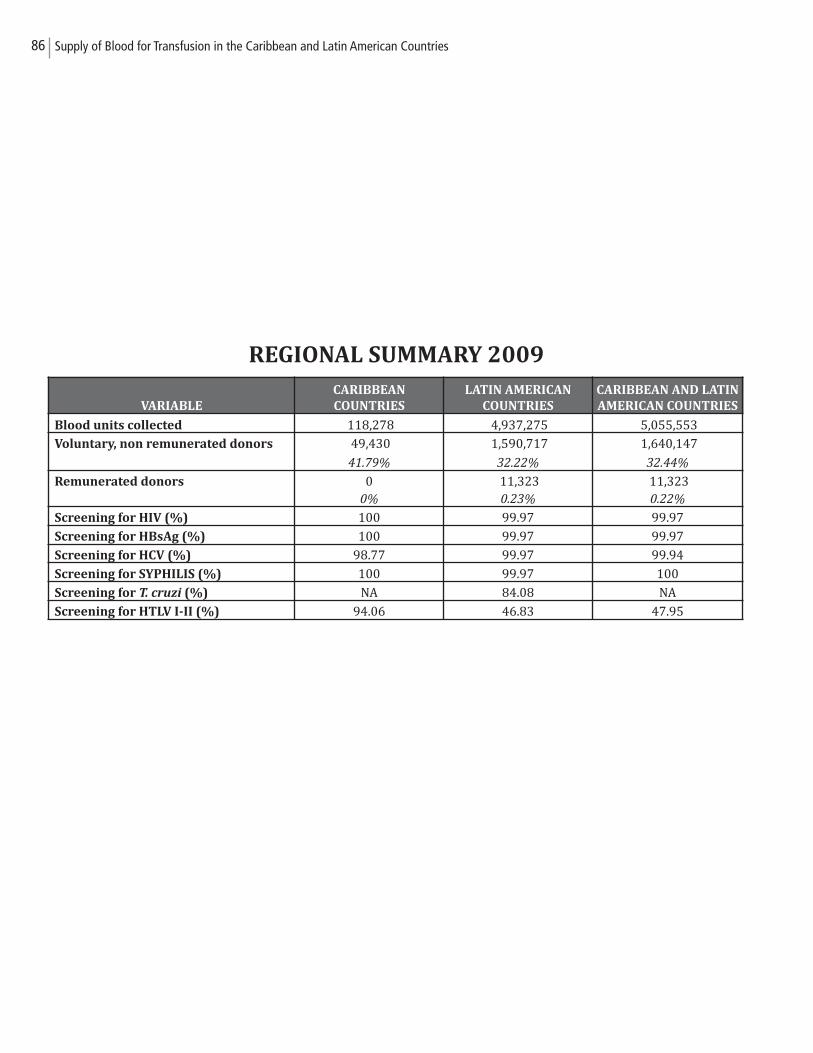
86 Supply of Blood for Transfusion in the Caribbean and Latin American Countries
REGIONAL SUMMARY 2009
VARIABLE
CARIBBEAN
COUNTRIES
LATIN AMERICAN
COUNTRIES
CARIBBEAN AND LATIN
AMERICAN COUNTRIES
Blood units collected 118,278 4,937,275 5,055,553
Voluntary, non remunerated donors 49,430 1,590,717 1,640,147
41.79% 32.22% 32.44%
Remunerated donors 0 11,323 11,323 0% 0.23% 0.22%
Screening for HIV (%) 100 99.97 99.97
Screening for HBsAg (%) 100 99.97 99.97
Screening for HCV (%) 98.77 99.97 99.94
Screening for SYPHILIS (%) 100 99.97 100
Screening for T. cruzi (%) NA 84.08 NA
Screening for HTLV I-II (%) 94.06 46.83 47.95
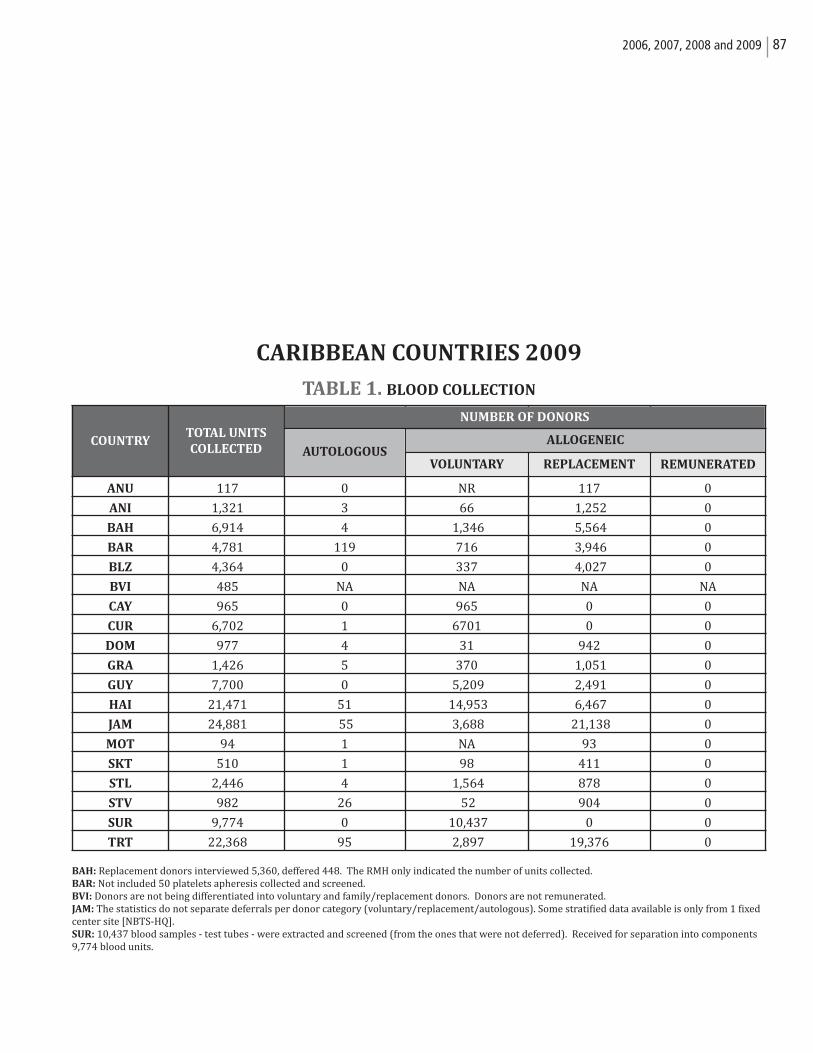
872006, 2007, 2008 and 2009
CARIBBEAN COUNTRIES 2009
TABLE 1. BLOOD COLLECTION
BAH: Replacement donors interviewed 5,360, deffered 448. The RMH only indicated the number of units collected. BAR: Not included 50 platelets apheresis collected and screened. BVI: Donors are not being differentiated into voluntary and family/replacement donors. Donors are not remunerated.JAM: The statistics do not separate deferrals per donor category (voluntary/replacement/autologous). Some stratified data available is only from 1 fixedcenter site [NBTS-HQ].SUR: 10,437 blood samples - test tubes - were extracted and screened (from the ones that were not deferred). Received for separation into components9,774 blood units.
COUNTRYTOTAL UNITS
COLLECTED
ANU 117 0 NR 117 0
ANI 1,321 3 66 1,252 0
BAH 6,914 4 1,346 5,564 0
BAR 4,781 119 716 3,946 0
BLZ 4,364 0 337 4,027 0
BVI 485 NA NA NA NA
CAY 965 0 965 0 0
CUR 6,702 1 6701 0 0
DOM 977 4 31 942 0
GRA 1,426 5 370 1,051 0
GUY 7,700 0 5,209 2,491 0
HAI 21,471 51 14,953 6,467 0
JAM 24,881 55 3,688 21,138 0
MOT 94 1 NA 93 0
SKT 510 1 98 411 0
STL 2,446 4 1,564 878 0
STV 982 26 52 904 0
SUR 9,774 0 10,437 0 0
TRT 22,368 95 2,897 19,376 0
NUMBER OF DONORS
AUTOLOGOUSALLOGENEIC
VOLUNTARY REPLACEMENT REMUNERATED
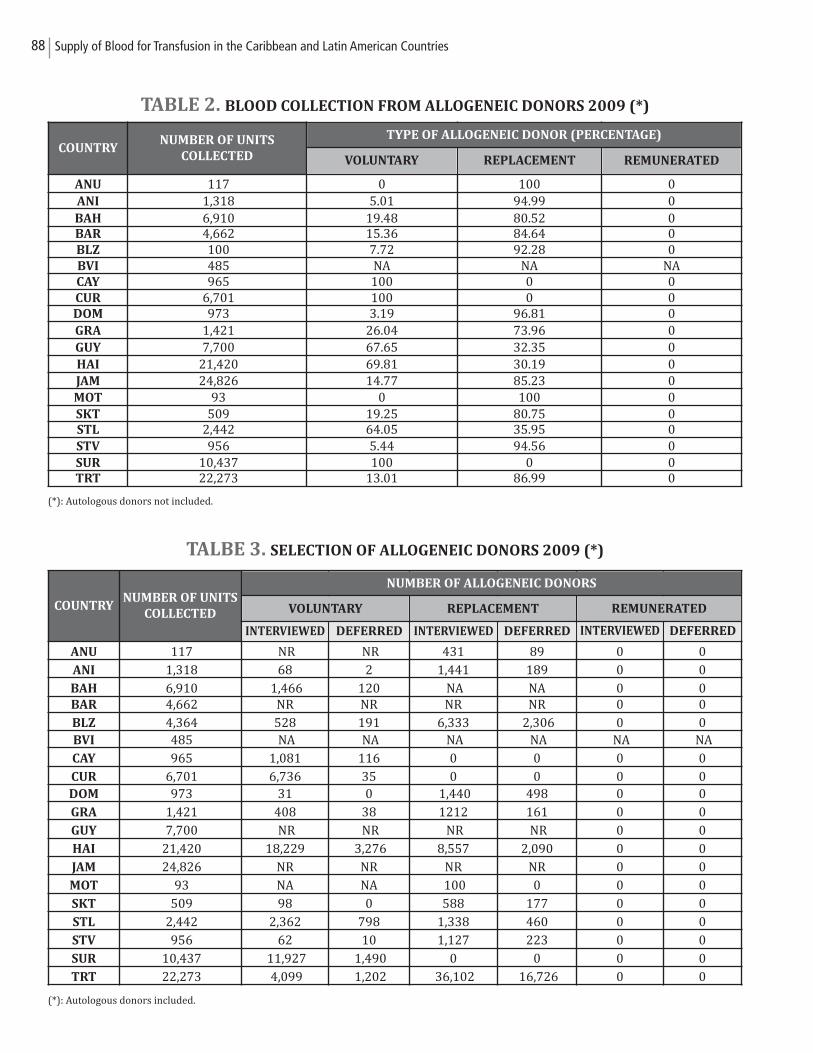
88 Supply of Blood for Transfusion in the Caribbean and Latin American Countries
TABLE 2. BLOOD COLLECTION FROM ALLOGENEIC DONORS 2009 (*)
(*): Autologous donors not included.
TALBE 3. SELECTION OF ALLOGENEIC DONORS 2009 (*)
(*): Autologous donors included.
COUNTRYNUMBER OF UNITS
COLLECTED
ANU 117 NR NR 431 89 0 0ANI 1,318 68 2 1,441 189 0 0BAH 6,910 1,466 120 NA NA 0 0BAR 4,662 NR NR NR NR 0 0BLZ 4,364 528 191 6,333 2,306 0 0BVI 485 NA NA NA NA NA NA CAY 965 1,081 116 0 0 0 0CUR 6,701 6,736 35 0 0 0 0DOM 973 31 0 1,440 498 0 0GRA 1,421 408 38 1212 161 0 0GUY 7,700 NR NR NR NR 0 0HAI 21,420 18,229 3,276 8,557 2,090 0 0JAM 24,826 NR NR NR NR 0 0MOT 93 NA NA 100 0 0 0SKT 509 98 0 588 177 0 0STL 2,442 2,362 798 1,338 460 0 0STV 956 62 10 1,127 223 0 0SUR 10,437 11,927 1,490 0 0 0 0TRT 22,273 4,099 1,202 36,102 16,726 0 0
NUMBER OF ALLOGENEIC DONORS
VOLUNTARY REPLACEMENT REMUNERATED
INTERVIEWED DEFERRED DEFERRED DEFERREDINTERVIEWED INTERVIEWED
COUNTRYNUMBER OF UNITS
COLLECTED
ANU 117 0 100 0ANI 1,318 5.01 94.99 0BAH 6,910 19.48 80.52 0BAR 4,662 15.36 84.64 0BLZ 100 7.72 92.28 0BVI 485 NA NA NACAY 965 100 0 0CUR 6,701 100 0 0DOM 973 3.19 96.81 0GRA 1,421 26.04 73.96 0GUY 7,700 67.65 32.35 0HAI 21,420 69.81 30.19 0JAM 24,826 14.77 85.23 0MOT 93 0 100 0SKT 509 19.25 80.75 0STL 2,442 64.05 35.95 0STV 956 5.44 94.56 0SUR 10,437 100 0 0TRT 22,273 13.01 86.99 0
TYPE OF ALLOGENEIC DONOR (PERCENTAGE)
VOLUNTARY REPLACEMENT REMUNERATED
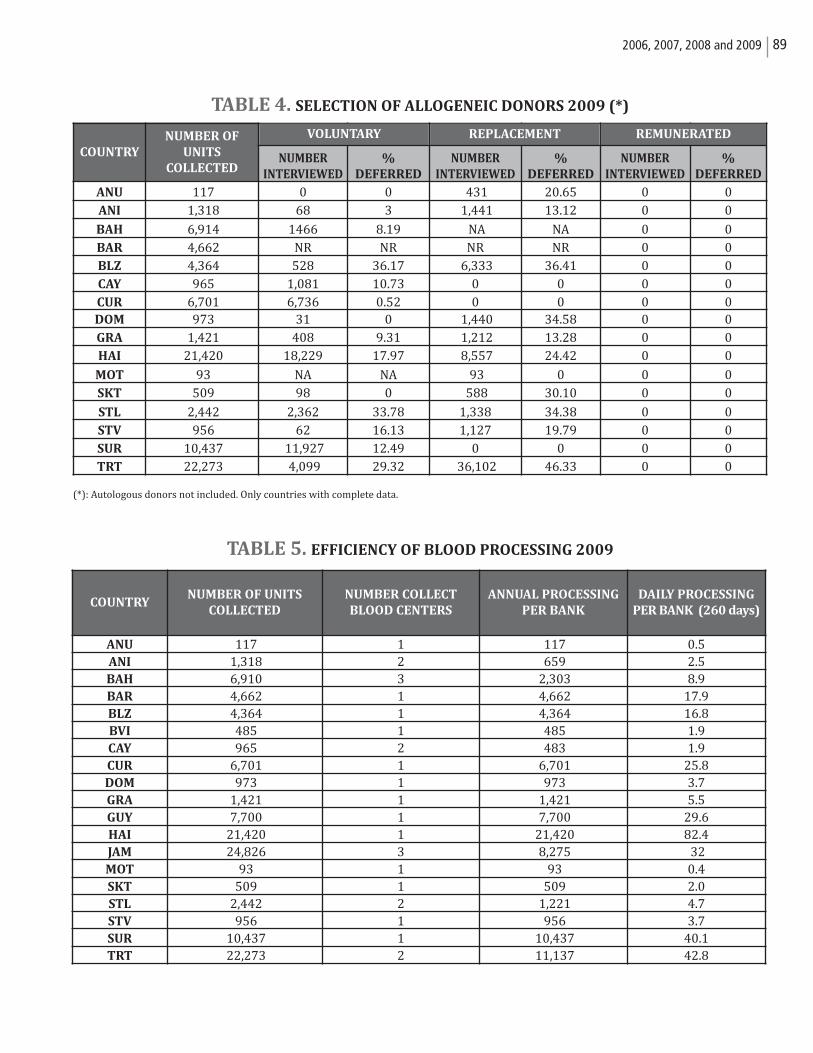
892006, 2007, 2008 and 2009
TABLE 4. SELECTION OF ALLOGENEIC DONORS 2009 (*)
(*): Autologous donors not included. Only countries with complete data.
TABLE 5. EFFICIENCY OF BLOOD PROCESSING 2009
COUNTRY
NUMBER OF
UNITS
COLLECTED NUMBER
INTERVIEWED
%
DEFERRED
NUMBER
INTERVIEWED
%
DEFERRED
NUMBER
INTERVIEWED
%
DEFERRED
ANU 117 0 0 431 20.65 0 0ANI 1,318 68 3 1,441 13.12 0 0
BAH 6,914 1466 8.19 NA NA 0 0BAR 4,662 NR NR NR NR 0 0BLZ 4,364 528 36.17 6,333 36.41 0 0CAY 965 1,081 10.73 0 0 0 0CUR 6,701 6,736 0.52 0 0 0 0DOM 973 31 0 1,440 34.58 0 0GRA 1,421 408 9.31 1,212 13.28 0 0HAI 21,420 18,229 17.97 8,557 24.42 0 0
MOT 93 NA NA 93 0 0 0SKT 509 98 0 588 30.10 0 0
STL 2,442 2,362 33.78 1,338 34.38 0 0STV 956 62 16.13 1,127 19.79 0 0SUR 10,437 11,927 12.49 0 0 0 0TRT 22,273 4,099 29.32 36,102 46.33 0 0
VOLUNTARY REPLACEMENT REMUNERATED
COUNTRYNUMBER OF UNITS
COLLECTED
NUMBER COLLECT
BLOOD CENTERS
ANNUAL PROCESSING
PER BANK
DAILY PROCESSING
PER BANK (260 days)
ANU 117 1 117 0.5ANI 1,318 2 659 2.5BAH 6,910 3 2,303 8.9BAR 4,662 1 4,662 17.9BLZ 4,364 1 4,364 16.8BVI 485 1 485 1.9CAY 965 2 483 1.9CUR 6,701 1 6,701 25.8DOM 973 1 973 3.7GRA 1,421 1 1,421 5.5GUY 7,700 1 7,700 29.6HAI 21,420 1 21,420 82.4JAM 24,826 3 8,275 32 MOT 93 1 93 0.4SKT 509 1 509 2.0STL 2,442 2 1,221 4.7STV 956 1 956 3.7SUR 10,437 1 10,437 40.1TRT 22,273 2 11,137 42.8
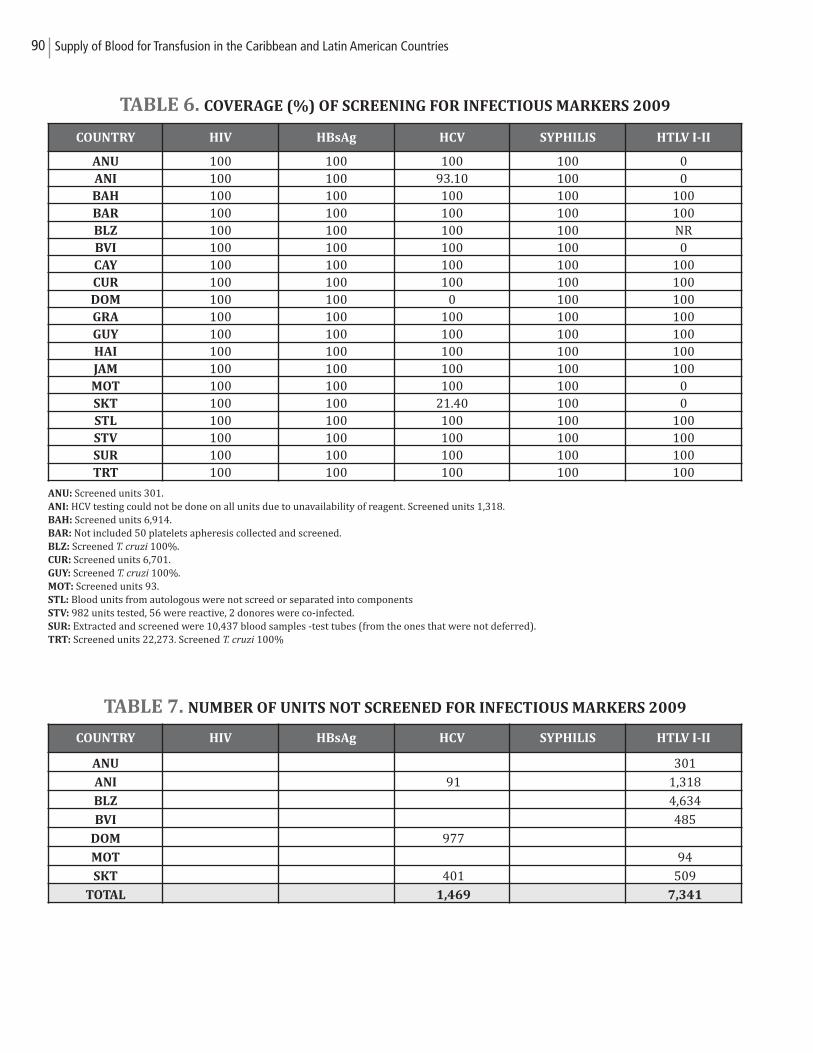
90 Supply of Blood for Transfusion in the Caribbean and Latin American Countries
TABLE 6. COVERAGE (%) OF SCREENING FOR INFECTIOUS MARKERS 2009
ANU: Screened units 301.ANI: HCV testing could not be done on all units due to unavailability of reagent. Screened units 1,318.BAH: Screened units 6,914.BAR: Not included 50 platelets apheresis collected and screened.BLZ: Screened T. cruzi 100%. CUR: Screened units 6,701.GUY: Screened T. cruzi 100%.MOT: Screened units 93.STL: Blood units from autologous were not screed or separated into componentsSTV: 982 units tested, 56 were reactive, 2 donores were co-infected.SUR: Extracted and screened were 10,437 blood samples -test tubes (from the ones that were not deferred). TRT: Screened units 22,273. Screened T. cruzi 100%
TABLE 7. NUMBER OF UNITS NOT SCREENED FOR INFECTIOUS MARKERS 2009
COUNTRY HIV HBsAg HCV SYPHILIS HTLV I-II
ANU 100 100 100 100 0ANI 100 100 93.10 100 0BAH 100 100 100 100 100BAR 100 100 100 100 100BLZ 100 100 100 100 NRBVI 100 100 100 100 0CAY 100 100 100 100 100CUR 100 100 100 100 100DOM 100 100 0 100 100GRA 100 100 100 100 100GUY 100 100 100 100 100HAI 100 100 100 100 100JAM 100 100 100 100 100MOT 100 100 100 100 0SKT 100 100 21.40 100 0STL 100 100 100 100 100STV 100 100 100 100 100SUR 100 100 100 100 100TRT 100 100 100 100 100
COUNTRY HIV HBsAg HCV SYPHILIS HTLV I-II
ANU 301
ANI 91 1,318
BLZ 4,634
BVI 485
DOM 977
MOT 94
SKT 401 509
TOTAL 1,469 7,341
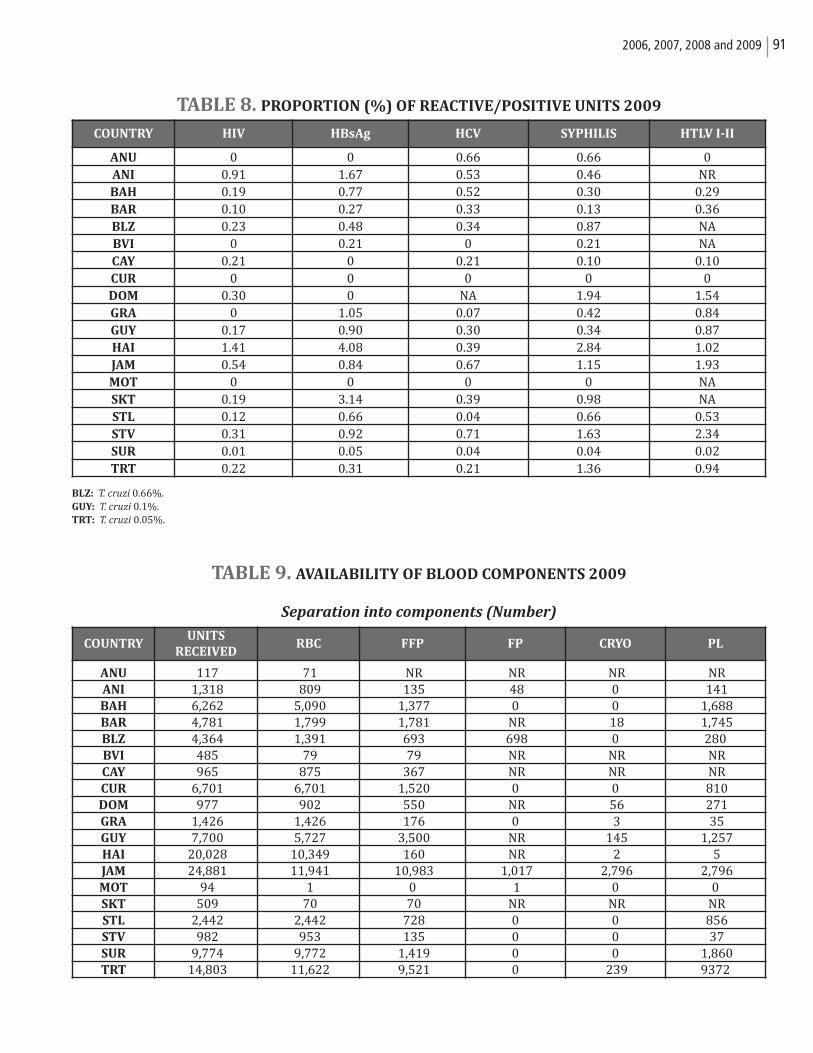
912006, 2007, 2008 and 2009
TABLE 8. PROPORTION (%) OF REACTIVE/POSITIVE UNITS 2009
BLZ: T. cruzi 0.66%.GUY: T. cruzi 0.1%.TRT: T. cruzi 0.05%.
TABLE 9. AVAILABILITY OF BLOOD COMPONENTS 2009
Separation into components (Number)
COUNTRY HIV HBsAg HCV SYPHILIS HTLV I-II
ANU 0 0 0.66 0.66 0ANI 0.91 1.67 0.53 0.46 NRBAH 0.19 0.77 0.52 0.30 0.29BAR 0.10 0.27 0.33 0.13 0.36BLZ 0.23 0.48 0.34 0.87 NABVI 0 0.21 0 0.21 NACAY 0.21 0 0.21 0.10 0.10CUR 0 0 0 0 0DOM 0.30 0 NA 1.94 1.54GRA 0 1.05 0.07 0.42 0.84GUY 0.17 0.90 0.30 0.34 0.87HAI 1.41 4.08 0.39 2.84 1.02JAM 0.54 0.84 0.67 1.15 1.93MOT 0 0 0 0 NASKT 0.19 3.14 0.39 0.98 NASTL 0.12 0.66 0.04 0.66 0.53STV 0.31 0.92 0.71 1.63 2.34SUR 0.01 0.05 0.04 0.04 0.02TRT 0.22 0.31 0.21 1.36 0.94
COUNTRYUNITS
RECEIVEDRBC FFP FP CRYO PL
ANU 117 71 NR NR NR NR ANI 1,318 809 135 48 0 141 BAH 6,262 5,090 1,377 0 0 1,688 BAR 4,781 1,799 1,781 NR 18 1,745 BLZ 4,364 1,391 693 698 0 280BVI 485 79 79 NR NR NR CAY 965 875 367 NR NR NR CUR 6,701 6,701 1,520 0 0 810 DOM 977 902 550 NR 56 271 GRA 1,426 1,426 176 0 3 35 GUY 7,700 5,727 3,500 NR 145 1,257 HAI 20,028 10,349 160 NR 2 5 JAM 24,881 11,941 10,983 1,017 2,796 2,796 MOT 94 1 0 1 0 0SKT 509 70 70 NR NR NR STL 2,442 2,442 728 0 0 856 STV 982 953 135 0 0 37 SUR 9,774 9,772 1,419 0 0 1,860 TRT 14,803 11,622 9,521 0 239 9372
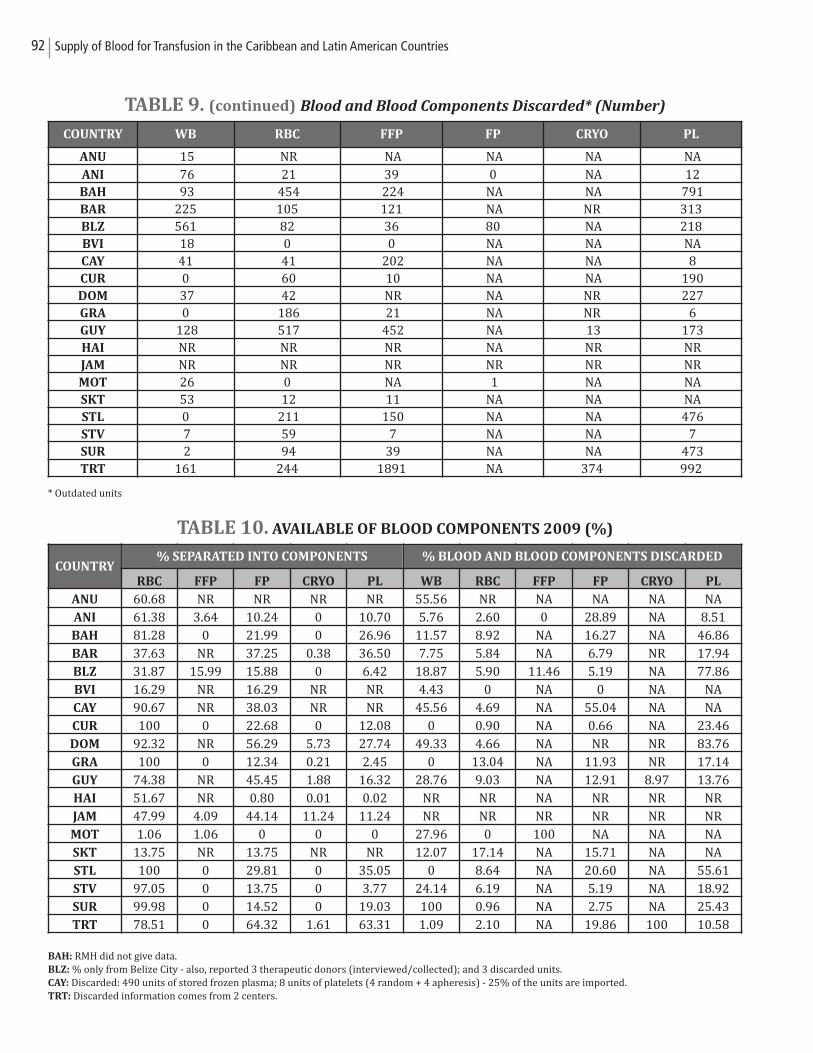
92 Supply of Blood for Transfusion in the Caribbean and Latin American Countries
TABLE 9. (continued) Blood and Blood Components Discarded* (Number)
* Outdated units
TABLE 10. AVAILABLE OF BLOOD COMPONENTS 2009 (%)
BAH: RMH did not give data. BLZ: % only from Belize City - also, reported 3 therapeutic donors (interviewed/collected); and 3 discarded units.CAY: Discarded: 490 units of stored frozen plasma; 8 units of platelets (4 random + 4 apheresis) - 25% of the units are imported.TRT: Discarded information comes from 2 centers.
COUNTRY WB RBC FFP FP CRYO PL
ANU 15 NR NA NA NA NA ANI 76 21 39 0 NA 12 BAH 93 454 224 NA NA 791 BAR 225 105 121 NA NR 313BLZ 561 82 36 80 NA 218BVI 18 0 0 NA NA NA CAY 41 41 202 NA NA 8 CUR 0 60 10 NA NA 190 DOM 37 42 NR NA NR 227 GRA 0 186 21 NA NR 6 GUY 128 517 452 NA 13 173 HAI NR NR NR NA NR NR JAM NR NR NR NR NR NR MOT 26 0 NA 1 NA NA SKT 53 12 11 NA NA NA STL 0 211 150 NA NA 476 STV 7 59 7 NA NA 7 SUR 2 94 39 NA NA 473 TRT 161 244 1891 NA 374 992
COUNTRYRBC FFP FP CRYO PL WB RBC FFP FP CRYO PL
ANU 60.68 NR NR NR NR 55.56 NR NA NA NA NAANI 61.38 3.64 10.24 0 10.70 5.76 2.60 0 28.89 NA 8.51BAH 81.28 0 21.99 0 26.96 11.57 8.92 NA 16.27 NA 46.86BAR 37.63 NR 37.25 0.38 36.50 7.75 5.84 NA 6.79 NR 17.94BLZ 31.87 15.99 15.88 0 6.42 18.87 5.90 11.46 5.19 NA 77.86BVI 16.29 NR 16.29 NR NR 4.43 0 NA 0 NA NACAY 90.67 NR 38.03 NR NR 45.56 4.69 NA 55.04 NA NACUR 100 0 22.68 0 12.08 0 0.90 NA 0.66 NA 23.46DOM 92.32 NR 56.29 5.73 27.74 49.33 4.66 NA NR NR 83.76GRA 100 0 12.34 0.21 2.45 0 13.04 NA 11.93 NR 17.14GUY 74.38 NR 45.45 1.88 16.32 28.76 9.03 NA 12.91 8.97 13.76HAI 51.67 NR 0.80 0.01 0.02 NR NR NA NR NR NRJAM 47.99 4.09 44.14 11.24 11.24 NR NR NR NR NR NRMOT 1.06 1.06 0 0 0 27.96 0 100 NA NA NASKT 13.75 NR 13.75 NR NR 12.07 17.14 NA 15.71 NA NASTL 100 0 29.81 0 35.05 0 8.64 NA 20.60 NA 55.61STV 97.05 0 13.75 0 3.77 24.14 6.19 NA 5.19 NA 18.92SUR 99.98 0 14.52 0 19.03 100 0.96 NA 2.75 NA 25.43TRT 78.51 0 64.32 1.61 63.31 1.09 2.10 NA 19.86 100 10.58
% SEPARATED INTO COMPONENTS % BLOOD AND BLOOD COMPONENTS DISCARDED
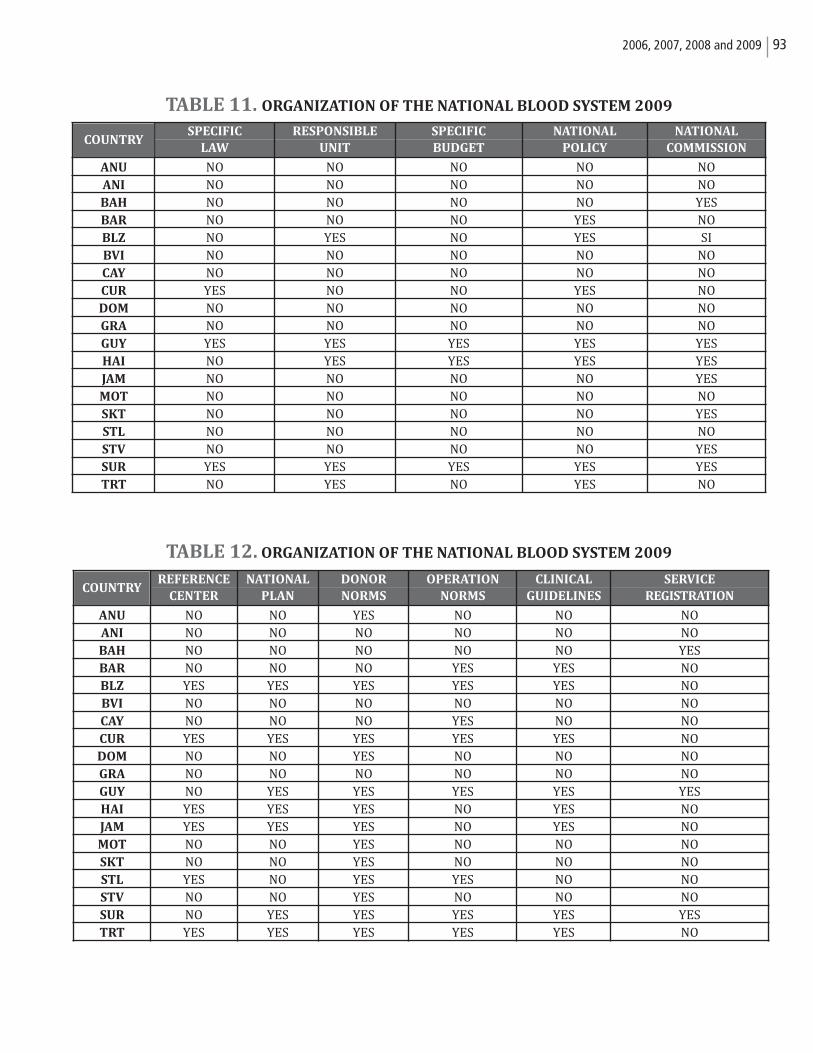
932006, 2007, 2008 and 2009
TABLE 11. ORGANIZATION OF THE NATIONAL BLOOD SYSTEM 2009
TABLE 12. ORGANIZATION OF THE NATIONAL BLOOD SYSTEM 2009
SPECIFIC RESPONSIBLE SPECIFIC NATIONAL NATIONAL
LAW UNIT BUDGET POLICY COMMISSION
ANU NO NO NO NO NOANI NO NO NO NO NOBAH NO NO NO NO YESBAR NO NO NO YES NOBLZ NO YES NO YES SIBVI NO NO NO NO NOCAY NO NO NO NO NOCUR YES NO NO YES NODOM NO NO NO NO NOGRA NO NO NO NO NOGUY YES YES YES YES YES HAI NO YES YES YES YESJAM NO NO NO NO YES MOT NO NO NO NO NOSKT NO NO NO NO YESSTL NO NO NO NO NOSTV NO NO NO NO YES SUR YES YES YES YES YESTRT NO YES NO YES NO
COUNTRY
REFERENCE NATIONAL DONOR OPERATION CLINICAL SERVICE
CENTER PLAN NORMS NORMS GUIDELINES REGISTRATION
ANU NO NO YES NO NO NOANI NO NO NO NO NO NOBAH NO NO NO NO NO YESBAR NO NO NO YES YES NOBLZ YES YES YES YES YES NOBVI NO NO NO NO NO NOCAY NO NO NO YES NO NOCUR YES YES YES YES YES NODOM NO NO YES NO NO NOGRA NO NO NO NO NO NOGUY NO YES YES YES YES YESHAI YES YES YES NO YES NOJAM YES YES YES NO YES NOMOT NO NO YES NO NO NOSKT NO NO YES NO NO NOSTL YES NO YES YES NO NOSTV NO NO YES NO NO NOSUR NO YES YES YES YES YES TRT YES YES YES YES YES NO
COUNTRY
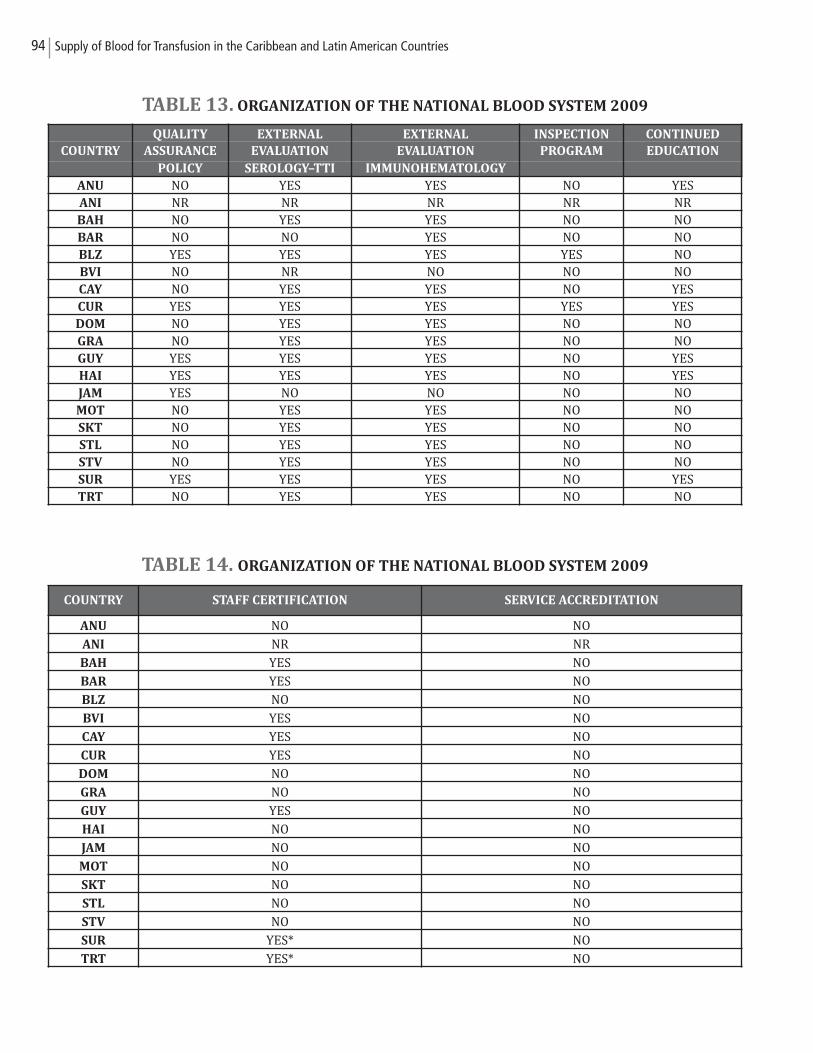
94 Supply of Blood for Transfusion in the Caribbean and Latin American Countries
TABLE 13. ORGANIZATION OF THE NATIONAL BLOOD SYSTEM 2009
TABLE 14. ORGANIZATION OF THE NATIONAL BLOOD SYSTEM 2009
QUALITY EXTERNAL EXTERNAL INSPECTION CONTINUED
COUNTRY ASSURANCE EVALUATION EVALUATION PROGRAM EDUCATION
POLICY SEROLOGY–TTI IMMUNOHEMATOLOGY
ANU NO YES YES NO YESANI NR NR NR NR NRBAH NO YES YES NO NOBAR NO NO YES NO NOBLZ YES YES YES YES NOBVI NO NR NO NO NOCAY NO YES YES NO YES CUR YES YES YES YES YESDOM NO YES YES NO NOGRA NO YES YES NO NOGUY YES YES YES NO YES HAI YES YES YES NO YESJAM YES NO NO NO NOMOT NO YES YES NO NOSKT NO YES YES NO NOSTL NO YES YES NO NOSTV NO YES YES NO NOSUR YES YES YES NO YESTRT NO YES YES NO NO
COUNTRY STAFF CERTIFICATION SERVICE ACCREDITATION
ANU NO NO
ANI NR NR
BAH YES NO
BAR YES NO
BLZ NO NO
BVI YES NO
CAY YES NO
CUR YES NO
DOM NO NO
GRA NO NO
GUY YES NO
HAI NO NO
JAM NO NO
MOT NO NO
SKT NO NO
STL NO NO
STV NO NO
SUR YES* NO
TRT YES* NO
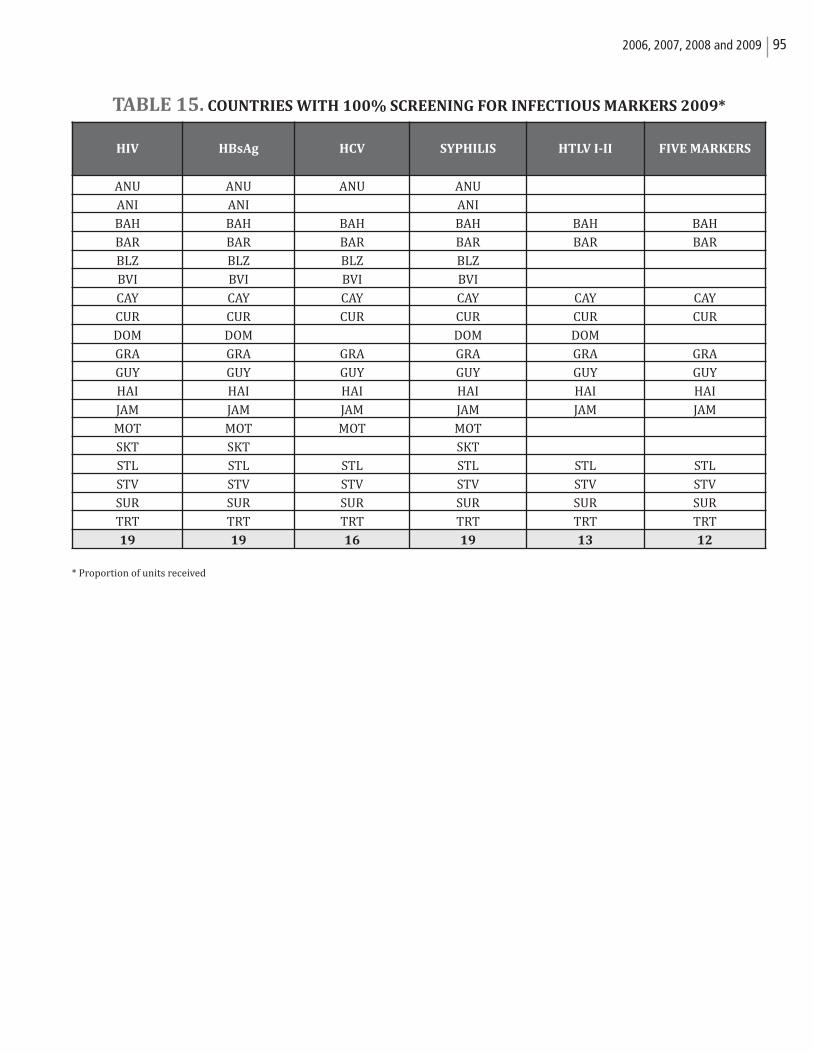
952006, 2007, 2008 and 2009
TABLE 15. COUNTRIES WITH 100% SCREENING FOR INFECTIOUS MARKERS 2009*
* Proportion of units received
HIV HBsAg HCV SYPHILIS HTLV I-II FIVE MARKERS
ANU ANU ANU ANU
ANI ANI ANI
BAH BAH BAH BAH BAH BAH
BAR BAR BAR BAR BAR BAR
BLZ BLZ BLZ BLZ
BVI BVI BVI BVI
CAY CAY CAY CAY CAY CAY
CUR CUR CUR CUR CUR CUR
DOM DOM DOM DOM
GRA GRA GRA GRA GRA GRA
GUY GUY GUY GUY GUY GUY
HAI HAI HAI HAI HAI HAI
JAM JAM JAM JAM JAM JAM
MOT MOT MOT MOT
SKT SKT SKT
STL STL STL STL STL STL
STV STV STV STV STV STV
SUR SUR SUR SUR SUR SUR
TRT TRT TRT TRT TRT TRT
19 19 16 19 13 12
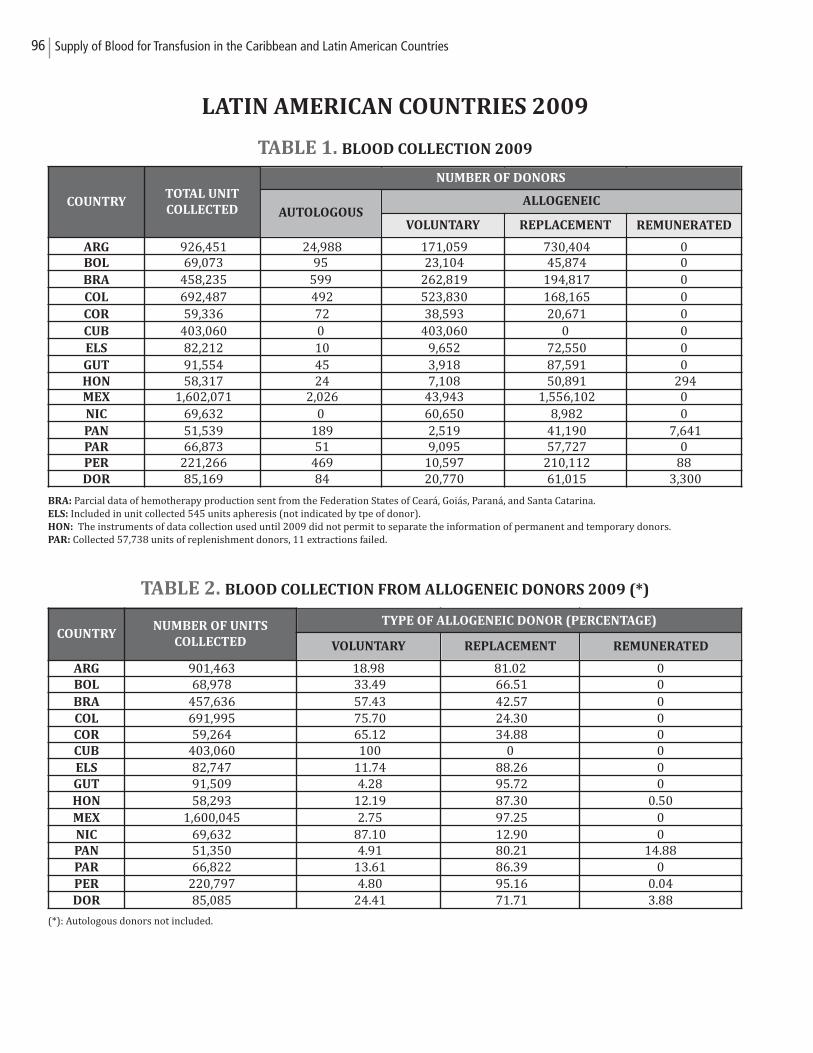
96 Supply of Blood for Transfusion in the Caribbean and Latin American Countries
LATIN AMERICAN COUNTRIES 2009
TABLE 1. BLOOD COLLECTION 2009
BRA: Parcial data of hemotherapy production sent from the Federation States of Ceará, Goiás, Paraná, and Santa Catarina.ELS: Included in unit collected 545 units apheresis (not indicated by tpe of donor).HON: The instruments of data collection used until 2009 did not permit to separate the information of permanent and temporary donors. PAR: Collected 57,738 units of replenishment donors, 11 extractions failed.
TABLE 2. BLOOD COLLECTION FROM ALLOGENEIC DONORS 2009 (*)
(*): Autologous donors not included.
COUNTRYNUMBER OF UNITS
COLLECTED
ARG 901,463 18.98 81.02 0BOL 68,978 33.49 66.51 0BRA 457,636 57.43 42.57 0COL 691,995 75.70 24.30 0COR 59,264 65.12 34.88 0CUB 403,060 100 0 0ELS 82,747 11.74 88.26 0GUT 91,509 4.28 95.72 0HON 58,293 12.19 87.30 0.50MEX 1,600,045 2.75 97.25 0NIC 69,632 87.10 12.90 0PAN 51,350 4.91 80.21 14.88PAR 66,822 13.61 86.39 0PER 220,797 4.80 95.16 0.04DOR 85,085 24.41 71.71 3.88
TYPE OF ALLOGENEIC DONOR (PERCENTAGE)
VOLUNTARY REPLACEMENT REMUNERATED
COUNTRYTOTAL UNIT
COLLECTED
ARG 926,451 24,988 171,059 730,404 0BOL 69,073 95 23,104 45,874 0BRA 458,235 599 262,819 194,817 0COL 692,487 492 523,830 168,165 0COR 59,336 72 38,593 20,671 0CUB 403,060 0 403,060 0 0ELS 82,212 10 9,652 72,550 0GUT 91,554 45 3,918 87,591 0HON 58,317 24 7,108 50,891 294 MEX 1,602,071 2,026 43,943 1,556,102 0NIC 69,632 0 60,650 8,982 0PAN 51,539 189 2,519 41,190 7,641 PAR 66,873 51 9,095 57,727 0PER 221,266 469 10,597 210,112 88DOR 85,169 84 20,770 61,015 3,300
NUMBER OF DONORS
AUTOLOGOUSALLOGENEIC
VOLUNTARY REPLACEMENT REMUNERATED
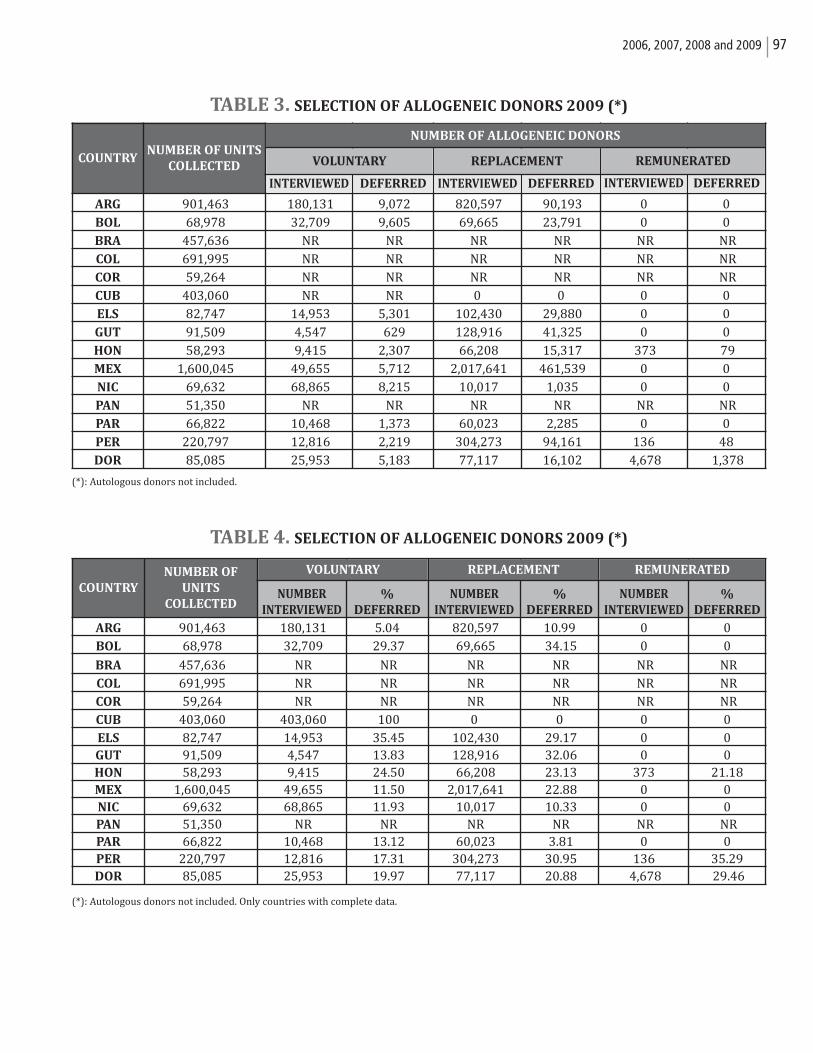
972006, 2007, 2008 and 2009
TABLE 3. SELECTION OF ALLOGENEIC DONORS 2009 (*)
(*): Autologous donors not included.
TABLE 4. SELECTION OF ALLOGENEIC DONORS 2009 (*)
(*): Autologous donors not included. Only countries with complete data.
COUNTRYNUMBER OF UNITS
COLLECTED
ARG 901,463 180,131 9,072 820,597 90,193 0 0BOL 68,978 32,709 9,605 69,665 23,791 0 0BRA 457,636 NR NR NR NR NR NR COL 691,995 NR NR NR NR NR NR COR 59,264 NR NR NR NR NR NR CUB 403,060 NR NR 0 0 0 0ELS 82,747 14,953 5,301 102,430 29,880 0 0GUT 91,509 4,547 629 128,916 41,325 0 0HON 58,293 9,415 2,307 66,208 15,317 373 79 MEX 1,600,045 49,655 5,712 2,017,641 461,539 0 0NIC 69,632 68,865 8,215 10,017 1,035 0 0PAN 51,350 NR NR NR NR NR NR PAR 66,822 10,468 1,373 60,023 2,285 0 0PER 220,797 12,816 2,219 304,273 94,161 136 48DOR 85,085 25,953 5,183 77,117 16,102 4,678 1,378
NUMBER OF ALLOGENEIC DONORS
VOLUNTARY REPLACEMENT REMUNERATED
INTERVIEWED DEFERRED DEFERRED DEFERREDINTERVIEWED INTERVIEWED
COUNTRY
NUMBER OF
UNITS
COLLECTED NUMBER
INTERVIEWED
%
DEFERRED
NUMBER
INTERVIEWED
%
DEFERRED
NUMBER
INTERVIEWED
%
DEFERRED
ARG 901,463 180,131 5.04 820,597 10.99 0 0BOL 68,978 32,709 29.37 69,665 34.15 0 0
BRA 457,636 NR NR NR NR NR NR COL 691,995 NR NR NR NR NR NR COR 59,264 NR NR NR NR NR NR CUB 403,060 403,060 100 0 0 0 0ELS 82,747 14,953 35.45 102,430 29.17 0 0GUT 91,509 4,547 13.83 128,916 32.06 0 0HON 58,293 9,415 24.50 66,208 23.13 373 21.18MEX 1,600,045 49,655 11.50 2,017,641 22.88 0 0NIC 69,632 68,865 11.93 10,017 10.33 0 0PAN 51,350 NR NR NR NR NR NR PAR 66,822 10,468 13.12 60,023 3.81 0 0PER 220,797 12,816 17.31 304,273 30.95 136 35.29DOR 85,085 25,953 19.97 77,117 20.88 4,678 29.46
VOLUNTARY REPLACEMENT REMUNERATED
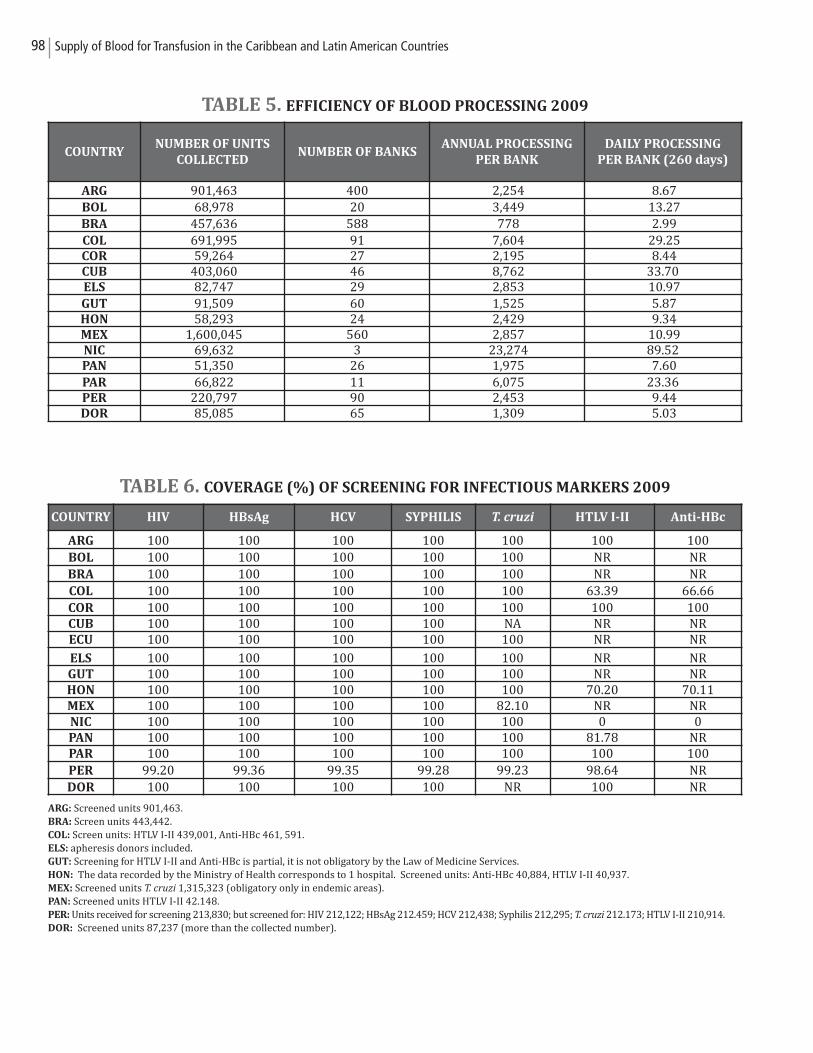
98 Supply of Blood for Transfusion in the Caribbean and Latin American Countries
TABLE 5. EFFICIENCY OF BLOOD PROCESSING 2009
TABLE 6. COVERAGE (%) OF SCREENING FOR INFECTIOUS MARKERS 2009
ARG: Screened units 901,463.BRA: Screen units 443,442.COL: Screen units: HTLV I-II 439,001, Anti-HBc 461, 591.ELS: apheresis donors included.GUT: Screening for HTLV I-II and Anti-HBc is partial, it is not obligatory by the Law of Medicine Services.HON: The data recorded by the Ministry of Health corresponds to 1 hospital. Screened units: Anti-HBc 40,884, HTLV I-II 40,937. MEX: Screened units T. cruzi 1,315,323 (obligatory only in endemic areas). PAN: Screened units HTLV I-II 42.148.PER: Units received for screening 213,830; but screened for: HIV 212,122; HBsAg 212.459; HCV 212,438; Syphilis 212,295; T. cruzi 212.173; HTLV I-II 210,914.DOR: Screened units 87,237 (more than the collected number).
COUNTRYNUMBER OF UNITS
COLLECTED NUMBER OF BANKS
ANNUAL PROCESSING
PER BANK
DAILY PROCESSING
PER BANK (260 days)
ARG 901,463 400 2,254 8.67 BOL 68,978 20 3,449 13.27 BRA 457,636 588 778 2.99 COL 691,995 91 7,604 29.25 COR 59,264 27 2,195 8.44 CUB 403,060 46 8,762 33.70ELS 82,747 29 2,853 10.97 GUT 91,509 60 1,525 5.87 HON 58,293 24 2,429 9.34 MEX 1,600,045 560 2,857 10.99 NIC 69,632 3 23,274 89.52PAN 51,350 26 1,975 7.60 PAR 66,822 11 6,075 23.36PER 220,797 90 2,453 9.44 DOR 85,085 65 1,309 5.03
COUNTRY HIV HBsAg HCV SYPHILIS T. cruzi HTLV I-II Anti-HBc
ARG 100 100 100 100 100 100 100BOL 100 100 100 100 100 NR NRBRA 100 100 100 100 100 NR NRCOL 100 100 100 100 100 63.39 66.66COR 100 100 100 100 100 100 100CUB 100 100 100 100 NA NR NRECU 100 100 100 100 100 NR NR
ELS 100 100 100 100 100 NR NRGUT 100 100 100 100 100 NR NRHON 100 100 100 100 100 70.20 70.11MEX 100 100 100 100 82.10 NR NRNIC 100 100 100 100 100 0 0PAN 100 100 100 100 100 81.78 NRPAR 100 100 100 100 100 100 100PER 99.20 99.36 99.35 99.28 99.23 98.64 NRDOR 100 100 100 100 NR 100 NR
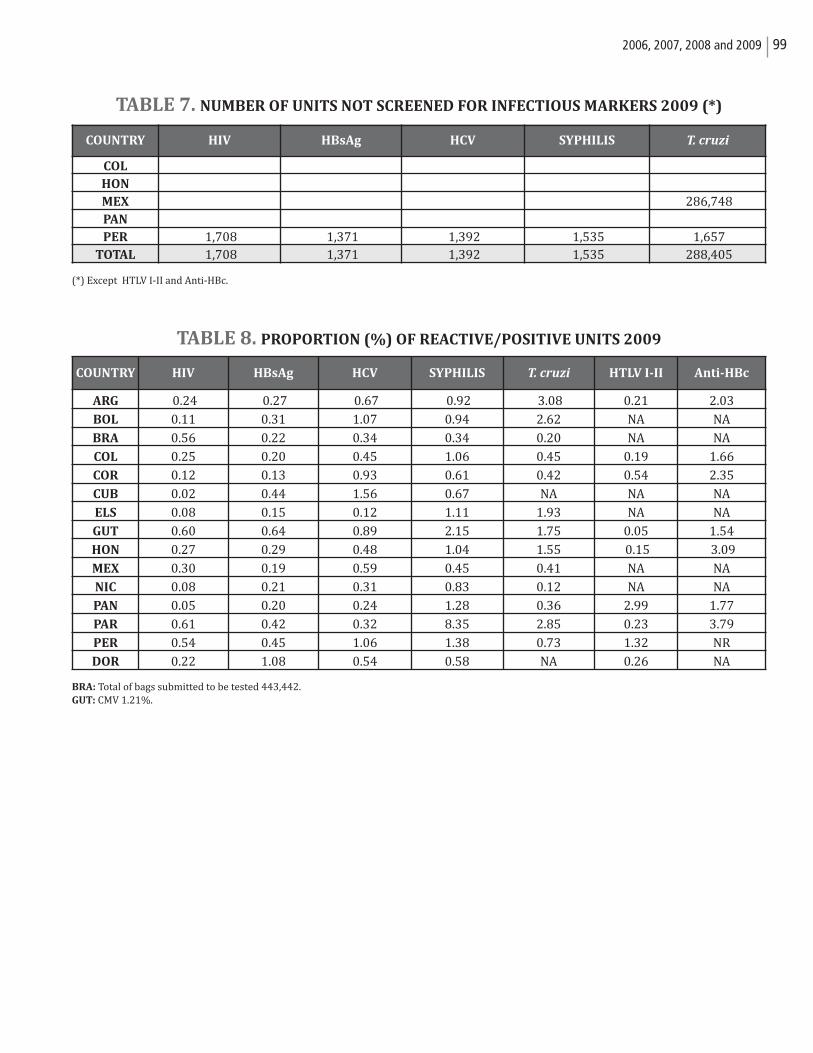
992006, 2007, 2008 and 2009
TABLE 7. NUMBER OF UNITS NOT SCREENED FOR INFECTIOUS MARKERS 2009 (*)
(*) Except HTLV I-II and Anti-HBc.
TABLE 8. PROPORTION (%) OF REACTIVE/POSITIVE UNITS 2009
BRA: Total of bags submitted to be tested 443,442.GUT: CMV 1.21%.
COUNTRY HIV HBsAg HCV SYPHILIS T. cruzi
COL
HON
MEX 286,748 PAN
PER 1,708 1,371 1,392 1,535 1,657 TOTAL 1,708 1,371 1,392 1,535 288,405
COUNTRY HIV HBsAg HCV SYPHILIS T. cruzi HTLV I-II Anti-HBc
ARG 0.24 0.27 0.67 0.92 3.08 0.21 2.03
BOL 0.11 0.31 1.07 0.94 2.62 NA NA
BRA 0.56 0.22 0.34 0.34 0.20 NA NA
COL 0.25 0.20 0.45 1.06 0.45 0.19 1.66
COR 0.12 0.13 0.93 0.61 0.42 0.54 2.35
CUB 0.02 0.44 1.56 0.67 NA NA NA
ELS 0.08 0.15 0.12 1.11 1.93 NA NA
GUT 0.60 0.64 0.89 2.15 1.75 0.05 1.54
HON 0.27 0.29 0.48 1.04 1.55 0.15 3.09
MEX 0.30 0.19 0.59 0.45 0.41 NA NA
NIC 0.08 0.21 0.31 0.83 0.12 NA NA
PAN 0.05 0.20 0.24 1.28 0.36 2.99 1.77
PAR 0.61 0.42 0.32 8.35 2.85 0.23 3.79
PER 0.54 0.45 1.06 1.38 0.73 1.32 NR
DOR 0.22 1.08 0.54 0.58 NA 0.26 NA
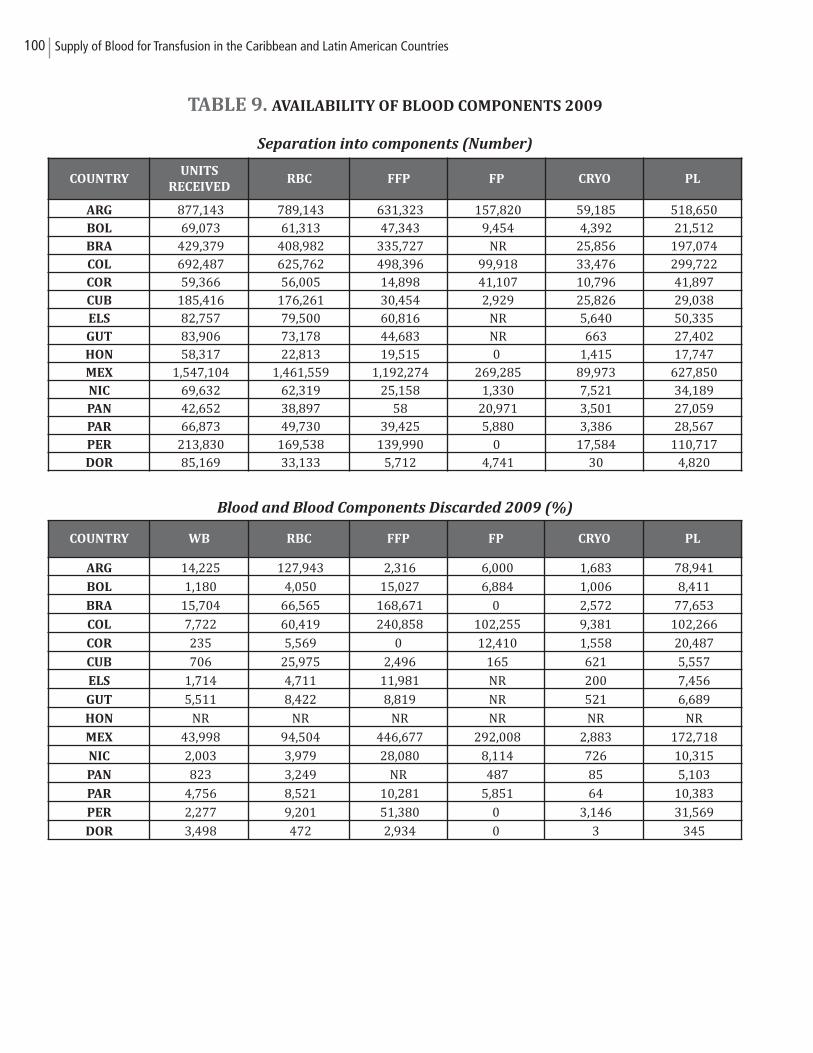
100 Supply of Blood for Transfusion in the Caribbean and Latin American Countries
TABLE 9. AVAILABILITY OF BLOOD COMPONENTS 2009
Separation into components (Number)
Blood and Blood Components Discarded 2009 (%)
COUNTRYUNITS
RECEIVEDRBC FFP FP CRYO PL
ARG 877,143 789,143 631,323 157,820 59,185 518,650 BOL 69,073 61,313 47,343 9,454 4,392 21,512 BRA 429,379 408,982 335,727 NR 25,856 197,074 COL 692,487 625,762 498,396 99,918 33,476 299,722 COR 59,366 56,005 14,898 41,107 10,796 41,897 CUB 185,416 176,261 30,454 2,929 25,826 29,038 ELS 82,757 79,500 60,816 NR 5,640 50,335 GUT 83,906 73,178 44,683 NR 663 27,402 HON 58,317 22,813 19,515 0 1,415 17,747 MEX 1,547,104 1,461,559 1,192,274 269,285 89,973 627,850 NIC 69,632 62,319 25,158 1,330 7,521 34,189 PAN 42,652 38,897 58 20,971 3,501 27,059 PAR 66,873 49,730 39,425 5,880 3,386 28,567 PER 213,830 169,538 139,990 0 17,584 110,717 DOR 85,169 33,133 5,712 4,741 30 4,820
COUNTRY WB RBC FFP FP CRYO PL
ARG 14,225 127,943 2,316 6,000 1,683 78,941
BOL 1,180 4,050 15,027 6,884 1,006 8,411
BRA 15,704 66,565 168,671 0 2,572 77,653
COL 7,722 60,419 240,858 102,255 9,381 102,266
COR 235 5,569 0 12,410 1,558 20,487
CUB 706 25,975 2,496 165 621 5,557
ELS 1,714 4,711 11,981 NR 200 7,456
GUT 5,511 8,422 8,819 NR 521 6,689
HON NR NR NR NR NR NR
MEX 43,998 94,504 446,677 292,008 2,883 172,718
NIC 2,003 3,979 28,080 8,114 726 10,315
PAN 823 3,249 NR 487 85 5,103
PAR 4,756 8,521 10,281 5,851 64 10,383
PER 2,277 9,201 51,380 0 3,146 31,569
DOR 3,498 472 2,934 0 3 345
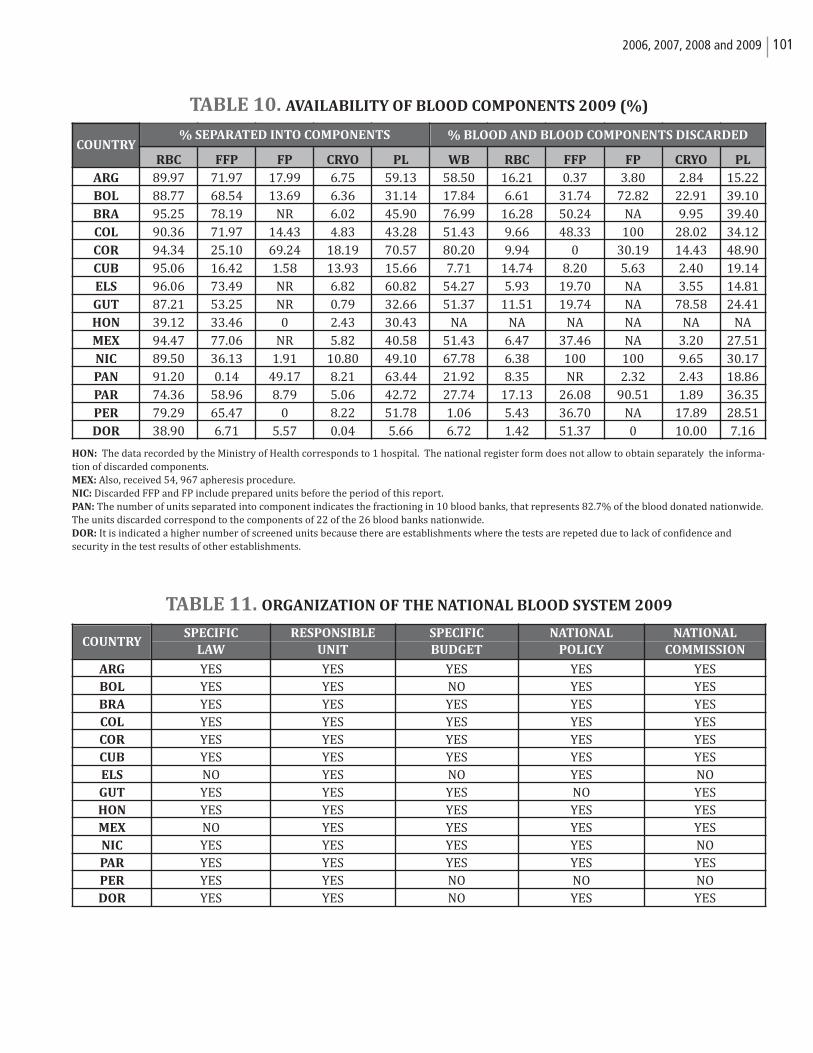
1012006, 2007, 2008 and 2009
TABLE 10. AVAILABILITY OF BLOOD COMPONENTS 2009 (%)
HON: The data recorded by the Ministry of Health corresponds to 1 hospital. The national register form does not allow to obtain separately the informa-tion of discarded components. MEX: Also, received 54, 967 apheresis procedure.NIC: Discarded FFP and FP include prepared units before the period of this report.PAN: The number of units separated into component indicates the fractioning in 10 blood banks, that represents 82.7% of the blood donated nationwide.The units discarded correspond to the components of 22 of the 26 blood banks nationwide.DOR: It is indicated a higher number of screened units because there are establishments where the tests are repeted due to lack of confidence and security in the test results of other establishments.
TABLE 11. ORGANIZATION OF THE NATIONAL BLOOD SYSTEM 2009
COUNTRYRBC FFP FP CRYO PL WB RBC FFP FP CRYO PL
ARG 89.97 71.97 17.99 6.75 59.13 58.50 16.21 0.37 3.80 2.84 15.22BOL 88.77 68.54 13.69 6.36 31.14 17.84 6.61 31.74 72.82 22.91 39.10BRA 95.25 78.19 NR 6.02 45.90 76.99 16.28 50.24 NA 9.95 39.40COL 90.36 71.97 14.43 4.83 43.28 51.43 9.66 48.33 100 28.02 34.12COR 94.34 25.10 69.24 18.19 70.57 80.20 9.94 0 30.19 14.43 48.90CUB 95.06 16.42 1.58 13.93 15.66 7.71 14.74 8.20 5.63 2.40 19.14ELS 96.06 73.49 NR 6.82 60.82 54.27 5.93 19.70 NA 3.55 14.81GUT 87.21 53.25 NR 0.79 32.66 51.37 11.51 19.74 NA 78.58 24.41HON 39.12 33.46 0 2.43 30.43 NA NA NA NA NA NAMEX 94.47 77.06 NR 5.82 40.58 51.43 6.47 37.46 NA 3.20 27.51NIC 89.50 36.13 1.91 10.80 49.10 67.78 6.38 100 100 9.65 30.17PAN 91.20 0.14 49.17 8.21 63.44 21.92 8.35 NR 2.32 2.43 18.86PAR 74.36 58.96 8.79 5.06 42.72 27.74 17.13 26.08 90.51 1.89 36.35PER 79.29 65.47 0 8.22 51.78 1.06 5.43 36.70 NA 17.89 28.51DOR 38.90 6.71 5.57 0.04 5.66 6.72 1.42 51.37 0 10.00 7.16
% SEPARATED INTO COMPONENTS % BLOOD AND BLOOD COMPONENTS DISCARDED
SPECIFIC RESPONSIBLE SPECIFIC NATIONAL NATIONAL
LAW UNIT BUDGET POLICY COMMISSION
ARG YES YES YES YES YESBOL YES YES NO YES YESBRA YES YES YES YES YESCOL YES YES YES YES YESCOR YES YES YES YES YESCUB YES YES YES YES YESELS NO YES NO YES NOGUT YES YES YES NO YESHON YES YES YES YES YESMEX NO YES YES YES YESNIC YES YES YES YES NOPAR YES YES YES YES YESPER YES YES NO NO NODOR YES YES NO YES YES
COUNTRY
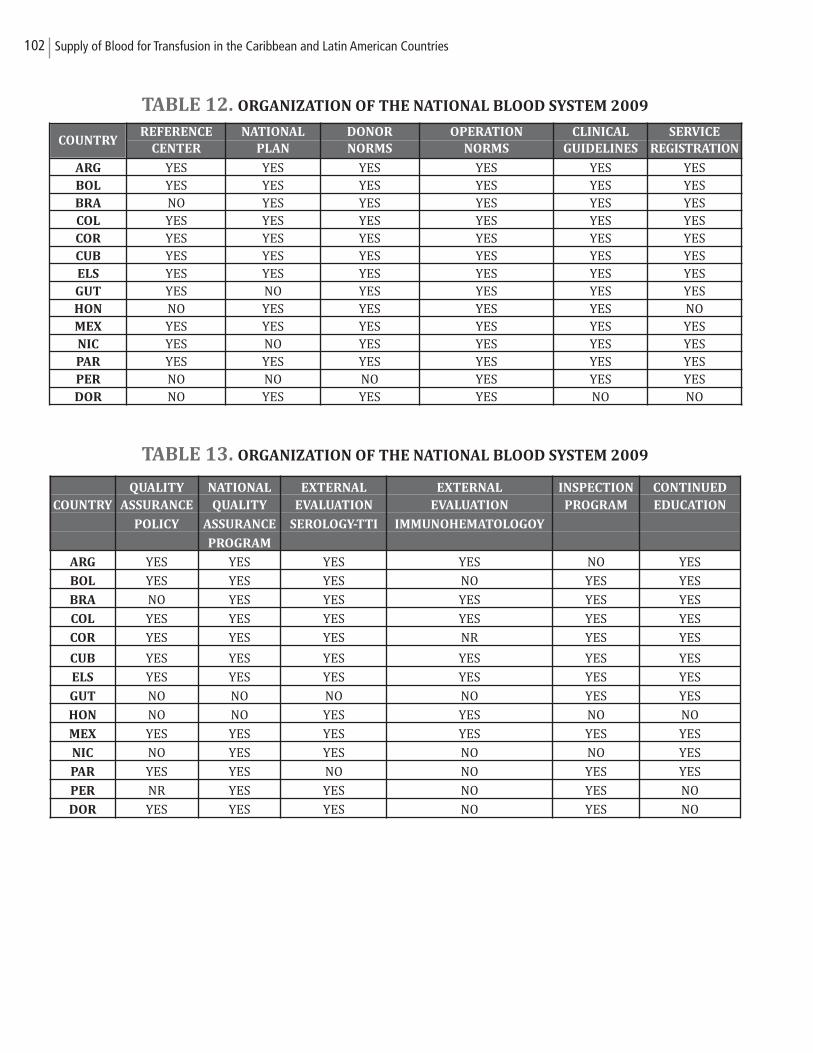
102 Supply of Blood for Transfusion in the Caribbean and Latin American Countries
TABLE 12. ORGANIZATION OF THE NATIONAL BLOOD SYSTEM 2009
TABLE 13. ORGANIZATION OF THE NATIONAL BLOOD SYSTEM 2009
REFERENCE NATIONAL DONOR OPERATION CLINICAL SERVICE
CENTER PLAN NORMS NORMS GUIDELINES REGISTRATION
ARG YES YES YES YES YES YESBOL YES YES YES YES YES YESBRA NO YES YES YES YES YESCOL YES YES YES YES YES YESCOR YES YES YES YES YES YESCUB YES YES YES YES YES YESELS YES YES YES YES YES YESGUT YES NO YES YES YES YESHON NO YES YES YES YES NOMEX YES YES YES YES YES YESNIC YES NO YES YES YES YESPAR YES YES YES YES YES YESPER NO NO NO YES YES YESDOR NO YES YES YES NO NO
COUNTRY
QUALITY NATIONAL EXTERNAL EXTERNAL INSPECTION CONTINUED
COUNTRY ASSURANCE QUALITY EVALUATION EVALUATION PROGRAM EDUCATION
POLICY ASSURANCE SEROLOGY-TTI IMMUNOHEMATOLOGOY
PROGRAM
ARG YES YES YES YES NO YES
BOL YES YES YES NO YES YES
BRA NO YES YES YES YES YES
COL YES YES YES YES YES YES
COR YES YES YES NR YES YES
CUB YES YES YES YES YES YES
ELS YES YES YES YES YES YES
GUT NO NO NO NO YES YES
HON NO NO YES YES NO NO
MEX YES YES YES YES YES YES
NIC NO YES YES NO NO YES
PAR YES YES NO NO YES YES
PER NR YES YES NO YES NO
DOR YES YES YES NO YES NO
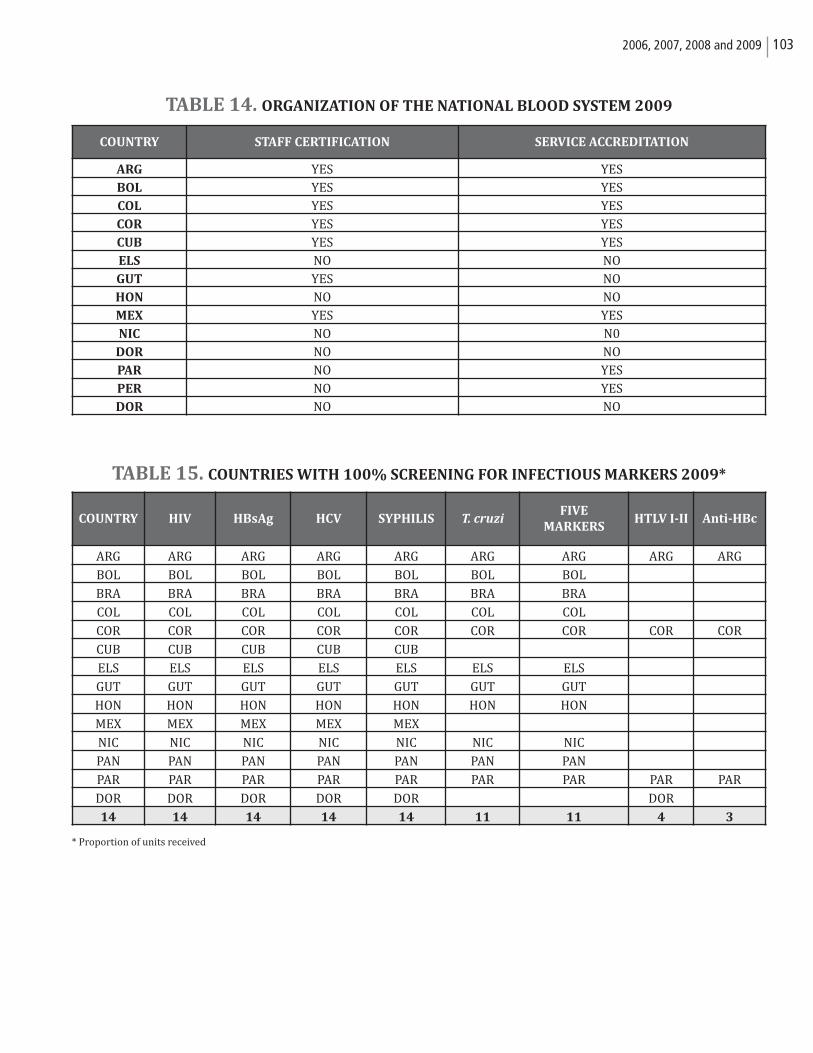
1032006, 2007, 2008 and 2009
TABLE 14. ORGANIZATION OF THE NATIONAL BLOOD SYSTEM 2009
TABLE 15. COUNTRIES WITH 100% SCREENING FOR INFECTIOUS MARKERS 2009*
* Proportion of units received
COUNTRY STAFF CERTIFICATION SERVICE ACCREDITATION
ARG YES YESBOL YES YESCOL YES YESCOR YES YESCUB YES YESELS NO NOGUT YES NOHON NO NOMEX YES YESNIC NO N0
DOR NO NOPAR NO YESPER NO YESDOR NO NO
COUNTRY HIV HBsAg HCV SYPHILIS T. cruziFIVE
MARKERSHTLV I-II Anti-HBc
ARG ARG ARG ARG ARG ARG ARG ARG ARG
BOL BOL BOL BOL BOL BOL BOL
BRA BRA BRA BRA BRA BRA BRA
COL COL COL COL COL COL COL
COR COR COR COR COR COR COR COR COR
CUB CUB CUB CUB CUB
ELS ELS ELS ELS ELS ELS ELS
GUT GUT GUT GUT GUT GUT GUT
HON HON HON HON HON HON HON
MEX MEX MEX MEX MEX
NIC NIC NIC NIC NIC NIC NIC
PAN PAN PAN PAN PAN PAN PAN
PAR PAR PAR PAR PAR PAR PAR PAR PAR
DOR DOR DOR DOR DOR DOR
14 14 14 14 14 11 11 4 3
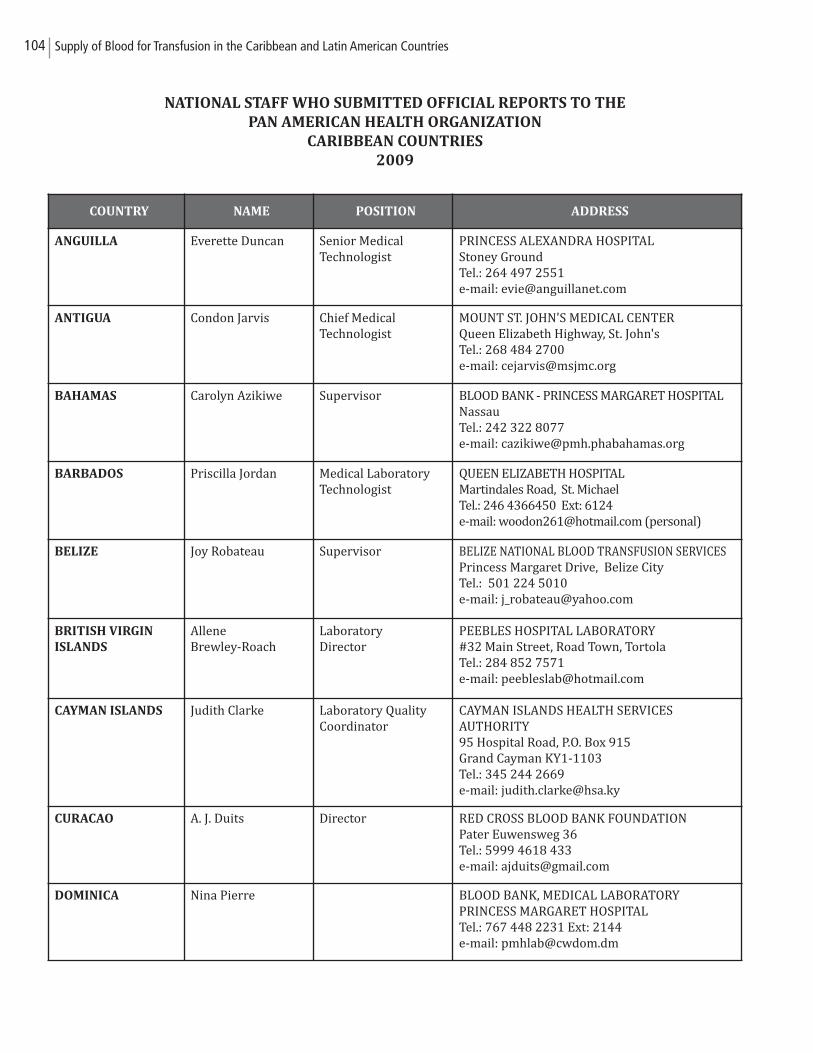
104 Supply of Blood for Transfusion in the Caribbean and Latin American Countries
NATIONAL STAFF WHO SUBMITTED OFFICIAL REPORTS TO THE
PAN AMERICAN HEALTH ORGANIZATION
CARIBBEAN COUNTRIES
2009
COUNTRY NAME POSITION ADDRESS
ANGUILLA Everette Duncan Senior Medical Technologist
PRINCESS ALEXANDRA HOSPITALStoney GroundTel.: 264 497 2551 e-mail: [email protected]
ANTIGUA Condon Jarvis Chief Medical Technologist
MOUNT ST. JOHN'S MEDICAL CENTERQueen Elizabeth Highway, St. John'sTel.: 268 484 2700e-mail: [email protected]
BAHAMAS Carolyn Azikiwe Supervisor BLOOD BANK - PRINCESS MARGARET HOSPITALNassauTel.: 242 322 8077e-mail: [email protected]
BARBADOS Priscilla Jordan Medical LaboratoryTechnologist
QUEEN ELIZABETH HOSPITALMartindales Road, St. MichaelTel.: 246 4366450 Ext: 6124e-mail: [email protected] (personal)
BELIZE Joy Robateau Supervisor BELIZE NATIONAL BLOOD TRANSFUSION SERVICESPrincess Margaret Drive, Belize City Tel.: 501 224 5010e-mail: [email protected]
BRITISH VIRGIN
ISLANDS
Allene Brewley-Roach
Laboratory Director
PEEBLES HOSPITAL LABORATORY#32 Main Street, Road Town, TortolaTel.: 284 852 7571e-mail: [email protected]
CAYMAN ISLANDS Judith Clarke Laboratory QualityCoordinator
CAYMAN ISLANDS HEALTH SERVICES AUTHORITY95 Hospital Road, P.O. Box 915 Grand Cayman KY1-1103 Tel.: 345 244 2669e-mail: [email protected]
CURACAO A. J. Duits Director RED CROSS BLOOD BANK FOUNDATIONPater Euwensweg 36Tel.: 5999 4618 433e-mail: [email protected]
DOMINICA Nina Pierre BLOOD BANK, MEDICAL LABORATORYPRINCESS MARGARET HOSPITALTel.: 767 448 2231 Ext: 2144e-mail: [email protected]
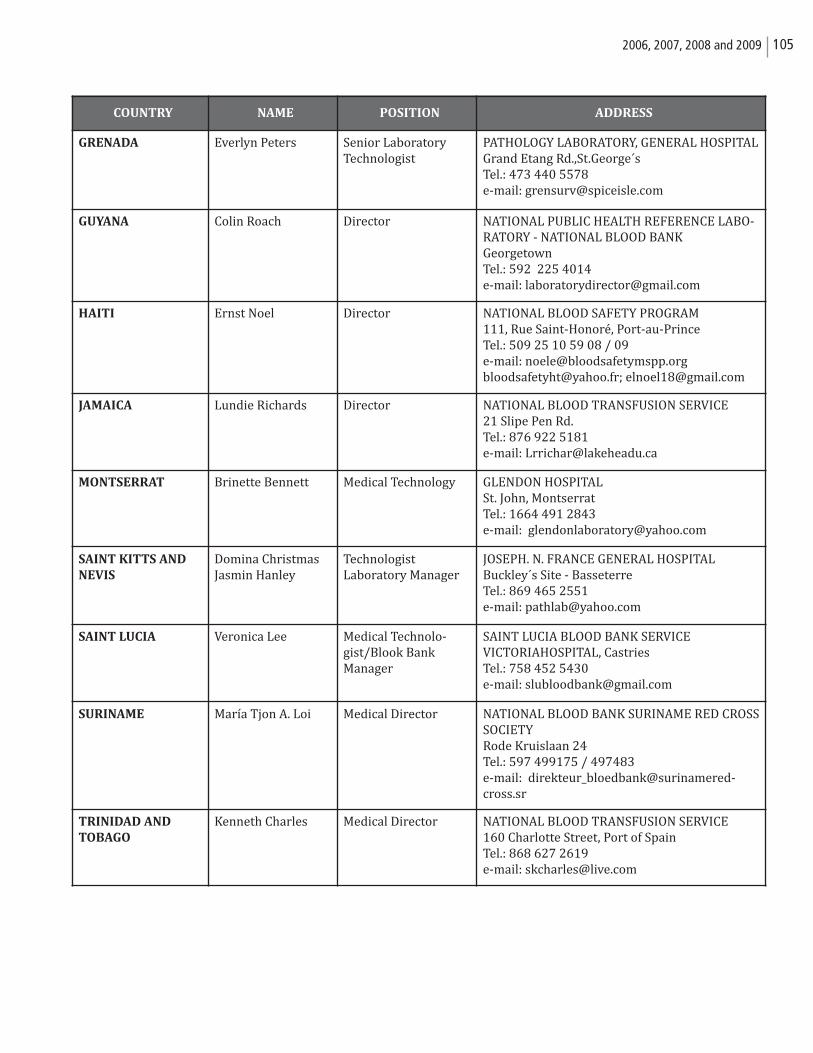
1052006, 2007, 2008 and 2009
COUNTRY NAME POSITION ADDRESS
GRENADA Everlyn Peters Senior LaboratoryTechnologist
PATHOLOGY LABORATORY, GENERAL HOSPITALGrand Etang Rd.,St.George´sTel.: 473 440 5578e-mail: [email protected]
GUYANA Colin Roach Director NATIONAL PUBLIC HEALTH REFERENCE LABO-RATORY - NATIONAL BLOOD BANKGeorgetownTel.: 592 225 4014e-mail: [email protected]
HAITI Ernst Noel Director NATIONAL BLOOD SAFETY PROGRAM111, Rue Saint-Honoré, Port-au-PrinceTel.: 509 25 10 59 08 / 09e-mail: [email protected]@yahoo.fr; [email protected]
JAMAICA Lundie Richards Director NATIONAL BLOOD TRANSFUSION SERVICE 21 Slipe Pen Rd.Tel.: 876 922 5181e-mail: [email protected]
MONTSERRAT Brinette Bennett Medical Technology GLENDON HOSPITALSt. John, MontserratTel.: 1664 491 2843e-mail: [email protected]
SAINT KITTS AND
NEVIS
Domina ChristmasJasmin Hanley
TechnologistLaboratory Manager
JOSEPH. N. FRANCE GENERAL HOSPITALBuckley´s Site - Basseterre Tel.: 869 465 2551 e-mail: [email protected]
SAINT LUCIA Veronica Lee Medical Technolo-gist/Blook Bank Manager
SAINT LUCIA BLOOD BANK SERVICEVICTORIAHOSPITAL, CastriesTel.: 758 452 5430e-mail: [email protected]
SURINAME María Tjon A. Loi Medical Director NATIONAL BLOOD BANK SURINAME RED CROSSSOCIETYRode Kruislaan 24Tel.: 597 499175 / 497483e-mail: [email protected]
TRINIDAD AND
TOBAGO
Kenneth Charles Medical Director NATIONAL BLOOD TRANSFUSION SERVICE160 Charlotte Street, Port of SpainTel.: 868 627 2619e-mail: [email protected]
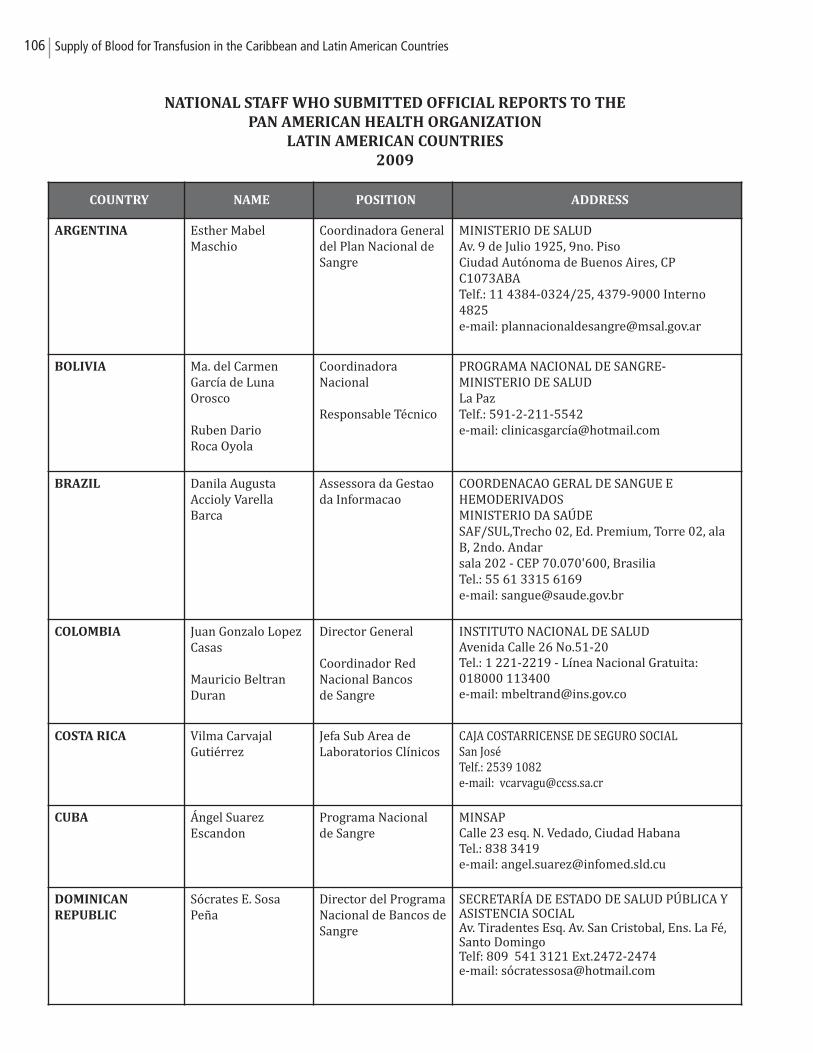
106 Supply of Blood for Transfusion in the Caribbean and Latin American Countries
NATIONAL STAFF WHO SUBMITTED OFFICIAL REPORTS TO THE
PAN AMERICAN HEALTH ORGANIZATION
LATIN AMERICAN COUNTRIES
2009
COUNTRY NAME POSITION ADDRESS
ARGENTINA Esther Mabel Maschio
Coordinadora Generaldel Plan Nacional deSangre
MINISTERIO DE SALUDAv. 9 de Julio 1925, 9no. PisoCiudad Autónoma de Buenos Aires, CPC1073ABATelf.: 11 4384-0324/25, 4379-9000 Interno4825e-mail: [email protected]
BOLIVIA Ma. del Carmen García de LunaOrosco
Ruben Dario Roca Oyola
Coordinadora Nacional
Responsable Técnico
PROGRAMA NACIONAL DE SANGRE-MINISTERIO DE SALUDLa PazTelf.: 591-2-211-5542e-mail: clinicasgarcí[email protected]
BRAZIL Danila Augusta Accioly VarellaBarca
Assessora da Gestaoda Informacao
COORDENACAO GERAL DE SANGUE E HEMODERIVADOSMINISTERIO DA SAÚDESAF/SUL,Trecho 02, Ed. Premium, Torre 02, alaB, 2ndo. Andarsala 202 - CEP 70.070'600, BrasiliaTel.: 55 61 3315 6169e-mail: [email protected]
COLOMBIA Juan Gonzalo LopezCasas
Mauricio BeltranDuran
Director General
Coordinador Red Nacional Bancos de Sangre
INSTITUTO NACIONAL DE SALUDAvenida Calle 26 No.51-20Tel.: 1 221-2219 - Línea Nacional Gratuita:018000 113400e-mail: [email protected]
COSTA RICA Vilma CarvajalGutiérrez
Jefa Sub Area de Laboratorios Clínicos
CAJA COSTARRICENSE DE SEGURO SOCIALSan JoséTelf.: 2539 1082e-mail: [email protected]
CUBA Ángel Suarez Escandon
Programa Nacional de Sangre
MINSAPCalle 23 esq. N. Vedado, Ciudad HabanaTel.: 838 3419e-mail: [email protected]
DOMINICAN
REPUBLIC
Sócrates E. SosaPeña
Director del ProgramaNacional de Bancos deSangre
SECRETARÍA DE ESTADO DE SALUD PÚBLICA YASISTENCIA SOCIALAv. Tiradentes Esq. Av. San Cristobal, Ens. La Fé, Santo DomingoTelf: 809 541 3121 Ext.2472-2474e-mail: só[email protected]
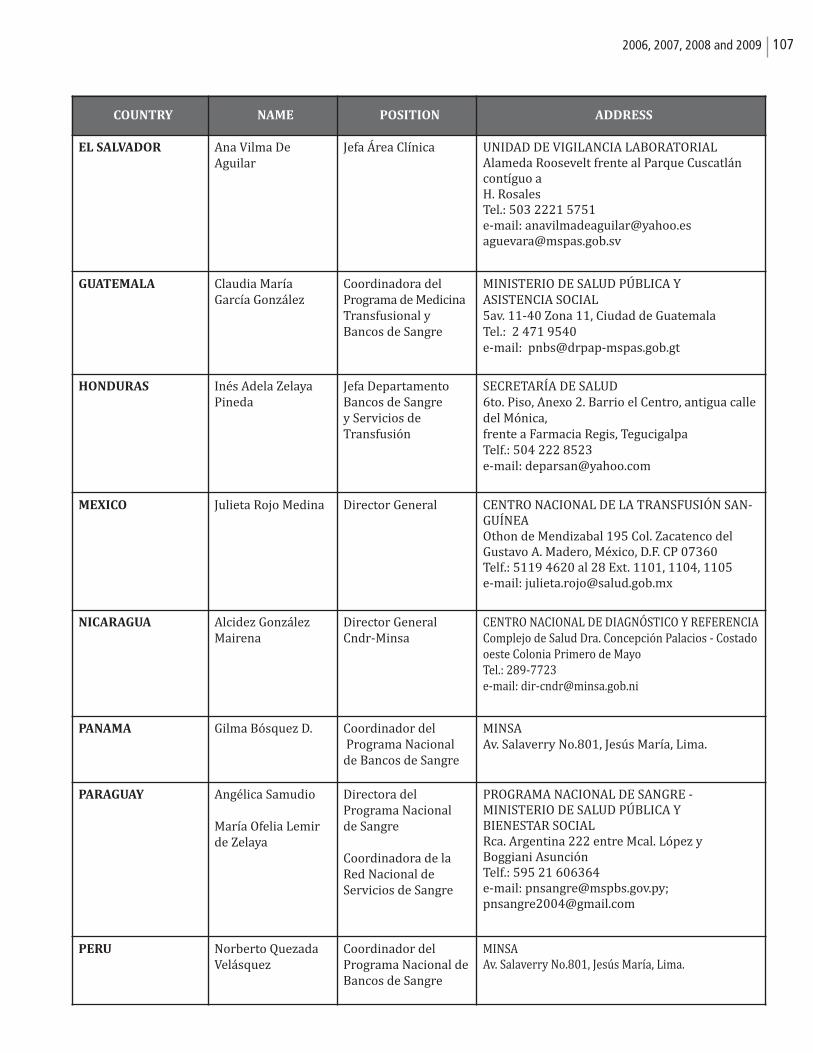
1072006, 2007, 2008 and 2009
COUNTRY NAME POSITION ADDRESS
EL SALVADOR Ana Vilma DeAguilar
Jefa Área Clínica UNIDAD DE VIGILANCIA LABORATORIALAlameda Roosevelt frente al Parque Cuscatláncontíguo a H. RosalesTel.: 503 2221 5751e-mail: [email protected] [email protected]
GUATEMALA Claudia María García González
Coordinadora del Programa de MedicinaTransfusional y Bancos de Sangre
MINISTERIO DE SALUD PÚBLICA Y ASISTENCIA SOCIAL5av. 11-40 Zona 11, Ciudad de GuatemalaTel.: 2 471 9540e-mail: [email protected]
HONDURAS Inés Adela ZelayaPineda
Jefa DepartamentoBancos de Sangrey Servicios de Transfusión
SECRETARÍA DE SALUD6to. Piso, Anexo 2. Barrio el Centro, antigua calledel Mónica, frente a Farmacia Regis, TegucigalpaTelf.: 504 222 8523e-mail: [email protected]
MEXICO Julieta Rojo Medina Director General CENTRO NACIONAL DE LA TRANSFUSIÓN SAN-GUÍNEAOthon de Mendizabal 195 Col. Zacatenco delGustavo A. Madero, México, D.F. CP 07360Telf.: 5119 4620 al 28 Ext. 1101, 1104, 1105e-mail: [email protected]
NICARAGUA Alcidez GonzálezMairena
Director GeneralCndr-Minsa
CENTRO NACIONAL DE DIAGNÓSTICO Y REFERENCIAComplejo de Salud Dra. Concepción Palacios - Costadooeste Colonia Primero de MayoTel.: 289-7723e-mail: [email protected]
PANAMA Gilma Bósquez D. Coordinador delPrograma Nacional
de Bancos de Sangre
MINSAAv. Salaverry No.801, Jesús María, Lima.
PARAGUAY Angélica Samudio
María Ofelia Lemirde Zelaya
Directora del Programa Nacional de Sangre
Coordinadora de laRed Nacional de Servicios de Sangre
PROGRAMA NACIONAL DE SANGRE - MINISTERIO DE SALUD PÚBLICA Y BIENESTAR SOCIALRca. Argentina 222 entre Mcal. López y Boggiani AsunciónTelf.: 595 21 606364e-mail: [email protected]; [email protected]
PERU Norberto QuezadaVelásquez
Coordinador del Programa Nacional deBancos de Sangre
MINSAAv. Salaverry No.801, Jesús María, Lima.

108 Supply of Blood for Transfusion in the Caribbean and Latin American Countries
1092006, 2007, 2008 and 2009
COUNTRY SPECIFIC
SUMMARIES
CARIBBEAN COUNTRIES
110 Supply of Blood for Transfusion in the Caribbean and Latin American Countries
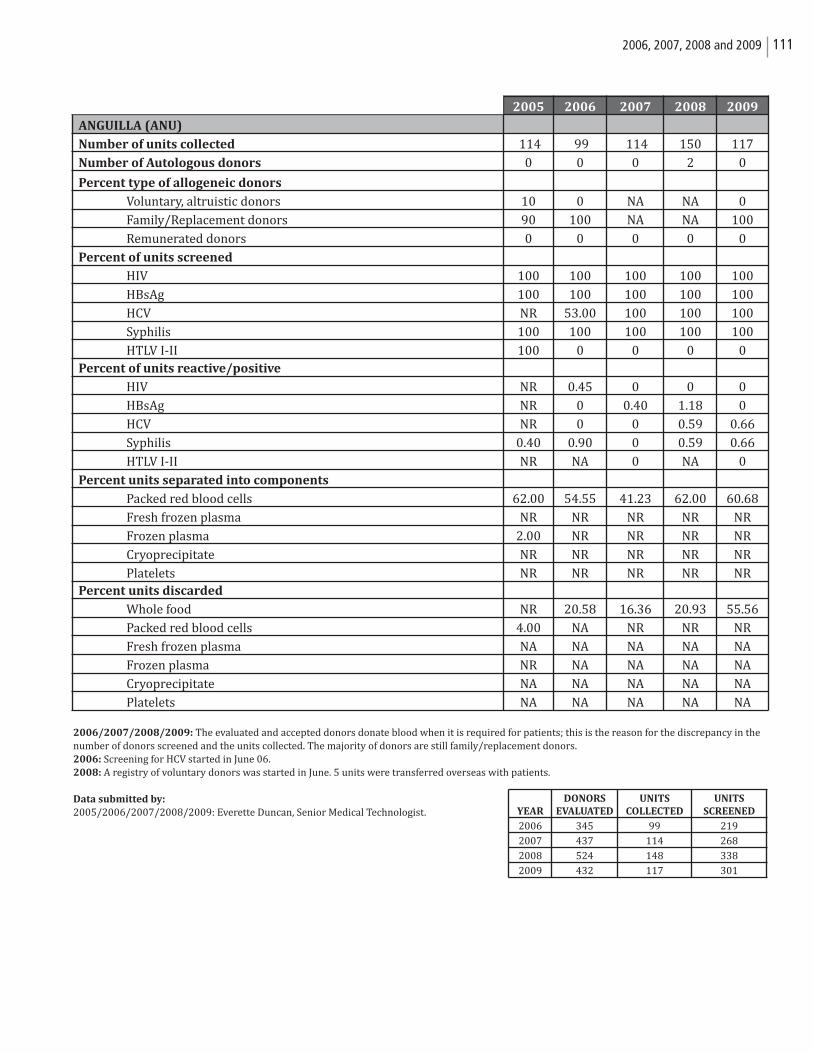
1112006, 2007, 2008 and 2009
2006/2007/2008/2009: The evaluated and accepted donors donate blood when it is required for patients; this is the reason for the discrepancy in thenumber of donors screened and the units collected. The majority of donors are still family/replacement donors.2006: Screening for HCV started in June 06.2008: A registry of voluntary donors was started in June. 5 units were transferred overseas with patients.
Data submitted by:
2005/2006/2007/2008/2009: Everette Duncan, Senior Medical Technologist.
2005 2006 2007 2008 2009
ANGUILLA (ANU)
Number of units collected 114 99 114 150 117
Number of Autologous donors 0 0 0 2 0
Percent type of allogeneic donors
Voluntary, altruistic donors 10 0 NA NA 0
Family/Replacement donors 90 100 NA NA 100
Remunerated donors 0 0 0 0 0
Percent of units screened
HIV 100 100 100 100 100
HBsAg 100 100 100 100 100
HCV NR 53.00 100 100 100
Syphilis 100 100 100 100 100
HTLV I-II 100 0 0 0 0Percent of units reactive/positive
HIV NR 0.45 0 0 0
HBsAg NR 0 0.40 1.18 0
HCV NR 0 0 0.59 0.66
Syphilis 0.40 0.90 0 0.59 0.66
HTLV I-II NR NA 0 NA 0
Percent units separated into components
Packed red blood cells 62.00 54.55 41.23 62.00 60.68
Fresh frozen plasma NR NR NR NR NR
Frozen plasma 2.00 NR NR NR NR
Cryoprecipitate NR NR NR NR NR
Platelets NR NR NR NR NRPercent units discarded
Whole food NR 20.58 16.36 20.93 55.56
Packed red blood cells 4.00 NA NR NR NR
Fresh frozen plasma NA NA NA NA NA
Frozen plasma NR NA NA NA NA
Cryoprecipitate NA NA NA NA NA
Platelets NA NA NA NA NA
YEAR
DONORS
EVALUATED
UNITS
COLLECTED
UNITS
SCREENED
2006 345 99 219
2007 437 114 268
2008 524 148 338
2009 432 117 301
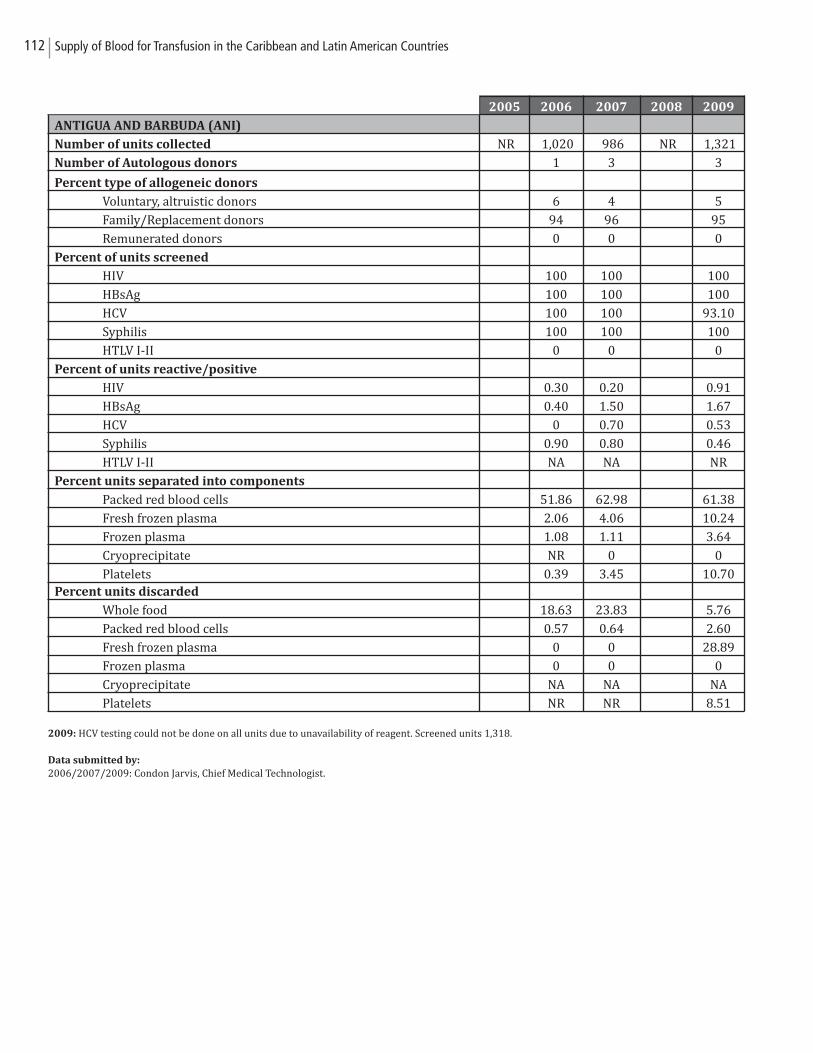
112 Supply of Blood for Transfusion in the Caribbean and Latin American Countries
2009: HCV testing could not be done on all units due to unavailability of reagent. Screened units 1,318.
Data submitted by:
2006/2007/2009: Condon Jarvis, Chief Medical Technologist.
2005 2006 2007 2008 2009
ANTIGUA AND BARBUDA (ANI)
Number of units collected NR 1,020 986 NR 1,321
Number of Autologous donors 1 3 3
Percent type of allogeneic donors
Voluntary, altruistic donors 6 4 5
Family/Replacement donors 94 96 95
Remunerated donors 0 0 0
Percent of units screened
HIV 100 100 100
HBsAg 100 100 100
HCV 100 100 93.10
Syphilis 100 100 100
HTLV I-II 0 0 0
Percent of units reactive/positive
HIV 0.30 0.20 0.91
HBsAg 0.40 1.50 1.67
HCV 0 0.70 0.53
Syphilis 0.90 0.80 0.46
HTLV I-II NA NA NR
Percent units separated into components
Packed red blood cells 51.86 62.98 61.38
Fresh frozen plasma 2.06 4.06 10.24
Frozen plasma 1.08 1.11 3.64
Cryoprecipitate NR 0 0
Platelets 0.39 3.45 10.70Percent units discarded
Whole food 18.63 23.83 5.76
Packed red blood cells 0.57 0.64 2.60
Fresh frozen plasma 0 0 28.89
Frozen plasma 0 0 0
Cryoprecipitate NA NA NA
Platelets NR NR 8.51
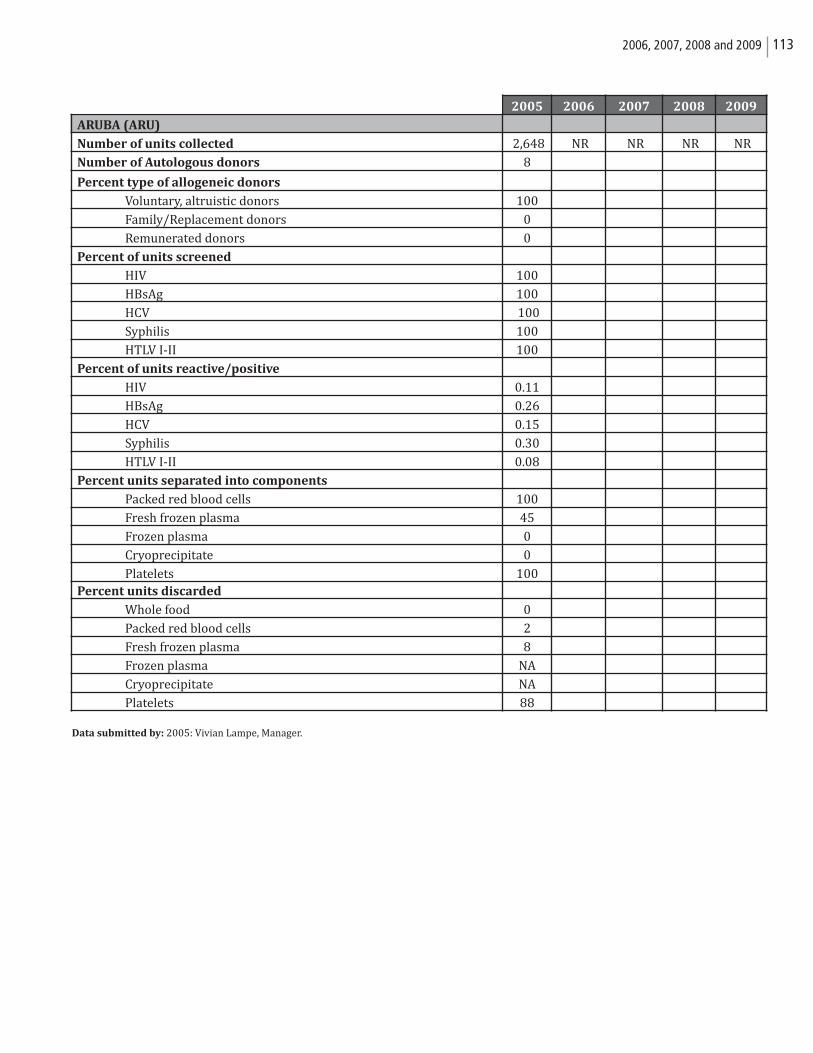
1132006, 2007, 2008 and 2009
Data submitted by: 2005: Vivian Lampe, Manager.
2005 2006 2007 2008 2009
ARUBA (ARU)
Number of units collected 2,648 NR NR NR NR
Number of Autologous donors 8
Percent type of allogeneic donors
Voluntary, altruistic donors 100
Family/Replacement donors 0
Remunerated donors 0
Percent of units screened
HIV 100
HBsAg 100
HCV 100
Syphilis 100
HTLV I-II 100
Percent of units reactive/positive
HIV 0.11
HBsAg 0.26
HCV 0.15
Syphilis 0.30
HTLV I-II 0.08
Percent units separated into components
Packed red blood cells 100
Fresh frozen plasma 45
Frozen plasma 0
Cryoprecipitate 0
Platelets 100Percent units discarded
Whole food 0
Packed red blood cells 2
Fresh frozen plasma 8
Frozen plasma NA
Cryoprecipitate NA
Platelets 88
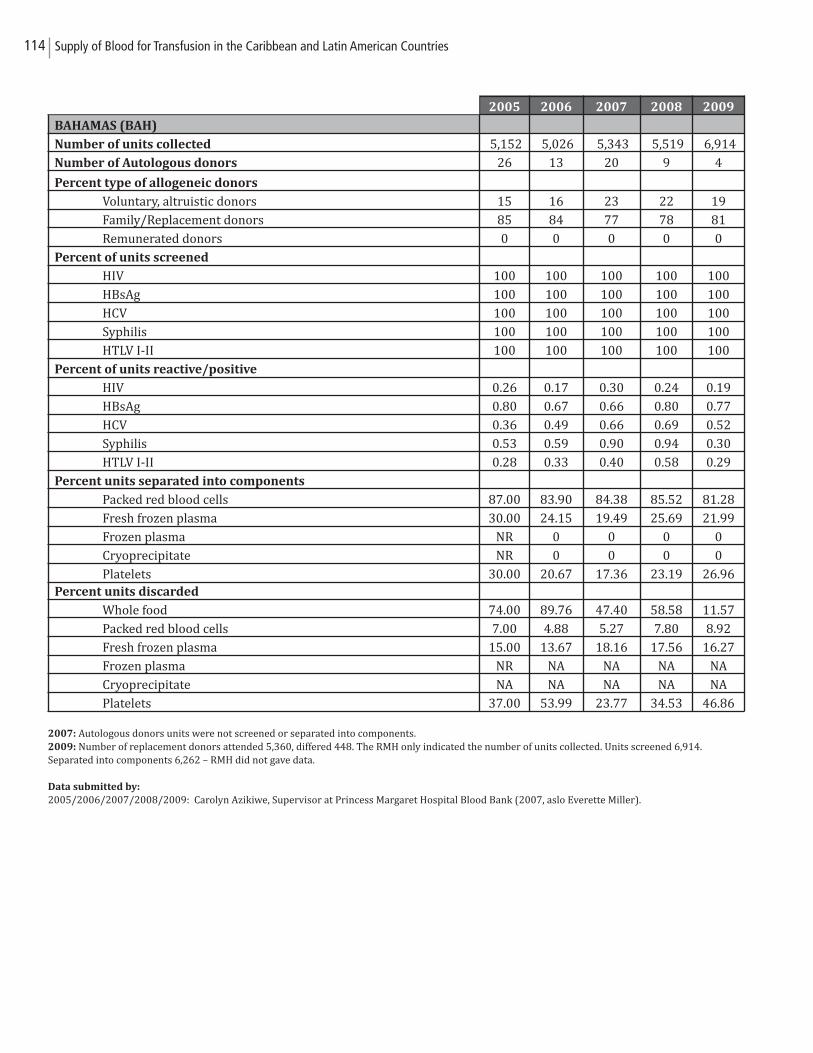
114 Supply of Blood for Transfusion in the Caribbean and Latin American Countries
2007: Autologous donors units were not screened or separated into components.2009: Number of replacement donors attended 5,360, differed 448. The RMH only indicated the number of units collected. Units screened 6,914. Separated into components 6,262 – RMH did not gave data.
Data submitted by:
2005/2006/2007/2008/2009: Carolyn Azikiwe, Supervisor at Princess Margaret Hospital Blood Bank (2007, aslo Everette Miller).
2005 2006 2007 2008 2009
BAHAMAS (BAH)
Number of units collected 5,152 5,026 5,343 5,519 6,914
Number of Autologous donors 26 13 20 9 4
Percent type of allogeneic donors
Voluntary, altruistic donors 15 16 23 22 19
Family/Replacement donors 85 84 77 78 81
Remunerated donors 0 0 0 0 0
Percent of units screened
HIV 100 100 100 100 100
HBsAg 100 100 100 100 100
HCV 100 100 100 100 100
Syphilis 100 100 100 100 100
HTLV I-II 100 100 100 100 100
Percent of units reactive/positive
HIV 0.26 0.17 0.30 0.24 0.19
HBsAg 0.80 0.67 0.66 0.80 0.77
HCV 0.36 0.49 0.66 0.69 0.52
Syphilis 0.53 0.59 0.90 0.94 0.30
HTLV I-II 0.28 0.33 0.40 0.58 0.29
Percent units separated into components
Packed red blood cells 87.00 83.90 84.38 85.52 81.28
Fresh frozen plasma 30.00 24.15 19.49 25.69 21.99
Frozen plasma NR 0 0 0 0
Cryoprecipitate NR 0 0 0 0
Platelets 30.00 20.67 17.36 23.19 26.96Percent units discarded
Whole food 74.00 89.76 47.40 58.58 11.57
Packed red blood cells 7.00 4.88 5.27 7.80 8.92
Fresh frozen plasma 15.00 13.67 18.16 17.56 16.27
Frozen plasma NR NA NA NA NA
Cryoprecipitate NA NA NA NA NA
Platelets 37.00 53.99 23.77 34.53 46.86
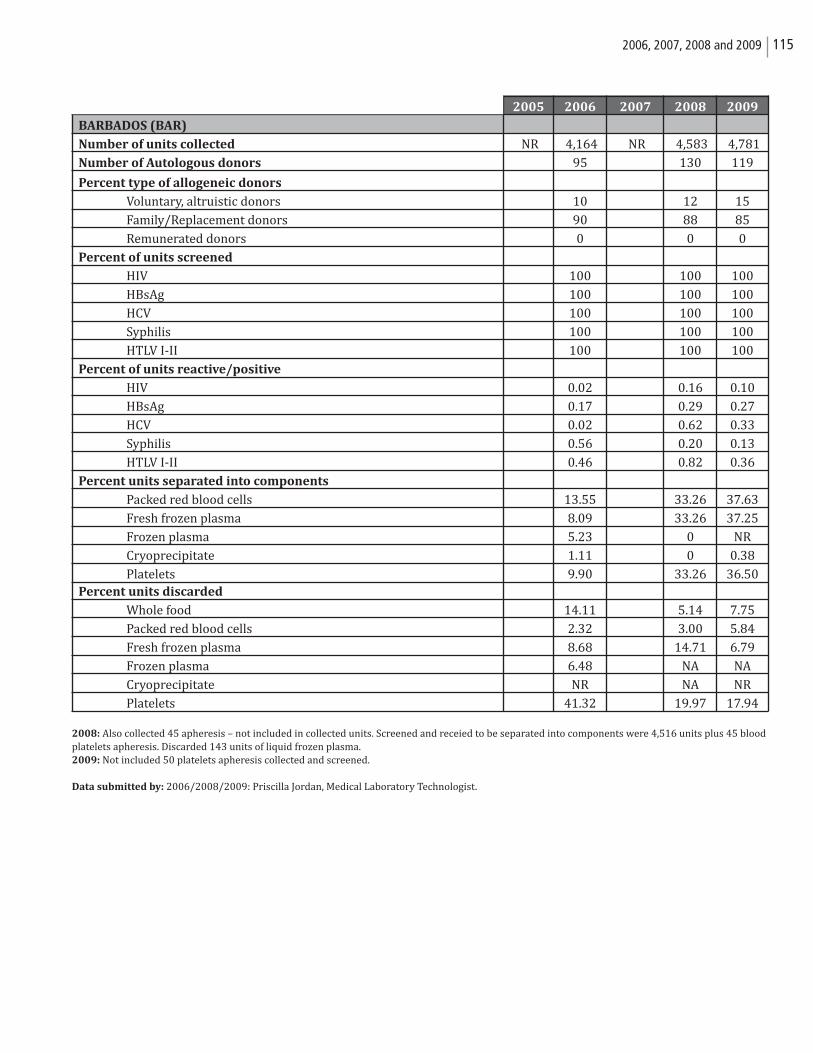
1152006, 2007, 2008 and 2009
2008: Also collected 45 apheresis – not included in collected units. Screened and receied to be separated into components were 4,516 units plus 45 bloodplatelets apheresis. Discarded 143 units of liquid frozen plasma.2009: Not included 50 platelets apheresis collected and screened.
Data submitted by: 2006/2008/2009: Priscilla Jordan, Medical Laboratory Technologist.
2005 2006 2007 2008 2009
BARBADOS (BAR)
Number of units collected NR 4,164 NR 4,583 4,781
Number of Autologous donors 95 130 119
Percent type of allogeneic donors
Voluntary, altruistic donors 10 12 15
Family/Replacement donors 90 88 85
Remunerated donors 0 0 0
Percent of units screened
HIV 100 100 100
HBsAg 100 100 100
HCV 100 100 100
Syphilis 100 100 100
HTLV I-II 100 100 100
Percent of units reactive/positive
HIV 0.02 0.16 0.10
HBsAg 0.17 0.29 0.27
HCV 0.02 0.62 0.33
Syphilis 0.56 0.20 0.13
HTLV I-II 0.46 0.82 0.36
Percent units separated into components
Packed red blood cells 13.55 33.26 37.63
Fresh frozen plasma 8.09 33.26 37.25
Frozen plasma 5.23 0 NR
Cryoprecipitate 1.11 0 0.38
Platelets 9.90 33.26 36.50Percent units discarded
Whole food 14.11 5.14 7.75
Packed red blood cells 2.32 3.00 5.84
Fresh frozen plasma 8.68 14.71 6.79
Frozen plasma 6.48 NA NA
Cryoprecipitate NR NA NR
Platelets 41.32 19.97 17.94
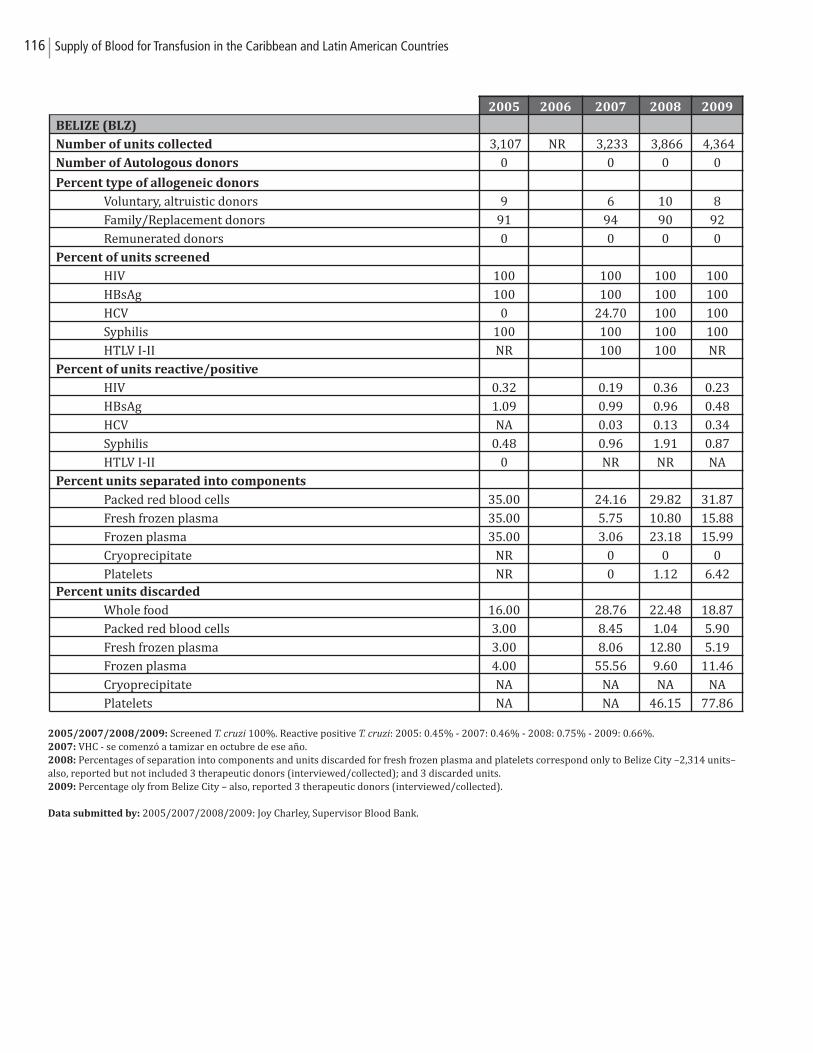
116 Supply of Blood for Transfusion in the Caribbean and Latin American Countries
2005/2007/2008/2009: Screened T. cruzi 100%. Reactive positive T. cruzi: 2005: 0.45% - 2007: 0.46% - 2008: 0.75% - 2009: 0.66%.2007: VHC - se comenzó a tamizar en octubre de ese año.2008: Percentages of separation into components and units discarded for fresh frozen plasma and platelets correspond only to Belize City –2,314 units–also, reported but not included 3 therapeutic donors (interviewed/collected); and 3 discarded units.2009: Percentage oly from Belize City – also, reported 3 therapeutic donors (interviewed/collected).
Data submitted by: 2005/2007/2008/2009: Joy Charley, Supervisor Blood Bank.
2005 2006 2007 2008 2009
BELIZE (BLZ)
Number of units collected 3,107 NR 3,233 3,866 4,364
Number of Autologous donors 0 0 0 0
Percent type of allogeneic donors
Voluntary, altruistic donors 9 6 10 8
Family/Replacement donors 91 94 90 92
Remunerated donors 0 0 0 0
Percent of units screened
HIV 100 100 100 100
HBsAg 100 100 100 100
HCV 0 24.70 100 100
Syphilis 100 100 100 100
HTLV I-II NR 100 100 NR
Percent of units reactive/positive
HIV 0.32 0.19 0.36 0.23
HBsAg 1.09 0.99 0.96 0.48
HCV NA 0.03 0.13 0.34
Syphilis 0.48 0.96 1.91 0.87
HTLV I-II 0 NR NR NA
Percent units separated into components
Packed red blood cells 35.00 24.16 29.82 31.87
Fresh frozen plasma 35.00 5.75 10.80 15.88
Frozen plasma 35.00 3.06 23.18 15.99
Cryoprecipitate NR 0 0 0
Platelets NR 0 1.12 6.42Percent units discarded
Whole food 16.00 28.76 22.48 18.87
Packed red blood cells 3.00 8.45 1.04 5.90
Fresh frozen plasma 3.00 8.06 12.80 5.19
Frozen plasma 4.00 55.56 9.60 11.46
Cryoprecipitate NA NA NA NA
Platelets NA NA 46.15 77.86
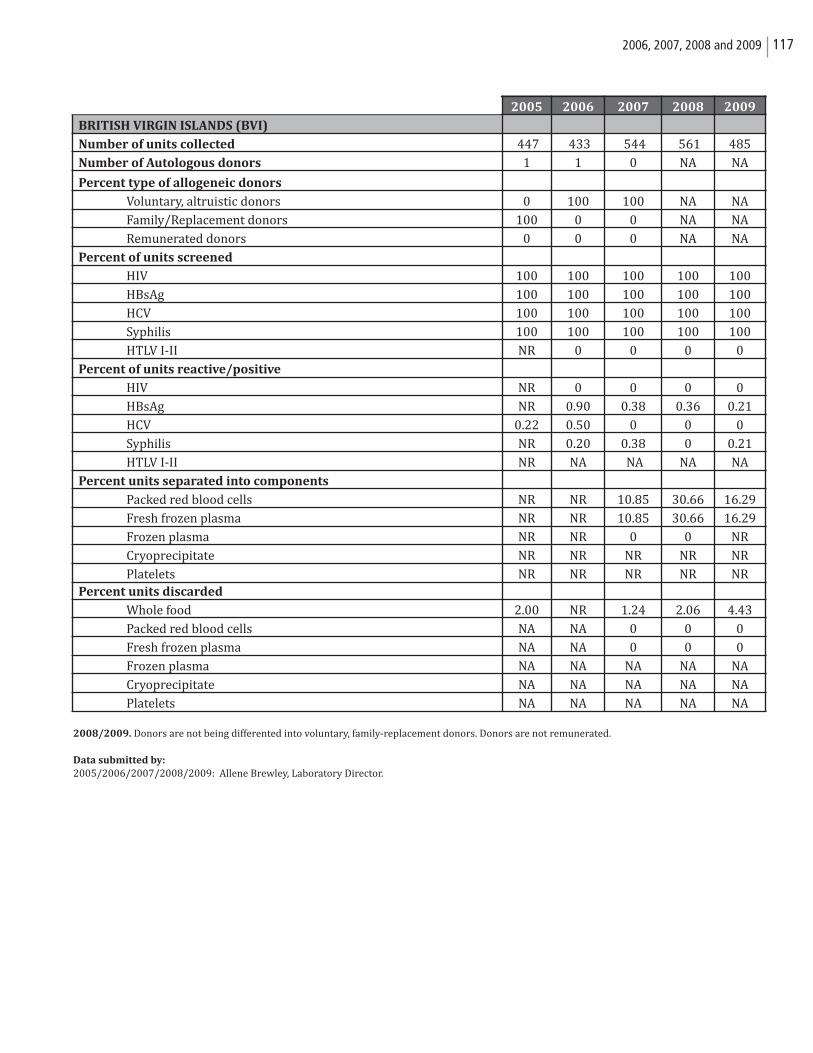
1172006, 2007, 2008 and 2009
2008/2009. Donors are not being differented into voluntary, family-replacement donors. Donors are not remunerated.
Data submitted by:
2005/2006/2007/2008/2009: Allene Brewley, Laboratory Director.
2005 2006 2007 2008 2009
BRITISH VIRGIN ISLANDS (BVI)
Number of units collected 447 433 544 561 485
Number of Autologous donors 1 1 0 NA NA
Percent type of allogeneic donors
Voluntary, altruistic donors 0 100 100 NA NA
Family/Replacement donors 100 0 0 NA NA
Remunerated donors 0 0 0 NA NA
Percent of units screened
HIV 100 100 100 100 100
HBsAg 100 100 100 100 100
HCV 100 100 100 100 100
Syphilis 100 100 100 100 100
HTLV I-II NR 0 0 0 0
Percent of units reactive/positive
HIV NR 0 0 0 0
HBsAg NR 0.90 0.38 0.36 0.21
HCV 0.22 0.50 0 0 0
Syphilis NR 0.20 0.38 0 0.21
HTLV I-II NR NA NA NA NA
Percent units separated into components
Packed red blood cells NR NR 10.85 30.66 16.29
Fresh frozen plasma NR NR 10.85 30.66 16.29
Frozen plasma NR NR 0 0 NR
Cryoprecipitate NR NR NR NR NR
Platelets NR NR NR NR NRPercent units discarded
Whole food 2.00 NR 1.24 2.06 4.43
Packed red blood cells NA NA 0 0 0
Fresh frozen plasma NA NA 0 0 0
Frozen plasma NA NA NA NA NA
Cryoprecipitate NA NA NA NA NA
Platelets NA NA NA NA NA
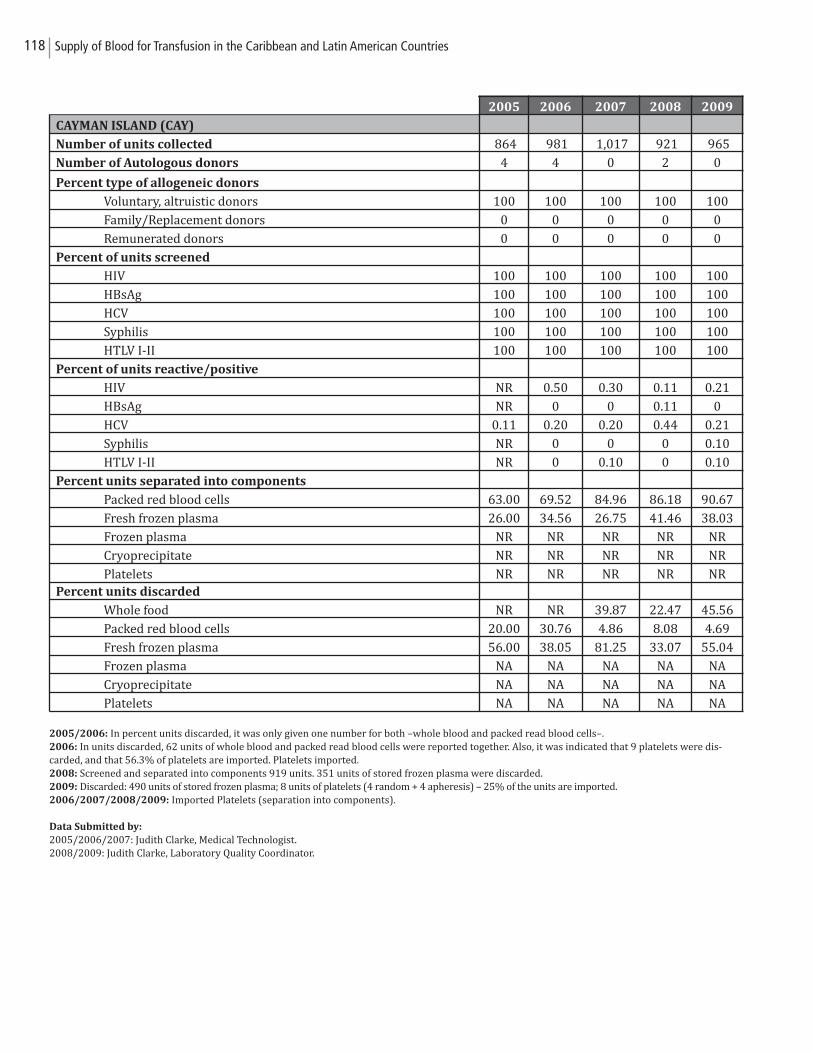
118 Supply of Blood for Transfusion in the Caribbean and Latin American Countries
2005/2006: In percent units discarded, it was only given one number for both –whole blood and packed read blood cells–.2006: In units discarded, 62 units of whole blood and packed read blood cells were reported together. Also, it was indicated that 9 platelets were dis-carded, and that 56.3% of platelets are imported. Platelets imported.2008: Screened and separated into components 919 units. 351 units of stored frozen plasma were discarded.2009: Discarded: 490 units of stored frozen plasma; 8 units of platelets (4 random + 4 apheresis) – 25% of the units are imported.2006/2007/2008/2009: Imported Platelets (separation into components).
Data Submitted by:
2005/2006/2007: Judith Clarke, Medical Technologist.2008/2009: Judith Clarke, Laboratory Quality Coordinator.
2005 2006 2007 2008 2009
CAYMAN ISLAND (CAY)
Number of units collected 864 981 1,017 921 965
Number of Autologous donors 4 4 0 2 0
Percent type of allogeneic donors
Voluntary, altruistic donors 100 100 100 100 100
Family/Replacement donors 0 0 0 0 0
Remunerated donors 0 0 0 0 0
Percent of units screened
HIV 100 100 100 100 100
HBsAg 100 100 100 100 100
HCV 100 100 100 100 100
Syphilis 100 100 100 100 100
HTLV I-II 100 100 100 100 100
Percent of units reactive/positive
HIV NR 0.50 0.30 0.11 0.21
HBsAg NR 0 0 0.11 0
HCV 0.11 0.20 0.20 0.44 0.21
Syphilis NR 0 0 0 0.10
HTLV I-II NR 0 0.10 0 0.10
Percent units separated into components
Packed red blood cells 63.00 69.52 84.96 86.18 90.67
Fresh frozen plasma 26.00 34.56 26.75 41.46 38.03
Frozen plasma NR NR NR NR NR
Cryoprecipitate NR NR NR NR NR
Platelets NR NR NR NR NRPercent units discarded
Whole food NR NR 39.87 22.47 45.56
Packed red blood cells 20.00 30.76 4.86 8.08 4.69
Fresh frozen plasma 56.00 38.05 81.25 33.07 55.04
Frozen plasma NA NA NA NA NA
Cryoprecipitate NA NA NA NA NA
Platelets NA NA NA NA NA
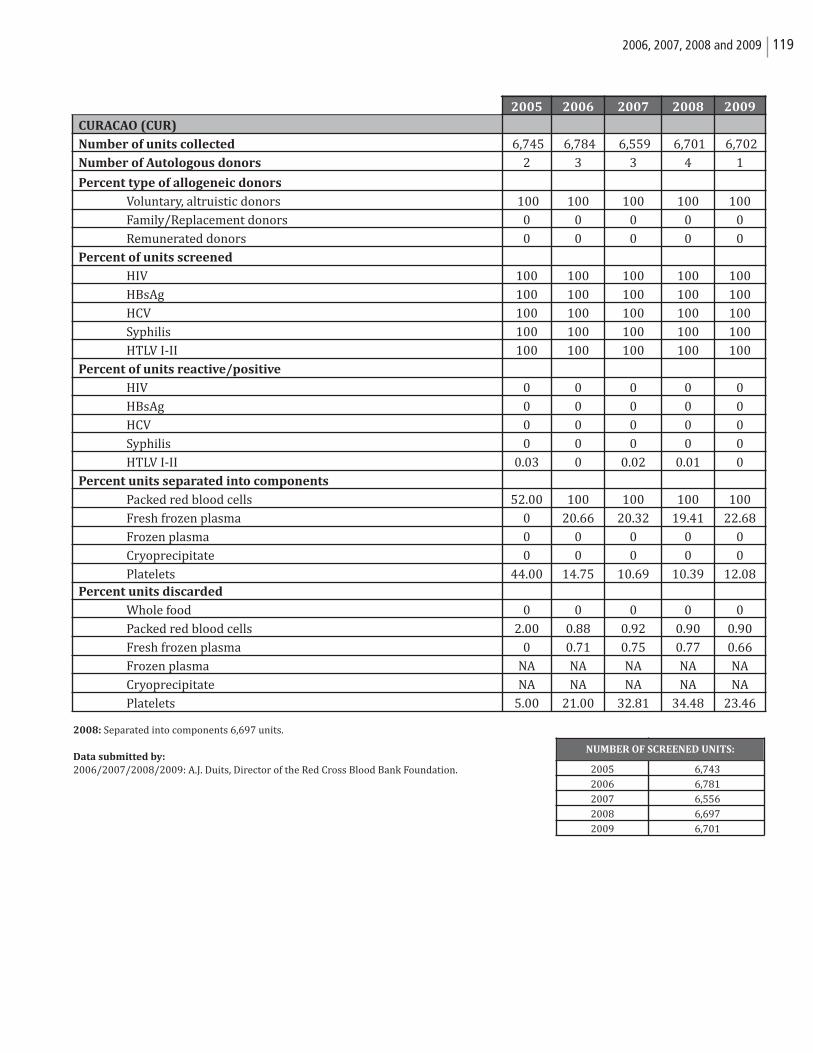
1192006, 2007, 2008 and 2009
2008: Separated into components 6,697 units.
Data submitted by:
2006/2007/2008/2009: A.J. Duits, Director of the Red Cross Blood Bank Foundation.
2005 2006 2007 2008 2009
CURACAO (CUR)
Number of units collected 6,745 6,784 6,559 6,701 6,702
Number of Autologous donors 2 3 3 4 1
Percent type of allogeneic donors
Voluntary, altruistic donors 100 100 100 100 100
Family/Replacement donors 0 0 0 0 0
Remunerated donors 0 0 0 0 0
Percent of units screened
HIV 100 100 100 100 100
HBsAg 100 100 100 100 100
HCV 100 100 100 100 100
Syphilis 100 100 100 100 100
HTLV I-II 100 100 100 100 100
Percent of units reactive/positive
HIV 0 0 0 0 0
HBsAg 0 0 0 0 0
HCV 0 0 0 0 0
Syphilis 0 0 0 0 0
HTLV I-II 0.03 0 0.02 0.01 0
Percent units separated into components
Packed red blood cells 52.00 100 100 100 100
Fresh frozen plasma 0 20.66 20.32 19.41 22.68
Frozen plasma 0 0 0 0 0
Cryoprecipitate 0 0 0 0 0
Platelets 44.00 14.75 10.69 10.39 12.08Percent units discarded
Whole food 0 0 0 0 0
Packed red blood cells 2.00 0.88 0.92 0.90 0.90
Fresh frozen plasma 0 0.71 0.75 0.77 0.66
Frozen plasma NA NA NA NA NA
Cryoprecipitate NA NA NA NA NA
Platelets 5.00 21.00 32.81 34.48 23.46
2005 6,743
2006 6,781
2007 6,556
2008 6,697
2009 6,701
NUMBER OF SCREENED UNITS:
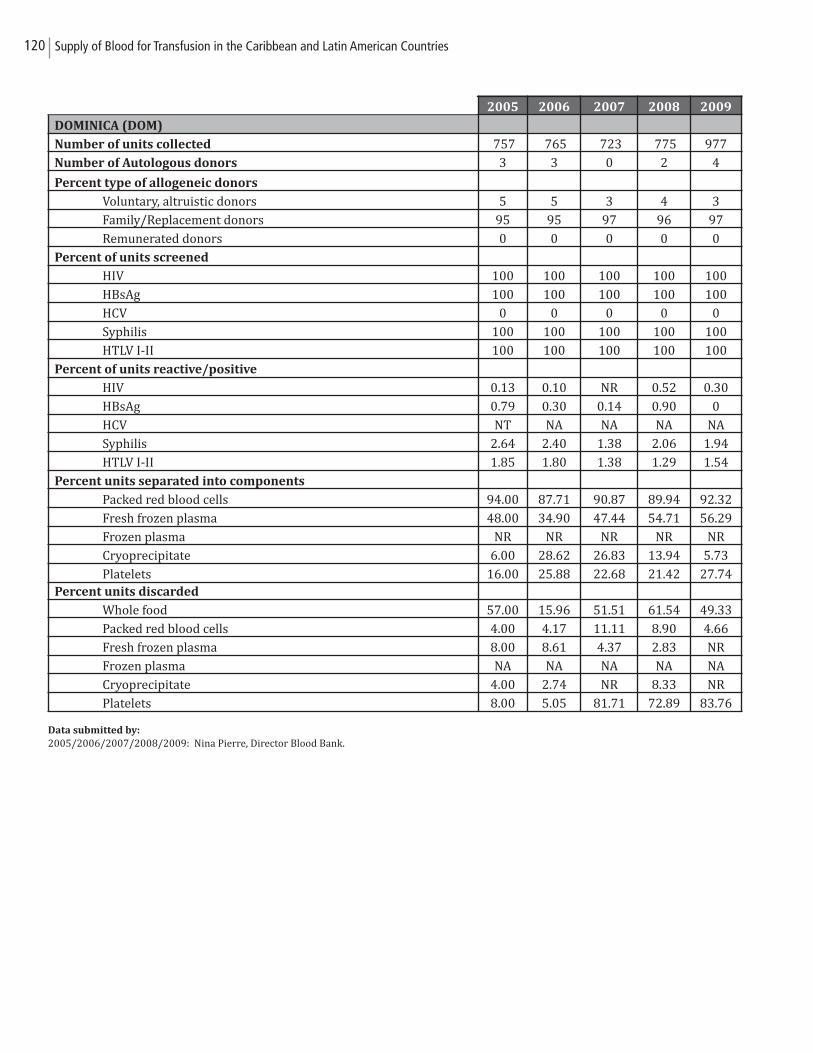
120 Supply of Blood for Transfusion in the Caribbean and Latin American Countries
Data submitted by:
2005/2006/2007/2008/2009: Nina Pierre, Director Blood Bank.
2005 2006 2007 2008 2009
DOMINICA (DOM)
Number of units collected 757 765 723 775 977
Number of Autologous donors 3 3 0 2 4
Percent type of allogeneic donors
Voluntary, altruistic donors 5 5 3 4 3
Family/Replacement donors 95 95 97 96 97
Remunerated donors 0 0 0 0 0
Percent of units screened
HIV 100 100 100 100 100
HBsAg 100 100 100 100 100
HCV 0 0 0 0 0
Syphilis 100 100 100 100 100
HTLV I-II 100 100 100 100 100
Percent of units reactive/positive
HIV 0.13 0.10 NR 0.52 0.30
HBsAg 0.79 0.30 0.14 0.90 0
HCV NT NA NA NA NA
Syphilis 2.64 2.40 1.38 2.06 1.94
HTLV I-II 1.85 1.80 1.38 1.29 1.54
Percent units separated into components
Packed red blood cells 94.00 87.71 90.87 89.94 92.32
Fresh frozen plasma 48.00 34.90 47.44 54.71 56.29
Frozen plasma NR NR NR NR NR
Cryoprecipitate 6.00 28.62 26.83 13.94 5.73
Platelets 16.00 25.88 22.68 21.42 27.74Percent units discarded
Whole food 57.00 15.96 51.51 61.54 49.33
Packed red blood cells 4.00 4.17 11.11 8.90 4.66
Fresh frozen plasma 8.00 8.61 4.37 2.83 NR
Frozen plasma NA NA NA NA NA
Cryoprecipitate 4.00 2.74 NR 8.33 NR
Platelets 8.00 5.05 81.71 72.89 83.76
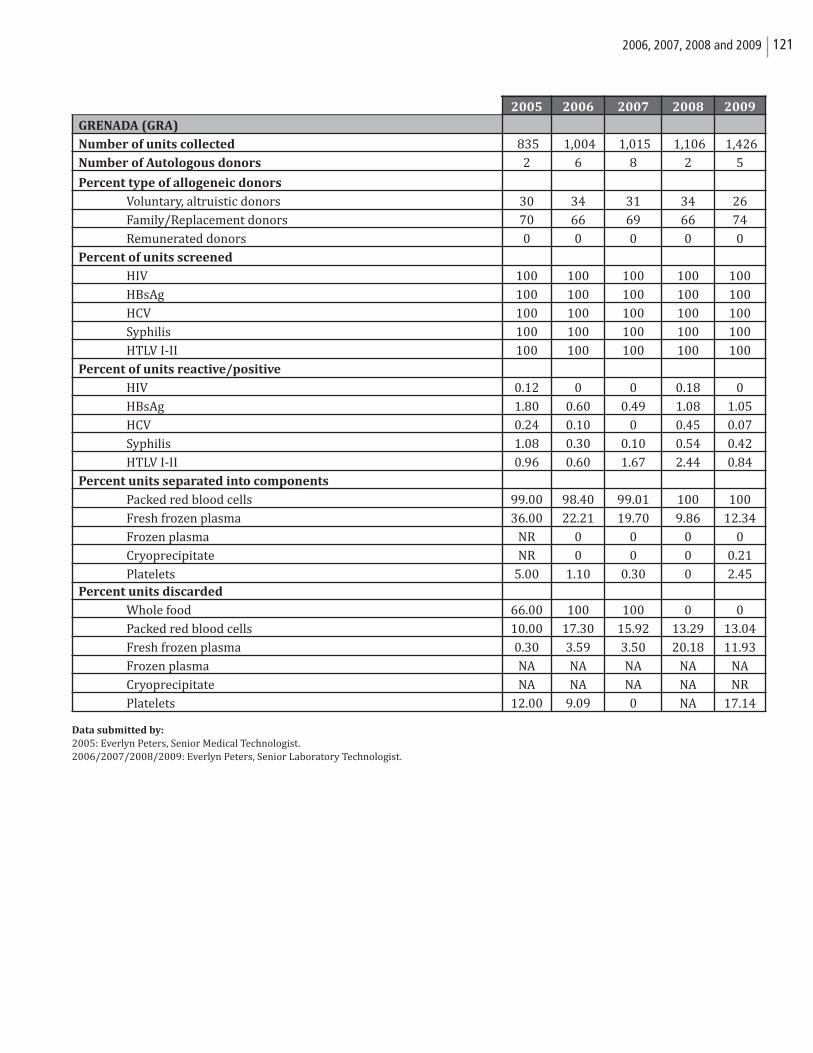
1212006, 2007, 2008 and 2009
Data submitted by:
2005: Everlyn Peters, Senior Medical Technologist.2006/2007/2008/2009: Everlyn Peters, Senior Laboratory Technologist.
2005 2006 2007 2008 2009
GRENADA (GRA)
Number of units collected 835 1,004 1,015 1,106 1,426
Number of Autologous donors 2 6 8 2 5
Percent type of allogeneic donors
Voluntary, altruistic donors 30 34 31 34 26
Family/Replacement donors 70 66 69 66 74
Remunerated donors 0 0 0 0 0
Percent of units screened
HIV 100 100 100 100 100
HBsAg 100 100 100 100 100
HCV 100 100 100 100 100
Syphilis 100 100 100 100 100
HTLV I-II 100 100 100 100 100
Percent of units reactive/positive
HIV 0.12 0 0 0.18 0
HBsAg 1.80 0.60 0.49 1.08 1.05
HCV 0.24 0.10 0 0.45 0.07
Syphilis 1.08 0.30 0.10 0.54 0.42
HTLV I-II 0.96 0.60 1.67 2.44 0.84
Percent units separated into components
Packed red blood cells 99.00 98.40 99.01 100 100
Fresh frozen plasma 36.00 22.21 19.70 9.86 12.34
Frozen plasma NR 0 0 0 0
Cryoprecipitate NR 0 0 0 0.21
Platelets 5.00 1.10 0.30 0 2.45Percent units discarded
Whole food 66.00 100 100 0 0
Packed red blood cells 10.00 17.30 15.92 13.29 13.04
Fresh frozen plasma 0.30 3.59 3.50 20.18 11.93
Frozen plasma NA NA NA NA NA
Cryoprecipitate NA NA NA NA NR
Platelets 12.00 9.09 0 NA 17.14
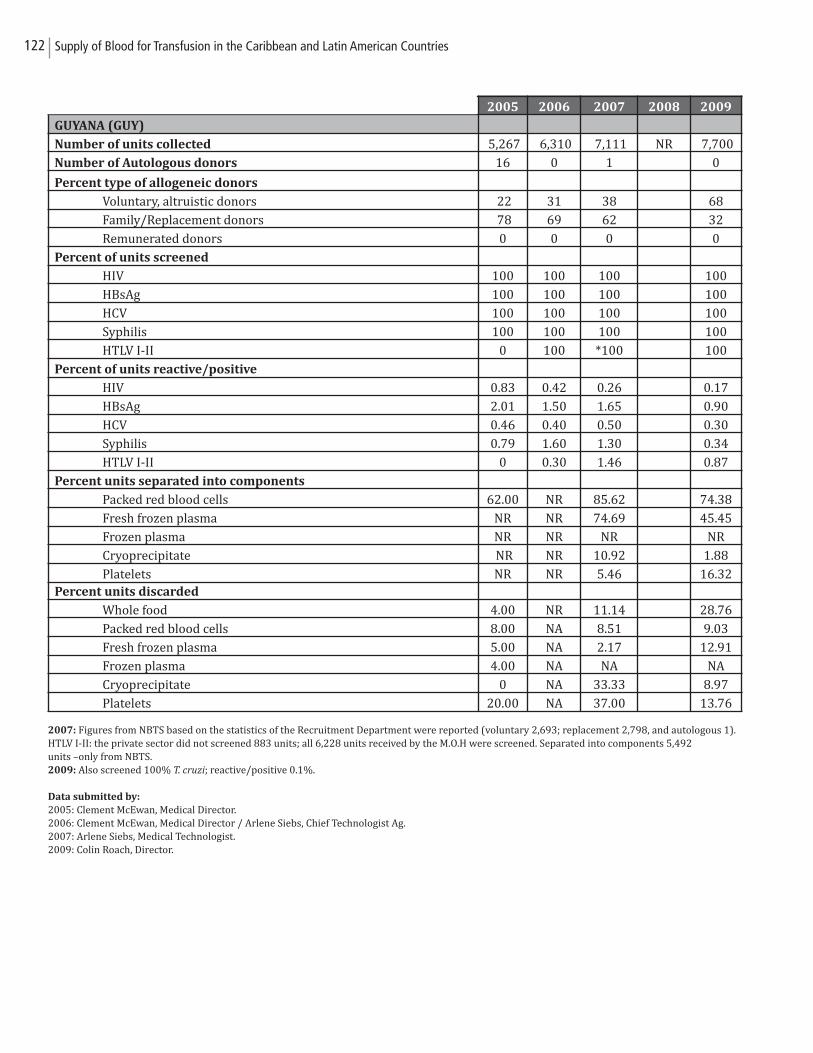
122 Supply of Blood for Transfusion in the Caribbean and Latin American Countries
2007: Figures from NBTS based on the statistics of the Recruitment Department were reported (voluntary 2,693; replacement 2,798, and autologous 1).HTLV I-II: the private sector did not screened 883 units; all 6,228 units received by the M.O.H were screened. Separated into components 5,492units –only from NBTS.2009: Also screened 100% T. cruzi; reactive/positive 0.1%.
Data submitted by:
2005: Clement McEwan, Medical Director.2006: Clement McEwan, Medical Director / Arlene Siebs, Chief Technologist Ag. 2007: Arlene Siebs, Medical Technologist.2009: Colin Roach, Director.
2005 2006 2007 2008 2009
GUYANA (GUY)
Number of units collected 5,267 6,310 7,111 NR 7,700
Number of Autologous donors 16 0 1 0
Percent type of allogeneic donors
Voluntary, altruistic donors 22 31 38 68
Family/Replacement donors 78 69 62 32
Remunerated donors 0 0 0 0
Percent of units screened
HIV 100 100 100 100
HBsAg 100 100 100 100
HCV 100 100 100 100
Syphilis 100 100 100 100
HTLV I-II 0 100 *100 100
Percent of units reactive/positive
HIV 0.83 0.42 0.26 0.17
HBsAg 2.01 1.50 1.65 0.90
HCV 0.46 0.40 0.50 0.30
Syphilis 0.79 1.60 1.30 0.34
HTLV I-II 0 0.30 1.46 0.87
Percent units separated into components
Packed red blood cells 62.00 NR 85.62 74.38
Fresh frozen plasma NR NR 74.69 45.45
Frozen plasma NR NR NR NR
Cryoprecipitate NR NR 10.92 1.88
Platelets NR NR 5.46 16.32Percent units discarded
Whole food 4.00 NR 11.14 28.76
Packed red blood cells 8.00 NA 8.51 9.03
Fresh frozen plasma 5.00 NA 2.17 12.91
Frozen plasma 4.00 NA NA NA
Cryoprecipitate 0 NA 33.33 8.97
Platelets 20.00 NA 37.00 13.76
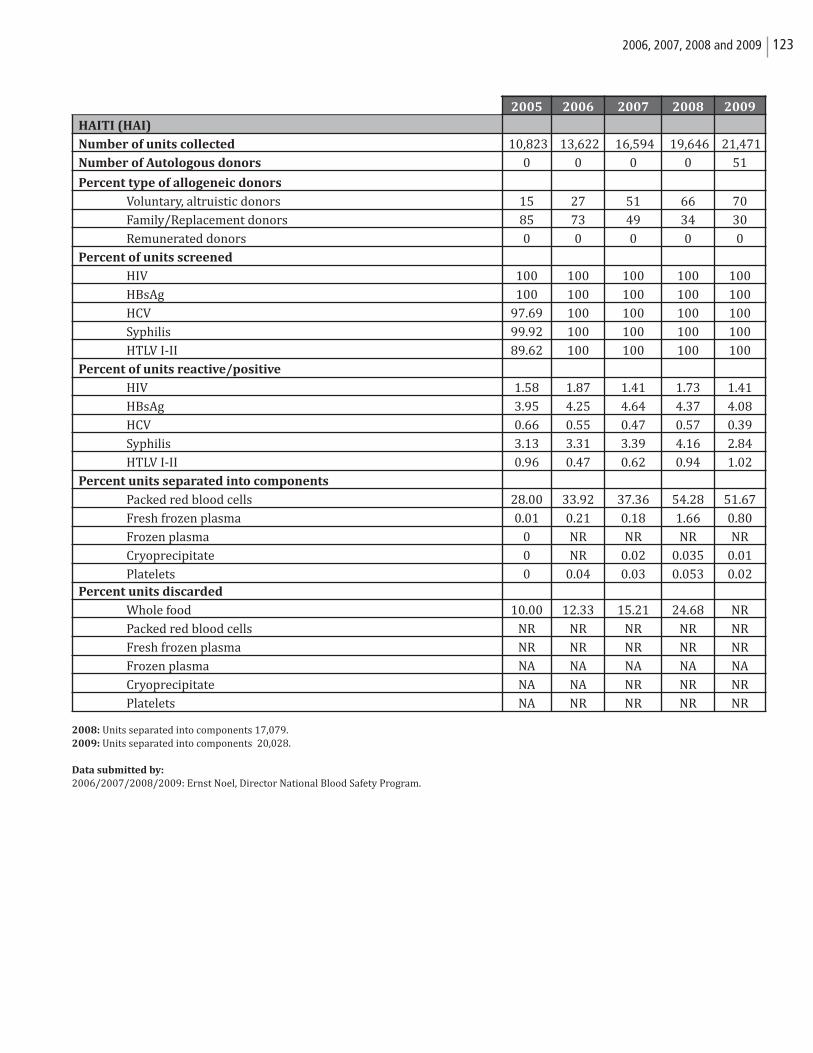
1232006, 2007, 2008 and 2009
2008: Units separated into components 17,079.2009: Units separated into components 20,028.
Data submitted by:
2006/2007/2008/2009: Ernst Noel, Director National Blood Safety Program.
2005 2006 2007 2008 2009
HAITI (HAI)
Number of units collected 10,823 13,622 16,594 19,646 21,471
Number of Autologous donors 0 0 0 0 51
Percent type of allogeneic donors
Voluntary, altruistic donors 15 27 51 66 70
Family/Replacement donors 85 73 49 34 30
Remunerated donors 0 0 0 0 0
Percent of units screened
HIV 100 100 100 100 100
HBsAg 100 100 100 100 100
HCV 97.69 100 100 100 100
Syphilis 99.92 100 100 100 100
HTLV I-II 89.62 100 100 100 100
Percent of units reactive/positive
HIV 1.58 1.87 1.41 1.73 1.41
HBsAg 3.95 4.25 4.64 4.37 4.08
HCV 0.66 0.55 0.47 0.57 0.39
Syphilis 3.13 3.31 3.39 4.16 2.84
HTLV I-II 0.96 0.47 0.62 0.94 1.02
Percent units separated into components
Packed red blood cells 28.00 33.92 37.36 54.28 51.67
Fresh frozen plasma 0.01 0.21 0.18 1.66 0.80
Frozen plasma 0 NR NR NR NR
Cryoprecipitate 0 NR 0.02 0.035 0.01
Platelets 0 0.04 0.03 0.053 0.02Percent units discarded
Whole food 10.00 12.33 15.21 24.68 NR
Packed red blood cells NR NR NR NR NR
Fresh frozen plasma NR NR NR NR NR
Frozen plasma NA NA NA NA NA
Cryoprecipitate NA NA NR NR NR
Platelets NA NR NR NR NR
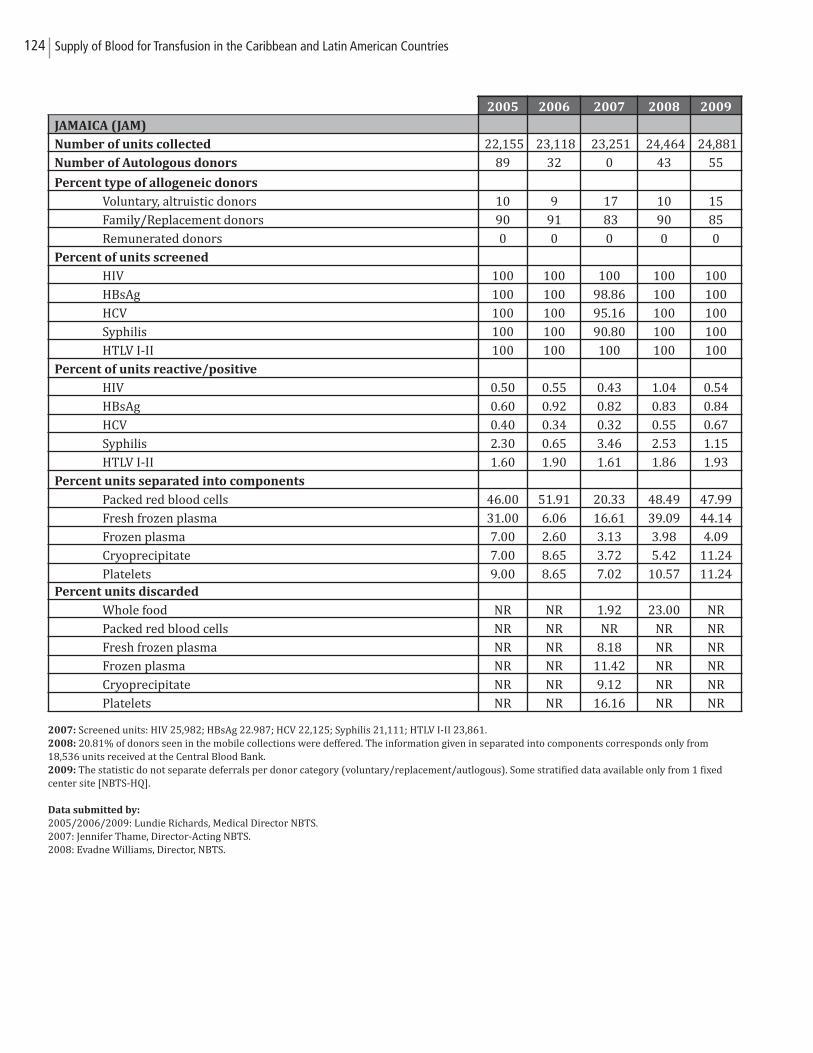
124 Supply of Blood for Transfusion in the Caribbean and Latin American Countries
2007: Screened units: HIV 25,982; HBsAg 22.987; HCV 22,125; Syphilis 21,111; HTLV I-II 23,861.2008: 20.81% of donors seen in the mobile collections were deffered. The information given in separated into components corresponds only from18,536 units received at the Central Blood Bank.2009: The statistic do not separate deferrals per donor category (voluntary/replacement/autlogous). Some stratified data available only from 1 fixedcenter site [NBTS-HQ].
Data submitted by:
2005/2006/2009: Lundie Richards, Medical Director NBTS.2007: Jennifer Thame, Director-Acting NBTS.2008: Evadne Williams, Director, NBTS.
2005 2006 2007 2008 2009
JAMAICA (JAM)
Number of units collected 22,155 23,118 23,251 24,464 24,881
Number of Autologous donors 89 32 0 43 55
Percent type of allogeneic donors
Voluntary, altruistic donors 10 9 17 10 15
Family/Replacement donors 90 91 83 90 85
Remunerated donors 0 0 0 0 0
Percent of units screened
HIV 100 100 100 100 100
HBsAg 100 100 98.86 100 100
HCV 100 100 95.16 100 100
Syphilis 100 100 90.80 100 100
HTLV I-II 100 100 100 100 100
Percent of units reactive/positive
HIV 0.50 0.55 0.43 1.04 0.54
HBsAg 0.60 0.92 0.82 0.83 0.84
HCV 0.40 0.34 0.32 0.55 0.67
Syphilis 2.30 0.65 3.46 2.53 1.15
HTLV I-II 1.60 1.90 1.61 1.86 1.93
Percent units separated into components
Packed red blood cells 46.00 51.91 20.33 48.49 47.99
Fresh frozen plasma 31.00 6.06 16.61 39.09 44.14
Frozen plasma 7.00 2.60 3.13 3.98 4.09
Cryoprecipitate 7.00 8.65 3.72 5.42 11.24
Platelets 9.00 8.65 7.02 10.57 11.24Percent units discarded
Whole food NR NR 1.92 23.00 NR
Packed red blood cells NR NR NR NR NR
Fresh frozen plasma NR NR 8.18 NR NR
Frozen plasma NR NR 11.42 NR NR
Cryoprecipitate NR NR 9.12 NR NR
Platelets NR NR 16.16 NR NR
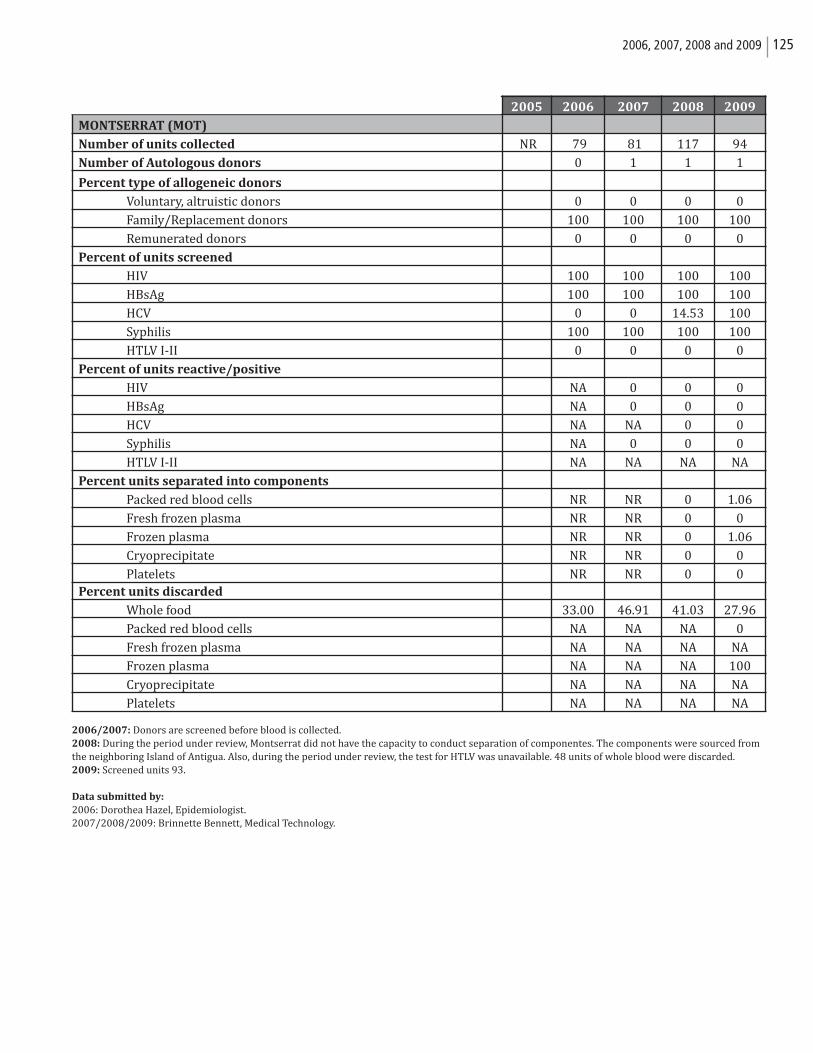
1252006, 2007, 2008 and 2009
2006/2007: Donors are screened before blood is collected. 2008: During the period under review, Montserrat did not have the capacity to conduct separation of componentes. The components were sourced fromthe neighboring Island of Antigua. Also, during the period under review, the test for HTLV was unavailable. 48 units of whole blood were discarded.2009: Screened units 93.
Data submitted by:
2006: Dorothea Hazel, Epidemiologist.2007/2008/2009: Brinnette Bennett, Medical Technology.
2005 2006 2007 2008 2009
MONTSERRAT (MOT)
Number of units collected NR 79 81 117 94
Number of Autologous donors 0 1 1 1
Percent type of allogeneic donors
Voluntary, altruistic donors 0 0 0 0
Family/Replacement donors 100 100 100 100
Remunerated donors 0 0 0 0
Percent of units screened
HIV 100 100 100 100
HBsAg 100 100 100 100
HCV 0 0 14.53 100
Syphilis 100 100 100 100
HTLV I-II 0 0 0 0
Percent of units reactive/positive
HIV NA 0 0 0
HBsAg NA 0 0 0
HCV NA NA 0 0
Syphilis NA 0 0 0
HTLV I-II NA NA NA NA
Percent units separated into components
Packed red blood cells NR NR 0 1.06
Fresh frozen plasma NR NR 0 0
Frozen plasma NR NR 0 1.06
Cryoprecipitate NR NR 0 0
Platelets NR NR 0 0Percent units discarded
Whole food 33.00 46.91 41.03 27.96
Packed red blood cells NA NA NA 0
Fresh frozen plasma NA NA NA NA
Frozen plasma NA NA NA 100
Cryoprecipitate NA NA NA NA
Platelets NA NA NA NA
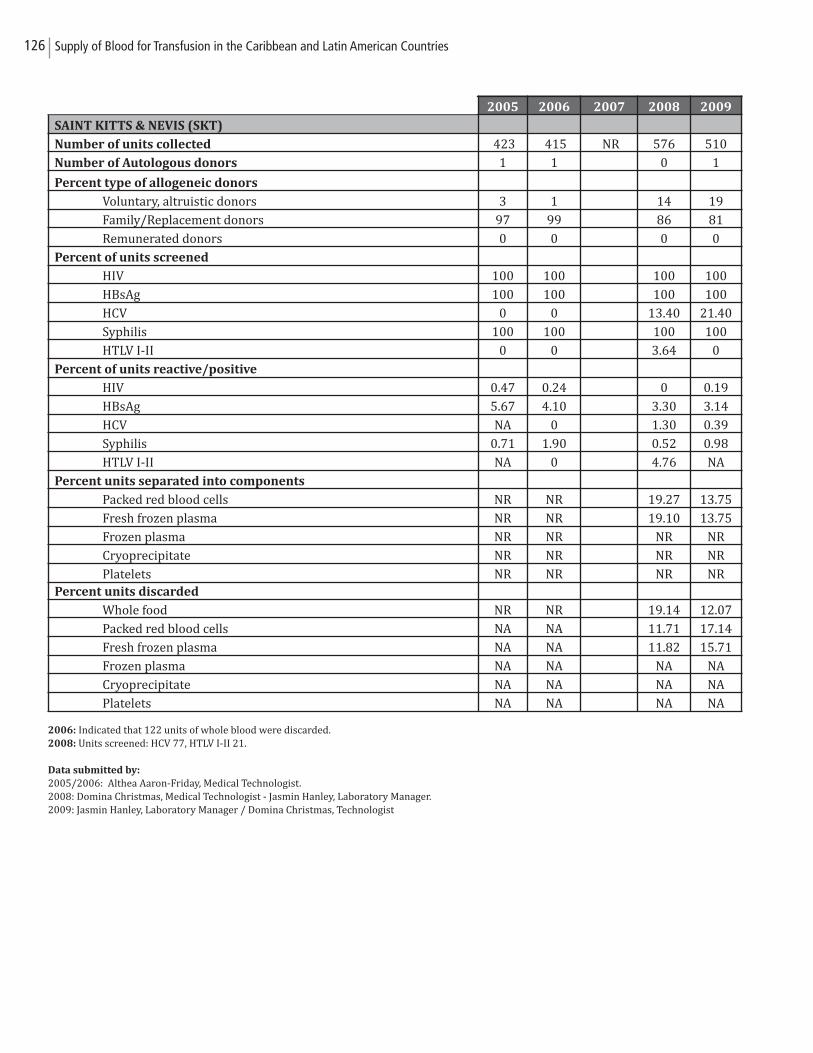
126 Supply of Blood for Transfusion in the Caribbean and Latin American Countries
2006: Indicated that 122 units of whole blood were discarded.2008: Units screened: HCV 77, HTLV I-II 21.
Data submitted by:
2005/2006: Althea Aaron-Friday, Medical Technologist.2008: Domina Christmas, Medical Technologist - Jasmin Hanley, Laboratory Manager.2009: Jasmin Hanley, Laboratory Manager / Domina Christmas, Technologist
2005 2006 2007 2008 2009
SAINT KITTS & NEVIS (SKT)
Number of units collected 423 415 NR 576 510
Number of Autologous donors 1 1 0 1
Percent type of allogeneic donors
Voluntary, altruistic donors 3 1 14 19
Family/Replacement donors 97 99 86 81
Remunerated donors 0 0 0 0
Percent of units screened
HIV 100 100 100 100
HBsAg 100 100 100 100
HCV 0 0 13.40 21.40
Syphilis 100 100 100 100
HTLV I-II 0 0 3.64 0
Percent of units reactive/positive
HIV 0.47 0.24 0 0.19
HBsAg 5.67 4.10 3.30 3.14
HCV NA 0 1.30 0.39
Syphilis 0.71 1.90 0.52 0.98
HTLV I-II NA 0 4.76 NA
Percent units separated into components
Packed red blood cells NR NR 19.27 13.75
Fresh frozen plasma NR NR 19.10 13.75
Frozen plasma NR NR NR NR
Cryoprecipitate NR NR NR NR
Platelets NR NR NR NRPercent units discarded
Whole food NR NR 19.14 12.07
Packed red blood cells NA NA 11.71 17.14
Fresh frozen plasma NA NA 11.82 15.71
Frozen plasma NA NA NA NA
Cryoprecipitate NA NA NA NA
Platelets NA NA NA NA
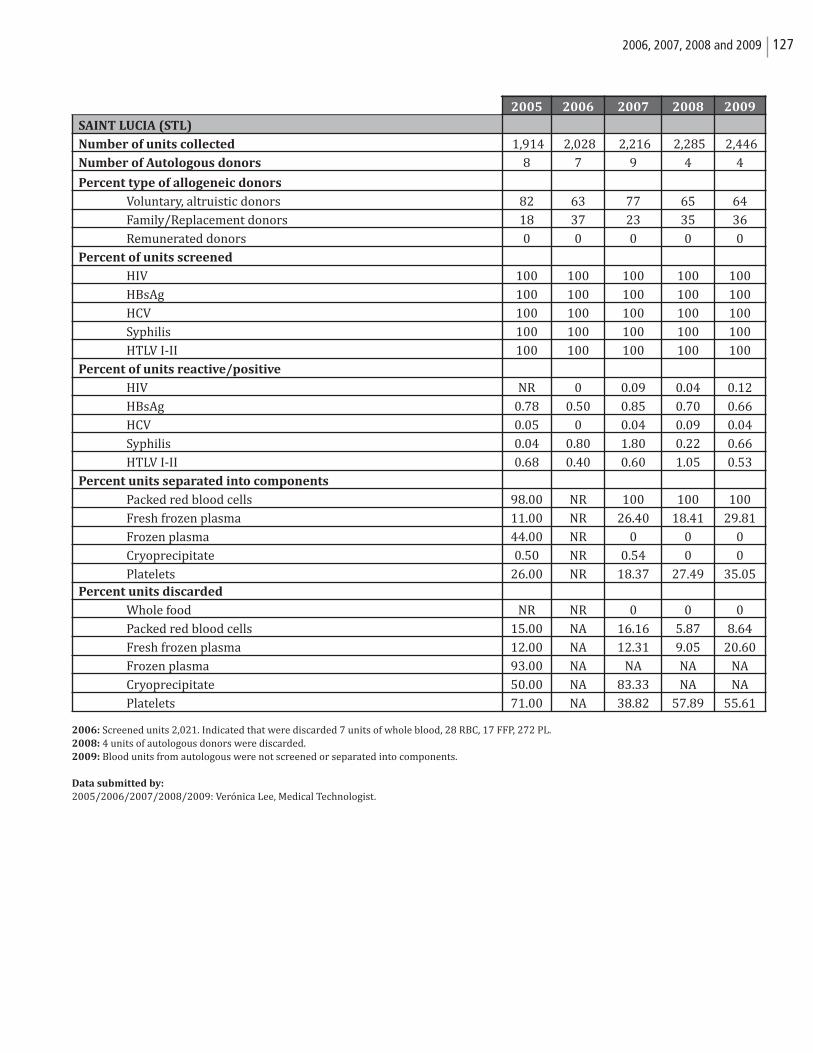
1272006, 2007, 2008 and 2009
2006: Screened units 2,021. Indicated that were discarded 7 units of whole blood, 28 RBC, 17 FFP, 272 PL. 2008: 4 units of autologous donors were discarded.2009: Blood units from autologous were not screened or separated into components.
Data submitted by:
2005/2006/2007/2008/2009: Verónica Lee, Medical Technologist.
2005 2006 2007 2008 2009
SAINT LUCIA (STL)
Number of units collected 1,914 2,028 2,216 2,285 2,446
Number of Autologous donors 8 7 9 4 4
Percent type of allogeneic donors
Voluntary, altruistic donors 82 63 77 65 64
Family/Replacement donors 18 37 23 35 36
Remunerated donors 0 0 0 0 0
Percent of units screened
HIV 100 100 100 100 100
HBsAg 100 100 100 100 100
HCV 100 100 100 100 100
Syphilis 100 100 100 100 100
HTLV I-II 100 100 100 100 100
Percent of units reactive/positive
HIV NR 0 0.09 0.04 0.12
HBsAg 0.78 0.50 0.85 0.70 0.66
HCV 0.05 0 0.04 0.09 0.04
Syphilis 0.04 0.80 1.80 0.22 0.66
HTLV I-II 0.68 0.40 0.60 1.05 0.53
Percent units separated into components
Packed red blood cells 98.00 NR 100 100 100
Fresh frozen plasma 11.00 NR 26.40 18.41 29.81
Frozen plasma 44.00 NR 0 0 0
Cryoprecipitate 0.50 NR 0.54 0 0
Platelets 26.00 NR 18.37 27.49 35.05Percent units discarded
Whole food NR NR 0 0 0
Packed red blood cells 15.00 NA 16.16 5.87 8.64
Fresh frozen plasma 12.00 NA 12.31 9.05 20.60
Frozen plasma 93.00 NA NA NA NA
Cryoprecipitate 50.00 NA 83.33 NA NA
Platelets 71.00 NA 38.82 57.89 55.61
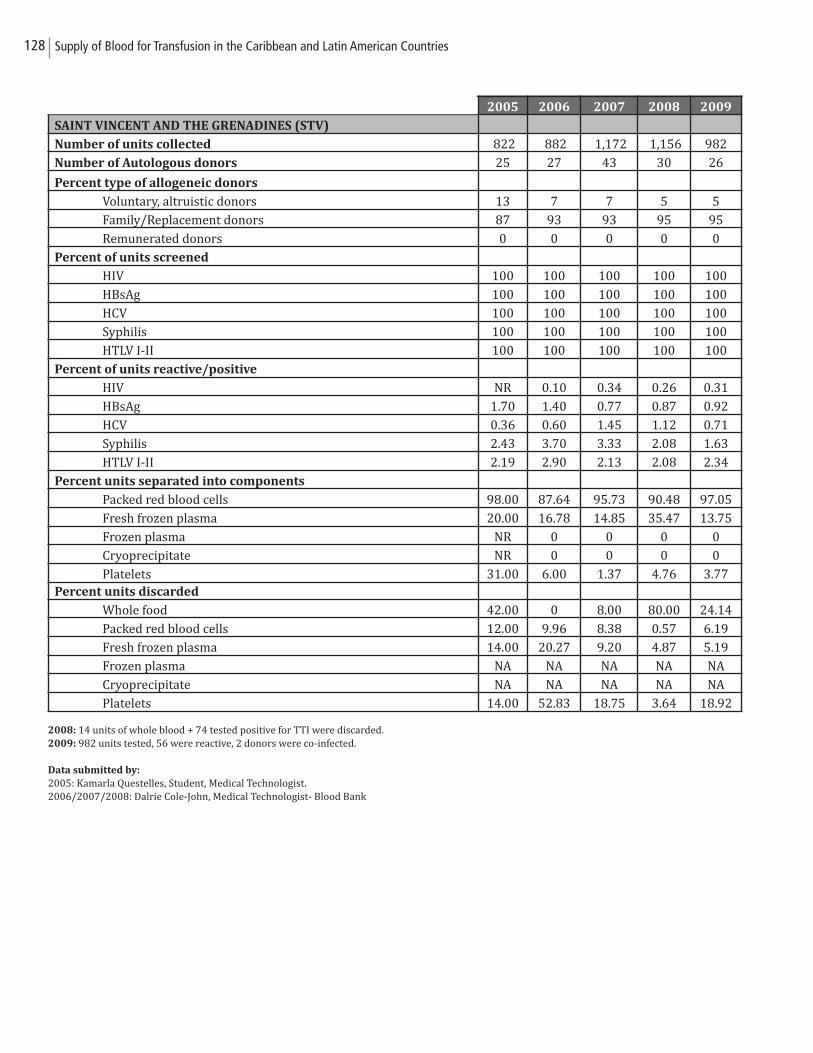
128 Supply of Blood for Transfusion in the Caribbean and Latin American Countries
2008: 14 units of whole blood + 74 tested positive for TTI were discarded.2009: 982 units tested, 56 were reactive, 2 donors were co-infected.
Data submitted by:
2005: Kamarla Questelles, Student, Medical Technologist.2006/2007/2008: Dalrie Cole-John, Medical Technologist- Blood Bank
2005 2006 2007 2008 2009
SAINT VINCENT AND THE GRENADINES (STV)
Number of units collected 822 882 1,172 1,156 982
Number of Autologous donors 25 27 43 30 26
Percent type of allogeneic donors
Voluntary, altruistic donors 13 7 7 5 5
Family/Replacement donors 87 93 93 95 95
Remunerated donors 0 0 0 0 0
Percent of units screened
HIV 100 100 100 100 100
HBsAg 100 100 100 100 100
HCV 100 100 100 100 100
Syphilis 100 100 100 100 100
HTLV I-II 100 100 100 100 100
Percent of units reactive/positive
HIV NR 0.10 0.34 0.26 0.31
HBsAg 1.70 1.40 0.77 0.87 0.92
HCV 0.36 0.60 1.45 1.12 0.71
Syphilis 2.43 3.70 3.33 2.08 1.63
HTLV I-II 2.19 2.90 2.13 2.08 2.34
Percent units separated into components
Packed red blood cells 98.00 87.64 95.73 90.48 97.05
Fresh frozen plasma 20.00 16.78 14.85 35.47 13.75
Frozen plasma NR 0 0 0 0
Cryoprecipitate NR 0 0 0 0
Platelets 31.00 6.00 1.37 4.76 3.77Percent units discarded
Whole food 42.00 0 8.00 80.00 24.14
Packed red blood cells 12.00 9.96 8.38 0.57 6.19
Fresh frozen plasma 14.00 20.27 9.20 4.87 5.19
Frozen plasma NA NA NA NA NA
Cryoprecipitate NA NA NA NA NA
Platelets 14.00 52.83 18.75 3.64 18.92
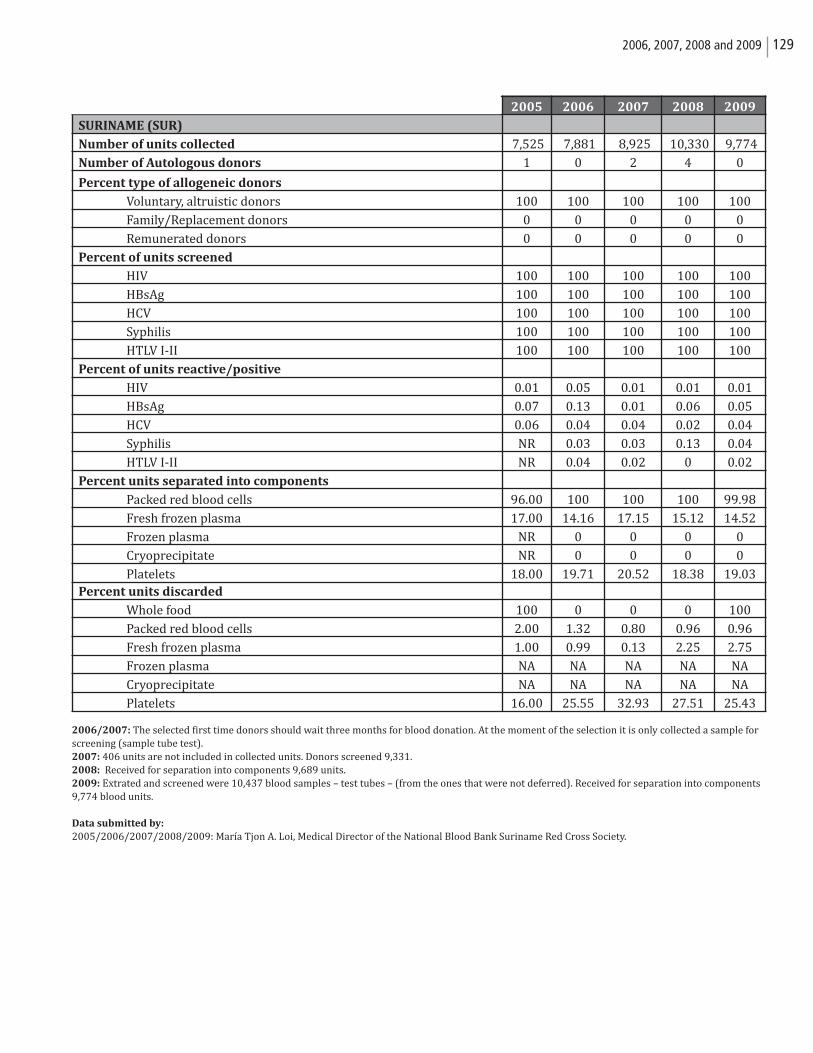
1292006, 2007, 2008 and 2009
2006/2007: The selected first time donors should wait three months for blood donation. At the moment of the selection it is only collected a sample forscreening (sample tube test). 2007: 406 units are not included in collected units. Donors screened 9,331.2008: Received for separation into components 9,689 units.2009: Extrated and screened were 10,437 blood samples – test tubes – (from the ones that were not deferred). Received for separation into components9,774 blood units.
Data submitted by:
2005/2006/2007/2008/2009: María Tjon A. Loi, Medical Director of the National Blood Bank Suriname Red Cross Society.
2005 2006 2007 2008 2009
SURINAME (SUR)
Number of units collected 7,525 7,881 8,925 10,330 9,774
Number of Autologous donors 1 0 2 4 0
Percent type of allogeneic donors
Voluntary, altruistic donors 100 100 100 100 100
Family/Replacement donors 0 0 0 0 0
Remunerated donors 0 0 0 0 0
Percent of units screened
HIV 100 100 100 100 100
HBsAg 100 100 100 100 100
HCV 100 100 100 100 100
Syphilis 100 100 100 100 100
HTLV I-II 100 100 100 100 100
Percent of units reactive/positive
HIV 0.01 0.05 0.01 0.01 0.01
HBsAg 0.07 0.13 0.01 0.06 0.05
HCV 0.06 0.04 0.04 0.02 0.04
Syphilis NR 0.03 0.03 0.13 0.04
HTLV I-II NR 0.04 0.02 0 0.02
Percent units separated into components
Packed red blood cells 96.00 100 100 100 99.98
Fresh frozen plasma 17.00 14.16 17.15 15.12 14.52
Frozen plasma NR 0 0 0 0
Cryoprecipitate NR 0 0 0 0
Platelets 18.00 19.71 20.52 18.38 19.03Percent units discarded
Whole food 100 0 0 0 100
Packed red blood cells 2.00 1.32 0.80 0.96 0.96
Fresh frozen plasma 1.00 0.99 0.13 2.25 2.75
Frozen plasma NA NA NA NA NA
Cryoprecipitate NA NA NA NA NA
Platelets 16.00 25.55 32.93 27.51 25.43
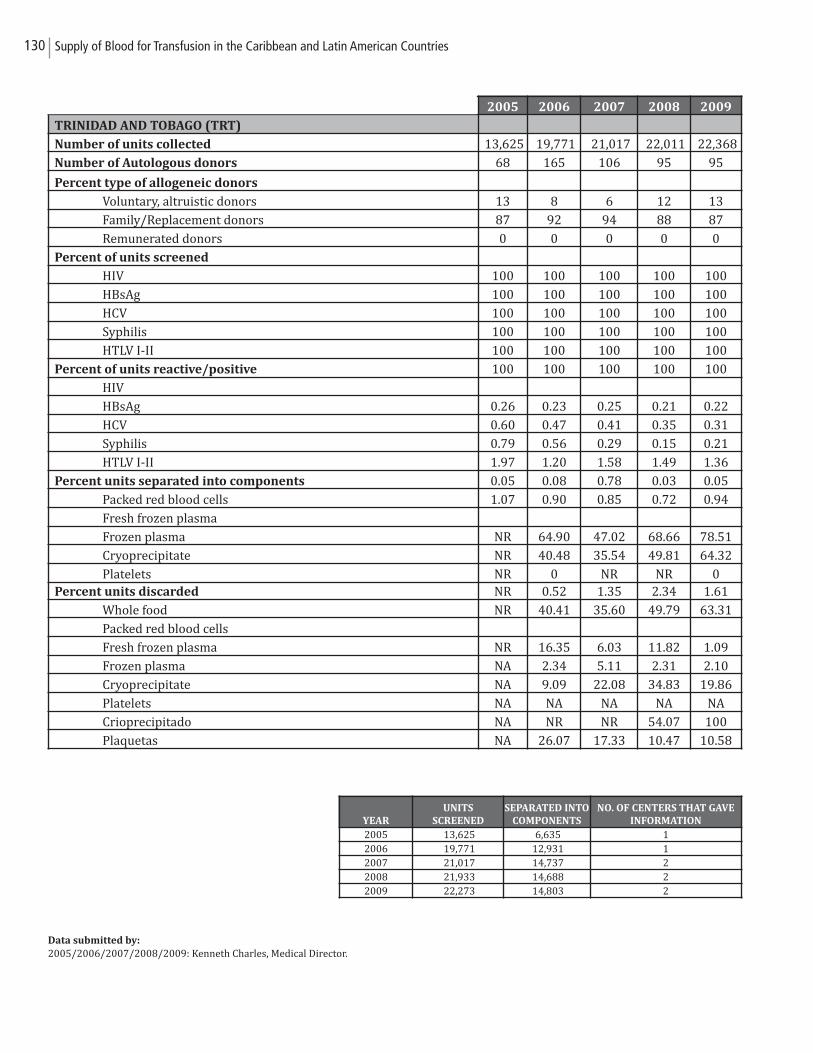
130 Supply of Blood for Transfusion in the Caribbean and Latin American Countries
Data submitted by:
2005/2006/2007/2008/2009: Kenneth Charles, Medical Director.
2005 2006 2007 2008 2009
TRINIDAD AND TOBAGO (TRT)
Number of units collected 13,625 19,771 21,017 22,011 22,368
Number of Autologous donors 68 165 106 95 95
Percent type of allogeneic donors
Voluntary, altruistic donors 13 8 6 12 13
Family/Replacement donors 87 92 94 88 87
Remunerated donors 0 0 0 0 0
Percent of units screened
HIV 100 100 100 100 100
HBsAg 100 100 100 100 100
HCV 100 100 100 100 100
Syphilis 100 100 100 100 100
HTLV I-II 100 100 100 100 100
Percent of units reactive/positive 100 100 100 100 100
HIV
HBsAg 0.26 0.23 0.25 0.21 0.22
HCV 0.60 0.47 0.41 0.35 0.31
Syphilis 0.79 0.56 0.29 0.15 0.21
HTLV I-II 1.97 1.20 1.58 1.49 1.36
Percent units separated into components 0.05 0.08 0.78 0.03 0.05
Packed red blood cells 1.07 0.90 0.85 0.72 0.94
Fresh frozen plasma
Frozen plasma NR 64.90 47.02 68.66 78.51
Cryoprecipitate NR 40.48 35.54 49.81 64.32
Platelets NR 0 NR NR 0Percent units discarded NR 0.52 1.35 2.34 1.61
Whole food NR 40.41 35.60 49.79 63.31
Packed red blood cells
Fresh frozen plasma NR 16.35 6.03 11.82 1.09
Frozen plasma NA 2.34 5.11 2.31 2.10
Cryoprecipitate NA 9.09 22.08 34.83 19.86
Platelets NA NA NA NA NA
Crioprecipitado NA NR NR 54.07 100
Plaquetas NA 26.07 17.33 10.47 10.58
YEAR
UNITS
SCREENED
SEPARATED INTO
COMPONENTS
NO. OF CENTERS THAT GAVE
INFORMATION
2005 13,625 6,635 12006 19,771 12,931 12007 21,017 14,737 22008 21,933 14,688 22009 22,273 14,803 2
1312006, 2007, 2008 and 2009
LATIN AMERICAN COUNTRIES

132 Supply of Blood for Transfusion in the Caribbean and Latin American Countries
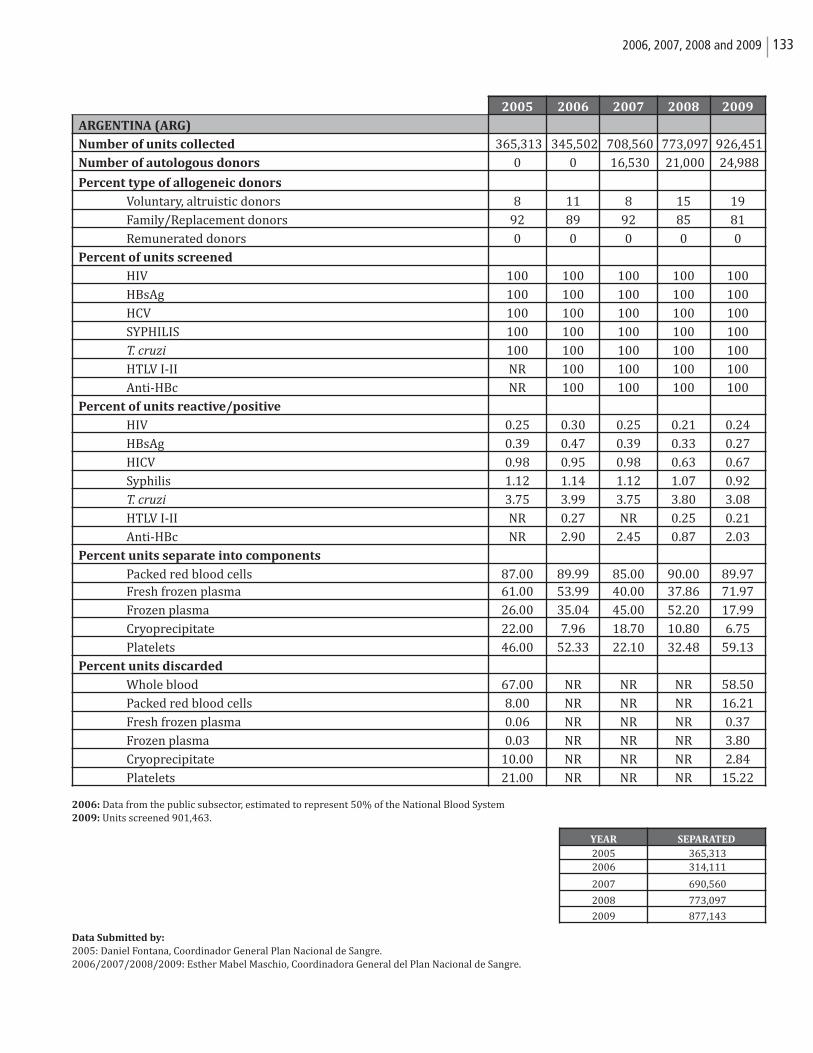
1332006, 2007, 2008 and 2009
2006: Data from the public subsector, estimated to represent 50% of the National Blood System2009: Units screened 901,463.
Data Submitted by:
2005: Daniel Fontana, Coordinador General Plan Nacional de Sangre. 2006/2007/2008/2009: Esther Mabel Maschio, Coordinadora General del Plan Nacional de Sangre.
2005 2006 2007 2008 2009
ARGENTINA (ARG)
Number of units collected 365,313 345,502 708,560 773,097 926,451
Number of autologous donors 0 0 16,530 21,000 24,988
Percent type of allogeneic donors
Voluntary, altruistic donors 8 11 8 15 19
Family/Replacement donors 92 89 92 85 81
Remunerated donors 0 0 0 0 0
Percent of units screened
HIV 100 100 100 100 100
HBsAg 100 100 100 100 100
HCV 100 100 100 100 100
SYPHILIS 100 100 100 100 100
T. cruzi 100 100 100 100 100
HTLV I-II NR 100 100 100 100
Anti-HBc NR 100 100 100 100
Percent of units reactive/positive
HIV 0.25 0.30 0.25 0.21 0.24
HBsAg 0.39 0.47 0.39 0.33 0.27
HICV 0.98 0.95 0.98 0.63 0.67
Syphilis 1.12 1.14 1.12 1.07 0.92
T. cruzi 3.75 3.99 3.75 3.80 3.08
HTLV I-II NR 0.27 NR 0.25 0.21
Anti-HBc NR 2.90 2.45 0.87 2.03
Percent units separate into components
Packed red blood cells 87.00 89.99 85.00 90.00 89.97Fresh frozen plasma 61.00 53.99 40.00 37.86 71.97
Frozen plasma 26.00 35.04 45.00 52.20 17.99
Cryoprecipitate 22.00 7.96 18.70 10.80 6.75
Platelets 46.00 52.33 22.10 32.48 59.13
Percent units discarded
Whole blood 67.00 NR NR NR 58.50
Packed red blood cells 8.00 NR NR NR 16.21
Fresh frozen plasma 0.06 NR NR NR 0.37
Frozen plasma 0.03 NR NR NR 3.80
Cryoprecipitate 10.00 NR NR NR 2.84
Platelets 21.00 NR NR NR 15.22
YEAR SEPARATED
2005 365,313 2006 314,111
2007 690,560
2008 773,097
2009 877,143
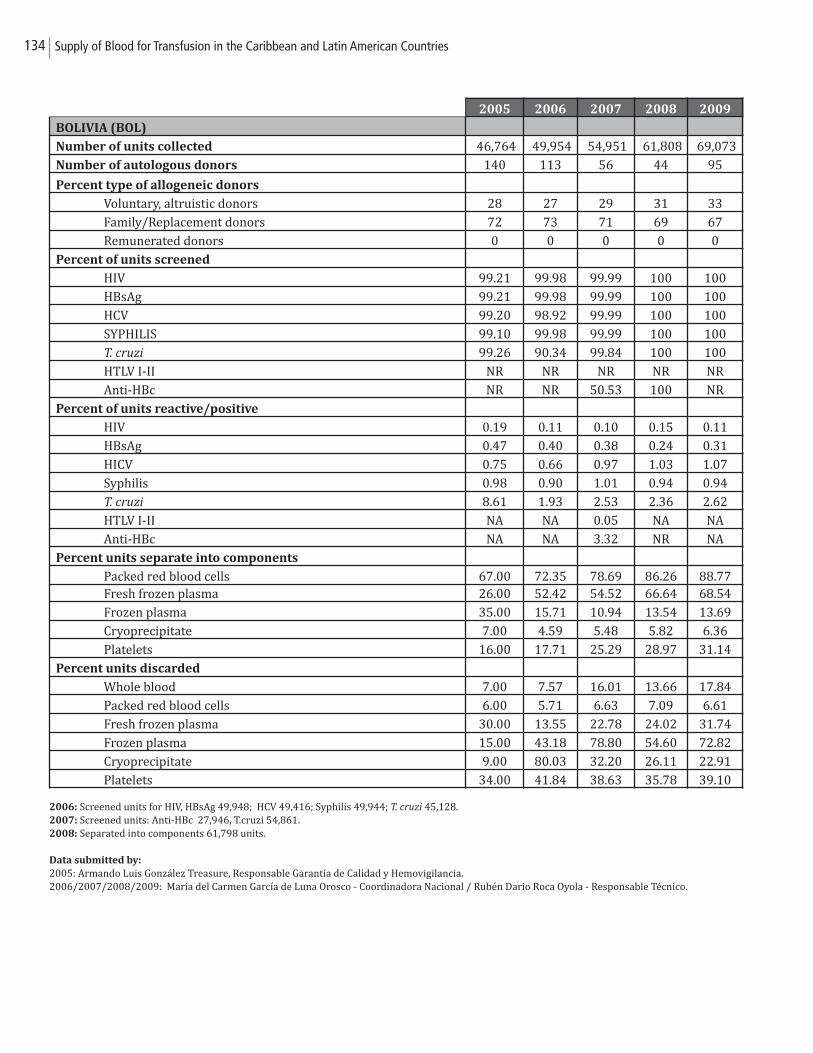
134 Supply of Blood for Transfusion in the Caribbean and Latin American Countries
2006: Screened units for HIV, HBsAg 49,948; HCV 49,416; Syphilis 49,944; T. cruzi 45,128.2007: Screened units: Anti-HBc 27,946, T.cruzi 54,861.2008: Separated into components 61,798 units.
Data submitted by:
2005: Armando Luis González Treasure, Responsable Garantía de Calidad y Hemovigilancia.2006/2007/2008/2009: María del Carmen García de Luna Orosco - Coordinadora Nacional / Rubén Dario Roca Oyola - Responsable Técnico.
2005 2006 2007 2008 2009
BOLIVIA (BOL)
Number of units collected 46,764 49,954 54,951 61,808 69,073
Number of autologous donors 140 113 56 44 95
Percent type of allogeneic donors
Voluntary, altruistic donors 28 27 29 31 33
Family/Replacement donors 72 73 71 69 67
Remunerated donors 0 0 0 0 0
Percent of units screened
HIV 99.21 99.98 99.99 100 100
HBsAg 99.21 99.98 99.99 100 100
HCV 99.20 98.92 99.99 100 100
SYPHILIS 99.10 99.98 99.99 100 100
T. cruzi 99.26 90.34 99.84 100 100
HTLV I-II NR NR NR NR NR
Anti-HBc NR NR 50.53 100 NR
Percent of units reactive/positive
HIV 0.19 0.11 0.10 0.15 0.11
HBsAg 0.47 0.40 0.38 0.24 0.31
HICV 0.75 0.66 0.97 1.03 1.07
Syphilis 0.98 0.90 1.01 0.94 0.94
T. cruzi 8.61 1.93 2.53 2.36 2.62
HTLV I-II NA NA 0.05 NA NA
Anti-HBc NA NA 3.32 NR NA
Percent units separate into components
Packed red blood cells 67.00 72.35 78.69 86.26 88.77Fresh frozen plasma 26.00 52.42 54.52 66.64 68.54
Frozen plasma 35.00 15.71 10.94 13.54 13.69
Cryoprecipitate 7.00 4.59 5.48 5.82 6.36
Platelets 16.00 17.71 25.29 28.97 31.14
Percent units discarded
Whole blood 7.00 7.57 16.01 13.66 17.84
Packed red blood cells 6.00 5.71 6.63 7.09 6.61
Fresh frozen plasma 30.00 13.55 22.78 24.02 31.74
Frozen plasma 15.00 43.18 78.80 54.60 72.82
Cryoprecipitate 9.00 80.03 32.20 26.11 22.91
Platelets 34.00 41.84 38.63 35.78 39.10
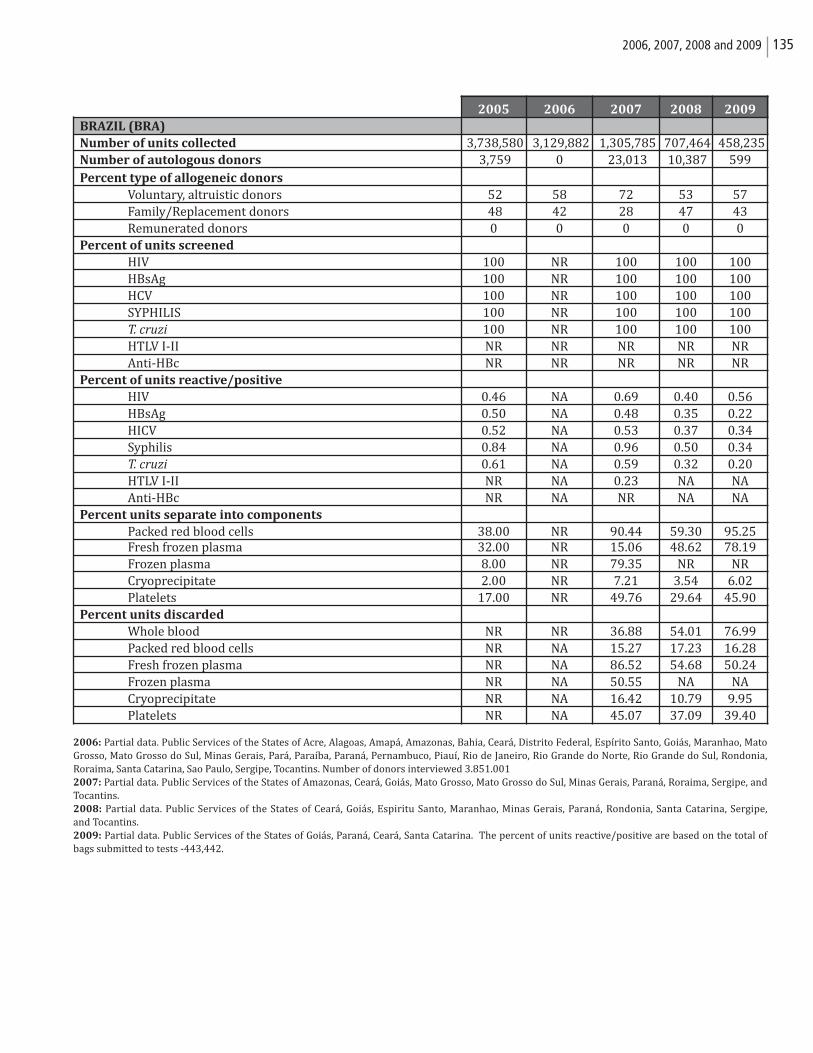
1352006, 2007, 2008 and 2009
2006: Partial data. Public Services of the States of Acre, Alagoas, Amapá, Amazonas, Bahia, Ceará, Distrito Federal, Espírito Santo, Goiás, Maranhao, MatoGrosso, Mato Grosso do Sul, Minas Gerais, Pará, Paraíba, Paraná, Pernambuco, Piauí, Rio de Janeiro, Rio Grande do Norte, Rio Grande do Sul, Rondonia, Roraima, Santa Catarina, Sao Paulo, Sergipe, Tocantins. Number of donors interviewed 3.851.0012007: Partial data. Public Services of the States of Amazonas, Ceará, Goiás, Mato Grosso, Mato Grosso do Sul, Minas Gerais, Paraná, Roraima, Sergipe, andTocantins. 2008: Partial data. Public Services of the States of Ceará, Goiás, Espiritu Santo, Maranhao, Minas Gerais, Paraná, Rondonia, Santa Catarina, Sergipe, and Tocantins. 2009: Partial data. Public Services of the States of Goiás, Paraná, Ceará, Santa Catarina. The percent of units reactive/positive are based on the total of bags submitted to tests -443,442.
2005 2006 2007 2008 2009
BRAZIL (BRA)
Number of units collected 3,738,580 3,129,882 1,305,785 707,464 458,235 Number of autologous donors 3,759 0 23,013 10,387 599Percent type of allogeneic donors
Voluntary, altruistic donors 52 58 72 53 57Family/Replacement donors 48 42 28 47 43Remunerated donors 0 0 0 0 0
Percent of units screened
HIV 100 NR 100 100 100HBsAg 100 NR 100 100 100HCV 100 NR 100 100 100SYPHILIS 100 NR 100 100 100T. cruzi 100 NR 100 100 100HTLV I-II NR NR NR NR NRAnti-HBc NR NR NR NR NR
Percent of units reactive/positive
HIV 0.46 NA 0.69 0.40 0.56HBsAg 0.50 NA 0.48 0.35 0.22HICV 0.52 NA 0.53 0.37 0.34Syphilis 0.84 NA 0.96 0.50 0.34T. cruzi 0.61 NA 0.59 0.32 0.20HTLV I-II NR NA 0.23 NA NAAnti-HBc NR NA NR NA NA
Percent units separate into components
Packed red blood cells 38.00 NR 90.44 59.30 95.25Fresh frozen plasma 32.00 NR 15.06 48.62 78.19Frozen plasma 8.00 NR 79.35 NR NRCryoprecipitate 2.00 NR 7.21 3.54 6.02Platelets 17.00 NR 49.76 29.64 45.90
Percent units discarded
Whole blood NR NR 36.88 54.01 76.99Packed red blood cells NR NA 15.27 17.23 16.28Fresh frozen plasma NR NA 86.52 54.68 50.24Frozen plasma NR NA 50.55 NA NACryoprecipitate NR NA 16.42 10.79 9.95Platelets NR NA 45.07 37.09 39.40
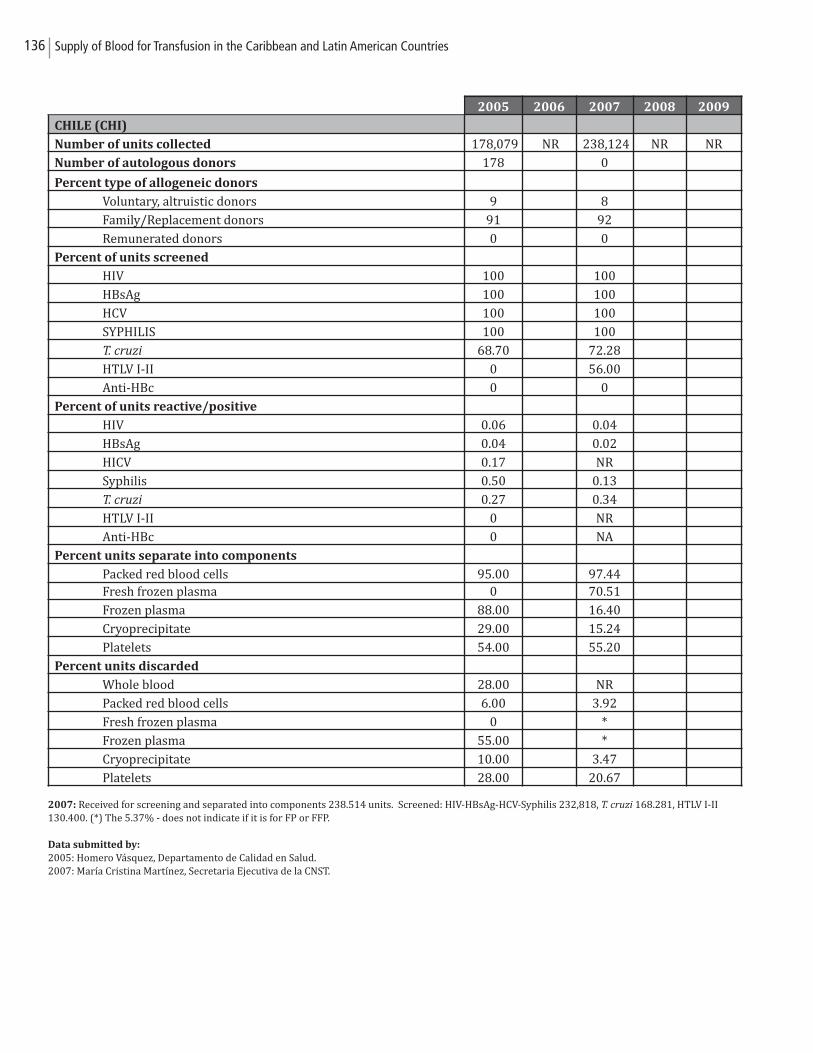
136 Supply of Blood for Transfusion in the Caribbean and Latin American Countries
2007: Received for screening and separated into components 238.514 units. Screened: HIV-HBsAg-HCV-Syphilis 232,818, T. cruzi 168.281, HTLV I-II130.400. (*) The 5.37% - does not indicate if it is for FP or FFP.
Data submitted by:
2005: Homero Vásquez, Departamento de Calidad en Salud.2007: María Cristina Martínez, Secretaria Ejecutiva de la CNST.
2005 2006 2007 2008 2009
CHILE (CHI)
Number of units collected 178,079 NR 238,124 NR NR
Number of autologous donors 178 0
Percent type of allogeneic donors
Voluntary, altruistic donors 9 8
Family/Replacement donors 91 92
Remunerated donors 0 0
Percent of units screened
HIV 100 100
HBsAg 100 100
HCV 100 100
SYPHILIS 100 100
T. cruzi 68.70 72.28
HTLV I-II 0 56.00
Anti-HBc 0 0
Percent of units reactive/positive
HIV 0.06 0.04
HBsAg 0.04 0.02
HICV 0.17 NR
Syphilis 0.50 0.13
T. cruzi 0.27 0.34
HTLV I-II 0 NR
Anti-HBc 0 NA
Percent units separate into components
Packed red blood cells 95.00 97.44Fresh frozen plasma 0 70.51
Frozen plasma 88.00 16.40
Cryoprecipitate 29.00 15.24
Platelets 54.00 55.20
Percent units discarded
Whole blood 28.00 NR
Packed red blood cells 6.00 3.92
Fresh frozen plasma 0 *
Frozen plasma 55.00 *
Cryoprecipitate 10.00 3.47
Platelets 28.00 20.67
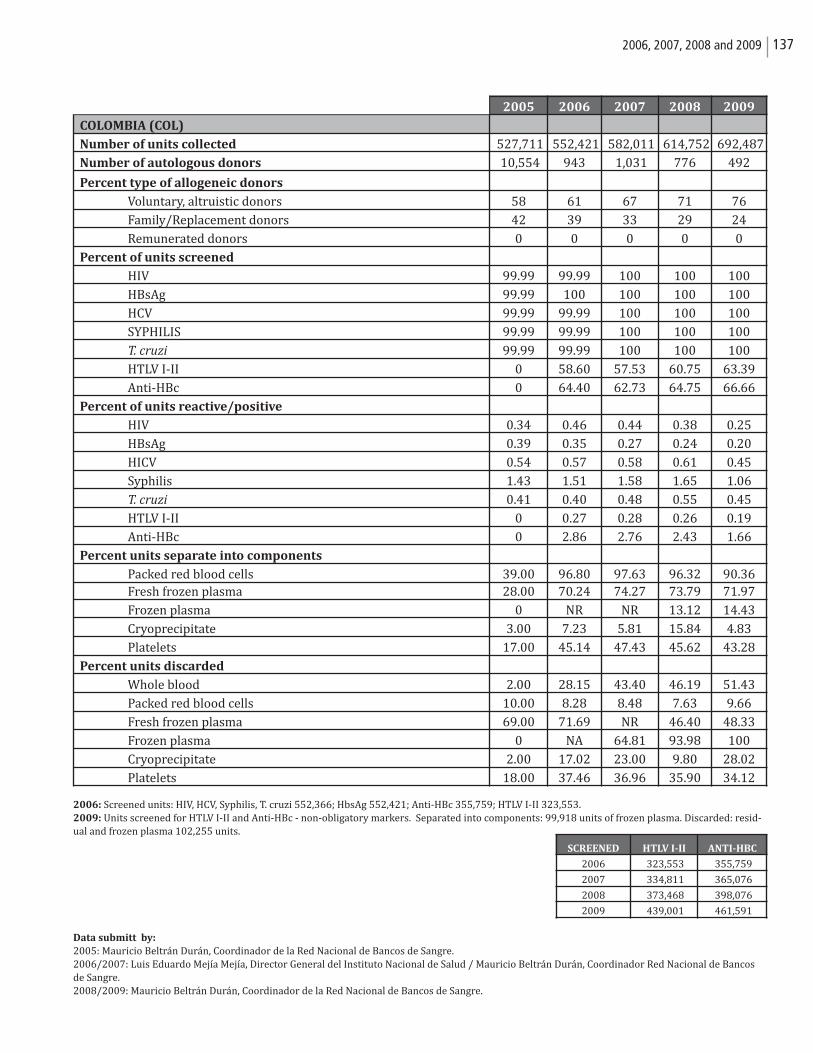
1372006, 2007, 2008 and 2009
2006: Screened units: HIV, HCV, Syphilis, T. cruzi 552,366; HbsAg 552,421; Anti-HBc 355,759; HTLV I-II 323,553.2009: Units screened for HTLV I-II and Anti-HBc - non-obligatory markers. Separated into components: 99,918 units of frozen plasma. Discarded: resid-ual and frozen plasma 102,255 units.
Data submitt by:
2005: Mauricio Beltrán Durán, Coordinador de la Red Nacional de Bancos de Sangre.2006/2007: Luis Eduardo Mejía Mejía, Director General del Instituto Nacional de Salud / Mauricio Beltrán Durán, Coordinador Red Nacional de Bancosde Sangre. 2008/2009: Mauricio Beltrán Durán, Coordinador de la Red Nacional de Bancos de Sangre.
2005 2006 2007 2008 2009
COLOMBIA (COL)
Number of units collected 527,711 552,421 582,011 614,752 692,487
Number of autologous donors 10,554 943 1,031 776 492
Percent type of allogeneic donors
Voluntary, altruistic donors 58 61 67 71 76
Family/Replacement donors 42 39 33 29 24
Remunerated donors 0 0 0 0 0
Percent of units screened
HIV 99.99 99.99 100 100 100
HBsAg 99.99 100 100 100 100
HCV 99.99 99.99 100 100 100
SYPHILIS 99.99 99.99 100 100 100
T. cruzi 99.99 99.99 100 100 100
HTLV I-II 0 58.60 57.53 60.75 63.39
Anti-HBc 0 64.40 62.73 64.75 66.66
Percent of units reactive/positive
HIV 0.34 0.46 0.44 0.38 0.25
HBsAg 0.39 0.35 0.27 0.24 0.20
HICV 0.54 0.57 0.58 0.61 0.45
Syphilis 1.43 1.51 1.58 1.65 1.06
T. cruzi 0.41 0.40 0.48 0.55 0.45
HTLV I-II 0 0.27 0.28 0.26 0.19
Anti-HBc 0 2.86 2.76 2.43 1.66
Percent units separate into components
Packed red blood cells 39.00 96.80 97.63 96.32 90.36Fresh frozen plasma 28.00 70.24 74.27 73.79 71.97
Frozen plasma 0 NR NR 13.12 14.43
Cryoprecipitate 3.00 7.23 5.81 15.84 4.83
Platelets 17.00 45.14 47.43 45.62 43.28
Percent units discarded
Whole blood 2.00 28.15 43.40 46.19 51.43
Packed red blood cells 10.00 8.28 8.48 7.63 9.66
Fresh frozen plasma 69.00 71.69 NR 46.40 48.33
Frozen plasma 0 NA 64.81 93.98 100
Cryoprecipitate 2.00 17.02 23.00 9.80 28.02
Platelets 18.00 37.46 36.96 35.90 34.12
SCREENED HTLV I-II ANTI-HBC
2006 323,553 355,759
2007 334,811 365,076
2008 373,468 398,076
2009 439,001 461,591
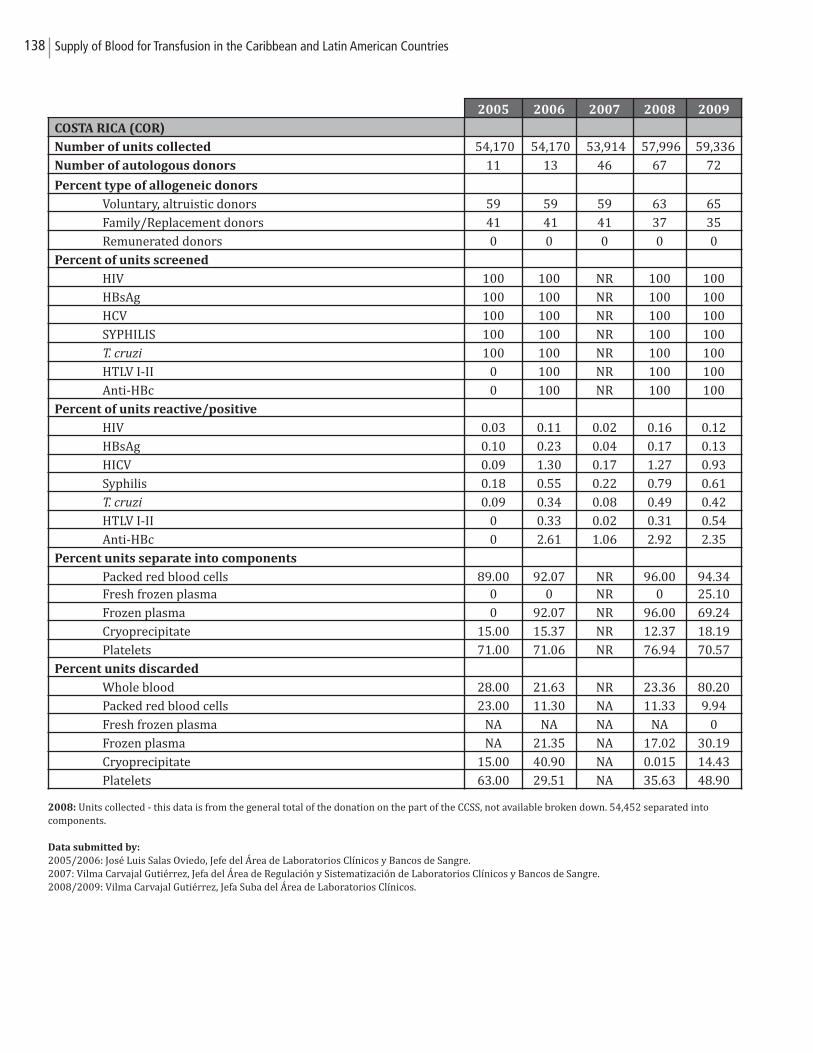
138 Supply of Blood for Transfusion in the Caribbean and Latin American Countries
2008: Units collected - this data is from the general total of the donation on the part of the CCSS, not available broken down. 54,452 separated into components.
Data submitted by:
2005/2006: José Luis Salas Oviedo, Jefe del Área de Laboratorios Clínicos y Bancos de Sangre.2007: Vilma Carvajal Gutiérrez, Jefa del Área de Regulación y Sistematización de Laboratorios Clínicos y Bancos de Sangre.2008/2009: Vilma Carvajal Gutiérrez, Jefa Suba del Área de Laboratorios Clínicos.
2005 2006 2007 2008 2009
COSTA RICA (COR)Number of units collected 54,170 54,170 53,914 57,996 59,336
Number of autologous donors 11 13 46 67 72
Percent type of allogeneic donors
Voluntary, altruistic donors 59 59 59 63 65
Family/Replacement donors 41 41 41 37 35
Remunerated donors 0 0 0 0 0
Percent of units screened
HIV 100 100 NR 100 100
HBsAg 100 100 NR 100 100
HCV 100 100 NR 100 100
SYPHILIS 100 100 NR 100 100
T. cruzi 100 100 NR 100 100
HTLV I-II 0 100 NR 100 100
Anti-HBc 0 100 NR 100 100
Percent of units reactive/positive
HIV 0.03 0.11 0.02 0.16 0.12
HBsAg 0.10 0.23 0.04 0.17 0.13
HICV 0.09 1.30 0.17 1.27 0.93
Syphilis 0.18 0.55 0.22 0.79 0.61
T. cruzi 0.09 0.34 0.08 0.49 0.42
HTLV I-II 0 0.33 0.02 0.31 0.54
Anti-HBc 0 2.61 1.06 2.92 2.35
Percent units separate into components
Packed red blood cells 89.00 92.07 NR 96.00 94.34Fresh frozen plasma 0 0 NR 0 25.10
Frozen plasma 0 92.07 NR 96.00 69.24
Cryoprecipitate 15.00 15.37 NR 12.37 18.19
Platelets 71.00 71.06 NR 76.94 70.57
Percent units discarded
Whole blood 28.00 21.63 NR 23.36 80.20
Packed red blood cells 23.00 11.30 NA 11.33 9.94
Fresh frozen plasma NA NA NA NA 0
Frozen plasma NA 21.35 NA 17.02 30.19
Cryoprecipitate 15.00 40.90 NA 0.015 14.43
Platelets 63.00 29.51 NA 35.63 48.90
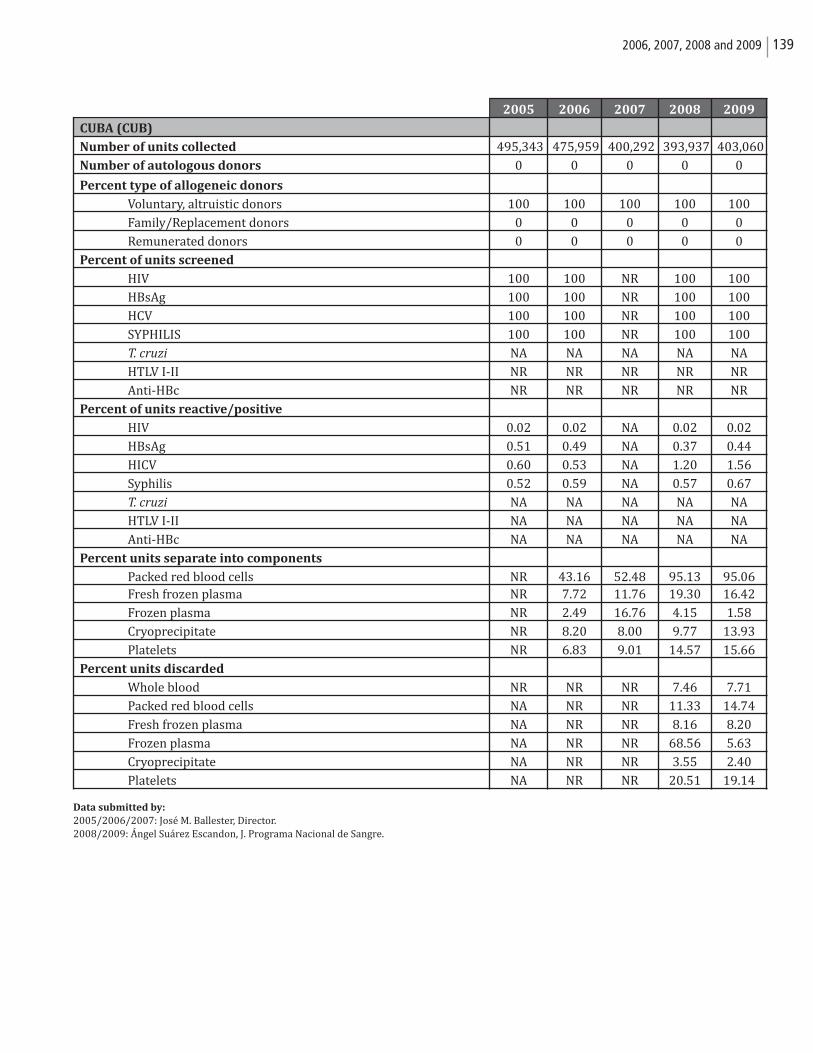
1392006, 2007, 2008 and 2009
Data submitted by:
2005/2006/2007: José M. Ballester, Director.2008/2009: Ángel Suárez Escandon, J. Programa Nacional de Sangre.
2005 2006 2007 2008 2009
CUBA (CUB)
Number of units collected 495,343 475,959 400,292 393,937 403,060
Number of autologous donors 0 0 0 0 0
Percent type of allogeneic donors
Voluntary, altruistic donors 100 100 100 100 100
Family/Replacement donors 0 0 0 0 0
Remunerated donors 0 0 0 0 0
Percent of units screened
HIV 100 100 NR 100 100
HBsAg 100 100 NR 100 100
HCV 100 100 NR 100 100
SYPHILIS 100 100 NR 100 100
T. cruzi NA NA NA NA NA
HTLV I-II NR NR NR NR NR
Anti-HBc NR NR NR NR NR
Percent of units reactive/positive
HIV 0.02 0.02 NA 0.02 0.02
HBsAg 0.51 0.49 NA 0.37 0.44
HICV 0.60 0.53 NA 1.20 1.56
Syphilis 0.52 0.59 NA 0.57 0.67
T. cruzi NA NA NA NA NA
HTLV I-II NA NA NA NA NA
Anti-HBc NA NA NA NA NA
Percent units separate into components
Packed red blood cells NR 43.16 52.48 95.13 95.06Fresh frozen plasma NR 7.72 11.76 19.30 16.42
Frozen plasma NR 2.49 16.76 4.15 1.58
Cryoprecipitate NR 8.20 8.00 9.77 13.93
Platelets NR 6.83 9.01 14.57 15.66
Percent units discarded
Whole blood NR NR NR 7.46 7.71
Packed red blood cells NA NR NR 11.33 14.74
Fresh frozen plasma NA NR NR 8.16 8.20
Frozen plasma NA NR NR 68.56 5.63
Cryoprecipitate NA NR NR 3.55 2.40
Platelets NA NR NR 20.51 19.14
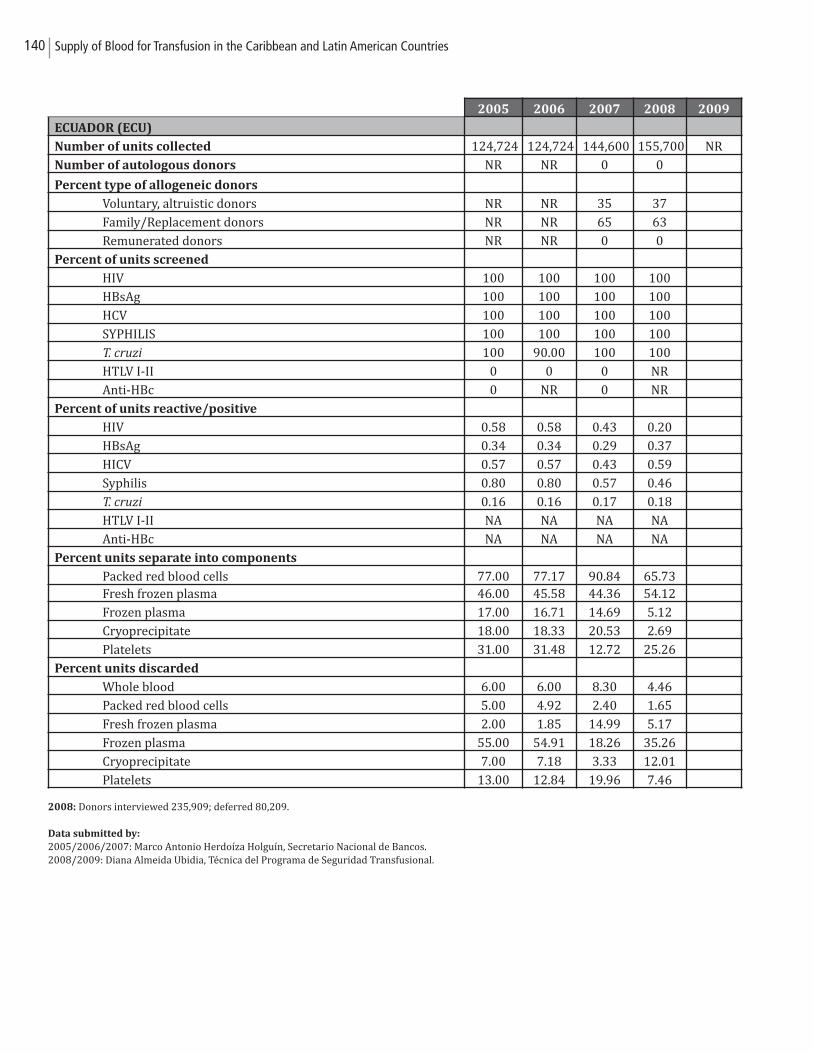
140 Supply of Blood for Transfusion in the Caribbean and Latin American Countries
2008: Donors interviewed 235,909; deferred 80,209.
Data submitted by:
2005/2006/2007: Marco Antonio Herdoíza Holguín, Secretario Nacional de Bancos.2008/2009: Diana Almeida Ubidia, Técnica del Programa de Seguridad Transfusional.
2005 2006 2007 2008 2009
ECUADOR (ECU)
Number of units collected 124,724 124,724 144,600 155,700 NR
Number of autologous donors NR NR 0 0
Percent type of allogeneic donors
Voluntary, altruistic donors NR NR 35 37
Family/Replacement donors NR NR 65 63
Remunerated donors NR NR 0 0
Percent of units screened
HIV 100 100 100 100
HBsAg 100 100 100 100
HCV 100 100 100 100
SYPHILIS 100 100 100 100
T. cruzi 100 90.00 100 100
HTLV I-II 0 0 0 NR
Anti-HBc 0 NR 0 NR
Percent of units reactive/positive
HIV 0.58 0.58 0.43 0.20
HBsAg 0.34 0.34 0.29 0.37
HICV 0.57 0.57 0.43 0.59
Syphilis 0.80 0.80 0.57 0.46
T. cruzi 0.16 0.16 0.17 0.18
HTLV I-II NA NA NA NA
Anti-HBc NA NA NA NA
Percent units separate into components
Packed red blood cells 77.00 77.17 90.84 65.73Fresh frozen plasma 46.00 45.58 44.36 54.12
Frozen plasma 17.00 16.71 14.69 5.12
Cryoprecipitate 18.00 18.33 20.53 2.69
Platelets 31.00 31.48 12.72 25.26
Percent units discarded
Whole blood 6.00 6.00 8.30 4.46
Packed red blood cells 5.00 4.92 2.40 1.65
Fresh frozen plasma 2.00 1.85 14.99 5.17
Frozen plasma 55.00 54.91 18.26 35.26
Cryoprecipitate 7.00 7.18 3.33 12.01
Platelets 13.00 12.84 19.96 7.46
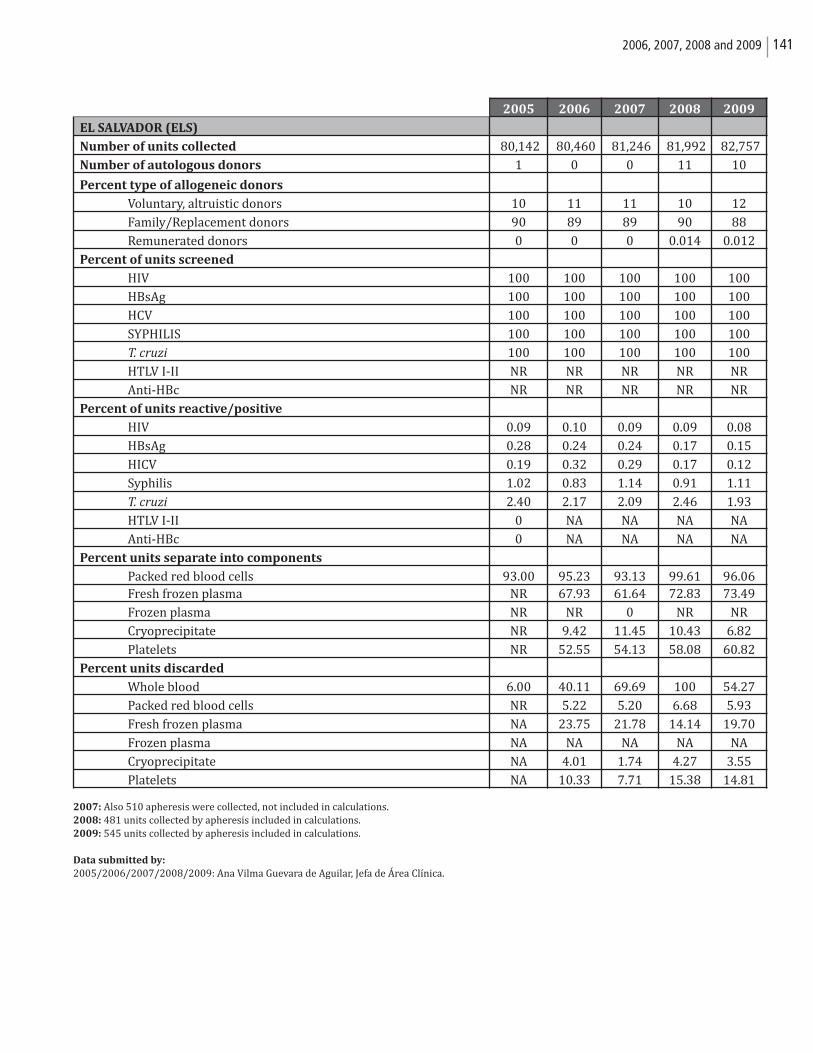
1412006, 2007, 2008 and 2009
2007: Also 510 apheresis were collected, not included in calculations.2008: 481 units collected by apheresis included in calculations.2009: 545 units collected by apheresis included in calculations.
Data submitted by:
2005/2006/2007/2008/2009: Ana Vilma Guevara de Aguilar, Jefa de Área Clínica.
2005 2006 2007 2008 2009
EL SALVADOR (ELS)
Number of units collected 80,142 80,460 81,246 81,992 82,757
Number of autologous donors 1 0 0 11 10
Percent type of allogeneic donors
Voluntary, altruistic donors 10 11 11 10 12
Family/Replacement donors 90 89 89 90 88
Remunerated donors 0 0 0 0.014 0.012
Percent of units screened
HIV 100 100 100 100 100
HBsAg 100 100 100 100 100
HCV 100 100 100 100 100
SYPHILIS 100 100 100 100 100
T. cruzi 100 100 100 100 100
HTLV I-II NR NR NR NR NR
Anti-HBc NR NR NR NR NR
Percent of units reactive/positive
HIV 0.09 0.10 0.09 0.09 0.08
HBsAg 0.28 0.24 0.24 0.17 0.15
HICV 0.19 0.32 0.29 0.17 0.12
Syphilis 1.02 0.83 1.14 0.91 1.11
T. cruzi 2.40 2.17 2.09 2.46 1.93
HTLV I-II 0 NA NA NA NA
Anti-HBc 0 NA NA NA NA
Percent units separate into components
Packed red blood cells 93.00 95.23 93.13 99.61 96.06Fresh frozen plasma NR 67.93 61.64 72.83 73.49
Frozen plasma NR NR 0 NR NR
Cryoprecipitate NR 9.42 11.45 10.43 6.82
Platelets NR 52.55 54.13 58.08 60.82
Percent units discarded
Whole blood 6.00 40.11 69.69 100 54.27
Packed red blood cells NR 5.22 5.20 6.68 5.93
Fresh frozen plasma NA 23.75 21.78 14.14 19.70
Frozen plasma NA NA NA NA NA
Cryoprecipitate NA 4.01 1.74 4.27 3.55
Platelets NA 10.33 7.71 15.38 14.81
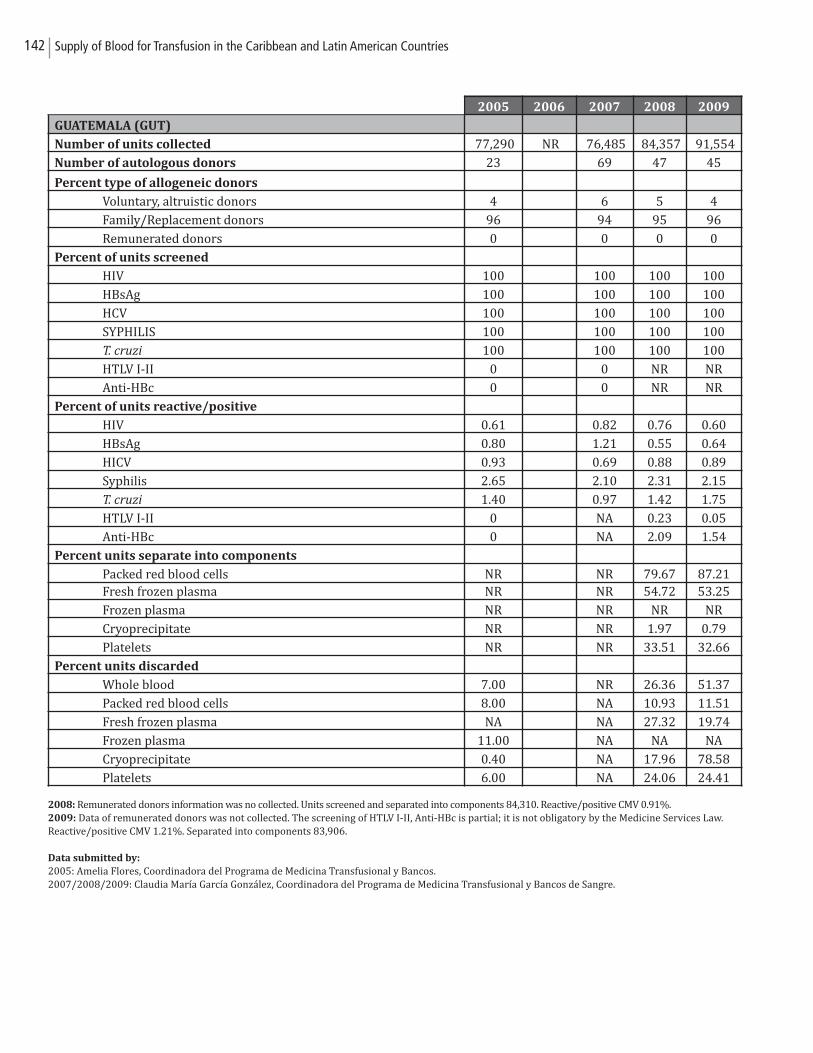
142 Supply of Blood for Transfusion in the Caribbean and Latin American Countries
2008: Remunerated donors information was no collected. Units screened and separated into components 84,310. Reactive/positive CMV 0.91%. 2009: Data of remunerated donors was not collected. The screening of HTLV I-II, Anti-HBc is partial; it is not obligatory by the Medicine Services Law. Reactive/positive CMV 1.21%. Separated into components 83,906.
Data submitted by:
2005: Amelia Flores, Coordinadora del Programa de Medicina Transfusional y Bancos.2007/2008/2009: Claudia María García González, Coordinadora del Programa de Medicina Transfusional y Bancos de Sangre.
2005 2006 2007 2008 2009
GUATEMALA (GUT)
Number of units collected 77,290 NR 76,485 84,357 91,554
Number of autologous donors 23 69 47 45
Percent type of allogeneic donors
Voluntary, altruistic donors 4 6 5 4
Family/Replacement donors 96 94 95 96
Remunerated donors 0 0 0 0
Percent of units screened
HIV 100 100 100 100
HBsAg 100 100 100 100
HCV 100 100 100 100
SYPHILIS 100 100 100 100
T. cruzi 100 100 100 100
HTLV I-II 0 0 NR NR
Anti-HBc 0 0 NR NR
Percent of units reactive/positive
HIV 0.61 0.82 0.76 0.60
HBsAg 0.80 1.21 0.55 0.64
HICV 0.93 0.69 0.88 0.89
Syphilis 2.65 2.10 2.31 2.15
T. cruzi 1.40 0.97 1.42 1.75
HTLV I-II 0 NA 0.23 0.05
Anti-HBc 0 NA 2.09 1.54
Percent units separate into components
Packed red blood cells NR NR 79.67 87.21Fresh frozen plasma NR NR 54.72 53.25
Frozen plasma NR NR NR NR
Cryoprecipitate NR NR 1.97 0.79
Platelets NR NR 33.51 32.66
Percent units discarded
Whole blood 7.00 NR 26.36 51.37
Packed red blood cells 8.00 NA 10.93 11.51
Fresh frozen plasma NA NA 27.32 19.74
Frozen plasma 11.00 NA NA NA
Cryoprecipitate 0.40 NA 17.96 78.58
Platelets 6.00 NA 24.06 24.41
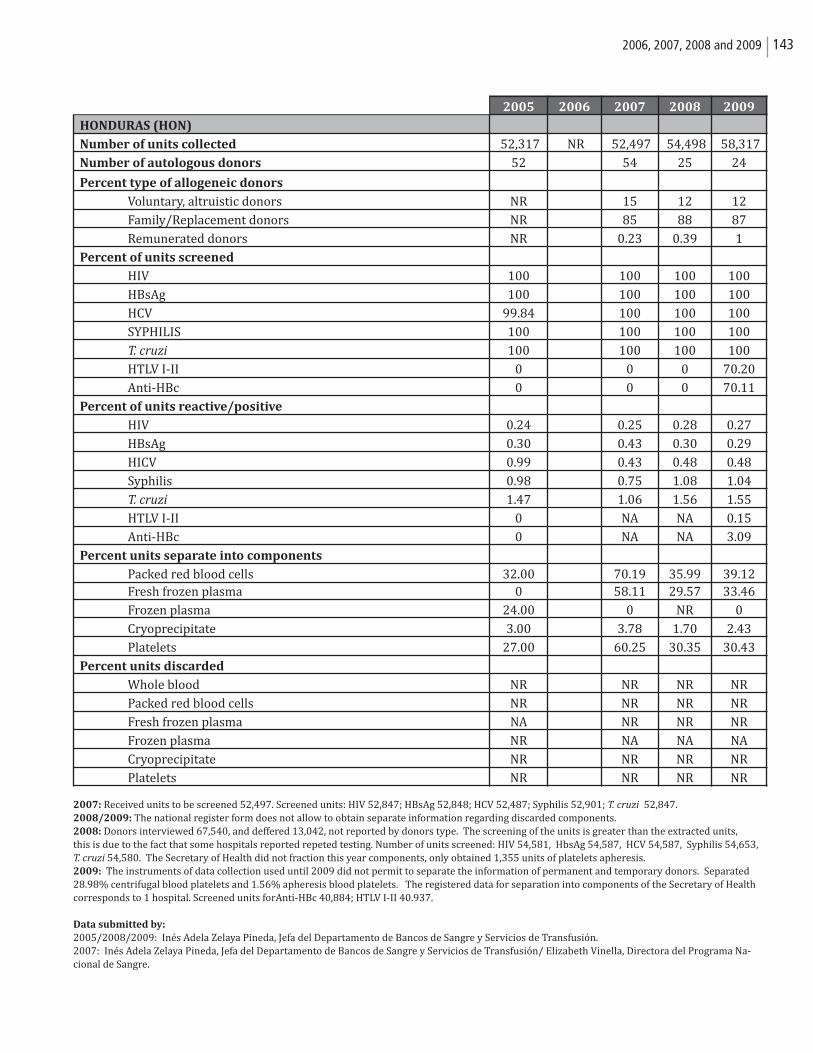
1432006, 2007, 2008 and 2009
2007: Received units to be screened 52,497. Screened units: HIV 52,847; HBsAg 52,848; HCV 52,487; Syphilis 52,901; T. cruzi 52,847.2008/2009: The national register form does not allow to obtain separate information regarding discarded components.2008: Donors interviewed 67,540, and deffered 13,042, not reported by donors type. The screening of the units is greater than the extracted units, this is due to the fact that some hospitals reported repeted testing. Number of units screened: HIV 54,581, HbsAg 54,587, HCV 54,587, Syphilis 54,653, T. cruzi 54,580. The Secretary of Health did not fraction this year components, only obtained 1,355 units of platelets apheresis. 2009: The instruments of data collection used until 2009 did not permit to separate the information of permanent and temporary donors. Separated28.98% centrifugal blood platelets and 1.56% apheresis blood platelets. The registered data for separation into components of the Secretary of Healthcorresponds to 1 hospital. Screened units forAnti-HBc 40,884; HTLV I-II 40.937.
Data submitted by:
2005/2008/2009: Inés Adela Zelaya Pineda, Jefa del Departamento de Bancos de Sangre y Servicios de Transfusión.2007: Inés Adela Zelaya Pineda, Jefa del Departamento de Bancos de Sangre y Servicios de Transfusión/ Elizabeth Vinella, Directora del Programa Na-cional de Sangre.
2005 2006 2007 2008 2009
HONDURAS (HON)
Number of units collected 52,317 NR 52,497 54,498 58,317
Number of autologous donors 52 54 25 24
Percent type of allogeneic donors
Voluntary, altruistic donors NR 15 12 12
Family/Replacement donors NR 85 88 87
Remunerated donors NR 0.23 0.39 1
Percent of units screened
HIV 100 100 100 100
HBsAg 100 100 100 100
HCV 99.84 100 100 100
SYPHILIS 100 100 100 100
T. cruzi 100 100 100 100
HTLV I-II 0 0 0 70.20
Anti-HBc 0 0 0 70.11
Percent of units reactive/positive
HIV 0.24 0.25 0.28 0.27
HBsAg 0.30 0.43 0.30 0.29
HICV 0.99 0.43 0.48 0.48
Syphilis 0.98 0.75 1.08 1.04
T. cruzi 1.47 1.06 1.56 1.55
HTLV I-II 0 NA NA 0.15
Anti-HBc 0 NA NA 3.09
Percent units separate into components
Packed red blood cells 32.00 70.19 35.99 39.12Fresh frozen plasma 0 58.11 29.57 33.46
Frozen plasma 24.00 0 NR 0
Cryoprecipitate 3.00 3.78 1.70 2.43
Platelets 27.00 60.25 30.35 30.43
Percent units discarded
Whole blood NR NR NR NR
Packed red blood cells NR NR NR NR
Fresh frozen plasma NA NR NR NR
Frozen plasma NR NA NA NA
Cryoprecipitate NR NR NR NR
Platelets NR NR NR NR
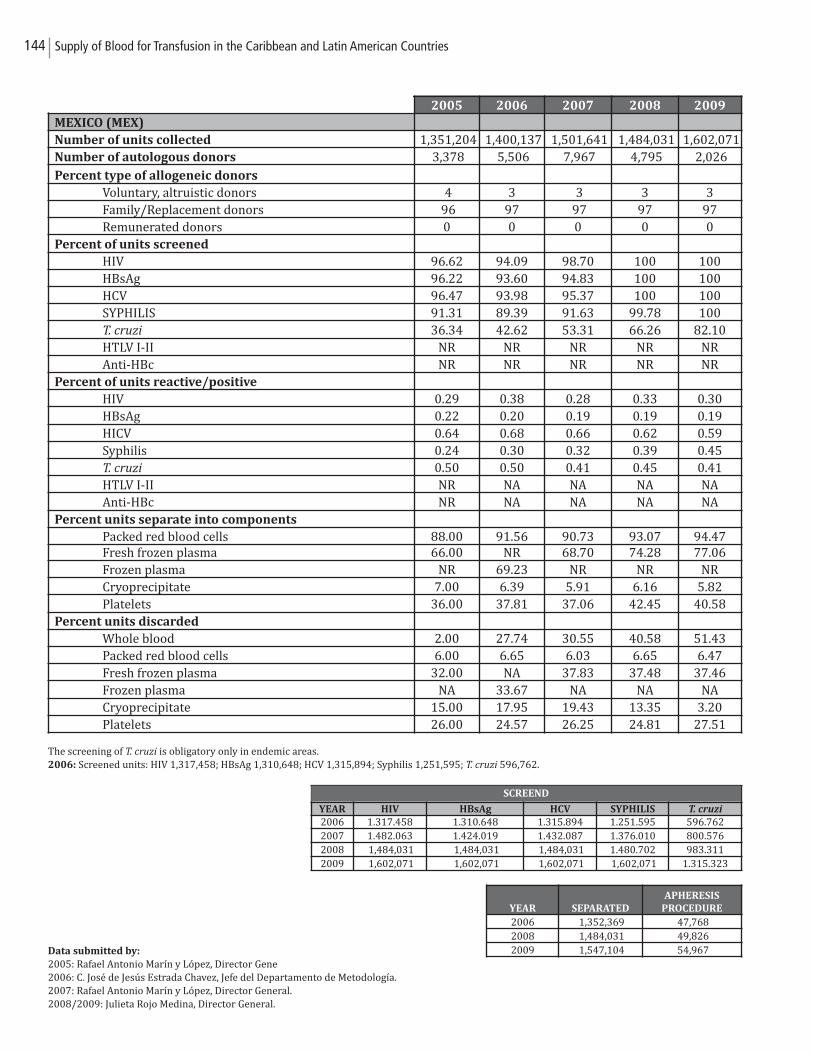
144 Supply of Blood for Transfusion in the Caribbean and Latin American Countries
The screening of T. cruzi is obligatory only in endemic areas.2006: Screened units: HIV 1,317,458; HBsAg 1,310,648; HCV 1,315,894; Syphilis 1,251,595; T. cruzi 596,762.
Data submitted by:
2005: Rafael Antonio Marín y López, Director Gene2006: C. José de Jesús Estrada Chavez, Jefe del Departamento de Metodología.2007: Rafael Antonio Marín y López, Director General.2008/2009: Julieta Rojo Medina, Director General.
2005 2006 2007 2008 2009
MEXICO (MEX)
Number of units collected 1,351,204 1,400,137 1,501,641 1,484,031 1,602,071 Number of autologous donors 3,378 5,506 7,967 4,795 2,026
Percent type of allogeneic donors
Voluntary, altruistic donors 4 3 3 3 3Family/Replacement donors 96 97 97 97 97Remunerated donors 0 0 0 0 0
Percent of units screened
HIV 96.62 94.09 98.70 100 100HBsAg 96.22 93.60 94.83 100 100HCV 96.47 93.98 95.37 100 100SYPHILIS 91.31 89.39 91.63 99.78 100T. cruzi 36.34 42.62 53.31 66.26 82.10HTLV I-II NR NR NR NR NRAnti-HBc NR NR NR NR NR
Percent of units reactive/positive
HIV 0.29 0.38 0.28 0.33 0.30HBsAg 0.22 0.20 0.19 0.19 0.19HICV 0.64 0.68 0.66 0.62 0.59Syphilis 0.24 0.30 0.32 0.39 0.45T. cruzi 0.50 0.50 0.41 0.45 0.41HTLV I-II NR NA NA NA NAAnti-HBc NR NA NA NA NA
Percent units separate into components
Packed red blood cells 88.00 91.56 90.73 93.07 94.47Fresh frozen plasma 66.00 NR 68.70 74.28 77.06Frozen plasma NR 69.23 NR NR NRCryoprecipitate 7.00 6.39 5.91 6.16 5.82Platelets 36.00 37.81 37.06 42.45 40.58
Percent units discarded
Whole blood 2.00 27.74 30.55 40.58 51.43Packed red blood cells 6.00 6.65 6.03 6.65 6.47Fresh frozen plasma 32.00 NA 37.83 37.48 37.46Frozen plasma NA 33.67 NA NA NACryoprecipitate 15.00 17.95 19.43 13.35 3.20Platelets 26.00 24.57 26.25 24.81 27.51
YEAR HIV HBsAg HCV SYPHILIS T. cruzi
2006 1.317.458 1.310.648 1.315.894 1.251.595 596.7622007 1.482.063 1.424.019 1.432.087 1.376.010 800.5762008 1,484,031 1,484,031 1,484,031 1.480.702 983.3112009 1,602,071 1,602,071 1,602,071 1,602,071 1.315.323
YEAR SEPARATED
APHERESIS
PROCEDURE
2006 1,352,369 47,768 2008 1,484,031 49,826 2009 1,547,104 54,967
SCREEND
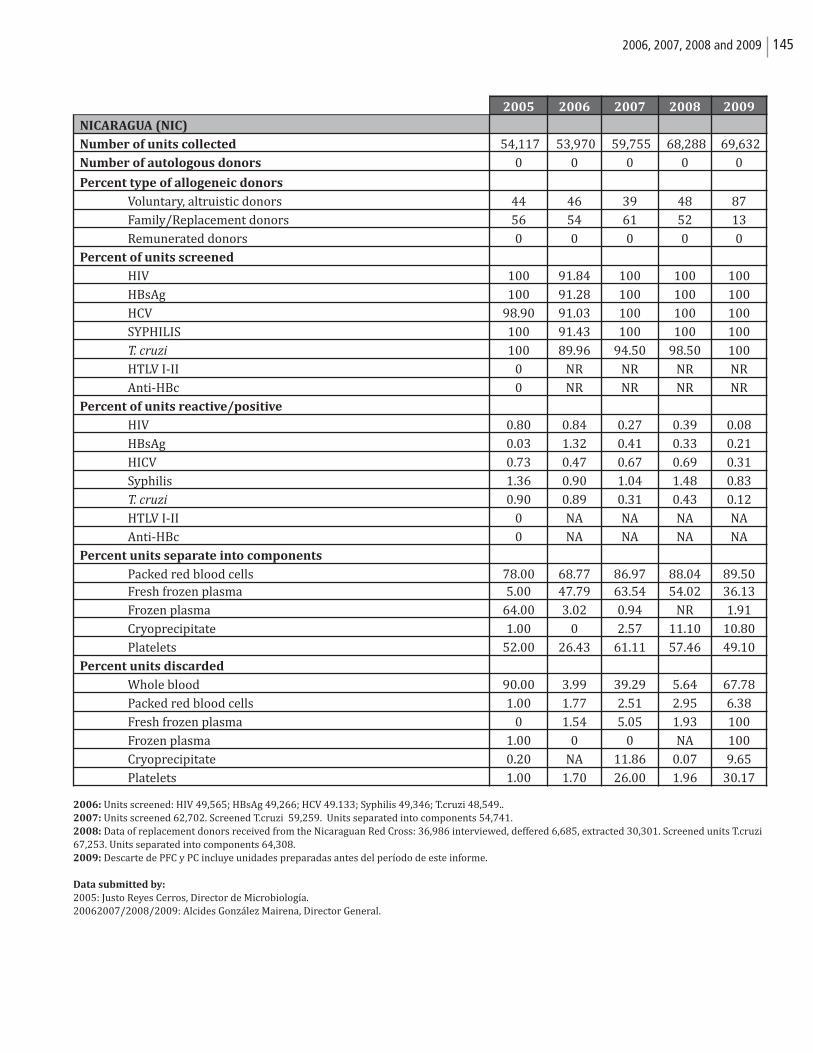
1452006, 2007, 2008 and 2009
2006: Units screened: HIV 49,565; HBsAg 49,266; HCV 49.133; Syphilis 49,346; T.cruzi 48,549..2007: Units screened 62,702. Screened T.cruzi 59,259. Units separated into components 54,741.2008: Data of replacement donors received from the Nicaraguan Red Cross: 36,986 interviewed, deffered 6,685, extracted 30,301. Screened units T.cruzi67,253. Units separated into components 64,308.2009: Descarte de PFC y PC incluye unidades preparadas antes del período de este informe.
Data submitted by:
2005: Justo Reyes Cerros, Director de Microbiología.20062007/2008/2009: Alcides González Mairena, Director General.
2005 2006 2007 2008 2009
NICARAGUA (NIC)
Number of units collected 54,117 53,970 59,755 68,288 69,632
Number of autologous donors 0 0 0 0 0
Percent type of allogeneic donors
Voluntary, altruistic donors 44 46 39 48 87
Family/Replacement donors 56 54 61 52 13
Remunerated donors 0 0 0 0 0
Percent of units screened
HIV 100 91.84 100 100 100
HBsAg 100 91.28 100 100 100
HCV 98.90 91.03 100 100 100
SYPHILIS 100 91.43 100 100 100
T. cruzi 100 89.96 94.50 98.50 100
HTLV I-II 0 NR NR NR NR
Anti-HBc 0 NR NR NR NR
Percent of units reactive/positive
HIV 0.80 0.84 0.27 0.39 0.08
HBsAg 0.03 1.32 0.41 0.33 0.21
HICV 0.73 0.47 0.67 0.69 0.31
Syphilis 1.36 0.90 1.04 1.48 0.83
T. cruzi 0.90 0.89 0.31 0.43 0.12
HTLV I-II 0 NA NA NA NA
Anti-HBc 0 NA NA NA NA
Percent units separate into components
Packed red blood cells 78.00 68.77 86.97 88.04 89.50Fresh frozen plasma 5.00 47.79 63.54 54.02 36.13
Frozen plasma 64.00 3.02 0.94 NR 1.91
Cryoprecipitate 1.00 0 2.57 11.10 10.80
Platelets 52.00 26.43 61.11 57.46 49.10
Percent units discarded
Whole blood 90.00 3.99 39.29 5.64 67.78
Packed red blood cells 1.00 1.77 2.51 2.95 6.38
Fresh frozen plasma 0 1.54 5.05 1.93 100
Frozen plasma 1.00 0 0 NA 100
Cryoprecipitate 0.20 NA 11.86 0.07 9.65
Platelets 1.00 1.70 26.00 1.96 30.17
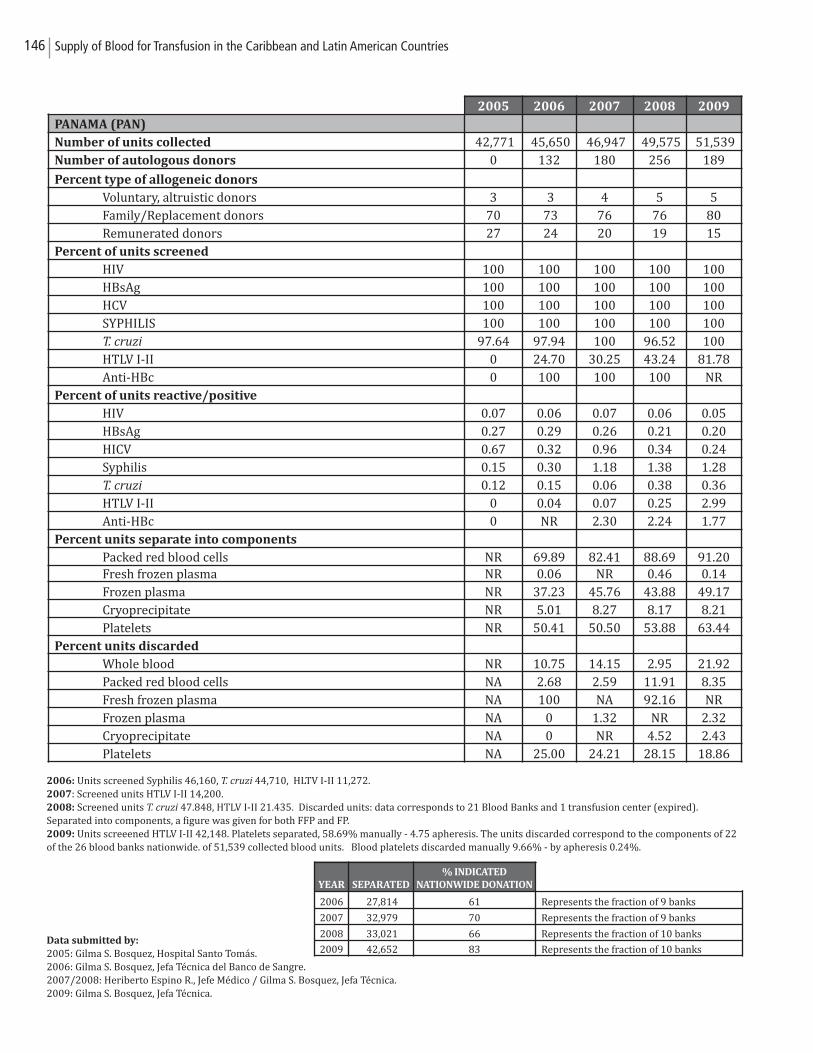
146 Supply of Blood for Transfusion in the Caribbean and Latin American Countries
2006: Units screened Syphilis 46,160, T. cruzi 44,710, HLTV I-II 11,272. 2007: Screened units HTLV I-II 14,200.2008: Screened units T. cruzi 47.848, HTLV I-II 21.435. Discarded units: data corresponds to 21 Blood Banks and 1 transfusion center (expired). Separated into components, a figure was given for both FFP and FP.2009: Units screeened HTLV I-II 42,148. Platelets separated, 58.69% manually - 4.75 apheresis. The units discarded correspond to the components of 22of the 26 blood banks nationwide. of 51,539 collected blood units. Blood platelets discarded manually 9.66% - by apheresis 0.24%.
Data submitted by:
2005: Gilma S. Bosquez, Hospital Santo Tomás.2006: Gilma S. Bosquez, Jefa Técnica del Banco de Sangre.2007/2008: Heriberto Espino R., Jefe Médico / Gilma S. Bosquez, Jefa Técnica. 2009: Gilma S. Bosquez, Jefa Técnica.
2005 2006 2007 2008 2009
PANAMA (PAN)
Number of units collected 42,771 45,650 46,947 49,575 51,539 Number of autologous donors 0 132 180 256 189
Percent type of allogeneic donors
Voluntary, altruistic donors 3 3 4 5 5Family/Replacement donors 70 73 76 76 80Remunerated donors 27 24 20 19 15
Percent of units screened
HIV 100 100 100 100 100HBsAg 100 100 100 100 100HCV 100 100 100 100 100SYPHILIS 100 100 100 100 100T. cruzi 97.64 97.94 100 96.52 100HTLV I-II 0 24.70 30.25 43.24 81.78Anti-HBc 0 100 100 100 NR
Percent of units reactive/positive
HIV 0.07 0.06 0.07 0.06 0.05HBsAg 0.27 0.29 0.26 0.21 0.20HICV 0.67 0.32 0.96 0.34 0.24Syphilis 0.15 0.30 1.18 1.38 1.28T. cruzi 0.12 0.15 0.06 0.38 0.36HTLV I-II 0 0.04 0.07 0.25 2.99Anti-HBc 0 NR 2.30 2.24 1.77
Percent units separate into components
Packed red blood cells NR 69.89 82.41 88.69 91.20Fresh frozen plasma NR 0.06 NR 0.46 0.14Frozen plasma NR 37.23 45.76 43.88 49.17Cryoprecipitate NR 5.01 8.27 8.17 8.21Platelets NR 50.41 50.50 53.88 63.44
Percent units discarded
Whole blood NR 10.75 14.15 2.95 21.92Packed red blood cells NA 2.68 2.59 11.91 8.35Fresh frozen plasma NA 100 NA 92.16 NRFrozen plasma NA 0 1.32 NR 2.32Cryoprecipitate NA 0 NR 4.52 2.43Platelets NA 25.00 24.21 28.15 18.86
YEAR SEPARATED
% INDICATED
NATIONWIDE DONATION
2006 27,814 61 Represents the fraction of 9 banks
2007 32,979 70 Represents the fraction of 9 banks
2008 33,021 66 Represents the fraction of 10 banks
2009 42,652 83 Represents the fraction of 10 banks
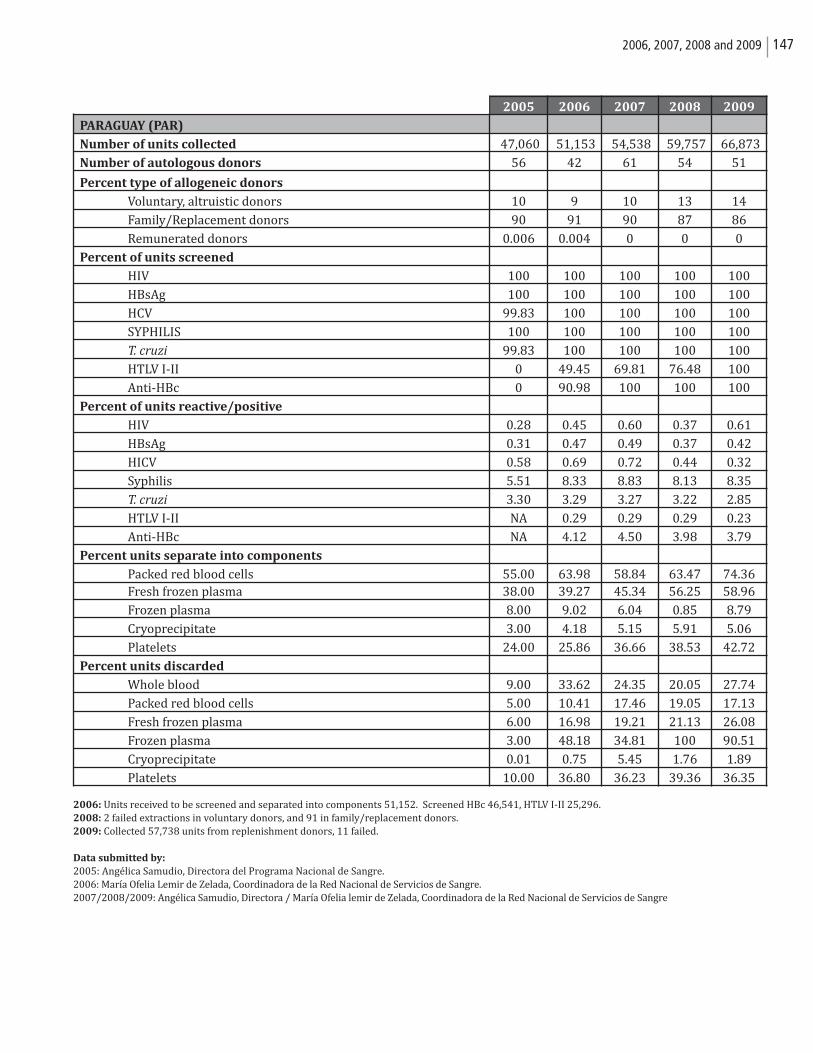
1472006, 2007, 2008 and 2009
2006: Units received to be screened and separated into components 51,152. Screened HBc 46,541, HTLV I-II 25,296.2008: 2 failed extractions in voluntary donors, and 91 in family/replacement donors.2009: Collected 57,738 units from replenishment donors, 11 failed.
Data submitted by:
2005: Angélica Samudio, Directora del Programa Nacional de Sangre.2006: María Ofelia Lemir de Zelada, Coordinadora de la Red Nacional de Servicios de Sangre.2007/2008/2009: Angélica Samudio, Directora / María Ofelia lemir de Zelada, Coordinadora de la Red Nacional de Servicios de Sangre
2005 2006 2007 2008 2009
PARAGUAY (PAR)
Number of units collected 47,060 51,153 54,538 59,757 66,873
Number of autologous donors 56 42 61 54 51
Percent type of allogeneic donors
Voluntary, altruistic donors 10 9 10 13 14
Family/Replacement donors 90 91 90 87 86
Remunerated donors 0.006 0.004 0 0 0
Percent of units screened
HIV 100 100 100 100 100
HBsAg 100 100 100 100 100
HCV 99.83 100 100 100 100
SYPHILIS 100 100 100 100 100
T. cruzi 99.83 100 100 100 100
HTLV I-II 0 49.45 69.81 76.48 100
Anti-HBc 0 90.98 100 100 100
Percent of units reactive/positive
HIV 0.28 0.45 0.60 0.37 0.61
HBsAg 0.31 0.47 0.49 0.37 0.42
HICV 0.58 0.69 0.72 0.44 0.32
Syphilis 5.51 8.33 8.83 8.13 8.35
T. cruzi 3.30 3.29 3.27 3.22 2.85
HTLV I-II NA 0.29 0.29 0.29 0.23
Anti-HBc NA 4.12 4.50 3.98 3.79
Percent units separate into components
Packed red blood cells 55.00 63.98 58.84 63.47 74.36Fresh frozen plasma 38.00 39.27 45.34 56.25 58.96
Frozen plasma 8.00 9.02 6.04 0.85 8.79
Cryoprecipitate 3.00 4.18 5.15 5.91 5.06
Platelets 24.00 25.86 36.66 38.53 42.72
Percent units discarded
Whole blood 9.00 33.62 24.35 20.05 27.74
Packed red blood cells 5.00 10.41 17.46 19.05 17.13
Fresh frozen plasma 6.00 16.98 19.21 21.13 26.08
Frozen plasma 3.00 48.18 34.81 100 90.51
Cryoprecipitate 0.01 0.75 5.45 1.76 1.89
Platelets 10.00 36.80 36.23 39.36 36.35
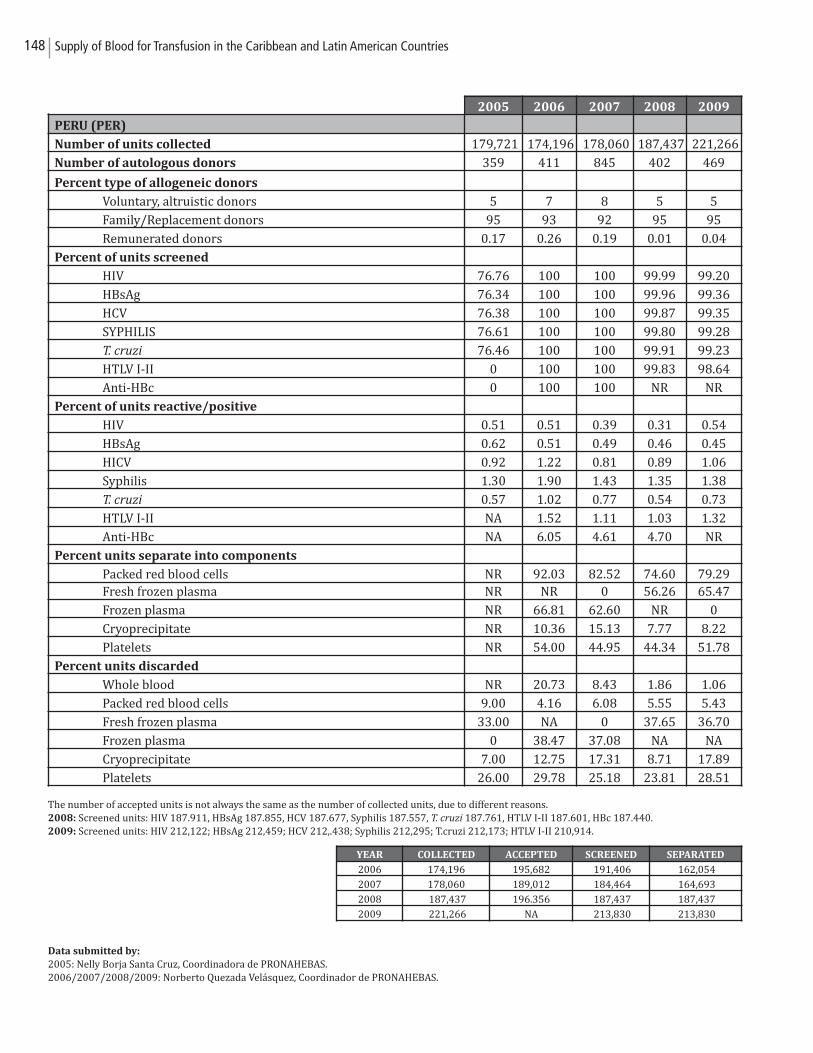
148 Supply of Blood for Transfusion in the Caribbean and Latin American Countries
The number of accepted units is not always the same as the number of collected units, due to different reasons.2008: Screened units: HIV 187.911, HBsAg 187.855, HCV 187.677, Syphilis 187.557, T. cruzi 187.761, HTLV I-II 187.601, HBc 187.440.2009: Screened units: HIV 212,122; HBsAg 212,459; HCV 212,.438; Syphilis 212,295; T.cruzi 212,173; HTLV I-II 210,914.
Data submitted by:
2005: Nelly Borja Santa Cruz, Coordinadora de PRONAHEBAS.2006/2007/2008/2009: Norberto Quezada Velásquez, Coordinador de PRONAHEBAS.
2005 2006 2007 2008 2009
PERU (PER)
Number of units collected 179,721 174,196 178,060 187,437 221,266
Number of autologous donors 359 411 845 402 469
Percent type of allogeneic donors
Voluntary, altruistic donors 5 7 8 5 5
Family/Replacement donors 95 93 92 95 95
Remunerated donors 0.17 0.26 0.19 0.01 0.04
Percent of units screened
HIV 76.76 100 100 99.99 99.20
HBsAg 76.34 100 100 99.96 99.36
HCV 76.38 100 100 99.87 99.35
SYPHILIS 76.61 100 100 99.80 99.28
T. cruzi 76.46 100 100 99.91 99.23
HTLV I-II 0 100 100 99.83 98.64
Anti-HBc 0 100 100 NR NR
Percent of units reactive/positive
HIV 0.51 0.51 0.39 0.31 0.54
HBsAg 0.62 0.51 0.49 0.46 0.45
HICV 0.92 1.22 0.81 0.89 1.06
Syphilis 1.30 1.90 1.43 1.35 1.38
T. cruzi 0.57 1.02 0.77 0.54 0.73
HTLV I-II NA 1.52 1.11 1.03 1.32
Anti-HBc NA 6.05 4.61 4.70 NR
Percent units separate into components
Packed red blood cells NR 92.03 82.52 74.60 79.29Fresh frozen plasma NR NR 0 56.26 65.47
Frozen plasma NR 66.81 62.60 NR 0
Cryoprecipitate NR 10.36 15.13 7.77 8.22
Platelets NR 54.00 44.95 44.34 51.78
Percent units discarded
Whole blood NR 20.73 8.43 1.86 1.06
Packed red blood cells 9.00 4.16 6.08 5.55 5.43
Fresh frozen plasma 33.00 NA 0 37.65 36.70
Frozen plasma 0 38.47 37.08 NA NA
Cryoprecipitate 7.00 12.75 17.31 8.71 17.89
Platelets 26.00 29.78 25.18 23.81 28.51
YEAR COLLECTED ACCEPTED SCREENED SEPARATED
2006 174,196 195,682 191,406 162,054
2007 178,060 189,012 184,464 164,693
2008 187,437 196.356 187,437 187,437
2009 221,266 NA 213,830 213,830
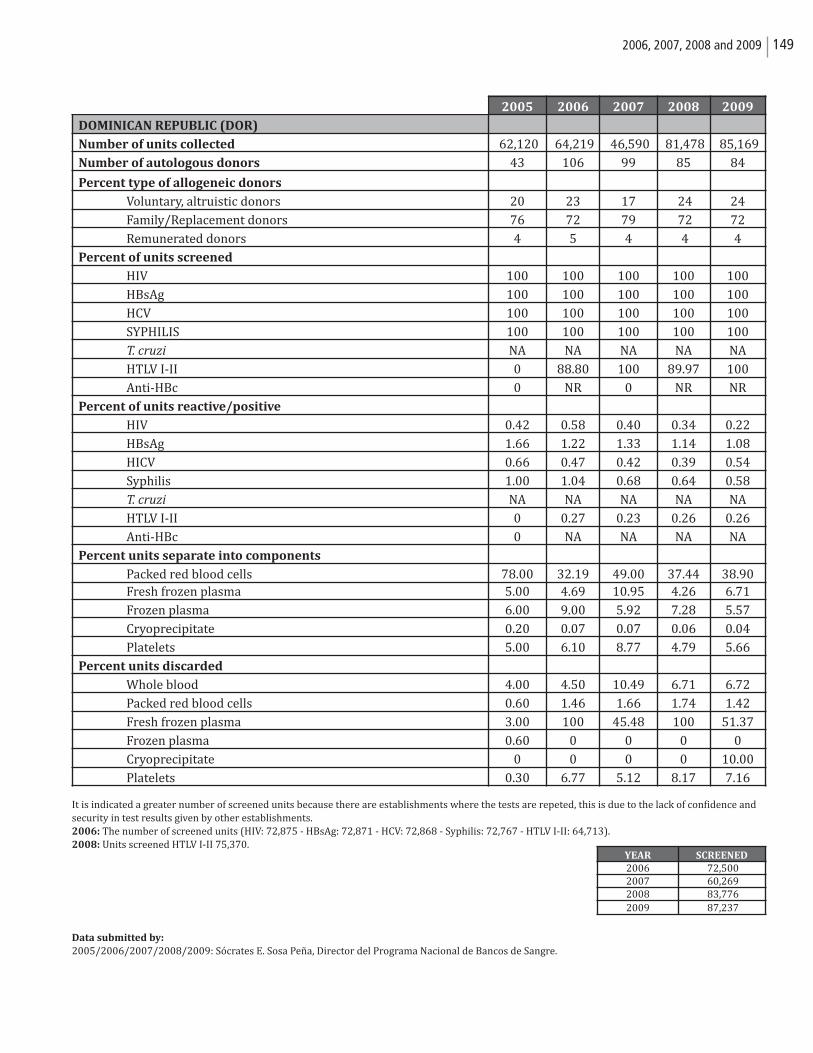
1492006, 2007, 2008 and 2009
It is indicated a greater number of screened units because there are establishments where the tests are repeted, this is due to the lack of confidence andsecurity in test results given by other establishments. 2006: The number of screened units (HIV: 72,875 - HBsAg: 72,871 - HCV: 72,868 - Syphilis: 72,767 - HTLV I-II: 64,713).2008: Units screened HTLV I-II 75,370.
Data submitted by:
2005/2006/2007/2008/2009: Sócrates E. Sosa Peña, Director del Programa Nacional de Bancos de Sangre.
2005 2006 2007 2008 2009
DOMINICAN REPUBLIC (DOR)
Number of units collected 62,120 64,219 46,590 81,478 85,169
Number of autologous donors 43 106 99 85 84
Percent type of allogeneic donors
Voluntary, altruistic donors 20 23 17 24 24
Family/Replacement donors 76 72 79 72 72
Remunerated donors 4 5 4 4 4
Percent of units screened
HIV 100 100 100 100 100
HBsAg 100 100 100 100 100
HCV 100 100 100 100 100
SYPHILIS 100 100 100 100 100
T. cruzi NA NA NA NA NA
HTLV I-II 0 88.80 100 89.97 100
Anti-HBc 0 NR 0 NR NR
Percent of units reactive/positive
HIV 0.42 0.58 0.40 0.34 0.22
HBsAg 1.66 1.22 1.33 1.14 1.08
HICV 0.66 0.47 0.42 0.39 0.54
Syphilis 1.00 1.04 0.68 0.64 0.58
T. cruzi NA NA NA NA NA
HTLV I-II 0 0.27 0.23 0.26 0.26
Anti-HBc 0 NA NA NA NA
Percent units separate into components
Packed red blood cells 78.00 32.19 49.00 37.44 38.90Fresh frozen plasma 5.00 4.69 10.95 4.26 6.71
Frozen plasma 6.00 9.00 5.92 7.28 5.57
Cryoprecipitate 0.20 0.07 0.07 0.06 0.04
Platelets 5.00 6.10 8.77 4.79 5.66
Percent units discarded
Whole blood 4.00 4.50 10.49 6.71 6.72
Packed red blood cells 0.60 1.46 1.66 1.74 1.42
Fresh frozen plasma 3.00 100 45.48 100 51.37
Frozen plasma 0.60 0 0 0 0
Cryoprecipitate 0 0 0 0 10.00
Platelets 0.30 6.77 5.12 8.17 7.16
YEAR SCREENED
2006 72,500 2007 60,269 2008 83,776 2009 87,237
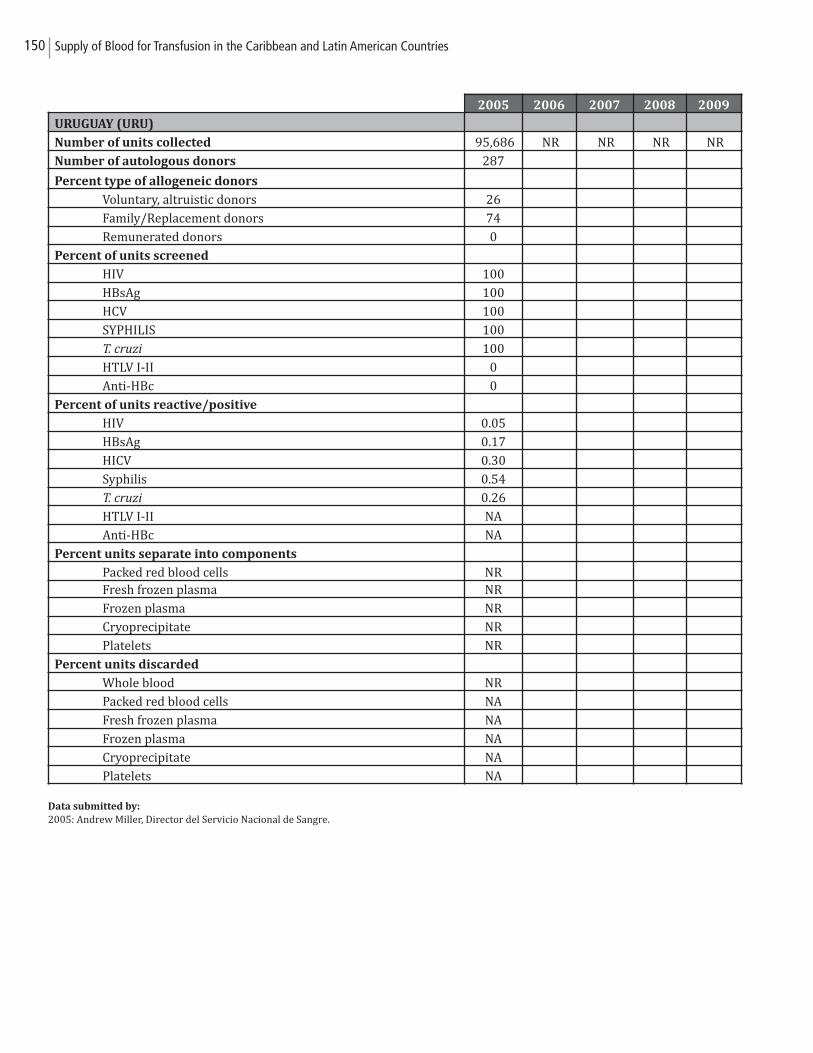
150 Supply of Blood for Transfusion in the Caribbean and Latin American Countries
Data submitted by:
2005: Andrew Miller, Director del Servicio Nacional de Sangre.
2005 2006 2007 2008 2009
URUGUAY (URU)
Number of units collected 95,686 NR NR NR NR
Number of autologous donors 287
Percent type of allogeneic donors
Voluntary, altruistic donors 26
Family/Replacement donors 74
Remunerated donors 0
Percent of units screened
HIV 100
HBsAg 100
HCV 100
SYPHILIS 100
T. cruzi 100
HTLV I-II 0
Anti-HBc 0
Percent of units reactive/positive
HIV 0.05
HBsAg 0.17
HICV 0.30
Syphilis 0.54
T. cruzi 0.26
HTLV I-II NA
Anti-HBc NA
Percent units separate into components
Packed red blood cells NRFresh frozen plasma NR
Frozen plasma NR
Cryoprecipitate NR
Platelets NR
Percent units discarded
Whole blood NR
Packed red blood cells NA
Fresh frozen plasma NA
Frozen plasma NA
Cryoprecipitate NA
Platelets NA
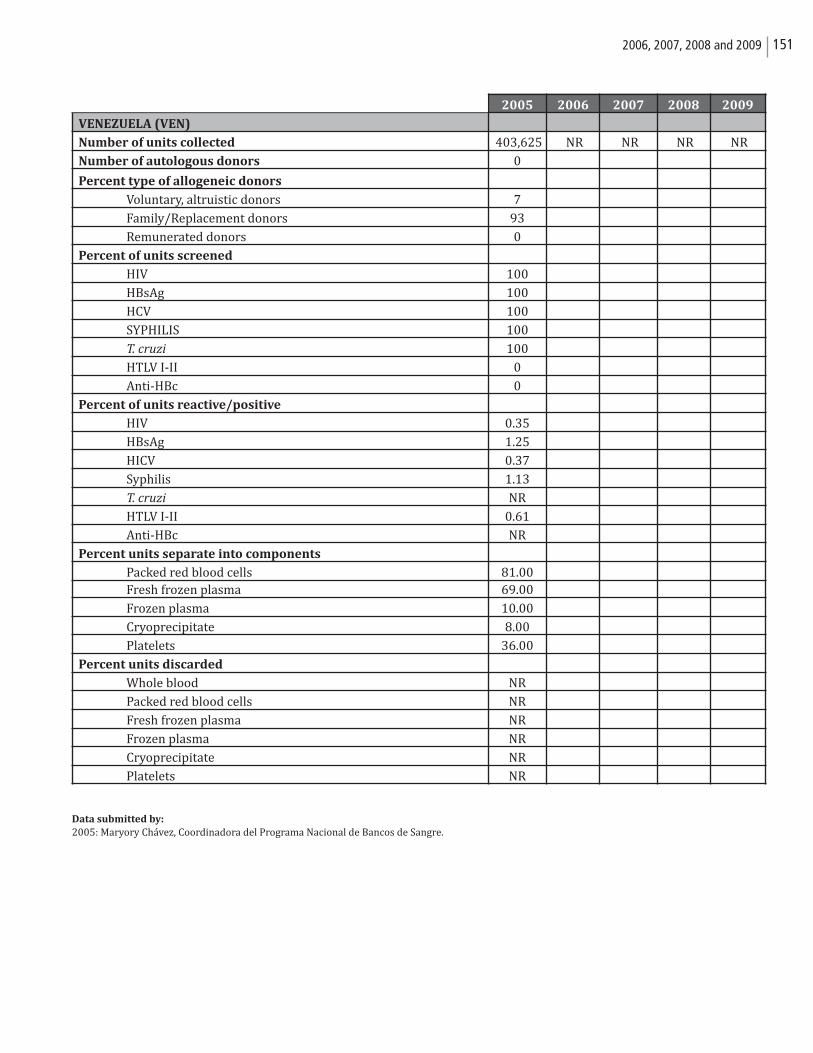
1512006, 2007, 2008 and 2009
Data submitted by:
2005: Maryory Chávez, Coordinadora del Programa Nacional de Bancos de Sangre.
2005 2006 2007 2008 2009
VENEZUELA (VEN)
Number of units collected 403,625 NR NR NR NR
Number of autologous donors 0
Percent type of allogeneic donors
Voluntary, altruistic donors 7
Family/Replacement donors 93
Remunerated donors 0
Percent of units screened
HIV 100
HBsAg 100
HCV 100
SYPHILIS 100
T. cruzi 100
HTLV I-II 0
Anti-HBc 0
Percent of units reactive/positive
HIV 0.35
HBsAg 1.25
HICV 0.37
Syphilis 1.13
T. cruzi NR
HTLV I-II 0.61
Anti-HBc NR
Percent units separate into components
Packed red blood cells 81.00Fresh frozen plasma 69.00
Frozen plasma 10.00
Cryoprecipitate 8.00
Platelets 36.00
Percent units discarded
Whole blood NR
Packed red blood cells NR
Fresh frozen plasma NR
Frozen plasma NR
Cryoprecipitate NR
Platelets NR

152 Supply of Blood for Transfusion in the Caribbean and Latin American Countries
1532006, 2007, 2008 and 2009
SUB–REGIONAL SUMMARIES

154 Supply of Blood for Transfusion in the Caribbean and Latin American Countries
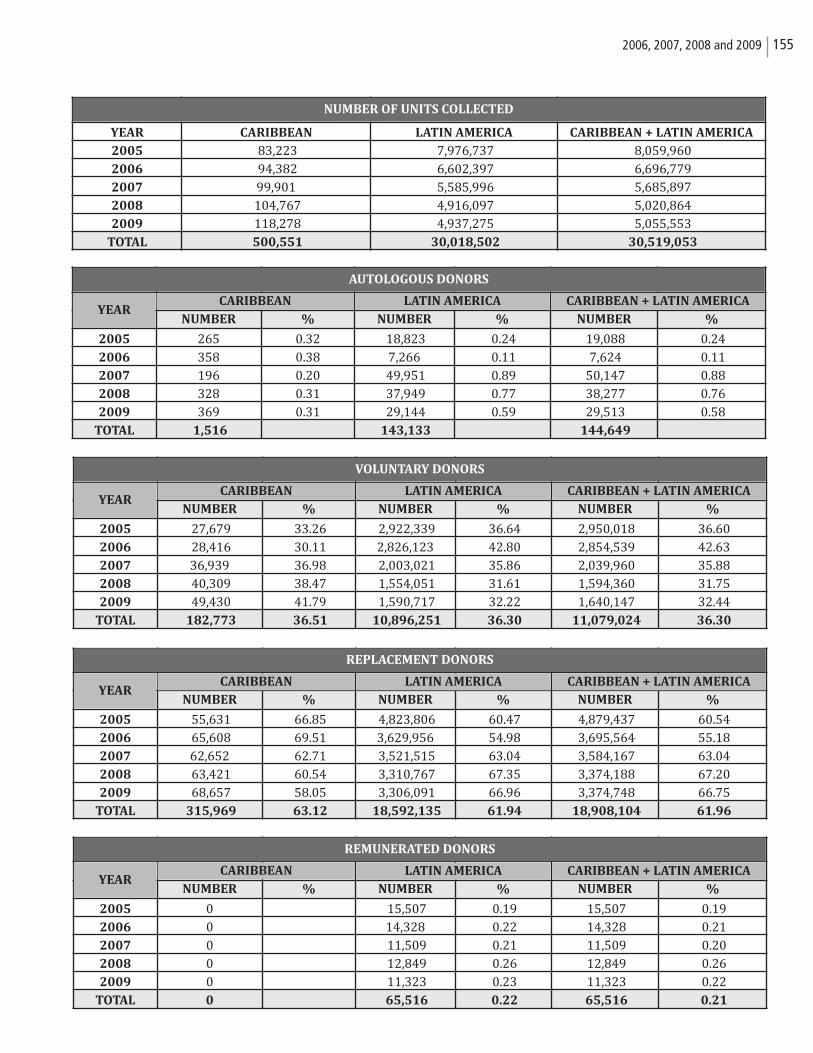
1552006, 2007, 2008 and 2009
YEAR CARIBBEAN LATIN AMERICA CARIBBEAN + LATIN AMERICA
2005 83,223 7,976,737 8,059,960 2006 94,382 6,602,397 6,696,779 2007 99,901 5,585,996 5,685,897 2008 104,767 4,916,097 5,020,864 2009 118,278 4,937,275 5,055,553
TOTAL 500,551 30,018,502 30,519,053
NUMBER OF UNITS COLLECTED
NUMBER % NUMBER % NUMBER %
2005 265 0.32 18,823 0.24 19,088 0.24 2006 358 0.38 7,266 0.11 7,624 0.11 2007 196 0.20 49,951 0.89 50,147 0.88 2008 328 0.31 37,949 0.77 38,277 0.76 2009 369 0.31 29,144 0.59 29,513 0.58
TOTAL 1,516 143,133 144,649
AUTOLOGOUS DONORS
CARIBBEAN + LATIN AMERICALATIN AMERICACARIBBEANYEAR
NUMBER % NUMBER % NUMBER %
2005 27,679 33.26 2,922,339 36.64 2,950,018 36.60 2006 28,416 30.11 2,826,123 42.80 2,854,539 42.63 2007 36,939 36.98 2,003,021 35.86 2,039,960 35.88 2008 40,309 38.47 1,554,051 31.61 1,594,360 31.75 2009 49,430 41.79 1,590,717 32.22 1,640,147 32.44
TOTAL 182,773 36.51 10,896,251 36.30 11,079,024 36.30
VOLUNTARY DONORS
CARIBBEAN + LATIN AMERICALATIN AMERICACARIBBEANYEAR
NUMBER % NUMBER % NUMBER %
2005 55,631 66.85 4,823,806 60.47 4,879,437 60.54 2006 65,608 69.51 3,629,956 54.98 3,695,564 55.18 2007 62,652 62.71 3,521,515 63.04 3,584,167 63.04 2008 63,421 60.54 3,310,767 67.35 3,374,188 67.20 2009 68,657 58.05 3,306,091 66.96 3,374,748 66.75
TOTAL 315,969 63.12 18,592,135 61.94 18,908,104 61.96
REPLACEMENT DONORS
CARIBBEAN + LATIN AMERICALATIN AMERICACARIBBEANYEAR
NUMBER % NUMBER % NUMBER %
2005 0 15,507 0.19 15,507 0.19 2006 0 14,328 0.22 14,328 0.21 2007 0 11,509 0.21 11,509 0.20 2008 0 12,849 0.26 12,849 0.26 2009 0 11,323 0.23 11,323 0.22
TOTAL 0 65,516 0.22 65,516 0.21
REMUNERATED DONORS
CARIBBEAN + LATIN AMERICALATIN AMERICACARIBBEANYEAR
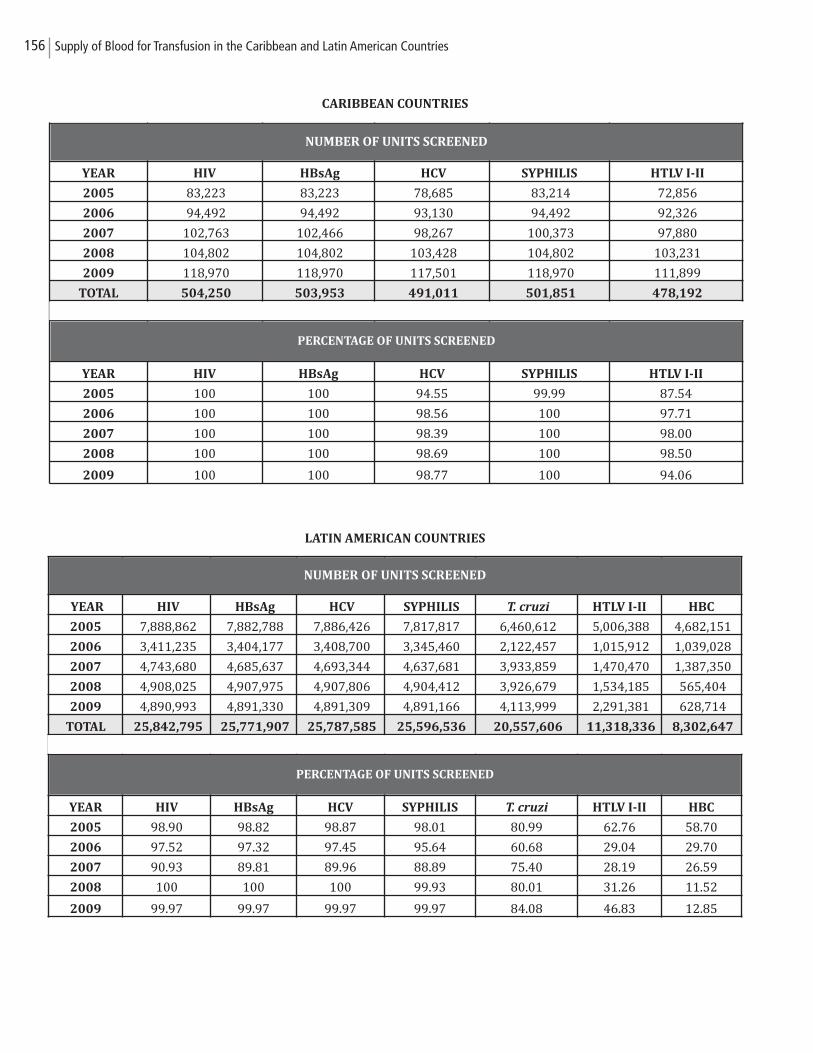
CARIBBEAN COUNTRIES
LATIN AMERICAN COUNTRIES
156 Supply of Blood for Transfusion in the Caribbean and Latin American Countries
YEAR HIV HBsAg HCV SYPHILIS T. cruzi HTLV I-II HBC
2005 7,888,862 7,882,788 7,886,426 7,817,817 6,460,612 5,006,388 4,682,151
2006 3,411,235 3,404,177 3,408,700 3,345,460 2,122,457 1,015,912 1,039,028
2007 4,743,680 4,685,637 4,693,344 4,637,681 3,933,859 1,470,470 1,387,350
2008 4,908,025 4,907,975 4,907,806 4,904,412 3,926,679 1,534,185 565,404
2009 4,890,993 4,891,330 4,891,309 4,891,166 4,113,999 2,291,381 628,714
TOTAL 25,842,795 25,771,907 25,787,585 25,596,536 20,557,606 11,318,336 8,302,647
YEAR HIV HBsAg HCV SYPHILIS T. cruzi HTLV I-II HBC
2005 98.90 98.82 98.87 98.01 80.99 62.76 58.70
2006 97.52 97.32 97.45 95.64 60.68 29.04 29.70
2007 90.93 89.81 89.96 88.89 75.40 28.19 26.59
2008 100 100 100 99.93 80.01 31.26 11.52
2009 99.97 99.97 99.97 99.97 84.08 46.83 12.85
NUMBER OF UNITS SCREENED
PERCENTAGE OF UNITS SCREENED
YEAR HIV HBsAg HCV SYPHILIS HTLV I-II
2005 83,223 83,223 78,685 83,214 72,856
2006 94,492 94,492 93,130 94,492 92,326
2007 102,763 102,466 98,267 100,373 97,880
2008 104,802 104,802 103,428 104,802 103,231
2009 118,970 118,970 117,501 118,970 111,899
TOTAL 504,250 503,953 491,011 501,851 478,192
YEAR HIV HBsAg HCV SYPHILIS HTLV I-II
2005 100 100 94.55 99.99 87.54
2006 100 100 98.56 100 97.71
2007 100 100 98.39 100 98.00
2008 100 100 98.69 100 98.50
2009 100 100 98.77 100 94.06
NUMBER OF UNITS SCREENED
PERCENTAGE OF UNITS SCREENED
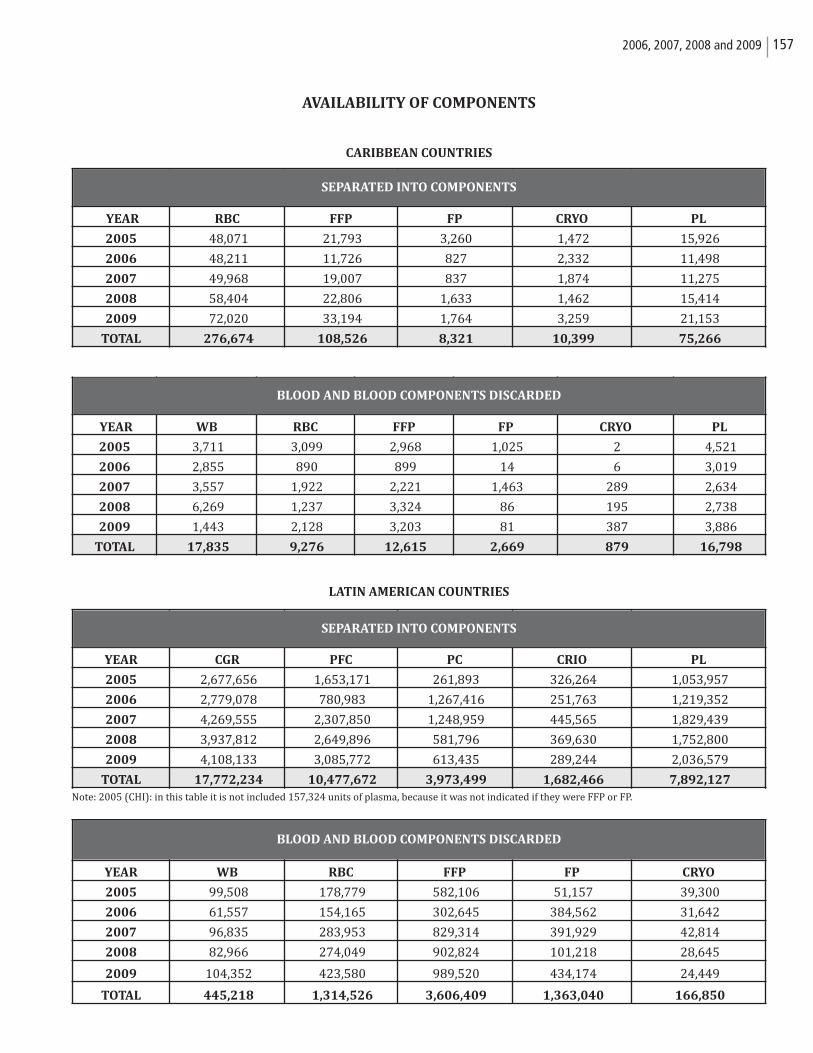
AVAILABILITY OF COMPONENTS
CARIBBEAN COUNTRIES
LATIN AMERICAN COUNTRIES
1572006, 2007, 2008 and 2009
YEAR CGR PFC PC CRIO PL
2005 2,677,656 1,653,171 261,893 326,264 1,053,957
2006 2,779,078 780,983 1,267,416 251,763 1,219,352
2007 4,269,555 2,307,850 1,248,959 445,565 1,829,439
2008 3,937,812 2,649,896 581,796 369,630 1,752,800
2009 4,108,133 3,085,772 613,435 289,244 2,036,579
TOTAL 17,772,234 10,477,672 3,973,499 1,682,466 7,892,127
YEAR WB RBC FFP FP CRYO
2005 99,508 178,779 582,106 51,157 39,300
2006 61,557 154,165 302,645 384,562 31,642
2007 96,835 283,953 829,314 391,929 42,814
2008 82,966 274,049 902,824 101,218 28,645
2009 104,352 423,580 989,520 434,174 24,449
TOTAL 445,218 1,314,526 3,606,409 1,363,040 166,850
SEPARATED INTO COMPONENTS
BLOOD AND BLOOD COMPONENTS DISCARDED
Note: 2005 (CHI): in this table it is not included 157,324 units of plasma, because it was not indicated if they were FFP or FP.
YEAR RBC FFP FP CRYO PL
2005 48,071 21,793 3,260 1,472 15,926
2006 48,211 11,726 827 2,332 11,498
2007 49,968 19,007 837 1,874 11,275
2008 58,404 22,806 1,633 1,462 15,414
2009 72,020 33,194 1,764 3,259 21,153
TOTAL 276,674 108,526 8,321 10,399 75,266
SEPARATED INTO COMPONENTS
YEAR WB RBC FFP FP CRYO PL
2005 3,711 3,099 2,968 1,025 2 4,521
2006 2,855 890 899 14 6 3,019
2007 3,557 1,922 2,221 1,463 289 2,634
2008 6,269 1,237 3,324 86 195 2,738
2009 1,443 2,128 3,203 81 387 3,886
TOTAL 17,835 9,276 12,615 2,669 879 16,798
BLOOD AND BLOOD COMPONENTS DISCARDED

158 Supply of Blood for Transfusion in the Caribbean and Latin American Countries
1592006, 2007, 2008 and 2009
ANNEX

160 Supply of Blood for Transfusion in the Caribbean and Latin American Countries
PAN AMERICAN HEALTH ORGANIZATION WORLD HEALTH ORGANIZATION
48th DIRECTING COUNCIL 60th SESSION OF THE REGIONAL COMMITTEE
Washington, D.C., USA, 29 September-3 October 2008
Provisional Agenda Item 4.7 CD48/11 (Eng.) 6 August 2008 ORIGINAL: ENGLISH
IMPROVING BLOOD AVAILABILITY AND TRANSFUSION SAFETY IN THE AMERICAS
Background 1. Since 1975 the World Health Assembly, the World Health Organization Executive Board and the Directing Council of the Pan American Health Organization have adopted several resolutions urging Member States to promote the establishment of coordinated blood services based on voluntary non-remunerated blood donation and on quality assurance, and to enact legislation and formulate national blood policies that facilitate the cost-effective organization and operation of blood services. The Governing Bodies have made it clear that it is necessary for the Member States to focus on blood transfusion safety as a means to improve patient care and to reduce the burden of HIV and other infections in the general population. 2. In 1999 the PAHO Directing Council adopted Resolution CD41.R15 and a Plan of Action that pursued the universal screening of blood units for HIV, hepatitis B (HBV) hepatitis C (HCV), and syphilis in the Region, and for T. cruzi in continental Latin America, universal participation of blood banks in programs of external evaluation of performance, 50% voluntary blood donation and the monitoring of high-risk groups for transfusion-transmitted infections. These expected results were not achieved by 2005. 3. In 2005, the PAHO Directing Council adopted Resolution CD46.R5, which urged the Member States to adopt the Regional Plan of Action for Transfusion Safety 2006-2010 and requested the Director to report periodically to the Governing Bodies on the progress of its implementation.
CD48/11 (Eng.) Page 2
4. A report on the challenges to achieve blood sufficiency, availability and safety in the Americas was presented to the Executive Committee during its 142nd Session in June 2008. The Executive Committee recommended that the Directing Council adopt a resolution as a means to enhance regional efforts to achieve the objective of the Regional Plan of Action for Transfusion Safety 2006-2010. 5. The objective of the Regional Plan of Action is to contribute to the reduction of mortality and to the improvement of patient care by making safe blood available in a timely manner for all those patients who need it. The Plan involves four strategies: Planning and Management of the National Blood Network System, Promotion of Voluntary Blood Donation, Quality Assurance, and Appropriate Use of Blood and Blood Components, and identified nine indicators of progress based on regional data for the period 2000-2003. Regional Situation in 2005 Screening Coverage 6. In 2003, 99.93% of the units collected by the Latin American and Caribbean countries that officially submitted reports to the Pan American Health Organization were screened for HIV, 99.86% were screened for HBV, 99.52% were screened for HCV, and 99.84% were screened for syphilis. The proportions of units that were screened for the four markers decreased to below 99% in 2004 and 2005 (Table 1). A negative trend was also observed for T. cruzi: the rates of screening were 87.17%, 86.20% and 87.06% in 2003, 2004 and 2005, respectively (Table 2). 7. In 2003 there were 19 (46%) countries that reported universal screening of all markers; there were 17 (41%) and 22 (54%) countries that screened all the collected units in 2004 and 2005, respectively (Table 3). Bolivia, Colombia, Honduras, Mexico, Nicaragua, Paraguay and Peru did not test all units for markers of viral infections in 2005. Nevertheless, two countries—Mexico and Peru—contributed 98.8% and 99.6% of the units that were not screened for HIV in 2004 and 2005, respectively. Anguilla, Belize, Dominica, and Saint Kitts and Nevis reported zero screening for HCV in 2005. External Performance Evaluation 8. The Regional Programs for External Performance Evaluation continued with support from the Spanish Agency for International Cooperation, the UKNEQAS, the International Consortium for Blood Safety, the Hemocentro in São Paulo, Brazil, and the Sevilla Transfusion Center in Spain (Tables 4 and 6). The purpose of these regional programs is to support the national reference centers that are responsible for organizing the national programs with participation of all local services. Local participation,
CD48/11 (Eng.) Page 3
nevertheless, is limited: in 2003 there were 1,330 (53.01%) national centers participating in national programs for external performance evaluation of serology for transfusion-transmitted infections. The proportion of participants decreased to 46.66% and 46.42% in 2004 and 2005 (Table 5). 9. Results from both the Regional and National Programs for External Performance Evaluation indicate that the quality of screening for serological markers of transfusion-transmitted infections has improved over the last four years. Some weaknesses remain in the immunohematological assays. Blood Donors 10. The proportion of voluntary blood donors in Latin American and Caribbean countries was 36.06% in 2003; that same year, 0.34% of blood units were collected from paid donors (Table 7). The proportion of voluntary blood donors remained unchanged between 2003 and 2005, although there was a reduction to 33.05% in 2004. Recognized paid donors accounted for only 0.19% of all units collected in 2005 (Table 7), but the actual number of individuals who receive money in exchange for their blood is unknown. In 2003, there were seven (17%) countries that reported more than 50% voluntary blood donors; Aruba, Brazil, Cayman Islands, Colombia, Costa Rica, Cuba, Curacao, Saint Lucia, and Suriname did so in 2005. 11. The median prevalence rate of infectious markers among blood donors was always higher in countries with less than 50% voluntary donation than in those countries with more than 50% voluntary donors (Table 8). Nevertheless, it is noteworthy that, while the prevalence rates of markers remained unchanged in the former group of countries, the rates for countries with more than 50% voluntary donors tended to increase from 2002 to 2005 (Table 8). 12. The higher rate of prevalence of infectious markers among donors in some countries and the larger number of units that were not screened in 2004 and 2005 resulted in higher estimates of transfusion-transmitted infections. In 2002 and 2003 the estimated numbers of HIV infections associated with transfusions were six per year. The corresponding numbers for 2004 and 2005 were 57 and 55, respectively (Table 9). There were also significant increases in the estimated number of HBV and HCV transfusion-associated infections (Table 9). Availability and Safety of Blood for Transfusion 13. The number of blood units collected in Latin America and the Caribbean increased from 7,325,093 in 2003 to 8,059,960 in 2005 (Table 10). The corresponding donation rates were 121.5/10,000 inhabitants in 2003 and 145.0/10,000 in 2005. There
CD48/11 (Eng.) Page 4
was, however, a wide range among national donation rates in 2005: the rate for Haiti was 12.7 and that for Cuba was 439.6. In all, there were 15 (42%) countries with donation rates below 100/10,000 inhabitants and five (14%) with rates above 200 (Table 13). 14. The actual availability of blood at the national level is affected by the prevalence of infectious markers among blood donors –units from donors who are found to have an infectious marker must not be used for transfusions. In 2005, the cumulative proportion of units discarded because they were reactive/positive in the laboratory tests varied from 0.03% in Curacao to 11.00% in Bolivia, with a median of 3.11% (Table 13). There were at least 3,562 (4.28%) units discarded in the Caribbean countries and 235,134 in Latin America due to reactivity/positivity in laboratory tests, although some countries did not test any of the units collected for markers of HCV and HTLVI/II and others reported the rate of donors that were confirmed as positive after being reactive in screening test. The 238,696 units discarded, at a direct cost of basic supplies of US$ 56 per unit, represented a loss of $13.4 million. 15. In the Caribbean and Latin American countries, rates of national availability of blood for transfusion are inversely related to national maternal mortality ratios and proportion of maternal deaths associated with hemorrhage. 16. In Latin America, transfusions are given primarily to treat medical and not surgical conditions; one of every seven patients who receive transfusions is under one year of age. Reduction of infant mortality, therefore, must consider availability of blood. 17. Treatment of road traffic injuries, which are predicted to increase by 67% by the year 2020, requires transfusions. Almost two thirds of blood used among patients of acute trauma is given during the first 24 hours of care. Timely availability of blood at the emergency services is a determinant factor of patient survival. 18. The risk of receiving a blood unit contaminated with HIV, HBV or HCV for lack of laboratory screening increased from 1 in 41,858 donations in 2003 to 1 in 11,784 donations in 2005 (Table 10). The risk was 8.79 times higher for HCV and 2.67 times higher for HBV than for HIV (Table 9). In continental Latin America, the risk of receiving a T. cruzi positive transfusion was 1 in 3,377 donations in 2005, which is similar to the risk observed in 2003 (1 in 3,330 donations) (Table 10). Efficiency of National Blood Systems 19. In Latin America, where countries collected between 42,771 and 3,738,580 units of blood in 2005, there is a wide range in the mean number of units processed by the individual blood services in a year: from 761 units in Argentina to 10,320 in Cuba. The seven countries with lowest mean annual collection per service had an average of
CD48/11 (Eng.) Page 5
11% voluntary blood donors, while the average voluntary donation was 51% in the six countries with the highest mean annual collection per service (Table 11). The mean donor deferral rate was lower, 7.9%, in the six countries with highest annual collection per service than in the other two groups of countries, 20.1% and 24.7%. Furthermore, the blood donation rate was 100.85 per 10,000 inhabitants in the group of countries with the less efficient blood collection systems, 115.90 in the intermediate group and 186.81 in the group of countries with blood services that collected a mean of 5,888 units per year (Table 11). There was no difference in the proportion of blood units discarded, which fluctuated around 10% in the three groups of countries (Table 11). 20. It is estimated that 603,950 units of red blood cells became outdated and were discarded in Latin America in 2005, for an estimated loss of $33.8 million. 21. In the Caribbean, where countries collected between 114 and 22,155 units of blood in 2005, donor deferral varied between 0% and 53%, with a median of 20%. The estimated number of deferred donors was 29,152 in 2005. Seven countries had deferral rates below 10%; the rate was between 20% and 53% in the other eight countries (Table 12). The median blood donation rate in the first group of countries was 167.6 (range 108.4 – 368.6) per 10,000 inhabitants, and 87.7 (range 12.7 – 118.9) in the second group. The median proportion of units that were reactive for any of the infectious markers was 0.90% (range 0.03% – 6.85%) in the first group and 4.09% (range 0.40% – 10.25%) in the second. Aruba, Cayman Islands, Curacao, and Suriname, the four countries with 100% voluntary blood donors, are in the first group. 22. It is estimated that 6,425 units of red blood cells became outdated and were discarded in the Caribbean countries in 2005, for a loss of $360,000. The median proportion of red blood cells discarded was 5.9% (range 2.0% – 15.7%) among countries with lower blood donor deferral rates, and 10.8% (range 1.8% – 14.7%) among countries with higher proportion of deferred donors (Table 12). Progress since 2005 23. The Regional Plan of Action 2006-2010 has nine progress indicators: • In order to strengthen the organizational and functional capacities of the national
blood systems, the legal framework is to be revised. Argentina, Colombia, Costa Rica, Dominican Republic, Ecuador, El Salvador, Guatemala, Mexico, Nicaragua, Panama, Paraguay, Guyana, Haiti and Jamaica have either started or completed the process. Only Paraguay has enacted a revised blood law.
• To allow the development of national plans, the allocation of resources and
appropriate evaluation of the national blood systems, the Regional Plan of Action
CD48/11 (Eng.) Page 6
included structured surveys to estimate the geographic and temporary blood requirements and blood components in the country. Aruba, Cuba, Curacao, Haiti, Paraguay, and Suriname have those estimates. Argentina, Bahamas, British Virgin Islands, Colombia, Costa Rica, Grenada, Guatemala, El Salvador, Saint Vincent and the Grenadines have either gross or partial estimates that do not take geographic and time variables into consideration.
• Considering that sufficiency and safety of blood can only be achieved through
voluntary blood donation, the countries adopted the goal of collecting more than 50% of their blood units from voluntary blood donors. Aruba, Brazil, Cayman Islands, Colombia, Costa Rica, Cuba, Curacao, Saint Lucia, and Suriname have achieved this goal.
• Argentina, Brazil, Colombia, Costa Rica, Cuba, Curacao, Haiti, Paraguay and
Suriname have initiated the implementation of national quality assurance programs.
• To facilitate better patient care and planning of the national bloods systems it is
necessary to develop national guidelines for the clinical use of blood. Argentina, Aruba, Belize, Bolivia, Brazil, Costa Rica, Cuba, Curacao, Ecuador, El Salvador, Guyana, Haiti, Jamaica, Mexico, Nicaragua, and Paraguay have prepared their guidelines.
• Belize, Costa Rica, Cuba, Guyana, Nicaragua and Suriname have established
national blood transfusion committees. • Brazil, Colombia, Cuba and Nicaragua have implemented hemovigilance systems. • Colombia, Cuba, Curacao and Nicaragua have prepared components in at least
95% of the blood units collected. • Nine Latin American countries—Argentina, Brazil, Colombia, Cuba, El Salvador,
Mexico, Nicaragua, Panama and Paraguay—have designed a regionalized national system for blood collection and processing.
Lessons Learned, Enablers and Obstacles for Progress, and Recommendations 24. Progress was made in blood safety in the Region of the Americas from 2000 to 2003 (Tables 1, 2, 3, 7, 9, 10). Unfortunately, despite the fact that some countries initiated or achieved universal screening of blood for infectious markers, the overall risk of receiving a virus-contaminated transfusion—estimated by using the number of
CD48/11 (Eng.) Page 7
unscreened blood units and the prevalence of infectious markers among blood donors—increased almost fourfold from 2003 to 2005 (Table 10). 25. Similarly, the proportion of voluntary blood donors in the Region increased from 15% in 2000 to 36% in 2003, but remained unchanged in the last two years (Table 7). Despite the increase in the number of voluntary blood donors, the proportion of those who are reactive/positive for infectious markers gradually increased from 2003 to 2005 (Table 8). This observation is associated with first-time or sporadic voluntary blood donors and underscores the need to pursue repeated and regular voluntary blood donation. 26. The number of blood units to be collected annually determines resources necessary to recruit blood donors, to procure supplies, and to collect, process, store and distribute blood components. It is difficult to appropriately plan and allocate national resources to blood systems when the need for blood and blood components in the country are unknown. 27. Central national health authorities have difficulties in organizing the different sectors (provincial or state authorities, social security, private and non-profit organizations) to implement national blood collection, processing and transfusion systems because the local factors that determine availability, opportunity, safety and efficacy of blood for transfusions are not taken into consideration for planning. In countries where structured efforts are being made, the political will and the technical skills of those at the normative level within the ministry of health determine the level of success. The permanent technical involvement of the PAHO Country Office is an important factor. 28. Regional work plans approved by the Directing Council in 1999 and in 2005 included the achievement of the goal of 50% voluntary blood donation. This goal was agreed upon by the national blood programs in order to induce gradual changes that would be acceptable to health workers. In retrospect, aiming for 50% voluntary blood donation results in policy, ethical and operational challenges since half of the recipient patients have to provide replacement donors; voluntary and replacement donors are handled differently by the blood services, and the access to blood in healthcare facilities is hindered by administrative processes of cost recovery. Pursuing the goal of 100% voluntary blood donation in the short term will result in the multidisciplinary operational approaches that were identified as vital in 2005. 29. Blood services need to work in three different spheres: (a) the community, to educate, recruit, select and maintain a healthy and committed donor pool; (b) within the blood processing center, as a factory of essential medicaments; and (c) the clinical services where patients are treated. Staffs with appropriate competencies, adequate
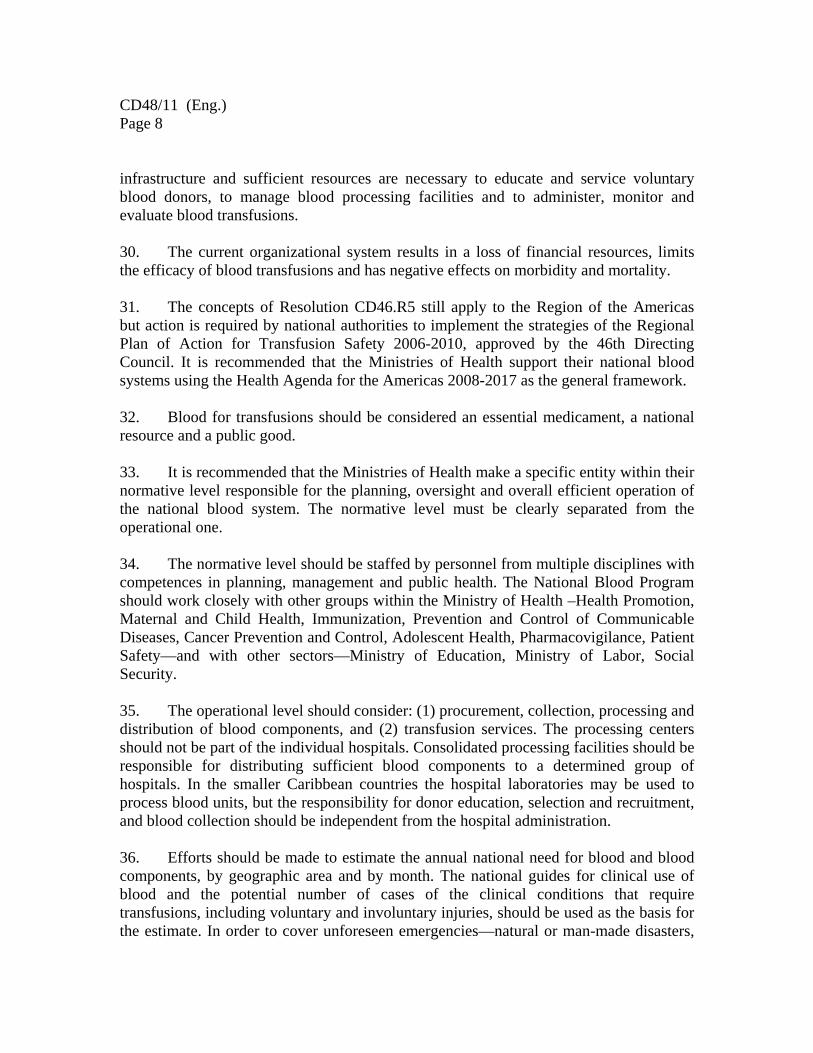
CD48/11 (Eng.) Page 8
infrastructure and sufficient resources are necessary to educate and service voluntary blood donors, to manage blood processing facilities and to administer, monitor and evaluate blood transfusions. 30. The current organizational system results in a loss of financial resources, limits the efficacy of blood transfusions and has negative effects on morbidity and mortality. 31. The concepts of Resolution CD46.R5 still apply to the Region of the Americas but action is required by national authorities to implement the strategies of the Regional Plan of Action for Transfusion Safety 2006-2010, approved by the 46th Directing Council. It is recommended that the Ministries of Health support their national blood systems using the Health Agenda for the Americas 2008-2017 as the general framework. 32. Blood for transfusions should be considered an essential medicament, a national resource and a public good. 33. It is recommended that the Ministries of Health make a specific entity within their normative level responsible for the planning, oversight and overall efficient operation of the national blood system. The normative level must be clearly separated from the operational one. 34. The normative level should be staffed by personnel from multiple disciplines with competences in planning, management and public health. The National Blood Program should work closely with other groups within the Ministry of Health –Health Promotion, Maternal and Child Health, Immunization, Prevention and Control of Communicable Diseases, Cancer Prevention and Control, Adolescent Health, Pharmacovigilance, Patient Safety—and with other sectors—Ministry of Education, Ministry of Labor, Social Security. 35. The operational level should consider: (1) procurement, collection, processing and distribution of blood components, and (2) transfusion services. The processing centers should not be part of the individual hospitals. Consolidated processing facilities should be responsible for distributing sufficient blood components to a determined group of hospitals. In the smaller Caribbean countries the hospital laboratories may be used to process blood units, but the responsibility for donor education, selection and recruitment, and blood collection should be independent from the hospital administration. 36. Efforts should be made to estimate the annual national need for blood and blood components, by geographic area and by month. The national guides for clinical use of blood and the potential number of cases of the clinical conditions that require transfusions, including voluntary and involuntary injuries, should be used as the basis for the estimate. In order to cover unforeseen emergencies—natural or man-made disasters,
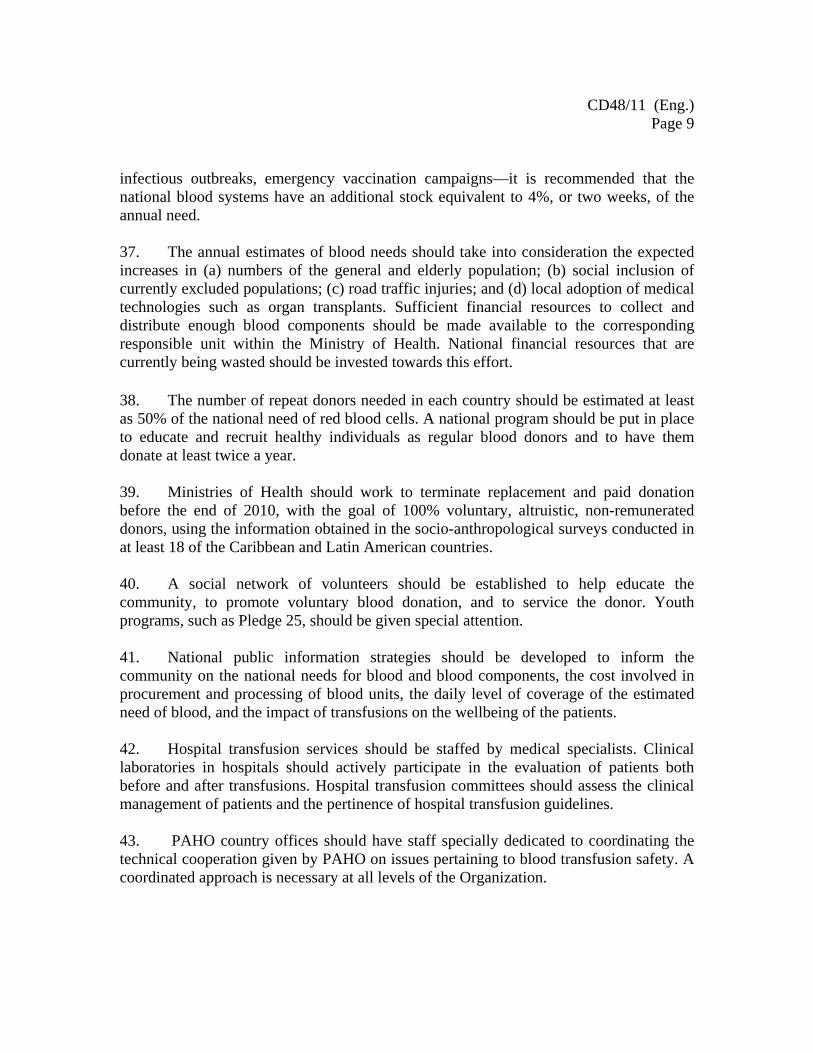
CD48/11 (Eng.) Page 9
infectious outbreaks, emergency vaccination campaigns—it is recommended that the national blood systems have an additional stock equivalent to 4%, or two weeks, of the annual need. 37. The annual estimates of blood needs should take into consideration the expected increases in (a) numbers of the general and elderly population; (b) social inclusion of currently excluded populations; (c) road traffic injuries; and (d) local adoption of medical technologies such as organ transplants. Sufficient financial resources to collect and distribute enough blood components should be made available to the corresponding responsible unit within the Ministry of Health. National financial resources that are currently being wasted should be invested towards this effort.
38. The number of repeat donors needed in each country should be estimated at least as 50% of the national need of red blood cells. A national program should be put in place to educate and recruit healthy individuals as regular blood donors and to have them donate at least twice a year. 39. Ministries of Health should work to terminate replacement and paid donation before the end of 2010, with the goal of 100% voluntary, altruistic, non-remunerated donors, using the information obtained in the socio-anthropological surveys conducted in at least 18 of the Caribbean and Latin American countries. 40. A social network of volunteers should be established to help educate the community, to promote voluntary blood donation, and to service the donor. Youth programs, such as Pledge 25, should be given special attention. 41. National public information strategies should be developed to inform the community on the national needs for blood and blood components, the cost involved in procurement and processing of blood units, the daily level of coverage of the estimated need of blood, and the impact of transfusions on the wellbeing of the patients. 42. Hospital transfusion services should be staffed by medical specialists. Clinical laboratories in hospitals should actively participate in the evaluation of patients both before and after transfusions. Hospital transfusion committees should assess the clinical management of patients and the pertinence of hospital transfusion guidelines. 43. PAHO country offices should have staff specially dedicated to coordinating the technical cooperation given by PAHO on issues pertaining to blood transfusion safety. A coordinated approach is necessary at all levels of the Organization.
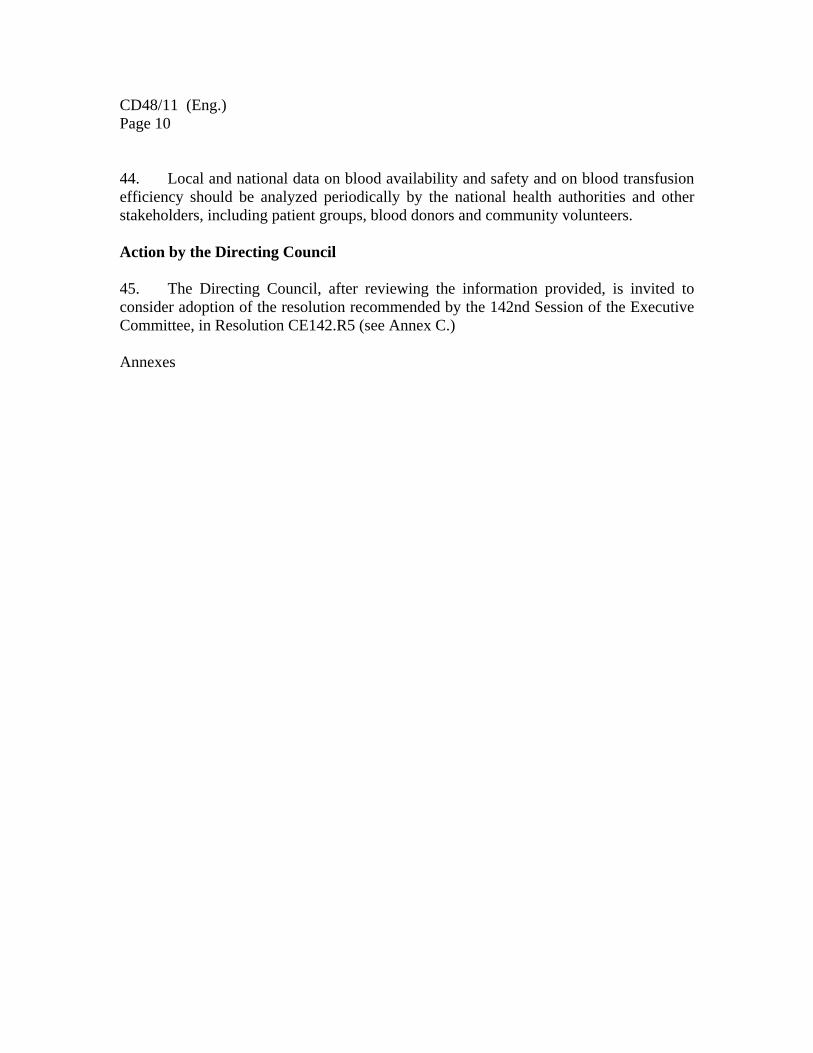
CD48/11 (Eng.) Page 10
44. Local and national data on blood availability and safety and on blood transfusion efficiency should be analyzed periodically by the national health authorities and other stakeholders, including patient groups, blood donors and community volunteers. Action by the Directing Council 45. The Directing Council, after reviewing the information provided, is invited to consider adoption of the resolution recommended by the 142nd Session of the Executive Committee, in Resolution CE142.R5 (see Annex C.) Annexes
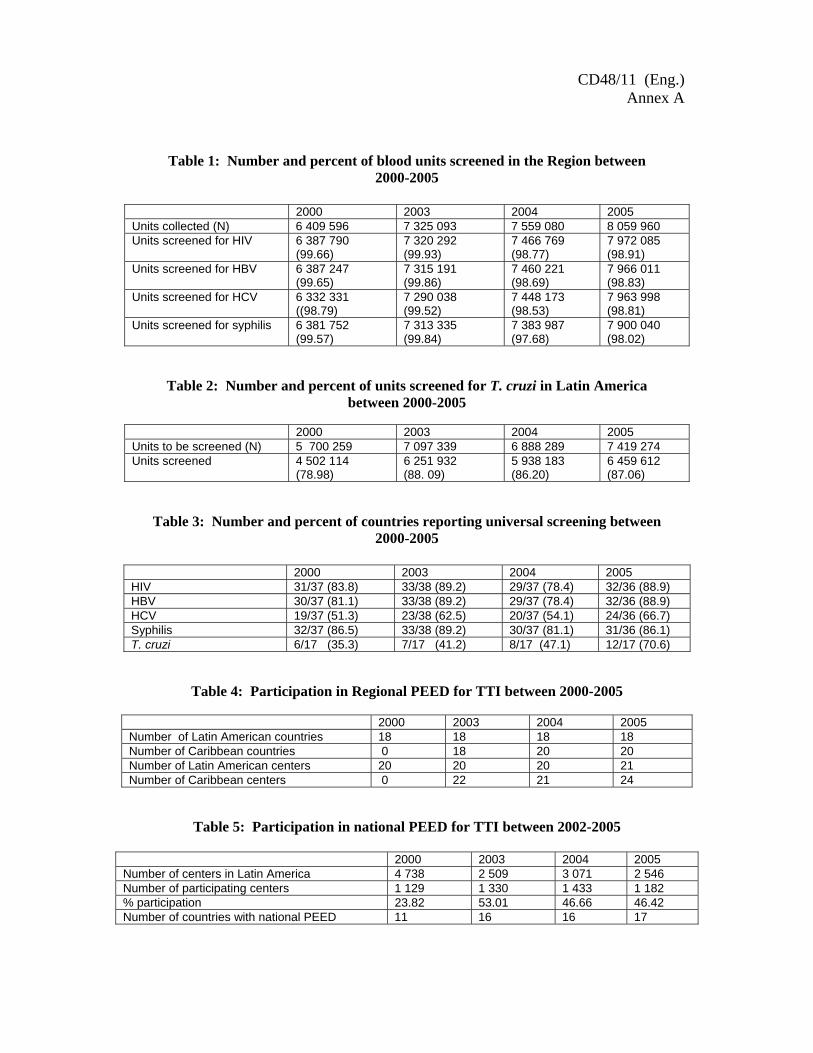
CE142/20 (Eng.) Annex
Table 1: Number and percent of blood units screened in the Region between 2000-2005
2000 2003 2004 2005 Units collected (N) 6 409 596 7 325 093 7 559 080 8 059 960 Units screened for HIV 6 387 790
(99.66) 7 320 292 (99.93)
7 466 769 (98.77)
7 972 085 (98.91)
Units screened for HBV 6 387 247 (99.65)
7 315 191 (99.86)
7 460 221 (98.69)
7 966 011 (98.83)
Units screened for HCV 6 332 331 ((98.79)
7 290 038 (99.52)
7 448 173 (98.53)
7 963 998 (98.81)
Units screened for syphilis 6 381 752 (99.57)
7 313 335 (99.84)
7 383 987 (97.68)
7 900 040 (98.02)
Table 2: Number and percent of units screened for T. cruzi in Latin America between 2000-2005
2000 2003 2004 2005 Units to be screened (N) 5 700 259 7 097 339 6 888 289 7 419 274 Units screened 4 502 114
(78.98) 6 251 932 (88. 09)
5 938 183 (86.20)
6 459 612 (87.06)
Table 3: Number and percent of countries reporting universal screening between 2000-2005
2000 2003 2004 2005 HIV 31/37 (83.8) 33/38 (89.2) 29/37 (78.4) 32/36 (88.9) HBV 30/37 (81.1) 33/38 (89.2) 29/37 (78.4) 32/36 (88.9) HCV 19/37 (51.3) 23/38 (62.5) 20/37 (54.1) 24/36 (66.7) Syphilis 32/37 (86.5) 33/38 (89.2) 30/37 (81.1) 31/36 (86.1) T. cruzi 6/17 (35.3) 7/17 (41.2) 8/17 (47.1) 12/17 (70.6)
Table 4: Participation in Regional PEED for TTI between 2000-2005
2000 2003 2004 2005 Number of Latin American countries 18 18 18 18 Number of Caribbean countries 0 18 20 20 Number of Latin American centers 20 20 20 21 Number of Caribbean centers 0 22 21 24
Table 5: Participation in national PEED for TTI between 2002-2005
2000 2003 2004 2005 Number of centers in Latin America 4 738 2 509 3 071 2 546 Number of participating centers 1 129 1 330 1 433 1 182 % participation 23.82 53.01 46.66 46.42 Number of countries with national PEED 11 16 16 17
CD48/11 (Eng.) Annex A
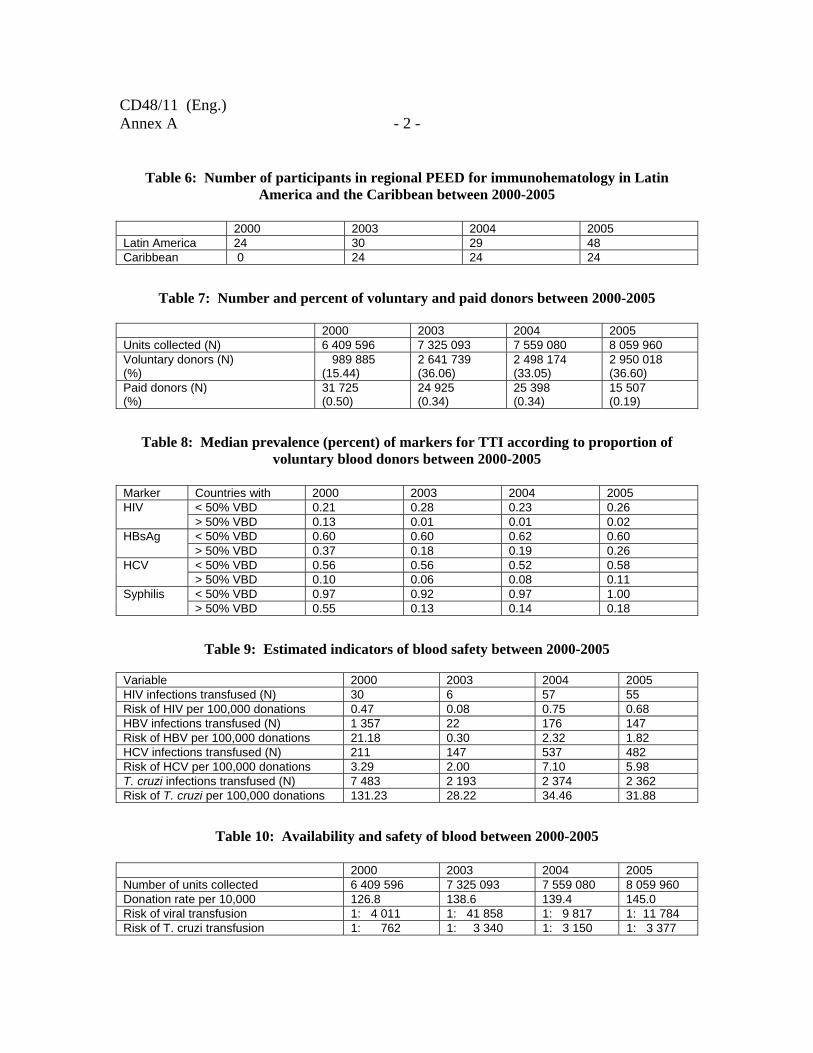
CD48/11 (Eng.) Annex A - 2 -
Table 6: Number of participants in regional PEED for immunohematology in Latin America and the Caribbean between 2000-2005
2000 2003 2004 2005 Latin America 24 30 29 48 Caribbean 0 24 24 24
Table 7: Number and percent of voluntary and paid donors between 2000-2005
2000 2003 2004 2005 Units collected (N) 6 409 596 7 325 093 7 559 080 8 059 960 Voluntary donors (N) (%)
989 885 (15.44)
2 641 739 (36.06)
2 498 174 (33.05)
2 950 018 (36.60)
Paid donors (N) (%)
31 725 (0.50)
24 925 (0.34)
25 398 (0.34)
15 507 (0.19)
Table 8: Median prevalence (percent) of markers for TTI according to proportion of voluntary blood donors between 2000-2005
Marker Countries with 2000 2003 2004 2005
< 50% VBD 0.21 0.28 0.23 0.26 HIV > 50% VBD 0.13 0.01 0.01 0.02 < 50% VBD 0.60 0.60 0.62 0.60 HBsAg > 50% VBD 0.37 0.18 0.19 0.26 < 50% VBD 0.56 0.56 0.52 0.58 HCV > 50% VBD 0.10 0.06 0.08 0.11 < 50% VBD 0.97 0.92 0.97 1.00 Syphilis > 50% VBD 0.55 0.13 0.14 0.18
Table 9: Estimated indicators of blood safety between 2000-2005 Variable 2000 2003 2004 2005 HIV infections transfused (N) 30 6 57 55 Risk of HIV per 100,000 donations 0.47 0.08 0.75 0.68 HBV infections transfused (N) 1 357 22 176 147 Risk of HBV per 100,000 donations 21.18 0.30 2.32 1.82 HCV infections transfused (N) 211 147 537 482 Risk of HCV per 100,000 donations 3.29 2.00 7.10 5.98 T. cruzi infections transfused (N) 7 483 2 193 2 374 2 362 Risk of T. cruzi per 100,000 donations 131.23 28.22 34.46 31.88
Table 10: Availability and safety of blood between 2000-2005
2000 2003 2004 2005 Number of units collected 6 409 596 7 325 093 7 559 080 8 059 960 Donation rate per 10,000 126.8 138.6 139.4 145.0 Risk of viral transfusion 1: 4 011 1: 41 858 1: 9 817 1: 11 784 Risk of T. cruzi transfusion 1: 762 1: 3 340 1: 3 150 1: 3 377
CD48/11 (Eng.) - 3 - Annex A
Table 11: Efficiency of national blood systems in Latin America, 2005
Group1 Group 2 Group 3
Variable
Argentina Dominican Republic
Uruguay Venezuela Guatemala
Panama Peru
Bolivia Nicaragua
Chile Honduras
Mexico El Salvador
Costa Rica Paraguay Colombia Ecuador
Brazil Cuba
Mean number of units collected per bank
1,404 2,334 5.888
Mean GNP per capita (US $) 3,664 3,123 2,628 Population x 1,000 121,613 152,079 266,987 Units collected 1.226,526 1.762,623 4.987,588 Donation rate per 10,000 100.85 115.90 186.81 Mean voluntary donors (%) 11.0 18.5 51.3 Mean donor deferral (%) 20.1 24.7 7.9 Mean units discarded (%) 10.7 9.9 10.3
Table 12: Efficiency of national blood systems in the Caribbean, 2005
Group 1 Donor deferral rate (%)
Voluntary donors (%)
Prevalence TTI (%)
Discard rate (%)
St Kitts and Nevis 0 3 6.85 NR Curacao 0.3 100 0.03 2.0 Aruba 2 100 0.90 2.0 Suriname 4.6 100 0.14 5.9 Bahamas 5 15 2.23 15.70 Dominica 9 5 5.41 7.1 Cayman Islands 10 100 0.11 20.0
Group 2 St. Vincent and the Grenadines
20 13 6.68 12.7
Guyana 24 22 4.09 6.5 Grenada 26.7 30 4.20 10.8 Haiti 27 15 10.25 7.2 Belize 39.0 9 1.89 11.5 St. Lucia 39.1 82 1.55 14.7 Trinidad and Tobago
44 13 4.69 NR
Anguilla 53 10 0.40 1.8
CD48/11 (Eng.) Annex A - 4 -
Table 13: Blood donation rate per 10,000 inhabitants and proportion of units
reactive/positive for infectious markers in 2005
Country Donation rate
% TTI markers Country Donation rate
% TTI markers
Anguilla 87.7 0.40 Argentina 94.2 6.49 Aruba 367.8 0.90 Bolivia 50.9 11.00 Bahamas 159.5 2.23 Brazil 200.5 2.93 Belize 115.1 1.89 Chile 109.2 1.54*
Colombia 115.7 3.11 British Virgin Islands 194.3 0.22
Costa Rica 125.1 0.49*
Cayman Islands 196.4 0.11 Cuba 439.6 1.65* Curacao 368.6 0.03 Ecuador 94.3 0.39* Dominica 109.7 5.41 El Salvador 116.5 3.98 Grenada 92.8 4.20 Guatemala 61.3 6.39 Guyana 70.1 4.09 Honduras 72.6 3.98 Haiti 12.7 10.25 Mexico 126.2 1.89 Jamaica 83.6 5.40 Nicaragua 98.6 3.82 St Kitts and Nevis 108.4 6.85 Panama 132.3 1.28 St Lucia 118.9 1.55 Paraguay 76.4 9.98
Peru 64.2 3.92 St. Vincent and the Grenadines
69.0 6.68
Dominican Republic
69.8 3.74
Suriname 167.6 0.14 Uruguay 276.3 1.32 Trinidad and Tobago 104.4 4.69 Venezuela 150.8 3.71 * Reported tests confirmed as positive. The rest of the countries reported units that were reactive in screening tests.
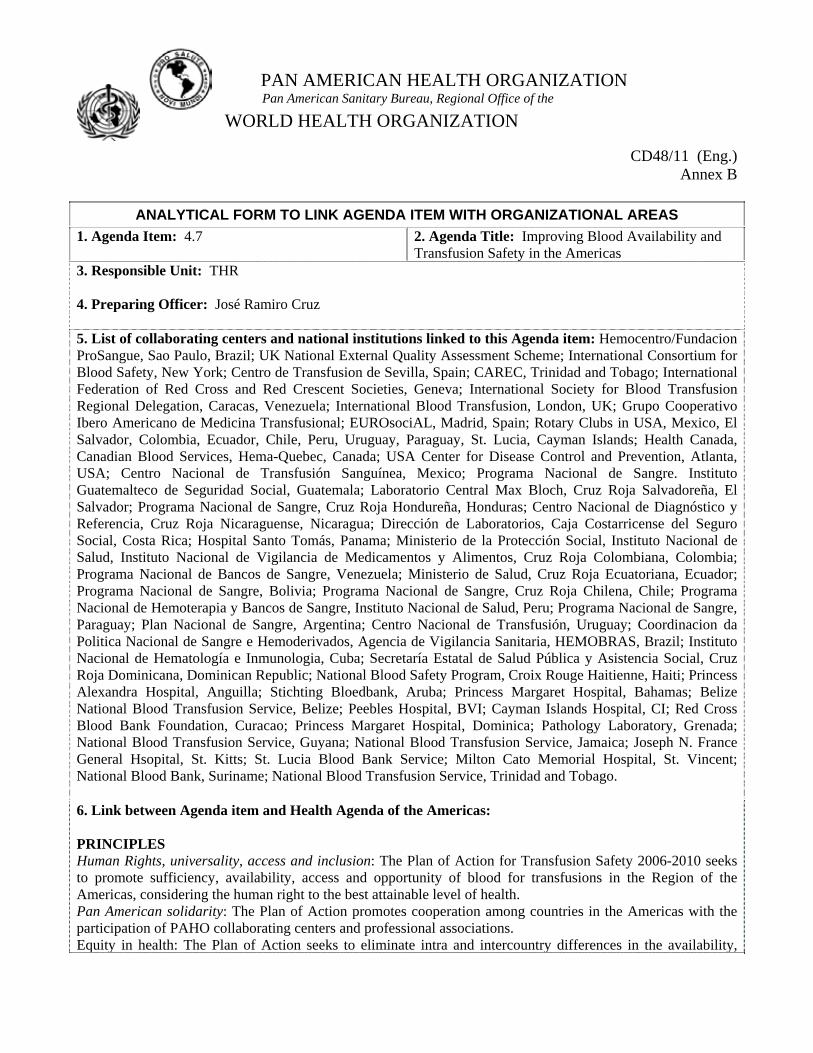
PAN AMERICAN HEALTH ORGANIZATION Pan American Sanitary Bureau, Regional Office of the
WORLD HEALTH ORGANIZATION
CD48/11 (Eng.) Annex B
ANALYTICAL FORM TO LINK AGENDA ITEM WITH ORGANIZATIONAL AREAS
1. Agenda Item: 4.7
2. Agenda Title: Improving Blood Availability and Transfusion Safety in the Americas
3. Responsible Unit: THR 4. Preparing Officer: José Ramiro Cruz 5. List of collaborating centers and national institutions linked to this Agenda item: Hemocentro/Fundacion ProSangue, Sao Paulo, Brazil; UK National External Quality Assessment Scheme; International Consortium for Blood Safety, New York; Centro de Transfusion de Sevilla, Spain; CAREC, Trinidad and Tobago; International Federation of Red Cross and Red Crescent Societies, Geneva; International Society for Blood Transfusion Regional Delegation, Caracas, Venezuela; International Blood Transfusion, London, UK; Grupo Cooperativo Ibero Americano de Medicina Transfusional; EUROsociAL, Madrid, Spain; Rotary Clubs in USA, Mexico, El Salvador, Colombia, Ecuador, Chile, Peru, Uruguay, Paraguay, St. Lucia, Cayman Islands; Health Canada, Canadian Blood Services, Hema-Quebec, Canada; USA Center for Disease Control and Prevention, Atlanta, USA; Centro Nacional de Transfusión Sanguínea, Mexico; Programa Nacional de Sangre. Instituto Guatemalteco de Seguridad Social, Guatemala; Laboratorio Central Max Bloch, Cruz Roja Salvadoreña, El Salvador; Programa Nacional de Sangre, Cruz Roja Hondureña, Honduras; Centro Nacional de Diagnóstico y Referencia, Cruz Roja Nicaraguense, Nicaragua; Dirección de Laboratorios, Caja Costarricense del Seguro Social, Costa Rica; Hospital Santo Tomás, Panama; Ministerio de la Protección Social, Instituto Nacional de Salud, Instituto Nacional de Vigilancia de Medicamentos y Alimentos, Cruz Roja Colombiana, Colombia; Programa Nacional de Bancos de Sangre, Venezuela; Ministerio de Salud, Cruz Roja Ecuatoriana, Ecuador; Programa Nacional de Sangre, Bolivia; Programa Nacional de Sangre, Cruz Roja Chilena, Chile; Programa Nacional de Hemoterapia y Bancos de Sangre, Instituto Nacional de Salud, Peru; Programa Nacional de Sangre, Paraguay; Plan Nacional de Sangre, Argentina; Centro Nacional de Transfusión, Uruguay; Coordinacion da Politica Nacional de Sangre e Hemoderivados, Agencia de Vigilancia Sanitaria, HEMOBRAS, Brazil; Instituto Nacional de Hematología e Inmunologia, Cuba; Secretaría Estatal de Salud Pública y Asistencia Social, Cruz Roja Dominicana, Dominican Republic; National Blood Safety Program, Croix Rouge Haitienne, Haiti; Princess Alexandra Hospital, Anguilla; Stichting Bloedbank, Aruba; Princess Margaret Hospital, Bahamas; Belize National Blood Transfusion Service, Belize; Peebles Hospital, BVI; Cayman Islands Hospital, CI; Red Cross Blood Bank Foundation, Curacao; Princess Margaret Hospital, Dominica; Pathology Laboratory, Grenada; National Blood Transfusion Service, Guyana; National Blood Transfusion Service, Jamaica; Joseph N. France General Hsopital, St. Kitts; St. Lucia Blood Bank Service; Milton Cato Memorial Hospital, St. Vincent; National Blood Bank, Suriname; National Blood Transfusion Service, Trinidad and Tobago. 6. Link between Agenda item and Health Agenda of the Americas: PRINCIPLES Human Rights, universality, access and inclusion: The Plan of Action for Transfusion Safety 2006-2010 seeks to promote sufficiency, availability, access and opportunity of blood for transfusions in the Region of the Americas, considering the human right to the best attainable level of health. Pan American solidarity: The Plan of Action promotes cooperation among countries in the Americas with the participation of PAHO collaborating centers and professional associations. Equity in health: The Plan of Action seeks to eliminate intra and intercountry differences in the availability,
- 2 -
access, opportunity, and quality of blood for transfusions with a public health approach. Social participation: The document CD48/11 clearly states that a social network is indispensable to attain 100% voluntary blood donation and sufficiency of blood. AREAS OF ACTION Strengthening the health authority: The Plan of Action 2006-2010 comprises four strategies. The first, Planning and Management of the National Blood Network System, requires a strong leadership of the Ministry of Health. Paragraphs 27, 29, 30, 31, 33, 34, 39 of document CD48/11 refer to steering role of the Ministries of Health. Tackling health determinants; Reducing the risk and burden of disease: Safety of blood depends primarily on the quality of the blood donor. National blood requirements depend on the overall health status of the population. Health promotion, health education and interventions to protect the population will result in safer blood donors and reduced needs for blood components. Safe blood contributes to the reduction of HIV, HBV, HCV, T. cruzi and other infections. Paragraphs 6-9, 11-18, 24, 29, 34, and 37, and tables 1-5 refer to these issues. Increasing social protection and access to quality health services; Diminishing health inequities among countries and inequities within them: Blood availability and access vary within and among countries. The overall objective of the Plan of Action 2006-2010 is to promote equitable access considering increased social inclusion. Tables 10-13 and paragraphs 13, 14, 15, 35, 36, 37, and 41 address social protection and access to blood. Strengthening health security: Blood for transfusions is an essential component for managing emergencies. Paragraph 36 of the document specifically refers to unforeseen emergencies. Furthermore, document CE48/11 Reads, in paragraph 31: “31. The concepts of Resolution CD46.R5 still apply to the Region of the Americas but action is required by national authorities to implement the strategies of the Regional Plan of Action for Transfusion Safety 2006-2010, approved by the 46th Directing Council. It is recommended that the Ministries of Health support their national blood systems using the Health Agenda for the Americas 2008-2017 as the general framework.” 7. Link between Agenda item and Strategic Plan 2008-2012: The Regional Plan of Action for Transfusion Safety addresses issues related to
SO1. To reduce the health, social and economic burden of communicable diseases –T.cruzi, HBV, HCV, HTLVI/II by improving donor selection and laboratory screening.
SO2. To combat HIV/AIDS, tuberculosis and malaria by improving donor selection and laboratory screening.
SO3. To prevent and reduce disease, disability and premature death from chronic noncommunicable conditions, violence and injuries by providing enough, safe blood in a timely manner.
SO4. To reduce mortality and improve health during key stages of life, including pregnancy, childbirth, the neonatal period, childhood and adolescence, and improve sexual and reproductive health and promote healthy aging for all individuals by promoting voluntary blood donation and by making safe blood available in a timely manner.
SO5. To reduce the health consequences of emergencies, disasters, crises and conflicts, and minimize their social and economic impact by providing blood for transfusion when necessary.
PAN AMERICAN HEALTH ORGANIZATION Pan American Sanitary Bureau, Regional Office of the
WORLD HEALTH ORGANIZATION
SO6. To promote health and development, and prevent or reduce risk factors such as use of tobacco, alcohol, drugs and other psychoactive substances, unhealthy diets, physical inactivity and unsafe sex, which affect health conditions by promoting the education of voluntary blood donors
SO7. To address the underlying social and economic determinants of health through policies and programs that enhance health equity and integrate pro-poor, gender-responsive, and human rights-based approaches by ensuring equitable access to safe blood
SO10. To improve the organization, management and delivery of health services by improving the planning and management of the national blood network system.
SO11. To strengthen leadership, governance and the evidence base of health systems by improving the planning and management of the national blood network system.
SO12. To ensure improved access, quality and use of medical products and technologies 8. Best practices in this area and examples from other countries within AMRO: Canada: Organization of blood services. Aruba, Cayman Islands, Cuba, Curacao, Suriname in voluntary blood donation. 9. Financial implications of Agenda item: Better planning and management at the country level will result in more efficient use of national resources. Around US$ 48 million were wasted in 2005 by the Caribbean and Latin American countries. Paragraphs 14, 20 and 22 refer to financial resources. Regular and extrabudgetary funding at the regional should not be further reduced in the coming years. PAHO HQ, PWR’s and Subregional initiatives should work to implement coordinated approaches of technical cooperation. Paragraph 43 of the document addresses this issue.
- 3 -

PAN AMERICAN HEALTH ORGANIZATION WORLD HEALTH ORGANIZATION
142nd SESSION OF THE EXECUTIVE COMMITTEE
Washington, D.C., USA, 23-27 June 2008
CD48/11 (Eng.)
Annex C
ORIGINAL: ENGLISH
RESOLUTION
CE142.R5
BLOOD TRANSFUSION SAFETY: PROGRESS REPORT THE 142nd SESSION OF THE EXECUTIVE COMMITTEE,
Having considered the progress report presented by the Director on Blood Transfusion Safety (Document CE142/20), which summarizes the difficulties observed in the implementation of the Regional Plan of Action for Transfusion Safety 2006-2010;
Concerned about the insufficiency and the poor quality of blood available for transfusions in the majority of countries of the Region; and
Taking into account the Health Agenda for the Americas 2008-2017,
RESOLVES:
To recommend that the Directing Council adopt a resolution along the following lines:
CE142.R5 (Eng.) Page 2
THE 48th DIRECTING COUNCIL,
Having considered the progress report presented by the Director on Blood Transfusion Safety (Document CD48/11), which summarizes the difficulties observed in the implementation of the Regional Plan of Action for Transfusion Safety 2006-2010;
Aware of the central role that transfusions play in the appropriate medical care of patients and in the reduction of mortality among mothers, infants, victims of traffic accidents and other traumas, patients suffering from cancer or clotting disorders, and transplant patients;
Concerned that the current levels of availability and safety of blood for transfusion in the Region are unsatisfactory;
Recognizing that the current national organizational systems limit the efficacy of blood transfusions, have negative effects on morbidity and mortality, and result in major financial losses;
Considering that the concepts of Resolutions CD41.R15 (1999) and CD46.R5 (2005) still apply to the Region of the Americas, and that action is required by national authorities to implement the strategies of the Regional Plan of Action 2006-2010, approved by the 46th Directing Council; and Recognizing that modifications in current national approaches are needed in order to achieve the regional goals set for transfusion safety by 2010,
RESOLVES: 1. To urge Member States to: (a) proactively implement the Regional Plan of Action for Transfusion Safety
2006-2010 by:
i. defining a specific entity within the normative level of their ministries of health as responsible for the planning, oversight and overall efficient operation of the national blood system;
ii. estimating the annual national need for blood components, taking into
consideration unforeseen emergencies, expected increases of the general and elderly population, social inclusion of currently excluded populations, road traffic injuries, and local adoption of medical technologies, such as
CE142.R5 (Eng.) Page 3
transplants and cancer treatment, and the financial resources necessary to cover those needs;
iii. establishing a network of volunteers to educate the community and to
promote voluntary blood donation and service blood donors, with special attention to youth programs;
(b) terminate replacement and paid blood donation before the end of 2010, with a
goal of 100% voluntary, altruistic, non-remunerated blood donation, using the information obtained from socio-anthropological surveys conducted in the countries, given that blood collection should not be solely the responsibility of hospital medical teams;
(c) share best practices in the recruitment and retention of voluntary blood donors. 2. To request the Director to: (a) cooperate with the Member States in the implementation of the Regional Plan of
Action for Transfusion Safety 2006-2010 using a multidisciplinary and coordinated approach for health promotion, public education, human and patient rights, quality assurance and financial efficiency;
(b) work with Member States and international organizations to assess the
implementation of the Regional Plan of Action 2006-2010 and to identify country-specific interventions needed to assure sufficiency and acceptable quality and safety of blood for transfusions at the national level;
(c) prepare annual reports on the situation of blood transfusion safety in the Region.
(Seventh meeting, 26 June 2008)

PAN AMERICAN HEALTH ORGANIZATION WORLD HEALTH ORGANIZATION
48th DIRECTING COUNCIL 60th SESSION OF THE REGIONAL COMMITTEE
Washington, D.C., USA, 29 September-3 October 2008
CD48/11 (Eng.)
Annex D
Report on the Financial and Administrative Implications for the Secretariat of the Resolutions Proposed for Adoption
by the Directing Council 1. Resolution: Blood Transfusion Safety: Progress Report. 2. Linkage to program budget Area of work 21; 01 Expected result 3; 5 3. Financial implications
a) Total estimated cost for implementation over the lifecycle of the resolution (estimated to the nearest US$ 10,000; including staff and activities): $1,780,000
b) Estimated cost for the biennium 2008-2009 (estimated to the nearest US$ 10,000; including staff and activities): $1,420,000
c) Of the estimated cost noted in (b) what can be subsumed under existing programmed
activities? 100% 4. Administrative implications
a) Implementation locales (indicate the levels of the Organization at which the work will be undertaken and identify the specific regions, where relevant): HQ, Subregional Units, PWR’s, and Collaborating Centers.
b) Additional staffing requirements (indicate additional required staff full-time
equivalents, noting necessary skills profile): Specific focal points for blood transfusion safety are necessary in each Subregional Unit and PWR.
c) Timeframes (indicate broad time frames for the implementation and evaluation): The
implementation of the activities started in 2005 and must continue to 2010. Regional and national progress should be assessed yearly.
- - -

PAN AMERICAN HEALTH ORGANIZATION WORLD HEALTH ORGANIZATION
48th DIRECTING COUNCIL 60th SESSION OF THE REGIONAL COMMITTEE
Washington, D.C., USA, 29 September-3 October 2008
CD48.R7 (Eng.)
ORIGINAL: ENGLISH
RESOLUTION
CD48.R7
IMPROVING BLOOD AVAILABILITY AND TRANSFUSION SAFETY IN THE AMERICAS
THE 48th DIRECTING COUNCIL,
Having considered the report of the Director on blood transfusion safety (Document CD48/11), which summarizes the difficulties observed in the implementation of the Regional Plan of Action for Transfusion Safety 2006-2010;
Aware of the central role that transfusions play in the appropriate medical care of patients and in the reduction of mortality among mothers, infants, victims of traffic accidents and other traumas, patients suffering from cancer or clotting disorders, and transplant patients;
Concerned that the current levels of availability and safety of blood for
transfusion in the Region are unsatisfactory;
Recognizing that the current national organizational systems limit the efficacy of blood transfusions, have negative effects on morbidity and mortality, and result in major financial losses;
Considering that the concepts of Resolutions CD41.R15 (1999) and CD46.R5 (2005) still apply to the Region of the Americas, and that action is required by national authorities to implement the strategies of the Regional Plan of Action 2006-2010, approved by the 46th Directing Council; and
CD48.R7 (Eng.) Page 2 Recognizing that modifications in current national approaches are needed in order to achieve the regional goals set for transfusion safety by 2010,
RESOLVES: 1. To urge Member States to: (a) proactively implement the Regional Plan of Action for Transfusion Safety 2006-
2010 by:
i. defining a specific entity within the normative level of their ministries of health as responsible for the planning, oversight and overall efficient operation of the national blood system;
ii. estimating the annual national need for blood components, taking into
consideration unforeseen emergencies, expected increases of the general and elderly population, social inclusion of currently excluded populations, road traffic injuries, and local adoption of medical technologies, such as transplants and cancer treatment, and the financial resources necessary to cover those needs;
iii. establishing a network of volunteers to educate the community and to
promote voluntary blood donation and service blood donors, with special attention to youth programs;
(b) except in limited circumstances of emergency medical necessity, terminate
replacement and paid blood donation by the end of 2010, with a goal of 100% voluntary, altruistic, non-remunerated blood donation, using the information obtained from socio-anthropological surveys conducted in the countries, given that blood collection should not be solely the responsibility of hospital medical teams;
(c) terminate mandatory patient replacement of transfused blood by the end of 2010; (d) share best practices in the recruitment and retention of voluntary blood donors. 2. To request the Director to: (a) cooperate with the Member States in the implementation of the Regional Plan of
Action for Transfusion Safety 2006-2010 using a multidisciplinary and coordinated approach for health promotion, public education, human and patient rights, quality assurance and financial efficiency;
CD48.R7 (Eng.) Page 3
(b) work with Member States and international organizations to assess the implementation of the Regional Plan of Action 2006-2010 and to identify country-specific interventions needed to assure sufficiency and acceptable quality and safety of blood for transfusions at the national level;
(c) prepare annual reports on the situation of blood transfusion safety in the Region.
(Seventh meeting, 2 October 2008)

SUPPLY O
F BLOO
D FO
R TRAN
SFUSIO
N IN
THE CA
RIBBEAN
AN
D LATIN
AM
ERICAN
COU
NTRIES
2006, 2007, 2008, AN
D 2009