Study of Urban Wetlands in View of Potential Urban Cooling by
479
Urban Adaptation Measures for Climate Change: Study of Urban Wetlands in View of Potential Urban Cooling by Abu Taib Mohammed Shahjahan A thesis submitted In partial fulfilment of the requirement for the Degree of DOCTOR OF PHILOSOPHY Department of Architecture BANGLADESH UNIVERSITY OF ENGINEERING AND TECHNOLOGY 2018
-
Upload
khangminh22 -
Category
Documents
-
view
0 -
download
0
Transcript of Study of Urban Wetlands in View of Potential Urban Cooling by

Urban Adaptation Measures for Climate Change: Study of Urban Wetlands in View of
Potential Urban Cooling
by
Abu Taib Mohammed Shahjahan
A thesis submitted
In partial fulfilment of the requirement for the
Degree of DOCTOR OF PHILOSOPHY
Department of Architecture
BANGLADESH UNIVERSITY OF ENGINEERING AND TECHNOLOGY
2018


!
Signature of the Examining Committee:
1.
Chairman
2.
Ex-officio
3.
Dr Cristian Suau
! Internal/ ! External Member
4.
! Internal/ ! External Member
5.
! Internal/ ! External Member
6.
! Internal/ ! External Member
7.
! Internal/ ! External Member
1.#As#per#clause#14.3#of#Ordinance)for)the)Degree)of)Post)Graduate)Ordinance,#BUET.#
2.#Where#revisions#and#/or#corrections#are#recommended,#the#instructions#should#be#clear#and#precise#so#that#the#candidate,#supervisor#(s)#and#Head#of#the#Department#readily#understand#what#aspects#of#the#thesis#are#being#proposed#for#revision.#
3.#Reasons#should#be#fully#detailed#where#a#reduced#award#or#no#award#is#recommended.#This%report%will%be%copied%to%the%candidate.(The report must be in typescript and may be submitted on a separate sheet attached to this form.)

CANDIDATE’S DECLARATION
It is hereby declared that this thesis has been prepared in partial fulfillment of the
requirements for the degree of Doctor of Philosophy in Architecture at Bangladesh
University of Engineering and Technology, Dhaka and has not been submitted
elsewhere for the award of any degree or diploma.
__________________________________________________________________________
Abu Taib Mohammed Shahjahan
Student number: 0410014001
Session: April 2010
Department of Architecture
Bangladesh University of Engineering and Technology, Dhaka-1000

Acknowledgements
It is a great pleasure to acknowledge my indebtedness to my supervisor Professor Dr.
Khandaker Shabbir Ahmed, Department of Architecture, Bangladesh University of
Engineering and Technology (BUET), for his constructive advice, appropriate
guidance and support which always helped me in many critical moments in the
research. His scientific approach to any problem and quest for exploring new
phenomenon of nature always was and will be an inspiration for me. I am grateful to
my External Supervisor: Dr. Ismail Said of Associate Professor, Department of
Landscape Architecture, Universiti Teknologi Malaysia for his useful and timely
comments. His cordiality and enthusiasm was always encouraging in difficult work. I
thank the staffs of Department of Architecture, BUET for their sincere support in many
official works. Thanks are due to many individuals for their help in my field work.
Finally, I wish to thank my parents for their continuing encouragement and support for
my education since childhood. I am greatly indebted to my wife who generously
allowed my absence from my duties towards family for an extended period to complete
my research work.

ABSTRACT
Urbanization in the developing world took place at an unprecedented rate
which outpaced that of the developed world except for few exceptions. Much of the
urban areas of the developing world are in the tropical zone, which has gone through
an inadvertent environmental modification due to increased built density. This
environmental modification due to high built density resulted in an adverse thermal
environment in the urban area which is further exacerbated by global warming due to
climate change. This adverse thermal environment in the city resulted in a much-
reported phenomenon known as Urban Heat Island. An adaptation measure against
Urban Heat Island in the tropical cities of the developing world can be use of the
natural cycle to cool down the overheated urban fabric.
Dhaka is one of the most densely populated cities in the world, where the
juxtaposition of wetlands and built up area coupled together may have an opportunity
for creating a viable and distinct character of its own while addressing the challenges
of inadvertent environmental modification. Increased built density and reduction of
wetlands are making Dhaka’s climate uncomfortable in comparison to its rural
surroundings, resulting increasing number of air-conditioned buildings, which in turn
elevate urban air temperature and consequent energy demand. Thus, urban land use in
Dhaka is directly contributing to Urban Heat Island effect. Coolth produced by urban
wetland can be an adaptive measure against urban heat island in Dhaka. This study
approaches the problem by identifying wetland as existing and potential cool spot and
analyzing their characteristics for cooling efficiency. Remote sensing technique was
used to identify the existing and potential cool spot at surface level for analysis. This
technique applied to analyze the morphology of the wetland as a producer of coolth
with potential to counterbalance for the urban heat. As a part of the study field
campaigns were conducted and environmental variables were recorded on the buffer
area of selected wetlands indicated in the remote sensing study. Evaluations were
undertaken with respect to the design factors such as the orientation of the wetlands,
riparian shading characteristics, urban permeability for the cooling effect, as those
factors affect the cooling intensity produced by the wetland. Through simulation
studies, some aspects are identified which could not be derived from the fieldwork.
They are the effect of differential riparian shading on the wetlands, effects of variable
temperature and relative humidity on the coolth produced by the wetland. Based on
the simulations some urban design recommendations was derived.
The research finding that indicated the relationship between some important
factors like the interdependency between fetch and inversion height to control
inversion layer over the water surface that regulate the urban cooling effect of the
wetland at an urban scale. This relationship informs as to what extent urban wetland
design might impact the thermal environment leading to possible urban microclimatic
cooling. These findings, in turn, might help in the development of certain policy
guidelines for the urban designers and planners to more positively impact the urban
thermal environment.

1
Table of Contents
Chapter 1 : GENERAL BACKGROUND ................................................................. 13
1.1 Introduction ................................................................................................. 13
1.2 Urbanization and Climate Change............................................................... 14
1.3 Statement of The Problem ........................................................................... 15
1.4 Methodology ............................................................................................... 16
1.4.1 Objectives of the research ........................................................................ 16
1.4.2 Remote sensing of Urban Cooling Island ................................................ 16
1.4.3 Field measurement of Urban Cooling Island ........................................... 17
1.4.4 Simulation and modelling ........................................................................ 20
1.4.5 Research framework ................................................................................ 22
1.5 Structure of The Thesis ............................................................................... 23
1.6 References ................................................................................................... 24
Chapter 2 : URBAN HEAT ISLAND AND ADAPTATION MEASURES ............. 26
2.1 Urban Boundary Layer (UBL) .................................................................... 26
2.2 Urban Energy Balance ................................................................................. 27
2.3 Urban Heat Island (UHI) ............................................................................. 28
2.3.1 Type of Urban Heat Island ...................................................................... 29
2.4 Surface Temperature and Surface Energy Balance ..................................... 30
2.5 Near Surface Urban Heat Island Under ‘Ideal’ Condition .......................... 31
2.6 Reasons For Urban Heat Island ................................................................... 34
2.7 Effects of Urban Heat Island ....................................................................... 38
2.8 Urban Heat Island Observation in Dhaka .................................................... 38
2.9 Surface Urban Heat Island Study in Dhaka ................................................. 42
2.10 Urban Adaptation Measure for Climate Change: Urban Cooling Islands ... 49
2.11 Inversion Layer Over the Water Bodies ...................................................... 50
2.12 Extent of The Cooling Effect of Urban Water Bodies ................................ 50
2.13 Relationship Between Microclimatic Cooling and Shape Complexity of The
Urban Water Bodies ............................................................................................... 54
2.14 Relationship Between Water Quality and Shape of The Urban Water Bodies
54

2
2.15 Effects of Water Temperature on Water Quality ........................................ 56
2.16 References ................................................................................................... 58
Chapter 3 : PRODUCTION AND TRANSPORT OF COOLING EFFECT ............. 62
3.1 Characteristics of Water, Water Heating and Cooling ................................ 62
3.2 Effects of Riparian Shade on Water Temperature ....................................... 63
3.2.1 Methods of producing riparian shade ...................................................... 64
3.2.2 Width of the riparian buffer to control water temperature ....................... 65
3.2.3 Influence of riparian buffer on removal of nitrogen ................................ 66
3.2.4 Effects of riparian buffer on overland sediment movement .................... 66
3.2.5 Width of riparian buffer to maintain large woody debris and
macroinvertebrates ................................................................................................. 66
3.2.6 Carbon sequestration by persistent reedbeds ........................................... 67
3.3 Simulating Effect of Water Temperature on Shading ................................. 67
3.4 Relationship of The Different Parameters to Create Urban Cooling Islands
68
3.5 Transporting Cooling Effect Through Advection ....................................... 71
3.6 Advection in The Earth Science .................................................................. 71
3.6.1 Clothesline effect ..................................................................................... 71
3.6.2 Leading-edge or Fetch effect ................................................................... 72
3.6.3 Oasis effect .............................................................................................. 74
3.7 Advective Effects of Urban Wetland and Urban Green .............................. 74
3.8 Advection of Urban Heat Island .................................................................. 75
3.9 Thermal Comfort Zone in The Dhaka City ................................................. 76
3.10 REFERENCES ............................................................................................ 77
Chapter 4 : REMOTE SENSING OF URBAN COOLING ISLAND ....................... 79
4.1 Introduction ................................................................................................. 79
4.2 Landsat Data ................................................................................................ 80
4.3 Extracting Albedo from Landsat Data ......................................................... 80
4.4 Determining Land Surface Temperature from Landsat 8 ............................ 82
4.5 Land Surface Temperature Retrieval from Landsat Tm 5 ........................... 84
4.6 Analysis of Normalized Difference Vegetation Index ................................ 87

3
4.7 Cool Spots in The Urban Area Due to Riparian Shading ............................ 89
4.8 Relationship Between the LST and Distance from The Wetland in Different
Season ..................................................................................................................... 92
4.9 Conclusion ................................................................................................. 143
4.10 References ................................................................................................. 145
Chapter 5 : FIELD MEASUREMENT OF URBAN COOLING ISLAND ............ 147
5.1 Introduction ............................................................................................... 147
5.2 Methods ..................................................................................................... 147
5.2.1 Location of the study area ...................................................................... 147
5.2.2 Physiography of the study area .............................................................. 148
5.2.3 Date and time of data logging ................................................................ 148
5.2.4 Characteristics of the urban stations ...................................................... 149
5.2.5 Climatic variables measured .................................................................. 159
5.2.6 Instruments ............................................................................................ 159
5.3 Results from The Urban Station ................................................................ 159
5.3.1 Reference measurement at Bangladesh Meteorological Department .... 159
5.3.2 Calibration of the instrument ................................................................. 161
5.3.3 Dhanmondi Lake temperature ............................................................... 162
5.3.4 Dhanmondi Lake relative humidity ....................................................... 169
5.3.5 Hatirjheel Lake temperature .................................................................. 175
5.3.6 Hatirjheel Lake relative humidity .......................................................... 180
5.4 Determining Morphology of Urban Cooling Island From Field
Measurement ........................................................................................................ 185
5.5 References ................................................................................................. 187
Chapter 6 : SIMULATION AND MODELING ...................................................... 188
6.1 Introduction ............................................................................................... 188
6.2 Preparation of The Model .......................................................................... 188
6.2.1 Location of the modeling area ............................................................... 188
6.2.2 Morphology of the modeling the area.................................................... 188
6.2.3 Computational domain ........................................................................... 189
6.2.4 Computational grid (mesh) .................................................................... 190

4
6.2.5 Roughness parameters ........................................................................... 193
6.2.6 Discretization scheme ............................................................................ 193
6.2.7 Simulation categories ............................................................................. 193
6.2.8 Model definition .................................................................................... 194
6.2.9 Measurement points in the model .......................................................... 196
6.3 Simulation Results and Analysis ............................................................... 196
6.3.1 Effect of cumulative time on the rate of change of air temperature and
relative humidity ................................................................................................... 196
6.3.2 Development of inversion layer ............................................................. 198
6.3.3 Effect of the fetch on the inversion height ............................................. 204
6.3.4 Inversion model ..................................................................................... 206
6.3.5 Effect of the relative humidity on the inversion layer thickness ........... 207
6.3.6 Effect of the orientation and riparian shading height of the wetland on the
water temperature ................................................................................................. 208
6.4 References ................................................................................................. 210
Chapter 7 : TRANSFORMING URBAN WETLAND INTO URBAN COOLING
ISLANDS ................................................................................................................. 211
7.1 Significant Findings of Urban Cooling Islands ......................................... 211
7.1.1 Change of surface Urban Heat Island .................................................... 211
7.1.2 Rate of change of temperature and relative humidity in terms of solar
influx 211
7.1.3 Shading impact on rate of change of temperature and relative humidity
211
7.1.4 Humidity distribution ............................................................................. 211
7.1.5 Day time evaporative cooling potential ................................................. 212
7.1.6 Inversion layer development .................................................................. 212
7.2 Measures to Create Urban Cooling Islands ............................................... 212
7.2.1 Shading measure .................................................................................... 212
7.2.2 Orientation measure ............................................................................... 213
7.2.3 Advection measure ................................................................................ 213
7.2.4 Proximity measure ................................................................................. 213
7.2.5 Air corridor from the wetland measure ................................................. 213

5
7.2.6 Oasis effect measure .............................................................................. 214
7.3 Wetland as An Urban Cooling Islands in Urban Design ........................... 214
7.3.1 Controlling the “inversion layer” over the water surface of urban
wetlands 214
7.4 Urban Design Guidelines for Urban Wetland ........................................... 217
7.5 Suggestions for Further Work ................................................................... 219
Appendix 1 Wilcox K-Ω Turbulence Model ........................................................ 220
Appendix 2 Instrumentation ................................................................................. 221
Appendix 2.1 Temperature and humidity data logger .......................................... 221
Appendix 2.2 Temperature and humidity data logger .......................................... 222
Appendix 2.3 Dial stem thermometers ................................................................. 222
Appendix 2.4 Temperature and wind speed logger .............................................. 223
Appendix 2.5 Weather station .............................................................................. 224
Data: All the data used in this PhD research is included on the CD attached at the
back of the thesis.
Transparent Protractor: A protractor containing the base map of the Dhaka city
also attached at the back of the thesis to aid the reading of the Land surface
temperature map extracted from the Landsat data.

6
List of Figures
Figure 1.1: Urban and rural population of the world, 1950-2050 (UNPD, 2014) ..... 14
Figure 1.2: Distribution of world's Urban population (UNPD, 2014) ....................... 14
Figure 1.3: Buffer zone for field measurement .......................................................... 17
Figure 1.4: Installation of the data loggers on the site. .............................................. 19
Figure 1.5: Model of Buoyancy Flow ........................................................................ 21
Figure 1.6: Research Framework ............................................................................... 22
Figure 2.1: Schematic of typical layering of the atmosphere over a city (a) by day,
and (b) at night. Note the height scale is logarithmic, except near the surface. (Oke
2017) .......................................................................................................................... 27
Figure 2.2: Schematic of the fluxes in the SEB of (a) a rural and (b) an urban
building-soil-air volume. (Oke, 2017) ....................................................................... 28
Figure 2.3: Schematic depiction of a typical UHIUCL at night in calm and clear
conditions in a city on the relatively level terrain. (a) Isotherm map illustrating
typical features of the UHI and their correspondence with the degree of urban
development. (b) 2D cross-section of both surface and screen-level air temperature in
a traverse along the line A–B shown in (a). (Oke, 2017) ........................................... 32
Figure 2.4: Temporal Variation of Urban and Rural (c) air temperature (d)
heating/cooling rates and (e) the resulting heat island intensity (Oke, 1980) ............ 33
Figure 2.5: Generalized form of UBL thermal structure in a large mid-latitude city
during fine summer weather (a) by day, including schematic profiles of potential
temperature () and the depths of the urban and rural internal boundary layers (---)
and the daytime mixed layer (-·-) and (b) at night. (Oke,1981) ................................. 34
Figure 2.6: Temperature distribution at 0600 BST of 03 January 1992 over Dhaka
city (source BMD)...................................................................................................... 40
Figure 2.7: Temperature distribution at 1800 BST of 03 January 1992 over Dhaka
city (source BMD)...................................................................................................... 41
Figure 2.8:Humidity field analysis at 1600 BST of 03 January 1992 over Dhaka city
(source BMD). ........................................................................................................... 42
Figure 2.9: Dhaka city Base Map (source RAJUK). .................................................. 44
Figure 2.10: Land Surface Temperature_ LST (T0) of Dhaka at 12 DEC 1991 derived
from Landsat 5 TM data ............................................................................................. 45
Figure 2.11: Land Surface Temperature_T0 (LST) of Dhaka at 16 DEC 2016 derived
from Landsat-8 data ................................................................................................... 47
Figure 2.12: Change of Land Surface Temperature T0 (LST) from 1991 to 2016 .... 48
Figure 2.13: Change of Relative Humidity with time (Manteghi et al, 2015) ........... 54
Figure 3.1:Sketch of a typical stream channel cross-section showing topography and
canopy angles perpendicular to stream. (Rutherford et al., 1997) ............................. 64
Figure 3.2: Schematic of a generic riparian buffer area (Riparian areas: functions and
strategies for management, 2002). ............................................................................. 65

7
Figure 3.3: Effect of shading on simulated water surface temperature of the lake .... 68
Figure 3.4: Relation of the different parameters related to the creation of UCI ........ 70
Figure 3.5: Schematic depiction of fluxes involved in the energy balances of a soil-
plant-air volume (Oke, 2002) ..................................................................................... 72
Figure 3.6: The development of an internal boundary layer as air flows from a
smooth, hot, dry, bare soil surface to a rougher cooler and more moist vegetation
surface (Oke,2002). .................................................................................................... 72
Figure 3.7: Moisture advection from a dry to a wet surface, (a) Evaporation rates and
the vapour balance of a surface air layer (fluxes of vapour are proportional to the
length of the arrows), (b) Surface evaporation rate (E0), and mean water vapour
concentration of the air layer, (c) Vertical profile of water vapour in relation to the
developing boundary layer (Oke, 2002). ................................................................... 73
Figure 3.8: Average daily energy balance of an alfalfa crop in June 1964 near
Phoenix, Arizona (33°N). The crop was irrigated by flooding in late May and this
was followed by drought throughout June (van Bavel, 1967, Oke 2002).................. 75
Figure 4.1. NDVI showing 500m buffer area of both the lake .................................. 87
Figure 4.2: Change of Albedo within 25 years .......................................................... 90
Figure 4.3: LST of Urban Dhaka12 Dec 1991 derived from Landsat data showing
cool spots .................................................................................................................... 91
Figure 4.4: Comparison of Land Surface Temperature of different season of selected
spots in Dhaka. ........................................................................................................... 92
Figure 4.5: LST 12 April 2013 ................................................................................... 93
Figure 4.6: LST 15 JUNE 2013 ................................................................................. 95
Figure 4.7: LST 6 NOV 2013 .................................................................................... 97
Figure 4.8: LST 24 DEC2013 .................................................................................... 99
Figure 4.9: LST 25 January 2014 ............................................................................. 100
Figure 4.10: LST 10 February 2014 ......................................................................... 102
Figure 4.11: LST 26 FEBRUARY 2014 .................................................................. 104
Figure 4.12: LST 14 March 2014 ............................................................................. 106
Figure 4.13: LST 30 March 2014 ............................................................................. 108
Figure 4.14: LST 25 November 2014 ...................................................................... 110
Figure 4.15: LST 28 January 2015 ........................................................................... 112
Figure 4.16: LST 13 February 2015 ......................................................................... 113
Figure 4.17: LST 17 March 2015 ............................................................................. 116
Figure 4.18: LST 18 April 2015 ............................................................................... 118
Figure 4.19: LST 4 May 2015 .................................................................................. 119
Figure 4.20: LST 25 September 2015 ...................................................................... 121
Figure 4.21: LST 27 October 2015 .......................................................................... 123
Figure 4.22: LST 12 November 2015 ...................................................................... 125
Figure 4.23: LST 28 November 2015 ...................................................................... 127
Figure 4.24: LST 30 December 2015 ....................................................................... 128

8
Figure 4.25: LST 15 January 2016 ........................................................................... 130
Figure 4.26: LST 16 February 2016 ......................................................................... 132
Figure 4.27: LST 3 March 2016 ............................................................................... 134
Figure 4.28: LST 14 November 2016 ...................................................................... 136
Figure 4.29: LST 30 November 2016 ...................................................................... 138
Figure 4.30: LST 18 February 2017 ......................................................................... 139
Figure 4.31: LST 22 March 2017 ............................................................................. 141
Figure 4.32: Cooling effect of the wetland .............................................................. 144
Figure 5.1: Buffer zone for field measurement ........................................................ 148
Figure 5.2: Physiographic region of the wetland area (Brammer H.,2012) ............. 149
Figure 5.3: Location of the Urban stations of field measurement at Dhanmondi Lake
on 24 February 2017 ................................................................................................ 150
Figure 5.4: View of the Dhanmondi Lake on 24 February 2017 ............................. 150
Figure 5.5: Location of the Urban stations of field measurement at Hatirjheel Lake
on 10 February 2017 ................................................................................................ 154
Figure 5.6: Hatirjheel Lake on 10 February 2017 .................................................... 155
Figure 5.7: Air Temperature and Relative Humidity measurement at Bangladesh
Meteorological Urban Station (BMD) ..................................................................... 160
Figure 5.8: Calibration of the instrument ................................................................. 162
Figure 5.9: Air Temperature at Dhanmondi lake Urban stations on 21 October 2016
.................................................................................................................................. 164
Figure 5.10: Air Temperature at Dhanmondi lake Urban stations on 27 January 2017
.................................................................................................................................. 165
Figure 5.11: Air Temperature at Dhanmondi lake Urban stations on 24 February
2017 .......................................................................................................................... 167
Figure 5.12: Correlation between Air Temperature & cumulative Time at Dhanmondi
lake Urban stations on 24 February 2017 ................................................................ 168
Figure 5.13: Relative Humidity at Dhanmondi lake Urban stations on 21 October
2016 .......................................................................................................................... 170
Figure 5.14: Relative Humidity at Dhanmondi lake Urban stations on 27 January
2017 .......................................................................................................................... 171
Figure 5.15: Relative Humidity at Dhanmondi lake Urban stations on 24 February
2017 .......................................................................................................................... 173
Figure 5.16: Correlation between Relative Humidity & cumulative Time at
Dhanmondi lake Urban stations on 24 February 2017............................................. 174
Figure 5.17: Temperature at Hatirjheel lake Urban stations on 11 November 2016 176
Figure 5.18: Temperature at Hatirjheel lake Urban stations on 13 December 2016 177
Figure 5.19: Temperature at Hatirjheel lake Urban stations on 10 February 2017 .. 179
Figure 5.20: Relative Humidity at Hatirjheel lake Urban stations on 11 November
2016 .......................................................................................................................... 181

9
Figure 5.21: Relative Humidity at Hatirjheel lake Urban stations on 13 December
2016 .......................................................................................................................... 182
Figure 5.22: Relative Humidity at Hatirjheel lake Urban stations on 10 February
2017 .......................................................................................................................... 184
Figure 6.1: Computational Domain (Blocken B., 2007) .......................................... 190
Figure 6.2: computational grid of control domain ................................................... 191
Figure 6.3: computational grid of the model ............................................................ 192
Figure 6.4: measurement points of the model .......................................................... 196
Figure 6.5: Case 1_Inversion layer above the lake .................................................. 199
Figure 6.6: Case 2_Inversion layer above the lake .................................................. 201
Figure 6.7: Case 3_Inversion layer above the lake .................................................. 202
Figure 6.8: Case 4_Inversion layer above the lake .................................................. 203
Figure 6.9: Case 1_Inversion height z versus fetch x .............................................. 204
Figure 6.10: Case 2_Inversion height z versus fetch x ............................................ 204
Figure 6.11: Case 3_Inversion height z versus fetch x ............................................ 205
Figure 6.12: Case 4_Inversion height z versus fetch x ............................................ 205
Figure 6.13: Case1_Effect of relative humidity (RH) on inversion height .............. 208
Figure 6.14: Case3_Effect of relative humidity (RH) on inversion height .............. 208
Figure 6.15: Effect of wetland orientation and ratio of shading height (H) vs water
surface width (W) on the temperature of water surface. .......................................... 209
Figure 7.1: Air corridor inside the Urban fabric ...................................................... 213
Figure 7.2: Correctly oriented (E-W axis) Wetland for both topographical and
riparian shading ........................................................................................................ 215
Figure 7.3: Wind flow direction in Wetland with no shading.................................. 216
Figure 7.4: Wind flow direction in Wetland with riparian shading ......................... 216
Figure 7.5: Urban design matrix for urban wetland ................................................. 218

10
List of Tables
Table 2.1: Summary of UHI types, scales, thermal processes, modeling approach,
direct and remote measurement techniques used to observe them (Oke, 2017). ....... 29
Table 2.2: suggested causes of UHI (Oke, 2017) ....................................................... 36
Table 4.1: List of Bands available in Landsat-7 ETM+ and Landsat-8 OLI and TIRS
(source: Landsat Science Data Users Handbook) ...................................................... 80
Table 4.2: Landsat 4-5 Thematic Mapper (TM) and Landsat 7 Enhanced Thematic
Mapper Plus (ETM+) (source: Landsat Science Data Users Handbook) .................. 84
Table 4.3: ETM+ Solar Spectral Irradiances ............................................................. 85
Table 4.4: Earth-Sun Distance in Astronomical Units ............................................... 85
Table 4.5: ETM+ and TM Thermal Band Calibration Constants .............................. 86
Table 4.6. Percentage of vegetation based on the NDVI of Dhanmondi Lake. ......... 88
Table 4.7. Percentage of vegetation based on the NDVI of Hatirjheel Lake. ............ 88
Table 4.8: Dhanmondi Lake ....................................................................................... 88
Table 4.9: Hatirjheel Lake.......................................................................................... 89
Table 4.10: Correlation analysis between distance and LST on 12 April 2013 ......... 94
Table 4.11: Correlation analysis between distance and LST on 15 June 2013 .......... 96
Table 4.12: Correlation analysis between distance and LST on 6 November 2013 .. 98
Table 4.13: Correlation analysis between distance and LST on 24 December 2013 . 98
Table 4.14: Correlation analysis between distance and LST on 25 January 2014 ... 101
Table 4.15: Correlation analysis between distance and LST on 10 February 2014 . 103
Table 4.16: Correlation analysis between distance and LST on 26 February 2014 . 105
Table 4.17: Correlation analysis between distance and LST on 14 March 2014 ..... 107
Table 4.18: Correlation analysis between distance and LST on 30 March 2014 ..... 109
Table 4.19: Correlation analysis between distance and LST on 25 November 2014
.................................................................................................................................. 111
Table 4.20: Correlation analysis between distance and LST on 28 January 2015 ... 111
Table 4.21: Correlation analysis between distance and LST on 13 February 2015 . 114
Table 4.22: Correlation analysis between distance and LST on 17 March 2015 ..... 115
Table 4.23: Correlation analysis between distance and LST on 18 April 2015 ....... 117
Table 4.24: Correlation analysis between distance and LST on 4 May 2015 .......... 117
Table 4.25: Correlation analysis between distance and LST on 25 September 2015
.................................................................................................................................. 120
Table 4.26: Correlation analysis between distance and LST on 27 October 2015 .. 124
Table 4.27: Correlation analysis between distance and LST on 12 November 2015
.................................................................................................................................. 124
Table 4.28: Correlation analysis between distance and LST on 28 November 2015
.................................................................................................................................. 126
Table 4.29: Correlation analysis between distance and LST on 30 December 2015
.................................................................................................................................. 126

11
Table 4.30: Correlation analysis between distance and LST on 15 January 2016 ... 129
Table 4.31: Correlation analysis between distance and LST on 16 February 2016 . 131
Table 4.32: Correlation analysis between distance and LST on 3 March 2016 ....... 133
Table 4.33:Correlation analysis between distance and LST on 14 November 2016 135
Table 4.34: Correlation analysis between distance and LST on 30 November 2016
.................................................................................................................................. 137
Table 4.35: Correlation analysis between distance and LST on 18 February 2017 . 137
Table 4.36: Correlation analysis between distance and LST on 22 March 2017 ..... 140
Table 4.37. Correlation coefficient (r) between LST and Distance from the edge of
the wetland. .............................................................................................................. 142
Table 5.1: Simplified classification of distinct urban forms arranged in approximate
decreasing order of their ability to impact local climate [Oke, 2006] ..................... 147
Table 5.2: Data Logger Location at Dhanmondi Lake area_21 October 2016 ........ 151
Table 5.3: Data Logger Location at Dhanmondi Lake area_27 January 2017 ........ 152
Table 5.4: Data Logger Location at Dhanmondi Lake area_24 February 2017 ...... 153
Table 5.5:Data Logger Location at Hatirjheel Lake area_11 November 2016 ........ 155
Table 5.6: Data Logger Location at Hatirjheel Lake area_13 December 2016 ....... 156
Table 5.7: Data Logger Location at Hatirjheel Lake area_10 February 2017 ......... 157
Table 5.8: Correlation coefficient of Air temperature and Relative humidity at the
Bangladesh Meteorological Department urban station ............................................ 161
Table 5.9: correlation coefficient between air temperature and cumulative time of the
urban stations of Dhanmondi lake on 21 October 2016 ........................................... 163
Table 5.10: correlation coefficient between air temperature and cumulative time of
the urban stations of Dhanmondi lake on 27 January 2017 ..................................... 163
Table 5.11: correlation coefficient between air temperature and cumulative time of
the urban stations of Dhanmondi lake on 24th February 2017 ................................ 166
Table 5.12: correlation coefficient between Relative Humidity and cumulative time
of the urban stations of Dhanmondi lake on 21 October 2016 ................................ 169
Table 5.13: correlation coefficient between Relative Humidity and cumulative time
of the urban stations of Dhanmondi lake on 27 January 2017 ................................. 172
Table 5.14: correlation coefficient between Relative Humidity and cumulative time
of the urban stations of Dhanmondi lake on 24th February 2017 ............................ 172
Table 5.15: correlation coefficient between air temperature and cumulative time of
the urban stations of Hatirjheel lake on 11th November 2016................................. 175
Table 5.16: correlation coefficient between air temperature and cumulative time of
the urban stations of Hatirjheel lake on 13th December 2016 ................................. 178
Table 5.17: correlation coefficient between air temperature and cumulative time of
the urban stations of Hatirjheel lake on 10th February 2017 ................................... 180
Table 5.18: correlation coefficient between Relative Humidity and cumulative time
of the urban stations of Hatirjheel lake on 11th November 2016 ............................ 180

12
Table 5.19: correlation coefficient between Relative Humidity and cumulative time
of the urban stations of Hatirjheel lake on 13th December 2016 ............................. 183
Table 5.20: correlation coefficient between Relative Humidity and cumulative time
of the urban stations of Hatirjheel lake on 10th February 2017 ............................... 185
Table 6.1: Case 1 Correlation analysis of Air Temperature, Relative Humidity and
Time ......................................................................................................................... 197
Table 6.2: Case 2 Correlation analysis of Air Temperature, Relative Humidity and
Time ......................................................................................................................... 197
Table 6.3: Case 3 Correlation analysis of Air Temperature, Relative Humidity and
Time ......................................................................................................................... 197
Table 6.4: Case 4 Correlation analysis of Air Temperature, Relative Humidity and
Time ......................................................................................................................... 198
Table 6.5: Correlation between inversion height and fetch ..................................... 206

13
Chapter 1 : GENERAL BACKGROUND
1.1 Introduction
The world has crossed a historic landmark in 2008, since the construction of
earliest urban settlement like Catal Hyuk and Zericho almost 9000 years ago. From
2008 “more than half of the world’s population started living in urban centres than the
rural areas and this ratio of urban to rural population continues to grow”. Urbanization
in the developing world is dramatic if compared with the standard of today’s urbanized
world. Within a short span of time urban population in developing world superseded
the developed world. Most of the rural-urban migration in the developing world is for
the economic reasons, as city offers better opportunity in terms of livelihood. Many
people also migrate to urban areas for the preference of the urban way of life, which is
markedly different from the rural. In many parts of the developing world natural
disaster like flood, river corrosion, draught often drive away the poorest rural people
to the urban area, as they become landless due those natural disaster. Land grab by the
social elite or corporations for their economic reasons or exploitation is also
contributing to the urban rural migration. Developed world also contributed to the
rapid urbanization in the developing world using cheap labours for the mass production
of their necessary goods at a lower price. In the recent times, most of rural-urban
migrations in the developing world are related to global climate change. All those
factors discussed earlier, created the unprecedented urbanization in the developing
world, which dwarfed that of the developed world except few exceptions. While Latin
America is the world’s most urbanized continent, Asia is distinctive for its rapid
transformation into metacities. From a low level of urbanization Africa observed
fastest rates of urbanization. Much of the urban areas of the developing world are in
the tropical zone, where urbanization is distinctive from climate, demography and
cultural point of view. Rapid urbanization in the developing world often went out of
control measures putting constraint on necessary infrastructural facilities essential for
city life like services, transportation etc. Informal urban areas like slums of developing
world are result of the lack of infrastructural facilities and services. “United Nations
Population Division” stated that, “the urban population in the global total population
has risen dramatically from 13% in 1900 to 46% in 2000” (figure 1.1). UNPD stated
that “more than half the world’s population together with its economic activities and
built assets are in urban areas” (UNPD, 2014). UN projections also suggest that “Urban
centres of Current low- and middle-income nations will contribute to almost all the
population increase up of the whole world to 2050” (UNPD, 2014). Global urban
population growth is propelled by the growth of all sizes of cities. At 2030 there will
be 41 megacities of the population 10 million or more.

14
Figure 1.1: Urban and rural population of the world, 1950-2050 (UNPD, 2014)
Nearly half of the urban population will be in the cities in Asia (Figure 1.2).
Figure 1.2: Distribution of world's Urban population (UNPD, 2014)
Zhu O. et al., (2012) reported that cities today occupy only 2% of the total land,
however, they contribute 70% of the GDP. Carbon emissions from cities and their
support systems represent the single largest human contribution to climate change.
Over 60% of the Global energy consumption belongs to the urban area. By this energy,
consumption cities produce 70% of the greenhouse gas emissions and also the same
percentage of global waste. Half of the greenhouse gas emissions are from the mega
cities (Zhu O et al., 2012).
1.2 Urbanization and Climate Change
Recent reports of “Intergovernmental Panel on Climate Change (IPCC)” stated
with the significant importance that “Climate Change due to anthropogenic activities
has caused severe impacts on human and natural systems on all continents, resulting
in climate-related extremes” (Revi A. et al, 2014). The examples of such extremes are
such as: a. poor air quality, b. extreme heat/cold and human thermal stress, c.
hurricanes, typhoons, extreme local winds, d.wild fires, sand and dust storms, e. urban

15
floods, f. sea-level rising level of sea due to global warming, g. energy and water
sustainability h. public health problems caused by the extreme hazard events.in a
recent study. Missirian A. et al (2017) related increase in temperatures in developing
countries to an increase in asylum applications to the EU. They also expect this larger
surge in migration continue to increase in future with the warming climate.
According to the IPCC, Bangladesh is the sixth most vulnerable country to the
Climate Change (IPCC, 2014). At present the capital of Bangladesh Dhaka is the
densest and ‘one of the most populated cities in the whole world’. In 1948, Dhaka was
a city with an area of approximately 50 sq.km and with a population of 250,000 and in
1993 the population of Dhaka grew to 7.4 million with an area of 300 sq.km and at
present, the population is more than 14 million [Ahmed R. 1993; BBS, 2016].
Wetlands and green spaces are diminishing due to unprecedented and often unplanned
urbanization, in addition to pressure from the housing sector. Within a span of 20 years
(1989-2009), urban wetlands in Dhaka metropolitan area has been reduced from
26.68% of the total area to 9.27% of the total city area, which is approximately a 65%
reduction [Ahmed B., et al, 2013]. Increased build density and reduction of public open
spaces and wetlands are making Dhaka’s climate uncomfortable in comparison to its
rural surroundings. Number of air-conditioned buildings increases due to high
temperature in urban Dhaka. Air-conditioner used in the buildings extracted heat from
interior to exterior urban environment, which in turn elevated urban air temperature
and consequent energy demand.
1.3 Statement of The Problem
One of the climate-related extreme that we are facing in Dhaka like other
megacities in the world is Urban Heat Island (UHI) which are exacerbated by growing
global temperature. From numerous study on UHI mitigation, it can concur that
“Urban water bodies can play an effective role in mitigating UHI through
microclimatic cooling of the urban area by creating cool spots”. As these cool spots
can transport coolth inside the urban fabric, they can be termed as Urban Cooling
Islands (UCIs). Besides the wetland urban parks can also act as UCIs for the
evapotranspiration effect and shading of the trees. As the Heat content capacity of the
water is high it could counteract the UCIs effect if kept unshaded. Urban wetland
Shaded by Built environment, topography and shade trees can have a proficient effect
on microclimatic cooling, whereas riparian shade is having a positive effect on the
UCIs as well as on the water quality. The effect of riparian shade on the water body is
mostly observed on the linear and narrow streams having urban area barely on either
side (Sun R. et al., 2012). There are very few detail studies about the effect of riparian
shade on the wider water body. Also, most of the study suggesting a small area and
regular (Euclidean shape) shape water body distributed in the regular interval in an
urban area for better Urban Cooling Island (UCIs) intensity. Hence the Major
research questions are:

16
o How could the negative impact of the Heat capacity of the reservoirs on UCIs
be moderated by the introduction of riparian shade?
o Could the large water body with fractal shape moderate the impact of the heat
capacity of the reservoirs on UCIs?
o What is the link between ‘UCIs’ and the “water quality” of the urban wetland?
Also, it was essential to investigate if it was possible to lower the minimum
water temperature of wetland below the temperature of the air immediately above it
by providing continuous shading of the water surface, at least during the hot and dry
period.
1.4 Methodology
Hence, the specific aims of this PhD research was to develop a sustainable path
to transform potential wetlands of Dhaka into “Urban Cooling Islands (UCIs)” to
address warming issues of Climate Change which will also promote waterfront
ecology with leisure and park amenities as they relate to the urban environment. There
is growing energy crisis in the city due to the high cooling energy demand. Therefore,
Urban cooling will be an effective way forward as an adaptation measure against
climate change. This multidisciplinary research also aims to form an area of co-
existence between natural and manmade structures in Dhaka.
1.4.1 Objectives of the research
i. To investigate the factors of Urban Wetland that contribute to Urban
Cooling Islands (UCIs) in Dhaka.
ii. To evaluate the impacts of wetland area, shape complexity, location
and riparian shading potential on UCIs intensity in Dhaka.
The research can potentially indicate the parametric relationship between the
factors that regulate the Urban Cooling Island (UCI) effect of the wetland at an urban
scale. This relationship will give insight to what extent urban wetland design might
impact the thermal environment leading to possible Urban Microclimatic cooling.
These findings, in turn, might help in the development of a tool for the urban designers
and planners to more efficiently manage the Urban Thermal Environment. This
research will follow the strategy of field study to support simulation and modelling
research:
1.4.2 Remote sensing of Urban Cooling Island
Through the study, the existence and intensity of potential Urban Cooling
Island (UCI) formed by the wetlands were identified. Spatial information on the land
cover and Land Surface Temperature (LST) was extracted using the data obtained from
Earth-observing satellites Landsat. Land remote sensing data, obtained by Landsat
satellite is the longest continuously acquired moderate-resolution data in terms of time
span. Landsat is a joint initiative between the “U.S. Geological Survey (USGS)” and
“NASA”. The data obtained by Landsat Project is freely available for all types of use,
irrespective of governmental, commercial, industrial, civilian, military, and
educational purpose worldwide. One of the main rationale to select Landsat data was

17
that it allows to compare and analyze the long-time change in Urban surface
temperature due to data availability.
1.4.3 Field measurement of Urban Cooling Island
Based on the previous study conducted by Bangladesh Meteorological Department
and Shahjahan et.al (2016), two wetlands of Urban Dhaka were selected for the field
study. They were Dhanmondi and Hatirjheel lake. The rationale for selecting wetland
sites are given below:
i. These two wetlands are accessible up to their inner periphery without any
hindrance.
ii. Both the wetlands have radiating roads leading into the surrounding urban
fabric having potentials for studying impact of wetland on surrounding
area.
iii. To enable the analysis of the effect of riparian shade, Dhanmondi Lake
was selected for its significantly visible riparian shade and Hatirjheel lake
was chosen for the absence of visible riparian shade.
iv. The watershed characteristics of both the lakes are comparable in terms of
area.
v. Both the lakes are located on the same physiographic condition (Brammer
H., 2012). Agro ecological zone for both the lake are also same
(FAO/UNDP,1988).
vi. Both the lakes are located on the same overall geothermal gradient zone
(Akbar M.A.,2011).
These two existing urban wetlands in Dhaka were studied to discern the relation among
the factors such as- UCI intensity and extent; wetland area, shape, location and heat
capacity; Riparian buffer width and type for the Riparian shade of the wetland. A
buffer zone of 0.5 km from the edge of the wetlands were taken into consideration for
the field measurement. Within the buffer zone multiple points starting from the water
edge to the deep inside urban fabric were selected for microclimatic measurement in
line with other studies performed in this field [Sun R. et al, 2012; Robitu M.et al, 2006;
Hwang S.J.et al, 2007].
Figure 1.3: Buffer zone for field measurement
Measurement were performed by the following methods:
Choosing the location for an urban station:
The Urban data logging station inside the urban area around these two
wetlands were selected with the intent to detect the greatest impact of those wetlands
on the microclimate of the encompassing urban fabric. Surrounding area uniform in
0.5 Km Buffer zone 0.5 Km Buffer zone

18
nature or more representative at least with in a half km buffer zone. The Areas has
been selected based on the Urban Climate Zone (UCZ) types given by Oke (2017)
expecting the highest probability of finding maximum effects in the Urban Canopy
Layer (UCL).
Extensive areas of similar urban development were closely investigated to
select a typical urban station. The second step of the search was conducting spatial
surveys of air temperature and humidity through traversing the areas of interest
surrounding the wetlands carrying the sensor on foot. Cross sections or isoline maps
have been drawn after several repetitions of traverse. These cross sections and isoline
maps revealed the areas of thermal and moisture anomaly. Those anomalies were the
point of significance. Traversing had been done during calm airflow and cloudless
skies as recommended by Oke (2006) .Calm airflow and cloudless sky condition
increase the potential to differentiate micro- and local climate. The aim was to monitor
local effect of urban wetland. For this reason, locations of urban data logging stations
were subjected to such local effect. The network of the urban stations designed
specifically to sample specific local effects on the urban climate, such as the
amelioration of an overly hot urban area by lake breezes.
1. Air temperature:
The air temperature around the selected water bodies were measured using air
temperature measuring thermometer/data logger.
Response times of thermometers:
Thermometers with a very small lag coefficient or time-constant records
temperature readings which fluctuates rapidly within a few seconds up to one or two
degrees. A good number of readings should be averaged to get a representative reading
from these fluctuating readings. So, for routine measurement there is no benefit of
using thermometer of small time constant. A reasonably larger time-constant of
thermometer will smooth out these rapid fluctuations. But if the time-constant is too
long it may result in errors in case of long-period changes in temperature. It is
recommended by Oke (2006) that “the time-constant, defined as the time required by
the thermometer to register 63.2 percent of a step change in air temperature, should be
20 s. The time constant depends on the air-flow over the sensor”.
Recording the circumstances in which measurements are taken:
Temperature is one of the meteorological quantities whose measurements are
particularly sensitive to exposure. WMO stated that “for climate studies temperature
measurements are affected by the state of the surroundings such as vegetation,
presence of buildings and other objects such as ground cover”. The condition of the
shield and the modification in the design of the radiation shield or screen, or by some
other changes in equipment can also affect temperature measurements. It is important
that records should be kept not only of the temperature data but also of the
circumstances in which the measurements are taken. Such information is known as
metadata (data about data).(Organization & WMO, 2008). The metadata for all the
urban stations in both the wetlands were collected.

19
Radiation shields:
Screens to use as radiation shields for the data logger was made from a
Thermally insulating material (e.g. particle board), as the system relies on natural
ventilation. The size and construction of the perforated screen constructed, to keep the
heat capacity as low as practicable and allows ample space between the instruments
and the walls. Direct contact between the sensing elements and the thermometer
mounting was avoided. only one door is kept, with the screen being placed so that the
sun does not shine on the thermometers when the door is open at the times of
observation and the screens are made of plywood.
Observation Period:
To investigate ‘urban microclimate’ dynamics and the “urban heat island”,
selected observation days were chosen to typify a range of different weather status,
like the three design seasons in Dhaka other than rainy days. It was essential to attain
data of high geographical and temporal resolution. But, taking account of our limited
budget and manpower, we were only able to collect 12-h samples of data on six
occasions, starting from October to February, which were adequate for the research.
The variables measured were air temperatures, humidity and wind speed at 1.5–2.0-m
height in the middle of Urban Canopy Layer and wetland edge from 07:00 am of one
day till 06:00 pm of the same day. Except in one case where the data logger was placed
with the Bangladesh Meteorological Department (BMD) instruments for three days
for validation purpose. Wind direction and velocity, in our case, were measured just at
the edge of the wetland. (Huang, Li, Zhao, & Zhu, 2008)
For air temperature, two types of measurements had been carried out, one is
traverse measurement and the other is continuous data logging in the Urban Canopy
Layer (UCL) at a selected location based on the Buffer analysis. The position of the
data logger in the Urban Canyon and the Wetlands is shown in the figure below:
Figure 1.4: Installation of the data loggers on the site.
2. Water Temperature: Water temperature of the selected water bodies were
measured using thermometer.
3. Wind speed: Wind velocity around the wetland within the buffer zone were
measured by traverse measurement.
H
Data Logger height= 1.5 -2 m from
the ground
Submerged Thermometer to
measure Water temperature at
the surface to a depth of 50
cm.

20
4. Wetland area, location and Riparian buffer: Continuous buffers around each
wetland was identified with appropriate interval using the spatial analytical module
in ArcGIS software. Location and area of the urban wetland were determined from
the GIS data of Dhaka. Riparian buffer width and type were determined from GIS
data.
5. Shape complexity of the wetland: FRAGSTATS, a “spatial pattern analysis
program for quantifying landscape structure” were used to determine shape
complexity of the selected water bodies of Dhaka. There are several indices to
measure the shape complexity, originally developed by Mandelbrot. Perimeter (P)
to Area (A) ratio is one of the first measurement of shape complexity of a landscape
feature. Several shape complexity indices were integrated in FRAGSTATS
software. Among them, “Fractal Dimension Index (FRAC) used to measure the
shape complexity of Urban Wetland” [Mandelbrot B. B., 1982. McGarigal K.et
al,1995].
1.4.4 Simulation and modelling
Numerical model quantifying shading by riparian vegetation, topography and
built-form were built. “Computational Fluid Dynamics (CFD) simulations of the
evaporative and radiative cooling effect from water surfaces, buoyancy-driven flow to
the wetland and from the wetland in a micro-scale urban environment was evaluated
with various configurations” (Robitu M. et al ,2006). The model was used to estimate
the influence of wetlands in the micro-climate of surrounding area in real situations.
Problem modelling:
Data obtained from the field study of the two wetlands were entered into the
COMSOL–Multiphysics software as a part of problem modelling study. Water and Air
temperature, Relative humidity and Wind speed are primary inputs for the simulation
besides types of ground cover and the built form. Once the problem modelling is done,
the model will be projected to test the specific effect of each contributing factor of
Urban Cooling Island (UCI) described above. The principal assumption which had
been tested in the simulation model was that the water in the wetland will be cooled
down with the help of continuous shading and evaporation to act as UCI, which in turn
will cool down the air above it and create high-pressure zone. This cool air will then
flow towards the nearest urban centre with low-pressure zone owing to the UHI
(Figure 1.5).
The modules of the COMSOL-Multiphysics that are to be combined to model
the Urban Cooling Island Effect of the urban wetland is:
i. CFD module: Fluid Flow-Single phase flow
ii. Heat Transfer Module: Heat Transfer in Fluids and Heat Transfer with
Surface to Surface Radiation (ht)
iii. Chemical Species Transport: Transport of Diluted species (tds).

21
Figure 1.5: Model of Buoyancy Flow
Cool Air Cool Air
Hot Air Hot Air
UHI
UCI
UHI

22
1.4.5 Research framework
Figure 1.6: Research Framework
Determination of LST from Landsat Data;
field measurement of the selected urban
wetland to determine potential UCI intensity
and extent; wetland area, shape, location and
heat capacity; Riparian buffer width and type
of Riparian shade; water quality of the
wetlands.
COMSOL would be used in simulation and
modeling studies. Numerical model
quantifying shading by riparian buffer and
topography. CFD simulations of the
evaporative cooling effect from water surfaces
and effect of trees (evapotranspiration)
Multivariate regression analysis will be used to
quantify the relative contribution of descriptor
variables to the UCI intensity and efficiency.
Set of design guidelines for the urban
designers, planners, landscape architects and
urban water experts to aid design and planning
of urban wetlands.
FIELD STUDY
SIMULATION AND
MODELING STUDY
RESULT & ANALYSIS
DEVELOPMENT OF
PARAMETERIC
RELATIONSHIP OF
THE FACTORS
REGULATIING URBAN
COOLING ISLAND
Study of the related literature to understand the
potential role of urban wetland as UCI; to
identify the different factors that might help to
enhance UCI effect of the wetlands.
LITERATURE STUDY
Determination of Land Surface Temperature
from Landsat Data to investigate the UHI
intensity and UCI potential
REMOTE SENSING

23
1.5 Structure of The Thesis
Chapter one starts with a brief introduction to the urbanization trends of the
whole earth and then describes the major impact of the climate due to rapid
urbanization. Then the Statement of the problem is given followed by the research
objectives. Then a detail description of the methodology to conduct the research are
explained. The related references to this chapter are given at the end.
Chapter two begins with the brief description of the Urban Boundary Layer (UBL)
followed by brief discussion of the physics behind the Urban Energy Balance. Then
the formation of Urban Heat Island (UHI) is explained followed by the category of
UHI and its spatial structures and causes of UHI. An Urban Heat Island studies at
surface level in Dhaka is presented at this chapter. At the second part of the Chapter
there are description of UHI mitigation strategies identifying the role of the Urban
wetland as Urban Cooling Islands (UCIs) to mitigate Urban Heat Island effect. This
chapter then elaborates the morphology of UCI through identifying its necessary
parameters. At the end, the related references are given.
Chapter three elaborate the role of riparian shading in the formation of UCIs. It also
indicates the methods of creating riparian shading besides identifying the other
ecological services provided by trees including carbon sequestration. Second part of
the Chapter explains the mechanism which transports the cooling effect from the
source. At the end of the chapter related references to this chapter are given.
Chapter four starts with the objectives of remote sensing technique used for the study.
It then explains the methods and the necessary equation for remote sensing. After that,
it analyses the UCI with the help of LST and other parameter derived through remote
sensing. Related references are given at the end.
Chapter five starts with the objectives of field measurement conducted for the study of
UCI. It then explains the field measurement methods, analysis of data obtained from
the field and results from field measurement followed by related references.
Chapter six starts with the objective of the simulation study for the research. It then
explains the platform chosen for simulation study and simulation model itself. After
that result obtained from the simulation are analysed and findings are presented
followed by references to related literature
Chapter seven brings together all the findings specially from remote sensing, field
measurement and simulation study to explain all the parameters required for the
formation of Urban Cooling Islands (UCIs). It then elaborates the techniques obtained
from the research to transform Urban wetlands into UCIs as an adaptation strategy
against the Urban Heat Island effects.

24
1.6 References
1. Ahmed R. (1993). “In search of the impact of urbanization on the thermal environment of the city of Dhaka, Bangladesh, during the pre-monsoon hot season from 1948 through 1987”. Report of the Technical Conference on Tropical Urban
Climates Dhaka, Bangladesh, 28 March - 2 April 1993, World Meteorological
Organization (WMO). 2. Ahmed B., Kamruzzaman M., Zhu X., Rahman S.M. and Choi K. (2013). “Simulating
Land Cover Changes and Their Impacts on Land Surface Temperature in Dhaka, Bangladesh”. Remote Sens., 5, 5969-5998; doi:10.3390/rs5115969
3. Akbar, M. A. (2011). “An assessment of the geothermal potential of Bangladesh”. (pp.
1-33, Rep. No. 5). Reykjavik, Iceland: United Nations University.
4. Brammer H. (2012). “The physical geography of Bangladesh”. First edition, The
University press limited, Dhaka.
5. Bangladesh Bureau of Statistics. (2016) “Community Report, Dhaka Zila, June 2012”.
Population and Housing Census 2011, Statistics and Informatics Division, Ministry of
Planning. Bbsgovbd. Retrieved 29 March 2016, from
http://www.bbs.gov.bd/PageSearchContent.aspx?key=statistical yearbook.
6. FAO/ UNDP (1988). “land resources appraisal of Bangladesh for Agricultural Development Report 2: Agro-ecological regions of Bangladesh”. (Rep. No. 2). (1988).
FAO.
7. Huang L., Li J., Zhao D., Zhu J (2008). “A fieldwork study on the diurnal changes of urban microclimate in four types of ground cover and urban heat island of Nanjing, China”. Building and Environment 43, 7–17.
8. Hwang S.J., Lee S.W., Sona J.Y., Park G.A., Kim S.J. (2007). “Moderating effects of the geometry of reservoirs on the relation between urban land use and water quality.”
Landscape and Urban Planning 82, 175–183, Elsevier.
9. Hossain M.E. and Nooruddin M.“Some aspects of urban climates of Dhaka city”. Report of the Technical Conference on Tropical Urban Climates Dhaka, Bangladesh,
28 March - 2 April 1993, World Meteorological Organization (WMO).
10. IPCC. (2014). Climate Change 2014: Synthesis Report. Contribution of Working
Groups I, II and III to the Fifth Assessment Report of the Intergovernmental Panel on
Climate Change [Core Writing Team, R. K. Pachauri and L. A. Meyer (eds.)]. IPCC,
Geneva, Switzerland, 151 pp.
11. Kadygrov, E.N. 2006. “Operational Aspects of Different Ground-Based Remote Sensing Observing Techniques for Vertical Profiling of Temperature, Wind, Humidity and Cloud Structure”. IOM Report No. 89, WMO/TD No.
1309. Available from: http://www.wmo.int/web/www/IMOP/publications-
IOM-series.html 12. Missirian A., Schlenker W. (2017). “Asylum applications respond to temperature
fluctuations”. Science 358 (6370), 1610-1614 13. Mandelbrot, B. B. 1982. “The Fractal Geometry of Nature”. W. H. Freeman and Co.,
New York.
14. McGarigal, K., Marks, B.J., 1995. “Fragstats: Spatial Pattern Analysis Program for Quantifying Landscape Structure”. General Technical Report PNW-GTR- 351,
USDA Forest Service, Pacific Northwest Research Station, Portland, OR.
15. Oke, T.R. 2006. “Initial Guidance to Obtain Representative Meteorological Observations at Urban Sites”. World Meteorological Organization, Instruments and Observing Methods, IOM Report No. 81, WMO/TD-No. 1250
Available from: http://www.wmo.int/web/www/IMOP/publications-IOM-
series.html 16. Robitu M., Musy M., Inard C., Groleau D. (2006). “Modeling the influence of

25
vegetation and water pond on urban microclimate”. Solar Energy 80, 435–447.
17. Revi A., Satterthwaite D.E., Durand F. A., Morlot J. C., Kiunsi R.B.R., Pelling M.,
Roberts D.C., and Solecki W., 2014: Urban areas. In: Climate Change 2014: Impacts, Adaptation, and Vulnerability. Part A: Global and Sectoral Aspects. Contribution of Working Group II to the Fifth Assessment Report of the Intergovernmental Panel on Climate Change. Cambridge University Press, Cambridge, United Kingdom and New
York, NY, USA, pp. 535-612.
18. Sun R., Chen L. (2012). “How can urban water bodies be designed for climate adaptation?” Landscape and Urban Planning 105, 27– 33.
19. Sun R., Chen A., Chen L, Lü Y. (2012). “Cooling effects of wetlands in an urban region: The case of Beijing”. Ecological Indicators 20, 57–64.
20. Tominaga Y., Sato Y. and Sadohara S. (2015). “CFD simulations of the effect of evaporative cooling from water bodies in a micro-scale urban environment: Validation and application studies.” Sustainable Cities and Society 19(2015)259–270.
21. United Nations Population Division | Department of Economic and Social Affairs.
(n.d.). Retrieved January 30, 2018, from
http://www.un.org/en/development/desa/population/index.shtml
22. Zhu O, Melamed M.L., Parrish D., Gauss M., Klenner L.G., Lawrence M., Konare
A.and Liousse C. (2012). “WMO/IGAC Impacts of Megacities on Air Pollution and Climate" (Rep. No. 205). (n.d.). Retrieved from
http://www.wmo.int/pages/prog/arep/gaw/documents/Final_GAW_205.pdf

26
Chapter 2 : URBAN HEAT ISLAND AND ADAPTATION
MEASURES
2.1 Urban Boundary Layer (UBL)
The lowermost part of the atmosphere of the earth which is in direct contact
with earth’s surface is known as Atmospheric Boundary Layer (ABL). The depth of
the ABL is between 100 m to 3000m from mean sea level and controlled by surface
roughness, thermal mixing, injection of air pollutants and moisture from the Earth’s
surface (Oke, 2017). The Atmospheric Boundary Layer can be divided into two layers:
Outer and inner region. In the outer region, thermal effects of the Earth’s surface
dominate. The inner region is roughly lowest 10% of the ABL is more commonly
known as the surface layer (SL). Here flow is dominated by friction with earth’s
surface. During daytime due to the thermal buoyancy driven flow initiated by the hot
earth surfaces air is carried upward until they reach the top of the ABL, where further
uplifting is barred by a capping inversion. The atmospheric layer above this capping
inversion at height Zi is known as the Free Atmosphere (FA). The layer just below the
FA is called Entrainment Zone (EZ) where buoyant thermals air ‘bombard’ the
underside of the inversion and sometimes overshoot into the FA for their inertia. Then
they settle back as cleaner, warmer and drier air. This daytime situation in the outer
layer is often termed as Mixed Layer (ML) which is refers to the top 90% of the ABL.
Due to the Earth’s surface, nocturnal cooling at night ABL shrinks nearer to the surface
and settle down as a stagnant layer near to the ground at a depth of 200-400m. (Oke,
2017). This layer is known as the nocturnal boundary layer (NBL).
The Surface Layer (SL):
The lowest 10% of the ABL is known as the surface layer (SL) where surface
influences such as heating, cooling, and roughness dominate even more, and frictional
forces create most mixing.
Inertial sublayer (ISL):
The upper part of the Surface Layer (SL) where the atmosphere responds to the integral
effects of Urban Neighborhoods is known as ISL.
Roughness sublayer (RSL):
The lower layer of the Surface Layer (SL), the flow responds to the nature of the
individual roughness elements themselves. It is a zone of substantial flow deflection,
zones of up- and downflows, overturning, vortices and plumes arising from facets that
are warmer/cooler, moister/dryer, cleaner/more polluted than average. The upper
boundary of the RSL is termed the blending height Zr.
The Urban Canopy Layer:
In a city, “the lower part of the RSL, that is the layer below ZH,” i.e. the height of the
main urban elements, is termed the urban canopy layer (UCL) (Oke, 1976, 2017). The
UCL is the site of intense human activity and exchange and transformation of energy,
momentum, and water. The top of the UCL is defined as the height of the urban
elements – buildings and/or trees (Figure 2.1). Oke described that Defining the height

27
of the urban elements is not an easy task, as evidence suggests that a few unusually
tall elements (isolated high buildings, tall trees) play a particularly significant role in
the generation of roughness and turbulence.
Figure 2.1: Schematic of typical layering of the atmosphere over a city (a) by day, and (b) at night.
Note the height scale is logarithmic, except near the surface. (Oke 2017)
2.2 Urban Energy Balance
The relevant flux densities at a non-urban land surface are: the net all-wave
radiation Q∗, the ground heat flux density, that transfers sensible heat by conduction
to the substrate (QG); the sensible heat flux density QH and the latent heat flux density
QE are the two turbulent heat flux densities that exchange energy between the

28
atmosphere and surface. Energy conservation means those fluxes must balance at a
surface (Grimmond and Oke, 1999):
Q∗=QH+QE+QG………………………………………………………………………………………… (1)
If Anthropogenic heat and energy added or subtracted due to advection are
considered, then the equation could be written as (Oke, 1987, 2017):
Q∗+QF=QH+QE+ΔQS+ΔQA…..……………………………………………………………………(2)
Figure 2.2: Schematic of the fluxes in the SEB of (a) a rural and (b) an urban building-soil-air volume.
(Oke, 2017)
A key feature of the Urban Surface Energy Balance is the relation between Q∗
and ΔQS. As the sunrise in the morning, a large fraction of Q∗ transferred into the heat
storage (ΔQS). but after the noon more energy is channeled into the two turbulent
fluxes QH and QE, at night the turbulent fluxes subside, the heat that stored in the urban
fabric released again and in the dense urban districts fuels continued positive QH into
the atmosphere during the night.
2.3 Urban Heat Island (UHI)
“The rapid urbanization is accompanied by high levels of concentration of the
urban population and built-up areas in many countries” (Oke,2017). One of the
environmental manifestations of such an increase in urbanization is the formation of
heat islands in urban domain commonly known as Urban Heat Island (UHI). This

29
phenomenon that the Air temperature in a city is often higher than surrounding
countryside was first observed by Luke Howard at 1833 (Oke, 1982, 2017). Miao S.
et al, 2009 observed for Beijing area the monthly mean UHI intensity for August 2005
is maximum 1.128°C at 1300 UTC. For 14 no-rain days during in August 2005, the
nighttime intensity reached the maximum of 1.628°C. Using UrbClim model Lauwaet
D. et al, 2015 found the nighttime UHI of Brussels at 0000 LT over all summer periods
during 2000-2009 is 3.15°C.
2.3.1 Type of Urban Heat Island
UHI can be distinguished into four types (table 2.1, Oke, 2017):
1. Surface Heat Island (UHISurf)
2. Canopy layer heat island (UHIUCL)
3. Boundary layer heat island (UHIUBL)
4. Subsurface heat island (UHISub)
Table 2.1: Summary of UHI types, scales, thermal processes, modeling approach, direct and remote
measurement techniques used to observe them (Oke, 2017).
UHI Type Scale Processes Models Direct
Measurement
Remote
sensing
Surface heat
island
(UHISurf)
Micro Surface EB Surface EB
and
equilibrium
surface
temperature
Temperature
sensors
attached to the
surface
Satellite/
aircraft
sensors
Canopy layer
heat island
(UHIUCL)
Local Surface EB and EB
of UCL air volume
Canopy and RSL
scheme incl.
interactions
with
subsurface and
overlying BL
Temperature
sensors
at fixed points,
arrays and
mobile in UCL
and
rural SL
Mini-
sodar(1),
mini-lidar
Boundary
layer
heat island
(UHIUBL)
Local
and
meso
EB at top of RSL
and BL EB
BL scheme
incl.
interaction
with
RSL/surface
and
free
atmosphere
Temperature
sensors
mounted on
aircraft,
balloons and
tall
towers
Sodar, lidar,
RASS
profiler
Subsurface
heat island
(UHISub)
Local Subsurface Energy
Balance (EB)
Heat (water)
diffusion in
solid
Temperature
sensors
within the
substrate

30
Subsurface urban heat island (UHISub):
Differences between temperature patterns in the ground under the city,
including urban soils and the subterranean built fabric, and those in the surrounding
rural ground.
Surface urban heat island (UHISurf):
Temperature differences at the interface of the outdoor atmosphere with the
solid materials of the city and equivalent rural air to the ground interface. Ideally, those
interfaces comprise their respective complete surfaces (i.e. λc)
Canopy layer urban heat island (UHIUCL):
Urban canopy layer (UCL) is the layer in between the urban surface and roof
level, that is the exterior UCL. “Canopy layer urban heat island is the difference
between the temperature of the air contained in the urban canopy layer (UCL), and the
corresponding height in the near-surface layer of the countryside. The upper boundary
just of the UCL heat island is just the below roof level and it consists of the air between
the roughness elements such as buildings and tree canopies”.
Boundary layer urban heat island (UHIUBL):
“Boundary layer urban heat island is the difference between the temperature
of the air in the layer between the top of the UCL and the top of the urban boundary
layer (UBL), and the temperature at similar elevations in the atmospheric boundary
layer (ABL) of the surrounding rural area”. The UBL Heat Island located above the
UHIUCL. But the lower boundary of UHIUBL is subject to the influence of urban surface.
2.4 Surface Temperature and Surface Energy Balance
Every surface possesses a unique single temperature due to its unique SEB at
its interface with the air. the surface temperature T0 satisfies its combination of
radiative, conductive and turbulent fluxes. This temperature is the common boundary
in the temperature gradients that generate a sensible heat flux density (QH) upwards
into the atmosphere and similarly conducts a sensible heat flux downward into the
substrate (QG). Equation 3 represents the SEB for a surface, as a function of the change
of T0 with time for a layer of thickness z with heat capacity C:
C∂T0
∂tz = Q*-QH-QE-QG…………………………………………………………. (3)
Five surface properties exert particularly strong control on Equation 1 and therefore
on T0:
o Geometric,
o Radiative,
o Thermal,
o Moisture and

31
o Aerodynamic.
Naturally, the surface temperature (T0) remains critically important to that of
the lowest layer of air (Ta), however, while the two are closely linked, the relationship
is not linear Geometric properties control T0 by regulating the available Solar
irradiance to the facets. Radiative properties control the ability to reflect shortwave
(albedo; α) and longwave radiation and to emit longwave radiation (emissivity; ε).
Facets with high albedo reduce shortwave radiation gain and thus lower T0.
Aerodynamic properties such as aerodynamic roughness length z0 and shelter from
wind influence T0. Highest T0 occur on facets that are smooth with little turbulence,
and facets sheltered from the wind, while lower T0 are observed over rough facets well
coupled with wind. A heat island effect of Putrajaya, Malaysia has identified that
shading from built structure could be more effective in reducing urban surface
temperature than tree canopies. This reduction in surface temperature by built
environment shading has been observed at a magnitude of 3-5°C during the noon
(Ahmed A.Q. et al, 2015).
Traditionally Urban Heat Island studies have been conducted for isolated
locations with the air temperatures recorded in site. Satellite remote sensing
technology has made it possible to study UHISurf for large areas of cities. Local
building geometry and materials influence the “canopy layer urban heat island”. On
the other hand, “Heated air from upwind urban areas and the underlying canopy layer
in which the canopy urban heat island occurs generates the boundary-layer urban heat
island” (Soushi Kato et al., 2007).
2.5 Near Surface Urban Heat Island Under ‘Ideal’ Condition
The temperature cross-section and iso-therm map in figure 2.3 clearly show a
number of common features of the heat island morphology as described by Oke (1980,
2017). If the surrounding topography doesn’t have any significant effect the heat island
effect sharply protrudes against background rural temperature field. Windward side of
the urban/rural boundary area has the “cliff” of the heat island and it follows closely
the built-up area for much of the city perimeter. Horizontal Temperature Gradient due
to the UHI is slacker for most of the urban area, except we can expect “warm spot”
due to anomalously high-density urban area, industrial area, apartment complex,
shopping node or the city central area, as these areas are relatively warmer than the
other urban areas. Again, we can expect “cool spot” due to the presence of park,
wetlands or anomalously low-density urban areas, as these areas are relatively cooler
than the other urban areas. These thermal features of the UHI might shift a little bit
downwind from their source area due to advection process with wind flow.
Time-dependent aspects of UHI explained by Oke as shown in fig 2.4. Due to
the different rates of near-surface warming and cooling, there are different distinctive
diurnal air temperature regimes in the Urban and Rural area. At a given time the
difference between the Urban and rural temperature defines the UHI intensity. Heat
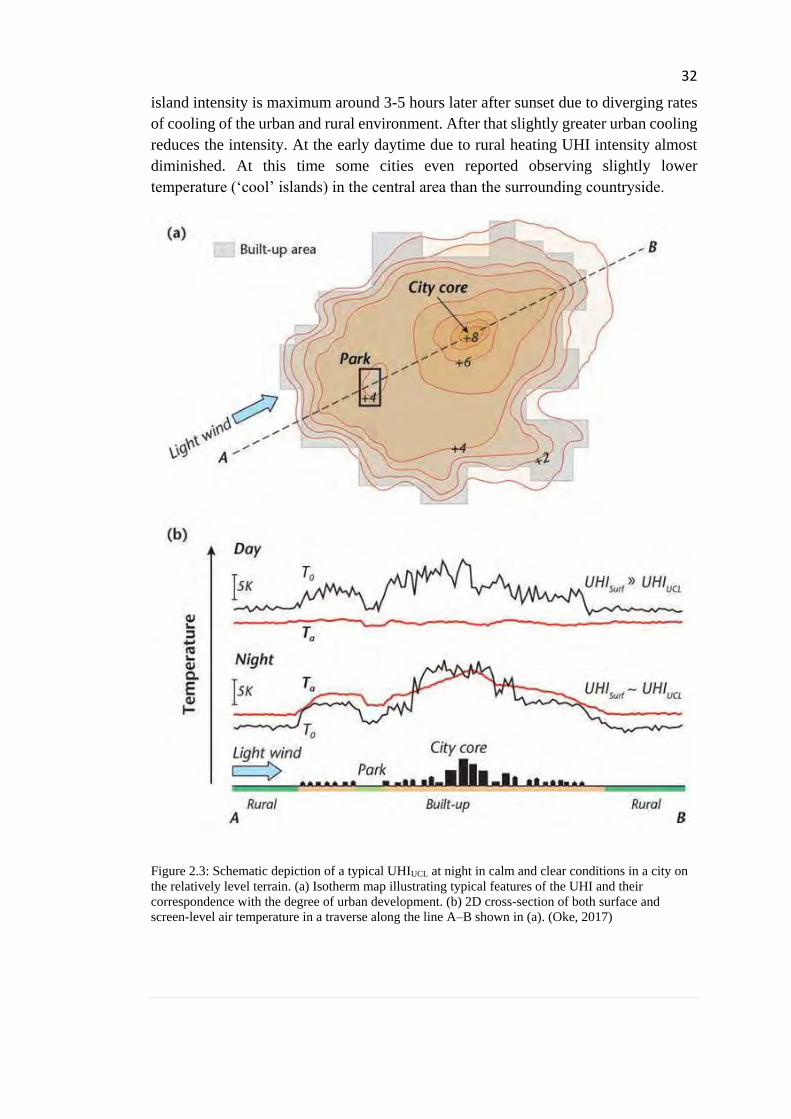
32
island intensity is maximum around 3-5 hours later after sunset due to diverging rates
of cooling of the urban and rural environment. After that slightly greater urban cooling
reduces the intensity. At the early daytime due to rural heating UHI intensity almost
diminished. At this time some cities even reported observing slightly lower
temperature (‘cool’ islands) in the central area than the surrounding countryside.
Figure 2.3: Schematic depiction of a typical UHIUCL at night in calm and clear conditions in a city on
the relatively level terrain. (a) Isotherm map illustrating typical features of the UHI and their
correspondence with the degree of urban development. (b) 2D cross-section of both surface and
screen-level air temperature in a traverse along the line A–B shown in (a). (Oke, 2017)

33
Figure 2.4: Temporal Variation of Urban and Rural (c) air temperature (d) heating/cooling rates and
(e) the resulting heat island intensity (Oke, 1980)
Vertical Structure of the UHI:
Under the calm condition, Urban Canopy Layer UHI creates a self-contained
urban heat ‘dome’, which due to the wind flow creates an urban boundary layer in the
direction of the wind as shown in fig 2-5.

34
Figure 2.5: Generalized form of UBL thermal structure in a large mid-latitude city during fine summer
weather (a) by day, including schematic profiles of potential temperature () and the depths of the
urban and rural internal boundary layers (---) and the daytime mixed layer (-·-) and (b) at night.
(Oke,1981)
UBL increases as the day progress and by mid-afternoon may reach up to .5-
1.5 km in depth depending on surface sensible heat flux and stability of the air mass
(Oke, 1980). Downwind of the city a new rural internal boundary layer creates and
makes the urban effected air aloft as a heat ‘plume’, often extending for tens of
kilometers (Oke, 1980). The most significant variables that effects UHI intensity is
wind speed and cloud cover. Oke (1973) examined the effects of wind speed on UHI
intensity which is non-linear and approximately inverse square root of UHI intensity.
In case of cloud cover, the cloud type as well as amount also have effects on UHI
intensity. It has been observed that low cloud is more effective than an equal amount
of high cloud in limiting the UHI intensity.
2.6 Reasons For Urban Heat Island
Transformation of cities natural land with impervious surfaces, buildings, and
other infrastructure generates the “urban heat island” (UHI) effect. The UHI is one of
the most compelling and crucial concerns of city sustainability. “Although, the urban
heat island arises due to many factors, the nature of the surface and its conditions is
the strongest among the reason. Lack of evapotranspiration due to the absence of
vegetation and water bodies in urban areas and the changes in the thermal properties
of surface materials are the main reasons for UHI”. “Urban microclimate is closely
correlated with the types and patterns of landscape existing in the urban environment”
(Sun R. et al,2012 and Steeneveld G.J. et al, 2014). But UHI is not only related to
simply an urban-rural comparison of thermal properties, moisture availability and
geometric structure also plays part in it.
Oke, (2017) explained four thermal properties that are pertinent to explain
UHI.

35
a. Heat capacity (C, in J m-3 K-1) expresses a materials ability to store heat and gives
the temperature change to expect due to uptake or release of sensible heat. It is the
product of density (ρ) and specific heat (c, in J kg-1 K-1) of a material (i.e. C= ρc).
b. The ability of a substance to conduct a heat flux density (Wm-2) by passing energy
from one molecule to another along a given temperature gradient (Km-1) is known
as the Thermal conductivity (k, in W m-1 K-1 Relatively large amounts of heat
will be transmitted for a given temperature gradient if the k is high whereas heat
transmission will be low for the same temperature gradient if the k is low.
c. The ease with which temperature signals are transmitted through the material is
known as Thermal diffusivity (κ, in m2 s-1). κ controls the speed of the movement
of temperature wave. With κ the depth of the layer involved in thermal changes
could be estimated. The ratio of the Thermal conductivity to the heat capacity is
Thermal diffusivity (i.e. κ =k/C). So, “thermal activity is directly related to the
ability of a material to conduct heat, but it has an inverse relationship with the
total heat required to cool or warm the substance”. Rapid penetration of surface
temperature changes in a thick layer of material will require high κ, but if the
change is restricted to a shallow layer it means low κ.
d. Thermal admittance (μ, in J m-2 K-1 s-1/2; also called ‘thermal inertia’) is a
property of interface of two material surface. Previous three measures are related
with volume of the subsurface material itself whereas this property is for the
interface of the surfaces. Each of the substance forming the interface has its own
μ value. In case of an urban area it is the construction material or ground surface
and the surrounding air. Thermal admittance for air (μa) depends on the thermal
diffusivity of the atmosphere and therefore turbulence. So, μa is highly variable.
But for soil or construction materials of the built form the value is more stable.
Again, in case of wetland the two-material forming the interface is air and water.
simply involving the other thermal properties, the expression for thermal
admittance is:
μ =√kC=C√k …………………………………………………………………. (4)
“Various studies put Thermal admittance (μ) is the most important thermal
property of the material”. Because Large Thermal admittance sequester heat in the
material resulting is a relatively small change in the surface temperature throughout
the day. Again, a material with low Thermal admittance undergoes large temperature
variation throughout the day due to the shedding of a “large amount of heat in the
atmosphere”. There is a large difference in urban and rural Thermal admittance (oke,
2017). So, it could be concurred that urban area with material with low thermal
admittance can end up with significantly higher Urban Surface Heat Island (UHISURF)
In case of Dhaka till now there is no investigation of urban material in terms of
Thermal admittance. But the Urban Surface Heat Island (UHISURF) study presented
later in this chapter might be able to explain about the ‘thermal admittance’ of the
urban material of Dhaka. Oke described the following reasons (table 2-2) for Urban
Canopy Layer Heat island.

36
Table 2.2: suggested causes of UHI (Oke, 2017)
Cause Description of cause
Canopy layer heat island (UHIUCL)
Surface geometry (a) Increased surface area (λc > 1)
(b) Closely-spaced buildings
– multiple reflections and greater shortwave
absorption (lower system albedo);
– small sky view factor (ψsky < 1) reduces net
longwave loss, especially at night;
– wind shelter in UCL reduces heat losses by
convection and advection.
Thermal properties Building materials often have a greater capacity
to store and later release sensible heat.
Surface state (a) Surface moisture-waterproofing by buildings
and paving reduces soil moisture and
surface wetness.
(b) Convection favors sensible (QH) over latent
heat flux density (QE).
(c) If snow – lower albedo in the city gives a
relative increase of shortwave absorption
compared
to rural areas.
Anthropogenic heat Anthropogenic heat release due to fuel
combustion and electricity use is much greater
in the city.
Urban ‘greenhouse effect’ Warmer, polluted and often moister urban
atmosphere emits more downward
longwave radiation to UCL.
A significantly important observation from the numerous UHI study is the
existence of “Cool Island in the middle of the day in the city center” due to the shading
of the Urban canyon as shading prevents direct solar radiation gain. “Incoming
longwave radiation at the surface of the city is often slightly greater”. In general, daily
ΔL↓U_R in a large city is typically about 20 W m_2, which translates to an increase of
5–10% (Oke et al, 2017). The physical cause of the increase in L↓ is attributed to the
air pollutants. It was assumed that pollution was chiefly responsible for creating urban
warming by absorbing much of the outgoing longwave from the surface and re-
emitting a significant fraction back which could be described as an urban ‘greenhouse’
effect. Although the effect is minor than the UHI, it appears the extra L↓ originates
from an atmosphere warmed largely by non-radiative processes. (Oke et al,2017). This
is a serious concern for the Dhaka as it is one of the most polluted city with the high
density of pollutant in the air which could absorb outgoing longwave L↑ radiation and
re-emit a significant portion back. This might be exacerbating the UHI effect in Dhaka.
Urban green spaces show relatively lower air and surface temperature than
their urban surroundings due to the availability of moisture, the sky view factor and
the presence of vegetation and/or water. These properties affect both the daytime
heating, nocturnal cooling rates and the relative coolness or warmth of the thermal
climate relative to that of the surrounding urban area in which it is embedded. The
difference sometimes called the ‘park cool island’ (PCI) has been studied in the parks

37
of several cities located in different climatic zones. Like the UHIUCL, the PCI is usually
largest on nights with ‘ideal’ weather and its influence declines roughly exponentially
with distance from the park edge, this limits its effective impact to a distance of about
one park width (diameter) into its surrounds. The largest PCI differences reported are
about 5 K (Spronken-Smith and Oke 1998, Upmanis et al., 1998). The results from
tropical cities, while fewer in number, suggest similar effects to those of mid-latitude
parks.
Following properties modify air temperature in the UCL at the micro- and local scale:
1. Street geometry, because it affects radiation receipt, loss, and air flow.
2. Building fabric, because it affects heat storage, release and waterproofing.
3. Vehicle traffic and space heating/cooling, that release QF
The magnitude of the largest observed UHIUCL that is passively-driven (i.e. not due to
larger than normal QF) is about 12 K (Oke, 2017). If the urban canyon H/W ratio
exceeds some threshold, increased shade within the canyon could limit daytime heat
storage uptake and this can outweigh the nocturnal thermal benefit due to the reduced
longwave radiation loss. Wind speed reduces the magnitude of UHIUCL while wind
direction changes the shape of UHIUCL which is strongly affected by city’s internal
structure. Due to the wind flow, UHI might advect beyond the city boundary like a
plume towards the downwind direction of the wind flow.
Cloud cover fraction affects the UHIUCL by reducing solar receipt and trapping
longwave radiation. Cloud type such as cirrus (Ci), altocumulus (Ac); cumulus (Cu)
and stratus (St) etc. influence the growth of UHIUCL. The combined effect of cloud type
and a cover fraction on net longwave radiation cooling at night are given by Bolz
relation:
L*=L*clear (1-kn2) (W/m-2) ……………………………………………………… (5)
Where,
L*clear = net longwave radiation with cloudless skies
k= cloud type factor accounting for the decrease in cloud base temperature with
increasing height.
n= cloud amount (in tenths).
Oke (2017) described that in case of complete cloud cover (n=1.0), relatively
warm stratus cloud low cloud base reduces the drain of heat by L* by about 90%
(average of low clouds – those with bases below approximately 1.5 km). so, the UHI
potential is severely curtailed. For middle height altus types cloud the energy sink is
cut by about 75% and with high altitude cirrus clouds, consisting of ice crystals, even
with overcast L* is only reduced by about 25%. The effect of cloud on UHI potential
is a severe concern for Dhaka as six (6) months of the year is Warm and humid
characterized by low cloud cover as this restricts the longwave heat loss of the urban
fabric through the atmosphere at specifically at night.

38
2.7 Effects of Urban Heat Island
flooding, landslides, drought, increased aridity, water scarcity, and air
pollution has widespread negative impacts on people’s health, livelihoods, and assets”.
It has also been observed by IPCC that “intensity of urbanization is closely associated
with long-term trends in surface air temperature in urban centers”. It has been stated
by IPCC that “climate change can strengthen and/or increase the range of the local
urban heat island (UHI), altering small-scale processes, such as a land-sea breeze
effect, katabatic winds, etc., and modifying synoptic scale meteorology (e.g. changes
in the position of high-pressure systems in relation to UHI events)”. From the IPCC
reports it is also palpable that “increased frequency of hot days and warm spells are
already exacerbating urban heat island (UHI) effects, causing heat-related health
problems, increased air pollution, as In the most recent assessment report, IPCC stated
that increasing “Urban climate change-related risks, such as heat stress, extreme
precipitation, inland and coastal well as an increase in energy demand for warm season
cooling of the buildings in a variety of cities in subtropical, semiarid, and temperate
sites” (Revi et al, 2014).
In hot regions, the UHI adds to the number of cooling degree-days thereby
increasing the cost of air conditioning buildings. UHI adds to the burden of hot weather
for inhabitants of cities in the tropics because many cities in this climatic region are
from Low and middle income. Most of the people in these cities have no access to air
conditioning the UHI is an added threat to their health. Heat stress is the leading cause
of mortality from weather-related hazards in various part of the world greater than
more violent phenomena like hurricanes (typhoons), tornadoes and floods. Prolonged
exposure to excessive heat is particularly dangerous because the human body requires
regular periods of sufficient coolness in which to recover. One of the major concern
about UHI is that it ramps up during the evening when people sought respite after the
day’s heat.
The various types of UHI induce other climatic phenomena, such as the extra
warmth shifts the thermal structure of the boundary layer towards neutrality and
instability, which encourages vertical mixing. This modified temperature structure
generates country-breezes. This is an urban heat island circulation (UHIC) that draws
air towards the city center at a low level where it converges, rises, flows outwards at a
higher level and sinks away from the city over adjacent rural areas.
2.8 Urban Heat Island Observation in Dhaka
“Dhaka is one of the most populated and polluted cities in the world, where the
juxtaposition of wetlands and urban context have an opportunity for creating a viable
and distinct character of its own. Urban wetland and green space are diminishing due
to pressure from the housing sector and unplanned urbanization” (Shahjahan A.T.M.
et al, 2016). The first ever city-wide Canopy Layer Urban Heat Island (UHIUCL) study
was done by Bangladesh Meteorological Department (BMD) during the year1992.

39
Urban air temperature at 0600 hours BST and 1800 hours BST and Humidity
at 0600 hours BST of the two dates 03 January 1992 and 08 June 1992 are measured.
Thermometers and Assman Psychrometers are used. Air temperature and Humidity
observations at fixed hour 0600 BST (morning) and 1800 BST (evening) are
considered to find out the thermal and humidity distribution patterns over Dhaka city.
The heat island study is based on mobile survey data during the winter months and the
month of June and July over Dhaka city which is fast expanding and developing. A
network of 10 points is selected for the study which is (1) Agargaon, (2) Tejgaon (3.)
Motijheel (4) Dhanmondi (5) Nowabgonj (6) Mirpur (7) Kallayanpur (8) Gulshan (9)
Bakshibazar and (10) Airport, these include two meteorological observing station, one
at Agargaon and other at Hazrat Shah Jalal International Airport, rest are mobile
Survey points. The locations were chosen keeping in view the altitude, exposure, site
peculiarities, population density and industrial sites to work out the effects of various
"factors on heat island.” Figure 2-6 represents the observed heat island intensity during
1992 at the time of minimum temperature epoch [0600 hours BST] at Dhaka city in
January was 3.8°, in April was 2.5° and that of July was 0.6° [Hossain et al,1993,
Khaleque et al 1993, Ahmed,1993]. The maximum intensity of heat island or warm
pocket is observed to be of the order 3.8°C at Old Dhaka and Motijheel Commercial
area.
Figure 2-7 represents the isothermal pattern of 03 January 1992 at 1800 hours
BST. The pattern more or less resembles the 0600 hours BST pattern but its heat island
intensity decreases from 3.8°C to 2.8°C, during summer months isothermal pattern of
08 June 1992 shows heat island intensity is in order of 0.08°C. [Hossain et al,1993,
Khaleque et al 1993, Ahmed,1993]. The Isothermal pattern-shows Warm pockets at
Tejgaon Industrial Area, Mirpur and Azimpur because of high-density urban
dwellings; among the cool areas that had been observed were Agargaon area,
Dhanmondi residential area, Shahjalal International Airport and over outer "boundary
of the city”. “Dhanmondi residential area was under the grip of cool pools due to the
presence of large water body within the area and more greenery” (Shahjahan A.T.M.
et al, 2016).

40
Figure 2.6: Temperature distribution at 0600 BST of 03 January 1992 over Dhaka city (source BMD)

41
Figure 2.7: Temperature distribution at 1800 BST of 03 January 1992 over Dhaka city (source BMD).
Two peaks of heat island intensity are observed one at early morning and
another at early night, but early morning heat island intensity is stronger than early
night heat island. During summer months heat island effect is insignificant to consider.
Humidity Island (Fig 2-8) has an inverse relation to heat island whenever moisture is
less but followed heat island intensity whenever moisture is high.

42
Figure 2.8:Humidity field analysis at 1600 BST of 03 January 1992 over Dhaka city (source BMD).
2.9 Surface Urban Heat Island Study in Dhaka
In regard to Dhaka city, it has been reported that changing of Land Surface
Temperature (LST) is found to be directly correlated with Land Cover transition. It
had been observed that LST had increased in areas with growing urban development
where hard, impermeable pavement and dark surface are replacing natural Land Cover

43
(LC) like the vegetative land cover and the wetlands (Raja et al, 2013). “Thus,
urbanized land use due to rapid urbanization in Dhaka has a direct impact on its urban
microclimate which is exacerbating Urban Heat Island Effect” (Shahjahan A.T.M. et
al. 2016). Several studies reported that Dhaka city “land surface temperature (LST)”
is about 2 - 4°C higher than the LST of its suburbs (Khaleque et al 1993, Raja et al,
2013).
A “Surface Urban Heat Island (UHIsurf)” study has been done in this research
by extracting LST from the data obtained from the Earth-observing Landsat-8 and 5
TM satellite of NASA. The data has been obtained through web-based earth-explorer
service of the USGS. Detail method and equation used in this UHIsurf analysis has been
elaborated in chapter 4. Two dates have been selected to extract LST from the TIR
band of Landsat satellite. The first date is 12th December 1991 which is a similar day
like the date chosen by Bangladesh Meteorological Department (BMD) for UHIUCL
study in Dhaka as stated before and the second date is 16th December 2016. The reason
to choose these two dates are to compare the UHIsurf as Dhaka has gone under rapid
urbanization process after 1990 in this time period of a quarter of a century. So, there
will be definitely a relation between the LST change and the urban development
process of this quarter century time period which have seen rapid transformation of
natural land cover with artificial man-made material.
Base map of the Dhaka city is given in the figure to aid reading the extracted
Land Surface Temperature map in figure 2.10, 2.11 and 2.12. From Fig. 2.10 we can
see the LST of 12 December 1991, which fairly corresponds with the UHIUCL observed
by the BMD. This correspondence with BMD observation is important for the research
because subsequent work finding the change in urban surface layer heat island derived
based on the value of this date. The highest LST (26.21°C) could be found in Old
Dhaka and Tejgaon industrial area and some pockets in Mirpur and Motijheel
commercial area. Dhanmondi residential area exhibited lowest LST (21.03°C) which
is almost equivalent to the LST of surrounding rural/ peri-urban area. The time of the
Landsat pass over Dhaka is around 10:30 am in the morning. So, the Landsat estimated
UHIsurf for Dhaka on 12 December 1991 is 5.18°C. From Fig. 2.11 we can see the
LST of 16 December 2016, which significantly demonstrate the Urban surface change
in this 25 years of time. The highest LST (28.20°C) could be found in the new sand
filled area for the new residential area in north-east (Bashundhara Residential area)
and north-west part of Dhaka, Tongi industrial area. As before motijheel commercial
area, Old Dhaka, Mirpur and Tejgaon industrial also exhibited Higher LST around
26.56°C. Like before Dhanmondi residential area exhibited lowest LST (22.4°C).
Although LST of Dhanmondi residential area also increased, but it is still nearer to the
LST of surrounding rural/ peri-urban area, which is around 21.13°C The time of the
Landsat passes over Dhaka are around 10:30 am in the morning. So, the Landsat
estimated UHIsurf for Dhaka on 16 December 2016 is 7.07°C. From these data, it can
be concurred that within the period of 25 years Landsat estimated UHIsurf for Dhaka
increased around 2°C.

44
Figure 2.9: Dhaka city Base Map (source RAJUK).

45
Figure 2.10: Land Surface Temperature_ LST (T0) of Dhaka at 12 DEC 1991 derived from Landsat 5
TM data (map overlay is provided in the back of this thesis)

46
From Fig 2.12 the change in LST for the whole urban area of Dhaka in the last 25
years are estimated by deducting the Landsat LST map of 12 December 1991 from the
that of 16 December 2016. Some conclusion could be drawn from this analysis of LST
change.
a. The newly developed urban area has shown highest increase in LST, hence
exhibited the greatest change in UHIsurf. The change in LST is in a magnitude
of 8.2°C.
b. Industrial area also exhibited LST increase of around at a maximum magnitude
of 5.46°C.
c. Commercial area also exhibited LST increase of around at a maximum
magnitude of 5°C.
d. Some part of Old city and area under Dhaka south city corporation has seen
LST decrease of up to 1°C.
Apart from Urban water surface area, there is area also in the Urban Canyon
which has exhibited LST decrease. The cause behind this LST decrease could be
increasing shading from tall building.
Although Bangladesh environmental protection law prohibits [Ministry of
environment and forest, Bangladesh] modification or filling of any area designated as
wetland including rivers, canals, ponds, marshland, flood flow plains and water
retention areas, there is no definitive guideline on how these wetlands could be
included in the Urban Design process to regulate the thermal environment of Dhaka
aside from helping to manage stormwater during the wet season.

47
Figure 2.11: Land Surface Temperature_T0 (LST) of Dhaka at 16 DEC 2016 derived from
Landsat-8 data(map overlay is provided in the back of this thesis)

48
Figure 2.12: Change of Land Surface Temperature T0 (LST) from 1991 to 2016 (map overlay is
provided in the back of this thesis)

49
2.10 Urban Adaptation Measure for Climate Change: Urban Cooling Islands
Wetlands of Urban areas can have a profound impact on Urban Canopy Layer
(UCL) climate levels. Wetlands lower temperature, increases RH and lower Heat
Stress Index (HIS) at the downwind side, which is also known as “Lake Effect”
(Saaroni H., et al 2003). “Wetlands include reservoirs, lakes, and rivers, and form
many Urban Cooling Islands (UCIs)” (Sun R. et al, 2012). This UCI could be an
effective adaptation measure against UHI in the urban areas.
Two main processes take place when Hot dry air passes over a wetland. First
one is reduction in air temperature due to latent heat absorption of water for
evaporation. The second process is sensible heat transfer between the air and
underlying water. If the temperature of water is less than that of air, this second process
results in temperature drop of air. Also, if the moisture content of the air remains
unchanged, there will be an increase in Relative Humidity [RH] with decreasing air
temperature (Saaroni H.et al, 2003).
The cooling effect of the urban fabric transported from urban wetlands is
widely considered as an important ecosystem regulating service. The environmental
benefits of ecosystem regulating services is very valuable in terms of economics. Most
of the UHI studies are implemented at the scale of an entire city. For this reason, there
are little information available on the effect of individual wetland. Various information
on individual wetland such as, the difference of temperature between the wetland and
its surrounding landscapes and the transport of cooling effects of wetlands in various
spatial scales are not known. The determinants for the existence of UCI such as
influence scale of wetlands and the temperature difference are not clearly understood.
Also, the factors having impact on the UCI intensity is still not clearly known (Sun R.
et al, 2012).
Several strategies have been proposed for the improvement of urban climate
like, material with higher albedo, more large trees and vegetative surface or wetlands
to promote evaporative cooling. One of the most efficient ways of passive cooling for
buildings and urban spaces in hot regions is the Evaporative cooling. “The presence of
vegetation and water ponds in cities modify the energy balance, inducing variations in
the amount of solar radiation reaching the surface, wind speeds, ambient temperature
and air humidity and thus can modify the comfort conditions in urban environment”.
[Robitu M. et al, (2006), Taleghani M. et al (2014)].
An investigation by Frey C.M. et al. (2005) from four ASTER satellite scenes
with channels from the very near infrared to the thermal infrared showed “a distinct
daily cool island for ‘tropical semi desert and desert climate’ city Dubai and daily
cooling areas of Abu Dhabi city and its surrounding mangrove areas”. Albedo of a
surface controls the net radiation. Although having lower albedo than the surrounding
desert, due to the availability water at the parks, golf courses, mangroves these two
city exhibits cool island effect (Frey C.M. et al. 2005).

50
2.11 Inversion Layer Over the Water Bodies
When the air is blowing from the warmer land over the surface of waterbody a
shallow stably stratified layer (inversion layer) is produced by a negative (downward)
heat flux over the water surface. Moreover, if the advected air is relatively dry,
evaporational cooling amplifies the stable layer. Such a shallow inversion layer over
the water surface will reduce the evaporation of the reservoir. During spring and
summer inversion occurs all times but in winter it occurs only during the day. Inversion
can also occur over a well irrigated grass field and can modify the microclimate.
Fraedrich K. (1972) developed a simple model of this evaporation process.
Fraedrich indicates many further effects in this inversion effects:
I. Due to the stress between land and lake the air flowing over the water
accelerates.
II. Due to the temperature differences between the land and the lake and by a
pressure increase Because of the cooling inversion layer, secondary flows of
thermal origin develop.
III. Increasing moisture in the inversion layer diverge the long wave radiative flux
which in turn increase the inversion strength and height.
IV. “Even the air temperature of the environment is equal or less compared with
the temperature of the water surface at the shore, inversion can still develop
because the water surface temperature decreases due to the interaction between
air and water along the air trajectory”.
Inversion, increasingly suppresses the evaporation increasing with the travel distance
of the air over the reservoir by creating a “vapour blanket”.
2.12 Extent of The Cooling Effect of Urban Water Bodies
In the micro-scale environment of the urban heat island, a numerical approach
based on computational fluid dynamics (CFD) is now broadly used as an effective
analysis tool. ‘Computational fluid dynamics (CFD)’ simulations can be a powerful
analysis tool for determining the potential of the coolth produced from small water
surfaces of wetland in micro-scale urban environments and utilizing it in the practical
design stage of urban land use. In a study of a residential neighbourhood pond in Japan
it has been observed that the “maximum temperature decrease induced by the water
surface was approximately 2◦C at the pedestrian level. For a wind velocity of
approximately 3m/s at a height of 10m, the effect of the evaporative cooling propagates
downwind over an unobstructed distance of 100m.” (Tominaga Y. et al, 2015)
A combination of climate and population pressures now threatens the
sustainability and security of urban water supplies in many of the cities across the
globe. A re-evaluation of alternative approaches to securing a reliable and quality
water supply for growing cities is now becoming critical. One of the alternative
approaches being explored is ‘Water Sensitive Urban Design’ (WSUD) or ‘Low
Impact Design’ (LID), the intent of which is to conserve water use by managing design
options for reducing and re-using urban waste and storm water.

51
A study using aquacycle and the single-source urban evapotranspiration
interception scheme (SUES) at Canberra, Australia confirms that through passive
design strategy to modify urban microclimate like wetland and vegetation maximize
evapotranspiration. The subsequent effects on daily maximum air temperatures are
estimated using an atmospheric boundary layer budget. Potential energy savings of
about 2% in summer cooling are estimated from this analysis (Mitchell V. G.et al,
2008).
Through an optimization study for the thermal comfort of an urban square in
France, Robitu et al. (2006) reported that “the presence of water ponds and trees
reduced the mean radiant temperature by 35–40 ̊C at 1.5 m on the top of the ground
surface”. Using a water pool inside the courtyard or covering the ground of the
courtyard with vegetation significantly reduced both the air temperature and mean
radiant temperature. Finally, this research suggests using water pool and green areas
are the most effective heat mitigation strategies for urban blocks in the Netherlands.
(Taleghani M. et al, 2014).
A research work based on weather study by “Dutch hobby meteorologists and
a network of stations in Rotterdam (Netherlands, has been observed that water bodies
increase rather than decrease the 95 percentile of the daily maximum UHI which is the
highest around sunset”. This suggest that “water bodies do not a priori act as cooling
elements in an urban area, as previously thought”, especially during the night and
evenings in the late summer, when surface waters are relatively warm. Heat capacity
of water bodies are relatively large compared to their milieu which “suppresses the
diurnal and annual cycle over water, and water temperatures remain relatively high
after evening and season transitions” (Steeneveld G.J. et al,2014).
Theeuwes N. E. et al. (2013) used the “Weather Research and Forecasting
(WRF)”, a mesoscale meteorological model, “to investigate and quantify the influence
of surface water on urban temperature”. In this study, how the temperature in the urban
area influenced by the spatial distribution of water bodies and water fraction in the city
are investigated based on an idealized circular city. The variable of this simulation
study was the size and spatial configuration of the surface water cover, and temperature
of the water. The result of this simulation study demonstrates “a nonlinear relationship
of cooling effect of water bodies with the fractional water cover, size of the water
bodies and distribution of water bodies within the city with respect to wind direction”.
One of the important observation from this simulation study is that although relatively
large lakes show more cooling effect close to their edges and in downwind areas,
several smaller waterbodies can influence a larger area of the city through their cooling
effect if distributed equally within the urban area (Theeuwes et al. 2013). One of the
important findings of this simulation study is that, if the water temperature of the
wetland stays below the air temperature surrounding it, wetland will always act as a
cooling element to the surrounding urban area. In case of the water temperature going
above the air temperature, the wetland will act as a warming element for the
surrounding urban area. Also, the cooling effect of the wetland varies with the water

52
temperature with the warmer water producing less cooling effect. Another finding is
that the lake or wetland has a larger cooling influence on its direct surroundings than
on the urban areas further downwind of the wetland (Theeuwes et al. 2013). This study
demonstrated obvious relation between the urban temperature and the available
wetland surface in an urban area. Also, this study emphasis a further understanding of
the role of lakes in the urban climate by investigating different influencing factors
including the water body area, shape complexity of the wetland in terms of landscape
shape index, distance from the city center as the center of UHI and the properties of
the surrounding built-up area.
Wong et al. (2012) conducted a research on the “evaporative cooling
performance of water bodies to its surrounding microclimate” at a height of 2m at two
locations, Kallang and Sungei Api-api study case area was conducted. Both locations
are characterized by “having vast water bodies and encircled by greenery”. The
cooling effect are likely start at 9am when the solar radiation reaches around 150-200
W/m² in the morning and end at the around 6pm, when the solar radiation was less
than 75-100 W/m² in the evening. During daytime, with clear day condition there is a
reduction of evaporative cooling impact on the range of 0.1°C - 0.2°C on every span
of 35m away from the waterway (Wong et al. 2012).
“Documents of the past manifested that the temperature differences between
the city center and its surrounding areas decreased with increasing wind speed and
disappeared on clear days” (Rutherford J. C. et al, 2004). Wong N.H. et al, (2011)
showed that the effect of wind speed on the temperature difference was small, and did
not greatly affect the correlation between urban temperature and land use. Data from
field observation at 1.5–2.0-m height which included different weather conditions
except rainy days showed the temperatures were also not correlated with the wind
speeds, but had a high negative correlation with humidity (Huang et al. 2008).
Kim Y.H. et al. (2008) conducted a study of changes in “local thermal
environment by associated with the restoration of an inner-city stream”, the
Cheonggye stream, in Seoul were investigated in the stream area over several
“summertime periods before, during, and after the stream restoration”. It has been
concurred that the restored stream affects local thermal environment, including
temperature mitigation and transformation in sensible heat flux (Kim Y. H. et al.
2008).
A study compared two urban streets found that Urban streets beneficial to the
blowing of river wind have better thermal environment than obstructive streets. One
street Sanyang Road is spacious and has good natural ventilation while Eryao Street is
very narrow and has too many cars to remove heat, resulting in poor natural ventilation.
The thermal comfort on Sanyang Road is better than that on Eryao Street. “Through
proper adjustment of planning, guiding river wind into urban blocks will play an active
role in the improvement of urban thermal environment” (Han G. et al. 2011).
Conventional water facilities, such as canals, fountains and sprays installed in
urban areas mainly for landscaping purposes exhibits their cooling effect through

53
evaporative cooling by adjusting relative humidity and air temperature, as well as
providing its “landscaping and hydrophilic functions”. so, new water facility for
“rather narrow city spaces, such as beside sidewalks and between buildings could be
designed that can be adjusted according to the micro-meteorological environment in
the living space”. This phenomenon has been investigated by Nomura et al., 1993 in
“a field study on the degree of cooling effect that artificial water facilities can produce
in relatively-narrow urban areas. In their experiments, a model fountain, which serves
as a basic water facility, was established in a wind tunnel to measure the range of
cooling effect. Based on the results, they placed new, novel water facilities in the field
environment”. “The time of the field measurements were on July 30 and 31st, 1992,
when summer conditions were at an average level with clear days with a 2.5 m/ s west-
northwesterly sea breeze. The temperature fall area induced by evaporation of water
from the spray and water fall operation at the Stage Stone Pillar Pond spreads out to
nearly 35m toward leeward from the Stage Stone Pillar Pond. Also, even when the
spray is not operated, air temperature is 1 to 2 K lower than the average air temperature
in this park, that is, 35.8° C”. “Thus, it was confirmed that spray or water fall
operations create an air temperature decline area on the leeward side, and that the
degree of temperature decline depends on types of water facilities, but especially water
spray facilities are effective for cooling. The result was reproduced in a suction type
wind tunnel, 6.4 m long, 0.4 m wide and 0.4 m high for the measuring part with the
same atmospheric properties in a wind tunnel as the actual ones in an urban area in
order to experimentally study the effect of air temperature decline by urban water
facilities” (Nishimura et al. 1998).
Manteghi et al , 2015 observed that the temperature inside some of the street
canyons was actually lower in many cases than in the open area (bay point) after the
morning hours due to the large heat capacity of the water body compared to its
surroundings. This suggests that in high ambient temperatures, these waters also reach
a relatively high temperature compared to their surroundings. Due to the distance from
the river the four N-S oriented streets showed significantly higher temperatures, even
although they enjoy a longer time out of direct sunlight, i.e. solar radiation which
suggests that their distance from the river is an important factor in producing lower
temperatures. They also observed that the cooling effects of the Malacca River are
greater than those of the Malacca Sea which indicates that distance to the sea does not
make a significant difference. This study indicates that the relative temperature of the
respective body of water is mainly prescribes the temperature change, overriding the
effects of cooling owing to evaporation. Thus, lower temperature of the water compare
than its surroundings always works as a cooling element; but the converse is also true
(e.g. at night). In short, water bodies work as buffers of the diurnal temperature cycle:
cooling the environment throughout the day time and warming it at night time. Also,
the study showed that the relative humidity of the measured points was lower at the
time of high temperature (Figure 3.1) which points to an inverse relationship between
air temperature and relative humidity. Overall urban streets open to winds from the

54
river have a better microclimate than streets which block this to a greater extent. The
maximum nearest water body point temperature has a delay of few hours was
compared to the maximum air temperature of the streets with the higher temperature
of the near water body which occurs in the evening (Manteghi et al, 2015).
Figure 2.13: Change of Relative Humidity with time (Manteghi et al, 2015)
2.13 Relationship Between Microclimatic Cooling and Shape Complexity of
The Urban Water Bodies
On average Urban wetlands are cooler than their surrounding landscapes. This
implies that cooling effects of wetlands are significant to cool down hot urban
environments. The cooling effect of the wetland should therefore be included in the
assessment of wetland ecosystem services. Next observation made by Sun R. et al
(2012) is that the UCI intensity does not linearly correlate with wetland area, whereas
it is highly correlated with wetland shape. There observation indicates that the cooling
effect has a threshold as the wetland area increases. Thus, it is reasonable, to benefit
more stakeholders a large water body could be substituted with several small water
bodies of the same total area. Their recommendation was “the cooling effect of
wetlands may be intensified by constructing them in a small size with relatively regular
shape because we do not have enough urban land to create large wetlands with natural
complex shape” (Sun R. et al, 2012).
2.14 Relationship Between Water Quality and Shape of The Urban Water
Bodies
Hwang S.J. et al observed that “edges of wetland mediate the material flux
between adjacent systems. This mediating effect of edges is strongly tied to the
complexity of the adjacent shapes of the wetland. Land use within a watershed has a
direct impact on the water quality of adjacent aquatic systems. Hydrological processes
carry material produced by land-use activities into aquatic ecosystems through the
edges of the ecosystem. Therefore, the geometry of aquatic ecosystems theoretically

55
affects the relationship between land use and water quality”. With the increment of
“shape complexity of wetlands, the concentration of BOD, COD, and TP within
reservoir water significantly reduces”. They build a “moderation model for BOD,
COD, TN, and TP, which suggest that shape complexity can considerably relieve the
negative impacts on water quality of urban land use in areas adjacent to reservoirs”.
(Hwang S.J., et al, 2007).
Research by various author on urban wetlands has addressed matters like
“water pollution, eutrophication, sedimentation, and shifts in biotic communities
(Birch and McCaskie 1999, Lindstrom 2001, Leavitt et al. 2006, Novotny et al. 2008,
Effler et al. 2010, Meter et al. 2011, Van Metre 2012)”. “Changes may be mediated by
morphological characteristics of water bodies (e.g., size, shape, and type), as well as
broader, landscape-scale characteristics of lake districts and flow networks, like water
body density and connectivity” (Oertli et al. 2002, Williams 2004, Downing 2010).
The water quality of adjacent urban wetland is profoundly affected by the types
of urban area. Downing (2010) defined, “Developed urban open area land cover
includes parks, golf courses, and other spaces where the natural vegetation removed
or altered, but not necessarily built up. On the other hand, undeveloped category,
depending on the region and climate includes areas designated as forest, scrub, or
desert”. “The size and shape of water bodies has a broad range of effects on their
hydrologic and geochemical conditions and their ecological and biogeochemical
functions. Small water bodies also differ from larger (and more intensively studied)
lakes in terms of physical and biogeochemical conditions and processes” (Downing
2010). For example, “smaller lakes tend to be high in dissolved organic matter and
dissolved CO2 but low in dissolved inorganic carbon and oxygen” (Kelly et al.,2001;
Crisman et al.,1998; Hanson et al.,2007). “Lake size has been observed to impact
methane production” (Michmerhuizen et al.,1996; Bastviken et al.,2004) and “CO2
efflux” (Cole et al.,2007; Hanson et al.,2007). “Areal rates of organic carbon
sequestration are potentially an order of magnitude higher in small lakes” (Downing
et al.,2008; Dean et al.,1998; Downing J.A.,2010). In akin to, “lake size also influences
regional and global Nitrogen budgets, as small lakes retain double the amount of
nitrogen globally than large lakes and are sinks for N via denitrification” (Harrison et
al. 2008).
Shoreline development factor (SDF) used to measure the shape of landscape
feature. Water body shape measured by the shoreline development factor (SDF)
showed it is marginally influenced by land cover. “The median SDF indicated a
significant increase in the shoreline-to-area ratio in the urban low-, medium-, and high-
intensity land cover classes, meaning that urban water bodies are likely to be longer
and tortuous compared to the undeveloped land. The variation in median SDF across
cities increased at medium- and high intensity urban land covers. In contrast, the slope
of the SDF frequency distribution was significantly lower in high-intensity urban land
cover than undeveloped land, indicating that the distribution was shifting to ‘‘rounder’’
water bodies in these land covers” (Steele M. K. et al 2014). urban land covers exhibit

56
moderate sized water bodies less connected in comparison of the waterbodies in
undeveloped land. Steele suggested that “the differences in the size distributions
suggest that the smallest water bodies nearer to an area of 0.5 ha are the most affected
by urbanization. Visual observations indicate most of water bodies in all land cover
classes were irregular spheroids, but certain shapes were associated with human
alteration. Although the impounded dendritic shape was also observed in all land
covers urban land cover are associated with simplified shapes. Due to anthropogenic
activities, urban wetland is characterized by a reduction of irregularity of the basic
shape and a reduction in tortuosity and irregularity of the shoreline. water bodies in
the urban land covers are less connected to surface flow lines like streams and rivers
compared to water bodies in undeveloped land”. Steele further stated that “although
the percentage of water bodies connected to surface flow lines increased as the size of
water bodies increased, small water bodies with an area around 0.01 km2 in urban land
covers were more likely to be disconnected from flow lines than similar-sized water
bodies in the undeveloped land covers”. He suggested “to mitigate the urban heat
island and simultaneously influence biogeochemical cycling on a regional level,
reincorporation of small water bodies with the water network is necessary”. He also
described that “the decrease in connectivity to the greater watershed and the loss of the
smallest water bodies together may have substantial implications for both the
terrestrial environment and regional and global nutrient and carbon cycling. Small
water bodies in urban landscapes are less likely to be connected to streams than in
minimally developed landscapes, and patterns of connectivity between lakes and
streams reflected an interaction between land use intensity and climate” (Steele M. K.
et al ,2014).
2.15 Effects of Water Temperature on Water Quality
A research in Sierra Nevada, California by Ficklin et al (2013) showed,
“Warmer temperatures are expected to raise mountain stream temperatures, affecting
water quality and ecosystem health”. They “demonstrate the importance of climate-
driven changes in hydrology as fundamental to understanding changes in the local
water quality”. In their Sierra Nevada case study, they “focused on changes in stream
temperature, dissolved oxygen (DO) concentrations, and sediment transport in
mountainous, snowmelt-dominated, and water limited systems”. They observed that
“stream temperatures are primarily influenced by the amount of heat exchange at the
air/water interface and secondarily by the temperature of the contributing hydrologic
components to the stream reach such as groundwater, surface runoff, and snowmelt
inputs. Stream temperatures in general have shown a strong positive correlation with
air temperature” (Ficklin D.L. et al ,2013).
“Increased stream temperatures can cause dissolved O2 (DO) limitation via
increased microbial activity and O2 demand and reduced O2 diffusion and solubility”
(Somers et al. 2013). “Stream temperature influences growth, metabolism, and
reproduction of aquatic biota, and can be lethal if it exceeds thermal limits of aquatic

57
fauna” (Vannote et al. 1980, Hester et al. 2011). “Urbanization elevates water
temperature at baseflow and can cause temperature surges during storms. Impervious
surface in highly developed watersheds leads to high levels of runoff during storms”
(Dunne et al. 1978, Arnold et al. 1996). “The initial runoff from paved surfaces can
reach extremely high temperatures because impervious surfaces can be as much as
50°C hotter than the air” (Berdahl et al. 1997).
Somers measured “canopy closure from the ground at the thalweg (a line
following the lowest part of a valley whether under water or not) of the stream with
concave forest densiometers (Forest Densiometers, Bartlesville, Oklahoma) (Lemmon
1957) at each cross-section to provide an estimate of canopy closure 100 m upstream
of the temperature logger”. “Densiometer readings are subjective, so field canopy-
closure measurements were made by 2 technicians who underwent extensive
calibration to ensure their interpretations were consistent”. They “also calculated
canopy closure from aerial photographs taken in 2008 (NAIP 2008)” and “created a
10 3 10-m grid in ArcGIS that covered the entire study area, overlaid satellite images
of each stream reach with the grid, and visually analyzed cover 100 m upstream of the
temperature loggers”. Than they “counted the grid cells in which the stream was not
visible and divided this number by 10. For example, if the stream was clearly visible
in 2 of the grid cells, estimated canopy closure is 80%. These estimates were only
slightly correlated with densitometer readings (adjusted R2 = 0.25, p <0.05), probably
because of differences in sampling and photography dates and in resolution between
densiometer readings and 30-m grids” (Somers et al. 2013)

58
2.16 References
1. Ahmed R. “In search of the impact of urbanization on the thermal environment of the city of Dhaka, Bangladesh, during the pre-monsoon hot season from 1948 through 1987”. Report of the Technical Conference on Tropical Urban Climates Dhaka,
Bangladesh, 28 March - 2 April 1993, World Meteorological Organization (WMO).
2. Ahmed A.Q., Ossen D.R., Jamei E., Manaf N.A., Said I., Ahmad M.H. (2015). “Urban surface temperature behaviour and heat island effect in a tropical planned city”.
Theoretical Applied Climatology 119:493–514.
3. Ahmed K S. 1995. “Approaches to Bioclimatic Urban Design for the tropics with special reference to Dhaka, Bangladesh”. Ph.D. thesis, Environment and Energy
studies Programme, Architectural Association School of Architecture, London.
4. Arnold, C. L., and C. J. Gibbons. (1996). “Impervious surface coverage: the emergence of a key environmental indicator”. Journal of the American Planning
Association 62:243–258.
5. Berdahl, P., and S. Bretz. (1997). “Preliminary survey of the solar reflectance of cool roofing materials”. Energy and Buildings 25:149–158.
6. Bastviken, D., J. J. Cole, M. L. Pace, and L. J. Tranvik. 2004. “Methane emissions from lakes: dependence of lake characteristics, two regional assessments, and a global estimate”. Global Biogeochemical Cycles 18:1–12.
7. Birch, S. & McCaskie, J. (1999) “Shallow urban lakes: a challenge for lake management”. Hydrobiologia 395: 365
8. Crisman, T. L., L. J. Chapman, and C. A. Chapman. 1998. “Predictors of seasonal oxygen levels in small Florida lakes: the importance of color”. Hydrobiologia
368:149–155.
9. Cole, J. J., Y. T. Prairie, N. F. Caraco, W. H. McDowell, L. J. Tranvik, R. G. Striegl,
C. M. Duarte, P. Kortelainen, J. A. Downing, J. J. Middelburg, and J. Melack. 2007.
“Plumbing the global carbon cycle: integrating inland waters into the terrestrial carbon budget”. Ecosystems 10:172–185.
10. Coutts, A. M., Tapper, N. J., Beringer, J., Loughnan, M., & Demuzere, M. (2013).
“Watering our cities the capacity for Water Sensitive Urban Design to support urban cooling and improve human thermal comfort in the Australian context”. Progress in Physical Geography, 37(1), 2-28.
11. Dunne, T., and L. Leopold. (1978). “Water in environmental planning”. 16th edition.
W. H. Freeman and Company, San Francisco, California.
12. Downing, J. A. 2010. “Emerging global role of small lakes and ponds: little things mean a lot”. Limnetica 29:9–24.
13. Dean, W. E., and E. Gorham. 1998. “Magnitude and significance of carbon burial in lakes, reservoirs, and peatlands”. Geology 26:535.
14. Effler, S. W., S. M. O’Donnell, A. R. Prestigiacomo, D. M. O’Donnell, R. K. Gelda,
and D. A. Matthews. 2010. “The effect of municipal wastewater effluent on nitrogen levels in Onondaga Lake, a 36-year record”. Water Environment Research 82:3–19.
15. Fraedrich K. (1972). “On the evaporation of a lake in warm and dry environment”.
Tellus, 24: 116–121. doi:10.1111/j.2153-3490.tb01538.x
16. Ficklin D.L., Stewart I.T., and Maurer E.P. (2013). “Effects of climate change on stream temperature, dissolved oxygen, and sediment concentration in the Sierra Nevada in California.” Water Resources Research, Vol. 49, 2765–2782,
doi:10.1002/wrcr.20248.
17. Frey C.M., Rigo G., Parlow E. “Investigation of the daily Urban Cooling Island (UCI) in two coastal cities in an arid environment: Dubai and Abu Dhabi (U.A.E)”. Institute
of Meteorology, Climatology and Remote Sensing, Department of Geosciences,
University of Basel. 18. Golnoosh Manteghi, Hasanuddin bin limit & Dilshan Remaz. (2015). “Water Bodies
an Urban Microclimate: A Review”. Modern Applied Science; Vol. 9, No. 6;

59
19. Grimmond C.S.B, Oke T.R. (1999). “Heat storage in urban areas: observations and evaluation of a simple model”. Journal of Applied Meteorology 38: 922–940.
20. Hwang S.J., Lee S.W., Sona J.Y., Park G.A., Kim S.J. (2007). “Moderating effects of the geometry of reservoirs on the relation between urban land use and water quality.”
Landscape and Urban Planning 82, 175–183, Elsevier.
21. Hester, E. T., And M. W. Doyle. (2011). “Human impacts to river temperature and their effects on biological processes: a quantitative synthesis”. Journal of the
American Water Resources Association 46:1–17.
22. Huang L., Li J., Zhao D., Zhu J (2008). “A fieldwork study on the diurnal changes of urban microclimate in four types of ground cover and urban heat island of Nanjing, China”. Building and Environment 43, 7–17.
23. Han G., Chen H., Yuan L., Cai Y., Han M. (2011). “Field measurements on micro-climate and cooling effect of river wind on urban blocks in Wuhan city”. Multimedia
Technology (ICMT), 2011 International Conference on
.10.1109/ICMT.2011.6003331 24. Hanson, P. C., S. R. Carpenter, J. A. Cardille, M. T. Coe, and L. A. Winslow. 2007.
“Small lakes dominate a random sample of regional lake characteristics”. Freshwater
Biology 52:814–822.
25. Hanson, P. C., S. R. Carpenter, J. A. Cardille, M. T. Coe, and L. A. Winslow. 2007.
“Small lakes dominate a random sample of regional lake characteristics”. Freshwater
Biology 52:814– 822.
26. Harrison, J. A., R. J. Maranger, R. B. Alexander, A. E. Giblin, P.A. Jacinthe, E.
Mayorga, S. P. Seitzinger, D. J. Sobota, and W. M. Wollheim. 2008. “The regional and global significance of nitrogen removal in lakes and reservoirs”.
Biogeochemistry 93:143–157.
27. Hossain M.E. and Nooruddin M. “Some aspects of urban climates of Dhaka city”. Report of the Technical Conference on Tropical Urban Climates Dhaka, Bangladesh,
28 March - 2 April 1993, World Meteorological Organization (WMO).
28. Jáuregui, E. (1991). “Effects of revegetation and new artificial water bodies on the climate of northeast Mexico City”. Energy and buildings, 15(3), 447-455.
29. Kim Y. H., Ryoo, S. B., Baik, J. J., Park, I. S., Koo, H. J., & Nam, J. C. (2008). “Does the restoration of an inner-city stream in Seoul affect local thermal environment”?
Theoretical and applied climatology, 92(3-4), 239-248.
30. Khaleque M.A., Habib A. and Ahmed S. “Eco-climatic features of Dhaka city due to urbanization”. Report of the Technical Conference on Tropical Urban Climates
Dhaka, Bangladesh, 28 March - 2 April 1993, World Meteorological Organization
(WMO).
31. Kotthaus S., Grimmond C.S.B. (2014). “Energy exchange in a dense urban environment – Part I: Temporal variability of long-term observations in central London”. Urban Climate 10, 261–280, Elsevier B.V.
32. Kelly, C. A., E. Fee, P. S. Ramlal, J. W. M. Rudd, R. H. Hesslein, C. Amena, and E.
U. Schindler. 2001. “Natural variability of carbon dioxide and net epilimnetic production in the surface waters of boreal lakes of different sizes”. Limnology and
Oceanography 46:1054–1064.
33. Lauwaet D., Ridder K.D., Saeed S., Brisson E., Chatterjee F., Lipzig N.P.M. V.,
Maiheu B., Hooyberghs. H. (2016). “Assessing the current and future urban heat island of Brussels”. Urban Climate 15, 1–15.
34. Lemmon, P. E. (1957). “A new instrument for measuring forest overstory density”.
Journal of Forestry 55:667–669.
35. Lindstrom, M. 2001. “Urban land use influences on heavy metal fluxes and surface sediment concentration of small lakes”. Water, Air, and Soil Pollution 126:363–383.

60
36. Leavitt, P. R., C. S. Brock, C. Ebel, and A. Patoine. 2006. “Landscape-scale effects of urban nitrogen on a chain of freshwater lakes in central North America”. Limnology
and Oceanography 51:2262–2277.
37. Michmerhuizen, C. M., R. G. Striegl, and M. E. McDonald. 1996. “Potential methane emission from north-temperate lakes following ice melt”. Limnology and
Oceanography 41:985– 991.
38. Manteghi G., Lamit H.B. and Ossen D.R. (2015). “Influence of Street Orientation and Distance to Water Body on Microclimate Temperature Distribution in Tropical Coastal City of Malacca”. International Journal of Applied Environmental Sciences,
Volume 10, Number 2, pp. 749-766
39. Ministry of Environment & Forests (n.d.). Retrieved February 02, 2018, from
http://moef.portal.gov.bd/
40. Miao S., Chen F., LeMone M.A., Tewari M., Li Q., and Wang Y. (2009). “An Observational and Modeling Study of Characteristics of Urban Heat Island and Boundary Layer Structures in Beijing”. Journal of Applied Meteorology and
Climatology. Volume 48 No. 3.
41. Mitchell V. G., Cleugh H. A., Grimmond C. S. B. and Xu J. (2008) “Linking urban water balance and energy balance models to analyse urban design options”.
Hydrological Processes Hydrol. Process. 22, 2891–2900. Published online in Wiley
InterScience.
42. Mills, G. 2004. “The Urban Canopy Layer Heat Island”. Available from:
http://www.urban-climate.org/
43. Murakawa, S., Sekine, T., Narita, K. I., & Nishina, D. (1991). “Study of the effects of a river on the thermal environment in an urban area”. Energy and buildings, 16(3),
993-1001.
44. Nishimura N., Nomura T., Iyota H. and Kimoto S (1998). “Novel water facilities for creation of comfortable urban micrometeorology”. Solar Energy Vol. 64, Nos 4–6,
pp. 197–207. 45. Novotny, E. V., D. Murphy, and H. G. Stefan. 2008. “Increase of urban lake salinity
by road deicing salt”. Science of the Total Environment 406:131–144.
46. Oke, T.R. 1982. “The energetic basis of the urban heat island”. Quarterly Journal of
the Royal Meteorological Society (1982), 108, pp. 1-24
47. Oke T. R., Mills G., Christen A., and Voogt J. A. (2017). “Urban Climates”.
Cambridge University Press.
48. Offerle B., Grimmond C. S. B. and Fortuniak K. (2005). “Heat storage and anthropogenic heat flux in relation to the energy balance of a central European city centre”. International Journal of Climatology. 25: 1405–1419 (2005)
49. Oertli, B., D. A. Joye, E. Castella, R. Juge, D. Cambin, and J. Lachavanne. 2002.
“Does size matter? The relationship between pond area and biodiversity”. Biological
Conservation 104:59–70.
50. Robitu M., Musy M., Inard C., Groleau D. (2006) “Modeling the influence of vegetation and water pond on urban microclimate”. Solar Energy 80, 435–447.
51. Revi A., Satterthwaite D.E., Durand F. A., Morlot J. C., Kiunsi R.B.R., Pelling M.,
Roberts D.C., and Solecki W., (2014): Urban areas. In: Climate Change 2014: Impacts, Adaptation, and Vulnerability. Part A: Global and Sectoral Aspects. Contribution of Working Group II to the Fifth Assessment Report of the Intergovernmental Panel on Climate Change. Cambridge University Press,
Cambridge, United Kingdom and New York, NY, USA, pp. 535-612.
52. Raja D.R., Neema M.N. “Impact of Urban Development and Vegetation on Land Surface Temperature”. Computational Science and Its Applications – ICCSA

61
2013,13th International Conference, Ho Chi Minh City, Vietnam, June 24-27, 2013,
Proceedings, Part III. Pages 351-367.Springer
53. Sun R., Chen L. (2012). “How can urban water bodies be designed for climate adaptation?” Landscape and Urban Planning 105, 27– 33.
54. Steeneveld G.J., Koopmans S., Heusinkveld B.G., Theeuwes N.E. (2014).
“Refreshing the role of open water surfaces on mitigating the maximum urban heat island effect.” Landscape and Urban Planning 121,92–96.
55. Saaroni H., Ziv B. (2003). “The impact of a small lake on heat stress in a Mediterranean urban park: the case of Tel Aviv, Israel”. Int J Biometeorol 47:156–
165 DOI 10.1007/s00484-003-01617
56. Spronken-Smith R. A. & Oke T. R. (1998). “The thermal regime of urban parks in two cities with different summer climates”. International Journal of Remote Sensing,
19:11, 2085-2104, DOI:10.1080/014311698214884
57. Spronken-Smith R. A. & Oke T. R. (1998). “The thermal regime of urban parks in two cities with different summer climates”. International Journal of Remote Sensing,
19:11, 2085-2104, DOI:10.1080/014311698214884
58. Sun R., Chen A., Chen L, Lü Y. (2012). “Cooling effects of wetlands in an urban region: The case of Beijing”. Ecological Indicators 20 (2012) 57–64.
59. Steeneveld G.J., Koopmans S., Heusinkveld B.G., Theeuwes N.E. (2014) “Refreshing the role of open water surfaces on mitigating the maximum urban heat island effect.”
Landscape and Urban Planning 121, 92–96.
60. Somers K. A., Bernhardt E.S., Grace J.B., Hassett B. A., Sudduth E.B., Wang S. and
Urban D.L. (2013). “Streams in the urban heat island: spatial and temporal variability in temperature”. Freshwater Science, 32(1):309–326
61. Steele M. K., Heffernan J. B. (2014). “Morphological characteristics of urban water bodies: mechanisms of change and implications for ecosystem function”. Ecological
Applications, 24(5), pp. 1070–1084.
62. Tominaga Y., Sato Y. and Sadohara S. (2015) “CFD simulations of the effect of evaporative cooling from water bodies in a micro-scale urban environment: Validation and application studies.” Sustainable Cities and Society 19(2015)259–270.
63. Taleghani M., Tenpierik M., Dobbelsteen A.V.D., and Sailor D.J. (2014) “Heat in courtyards: A validated and calibrated parametric study of heat mitigation strategies for urban courtyards in the Netherlands.” Solar Energy 103, 108–124. 2014.
64. Theeuwes N.E., Solcerová A. and Steeneveld G.J. (2013). “Modeling the influence of open water surfaces on the summertime temperature and thermal comfort in the city”. Journal of Geophysical Research: Atmospheres, 118(16), 8881-8896.
doi:10.1002/jgrd.50704.
65. United Nations Population Division | Department of Economic and Social Affairs.
(n.d.). Retrieved February 03, 2018, from
http://www.un.org/en/development/desa/population/
66. Vannote, R. L., And B. W. Sweeney. (1980). “Geographic analysis of thermal equilibria: a conceptual-model for evaluating the effect of natural and modified thermal regimes on aquatic insect communities”. American Naturalist 115:667–695.
67. Van Metre, P. C. 2012. “Increased atmospheric deposition of mercury in reference lakes near major urban areas”. Environmental Pollution 162:209–215.
68. Williams, P. 2004. “Comparative biodiversity of rivers, streams, ditches and ponds in an agricultural landscape in Southern England”. Biological Conservation 115:329–
341.
69. Wong N.H., Tan C.L., Nindyani A.D.S., Jusuf S.K. and Tan E. (2011). “Influence of Water bodies on Outdoor Air Temperature in Hot and Humid Climate”. ICSDC 2011:
pp. 81-89. doi:10.1061/41204(426)11

62
Chapter 3 : PRODUCTION AND TRANSPORT OF COOLING
EFFECT
3.1 Characteristics of Water, Water Heating and Cooling
The first and second law of thermodynamics describe “Energy exchange”
(Halliday et al. 1988), “which tells us we can transform energy but can’t create or
destroy. The direction of energy exchange will occur from areas of high concentration
towards area of lower concentration”. A natural body of water such as lake, river etc.
can be heated by two primary sources: “the sun and the ambient radiation emitted by
the atmosphere and earth. In a temperate zone on a clear summer day the daily
incoming solar radiation would be 332 Wm-2 and ambient radiation 330 Wm-2”
(Satterlund et al., 1992). “Shade is created by intercepting direct solar radiation and
preventing it from reaching the surface of the earth. Approximately 95% of visible
radiation will penetrate a column of clear water to a depth of 3 feet and over 75% will
penetrate to a depth of 30 feet” (Hollaender 1956, Sellers W.D. 1974). “The interaction
of water with visible, near-infrared and ambient radiation vary with the season of the
year, time of day, water turbidity and surface turbulence. Energy exchange between
water and incoming radiation can be estimated mathematically by the following
equation” (Halliday et al., 1988).
𝜏 =𝑄
𝑃=
𝑄
𝑆𝐴
Where,
𝑄 = 𝑚𝑐(𝑇𝑓 − 𝑇𝑖)
“Here τ is time(s); P is the total energy delivered to the water per second (W),
Q is the amount of heat deposited in the body of water(J); A is the surface area of the
body of water exposed to the radiation (m2); m is the mass of the body of water (kg);
c is the specific heat capacity of water (4,190 Jkg-1@ 288°K); Tf is the final
temperature of the body of water(K); Ti is the initial temperature of the body of water;
and S is the radiation at the surface of the water (Wm-2)” (Halliday et al., 1988).
To accurately estimate the increase of temperature of water body “water
surface reflectance, the transparency of the water to visible radiation, heat exchange
with other thermal bodies (i.e. soil) and the mixing associated with stream environment
need to be considered. Introduction of shade in the urban wetland would end up
intercepting direct solar radiation. But the shading will have little effect on diffuse,
scattered or ambient radiation sources. To cool down water must convert and radiate
its internal energy (in the form of heat) out into the thermal reservoir of the atmosphere.
This process is governed by a partial differential equation known as the ‘one
dimensional heat equation’ or the ‘diffusion equation’ are provided as follows”
(Matthews J. et al 1970):

63
𝜕2𝑇
𝜕𝑥2−
1
ҡ
𝜕𝑇
𝜕𝑡= 0
Where,
ҡ =𝑘
ρc
“Here x is the position in the water column (m), ҡ is a constant depending on
the thermal conductivity k, the heat capacity is c and the mass density is ρ”.
From this equation, it can be see that “cooling of water by diffusion is a slow
process. It has to remembered that shading doesn’t produce cooling, but rather prevents
heating by direct solar radiation” (Larson et al, 1996).
3.2 Effects of Riparian Shade on Water Temperature
“Riparian vegetation may affect the stream micro-climate (e.g., air
temperature, humidity, and wind speed), which in turn affect evaporation, conduction,
ground temperature, and water temperature” (Rutherford J. C. et al, 1997). Rising
water temperature (Tw) due to anthropogenic climate change may have serious
consequences for river ecosystems. Conservation and/or expansion of riparian shade
could counter the negative effect warming and buy time for ecosystems to adapt. In a
field study in UK rivers it has been identified that approximately 0.5 km of complete
shade is necessary to off-set Tw (water temperature) by 1°C during July (the month
with peak Tw) at a headwater site; whereas 1.1 km of shade is required 25 km
downstream (Johnson M. F. et al, 2015).
Riparian vegetation strongly affects stream temperature in small streams.
Quinn et al. (1997) found that pasture streams had daily max. temperature 6-7 °C
higher than adjacent forest stream. Riparian vegetation absorbs incoming shortwave
radiation. On a given day daily minimum temperature occurred almost simultaneously
and was similar in magnitude regardless of riparian shading but there were significant
differences in daily maximum water temperature between sites depending on the
amount of shade. Daily minimum water temperature is largely determined by air
temperature, the exchange of long-wave radiation between the atmosphere and the
stream at night and heat conduction from the steam bed (Rutherford J. C. et al, 2004).
Bowler explained that “Predicted increases in stream temperature due to
climate change will have many direct and indirect impacts on stream biota. A potential
intervention for mitigating stream temperature rise is the use of wooded riparian zones
to increase shade and reduce direct warming through solar radiation. Bowler conducted
a systematic review of the available evidence for the effects of wooded riparian zones
on stream temperature to assess the effectiveness of this intervention. This systematic
review provides evidence that wooded riparian zones can reduce stream temperatures,
particularly in terms of maximum temperatures up to 4.94°C” (Bowler D.E, et al,
2012).

64
Somers et al. (2013) showed that at “the reach scale, warmer baseflow
temperatures were associated with wider streams, whereas cooler baseflow
temperatures were associated with greater riparian canopy cover and more habitat
transitions. At the watershed scale, warmer temperatures occurred in watersheds with
higher road densities, and cooler temperatures occurred in watersheds with higher
%forest. Maximum temperature appeared to be most strongly influenced by canopy
closure via a direct negative path and by mean width of the channel by a direct positive
path. Percent developed land cover and road density significantly influenced
maximum temperature via a direct path. A significant indirect path indicated that
shading effects of % canopy cover dampened the positive relationship between %
developed land and stream baseflow temperatures” (Somers et al. 2013).
3.2.1 Methods of producing riparian shade
Rutherford J. C. et al, (1997) constructed “a computer model for stream water
temperature was developed, and tested in a small pasture stream near Hamilton, New
Zealand. The model quantifies shading by riparian vegetation, hillsides, and stream
banks using three coefficients: canopy angle, topography angle, and canopy shade
factor (figure 3.1). Shade was measured directly and found to vary significantly along
the channel”.
Figure 3.1:Sketch of a typical stream channel cross-section showing topography and canopy angles
perpendicular to stream. (Rutherford et al., 1997)
Floating plants/watercress did not prevent solar radiation from reaching the
stream, presumably because there is enough water movement through the weed beds.
In small streams additional shading may be provided by the banks and groundcover
which grows along the edge of the stream, so trees may be planted 10 m apart or more.
It is desirable that trees be separated so that enough light reaches the banks to maintain
groundcover (e.g., ferns, grasses etc.) along stream banks which help stabilize the
channel against erosion. (Rutherford J. C. et al, 1997).
Larson L. L. et al. (1996) reported that “direct sunlight only accounts for
approximately 20% of the total, and as a result, shaded areas can receive up to 80% of
the total radiative energy available at the surface. Furthermore, the ability of woody
vegetation (the physical limitation of height growth) to shade a stream decreases with

65
increasing stream width. A stream running east or west will have an entirely different
shading pattern than one running north or south. Shade generated by the topography
and/or stream channel will also contribute different levels of shading and exposure for
water” (Larson L. L. et al, 1996).
Bowler D.E. et al (2012) suggested that “analysis of riparian shade need to
inform on how trees should be planted, in terms of buffer width, length of reach
requiring a buffer and the types of trees that should be planted, nor on the roles of stand
density/age and nature of understory vegetation. Variables such as stream width and
river discharge (thermal capacity), river basin location (headwater or lowlands) and
the degree to which the wider catchment is forested are likely to be critical controls on
the efficacy of riparian trees as a temperature moderator” (Bowler D.E. et al, 2012).
3.2.2 Width of the riparian buffer to control water temperature
The width of the riparian shading buffer closely effects the temperature of the
wetland. Sweeney B. W. et al. (2014) reports that “buffer widths of ≥20 m will keep
stream temperatures within 2°C of those that would occur in a fully forested watershed
but that full protection from measurable temperature increases is assured only by a
buffer width of ≥30 m.” (Sweeney B. W. et al, 2014). Figure 3.2 showing a schematic
representation of generic riparian buffer area. This buffer is showing “a zone of
influence relative to aquatic and upland areas. The intensity of riparian influence is
depicted with shading. Material flows refers to energy, organic matter, water,
sediment, and nutrient flow”. (Riparian areas: functions and strategies for
management, 2002).
Figure 3.2: Schematic of a generic riparian buffer area (Riparian areas: functions and strategies for
management, 2002).

66
3.2.3 Influence of riparian buffer on removal of nitrogen
Sweeney B. W. et al. (2014) also reports that riparian shading buffers of “at
least 30 m wide are needed to protect the physical, chemical, and biological integrity
of small streams. A width of 20-30 m should be reasonably effective for removal of
nitrogen from surface runoff. effective nitrogen removal at the watershed scale
probably requires buffers that are at least 30 m wide and that the likelihood of high
removal efficiencies continues to increase in buffers wider than 30 m” (Sweeney B.
W. et al, 2014).
3.2.4 Effects of riparian buffer on overland sediment movement
Sweeney B. W. et al. (2014) also reports about several factors influencing the
riparian shading buffer effectiveness. Those factors are “soil type, vegetation, slope,
sediment load, rainfall intensity, and microtopography influence. Streamside buffers
10 m wide can be expected to trap about 65% of sediments delivered by overland flow,
while 30-m buffers can be expected to trap about 85% of sediments. Removal
efficiency was maximized at a slope of 9%. A streamside forest of 25 m can maximize
the width of small streams but it appears that little or no additional widening occurs in
response to forest buffers ≥25 m. An interlocking network of tree roots can increase
bank strength and, therefore, resist erosion, streamside forest widths of around 10 m
provide some protection, could reduce streambank soil loss and sediment release by
77-97%. Forests on the side of the canal or lake help to reduce bank erosion and
channel meandering” (Sweeney B. W. et al, 2014).
3.2.5 Width of riparian buffer to maintain large woody debris and
macroinvertebrates
Large woody debris(LWD) in the wetland that naturally accumulated from the
forest or large trees by the side of wetland perform some important role on the ecology
of the wetland. Sweeney B. W. et al. (2014) in his review of wetland side riparian
buffer summed up that “a streamside forest can best provide a natural level of Large
Woody Debris to streams if its width is generally ~30 m or equal to the height at
maturity of the dominant streamside trees”. “LWD provides nutrients and food for
aquatic organisms, increases the diversity of instream habitats by forming dams and
attendant pools, and helps dissipate the energy of water and keep its sediments from
moving downstream”. “Role of LWD in channel development, oxygenation, and
turbulent mixing of water, organic carbon and nutrient cycling, species habitat”. “A
streamside forest can best provide a natural level of LWD to streams if its width is
generally ~30 m or equal to the height at maturity of the dominant streamside trees”.
“At least 30m wide buffer of dense streamside forest is needed to protect and support
natural levels of macroinvertebrates as well as macroinvertebrate activity in small
streams”. “A streamside forest of ≥30 m is also needed to protect and maintain fish
communities in a natural or near-natural state. Streamside forest buffers ≥30 m wide
are also essential to protect water quality, habitat, and biotic features of streams

67
associated with watersheds ≤100 km2, or about fifth order or smaller in size” (Sweeney
B. W. et al, 2014).
3.2.6 Carbon sequestration by persistent reedbeds
One study suggests that the maintenance of persistent reedbeds by regular
inundation is a means of promoting carbon sequestration. Equally, alterations to
flooding regime that lead to the dieback of reedbeds and the drying of soils have the
potential to cause considerable losses of carbon to the atmosphere. The management
of river hydrology, being an activity of government, is a means by which these carbon
fluxes to the atmosphere can be manipulated. Further quantification of gas flux and
transfers between soil and water is required to fully articulate a carbon budget relating
to phases of wet and dry conditions within the reedbeds of the Macquarie Marshes.
The technique developed in this paper of combining the biomass assessment methods
of Thursby et al. (2002) with NDVI modeling provides an effective means of assessing
changes in aboveground carbon storage associated with flows that could have broader
application in environmental water monitoring and evaluation. (Whitaker K. et al,
2015).
So, it is evident that cooling down the water of the wetland with the help of
riparian shading is essential to create UCI. The ancient way of ice making in the desert
by the Persian (modern Iran) people with help of continuous shading the water is an
appropriate example of cooling the water to even below the air temperature with the
help of shading only (Asadi F. et al, 2012). So, to keep the water of the wetland in
urban area under continuous shading, we need to develop appropriate Urban Solar
Envelope (Knowles R. L. et al, 1980).
3.3 Simulating Effect of Water Temperature on Shading
A simulation study had been conducted at a section of Dhanmondi Lake area
(approx. 468mX280m) adjacent to the Satmasjid road on South-west and road 6A on
the south-east has been selected. One of the day of field measurement in this area, 24
Feb 2017 was used for the sun position in the simulation model. The simulation time
was fixed from 9 AM to 16:00 PM of that day. The whole simulation study conducted
for three cases depicting three types of ambient condition:
a. Case 1: First simulation study conducted with the water of the lake completely
under solar radiation.
b. Case 2: Second simulation study conducted with the fifty percent (50%) water
of the lake under solar radiation.
c. Case 3: Third simulation study conducted with the water body completely
shaded from solar radiation.
The simulation was conducted using COMSOL-Multiphysics software 5.0.
Heat Transfer Module_Heat Transfer with Surface to Surface Radiation (ht) of
COMSOL -Multiphysics was used in the simulation. The initial temperature of the
water fixed equal the minimum temperature of the day obtained from the field

68
measurement. Detail description about the model are in chapter six. The following
figure 3.3 depicts the effect of shading on water surface temperature of the lake.
Figure 3.3: Effect of shading on simulated water surface temperature of the lake
From the simulation study it could be concurred that the fully shaded water
surface response little with the progressing day temperature as in this case water body
can only gain heat from the ambient temperature of the atmosphere.
3.4 Relationship of The Different Parameters to Create Urban Cooling Islands
From the study of related literature, it can be concurred that Urban water bodies
can play an effective role in microclimatic cooling of the urban area by creating “urban
cooling islands” (UCIs). We also can identify several factors that have profound effect
on UCIs. They are as follows:
1. Area of the water body
2. Distance of the water body
3. Shape complexity of water body
4. Percentage of Built up area around the water body
5. Heat capacity of Water body
6. Riparian Shade
7. Width of Riparian Buffer
8. Type of Riparian Shade
1. Riparian vegetation (Canopy angle, Canopy shade
factor)
a. Macrophytes
i. Floating plants

69
ii. Emergent
b. Shade trees
c. Ground covers
i. Ferns
ii. Grasses
2. Topography (Topography angle)
a. Hillsides
b. Stream banks
9. Water Quality
1. Removal of nitrogen
2. Overland sediment movement
3. Dissolved oxygen (DO) concentrations
The relationship among the different factors discussed above is shown in the
diagram next page. Form the above discussion it is evident that Heat capacity of the
water body is counteracting the UCIs effect. Whereas riparian shade is having positive
influence on the UCIs and likewise on the water quality. The effect of riparian shade
on the water body is mostly done on the linear and narrow streams. There is very few
detail studies about the effect of riparian shade on the wider water body. Also, most of
the study suggesting small area and regular (Euclidean shape) shape water body
distributed in regular interval in urban area for better Urban Cooling Island (UCIs)
intensity. So, from the above literature study some Major research questions arises are:
1. How the negative impact of Heat capacity of the reservoirs on UCIs
could be moderated by the introduction of riparian shade?
2. Could the large water body with fractal shape moderate the impact of
heat capacity of the reservoirs on UCIs?
3. What is the link between “UCIs” and the “water quality of the urban
wetland”?
Also, it will be necessary to investigate whether it is possible to lower the
minimum water temperature of wetland below that of the air temperature by
continuous shading of the water, at least during the hot and dry period. In the figure
3.3 below all the parameters related to the creation of Urban Cooling Island (UCI) are
indicated with possible relationship.

70
Shape complexity
of water body
Distance from the
edge of the wetland
Percentage of Built up area
around the water body
Heat capacity of
Water body
UCIs
Area of the water
body
Riparian Shade
Width of the
Riparian Buffer
Type of the Riparian
Shade
Riparian vegetation
o Canopy angle
o Canopy shade factor
Topographical shade
o Hillside angle
o Stream banks
angle
Shade trees (Hijol or
fresh water mangrove)
Source: The daily star
Macrophytes
o Emergent
o Floating
Water Quality
Figure 3.4: Relation of the different parameters related to the creation of UCI

71
3.5 Transporting Cooling Effect Through Advection
Meteorological office, 1957 in the meteorological glossary stated advection as
“the process of transfer by horizontal motion” (Rider N.E. et al, 1963). The term
advection could be defined as “the transport of a substance by bulk motion from one
region to another in the field of physics, engineering, and earth sciences”. In general,
most of the advected substance are fluid and the properties of the substance are carried
with it. The advected substance carries its conserved properties such as energy through
the process. “The advection of variables like temperature, moisture and vorticity are
mostly discussed in the meteorology”. Warm advection is the process in which the
wind blows from a region of warm air to a region of cooler air. Moisture advection
which regions are often co-located with regions of warm advection, is horizontal
transport of moisture. “Moisture advection plays a very important role in the
development of precipitation, because precipitation will not form if there is little
moisture availability”.
The quantity of a “substance passing through a section perpendicular to a
particular direction per unit area and per unit time is called the flux of a substance. The
nature of the transporting process determines the amount of substance traversing the
cross-section over which the count is performed depends on. In case of the passive
entrainment of the substance by the carrying fluid, then the flux can be easily related
to the substance concentration and the fluid velocity, as follows:
𝑞 =𝑎𝑚𝑜𝑢𝑛𝑡
𝑣𝑜𝑙𝑢𝑚𝑒 𝑜𝑓 𝑓𝑙𝑢𝑖𝑑×
𝑣𝑜𝑙𝑢𝑚𝑒 𝑜𝑓 𝑓𝑙𝑢𝑖𝑑
𝑎𝑟𝑒𝑎 × 𝑡𝑖𝑚𝑒= 𝑐 × 𝑢
Where, where u is the entraining fluid velocity, q is flux, c is concentration of the
substance. This process is called Advection, a term that simply means passive transport
by the moving fluid that contains the substance” (Thayer School of Engineering at
Dartmouth).
3.6 Advection in The Earth Science
There are three different advective effects are generally recognized: they are
‘clothesline effect’, the ‘leading-edge or fetch effect’, and the ‘oasis effect’. 3.6.1 Clothesline effect
When the air flows through a vegetative canopy we can observe this effect. For
the ideal conditions of this effect we can consider two vegetative stand borders, one at
the edge of a crop field surrounded by warmer and drier ground and the other the edge
of a forest bordered by fields. Oke illustrated this effect by the following figure 3.5 of
horizontal flow. The air entering crop from the right is warm and dry will increase both
the heat supply and the “vapour pressure gradient” between the transpiring leaves and
the crop air. As an outcome of this the soil moisture adjacent to the stand border will
rapidly deplete due to enhance evaporation rate. As the air enters further into the crop
it adjusts to the more typical condition due to moisture acquiring.

72
Figure 3.5: Schematic depiction of fluxes involved in the energy balances of a soil-plant-air volume
(Oke, 2002)
3.6.2 Leading-edge or Fetch effect
When the air passes from one surface-type to another new and climatically
different surface it must adjust to new set of boundary condition. Due to this
adjustment a line of discontinuity is created as illustrated in the fig 3.6, which is called
the leading-edge. Oke (2002) described that “the adjustment is not immediate
throughout the depth of the whole layer, which is generated at the surface and diffuse
upward. The layer of the surface whose properties have been affected by the new
surface is called as an Internal boundary layer (IBL)”. The depth of the internal
boundary layer grows with the increasing distance from the starting point of this layer
towards the wind direction. As illustrated in figure 3.6 the starting point of the IBL is
known as “Leading edge” and the “distance from the leading edge to the downwind
direction” known as the “Fetch” (Oke,2002).
Figure 3.6: The development of an internal boundary layer as air flows from a smooth, hot, dry, bare
soil surface to a rougher cooler and more moist vegetation surface (Oke,2002).

73
Only lower 10% of the new IBL are fully adjusted to the properties of the new
surface. The rest of the layer is modified by the new surface but not adjusted to it and
is in a transition zone. The properties of the air above the IBL are not determined by
the surface immediately below it but with the upwind influences. To illustrate the
advection, we may consider air flowing from a dry bare soil surface to a fully moist
low vegetation cover. If no major across flow is assumed vertical and along wind (z
and x direction) could be analyzed conveniently (figure 3.6). The rate of horizontal
moisture transport, A (kgm-2s-1) is:
𝐴 = 𝑢𝑝𝑣
Where 𝑝𝑣 = 𝑣𝑎𝑝𝑜𝑢𝑟 𝑐𝑜𝑡𝑒𝑛𝑡 (𝑘𝑔𝑚−3), 𝑢 = 𝑎𝑖𝑟 𝑠𝑝𝑒𝑒𝑑 (𝑚−1)
Figure 3.7: Moisture advection from a dry to a wet surface, (a) Evaporation rates and the vapour balance
of a surface air layer (fluxes of vapour are proportional to the length of the arrows), (b) Surface
evaporation rate (E0), and mean water vapour concentration of the air layer, (c) Vertical profile of water
vapour in relation to the developing boundary layer (Oke, 2002).

74
The vertical arrows represent the evaporation fluxes, and the horizontal arrows
the advective fluxes. Leading-edge effects occur wherever there is a marked
discontinuity in surface properties.
3.6.3 Oasis effect
In an arid region, an isolated moisture source always finds itself cooler than its
surroundings due to evaporative cooling. The oasis in the desert is an obvious example
of this effect known as “Oasis effect”.
Due to its limited precipitation semi desert area can consume only small
amount of radiant energy through evaporation from the precipitation, leaving a big
portion of the radiant energy dissipated as sensible heat to warm the air, and thus
exhibiting large Bowen ratio (). On the other hand, free availability of water in the
Oasis permits evaporations to exceed beyond precipitation by one order. To do this the
energy needed for the evaporation is much more than the supplied radiant energy (here,
QE is greater than Q*). For this reason, in the Oasis sensible heat from the atmosphere
contributed to the surface to accomplish exceeding evaporation. Thus, the Oasis is
cooler than its surroundings, where it is embedded. In an example of an extreme case
of “Oasis effect”, the observed ratio 𝑄𝐸
𝑄∗ = 2.5 for shorter period over an irrigated
cotton field. In the Oasis the reversal of QH due to continual air-to-oasis inversion
temperature gradient exhibits negative Bowen ratio (). The irrigated field of alfalfa
near Phoenix, Arizona exhibits the ‘oasis-effect’ (Figure 3.7). it shows the average
daily energy balance components in June following the irrigation in late May. For the
first half of June an ‘oasis effect’ is clear; evapotranspiration exceeds the net radiation,
and QH is directed towards the crop.
Many types of ‘oasis-effect’ advective situations can be found. Such as:
i. A cool, moist surface dominated by large-scale warmer, drier
surroundings.
ii. A lake in an area with a dry summer climate;
iii. A glacier in a mountain valley;
iv. An isolated snow patch;
v. An urban park;
vi. An isolated tree in a street or on open, bare ground.
3.7 Advective Effects of Urban Wetland and Urban Green
“Several field studies of evaporation from irrigated fields surrounded by semi-arid
areas report leading edge effects” (Rosenberg et al., 1983). For example, “several
observational studies at Davis, CA (near the Sacramento site used here) focus on the
case of a step change in moisture availability due to irrigation of grass set in the midst
of drier fields” (e.g. Dyer and Crawford, 1965; Goltz and Pruitt,1970). In those studies,
“the latent heat flux was estimated from both closure of the energy balance (Q* and

75
Figure 3.8: Average daily energy balance of an alfalfa crop in June 1964 near Phoenix, Arizona
(33°N). The crop was irrigated by flooding in late May and this was followed by drought throughout
June (van Bavel, 1967, Oke 2002). QG were measured and QH was inferred from changes in a series of air temperature
profiles downstream from the leading-edge) and lysimetry”. Lang et al. (1974)
“used lysimetry to study the influence of microscale advection on evaporation from
an irrigated field of rice”. Rider et al. (1963) “measured evaporation from irrigated
grass downwind from a paved airport runway at Canberra airport in between 5cm
to 150 cm height from the ground. All these studies show sharp increases in
evaporation near the step change, followed by exponential decay with increasing
fetch, until the surface layer fully adjusts to the new surface moisture, i.e. QE
becomes approximately constant with distance. Estimates of the horizontal extent
of leading edge effects vary widely; from less than 20 m” (Rider et al., 1963) “to
as great as 200 m” (Rijks, 1971). Increased evaporation can also occur due to
Microscale advection in urban areas. Oke (1979) found “advectively-assisted
evaporation over an irrigated suburban lawn in Vancouver, BC”.
3.8 Advection of Urban Heat Island
Through Urban Heat Island Circulation (UHIC) rural cool air advected to
the urban area during late evening and hence increase cooling rate. Eugensson et

76
al. (1998) described three phases of urban heat island development due to this
advection of rural cool air: phase one, differential cooling: differential cooling rate
after the sunset in urban and rural area increase the UHI rapidly before the UHIC
starts. Phase two, transition: “at the beginning of the second phase, the wind speed
slowly increases because of the UHIC and entrainment of the rural cooler air
increases the urban cooling rate”. After 2-3 hour into the sunset the UHIC is fully
developed and the level of advected energy QA becomes more stable. Phase three,
stabilization: in this final phase, the two cooling rates together with UHI, wind
speed and wind direction become stable which last till morning. The UHI and
UHIC are dynamic systems pulsating horizontally throughout the night. This is a
self-regulating system that requires a ∆𝑇𝑢−𝑟 ≈ 2°𝐶 to maintain the UHIC
(calculated for the whole city).
3.9 Thermal Comfort Zone in The Dhaka City
One of the major objectives of the creation of “Urban Cooling Island” is to create
coolth and transport it inside the urban fabric to achieve thermally desirable
environment in the urban spaces. Thermal comfort in urban spaces is essential for
the liveability of the urban spaces in a city, which depends on the number of
environmental variables such as air temperature, radiant temperature, relative
humidity and airflow. Through field investigation Ahmed (1995) established the
comfort criteria for the outdoor urban spaces of the warm-humid city like Dhaka.
The following criteria for outdoor comfort in the urban spaces of Dhaka were
summarized from his work:
a. “Under still air conditions, at an average relative humidity of 70% the range of
comfort air temperature for people with commonly worn summer clothing and
engaged in sedentary activities or stationary in between 28.5°C to 32°C”.
b. “Air flow in urban spaces could push the maximum limit of comfort
temperature up to 34°C. Airflow also pushes up the upper boundary of
acceptable relative humidity. For example, with air flow above 2m/sec the level
of humidity for comfort was found to be extended up to 95%”.
c. “Shading in urban spaces by any means is most essential for thermal comfort
particularly in between 10:30 to 15:30 hours”.
d. “To design outdoor spaces for long stay comfort temperature range can swing
of ±3°K around the mean, but for the short stay or transient spaces it should be
of ±1°K”.
One of the most important implication of the above comfort criterion with
respect Dhaka city is that for an ideal configuration of urban outdoor spaces
should be aligned with a wind corridor, ensured through judicious urban
design, while optimally shaded by built-form or trees. Trees could provide
double benefit by evapotranspiration besides direct solar shielding. The
thermal effect of such urban spaces could be further enhanced if the air coming
through wind corridor is from a shaded wetland, which pre-cool the air by
exchanging latent heat of evaporation.

77
3.10 REFERENCES
1. Asadi F. and Kazemzadeh M. (2012). “Ancient Refrigerator (Earth Architecture): A Sustainable Solution to Desert Architecture in Iran—Case Study in Kerman”.
ICSDEC 2012: pp. 260-267. doi: 10.1061/9780784412688.031.
2. Ahmed K S. 1995. “Approaches to Bioclimatic Urban Design for the tropics with special reference to Dhaka, Bangladesh”. Ph.D. thesis, Environment and Energy
studies Programme, Architectural Association School of Architecture, London.
3. Bowler D.E., Mant R., Orr H., Hannah D. M. and Pullin A.S. (2012). “What are the effects of wooded riparian zones on stream temperature?” Environmental Evidence,
1:3.
4. Dyer A.J., Crawford T.V. 1965. “Observations of the microclimate at a leading edge”.
Quarterly Journal of the Royal Meteorological Society 91: 345–348. 5. Ficklin D.L., Stewart I.T., and Maurer E.P. (2013). “Effects of climate change on
stream temperature, dissolved oxygen, and sediment concentration in the Sierra Nevada in California.” Water Resources Research, Vol. 49, 2765–2782,
doi:10.1002/wrcr.20248.
6. Goltz S.M., Pruitt W.O. 1970. “Spatial and Temporal Variations of Evapotranspiration Downwind from the Leading Edge of a Dry Fallow Field”. Div.
Technical Report ECOM68-G10-1, Department of Water Science and Engineering,
University of California at Davis.
7. Haeger-Eugensson M. and Holmer B. (1999). “Advection caused by the urban heat island circulation as a regulating factor on the nocturnal urban heat island”. Int. J.
Climatology. 19: 975–988. 8. Hollaender A. (1956). “Radiation Biology”. Vol 1-3. McGraw-Hill, New York.
Matthews, J. and Walker, R. L. 1970. Mathematical methods of physics. Addison-
Wesley Publishing Company, Inc. New York 9. Halliday, D. and R. Resnick. 1988. “Fundamentals of physics”. 3rd ed. John Wiley &
Sons Inc., New York.
10. Johnson M. F., and Wilby R. L. (2015). “Seeing the landscape for the trees: Metrics to guide riparian shade management in river catchments.” Water Resources Research,
51, 3754–3769, doi:10.1002/2014WR016802.
11. Knowles R. L. and Berry R. D (1980). “Solar Envelope Concepts: Moderate Density Building Applications: Final Report”. Solar Energy Information Data Bank (U.S.),
Solar Energy Research Institute.
12. Lang ARG, Evans GN, Ho PY. 1974. “The influence of local advection on evapotranspiration from irrigated rice in a semi-arid region”. Agricultural
Meteorology 13: 5–13.
13. Larson L. L. and Larson S. L. (1996). “Riparian Shade and Stream Temperature: A Perspective.” Rangelands, Vol. 18, No. 4, pp. 149-152.
14. Matthews J. and Walker R.L. 1970. “Mathematical methods of physics”. Addison-
Wesley Publishing Company, Inc. New York.
15. Oke, T.R. (2002). “Boundary layer climates”. 2nd edition. Routledge, Taylor and
Francis Group.
16. Oke TR. 1979. “Advectively-assisted evapotranspiration from irrigated urban vegetation”. Boundary-Layer Meteorology 17: 167–173.
17. Rutherford J. C., Blackett S., Blackett C., Saito L., Colley R.J.D (1997). “Predicting the effects of shade on water temperature in small streams.” New Zealand Journal of
Marine and Freshwater Research, 1997, Vol. 31: 707-721.
18. Rutherford J. C., Marsh N.A., Davies P.M. and Bunn S.E. (2004). “Effect of patchy shade on stream water temperature: how quickly do small streams heat and cool.”
Marine and fresh water research, 55, 737-748.

78
19. Rider N.E, Philip J.R., Bradley E.F. (1963). “The horizontal transport of heat and moisture-a micrometeorological study”. Quarterly Journal of the Royal
Meteorological Society 89: 507–531. 20. Rijks DA. 1971. “Water use by irrigated cotton in Sudan: III. Bowen ratios and
advective energy”. Journal of Applied Ecology 8: 643–663.
21. “Riparian areas: functions and strategies for management”. (2002). Washington,
D.C.: National Academy Press.
22. Rosenberg NJ, Blad BL, Verma SB. 1983. “Microclimate—the Biological Environment”. John Wiley and Sons: New York.
23. Satterlund, D. R. and P. W. Adams. 1992. “Wildland watershed management”. 2nd
ed. John Wiley & Sons inc. New York.
24. Sellers, W. D. 1974. “Physical Climatology”. University of Chicago Press. Chicago,
Ill.
25. Sweeney B. W. and Newbold J. D. (2014). “Streamside forest buffer width needed to protect stream water quality, habitat, and organisms: A literature review.” Journal of
The American Water Resources Association, Vol. 50, No. 3.
26. Shahjahan A.T.M. and Ahmed K. S. "Study of urban water bodies in view of potential for micro-climatic cooling and natural purification of waste water" in the book "
Balanced Urban Development: Options and Strategies for Liveable Cities". Edited by:
Basant Maheshwari, Vijay P. Singh and Bhadranie Thoradeniya. Springer
International Publishing. The Netherlands. 2016 27. Spronken-smith R.A., Oke T.R. and Lowry W.P(2000). “Advection and the surface
energy balance across an irrigated urban park”. International Journal of
Climatology. 20: 1033–1047 28. Spronken-Smith R. A. & Oke T. R. (1998). “The thermal regime of urban parks in
two cities with different summer climates”. International Journal of Remote Sensing,
19:11, 2085-2104, DOI:10.1080/014311698214884
29. Taleghani M., Tenpierik M., Dobbelsteen A.V.D., and Sailor D.J. (2014) “Heat in courtyards: A validated and calibrated parametric study of heat mitigation strategies for urban courtyards in the Netherlands.” Solar Energy 103, 108–124. 2014.
30. Thayer School of Engineering at Dartmouth. (n.d.). Retrieved February 02, 2018, from
https://thayer.dartmouth.edu/
31. Whitaker K., Rogers K., Saintilan N., Mazumder D., Wen L., and Morrison R. J.
(2015). “Vegetation persistence and carbon storage: Implications for environmental water management for Phragmites australis.” Water Resour. Res., 51, 5284–5300,
doi:10.1002/2014WR016253.

79
Chapter 4 : REMOTE SENSING OF URBAN COOLING ISLAND
4.1 Introduction
Remote sensing technique can capture the data of large area with high spatial
resolution at a time, which is very useful for urban meteorological and land cover
analysis. Through the remote sensing methodology, the existence and intensity of
potential Urban Cooling Island (UCI) formed by the wetland had been identified.
Spatial information on the land cover and Land Surface Temperature (LST) were
extracted using Landsat - a collection of space-based moderate-resolution land remote
sensing data, which is a joint initiative between the U.S. Geological Survey (USGS)
and NASA. One of the reasons to choose Landsat satellite data is because this program
is the longest-serving earth observing satellites. That’s the reason Landsat data is
extremely valuable to grasp the long-time urban thermal environmental change besides
observing urban land cover change. Data from the Landsat-5 and Landsat-8 of selected
dates were downloaded and processed to find the Normalized Difference Vegetation
Index (NDVI), Normalized Difference Built-up Index (NDBI), Normalized Difference
Water Index (NDWI), Modified NDWI (MNDWI), Soil Adjusted Vegetation Index
(SAVI) and Index-based Built-up Index (IBI) and finally Land Surface Temperature
(LST). Using ArcGIS 10.2.1 software, at first, the Landsat images were
atmospherically corrected and the NDVI was calculated. Land Surface Temperature
was then extracted using several equations in a couple of steps explained in various
remote sensing literature. The first date was 12 December 1991, that was chosen for
remote sensing to correspond with the first urban heat island study in Dhaka conducted
by Bangladesh meteorological department at winter and summer season of 1992.
Albedo for two dates in a span of 25 years were also calculated for the Dhaka
city. Albedo is an important property of the Earth surface heat budget which is the
average reflectance of the sun’s spectrum. This unitless quantity has values ranging
from 0 to 1.0 and will vary based on the land cover. For example, snow would have a
high value and coniferous forests a low value. Water also have very low albedo and
absorbs lots of heat. Weng (2003) observed the relation between UHIsurf and the Fractal
dimensions by deriving transect of the urban area form the LST of Summer and
springtime. In the calculated Normalized difference vegetation index (NDVI) from
Landsat data, a threshold NDVI of 0.35 was applied to all NDVI images to distinguish
large canopy trees from non-vegetated surfaces. Because many studies revealed that
above 0.35, NDVI is agreed to have a strong correlation to photosynthetic activity and
plant evapotranspiration (Mackey C. et al, 2012 and Hung T. et al, 2006).

80
4.2 Landsat Data The band from Landsat-8 data that had been used in this study were Band 2
(Blue), Band3 (Green), Band4 (Red), Band5 (NIR), Band 6 (SWIR-1), Band 7 (SWIR-
2) and Band 10 (TIR-1). From Landsat-5, the band used were Band 1 (Blue), Band 2
(Green), Band 3 (Red), Band 4 (NIR), Band 6 (TIR)
Table 4.1: List of Bands available in Landsat-7 ETM+ and Landsat-8 OLI and TIRS (source: Landsat
Science Data Users Handbook)
4.3 Extracting Albedo from Landsat Data
The Landsat Thematic Mapper (TM) and Enhanced Thematic Mapper Plus
(ETM+) sensors capture reflected solar energy, convert these data to radiance, then
rescale this data into an 8-bit digital number (DN) with a range between 0 and 255. It
is possible to manually convert these DNs to ToA Reflectance using a two-step
process. The first step is to convert the DNs to radiance values using the bias and gain
values specific to the individual scene you. The second step converts the radiance
data to ToA reflectance. The Landsat 8 OLI sensor is more sensitive, so these data
are rescaled into 16-bit DNs with a range from 0 and 65536. Also, these data had been
converted to reflectance, rather than radiance, so DNs can be manually converted to
Reflectance in a single step. The input to the albedo calculation was a Landsat image
that had been converted from digital numbers to Top of Atmosphere (TOA)
reflectance.

81
OLI Top of Atmosphere Reflectance:
Like the conversion to radiance, the 16-bit integer values in the level 1 product
can also be converted to Top of Atmosphere (TOA) reflectance. The following
equation was used to convert level 1 DN values to TOA reflectance:
𝜌λ′ = 𝑀𝜌 ∗ Qcal + 𝐴𝜌
where:
ρλ' = Top-of-Atmosphere Planetary Spectral Reflectance, without correction for the
solar angle. (Unitless)
𝑀𝜌 = Reflectance multiplicative scaling factor for the band
(REFLECTANCE_MULT_BAND_n from the metadata).
𝐴𝜌= Reflectance additive scaling factor for the band
(REFLECTANCE_ADD_BAND_N from the metadata).
Qcal = Level 1-pixel value in DN
Correction for the solar elevation angle:
Equation for corrected TOA Reflectance was:
ρλ =𝜌′𝜆
𝑠𝑖𝑛𝜃
Liang (2000) developed a series of algorithms for calculating albedo from various
satellite sensors. His Landsat formula to calculate Landsat shortwave albedo was
normalized by Smith (2010) and is presented below.
𝛼𝑠ℎ𝑜𝑟𝑡 =0.356𝜌1 + 0.130𝜌3 + 0.373𝜌4 + 0.085𝜌5 + 0.072𝜌7 − 0.0018
0.356 + 0.130 + 0.373 + 0.085 + 0.072
This formula had been implemented in ArcMap using Band Math as:
((0.356*B1) + (0.130*B2) + (0.373*B3) + (0.085*B4) + (0.072*B5) -0.018) / 1.016
Determining NDVI, NDBI, NDWI, MNDWI, SAVI and IBI:
Normalized Difference Vegetation Index (NDVI) is expressed as follows (Purevdorj
et al., 1998)
𝑁𝐷𝑉𝐼 =𝑁𝐼𝑅 − 𝑅𝐸𝐷
𝑁𝐼𝑅 + 𝑅𝐸𝐷
Normalized Difference Built-up Index (NDBI) is expressed as follows (Zha et al.,
2003)

82
𝑁𝐷𝐵𝐼 =𝑆𝑊𝐼𝑅 − 𝑁𝐼𝑅
𝑆𝑊𝐼𝑅 + 𝑁𝐼𝑅
Normalized Difference Water Index (NDWI) is expressed as follows (McFeeters
1996):
𝑁𝐷𝑊𝐼 =𝐺𝑅𝐸𝐸𝑁 − 𝑁𝐼𝑅
𝐺𝑅𝐸𝐸𝑁 + 𝑁𝐼𝑅
Modified NDWI (MNDWI) can be expressed as follows (Hanqiu Xu 2006):
𝑀𝑁𝐷𝑊𝐼 =𝐺𝑅𝐸𝐸𝑁 − 𝑆𝑊𝐼𝑅1
𝐺𝑅𝐸𝐸𝑁 + 𝑆𝑊𝐼𝑅1
Soil Adjusted Vegetation Index (SAVI) can be expressed as follows (H. XU,2008)
𝑆𝐴𝑉𝐼 =(𝑁𝐼𝑅 − 𝑅𝐸𝐷)(1 + 𝑙)
(𝑁𝐼𝑅 + 𝑅𝐸𝐷 + 𝑙)
Index-based Built-up Index (IBI) can be expressed as follows (H. XU,2008)
𝐼𝐵𝐼 =[𝑁𝐷𝐵𝐼 −
(𝑆𝐴𝑉𝐼 + 𝑀𝑁𝐷𝑊𝐼)2
]
[𝑁𝐷𝐵𝐼 +(𝑆𝐴𝑉𝐼 + 𝑀𝑁𝐷𝑊𝐼)
2]
When the NDVI is used instead of the SAVI, the IBI can be rewritten:
𝐼𝐵𝐼 =
2𝑀𝐼𝑅𝑀𝐼𝑅 + 𝑁𝐼𝑅 − [
𝑁𝐼𝑅𝑁𝐼𝑅 + 𝑅𝐸𝐷 +
𝐺𝑅𝐸𝐸𝑁𝐺𝑅𝐸𝐸𝑁 + 𝑀𝐼𝑅]
2𝑀𝐼𝑅𝑀𝐼𝑅 + 𝑁𝐼𝑅
+ [𝑁𝐼𝑅
𝑁𝐼𝑅 + 𝑅𝐸𝐷+
𝐺𝑅𝐸𝐸𝑁𝐺𝑅𝐸𝐸𝑁 + 𝑀𝐼𝑅
]
4.4 Determining Land Surface Temperature from Landsat 8
Step 1: Conversion to spectral radiance
𝐿λ = 𝑀𝐿𝑄𝑐𝑎𝑙 + 𝐴𝐿
Where:
𝐿λ = Spectral radiance (W/ (m2 * sr * μm))
𝑀𝐿 = Radiance multiplicative scaling factor for the band
(RADIANCE_MULT_BAND_n from the metadata).
𝐴𝐿 = Radiance additive scaling factor for the band (RADIANCE_ADD_BAND_n
from the metadata).
Qcal = Level 1-pixel value in DN

83
Step 2: TIRS Top of Atmosphere Brightness Temperature
Temperature at satellite
𝑻 =𝑲𝟐
𝐥𝐧 (𝑲𝟏𝑳λ
+ 𝟏)
where:
T = Top of Atmosphere Brightness Temperature, in Kelvin.
Lλ = Spectral radiance (Watts/(m2 * sr * μm))
K1 = Thermal conversion constant for the band (K1_CONSTANT_BAND_n from
the metadata)
K2 = Thermal conversion constant for the band (K2_CONSTANT_BAND_n from
the metadata)
Step 3: Deriving Land Surface Emissivity
(Jose´ A. Sobrino, Juan C. Jimenez-Munoz, 2004)
𝜺 = 𝟎. 𝟎𝟎𝟒𝑷𝒗 + 𝟎𝟎. 𝟗𝟖𝟔
(Carlson & Ripley, 1997)
𝑷𝒗 = (𝑵𝑫𝑽𝑰 − 𝑵𝑫𝑽𝑰𝒎𝒊𝒏
𝑵𝑫𝑽𝑰𝒎𝒂𝒙 − 𝑵𝑫𝑽𝑰𝒎𝒊𝒏)
𝟐
where,
Pv = Proportion of Vegetation
ε = Land Surface Emissivity (LSE)
Step 4: Deriving Land Surface Temperature
Land Surface Temperature (LST) (Weng, Lu, & Schubring, 2004)
𝐿𝑆𝑇 =𝑇
1 + (λ ×𝑇𝜌
) × ln(𝜀)
Where:
λ = wavelength of emitted radiance (for which the peak response and the average of
the limiting wavelengths (λ= 11.5 μm) (Markham & Barker, 1985) will be used),

84
𝜌 = ℎ ×𝑐
𝜎 (1.438×10⁻² m K)
σ = Boltzmann constant (1.38 × 10⁻²³ J/K),
h = Planck’s constant (6.626×10⁻³⁴ J s),
and
c = velocity of light (2.998×10⁸ m/s).
Table 4.2: Landsat 4-5 Thematic Mapper (TM) and Landsat 7 Enhanced Thematic Mapper Plus
(ETM+) (source: Landsat Science Data Users Handbook)
Band Wavelength Useful for mapping
Band 1 - blue 0.45 - 0.52
Bathymetric mapping, distinguishing soil from
vegetation and deciduous from coniferous
vegetation
Band 2 - green 0.52 - 0.60 Emphasizes peak vegetation, which is useful for
assessing plant vigor
Band 3 - red 0.63 - 0.69 Discriminates vegetation slopes
Band 4 - Near Infrared 0.77 - 0.90 Emphasizes biomass content and shorelines
Band 5 - Short-wave
Infrared 1.55 - 1.75
Discriminates moisture content of soil and
vegetation; penetrates thin clouds
Band 6 - Thermal
Infrared 10.40 - 12.50 Thermal mapping and estimated soil moisture
Band 7 - Short-wave
Infrared 2.09 - 2.35
Hydrothermally altered rocks associated with
mineral deposits
Band 8 - Panchromatic
(Landsat 7 only) 0.52 - 0.90 15-meter resolution, sharper image definition
4.5 Land Surface Temperature Retrieval from Landsat Tm 5
The following equation was used to convert DN's in a 1G product back to radiance
units:
Lλ = ((LMAXλ − LMINλ)
(QCALMAX − QCALMIN)) × (QCAL − QCALMIN) + LMINλ
QCAL = the quantized calibrated pixel value in DN
LMINλ = the spectral radiance that is scaled to QCALMIN in watts/(meter
squared * ster * μm)
LMAXλ = the spectral radiance that is scaled to QCALMAX in watts/(meter
squared * ster * μm)
QCALMIN = the minimum quantized calibrated pixel value (corresponding to
LMINλ) in DN
= 1 for LPGS products
= 1 for NLAPS products processed after 4/4/2004
= 0 for NLAPS products processed before 4/5/2004
QCALMAX = the maximum quantized calibrated pixel value (corresponding to
LMAXλ) in DN = 255
Radiance to Reflectance: For relatively clear Landsat scenes, a reduction in between-scene variability
could be achieved through a normalization for solar irradiance by converting spectral
radiance, as calculated above, to planetary reflectance or albedo. This combined

85
surface and atmospheric reflectance of the Earth is computed with the following
formula:
ρP = π × Lλ × d2
ESUNλ × cosθs
Where:
ρP = Unitless planetary reflectance
Lλ = Spectral radiance at the sensor's aperture
d = Earth-Sun distance in astronomical units from an Excel file or interpolated from
values listed in Table 4.4
ESUNλ = Mean solar exoatmospheric irradiances from Table 4.3
θs = Solar zenith angle in degrees [ cos (Solar zenith angle) = sin (Sun_Elevation)]
Table 4.3: ETM+ Solar Spectral Irradiances
ETM+ Solar Spectral Irradiances (generated using the ChKur* solar spectrum)
Band watts/(meter squared * μm)
1 1970
2 1842
3 1547
4 1044
5 225.7
7 82.06
8 1369
*ChKur is the combined Chance-Kurucz Solar Spectrum within MODTRAN 5 (2011, Berk, A.,
Anderson, G.P., Acharya, P.K., Shettler, E.P., MODTRAN 5.2.0.0 User's Manual, available
http://modtran5.com)
Table 4.4: Earth-Sun Distance in Astronomical Units
Earth-Sun Distance in Astronomical Units
Day
of
Year
Distance
Day
of
Year
Distance
Day
of
Year
Distance
Day
of
Year
Distance
Day
of
Year
Distance
1 .98331 74 .99446 152 1.01403 227 1.01281 305 .99253
15 .98365 91 .99926 166 1.01577 242 1.00969 319 .98916
32 .98536 106 1.00353 182 1.01667 258 1.00566 335 .98608
46 .98774 121 1.00756 196 1.01646 274 1.00119 349 .98426
60 .99084 135 1.01087 213 1.01497 288 .99718 365 .98333
Band 6 Conversion to Temperature:
𝑻 =𝑲𝟐
𝐥𝐧 (𝑲𝟏𝑳λ
+ 𝟏)
Where:
T = Effective at-satellite temperature in Kelvin

86
K2 = Calibration constant 2 from Table 11.5
K1 = Calibration constant 1 from Table 11.5
L = Spectral radiance in watts/ (meter squared * ster * μm)
Table 4.5: ETM+ and TM Thermal Band Calibration Constants
ETM+ and TM Thermal Band Calibration Constants
Constant 1- K1
watts/(meter squared * ster * μm)
Constant 2 - K2
Kelvin
Landsat 7 666.09 1282.71
Landsat 5 607.76 1260.56
Once the Landsat data was processed following the above steps, LST of
selected points in both the wetland area, including the points (Urban Stations) of
continuous data logging were extracted from the LST map, for correlational analysis.
Two sets of points were selected for both the wetlands to extract LST data, the first set
were at the Upwind side of the wetland and second set of points were at the Down-
wind side of the wetland based on the wind direction during Hot-Dry and Warm-
Humid season in the urban area Dhaka. All the points chosen were nearer to 100m
apart from each other to avoid the possibilities of them being into the same pixel, as
the Landsat TIR image (Band 10 and 11 in case of Landsat 8) has a 100m resolution.
Band 10 and 11 later resampled to 30m. Distance from those points to the edge of the
wetlands were measured. Then Correlational analysis between the distance and LST
were done using both Microsoft Excel and R programing language in R studio.

87
4.6 Analysis of Normalized Difference Vegetation Index
Figure 4.1. NDVI showing 500m buffer area of both the lake

88
Table 4.6. Percentage of vegetation based on the NDVI of Dhanmondi Lake.
Land Use AREA (sqm) Percentage (%)
other 7,200.00 0.20
Water 18,000.00 0.50
Vegetation small canopy 2,934,000.00 81.97
Vegetation Large canopy 620,100.00 17.32
Total area 3,579,300.00
Total area (ha) 357.93
Total area (sqkm) 3.58
Table 4.7. Percentage of vegetation based on the NDVI of Hatirjheel Lake.
Land Use AREA (sqm) Percentage (%)
other 8,100.00 0.20
Water 547,200.00 13.30
Vegetation small canopy 3,339,000.00 81.15
Vegetation Large canopy 220,500.00 5.36
Total area 4,114,800.00
Total area (ha) 411.48
Total area (sqkm) 4.11
The data of table 4.6 and 4.7 extracted from NDVI in figure 4.1 shows that in
case of Dhanmondi lake, the area covered by vegetation canopy in the buffer zone is
Higher (99.30%) than the Hatirjheel lake (86.51%). Moreover, large tree canopy cover
is much higher in the buffer zone of Dhanmondi lake than the Hatirjheel lake. Also, in
case of Dhanmondi lake, only 0.50% is exposed water in the buffer zone whereas in
case of Hatirjheel lake it is 13.30%. All those analyses clearly indicate the higher
riparian shading potential of the Dhanmondi lake than the other lake.
Change of Large Canopy Vegetation and water area:
In case of Dhanmondi lake large vegetation showing NDVI above 0.35 decreased
almost half within a span of 25 years, whereas water area increased due to the lake
development project (table 4.8).
Table 4.8: Dhanmondi Lake
Land scape category
Percentage_16DEC16
Percentage_91DEC12
Vegetation Large canopy 4.98 10.08
Water Area 9.68 6.11
In case of Hatirjheel lake large vegetation- showing NDVI above 0.35
decreased almost seven-fold within a 25 years’ time span. The water area also
decreased as a part of new development (table 4.9).

89
Table 4.9: Hatirjheel Lake
Landscape category
Percentage_16DEC16
Percentage_91DEC12
Vegetation Large canopy 0.74 5.51
Water Area 21.52 29.66
Change of Albedo:
The calculated albedo difference in between 12 December 1991 and 16
December 2016 (Fig. 4.2) clearly demonstrate that buffer zone of both the wetland
area showing minimal albedo increase, whereas the water surface of the lakes is
showing maximum albedo increase.
4.7 Cool Spots in The Urban Area Due to Riparian Shading
Land surface temperature (LST) of eight dates had been derived from the
Landsat data obtained from USGS and Nasa. The first date to derive LST was 12 Dec
1991 (figure 4.3) which was nearer and similar (typical winter day) to the date 3rd
January 1992, when Bangladesh Meteorological Department (BMD) carried out field
measurement at ten locations in the city to determine Urban Heat Island effect of
Dhaka.
The other dates as shown in Figure 4.4 were chosen from the year 2015 to
represent the typical day of the three seasons. As consistent with the studies of BMD
Land Surface Temperature derived from the Landsat data (Fig.4.3) is also showing
that Dhanmondi Lake area is cooler than the rest of the spots, which acts as a cool spot
in all seasons of the year. Tejgaon area which is an industrial area located beside
Hatirjheel Lake is warmer than Dhanmondi area despite the presence of water body
due to the difference in Riparian shading (Fig.4.3 & 4.4). Also, topographical and
shading by built-form are more prominent in Dhanmondi lake than Hatirjheel lake.

90
Figure 4.2: Change of Albedo within 25 years (map overlay is provided in the back of this thesis)

91
Figure 4.3: LST of Urban Dhaka12 Dec 1991 derived from Landsat data showing cool spots (map
overlay is provided in the back of this thesis)

92
Figure 4.4: Comparison of Land Surface Temperature of different season of selected spots in Dhaka.
4.8 Relationship Between the LST and Distance from The Wetland in Different
Season
Results of Correlational analysis between Land Surface Temperature (LST) at
selected points and their distance from water edge for both the Dhanmondi and
Hatirjheel for the selected dates (representing three seasons) of 2013 to 2017 are
presented below. All the related data of this part of work are given in the Data
Appendices A, B and C. in the attached computer disk with the thesis.
Land Surface Temperature 12 April 2013:
Extracted Land Surface Temperature is presented in the figure 4.5 and correlational
analysis in the table 4.10
Wind flow and the cooling effect:
At this date and time, the predominant wind flow was from Southern side.
The cooling effect from the lake was clearly carried towards the downwind side of
both the lake through Advection process. Because the correlation between
temperature at the urban station and their distance from the wetland along the line
of wind direction was more at the downwind side than the upwind side.
Dhanmondi Lake:
The correlation between temperature at the urban station and their distance
from the wetland along the line of wind direction was more at the downwind side
than the upwind side. The cooling effect from the lake was clearly carried towards
the downwind side of the lake through Advection process as the North and North-
west area of the Dhanmondi lake area were surrounded by the part of the lake on its
Southern side. The other part South and south-east didn’t have any part of the lake
on its Southern side and hence the cooling effect of wetland was not carried through
advection process to this area.

93
Figure 4.5: LST 12 April 2013(map overlay is provided in the back of this thesis)

94
Table 4.10: Correlation analysis between distance and LST on 12 April 2013
Wind Direction (WD) % {N=0 or 360, E=90, S=180, W=270}, WS means Wind Speed in m/s.
Hatirjheel Lake:
In case of the Hatirjheel lake, the correlation between temperature at the urban
station and their distance from the wetland along the line of wind direction was
slightly more at the downwind North and North-West area than the South and South-
East area. In the absence of riparian shading, the lake was partly shaded by
topographic shading (by the bank of the lake) due to low water level. Hence the chance
of advective cooling of North and North-West area from the lake was not so great due
to the minimal shading of lake water.
Land Surface Temperature 15 June 2013:
Extracted Land Surface Temperature is presented in the figure 4.6 and correlational
analysis in the table 4.11
Wind flow and the cooling effect:
At this date and time, the predominant wind flow was from Eastern side.
Dhanmondi Lake:
The correlation between temperature at the urban station and their distance
from the wetland along the line of wind direction was more at the downwind side
than the upwind side. The cooling effect from the lake was clearly carried towards
the downwind side of the lake through Advection process as the North and
Northwest area of the Dhanmondi lake area were surrounded by the part of the lake
on its East side. The other part South and south-east didn’t have any part of the lake
on its East side and hence missed the cooling effect being carried through advection
process.
sl
no
LST
Dat
e
HatirJh
eel_
N&NW
area
HatirJh
eel_
S&SE
area
Dhanm
ondi
_
N&NW
area
Dhan
mon
di
_
S&S
E
area
WD
9am
WD
12pm
WS
9am
WS
12p
m
Air
Tem
p.
9am
Air
Tem
p.
12p
m
1 LST
12
Apr
il
201
3
0.67 0.57 0.5 0.35 200 180 1.02 1.02 30.3 34.7

95
Figure 4.6: LST 15 JUNE 2013 (map overlay is provided in the back of this thesis)

96
Table 4.11: Correlation analysis between distance and LST on 15 June 2013
Wind Direction % {N=0 or 360, E=90, S=180, W=270}
sl
n
o
LST Date HatirJhe
el_
N&NW
area
HatirJhe
el_
S&SE
area
Dhanmo
ndi
_
N&NW
area
Dhanmo
ndi
_ S&SE
area
W
D
9
am
W
D
12
p
m
W
S
9
am
W
S
12
pm
Air
Tem
p.
9
am
Air
Tem
p.
12
pm
1 LST
15JUNE2
013
-0.46 0.50 0.26 0.18 90 90 1.0
2
1.0
2
29.8
0
33.4
0
Hatirjheel Lake:
In case of the Hatirjheel lake, the correlation between temperature at the urban
station and their distance from the wetland along the line of wind direction was less
at the downwind North and North-West area than the South and South-East area.
Because due to the lack of riparian shading North and North-West area is getting
warmer by the hot air flow from the lake. At that time of the season due to the high-
water level for monsoon rain, the chance of topographic shading (by the bank of the
lake) was also very low.
Land Surface Temperature 6 November 2013:
Extracted Land Surface Temperature is presented in the figure 4.7 and correlational
analysis in the table 4.12.
Wind flow and the cooling effect:
At that date and time, the predominant wind flow was from North and North-
east side.
Dhanmondi Lake:
The correlation between temperature at the urban station and their distance
from the wetland along the line of wind direction was more at the downwind side
than the upwind side. The cooling effect from the lake was clearly carried towards
the downwind side of the lake through Advection process as the North and North-
west area of the Dhanmondi lake area were also surrounded by the part of the lake
on its North and East side. The other part South and south-east didn’t have any part
of the lake on its East side and hence missed the cooling effect being carried through
advection process.
Hatirjheel Lake:
In case of the Hatirjheel lake, the correlation between temperature at the urban
station and their distance from the wetland along the line of wind direction was less
at the downwind South and South-East area than the North and North-West area.
Because due to the lack of riparian shading South and South-East area were getting
warmer by the hot air flow from the lake. During this time of the season due to the
high-water level for monsoon rain, the chance of topographic shading (by the bank of
the lake) was also very low.

97
Figure 4.7: LST 6 NOV 2013 (map overlay is provided in the back of this thesis)

98
Table 4.12: Correlation analysis between distance and LST on 6 November 2013
Wind Direction % {N=0 or 360, E=90, S=180, W=270}
Land Surface Temperature 24 December 2013:
Extracted Land Surface Temperature is presented in the figure 4.8 and correlational
analysis in the table 4.13.
Wind flow and the cooling effect:
At this date and time, the predominant wind flow was from Western side.
Dhanmondi Lake:
The correlation between temperature at the urban station and their distance
from the wetland along the line of wind direction was more at the downwind side
than the upwind side. The cooling effect from the lake was clearly carried towards
the downwind side of the lake through Advection process because the South and
South-East area of the Dhanmondi lake area was surrounded by the part of the lake
on its Western side. The other part North and North-West area didn’t have any part
of the lake on its Western side and hence missed the cooling effect being carried
through advection process.
Hatirjheel Lake:
In case of the Hatirjheel lake, the correlation between temperature at the urban station
and their distance from the wetland along the line of wind direction was more at the
downwind North and North-West area than the South and South-East area. Because
North and North-West area was having part of the lake on its western side which
the other area didn’t have. Because of the lack of riparian shading, at that time of the
season the topographic shading (by the bank of the lake) due to the low water level is
the only option for the lake water to avoid direct solar radiation.
Table 4.13: Correlation analysis between distance and LST on 24 December 2013
Wind Direction % {N=0 or 360, E=90, S=180, W=270}
sl
n
o
LST Date
HatirJ
heel_
N&N
W
area
HatirJh
eel_
S&SE
area
Dhanm
ondi_
N&NW
area
Dhan
mondi
_
S&SE
area
WD
9 am
WD
12
pm
WS
9 am
WS
12
pm
Air
Tem
p
9 am
Air
Tem
p
12
pm
1 LST
24DEC
2013
0.78 0.50 .54 .75 270 270 1.54 1.54 20.3 25
sl
no
LST
Date
Hatir
Jheel
_
N&
NW
area
Hatir
Jheel
_
S&S
E
area
Dhan
mon
di
_
N&
NW
area
Dhan
mon
di
_
S&S
E
area
WD
9 am
WD
12
pm
WS
9 am
WS
12 pm
Air
Temp.
9 am
Air
Tem
p.
12
pm
1 LST
6NOV20
13
0.60 0.42 0.65 0.26 0 50
0 1.02 25.2 28.5

99
Figure 4.8: LST 24 DEC2013 (map overlay is provided in the back of this thesis)

100
Figure 4.9: LST 25 January 2014 (map overlay is provided in the back of this thesis)

101
Land Surface Temperature 25 January 2014:
Table 4.14: Correlation analysis between distance and LST on 25 January 2014
Wind Direction % {N=0 or 360, E=90, S=180, W=270}
s
l
n
o
LST
Date
HatirJhe
el_
N&NW
area
HatirJhe
el_
S&SE
area
Dhanmo
ndi
_
N&NW
area
Dhan
mondi
_
S&SE
area
WD
9
am
WD
12
pm
WS
9 am
W
S
12
pm
Air
Te
mp
9
am
Air
Te
mp
12
pm
1 LST
25JAN
2014
0.44 0.58 .53 .18 270 0 1.02 0 19.8 25.2
Extracted Land Surface Temperature is presented in the figure 4.9 and correlational
analysis in the table 4.14.
Wind flow and the cooling effect:
At this date and time, the predominant wind flow was from Northern side.
Dhanmondi Lake:
The correlation between temperature at the urban station and their distance
from the wetland along the line of wind direction was more at the downwind side
than the upwind side. The cooling effect from the lake is clearly carried towards the
downwind side of the lake through Advection process as the North and North-West
area of the Dhanmondi lake area also surrounded by the part of the lake on its
Northern side. The other part South and South-East areas had very small part of the
lake on its Northern side and hence missed the cooling effect being carried through
advection process.
Hatirjheel Lake:
In case of the Hatirjheel lake, the correlation between temperature at the urban
station and their distance from the wetland along the line of wind direction was more
at the downwind South and South-East area than the North and North-West area.
Because South and South-East area had part of the lake on its Northern side which
the other area didn’t. Because of the lack of riparian shading, at that time of the season
the topographic shading (by the bank of the lake) due to the low water level was the
only option for the lake water to avoid direct solar radiation.
Land Surface Temperature 10 February 2014:
Extracted Land Surface Temperature is presented in the figure 4.10 and correlational
analysis in the table 4.15. At this date and time, the predominant wind flow was
from the North-Eastern side.
Dhanmondi Lake:
The correlation between temperature at the urban station and their distance from the
wetland along the line of wind direction was more at the downwind side than the
upwind side.

102
Figure 4.10: LST 10 February 2014 (map overlay is provided in the back of this thesis)

103
Table 4.15: Correlation analysis between distance and LST on 10 February 2014
Wind Direction % {N=0 or 360, E=90, S=180, W=270}
S
l
n
o
LST
Date
Hatir
Jheel
_
N&N
W
area
Hatir
Jheel
_
S&S
E
area
Dhan
mon
di
_
N&
NW
area
Dhan
mondi
_
S&SE
area
WD
9 am
WD
12
pm
WS
9 am
WS
12
pm
Air
Tem
p
9 am
Air
Temp.
12 pm
1 LST
10FEB2
014
0.61 0.29 0.59 -0.03 360 50 3.08 1.54 22.2 26
The cooling effect from the lake was clearly carried towards the downwind
side of the lake through Advection process, as the North and North-West area of the
Dhanmondi lake area were surrounded by the part of the lake on its Northern side.
The other part South and South-East area didn’t have any part of the lake on its
North-Eastern side and hence missed the cooling effect being carried through
advection process.
Hatirjheel Lake:
In case of the Hatirjheel lake, the correlation between temperature at the urban
station and their distance from the wetland along the line of wind direction was more
at the downwind North and North-West area than the South and South-East area.
Because North and North-West area was having part of the lake on its Northern side
which the other area didn’t have. Due to the lack of riparian shading at that time of
the season, the topographic shading (by the bank of the lake) due to the low water level
was the only option for the lake water to avoid direct solar radiation.
Land Surface Temperature 26 February 2014:
Extracted Land Surface Temperature is presented in the figure 4.11 and correlational
analysis in the table 4.16.
At this date and time, the predominant wind flow was from the North-
Eastern side.
Dhanmondi Lake:
The correlation between temperature at the urban station and their distance
from the wetland along the line of wind direction was more at the downwind side
than the upwind side. The cooling effect from the lake was clearly carried towards
the downwind side of the lake through Advection process as the North and North-
West area of the Dhanmondi lake area also surrounded by the part of the lake on its
Northern side. The other part South and South-East area didn’t have any part of the
lake on its North-Eastern side and hence missed the cooling effect being carried
through advection process.

104
Figure 4.11: LST 26 FEBRUARY 2014 (map overlay is provided in the back of this thesis)
Cloud Surface
temperature not
considered in the
calculation

105
Table 4.16: Correlation analysis between distance and LST on 26 February 2014
Wind Direction % {N=0 or 360, E=90, S=180, W=270}
S
l
n
o
LST
Date
HatirJh
eel_
N&NW
area
HatirJ
heel_
S&SE
area
Dhanm
ondi
_
N&NW
area
Dhan
mondi
_
S&SE
area
WD
9
am
WD
12
pm
WS
9 am
WS
12
pm
Air
Tem
p.
9 am
Air
Tem
p.
12
pm
1 LST
26FEB
2014
0.64 0.31 .54 .13 360 50 1.02 1.02 23.4 27.8
Hatirjheel Lake:
In case of the Hatirjheel lake, the correlation between temperature at the urban
station and their distance from the wetland along the line of wind direction was more
at the downwind North and North-West area than the South and South-East area.
Because North and North-West area was having part of the lake on its North-eastern
side but in case of the other area there was no lake on similar side. Because of the
lack of riparian shading, at that time of the season the topographic shading (by the
bank of the lake) due to the low water level was the only option for the lake water to
avoid direct solar radiation.
Land Surface Temperature 14 March 2014:
Extracted Land Surface Temperature is presented in the figure 4.12 and correlational
analysis in the table 4.17.
At this date and time, the predominant wind flow was from Northern side.
Dhanmondi Lake:
The correlation between temperature at the urban station and their distance from the
wetland along the line of wind direction was more at the downwind side than the
upwind side. The cooling effect from the lake was clearly carried towards the
downwind side of the lake through Advection process as the North and North-West
area of the Dhanmondi lake area also surrounded by the part of the lake on its
Northern side. There was very small part of the lake on the Northern side of South
and South-East areas and hence missed the cooling effect being carried through
advection process.
Hatirjheel Lake:
In case of the Hatirjheel lake, the correlation between temperature at the urban station
and their distance from the wetland along the line of wind direction was relatively
more at the downwind South and South-East area than the North and North-West
area. Because South and South-East area was having part of the lake adjacent to its
Northern side which the other area didn’t have. Because of the lack of riparian
shading, at that time of the season, the topographic shading (by the bank of the lake)
due to low water level was the only option for the lake water to avoid direct solar
radiation.

106
Figure 4.12: LST 14 March 2014 (map overlay is provided in the back of this thesis)

107
Table 4.17: Correlation analysis between distance and LST on 14 March 2014
Wind Direction % {N=0 or 360, E=90, S=180, W=270}
S
l
n
o
LST
Date
HatirJ
heel_
N&N
W
area
Hatir
Jheel
_
S&S
E
area
Dhanm
ondi
_
N&NW
area
Dhan
mondi
_
S&SE
area
WD
9 am
WD
12
pm
WS
9 am
WS
12
pm
Air
Tem
p.
9 am
Air
Tem
p.
12
pm
1 LST
14MAR
2014
0.47 0.52 0.53 0.20 360 360 1.02 1.02 28.4 31.8
Land Surface Temperature 30 March 2014:
Extracted Land Surface Temperature is presented in the figure 4.13 and correlational
analysis in the table 4.18.
Wind flow and the cooling effect:
At this date and time, the predominant wind flow was from the South-
Western side.
Dhanmondi Lake:
At this direction of wind flow both the selected area around the lake had part
of the lake at their upwind end. So, the correlation between temperature at the urban
station and their distance from the wetland along the line of wind direction were
relatively high in both the area, with North and North-Western area demonstrated
slightly higher correlation. This may be due to the part of the lake at the upwind side
of the North and North-West area was wider than the lake at the upwind of the other
area.
Hatirjheel Lake:
In case of the Hatirjheel lake, the correlation between temperature at the urban
station and their distance from the wetland along the line of wind direction was more
at the downwind North and North-West area than the South and South-East area.
Because North and North-West area were surrounded by part of the lake on its
western and south-western side, but the other area didn’t have lake on its south-
western side. Because of the lack of riparian shading, at that time of the season, the
topographic shading (by the bank of the lake) due to the low water level was the only
option for the lake water to avoid direct solar radiation.

108
Figure 4.13: LST 30 March 2014 (map overlay is provided in the back of this thesis)

109
Table 4.18: Correlation analysis between distance and LST on 30 March 2014
Wind Direction % {N=0 or 360, E=90, S=180, W=270}
S
l
n
o
LST
Date
HatirJ
heel_
N&N
W
area
HatirJ
heel_
S&SE
area
Dhanm
ondi
_
N&NW
area
Dhan
mondi
_
S&SE
area
WD
9 am
WD
12
pm
WS
9 am
WS
12
pm
Air
Te
mp
9
am
Air
Tem
p.
12
pm
1 LST
30MAR
2014
0.72 0.31 0.67 0.62 240 250 1.02 1.54 30.4 36.2
Land Surface Temperature 25 November 2014:
Extracted Land Surface Temperature is presented in the figure 4.14 and correlational
analysis in the table 4.19.
Wind flow and the cooling effect:
At this date and time, the predominant wind flow was from Western side.
Dhanmondi Lake:
The correlation between temperature at the urban station and their distance
from the wetland along the line of wind direction was more at the downwind side
than the upwind side. The cooling effect from the lake was clearly carried towards
the downwind side of the lake through Advection process as the South and South-
East area of the Dhanmondi lake area were surrounded by the part of the lake on its
Western side. The other part North and North-West area didn’t have any part of the
lake on its Western side and hence missing the cooling effect being carried through
advection process.
Hatirjheel Lake:
In case of the Hatirjheel lake, the correlation between temperature at the urban
station and their distance from the wetland along the line of wind direction was more
at the downwind North and North-West area than the South and South-East area.
Because North and North-West area is having part of the lake on its western side
which the other area didn’t have. Riparian shading was scarce in this lake and at this
time of the season due to the high-water level accumulated during the rainy season,
the potential for topographic shading (by the bank of the lake) was also low for the
lake water to avoid direct solar radiation. But there was shading from the built form
on the part of the lake on the western side of North and North-West area, as this part
was comparatively narrow, hence able to produce cooling effect.

110
Figure 4.14: LST 25 November 2014 (map overlay is provided in the back of this thesis)

111
Table 4.19: Correlation analysis between distance and LST on 25 November 2014
Wind Direction % {N=0 or 360, E=90, S=180, W=270}
S
l
n
o
LST Date HatirJ
heel_
N&N
W
area
HatirJ
heel_
S&SE
area
Dhanm
ondi
_
N&NW
area
Dhan
mondi
_
S&SE
area
WD
9 am
WD
12
pm
WS
9 am
WS
12
pm
Air
Te
mp
9
am
Air
Tem
p.
12
pm
1 LST
25NOV2
014
0.61 0.30 0.53 0.75 320 270 1.02 1.02 21.6 26.4
Land Surface Temperature 28 January 2015:
Extracted Land Surface Temperature is presented in the figure 4.15 and correlational
analysis in the table 4.20.
Wind flow and the cooling effect:
At this date and time, the predominant wind flow was from Northern side.
Dhanmondi Lake:
The correlation between temperature at the urban station and their distance
from the wetland along the line of wind direction was more at the downwind side
than the upwind side. The cooling effect from the lake was clearly carried towards
the downwind side of the lake through Advection process as the North and North-
West area of the Dhanmondi lake area was also surrounded by the part of the lake
on its Northern side. The other part South and South-East area had very small part
of the lake on its Northern side and hence missed the cooling effect being carried
through advection process.
Hatirjheel Lake:
In case of the Hatirjheel lake, the correlation between temperature at the urban station
and their distance from the wetland along the line of wind direction was slightly
more at the downwind South and South-East area than the North and North-West
area. Because South and South-East area was having part of the lake on its Northern
side which the other area didn’t have. Due to the lack of riparian shading at that time
of the season, the topographic shading (by the bank of the lake) due to the low water
level was the only option for the lake water to avoid direct solar radiation.
Table 4.20: Correlation analysis between distance and LST on 28 January 2015
Wind Direction % {N=0 or 360, E=90, S=180, W=270}
S
l
n
o
LST Date HatirJhe
el_
N&NW
area
HatirJhe
el_
S&SE
area
Dhanmo
ndi
_
N&NW
area
Dhanmo
ndi
_ S&SE
area
W
D
9
am
W
D
12
p
m
W
S
9
a
m
W
S
12
p
m
Air
Te
mp
9
am
Air
Tem
p.
12
pm
1 LST28JAN
2015
0.51 0.54 0.58 0.32 0 0 0 0 21.
2
24.5

112
Figure 4.15: LST 28 January 2015 (map overlay is provided in the back of this thesis)

113
Figure 4.16: LST 13 February 2015 (map overlay is provided in the back of this thesis)

114
Land Surface Temperature 13 February 2015:
Extracted Land Surface Temperature is presented in the figure 4.16 and correlational
analysis in the table 4.21.
Wind flow and the cooling effect:
At that date and time, the predominant wind flow was from Western side.
Table 4.21: Correlation analysis between distance and LST on 13 February 2015
Wind Direction % {N=0 or 360, E=90, S=180, W=270}
S
l
n
o
LST
Date
HatirJhee
l_
N&NW
area
HatirJh
eel_
S&SE
area
Dhanm
ondi
_
N&NW
area
Dhanm
ondi
_ S&SE
area
WD
9
am
WD
12
pm
W
S
9
a
m
WS
12
pm
Air
Temp
9 am
Air
Tem
p.
12
pm
1 LST1
3FEB
2015
0.57 0.22 0.56 0.58 0 270 0 1.54 20.6 25.4
Dhanmondi Lake:
The correlation between temperature at the urban station and their distance
from the wetland along the line of wind direction was slightly more at the downwind
side than the upwind side. The cooling effect from the lake was clearly carried
towards the downwind side of the lake through Advection process as the South and
South-East area of the Dhanmondi lake area was also surrounded by the part of the
lake on its Western side. The other part North and North-West area didn’t have any
part of the lake on its Western side and hence missing the cooling effect being
carried through advection process.
Hatirjheel Lake:
In case of the Hatirjheel lake, the correlation between temperature at the urban
station and their distance from the wetland along the line of wind direction was more
at the downwind North and North-West area than the South and South-East area.
Because North and North-West area were having part of the lake on its western side
which the other area didn’t have. Because of the lack of riparian shading at that time
of the season, the topographic shading (by the bank of the lake) due to the low water
level is the only option for the lake water to avoid direct solar radiation.
Land Surface Temperature 17 March 2015:
Extracted Land Surface Temperature is presented in the figure 4.17 and correlational
analysis in the table 4.22.
Wind flow and the cooling effect:
At that date and time, the predominant wind flow was from Western side.
Dhanmondi Lake:
The correlation between temperature at the urban station and their distance from the
wetland along the line of wind direction was slightly more at the downwind side

115
than the upwind side. The cooling effect from the lake was clearly carried towards
the downwind side of the lake through Advection process as the South and South-
East area of the Dhanmondi lake area was also surrounded by the part of the lake on
its Western side.
Table 4.22: Correlation analysis between distance and LST on 17 March 2015
Wind Direction % {N=0 or 360, E=90, S=180, W=270}
S
l
n
o
LST Date HatirJ
heel_
N&N
W area
HatirJ
heel_
S&SE
area
Dhanm
ondi
_
N&NW
area
Dhan
mondi
_
S&SE
area
WD
9
am
WD
12
pm
W
S
9
a
m
WS
12
pm
Air
Te
mp
9
am
Air
Tem
p.
12
pm
1 LST17MAR
2015
0.60 0.12 0.73 0.14 0 270 0 1.02 26.8 30.4
The other part North and North-West area didn’t have any part of the lake on its
Western side and hence missed the cooling effect being carried through advection
process.
Hatirjheel Lake:
In case of the Hatirjheel lake, the correlation between temperature at the urban
station and their distance from the wetland along the line of wind direction was more
at the downwind North and North-West area than the South and South-East area.
Because North and North-West area was having part of the lake on its western side
which the other area didn’t have. Because of the lack of riparian shading at that time
of the season topographic shading (by the bank of the lake) due to the low water level
was the only option for the lake water to avoid direct solar radiation.
Land Surface Temperature 18 April 2015:
Extracted Land Surface Temperature is presented in the figure 4.18 and correlational
analysis in the table 4.23.
Wind flow and the cooling effect:
At that date and time, the predominant wind flow was from the South-
Western side.
Dhanmondi Lake:
The correlation between temperature at the urban station and their distance from the
wetland along the line of wind direction was more at the downwind side than the
upwind side. The cooling effect from the lake was clearly carried towards the
downwind side of the lake through Advection process, as the South and South-East
area of the Dhanmondi lake area was surrounded by the part of the lake on its
Western side. The other part North and North-West area didn’t have any part of the
lake on its Western side and hence missed the cooling effect being carried through
advection process.

116
Figure 4.17: LST 17 March 2015 (map overlay is provided in the back of this thesis)
Cloud Surface temperature
not considered in the
calculation

117
Hatirjheel Lake:
In case of the Hatirjheel lake, the correlation between temperature at the urban station
and their distance from the wetland along the line of wind direction was more at the
downwind North and North-West area than the South and South-East area. Because
North and North-West area was having part of the lake on its western side which
the other area didn’t have.
Table 4.23: Correlation analysis between distance and LST on 18 April 2015
Wind Direction % {N=0 or 360, E=90, S=180, W=270}
S
l
n
o
LST
Date
HatirJ
heel_
N&N
W
area
HatirJ
heel_
S&SE
area
Dhanm
ondi
_
N&NW
area
Dhan
mondi
_
S&SE
area
WD
9 am
WD
12
pm
WS
9 am
WS
12
pm
Air
Tem
p
9 am
Air
Tem
p.
12
pm
1 LST18
APRIL
2015
0.85 0.43 0.63 0.80 260 240 1.02 5.15 28.5 31.8
Due to the lack of riparian shading at this time of the season, the topographic shading
(by the bank of the lake) due to the low water level was the only option for the lake
water to avoid direct solar radiation.
Land Surface Temperature 4 May 2015:
Extracted Land Surface Temperature is presented in the figure 4.19 and correlational
analysis in the table 4.24.
Table 4.24: Correlation analysis between distance and LST on 4 May 2015
Wind Direction % {N=0 or 360, E=90, S=180, W=270}
S
l
n
o
LST Date HatirJ
heel_
N&N
W
area
HatirJ
heel_
S&SE
area
Dhan
mondi
_
N&N
W
area
Dhan
mondi
_
S&SE
area
WD
9
am
WD
12
pm
WS
9 am
WS
12
pm
Air
Te
mp
9
am
Air
Tem
p.
12
pm
1 LST4MAY
2015
0.67 0.46 0.35 0.51 180 130 1.02 1.02 29.8 33.6
Wind flow and the cooling effect:
At this date and time, the predominant wind flow was from South and South-
Eastern side. The cooling effect from the lake was clearly carried towards the
downwind side of both the lake through Advection process. Because the correlation
between temperature at the urban station and their distance from the wetland along
the line of wind direction was more at the downwind side than the upwind side.
Dhanmondi Lake:
In case of Dhanmondi lake the correlation between temperature at the urban
station and their distance from the wetland along the line of wind direction was
more at the downwind side than the upwind side.

118
Figure 4.18: LST 18 April 2015 (map overlay is provided in the back of this thesis)

119
Figure 4.19: LST 4 May 2015 (map overlay is provided in the back of this thesis)

120
The cooling effect from the lake was clearly carried towards the downwind side of
the lake through Advection process as the North and North-west area of the
Dhanmondi lake area was surrounded by the part of the lake on its Southern side.
The other part South and south-east didn’t have any part of the lake on its Southern
side and hence missed the cooling effect of wetland being carried through advection
process.
Hatirjheel Lake:
In case of the Hatirjheel lake, the correlation between temperature at the urban
station and their distance from the wetland along the line of wind direction was
slightly more at the downwind North and North-West area than the South and South-
East area. In the absence of riparian shading, the lake is partly shaded by topographic
shading (by the bank of the lake) due to low water level. Hence the chance of advective
cooling of North and North-West area from the lake was not so great due to the
minimal shading of lake water.
Land Surface Temperature 25 September 2015:
Extracted Land Surface Temperature is presented in the figure 4.20 and correlational
analysis in the table 4.25.
Wind flow and the cooling effect:
At this date and time, the predominant wind flow was from South and South-
Western side. The cooling effect from the lake was clearly carried towards the
downwind side of both the lake through Advection process.
Table 4.25: Correlation analysis between distance and LST on 25 September 2015
Wind Direction % {N=0 or 360, E=90, S=180, W=270}
S
l
n
o
LST Date HatirJ
heel_
N&N
W area
HatirJ
heel_
S&SE
area
Dhanmo
ndi
_
N&NW
area
Dhan
mondi
_
S&SE
area
W
D
9
a
m
WD
12
pm
WS
9
am
WS
12
pm
Air
Te
mp
9
am
Air
Tem
p.
12
pm
1 LST25SEPT
2015
0.62 0.34 0.58 0.79 0 210 0 1.02 30 33
Because correlation between temperature at the urban station and their
distance from the wetland along the line of wind direction was more at the
downwind side than the upwind side.
Dhanmondi Lake:
The correlation between temperature at the urban station and their distance
from the wetland along the line of wind direction was more at the downwind side
than the upwind side. The cooling effect from the lake was clearly carried towards
the downwind side of the lake through Advection process as the South and

121
Figure 4.20: LST 25 September 2015 (map overlay is provided in the back of this thesis)

122
South-East area of the Dhanmondi lake was surrounded by the part of the lake on
its South-Western side. The other part North and North-West had less exposure to
the lake on its South-Western side and hence missed the cooling effect of wetland
being carried through advection process.
Hatirjheel Lake:
In case of the Hatirjheel lake, the correlation between temperature at the urban
station and their distance from the wetland along the line of wind direction was more
at the downwind North and North-West area than the South and South-East area. In
the absence of riparian shading, the lake was partly shaded by topographic shading
(by the bank of the lake) due to low water level. Hence the chance of advective cooling
of North and North-West area from the lake was not so great due to the minimal
shading of lake water.
Land Surface Temperature 27 October 2015:
Extracted Land Surface Temperature is presented in the figure 4.21 and correlational
analysis in the table 4.26.
Wind flow and the cooling effect:
At this date and time, the predominant wind flow was from Northern side.
Dhanmondi Lake:
The correlation between temperature at the urban station and their distance
from the wetland along the line of wind direction was more at the downwind side
than the upwind side. The cooling effect from the lake was clearly carried towards
the downwind side of the lake through Advection process as the North and North-
west area of the Dhanmondi lake area were surrounded by the part of the lake on its
Northern side. The other part South and south-east had very little part of the lake on
its Northern side and hence missed the cooling effect being carried through
advection process.
Hatirjheel Lake:
In case of the Hatirjheel lake, the correlation between temperature at the urban station
and their distance from the wetland along the line of wind direction was relatively
low at the downwind South and South-East area than the North and North-West
area. Because due to the lack of riparian shading South and South-East area were
getting warmer by the hot air flow from the lake. At this time of the season due to the
high-water level accumulated from monsoon rain, the chance of topographic shading
(by the bank of the lake) was also very low.

123
Figure 4.21: LST 27 October 2015 (map overlay is provided in the back of this thesis)

124
Table 4.26: Correlation analysis between distance and LST on 27 October 2015
Wind Direction % {N=0 or 360, E=90, S=180, W=270}
S
l
n
o
LST
Date
HatirJhee
l_
N&NW
area
HatirJh
eel_
S&SE
area
Dhanm
ondi
_
N&NW
area
Dhan
mondi
_
S&SE
area
WD
9
am
WD
12
pm
WS
9
am
W
S
12
p
m
Air
Te
mp
9
am
Air
Tem
p.
12
pm
1 LST27O
CT2015
0.58 0.54 0.63 0.19 0 0 0 0 28.4 31
Land Surface Temperature 12 November 2015:
Extracted Land Surface Temperature is presented in the figure 4.22 and correlational
analysis in the table 4.27.
Wind flow and the cooling effect:
At this date and time, the predominant wind flow was from Northern side.
Dhanmondi Lake:
The correlation between temperature at the urban station and their distance
from the wetland along the line of wind direction was more at the downwind side
than the upwind side. The cooling effect from the lake was clearly carried towards
the downwind side of the lake through Advection process as the North and North-
west area of the Dhanmondi lake area was surrounded by the part of the lake on its
Northern side. The other part South and south-east had very little part of the lake on
its Northern side and hence missed the cooling effect being carried through
advection process.
Hatirjheel Lake:
In case of the Hatirjheel lake, the correlation between temperature at the urban
station and their distance from the wetland along the line of wind direction was
relatively low at the downwind South and South-East area than the North and North-
West area. Because due to the lack of riparian shading South and South-East area
were getting warmer by the hot air flow from the lake. At this time of the season due
to the high-water level accumulated from monsoon rain, the chance of topographic
shading (by the bank of the lake) was also very low.
Table 4.27: Correlation analysis between distance and LST on 12 November 2015
Wind Direction % {N=0 or 360, E=90, S=180, W=270}
S
l
n
o
LST Date HatirJhe
el_
N&NW
area
HatirJhe
el_
S&SE
area
Dhanmo
ndi
_
N&NW
area
Dhanmo
ndi
_ S&SE
area
W
D
9
am
W
D
12
pm
W
S
9
a
m
W
S
12
p
m
Air
Te
mp
9
am
Air
Tem
p.
12
pm
1 12NOV2
015
0.58 0.57 0.55 0.11 0 0 0 0 27 30

125
Figure 4.22: LST 12 November 2015 (map overlay is provided in the back of this thesis)

126
Land Surface Temperature 28 November 2015:
Extracted Land Surface Temperature is presented in the figure 4.23 and correlational
analysis in the table 4.28. At this date and time, the predominant wind flow was from
Northern side.
Dhanmondi Lake:
The correlation between temperature at the urban station and their distance
from the wetland along the line of wind direction was more at the downwind side
than the upwind side. The cooling effect from the lake was clearly carried towards
the downwind side of the lake through Advection process as the North and North-
west area of the Dhanmondi lake area was surrounded by the part of the lake on its
Northern side. The other part South and south-east had very little part of the lake on
its Northern side and hence missed the cooling effect being carried through
advection process.
Hatirjheel Lake:
In case of the Hatirjheel lake, the correlation between temperature at the urban
station and their distance from the wetland along the line of wind direction was
relatively low at the downwind South and South-East area than the North and North-
West area. Because due to the lack of riparian shading South and South-East area
were getting warmer by the hot air flow from the lake. At this time of the season due
to the high-water level accumulated from monsoon rain, the chance of topographic
shading (by the bank of the lake) was also very low.
Table 4.28: Correlation analysis between distance and LST on 28 November 2015
Wind Direction % {N=0 or 360, E=90, S=180, W=270}
Sl
n
o
LST Date HatirJ
heel_
N&N
W
area
HatirJ
heel_
S&SE
area
Dhanm
ondi
_
N&NW
area
Dhanm
ondi
_
S&SE
area
W
D
9
am
W
D
12
pm
W
S
9
am
W
S
12
p
m
Air
Tem
p
9 am
Air
Tem
p.
12
pm
1 28 NOV 2015 0.59 0.33 0.59 0.1 0 0 0 0 24 27.6
Land Surface Temperature 30 December 2015:
Extracted Land Surface Temperature is presented in the figure 4.24 and correlational
analysis in the table 4.29.
Table 4.29: Correlation analysis between distance and LST on 30 December 2015
Wind Direction % {N=0 or 360, E=90, S=180, W=270}
Sl
n
o
LST
Date
HatirJh
eel_
N&NW
area
HatirJ
heel_
S&SE
area
Dhanmon
di
_ N&NW
area
Dhanm
ondi
_ S&SE
area
WD
9
am
WD
12
pm
W
S
9
am
W
S
12
pm
Air
Tem
p
9 am
Air
Tem
p.
12
pm
1 30 DEC
2015
0.51 0.49 0.57 0.32 0 0 0 0 18 24.2

127
Figure 4.23: LST 28 November 2015 (map overlay is provided in the back of this thesis)

128
Figure 4.24: LST 30 December 2015 (map overlay is provided in the back of this thesis)

129
Wind flow and the cooling effect:
At this date and time, the predominant wind flow was from Northern side.
Dhanmondi Lake:
The correlation between temperature at the urban station and their distance
from the wetland along the line of wind direction was more at the downwind side
than the upwind side. The cooling effect from the lake was clearly carried towards
the downwind side of the lake through Advection process as the North and North-
west area of the Dhanmondi lake area were surrounded by the part of the lake on its
Northern side. The other part South and south-east had very little part of the lake on
its Northern side and hence missed the cooling effect being carried through
advection process.
Hatirjheel Lake:
In case of the Hatirjheel lake, the correlation between temperature at the urban
station and their distance from the wetland along the line of wind direction was
relatively low at the downwind South and South-East area than the North and North-
West area. Because due to the lack of riparian shading South and South-East area
were getting warmer by the hot air flow from the lake. At this time of the season due
to the high-water level accumulated from monsoon rain, the chance of topographic
shading (by the bank of the lake) was also very low.
Land Surface Temperature 15 January 2016:
Extracted Land Surface Temperature is presented in the figure 4.25 and
correlational analysis in the table 4.30. At this date and time, the predominant wind
flow was from Northern side.
Table 4.30: Correlation analysis between distance and LST on 15 January 2016
Wind Direction % {N=0 or 360, E=90, S=180, W=270}
Sl
n
o
LST Date Hatir
Jheel
_
N&
NW
area
HatirJ
heel_
S&SE
area
Dhanmo
ndi
_
N&NW
area
Dhanm
ondi
_
S&SE
area
W
D
9
am
W
D
12
pm
W
S
9
am
W
S
12
pm
Air
Tem
p
9 am
Air
Tem
p.
12
pm
1 15 JAN 2016 0.36 0.57 0.48 0.30 0 0 0 0 18.2 24.2
Dhanmondi Lake:
The correlation between temperature at the urban station and their distance
from the wetland along the line of wind direction was more at the downwind side
than the upwind side. The cooling effect from the lake was clearly carried towards
the downwind side of the lake through Advection process as the North and North-
west area of the Dhanmondi lake area were surrounded by the part of the lake on its
Northern side. The other part South and south-east had very little part of the lake on
its Northern side and hence missed the cooling effect being carried through
advection process.

130
Figure 4.25: LST 15 January 2016 (map overlay is provided in the back of this thesis)

131
Hatirjheel Lake:
At this time of the season high-water level accumulated from monsoon rain
dropped down, together with the low angle of winter sun the chance of topographic
shading (by the bank of the lake) was also very high. This helps the lake water to avoid
a significant amount of direct solar radiation. That is the reason in case of the Hatirjheel
lake, the correlation between temperature at the urban station and their distance from
the wetland along the line of wind direction was relatively high at the downwind
South and South-East area than the North and North-West area. The cooling effect
from the lake was clearly carried towards the downwind side of the lake through
Advection process as the South and South-East area of the Hatirjheel lake were
surrounded by the part of the lake on its Northern side.
Land Surface Temperature 16 February 2016:
Extracted Land Surface Temperature is presented in the figure 4.26 and correlational
analysis in the table 4.31.
Wind flow and the cooling effect:
At this date and time, the predominant wind flow was from Northern side.
Dhanmondi Lake:
The correlation between temperature at the urban station and their distance from the
wetland along the line of wind direction was more at the downwind side than the
upwind side. The cooling effect from the lake was clearly carried towards the
downwind side of the lake through Advection process as the North and North-west
area of the Dhanmondi lake area were surrounded by the part of lake on its Northern
side. The other part South and south east had very little part of the lake on its
Northern side and hence missed the cooling effect being carried through advection
process.
Table 4.31: Correlation analysis between distance and LST on 16 February 2016
Wind Direction % {N=0 or 360, E=90, S=180, W=270}
Sl
no
LST
Date
HatirJh
eel_
N&N
W area
HatirJ
heel_
S&SE
area
Dhanm
ondi
_
N&NW
area
Dhan
mondi
_
S&SE
area
WD
9
am
WD
12
pm
WS
9
am
WS
12
pm
Air
Tem
p
9 am
Air
Temp
12 pm
1 16
FEB
2016
0.43 0.46 0.57 0.21 0 360 0 1.02 24.2 29.5
Hatirjheel Lake:
At this time of the season high-water level accumulated from monsoon rain dropped
down, together with the low angle of winter sun the chance of topographic shading (by
the bank of the lake) was also quite high. This helps the lake water to avoid significant
amount of direct solar radiation.

132
Figure 4.26: LST 16 February 2016 (map overlay is provided in the back of this thesis)

133
That was the reason in case of the Hatirjheel lake, the correlation between
temperature at the urban station and their distance from the wetland along the line
of wind direction was relatively high at the downwind South and South-East area
than the North and North-West area. The cooling effect from the lake was clearly
carried towards the downwind side of the lake through Advection process as the
South and South-East area of the Hatirjheel lake surrounded by the part of lake on
its Northern side.
Land Surface Temperature 3 March 2016:
Extracted Land Surface Temperature is presented in the figure 4.27 and correlational
analysis in the table 4.32.
Wind flow and the cooling effect:
At this date and time, the predominant wind flow was from Western side.
Dhanmondi Lake:
The correlation between temperature at the urban station and their distance from the
wetland along the line of wind direction was slightly more at the downwind side
than the upwind side. The cooling effect from the lake was clearly carried towards
the downwind side of the lake through Advection process as the South and South-
East area of the Dhanmondi lake area was surrounded by the part of lake on its
Western side. The other part North and North-West area didn’t have any part of the
lake on its Western side and hence missed the cooling effect being carried through
advection process.
Hatirjheel Lake:
In case of the Hatirjheel lake, the correlation between temperature at the urban
station and their distance from the wetland along the line of wind direction was more
at the downwind North and North-West area than the South and South-East area.
Because North and North-West area was having part of the lake on its western side
which the other area didn’t have. Due to the lack of riparian shading at this time of
the season, the topographic shading (by the bank of the lake) due to the low water level
was the only option for the lake water to avoid direct solar radiation.
Table 4.32: Correlation analysis between distance and LST on 3 March 2016
Wind Direction % {N=0 or 360, E=90, S=180, W=270}
S
l
n
o
LST Date Hatir
Jheel
_
N&
NW
area
Hatir
Jheel
_
S&S
E
area
Dhan
mondi
_
N&N
W
area
Dhan
mondi
_
S&SE
area
WD
9am
WD
12p
m
W
S
9a
m
WS
12p
m
Air
Tem
p
9am
Air
Tem
p.
12p
m
1 3 MAR
2016
0.79 0.29 0.46 0.75 0 290 0 1.54 26.7 30.9

134
Figure 4.27: LST 3 March 2016 (map overlay is provided in the back of this thesis)

135
Land Surface Temperature 14 November 2016:
Extracted Land Surface Temperature is presented in the figure 4.28 and correlational
analysis in the table 4.33.
Wind flow and the cooling effect:
At this date and time, the predominant wind flow was from Northern side.
Dhanmondi Lake:
The correlation between temperature at the urban station and their distance from the
wetland along the line of wind direction was more at the downwind side than the
upwind side. The cooling effect from the lake was clearly carried towards the
downwind side of the lake through Advection process as the North and North-west
area of the Dhanmondi lake area were surrounded by the part of lake on its Northern
side. The other part South and south east had very little part of the lake on its
Northern side and hence missed the cooling effect being carried through advection
process.
Hatirjheel Lake:
In case of the Hatirjheel lake, the correlation between temperature at the urban
station and their distance from the wetland along the line of wind direction was
relatively low at the downwind South and South-East area than the North and North-
West area. Because due to the lack of riparian shading South and South-East area
were getting warmer by the hot air flow from the lake. At this time of the season due
to the high-water level accumulated from monsoon rain, the chance of topographic
shading (by the bank of the lake) was also quite low.
Table 4.33:Correlation analysis between distance and LST on 14 November 2016
Wind Direction % {N=0 or 360, E=90, S=180, W=270}
Sl
n
o
LST
Date
HatirJh
eel_
N&N
W area
HatirJ
heel_
S&SE
area
Dhanm
ondi
_
N&NW
area
Dhan
mondi
_
S&SE
area
WD
9a
m
WD
12p
m
WS
9am
WS
12p
m
Air
Tem
p
9am
Air
Tem
p
12p
m
1 14
NOV
2016
0.71 0.48 0.48 0.22 50 360 1.02 1.02 26.2 29.5
Land Surface Temperature 30 November 2016:
Extracted Land Surface Temperature is presented in the figure 4.29 and correlational
analysis in the table 4.34.
Wind flow and the cooling effect:
At that date and time, the predominant wind flow was from Northern side.

136
Figure 4.28: LST 14 November 2016 (map overlay is provided in the back of this thesis)

137
Dhanmondi Lake:
The correlation between temperature at the urban station and their distance
from the wetland along the line of wind direction was more at the downwind side
than the upwind side. The cooling effect from the lake was clearly carried towards
the downwind side of the lake through Advection process as the North and North-
west area of the Dhanmondi lake area were surrounded by the part of lake on its
Northern side. The other part South and south east had very little part of the lake on
its Northern side and hence missed the cooling effect being carried through
advection process.
Hatirjheel Lake:
In case of the Hatirjheel lake, the correlation between temperature at the urban
station and their distance from the wetland along the line of wind direction was
slightly high at the downwind South and South-East area than the North and North-
West area. Although located at the downwind side, due to the lack of riparian shading
South and South-East area were getting warmer due to the hot air flow from the lake,
hence the correlation due to the cooling effect of the lake are not that much high. At
this time of the season due to the high-water level accumulated from monsoon rain,
the chance of topographic shading (by the bank of the lake) was also quite low.
Table 4.34: Correlation analysis between distance and LST on 30 November 2016
Wind Direction % {N=0 or 360, E=90, S=180, W=270}
Sl
no
LST
Date
HatirJ
heel_
N&N
W
area
HatirJ
heel_
S&SE
area
Dhanm
ondi
_
N&NW
area
Dhan
mondi
_
S&SE
area
WD
9a
m
WD
12p
m
WS
9am
WS
12p
m
Air
Temp
9am
Air
Temp.
12pm
1 30
NOV
2016
0.54 0.56 0.63 0.26 90 0 1.02 0 24 27.5
Land Surface Temperature 18 February 2017:
Extracted Land Surface Temperature is presented in the figure 4.30 and correlational
analysis in the table 4.35.
Table 4.35: Correlation analysis between distance and LST on 18 February 2017
Wind Direction % {N=0 or 360, E=90, S=180, W=270}
Sl
no
LST Date HatirJheel_
N&NW area
HatirJheel_
S&SE area
Dhanmondi
_ N&NW area
Dhanmondi
_ S&SE area
1 18 FEB 2017 0.71 0.60 0.70 0.66
In both case of Hatirjheel and Dhanmondi lake area correlations were strong in
the downwind side, hence proved the advection process to transport the cooling effect
from the lake.

138
Figure 4.29: LST 30 November 2016 (map overlay is provided in the back of this thesis)

139
Figure 4.30: LST 18 February 2017 (map overlay is provided in the back of this thesis)

140
Land Surface Temperature 22 March 2017:
Extracted Land Surface Temperature is presented in the figure 4.31 and correlational
analysis in the table 4.36.
Table 4.36: Correlation analysis between distance and LST on 22 March 2017
Wind Direction % {N=0 or 360, E=90, S=180, W=270}
Sl
no
LST Date HatirJheel_
N&NW
area
HatirJheel_
S&SE area
Dhanmondi
_ N&NW area
Dhanmondi
_ S&SE area
1 22 MAR 2017 0.78 0.47 0.71 0.58
In both case of Hatirjheel and Dhanmondi lake area correlations were strong in the
downwind side, hence showed the advection process as a means of transport coolth
to the urban fabric.
Results of Correlational analysis between Land Surface Temperature (LST) at
selected points and their distance from water edge for both the Dhanmondi and
Hatirjheel lake for the selected dates (representing three seasons) of 2013 to 2017 are
presented in table 4.37 and corresponding figure 4.32. The result of the correlation
analysis (Table 4.37) shows that the LST strongly and positively correlated with
distance from the edge of wetland. In case of Hatirjheel the correlation is strongest in
April, which is Hot dry season and in case of Dhanmondi Lake the correlation was
strongest in September which is Warm-Humid season. The possible explanation was
that during the hot dry season Hatirjheel lake get more topographical shading due to
low water level and hence the water temperature stays comparatively low to produce
more cooling which in turn increases the difference of the cooling effect with the
distance.

141
Figure 4.31: LST 22 March 2017 (map overlay is provided in the back of this thesis)
Cloud Surface
temperature not
considered in the
calculation

142
Table 4.37. Correlation coefficient (r) between LST and Distance from the edge of the wetland.
Sl
no
LST
Date
Hatirj
heel
Down
Wind
Dhan
mondi
Down
Wind
Hatirjhe
el
Upwind
Dhanm
ondi
Upwind
Wind
Speed
(ms-1)
9am
Wind
Speed
(ms-1)
12pm
Temp
(°C)
9am
Temp
(°C)
12pm
1 LST
12APRI
L 2013
0.67 0.5 0.57 0.35 1.02 1.02 30.3 34.7
2 LST
15JUNE
2013
-0.46 0.26 0.5 0.18 1.02 1.02 29.8 33.4
3 LST
6NOV20
13
0.42 0.65 0.6 0.26 0 1.02 25.2 28.5
4 LST
24DEC2
013
0.78 0.75 0.5 0.54 1.54 1.54 20.3 25
5 LST
25JAN2
014
0.58 0.53 0.44 0.18 1.02 0 19.8 25.2
6 LST
10FEB2
014
0.61 0.59 0.29 -0.03 3.08 1.54 22.2 26
7 LST
26FEB2
014
0.64 0.54 0.31 0.13 1.02 1.02 23.4 27.8
8 LST
14MAR
2014
0.52 0.53 0.47 0.2 1.02 1.02 28.4 31.8
9 LST
30MAR
2014
0.72 0.62 0.31 0.67 1.02 1.54 30.4 36.2
10 LST
25NOV2
014
0.61 0.75 0.3 0.53 1.02 1.02 21.6 26.4
11 LST
28JAN2
015 0.54 0.58 0.51 0.32 0 0 21.2 24.5
12 LST
13FEB2
015 0.57 0.58 0.22 0.56 0 1.54 20.6 25.4
13 LST 17
MAR
2015 0.6 0.14 0.12 0.73 0 1.02 26.8 30.4
14 LST
18APRI
L2015
0.85 0.8 0.43 0.63 1.02 5.15 28.5 31.8
15 LST
4MAY2
015
0.67 0.35 0.46 0.51 1.02 1.02 29.8 33.6
16 LST
25SEPT
2015
0.62 0.79 0.34 0.58 0 1.02 30 33
17 LST
27OCT2
015
0.54 0.63 0.58 0.19 0 0 28.4 31

143
Sl
no
LST
Date
Hatirj
heel
Down
Wind
Dhan
mondi
Down
Wind
Hatirjhe
el
Upwind
Dhanm
ondi
Upwind
Wind
Speed
(ms-1)
9am
Wind
Speed
(ms-1)
12pm
Temp
(°C)
9am
Temp
(°C)
12pm
18 LST
12NOV2
015
0.57 0.55 0.58 0.11 0 0 27 30
19 LST
28NOV2
015
0.33 0.59 0.59 0.1 0 0 24 27.6
20 LST
30DEC2
015
0.49 0.57 0.51 0.32 0 0 18 24.2
21 LST15J
AN2016 0.57 0.48 0.36 0.3 0 0 18.2 24.2
22 LST
16FEB2
016 0.46 0.57 0.43 0.21 0 1.02 24.2 29.5
23 LST
3MAR2
016
0.79 0.75 0.29 0.46 0 1.54 26.7 30.9
24 LST
14NOV2
016
0.48 0.48 0.71 0.22 1.02 1.02 26.2 29.5
25 LST
30NOV2
016
0.56 0.63 0.54 0.26 1.02 0 24 27.5
26 LST
18FEB2
017
0.71 0.7 0.6 0.66
27 LST
22MAR
2017
0.78 0.71 0.47 0.58
4.9 Conclusion
From the analysis of land surface temperature and other parameters of the
urban landcover extracted from the remotely sensed satellite data, three significant
findings could be made. They are as follows:
a. The Urban Cooling Island (UCI) Intensity of urban wetland were co-related with
the distance from the water edge.
b. The cooling efficiency of the urban wetland were closely moderated by riparian,
topographical and built environmental shading.
c. Seasonal variation in the Urban Cooling Island (UCI) intensity were also observed
through the remote sensing technique.

144
Fig
ure
4.3
2:
Co
oli
ng
eff
ect
of
the
wet
lan
d

145
4.10 References
1. Ahmed B., Kamruzzaman M., Zhu X., Rahman S.M. and Choi K. (2013). “Simulating Land Cover Changes and Their Impacts on Land Surface Temperature in Dhaka, Bangladesh”. Remote Sens., 5, 5969-5998; doi:10.3390/rs5115969.
2. Chen X.L., Zhao H.M., Li P.X., Yin Z.Y. (2006). “Remote sensing image-based analysis of the relationship between urban heat island and land use/cover changes”. Remote Sensing of Environment 104, 133–146.
3. Carlson T.N., Riziley D.A. (1997). “On the Relation between NDVI, Fractional Vegetation Cover, and Leaf Area Index”. Remote Sensing of Environment, 62, pp.
241–252.
4. Finding values for ESUNλ
“Remote Sensing of Environment” 113(2009) 893-903
http://landsathandbook.gsfc.nasa.gov/pdfs/Landsat_Calibration_Summary_RSE.pdf
5. Finding the Julian day (day of the year) http://amsu.cira.colostate.edu/julian.htm
6. Finding the distance between the Sun and Earth for a Julian day:
http://landsathandbook.gsfc.nasa.gov/data_prod/prog_sect11_3.html
7. H. Xu (2008). “A new index for delineating built‐up land features in satellite imagery”. International Journal of Remote Sensing, 29:14, 4269-4276
8. Hanqiu Xu (2006). “Modification of normalized difference water index (NDWI) to enhance open water features in remotely sensed imagery”, International Journal of
Remote Sensing, 27:14, 3025-3033, DOI: 10.1080/01431160600589179
9. Hung T, Uchihama D, Ochi S, Yasuoka Y. (2006) “Assessment with satellite data of the urban heat island effects in Asian mega cities”. Int. J Appl. Earth Obs; 8:34e48.
10. Iino A., Hoyano A. “Development of a method to predict the heat island potential using remote sensing and GIS data”. Energy and Buildings 23 (1996) 199-205,
Elsevier.
11. Kadygrov, E.N. 2006. “Operational Aspects of Different Ground-Based Remote Sensing Observing Techniques for Vertical Profiling of Temperature, Wind, Humidity and Cloud Structure”. IOM Report No. 89, WMO/TD No. 1309. Available from:
http://www.wmo.int/web/www/IMOP/publications-IOM-series.html
12. Kato S., Yamaguchi Y (2007). “Estimation of storage heat flux in an urban area using ASTER data”. Remote Sensing of Environment 110, 1–17.
13. Liang, S. (2000). “Narrowband to broadband conversions of land surface albedo I algorithms.” Remote Sensing of Environment 76, 213-238.
14. Markham B.L., Barker J.L. (1985). “Spectral characterization of the LANDSAT Thematic Mapper sensors”. International Journal of Remote Sensing, 6:5, 697-716.
15. Masson, V. (2006). “Urban surface modeling and the meso-scale impact of cities”.
Theoretical and Applied Climatology, 84(1-3), 35-45.
16. Mackey C.W., Lee X., Smith R.B. (2012). “Remotely sensing the cooling effects of city scale efforts to reduce urban heat island. Building and Environment 49, 348-358.
17. Mcfeeters, S.K., 1996, The use of normalized difference water index (NDWI) in the delineation of open water features. International Journal of Remote Sensing, 17, pp.
1425–1432.
18. NASA: Landsat 7 Science Data Users Handbook (2010),
http://landsathandbook.gsfc.nasa.gov/pdfs/Landsat7_Handbook.pdf

146
19. Purevdorj T. S., Tateishi R., Ishiyama T., & Honda, Y. (1998). “Relationships between percent vegetation cover and vegetation indices”. International Journal of Remote
Sensing, 19(18), 3519−3535. 20. R.B. Smith; (March 2010). “The heat budget of the earth’s surface deduced from
space”. Centre for earth observation, Yale University.
21. Sobrino J.A., Jimenez-Munoz J.C., Paolini L. (2004). “Land surface temperature retrieval from LANDSAT TM 5”. Remote Sensing of Environment, 90, pp. 434–440.
22. Voogt, J.A., & Oke, T.R. 2003. “Thermal remote sensing of urban climates”. Remote
Sensing of Environment, 86, 370–384.
23. Weng Q. (2003). “Fractal Analysis of Satellite-Detected Urban Heat Island Effect”. Photogrammetric Engineering & Remote Sensing Vol. 69, No. 5, May 2003, pp. 555–
566.
24. Weng Q., Lu D., Schubring J. (2004). “Estimation of land surface temperature–vegetation abundance relationship for urban heat island studies”. Remote Sensing of
Environment, 89, pp. 467–483
25. Weng Q. (2001). “A remote sensing GIS evaluation of urban expansion and its impact on surface temperature in the Zhujiang Delta, China”. International Journal of
Remote Sensing. 22:10, 1999-2014, DOI: 10.1080/713860788 26. Zha Y., Gao, J., & Ni, S. (2003). “Use of normalized difference built-up index in
automatically mapping urban areas from TM imagery”. International Journal of
Remote Sensing, 24(3), 583−594.

147
Chapter 5 : FIELD MEASUREMENT OF URBAN COOLING
ISLAND
5.1 Introduction
The main objective of the field measurement was to determine the
morphological characteristics of the Urban Cooling Island (UCI) at Urban Canopy
Layer (UCL). For this reason, the measurement had been carried out in the two-
study area described in the previous section at the Urban Canopy Layer (UCL) at
a height of 1.5m to 2m from the ground. Some measurements were also taken on
top of the water surface and its edge to determine the effect of water on the air
layer above it.
5.2 Methods
5.2.1 Location of the study area
Based on the Remote sensing study of chapter four, two wetlands,
Dhanmondi and Hatirjheel lake of Urban Dhaka were selected for the field study.
The main rationale for selecting the wetlands sites is to enable the analysis of the
effect of riparian shade as Dhanmondi Lake had been chosen for its visible riparian
shade and Hatirjheel lake was chosen for its absence of visible riparian shade.
Table 5.1: Simplified classification of distinct urban forms arranged in approximate decreasing
order of their ability to impact local climate [Oke, 2006]

148
1 A simplified set of classes that includes aspects of the schemes of Auer (1978) and Ellefsen
(1990/91) plus physical measures relating to wind, thermal and moisture controls (columns at
right). Approximate correspondence between UCZ and Ellefsen’s urban terrain zones is: 1(Dc1,
Dc8), 2 (A1-A4, Dc2), 3 (A5, Dc3-5, Do2), 4 (Do1, Do4, Do5), 5 (Do3), 6 (Do6), 7 (none). 2 Effective terrain roughness according to the Davenport classification (Davenport et al., 2000);
see Table 2. 3 Aspect ratio = zH/W is the average height of the main roughness elements (buildings, trees)
divided by their average spacing, in the city center this is the street canyon height/width. This
measure is known to be related to flow regime types (Oke 1987) and thermal controls (solar
shading and longwave screening) (Oke, 1981). Tall trees increase this measure significantly. 4 The average proportion of ground plan covered by built features (buildings, roads, paved and
other impervious areas) the rest of the area is occupied by pervious cover (green space, water,
and other natural surfaces). Permeability affects the moisture status of the ground and hence
humidification and evaporative cooling potential.
As per the Urban Climate Zone (UCZ) classification by Oke (Table 5.1),
the surrounding urban area of the selected Urban Wetland belongs to UCZ 2. A
buffer zone of 0.5 km (fig 5.1 & 1.3) from the edge of the wetland had been taken
into consideration for the field measurement as well as Remote sensing.
Figure 5.1: Buffer zone for field measurement
5.2.2 Physiography of the study area
The physiography of the both the wetland are same as they are located on
the same physiographic regions and consequent sub regions (Brammer H., 2012).
The physiographic region of the wetland is Madhupur Tract. Much of the Dhaka
city lies on the Madhupur Tract, but in the map (figure 5.2), it has been shown
separately. Next important locational information is that, both the lakes are located
on the same overall geothermal gradient zone (Akbar M.A.,2011). From the above
information it could be safely deduce that in terms of heat gain from the ground
source both Dhanmondi and Hatirjheel lakes are in the same category, that means
if they gain heat from the ground that will be in the same rate. In fact, they won’t
get any heat at all from the ground source as the geothermal potential in this
location is not high enough. So, it is only the differential shading pattern, due to
the big riparian shading and the built form, will create differential solar gain for
both the lake.
5.2.3 Date and time of data logging
Dates for the field measurement were selected from three design seasons
of Dhaka, which are Hot Dry (March-May), Warm Humid (June-November) and
Cold Dry (December-February). For all the measurement, the sky was mostly free
of cloud with bright sunlight. Data logging was done from morning to sunset on
0.5 Km Buffer zone 0.5 Km Buffer zone
Shade trees

149
the following dates, at Dhanmondi Lake site on 21 Oct 2016 and 24 Feb 2017; at
Hatirjheel lakeside on 11 Nov 2016 and 10 Feb 2017. One additional Data logging
was done on 13 Dec 2016 at Hatirjheel lake site. On this date simultaneously one
data logger was placed inside Stevenson Screen at the measurement point of
Bangladesh Meteorological Department (BMD) at Agargaon together with
instruments of BMD from 12 Dec 2016 11:00 am to 14 Dec 2016 11:00 am for
calibration of the instrument used in the study and also as a reference measurement.
Figure 5.2: Physiographic region of the wetland area (Brammer H.,2012)
5.2.4 Characteristics of the urban stations
Dhanmondi Lake urban Stations:
The locations of the urban stations chosen for field measurement are shown
on the google earth image (fig.5.3) In case of Dhanmondi lake, all the urban
stations except one (UCILogger4) were installed along the path of prevailing wind
direction form the lake. The urban station UCILogger4 was placed in a road deep
inside the urban fabric which was perpendicular to the prevailing wind direction.
One urban station UCIlogger1 was placed on a small island inside the lake.
Wetland location

150
Figure 5.3: Location of the Urban stations of field measurement at Dhanmondi Lake on 24 February
2017
Figure 5.4: View of the Dhanmondi Lake on 24 February 2017
Following three tables (5.2,5.3 and 5.4) provides detail information of each urban
stations in each measurement day of the Dhanmondi Lake area.

151
Table 5.2: Data Logger Location at Dhanmondi Lake area_21 October 2016
Sl Logg
er
Nam
e
Location and Physical Characteristics of
location
Location
Photo
Geographic
al Co-
ordinates
Duratio
n of the
Data
Loggin
g
1 UCI
Logg
er1
Island 1_near road 6A & 5A.
On the edge of a small island, at the
middle of the lake under tree shade
Latitude
23°44'35.84
"N
Longitude
90°22'38.98
"E
Start:
7:50 am
Finish:
5:30 pm
2 UCI
Logg
er2
Local play ground_Rd # 4, south eastern
side. Bamboo tripod mounted (at 1.8m
height) in a partly grass-covered ground
surface under the shade of a tree, two air
corridors from the lake:
I. 330m from the edge of the water in
western direction.
II. 327m in the northern direction
291m directly from the water edge
Latitude
23°44'28.12
"N
Longitude
90°22'49.25
"E
Start:
9:03 am
Finish:
5:30 pm
3 UCI
Logg
er4
the crossing of Road 8A &10A. Bamboo
tripod mounted (at 1.8m height) in a
partly grass-covered ground surface under
the shade of a tree, Deep in the urban
fabric with no direct air corridor from the
lake to the point. Approx.420m distance
directly from the edge of the lake water in
the North-Eastern direction (Heading 112
degree).
Latitude
23°44'43.11
"N
Longitude
90°22'29.06
"E
Start:
8:27 am
Finish:
5:30 pm
4 UCI
Logg
er6
Road 8A near Rabindra Sorobor. Bamboo
tripod mounted (at 1.8m height) on paved
footpath under the shade of a tree, two air
corridors from the lake:
157m from the edge of the water in North-
Eastern direction.
Latitude
23°44'45.80
"N
Longitude
90°22'34.01
"E
Start:
8:13 am
Finish:
5:30 pm
5 UCI
Logg
er7
Junction Road 10A & Sultana Kamal
Mohila Complex. Bamboo tripod
mounted (at 1.8m height) in a partly
grass-covered ground surface under the
shade of a tree, with a direct air corridor
from the lake to the point. Approx.265m
distance from the edge of the lake water
along the air corridor in North-Eastern
direction.
Latitude
23°44'53.71
"N
Longitude
90°22'32.77
"E
Start:
9:41 am
Finish:
5:30 pm

152
Table 5.3: Data Logger Location at Dhanmondi Lake area_27 January 2017
Sl. Logger
Name
Location and Physical Characteristics of location Geographical
Co-ordinates
Duration
of the
Data
Logging
1 UCILogger1 Middle of bridge between Island and road 6A.
1.1 m from the top of water surface, suspended
with the help of a rope.
Latitude
23.743354
Longitude
90.377209
Start:
9:03 am
Finish:
5:00pm
2 UCILogger2 Rabindra shorobor water edge tied with the
branch of a banyan tree.
0.8m from the top of water surface.
Latitude
23.744261
Longitude
90.376882
Start:
11:25 am
Finish:
5:00pm
3 UCILogger3 PWD playfield.
on a partly grass-covered ground surface under
the shade of a tree, two air corridors from the
lake: 330m from the edge of the water in western
direction. 327m in the northern direction Height:
1.8m from ground surface
Latitude
23.740808
Longitude
90.380631
Start:
10:34
am
Finish:
5:00pm
4 UCILogger4 the crossing of Road 8A &10A.
Ventilated Box mounted (at 1.8m height) in a
partly grass-covered ground surface under the
shade of a tree, Deep in the urban fabric with no
direct air corridor from the lake to the point.
Approx.420m distance directly from the edge of
the lake water in the North-Eastern direction
(Heading 112 degree).
Latitude
23.747157
Longitude
90.373729
Start:
9:47 am
Finish:
5:00pm
5 UCILogger5 Island in between road 6A and Sudha Sadan.
On the edge of a small island, at the middle of
the lake under tree shade. 1m from the ground
surface, tied with a branch of shrubs
Latitude
23.743262
Longitude
90.377415
Start:
9:10am
Finish:
5:00pm
6 UCILogger6 Road 8A near Rabindra Sorobor.
Ventilated Box mounted (at 1.8m height) on
paved footpath under the shade of a tree, two air
corridors from the lake:120m from the edge of
the water in North-Eastern direction.120m on
South-Eastern direction.
Latitude
23.746108
Longitude
90.376076
Start:
9:20 am
Finish:
5:00pm
7 UCILogger7 Junction Road 10A & Sultana Kamal Mohila
Complex.
Ventilated Box mounted (at 1.6m height) in a
partly grass-covered ground surface under the
shade of a tree, with a direct air corridor from the
lake to the point. Approx.230m distance from the
edge of the lake water along the air corridor in
North-Eastern direction.
Latitude
23.748209
Longitude
90.375590
Start:
9:37 am
Finish:
5:00pm
8 UCILogger8 Middle of bridge between Kalabagan field island
and road 12A.
Height .85 m from the water surface, suspended
with the help of a rope.
Latitude
23.747981
Longitude
90.3784
Start:
10:09 am
Finish:
5:00pm

153
Sl. Logger
Name
Location and Physical Characteristics of location Geographical
Co-ordinates
Duration
of the
Data
Logging
9 UCILogger9 island behind Kalabagan field.
Height 1m from ground surface
Latitude
23.747870
Longitude
90.378587
Start:
10:09 am
Finish:
5:00pm
Table 5.4: Data Logger Location at Dhanmondi Lake area_24 February 2017
S
l
Logger Name Location and Physical Characteristics of location Geographical
Co-ordinates
Duration
of the
Data
Logging
1 UCILogger1 Island in between road 6A and Sudha Sadan.
Ventilated Box mounted. On the edge of a small
island, at the middle of the lake under tree shade.
1m from the ground surface, tied with a branch
of shrubs
Latitude
23.743302
Longitude
90.377449
Start
7:35 am
Finish
6:00pm
2 UCILogger1_
Extech Dual
Sensor
Island in between road 6A and Sudha Sadan.
Handheld. On the edge of a small island, at the
middle of the lake under tree shade.
1m from the ground surface, tied with a branch
of shrubs
Latitude
90.377449
Longitude 23.743302
Start
7:45am
Finish
6:00pm
3 UCILogger2 Rabindra Sorobor water edge tied with the
branch of a banyan tree. Ventilated Box
mounted. 0.8m from the top of water surface.
Latitude
23.744261
Longitude 90.376882
Start
7:55 am
Finish
6:00pm
4 UCILogger2_
Extech
Thermo-
anemometer
Rabindra Sorobor water. Handheld. 1.5m from
the top of the ground surface.
Latitude
23.744261
Longitude 90.376882
Start
11:50 am
Finish
6:00pm
5 UCILogger3 Rabindra Sorobar restaurant, Junction of road
7A.
Ventilated Box mounted (at 1.8m height) under
the shade of a tree, exposed to direct air from the
lake:
80m from the edge of the water in North-western
direction.
Latitude
23.745408
Longitude90.
376686
Start
9:10 am
Finish
6:00pm
6 UCILogger4 the crossing of Road 8A &10A.
Ventilated Box mounted (at 1.8m height) in a
partly grass-covered ground surface under the
shade of a tree, Deep in the urban fabric with no
direct air corridor from the lake to the point.
Approx.420m distance directly from the edge of
the lake water in the North-Eastern direction
(Heading 112 degree).
Latitude
23.747157
Longitude 90.373729
Start
8:32 am
Finish
6:00pm
7 UCILogger6 Road 8A near Rabindra Sorobor.
Ventilated Box mounted (at 1.8m height) on
paved footpath under the shade of a tree, two air
corridors from the lake: 120m from the edge of
the water in North-Eastern direction. 120m on
South-Eastern direction.157m directly from the
edge.
Latitude
23.745942
Longitude 90.376096
Start
9:25 am
Finish
6:00pm

154
S
l
Logger Name Location and Physical Characteristics of location Geographical
Co-ordinates
Duration
of the
Data
Logging
8 UCILogger7 Junction Road 10A & Sultana Kamal Mohila
Complex. Ventilated Box mounted (at 1.6m
height) in a partly grass-covered ground surface
under the shade of a tree, with a direct air
corridor from the lake to the point. Approx.265m
distance from the edge of the lake water along
the air corridor in North-Eastern direction.
Latitude
23.748209
Longitude 90.375590
Start
8:25am
Finish
6:00pm
9 UCILogger8 At the junction between road 9A & 11A, South-
West corner of Sultana Kamal Mohila complex.
Height 1.6 m from the footpath.
I. 160m from the edge of the water in North-
Western direction.
Latitude
23.747469
Longitude 90.376386
Start
8:45 am
Finish
6:00pm
Hatirjheel Lake Urban Stations:
In case of Hatirjheel Lake, one urban station UCILogger1 was suspended
form the middle of the Mahanagar Bridge above the water of the lake. Urban
station UCILogger2 placed beside the Lake edge. Two Urban stations
(UCILogger8 & 3) placed inside and the edge of the park beside the lake. Rest of
the Urban stations are placed along a road parallel to the prevailing wind direction.
All the location of the urban stations except UCILogger1 could be seen in the
google-earth image of figure 5.5.
Figure 5.5: Location of the Urban stations of field measurement at Hatirjheel Lake on 10 February
2017

155
Figure 5.6: Hatirjheel Lake on 10 February 2017
Following three tables (5.5,6 and 7) provides detail information of each
urban stations in each measurement day of the Hatirjheel Lake area.
Table 5.5:Data Logger Location at Hatirjheel Lake area_11 November 2016
Sl Logger
Name
Location and Physical
Characteristics of location
Location Photo Geographi
cal Co-
ordinates
Duratio
n of the
Data
Loggin
g
1 UCILogger1 Mahanagar Bridge (Bridge 2).
Suspended from the middle of
the bridge at the top of water
surface
Latitude
23.768043
Longitude
90.413047
Start
9:25 am
Finish
5:15 pm
2 UCILogger2 Gulshan 1 park, opposite of
shooting club.
Bamboo tripod mounted in a
partly grass-covered ground
surface under the shade of tree,
190m from the edge of the water
in southern direction
Latitude
23.773993
Longitude
90.415802
Start
7:25 am
Finish
5:15 pm

156
Sl Logger
Name
Location and Physical
Characteristics of location
Location Photo Geographi
cal Co-
ordinates
Duratio
n of the
Data
Loggin
g
3 UCILogger6 HatirJheel Link Road South
Badda side. Bamboo tripod
mounted at the edge of water
Latitude
23.770620
Longitude
90.420367
Start
8:25 am
Finish
5:15 pm
4 UCILogger7 Roundabout, South Badda road.
Bamboo tripod mounted on bare
ground, 100 m from the edge of
water
Latitude
23.772746
Longitude
90.418953
Start
8:40 am
Finish
5:15 pm
5 UCILogger8 At the junction of Road 2 and
Road 4 of Gulshan 1. Bamboo
tripod mounted on roadside
paved footpath, 425 m from the
lake in southern direction and
110 m from the lake edge in
western direction.
Latitude
23.776434
Longitude
90.414946
Start
9:03 am
Finish
5:15 pm
Table 5.6: Data Logger Location at Hatirjheel Lake area_13 December 2016
Sl Logger
Name
Location and Physical
Characteristics of location
Location
Photo
Geographic
al Co-
ordinate
Duratio
n of the
Data
Loggin
g
1 UCILogger1 Mahanagar Bridge (Bridge 2).
Handheld Suspended from the
middle of the bridge at 6m_above
the top of water surface
Latitude
23.768043
Longitude
90.413047
Start
10:10
am
Finish
5:00 pm
2 UCILogger2 Gulshan 1 park, opposite of
shooting club.
Cased inside ventilated Hard Paper
box and tied to the branch of shrub,
in a partly grass-covered ground
surface under the shade of tree,
190m from the edge of the water in
southern direction
Latitude
23.773993
Longitude
90.415802
Start
8:15 am
Finish
5:00 pm

157
Sl Logger
Name
Location and Physical
Characteristics of location
Location
Photo
Geographic
al Co-
ordinate
Duratio
n of the
Data
Loggin
g
3 UCILogger6 4.49m downwards from the top of
Mahanagar Bridge (Bridge 2).
Cased inside ventilated Hard Paper
box, Suspended from the middle of
the bridge at 1.63m_above the top
of water surface
Latitude
23.768043
Longitude
90.413047
Start
8:49 am
Finish
5:00 pm
4 UCILogger7 2m downwards from the top of
Mahanagar Bridge (Bridge 2).
Cased inside ventilated Hard Paper
box, Suspended from the middle of
the bridge at 4.12m_above the top
of water surface.
Latitude
23.768043
Longitude
90.413047
Start
8:55 am
Finish
5:00 pm
5 UCILogger8 Bangladesh Meteorological
Department, Agargaon Dhaka.
Placed inside the Stevenson screen
of the BMD beside the office
instrument (Thermometer and
Hygrometer) used to collect
meteorological data.
Latitude
23.779854
Longitude
90.378410
Start
12:00
pm at
13/12/2
016.
Finish
11:00
am at
14/12/2
016
Table 5.7: Data Logger Location at Hatirjheel Lake area_10 February 2017
Sl Logger
Name
Location and Physical
Characteristics of location
Location
Photo
Geographic
al Co-
ordinate
Duratio
n of the
Data
Loggin
g
1 UCILogger
1
Mahanagar Bridge (Bridge 2).
Suspended from the middle of the
bridge at 6m_above the top of water
surface
Latitude
23.768043
Longitude
90.413047
Start
8:19 am
Finish5:
50pm
2 UCILogger
1_Extech
Dual Sensor
Mahanagar Bridge (Bridge 2).
Suspended from the middle of the
bridge at 6m_above the top of water
surface
Latitude
23.768043
Longitude
90.413047
Start
8:25 am
Finish5:
50 pm
3 UCILogger
2
Opposite of Police Plaza Concord.
Cased inside ventilated Particle
board box and tied to the branch of
shrub, 1.8m above a grass-covered
ground surface under the shade of
tree, at the edge of the water of
HatirJheel Lake.
Latitude
23.772448
Longitude
90.415489
Start
8:35 am
Finish
5:50 pm
4 UCILogger
2_Extech
Thermo
anemometer
Opposite of police plaza Concord.
Hand Held_1.2m above a grass-
covered ground surface under the
shade of tree, at the edge of the
water of HatirJheel Lake.
Latitude
23.772448
Longitude
90.415489
Start
8:50 am
Finish
5:50pm

158
Sl Logger
Name
Location and Physical
Characteristics of location
Location
Photo
Geographic
al Co-
ordinate
Duratio
n of the
Data
Loggin
g
5 UCILogger
3
Gulshan 1 park, opposite of shooting
club. Cased inside ventilated Particle
board box and tied to the branch of
shrub, 1.5m above a partly grass-
covered ground surface under the
shade of tree, 190m (155m towards
east) away from the edge of the
water on southern direction
Latitude
23.774313
Longitude
90.415876
Start
7:50 am
Finish5:
50 pm
6 UCILogger
4
Junction between road 2 & 4. Cased
inside ventilated Particle board box
and tied to the trunk of the tree,
1.5m above the paved surface,
approx. 425m (105m towards NW)
away from the edge of the water in
the southern direction and 110 m
from the lake edge in the western
direction.
Latitude
23.776312
Longitude
90.414983
Start
9:06 am
Finish
5:50 pm
7 UCILogger
6
Junction between road 2 & 6. Cased
inside ventilated Particle board box
and tied to the trunk of the tree,
1.5m above the paved surface,
approx. 550m (164m towards NW)
away from the edge of the water in
the southern direction
Latitude
23.777164
Longitude
90.415349
Start
9:17 am
Finish5:
50 pm
8 UCILogger
7
Junction between road 8 & 2. Cased
inside ventilated Particle board box
and tied to the trunk of the tree,
1.5m above the paved surface,
approx. 660m (243m towards NW)
away from the edge of the water in
the southern direction
Latitude
23.777975
Longitude
90.415434
Start
9:25 am
Finish5:
50 pm
9 UCILogger
8
Gulshan-1 park, police plaza
complex corner. Cased inside
ventilated Particle board box and
tied to the branch of shrub, 1.5m
above a partly grass-covered ground
surface under the shade of tree,
approximately 120m away from the
edge of the water in southern
direction
Latitude
23.773342
Longitude
90.415418
Start
9:45 am
Finish5:
50 pm
10 UCILogger
8_Davis
Gulshan-1 park, police plaza
complex corner. 2m above a partly
grass-covered ground surface under
the shade of a tree, approximately
120m away from the edge of the
water in the southern direction
Latitude
23.773342
Longitude
90.415418
Start
11:30
am
Finish
5:50 pm

159
5.2.5 Climatic variables measured
Air Temperature (Ta), Relative Humidity (RH) and wind speed (ws) inside and
around the selected Urban Wetlands had been measured at selected Urban Stations
(Data logging points) by continuous data logging using Fixed data logger.
5.2.6 Instruments
The instruments used for data collections are EL-USB-2-LCD Temp & RH
Data Logger of Lascar Electronics, Extech 445713: Big Digit Indoor/Outdoor
Hygro-Thermometer and Extech AN400 Rotating Cup Thermo-Anemometer. All
the measurements were done at pedestrian level in between a height of 1.5m-2m.
During the first two measurements in both the study area, the Lascar instruments
were Bamboo tripod mounted in a partly grass-covered ground or paved surface
under the shade of a tree. In The second two measurements, Lascar instruments
were Ventilated Box mounted under the shade of a tree. In case of both the wetland
all the data logging stations were selected on the downwind side of the wetland
except Dhanmondi lake, where one station is chosen on the upwind side. Detail
specification of the instruments are on the appendix 2.
5.3 Results from The Urban Station
All the related data from the field measurement are given in the Appendices
D, E and F.
5.3.1 Reference measurement at Bangladesh Meteorological Department
As stated earlier one data logger was placed inside the Stevenson screen of
the Bangladesh Meteorological department’s (BMD) measurement site at
Agargaon together with the BMD’s instrument. The duration of the measurement
was from 11:00 am 12 December 2016 to 11:00 am 14 December 2016. The air
temperature and relative humidity data from 6:00 pm 12 December to 6:00 am 14
December 2016 of this urban station were analyzed. For the correlational analysis
the data was divided into three chunks, first one was 6:00 pm 12 December to 6:00
am 13 December 2016 (Night), the second one was 6:00 am 13 December to 6:00
pm 13 December 2016 (day) and the third one was 6:00 pm 13 December to 6:00
am 14 December 2016 (Night).
The Air temperature and relative humidity showed a typical diurnal
pattern (Figure 5.7). At the beginning of the day, air temperature started to rise
with a pick in between 13:00 pm to 15:30 pm than started to decline again. Relative
Humidity shows the opposite trend with highest at the beginning of the day and
continues to decline as the day progress with the lowest in between 13:00 pm to
15:30 pm than started to rise again. Air temperature continues to decline after the
sunset throughout the night with the lowest in between 05:33 am to 07:15 am.
Again, relative Humidity showed the opposite trend which continued rising after
sunset throughout the night with the highest in between 05:34 am to 07:15 am.

160
Figure 5.7: Air Temperature and Relative Humidity measurement at Bangladesh Meteorological
Urban Station (BMD)

161
Table 5.8: Correlation coefficient of Air temperature and Relative humidity at the Bangladesh
Meteorological Department urban station
Variables 6:00 pm 12
December to 6:00
am (Night)
6:00 am 13 December
to 6:00 pm 13
December 2016 (Day)
6:00 pm 13 December to 6:00
am 14 December 2016
(Night)
Air
Temperature
(Ta)
-0.9917444 0.7866812 -0.9848626
Relative
Humidity (RH)
0.9834432 -0.8062279 0.9341942
The correlation analysis had been done separately by dividing the data into
the day (6:00 am to 6:00 pm) and night (6:00 pm to 6:00 am) part (table 7-8). Both
the air temperature and relative humidity had shown strong correlation with
cumulative time, but the correlation is opposite for air temperature and relative
humidity. At the day air temperature showed strong positive correlation with
cumulative time and relative humidity showed strong negative correlation with
cumulative time. At the night the phenomenon changed to opposite where air
temperature showed an almost negative linear relationship with cumulative time
and relative humidity showed an almost positive linear relationship with
cumulative time. The positive correlation of air temperature with cumulative time
indicates heat gain from solar radiation whereas the negative correlation of air
temperature with cumulative time indicates heat loss through longwave radiation
to the sky and advection through wind flow.
When considered as a continuous independent variable rather than a
categorical value Time has a cumulative effect throughout the day and night on
dependent variables like Air Temperature and Relative Humidity(RH) in terms of
solar influx. The strong positive correlational value in between cumulative time
and air temperature showed that the rate of change in the solar influx is always
positive during the daytime. Although the rate of solar influx varies throughout the
day. At the beginning of the day, the solar influx started to increase as the sunrises
which continue till afternoon. After that solar influx started to decrease towards
zero at the sunset. The overall rate of change of solar influx throughout the day is
positive. At night with the absence of sun, there is no solar influx and urban rate
of heat loss from the urban fabric is constant till the sunrise.
5.3.2 Calibration of the instrument
One of the objective to place an automatic air temperature and relative
humidity data logger used in this study, with the instrument of Bangladesh
meteorological department (BMD) for 3 days of measurement was to calibrate the
instrument. Figure 5.8 presents the results of the calibration data. The air
temperature data collected by the instrument exactly matches the reading from the
instrument of BMD. In case of relative humidity (RH) during the time of maximum
humidity spell both the reading from the UCIL8 and BMD instrument almost same.

162
As the RH goes down BMD reading for RH always stays less than UCIL8 and the
difference is maximum at the lowest RH spell, which is as high as 24.5 percentage
point.
Figure 5.8: Calibration of the instrument
5.3.3 Dhanmondi Lake temperature
On 21st October 2016 during the maximum hot spell of the day (figure 5.9)
which is at 3:25 pm UCILogger4 showed the maximum temperature of 35.5C as
it is in a road perpendicular to the wind direction from the lake. Among the urban
stations placed in the road parallel to the wind direction UCILogger6 showed the
highest temperature of 34.0C as it was located further away from the lake edge.
But being the furthest station in the wind corridor UCILogger7 was showing
significantly lower temperature 32.5C. Because this station was receiving
unhindered wind flow from the lake due to wide and unobstructed road whereas
wind flow to UCILoggere6 is reduced by trees, small road width and other small
man-made structure. The maximum temperature of the urban station at the island
UCILogger1 was 32.9C, which was almost equal to UCILogger7. In general,
UCILogger4 showed greater temperature throughout the day.
Form table 5.9 urban station UCIL1 which was on the island showed the
strongest correlation in between air temperature and cumulative time. Urban
stations UCIL7 showed the least correlation followed by Urban stations UCIL2
with second lowest correlational value, which indicates less heat gain in this two
points or heat was being advected away. Overall all the urban stations showed a
positive correlation between air temperature and cumulative time.
36
46
56
66
76
86
15
17
19
21
23
25
27
29
RE
LA
TIV
E H
UM
IDIT
Y(%
)
TE
MP
ER
AT
UR
EC
TIME OF THE DAY
CALIBRATION OF THE INSTRUMENT
BMD_T (degC) UCIL8_T (degC) BMD_RH (%) UCIL8_RH(%)

163
Table 5.9: correlation coefficient between air temperature and cumulative time of the urban stations of
Dhanmondi lake on 21 October 2016
Urban stations correlation coefficient
UCIL1(°C) 0.7287369
UCIL2(°C) 0.3943478
UCIL4(°C) 0.5682237
UCIL6(°C) 0.7629839
UCIL7(°C) 0.06319901
Figure 5.10 showing the temperature of the urban stations during
measurement campaign on 27th January 2017. Urban stations UCILogger9 located
on an island with no riparian shading inside the lake showing maximum
temperature throughout the day. Due to the sky became cloudy from 11:00 am
onwards on this measurement day the temperature difference between the different
urban stations reduced with respect to previous measurement day. Even though
urban station UCIL9 located in the island middle of the lake had shown a higher
temperature than the other station throughout the day.
Form table 5.10 urban station UCIL9 which is on the island is showing the
strongest correlation in between air temperature and cumulative time. But one
important thing to observe is that the correlation between air temperature and
cumulative time has been significantly changed due to the cloudy sky. The value
decreased in case of Urban station UCIL4, 6 and increased in case of UCIL7. Some
urban stations UCIL2,3,5 and 8 showed negative correlation, which means the state
of heat loss due to the absence of sun.
Table 5.10: correlation coefficient between air temperature and cumulative time of the urban stations
of Dhanmondi lake on 27 January 2017
urban stations correlation coefficient
UCIL1(°C) 0.3637763
UCIL2(°C) -0.7791296
UCIL3(°C) -0.259729
UCIL4(°C) 0.4463227
UCIL5_Hh(°C) -0.02484631
UCIL6(°C) 0.4421808
UCIL7(°C) 0.3723458
UCIL8(°C) -0.7303561
UCIL9_Hh(°C) 0.4710534

164
Fig
ure
5.9
: A
ir T
emp
erat
ure
at
Dh
anm
on
di
lak
e U
rban
sta
tio
ns
on
21
Oct
ob
er 2
01
6

165
Fig
ure
5.1
0:
Air
Tem
per
atu
re a
t D
han
mo
nd
i la
ke
Urb
an s
tati
on
s o
n 2
7 J
anu
ary 2
017

166
Figure 5.11 is showing the temperature of the urban stations during
measurement campaign on 24th February 2017. On this day, during the maximum
hot spell of the day which was in between 3:35 pm to 4:20 pm UCILogger4 showed
the maximum temperature of 30.5C as it is in a road perpendicular to the wind
direction from the lake. Urban station UCILogger2 showed lower temperature
throughout the day. Among the urban stations placed in the road parallel to the
wind direction UCILogger7 and 8 exhibited the higher temperature of 28.5C as
they were located further away from the lake edge. The maximum temperature of
the urban station at the island UCILogger1 is 29C which is 0.5C more than
UCILogger7. In general, UCILogger4 showed greater temperature throughout the
day.
The correlation analysis in (table 5.11 and fig. 5.12) between air
temperature and cumulative time throughout the day, shows heat gain with time
for all the urban station. It is important to note that urban station at the small island
and water edge was on the higher side in terms of heat gain.
Table 5.11: correlation coefficient between air temperature and cumulative time of the urban stations
of Dhanmondi lake on 24th February 2017
Urban Stations Distance from the water edge Correlation coefficient
UCIL1(°C) 0, middle 0.8550726
UCIL2(°C) 0, edge 0.8893085
UCIL3(°C) 80m 0.8769852
UCIL4(°C) 420m 0.873383
UCIL6(°C) 157m 0.7462933
UCIL7(°C) 230m 0.8052079
UCIL8(°C) 206m 0.695779

167
Fig
ure
5.1
1:
Air
Tem
per
atu
re a
t D
han
mo
nd
i la
ke
Urb
an s
tati
on
s o
n 2
4 F
ebru
ary 2
01
7

168
Fig
ure
5.1
2:
Co
rrel
atio
n b
etw
een
Air
Tem
per
atu
re &
cu
mu
lati
ve
Tim
e at
Dh
anm
on
di
lak
e U
rban
sta
tio
ns
on
24
Feb
ruar
y
20
17

169
5.3.4 Dhanmondi Lake relative humidity
On this measurement day of 21st October (fig. 5.13), 2016 the minimum
humidity was observed throughout the day at the Urban station UCILogger1 at the
island inside the lake, which was contrary to the current assumption that humidity
near and over the lake should be maximum. The maximum humidity observed
throughout the day are at the urban station UCILogger6 and 7. The urban station
at UCILogger4 showed relatively less humidity than UCILogger6 and 7.
The correlation calculated from the observation on 21 October 2016
between cumulative time and observed relative humidity (RH) (Table 5.12)
indicates negative correlation which is consistent with the reference observation
made at BMD site. This negative correlation indicates the positive rate of change
in the solar influx throughout the day which is opposite to the air temperature. For
a particular point in the UCL the more the heat gains due to the solar radiation the
less will be the RH. But this positive solar gain could be affected by other factors
such as advection and shading from trees or built fabric, which is evident from the
observation. From the correlation coefficient, it is evident that the highest solar
gain is at the Urban station UCIL1, 4 & 6. The least solar heat gain is on the urban
station UCIL7.
Table 5.12: correlation coefficient between Relative Humidity and cumulative time of the urban
stations of Dhanmondi lake on 21 October 2016
Urban stations correlation coefficient
UCIL1(%rh) -0.5848008
UCIL2(%rh) -0.3303872
UCIL4(%rh) -0.5752285
UCIL6(%rh) -0.6392395
UCIL7(%rh) -0.08758491
Figure 5.14 showing the Relative Humidity (RH) of the urban stations
during measurement campaign on 27th January 2017. As the sky becomes overcast
from 11:00 am onwards the Relative Humidity (RH) measurement shows little
difference. The correlation coefficient in between cumulative time and RH
calculated from the observation made on 27 January 2017 is presented in table
5.13. The result in table 5.13 clearly indicates the heat loss due to the absence of
solar influx as the sky became overcast. Usually, at the daytime, the RH is
negatively correlated with the cumulative time due to solar influx although
variable. But as the sun disappears behind the cloud direct solar gain stops
immediately and net radiative loss increase immediately, which is the case in all
the urban stations except UCIL4 and 6. UCIL4 and 6 were deep in the fabric and
devoid of airflow from the lake. But due to heat storage by the fabric they were
still gaining heat although much slower rate than before.

170
Fig
ure
5.1
3:
Rel
ativ
e H
um
idit
y a
t D
han
mo
nd
i la
ke
Urb
an s
tati
on
s o
n 2
1 O
cto
ber
20
16

171
Fig
ure
5.1
4:
Rel
ativ
e H
um
idit
y a
t D
han
mo
nd
i la
ke
Urb
an s
tati
on
s o
n 2
7 J
anu
ary
20
17

172
Table 5.13: correlation coefficient between Relative Humidity and cumulative time of the urban
stations of Dhanmondi lake on 27 January 2017
urban stations correlation coefficient
UCIL1(%rh) 0.06428339
UCIL2(%rh) 0.7835108
UCIL3(%rh) 0.2770792
UCIL4(%rh) -0.1739092
UCIL6(%rh) -0.2526658
UCIL7(%rh) 0.1213577
UCIL8(%rh) 0.6251589
The observations at the urban stations made on 24 February 2017 are
presented in fig.5.15 & 16. In the all the urban station relative humidity stays in its
highest value at the starting of the day which decreased as the day progress. The
rate of decrease ceased out in the late afternoon approximately around 03:00 pm.
After 04:00 pm it started slow increase till the sunset. The lowest humidity
observed is 30.5 % at 3:50 pm at the urban station 4 which is the furthest inside
the urban fabric.
From the correlation coefficient calculated from the 24 February 2014
(Table 5.14) observation of the urban stations, all the urban stations are showing a
negative correlation with humidity change with cumulative time. This indicates
heat gain due to solar influx throughout the day and thus the drop in RH. Maximum
heat gain and thus increased rate of RH drop identified at the Urban stations UCIL4
deep in the urban fabric. The second highest rate of RH drop was observed at the
island urban station UCIL1. The UCIL 6, 7 and 8 are showing comparatively less
RH drop as they were getting moist air directly from the lake and the RH drop
increased with the distance.
Table 5.14: correlation coefficient between Relative Humidity and cumulative time of the urban
stations of Dhanmondi lake on 24th February 2017
Urban Stations Distance from the water edge Correlation coefficient
UCIL1(%rh) 0, middle -0.7073007
UCIL2(%rh) 0, edge -0.5923311
UCIL3(%rh) 80m -0.5166587
UCIL4(%rh) 420m -0.7891712
UCIL6(%rh) 157m -0.2328342
UCIL7(%rh) 230m -0.6613266
UCIL8(%rh) 206m -0.4341711

173
Fig
ure
5.1
5:
Rel
ativ
e H
um
idit
y a
t D
han
mo
nd
i la
ke
Urb
an s
tati
on
s o
n 2
4 F
ebru
ary 2
017

174
Fig
ure
5.1
6:
Corr
elat
ion
bet
wee
n R
elat
ive
Hu
mid
ity
& c
um
ula
tiv
e T
ime
at D
han
mo
nd
i la
ke
Urb
an s
tati
on
s o
n 2
4 F
ebru
ary 2
01
7

175
5.3.5 Hatirjheel Lake temperature
The observation result (figure 5.17) on 11 November 2016 at the Hatirjheel
lake Urban stations demonstrated one of the advective effect named “Oasis effect”
in an urban area due to the presence of an urban park. The trees in the park reduced
solar gain through shading and evapotranspiration. Otherwise, Hatirjheel lake area
is mostly devoid of significantly large trees for evapotranspiration and shading at
UCL. The Urban station UCIL2 located at the edge of the park on the downwind
side showed overall lower temperature than the others. The urban station UCIL1
showed higher temperature with some unusual high peak due to the location was
on the top of the water of the lake on a bridge without any shading. Also, the
passing vehicle was also contributing to sudden peak in temperature. But overall
UCIL1 is showing higher temperature. Although being inside the fabric and
without significant tree shading UCIL8 showed comparatively lower temperature
due to the canyon shading at the UCL.
The correlation analysis (Table 5.15) in between cumulative time and air
temperature for all the urban stations on 11 November 2016 showed moderately
positive correlation except for the urban station UCIL8. Being the furthest from
the water edge its showed almost zero correlation which indicates neither heat gain
nor heat loss. One reason is that due to its location on an Urban canopy of the
north-south elongated road at this time of the year, it stays mostly in shade
throughout the day. The urban stations in the middle of the lake and water edge
showed moderate correlation, which indicates solar gain throughout the day.
Table 5.15: correlation coefficient between air temperature and cumulative time of the urban stations
of Hatirjheel lake on 11th November 2016
Urban Statins Distance from the water edge correlation coefficient
UCIL1(°C) 0m, middle 0.560289187
UCIL2(°C) 190m, park 0.546136277
UCIL6(°C) 0m, edge 0.52784335
UCIL7(°C) 100m 0.386346895
UCIL8(°C) 425m -0.035748094
On 13 December 2016 (fig 5.18), one of the urban station UCIL8 was at
the Bangladesh meteorological department site with their instrument. This was
done to consider it as a reference point and also for calibration purpose. Among
the four Urban stations at Hatirjheel lake area three stations UCIL1,6 & 7 are
hanged from a bridge in the middle of the lake at a different level from the top of
the water surface. UCIL2 was placed at the edge of the park like before on the
downwind side of the park. At the urban stations at Hatirjheel lake area, UCIL2
showed maximum temperature during the hottest spell of the day. The urban
stations in the middle of the water behaved in a similar manner.

176
Fig
ure
5.1
7:
Tem
per
atu
re a
t H
atir
jhee
l la
ke
Urb
an s
tati
on
s o
n 1
1 N
ov
emb
er 2
01
6

177
Fig
ure
5.1
8:
Tem
per
atu
re a
t H
atir
jhee
l la
ke
Urb
an s
tati
on
s o
n 1
3 D
ecem
ber
20
16

178
The correlation analysis (table 5.16) from the data of 13 December 2016
showed a strong relationship between cumulative time and air temperature in case
of the two urban stations nearest to the top of the surface of the lake water which
indicates positive solar gain. The urban stations at the park also showing positive
solar gain although less the former two.
Table 5.16: correlation coefficient between air temperature and cumulative time of the urban stations
of Hatirjheel lake on 13th December 2016
Urban stations correlation coefficient
UCIL1(°C) 0.648584
UCIL2(°C) 0.7980454
UCIL6(°C) 0.9158919
UCIL7(°C) 0.9083694
UCIL8(°C) 0.7867869
The air temperature data from the observation of the urban stations at
Hatirjheel lake on 10 February 2017 are presented in figure 5.19. The minimum
temperature at the time of hot spell was 27.5 C at the urban station UCIL6 and the
maximum were 30C at the urban station UCIL7. Urban station UCIL1 in the
middle of the lake hanging on the top of water showed a consistent increase in air
temperature although the temperature stayed below the urban station on the land
inside the urban fabric till afternoon. But it didn’t decrease like the other urban
station on the land inside the urban fabric in the late afternoon. Urban station
UCIL2 at the water edge also followed the pattern like UCIL1.
The correlational analysis of the air temperature data and cumulative time
of Hatirjheel Lake urban stations on 10 February 2017 are given at table 5.17. The
urban stations on the top of the water UCIL1 and at the edge of the water UCIL2
showing a strongest positive correlation of air temperature with cumulative time,
which means strong heat gain throughout the day due to the solar influx. This could
be explained by the heat capacity of the water which is larger than the land and air
temperature near the water surface are regulated by the temperature of the water
surface. Water can contain large amount of heat and it has very low albedo. So,
with the beginning of the day, it absorbs heat without increasing the temperature
quickly like the urban hard surface. But in the late afternoon when urban hard
surface started losing heat and thus decrease its temperature water surface doesn’t
exhibit temperature decrease so quickly. It stays relatively warmer till late in the
evening than the land, so does the air layer near the water surface. That’s why air
temperature at the urban station1 and 2 are strongly positively correlated with
cumulative time which indicates strong solar gain. The two urban stations at the
middle and edge of the urban park UCIL8 & 3 also exhibited strong positive
correlation between air temperature and cumulative time and thus indicated strong
heat gain due to the solar influx.

179
Fig
ure
5.1
9:
Tem
per
atu
re a
t H
atir
jhee
l la
ke
Urb
an s
tati
on
s o
n 1
0 F
ebru
ary 2
017

180
The other three urban station inside the urban fabric UCIL4, 6 and 7
exhibited moderate positive correlation and thus indicated moderate heat gain due
to the solar influx. Among these urban stations heat gain increased with their
distance from the water edge.
Table 5.17: correlation coefficient between air temperature and cumulative time of the urban stations
of Hatirjheel lake on 10th February 2017
Urban Stations Distance from the water edge correlation coefficient
UCIL1(°C) 0m 0.9234208
UCIL2(°C) 0m water Edge 0.8790585
UCIL8(°C) 120m, middle of the park 0.7683875
UCIL3(°C) 190m, edge of the park 0.8194174
UCIL4(°C) 425m 0.5792301
UCIL6(°C) 550m 0.5944549
UCIL7(°C) 660m 0.6755592
5.3.6 Hatirjheel Lake relative humidity
From the Relative Humidity (RH) data (figure 5.20) of the measurement at
Urban stations at Hatirjheel lake on 11 November 2016, the overall lowest RH was
observed at urban station UCIL1 throughout the day. Overall higher RH was
observed by the UCIL2 located at the edge of the urban park on downwind side.
Urban station UCIL6 at the water edge also showed overall lower RH throughout
the day.
The correlation analysis (table 5.18) between RH and the cumulative time
of the data from the urban stations at Hatirjheel lake on 11 November 2016 showed
the urban stations at the water edge, top of the water and the park were negatively
correlated with the correlation strength is moderate. The other two stations in the
urban fabric are also showing a negative correlation. UCIL8 showed the least
negative correlation for RH which indicates least heat gain throughout the day.
Table 5.18: correlation coefficient between Relative Humidity and cumulative time of the urban
stations of Hatirjheel lake on 11th November 2016
Urban Statins correlation coefficient
UCIL1(%rh) -0.4922671
UCIL2(%rh) -0.5230172
UCIL6(%rh) -0.4645949
UCIL7(%rh) -0.3971748
UCIL8(%rh) -0.1057552
Figure 5.21 showing the Relative humidity data from the urban stations at
Hatirjheel lake on 13 December 2016. Overall the topmost Urban stations on the
top of the water surface showed low relative humidity throughout the day

181
Fig
ure
5.2
0:
Rel
ativ
e H
um
idit
y a
t H
atir
jhee
l la
ke
Urb
an s
tati
on
s o
n 1
1 N
ov
emb
er 2
01
6

182
Fig
ure
5.2
1:
Rel
ativ
e H
um
idit
y a
t H
atir
jhee
l la
ke
Urb
an s
tati
on
s o
n 1
3 D
ecem
ber
20
16

183
The correlational analysis (Table 5.19) in between cumulative time and
Relative humidity data from the urban stations at Hatirjheel lake on 13 December
2016 showed negative correlation throughout the day for all the stations, which is
in correspondence with the reference urban station at BMD site. The negative
correlation is strong at the urban stations nearer to water surface UCIL6 and 7. The
urban station at the edge of park UCIL2 is also showing strong negative correlation
which indicates strong positive heat gain by air due to solar influx throughout the
day.
Table 5.19: correlation coefficient between Relative Humidity and cumulative time of the urban
stations of Hatirjheel lake on 13th December 2016
Urban stations correlation coefficient
UCIL1(%rh) -0.5896493
UCIL2(%rh) -0.8396173
UCIL6(%rh) -0.8576293
UCIL7(%rh) -0.848607
UCIL8(%rh) -0.8210089
Figure 5.22 showing the relative humidity data from the urban stations at
Hatirjheel lake on 10 February 2017. Overall all the urban stations showed a
decline of relative humidity as the day progress which flattens from the afternoon
to late afternoon. Relative humidity again continued to increase slowly in the late
afternoon. Urban station UCIL2 at the edge of water surface started showing lower
relative humidity than the other stations starting from the afternoon till sunset. The
humidity at the urban station UCIL1 on top of the water surface declined relative
to other urban stations on the ground from afternoon till sunset.
The correlational analysis (Table 5.20) between cumulative time and
relative humidity data of the urban stations of Hatirjheel lake on 10 February 2017
are presented in table 5.20 indicates overall negative correlation at all urban
stations. This correlational analysis clearly showed the strongest negative
correlation between cumulative time and relative humidity at the urban station on
top of the water UCIL1 and at the water edge UCIL2, which indicates a decrease
in relative humidity due to the high heat gain of water due to solar influx
throughout the day. The urban stations at the middle of park UCIL8 and at the edge
of the park UCIL3 also showed strong negative correlation. The other three urban
stations inside the urban fabric UCIL4,6 &7 also showed strong negative
correlation although to some lesser extent than the previous four stations at the top
of the water and at the park near the water edge.

184
Fig
ure
5.2
2:
Rel
ativ
e H
um
idit
y a
t H
atir
jhee
l la
ke
Urb
an s
tati
on
s o
n 1
0 F
ebru
ary
20
17

185
Table 5.20: correlation coefficient between Relative Humidity and cumulative time of the urban
stations of Hatirjheel lake on 10th February 2017
Urban Stations
Distance from the water
edge correlation coefficient
UCIL1(%rh) 0m -0.9025281
UCIL2(%rh) 0m water Edge -0.9010745
UCIL8(%rh) 120m, middle of the park -0.8260548
UCIL3(%rh) 190m, edge of the park -0.8866804
UCIL4(%rh) 425m -0.7792143
UCIL6(%rh) 550m -0.7394349
UCIL7(%rh) 660m -0.7949549
5.4 Determining Morphology of Urban Cooling Island from Field Measurement
Several important observations could be made from the analyzed field
measurement data obtained from the selected urban stations on both the wetland in
the previous section.
5.4.1 Effect of cumulative time on the rate of change of air temperature
and relative humidity
The study shows that Time if considered as an increasing quantity rather
than a categorical value, has a cumulative effect on the rate of change of air
temperature and relative humidity in terms of solar influx. At the night due to the
absence of solar influx air temperature has an almost negative linear relationship
with cumulative time and relative humidity (RH) has an almost positive linear
relationship with cumulative time. During the day with the presence of solar influx,
although variable, the time cumulative effect is reversed. At day air temperature
has a strong positive correlation with cumulative time and Relative Humidity has
a strong negative correlation with cumulative time.
5.4.2 Effect of riparian shading on the cumulative time effect
In case of urban wetland devoid of riparian shading, the cumulative effect
of time is strongest at the top and near the edge of the wetland, which is evident
from the analysis of the field data measured at Hatirjheel lake urban stations. In
case of Dhanmondi lake area cumulative effect of time relatively lower than that
of Hatirjheel lake area.
5.4.3 Influence of the distance from the edge of the wetland on temperature
Air temperature drops in those urban stations which are located on the road
parallel to the wind flow from the wetland and the wind flow are not obstructed by
the built from or natural feature. This effect is more pronounced in case of
Dhanmondi lake then Hatirjheel lake. The temperature on the urban station
increases with distance from the lake edge. The urban station located on the road
perpendicular to the prevailing wind direction from the lake exhibits higher
temperature.

186
5.4.4 Effect of the location of the park on temperature
The existence of urban park creates “oasis effect” by moderating
temperature and increasing humidity, which is the case in Hatirjheel Lake area.
Hatirjheel lake is mostly devoid of large vegetation on its surrounding. But the
existence of the urban park creates a small “oasis effect”.
5.4.5 Effect of shading in the urban canyon
Urban stations which are located in the urban canyon shaded most of the
time by canyon itself showed decreased temperature.
5.4.6 Humidity and distance from the lake edge
Relative humidity (RH) near the edge of the water and over the water is
lower than the park and vegetated area, which is consistent with the findings of
Geiger R. (2009).
5.4.7 Evaporative cooling potential
Another important observation is, with the progress of the day relative
humidity decreases which dip significantly from the mid-day to late afternoon.
This phenomenon of the relative humidity increases the evaporative cooling
potential.

187
5.5 References
1. Brammer H. (2012). “The physical geography of Bangladesh”. First edition, The
University press limited, Dhaka.
2. Geiger R., Aron R.H., Todhunter P. (March 16, 2009). “The Climate Near the Ground”. Rowman & Littlefield Publishers; 7th edition.
3. Oke T.R. “Boundary Layer Climates” (January 30, 1988). Routledge; 2nd edition
4. Oke, T.R. 2006. “Initial Guidance to Obtain Representative Meteorological Observations at Urban Site”. World Meteorological Organization, Instruments and Observing Methods, IOM Report No. 81, WMO/TD-No. 1250 Available from:
http://www.wmo.int/web/www/IMOP/publications-IOM-series.html

188
Chapter 6 : SIMULATION AND MODELING
6.1 Introduction
The main objective of the simulation work was to determine the
morphological characteristics of the Urban Cooling Island (UCI) at Urban Canopy
Layer (UCL). The principal assumption which has been tested in the simulation
model is that the water in the wetland will be cooled down with the help of
continuous riparian shading to act as UCI, this cooling effect will then be
transferred to the urban fabric through the advective process. For this reason, the
simulation work was conducted in one of the study area described in the previous
section at the Urban Canopy Layer (UCL) recording the result at a height of 1.5m
to 2m from the ground. Some measurements were also recorded on top of the water
surface and edge of the lake to determine the effect of water on the air layer above
it.
6.2 Preparation of The Model
6.2.1 Location of the modeling area
An area (approx. 750m length) adjacent to the Dhanmondi Lake bounded
by road 12A on North-west, Satmasjid road on South-west and road 6A on the
south-east was selected for the simulation study as all the data logger except one
in one occasion, were placed in this zone to collect microclimatic data.
6.2.2 Morphology of the modeling the area
Due to the limited computational power of the computer available for
simulation study, this area was scaled down at a scale of 1: 50. Data obtained from
the field measurement of this wetlands were used as an initial condition into the
COMSOL–Multiphysics software as a part of problem modeling study. Water and
Air temperature, Relative humidity and Wind speed are primary inputs for the
simulation besides types of ground cover and the built form. Although all the
buildings in each block are the detached type, the gaps between the buildings in
most of the case, is not more than 2 m. So, for the simplicity of the model, all the
buildings in a single block were safely considered as a single building mass.
Average building height of the area approximately 24 m. Also, only the part of the
lake in the line of prevailing wind direction was modeled. One of the days of field
measurement in this area, 24 Feb 2017 was used for the position of the sun in the
simulation model. The simulation time was fixed from 9 AM to 16:00 PM on that
day. The whole simulation study was conducted for four cases depicting four types
of ambient condition:
i. Case 1: First simulation study was conducted with the water of the lake
completely under solar radiation and inlet temperature equal to maximum
temperature of the day obtained from the field measurement.

189
ii. Case 2: Second simulation study was conducted with the water of the lake
completely under solar radiation and inlet temperature equal to minimum
temperature of the day obtained from the field measurement.
iii. Case 3: Third simulation study was conducted with the water body
completely shaded from solar radiation and inlet temperature equal to
maximum temperature of the day obtained from the field measurement.
iv. Case 4: Fourth simulation study was conducted with the water body
completely shaded from solar radiation and inlet temperature equal to
minimum temperature of the day obtained from the field measurement.
In all the four cases relative humidity(RH), which is equal to starting RH
at 9:00 am was obtained from the field measurement on 24 Feb 2017.
6.2.3 Computational domain
Only the bottom of the computational domain represents an actual physical
boundary. The side faces and top of the model are non-physical boundaries. These
non-physical boundaries should be located far enough from the urban model to
avoid too strong artificial acceleration of the flow. This artificial acceleration
happens due to too strong contraction of the flow by these boundaries. There are
three types of guidelines have been established to determine the size of the
computational domain. (Franke, J. et al. 2004). They are
Type-1: guidelines that impose minimum distances between the urban or building
model and the boundaries of the domain;
Type-2: guidelines that impose a maximum allowed blockage ratio; and
Type-3: guidelines that are a combination of Types 1 and 2.
The blockage ratio is defined as in wind-tunnel testing: it is the ratio of the
projected frontal (windward) area of the obstacles to the cross-section of the
computational domain [Fig.6.1(e)] and in CFD it is generally required to be less
than 3%.

190
Figure 6.1: Computational Domain (Blocken B., 2007)
Figure 6.1 illustrates (c) Type 1 guidelines by Franke et al for the size of
computational domain (d) View in streamwise direction of building models in
computational domain and definition of blockage ratio. (e) Low-rise wide building
in a computational domain that satisfies existing best practice guidelines but that
will give rise to artificial acceleration on lateral sides. (f) Same building in a
computational domain defined based on the new concept of directional blockage
ratio.
6.2.4 Computational grid (mesh)
High-quality computational grids are important to reduce discretization
errors besides allowing convergence of the iterative process with the minimum
required second-order discretization schemes. Blocken B. (2015) described two
characteristics of the high-quality computational grid. They are:
1.Sufficient overall grid resolution
2. Quality of the computational cells in terms of shape (including skewness)
orientation and stretching ratio.
For urban and building model Franke et al (2007) suggested to use at least
10 cells per cube root of the building volume, and 10 cells in between every two
buildings. For studies of pedestrian-level wind speed, the focus height of the 1.5-
2m should coincide with the 3rd and 4th cell above ground level. Computational
grid of control domain is given in figure 6.2.

191
Figure 6.2: computational grid of control domain
Form figure 6.3 computational grid of the model with its different area could be seen.

192
Figure 6.3: computational grid of the model

193
6.2.5 Roughness parameters
Hargreaves (2006) stated that there are two aspects of the real flow situation
that are not amenable to direct representation in the CFD and that must, therefore,
be modeled in some way. Firstly, “the atmospheric boundary layer (ABL) extends
for a considerable distance above the earth’s surface relative to the average
building height: a CFD model can only represent a smaller, finite distance because
of hardware limitations and the complexity of including a meteorological model”.
Secondly, smaller-scale features such as vegetation and small buildings cannot be
included in the computational grid and are therefore represented by a roughness
model. He further stated that most of the modeling irrespective of modeling
process have been conducted with buildings embedded in a neutral ABL because
buoyancy-induced turbulence need not be modeled.
Roughness parameters had been specified for five spatial areas inside the
computational domain as suggested by blocken (2015). Area one is upstream of
the computational domain. Area two is the area inside the computational domain
and upstream of the explicitly modeled building. Area three inside the
computational domain representing the ground surface amidst the explicitly
modeled buildings and other obstacles. Area four is the surface of the explicitly
modeled buildings (façade, roofs) and structures inside the computational domain.
Area five is the area inside the computational domain and downstream of the
explicitly modeled buildings. Also, two types of roughness specification had been
made (blocken,2015):
i. Aerodynamic roughness length z0: used for area one, two, three and five
ii. Equivalent sand-grain roughness length ks: used in area four
6.2.6 Discretization scheme
By default, “COMSOL uses second-order elements for most physics, the
two exceptions are problems involving chemical species transport and when
solving for a fluid flow field. (Since those types of problems are convection
dominated, the governing equations are better solved with first-order elements.)
Higher order elements are also available, but the default second-order elements
usually represent a good compromise between accuracy and computational
requirements”.
6.2.7 Simulation categories
Two main categories of equations used in CFD are steady RANS
(Reynolds-average Navier-Strokes) and Large Eddy Simulation (LES). In addition,
hybrid RANS/LES approaches are sometimes used. “The RANS equations are
derived by averaging the NS equations (time-averaging if the flow is statistically
steady or ensemble averaging for time-dependent flows). With the RANS
equations, only the mean flow is solved while all scales of the turbulence are

194
modelled (i.e. approximated). The averaging process generates additional
unknowns and as a result, the RANS equations do not form a closed set”
(COMSOL). Therefore, approximations must be made to achieve closure. These
approximations are called turbulence models. Up to now, RANS had been the most
commonly used approach in CFD for urban physics.
In the LES approach, the NS equations are filtered in space, which consists
of removing only the small turbulent eddies (that are smaller than the size of a filter
that is often taken as the mesh size). The large-scale motions of the flow are solved,
while the small-scale motions are modeled: “the filtering process generates
additional unknowns that must be modeled in order to obtain closure” (COMSOL).
This is done with a sub-filter turbulence model. LES generally shows superior
performance compared to RANS and URANS, because a large part of the unsteady
turbulent flow is actually resolved. However, the required computational resources
increase significantly, the inlet boundary condition requires time and space
resolved data and a larger amount of output data is generated.
6.2.8 Model definition
The modules of the COMSOL-Multiphysics that were combined to model the
Urban Cooling Island Effect of the urban wetland were (1) CFD module: Fluid
Flow-Single phase flow, Turbulent Flow, k-. (2) Heat Transfer Module: Heat
Transfer in Fluids and Heat Transfer with Surface to Surface Radiation (ht). (3)
Chemical Species Transport: Transport of Diluted species (tds)
i. Turbulent Flow:
The flow was modeled using Wilcox k- turbulence model. The main
reason for using the k- model over the k-ε model is that former is, in general,
more reliable when it comes to predicting the spreading rate of jets (Wilcox,1998).
The k-ω model uses wall functions which is quite all right in this case since all
walls are almost insulated and there would not be much benefit from using the
more expensive low-Re k-ε model.
Further, it is assumed that the velocity and pressure field is independent of
the air temperature and moisture content. This allows to calculate the flow field in
advance and then use it as input for the heat transfer and species transport equation.
Mathematical model of the k- by Wilcox has been given in the Appendix 1.
ii. Heat Transfer:
The primary source of heat in this model was the solar irradiation, which
was included using the External Radiation Source feature. This feature uses the
longitude, latitude, time zone, time of year, and time of day to compute the
direction of the incident solar radiation over the simulation time. Assuming no
cloud cover, the solar flux at the surface was about 1000 W/m2. “All of the ambient
surfaces of the model were included in the solar loading calculation, and

195
shadowing effects were included. The temperature of the sun is about 5800 K, and
it emits primarily short-wavelength infrared and visible light at wavelengths
shorter than 2.5 microns” (COMSOL). The fraction of this short-wavelength solar
radiation that is absorbed by the various materials is quantified by the solar
absorptivity. Because the surfaces are at a much lower temperature, they reradiate
in the long-wavelength infrared band, at wavelengths above 2.5 microns, and the
fraction of reradiated energy is quantified by the surface emissivity. “The solar and
ambient wavelength dependence of emissivity model was used to account for
differing emissivities in different wavelength bands” (COMSOL).
The heat transfer between the lake and land is due to conduction only. For
the air, convection dominates the heat transfer and the turbulent flow field is
required. The material properties were determined by the moist air theory. During
evaporation, latent heat was released from the water surface which cools down the
water in addition to convective and conductive cooling by the surrounding. This
means that the fraction of convective and diffusive flux normal to the water surface
contributes to the evaporative heat flux (Incropera F.P. et al, 2006).
−𝑛. (−𝓀∇𝑇) = 𝐻𝑣𝑎𝑝𝑛. (−𝐷∇𝑐 + 𝑢𝑐)
The latent heat of vaporization 𝐻𝑣𝑎𝑝 is given in kj/mol.
iii. Transport of water vapor:
To obtain the correct amount of water evaporated from the lake into the air,
the Transport of Diluted Species interface was used in the air domain. The initial
concentration was chosen to keep the initial relative humidity (RH) equal to the
RH at 9 am in the morning obtain from the field measurement. The source term for
water vapor at the water surface is given by the ideal gas law at saturation pressure
(Monteith J. et al, 2013):
𝑐𝑣𝑎𝑝 =𝑝𝑠𝑎𝑡
𝑅𝑔𝑇
The transport equation again uses the turbulent flow field as input.
Turbulent has been considered for the diffusion coefficient, by adding the
following turbulent diffusivity to the diffusion tensor:
𝐷𝑇 =𝑣𝑇
𝑆𝑐𝑇𝐼
Where 𝑣𝑇 is the turbulent kinematic viscosity, 𝑆𝑐𝑇 is the turbulent
Schmidt number and I the unit matrix.

196
6.2.9 Measurement points in the model
Two sets of measurement points had been taken in the model. The first set
of seven measurement points at the downwind side of the lake had been chosen to
keep similarity with the actual urban stations (data logging point) in the field
measurement around Dhanmondi lake area, started from over the water of the lake,
then edge of the lake gradually shifting deep inside the urban fabric. The second
set of twenty-two measurement points were taken starting from the land -lake
boundary at the upwind side of the lake to the land-lake boundary of the downwind
side of the lake. Most of those points in the second set are at equal distance along
the length of the lake. All those points are given in fig.6.4.
Figure 6.4: measurement points of the model
6.3 Simulation Results and Analysis
All the related data for the simulation results and analysis are given in the
appendix G.
6.3.1 Effect of cumulative time on the rate of change of air temperature
and relative humidity
when the time is considered as a continuous variable rather than the
categorical value we get the cumulative effect of time on the rate of change of air
temperature and relative humidity.
Case 1: In the first case water of the whole lake was under complete under
solar radiation with inlet temperature equals the maximum temperature of the day.
Temperature and Relative humidity(RH) data at the first set of seven points
extracted and correlation analysis done in the R-studio using R programming
language considering time as a continuous independent variable to see its
cumulative effect. (Table 6.1)

197
Table 6.1: Case 1 Correlation analysis of Air Temperature, Relative Humidity and Time
Measurement point Pearson's product-moment
correlation coefficient
for air temperature
Pearson's product-moment
correlation coefficient
for Relative Humidity
UCIL2 0.8956205 0.8866912
UCIL3 0.9110763 0.5179765
UCIL4 0.9209397 -0.8439007
UCIL5 0.9156383 0.6140438
UCIL6 0.8544383 0.1261469
UCIL7 0.9219397 -0.8535848
UCIL8 0.8226153 -0.06217233
Case 2: In the second case water of the whole lake was under complete
under solar radiation with inlet temperature equals the minimum temperature of
the day. Temperature and Relative humidity(RH) data at the first set of seven
points extracted and correlation analysis done in the R-studio using R
programming language considering time as a continuous independent variable to
see its cumulative effect. (Table 6.2)
Table 6.2: Case 2 Correlation analysis of Air Temperature, Relative Humidity and Time
Measurement point Pearson's product-moment
correlation coefficient
for air temperature
Pearson's product-moment
correlation coefficient
for Relative Humidity
UCIL2 0.9820582 0.734411
UCIL3 0.9386021 0.4670124
UCIL4 0.9383335 -0.8390386
UCIL5 0.9498092 0.5335272
UCIL6 0.8731839 0.1466815
UCIL7 0.9344495 -0.8475209
UCIL8 0.8438288 -0.05475282
Case 3: In the third case water of the whole lake was completely shaded
from solar radiation with inlet temperature equals the maximum temperature of the
day. Temperature and Relative humidity(RH) data at the first set of seven points
extracted and correlation analysis done in the R-studio using R programming
language considering time as a continuous independent variable to see its
cumulative effect (Table 6.3).
Table 6.3: Case 3 Correlation analysis of Air Temperature, Relative Humidity and Time
Measurement point Pearson's product-moment
correlation coefficient
for Air Temperature
Pearson's product-moment
correlation coefficient
for Relative Humidity
UCIL2 0.8161152 0.3497697
UCIL3 0.8424691 -0.3760967
UCIL4 0.9087311 -0.8948763
UCIL5 0.842523 -0.3727366
UCIL6 0.7835263 -0.5478617
UCIL7 0.9143121 -0.8936088
UCIL8 0.7327484 -0.5152106

198
Case 4: In the fourth case water of the whole lake was completely shaded
from solar radiation with inlet temperature equals the minimum temperature of the
day. Temperature and Relative humidity(RH) data at the first set of seven points
extracted and correlation analysis done in the R-studio using R programming
language considering time as a continuous independent variable to see its
cumulative effect (Table 6.4).
Table 6.4: Case 4 Correlation analysis of Air Temperature, Relative Humidity and Time
Measurement point Pearson's product-moment
correlation coefficient
for Air Temperature
Pearson's product-moment
correlation coefficient
for Relative Humidity
UCIL2 0.9747011 0.1416486
UCIL3 0.8970227 -0.3672817
UCIL4 0.9285554 -0.8920262
UCIL5 0.912889 -0.3555603
UCIL6 0.8104017 -0.5294822
UCIL7 0.9276761 -0.8903609
UCIL8 0.7581881 -0.4985059
The correlation analysis of the four cases strongly corresponds with the
result of field measurement at the two-lake areas and reference measurement at
Bangladesh Meteorological Department (BMD). It has been observed from the
field study that the time, if considered as a continuous variable (an increasing
quantity rather than a categorical value), has a cumulative effect on the rate of
change of air temperature and relative humidity in terms of solar influx. In all the
four cases rate of change of air temperature strongly and positively correlated with
time. In case of Relative Humidity, it is mostly negatively correlated, with the
measurement point deep inside the urban fabric (UCIL4 and UCIL7) showing the
strongest negative correlation. The measurement points near and over the water of
the lake showing weak negative or weak positive correlation with time, which
corresponds to the field measurement of both the lake area.
6.3.2 Development of inversion layer
Fraedrich K. (1972) observed a shallow stably stratified layer over the
water of the lake which he named as “inversion layer”. This layer produced by a
negative downward flux over a water surface, when the air is blowing from the
warmer land. Also, if the advected air is relatively dry, evaporative cooling
amplifies the stable inversion layer. The inversion can also happen even if the air
temperature of the environment is equal or less compared with the temperature of
the water surface at the shore. The reason is interaction between the air and the
water varies (decreases) the water surface temperature along the air trajectory.
Inversion layer also increasingly suppresses the evaporation from the lake which
increases with the travel distance of the air over the lake by creating a “Vapor
blanket”.

199
Fig
ure
6.5
: C
ase
1_
Inv
ersi
on
lay
er a
bov
e th
e la
ke

200
All this above-mentioned phenomenon observed by Fraedrich clearly
demonstrated in the four cases of the simulation study. All the conditions of the
creation of “inversion layer” has been covered by the four cases of the simulation
study.
Case 1: In the first case water of the whole lake was under complete under
solar radiation with inlet temperature equals the maximum temperature of the day.
The starting Relative Humidity (RH) of the simulation was set equal to the RH
observed at 9:00 am on 24th February in the Dhanmondi lake area. The simulation
showed (fig. 6.5) a clear inversion layer above the water surface of the lake. The
inversion layer is slightly advected towards the downwind side of the lake above
the ground.
Case 2: In the second case water of the whole lake was under complete
solar radiation with inlet temperature equals the minimum temperature of the day
and the starting Relative Humidity (RH) of the simulation was set equal to the RH
observed at 9:00 am on 24th February in the Dhanmondi lake area. The simulation
showed (fig. 6.6) a clear inversion layer above the water surface of the lake. The
inversion layer is slightly advected towards the downwind side of the lake above
the ground.
Case 3: In the Third case water of the whole lake was completely shaded
from solar radiation with inlet temperature equals the maximum temperature of the
day and the starting Relative Humidity (RH) of the simulation was set equal to the
RH observed at 9:00 am on 24th February in the Dhanmondi lake area. The
simulation showed (fig. 6.7) a clear inversion layer above the water surface of the
lake. The inversion layer is slightly advected towards the downwind side of the
lake above the ground, although this advection is less than case 1 and 2. Also, the
thickness of the inversion layer is less than case 1 and 2.
Case 4: In the Third case water of the whole lake was completely shaded
from solar radiation with inlet temperature equals the minimum temperature of the
day and the starting Relative Humidity (RH) of the simulation was set equal to the
RH observed at 9:00 am on 24th February in the Dhanmondi lake area. The
simulation showed (fig.6.8) a clear inversion layer above the water surface of the
lake. The inversion layer is slightly advected towards the downwind side of the
lake above the ground, although this advection is less than case 1 and 2. Also, the
thickness of the inversion layer is less than case 1,2 & 3

201
Fig
ure
6.6
: C
ase
2_
Inv
ersi
on
lay
er a
bov
e th
e la
ke

202
Fig
ure
6.7
: C
ase
3_
Inv
ersi
on
lay
er a
bov
e th
e la
ke

203
Fig
ure
6.8
: C
ase
4_
Inv
ersi
on
lay
er a
bov
e th
e la
ke

204
6.3.3 Effect of the fetch on the inversion height
A strong relationship between the inversion height and the fetch had been
observed in all the four cases. Fetch is the distance starting from the land-lake
boundary of the downwind side of the lake to the upwind side towards wind flow
direction. Inversion height is the maximum thickness of the inversion layer (fully
saturated with water vapor) at a particular point over the lake.
Case 1: In the first case water of the whole lake was under complete under
solar radiation with inlet temperature equals the maximum temperature of the day.
In this case, the inversion layer increases in height with the increasing fetch
(fig.6.9).
Figure 6.9: Case 1_Inversion height z versus fetch x
Case 2: In the second case water of the whole lake was under complete
solar radiation with inlet temperature equals the minimum temperature of the day.
In this case, the inversion layer increases in height with the increasing fetch
(fig6.10), although this increase is less than case 1.
Figure 6.10: Case 2_Inversion height z versus fetch x

205
Case 3: In the third case water of the whole lake was completely shaded
from solar radiation with inlet temperature equals the maximum
temperature of the day. In this case, the inversion layer decreases in height
with the increasing fetch (fig. 6.11).
Figure 6.11: Case 3_Inversion height z versus fetch x
Case 4: In the fourth case water of the whole lake was completely shaded
from solar radiation with inlet temperature equals the minimum temperature of the
day. In this case, the inversion layer decreases in height with the increasing fetch
(fig6.12).
Figure 6.12: Case 4_Inversion height z versus fetch x
Correlation between the Inversion height and Fetch:
Table 6.5 shows the correlation between the inversion height and fetch. In
case of case 1 and 2 inversion height has a strong positive correlation with fetch
with the case1 has the strongest positive correlation. Whereas in case of case 3 and
4 correlation is negative with the case 4 is having the strongest negative correlation.

206
Table 6.5: Correlation between inversion height and fetch
Pearson's product-moment correlation between
Inversion height z and fetch x Case 1 0.8494861
Case 2 0.7983775
Case 3 -0.3815254
Case 4 -0.5927785
This correlational analysis clearly demonstrates the effect of riparian
shading on the water temperature of the lake and hence the thickness of the
inversion layer. It is clear from the study that Urban wetland with shade and less
warm wind flow from the upwind will have thinner inversion layer than the
wetland with no shading and warmer inflow.
Also, relative humidity(RH) above the inversion layer of the lake will be
less even comparing with the land. This is the reason in the field study the urban
station over the water of the lake and edge of the lake showed lower Relative
Humidity(RH) compared to the urban station deep inside the fabric. Because in
average urban station above the water surface and edge of the lake were
approximately 6m above the water. So those urban stations were above the
inversion layer and hence showed lower RH.
6.3.4 Inversion model
A linear regression model has been built based on the simulation model to test the
relation between fetch, inversion layer thickness, temperature and horizontal
component of total energy flux in the inversion layer. All the four cases
described in the chapter 6 are considered in the regression analysis. The variables
included are:
Independent variable: Fetch (x)
Dependent variable: Inversion height (z), Air temperature (T), Relative humidity
(RH), horizontal component of the total energy flux (f). From the simulation data, all the values of the variables are selected for the fully
saturated air i.e. 100% relative humidity. The regression analysis is done on the R-
studio using “R” programming language. Following are the regression models that
describe the relationship:
Case 1:
For the case one the regression model is:
𝑥 = 39.42 + 868.6928𝑧 − 1.319𝑇 + .003547𝑓
From the model it is obvious that if the T and f are unchanged increasing fetch will
increase the inversion layer thickness.
Case 2:
For the case two the regression model is:
𝑥 = 43.02 + 740.7𝑧 − 1.321𝑇 + .00004596𝑓

207
From the model it is obvious that if the T and f are unchanged increasing fetch will
increase the inversion layer thickness, although the increase will be less than case
1.
From these two models, it is clear that we have to reduce fetch to reduce the
thickness of the inversion layer and thus promote heat exchange between water
and the air blowing above it. To reduce fetch longer direction or length of the
wetland should be perpendicular to the prevailing wind direction.
Case 3:
For the case three the regression model is:
𝑥 = 3.317 − 491.1𝑧 − .3212𝑇 + .00004596𝑓
From this model it is obvious that if the T and f are unchanged increasing fetch
will decrease the inversion layer thickness.
Case 4:
For the case four the regression model is:
𝑥 = −17.74 − 305.93952𝑧 + 1.0244𝑇 − .01463𝑓
From the model it is obvious that if the T and f are unchanged increasing fetch will
decrease the inversion layer thickness. This reduction will be greater than case 3.
Form these four models it is obvious that in an unshaded wetland
increasing fetch will increase the depth of the inversion layer, whereas in a shaded
wetland increasing fetch will decrease the depth of the inversion layer. As the
inversion layer decreases with increasing fetch and thus promote heat exchange
between water and the air blowing above it.
6.3.5 Effect of the relative humidity on the inversion layer thickness
To test the relationship between the inversion height and the relative
humidity two additional scenarios of relative humidity had been considered both
with the case 1 and case 3 described before.
Case 1: In the first case water of the whole lake was under complete under solar
radiation with inlet temperature equals the maximum temperature of the day.
Relative humidity (RH) was equal to the starting RH obtained from the field
measurement at 9:00 am which was 51.5%. In the first scenario of case1 initial
RH is set to 1.5 times of RH of the field measurement, which is 77.25%. In the
second scenario of case1 initial RH is set 0.5 times of RH of the field
measurement, which is 25.75%. The results of case 1 with 2 scenarios are plotted
below in figure 6.13.The results clearly indicate the increase of the inversion layer
thickness with increasing humidity from the upwind flow.
Case 3: In the third case water of the whole lake was completely shaded from
solar radiation with inlet temperature equals the maximum temperature of the day.
Relative humidity (RH) was equal to the starting RH obtained from the field
measurement at 9:00 am which is 51.5%. In the first scenario of case3 initial RH
is set to 1.5 times of RH of the field measurement, which is 77.25%. In the second
scenario of case3 initial RH is set 0.5 times of RH of the field measurement, which
is 25.75%. The results of case 3 with 2 scenarios are plotted below in figure 6.14.

208
The results clearly indicate the increase of the inversion layer thickness with
increasing humidity from the upwind flow although the water surface is under
completely shading.
Figure 6.13: Case1_Effect of relative humidity (RH) on inversion height
Figure 6.14: Case3_Effect of relative humidity (RH) on inversion height
6.3.6 Effect of the orientation and riparian shading height of the wetland
on the water temperature
The effect of orientation and shading height on the water surface temperature was
simulated. The simulation time was 9:00 hours in the morning to 16:00 hours in
the afternoon. The date of the simulation was considered as 24th February to keep

209
consistency with the field measurement date of the Dhanmondi lake area. For this
simulation a hypothetical wetland of linear shape with shading on it’s both side
was considered. Four ratios between the shading height (H) and wetland water
surface width (W) was considered in conjunction with three orientations of the
wetland. The ratios were H/W=1, H/W=2, H/W=3 and H/W=4. The three
orientations of the long axis of the wetland considered were East-West (90),
North/East-South/West (45) and North-South (0). The result of the simulations
is given on the following figure 6.15.
Figure 6.15: Effect of wetland orientation and ratio of shading height (H) vs water surface width
(W) on the temperature of water surface.
It could be concluded from figure 6.15 that for the same amount of shading if the
long axis of the wetland is oriented towards East-west (i.e. wetland is more
elongated towards East-West than North-South), it will be shielded more from the
direct solar radiation, hence heat gain will be less. Wetland with long North-South
axis is less desirable in terms of shading from direct shortwave radiation from sun.
Although Increase in H/W ratio will provide better shielding against the direct
solar radiation, but together with the correct orientation this high H/W ratio will
create optimal shading for the water of the wetland. Also, beyond H/W ratio 2,
further increase in shading height won’t bring significant benefit in terms of
controlling the temperature of the water surface.

210
6.4 References
1. Bert Blocken. (2015). “Computational Fluid Dynamics for urban physics: Importance, scales, possibilities, limitations and ten tips and tricks towards accurate and reliable simulations”. Building and Environment 91, 219-245.
2. Blocken B, Stathopoulos T, Carmeliet J. “CFD simulation of the atmospheric boundary layer: wall function problems”. Atmos. Environ 2007;41(2): 238-52.
3. Blocken B, Carmeliet J, Stathopoulos T. “CFD evaluation of wind speed conditions in passages between parallel buildings effect of wall-function roughness modifications for the atmospheric boundary layer flow”. J Wind Eng. Ind. Aerodyn.
2007;95(9e11):941-62.
4. Di Sabatino S, Buccolieri R, Pulvirtenti B, Britter R. “Simulations of pollutant dispersion within idealised urban-type geometries with CFD and integral models”.
Atmos. Environ 2007; 41:8316-29.
5. Fraedrich K. (1972). “On the evaporation of a lake in warm and dry environment”.
Tellus, 24: 116–121. doi:10.1111/j.2153-3490. 1972.tb01538.x
6. Franke J, Hellsten A, Schlünzen H, Carissimo B. (2007). “Best practice guideline for the CFD simulation of flows in the urban environment”. Brussels: COST Office;
2007, ISBN 3-00-018312-4.
7. Gorl_e C, van Beeck J, Rambaud P, Van Tendeloo G. “CFD modelling of small particle dispersion: the influence of the turbulence kinetic energy in the atmospheric boundary layer”. Atmos. Environ 2009;43(3):673-81.
8. Hargreaves DM, Wright NG. “On the use of the k-ε model in commercial CFD software to model the neutral atmospheric boundary layer”. J Wind Eng. Ind.
Aerodyn 2007;95(5):355e69.
9. Incropera F.P., DeWitt D.P., Bergman T.L., and Lavine A.S. (2006). “Fundamentals of Heat and Mass Transfer”, 6th ed., John Wiley & Sons.
10. Monteith J. L. & Unsworth M. H. (2013). “Principles of environmental physics”. 4th
edition, Academic Press
11. Parente A, Gorl_e C, van Beeck J, Benocci C. “Improved k-ε model and wall function formulation for the RANS simulation of ABL flows”. J Wind Eng Ind Aerodyn
2011;99(4):267-78.
12. Richards PJ, Hoxey RP. “Appropriate boundary conditions for computational wind engineering models using the k-ε turbulence model”. J Wind Eng Ind Aerodyn
1993;46&47:145-53.
13. Richards PJ, Norris SE. “Appropriate boundary conditions for computational wind engineering models revisited”. J Wind Eng. Ind. Aerodyn 2011;99(4): 257-66.
14. Tucker PG, Mosquera A. “NAFEMS introduction to grid and mesh generation for CFD”. NAFEMS CFD Working Group; 2001. p. 56. R0079.
15. Tominaga Y, Mochida A, Yoshie R, Kataoka H, Nozu T, Yoshikawa M, et al. “AIJ guidelines for practical applications of CFD to pedestrian wind environment around buildings”. J Wind Eng. Ind. Aerodyn. 2008;96(10-11):1749-61.
16. van Hooff T., Blocken B. “Coupled urban wind flow and indoor natural ventilation modelling on a high-resolution grid: a case study for the Amsterdam ArenA stadium”. Environ Model Softw 2010;25(1):51-65.
17. Wilcox D.C. (1998) “Turbulence modeling for CFD”. DCW industries Inc. La
Canada, California.
18. Yang Y, Gu M, Chen S, Jin X. “New inflow boundary conditions for modelling the neutral equilibrium atmospheric boundary layer in computational wind engineering”. J Wind Eng. Ind. Aerodyn 2009;97(2):88-95.
19. COMSOL Documentation. (n.d.). Retrieved February 01, 2018, from
https://www.comsol.com/documentation

211
Chapter 7 : TRANSFORMING URBAN WETLAND INTO URBAN
COOLING ISLANDS
7.1 Significant Findings of Urban Cooling Islands
Throughout the research, reasons effecting Urban wetland to their ability
to act as an adaptation strategy against Urban heat island (UHI) has been identified.
Those reasons are summarized below:
7.1.1 Change of surface Urban Heat Island
Landsat estimated UHIsurf for Dhaka in 12 December 1991 is 5.18C and
16 December 2016 is 7.07C. within the span of 25 years Landsat estimated
Surface Urban Heat Island (UHIsurf) increased around 2C. Newly developed
urban area has exhibited highest change in UHIsurf. Urban canyon with shading
exhibited decreased Land surface temperature (LST) due to increased shading from
tall building. These findings have been based on the Urban Heat Island study of
chapter two.
7.1.2 Rate of change of temperature and relative humidity in terms of
solar influx
Time if considered as a continuous independent variable rather than a
categorical value has a cumulative effect throughout the day and night on
independent variables like Air Temperature and Relative Humidity (RH) in terms
of solar influx. During the day at the land rate of change of air temperature are
strongly positively correlated with cumulative time in terms of solar influx which
is strongly negative at night. On the other hand, at the land during the day rate of
change of RH has strong negative correlation with cumulative time in terms of
solar influx, which is strongly positively correlated at night. These findings have
been detailed on the field measurement of chapter five.
7.1.3 Shading impact on rate of change of temperature and relative
humidity
In case of the urban wetland devoid of riparian shading this cumulative
effect of time on Air temperature and RH becomes stronger near the edge and at
the top of wetland. Whereas, in case of the urban wetland with significant riparian
shading this cumulative effect of time on Air temperature and RH becomes weaker
near the edge and at the top of the water surface of wetland. But in both the case
cumulative effect of time on Air temperature and RH still maintains the same trend.
7.1.4 Humidity distribution
Contrary to the common assumption, Relative Humidity (RH) near the
edge of wetland and at the top of water surface of the wetland are lower than the
park and the vegetated area.

212
7.1.5 Day time evaporative cooling potential
With the progress of the day relative humidity decreases, which dips
significantly from the mid-day to late afternoon, which increase evaporative
cooling potential of urban environment.
7.1.6 Inversion layer development
When relatively dry and warm air from a warmer land advected at the top
of the water surface of the wetland a shallow stably stratified layer of fully
saturated air develops over the surface of the wetland known as “inversion layer”.
Although the inversion layer can develop even air temperature of the surroundings
environment is less than or equal to the temperature of the wetland it is most
amplified if the advected air is warmer and relatively dry.
7.1.7 Evaporation suppression
Inversion layer at the top of the water surface act as a “vapor blanket” and
suppress the evaporation from the lake which increases with travelling distance of
the air from the land-lake boundary to the downwind direction.
7.1.8 Humidity over wetland
Relative Humidity (RH) above the inversion layer is relatively low and air
temperature is higher, that is why wetland devoid of riparian shading exhibits low
RH and higher air temperature above its water surface in the middle and at the edge
of wetland.
7.1.9 Fetch and the inversion height
Fetch or leading edge is the distance from the land-lake boundary at the
upwind side to the downwind side towards the wind direction. In case of wetland
without shading inversion height of the inversion layer increases with increasing
fetch. In case of wetland with significant shading inversion height of the inversion
layer decreases with increasing fetch.
7.2 Measures to Create Urban Cooling Islands
Form the research some important measures have been identified to convert
urban wetlands as Urban Cooling Island. They are given below:
7.2.1 Shading measure
Riparian shading provides thermal and ecological benefit by moderating
the water temperature of the wetland. At least 30m wide riparian shading needed
to protect the physical, chemical and biological integrity of wetland. Riparian
Shading the urban wetlands alone can significantly improves the water quality by
lowering water temperature. Shading of urban wetland by topography and built
form also positively modify Urban thermal environment. Also Shading in the urban
canyon can decrease air temperature.

213
7.2.2 Orientation measure
E-W elongation of the wetland can produce greatest shielding from the
direct solar influx. Complex wetland shape with major east-west axis have the
greatest shading potential beside other ecological potential.
7.2.3 Advection measure
The cooling effect produced in the wetland by exchanging heat between air
and water would carried to the land at upwind through advection known as
“leading-edge or fetch effect”.
7.2.4 Proximity measure
Urban Cooling Intensity of the urban wetland are correlated with the
distance from the edge of the wetland. UCI intensity in generally more prominent
within 500 m from the edge of the wetland. This correlation is generally more at
the downwind side of the wetland than the upwind side. UCI intensity also vary
seasonally and closely moderated by riparian, topographical and build form
shading.
7.2.5 Air corridor from the wetland measure
The point on the urban fabric located on the road parallel to the wind
direction from the wetland can benefit from the cooling effect through advection
of air from the wetland (Figure 7.1).
Figure 7.1: Air corridor inside the Urban fabric

214
7.2.6 Oasis effect measure
Existence of urban park creates oasis effect in otherwise dry urban
surroundings. Because due to the more surface area present in the leaves of plant
they can evaporate more water to cool down the air surrounding them by removing
latent heat from the air. Among the artificial measures to create oasis effect,
fountains and sprinkler will also have positive impact as they break down the water
into smaller particles which promote rapid evaporation and thus cooling.
7.3 Wetland as An Urban Cooling Islands in Urban Design
To effectively use urban wetland as an urban cooling islands several
strategies might need in existing urban area and new design. One of the most
important strategies found from the research is delineated in the following section.
7.3.1 Controlling the “inversion layer” over the water surface of urban
wetlands
One of the consideration in the urban area for the wetland should be
strategy to keep “Inversion layer” over the surface of wetland weak. Because
inversion layer suppresses the evaporation from the water surface and also act as
barrier between heat exchange in between the water surface and air above it to cool
down. There are several ways to weaken the inversion layer above the water
surface.
Preventing solar gain of the urban wetland:
As the inversion layer thickens with the heat supplied from sun following
measures should be taken to prevent direct solar gain from the sun:
a. Riparian shading:
Shading is one of the most important parameter to keep the water of the
urban wetland from gaining heat. The 30m buffer of riparian shading should be
maintained around the edge of the wetland to gain optimum thermal performance.
Where the riparian shading is not possible, built structure could be oriented to shed
the water of the lake. If the wetland is wider emergent macrophytes and other water
born local trees could be introduced to keep the water of the wetland under shading.
Wetland plant species also helps to improve the quality of water besides shading.
b. Topographical shading through orientation:
If the wetland could be oriented in a correct orientation (figure: 7.2) it can
utilize the benefit of shading from the natural feature like hills or high land. Also
in case of low water level, which often happens in the dry season wetland can shade
itself by its bank. For this reason, E-W orientation will be most beneficial for
reducing solar gain though out the day.

215
Figure 7.2: Correctly oriented (E-W axis) Wetland for both topographical and riparian shading
Controlling “Fetch” to reduce the thickness of inversion layer:
Controlling of “Fetch” could be effective strategy to reduce inversion layer
in case of Urban wetland. Four linear regression models were built based on the
simulation model to test the effect of fetch on inversion layer in chapter 6. Based
on those models following are the strategies for fetch control.
a. Wetland without shading “reduce fetch”:
Urban areas like case one and case two of the simulation study need to
follow similar strategy for fetch control. For an unshaded urban wetland, we have
to reduce fetch to reduce the thickness of the inversion layer and thus promote heat
exchange between water and the air blowing above it. Thus, the warm air cooled
down by the wetland could be supplied to the urban area at the downwind side for
urban cooling. To reduce fetch longer direction or length of the wetland should be
perpendicular to the prevailing wind direction (Fig 7.3).
b. Wetland with shading “increase fetch”:
Urban areas like case two and case three of the simulation study need to
follow similar strategy for fetch control. For a shaded urban wetland, we must
increase fetch to reduce the depth of the inversion layer as the inversion layer
decreases with increasing fetch and thus promote heat exchange between water and
the air blowing above it. Thus, the warm air cooled down by the shaded wetland
could be supplied to the urban area at the downwind side for urban cooling. For
this reason, wetland should be oriented with its longer dimension parallel to the
prevailing wind, to increase contact between wind and the water surface (Figure
7.4).
N

216
Figure 7.3: Wind flow direction in Wetland with no shading
Figure 7.4: Wind flow direction in Wetland with riparian shading

217
7.4 Urban Design Guidelines for Urban Wetland
Urban wetlands are paramount for their environmental functions besides
their role in improving the aesthetic characteristics of urban places. They also have
significant social and economic functions besides its primary environmental
functions. To use the wetland in the urban fabric without considering its wide range
of physical and morphological characteristics might create unfavorable urban
environment or may result in a loss of opportunity. However shading is essential
for the urban environment in the tropics. Without necessary shading urban wetland
will cease to play its role as a source of coolth for the urban fabric. Shading of the
urban wetland could be achieved through topography, urban built form, and
riparian shading. Although built form and topographical shading potentially shield
the urban wetland from the direct solar radiation to prevent temperature increase
of the wetland water, they don’t have any other ecological, economical, and social
functions pertaining to the wetland. On the other hand, riparian shading of urban
wetlands both by the shade trees and macrophytes have multiple economic and
social functions besides their multiple primary environmental functions. Beside
preventing the temperature increase of wetland water, shade trees and macrophytes
included in riparian shading further cools down the urban environment through
evapotranspiration. While floating and emergent macrophytes contribute in
improving water quality, large shade trees can trap airborne pollutants to improve
air quality. Carbon sequestration is an important function by large shade trees and
macrophytes besides creating habitat for urban wild life. Space under the large
shade beside the wetland can act as emergency evacuation spaces in times of major
urban disaster like earthquakes or fire subject to their accessibility. The shade trees
and wetland plants (macrophytes) can transforms the urban wetland into a leisure
space in the form of a wetland park which is an immense social service. So, urban
wetland with riparian shading can render several environmental, economic, and
social functions besides its essential role as “Urban Cooling Island (UCI)”. The
application of the urban design guidelines for urban wetlands provided in the
design matrix in figure 7.5 can provide a thermally desirable micro climate which
is essential in the warm-humid conditions of Bangladesh as an adaptation measure
against climate change. The effectiveness of the urban design guidelines for urban
wetlands can be improved significantly if they are adopted as a part of overall
urban design scheme.


219
7.5 Suggestions for Further Work
Further works are required to investigate the behavior of urban wetland in
terms of its heat exchange with the atmosphere and with the land. This works
required specially in two forms:
Field measurement:
Field measurement at multiple points both at horizontal and vertical
direction to capture the characteristic of the inversion layer in detail. This
measurement need to be carried out both diurnal basis and throughout the whole
year in different season. Because in this study the measurement point was only one
or two points at the top and edge of the water with no robust measurement to
capture the vertical profile of the variables.
Simulation work:
Due to the limited computational resources, the simulation model of the
urban area was scaled down to 1:50 and also simplified. So, to get accurate
understanding of the heat exchange mechanism of the urban wetland with its
surroundings and atmosphere full scale model simulation with possible detail is
required. Also, evapo-transpiration of tree has not been included in the simulation
model, which must be included to get accurate scenario of urban environment.

220
Appendix 1 Wilcox K-Ω Turbulence Model
With the k-ω model (Wilcox, 1993,1998) the major difference from the
standard k– ε model is that the second turbulence property solved is the specific
dissipation:
ω =ε
𝑘𝛽ˊ
The constant 𝛽ˊ is equivalent to Cμ and also has a value of 0.09.
The conservation equations are:
𝐷(𝜌𝑘)
𝐷𝑡= 𝜏𝑖𝑗
𝜕𝑈𝑖
𝜕𝑋𝑗− 𝛽ˊ𝜌𝑘𝜔 +
𝜕
𝜕𝑋𝑗((𝜇𝑙 +
𝜇𝑇
𝜕𝑘𝑤)
𝜕𝑘
𝜕𝑋𝑗)
𝐷(𝜌𝜔)
𝐷𝑡= 𝛼
𝜔
𝑘𝜏𝑖𝑗
𝜕𝑈𝑖
𝜕𝑋𝑗− 𝛽𝜌𝜔2
𝜕
𝜕𝑋𝑗((𝜇𝑙 +
𝜇𝑇
𝜕𝜔)
𝜕𝜔
𝜕𝑋𝑗)
with the supplementary equation:
𝜇𝑇 = 𝜌𝑘
𝜔
Solution of these equations for the atmospheric surface layer as a
horizontally homogeneous turbulent surface layer (HHTSL) is essentially the same
as for the k–ε model and yields essentially the same U and k; however, with the
standard constants α=5/9, β=0.075, 𝜎𝑘𝑤 = 2 , 𝜎𝜔 = 2 the effective Von
Kármán’s constant is given by:
𝑘𝑘−𝜔 = √(𝛽 − 𝛼𝛽ˊ)𝜎𝜔
√𝛽ˊ= 0.408
Wilcox (1993, p.94) explains that the value was chosen in order to be consistent with
a Von Kármán’s constant of 0.41.
The profile of the specific dissipation is given by:
𝜔 =𝑢∗
√𝛽ˊ𝑘𝑘−𝜔𝑧
To implement the model similar boundary conditions are imposed at the upper
boundary, with the flux of 𝜔 being prescribed as:
𝜇𝑇
𝜎𝜔
𝑑𝜔
𝑑𝑧= −
𝜌𝑢∗2
√𝛽ˊ𝜎𝜔𝑧

221
Appendix 2 Instrumentation
Appendix 2.1 Temperature and humidity data logger
EL-USB-2-LCD
Temperature, Humidity and Dew Point Data Logger with LCD Screen.
1. -35 to +80°C (-31 to +176°F) and 0 to 100%RH measurement range
2. Stores over 16,000 readings for both temperature and humidity
3. Easy Log software available as a free download
4. High contrast LCD, with two-and-a-half-digit temperature and humidity
display function
5. Logging rates between 10 seconds and 12 hours
6. Immediate, delayed and push-to-start logging
7. User-programmable alarm thresholds for both temperature and humidity
8. Status indication via red/green LEDs
9. Environmental protection to IP67
Specification:

222
Appendix 2.2 Temperature and humidity data logger
Extech Big Digit Indoor/Outdoor Hygro-Thermometer
1. Max/Min with "reset" function
2. Humidity: 10 to 99% RH
3. Temperature: 14 to 140°F or -10 to 60°C
4. Accuracy: ±5%RH; ±1.8°F, ±1°C
5. Dimensions: 4.3 x 3.9 x 0.78" (109 x 99 x 20mm)
6. Weight: 6oz (169g)
7. Complete with built-in stand, wall mounting bracket, outdoor sensor with 35"
(89cm) cable, and 01.5V AAA battery
Appendix 2.3 Dial stem thermometers
Extech Penetration Stem Thermometer For use in liquids, semi-solids and solids
Penetration Stem (Model 392050): Temperature range: -58 to 302°F (-50 to 150°C) Basic Accuracy of 2°F or 1°C 0.1° resolution to 199.9; 1° over 200°

223
Appendix 2.4 Temperature and wind speed logger
Extech Cup Thermo-Anemometer AN400
The AN400 measures air velocity in five units of measure: feet per minute
(ft/min), meters per second (m/sec), miles per hour (MPH), kilometers per hour
(km/hr), & nautical miles per hour (knots). The low-friction cup vane freely rotates
in response to air flow. An internal thermistor allows the AN400 to measure air
temperature in Centigrade or Fahrenheit units. This meter is shipped fully tested and
calibrated and with proper use will provide years of reliable service
Specification:
Circuit description: Custom LSI microprocessor design
Display: Dual function 9999 count LCD display
Measurement units: m/s, km/h, ft/min, knots, mph, Temperature oC/oF
Data hold: Freezes reading on the display
Sensor Structure: Air velocity sensor: Cup vane arm with low-friction ball bearing
design. Temperature sensor: Precision thermistor
Memory Recall: Record and Recall Maximum (MAX) and Minimum (MIN)
readings
Data Logger: Manual store/recall of up to 100 data points
Auto Power off: After 10 minutes
Sampling Time: Approx. 1 second
Water Resistance: IP65
Operating Temperature: 32 °F to 122 °F (0 °C to 50 °C)
Operating Humidity: Max. 80% RH
Power Supply: 4 x 1.5V AAA batteries
Power Consumption: Approx. 6.8mA DC (typical battery life: approx. 150 hrs)
Weight: 0.4 lbs. (181g)
Dimensions: Main instrument: 7.5 x 1.6 x1.3” (190 x 40 x 32mm)
Cup Vane: 5.3” (135mm) diameter

224
Appendix 2.5 Weather station
Davis Vantage Vue® wireless weather station
Specification:
Operating Temperature ....... ....................................... -40° to +150°F (-40° to +65°C)
Non-operating (Storage) Temperature......................... -40° to +158°F (-40° to +70°C)
Current Draw ........................................0.20 mA (average), 30 mA (peak) at 3.3 VDC
Solar Power Panel ...........................................................0.5 Watts
Battery .............................................................................CR-123 3-Volt Lithium cell
Battery Life (3-Volt Lithium cell) ...........8 months without sunlight - greater than 2
years depending on solar charging
Wind Speed Sensor .............................................Wind cups with magnetic detection
Wind Direction Sensor ...........................................Wind vane with magnetic encoder
Rain Collector Type ......................Tipping spoon, 0.01" per tip (0.2 mm with metric
rain cartridge, Part No. 7345.319), 18.0 in2 (116 cm2) collection area
Temperature Sensor Type ................................................PN Junction Silicon Diode
Relative Humidity Sensor Type .........................................Film capacitor element
Housing Material ........................................... ..........UV-resistant ABS & ASA plastic
ISS Dimensions ....................12.95" x 5.75" x 13.40" (329 mm x 146 mm x 340 mm)
Package weight: ...............................................................5.44 lbs (2.47 kg)

Appendix A: Data from the field measurement and Remote Sensing
Dhanmondi Lake Area: Land Surface Temperature and Distance from Lake edge_2013-17

1
Name LST13APR12
Distance WD (9am-200, 12pm-180)
UCILogger_KI 27.55899239 0 UCILogger_KIB 27.51291466 0
UCILogger2 28.26181602 0 UCILogger1 26.89401627 0 UCILogger8 29.3281517 485 UCILogger7 29.20265007 619 UCILogger6 29.37782478 328 UCILogger4 29.16551018 397 UCILogger3 29.12707901 249
DP41 29.824646 374DP40 29.35160255 280DP39 28.78481483 256DP38 28.11304283 88DP37 28.10058594 76DP36 27.91230965 322DP35 28.75405884 33DP34 29.42637825 848DP33 29.60425568 181DP32 29.87803459 221DP31 30.33423996 1280DP30 28.96141624 101DP29 29.65961456 172DP28 30.0568409 1162DP27 29.12354279 1066DP26 29.93835449 1038DP25 28.94070244 985DP24 29.88695717 958DP23 29.45984077 905DP22 28.82393265 883DP21 29.33380699 793DP20 30.02137756 742DP19 29.8374176 637DP18 29.22636223 677DP17 29.20448685 750DP16 27.81456566 760DP15 28.82081223 689DP14 27.58621025 156DP13 29.19809532 549DP12 30.1885643 514DP11 29.63791847 465DP10 29.95774269 403DP9 29.76374054 286DP8 29.66111755 345DP7 29.10132027 355DP6 29.177248 70DP5 28.75335121 83DP4 27.80923843 91DP3 29.32538795 177DP2 29.63889694 212DP1 28.96811104 226
LST13APR12 Distance WD (9am-200, 12pm-180)LST13APR12 1Distance WD (9am-200, 12pm-180) 0.501809462 1
Combined_LST_C_UCILoggerPoint_Dhanmondi_20170515.xls
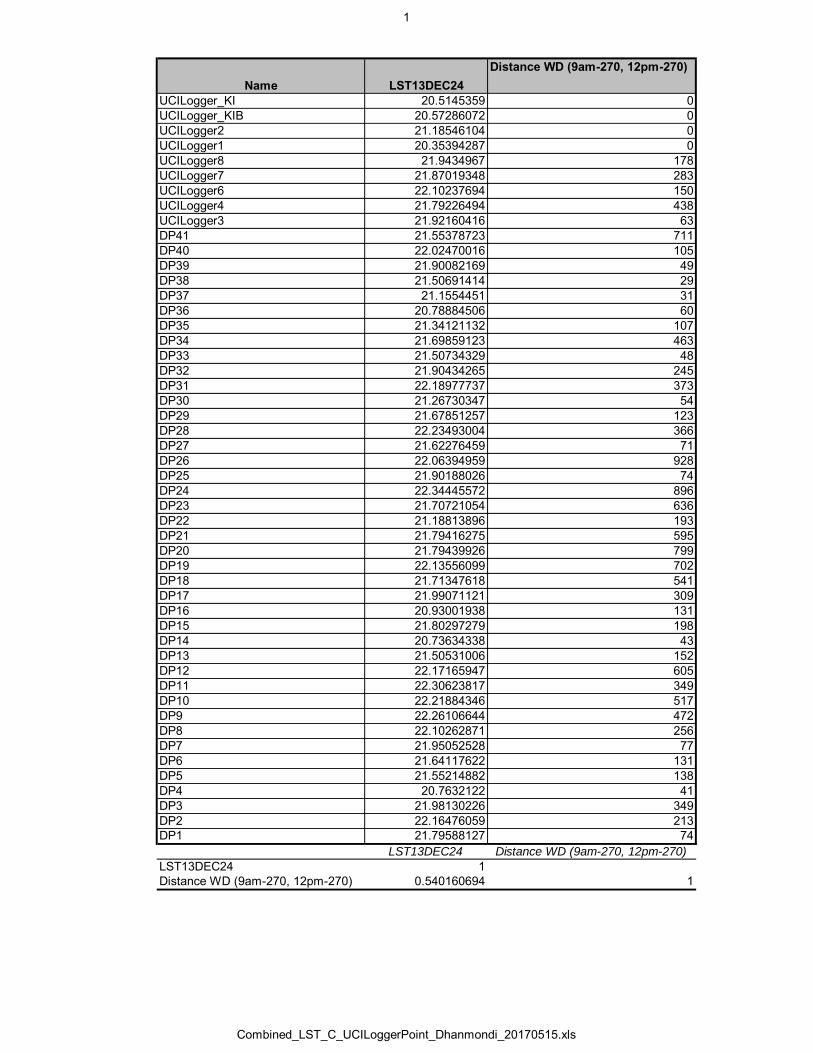
1
Name LST13DEC24
Distance WD (9am-270, 12pm-270)
UCILogger_KI 20.5145359 0 UCILogger_KIB 20.57286072 0
UCILogger2 21.18546104 0 UCILogger1 20.35394287 0 UCILogger8 21.9434967 178 UCILogger7 21.87019348 283 UCILogger6 22.10237694 150 UCILogger4 21.79226494 438 UCILogger3 21.92160416 63
DP41 21.55378723 711DP40 22.02470016 105DP39 21.90082169 49DP38 21.50691414 29DP37 21.1554451 31DP36 20.78884506 60DP35 21.34121132 107DP34 21.69859123 463DP33 21.50734329 48DP32 21.90434265 245DP31 22.18977737 373DP30 21.26730347 54DP29 21.67851257 123DP28 22.23493004 366DP27 21.62276459 71DP26 22.06394959 928DP25 21.90188026 74DP24 22.34445572 896DP23 21.70721054 636DP22 21.18813896 193DP21 21.79416275 595DP20 21.79439926 799DP19 22.13556099 702DP18 21.71347618 541DP17 21.99071121 309DP16 20.93001938 131DP15 21.80297279 198DP14 20.73634338 43DP13 21.50531006 152DP12 22.17165947 605DP11 22.30623817 349DP10 22.21884346 517DP9 22.26106644 472DP8 22.10262871 256DP7 21.95052528 77DP6 21.64117622 131DP5 21.55214882 138DP4 20.7632122 41DP3 21.98130226 349DP2 22.16476059 213DP1 21.79588127 74
LST13DEC24 Distance WD (9am-270, 12pm-270)LST13DEC24 1Distance WD (9am-270, 12pm-270) 0.540160694 1
Combined_LST_C_UCILoggerPoint_Dhanmondi_20170515.xls

1
Name LST13JUN15
Distance WD (9am-90, 12pm-90)
UCILogger_KI 19.95090675 0 UCILogger_KIB 19.95290375 0
UCILogger2 21.62176895 0 UCILogger1 20.94186783 0 UCILogger8 21.57720947 178 UCILogger7 21.50227356 283 UCILogger6 21.50240898 150 UCILogger4 21.24580002 438 UCILogger3 21.61228371 63
DP41 20.52697945 711DP40 21.58065033 105DP39 21.39236069 49DP38 21.26144028 29DP37 20.82192421 31DP36 19.82249832 60DP35 19.25704193 107DP34 20.37498856 463DP33 15.48937035 48DP32 19.6421032 245DP31 21.62387848 373DP30 16.29462051 54DP29 19.10718727 123DP28 21.28384781 366DP27 18.54211617 71DP26 21.11183548 928DP25 18.55875206 74DP24 21.11968231 896DP23 19.33279228 636DP22 20.29029655 193DP21 19.68258667 595DP20 21.72526932 799DP19 21.95998192 702DP18 20.38695145 541DP17 21.26153564 309DP16 20.06114769 131DP15 20.89827347 198DP14 20.04605675 43DP13 20.82775116 152DP12 22.59066582 605DP11 22.07172203 349DP10 22.91754723 517DP9 23.00911713 472DP8 22.03660202 256DP7 21.37984657 77DP6 22.56264496 131DP5 22.00109863 138DP4 21.16813278 41DP3 22.58888626 349DP2 22.43638992 213DP1 21.73933411 74
LST13JUN15 Distance WD (9am-90, 12pm-90)LST13JUN15 1Distance WD (9am-90, 12pm-90) 0.26 1
Combined_LST_C_UCILoggerPoint_Dhanmondi_20170515.xls

1
Name LST13NOV6Distance WD (9am-0, 12pm-0)
UCILogger_KI 24.76684189 0 UCILogger_KIB 24.88622284 0
UCILogger2 25.34615135 0 UCILogger1 24.7461338 0 UCILogger8 26.49707413 367 UCILogger7 26.13654327 282 UCILogger6 26.55716705 540 UCILogger4 26.48220825 397 UCILogger3 26.09937668 601
DP41 25.87960815 374DP40 26.35326386 579DP39 26.04003143 572DP38 26.17629242 513DP37 25.49721718 339DP36 24.9011898 140DP35 25.74861717 33DP34 26.35626984 139DP33 26.38489723 181DP32 26.94606018 221DP31 27.56030464 1280DP30 26.18153763 101DP29 26.66465569 172DP28 27.4478302 1162DP27 26.13755226 1066DP26 27.1965847 1038DP25 26.2934227 135DP24 26.84923172 958DP23 25.84303474 123DP22 25.60301209 65DP21 26.18989182 206DP20 26.53853798 742DP19 27.13204384 637DP18 25.97982407 297DP17 26.49277687 160DP16 24.99811745 77DP15 25.87457085 183DP14 25.11519241 209DP13 25.94434929 281DP12 27.18758774 514DP11 26.68123817 503DP10 27.38622475 624DP9 27.22078705 716DP8 26.73107719 590DP7 26.32740402 469DP6 26.34084702 929DP5 26.16503143 792DP4 25.50988197 721DP3 26.42168045 826DP2 26.7124958 686DP1 26.03126144 621
LST13NOV6 Distance WD (9am-0, 12pm-0)LST13NOV6 1Distance WD (9am-0, 12pm-0) 0.650396603 1
Combined_LST_C_UCILoggerPoint_Dhanmondi_20170515.xls

1
Name LST14FEB10Distance WD (12pm-50)
UCILogger_KI 20.24439812 0 UCILogger_KIB 20.41776466 0
UCILogger2 20.7977829 0 UCILogger1 19.35940933 0 UCILogger8 21.65517044 367 UCILogger7 21.65634537 282 UCILogger6 21.94299698 540 UCILogger4 21.66063309 397 UCILogger3 21.52023697 601
DP41 21.69752121 374DP40 21.88226509 579DP39 21.43734932 572DP38 21.32493401 513DP37 20.9973526 339DP36 20.35373878 140DP35 20.76519394 33DP34 21.41280365 139DP33 21.52464104 181DP32 22.14418411 221DP31 22.36668968 1280DP30 21.2413311 101DP29 22.04558182 172DP28 22.28333473 1162DP27 21.23915863 1066DP26 22.14478302 1038DP25 21.20534325 135DP24 22.18023872 958DP23 21.35279846 123DP22 20.68870163 65DP21 21.59988022 206DP20 22.12188339 742DP19 22.22383118 637DP18 21.53271866 297DP17 21.62555695 160DP16 20.16108513 77DP15 21.48195267 183DP14 20.55070496 209DP13 21.59807205 281DP12 22.36610222 514DP11 22.08889961 503DP10 22.49728012 624DP9 22.3533802 716DP8 22.0577774 590DP7 21.76104546 469DP6 21.56440735 929DP5 21.39062309 792DP4 20.26312256 721DP3 22.02249146 826DP2 22.01908684 686DP1 21.52023697 621
LST14FEB10 Distance WD (12pm-50)LST14FEB10 1Distance WD (12pm 0.59 1
Combined_LST_C_UCILoggerPoint_Dhanmondi_20170515.xls

1
Name LST14FEB26Distance WD (12pm-50)_PR
UCILogger_KI 21.64054108 0 UCILogger_KIB 21.82856941 0
UCILogger2 22.58848953 0 UCILogger1 21.12413406 0 UCILogger8 23.60874367 367 UCILogger7 23.51888084 282 UCILogger6 23.53924751 540 UCILogger4 23.28371048 397 UCILogger3 23.20077705 601
DP41 23.41959953 374DP40 23.52061462 579DP39 23.06609154 572DP38 22.97356415 513DP37 22.41320419 339DP36 21.88452148 140DP35 21.90950012 33DP34 22.58494186 139DP33 18.55518723 181DP32 16.77632713 221DP30 18.49469376 101DP29 18.17883301 172DP25 21.92731667 135DP24 23.06128311 958DP23 22.50924492 123DP22 21.78736687 65DP21 22.9498291 206DP20 23.75411224 742DP19 24.03909302 637DP18 22.97211456 297DP17 23.15160751 160DP16 21.26787186 77DP15 23.13250542 183DP14 22.03943253 209DP13 23.35758972 281DP12 24.22351265 514DP11 23.9290123 503DP10 24.28420448 624DP9 24.2821064 716DP8 23.78886604 590DP7 23.43303299 469DP6 23.60534477 929DP5 23.1961689 792DP4 22.00958633 721DP3 23.94886971 826DP2 23.79486847 686DP1 23.20077705 621
LST14FEB26 Distance WD (12pm-50)_PRLST14FEB26 1Distance WD (12pm 0.54 1
Combined_LST_C_UCILoggerPoint_Dhanmondi_20170515.xls

1
Name LST14JAN25Distance WD (12pm-0)
UCILogger_KI 20.21820641 0 UCILogger_KIB 20.32680511 0
UCILogger2 20.65257454 0 UCILogger1 19.45575523 0 UCILogger8 21.71073341 367 UCILogger7 21.85265732 282 UCILogger6 21.69313049 540 UCILogger4 21.76649857 397 UCILogger3 21.27594376 601
DP41 21.5848484 374DP40 21.62275696 579DP39 21.18209457 572DP38 21.04570389 513DP37 20.6521225 339DP36 20.44461441 140DP35 20.9475975 33DP34 21.41365242 139DP33 21.46100044 181DP32 21.88524055 221DP31 22.17446709 1280DP30 21.12317467 101DP29 21.83937263 172DP28 22.0778904 1162DP27 21.26120949 1066DP26 21.96772957 1038DP25 21.32205391 135DP24 22.30065918 958DP23 21.34868622 123DP22 20.73423576 65DP21 21.6091404 206DP20 21.88978577 742DP19 22.04043388 637DP18 21.53465843 297DP17 21.83582878 160DP16 20.39679909 77DP15 21.82293129 183DP14 20.5554142 209DP13 21.76334763 281DP12 22.18224525 514DP11 22.07774544 503DP10 22.43768883 624DP9 22.34618187 716DP8 21.87335205 590DP7 21.53217125 469DP6 21.49992752 929DP5 21.33441353 792DP4 20.12130737 721DP3 21.95657921 826DP2 21.98667336 686DP1 21.27594376 621
LST14JAN25 Distance WD (12pm-0)LST14JAN25 1Distance WD (12pm 0.53 1
Combined_LST_C_UCILoggerPoint_Dhanmondi_20170515.xls

1
Name LST14MAR14Distance WD (12pm-360)
UCILogger_KI 26.41306686 0 UCILogger_KIB 26.54836845 0
UCILogger2 27.09721184 0 UCILogger1 25.45395088 0 UCILogger8 28.60222054 367 UCILogger7 28.61509895 282 UCILogger6 28.56582451 540 UCILogger4 28.54867554 397 UCILogger3 28.33023071 601
DP41 28.83337784 374DP40 28.5647068 579DP39 27.89804459 572DP38 27.14112854 513DP37 27.11016464 339DP36 27.30084801 140DP35 27.39703941 33DP34 28.24647713 139DP33 28.30628014 181DP32 28.66745186 221DP31 29.16180611 1280DP30 27.6301384 101DP29 28.57455063 172DP28 29.11633682 1162DP27 27.8465519 1066DP26 29.07578659 1038DP25 27.88796806 135DP24 29.12275696 958DP23 28.60268211 123DP22 27.17525864 65DP21 28.24173355 206DP20 29.21717072 742DP19 29.117342 637DP18 28.37799263 297DP17 28.44901276 160DP16 26.5786438 77DP15 28.72974396 183DP14 26.5304184 209DP13 28.72603798 281DP12 29.43102646 514DP11 28.70651817 503DP10 29.41175652 624DP9 29.13299179 716DP8 28.65461349 590DP7 28.58897209 469DP6 28.19287682 929DP5 28.2579689 792DP4 26.46896172 721DP3 28.67796516 826DP2 28.86034584 686DP1 28.33023071 621
LST14MAR14 Distance WD (12pm-360)LST14MAR14 1Distance WD (12pm-360) 0.53 1
Combined_LST_C_UCILoggerPoint_Dhanmondi_20170515.xls

1
Name LST14MAR30
Distance WD (9am-240, 12pm-250)
UCILogger_KI 31.94124794 0 UCILogger_KIB 32.32409668 0
UCILogger2 33.03062058 0 UCILogger1 30.66671944 0 UCILogger8 35.15718842 178 UCILogger7 34.95095062 283 UCILogger6 34.50928879 150 UCILogger4 34.30347443 438 UCILogger3 34.07836914 63
DP41 35.23468781 711DP40 34.47000504 105DP39 33.70753098 49DP38 33.34250641 29DP37 33.28330612 31DP36 32.72219849 60DP35 33.77443695 107DP34 34.27917099 463DP33 34.10957336 48DP32 34.98778915 245DP31 35.38929749 373DP30 33.36483383 54DP29 34.45339584 123DP28 34.94655609 366DP27 33.75304413 71DP26 35.20031738 928DP25 33.99977875 74DP24 35.76265335 896DP23 34.42549133 636DP22 33.25687027 193DP21 34.59024811 595DP20 35.83687592 799DP19 35.33322144 702DP18 34.34708405 541DP17 34.93606567 309DP16 32.56393814 131DP15 35.04942322 198DP14 32.8991394 43DP13 35.33551407 152DP12 35.54343414 605DP11 34.96499634 349DP10 35.51331329 517DP9 35.36540222 472DP8 34.97321701 256DP7 34.27005386 77DP6 34.41926193 131DP5 33.86035538 138DP4 31.90798569 41DP3 34.73984909 349DP2 34.9459877 213DP1 34.07836914 74
LST14MAR30 Distance WD (9am-240, 12pm-250)LST14MAR30 1Distance WD (9am-240, 12pm-250) 0.67 1
Combined_LST_C_UCILoggerPoint_Dhanmondi_20170515.xls

1
Name LST14NOV25
Distance WD (12pm-270)
UCILogger_KI 21.88544846 0 UCILogger_KIB 21.88653564 0
UCILogger2 22.34484291 0 UCILogger1 21.78601074 0 UCILogger8 23.12737656 178 UCILogger7 22.98659515 283 UCILogger6 23.31984711 150 UCILogger4 23.0518322 438 UCILogger3 23.07877541 63
DP41 22.86313248 711DP40 23.29360962 105DP39 22.84338379 49DP38 22.50882721 29DP37 22.27090454 31DP36 22.11588287 60DP35 22.50589561 107DP34 22.94690132 463DP33 23.07299614 48DP32 23.27829933 245DP31 23.49144173 373DP30 22.66136551 54DP29 23.05804253 123DP28 23.62441063 366DP27 22.76399612 71DP26 23.3764019 928DP25 22.71155739 74DP24 23.32036781 896DP23 22.87493134 636DP22 22.29171753 193DP21 22.79299736 595DP20 23.09386444 799DP19 23.25490189 702DP18 22.85340309 541DP17 23.11191559 309DP16 21.74361038 131DP15 22.61801338 198DP14 21.86744499 43DP13 22.68364716 152DP12 23.58968925 605DP11 23.60182762 349DP10 23.75366402 517DP9 23.7410202 472DP8 23.44302177 256DP7 23.2538414 77DP6 22.88213348 131DP5 22.99320602 138DP4 22.05893898 41DP3 23.32438087 349DP2 23.33640671 213DP1 23.07877541 74
LST14NOV25 Distance WD (12pm-270)LST14NOV25 1Distance WD (12pm-270) 0.53 1
Combined_LST_C_UCILoggerPoint_Dhanmondi_20170515.xls

1
Name LST15APR18Distance WD (12pm-240)
UCILogger_KI 24.94127274 0 UCILogger_KIB 24.97157478 0
UCILogger8 27.05012131 0 UCILogger7 26.60859871 0 UCILogger6 27.02362251 178 UCILogger4 26.64056587 283 UCILogger3 26.50679016 150 UCILogger2 26.4468174 438 UCILogger1 24.91942596 63
DP41 27.48780441 711DP40 26.88678551 105DP39 26.31933975 49DP38 26.05332375 29DP37 25.87170601 31DP36 25.59609604 60DP35 26.49096489 107DP34 27.00353622 463DP33 27.36369133 48DP32 27.34659195 245DP31 27.84961128 373DP30 26.65947914 54DP29 27.22490311 123DP28 27.74847031 366DP27 26.74550819 71DP26 27.62053871 928DP25 26.74916458 74DP24 27.60276031 896DP23 27.4497242 636DP22 26.06333923 193DP21 26.92636108 595DP20 27.36926842 799DP19 27.67188644 702DP18 26.6884594 541DP17 26.95894241 309DP16 25.31918526 131DP15 26.21961212 198DP14 25.31868935 43DP13 26.33035469 152DP12 27.73249435 605DP11 27.11400604 349DP10 27.70153999 517DP9 27.77252769 472DP8 27.28151131 256DP7 26.70643616 77DP6 26.83194542 131DP5 26.9708786 138DP4 25.92165375 41DP3 27.09246635 349DP2 27.43297958 213DP1 26.78681755 74
LST15APR18 Distance WD (12pm-240)LST15APR18 1Distance WD (12pm-240) 0.63 1
Combined_LST_C_UCILoggerPoint_Dhanmondi_20170515.xls

1
Name LST15DEC30
Distance WD (12pm-0)
UCILogger_KI 18.54937172 0 UCILogger_KIB 18.64752388 0
UCILogger2 18.94364166 0 UCILogger1 18.50945663 0 UCILogger8 19.61043358 367 UCILogger7 19.52008629 282 UCILogger6 19.46564484 540 UCILogger4 19.5640831 397 UCILogger3 19.36130333 601
DP41 19.55333519 374DP40 19.4410305 579DP39 19.23167419 572DP38 18.95183373 513DP37 18.97763443 339DP36 18.96571159 140DP35 19.23621178 33DP34 19.43015862 139DP33 19.34487343 181DP32 19.5720768 221DP31 19.77958107 1280DP30 19.19052887 101DP29 19.42188263 172DP28 19.90254593 1162DP27 19.27513695 1066DP26 19.80483818 1038DP25 19.2416172 135DP24 19.81464958 958DP23 19.4954834 123DP22 18.97209167 65DP21 19.37314415 206DP20 19.42993164 742DP19 19.56952858 637DP18 19.51886749 297DP17 19.476017 160DP16 18.83122253 77DP15 19.44608498 183DP14 18.75587463 209DP13 19.19863892 281DP12 19.79589272 514DP11 19.66027832 503DP10 20.12000465 624DP9 20.03688812 716DP8 19.53086853 590DP7 19.64523888 469DP6 19.47207069 929DP5 19.28346443 792DP4 18.76573563 721DP3 19.78164101 826DP2 19.60366249 686DP1 19.36130333 621
LST15DEC30 Distance WD (12pm-0)LST15DEC30 1Distance WD (12pm-0) 0.57 1
Combined_LST_C_UCILoggerPoint_Dhanmondi_20170515.xls

1
Name LST15FEB13Distance WD (12pm-270)
UCILogger_KI 19.30706215 0 UCILogger_KIB 19.367342 0
UCILogger2 19.90709686 0 UCILogger1 18.96791267 0 UCILogger8 20.96928024 178 UCILogger7 20.88335037 283 UCILogger6 20.80402374 150 UCILogger4 20.62944031 438 UCILogger3 20.54317856 63
DP41 20.6289196 711DP40 20.75356865 105DP39 20.32355881 49DP38 19.83369446 29DP37 20.07940674 31DP36 19.82494545 60DP35 19.95335007 107DP34 20.34241295 463DP33 20.60959435 48DP32 20.77904129 245DP31 21.27729034 373DP30 20.21826744 54DP29 20.73724937 123DP28 21.3730526 366DP27 20.30407906 71DP26 21.07284737 928DP25 20.3279953 74DP24 21.03385925 896DP23 20.70531654 636DP22 19.76270485 193DP21 20.30497742 595DP20 20.79804611 799DP19 21.04580116 702DP18 20.40491676 541DP17 20.61475945 309DP16 19.27139473 131DP15 20.56617737 198DP14 19.52913094 43DP13 20.65500832 152DP12 21.2549572 605DP11 21.03134155 349DP10 21.46902466 517DP9 21.4381752 472DP8 20.85310364 256DP7 20.93863869 77DP6 20.770401 131DP5 20.6055603 138DP4 19.5292511 41DP3 21.06798172 349DP2 20.76491165 213DP1 20.54317856 74
LST15FEB13 Distance WD (12pm-270)LST15FEB13 1Distance WD (12pm-270) 0.56 1
Combined_LST_C_UCILoggerPoint_Dhanmondi_20170515.xls

1
Name LST15JAN28Distance WD (12pm-0)
UCILogger_KI 19.94853973 0 UCILogger_KIB 19.8859005 0
UCILogger2 20.81212425 0 UCILogger1 19.699543 0 UCILogger8 21.30670738 367 UCILogger7 21.40082359 282 UCILogger6 21.52838135 540 UCILogger4 21.46484375 397 UCILogger3 21.07804108 601
DP41 21.46632957 374DP40 21.44095612 579DP39 20.86271286 572DP38 20.92133522 513DP37 20.58213234 339DP36 20.55900764 140DP35 20.49017715 33DP34 21.20211792 139DP33 21.25830078 181DP32 21.30590057 221DP31 21.74995422 1280DP30 21.07233238 101DP29 21.46544456 172DP28 22.02182579 1162DP27 21.01214218 1066DP26 21.88498688 1038DP25 21.40457916 135DP24 21.89233398 958DP23 21.95951653 123DP22 20.3180809 65DP21 21.27350044 206DP20 21.49612045 742DP19 21.63026619 637DP18 21.1041851 297DP17 21.25249672 160DP16 19.85071182 77DP15 21.01806068 183DP14 20.2569828 209DP13 21.39074707 281DP12 21.77539635 514DP11 21.79972839 503DP10 22.1655407 624DP9 22.08949471 716DP8 21.66020584 590DP7 21.20491982 469DP6 21.35679817 929DP5 21.28787422 792DP4 20.42910576 721DP3 21.65449905 826DP2 21.69479179 686DP1 21.40836716 621
LST15JAN28 Distance WD (12pm-0)LST15JAN28 1Distance WD (12pm-0) 0.58 1
Combined_LST_C_UCILoggerPoint_Dhanmondi_20170515.xls

1
Name LST15MAR17Distance WD (12pm-270)
UCILogger_KI 23.01456833 0 UCILogger_KIB 23.29629135 0
UCILogger2 24.35463905 0 UCILogger1 23.10140991 0 UCILogger8 25.33636093 178 UCILogger7 25.6012001 283 UCILogger6 25.25854301 150 UCILogger4 25.62698936 438 UCILogger3 24.86424255 63
DP41 26.55724525 711DP40 25.16665459 105DP39 24.55076218 49DP38 24.21345901 29DP37 23.83267403 31DP36 24.16709328 60DP35 25.39282608 107DP34 25.91882706 463DP33 26.18945503 48DP32 26.5876236 245DP31 27.19805336 373DP30 25.73166084 54DP29 26.2498188 123DP28 26.93418884 366DP27 25.87014389 71DP26 26.68669128 928DP25 25.86968994 74DP24 26.88722801 896DP23 26.27582932 636DP22 24.78824043 193DP21 26.05925179 595DP20 26.67726898 799DP19 26.65724373 702DP18 25.71229744 541DP17 25.66685104 309DP16 24.24734688 131DP15 25.22394943 198DP14 23.55499458 43DP13 25.01010704 152DP12 26.85995293 605DP11 25.70321465 349DP10 26.61964226 517DP9 26.27028275 472DP8 25.49564934 256DP7 25.19951439 77DP6 25.26398659 131DP5 25.09684944 138DP4 23.94216537 41DP3 25.87918854 349DP2 25.34685326 213DP1 24.86424255 74
LST15MAR17 Distance WD (12pm-270)LST15MAR17 1Distance WD (12pm-270) 0.73 1
Combined_LST_C_UCILoggerPoint_Dhanmondi_20170515.xls

1
Name LST15MAY4
Distance WD (12pm-130)
UCILogger_KI 27.28395653 0 UCILogger_KIB 27.36493874 0
UCILogger8 29.47881317 0 UCILogger7 29.19140053 0 UCILogger6 29.2914238 485 UCILogger4 29.34162712 619 UCILogger3 28.72475433 328 UCILogger2 28.46801376 397 UCILogger1 27.12102699 249
DP41 29.52919197 374DP40 29.11878204 280DP39 28.43891144 256DP38 28.35732651 88DP37 28.01373863 76DP36 27.70403099 322DP35 28.7406559 33DP34 29.37358284 848DP33 29.72714043 181DP32 29.72139931 221DP31 30.29904175 1280DP30 28.87541389 101DP29 29.53899193 172DP28 30.22474098 1162DP27 29.1693573 1066DP26 29.81516647 1038DP25 28.90762138 985DP24 29.72934341 958DP23 29.36598396 905DP22 28.19911194 883DP21 29.29626274 793DP20 29.62049675 742DP19 29.83184624 637DP18 29.22905922 677DP17 29.39987946 750DP16 27.46296501 760DP15 28.48926735 689DP14 27.68124962 156DP13 28.97784233 549DP12 30.03294182 514DP11 29.81424522 465DP10 30.22495842 403DP9 30.15446472 286DP8 29.77375412 345DP7 29.08500099 355DP6 29.10317421 70DP5 29.30441666 83DP4 27.96052742 91DP3 29.60575867 177DP2 29.81461906 212DP1 29.07491875 226
LST15MAY4 Distance WD (12pm-130)LST15MAY4 1Distance WD (12pm 0.35 1
Combined_LST_C_UCILoggerPoint_Dhanmondi_20170515.xls

1
Name LST15NOV12
Distance WD (12pm-0)
UCILogger_KI 25.59336472 0 UCILogger_KIB 25.70890999 0
UCILogger2 26.32953644 0 UCILogger1 25.46924782 0 UCILogger8 27.55172539 367 UCILogger7 27.65784073 282 UCILogger6 27.58842659 540 UCILogger4 27.71347427 397 UCILogger3 27.26453018 601
DP41 27.25551414 374DP40 27.53576088 579DP39 26.99832535 572DP38 26.71020126 513DP37 26.40507507 339DP36 26.15367699 140DP35 26.57845879 33DP34 27.24671364 139DP33 27.21031189 181DP32 27.24048042 221DP31 27.85450554 1280DP30 26.6531105 101DP29 27.33625984 172DP28 27.85964203 1162DP27 26.7237606 1066DP26 27.50414276 1038DP25 26.76075363 135DP24 27.62366104 958DP23 27.19772148 123DP22 26.5073204 65DP21 27.16242981 206DP20 27.31723213 742DP19 27.72520638 637DP18 27.13462448 297DP17 27.58589363 160DP16 25.71379852 77DP15 27.15186882 183DP14 25.87380028 209DP13 27.1230278 281DP12 27.919487 514DP11 27.88973618 503DP10 28.09835243 624DP9 28.18984032 716DP8 27.83319664 590DP7 27.55734253 469DP6 27.09501266 929DP5 26.96175385 792DP4 26.20131111 721DP3 27.56323242 826DP2 27.72185707 686DP1 27.26453018 621
LST15NOV12 Distance WD (12pm-0)LST15NOV12 1Distance WD (12pm-0) 0.55 1
Combined_LST_C_UCILoggerPoint_Dhanmondi_20170515.xls

1
Name LST15NOV28
Distance WD (12pm-0)
UCILogger_KI 21.63009262 0 UCILogger_KIB 21.74761391 0
UCILogger2 22.28561401 0 UCILogger1 21.5662632 0 UCILogger8 23.24843979 367 UCILogger7 22.91410446 282 UCILogger6 23.15269279 540 UCILogger4 23.27471542 397 UCILogger3 22.94863701 601
DP41 23.13188362 374DP40 23.11302948 579DP39 23.00980377 572DP38 22.6929512 513DP37 22.39918327 339DP36 21.93152046 140DP35 22.82050323 33DP34 22.92630768 139DP33 23.05930328 181DP32 23.16127014 221DP31 23.64034462 1280DP30 22.63469505 101DP29 23.03627205 172DP28 23.65540314 1162DP27 22.81009865 1066DP26 23.41309547 1038DP25 22.85031509 135DP24 23.50796318 958DP23 22.94170189 123DP22 22.4470253 65DP21 23.11096191 206DP20 23.23603821 742DP19 23.37687874 637DP18 23.03684235 297DP17 23.08113861 160DP16 22.00945091 77DP15 22.87983322 183DP14 21.9121685 209DP13 22.77598381 281DP12 23.59365082 514DP11 23.49217224 503DP10 23.63064766 624DP9 23.79916763 716DP8 23.19146156 590DP7 23.12510872 469DP6 22.96954155 929DP5 22.81890297 792DP4 21.93353844 721DP3 23.33790207 826DP2 23.18900108 686DP1 22.94863701 621
LST15NOV28 Distance WD (12pm-0)LST15NOV28 1Distance WD (12pm-0) 0.59 1
Combined_LST_C_UCILoggerPoint_Dhanmondi_20170515.xls

1
Name LST15OCT27
Distance WD (12pm-0)
UCILogger_KI 25.90423393 0 UCILogger_KIB 25.94477844 0
UCILogger2 27.02303123 0 UCILogger1 25.83488846 0 UCILogger8 27.96661949 367 UCILogger7 27.52586937 282 UCILogger6 27.81725311 540 UCILogger4 28.00553131 397 UCILogger3 27.5649128 601
DP41 27.70175362 374DP40 27.76361847 579DP39 27.5041008 572DP38 27.20890236 513DP37 26.71101761 339DP36 25.95157242 140DP35 27.36364174 33DP34 27.71842194 139DP33 27.77272987 181DP32 28.1105423 221DP31 28.72278214 1280DP30 27.20928764 101DP29 27.91887665 172DP28 28.86738396 1162DP27 27.52939987 1066DP26 28.69121361 1038DP25 27.28120041 135DP24 28.64123344 958DP23 27.43820572 123DP22 26.82836723 65DP21 27.85104179 206DP20 28.24673843 742DP19 28.56832504 637DP18 27.77705574 297DP17 27.77989388 160DP16 26.0342083 77DP15 27.2078495 183DP14 26.02125931 209DP13 26.87330437 281DP12 28.89750671 514DP11 28.41512108 503DP10 28.93136024 624DP9 28.94553757 716DP8 28.1710434 590DP7 27.76783943 469DP6 27.68710136 929DP5 27.71287346 792DP4 26.41771126 721DP3 28.25793457 826DP2 28.12141228 686DP1 27.5649128 621
LST15OCT27 Distance WD (12pm-0)LST15OCT27 1Distance WD (12pm-0) 0.63 1
Combined_LST_C_UCILoggerPoint_Dhanmondi_20170515.xls

1
Name LST15SEPT25Distance WD (12pm-210)
UCILogger_KI 24.99556732 0 UCILogger_KIB 25.07178497 0
UCILogger8 26.51268005 0 UCILogger7 26.03376007 0 UCILogger6 26.07391548 178 UCILogger4 26.23056221 283 UCILogger3 25.76970673 150 UCILogger2 26.0718689 438 UCILogger1 24.98154259 63
DP41 26.32443619 711DP40 25.94344711 105DP39 25.71636009 49DP38 25.77305222 29DP37 25.59649277 31DP36 25.29000092 60DP35 25.89530182 107DP34 26.1004467 463DP33 26.51526642 48DP32 26.55491638 245DP31 27.09239578 373DP30 26.04083252 54DP29 26.41222954 123DP28 27.09516335 366DP27 26.14433861 71DP26 26.73960876 928DP25 25.98805046 74DP24 26.76395416 896DP23 25.95827103 636DP22 25.77359772 193DP21 26.04800415 595DP20 26.59969139 799DP19 26.83258057 702DP18 26.10860443 541DP17 26.12829208 309DP16 25.09835815 131DP15 25.88916206 198DP14 25.39480972 43DP13 26.33059883 152DP12 26.81440544 605DP11 26.55830765 349DP10 26.9229393 517DP9 27.05386925 472DP8 26.42269135 256DP7 25.9597702 77DP6 26.43149757 131DP5 26.25091553 138DP4 25.63817978 41DP3 26.5071106 349DP2 26.32857704 213DP1 25.93506813 74
LST15SEPT25 Distance WD (12pm-210)LST15SEPT25 1Distance WD (12pm-210) 0.58 1
Combined_LST_C_UCILoggerPoint_Dhanmondi_20170515.xls
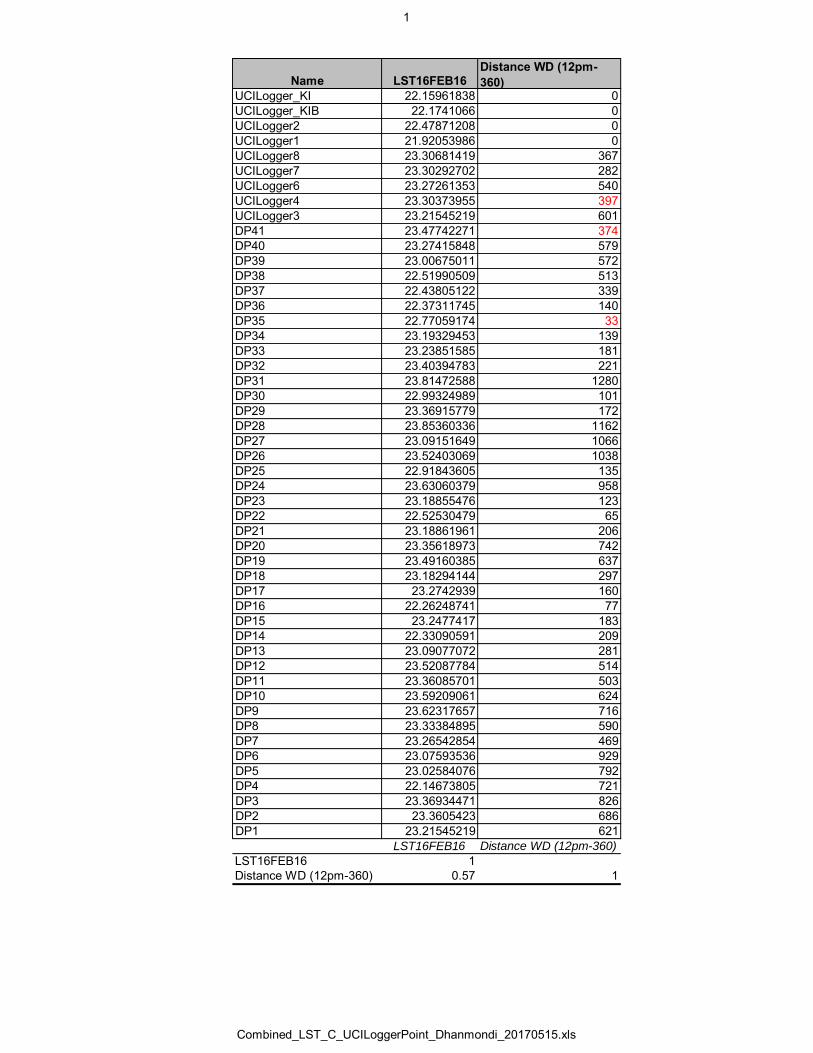
1
Name LST16FEB16Distance WD (12pm-360)
UCILogger_KI 22.15961838 0 UCILogger_KIB 22.1741066 0
UCILogger2 22.47871208 0 UCILogger1 21.92053986 0 UCILogger8 23.30681419 367 UCILogger7 23.30292702 282 UCILogger6 23.27261353 540 UCILogger4 23.30373955 397 UCILogger3 23.21545219 601
DP41 23.47742271 374DP40 23.27415848 579DP39 23.00675011 572DP38 22.51990509 513DP37 22.43805122 339DP36 22.37311745 140DP35 22.77059174 33DP34 23.19329453 139DP33 23.23851585 181DP32 23.40394783 221DP31 23.81472588 1280DP30 22.99324989 101DP29 23.36915779 172DP28 23.85360336 1162DP27 23.09151649 1066DP26 23.52403069 1038DP25 22.91843605 135DP24 23.63060379 958DP23 23.18855476 123DP22 22.52530479 65DP21 23.18861961 206DP20 23.35618973 742DP19 23.49160385 637DP18 23.18294144 297DP17 23.2742939 160DP16 22.26248741 77DP15 23.2477417 183DP14 22.33090591 209DP13 23.09077072 281DP12 23.52087784 514DP11 23.36085701 503DP10 23.59209061 624DP9 23.62317657 716DP8 23.33384895 590DP7 23.26542854 469DP6 23.07593536 929DP5 23.02584076 792DP4 22.14673805 721DP3 23.36934471 826DP2 23.3605423 686DP1 23.21545219 621
LST16FEB16 Distance WD (12pm-360)LST16FEB16 1Distance WD (12pm-360) 0.57 1
Combined_LST_C_UCILoggerPoint_Dhanmondi_20170515.xls

1
Name LST16JAN15Distance WD (12pm-0)
UCILogger_KI 18.74083328 0 UCILogger_KIB 18.84362602 0
UCILogger8 20.0084362 0 UCILogger7 19.76615524 0 UCILogger6 19.87608147 367 UCILogger4 19.7941227 282 UCILogger3 19.68351746 540 UCILogger2 19.25710869 397 UCILogger1 18.55200386 601
DP41 19.70663643 374DP40 19.83482742 579DP39 19.64854622 572DP38 19.47627258 513DP37 19.33452034 339DP36 19.02214623 140DP35 19.45546913 33DP34 19.57364845 139DP33 19.78629303 181DP32 20.06110764 221DP31 20.36043549 1280DP30 19.5863781 101DP29 19.89291 172DP28 20.47771263 1162DP27 19.58579826 1066DP26 20.1698761 1038DP25 19.60767746 135DP24 20.27838135 958DP23 19.65192413 123DP22 19.1245842 65DP21 19.72211266 206DP20 19.80314255 742DP19 19.98461151 637DP18 19.69923019 297DP17 19.83362961 160DP16 18.99092865 77DP15 19.7401371 183DP14 19.02994919 209DP13 19.7130127 281DP12 20.07063484 514DP11 19.98012924 503DP10 20.1638546 624DP9 20.30907249 716DP8 19.93962669 590DP7 19.84564209 469DP6 19.83210182 929DP5 19.56759644 792DP4 18.92821503 721DP3 20.12582397 826DP2 19.89691734 686DP1 19.68351746 621
LST16JAN15 Distance WD (12pm-0)LST16JAN15 1Distance WD (12pm-0) 0.48 1
Combined_LST_C_UCILoggerPoint_Dhanmondi_20170515.xls

1
Name LST16MAR3Distance WD (12pm-290)
UCILogger_KI 24.77837372 0 UCILogger_KIB 25.05787659 0
UCILogger8 26.56407547 0 UCILogger7 26.45191002 0 UCILogger6 26.43847084 178 UCILogger4 26.2964344 283 UCILogger3 26.25210381 150 UCILogger2 25.69402504 438 UCILogger1 24.50333023 63
DP41 26.58964157 711DP40 26.38586235 105DP39 26.09647942 49DP38 25.76172638 29DP37 25.77726173 31DP36 25.34503365 60DP35 25.56712341 107DP34 26.03742981 463DP33 26.36139679 48DP32 26.24639702 245DP31 26.72821999 373DP30 25.89201927 54DP29 26.20056343 123DP28 26.60197639 366DP27 26.06071663 71DP26 26.36354065 928DP25 26.03495979 74DP24 26.48718071 896DP23 26.42458916 636DP22 25.42116928 193DP21 26.10953331 595DP20 26.40062904 799DP19 26.53442574 702DP18 25.98200226 541DP17 26.51109886 309DP16 24.98506165 131DP15 26.34998894 198DP14 25.241745 43DP13 26.46155357 152DP12 26.71559906 605DP11 26.59600067 349DP10 26.81097412 517DP9 26.91358757 472DP8 26.49457359 256DP7 26.36897469 77DP6 26.22481155 131DP5 26.15012169 138DP4 25.37694168 41DP3 26.5899601 349DP2 26.64041519 213DP1 26.25210381 74
LST16MAR3 Distance WD (12pm-290)LST16MAR3 1Distance WD (12pm-290) 0.46 1
Combined_LST_C_UCILoggerPoint_Dhanmondi_20170515.xls

1
Name LST16NOV14
Distance WD (12pm-360)
UCILogger_KI 24.18758583 0 UCILogger_KIB 24.18758583 0
UCILogger8 25.76178932 0 UCILogger7 25.56616974 0 UCILogger6 25.69049072 367 UCILogger4 26.01422882 282 UCILogger3 25.26690483 540 UCILogger2 24.7007637 397 UCILogger1 24.22936249 601
DP41 25.56958771 374DP40 25.69405556 579DP39 25.39904785 572DP38 24.83474159 513DP37 24.70333481 339DP36 24.62117577 140DP35 25.06873131 33DP34 25.56108093 139DP33 25.95536232 181DP32 26.01483536 221DP31 26.70137024 1280DP30 25.4889946 101DP29 25.84190941 172DP28 26.52998734 1162DP27 25.58164215 1066DP26 26.33446503 1038DP25 25.54001045 135DP24 26.33153152 958DP23 25.69163322 123DP22 25.33251572 65DP21 25.6631813 206DP20 25.99007607 742DP19 26.52311897 637DP18 25.67915726 297DP17 25.77395058 160DP16 24.58778191 77DP15 25.22923088 183DP14 24.41128349 209DP13 25.17917442 281DP12 26.67565537 514DP11 26.07141113 503DP10 26.6119175 624DP9 26.61827278 716DP8 25.9393692 590DP7 25.45814514 469DP6 25.82240868 929DP5 25.29128456 792DP4 24.48386192 721DP3 26.05405235 826DP2 25.71559715 686DP1 25.53160477 621
LST16NOV14 Distance WD (12pm-360)LST16NOV14 1Distance WD (12pm-360) 0.48 1
Combined_LST_C_UCILoggerPoint_Dhanmondi_20170515.xls

1
Name LST16NOV30Distance WD (12pm-0)
UCILogger_KI 22.58520889 0 UCILogger_KIB 22.62083626 0
UCILogger2 23.33563042 0 UCILogger1 22.42624283 0 UCILogger8 24.40879822 367 UCILogger7 24.07154655 282 UCILogger6 24.33375359 540 UCILogger4 24.25638962 397 UCILogger3 24.04073524 601
DP41 23.9858532 374DP40 24.28215408 579DP39 23.95067787 572DP38 23.61395454 513DP37 23.32476616 339DP36 22.66961098 140DP35 23.55568123 33DP34 23.86967659 139DP33 23.88651657 181DP32 24.24012947 221DP31 24.81686592 1280DP30 23.60579681 101DP29 24.2095108 172DP28 24.88736343 1162DP27 23.92747879 1066DP26 24.59565544 1038DP25 23.60059929 135DP24 24.67635155 958DP23 23.84066391 123DP22 23.29746437 65DP21 24.01224136 206DP20 24.1348629 742DP19 24.46587563 637DP18 23.92476082 297DP17 24.26247025 160DP16 22.8860302 77DP15 23.91324615 183DP14 22.76467705 209DP13 23.81148148 281DP12 24.8172245 514DP11 24.46084976 503DP10 24.97382927 624DP9 25.02753258 716DP8 24.35298538 590DP7 24.15691566 469DP6 24.01189423 929DP5 23.91671562 792DP4 22.75994682 721DP3 24.52214241 826DP2 24.35403252 686DP1 24.04073524 621
LST16NOV30 Distance WD (12pm-0)LST16NOV30 1Distance WD (12pm-360) 0.63 1
Combined_LST_C_UCILoggerPoint_Dhanmondi_20170515.xls

1
Name LST17FEB18 Distance UCILogger_KI 22.24634743 0
UCILogger_KIB 22.30157852 0 UCILogger8 23.65303993 160 UCILogger7 23.42924881 265 UCILogger6 23.44867706 157 UCILogger4 23.64612579 420 UCILogger3 23.24389648 80 UCILogger2 22.60085106 0 UCILogger1 21.94315338 0
DP41 23.40809631 284DP40 23.43651962 108DP39 23.30550766 53DP38 23.12462425 37DP37 22.75092125 32DP36 22.64050484 54DP35 23.06549454 27DP34 23.42974281 130DP33 23.5180645 41DP32 23.86180878 219DP31 24.26826286 381DP30 23.19261742 52DP29 23.74727058 123DP28 24.1926918 337DP27 23.42321014 73DP26 23.98384285 312DP25 23.36884117 72DP24 23.93370628 304DP23 23.40904045 115DP22 23.09582329 65DP21 23.52274323 197DP20 23.71075249 381DP19 23.68988991 445DP18 23.51947021 293DP17 23.59653854 150DP16 22.54181862 70DP15 23.46080971 170DP14 22.62553787 40DP13 23.46196365 154DP12 23.69329834 591DP11 23.69577217 340DP10 23.85445976 522DP9 23.8921566 472DP8 23.44219589 262DP7 23.52713203 73DP6 23.34137917 81DP5 23.0481205 84DP4 22.07772827 44DP3 23.66414452 188DP2 23.30095673 218DP1 23.24389648 78
LST17FEB18 DistanceLST17FEB18 1Distance 0.699624844 1
Combined_LST_C_UCILoggerPoint_Dhanmondi_20170515.xls

1
Name LST17MAR22 Distance UCILogger_KI 21.92351913 0
UCILogger_KIB 21.94105339 0 UCILogger8 23.53137589 160 UCILogger7 23.09280014 265 UCILogger6 23.19987679 157 UCILogger4 23.19150925 420 UCILogger3 23.02290344 80 UCILogger2 22.59947586 0 UCILogger1 21.79406548 0
DP41 23.12265396 284DP40 23.17647552 108DP39 23.01342583 53DP38 22.67833138 37DP37 22.32533455 32DP36 22.06396103 54DP35 22.70689774 27DP34 23.06121254 130DP33 23.45934677 41DP32 23.49821091 219DP31 23.96851921 381DP30 22.97460365 52DP29 23.49461937 123DP28 24.08452988 337DP27 22.98265648 73DP26 23.72892952 312DP25 22.80956268 72DP24 23.61465645 304DP23 22.90384293 115DP22 22.85455704 65DP21 22.96403503 197DP20 23.5430603 381DP19 23.5814209 445DP18 22.97453308 293DP17 23.13466072 150DP16 22.08281708 70DP15 22.89976692 170DP14 22.06343269 40DP13 22.97865295 154DP12 23.49751854 591DP11 23.37978554 340DP10 23.79037094 522DP9 23.77598572 472DP8 23.35434341 262DP7 23.30615234 73DP6 23.34026337 81DP5 22.97974586 84DP4 22.05021286 44DP3 23.34622765 188DP2 23.20217705 218DP1 23.02290344 78
LST17MAR22 DistanceLST17MAR22 1Distance 0.706436221 1
Combined_LST_C_UCILoggerPoint_Dhanmondi_20170515.xls

Name LST13APR12
Distance WD (9am-200, 12pm-180)
DW_DP1 28.95789719 509DW_DP2 27.33084297 65DW_DP3 28.86349297 94DW_DP4 28.8585968 336DW_DP5 29.33179665 396DW_DP6 29.24243736 150DW_DP7 29.29669762 235DW_DP8 29.38947868 346DW_DP9 29.08367729 98DW_DP10 29.42903519 265DW_DP11 28.71652222 396DW_DP12 29.62737274 455DW_DP13 28.87569809 50DW_DP14 29.36657524 517DW_DP15 29.04884148 511DW_DP16 29.01838303 424DW_DP17 29.16185379 536DW_DP18 29.16013527 580DW_DP19 29.36651039 483DW_DP20 29.49435234 318DW_DP21 29.66441536 387DW_DP22 29.65711021 222DW_DP23 29.68217087 326DW_DP24 29.57777023 187DW_DP25 29.70368958 509DW_DP26 29.22967911 41DW_DP27 29.58985519 360DW_DP28 30.24546814 374DW_DP29 29.73584557 137DW_DP30 30.0081501 303DW_DP31 29.73766518 238DW_DP32 29.54528236 218DW_DP33 28.69837189 167DW_DP34 28.65053177 150DW_DP35 29.67712021 261DW_DP36 29.78377151 323DW_DP37 28.37061691 353DW_DP38 29.75048065 405DW_DP39 27.13711548 44
UCILogger_PWD 29.14830399 324LST13APR12 Distance WD (9am-200, 12pm-180)
LST13APR12 1Distance WD (9am-200, 12pm-180) 0.352005805 1

Name LST13DEC24
Distance WD (9am-270, 12pm-270)
DW_DP1 21.29298973 89DW_DP2 20.70066452 31DW_DP3 21.33873558 53DW_DP4 21.58759117 197DW_DP5 21.85621071 291DW_DP6 21.446064 68DW_DP7 21.73889542 176DW_DP8 21.9292202 288DW_DP9 21.5987606 92DW_DP10 21.9323101 212DW_DP11 21.66807365 320DW_DP12 21.70804596 136DW_DP13 21.12359619 23DW_DP14 21.70065498 249DW_DP15 21.63105202 343DW_DP16 21.88271904 449DW_DP17 21.81839752 464DW_DP18 21.99981689 591DW_DP19 22.091959 577DW_DP20 22.1260128 426DW_DP21 22.16114998 555DW_DP22 21.984375 426DW_DP23 21.96464348 529DW_DP24 21.89547539 201DW_DP25 21.99246407 280DW_DP26 21.37599373 137DW_DP27 21.62949562 273DW_DP28 22.26100349 389DW_DP29 21.63367844 188DW_DP30 21.65518379 377DW_DP31 21.80960274 269DW_DP32 21.69814873 149DW_DP33 21.21478844 47DW_DP34 20.98441887 43DW_DP35 21.89363861 204DW_DP36 22.06850815 292DW_DP37 21.17105865 73DW_DP38 22.02111053 148DW_DP39 20.65110397 58
UCILogger_PWD 21.86992455 314LST13DEC24 Distance WD (9am-270, 12pm-270)
LST13DEC24 1Distance WD (9am-270, 12pm-270) 0.75 1


Name LST13JUN15Distance WD (9am-90, 12pm-90)
DW_DP1 21.95865631 89DW_DP2 21.40783882 31DW_DP3 22.24785042 53DW_DP4 22.07725716 197DW_DP5 22.08502579 291DW_DP6 22.15506172 68DW_DP7 22.07564163 176DW_DP8 21.97249985 288DW_DP9 22.2494278 92DW_DP10 21.94813728 212DW_DP11 21.82358551 320DW_DP12 22.3814373 136DW_DP13 22.19264793 23DW_DP14 22.06041336 249DW_DP15 21.90695953 343DW_DP16 22.07889366 449DW_DP17 22.03710175 464DW_DP18 21.62785912 591DW_DP19 21.74951744 577DW_DP20 22.18923187 426DW_DP21 22.14189911 555DW_DP22 22.11787033 426DW_DP23 21.92404747 529DW_DP24 22.00873375 201DW_DP25 21.71125793 280DW_DP26 21.78738213 137DW_DP27 21.82344437 273DW_DP28 21.65685081 389DW_DP29 21.94270515 188DW_DP30 21.48171425 377DW_DP31 21.55597687 269DW_DP32 21.6872673 149DW_DP33 21.60241699 47DW_DP34 21.20609856 43DW_DP35 21.54617691 204DW_DP36 21.19468308 292DW_DP37 20.97101593 73DW_DP38 20.86477852 148DW_DP39 20.96318626 58
UCILogger_PWD 21.8606205 314LST13JUN15 Distance WD (9am-90, 12pm-90)
LST13JUN15 1Distance WD (9am-9 0.187292013 1

Name LST13NOV6Distance WD (9am-0, 12pm-0)
DW_DP1 25.88509369 509DW_DP2 24.98672867 27DW_DP3 25.82793808 173DW_DP4 25.79135895 170DW_DP5 26.21168709 170DW_DP6 25.96434212 287DW_DP7 26.07874298 266DW_DP8 26.19717216 279DW_DP9 26.20536041 399DW_DP10 26.18810463 400DW_DP11 26.00242424 396DW_DP12 26.0589962 455DW_DP13 25.76803207 50DW_DP14 26.19096565 517DW_DP15 26.199543 511DW_DP16 26.3412056 424DW_DP17 26.70082664 536DW_DP18 26.703022 580DW_DP19 27.07055855 483DW_DP20 26.67780685 318DW_DP21 27.11974525 387DW_DP22 26.92887306 222DW_DP23 26.83304977 326DW_DP24 26.45812035 187DW_DP25 26.78967667 509DW_DP26 25.65303802 261DW_DP27 26.33108902 360DW_DP28 27.11719513 374DW_DP29 26.22660637 256DW_DP30 26.5171032 278DW_DP31 26.25800323 196DW_DP32 26.26640892 181DW_DP33 25.27684784 238DW_DP34 25.32729912 78DW_DP35 26.35152626 141DW_DP36 26.6471653 167DW_DP37 25.34019661 52DW_DP38 26.92116165 80DW_DP39 24.76049232 577
UCILogger_PWD 26.00055313 324LST13NOV6 Distance WD (9am-0, 12pm-0)
LST13NOV6 1Distance WD (9am-0, 12pm-0) 0.264311946 1

Name LST14FEB10Distance WD (12pm-50)
DW_DP1 21.2500267 509DW_DP2 19.80583191 27DW_DP3 21.26882362 173DW_DP4 21.23693657 170DW_DP5 21.50837708 170DW_DP6 21.30121613 287DW_DP7 21.43424416 266DW_DP8 21.46463585 279DW_DP9 21.38700294 399DW_DP10 21.60222244 400DW_DP11 21.16921234 396DW_DP12 21.57628822 455DW_DP13 20.82612038 50DW_DP14 21.61466599 517DW_DP15 21.35234833 511DW_DP16 21.2308197 424DW_DP17 21.07157516 536DW_DP18 20.08674431 580DW_DP19 21.71539307 483DW_DP20 21.61661148 318DW_DP21 21.63564873 387DW_DP22 21.50771713 222DW_DP23 21.29188919 326DW_DP24 21.69521904 187DW_DP25 21.4795723 509DW_DP26 21.33053398 261DW_DP27 21.3535099 360DW_DP28 22.029953 374DW_DP29 21.50939751 256DW_DP30 21.79060173 278DW_DP31 21.63393211 196DW_DP32 21.67822075 181DW_DP33 21.18661499 238DW_DP34 20.71076775 78DW_DP35 21.63150978 141DW_DP36 21.8997879 167DW_DP37 20.65870857 52DW_DP38 22.11941719 80DW_DP39 20.05394554 577
UCILogger_PWD 21.37178802 324LST14FEB10 Distance WD (12pm-50)
LST14FEB10 1Distance WD (12pm-50) -0.03 1

Name LST14FEB26 Distance WD (12pm-50)
DW_DP1 22.71440506 509DW_DP2 21.52771759 27DW_DP3 23.11514854 173DW_DP4 22.81243324 170DW_DP5 23.07728767 170DW_DP6 23.23098755 287DW_DP7 23.14871216 266DW_DP8 23.28301811 279DW_DP9 23.13466072 399DW_DP10 23.23606491 400DW_DP11 22.85917473 396DW_DP12 23.36474419 455DW_DP13 22.71306038 50DW_DP14 23.270298 517DW_DP15 22.79227448 511DW_DP16 23.13870239 424DW_DP17 22.94420242 536DW_DP18 23.07791328 580DW_DP19 23.77965546 483DW_DP20 23.48591042 318DW_DP21 23.80456924 387DW_DP22 23.38222504 222DW_DP23 23.38828087 326DW_DP24 23.38771057 187DW_DP25 23.47502708 509DW_DP26 22.91074181 261DW_DP27 22.99011803 360DW_DP28 23.89157486 374DW_DP29 23.2381382 256DW_DP30 23.44663048 278DW_DP31 23.40936661 196DW_DP32 23.47001648 181DW_DP33 22.70137787 238DW_DP34 22.34452057 78DW_DP35 23.41417694 141DW_DP36 23.44741249 167DW_DP37 22.10783005 52DW_DP38 23.57925606 80DW_DP39 21.40253639 577
UCILogger_PWD 23.12308693 324LST14FEB26 Distance WD (12pm-50)
LST14FEB26 1Distance WD (12pm-50) 0.13 1

Name LST14JAN25 Distance WD (9am-270)DW_DP1 21.18372154 89DW_DP2 19.86787605 31DW_DP3 21.14456749 53DW_DP4 21.14901161 197DW_DP5 21.47565079 291DW_DP6 21.17416 68DW_DP7 21.36197853 176DW_DP8 21.50717163 288DW_DP9 21.38810921 92DW_DP10 21.57784843 212DW_DP11 21.05452538 320DW_DP12 21.40512276 136DW_DP13 20.52709007 23DW_DP14 21.43259621 249DW_DP15 21.16544914 343DW_DP16 21.53602028 449DW_DP17 21.48896217 464DW_DP18 21.56572533 591DW_DP19 21.95142365 577DW_DP20 22.02389908 426DW_DP21 21.99402428 555DW_DP22 21.7484417 426DW_DP23 21.53311729 529DW_DP24 21.65283775 201DW_DP25 21.72779846 280DW_DP26 21.13618088 137DW_DP27 21.34688568 273DW_DP28 22.0639782 389DW_DP29 21.67780495 188DW_DP30 21.73455238 377DW_DP31 21.95353889 269DW_DP32 21.78641891 149DW_DP33 21.11351776 47DW_DP34 20.51395798 43DW_DP35 21.9037571 204DW_DP36 21.8372364 292DW_DP37 20.55254555 73DW_DP38 21.8641777 148DW_DP39 19.90518379 58
UCILogger_PWD 21.37257004 314LST14JAN25 Distance WD (9am-270)
LST14JAN25 1Distance WD (9am-270) 0.62 1


Name LST14MAR14Distance WD (12pm-360)
DW_DP1 27.83653069 509DW_DP2 25.92771339 27DW_DP3 27.53509331 173DW_DP4 27.77313614 170DW_DP5 28.19771576 170DW_DP6 28.09882927 287DW_DP7 28.08064079 266DW_DP8 28.35075378 279DW_DP9 27.96924782 399DW_DP10 28.4114151 400DW_DP11 27.99795341 396DW_DP12 27.94600296 455DW_DP13 27.23954201 50DW_DP14 28.55514908 517DW_DP15 27.87121582 511DW_DP16 28.35575294 424DW_DP17 28.24697876 536DW_DP18 28.65777397 580DW_DP19 28.66233253 483DW_DP20 28.78842163 318DW_DP21 28.84275818 387DW_DP22 28.50135231 222DW_DP23 28.20978737 326DW_DP24 28.43980789 187DW_DP25 28.42363739 509DW_DP26 28.01243401 261DW_DP27 28.25651741 360DW_DP28 28.9236412 374DW_DP29 28.59032059 256DW_DP30 28.81522751 278DW_DP31 28.58806419 196DW_DP32 28.38840866 181DW_DP33 27.59379578 238DW_DP34 27.46425629 78DW_DP35 28.44775391 141DW_DP36 28.73087692 167DW_DP37 26.79078102 52DW_DP38 28.62261391 80DW_DP39 25.82839966 577
UCILogger_PWD 28.33613205 324LST14MAR14 Distance WD (12pm-360)
LST14MAR14 1Distance WD (12pm-360) 0.20 1

Name LST14MAR30Distance WD (9am-240, 12pm-250)
DW_DP1 33.61787033 89DW_DP2 31.38440895 31DW_DP3 33.72140121 53DW_DP4 33.77561188 197DW_DP5 34.2911644 291DW_DP6 33.72712326 68DW_DP7 34.21504211 176DW_DP8 34.61620712 288DW_DP9 33.98496246 92DW_DP10 34.47325897 212DW_DP11 34.13871384 320DW_DP12 34.39377213 136DW_DP13 32.89753723 23DW_DP14 34.42948151 249DW_DP15 34.00094986 343DW_DP16 34.2823143 449DW_DP17 34.37247086 464DW_DP18 34.69065475 591DW_DP19 35.04236984 577DW_DP20 35.06632614 426DW_DP21 35.0761261 555DW_DP22 34.87301254 426DW_DP23 34.26702118 529DW_DP24 34.52825165 201DW_DP25 34.46055222 280DW_DP26 34.06145477 137DW_DP27 34.00384521 273DW_DP28 35.2827034 389DW_DP29 34.94768906 188DW_DP30 35.26515579 377DW_DP31 35.18164825 269DW_DP32 34.98906326 149DW_DP33 33.48957062 47DW_DP34 32.88623428 43DW_DP35 34.78432846 204DW_DP36 34.85029602 292DW_DP37 32.96969223 73DW_DP38 34.79711533 148DW_DP39 31.40942383 58
UCILogger_PWD 34.50806046 314LST14MAR30 Distance WD (9am-240, 12pm-250)
LST14MAR30 1Distance WD (9am-270, 12pm-270) 0.62 1

Name LST14NOV25Distance WD (12pm-270)
DW_DP1 22.91063499 89DW_DP2 21.94418335 31DW_DP3 22.559021 53DW_DP4 22.77630043 197DW_DP5 23.1698761 291DW_DP6 22.92641068 68DW_DP7 22.97971153 176DW_DP8 23.26277924 288DW_DP9 22.82282066 92DW_DP10 23.09713554 212DW_DP11 22.51706123 320DW_DP12 22.78500366 136DW_DP13 22.52007675 23DW_DP14 23.09863853 249DW_DP15 22.73962021 343DW_DP16 23.3199749 449DW_DP17 23.17499733 464DW_DP18 23.39904785 591DW_DP19 23.5225544 577DW_DP20 23.4677372 426DW_DP21 23.83959389 555DW_DP22 23.19160271 426DW_DP23 23.39322662 529DW_DP24 23.29368782 201DW_DP25 23.27226639 280DW_DP26 22.72547913 137DW_DP27 22.97504234 273DW_DP28 23.59886169 389DW_DP29 23.00102615 188DW_DP30 23.22255325 377DW_DP31 23.11132622 269DW_DP32 22.99685097 149DW_DP33 22.58162117 47DW_DP34 22.3573513 43DW_DP35 23.18387222 204DW_DP36 23.50171852 292DW_DP37 22.2955246 73DW_DP38 23.23373413 148DW_DP39 21.86547661 58
UCILogger_PWD 23.04258728 314LST14NOV25 Distance WD (12pm-270)
LST14NOV25 1Distance WD (12pm-270) 0.75 1

Name LST15APRIL18
Distance WD (12pm-240)
DW_DP1 26.12661934 89DW_DP2 24.78730392 31DW_DP3 25.78170204 53DW_DP4 26.15192604 197DW_DP5 26.74104881 291DW_DP6 26.5711174 68DW_DP7 26.77507591 176DW_DP8 27.13092804 288DW_DP9 26.46225929 92DW_DP10 26.99249268 212DW_DP11 26.81687355 320DW_DP12 26.77795219 136DW_DP13 26.08176613 23DW_DP14 26.97561836 249DW_DP15 26.80854797 343DW_DP16 27.03079987 449DW_DP17 27.19995689 464DW_DP18 27.53151512 591DW_DP19 27.45005226 577DW_DP20 27.46313095 426DW_DP21 27.75742722 555DW_DP22 27.50187302 426DW_DP23 27.23493004 529DW_DP24 27.08253288 201DW_DP25 27.40272522 280DW_DP26 26.47068596 137DW_DP27 26.8672142 273DW_DP28 27.59274864 389DW_DP29 26.97686768 188DW_DP30 27.18815994 377DW_DP31 26.92538452 269DW_DP32 26.43162346 149DW_DP33 25.47333527 47DW_DP34 25.71751213 43DW_DP35 26.52779961 204DW_DP36 26.77441788 292DW_DP37 25.16032982 73DW_DP38 26.61255264 148DW_DP39 24.54416275 58
UCILogger_PWD 27.07656288 314LST15APRIL18 Distance WD (12pm-240)
LST15APRIL18 1Distance WD (12pm-240) 0.80 1

Name LST15DEC30Distance WD (12pm-0)
DW_DP1 19.35626793 509DW_DP2 18.66500854 27DW_DP3 19.14376259 173DW_DP4 19.35754395 170DW_DP5 19.5530014 170DW_DP6 19.32640076 287DW_DP7 19.5069294 266DW_DP8 19.46137047 279DW_DP9 19.31986046 399DW_DP10 19.46277618 400DW_DP11 19.27908134 396DW_DP12 19.40044212 455DW_DP13 19.02845001 50DW_DP14 19.54455948 517DW_DP15 19.36566544 511DW_DP16 19.59525871 424DW_DP17 19.48278809 536DW_DP18 19.69050598 580DW_DP19 19.63117599 483DW_DP20 19.80012703 318DW_DP21 19.82977104 387DW_DP22 19.54107094 222DW_DP23 19.46565247 326DW_DP24 19.54812813 187DW_DP25 19.58579254 509DW_DP26 19.12573624 261DW_DP27 19.29234123 360DW_DP28 19.65416908 374DW_DP29 19.21351242 256DW_DP30 19.49595833 278DW_DP31 19.21767616 196DW_DP32 19.23844719 181DW_DP33 19.0489502 238DW_DP34 19.00073242 78DW_DP35 19.28347206 141DW_DP36 19.58980179 167DW_DP37 18.83094597 52DW_DP38 19.54800606 80DW_DP39 18.46168327 577
UCILogger_PWD 19.45927429 324LST15DEC30 Distance WD (12pm-0)
LST15DEC30 1Distance WD (12pm-0) 0.32 1

Name LST15FEB13Distance WD (12pm-270)
DW_DP1 20.2234211 89DW_DP2 19.19548416 31DW_DP3 20.23931122 53DW_DP4 20.31364059 197DW_DP5 20.61742592 291DW_DP6 20.46596146 68DW_DP7 20.40509987 176DW_DP8 20.51019478 288DW_DP9 20.28354263 92DW_DP10 20.43811035 212DW_DP11 20.08980179 320DW_DP12 20.24690628 136DW_DP13 19.97310638 23DW_DP14 20.53719521 249DW_DP15 20.14632225 343DW_DP16 20.27072906 449DW_DP17 20.35370064 464DW_DP18 20.61628723 591DW_DP19 20.68200874 577DW_DP20 20.60539818 426DW_DP21 20.76353645 555DW_DP22 20.51915932 426DW_DP23 20.38508224 529DW_DP24 20.50251579 201DW_DP25 20.47980309 280DW_DP26 20.09845161 137DW_DP27 20.26345062 273DW_DP28 20.85294914 389DW_DP29 20.44223785 188DW_DP30 20.60732079 377DW_DP31 20.50539207 269DW_DP32 20.37861061 149DW_DP33 19.90446854 47DW_DP34 19.90838432 43DW_DP35 20.41363335 204DW_DP36 20.55574799 292DW_DP37 19.56109238 73DW_DP38 20.66790962 148DW_DP39 18.84983635 58
UCILogger_PWD 20.2814312 314LST15FEB13 Distance WD (12pm-270)
LST15FEB13 1Distance WD (12pm-270) 0.58 1

Name LST15JAN28Distance WD (12pm-0)
DW_DP1 20.346365 509DW_DP2 19.4479637 27DW_DP3 20.282526 173DW_DP4 20.734581 170DW_DP5 21.0186138 170DW_DP6 20.8332424 287DW_DP7 20.9462776 266DW_DP8 21.1995392 279DW_DP9 20.5092545 399DW_DP10 21.2783146 400DW_DP11 21.0728321 396DW_DP12 20.9106827 455DW_DP13 20.1872368 50DW_DP14 21.2647438 517DW_DP15 20.9023724 511DW_DP16 21.1464272 424DW_DP17 21.1482258 536DW_DP18 21.552393 580DW_DP19 21.5458298 483DW_DP20 21.3266869 318DW_DP21 21.5651169 387DW_DP22 21.1637745 222DW_DP23 21.1158581 326DW_DP24 21.0112953 187DW_DP25 21.3190193 509DW_DP26 20.5976944 261DW_DP27 20.6666794 360DW_DP28 21.1700268 374DW_DP29 20.9793797 256DW_DP30 20.9960175 278DW_DP31 21.0247936 196DW_DP32 20.8159027 181DW_DP33 19.9398365 238DW_DP34 20.4763527 78DW_DP35 21.072958 141DW_DP36 21.3640823 167DW_DP37 19.8019257 52DW_DP38 20.9768562 80DW_DP39 19.2791634 577
UCILogger_PWD 21.1616707 324LST15JAN28 Distance WD (12pm-0)
LST15JAN28 1Distance WD (12pm-0) 0.32 1

Name LST15MAR17
Distance WD (12pm-270)
DW_DP1 24.23814011 89DW_DP2 23.52156067 31DW_DP3 24.61844063 53DW_DP4 24.63724899 197DW_DP5 24.67419243 291DW_DP6 24.95020294 68DW_DP7 24.9009819 176DW_DP8 24.83939552 288DW_DP9 24.84752655 92DW_DP10 24.98726273 212DW_DP11 24.30470657 320DW_DP12 24.83336258 136DW_DP13 24.77239037 23DW_DP14 25.02953339 249DW_DP15 24.6521244 343DW_DP16 24.55590057 449DW_DP17 24.65556335 464DW_DP18 24.56152534 591DW_DP19 24.43317986 577DW_DP20 24.58563614 426DW_DP21 24.42487144 555DW_DP22 24.22609711 426DW_DP23 24.10147476 529DW_DP24 24.52497101 201DW_DP25 24.38453865 280DW_DP26 24.33739281 137DW_DP27 24.58007813 273DW_DP28 25.07480812 389DW_DP29 24.97159386 188DW_DP30 24.91139221 377DW_DP31 24.86240578 269DW_DP32 24.97024155 149DW_DP33 24.52710915 47DW_DP34 24.09539604 43DW_DP35 24.64081955 204DW_DP36 24.67180824 292DW_DP37 23.70837402 73DW_DP38 24.59415245 148DW_DP39 23.30380058 58
UCILogger_PWD 24.60948181 314LST15MAR17 Distance WD (12pm-270)
LST15MAR17 1Distance WD (12pm-270) 0.14 1

Name LST15MAY4Distance WD (12pm-130)
DW_DP1 28.48204422 509DW_DP2 27.16413879 65DW_DP3 28.25348282 94DW_DP4 28.52547836 336DW_DP5 29.06589317 396DW_DP6 28.97064781 150DW_DP7 29.1020546 235DW_DP8 29.34956741 346DW_DP9 28.73234177 98DW_DP10 29.24014282 265DW_DP11 29.08397102 396DW_DP12 28.78626442 455DW_DP13 28.35130501 50DW_DP14 29.23067665 517DW_DP15 29.0873642 511DW_DP16 29.06129837 424DW_DP17 29.31108284 536DW_DP18 29.60822105 580DW_DP19 29.58245659 483DW_DP20 29.4757328 318DW_DP21 29.86571121 387DW_DP22 29.58629227 222DW_DP23 29.52508545 326DW_DP24 29.42101288 187DW_DP25 29.56125069 509DW_DP26 28.75180244 41DW_DP27 29.24999046 360DW_DP28 30.02316284 374DW_DP29 29.36109924 137DW_DP30 29.62166595 303DW_DP31 29.3553772 238DW_DP32 28.90378761 218DW_DP33 27.89078712 167DW_DP34 28.1772747 150DW_DP35 29.10059547 261DW_DP36 29.34770203 323DW_DP37 27.7547226 353DW_DP38 29.14797592 405DW_DP39 26.98035049 44
UCILogger_PWD 29.22504997 324LST15MAY4 Distance WD (12pm-130)
LST15MAY4 1Distance WD (12pm-130) 0.51 1

Name LST15NOV12Distance WD (12pm-0)
DW_DP1 26.99564743 509DW_DP2 25.76623917 27DW_DP3 27.02079773 173DW_DP4 27.05706024 170DW_DP5 27.55653 170DW_DP6 27.30381775 287DW_DP7 27.15375137 266DW_DP8 27.23791313 279DW_DP9 27.11696434 399DW_DP10 27.36795616 400DW_DP11 26.79493713 396DW_DP12 26.83356476 455DW_DP13 26.54713631 50DW_DP14 27.31122971 517DW_DP15 26.89057732 511DW_DP16 27.26222038 424DW_DP17 27.19685936 536DW_DP18 27.36183167 580DW_DP19 27.82008171 483DW_DP20 27.91252327 318DW_DP21 27.86175156 387DW_DP22 27.65021896 222DW_DP23 27.52059364 326DW_DP24 27.41145706 187DW_DP25 27.51071739 509DW_DP26 26.95630264 261DW_DP27 27.23538589 360DW_DP28 27.82404327 374DW_DP29 27.25528717 256DW_DP30 27.29313469 278DW_DP31 27.70151711 196DW_DP32 27.53235817 181DW_DP33 26.5887661 238DW_DP34 26.46166229 78DW_DP35 27.73377609 141DW_DP36 27.64635277 167DW_DP37 26.16446114 52DW_DP38 27.72153282 80DW_DP39 25.65202522 577
UCILogger_PWD 27.10024261 324LST15NOV12 Distance WD (12pm-0)
LST15NOV12 1Distance WD (12pm-0) 0.11 1

Name LST15NOV28
Distance WD (12pm-0)
DW_DP1 22.89214706 509DW_DP2 21.92383194 27DW_DP3 22.68466759 173DW_DP4 22.76096344 170DW_DP5 23.2090416 170DW_DP6 22.72232056 287DW_DP7 23.05101395 266DW_DP8 23.01645088 279DW_DP9 22.94252586 399DW_DP10 23.00752449 400DW_DP11 22.60483933 396DW_DP12 22.82714462 455DW_DP13 22.3304615 50DW_DP14 22.83135223 517DW_DP15 22.65512657 511DW_DP16 22.97522163 424DW_DP17 22.84397697 536DW_DP18 22.88188362 580DW_DP19 23.16125107 483DW_DP20 23.19325829 318DW_DP21 23.26364326 387DW_DP22 23.08029366 222DW_DP23 22.84887314 326DW_DP24 23.08205986 187DW_DP25 22.74458122 509DW_DP26 22.71378899 261DW_DP27 22.86055946 360DW_DP28 23.12124062 374DW_DP29 22.73813057 256DW_DP30 22.82238197 278DW_DP31 22.91499329 196DW_DP32 22.91944504 181DW_DP33 22.80861282 238DW_DP34 22.16419029 78DW_DP35 22.97924042 141DW_DP36 23.13259697 167DW_DP37 22.33650589 52DW_DP38 23.47323418 80DW_DP39 21.81532097 577
UCILogger_PWD 22.83078003 324LST15NOV28 Distance WD (12pm-0)
LST15NOV28 1Distance WD (12pm-0) 0.10 1

Name LST15OCT27Distance WD (12pm-0)
DW_DP1 27.59517097 509DW_DP2 26.41083717 27DW_DP3 27.49738693 173DW_DP4 27.45519447 170DW_DP5 28.01793289 170DW_DP6 27.72128677 287DW_DP7 27.83703804 266DW_DP8 27.90311432 279DW_DP9 27.77222443 399DW_DP10 27.79910469 400DW_DP11 27.46105576 396DW_DP12 27.6458931 455DW_DP13 27.2083683 50DW_DP14 27.71976852 517DW_DP15 27.70387077 511DW_DP16 27.97961807 424DW_DP17 27.96711922 536DW_DP18 27.75621033 580DW_DP19 28.09443665 483DW_DP20 28.27488709 318DW_DP21 28.55330467 387DW_DP22 28.2942028 222DW_DP23 28.08028603 326DW_DP24 28.11181259 187DW_DP25 28.16804314 509DW_DP26 27.29574394 261DW_DP27 27.83889961 360DW_DP28 28.53358841 374DW_DP29 27.73115158 256DW_DP30 27.81933594 278DW_DP31 27.85658455 196DW_DP32 27.7136631 181DW_DP33 27.37025452 238DW_DP34 26.65791893 78DW_DP35 27.82586861 141DW_DP36 27.92582512 167DW_DP37 26.95811462 52DW_DP38 28.39833832 80DW_DP39 26.14357948 577
UCILogger_PWD 27.72051048 324LST15OCT27 Distance WD (12pm-0)
LST15OCT27 1Distance WD (12pm-0) 0.19 1

Name LST15SEPT25Distance WD (12pm-210)
DW_DP1 25.87734985 89DW_DP2 25.10789108 31DW_DP3 25.69908142 53DW_DP4 25.69713974 197DW_DP5 26.26877594 291DW_DP6 25.84822655 68DW_DP7 26.20968437 176DW_DP8 26.3771553 288DW_DP9 25.94521523 92DW_DP10 26.12932205 212DW_DP11 26.09974861 320DW_DP12 26.1930294 136DW_DP13 25.66591835 23DW_DP14 26.24375725 249DW_DP15 26.1010704 343DW_DP16 26.16704178 449DW_DP17 26.41378403 464DW_DP18 26.48934746 591DW_DP19 26.96621132 577DW_DP20 26.49056053 426DW_DP21 26.66942215 555DW_DP22 26.5107975 426DW_DP23 26.41272736 529DW_DP24 26.30874443 201DW_DP25 26.63069153 280DW_DP26 25.93961716 137DW_DP27 26.18717003 273DW_DP28 26.73727608 389DW_DP29 26.26908684 188DW_DP30 26.46072197 377DW_DP31 26.37009811 269DW_DP32 25.93209648 149DW_DP33 25.48414993 47DW_DP34 25.35270309 43DW_DP35 26.08110046 204DW_DP36 26.41309547 292DW_DP37 25.29710197 73DW_DP38 26.43455124 148DW_DP39 25.01698112 58
UCILogger_PWD 26.2511692 314LST15SEPT25 Distance WD (12pm-210)
LST15SEPT25 1Distance WD (12pm-210) 0.79 1

Name LST16FEB16Distance WD (12pm-360)
DW_DP1 22.9659653 509DW_DP2 22.3499317 27DW_DP3 22.8296604 173DW_DP4 23.0152798 170DW_DP5 23.2716904 170DW_DP6 23.0335999 287DW_DP7 23.2703571 266DW_DP8 23.1370659 279DW_DP9 23.1321125 399DW_DP10 23.1873264 400DW_DP11 22.9752426 396DW_DP12 22.9355202 455DW_DP13 22.8152065 50DW_DP14 23.1983452 517DW_DP15 23.018795 511DW_DP16 23.3811302 424DW_DP17 23.251543 536DW_DP18 23.4205589 580DW_DP19 23.3717613 483DW_DP20 23.5147114 318DW_DP21 23.6134453 387DW_DP22 23.315361 222DW_DP23 23.2127781 326DW_DP24 23.2181396 187DW_DP25 23.225769 509DW_DP26 22.8267899 261DW_DP27 23.018795 360DW_DP28 23.4337349 374DW_DP29 22.9792042 256DW_DP30 23.2514801 278DW_DP31 22.982069 196DW_DP32 23.0030022 181DW_DP33 22.8218555 238DW_DP34 22.7508144 78DW_DP35 23.0705585 141DW_DP36 23.3953857 167DW_DP37 22.6375427 52DW_DP38 23.3166885 80DW_DP39 22.0030174 577
UCILogger_PWD 23.1418953 324LST16FEB16 Distance WD (12pm-360)
LST16FEB16 1Distance WD (12pm-0) 0.21 1

Name LST16JAN15Distance WD (12pm-0)
DW_DP1 19.54755974 509DW_DP2 18.78773308 27DW_DP3 19.49594307 173DW_DP4 19.40645599 170DW_DP5 19.70943832 170DW_DP6 19.5801506 287DW_DP7 19.59175491 266DW_DP8 19.72471046 279DW_DP9 19.74416351 399DW_DP10 19.75791359 400DW_DP11 19.43231583 396DW_DP12 19.58768654 455DW_DP13 19.24011993 50DW_DP14 19.68405533 517DW_DP15 19.55937576 511DW_DP16 19.79035378 424DW_DP17 19.78415489 536DW_DP18 19.76636124 580DW_DP19 20.16456985 483DW_DP20 19.98581505 318DW_DP21 20.16997528 387DW_DP22 19.75101852 222DW_DP23 19.68135071 326DW_DP24 19.75090027 187DW_DP25 19.69728851 509DW_DP26 19.45874596 261DW_DP27 19.53759766 360DW_DP28 19.97435188 374DW_DP29 19.40283394 256DW_DP30 19.44735718 278DW_DP31 19.34631157 196DW_DP32 19.59301758 181DW_DP33 19.42128372 238DW_DP34 19.05543327 78DW_DP35 19.54220772 141DW_DP36 19.86590004 167DW_DP37 19.19069672 52DW_DP38 19.92498589 80DW_DP39 18.68899536 577
UCILogger_PWD 19.64006615 324LST16JAN15 Distance WD (12pm-0)
LST16JAN15 1Distance WD (12pm-0) 0.30 1

Name LST16MAR3
Distance WD (12pm-290)
DW_DP1 25.60401344 89DW_DP2 24.5760231 31DW_DP3 25.60490608 53DW_DP4 25.71974373 197DW_DP5 26.09534073 291DW_DP6 25.85120583 68DW_DP7 25.94301033 176DW_DP8 26.20421791 288DW_DP9 25.72389984 92DW_DP10 26.12114143 212DW_DP11 25.71653175 320DW_DP12 25.9078083 136DW_DP13 25.35528564 23DW_DP14 26.08679581 249DW_DP15 25.83785057 343DW_DP16 26.03648949 449DW_DP17 25.92667198 464DW_DP18 26.54208565 591DW_DP19 26.78783226 577DW_DP20 26.47003937 426DW_DP21 26.73921585 555DW_DP22 26.41044807 426DW_DP23 26.38256073 529DW_DP24 26.2890892 201DW_DP25 26.29076386 280DW_DP26 25.78597641 137DW_DP27 25.95303535 273DW_DP28 26.65179443 389DW_DP29 26.17185211 188DW_DP30 26.16172409 377DW_DP31 26.08288956 269DW_DP32 25.96019745 149DW_DP33 25.06103325 47DW_DP34 25.36260223 43DW_DP35 26.04450989 204DW_DP36 26.40891075 292DW_DP37 24.87702179 73DW_DP38 26.21779823 148DW_DP39 24.45985222 58
UCILogger_PWD 26.03869247 314LST16MAR3 Distance WD (12pm-290)
LST16MAR3 1Distance WD (12pm-290) 0.75 1

Name LST16NOV14Distance WD (12pm-360)
DW_DP1 25.79252052 509DW_DP2 24.88327408 27DW_DP3 25.31123352 173DW_DP4 25.66493988 170DW_DP5 26.00790596 170DW_DP6 25.69445038 287DW_DP7 25.82601357 266DW_DP8 25.67070961 279DW_DP9 25.58016396 399DW_DP10 25.69584465 400DW_DP11 25.37179375 396DW_DP12 25.54035378 455DW_DP13 25.26965141 50DW_DP14 25.72055244 517DW_DP15 25.49753189 511DW_DP16 26.18613815 424DW_DP17 26.19094086 536DW_DP18 26.19497108 580DW_DP19 26.10109138 483DW_DP20 26.09954643 318DW_DP21 26.61589241 387DW_DP22 26.01885414 222DW_DP23 26.02293777 326DW_DP24 26.0143528 187DW_DP25 25.70922661 509DW_DP26 25.42188072 261DW_DP27 25.71876526 360DW_DP28 26.05063629 374DW_DP29 25.54872513 256DW_DP30 25.76552582 278DW_DP31 25.4477272 196DW_DP32 25.51685333 181DW_DP33 25.1620121 238DW_DP34 25.09357071 78DW_DP35 25.8102417 141DW_DP36 26.02336121 167DW_DP37 25.01140022 52DW_DP38 26.2298851 80DW_DP39 24.42117882 577
UCILogger_PWD 25.47258568 324LST16NOV14 Distance WD (12pm-360)
LST16NOV14 1Distance WD (12pm-360) 0.22 1

Name LST16NOV30Distance WD (12pm-0)
DW_DP1 24.07687 509DW_DP2 22.8798618 27DW_DP3 23.7846165 173DW_DP4 23.8896961 170DW_DP5 24.4401207 170DW_DP6 23.8584385 287DW_DP7 24.1500778 266DW_DP8 24.2489662 279DW_DP9 24.2431717 399DW_DP10 24.1547222 400DW_DP11 23.9472656 396DW_DP12 24.0212555 455DW_DP13 23.4316235 50DW_DP14 23.9988079 517DW_DP15 23.9300156 511DW_DP16 24.2978611 424DW_DP17 24.0933723 536DW_DP18 23.9654694 580DW_DP19 24.6258316 483DW_DP20 24.6188431 318DW_DP21 24.8482246 387DW_DP22 24.4862576 222DW_DP23 24.2852917 326DW_DP24 24.295433 187DW_DP25 24.1945915 509DW_DP26 23.6100597 261DW_DP27 24.0906887 360DW_DP28 24.5111427 374DW_DP29 23.7888145 256DW_DP30 23.9993973 278DW_DP31 23.9122562 196DW_DP32 23.89361 181DW_DP33 23.6762905 238DW_DP34 22.9521408 78DW_DP35 23.9358902 141DW_DP36 24.2113438 167DW_DP37 23.4095268 52DW_DP38 24.4982224 80DW_DP39 22.8139019 577
UCILogger_PWD 24.0939789 324LST16NOV30 Distance WD (12pm-0)
LST16NOV30 1Distance WD (12pm-0) 0.26 1

Name LST17FEB18 DistanceDW_DP1 23.21567535 60DW_DP2 22.37114716 17DW_DP3 23.02347565 52DW_DP4 23.12710762 90DW_DP5 23.45149994 134DW_DP6 22.9605484 52DW_DP7 23.2528553 168DW_DP8 23.36077881 280DW_DP9 23.22277451 85DW_DP10 23.33471107 207DW_DP11 23.12059784 314DW_DP12 23.19663811 124DW_DP13 22.50556374 31DW_DP14 23.40527153 230DW_DP15 23.3057251 334DW_DP16 23.62306786 438DW_DP17 23.62955475 456DW_DP18 23.43490791 579DW_DP19 23.72403717 570DW_DP20 23.72907448 412DW_DP21 23.96988487 533DW_DP22 23.64112282 414DW_DP23 23.45601082 533DW_DP24 23.52626801 173DW_DP25 23.53326607 286DW_DP26 23.20909882 50DW_DP27 23.33840561 169DW_DP28 23.67893791 284DW_DP29 23.1371212 160DW_DP30 23.51711082 290DW_DP31 23.2289238 253DW_DP32 23.34571648 138DW_DP33 23.10275459 36DW_DP34 22.80254555 36DW_DP35 23.37903023 148DW_DP36 23.61139297 169DW_DP37 22.79532242 46DW_DP38 23.79169846 56DW_DP39 22.27600288 40
UCILogger_PWD 23.35278702 291LST17FEB18 Distance
LST17FEB18 1Distance 0.662680768 1

Name LST17MAR22 DistanceDW_DP1 23.13405609 60DW_DP2 22.17937851 17DW_DP3 22.89559174 52DW_DP4 22.94605827 90DW_DP5 23.35374641 134DW_DP6 22.91369629 52DW_DP7 23.16709328 168DW_DP8 23.16497993 280DW_DP9 23.18932152 85DW_DP10 23.04842949 207DW_DP11 22.93556595 314DW_DP12 23.20923042 124DW_DP13 22.59936905 31DW_DP14 23.22274017 230DW_DP15 22.98255348 334DW_DP16 23.42764091 438DW_DP17 23.52613258 456DW_DP18 23.34090996 579DW_DP19 23.25079346 570DW_DP20 23.44652939 412DW_DP21 23.56288528 533DW_DP22 23.48319244 414DW_DP23 23.31802559 533DW_DP24 23.46072578 173DW_DP25 23.37316513 286DW_DP26 23.07016563 50DW_DP27 23.17916489 169DW_DP28 23.43778419 284DW_DP29 23.11474609 160DW_DP30 23.38406181 290DW_DP31 23.30942345 253DW_DP32 23.0478363 138DW_DP33 22.79834938 36DW_DP34 22.50889015 36DW_DP35 23.22893524 148DW_DP36 23.46387863 169DW_DP37 22.57331467 46DW_DP38 23.49269104 56DW_DP39 21.879776 40
UCILogger_PWD 23.09191132 291LST17MAR22 Distance
LST17MAR22 1Distance 0.584719528 1

Appendix B: Data from the field measurement and Remote Sensing
Hatirjheel Lake Area: Land Surface Temperature and Distance from Lake edge_2013-17

1
Name LST14FEB10 Distance WD (12pm-50)
UCILogger7_BPP 21.07230759 175 UCILogger6_Ledge 20.6345005 0
UCILogger8 21.1095314 121 UCILogger7 21.2079792 633 UCILogger6 20.90851784 542 UCILogger4 20.68213081 448 UCILogger3 21.70109558 218 UCILogger2 21.28859138 0 UCILogger1 18.86213303 0
HP44 21.53298187 156HP43 21.72225952 215HP42 21.41362762 344HP41 21.02770042 492HP40 21.27186394 639HP39 21.47010994 686HP38 22.04853249 777HP37 22.35439873 779HP36 22.31563568 844HP35 22.26340675 877HP34 22.30940628 824HP33 21.58469582 431HP32 21.43399811 333HP31 21.14166069 277HP30 21.5201149 361HP29 20.4717083 134HP28 20.78372192 208HP27 20.87615967 261HP26 21.12074471 281HP25 22.05729866 467HP24 21.7533741 674HP23 21.5300312 690HP22 21.39256096 670HP21 20.49172783 88HP20 20.69186211 126HP19 20.79345512 190HP18 20.89327812 134HP17 20.55488777 75HP16 21.31156349 640HP15 21.28512955 561HP14 21.09729576 597HP13 20.82268715 502HP12 20.98593521 442HP11 20.87289619 491HP10 20.77215004 457HP9 20.5180645 331HP8 20.50951195 254HP7 21.15731239 345HP6 20.7497673 349HP5 20.88903618 273HP4 21.0162468 200HP3 20.98771286 146HP2 21.32868958 100HP1 21.39116478 32
LST14FEB10 Distance WD (12pm-50)LST14FEB10 1Distance WD (12pm-50) 0.61 1
Combined_LST_C_UCILoggerPoint_HatirJheel_20170515.xls

1
Name LST13APR12 Distance WD (12pm-180)
LST13APR12 Distance WD (12pm-50)
UCILogger7_BPP 29.46073151 206 29.46073151 175 UCILogger6_Ledge 28.2534008 0 28.2534008 0
UCILogger8 29.14341927 118 29.14341927 121 UCILogger7 29.33443642 631 29.33443642 633 UCILogger6 28.92001724 545 28.92001724 542 UCILogger4 28.67988205 445 28.67988205 448 UCILogger3 29.59271431 221 29.59271431 218 UCILogger2 28.34359169 19 28.34359169 0 UCILogger1 27.13567162 0 27.13567162 0
HP44 29.52172661 162 29.52172661 156HP43 29.59271431 220 29.59271431 215HP42 29.62142181 347 29.62142181 344HP41 28.92027473 493 28.92027473 492HP40 29.18147469 639 29.18147469 639HP39 29.41089821 677 29.41089821 686HP38 29.60534859 768 29.60534859 777HP37 30.46299171 784 30.46299171 779HP36 29.92575264 838 29.92575264 844HP35 29.99979019 875 29.99979019 877HP34 30.19892693 853 30.19892693 824HP33 29.62206078 427 29.62206078 431HP32 29.44628906 335 29.44628906 333HP31 29.22922516 275 29.22922516 277HP30 29.29692078 355 29.29692078 361HP29 28.29449081 138 28.29449081 134HP28 28.61473846 204 28.61473846 208HP27 28.77193832 270 28.77193832 261HP26 28.91108704 316 28.91108704 281HP25 30.14922905 795 30.14922905 467HP24 29.35223389 762 29.35223389 674HP23 29.66654968 688 29.66654968 690HP22 29.08654404 703 29.08654404 670HP21 28.21660423 81 28.21660423 88HP20 28.65283966 125 28.65283966 126HP19 28.71460533 196 28.71460533 190HP18 28.52591705 147 28.52591705 134HP17 28.24023247 84 28.24023247 75HP16 29.3775177 643 29.3775177 640HP15 29.02226257 666 29.02226257 561HP14 29.18309402 592 29.18309402 597HP13 28.80867195 502 28.80867195 502HP12 28.67992592 567 28.67992592 442HP11 28.89151192 489 28.89151192 491HP10 28.84324646 461 28.84324646 457HP9 28.44547081 334 28.44547081 331HP8 28.32659149 256 28.32659149 254HP7 29.43701553 346 29.43701553 345HP6 28.69723129 348 28.69723129 349HP5 28.73150063 291 28.73150063 273HP4 28.77635384 231 28.77635384 200HP3 28.82321739 170 28.82321739 146HP2 29.24698257 100 29.24698257 100HP1 28.80643845 31 28.80643845 32
LST13APR12 Distance WD (12pm-180)LST13APR12 1Distance WD (12pm-180) 0.666589857 1
Combined_LST_C_UCILoggerPoint_HatirJheel_20170515.xls

2
LST13APR12 Distance WD (12pm-50)LST13APR12 1Distance WD (12pm-50) 0.651680407 1
Combined_LST_C_UCILoggerPoint_HatirJheel_20170515.xls

1
Name LST15NOV12 Distance WD (12pm-0)
UCILogger7_BPP 27.15605545 175 UCILogger6_Ledge 27.12168121 0
UCILogger8 26.97395134 121 UCILogger7 27.42021179 633 UCILogger6 27.11036682 542 UCILogger4 26.63853264 448 UCILogger3 27.53449249 218 UCILogger2 27.52316666 0 UCILogger1 24.80630875 0
HP44 27.25712967 156HP43 27.53513908 215HP42 27.20445442 344HP41 26.56753349 492HP40 27.21420479 639HP39 27.31880379 686HP38 27.90166664 777HP37 28.49149132 779HP36 28.17803955 844HP35 28.21446037 877HP34 28.31011581 824HP33 27.23286057 431HP32 26.86507225 333HP31 26.71022034 277HP30 27.11558533 361HP29 26.3151207 134HP28 26.6894474 208HP27 26.75402832 261HP26 26.85586166 281HP25 27.80771255 467HP24 27.36309242 674HP23 27.6247673 690HP22 27.17517662 670HP21 26.74407768 88HP20 26.96616364 126HP19 26.88204575 190HP18 27.18756485 134HP17 26.81817436 75HP16 27.506073 640HP15 27.25934219 561HP14 27.27319527 597HP13 26.97576141 502HP12 27.03520775 442HP11 26.66609573 491HP10 26.88597107 457HP9 26.54092979 331HP8 26.6062851 254HP7 27.01080322 345HP6 26.74283409 349HP5 26.77933502 273HP4 26.95269394 200HP3 26.73205566 146HP2 27.0583992 100HP1 27.6027298 32
LST15NOV12 Distance WD (12pm-0)LST15NOV12 1Distance WD (12pm-0) 0.58 1
Combined_LST_C_UCILoggerPoint_HatirJheel_20170515.xls

1
Name LST15FEB13 Distance WD (12pm-270)
UCILogger7_BPP 20.79406166 103
UCILogger6_Ledge 20.47874832 0
UCILogger8 20.51211548 92
UCILogger7 20.53376198 316
UCILogger6 20.3239212 242
UCILogger4 20.19808197 109
UCILogger3 20.97784424 217
UCILogger2 20.373209 0
UCILogger1 18.49598312 0
HP44 20.80133247 174HP43 20.92317963 205HP42 20.62364769 197HP41 20.18852806 295HP40 20.40408516 427HP39 20.57087326 450HP38 20.66794777 482HP37 21.39030647 389HP36 20.94328499 485HP35 21.04570961 399HP34 21.13852501 297HP33 20.41479492 202HP32 20.21188927 121HP31 20.06822205 100HP30 20.29291916 192HP29 19.87661362 41HP28 20.00642395 97HP27 20.10101128 173HP26 20.22165489 187HP25 21.15290642 296HP24 20.73171997 291HP23 20.70261192 376HP22 20.26388741 272HP21 19.84162903 49HP20 20.11547852 91HP19 20.01145172 154HP18 19.94824982 126HP17 19.87950325 74HP16 20.59018898 370HP15 20.29610634 258HP14 20.47254372 278HP13 20.26290894 187HP12 20.11558151 166HP11 20.2089119 249HP10 20.23365402 146HP9 20.12722015 63HP8 20.01312828 42HP7 20.4469986 145HP6 20.18217659 90HP5 20.26764679 76HP4 20.58701324 127HP3 20.66246796 83HP2 20.53054619 91HP1 20.38797951 91
LST15FEB13 Distance WD (12pm-270)LST15FEB13 1Distance WD (12pm-270) 0.57 1
Combined_LST_C_UCILoggerPoint_HatirJheel_20170515.xls

1
Name LST14MAR14 Distance WD (12pm-360)
UCILogger7_BPP 27.94954491 175 UCILogger6_Ledge 27.68795013 0
UCILogger8 28.13482094 121 UCILogger7 27.771101 633 UCILogger6 27.7604599 542 UCILogger4 27.47467041 448 UCILogger3 28.48416901 218 UCILogger2 27.51570129 0 UCILogger1 23.80748367 0
HP44 28.46842384 156HP43 28.52576065 215HP42 28.18871117 344HP41 27.40358543 492HP40 27.69121361 639HP39 27.926651 686HP38 28.26803589 777HP37 28.72854805 779HP36 28.34062576 844HP35 28.34745216 877HP34 28.85622025 824HP33 27.74995232 431HP32 27.5989399 333HP31 27.29238892 277HP30 27.77012634 361HP29 26.50600052 134HP28 26.83983421 208HP27 27.23128891 261HP26 27.35196114 281HP25 28.40432358 467HP24 28.11750031 674HP23 28.1697998 690HP22 27.60183525 670HP21 26.65025139 88HP20 27.1409874 126HP19 27.31709671 190HP18 27.28466225 134HP17 26.73791313 75HP16 28.00605965 640HP15 27.56803513 561HP14 27.70231438 597HP13 27.67179108 502HP12 27.37496376 442HP11 27.39204216 491HP10 27.5930481 457HP9 27.12653542 331HP8 26.92314529 254HP7 27.82127953 345HP6 27.24435425 349HP5 27.29252815 273HP4 27.63938713 200HP3 27.85238266 146HP2 28.27581215 100HP1 27.68746376 32
LST14MAR14 Distance WD (12pm-360)LST14MAR14 1Distance WD (12pm-360) 0.47 1
Combined_LST_C_UCILoggerPoint_HatirJheel_20170515.xls

1
Name LST16NOV14 Distance WD (12pm-360)
UCILogger7_BPP 25.82184029 175 UCILogger6_Ledge 24.7926712 0
UCILogger8 25.29207611 121 UCILogger7 25.56406975 633 UCILogger6 25.38982391 542 UCILogger4 25.06285477 448 UCILogger3 25.68849564 218 UCILogger2 24.85932159 0 UCILogger1 23.64270973 0
HP44 25.59459305 156HP43 25.68849564 215HP42 25.59062004 344HP41 25.2292881 492HP40 25.69399261 639HP39 25.70706749 686HP38 26.17664719 777HP37 26.18170166 779HP36 26.44609261 844HP35 26.44644737 877HP34 26.15156937 824HP33 25.50872421 431HP32 25.19106293 333HP31 24.97076988 277HP30 25.16460419 361HP29 24.91012001 134HP28 24.98046494 208HP27 25.00960732 261HP26 25.02531624 281HP25 25.47791481 467HP24 25.22333336 674HP23 25.82554817 690HP22 25.19196892 670HP21 25.03242874 88HP20 25.16607285 126HP19 25.17434311 190HP18 25.18213844 134HP17 24.94488716 75HP16 25.73656845 640HP15 25.24456215 561HP14 25.52124214 597HP13 25.25086212 502HP12 25.22710991 442HP11 25.40670013 491HP10 25.1662159 457HP9 24.9151001 331HP8 25.00475883 254HP7 25.55723763 345HP6 25.19080162 349HP5 25.18157768 273HP4 25.10355568 200HP3 25.0282402 146HP2 25.32138443 100HP1 25.04345131 32
LST16NOV14 Distance WD (12pm-360)LST16NOV14 1Distance WD (12pm-360) 0.71 1
Combined_LST_C_UCILoggerPoint_HatirJheel_20170515.xls

1
Name LST16JAN15 Distance WD (12pm-0)
UCILogger7_BPP 19.07183075 175 UCILogger6_Ledge 19.33108711 0
UCILogger8 19.0801487 121 UCILogger7 18.98269081 633 UCILogger6 18.79936409 542 UCILogger4 18.83381462 448 UCILogger3 19.47894859 218 UCILogger2 19.04063416 0 UCILogger1 18.31298637 0
HP44 19.21132469 156HP43 19.38129425 215HP42 19.08283615 344HP41 18.83766365 492HP40 18.96848297 639HP39 19.01892662 686HP38 19.19230652 777HP37 19.33231544 779HP36 19.50908089 844HP35 19.59891319 877HP34 19.62900352 824HP33 19.27972603 431HP32 19.05504417 333HP31 18.85508919 277HP30 19.08786964 361HP29 18.78672409 134HP28 18.95668602 208HP27 19.12065887 261HP26 19.04606438 281HP25 19.4929924 467HP24 19.38434601 674HP23 19.11749458 690HP22 19.0886898 670HP21 18.88972282 88HP20 18.97978401 126HP19 19.04405403 190HP18 18.99302101 134HP17 19.00650024 75HP16 19.06202507 640HP15 19.05108261 561HP14 18.90949631 597HP13 18.79974556 502HP12 18.95976067 442HP11 18.80115891 491HP10 18.80750847 457HP9 18.83258247 331HP8 18.82459259 254HP7 19.03435898 345HP6 18.92688179 349HP5 19.00702286 273HP4 19.0401783 200HP3 19.00849342 146HP2 19.1265316 100HP1 19.07617188 32
LST16JAN15 Distance WD (12pm-0)LST16JAN15 1Distance WD (12pm-0) 0.36 1
Combined_LST_C_UCILoggerPoint_HatirJheel_20170515.xls

1
Name LST13JUN15 Distance WD (9am-90, 12pm-90)
UCILogger7_BPP 23.93180656 106
UCILogger6_Ledge 22.1544857 0
UCILogger8 22.96927643 201
UCILogger7 23.34112549 371
UCILogger6 23.19211197 348
UCILogger4 22.95661354 343
UCILogger3 23.60252571 168
UCILogger2 21.99586105 0
UCILogger1 21.16384125 0
HP44 23.37701988 157HP43 23.60252571 146HP42 23.92206383 188HP41 23.4552269 223HP40 23.61211205 269HP39 23.59896278 256HP38 23.55892754 222HP37 23.67510605 316HP36 24.03573608 212HP35 23.30280685 315HP34 21.92207909 405HP33 20.39698601 512HP32 20.9056797 609HP31 20.78723526 599HP30 20.57614136 505HP29 21.56859779 658HP28 21.68314743 601HP27 22.24157333 528HP26 21.7761364 518HP25 22.31038094 409HP24 22.32104301 412HP23 23.62656975 332HP22 23.00244713 437HP21 22.32743645 652HP20 22.50178528 613HP19 22.72885895 548HP18 22.69246483 540HP17 22.49726677 526HP16 23.50728035 322HP15 23.13615608 440HP14 23.27477455 370HP13 23.05747223 339HP12 22.86995697 426HP11 23.26029587 280HP10 23.08198929 330HP9 22.87660599 369HP8 22.84291458 355HP7 23.58625984 248HP6 23.07641983 305HP5 23.06982231 280HP4 22.78297997 266HP3 22.73212242 246HP2 23.06731796 177HP1 22.46200371 117
LST13JUN15 Distance WD (9am-90, 12pm-90)LST13JUN15 1Distance WD (9am-90, 12pm-90) -0.46 1
Combined_LST_C_UCILoggerPoint_HatirJheel_20170515.xls

1
Name LST16FEB16 Distance WD (12pm-360)
UCILogger7_BPP 23.37106705 175 UCILogger6_Ledge 23.15265274 0
UCILogger8 23.36294746 121 UCILogger7 23.05738068 633 UCILogger6 22.95835876 542 UCILogger4 22.85134125 448 UCILogger3 23.5176506 218 UCILogger2 23.04958153 0 UCILogger1 21.63009262 0
HP44 23.65060806 156HP43 23.56675339 215HP42 23.2786293 344HP41 23.02569199 492HP40 23.13209915 639HP39 23.24872208 686HP38 23.42477226 777HP37 23.67208481 779HP36 23.58030319 844HP35 23.7215538 877HP34 23.55810738 824HP33 23.28470993 431HP32 22.90591621 333HP31 22.76063156 277HP30 23.0272522 361HP29 22.6551075 134HP28 22.73008919 208HP27 22.8173008 261HP26 22.85767174 281HP25 23.37517548 467HP24 23.24409676 674HP23 23.29935265 690HP22 23.03320313 670HP21 22.69702148 88HP20 22.82099342 126HP19 22.86659622 190HP18 22.87950325 134HP17 22.67462158 75HP16 23.189888 640HP15 22.99657631 561HP14 23.04029083 597HP13 22.9105854 502HP12 22.83026695 442HP11 23.01052284 491HP10 22.89562607 457HP9 22.80861664 331HP8 22.86965942 254HP7 23.29594994 345HP6 23.05623245 349HP5 23.09649658 273HP4 23.18051529 200HP3 23.16274643 146HP2 23.45853996 100HP1 23.10497856 32
LST16FEB16 Distance WD (12pm-360)LST16FEB16 1Distance WD (12pm-0) 0.43 1
Combined_LST_C_UCILoggerPoint_HatirJheel_20170515.xls

1
Name LST15MAR17 Distance WD (12pm-270)
UCILogger7_BPP 26.27622604 103
UCILogger6_Ledge 25.81309319 0
UCILogger8 26.30768394 92
UCILogger7 26.07144547 316
UCILogger6 25.972229 242
UCILogger4 25.66913223 109
UCILogger3 26.49465752 217
UCILogger2 25.49404716 0
UCILogger1 23.23783112 0
HP44 26.53184319 174HP43 26.53148842 205HP42 26.08693886 197HP41 25.70582199 295HP40 25.97935104 427HP39 26.09911919 450HP38 26.32005501 482HP37 26.90071297 389HP36 26.61017036 485HP35 26.81735992 399HP34 27.08653641 297HP33 26.14045334 202HP32 25.84095573 121HP31 25.47408676 100HP30 25.94413567 192HP29 25.17154503 41HP28 25.43055153 97HP27 25.74020195 173HP26 25.83507538 187HP25 26.75675201 296HP24 26.50920486 291HP23 26.38492966 376HP22 26.0246563 272HP21 25.33504105 49HP20 25.61192322 91HP19 25.65363503 154HP18 25.6185894 126HP17 25.34121132 74HP16 26.21055985 370HP15 25.93422699 258HP14 26.03841782 278HP13 25.87887764 187HP12 25.66901588 166HP11 25.77933121 249HP10 25.80139542 146HP9 25.58497047 63HP8 25.53936195 42HP7 25.98299026 145HP6 25.69823456 90HP5 25.79959488 76HP4 26.15699577 127HP3 26.32522774 83HP2 26.20252037 91HP1 25.56925201 91
LST15MAR17 Distance WD (12pm-270)LST15MAR17 1Distance WD (12pm-270) 0.60 1
Combined_LST_C_UCILoggerPoint_HatirJheel_20170515.xls

1
Name LST15APR18 Distance WD (12pm-240)
UCILogger7_BPP 26.57172966 103
UCILogger6_Ledge 25.81293678 0
UCILogger8 25.75804138 92
UCILogger7 26.88162804 316
UCILogger6 26.48834991 242
UCILogger4 26.08683395 109
UCILogger3 26.74811935 217
UCILogger2 25.68483543 0
UCILogger1 24.05893326 0
HP44 26.51528931 174HP43 26.58886719 205HP42 27.06299973 197HP41 26.57369232 295HP40 26.985672 427HP39 27.12794876 450HP38 27.49543571 482HP37 28.0514679 389HP36 27.77061462 485HP35 27.31213188 399HP34 27.58166122 297HP33 26.89657021 202HP32 26.40122032 121HP31 26.26978683 100HP30 26.87231827 192HP29 25.31271553 41HP28 25.84670639 97HP27 26.29046822 173HP26 26.56332779 187HP25 27.53996468 296HP24 27.38579369 291HP23 27.1180172 376HP22 26.58259201 272HP21 25.47660446 49HP20 26.10006714 91HP19 26.32619476 154HP18 26.15903282 126HP17 25.78968048 74HP16 26.99032021 370HP15 26.58293915 258HP14 26.74772835 278HP13 26.3421402 187HP12 26.29966927 166HP11 26.51373863 249HP10 26.26922798 146HP9 25.88063431 63HP8 25.4749279 42HP7 26.68274117 145HP6 25.94312477 90HP5 25.82193565 76HP4 25.56550407 127HP3 25.50411987 83HP2 26.17965698 91HP1 25.68886566 91
LST15APR18 Distance WD (12pm-240)LST15APR18 1Distance WD (12pm-240) 0.85 1
Combined_LST_C_UCILoggerPoint_HatirJheel_20170515.xls

1
Name LST17FEB18 Distance
UCILogger7_BPP 23.5841732 100
UCILogger6_Ledge
23.2454052 0
UCILogger8 23.4272995 120
UCILogger7 23.61764717 243
UCILogger6 23.48441315 164
UCILogger4 23.24731255 105
UCILogger3 23.70653152 190
UCILogger2 23.39885521 0
UCILogger1 21.65570831 0
HP44 23.69408798 155HP43 23.67469597 142HP42 23.69244957 167HP41 23.2275219 213HP40 23.43977547 259HP39 23.51747131 262HP38 23.80945396 227HP37 24.14282417 312HP36 24.14878464 212HP35 24.2604599 321HP34 24.41351128 299HP33 23.86772919 190HP32 23.44189453 105HP31 23.31803703 92HP30 23.69003677 186HP29 22.86031532 39HP28 23.25292778 96HP27 23.16110039 168HP26 23.27483559 181HP25 24.0486927 292HP24 23.86910629 285HP23 23.67245293 314HP22 23.56069183 240HP21 23.17205429 47HP20 23.17729759 88HP19 23.2178421 133HP18 23.32437515 93HP17 23.07699013 52HP16 23.60766411 287HP15 23.54382896 204HP14 23.57044601 211HP13 23.42941475 136HP12 23.35468674 120HP11 23.32341766 186HP10 23.36119461 117HP9 23.10823059 56HP8 23.10085297 36HP7 23.6088829 140HP6 23.30452538 84HP5 23.37441063 74HP4 23.3508091 98HP3 23.30908775 74HP2 23.55201149 75HP1 23.34331131 32
LST17FEB18 DistanceLST17FEB18 1Distance 0.705426567 1
Combined_LST_C_UCILoggerPoint_HatirJheel_20170515.xls

1
Name LST17MAR22 Distance
UCILogger7_BPP 23.5358696 100
UCILogger6_Ledge
22.97171974 0
UCILogger8 22.93670273 120
UCILogger7 23.36762619 243
UCILogger6 23.18298912 164
UCILogger4 22.93900871 105
UCILogger3 23.77362251 190
UCILogger2 22.82412148 0
UCILogger1 21.50562859 0
HP44 23.50478363 155HP43 23.70474815 142HP42 23.51466942 167HP41 23.41859436 213HP40 23.4015522 259HP39 23.4321022 262HP38 23.62701797 227HP37 23.97257233 312HP36 24.03278351 212HP35 24.09917068 321HP34 24.11761284 299HP33 23.71288109 190HP32 23.20607948 105HP31 23.07490158 92HP30 23.61170769 186HP29 22.65313721 39HP28 22.87290573 96HP27 23.05835724 168HP26 23.20522118 181HP25 23.8409214 292HP24 23.6990242 285HP23 23.46853828 314HP22 23.31288528 240HP21 22.74554062 47HP20 22.99796104 88HP19 23.12335777 133HP18 23.26485825 93HP17 23.0658741 52HP16 23.43987083 287HP15 23.28385162 204HP14 23.32465172 211HP13 23.11021423 136HP12 23.29222679 120HP11 23.37325859 186HP10 23.05405045 117HP9 22.83187866 56HP8 22.87304688 36HP7 23.40191841 140HP6 23.06468964 84HP5 23.1841507 74HP4 23.15065765 98HP3 22.91320229 74HP2 23.08378983 75HP1 22.79793549 32
LST17MAR22 DistanceLST17MAR22 1Distance 0.77623663 1
Combined_LST_C_UCILoggerPoint_HatirJheel_20170515.xls

1
Name LST13DEC24 Distance WD (9am-270, 12pm-270)
UCILogger7_BPP 21.26242447 103
UCILogger6_Ledge 20.83275604 0
UCILogger8 20.94756126 92
UCILogger7 21.22313309 316
UCILogger6 21.06760025 242
UCILogger4 20.91688728 109
UCILogger3 21.38843536 217
UCILogger2 20.81262016 0
UCILogger1 20.14089394 0
HP44 21.16176987 174HP43 21.47331429 205HP42 21.23695755 197HP41 21.05365562 295HP40 21.06734848 427HP39 21.26918602 450HP38 21.7040596 482HP37 21.9253788 389HP36 21.69044685 485HP35 21.70932198 399HP34 21.42047691 297HP33 21.03223038 202HP32 20.83589172 121HP31 20.64804459 100HP30 20.76399231 192HP29 20.46231651 41HP28 20.65077972 97HP27 20.83893013 173HP26 20.78135681 187HP25 21.36691475 296HP24 21.37496185 291HP23 21.50702858 376HP22 21.19879532 272HP21 20.57034683 49HP20 20.66215897 91HP19 20.87566376 154HP18 20.92423058 126HP17 20.8990593 74HP16 21.21534157 370HP15 21.14988899 258HP14 21.14647484 278HP13 20.93514442 187HP12 20.95647621 166HP11 21.03850365 249HP10 20.91688728 146HP9 20.8333931 63HP8 20.62134743 42HP7 21.19049454 145HP6 20.94005013 90HP5 21.00184822 76HP4 21.11817169 127HP3 21.19030762 83HP2 20.84682846 91HP1 20.82767296 91
LST13DEC24 Distance WD (9am-270, 12pm-270)LST13DEC24 1Distance WD (9am-270, 12pm-270) 0.78 1
Combined_LST_C_UCILoggerPoint_HatirJheel_20170515.xls

1
Name LST14JAN25 Distance WD (12pm-0)
UCILogger7_BPP 21.49466515 175 UCILogger6_Ledge 21.90737534 0
UCILogger8 21.45809364 121 UCILogger7 21.29961586 633 UCILogger6 21.1517086 542 UCILogger4 20.97349548 448 UCILogger3 22.10553932 218 UCILogger2 21.55820274 0 UCILogger1 19.44239044 0
HP44 21.7869873 156HP43 22.1163559 215HP42 21.70196533 344HP41 21.13199615 492HP40 21.31366158 639HP39 21.54538727 686HP38 22.02885628 777HP37 22.40271568 779HP36 22.04606438 844HP35 22.0500946 877HP34 22.34000015 824HP33 21.47486496 431HP32 21.24405479 333HP31 20.91884041 277HP30 21.45860291 361HP29 20.28230858 134HP28 20.85175133 208HP27 21.07244301 261HP26 21.12755203 281HP25 22.07287216 467HP24 21.83557129 674HP23 21.72295189 690HP22 21.46675301 670HP21 20.92414856 88HP20 21.08358383 126HP19 21.15678597 190HP18 21.23991776 134HP17 20.93435287 75HP16 21.492239 640HP15 21.39118195 561HP14 21.22564507 597HP13 21.06907463 502HP12 21.34064865 442HP11 21.0458355 491HP10 21.0670433 457HP9 20.77516365 331HP8 20.70344925 254HP7 21.35359764 345HP6 20.90496254 349HP5 21.09776115 273HP4 21.45303917 200HP3 21.47636986 146HP2 21.51189613 100HP1 21.59087753 32
LST14JAN25 Distance WD (12pm-0)LST14JAN25 1Distance WD (12pm-0) 0.44 1
Combined_LST_C_UCILoggerPoint_HatirJheel_20170515.xls

1
Name LST14NOV25 Distance WD (12pm-270)
UCILogger7_BPP 23.22732925 103
UCILogger6_Ledge 23.28960419 0
UCILogger8 23.03052902 92
UCILogger7 23.11923599 316
UCILogger6 22.93547249 242
UCILogger4 22.55843353 109
UCILogger3 23.43976021 217
UCILogger2 23.0160408 0
UCILogger1 21.68705177 0
HP44 23.2540493 174HP43 23.37767029 205HP42 23.08154297 197HP41 22.74255371 295HP40 22.96858788 427HP39 23.1223278 450HP38 23.42792892 482HP37 23.78170967 389HP36 23.61406899 485HP35 23.65307236 399HP34 23.65745735 297HP33 23.00034523 202HP32 22.98601723 121HP31 22.590271 100HP30 22.81768799 192HP29 22.34248924 41HP28 22.55102921 97HP27 22.69230652 173HP26 22.69972229 187HP25 23.42913246 296HP24 23.13489342 291HP23 23.30532265 376HP22 22.94505501 272HP21 22.56883621 49HP20 22.79003525 91HP19 22.71879578 154HP18 22.76464081 126HP17 22.59175873 74HP16 23.1438942 370HP15 22.97109413 258HP14 23.1081028 278HP13 22.78711891 187HP12 22.758564 166HP11 22.76490784 249HP10 22.69818878 146HP9 22.59370613 63HP8 22.70471573 42HP7 22.97600555 145HP6 22.7978363 90HP5 22.87504578 76HP4 22.94185448 127HP3 22.83265495 83HP2 23.19713783 91HP1 23.12840843 91
LST14NOV25 Distance WD (12pm-270)LST14NOV25 1Distance WD (12pm-270) 0.61 1
Combined_LST_C_UCILoggerPoint_HatirJheel_20170515.xls

1
Name LST15SEPT25 Distance WD (12pm-210)
UCILogger7_BPP 26.06269646 175 UCILogger6_Ledge 26.04868698 0
UCILogger8 25.67826653 121 UCILogger7 26.06468391 633 UCILogger6 25.94261551 542 UCILogger4 25.66576958 448 UCILogger3 26.14492798 218 UCILogger2 25.85544014 0 UCILogger1 24.7744503 0
HP44 26.20664024 156HP43 26.18918991 215HP42 26.23283958 344HP41 25.97000504 492HP40 26.25380898 639HP39 26.24875641 686HP38 26.29050446 777HP37 26.4523983 779HP36 26.67171288 844HP35 26.47999763 877HP34 26.55895996 824HP33 26.08937263 431HP32 25.96933556 333HP31 25.81488991 277HP30 26.04143524 361HP29 25.25344658 134HP28 25.50073433 208HP27 25.79215431 261HP26 25.74792862 281HP25 26.42631149 467HP24 26.13761711 674HP23 26.17854881 690HP22 25.82258987 670HP21 25.60242844 88HP20 25.82529449 126HP19 25.86455727 190HP18 25.93040657 134HP17 25.82859802 75HP16 26.15225792 640HP15 25.85001755 561HP14 25.9732666 597HP13 25.86625099 502HP12 25.80669022 442HP11 25.99902916 491HP10 25.80174255 457HP9 25.58578682 331HP8 25.27457428 254HP7 26.03689957 345HP6 25.61285973 349HP5 25.5133152 273HP4 25.44864082 200HP3 25.45622635 146HP2 25.91085625 100HP1 25.87038612 32
LST15SEPT25 Distance WD (12pm-210)LST15SEPT25 1Distance WD (12pm-210) 0.62 1
Combined_LST_C_UCILoggerPoint_HatirJheel_20170515.xls

1
Name LST14FEB26 Distance WD (12pm-50)
UCILogger7_BPP 23.38903618 175 UCILogger6_Ledge 23.15207481 0
UCILogger8 22.80521774 121 UCILogger7 23.12043762 633 UCILogger6 22.84405899 542 UCILogger4 22.67425156 448 UCILogger3 23.44403458 218 UCILogger2 22.91437912 0 UCILogger1 20.63393021 0
HP44 23.24328613 156HP43 23.40651131 215HP42 23.20483971 344HP41 23.02166557 492HP40 23.15850067 639HP39 23.46854401 686HP38 23.82757759 777HP37 24.29417992 779HP36 24.01568985 844HP35 23.89422989 877HP34 23.97485542 824HP33 23.04163933 431HP32 23.05189133 333HP31 22.83713913 277HP30 23.04876518 361HP29 22.26615143 134HP28 22.59585381 208HP27 22.63333511 261HP26 22.85276985 281HP25 23.82745171 467HP24 23.44503784 674HP23 23.59150124 690HP22 23.05888557 670HP21 22.38687515 88HP20 22.59596443 126HP19 22.59942055 190HP18 22.71290588 134HP17 22.53177261 75HP16 23.39238358 640HP15 23.05643272 561HP14 23.00768089 597HP13 22.77872086 502HP12 22.78923416 442HP11 22.85696602 491HP10 22.74389839 457HP9 22.5098381 331HP8 22.35346794 254HP7 23.00957108 345HP6 22.61042976 349HP5 22.73989677 273HP4 22.941185 200HP3 22.84540939 146HP2 22.93061829 100HP1 22.95107651 32
LST14FEB26 Distance WD (12pm-50)LST14FEB26 1Distance WD (12pm-50) 0.64 1
Combined_LST_C_UCILoggerPoint_HatirJheel_20170515.xls

1
Name LST15OCT27 Distance WD (12pm-0)
UCILogger7_BPP 27.32489204 175 UCILogger6_Ledge 27.01925087 0
UCILogger8 27.05891418 121 UCILogger7 27.22872162 633 UCILogger6 27.00713348 542 UCILogger4 26.65093613 448 UCILogger3 27.89116287 218 UCILogger2 26.97361374 0 UCILogger1 25.30589294 0
HP44 27.61241913 156HP43 27.77291298 215HP42 27.34220123 344HP41 26.86693001 492HP40 27.15732574 639HP39 27.24657822 686HP38 27.56876373 777HP37 28.06633377 779HP36 28.17333412 844HP35 28.32903481 877HP34 28.06925964 824HP33 27.57361603 431HP32 27.06820488 333HP31 26.8353672 277HP30 27.19085312 361HP29 26.33025742 134HP28 26.77922821 208HP27 26.7234726 261HP26 26.92598343 281HP25 27.75618935 467HP24 27.52977943 674HP23 27.50702667 690HP22 27.0968399 670HP21 26.6374855 88HP20 26.78946877 126HP19 26.80549812 190HP18 26.9247303 134HP17 26.66233635 75HP16 27.33636856 640HP15 27.0779705 561HP14 27.17359161 597HP13 26.85646248 502HP12 26.87939072 442HP11 26.8380127 491HP10 26.74784279 457HP9 26.53923988 331HP8 26.57835388 254HP7 27.28279495 345HP6 26.83999634 349HP5 26.93173409 273HP4 26.74633217 200HP3 26.49097252 146HP2 27.41436386 100HP1 27.09051323 32
LST15OCT27 Distance WD (12pm-0)LST15OCT27 1Distance WD (12pm-0) 0.58 1
Combined_LST_C_UCILoggerPoint_HatirJheel_20170515.xls

1
Name LST15JAN28 Distance WD (12pm-0)
UCILogger7_BPP 21.16945648 175 UCILogger6_Ledge 21.01707268 0
UCILogger8 20.84356499 121 UCILogger7 20.89387894 633 UCILogger6 20.76651192 542 UCILogger4 20.40363884 448 UCILogger3 21.36205292 218 UCILogger2 21.01212883 0 UCILogger1 19.16513824 0
HP44 21.27124596 156HP43 21.39034271 215HP42 21.08154106 344HP41 20.42520905 492HP40 20.96952057 639HP39 21.14836502 686HP38 21.52693558 777HP37 22.06480408 779HP36 21.49258804 844HP35 21.11684418 877HP34 21.61092949 824HP33 20.54746628 431HP32 20.63926125 333HP31 20.34357834 277HP30 20.51543236 361HP29 19.81254959 134HP28 20.0783596 208HP27 20.48817635 261HP26 20.42707825 281HP25 21.56497955 467HP24 21.34069824 674HP23 21.16057777 690HP22 20.75184441 670HP21 19.96879959 88HP20 20.40994835 126HP19 20.55646896 190HP18 20.57364845 134HP17 20.41183853 75HP16 21.00003624 640HP15 20.7564888 561HP14 20.87418175 597HP13 20.65613747 502HP12 20.76735687 442HP11 20.51714897 491HP10 20.58631516 457HP9 20.28721237 331HP8 19.94091415 254HP7 20.7554512 345HP6 20.25925064 349HP5 20.29967117 273HP4 20.54027939 200HP3 20.79812431 146HP2 20.8301487 100HP1 20.92370605 32
LST15JAN28 Distance WD (12pm-0)LST15JAN28 1Distance WD (12pm-0) 0.51 1
Combined_LST_C_UCILoggerPoint_HatirJheel_20170515.xls

1
Name LST15NOV28 Distance WD (12pm-0)
UCILogger7_BPP 21.17711449 175 UCILogger6_Ledge 21.19530106 0
UCILogger8 20.80040169 121 UCILogger7 21.1532917 633 UCILogger6 20.8741951 542 UCILogger4 20.62255096 448 UCILogger3 21.49179459 218 UCILogger2 20.88084984 0 UCILogger1 20.34848213 0
HP44 21.15449142 156HP43 21.32202911 215HP42 20.99163055 344HP41 20.76774788 492HP40 21.13900757 639HP39 21.25928879 686HP38 21.34944916 777HP37 21.90465164 779HP36 21.69314194 844HP35 21.8101387 877HP34 21.85848999 824HP33 21.50634575 431HP32 21.22705841 333HP31 21.00233459 277HP30 21.24003601 361HP29 20.81513405 134HP28 20.8650856 208HP27 20.84766197 261HP26 21.02795601 281HP25 21.78006554 467HP24 21.5635643 674HP23 21.41204643 690HP22 21.12428665 670HP21 20.92835045 88HP20 20.88097 126HP19 20.86179543 190HP18 20.85398102 134HP17 20.75234222 75HP16 21.29238129 640HP15 21.06319809 561HP14 21.07945633 597HP13 20.74056625 502HP12 20.71482277 442HP11 20.76840591 491HP10 20.67447472 457HP9 20.54433632 331HP8 20.55283546 254HP7 20.96923637 345HP6 20.74905014 349HP5 20.89129257 273HP4 20.8700943 200HP3 20.75808525 146HP2 20.91423035 100HP1 20.91909599 32
LST15NOV28 Distance WD (12pm-0)LST15NOV28 1Distance WD (12pm-0) 0.59 1
Combined_LST_C_UCILoggerPoint_HatirJheel_20170515.xls

1
Name LST15DEC30 Distance WD (12pm-0)
UCILogger7_BPP 19.42455482 175 UCILogger6_Ledge 19.28300285 0
UCILogger8 19.26221085 121 UCILogger7 19.41624641 633 UCILogger6 19.19215393 542 UCILogger4 19.11730003 448 UCILogger3 19.60018349 218 UCILogger2 19.24983597 0 UCILogger1 17.90820503 0
HP44 19.60253716 156HP43 19.56262589 215HP42 19.45670891 344HP41 19.01222801 492HP40 19.1938324 639HP39 19.3120842 686HP38 19.55950928 777HP37 19.91077423 779HP36 19.7922821 844HP35 19.79182625 877HP34 19.75739479 824HP33 19.43153572 431HP32 19.20160294 333HP31 18.99643326 277HP30 19.19616699 361HP29 19.02893829 134HP28 18.99755478 208HP27 19.13591576 261HP26 19.14553642 281HP25 19.72252083 467HP24 19.57087135 674HP23 19.4692173 690HP22 19.35463142 670HP21 18.97175789 88HP20 19.16286087 126HP19 19.16620445 190HP18 19.13850975 134HP17 19.05377197 75HP16 19.33700562 640HP15 19.31666565 561HP14 19.34790993 597HP13 19.12319756 502HP12 19.15447807 442HP11 18.99761581 491HP10 19.08905029 457HP9 19.08891296 331HP8 19.03136444 254HP7 19.26349068 345HP6 19.12524414 349HP5 19.17915726 273HP4 19.18423843 200HP3 19.13722038 146HP2 19.41876984 100HP1 19.39881134 32
LST15DEC30 Distance WD (12pm-0)LST15DEC30 1Distance WD (12pm-0) 0.51 1
Combined_LST_C_UCILoggerPoint_HatirJheel_20170515.xls

1
Name LST14MAR30 Distance WD (12pm-250)
UCILogger7_BPP 33.99338531 103
UCILogger6_Ledge 32.7760582 0
UCILogger8 33.84411621 92
UCILogger7 34.48681641 316
UCILogger6 34.09265137 242
UCILogger4 33.61750412 109
UCILogger3 34.74507523 217
UCILogger2 33.26016235 0
UCILogger1 28.82238388 0
HP44 34.41184616 174HP43 34.7117424 205HP42 34.52597809 197HP41 33.88198853 295HP40 34.36735916 427HP39 34.61366272 450HP38 35.11930847 482HP37 36.16002655 389HP36 35.34640121 485HP35 35.26332855 399HP34 35.80652618 297HP33 34.09277344 202HP32 33.80453873 121HP31 33.55791473 100HP30 34.19335938 192HP29 32.54400635 41HP28 33.37517166 97HP27 33.81441116 173HP26 34.10700607 187HP25 35.82312393 296HP24 35.26276398 291HP23 34.97893524 376HP22 34.62430954 272HP21 33.24638367 49HP20 33.66254807 91HP19 33.87744141 154HP18 33.74160385 126HP17 33.00733566 74HP16 34.69761658 370HP15 34.53031921 258HP14 34.30764771 278HP13 33.90799713 187HP12 33.96429443 166HP11 33.70808792 249HP10 33.78313828 146HP9 33.2112236 63HP8 32.84631729 42HP7 34.36439514 145HP6 33.42469788 90HP5 33.61641312 76HP4 34.10564041 127HP3 33.9604454 83HP2 33.72693634 91HP1 33.18045044 91
LST14MAR30 Distance WD (12pm-250)LST14MAR30 1Distance WD (12pm-250) 0.72 1
Combined_LST_C_UCILoggerPoint_HatirJheel_20170515.xls

1
Name LST16NOV30 Distance WD (12pm-0)
UCILogger7_BPP 23.63318253 175 UCILogger6_Ledge 23.69040298 0
UCILogger8 23.43926048 121 UCILogger7 23.47665596 633 UCILogger6 23.24538612 542 UCILogger4 23.05434227 448 UCILogger3 23.8248806 218 UCILogger2 23.3180294 0 UCILogger1 22.13399696 0
HP44 23.50309372 156HP43 23.69398499 215HP42 23.65930176 344HP41 23.12071228 492HP40 23.34708405 639HP39 23.4292469 686HP38 23.67424202 777HP37 24.13190079 779HP36 24.13282013 844HP35 24.21331406 877HP34 24.13865471 824HP33 23.77714729 431HP32 23.37059784 333HP31 23.09701347 277HP30 23.39222908 361HP29 22.84087563 134HP28 23.14076614 208HP27 23.10626411 261HP26 23.1935997 281HP25 24.04987907 467HP24 23.81186295 674HP23 23.67629242 690HP22 23.52745056 670HP21 23.15006828 88HP20 23.23537636 126HP19 23.21476364 190HP18 23.39316559 134HP17 23.22538757 75HP16 23.55216599 640HP15 23.49404716 561HP14 23.3857975 597HP13 23.17073441 502HP12 23.2088604 442HP11 23.10440254 491HP10 23.10401344 457HP9 23.12528801 331HP8 23.21068954 254HP7 23.54395294 345HP6 23.30480957 349HP5 23.38845444 273HP4 23.34255219 200HP3 23.23418999 146HP2 23.4000206 100HP1 23.328125 32
LST16NOV30 Distance WD (12pm-0)LST16NOV30 1Distance WD (12pm-360) 0.54 1
Combined_LST_C_UCILoggerPoint_HatirJheel_20170515.xls

1
Name LST16MAR3 Distance WD (12pm-290)
UCILogger7_BPP 25.28881645 103
UCILogger6_Ledge 25.09617615 0
UCILogger8 25.17972183 92
UCILogger7 25.5265522 316
UCILogger6 25.22647476 242
UCILogger4 24.99818802 109
UCILogger3 25.76316834 217
UCILogger2 24.95301628 0
UCILogger1 23.77632904 0
HP44 25.57648659 174HP43 25.6962738 205HP42 25.56160545 197HP41 25.12624741 295HP40 25.4224968 427HP39 25.72982407 450HP38 26.12590599 482HP37 26.50536919 389HP36 26.29140282 485HP35 26.37527657 399HP34 26.11663437 297HP33 25.60143089 202HP32 25.42423439 121HP31 25.17447662 100HP30 25.38278198 192HP29 24.91356468 41HP28 25.03911972 97HP27 25.15198517 173HP26 25.26900101 187HP25 25.97395325 296HP24 25.60739517 291HP23 25.82971191 376HP22 25.36832237 272HP21 24.83077049 49HP20 25.11407089 91HP19 25.0660305 154HP18 24.97472572 126HP17 24.78189278 74HP16 25.63216782 370HP15 25.35858727 258HP14 25.44265747 278HP13 25.10823822 187HP12 25.02998543 166HP11 25.12273979 249HP10 25.04369164 146HP9 24.90055084 63HP8 24.79742241 42HP7 25.43016243 145HP6 25.05229568 90HP5 25.102314 76HP4 25.14946747 127HP3 25.09781647 83HP2 25.33371925 91HP1 24.94029045 91
LST16MAR3 Distance WD (12pm-290)LST16MAR3 1Distance WD (12pm-290) 0.79 1
Combined_LST_C_UCILoggerPoint_HatirJheel_20170515.xls

1
Name LST15MAY4 Distance WD (12pm-130)
UCILogger7_BPP 29.04849434 175 UCILogger6_Ledge 28.29521942 0
UCILogger8 28.35543442 121 UCILogger7 28.79200554 633 UCILogger6 28.67600632 542 UCILogger4 28.43808365 448 UCILogger3 29.24754524 218 UCILogger2 28.08401108 0 UCILogger1 26.67748833 0
HP44 29.06051445 156HP43 29.1142025 215HP42 29.20979309 344HP41 28.78223419 492HP40 28.94613838 639HP39 28.98505211 686HP38 29.23022461 777HP37 29.45655251 779HP36 29.663517 844HP35 29.37565041 877HP34 29.3689785 824HP33 29.03306961 431HP32 29.00050163 333HP31 28.60785866 277HP30 28.74896812 361HP29 27.76655579 134HP28 28.17707253 208HP27 28.5624485 261HP26 28.57616806 281HP25 29.18716621 467HP24 29.09330559 674HP23 28.92006302 690HP22 28.74577904 670HP21 27.8939476 88HP20 28.42313576 126HP19 28.60237312 190HP18 28.44766998 134HP17 28.05592155 75HP16 28.8535614 640HP15 28.71004677 561HP14 28.7906456 597HP13 28.55931282 502HP12 28.5243969 442HP11 28.6611042 491HP10 28.51028442 457HP9 28.33509445 331HP8 28.13102341 254HP7 28.94100571 345HP6 28.45793533 349HP5 28.34266853 273HP4 28.09895897 200HP3 28.01004982 146HP2 28.82140541 100HP1 28.24211884 32
LST15MAY4 Distance WD (12pm-130)LST15MAY4 1Distance WD (12pm-130) 0.67 1
Combined_LST_C_UCILoggerPoint_HatirJheel_20170515.xls

1
Name LST13NOV6 Distance WD (9am-0, 12pm-50)
UCILogger7_BPP 26.67201233 175 UCILogger6_Ledge 26.17141342 0
UCILogger8 25.93484116 121 UCILogger7 25.95052528 633 UCILogger6 25.83473778 542 UCILogger4 25.60040665 448 UCILogger3 26.38063622 218 UCILogger2 25.94286919 0 UCILogger1 25.15662766 0
HP44 25.89102554 156HP43 26.61367035 215HP42 26.46184921 344HP41 26.04480934 492HP40 26.14921951 639HP39 26.26958466 686HP38 27.07745552 777HP37 27.0282917 779HP36 27.14072418 844HP35 27.01286888 877HP34 26.72686958 824HP33 26.25460625 431HP32 25.94471931 333HP31 25.40377998 277HP30 25.7065239 361HP29 25.13117027 134HP28 25.326437 208HP27 25.38538933 261HP26 25.42951393 281HP25 26.21204758 467HP24 26.09692574 674HP23 26.46566772 690HP22 26.02592087 670HP21 25.43236542 88HP20 25.4352684 126HP19 25.51422882 190HP18 25.61478424 134HP17 25.52272034 75HP16 26.09393883 640HP15 26.00540161 561HP14 25.91767311 597HP13 25.72919655 502HP12 25.82447052 442HP11 25.82273483 491HP10 25.66433144 457HP9 25.53342819 331HP8 25.42944336 254HP7 26.22228622 345HP6 25.72438622 349HP5 25.63288689 273HP4 25.45620728 200HP3 25.28273201 146HP2 25.93484116 100HP1 26.30605316 32
LST15JAN28 Distance WD (9am-0, 12pm-50)LST15JAN28 1Distance WD (9am-0, 12pm-50) 0.601089032 1
Combined_LST_C_UCILoggerPoint_HatirJheel_20170515.xls

1
Name LST14FEB10 Distance WD (12pm-50)
HP_UW50 21.560215 230
HP_UW49 21.08701324 473
HP_UW48 21.30892944 338
HP_UW47 20.90348816 310
HP_UW46 21.30145454 281
HP_UW45 21.37646484 427
HP_UW44 21.40200424 456
HP_UW43 21.54867935 520
HP_UW42 21.13157463 347
HP_UW41 20.55293274 189HP_UW40 20.27675629 114HP_UW39 19.75155449 53HP_UW38 20.63752365 221HP_UW37 22.37640381 209HP_UW36 20.73784637 595HP_UW35 21.40611076 516HP_UW34 21.16398621 455HP_UW33 20.9272995 364HP_UW32 21.40858078 554HP_UW31 21.49405289 381HP_UW30 20.86114311 252HP_UW29 20.40727615 153HP_UW28 19.6024189 40HP_UW27 21.34845734 257HP_UW26 20.92603302 179HP_UW25 20.88078308 116HP_UW24 20.06185722 30HP_UW23 21.56773186 184HP_UW22 21.28560066 516HP_UW21 21.02701569 450HP_UW20 21.61410332 345HP_UW19 22.04118156 227HP_UW18 20.16909027 27HP_UW17 21.41192245 115HP_UW16 20.58666611 28HP_UW15 21.56590652 121HP_UW14 21.82072639 167HP_UW13 21.83697319 155HP_UW12 21.41562653 128HP_UW11 21.25909615 107HP_UW10 20.5628109 32HP_UW9 21.76467323 95HP_UW8 20.88552666 26HP_UW7 20.95277214 27HP_UW6 22.01826668 122HP_UW5 21.34529877 64HP_UW4 21.97210121 143HP_UW3 21.91047668 150HP_UW2 20.5830307 33HP_UW1 20.6081543 34
LST14FEB10 Distance WD (12pm-50)LST14FEB10 1Distance WD (12pm-50) 0.29 1
Combined_LST_C_UCILoggerPoint_HatirJheel_20170515.xls

1
Name LST13APR12 Distance WD (12pm-180)
HP_UW50 30.5234375 230
HP_UW49 30.35430717 473
HP_UW48 30.4441452 338
HP_UW47 30.40014648 310
HP_UW46 30.30260658 281
HP_UW45 30.20253754 427
HP_UW44 30.52522469 456
HP_UW43 30.29545593 520
HP_UW42 29.95039177 347
HP_UW41 29.67269707 189HP_UW40 29.91170692 114HP_UW39 29.68024063 53HP_UW38 29.91683197 221HP_UW37 30.52573013 209HP_UW36 30.49089813 595HP_UW35 30.67596436 516HP_UW34 30.62539864 455HP_UW33 30.44368172 364HP_UW32 30.66832161 554HP_UW31 30.33048439 381HP_UW30 30.03769112 252HP_UW29 30.21306419 153HP_UW28 29.65826607 40HP_UW27 30.38701439 257HP_UW26 30.29842758 179HP_UW25 30.34285164 116HP_UW24 29.56113434 30HP_UW23 30.44835091 184HP_UW22 29.96423912 516HP_UW21 30.40815926 450HP_UW20 30.5592804 345HP_UW19 30.62620735 227HP_UW18 29.47291183 27HP_UW17 30.37901688 115HP_UW16 30.04814148 28HP_UW15 30.49747658 121HP_UW14 30.5206871 167HP_UW13 30.35235786 155HP_UW12 30.4540863 128HP_UW11 30.29405403 107HP_UW10 29.83460236 32HP_UW9 30.15557289 95HP_UW8 29.41970825 26HP_UW7 29.64756966 27HP_UW6 30.29867935 122HP_UW5 30.09592628 64HP_UW4 30.29872704 143HP_UW3 30.30464554 150HP_UW2 29.57120895 33HP_UW1 30.05172348 34
LST13APR12 Distance WD (12pm-180)LST13APR12 1Distance WD (12pm-180) 0.57 1
Combined_LST_C_UCILoggerPoint_HatirJheel_20170515.xls

1
Name LST15NOV12 Distance WD (12pm-0)
HP_UW50 27.81661034 230
HP_UW49 27.51746559 473
HP_UW48 27.77463722 338
HP_UW47 27.81694603 310
HP_UW46 27.58391571 281
HP_UW45 27.33657074 427
HP_UW44 27.41083145 456
HP_UW43 27.58077049 520
HP_UW42 27.01295662 347
HP_UW41 26.6827507 189HP_UW40 26.83410645 114HP_UW39 26.40926933 53HP_UW38 27.03457451 221HP_UW37 28.22821236 209HP_UW36 27.73148918 595HP_UW35 27.50029945 516HP_UW34 27.90869141 455HP_UW33 27.9528656 364HP_UW32 27.84020805 554HP_UW31 27.5467701 381HP_UW30 27.22641373 252HP_UW29 27.37789536 153HP_UW28 26.31409645 40HP_UW27 27.75619125 257HP_UW26 27.62351608 179HP_UW25 27.57030296 116HP_UW24 26.60501099 30HP_UW23 27.82586861 184HP_UW22 27.35560417 516HP_UW21 27.55815887 450HP_UW20 28.16889572 345HP_UW19 28.06022453 227HP_UW18 26.29561424 27HP_UW17 27.82856941 115HP_UW16 26.63482857 28HP_UW15 27.71316338 121HP_UW14 27.85223579 167HP_UW13 27.83293533 155HP_UW12 27.47317314 128HP_UW11 27.17095184 107HP_UW10 26.38665962 32HP_UW9 27.12378693 95HP_UW8 26.39157867 26HP_UW7 26.37793732 27HP_UW6 27.44576836 122HP_UW5 26.65861321 64HP_UW4 27.72286415 143HP_UW3 27.79644585 150HP_UW2 26.25109673 33HP_UW1 26.1570549 34
LST15NOV12 Distance WD (12pm-0)LST15NOV12 1Distance WD (12pm-0) 0.57 1
Combined_LST_C_UCILoggerPoint_HatirJheel_20170515.xls

1
Name LST15FEB13 Distance WD (12pm-270)
HP_UW50 20.91737556 444
HP_UW49 20.69038963 595
HP_UW48 20.96579742 404
HP_UW47 21.07767868 432
HP_UW46 20.9849453 349
HP_UW45 20.36721992 354
HP_UW44 20.58738709 392
HP_UW43 20.62434578 382
HP_UW42 20.19952011 324
HP_UW41 20.20246696 198HP_UW40 20.3913517 139HP_UW39 19.77941513 69HP_UW38 20.51505661 252HP_UW37 21.47016907 602HP_UW36 20.70531273 559HP_UW35 20.74963379 492HP_UW34 20.91801643 525HP_UW33 21.03312874 476HP_UW32 20.95731926 430HP_UW31 20.51000404 368HP_UW30 20.6848793 290HP_UW29 20.81717491 191HP_UW28 19.74069214 57HP_UW27 21.05225182 389HP_UW26 21.2432785 257HP_UW25 21.15932274 180HP_UW24 19.91627121 47HP_UW23 21.21949196 327HP_UW22 20.5620327 679HP_UW21 20.7744503 631HP_UW20 21.33719254 570HP_UW19 21.1560154 508HP_UW18 19.78696251 82HP_UW17 21.18522644 212HP_UW16 20.21693802 232HP_UW15 20.86137199 326HP_UW14 20.98034668 442HP_UW13 21.05745888 502HP_UW12 20.74873543 392HP_UW11 20.61820602 430HP_UW10 20.02379799 323HP_UW9 20.15722466 732HP_UW8 19.251194 623HP_UW7 19.62974739 549HP_UW6 20.80700111 670HP_UW5 20.07138443 613HP_UW4 21.02523994 569HP_UW3 21.04501343 534HP_UW2 19.77114677 390HP_UW1 19.61315346 428
LST15FEB13 Distance WD (12pm-270)LST15FEB13 1Distance WD (12pm-270) 0.22 1
Combined_LST_C_UCILoggerPoint_HatirJheel_20170515.xls

1
Name LST14MAR14 Distance WD (12pm-360)
HP_UW50 29.12005615 230
HP_UW49 28.62580681 473
HP_UW48 28.69167328 338
HP_UW47 28.85860825 310
HP_UW46 28.69526863 281
HP_UW45 28.24146843 427
HP_UW44 28.29532814 456
HP_UW43 28.42389679 520
HP_UW42 27.99497604 347
HP_UW41 27.91999054 189HP_UW40 28.04402542 114HP_UW39 26.95621872 53HP_UW38 28.30172539 221HP_UW37 29.48025322 209HP_UW36 28.71255493 595HP_UW35 28.5237999 516HP_UW34 29.07255554 455HP_UW33 29.01301765 364HP_UW32 28.94301987 554HP_UW31 28.34850502 381HP_UW30 28.47288322 252HP_UW29 28.67195511 153HP_UW28 26.77088356 40HP_UW27 28.98357773 257HP_UW26 28.88277054 179HP_UW25 28.89640236 116HP_UW24 27.02073288 30HP_UW23 29.11816216 184HP_UW22 28.30139732 516HP_UW21 28.71894455 450HP_UW20 29.43656158 345HP_UW19 29.39007568 227HP_UW18 26.70230865 27HP_UW17 29.11358643 115HP_UW16 27.09404564 28HP_UW15 28.94576645 121HP_UW14 29.15843391 167HP_UW13 28.94929886 155HP_UW12 28.67026901 128HP_UW11 28.05352592 107HP_UW10 26.87128448 32HP_UW9 28.04616737 95HP_UW8 26.73916054 26HP_UW7 27.03547478 27HP_UW6 28.57233047 122HP_UW5 27.64584732 64HP_UW4 28.7224617 143HP_UW3 28.80782509 150HP_UW2 26.53564453 33HP_UW1 26.38143158 34
LST14MAR14 Distance WD (12pm-360)LST14MAR14 1Distance WD (12pm-360) 0.52 1
Combined_LST_C_UCILoggerPoint_HatirJheel_20170515.xls

1
Name LST16NOV14 Distance WD (12pm-360)
HP_UW50 26.6008625 230
HP_UW49 26.10102654 473
HP_UW48 26.81863594 338
HP_UW47 26.6565361 310
HP_UW46 26.23962402 281
HP_UW45 25.83028984 427
HP_UW44 26.01461983 456
HP_UW43 26.13633728 520
HP_UW42 25.91032028 347
HP_UW41 25.34496498 189HP_UW40 25.01429939 114HP_UW39 24.7970829 53HP_UW38 25.61348534 221HP_UW37 27.11166954 209HP_UW36 26.21030808 595HP_UW35 26.21969032 516HP_UW34 26.30341721 455HP_UW33 26.84522247 364HP_UW32 26.28533745 554HP_UW31 26.10458565 381HP_UW30 25.75245857 252HP_UW29 25.52051353 153HP_UW28 24.97732353 40HP_UW27 26.43343163 257HP_UW26 25.93763351 179HP_UW25 26.06348228 116HP_UW24 25.03639412 30HP_UW23 26.53822899 184HP_UW22 25.97561455 516HP_UW21 26.12195778 450HP_UW20 26.826231 345HP_UW19 26.86743927 227HP_UW18 24.86363411 27HP_UW17 26.22201538 115HP_UW16 25.28203774 28HP_UW15 26.41646767 121HP_UW14 26.54900932 167HP_UW13 26.8983345 155HP_UW12 26.40809059 128HP_UW11 26.25944519 107HP_UW10 24.8492794 32HP_UW9 25.80027199 95HP_UW8 24.96345329 26HP_UW7 24.47452736 27HP_UW6 26.13055992 122HP_UW5 25.47760773 64HP_UW4 26.67827606 143HP_UW3 26.83229637 150HP_UW2 25.13944817 33HP_UW1 24.94248581 34
LST16NOV14 Distance WD (12pm-360)LST16NOV14 1Distance WD (12pm-360) 0.48 1
Combined_LST_C_UCILoggerPoint_HatirJheel_20170515.xls

1
Name LST16JAN15 Distance WD (12pm-0)
HP_UW50 19.77915955 230
HP_UW49 19.76191139 473
HP_UW48 19.77037621 338
HP_UW47 19.73586082 310
HP_UW46 19.59053421 281
HP_UW45 19.29536247 427
HP_UW44 19.49855042 456
HP_UW43 19.53100777 520
HP_UW42 19.2497406 347
HP_UW41 19.11880684 189HP_UW40 19.07179451 114HP_UW39 18.78491783 53HP_UW38 19.33901787 221HP_UW37 19.96790123 209HP_UW36 19.73476219 595HP_UW35 19.59607315 516HP_UW34 19.70921707 455HP_UW33 19.87605667 364HP_UW32 19.57377052 554HP_UW31 19.61392975 381HP_UW30 19.4424839 252HP_UW29 19.37991714 153HP_UW28 18.89831924 40HP_UW27 19.67506027 257HP_UW26 19.74794197 179HP_UW25 19.66954994 116HP_UW24 18.94604492 30HP_UW23 19.81000328 184HP_UW22 19.55827332 516HP_UW21 19.78962898 450HP_UW20 20.0710144 345HP_UW19 19.90806961 227HP_UW18 18.93990135 27HP_UW17 19.74541473 115HP_UW16 18.89783096 28HP_UW15 19.62612915 121HP_UW14 19.70318413 167HP_UW13 19.695961 155HP_UW12 19.55887032 128HP_UW11 19.47732162 107HP_UW10 18.9663372 32HP_UW9 19.30698586 95HP_UW8 18.86569977 26HP_UW7 18.89190865 27HP_UW6 19.49083138 122HP_UW5 19.13602638 64HP_UW4 19.70633698 143HP_UW3 19.7066021 150HP_UW2 18.89554214 33HP_UW1 18.81199455 34
LST16JAN15 Distance WD (12pm-0)LST16JAN15 1Distance WD (12pm-0) 0.57 1
Combined_LST_C_UCILoggerPoint_HatirJheel_20170515.xls

1
Name LST13JUN15 Distance WD (12pm-90)
HP_UW50 24.50431252 444
HP_UW49 24.27438736 595
HP_UW48 24.28182411 404
HP_UW47 24.32299995 432
HP_UW46 24.18887138 349
HP_UW45 23.97188377 354
HP_UW44 24.19052124 392
HP_UW43 24.27911949 382
HP_UW42 23.92583466 324
HP_UW41 23.57961845 198HP_UW40 23.54046631 139HP_UW39 23.21581268 69HP_UW38 23.86239433 252HP_UW37 24.73604012 602HP_UW36 24.53941536 559HP_UW35 24.6397686 492HP_UW34 24.48365021 525HP_UW33 24.51708603 476HP_UW32 24.52363777 430HP_UW31 24.19261742 368HP_UW30 23.96925735 290HP_UW29 23.6750145 191HP_UW28 22.63206863 57HP_UW27 24.25197983 389HP_UW26 23.97408295 257HP_UW25 23.86550713 180HP_UW24 22.77412224 47HP_UW23 24.48772049 327HP_UW22 23.93221855 679HP_UW21 24.33058739 631HP_UW20 24.63251305 570HP_UW19 24.72264862 508HP_UW18 23.07849693 82HP_UW17 24.27685547 212HP_UW16 23.72294235 232HP_UW15 24.59144211 326HP_UW14 24.64752579 442HP_UW13 24.60464096 502HP_UW12 24.53403664 392HP_UW11 24.45255089 430HP_UW10 22.9666996 323HP_UW9 24.12062836 732HP_UW8 22.92551231 623HP_UW7 23.05950356 549HP_UW6 24.51874542 670HP_UW5 23.75879097 613HP_UW4 24.57538795 569HP_UW3 24.58598137 534HP_UW2 22.82421303 390HP_UW1 23.45598221 428
LST13JUN15 Distance WD (12pm-90)LST13JUN15 1Distance WD (12pm-90) 0.50 1
Combined_LST_C_UCILoggerPoint_HatirJheel_20170515.xls

1
Name LST16FEB16 Distance WD (12pm-360)
HP_UW50 23.71189499 230
HP_UW49 23.45067787 473
HP_UW48 23.70815659 338
HP_UW47 23.67988777 310
HP_UW46 23.5285778 281
HP_UW45 23.20406151 427
HP_UW44 23.37168694 456
HP_UW43 23.37965584 520
HP_UW42 23.20386124 347
HP_UW41 23.13448524 189HP_UW40 23.19429398 114HP_UW39 22.80682564 53HP_UW38 23.32974052 221HP_UW37 24.02151299 209HP_UW36 23.63198471 595HP_UW35 23.54974365 516HP_UW34 23.55237389 455HP_UW33 23.79582024 364HP_UW32 23.54267693 554HP_UW31 23.4547863 381HP_UW30 23.41320229 252HP_UW29 23.46339798 153HP_UW28 22.88970947 40HP_UW27 23.63773155 257HP_UW26 23.73647308 179HP_UW25 23.66144943 116HP_UW24 22.82207298 30HP_UW23 23.78050423 184HP_UW22 23.31753159 516HP_UW21 23.54125595 450HP_UW20 23.97932816 345HP_UW19 23.81092072 227HP_UW18 22.85326767 27HP_UW17 23.75856781 115HP_UW16 22.73586845 28HP_UW15 23.63568687 121HP_UW14 23.67535019 167HP_UW13 23.79950714 155HP_UW12 23.57590675 128HP_UW11 23.46050453 107HP_UW10 22.76583672 32HP_UW9 23.36472511 95HP_UW8 22.6179924 26HP_UW7 22.6492157 27HP_UW6 23.53131485 122HP_UW5 23.03481674 64HP_UW4 23.72464752 143HP_UW3 23.78984833 150HP_UW2 22.53971863 33HP_UW1 22.41057396 34
LST16FEB16 Distance WD (12pm-360)LST16FEB16 1Distance WD (12pm-360) 0.46 1
Combined_LST_C_UCILoggerPoint_HatirJheel_20170515.xls

1
Name LST15MAR17 Distance WD (12pm-270)
HP_UW50 26.84909058 444
HP_UW49 26.61771965 595
HP_UW48 27.063591 404
HP_UW47 26.96011353 432
HP_UW46 26.97304726 349
HP_UW45 26.58063698 354
HP_UW44 26.74604034 392
HP_UW43 26.88067627 382
HP_UW42 26.48315239 324
HP_UW41 26.4010601 198HP_UW40 26.42663956 139HP_UW39 25.59250259 69HP_UW38 26.87304115 252HP_UW37 27.06912613 602HP_UW36 26.77884293 559HP_UW35 26.73172188 492HP_UW34 26.78637886 525HP_UW33 27.07279396 476HP_UW32 26.92955971 430HP_UW31 26.79687881 368HP_UW30 27.01252174 290HP_UW29 27.10097313 191HP_UW28 25.61823463 57HP_UW27 26.92025948 389HP_UW26 27.15328598 257HP_UW25 26.979496 180HP_UW24 25.64563942 47HP_UW23 26.98784637 327HP_UW22 26.47361374 679HP_UW21 26.73233795 631HP_UW20 27.28928947 570HP_UW19 27.09458542 508HP_UW18 25.49770355 82HP_UW17 26.92671585 212HP_UW16 25.3735733 232HP_UW15 26.87273598 326HP_UW14 26.8880043 442HP_UW13 26.93526649 502HP_UW12 26.75706673 392HP_UW11 26.4353199 430HP_UW10 25.22512054 323HP_UW9 26.01132202 732HP_UW8 24.90502167 623HP_UW7 24.95769501 549HP_UW6 26.56581879 670HP_UW5 25.59491539 613HP_UW4 26.798172 569HP_UW3 26.86141205 534HP_UW2 24.99906731 390HP_UW1 24.80977821 428
LST15MAR17 Distance WD (12pm-270)LST15MAR17 1Distance WD (12pm-270) 0.12 1
Combined_LST_C_UCILoggerPoint_HatirJheel_20170515.xls

1
Name LST15APRIL18 Distance WD (12pm-240)
HP_UW50 27.86079216 444
HP_UW49 27.62883949 595
HP_UW48 27.88176155 404
HP_UW47 27.82115746 432
HP_UW46 27.84192848 349
HP_UW45 27.55628395 354
HP_UW44 27.64958191 392
HP_UW43 27.78630638 382
HP_UW42 27.51085281 324
HP_UW41 27.1218071 198HP_UW40 26.88558006 139HP_UW39 26.02633476 69HP_UW38 27.43659401 252HP_UW37 28.20325279 602HP_UW36 28.02186394 559HP_UW35 27.76828003 492HP_UW34 27.70195198 525HP_UW33 27.75707436 476HP_UW32 27.81095696 430HP_UW31 27.60195351 368HP_UW30 27.59710693 290HP_UW29 27.59717178 191HP_UW28 25.81502342 57HP_UW27 27.92191505 389HP_UW26 27.95158958 257HP_UW25 27.71068954 180HP_UW24 25.86078453 47HP_UW23 28.14195251 327HP_UW22 27.41560745 679HP_UW21 27.7017498 631HP_UW20 28.04304504 570HP_UW19 27.98880768 508HP_UW18 26.03438568 82HP_UW17 28.00156784 212HP_UW16 26.7993927 232HP_UW15 27.94119072 326HP_UW14 27.96672821 442HP_UW13 28.00855064 502HP_UW12 27.95894241 392HP_UW11 27.89922142 430HP_UW10 27.02291298 323HP_UW9 27.38363266 732HP_UW8 25.93332672 623HP_UW7 26.49946976 549HP_UW6 27.96959305 670HP_UW5 27.26135826 613HP_UW4 28.03472137 569HP_UW3 28.02478027 534HP_UW2 26.72406387 390HP_UW1 26.24505806 428
LST15APRIL18 Distance WD (12pm-240)LST15APRIL18 1Distance WD (12pm-270) 0.43 1
Combined_LST_C_UCILoggerPoint_HatirJheel_20170515.xls

1
Name LST17FEB18 Distance
HP_UW50 24.31643295 223
HP_UW49 24.26260757 450
HP_UW48 24.27282333 301
HP_UW47 24.31129646 302
HP_UW46 24.26959991 248
HP_UW45 23.64860916 318
HP_UW44 23.89373398 350
HP_UW43 23.93725395 370
HP_UW42 23.62171936 279
HP_UW41 23.44055939 154HP_UW40 23.60063934 91HP_UW39 23.11918259 40HP_UW38 23.82999229 187HP_UW37 24.6875515 205HP_UW36 24.18091965 528HP_UW35 24.3136692 445HP_UW34 24.49780655 427HP_UW33 24.45879364 350HP_UW32 24.12798309 402HP_UW31 23.9954071 312HP_UW30 24.04850578 207HP_UW29 24.04244614 128HP_UW28 23.04268265 35HP_UW27 24.26522446 252HP_UW26 24.34332657 155HP_UW25 24.30348587 102HP_UW24 23.10945892 25HP_UW23 24.3457737 182HP_UW22 23.92131615 508HP_UW21 24.208004 424HP_UW20 24.58328247 323HP_UW19 24.39139175 220HP_UW18 22.9902916 23HP_UW17 24.48591995 110HP_UW16 23.18119049 25HP_UW15 24.26725578 115HP_UW14 24.30371666 152HP_UW13 24.29421043 152HP_UW12 23.98694801 106HP_UW11 23.80527115 106HP_UW10 23.10764313 30HP_UW9 23.63613129 93HP_UW8 22.95876312 24HP_UW7 23.02038193 26HP_UW6 23.95833778 120HP_UW5 23.37424469 60HP_UW4 24.26602745 140HP_UW3 24.31890869 147HP_UW2 23.02694702 32HP_UW1 22.94577217 32
LST17FEB18 DistanceLST17FEB18 1Distance 0.595180675 1
Combined_LST_C_UCILoggerPoint_HatirJheel_20170515.xls

1
Name LST17MAR22 Distance
HP_UW50 24.224617 223
HP_UW49 23.96577644 450
HP_UW48 23.79745102 301
HP_UW47 24.09764862 302
HP_UW46 23.65782928 248
HP_UW45 23.04035759 318
HP_UW44 23.33227348 350
HP_UW43 23.38224602 370
HP_UW42 22.9678421 279
HP_UW41 22.5896492 154HP_UW40 22.9109993 91HP_UW39 22.74027443 40HP_UW38 22.97459221 187HP_UW37 24.43915939 205HP_UW36 24.02250862 528HP_UW35 24.13367844 445HP_UW34 24.29132271 427HP_UW33 24.31274223 350HP_UW32 23.70922661 402HP_UW31 23.49674797 312HP_UW30 23.18379211 207HP_UW29 23.20236397 128HP_UW28 22.76481247 35HP_UW27 24.04959488 252HP_UW26 23.60692406 155HP_UW25 23.85113907 102HP_UW24 22.90848732 25HP_UW23 24.18031693 182HP_UW22 23.64055252 508HP_UW21 23.90744591 424HP_UW20 24.48064613 323HP_UW19 24.31625938 220HP_UW18 22.92375374 23HP_UW17 24.22430801 110HP_UW16 23.30771255 25HP_UW15 24.1810627 115HP_UW14 24.17009354 152HP_UW13 24.06878281 152HP_UW12 23.95613861 106HP_UW11 23.70344734 106HP_UW10 23.21721458 30HP_UW9 23.66165543 93HP_UW8 22.89413071 24HP_UW7 22.98500252 26HP_UW6 23.70765114 120HP_UW5 23.40265274 60HP_UW4 23.88784409 140HP_UW3 23.98085976 147HP_UW2 22.92052841 32HP_UW1 22.67741203 32
LST17MAR22 DistanceLST17MAR22 1Distance 0.465227317 1
Combined_LST_C_UCILoggerPoint_HatirJheel_20170515.xls

1
Name LST13DEC24 Distance WD (9am-270, 12pm-270)
HP_UW50 21.4891243 444
HP_UW49 21.05958748 595
HP_UW48 21.47496796 404
HP_UW47 21.36790276 432
HP_UW46 21.29309464 349
HP_UW45 21.06009674 354
HP_UW44 21.13881874 392
HP_UW43 21.47757339 382
HP_UW42 20.96465492 324
HP_UW41 20.66912079 198HP_UW40 20.52885818 139HP_UW39 20.38691139 69HP_UW38 20.85477257 252HP_UW37 21.78848648 602HP_UW36 21.39883614 559HP_UW35 21.27978897 492HP_UW34 21.45232201 525HP_UW33 21.6627636 476HP_UW32 21.47301483 430HP_UW31 21.13230133 368HP_UW30 21.1043911 290HP_UW29 20.73945808 191HP_UW28 20.27619553 57HP_UW27 21.28476143 389HP_UW26 21.14752579 257HP_UW25 20.90747833 180HP_UW24 20.245924 47HP_UW23 21.47756004 327HP_UW22 21.13045311 679HP_UW21 21.2366581 631HP_UW20 21.75676155 570HP_UW19 21.5968399 508HP_UW18 20.3679924 82HP_UW17 21.22096443 212HP_UW16 20.71325874 232HP_UW15 21.37241745 326HP_UW14 21.41449547 442HP_UW13 21.30920792 502HP_UW12 21.24298477 392HP_UW11 21.18869972 430HP_UW10 20.38316727 323HP_UW9 21.14688301 732HP_UW8 20.32489014 623HP_UW7 20.38545036 549HP_UW6 21.23769569 670HP_UW5 20.68129349 613HP_UW4 21.46991348 569HP_UW3 21.424366 534HP_UW2 20.31315422 390HP_UW1 20.61464882 428
LST13DEC24 Distance WD (9am-270, 12pm-270)LST13DEC24 1Distance WD (9am-270, 12pm-270) 0.50 1
Combined_LST_C_UCILoggerPoint_HatirJheel_20170515.xls

1
Name LST14JAN25 Distance WD (12pm-0)
HP_UW50 22.44334984 230
HP_UW49 22.0218792 473
HP_UW48 22.25964165 338
HP_UW47 22.28164291 310
HP_UW46 22.15021133 281
HP_UW45 21.65964127 427
HP_UW44 21.90369797 456
HP_UW43 21.86094475 520
HP_UW42 21.55295181 347
HP_UW41 21.21100998 189HP_UW40 21.33937454 114HP_UW39 20.72034836 53HP_UW38 21.59792137 221HP_UW37 22.69602585 209HP_UW36 22.15952683 595HP_UW35 22.19029617 516HP_UW34 22.62804985 455HP_UW33 22.61117744 364HP_UW32 22.05620003 554HP_UW31 22.10732269 381HP_UW30 21.8278656 252HP_UW29 22.02865791 153HP_UW28 20.69620514 40HP_UW27 22.36317253 257HP_UW26 22.36348724 179HP_UW25 22.06860542 116HP_UW24 20.86749077 30HP_UW23 22.41141319 184HP_UW22 21.77977562 516HP_UW21 22.10112572 450HP_UW20 22.60539246 345HP_UW19 22.50767899 227HP_UW18 20.67486763 27HP_UW17 22.29153442 115HP_UW16 20.95377541 28HP_UW15 22.12500763 121HP_UW14 22.1708889 167HP_UW13 22.00968742 155HP_UW12 21.68775368 128HP_UW11 21.32815552 107HP_UW10 20.51081848 32HP_UW9 21.54809761 95HP_UW8 20.76245689 26HP_UW7 20.78437042 27HP_UW6 21.87317657 122HP_UW5 21.16887856 64HP_UW4 22.17705154 143HP_UW3 22.12024689 150HP_UW2 20.47958946 33HP_UW1 20.44000435 34
LST14JAN25 Distance WD (12pm-0)LST14JAN25 1Distance WD (12pm-0) 0.58 1
Combined_LST_C_UCILoggerPoint_HatirJheel_20170515.xls

1
Name LST14NOV25 Distance WD (12pm-270)
HP_UW50 23.84895325 444
HP_UW49 23.4069767 595
HP_UW48 23.89774132 404
HP_UW47 23.81472969 432
HP_UW46 23.62731934 349
HP_UW45 23.18412209 354
HP_UW44 23.39468575 392
HP_UW43 23.46357155 382
HP_UW42 23.08212662 324
HP_UW41 22.89794731 198HP_UW40 22.90218163 139HP_UW39 22.5894146 69HP_UW38 23.22046852 252HP_UW37 24.1696682 602HP_UW36 23.45673752 559HP_UW35 23.42458344 492HP_UW34 23.59455681 525HP_UW33 23.96513748 476HP_UW32 23.60871315 430HP_UW31 23.49156761 368HP_UW30 23.38066673 290HP_UW29 23.34127998 191HP_UW28 22.65615463 57HP_UW27 23.82427788 389HP_UW26 23.82670403 257HP_UW25 23.57896423 180HP_UW24 22.71681404 47HP_UW23 23.98191261 327HP_UW22 23.25380135 679HP_UW21 23.56121254 631HP_UW20 24.26880455 570HP_UW19 24.0796299 508HP_UW18 22.67028427 82HP_UW17 23.70905685 212HP_UW16 22.73629761 232HP_UW15 23.69127274 326HP_UW14 23.86164284 442HP_UW13 23.78031731 502HP_UW12 23.61637878 392HP_UW11 23.25077629 430HP_UW10 22.59767532 323HP_UW9 23.1609745 732HP_UW8 22.38499451 623HP_UW7 22.38772964 549HP_UW6 23.55399323 670HP_UW5 22.84262657 613HP_UW4 23.68502998 569HP_UW3 23.71522713 534HP_UW2 22.44401169 390HP_UW1 22.32711792 428
LST14NOV25 Distance WD (12pm-270)LST14NOV25 1Distance WD (12pm-270) 0.30 1
Combined_LST_C_UCILoggerPoint_HatirJheel_20170515.xls

1
Name LST15SEPT25 Distance WD (12pm-210)
HP_UW50 26.95055008 230
HP_UW49 26.81550217 473
HP_UW48 26.52653885 338
HP_UW47 26.74288559 310
HP_UW46 26.44454193 281
HP_UW45 26.19943619 427
HP_UW44 26.31713104 456
HP_UW43 26.47873497 520
HP_UW42 26.18148804 347
HP_UW41 25.9523983 189HP_UW40 25.88803673 114HP_UW39 25.53695488 53HP_UW38 26.00526237 221HP_UW37 27.3447361 209HP_UW36 26.99497414 595HP_UW35 26.72788048 516HP_UW34 26.91526794 455HP_UW33 26.76907349 364HP_UW32 26.62437439 554HP_UW31 26.34284592 381HP_UW30 26.17683792 252HP_UW29 26.30203247 153HP_UW28 25.41989708 40HP_UW27 26.76294136 257HP_UW26 26.65468216 179HP_UW25 26.74031448 116HP_UW24 25.7233448 30HP_UW23 27.00197983 184HP_UW22 26.47673416 516HP_UW21 26.91610909 450HP_UW20 27.28843117 345HP_UW19 27.14267921 227HP_UW18 25.67175484 27HP_UW17 27.26457596 115HP_UW16 25.94781494 28HP_UW15 27.02788353 121HP_UW14 27.11538887 167HP_UW13 27.16201401 155HP_UW12 26.97110176 128HP_UW11 26.93966293 107HP_UW10 26.38271904 32HP_UW9 26.46552086 95HP_UW8 25.63759422 26HP_UW7 25.92014885 27HP_UW6 26.86458397 122HP_UW5 26.26934052 64HP_UW4 27.07849121 143HP_UW3 27.1518364 150HP_UW2 26.26642227 33HP_UW1 25.78245544 34
LST15SEPT25 Distance WD (12pm-210)LST15SEPT25 1Distance WD (12pm-210) 0.34 1
Combined_LST_C_UCILoggerPoint_HatirJheel_20170515.xls

1
Name LST14FEB26 Distance WD (12pm-50)
HP_UW50 23.5644722 230
HP_UW49 23.08900642 473
HP_UW48 23.23388672 338
HP_UW47 23.32100296 310
HP_UW46 23.34160423 281
HP_UW45 22.55536652 427
HP_UW44 22.92047882 456
HP_UW43 22.90999031 520
HP_UW42 22.50982475 347
HP_UW41 22.47676468 189HP_UW40 22.68343544 114HP_UW39 22.10223961 53HP_UW38 22.83026695 221HP_UW37 23.89462662 209HP_UW36 23.07637215 595HP_UW35 22.99292946 516HP_UW34 23.22824669 455HP_UW33 23.26398087 364HP_UW32 23.15175819 554HP_UW31 22.93372536 381HP_UW30 23.01687241 252HP_UW29 23.10318756 153HP_UW28 21.93189812 40HP_UW27 23.49044991 257HP_UW26 23.46775627 179HP_UW25 23.33366013 116HP_UW24 22.10105324 30HP_UW23 23.65400696 184HP_UW22 22.79915619 516HP_UW21 23.20395851 450HP_UW20 23.76669884 345HP_UW19 23.80390358 227HP_UW18 22.20454979 27HP_UW17 23.64078331 115HP_UW16 22.73323441 28HP_UW15 23.55468941 121HP_UW14 23.58731079 167HP_UW13 23.42503548 155HP_UW12 23.28251076 128HP_UW11 22.98125649 107HP_UW10 22.38834381 32HP_UW9 23.14559174 95HP_UW8 22.11636543 26HP_UW7 22.24192238 27HP_UW6 23.32174873 122HP_UW5 22.73204803 64HP_UW4 23.45059395 143HP_UW3 23.43123436 150HP_UW2 22.21002007 33HP_UW1 22.07181931 34
LST14FEB26 Distance WD (12pm-50)LST14FEB26 1Distance WD (12pm-50) 0.31 1
Combined_LST_C_UCILoggerPoint_HatirJheel_20170515.xls

1
Name LST15OCT27 Distance WD (12pm-0)
HP_UW50 28.10982895 230
HP_UW49 27.75059319 473
HP_UW48 28.04508018 338
HP_UW47 27.98088837 310
HP_UW46 27.70166588 281
HP_UW45 27.63537025 427
HP_UW44 27.72080803 456
HP_UW43 27.79028511 520
HP_UW42 27.54210854 347
HP_UW41 27.12280655 189HP_UW40 26.9830513 114HP_UW39 26.48350334 53HP_UW38 27.31038094 221HP_UW37 28.48789597 209HP_UW36 27.93976784 595HP_UW35 27.78606606 516HP_UW34 27.84445953 455HP_UW33 28.25654411 364HP_UW32 27.83287811 554HP_UW31 27.92142677 381HP_UW30 27.49713707 252HP_UW29 27.31344223 153HP_UW28 26.53717422 40HP_UW27 27.90921211 257HP_UW26 27.93199539 179HP_UW25 27.82012939 116HP_UW24 26.54043961 30HP_UW23 28.15218163 184HP_UW22 27.67657852 516HP_UW21 27.94608307 450HP_UW20 28.37766266 345HP_UW19 28.27333641 227HP_UW18 26.77346802 27HP_UW17 28.02799034 115HP_UW16 26.77159119 28HP_UW15 28.01725388 121HP_UW14 28.15814018 167HP_UW13 28.15821838 155HP_UW12 27.9059124 128HP_UW11 27.76773453 107HP_UW10 26.73560715 32HP_UW9 27.40111542 95HP_UW8 26.31832504 26HP_UW7 26.29353714 27HP_UW6 27.81220245 122HP_UW5 26.92951202 64HP_UW4 28.20691299 143HP_UW3 28.22517776 150HP_UW2 26.54266167 33HP_UW1 26.34500313 34
LST15OCT27 Distance WD (12pm-0)LST15OCT27 1Distance WD (12pm-0) 0.54 1
Combined_LST_C_UCILoggerPoint_HatirJheel_20170515.xls

1
Name LST15JAN28 Distance WD (12pm-0)
HP_UW50 21.73438644 230
HP_UW49 21.51975632 473
HP_UW48 21.68424606 338
HP_UW47 21.77161407 310
HP_UW46 21.55907822 281
HP_UW45 21.10740471 427
HP_UW44 21.24761772 456
HP_UW43 21.50248146 520
HP_UW42 20.98696899 347
HP_UW41 20.57119751 189HP_UW40 20.48106384 114HP_UW39 19.95233345 53HP_UW38 20.94169044 221HP_UW37 22.43829155 209HP_UW36 21.78042412 595HP_UW35 21.47949982 516HP_UW34 21.80526733 455HP_UW33 21.82128334 364HP_UW32 21.71955299 554HP_UW31 21.18081474 381HP_UW30 21.16807938 252HP_UW29 21.15689278 153HP_UW28 19.72389603 40HP_UW27 21.75510979 257HP_UW26 21.6678524 179HP_UW25 21.3641758 116HP_UW24 19.96974182 30HP_UW23 21.86327744 184HP_UW22 21.26124763 516HP_UW21 21.59796715 450HP_UW20 22.04836273 345HP_UW19 21.94943047 227HP_UW18 19.9067173 27HP_UW17 21.72195625 115HP_UW16 20.52537537 28HP_UW15 21.72364616 121HP_UW14 21.83020782 167HP_UW13 21.79456139 155HP_UW12 21.60316849 128HP_UW11 21.24231911 107HP_UW10 20.65457916 32HP_UW9 20.9301815 95HP_UW8 20.08335876 26HP_UW7 20.29477501 27HP_UW6 21.58452034 122HP_UW5 20.69372749 64HP_UW4 21.71170616 143HP_UW3 21.70555687 150HP_UW2 20.35396576 33HP_UW1 20.10568047 34
LST15JAN28 Distance WD (12pm-0)LST15JAN28 1Distance WD (12pm-0) 0.54 1
Combined_LST_C_UCILoggerPoint_HatirJheel_20170515.xls

1
Name LST15NOV28 Distance WD (12pm-0)
HP_UW50 21.81775665 230
HP_UW49 21.60148811 473
HP_UW48 21.62450218 338
HP_UW47 21.6727047 310
HP_UW46 21.5221138 281
HP_UW45 21.25500107 427
HP_UW44 21.27064323 456
HP_UW43 21.54697227 520
HP_UW42 21.16994858 347
HP_UW41 21.05049896 189HP_UW40 21.10054398 114HP_UW39 20.82413864 53HP_UW38 21.20444489 221HP_UW37 22.23842239 209HP_UW36 21.55198097 595HP_UW35 21.50768662 516HP_UW34 21.60785675 455HP_UW33 21.88951874 364HP_UW32 21.53218842 554HP_UW31 21.34719658 381HP_UW30 21.33714867 252HP_UW29 21.24023628 153HP_UW28 20.80448341 40HP_UW27 21.60067177 257HP_UW26 21.68915749 179HP_UW25 21.71698761 116HP_UW24 20.72751045 30HP_UW23 21.91177177 184HP_UW22 21.34788322 516HP_UW21 21.65168381 450HP_UW20 22.15915108 345HP_UW19 22.08646393 227HP_UW18 20.95741081 27HP_UW17 21.9077549 115HP_UW16 21.21167374 28HP_UW15 21.85766983 121HP_UW14 21.89153099 167HP_UW13 21.87910652 155HP_UW12 21.69778061 128HP_UW11 21.59220505 107HP_UW10 21.01412773 32HP_UW9 21.47642899 95HP_UW8 20.72503853 26HP_UW7 20.79985046 27HP_UW6 21.6831646 122HP_UW5 21.19387245 64HP_UW4 21.98755836 143HP_UW3 21.96192551 150HP_UW2 20.89315033 33HP_UW1 20.7826252 34
LST15NOV28 Distance WD (12pm-0)LST15NOV28 1Distance WD (12pm-0) 0.33 1
Combined_LST_C_UCILoggerPoint_HatirJheel_20170515.xls

1
Name LST15DEC30 Distance WD (12pm-0)
HP_UW50 19.7638588230
HP_UW49 19.45110893 473
HP_UW48 19.86441612 338
HP_UW47 19.84436226 310
HP_UW46 19.65920258 281
HP_UW45 19.13644981 427
HP_UW44 19.40419197 456
HP_UW43 19.5465126 520
HP_UW42 19.21716881 347
HP_UW41 19.18282127 189HP_UW40 19.20337105 114HP_UW39 18.84999275 53HP_UW38 19.37253952 221HP_UW37 20.12726402 209HP_UW36 19.74118233 595HP_UW35 19.68907928 516HP_UW34 19.62298012 455HP_UW33 19.88511467 364HP_UW32 19.7110424 554HP_UW31 19.44751549 381HP_UW30 19.47505951 252HP_UW29 19.44921684 153HP_UW28 18.98310089 40HP_UW27 19.71806335 257HP_UW26 19.75100327 179HP_UW25 19.75063896 116HP_UW24 18.95685577 30HP_UW23 19.82805824 184HP_UW22 19.39683723 516HP_UW21 19.53375626 450HP_UW20 20.10969543 345HP_UW19 19.94860268 227HP_UW18 18.86837196 27HP_UW17 19.74689102 115HP_UW16 18.96438789 28HP_UW15 19.62651443 121HP_UW14 19.70332527 167HP_UW13 19.78298187 155HP_UW12 19.60616684 128HP_UW11 19.39451981 107HP_UW10 18.92668724 32HP_UW9 19.17713737 95HP_UW8 18.62438774 26HP_UW7 18.6516304 27HP_UW6 19.54706001 122HP_UW5 19.01856613 64HP_UW4 19.71012115 143HP_UW3 19.76537895 150HP_UW2 18.69758224 33HP_UW1 18.59353828 34
LST15DEC30 Distance WD (12pm-0)LST15DEC30 1Distance WD (12pm-0) 0.49 1
Combined_LST_C_UCILoggerPoint_HatirJheel_20170515.xls

1
Name LST14MAR30 Distance WD (12pm-250)
HP_UW50 35.41059494 444
HP_UW49 34.59390259 595
HP_UW48 34.97451782 404
HP_UW47 35.05498123 432
HP_UW46 35.23092651 349
HP_UW45 34.51668549 354
HP_UW44 34.54154205 392
HP_UW43 34.92593384 382
HP_UW42 34.29933929 324
HP_UW41 34.23593903 198HP_UW40 34.49620056 139HP_UW39 32.83964539 69HP_UW38 34.72631454 252HP_UW37 35.62037659 602HP_UW36 34.99520111 559HP_UW35 34.8365593 492HP_UW34 34.80919266 525HP_UW33 34.86292267 476HP_UW32 34.96484756 430HP_UW31 34.67930603 368HP_UW30 34.94822693 290HP_UW29 34.96285248 191HP_UW28 32.36601257 57HP_UW27 35.38477325 389HP_UW26 35.44711304 257HP_UW25 35.13874054 180HP_UW24 32.62581635 47HP_UW23 35.66892624 327HP_UW22 34.53803635 679HP_UW21 34.76237106 631HP_UW20 35.44299316 570HP_UW19 35.57802963 508HP_UW18 32.57541656 82HP_UW17 35.52333832 212HP_UW16 33.34925461 232HP_UW15 35.32771683 326HP_UW14 35.34283447 442HP_UW13 35.08055496 502HP_UW12 34.81642151 392HP_UW11 34.31983185 430HP_UW10 32.81469345 323HP_UW9 34.63487244 732HP_UW8 32.59328079 623HP_UW7 32.87669373 549HP_UW6 34.97012329 670HP_UW5 33.99000931 613HP_UW4 35.1500206 569HP_UW3 35.13262939 534HP_UW2 32.60424042 390HP_UW1 32.27597809 428
LST14MAR30 Distance WD (12pm-250)LST14MAR30 1Distance WD (12pm-250) 0.31 1
Combined_LST_C_UCILoggerPoint_HatirJheel_20170515.xls

2
Combined_LST_C_UCILoggerPoint_HatirJheel_20170515.xls

1
Name LST16NOV30 Distance WD (12pm-0)
HP_UW50 24.69256592 230
HP_UW49 24.50520515 473
HP_UW48 24.77346611 338
HP_UW47 24.59464645 310
HP_UW46 24.46829033 281
HP_UW45 23.8806324 427
HP_UW44 24.04779625 456
HP_UW43 24.19262314 520
HP_UW42 23.81505585 347
HP_UW41 23.58721924 189HP_UW40 23.51502991 114HP_UW39 23.04439354 53HP_UW38 23.91208076 221HP_UW37 25.17662239 209HP_UW36 24.6117115 595HP_UW35 24.50380707 516HP_UW34 24.64850616 455HP_UW33 24.83438492 364HP_UW32 24.27416611 554HP_UW31 24.37114906 381HP_UW30 24.18213654 252HP_UW29 23.98618507 153HP_UW28 23.15935516 40HP_UW27 24.49119949 257HP_UW26 24.48492813 179HP_UW25 24.28541756 116HP_UW24 23.23856163 30HP_UW23 24.70054817 184HP_UW22 24.28953934 516HP_UW21 24.51570129 450HP_UW20 25.03688431 345HP_UW19 24.86547661 227HP_UW18 23.34662437 27HP_UW17 24.51919746 115HP_UW16 23.39686966 28HP_UW15 24.52156258 121HP_UW14 24.61415863 167HP_UW13 24.58355141 155HP_UW12 24.33218193 128HP_UW11 24.12489319 107HP_UW10 23.25645256 32HP_UW9 23.79753876 95HP_UW8 22.87465858 26HP_UW7 22.91378593 27HP_UW6 24.17533112 122HP_UW5 23.37221909 64HP_UW4 24.59849167 143HP_UW3 24.62824059 150HP_UW2 23.09910202 33HP_UW1 22.88074112 34
LST16NOV30 Distance WD (12pm-0)LST16NOV30 1Distance WD (12pm-0) 0.56 1
Combined_LST_C_UCILoggerPoint_HatirJheel_20170515.xls
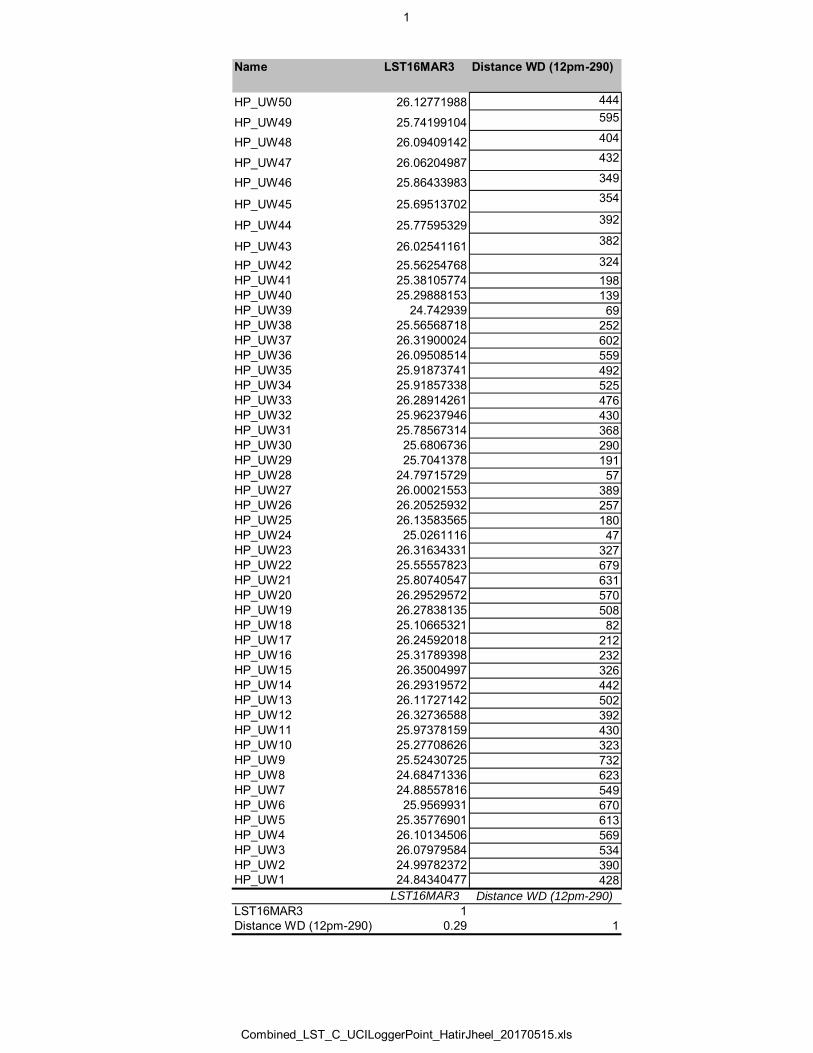
1
Name LST16MAR3 Distance WD (12pm-290)
HP_UW50 26.12771988 444
HP_UW49 25.74199104 595
HP_UW48 26.09409142 404
HP_UW47 26.06204987 432
HP_UW46 25.86433983 349
HP_UW45 25.69513702 354
HP_UW44 25.77595329 392
HP_UW43 26.02541161 382
HP_UW42 25.56254768 324
HP_UW41 25.38105774 198HP_UW40 25.29888153 139HP_UW39 24.742939 69HP_UW38 25.56568718 252HP_UW37 26.31900024 602HP_UW36 26.09508514 559HP_UW35 25.91873741 492HP_UW34 25.91857338 525HP_UW33 26.28914261 476HP_UW32 25.96237946 430HP_UW31 25.78567314 368HP_UW30 25.6806736 290HP_UW29 25.7041378 191HP_UW28 24.79715729 57HP_UW27 26.00021553 389HP_UW26 26.20525932 257HP_UW25 26.13583565 180HP_UW24 25.0261116 47HP_UW23 26.31634331 327HP_UW22 25.55557823 679HP_UW21 25.80740547 631HP_UW20 26.29529572 570HP_UW19 26.27838135 508HP_UW18 25.10665321 82HP_UW17 26.24592018 212HP_UW16 25.31789398 232HP_UW15 26.35004997 326HP_UW14 26.29319572 442HP_UW13 26.11727142 502HP_UW12 26.32736588 392HP_UW11 25.97378159 430HP_UW10 25.27708626 323HP_UW9 25.52430725 732HP_UW8 24.68471336 623HP_UW7 24.88557816 549HP_UW6 25.9569931 670HP_UW5 25.35776901 613HP_UW4 26.10134506 569HP_UW3 26.07979584 534HP_UW2 24.99782372 390HP_UW1 24.84340477 428
LST16MAR3 Distance WD (12pm-290)LST16MAR3 1Distance WD (12pm-290) 0.29 1
Combined_LST_C_UCILoggerPoint_HatirJheel_20170515.xls

1
Name LST15MAY4 Distance WD (12pm-130)
HP_UW50 30.12346458 230
HP_UW49 29.96056175 473
HP_UW48 29.85290337 338
HP_UW47 29.95142555 310
HP_UW46 29.65921402 281
HP_UW45 29.49341583 427
HP_UW44 29.71884537 456
HP_UW43 29.84348488 520
HP_UW42 29.40135193 347
HP_UW41 29.1397419 189HP_UW40 28.79077148 114HP_UW39 28.13479424 53HP_UW38 29.38591003 221HP_UW37 30.76463318 209HP_UW36 30.56443977 595HP_UW35 30.17009163 516HP_UW34 29.95178795 455HP_UW33 30.08270836 364HP_UW32 29.99190331 554HP_UW31 29.55920219 381HP_UW30 29.5019989 252HP_UW29 29.45025253 153HP_UW28 28.01029205 40HP_UW27 29.85260582 257HP_UW26 29.8402977 179HP_UW25 29.56099129 116HP_UW24 28.07156181 30HP_UW23 30.13689613 184HP_UW22 29.87441254 516HP_UW21 30.05376625 450HP_UW20 30.48532867 345HP_UW19 30.47376633 227HP_UW18 28.44830513 27HP_UW17 29.90200424 115HP_UW16 28.68468857 28HP_UW15 30.36439514 121HP_UW14 30.51862144 167HP_UW13 30.44018555 155HP_UW12 30.49723816 128HP_UW11 30.30900574 107HP_UW10 29.27239037 32HP_UW9 29.79889107 95HP_UW8 28.29524422 26HP_UW7 28.66526413 27HP_UW6 30.55130005 122HP_UW5 29.53233147 64HP_UW4 30.56617165 143HP_UW3 30.46533775 150HP_UW2 29.02650261 33HP_UW1 28.46346092 34
LST15MAY4 Distance WD (12pm-130)LST15MAY4 1Distance WD (12pm-0) 0.46 1
Combined_LST_C_UCILoggerPoint_HatirJheel_20170515.xls

1
Name LST13NOV6 Distance WD (9am-0, 12pm-50)
HP_UW50 27.43475151 230
HP_UW49 26.86514664 473
HP_UW48 27.17402649 338
HP_UW47 27.13775635 310
HP_UW46 26.83324242 281
HP_UW45 26.83057976 427
HP_UW44 26.86397552 456
HP_UW43 27.13028526 520
HP_UW42 26.70049095 347
HP_UW41 26.15581894 189HP_UW40 26.13817024 114HP_UW39 25.86006546 53HP_UW38 26.29422379 221HP_UW37 27.9243679 209HP_UW36 27.44838333 595HP_UW35 27.2724762 516HP_UW34 27.20902634 455HP_UW33 27.37090874 364HP_UW32 27.14720917 554HP_UW31 26.9388237 381HP_UW30 26.59797668 252HP_UW29 26.29381561 153HP_UW28 25.98705101 40HP_UW27 26.90934563 257HP_UW26 26.81923866 179HP_UW25 26.79558754 116HP_UW24 25.94518852 30HP_UW23 27.19934082 184HP_UW22 26.80956078 516HP_UW21 26.98597145 450HP_UW20 27.6490097 345HP_UW19 27.59474182 227HP_UW18 25.93326759 27HP_UW17 27.25302696 115HP_UW16 26.31463623 28HP_UW15 27.2918644 121HP_UW14 27.37414551 167HP_UW13 27.46487427 155HP_UW12 27.20580292 128HP_UW11 27.17685699 107HP_UW10 26.05885696 32HP_UW9 27.24908066 95HP_UW8 26.11788559 26HP_UW7 26.15808678 27HP_UW6 27.46391678 122HP_UW5 27.02859497 64HP_UW4 27.7112999 143HP_UW3 27.57791901 150HP_UW2 26.37590408 33HP_UW1 26.35897827 34
LST13NOV6 Distance WD (9am-0, 12pm-50)LST13NOV6 1Distance WD (9am-0, 12pm-50) 0.42 1
Combined_LST_C_UCILoggerPoint_HatirJheel_20170515.xls

Appendix C: Data from the field measurement and Remote Sensing
Solar angle and time of the day of Landsat pass_2013-17

1
Name LST91DEC12 LST13APR12 LST13JUN15 LST13NOV6 LST13DEC24 LST14JAN25SUN_ELEVATION 35.00505087 63.63618502 68.85373393 46.8600317 37.36177871 40.861972SUN_AZIMUTH 144.9518863 118.960079 84.52699309 152.950763 153.5645038 146.511122Time of the day 9:54:00 AM 10:28:00 AM 10:27:00 AM 10:35:00 AM 10:22:00 AM 10:31:00 AM
Wind Direction9am N 200.00 90.00 0 270 270
Wind Direction12pm 180.00 90.00 50 270 0Wind Speed 9am 1.02 1.02 0 1.54 1.02Wind Speed 12pm 1.02 1.02 1.02 1.54 0
- Monthly Wind Direction % {N=0 or 360,E=90,S=180,W=270}
Jan Feb Mar Apr May JunNorth 98 67 56 38 37 24
NorthEast 1 4 2 3 5 0East 0 3 3 1 16 4
SouthEast 0 0 5 6 10 20South 0 8 17 49 23 42
SouthWest 0 11 6 1 4 10West 0 4 4 0 4 0
NorthWest 0 4 6 2 0 0
LST_SolarAngle_DayTime.xls

2
LST14FEB10 LST14FEB26 LST14MAR14 LST14MAR30 LST14NOV25 LST15JAN28 LST15FEB13 LST15MAR17
44.39224208 49.04143798 54.27717614 59.47781141 42.12883676 41.23130251 44.98517176 55.05047594142.4320455 137.7935396 132.3075142 125.4700419 154.3612878 145.5582843 141.4052045 130.984344410:30:00 AM 10:30:00 AM 10:28:00 AM 10:27:00 AM 10:34:00 AM 10:30:00 AM 10:29:00 AM 10:27:00 AM
360 360 360 240 320 0 0 0
50 50 360 250 270 0 270 2703.08 1.02 1.02 1.02 1.02 0 0 01.54 1.02 1.02 1.54 1.02 0 1.54 1.02
Jul Aug Sep Oct Nov Dec
57 59 58 84 96 830 1 1 2 0 84 9 3 4 1 116 19 2 2 0 017 10 29 4 0 0
6 1 7 0 1 00 2 1 3 0 30 0 1 1 2 5
LST_SolarAngle_DayTime.xls

3
LST15APR18 LST15MAY4 LST15SEP25 LST15OCT27 LST15NOV12 LST15NOV28 LST15DEC30 LST16JAN15
64.47193416 67.30699394 58.38129521 49.52284282 45.10495132 41.44353568 38.19196082 39.10028096114.8193699 104.5042733 135.9828252 150.1262121 153.3742885 154.4511084 151.6960992 148.666819610:25:00 AM 10:24:00 AM 10:29:00 AM 10:31:00 AM 10:32:00 AM 10:32:00 AM 10:31:00 AM 10:30:00 AM
260 180 0 0 0 0 0 0
240 130 210 0 0 0 0 01.02 1.02 0 0 0 0 0 05.15 1.02 1.02 0 0 0 0 0
LST_SolarAngle_DayTime.xls

4
LST16FEB16 LST16MAR3 LST16NOV14 LST16NOV30 LST17FEB18 LST17MAR22
45.66159944 50.59388956 44.42461594 40.94110416 46.45721396 56.80888777140.7578886 135.9226066 153.7597953 154.4870957 139.9780613 128.94338310:28:00 AM 10:30:00 AM 10:30:00 AM 10:31:00 AM 10:30:00 AM 10:27:00 AM
0 0 50 90
360 290 360 00 0 1.02 1.02
1.02 1.54 1.02 0
LST_SolarAngle_DayTime.xls

Appendix D: Data from the field measurement
Bangladesh Meteorological Department (BMD)_Field measurement data

Timecum Temperature(12T)
Relative Humidity(12RH)
Dew Point (12DP)
VariablesCorrelation coefficent
0.0 22.5 64.5 15.5 12T -0.9917444
1.0 22.5 64.5 15.5 12RH 0.9834432
2.0 22.5 65.0 15.6 12DP -0.7602334
3.0 22.5 65.0 15.64.0 22.5 65.0 15.65.0 22.5 65.0 15.66.0 22.0 65.0 15.17.0 22.0 65.0 15.18.0 22.0 65.5 15.29.0 22.0 64.5 15.010.0 22.0 65.0 15.111.0 22.0 65.5 15.212.0 22.0 65.0 15.113.0 22.0 65.0 15.114.0 22.0 64.5 15.015.0 22.0 65.5 15.216.0 22.0 65.5 15.217.0 22.0 65.5 15.218.0 22.0 65.5 15.219.0 22.0 65.5 15.220.0 22.0 66.0 15.421.0 22.0 65.5 15.222.0 22.0 65.5 15.223.0 22.0 65.5 15.224.0 22.0 65.5 15.225.0 22.0 66.0 15.426.0 22.0 65.5 15.227.0 22.0 66.0 15.428.0 22.0 66.0 15.429.0 22.0 66.0 15.430.0 22.0 66.0 15.431.0 22.0 66.0 15.432.0 22.0 66.0 15.433.0 22.0 66.0 15.434.0 22.0 66.0 15.435.0 22.0 66.0 15.436.0 22.0 66.0 15.437.0 22.0 66.5 15.538.0 22.0 66.5 15.539.0 22.0 65.5 15.240.0 22.0 66.0 15.441.0 22.0 66.0 15.442.0 22.0 66.0 15.443.0 22.0 66.0 15.444.0 22.0 66.0 15.445.0 22.0 66.0 15.446.0 22.0 66.0 15.447.0 22.0 66.0 15.4

48.0 22.0 66.0 15.449.0 22.0 66.0 15.450.0 22.0 66.5 15.551.0 22.0 67.0 15.652.0 22.0 66.5 15.553.0 22.0 66.5 15.554.0 22.0 66.5 15.555.0 22.0 66.5 15.556.0 22.0 66.5 15.557.0 22.0 66.5 15.558.0 22.0 66.5 15.559.0 22.0 66.5 15.560.0 22.0 67.0 15.661.0 22.0 67.0 15.662.0 22.0 67.0 15.663.0 22.0 67.0 15.664.0 22.0 67.5 15.765.0 22.0 67.5 15.766.0 22.0 67.5 15.767.0 22.0 67.5 15.768.0 22.0 67.5 15.769.0 22.0 67.5 15.770.0 22.0 67.5 15.771.0 22.0 68.0 15.872.0 22.0 68.0 15.873.0 22.0 68.0 15.874.0 22.0 68.0 15.875.0 22.0 68.0 15.876.0 22.0 68.0 15.877.0 22.0 68.0 15.878.0 22.0 68.5 15.979.0 22.0 68.0 15.880.0 22.0 68.5 15.981.0 22.0 68.5 15.982.0 22.0 68.5 15.983.0 22.0 68.5 15.984.0 22.0 68.5 15.985.0 22.0 68.5 15.986.0 22.0 68.5 15.987.0 22.0 68.5 15.988.0 22.0 68.5 15.989.0 22.0 69.0 16.190.0 22.0 69.0 16.191.0 21.5 68.5 15.592.0 21.5 69.0 15.693.0 21.5 69.0 15.694.0 21.5 69.0 15.695.0 21.5 69.0 15.696.0 21.5 69.0 15.697.0 21.5 69.0 15.6

98.0 21.5 69.0 15.699.0 21.5 69.0 15.6100.0 21.5 69.0 15.6101.0 21.5 69.0 15.6102.0 21.5 69.0 15.6103.0 21.5 69.0 15.6104.0 21.5 69.0 15.6105.0 21.5 69.0 15.6106.0 21.5 69.5 15.7107.0 21.5 69.5 15.7108.0 21.5 69.5 15.7109.0 21.5 69.5 15.7110.0 21.5 69.5 15.7111.0 21.5 69.5 15.7112.0 21.5 69.5 15.7113.0 21.5 69.5 15.7114.0 21.5 69.5 15.7115.0 21.5 69.5 15.7116.0 21.5 69.5 15.7117.0 21.5 69.5 15.7118.0 21.5 69.5 15.7119.0 21.5 69.5 15.7120.0 21.5 69.5 15.7121.0 21.5 69.5 15.7122.0 21.5 69.5 15.7123.0 21.5 69.5 15.7124.0 21.5 69.5 15.7125.0 21.5 69.5 15.7126.0 21.0 69.5 15.2127.0 21.0 70.0 15.3128.0 21.0 70.0 15.3129.0 21.0 70.0 15.3130.0 21.0 70.0 15.3131.0 21.0 70.5 15.4132.0 21.0 70.0 15.3133.0 21.0 70.5 15.4134.0 21.0 70.5 15.4135.0 21.0 70.5 15.4136.0 21.0 70.5 15.4137.0 21.0 70.5 15.4138.0 21.0 70.5 15.4139.0 21.0 70.5 15.4140.0 21.0 71.0 15.5141.0 21.0 71.0 15.5142.0 21.0 71.0 15.5143.0 21.0 71.5 15.7144.0 21.0 71.5 15.7145.0 21.0 71.0 15.5146.0 21.0 72.0 15.8147.0 21.0 72.0 15.8

148.0 21.0 72.0 15.8149.0 21.0 72.0 15.8150.0 21.0 72.0 15.8151.0 21.0 72.0 15.8152.0 21.0 72.0 15.8153.0 21.0 72.0 15.8154.0 21.0 72.0 15.8155.0 21.0 72.5 15.9156.0 21.0 72.0 15.8157.0 21.0 72.0 15.8158.0 21.0 72.0 15.8159.0 21.0 72.5 15.9160.0 21.0 72.5 15.9161.0 21.0 72.5 15.9162.0 21.0 72.0 15.8163.0 21.0 72.5 15.9164.0 21.0 72.5 15.9165.0 21.0 72.5 15.9166.0 21.0 72.5 15.9167.0 21.0 72.5 15.9168.0 21.0 72.5 15.9169.0 21.0 72.5 15.9170.0 21.0 72.0 15.8171.0 21.0 72.0 15.8172.0 21.0 72.0 15.8173.0 21.0 72.0 15.8174.0 21.0 71.5 15.7175.0 21.0 72.0 15.8176.0 21.0 71.5 15.7177.0 21.0 71.5 15.7178.0 21.0 71.0 15.5179.0 21.0 70.5 15.4180.0 21.0 71.0 15.5181.0 21.0 70.5 15.4182.0 21.0 70.0 15.3183.0 21.0 69.5 15.2184.0 21.0 69.5 15.2185.0 21.0 69.5 15.2186.0 21.0 69.0 15.1187.0 21.0 69.5 15.2188.0 21.0 69.5 15.2189.0 21.0 69.0 15.1190.0 21.0 68.5 15.0191.0 21.0 69.0 15.1192.0 21.0 69.0 15.1193.0 21.0 68.5 15.0194.0 21.0 68.5 15.0195.0 21.0 68.5 15.0196.0 21.0 68.5 15.0197.0 21.0 69.0 15.1

198.0 21.0 68.5 15.0199.0 21.0 68.5 15.0200.0 21.0 68.5 15.0201.0 21.0 68.5 15.0202.0 21.0 68.5 15.0203.0 21.0 68.5 15.0204.0 21.0 68.5 15.0205.0 21.0 68.5 15.0206.0 21.0 68.5 15.0207.0 21.0 69.0 15.1208.0 21.0 69.0 15.1209.0 21.0 69.5 15.2210.0 21.0 68.5 15.0211.0 21.0 68.5 15.0212.0 21.0 69.0 15.1213.0 21.0 68.5 15.0214.0 21.0 68.5 15.0215.0 21.0 68.5 15.0216.0 21.0 68.5 15.0217.0 21.0 69.0 15.1218.0 21.0 69.0 15.1219.0 21.0 69.0 15.1220.0 21.0 69.5 15.2221.0 21.0 69.5 15.2222.0 21.0 69.5 15.2223.0 21.0 70.0 15.3224.0 21.0 70.0 15.3225.0 21.0 70.0 15.3226.0 21.0 70.5 15.4227.0 20.5 70.5 15.0228.0 20.5 70.5 15.0229.0 20.5 70.5 15.0230.0 20.5 70.5 15.0231.0 20.5 71.0 15.1232.0 20.5 70.5 15.0233.0 20.5 71.0 15.1234.0 20.5 71.0 15.1235.0 20.5 71.0 15.1236.0 20.5 71.0 15.1237.0 20.5 71.0 15.1238.0 20.5 71.5 15.2239.0 20.5 71.5 15.2240.0 20.5 71.5 15.2241.0 20.5 71.5 15.2242.0 20.5 71.5 15.2243.0 20.5 71.5 15.2244.0 20.5 71.5 15.2245.0 20.5 71.5 15.2246.0 20.5 71.5 15.2247.0 20.5 72.0 15.3

248.0 20.5 72.0 15.3249.0 20.5 72.0 15.3250.0 20.5 72.0 15.3251.0 20.5 72.0 15.3252.0 20.5 72.0 15.3253.0 20.5 72.0 15.3254.0 20.5 72.0 15.3255.0 20.5 72.0 15.3256.0 20.5 72.0 15.3257.0 20.5 72.0 15.3258.0 20.5 72.0 15.3259.0 20.5 72.0 15.3260.0 20.5 72.5 15.4261.0 20.5 72.5 15.4262.0 20.5 72.5 15.4263.0 20.5 72.5 15.4264.0 20.5 73.0 15.5265.0 20.5 73.0 15.5266.0 20.5 73.0 15.5267.0 20.5 73.0 15.5268.0 20.5 73.0 15.5269.0 20.5 73.0 15.5270.0 20.5 73.0 15.5271.0 20.0 73.5 15.1272.0 20.0 73.5 15.1273.0 20.0 73.5 15.1274.0 20.0 73.5 15.1275.0 20.0 73.5 15.1276.0 20.0 74.0 15.2277.0 20.0 74.0 15.2278.0 20.0 74.0 15.2279.0 20.0 74.0 15.2280.0 20.0 74.0 15.2281.0 20.0 74.0 15.2282.0 20.0 74.0 15.2283.0 20.0 74.0 15.2284.0 20.0 74.5 15.3285.0 20.0 74.5 15.3286.0 20.0 74.5 15.3287.0 20.0 74.5 15.3288.0 20.0 74.5 15.3289.0 20.0 74.5 15.3290.0 20.0 74.5 15.3291.0 20.0 74.5 15.3292.0 20.0 74.5 15.3293.0 20.0 74.5 15.3294.0 20.0 74.5 15.3295.0 20.0 74.5 15.3296.0 20.0 74.5 15.3297.0 20.0 74.5 15.3

298.0 20.0 75.0 15.4299.0 20.0 75.0 15.4300.0 20.0 75.0 15.4301.0 20.0 75.0 15.4302.0 20.0 75.0 15.4303.0 20.0 75.0 15.4304.0 20.0 75.5 15.5305.0 20.0 75.5 15.5306.0 20.0 75.5 15.5307.0 20.0 75.5 15.5308.0 20.0 75.5 15.5309.0 19.5 76.0 15.2310.0 19.5 76.5 15.3311.0 20.0 76.0 15.6312.0 19.5 76.5 15.3313.0 19.5 76.5 15.3314.0 19.5 76.5 15.3315.0 19.5 77.0 15.4316.0 19.5 76.5 15.3317.0 19.5 77.0 15.4318.0 19.5 77.0 15.4319.0 19.5 77.0 15.4320.0 19.5 77.0 15.4321.0 19.5 77.0 15.4322.0 20.0 77.0 15.8323.0 20.0 77.0 15.8324.0 20.0 76.5 15.7325.0 19.5 77.0 15.4326.0 19.5 77.0 15.4327.0 19.5 77.0 15.4328.0 19.5 77.0 15.4329.0 19.5 77.0 15.4330.0 19.5 77.0 15.4331.0 19.5 77.0 15.4332.0 19.5 77.0 15.4333.0 19.5 77.0 15.4334.0 19.5 77.5 15.5335.0 19.5 77.5 15.5336.0 19.5 78.0 15.6337.0 19.5 78.0 15.6338.0 19.5 77.5 15.5339.0 19.5 78.0 15.6340.0 19.5 78.0 15.6341.0 19.5 78.0 15.6342.0 19.5 78.0 15.6343.0 19.5 78.0 15.6344.0 19.5 78.0 15.6345.0 19.5 78.0 15.6346.0 19.5 78.0 15.6347.0 19.5 78.0 15.6

348.0 19.5 78.0 15.6349.0 19.5 78.0 15.6350.0 19.5 78.0 15.6351.0 19.5 78.5 15.7352.0 19.5 78.5 15.7353.0 19.5 78.5 15.7354.0 19.5 78.0 15.6355.0 19.5 78.5 15.7356.0 19.5 78.5 15.7357.0 19.5 78.0 15.6358.0 19.5 78.0 15.6359.0 19.5 78.0 15.6360.0 19.5 79.0 15.8361.0 19.5 79.0 15.8362.0 19.5 79.0 15.8363.0 19.5 78.5 15.7364.0 19.5 79.0 15.8365.0 19.5 79.0 15.8366.0 19.5 79.0 15.8367.0 19.5 79.0 15.8368.0 19.5 79.0 15.8369.0 19.5 79.0 15.8370.0 19.5 79.0 15.8371.0 19.5 79.0 15.8372.0 19.5 79.0 15.8373.0 19.5 79.0 15.8374.0 19.5 79.0 15.8375.0 19.5 79.0 15.8376.0 19.5 79.0 15.8377.0 19.5 79.0 15.8378.0 19.5 79.0 15.8379.0 19.5 79.0 15.8380.0 19.5 79.0 15.8381.0 19.5 79.0 15.8382.0 19.5 79.0 15.8383.0 19.5 79.0 15.8384.0 19.5 79.0 15.8385.0 19.5 79.0 15.8386.0 19.5 79.0 15.8387.0 19.5 79.0 15.8388.0 19.5 79.0 15.8389.0 19.5 79.0 15.8390.0 19.5 79.0 15.8391.0 19.5 79.0 15.8392.0 19.5 79.0 15.8393.0 19.5 79.0 15.8394.0 19.5 79.0 15.8395.0 19.0 79.0 15.3396.0 19.0 79.5 15.4397.0 19.0 79.5 15.4

398.0 19.0 79.5 15.4399.0 19.0 79.0 15.3400.0 19.0 79.5 15.4401.0 19.0 79.5 15.4402.0 19.0 79.5 15.4403.0 19.0 80.0 15.5404.0 19.0 80.0 15.5405.0 19.0 80.0 15.5406.0 19.0 79.5 15.4407.0 19.0 79.5 15.4408.0 19.0 79.5 15.4409.0 19.0 79.5 15.4410.0 19.0 80.0 15.5411.0 19.0 80.0 15.5412.0 19.0 80.0 15.5413.0 19.0 80.0 15.5414.0 19.0 80.5 15.6415.0 19.0 80.0 15.5416.0 19.0 79.5 15.4417.0 19.0 80.5 15.6418.0 19.0 80.0 15.5419.0 19.0 80.5 15.6420.0 19.0 80.0 15.5421.0 19.0 80.0 15.5422.0 19.0 80.5 15.6423.0 19.0 80.5 15.6424.0 19.0 80.0 15.5425.0 19.0 80.0 15.5426.0 19.0 80.5 15.6427.0 19.0 80.5 15.6428.0 18.5 80.5 15.1429.0 18.5 80.5 15.1430.0 18.5 81.0 15.2431.0 18.5 81.5 15.3432.0 18.5 81.0 15.2433.0 18.5 81.0 15.2434.0 18.5 81.0 15.2435.0 18.5 81.0 15.2436.0 18.5 81.0 15.2437.0 18.5 81.5 15.3438.0 18.5 81.5 15.3439.0 18.5 82.0 15.4440.0 18.5 82.0 15.4441.0 18.5 82.5 15.5442.0 18.5 82.5 15.5443.0 18.5 82.0 15.4444.0 18.5 82.0 15.4445.0 18.5 82.0 15.4446.0 18.5 82.0 15.4447.0 18.5 82.0 15.4

448.0 18.5 82.0 15.4449.0 18.5 82.0 15.4450.0 18.5 82.0 15.4451.0 18.5 82.0 15.4452.0 18.5 82.0 15.4453.0 18.0 82.0 14.9454.0 18.0 82.5 15.0455.0 18.0 82.0 14.9456.0 18.0 82.5 15.0457.0 18.0 82.0 14.9458.0 18.0 82.0 14.9459.0 18.0 82.0 14.9460.0 18.0 82.0 14.9461.0 18.0 82.0 14.9462.0 18.0 82.5 15.0463.0 18.0 82.0 14.9464.0 18.0 82.0 14.9465.0 18.0 82.0 14.9466.0 18.0 82.5 15.0467.0 18.0 82.5 15.0468.0 18.0 82.0 14.9469.0 18.0 82.0 14.9470.0 18.0 82.0 14.9471.0 18.0 82.5 15.0472.0 18.0 82.5 15.0473.0 18.0 82.5 15.0474.0 18.0 82.5 15.0475.0 18.0 82.5 15.0476.0 18.0 82.5 15.0477.0 18.0 82.0 14.9478.0 18.0 82.0 14.9479.0 18.0 82.0 14.9480.0 18.0 82.5 15.0481.0 18.0 82.5 15.0482.0 18.0 82.5 15.0483.0 18.0 82.5 15.0484.0 18.0 82.5 15.0485.0 18.0 82.5 15.0486.0 18.0 83.0 15.1487.0 18.0 83.0 15.1488.0 18.0 82.5 15.0489.0 18.0 82.5 15.0490.0 18.0 82.5 15.0491.0 18.0 82.5 15.0492.0 18.0 82.5 15.0493.0 18.0 82.5 15.0494.0 18.0 82.5 15.0495.0 18.0 83.0 15.1496.0 18.0 82.5 15.0497.0 18.0 83.0 15.1

498.0 18.0 83.5 15.2499.0 17.5 83.5 14.7500.0 17.5 83.5 14.7501.0 17.5 84.0 14.8502.0 17.5 84.0 14.8503.0 17.5 84.0 14.8504.0 17.5 83.5 14.7505.0 17.5 83.5 14.7506.0 17.5 83.5 14.7507.0 17.5 83.5 14.7508.0 17.5 84.0 14.8509.0 17.5 83.5 14.7510.0 17.5 83.5 14.7511.0 17.5 84.0 14.8512.0 17.5 84.0 14.8513.0 17.5 84.5 14.9514.0 17.5 84.5 14.9515.0 17.5 84.5 14.9516.0 17.5 84.0 14.8517.0 17.5 84.0 14.8518.0 17.5 84.0 14.8519.0 18.0 84.0 15.3520.0 18.0 83.5 15.2521.0 18.0 84.0 15.3522.0 18.0 83.5 15.2523.0 18.0 83.5 15.2524.0 18.0 83.5 15.2525.0 18.0 83.5 15.2526.0 18.0 83.5 15.2527.0 18.0 83.5 15.2528.0 18.0 83.5 15.2529.0 18.0 83.5 15.2530.0 18.0 83.5 15.2531.0 18.0 83.0 15.1532.0 18.0 83.5 15.2533.0 18.0 83.5 15.2534.0 18.0 83.5 15.2535.0 18.0 83.5 15.2536.0 18.0 83.5 15.2537.0 18.0 83.5 15.2538.0 18.0 83.5 15.2539.0 18.0 83.5 15.2540.0 18.0 83.5 15.2541.0 17.5 83.5 14.7542.0 17.5 83.5 14.7543.0 17.5 83.5 14.7544.0 17.5 83.5 14.7545.0 17.5 83.5 14.7546.0 17.5 83.5 14.7547.0 17.5 83.5 14.7

548.0 17.5 83.5 14.7549.0 17.5 83.5 14.7550.0 17.5 83.5 14.7551.0 17.5 84.0 14.8552.0 17.5 83.5 14.7553.0 17.5 84.0 14.8554.0 17.5 83.5 14.7555.0 17.5 84.0 14.8556.0 17.5 84.0 14.8557.0 17.5 84.0 14.8558.0 17.5 84.0 14.8559.0 17.5 84.0 14.8560.0 17.5 84.0 14.8561.0 17.5 84.0 14.8562.0 17.5 84.5 14.9563.0 17.5 84.0 14.8564.0 17.5 84.0 14.8565.0 17.5 84.0 14.8566.0 17.5 84.0 14.8567.0 17.5 84.0 14.8568.0 17.5 84.5 14.9569.0 17.5 84.0 14.8570.0 17.5 84.0 14.8571.0 17.5 84.0 14.8572.0 17.5 84.0 14.8573.0 17.5 84.5 14.9574.0 17.5 84.0 14.8575.0 17.5 84.5 14.9576.0 17.5 84.0 14.8577.0 17.5 84.0 14.8578.0 17.5 84.0 14.8579.0 17.5 84.0 14.8580.0 17.5 84.0 14.8581.0 17.5 84.0 14.8582.0 17.5 84.0 14.8583.0 17.5 84.0 14.8584.0 17.5 84.0 14.8585.0 17.5 84.5 14.9586.0 17.5 84.5 14.9587.0 17.5 84.5 14.9588.0 17.5 85.0 15.0589.0 17.5 85.0 15.0590.0 17.5 85.0 15.0591.0 17.5 85.0 15.0592.0 17.5 85.0 15.0593.0 17.5 85.0 15.0594.0 17.0 85.0 14.5595.0 17.0 85.0 14.5596.0 17.0 85.0 14.5597.0 17.0 85.0 14.5

598.0 17.0 85.0 14.5599.0 17.0 85.5 14.6600.0 17.0 85.5 14.6601.0 17.0 85.5 14.6602.0 17.0 85.5 14.6603.0 17.0 85.5 14.6604.0 17.0 86.0 14.6605.0 17.0 86.0 14.6606.0 17.0 86.0 14.6607.0 17.0 85.5 14.6608.0 17.0 86.0 14.6609.0 17.0 85.5 14.6610.0 17.0 85.5 14.6611.0 17.0 85.5 14.6612.0 17.0 85.5 14.6613.0 17.0 85.5 14.6614.0 17.0 85.5 14.6615.0 17.0 85.5 14.6616.0 17.0 85.5 14.6617.0 17.0 85.5 14.6618.0 17.0 85.5 14.6619.0 17.0 86.0 14.6620.0 17.0 86.0 14.6621.0 16.5 86.0 14.2622.0 16.5 86.0 14.2623.0 16.5 86.0 14.2624.0 16.5 86.0 14.2625.0 16.5 87.0 14.3626.0 16.5 86.0 14.2627.0 16.5 87.0 14.3628.0 16.5 87.0 14.3629.0 16.5 87.0 14.3630.0 16.5 87.0 14.3631.0 16.5 87.5 14.4632.0 16.5 87.5 14.4633.0 16.5 87.0 14.3634.0 16.5 87.0 14.3635.0 16.5 87.5 14.4636.0 16.5 87.5 14.4637.0 16.5 87.0 14.3638.0 16.5 87.0 14.3639.0 16.5 87.0 14.3640.0 16.5 87.0 14.3641.0 16.5 87.0 14.3642.0 16.5 87.0 14.3643.0 16.5 87.5 14.4644.0 16.5 87.0 14.3645.0 16.5 87.0 14.3646.0 16.5 87.0 14.3647.0 16.5 87.0 14.3

648.0 16.5 87.0 14.3649.0 16.5 87.0 14.3650.0 16.5 87.0 14.3651.0 16.5 87.0 14.3652.0 16.5 87.0 14.3653.0 16.5 87.0 14.3654.0 16.5 87.0 14.3655.0 16.0 87.5 13.9656.0 16.0 87.5 13.9657.0 16.0 87.0 13.8658.0 16.0 87.0 13.8659.0 16.0 88.0 14.0660.0 16.0 88.0 14.0661.0 16.0 87.5 13.9662.0 16.0 87.5 13.9663.0 16.0 87.5 13.9664.0 16.0 87.5 13.9665.0 16.0 87.5 13.9666.0 16.0 88.0 14.0667.0 16.5 87.5 14.4668.0 16.5 88.0 14.5669.0 16.5 87.5 14.4670.0 16.5 87.5 14.4671.0 16.5 87.5 14.4672.0 16.5 87.5 14.4673.0 16.5 87.5 14.4674.0 16.5 87.5 14.4675.0 16.5 87.5 14.4676.0 16.5 87.0 14.3677.0 16.5 87.5 14.4678.0 16.5 87.0 14.3679.0 16.5 87.0 14.3680.0 16.5 87.0 14.3681.0 16.5 87.0 14.3682.0 16.5 87.0 14.3683.0 16.5 87.0 14.3684.0 16.5 87.0 14.3685.0 16.5 87.0 14.3686.0 16.5 87.0 14.3687.0 16.5 87.0 14.3688.0 16.5 86.5 14.2689.0 16.5 87.0 14.3690.0 16.5 86.5 14.2691.0 16.5 86.5 14.2692.0 16.5 86.0 14.2693.0 16.5 86.5 14.2694.0 16.5 86.0 14.2695.0 16.5 86.0 14.2696.0 16.5 86.0 14.2697.0 16.5 87.0 14.3

698.0 16.5 86.0 14.2699.0 16.5 86.0 14.2700.0 16.5 87.0 14.3701.0 16.5 86.5 14.2702.0 16.5 86.5 14.2703.0 16.5 86.5 14.2704.0 16.5 86.0 14.2705.0 16.5 86.5 14.2706.0 16.5 86.5 14.2707.0 16.5 86.5 14.2708.0 16.0 86.5 13.7709.0 16.0 87.0 13.8710.0 16.0 87.5 13.9711.0 16.0 87.5 13.9712.0 16.0 87.0 13.8713.0 16.0 87.5 13.9714.0 16.0 87.5 13.9715.0 16.0 88.0 14.0716.0 16.0 88.0 14.0717.0 16.0 87.5 13.9718.0 16.0 87.5 13.9719.0 16.0 87.5 13.9

Timecum Temperature
(13T)
Relative Humidity (13RH)
Dew Point
(13DP)
Variables Correlation coefficent
0.0 16.0 88.5 14.1 13T 0.7866812
1.0 16.0 87.5 13.9 13RH -0.8062279
2.0 16.0 88.0 14.0 13DP 0.6506874
3.0 16.0 88.0 14.0
4.0 16.0 87.5 13.9
5.0 16.0 88.5 14.1
6.0 16.0 88.5 14.1
7.0 16.0 88.5 14.1
8.0 16.0 88.5 14.1
9.0 16.0 88.5 14.1
10.0 16.0 88.5 14.1
11.0 16.0 88.5 14.1
12.0 16.0 88.5 14.1
13.0 16.0 88.5 14.1
14.0 16.0 88.5 14.1
15.0 16.0 88.5 14.1
16.0 16.0 88.0 14.0
17.0 16.0 88.0 14.0
18.0 16.0 88.0 14.0
19.0 16.0 88.0 14.0
20.0 16.0 88.0 14.0
21.0 16.0 88.0 14.0
22.0 16.0 88.5 14.1
23.0 15.5 88.5 13.6
24.0 15.5 88.0 13.5
25.0 15.5 88.0 13.5
26.0 15.5 88.0 13.5
27.0 15.5 88.0 13.5
28.0 15.5 88.5 13.6
29.0 15.5 88.0 13.5
30.0 15.5 88.0 13.5
31.0 15.5 88.0 13.5
32.0 15.5 88.0 13.5
33.0 15.5 88.0 13.5
34.0 15.5 88.0 13.5
35.0 15.5 88.0 13.5
36.0 15.5 88.0 13.5
37.0 15.5 88.0 13.5
38.0 15.5 88.5 13.6
39.0 15.5 88.5 13.6
40.0 15.5 88.5 13.6
41.0 15.5 88.5 13.6
42.0 15.5 88.5 13.6
43.0 15.0 88.0 13.0
44.0 15.0 88.0 13.0
45.0 15.0 88.0 13.0
46.0 15.0 88.0 13.0
47.0 15.0 88.0 13.0

48.0 15.0 88.0 13.0
49.0 15.0 88.0 13.0
50.0 15.0 89.0 13.2
51.0 15.0 88.5 13.1
52.0 15.0 89.0 13.2
53.0 15.0 89.0 13.2
54.0 15.0 89.0 13.2
55.0 15.0 89.0 13.2
56.0 15.0 89.0 13.2
57.0 15.0 89.0 13.2
58.0 15.0 89.0 13.2
59.0 15.0 89.0 13.2
60.0 15.0 89.0 13.2
61.0 15.0 89.0 13.2
62.0 15.0 89.0 13.2
63.0 15.0 89.0 13.2
64.0 15.0 89.5 13.3
65.0 15.0 89.5 13.3
66.0 15.0 89.5 13.3
67.0 15.0 90.0 13.4
68.0 15.0 90.0 13.4
69.0 15.0 90.0 13.4
70.0 15.0 90.0 13.4
71.0 15.0 90.0 13.4
72.0 15.0 90.0 13.4
73.0 15.0 90.5 13.5
74.0 15.0 91.0 13.5
75.0 15.0 91.5 13.6
76.0 15.0 91.0 13.5
77.0 15.0 91.0 13.5
78.0 15.0 91.5 13.6
79.0 15.0 91.5 13.6
80.0 15.5 91.5 14.1
81.0 15.5 92.0 14.2
82.0 15.5 91.5 14.1
83.0 15.5 91.5 14.1
84.0 15.5 91.0 14.0
85.0 15.5 91.0 14.0
86.0 15.5 91.5 14.1
87.0 15.5 91.0 14.0
88.0 15.5 91.0 14.0
89.0 15.5 91.0 14.0
90.0 16.0 91.0 14.5
91.0 16.0 91.0 14.5
92.0 16.0 91.0 14.5
93.0 16.0 90.5 14.4
94.0 16.0 90.5 14.4
95.0 16.0 90.5 14.4
96.0 16.0 90.0 14.4
97.0 16.0 90.0 14.4
98.0 16.0 90.0 14.4

99.0 16.0 90.0 14.4
100.0 16.5 90.0 14.9
101.0 16.5 89.5 14.8
102.0 16.5 89.0 14.7
103.0 16.5 89.0 14.7
104.0 16.5 89.0 14.7
105.0 16.5 89.0 14.7
106.0 16.5 89.0 14.7
107.0 16.5 88.5 14.6
108.0 16.5 88.5 14.6
109.0 17.0 88.5 15.1
110.0 17.0 88.5 15.1
111.0 17.0 88.5 15.1
112.0 17.0 88.0 15.0
113.0 17.0 88.0 15.0
114.0 17.0 88.0 15.0
115.0 17.0 88.0 15.0
116.0 17.0 88.0 15.0
117.0 17.0 87.5 14.9
118.0 17.0 87.5 14.9
119.0 17.0 87.0 14.8
120.0 17.5 86.5 15.2
121.0 17.5 86.5 15.2
122.0 17.5 86.5 15.2
123.0 17.5 86.5 15.2
124.0 17.5 86.5 15.2
125.0 17.5 86.5 15.2
126.0 17.5 85.5 15.0
127.0 17.5 85.5 15.0
128.0 17.5 85.5 15.0
129.0 18.0 85.5 15.5
130.0 18.0 85.0 15.4
131.0 18.0 84.5 15.3
132.0 18.0 84.5 15.3
133.0 18.0 84.0 15.3
134.0 18.0 84.0 15.3
135.0 18.0 83.5 15.2
136.0 18.0 83.5 15.2
137.0 18.0 83.5 15.2
138.0 18.0 83.5 15.2
139.0 18.0 83.0 15.1
140.0 18.0 83.0 15.1
141.0 18.5 82.5 15.5
142.0 18.5 82.5 15.5
143.0 18.5 82.5 15.5
144.0 18.5 82.0 15.4
145.0 18.5 82.5 15.5
146.0 18.5 82.5 15.5
147.0 18.5 82.5 15.5
148.0 18.5 82.5 15.5
149.0 18.5 82.5 15.5

150.0 18.5 82.0 15.4
151.0 18.5 82.5 15.5
152.0 18.5 82.0 15.4
153.0 18.5 81.5 15.3
154.0 18.5 81.5 15.3
155.0 18.5 81.5 15.3
156.0 19.0 81.5 15.8
157.0 19.0 81.5 15.8
158.0 19.0 81.5 15.8
159.0 19.0 81.5 15.8
160.0 19.0 81.5 15.8
161.0 19.0 81.0 15.7
162.0 19.0 81.0 15.7
163.0 19.0 81.0 15.7
164.0 19.0 81.0 15.7
165.0 19.0 81.0 15.7
166.0 19.0 80.5 15.6
167.0 19.0 81.0 15.7
168.0 19.5 80.5 16.1
169.0 19.5 80.5 16.1
170.0 19.5 81.0 16.2
171.0 19.5 80.5 16.1
172.0 19.5 80.0 16.0
173.0 19.5 80.0 16.0
174.0 19.5 80.5 16.1
175.0 19.5 80.0 16.0
176.0 19.5 79.5 15.9
177.0 19.5 79.5 15.9
178.0 19.5 79.5 15.9
179.0 19.5 79.5 15.9
180.0 19.5 79.5 15.9
181.0 19.5 79.5 15.9
182.0 19.5 79.5 15.9
183.0 19.5 79.5 15.9
184.0 19.5 79.5 15.9
185.0 19.5 79.5 15.9
186.0 19.5 80.0 16.0
187.0 19.5 79.5 15.9
188.0 19.5 79.5 15.9
189.0 19.5 79.5 15.9
190.0 19.5 79.5 15.9
191.0 19.5 79.5 15.9
192.0 19.5 79.5 15.9
193.0 20.0 79.5 16.3
194.0 20.0 79.5 16.3
195.0 20.0 79.0 16.2
196.0 20.0 79.0 16.2
197.0 20.0 79.5 16.3
198.0 20.0 79.5 16.3
199.0 20.0 80.0 16.4

200.0 20.0 79.0 16.2
201.0 20.0 78.0 16.0
202.0 20.0 78.0 16.0
203.0 20.0 78.0 16.0
204.0 20.5 78.0 16.5
205.0 20.5 78.5 16.6
206.0 20.5 78.0 16.5
207.0 20.5 78.5 16.6
208.0 20.5 78.0 16.5
209.0 20.5 78.5 16.6
210.0 20.5 77.5 16.4
211.0 20.5 77.0 16.3
212.0 20.5 77.5 16.4
213.0 20.5 77.0 16.3
214.0 21.0 77.5 16.9
215.0 21.0 78.5 17.1
216.0 21.0 78.0 17.0
217.0 21.0 77.0 16.8
218.0 21.0 77.0 16.8
219.0 21.0 76.0 16.6
220.0 21.0 76.0 16.6
221.0 21.0 76.5 16.7
222.0 21.0 76.0 16.6
223.0 21.0 76.0 16.6
224.0 21.0 76.0 16.6
225.0 21.5 75.5 17.0
226.0 21.5 75.5 17.0
227.0 21.5 75.0 16.9
228.0 21.5 75.0 16.9
229.0 21.5 74.5 16.8
230.0 21.5 75.0 16.9
231.0 21.5 75.0 16.9
232.0 21.5 75.0 16.9
233.0 21.5 75.0 16.9
234.0 21.5 75.0 16.9
235.0 21.5 74.5 16.8
236.0 21.5 74.0 16.7
237.0 21.5 74.0 16.7
238.0 21.5 74.0 16.7
239.0 21.5 74.5 16.8
240.0 21.5 74.0 16.7
241.0 22.0 75.0 17.4
242.0 22.0 74.0 17.2
243.0 22.0 74.0 17.2
244.0 22.0 74.0 17.2
245.0 22.0 73.5 17.0
246.0 22.0 74.0 17.2
247.0 22.0 74.0 17.2
248.0 22.0 74.0 17.2
249.0 22.0 73.0 16.9
250.0 22.0 73.0 16.9

251.0 22.0 72.5 16.8
252.0 22.0 73.0 16.9
253.0 22.0 72.5 16.8
254.0 22.0 73.0 16.9
255.0 22.5 73.5 17.5
256.0 22.5 72.5 17.3
257.0 22.5 72.0 17.2
258.0 22.5 73.0 17.4
259.0 22.5 72.5 17.3
260.0 22.5 72.5 17.3
261.0 22.5 72.5 17.3
262.0 22.5 72.5 17.3
263.0 22.5 73.5 17.5
264.0 22.5 71.5 17.1
265.0 22.5 71.5 17.1
266.0 23.0 71.5 17.6
267.0 23.0 71.5 17.6
268.0 22.5 71.5 17.1
269.0 23.0 71.5 17.6
270.0 23.0 71.5 17.6
271.0 23.0 71.5 17.6
272.0 23.0 72.0 17.7
273.0 23.0 72.0 17.7
274.0 23.0 72.0 17.7
275.0 23.0 72.0 17.7
276.0 23.0 72.0 17.7
277.0 23.0 71.0 17.5
278.0 23.0 70.5 17.3
279.0 23.0 70.0 17.2
280.0 23.0 70.0 17.2
281.0 23.0 71.5 17.6
282.0 23.0 71.5 17.6
283.0 23.0 70.0 17.2
284.0 23.0 70.5 17.3
285.0 23.0 70.0 17.2
286.0 23.0 70.5 17.3
287.0 23.5 69.0 17.5
288.0 23.5 69.5 17.6
289.0 23.0 69.5 17.1
290.0 23.0 69.0 17.0
291.0 23.0 71.0 17.5
292.0 23.5 70.0 17.7
293.0 23.5 70.0 17.7
294.0 23.5 70.0 17.7
295.0 23.5 69.5 17.6
296.0 23.5 68.5 17.4
297.0 23.5 69.0 17.5
298.0 23.5 68.5 17.4
299.0 23.5 69.0 17.5
300.0 23.5 67.0 17.0
301.0 23.5 66.5 16.9

302.0 23.5 68.0 17.3
303.0 23.5 67.5 17.1
304.0 23.5 68.0 17.3
305.0 23.5 68.0 17.3
306.0 23.5 68.5 17.4
307.0 23.5 68.0 17.3
308.0 23.5 69.0 17.5
309.0 24.0 68.0 17.7
310.0 24.0 67.0 17.5
311.0 23.5 66.5 16.9
312.0 23.5 66.5 16.9
313.0 23.5 65.5 16.7
314.0 23.5 66.5 16.9
315.0 23.5 66.5 16.9
316.0 23.5 66.0 16.8
317.0 23.5 64.5 16.4
318.0 23.5 66.0 16.8
319.0 23.5 66.5 16.9
320.0 23.5 66.5 16.9
321.0 24.0 66.0 17.3
322.0 23.5 66.0 16.8
323.0 23.5 67.5 17.1
324.0 23.5 68.0 17.3
325.0 24.0 68.0 17.7
326.0 24.0 68.5 17.8
327.0 24.0 67.0 17.5
328.0 24.0 66.5 17.4
329.0 24.0 66.5 17.4
330.0 24.0 65.5 17.1
331.0 24.0 66.5 17.4
332.0 24.0 65.5 17.1
333.0 24.5 64.5 17.4
334.0 24.5 64.5 17.4
335.0 24.5 66.0 17.7
336.0 24.5 64.5 17.4
337.0 24.5 63.5 17.1
338.0 24.5 63.0 17.0
339.0 24.5 63.0 17.0
340.0 24.5 63.0 17.0
341.0 24.5 62.5 16.9
342.0 24.5 62.0 16.7
343.0 24.5 61.5 16.6
344.0 24.5 62.0 16.7
345.0 24.5 62.5 16.9
346.0 24.5 63.0 17.0
347.0 24.5 62.5 16.9
348.0 24.5 63.5 17.1
349.0 24.5 63.0 17.0
350.0 24.5 63.0 17.0
351.0 24.5 63.5 17.1
352.0 24.5 63.5 17.1

353.0 24.5 63.5 17.1
354.0 24.5 62.5 16.9
355.0 24.5 63.0 17.0
356.0 24.5 60.5 16.4
357.0 24.5 61.5 16.6
358.0 24.5 61.5 16.6
359.0 24.5 61.5 16.6
360.0 24.5 61.5 16.6
361.0 24.5 62.0 16.7
362.0 24.5 63.5 17.1
363.0 24.5 64.0 17.2
364.0 24.5 60.5 16.4
365.0 24.5 60.5 16.4
366.0 24.5 61.5 16.6
367.0 24.5 61.5 16.6
368.0 24.5 61.5 16.6
369.0 24.5 61.5 16.6
370.0 24.5 62.5 16.9
371.0 24.5 62.5 16.9
372.0 24.5 63.5 17.1
373.0 24.5 63.0 17.0
374.0 24.5 63.5 17.1
375.0 24.5 64.5 17.4
376.0 24.5 64.0 17.2
377.0 24.5 64.0 17.2
378.0 24.5 64.5 17.4
379.0 24.5 64.5 17.4
380.0 24.5 64.0 17.2
381.0 24.5 64.5 17.4
382.0 25.0 63.5 17.6
383.0 24.5 63.0 17.0
384.0 24.5 63.5 17.1
385.0 24.5 63.5 17.1
386.0 24.5 64.0 17.2
387.0 24.5 64.5 17.4
388.0 24.5 64.5 17.4
389.0 24.5 64.5 17.4
390.0 24.5 64.5 17.4
391.0 24.5 64.5 17.4
392.0 24.5 64.0 17.2
393.0 24.5 64.0 17.2
394.0 24.5 65.0 17.5
395.0 25.0 63.5 17.6
396.0 25.0 63.5 17.6
397.0 25.0 63.5 17.6
398.0 25.0 64.0 17.7
399.0 25.0 65.0 18.0
400.0 25.0 65.0 18.0
401.0 25.0 63.5 17.6
402.0 25.0 63.5 17.6

403.0 25.0 64.0 17.7
404.0 25.0 63.5 17.6
405.0 25.0 63.5 17.6
406.0 25.0 64.5 17.8
407.0 25.0 63.0 17.5
408.0 25.0 63.0 17.5
409.0 25.0 64.5 17.8
410.0 25.0 63.0 17.5
411.0 25.0 64.0 17.7
412.0 25.0 62.5 17.3
413.0 25.0 62.5 17.3
414.0 25.5 62.0 17.7
415.0 25.0 61.5 17.1
416.0 25.0 61.5 17.1
417.0 25.0 61.5 17.1
418.0 25.0 62.0 17.2
419.0 25.0 62.0 17.2
420.0 25.0 62.0 17.2
421.0 25.0 63.0 17.5
422.0 25.0 61.5 17.1
423.0 25.0 62.0 17.2
424.0 25.0 61.5 17.1
425.0 25.0 61.5 17.1
426.0 25.5 61.5 17.6
427.0 25.0 61.5 17.1
428.0 25.5 61.5 17.6
429.0 25.5 61.5 17.6
430.0 25.5 61.5 17.6
431.0 25.5 63.5 18.1
432.0 25.5 61.0 17.4
433.0 25.5 60.5 17.3
434.0 25.5 60.5 17.3
435.0 25.5 61.5 17.6
436.0 25.5 61.0 17.4
437.0 25.5 62.5 17.8
438.0 25.5 61.0 17.4
439.0 25.5 62.0 17.7
440.0 25.0 61.5 17.1
441.0 25.0 61.5 17.1
442.0 25.0 61.0 17.0
443.0 25.0 61.0 17.0
444.0 25.0 61.0 17.0
445.0 25.0 61.0 17.0
446.0 25.0 60.5 16.8
447.0 25.0 58.5 16.3
448.0 25.0 58.5 16.3
449.0 25.0 57.5 16.0
450.0 25.5 58.5 16.8
451.0 25.5 58.0 16.6
452.0 25.5 57.5 16.5
453.0 25.5 58.5 16.8

454.0 25.5 57.5 16.5
455.0 25.5 59.0 16.9
456.0 25.5 57.5 16.5
457.0 25.5 57.5 16.5
458.0 25.5 58.0 16.6
459.0 25.5 56.0 16.1
460.0 25.5 55.0 15.8
461.0 25.5 55.0 15.8
462.0 25.5 56.5 16.2
463.0 25.5 55.5 15.9
464.0 25.5 56.5 16.2
465.0 25.5 57.5 16.5
466.0 25.5 58.0 16.6
467.0 25.5 57.5 16.5
468.0 25.5 57.5 16.5
469.0 25.5 57.5 16.5
470.0 25.5 58.0 16.6
471.0 25.5 56.5 16.2
472.0 25.5 56.5 16.2
473.0 25.5 56.5 16.2
474.0 25.5 57.0 16.4
475.0 25.5 57.0 16.4
476.0 25.5 56.5 16.2
477.0 25.5 57.0 16.4
478.0 25.5 57.5 16.5
479.0 25.5 58.0 16.6
480.0 25.5 58.5 16.8
481.0 25.5 59.0 16.9
482.0 25.5 56.5 16.2
483.0 25.5 56.5 16.2
484.0 25.5 57.5 16.5
485.0 25.5 57.5 16.5
486.0 25.5 58.5 16.8
487.0 25.5 56.5 16.2
488.0 25.5 57.5 16.5
489.0 25.5 58.0 16.6
490.0 25.5 57.0 16.4
491.0 25.5 58.0 16.6
492.0 25.5 58.0 16.6
493.0 25.5 58.0 16.6
494.0 25.5 58.0 16.6
495.0 25.5 58.5 16.8
496.0 25.5 58.0 16.6
497.0 25.5 58.5 16.8
498.0 25.5 58.5 16.8
499.0 25.5 57.5 16.5
500.0 25.5 57.5 16.5
501.0 25.5 58.5 16.8
502.0 25.5 57.0 16.4
503.0 25.5 58.5 16.8
504.0 25.5 57.5 16.5

505.0 25.5 57.5 16.5
506.0 25.5 57.0 16.4
507.0 25.5 57.5 16.5
508.0 25.5 57.5 16.5
509.0 25.5 58.0 16.6
510.0 25.5 58.5 16.8
511.0 25.5 59.0 16.9
512.0 25.5 59.0 16.9
513.0 25.5 59.0 16.9
514.0 25.5 59.0 16.9
515.0 25.5 59.0 16.9
516.0 25.5 58.5 16.8
517.0 25.5 58.5 16.8
518.0 25.5 59.5 17.0
519.0 25.5 59.0 16.9
520.0 25.5 59.0 16.9
521.0 25.5 59.5 17.0
522.0 25.5 60.0 17.2
523.0 25.5 59.5 17.0
524.0 25.5 59.5 17.0
525.0 25.5 60.0 17.2
526.0 25.5 60.5 17.3
527.0 25.5 59.0 16.9
528.0 25.5 58.5 16.8
529.0 25.5 58.5 16.8
530.0 25.5 58.0 16.6
531.0 25.5 58.5 16.8
532.0 25.5 59.5 17.0
533.0 25.5 60.0 17.2
534.0 25.5 59.5 17.0
535.0 25.5 59.0 16.9
536.0 25.5 58.5 16.8
537.0 25.5 58.0 16.6
538.0 25.5 58.0 16.6
539.0 25.5 58.5 16.8
540.0 25.5 59.5 17.0
541.0 25.5 58.5 16.8
542.0 25.5 58.5 16.8
543.0 25.5 58.5 16.8
544.0 25.5 58.5 16.8
545.0 25.5 59.0 16.9
546.0 25.5 58.5 16.8
547.0 25.5 57.5 16.5
548.0 25.5 58.5 16.8
549.0 25.5 59.5 17.0
550.0 25.5 58.5 16.8
551.0 25.5 59.0 16.9
552.0 25.5 59.0 16.9
553.0 25.5 59.0 16.9
554.0 25.5 60.0 17.2

555.0 25.5 59.5 17.0
556.0 25.5 59.0 16.9
557.0 25.5 59.0 16.9
558.0 25.5 59.0 16.9
559.0 25.5 59.5 17.0
560.0 25.5 59.5 17.0
561.0 25.5 59.5 17.0
562.0 25.5 59.0 16.9
563.0 25.5 59.0 16.9
564.0 25.5 60.0 17.2
565.0 25.5 60.0 17.2
566.0 25.5 59.5 17.0
567.0 25.5 59.0 16.9
568.0 25.5 59.5 17.0
569.0 25.5 59.5 17.0
570.0 25.5 59.5 17.0
571.0 25.5 59.5 17.0
572.0 25.5 59.5 17.0
573.0 25.5 59.5 17.0
574.0 25.5 59.5 17.0
575.0 25.5 59.5 17.0
576.0 25.5 59.0 16.9
577.0 25.0 59.0 16.4
578.0 25.0 60.0 16.7
579.0 25.0 60.0 16.7
580.0 25.0 60.0 16.7
581.0 25.0 59.5 16.6
582.0 25.0 60.5 16.8
583.0 25.0 60.5 16.8
584.0 25.0 60.5 16.8
585.0 25.0 60.5 16.8
586.0 25.0 60.5 16.8
587.0 25.0 61.0 17.0
588.0 25.0 62.0 17.2
589.0 25.0 61.0 17.0
590.0 25.0 61.5 17.1
591.0 25.0 61.0 17.0
592.0 25.0 61.0 17.0
593.0 25.0 61.5 17.1
594.0 25.0 62.5 17.3
595.0 25.0 62.0 17.2
596.0 25.0 62.5 17.3
597.0 25.0 62.5 17.3
598.0 25.0 62.5 17.3
599.0 25.0 62.0 17.2
600.0 24.5 62.5 16.9
601.0 24.5 63.0 17.0
602.0 24.5 63.0 17.0
603.0 24.5 63.5 17.1
604.0 24.5 63.5 17.1
605.0 24.5 63.0 17.0

606.0 24.5 64.0 17.2
607.0 24.5 64.0 17.2
608.0 24.5 63.5 17.1
609.0 24.5 63.5 17.1
610.0 24.5 64.0 17.2
611.0 24.5 63.5 17.1
612.0 24.5 64.0 17.2
613.0 24.5 63.5 17.1
614.0 24.5 63.5 17.1
615.0 24.5 63.5 17.1
616.0 24.5 63.5 17.1
617.0 24.0 63.5 16.6
618.0 24.0 64.0 16.8
619.0 24.0 64.0 16.8
620.0 24.0 63.5 16.6
621.0 24.0 64.0 16.8
622.0 24.0 64.0 16.8
623.0 24.0 64.0 16.8
624.0 24.0 64.0 16.8
625.0 24.0 64.0 16.8
626.0 24.0 64.5 16.9
627.0 24.0 64.5 16.9
628.0 24.0 64.5 16.9
629.0 24.0 64.5 16.9
630.0 24.0 64.5 16.9
631.0 24.0 64.5 16.9
632.0 24.0 64.5 16.9
633.0 24.0 65.0 17.0
634.0 23.5 65.0 16.5
635.0 23.5 64.5 16.4
636.0 23.5 64.5 16.4
637.0 23.5 64.5 16.4
638.0 23.5 64.5 16.4
639.0 23.5 64.5 16.4
640.0 23.5 65.0 16.5
641.0 23.5 65.0 16.5
642.0 23.5 66.0 16.8
643.0 23.5 65.5 16.7
644.0 23.5 66.0 16.8
645.0 23.5 66.0 16.8
646.0 23.5 66.0 16.8
647.0 23.5 66.5 16.9
648.0 23.5 66.0 16.8
649.0 23.5 66.5 16.9
650.0 23.5 66.5 16.9
651.0 23.5 66.5 16.9
652.0 23.5 66.5 16.9
653.0 23.5 67.0 17.0
654.0 23.0 66.5 16.4
655.0 23.0 67.0 16.5
656.0 23.0 67.0 16.5

657.0 23.0 67.0 16.5
658.0 23.0 67.0 16.5
659.0 23.0 67.5 16.7
660.0 23.0 67.0 16.5
661.0 23.0 67.5 16.7
662.0 23.0 67.5 16.7
663.0 23.0 67.5 16.7
664.0 23.0 67.5 16.7
665.0 23.0 67.5 16.7
666.0 23.0 67.5 16.7
667.0 23.0 67.0 16.5
668.0 23.0 67.5 16.7
669.0 23.0 67.0 16.5
670.0 23.0 67.5 16.7
671.0 23.0 67.5 16.7
672.0 23.0 67.5 16.7
673.0 22.5 68.0 16.3
674.0 22.5 68.0 16.3
675.0 22.5 67.5 16.2
676.0 22.5 68.0 16.3
677.0 22.5 68.5 16.4
678.0 22.5 68.0 16.3
679.0 22.5 68.0 16.3
680.0 22.5 68.0 16.3
681.0 22.5 68.5 16.4
682.0 22.5 68.5 16.4
683.0 22.5 68.5 16.4
684.0 22.5 69.0 16.5
685.0 22.5 69.0 16.5
686.0 22.5 69.0 16.5
687.0 22.5 69.5 16.6
688.0 22.5 69.5 16.6
689.0 22.5 69.5 16.6
690.0 22.5 69.5 16.6
691.0 22.0 70.0 16.3
692.0 22.0 70.0 16.3
693.0 22.0 70.0 16.3
694.0 22.0 70.0 16.3
695.0 22.0 70.0 16.3
696.0 22.0 70.5 16.4
697.0 22.0 70.5 16.4
698.0 22.0 70.5 16.4
699.0 22.0 70.5 16.4
700.0 22.0 70.5 16.4
701.0 22.0 70.5 16.4
702.0 22.0 70.5 16.4
703.0 22.0 71.0 16.5
704.0 22.0 71.0 16.5
705.0 22.0 71.0 16.5
706.0 22.0 71.0 16.5
707.0 22.0 71.0 16.5

708.0 22.0 71.0 16.5
709.0 22.0 71.0 16.5
710.0 22.0 71.5 16.6
711.0 22.0 71.5 16.6
712.0 22.0 71.5 16.6
713.0 22.0 72.0 16.7
714.0 22.0 72.0 16.7
715.0 21.5 72.0 16.2
716.0 21.5 72.0 16.2
717.0 21.5 72.5 16.3
718.0 21.5 72.5 16.3
719.0 21.5 72.5 16.3

Timecum Temperature (14T)
Relative Humidity (14RH)
Dew Point
(14DP)
Variables Correlation coefficent
0 21.5 72.5 16.3 14T -0.9848626
1 21.5 72.5 16.3 14RH 0.9341942
2 21.5 73 16.5 14DP -0.984206
3 21.5 73 16.5
4 21.5 73.5 16.6
5 21.5 73.5 16.6
6 21.5 73.5 16.6
7 21.5 73.5 16.6
8 21.5 73.5 16.6
9 21.5 74 16.7
10 21.5 74 16.7
11 21.5 74 16.7
12 21.5 74 16.7
13 21.5 74.5 16.8
14 21.5 75 16.9
15 21.5 75 16.9
16 21.5 75 16.9
17 21.5 75 16.9
18 21.5 75.5 17
19 21.5 75.5 17
20 21.5 75.5 17
21 21.5 75.5 17
22 21.5 75.5 17
23 21.5 75.5 17
24 21.5 76 17.1
25 21.5 76 17.1
26 21.5 76 17.1
27 21.5 76 17.1
28 21.5 76 17.1
29 21.5 76 17.1
30 21.5 76.5 17.2
31 21.5 76.5 17.2
32 21.5 76.5 17.2
33 21.5 76.5 17.2
34 21.5 76.5 17.2
35 21.5 76.5 17.2
36 21.5 76.5 17.2
37 21.5 76.5 17.2
38 21 76.5 16.7
39 21 77 16.8
40 21 77 16.8
41 21 77.5 16.9
42 21 77.5 16.9
43 21 77.5 16.9
44 21 77.5 16.9
45 21 77.5 16.9
46 21 78 17

47 21 77.5 16.9
48 21 78 17
49 21 77.5 16.9
50 21 78 17
51 21 78 17
52 21 78 17
53 21 78.5 17.1
54 21 78.5 17.1
55 21 78.5 17.1
56 21 78 17
57 21 78 17
58 21 78.5 17.1
59 21 78 17
60 21 78.5 17.1
61 21 78.5 17.1
62 21 78.5 17.1
63 21 78.5 17.1
64 21 78.5 17.1
65 21 78.5 17.1
66 21 78.5 17.1
67 21 78.5 17.1
68 21 78.5 17.1
69 21 78.5 17.1
70 21 78.5 17.1
71 21 79 17.2
72 21 79 17.2
73 21 79 17.2
74 21 79 17.2
75 21 79 17.2
76 21 79 17.2
77 21 79.5 17.3
78 20.5 79.5 16.8
79 20.5 79.5 16.8
80 20.5 79.5 16.8
81 20.5 79.5 16.8
82 20.5 80 16.9
83 20.5 79.5 16.8
84 20.5 80 16.9
85 20.5 80 16.9
86 20.5 80 16.9
87 20.5 80 16.9
88 20.5 80 16.9
89 20.5 80 16.9
90 20.5 80 16.9
91 20.5 80.5 17
92 20.5 80 16.9
93 20.5 80 16.9
94 20.5 80.5 17
95 20.5 80.5 17
96 20.5 80.5 17

97 20.5 80.5 17
98 20.5 80.5 17
99 20.5 80.5 17
100 20.5 80 16.9
101 20.5 80 16.9
102 20.5 80.5 17
103 20.5 80.5 17
104 20.5 80.5 17
105 20.5 80.5 17
106 20.5 80.5 17
107 20 80.5 16.5
108 20 80.5 16.5
109 20 80.5 16.5
110 20 80.5 16.5
111 20 81 16.6
112 20 81 16.6
113 20 81 16.6
114 20 81 16.6
115 20 81 16.6
116 20 81 16.6
117 20 81 16.6
118 20 81.5 16.7
119 20 81 16.6
120 20 81 16.6
121 20 81 16.6
122 20 81 16.6
123 20 80.5 16.5
124 20 80.5 16.5
125 20 80.5 16.5
126 20 80.5 16.5
127 20 81 16.6
128 20 81 16.6
129 20 80.5 16.5
130 20 81 16.6
131 20 81 16.6
132 20 81 16.6
133 20 81 16.6
134 20 81 16.6
135 20 81 16.6
136 20 81 16.6
137 20 81 16.6
138 20 81 16.6
139 20 81 16.6
140 20 81 16.6
141 20 81 16.6
142 20 81 16.6
143 20 81.5 16.7
144 20 81.5 16.7
145 20 81.5 16.7
146 20 81.5 16.7

147 20 81 16.6
148 20 81 16.6
149 20 81 16.6
150 20 81 16.6
151 19.5 81 16.2
152 19.5 81 16.2
153 19.5 81 16.2
154 19.5 81 16.2
155 19.5 81 16.2
156 19.5 81 16.2
157 19.5 81 16.2
158 19.5 81 16.2
159 19.5 80.5 16.1
160 19.5 80.5 16.1
161 19.5 80.5 16.1
162 19.5 80.5 16.1
163 19.5 80.5 16.1
164 19.5 80.5 16.1
165 19.5 80.5 16.1
166 19.5 80.5 16.1
167 19.5 80.5 16.1
168 19.5 80.5 16.1
169 19.5 80.5 16.1
170 19.5 80.5 16.1
171 19.5 80.5 16.1
172 19.5 81 16.2
173 19.5 80.5 16.1
174 19.5 81 16.2
175 19.5 81 16.2
176 19.5 81 16.2
177 19.5 81 16.2
178 19.5 81.5 16.2
179 19.5 81.5 16.2
180 19.5 81 16.2
181 19.5 81.5 16.2
182 19.5 81.5 16.2
183 19.5 81.5 16.2
184 19.5 81 16.2
185 19.5 81 16.2
186 19.5 81.5 16.2
187 19.5 81.5 16.2
188 19.5 81.5 16.2
189 19.5 81.5 16.2
190 19.5 81.5 16.2
191 19.5 81.5 16.2
192 19.5 81.5 16.2
193 19.5 81.5 16.2
194 19.5 81 16.2
195 19.5 81 16.2
196 19.5 81 16.2

197 19 81 15.7
198 19 81 15.7
199 19 81 15.7
200 19 81.5 15.8
201 19 81.5 15.8
202 19 81.5 15.8
203 19 81.5 15.8
204 19 81.5 15.8
205 19 81.5 15.8
206 19 81.5 15.8
207 19 81.5 15.8
208 19 81.5 15.8
209 19 81.5 15.8
210 19 82 15.9
211 19 82 15.9
212 19 82 15.9
213 19 82 15.9
214 19 82 15.9
215 19 82 15.9
216 19 82 15.9
217 19 82 15.9
218 19 82 15.9
219 19 82 15.9
220 19 82 15.9
221 19 82.5 16
222 19 82.5 16
223 19 82.5 16
224 19 82.5 16
225 19 82 15.9
226 19 82.5 16
227 19 82.5 16
228 19 82 15.9
229 19 82.5 16
230 19 82.5 16
231 19 82 15.9
232 19 82.5 16
233 19 82.5 16
234 19 83 16
235 19 82.5 16
236 19 82.5 16
237 19 83 16
238 19 83 16
239 19 83 16
240 19 82.5 16
241 19 82.5 16
242 19 82.5 16
243 19 82.5 16
244 19 82.5 16
245 19 82.5 16
246 19 82.5 16

247 18.5 82.5 15.5
248 18.5 82.5 15.5
249 18.5 82.5 15.5
250 18.5 82.5 15.5
251 18.5 82.5 15.5
252 18.5 82.5 15.5
253 18.5 82.5 15.5
254 18.5 82.5 15.5
255 18.5 82.5 15.5
256 18.5 82.5 15.5
257 18.5 83 15.6
258 18.5 82.5 15.5
259 18.5 83 15.6
260 18.5 83 15.6
261 18.5 83 15.6
262 18.5 83 15.6
263 18.5 82.5 15.5
264 18.5 83 15.6
265 18.5 82.5 15.5
266 18.5 83 15.6
267 18.5 83 15.6
268 18.5 83 15.6
269 18.5 83 15.6
270 18.5 83 15.6
271 18.5 83 15.6
272 18.5 83.5 15.7
273 18.5 83 15.6
274 18.5 83.5 15.7
275 18.5 83 15.6
276 18.5 83.5 15.7
277 18.5 83 15.6
278 18.5 83 15.6
279 18.5 83 15.6
280 18.5 83 15.6
281 18.5 83.5 15.7
282 18.5 83.5 15.7
283 18.5 83.5 15.7
284 18.5 83.5 15.7
285 18.5 83 15.6
286 18.5 83.5 15.7
287 18.5 83.5 15.7
288 18.5 83.5 15.7
289 18.5 83.5 15.7
290 18.5 83.5 15.7
291 18.5 83.5 15.7
292 18.5 83.5 15.7
293 18.5 83.5 15.7
294 18.5 83.5 15.7
295 18.5 83.5 15.7
296 18.5 83.5 15.7

297 18.5 83.5 15.7
298 18.5 83.5 15.7
299 18.5 83.5 15.7
300 18.5 83.5 15.7
301 18.5 83.5 15.7
302 18.5 83.5 15.7
303 18.5 83.5 15.7
304 18.5 83.5 15.7
305 18.5 83.5 15.7
306 18.5 83.5 15.7
307 18.5 83.5 15.7
308 18.5 83.5 15.7
309 18.5 83.5 15.7
310 18.5 83.5 15.7
311 18.5 83.5 15.7
312 18 83.5 15.2
313 18 83.5 15.2
314 18 83.5 15.2
315 18 83.5 15.2
316 18 83.5 15.2
317 18 83.5 15.2
318 18 83.5 15.2
319 18 83.5 15.2
320 18 83.5 15.2
321 18 83.5 15.2
322 18 84 15.3
323 18 84 15.3
324 18 83.5 15.2
325 18 84 15.3
326 18 84 15.3
327 18 83.5 15.2
328 18 84 15.3
329 18 84 15.3
330 18 84 15.3
331 18 84 15.3
332 18 84 15.3
333 18 84 15.3
334 18 84 15.3
335 18 84 15.3
336 18 84 15.3
337 18 84 15.3
338 18 84 15.3
339 18 84 15.3
340 18 84 15.3
341 18 84 15.3
342 18 84 15.3
343 18 84 15.3
344 18 84 15.3
345 18 84 15.3
346 18 84 15.3

347 18 84 15.3
348 18 84 15.3
349 18 84 15.3
350 18 84 15.3
351 18 84 15.3
352 18 84 15.3
353 18 84 15.3
354 18 84 15.3
355 18 84 15.3
356 18 84 15.3
357 18 84 15.3
358 18 84 15.3
359 18 84 15.3
360 18 84 15.3
361 18 84 15.3
362 18 84 15.3
363 18 84 15.3
364 18 84 15.3
365 18 84 15.3
366 18 84 15.3
367 18 84.5 15.3
368 18 84 15.3
369 18 84.5 15.3
370 18 84.5 15.3
371 18 84.5 15.3
372 18 84 15.3
373 18 84.5 15.3
374 18 84.5 15.3
375 18 84.5 15.3
376 18 84.5 15.3
377 18 84.5 15.3
378 18 84.5 15.3
379 17.5 85 15
380 17.5 84.5 14.9
381 17.5 84.5 14.9
382 17.5 84.5 14.9
383 17.5 85 15
384 17.5 84.5 14.9
385 17.5 84.5 14.9
386 17.5 84.5 14.9
387 17.5 85 15
388 17.5 84.5 14.9
389 17.5 84.5 14.9
390 17.5 84.5 14.9
391 17.5 84.5 14.9
392 17.5 84.5 14.9
393 17.5 85 15
394 17.5 84.5 14.9
395 17.5 84.5 14.9
396 17.5 84.5 14.9

397 17.5 84.5 14.9
398 17.5 84.5 14.9
399 17.5 84.5 14.9
400 17.5 84.5 14.9
401 17.5 84.5 14.9
402 17.5 84.5 14.9
403 17.5 84.5 14.9
404 17.5 84.5 14.9
405 17.5 84.5 14.9
406 17.5 84.5 14.9
407 17.5 84.5 14.9
408 17.5 85 15
409 17.5 85 15
410 17.5 85 15
411 17.5 85 15
412 17.5 85 15
413 17.5 85 15
414 17.5 85 15
415 17.5 85 15
416 17.5 85 15
417 17.5 85 15
418 17.5 85 15
419 17.5 85 15
420 17.5 85 15
421 17.5 85 15
422 17.5 85 15
423 17.5 85 15
424 17.5 85 15
425 17.5 85 15
426 17.5 85 15
427 17.5 85 15
428 17.5 85 15
429 17.5 85 15
430 17.5 85.5 15
431 17.5 85.5 15
432 17.5 85.5 15
433 17.5 85.5 15
434 17.5 85.5 15
435 17 85.5 14.6
436 17 85.5 14.6
437 17 85.5 14.6
438 17 85.5 14.6
439 17 85.5 14.6
440 17 85.5 14.6
441 17 85.5 14.6
442 17 85.5 14.6
443 17 85.5 14.6
444 17 85.5 14.6
445 17 86 14.6
446 17 85.5 14.6

447 17 86 14.6
448 17 86 14.6
449 17 86 14.6
450 17 86 14.6
451 17 86 14.6
452 17 86 14.6
453 17 86 14.6
454 17 86 14.6
455 17 86 14.6
456 17 86 14.6
457 17 86 14.6
458 17 86 14.6
459 17 86 14.6
460 17 86 14.6
461 17 86 14.6
462 17 86 14.6
463 17 86 14.6
464 17 85.5 14.6
465 17 86 14.6
466 17 86 14.6
467 17 86 14.6
468 17 86 14.6
469 17 86 14.6
470 17 86 14.6
471 17 86 14.6
472 17 86 14.6
473 17 86 14.6
474 17 86 14.6
475 17 86 14.6
476 17 86 14.6
477 17 86 14.6
478 17 86 14.6
479 17 86 14.6
480 17 86 14.6
481 17 86 14.6
482 17 86 14.6
483 17 86 14.6
484 17 86 14.6
485 17 86 14.6
486 17 86 14.6
487 17 86 14.6
488 17 86 14.6
489 17 86 14.6
490 17 85.5 14.6
491 17 85.5 14.6
492 17 86 14.6
493 17 85.5 14.6
494 17 85.5 14.6
495 17 85.5 14.6
496 17 85.5 14.6

497 17 85.5 14.6
498 16.5 85.5 14.1
499 16.5 85.5 14.1
500 17 85.5 14.6
501 16.5 85.5 14.1
502 16.5 85.5 14.1
503 16.5 85.5 14.1
504 16.5 85.5 14.1
505 16.5 85.5 14.1
506 16.5 85.5 14.1
507 16.5 85.5 14.1
508 16.5 85.5 14.1
509 16.5 85.5 14.1
510 16.5 85.5 14.1
511 16.5 85.5 14.1
512 16.5 85.5 14.1
513 16.5 85.5 14.1
514 16.5 85.5 14.1
515 16.5 85.5 14.1
516 16.5 85 14
517 16.5 85.5 14.1
518 16.5 85.5 14.1
519 16.5 85.5 14.1
520 16.5 85.5 14.1
521 16.5 85.5 14.1
522 16.5 85.5 14.1
523 16.5 85 14
524 16.5 85 14
525 16.5 85 14
526 16.5 85.5 14.1
527 16.5 85.5 14.1
528 16.5 85 14
529 16.5 85 14
530 16.5 85.5 14.1
531 16.5 85.5 14.1
532 16.5 85.5 14.1
533 16.5 85.5 14.1
534 16.5 85.5 14.1
535 16.5 85.5 14.1
536 16.5 85.5 14.1
537 16.5 85.5 14.1
538 16.5 85.5 14.1
539 16.5 85.5 14.1
540 16.5 85.5 14.1
541 16.5 85.5 14.1
542 16.5 85.5 14.1
543 16.5 85.5 14.1
544 16.5 85.5 14.1
545 16.5 85.5 14.1
546 16.5 85.5 14.1

547 16.5 85.5 14.1
548 16.5 85.5 14.1
549 16.5 85.5 14.1
550 16.5 85.5 14.1
551 16.5 85.5 14.1
552 16.5 85.5 14.1
553 16.5 85.5 14.1
554 16.5 85.5 14.1
555 16.5 85.5 14.1
556 16.5 85.5 14.1
557 16.5 85 14
558 16.5 85 14
559 16.5 85.5 14.1
560 16.5 85 14
561 16.5 85 14
562 16.5 85.5 14.1
563 16.5 85.5 14.1
564 16.5 85.5 14.1
565 16.5 85.5 14.1
566 16.5 85.5 14.1
567 16.5 85.5 14.1
568 16.5 85.5 14.1
569 16.5 85.5 14.1
570 16.5 85.5 14.1
571 16.5 85.5 14.1
572 16.5 85.5 14.1
573 16.5 85.5 14.1
574 16.5 85.5 14.1
575 16.5 85.5 14.1
576 16.5 85.5 14.1
577 16.5 85.5 14.1
578 16.5 85.5 14.1
579 16.5 85.5 14.1
580 16.5 85.5 14.1
581 16.5 85.5 14.1
582 16.5 85.5 14.1
583 16.5 85.5 14.1
584 16.5 85.5 14.1
585 16.5 85.5 14.1
586 16.5 85.5 14.1
587 16.5 85.5 14.1
588 16.5 85.5 14.1
589 16.5 85.5 14.1
590 16.5 85.5 14.1
591 16.5 85.5 14.1
592 16.5 85.5 14.1
593 16.5 85.5 14.1
594 16.5 86 14.2
595 16.5 86 14.2
596 16.5 86 14.2

597 16.5 86 14.2
598 16.5 86 14.2
599 16 86 13.7
600 16 86 13.7
601 16 86 13.7
602 16 86 13.7
603 16 86 13.7
604 16 86 13.7
605 16 86 13.7
606 16 86 13.7
607 16 86 13.7
608 16 86 13.7
609 16 86 13.7
610 16 86 13.7
611 16 86 13.7
612 16 86 13.7
613 16 86 13.7
614 16 86 13.7
615 16 86.5 13.7
616 16 86.5 13.7
617 16 86.5 13.7
618 16 86.5 13.7
619 16 86.5 13.7
620 16 86 13.7
621 16 86 13.7
622 16 86.5 13.7
623 16 86.5 13.7
624 16 86.5 13.7
625 16 86.5 13.7
626 16 86.5 13.7
627 16 86.5 13.7
628 16 86.5 13.7
629 16 86.5 13.7
630 16 86.5 13.7
631 16 86.5 13.7
632 16 86.5 13.7
633 16 86.5 13.7
634 16 87 13.8
635 16 86.5 13.7
636 16 87 13.8
637 16 87 13.8
638 16 87 13.8
639 16 87 13.8
640 16 87 13.8
641 16 87 13.8
642 16 87 13.8
643 16 87 13.8
644 16 87 13.8
645 16 87 13.8
646 16 87 13.8

647 16 87 13.8
648 16 87 13.8
649 16 87 13.8
650 16 87 13.8
651 16 87 13.8
652 16 87 13.8
653 16 87 13.8
654 16 87 13.8
655 16 87 13.8
656 16 87 13.8
657 16 87 13.8
658 16 87 13.8
659 16 87 13.8
660 16 87 13.8
661 16 87 13.8
662 16 87 13.8
663 16 87 13.8
664 16 87 13.8
665 16 87 13.8
666 16 87 13.8
667 16 87 13.8
668 16 87 13.8
669 16 87 13.8
670 16 87 13.8
671 16 87 13.8
672 16 87 13.8
673 16 87 13.8
674 16 86.5 13.7
675 16 87 13.8
676 16 87 13.8
677 16 87 13.8
678 16 87.5 13.9
679 16 87.5 13.9
680 16 87.5 13.9
681 16 87.5 13.9
682 16 87.5 13.9
683 16 87.5 13.9
684 16 87.5 13.9
685 16 87.5 13.9
686 16 87.5 13.9
687 16 87.5 13.9
688 16 87.5 13.9
689 16 87.5 13.9
690 16 87.5 13.9
691 16 87.5 13.9
692 16 87.5 13.9
693 15.5 87.5 13.4
694 15.5 88 13.5
695 15.5 88 13.5
696 16 88 14

697 16 88 14
698 15.5 87.5 13.4
699 15.5 88 13.5
700 15.5 88 13.5
701 15.5 88 13.5
702 15.5 88 13.5
703 15.5 88 13.5
704 15.5 88 13.5
705 15.5 88 13.5
706 15.5 88 13.5
707 15.5 88 13.5
708 15.5 88 13.5
709 15.5 88 13.5
710 15.5 88 13.5
711 15.5 88 13.5
712 15.5 88 13.5
713 15.5 88 13.5
714 15.5 88 13.5
715 15.5 88 13.5
716 15.5 88 13.5
717 15.5 88 13.5
718 15.5 88 13.5
719 15.5 88 13.5

Appendix E: Data from the field measurement
Dhanmondi Lake_Field measurement data

Timecum UCIL1 degC
UCIL2 degC
UCIL4 degC
UCIL6 degC
UCIL7 degC
0.05.0
10.015.020.025.0 29.330.0 29.135.0 29.040.0 28.945.0 29.050.0 29.1 29.555.0 29.2 29.560.0 29.3 29.065.0 29.4 30.5 29.070.0 29.4 29.5 29.075.0 29.5 29.5 29.080.0 29.6 29.5 29.085.0 29.6 29.0 29.090.0 29.7 29.0 29.595.0 29.9 29.5 29.5
100.0 30.0 30.5 29.5 29.5105.0 30.0 30.5 29.5 29.5110.0 30.1 30.5 29.5 29.5115.0 30.1 30.5 29.5 30.0120.0 30.2 30.5 29.5 30.0125.0 30.3 30.5 30.0 30.0130.0 30.5 30.5 30.0 30.0135.0 30.5 30.5 30.0 30.0140.0 30.5 30.5 30.0 30.5 31.0145.0 30.7 30.5 30.5 30.5 31.0150.0 30.8 31.0 30.5 30.5 31.0155.0 30.7 31.0 30.5 30.5 31.0160.0 30.8 31.0 30.5 30.5 31.0165.0 30.9 31.5 30.5 31.0 31.0170.0 31.1 31.5 30.5 31.0 31.0175.0 31.1 31.5 30.5 31.0 31.5180.0 31.1 31.5 30.5 31.0 31.5185.0 31.2 32.0 31.0 31.0 31.5190.0 31.3 31.5 31.0 31.5 32.0195.0 31.5 31.5 31.5 31.5 32.0200.0 31.6 31.5 31.5 31.5 32.0205.0 31.6 31.5 31.5 31.5 32.0210.0 31.7 31.5 31.5 31.5 32.0215.0 31.6 32.0 31.5 32.0 32.5220.0 31.7 32.0 32.0 32.0 32.5225.0 31.8 32.0 32.0 32.0 32.5230.0 31.8 32.0 32.0 32.0 32.5235.0 31.8 32.0 32.0 32.0 32.5

240.0 31.9 32.0 32.0 32.0 32.5245.0 32.0 32.0 32.5 32.5 32.5250.0 32.0 32.0 32.5 32.5 33.0255.0 32.0 32.0 32.5 32.5 32.5260.0 32.2 32.0 32.5 32.5 32.5265.0 32.2 32.5 33.0 32.5 33.0270.0 32.4 32.5 33.0 33.0 33.0275.0 32.3 32.5 33.0 33.0 33.0280.0 32.4 32.5 33.0 33.0 33.0285.0 32.4 32.5 33.0 33.0 33.0290.0 32.5 32.5 33.0 33.0 33.0295.0 32.5 32.5 32.5 33.0 33.0300.0 32.6 32.5 33.0 33.0 33.0305.0 32.6 32.5 33.0 33.0 33.0310.0 32.8 32.5 33.5 33.0 33.0315.0 32.8 32.5 33.5 32.5 33.0320.0 32.7 33.0 33.5 33.0 33.0325.0 32.8 33.0 33.5 33.0 33.0330.0 32.9 32.5 34.0 33.0 33.0335.0 33.1 33.0 34.0 33.0 33.5340.0 33.1 33.0 34.0 33.0 33.5345.0 33.0 33.0 34.0 33.0 33.5350.0 33.1 33.0 34.0 33.0 33.0355.0 33.0 33.0 33.5 33.0 33.5360.0 33.0 33.0 33.5 33.0 33.5365.0 33.0 33.0 34.0 33.0 33.5370.0 33.2 33.0 34.0 33.0 33.5375.0 33.3 33.0 34.5 33.0 33.0380.0 33.4 33.5 34.5 33.5 33.5385.0 33.4 33.5 34.5 33.5 33.5390.0 33.4 33.5 35.0 33.5 33.5395.0 33.5 33.5 35.0 33.5 33.5400.0 33.5 33.5 35.0 33.5 33.5405.0 33.6 33.5 35.0 33.5 33.5410.0 33.8 33.5 35.0 33.5 33.5415.0 33.6 33.5 35.0 33.5 33.5420.0 33.4 33.5 35.0 33.5 33.0425.0 33.2 33.5 35.0 33.5 33.0430.0 33.0 33.0 34.5 33.5 32.5435.0 32.9 33.0 34.5 33.5 32.5440.0 33.0 33.0 34.5 33.5 32.5445.0 32.8 33.0 34.5 33.5 32.5450.0 32.9 33.0 34.5 33.5 33.0455.0 33.0 33.0 34.5 33.5 33.0460.0 33.0 33.0 34.5 33.5 33.0465.0 33.0 33.0 34.5 33.5 33.0470.0 32.9 33.0 34.5 33.5 33.0475.0 33.0 33.0 35.0 33.5 33.0480.0 32.9 33.0 35.5 34.0 32.5485.0 32.8 33.0 34.5 34.5 33.0

490.0 32.7 33.0 34.0 34.0 32.5495.0 32.8 33.0 34.0 33.5 32.5500.0 32.8 32.5 33.5 33.5 32.5505.0 32.7 32.5 33.5 33.5 32.5510.0 32.7 32.5 33.0 33.0 32.5515.0 32.7 32.5 33.0 33.0 32.5520.0 32.5 32.5 33.0 33.0 32.5525.0 32.6 32.5 32.5 33.0 32.5530.0 32.5 32.5 32.5 33.0 32.5535.0 32.4 32.5 32.5 33.0 32.0540.0 32.4 32.0 32.5 33.0 32.0545.0 32.4 32.0 32.0 33.0 32.0550.0 32.1 32.0 32.0 33.0 32.0555.0 32.0 31.5 32.0 32.5 32.0560.0 32.2 31.5 31.5 32.5 31.5565.0 32.1 31.5 31.5 32.5 31.5570.0 32.9 31.5 31.5 32.5 31.5575.0 32.6 31.0 31.5 32.5 31.5580.0 31.3 31.5 31.5 32.0 31.5585.0 31.2 31.0 31.0 32.0 31.5590.0 31.2 31.0 31.0 32.0 31.5595.0 31.1 31.0 31.0 32.0 31.5600.0 31.1 31.0 31.0 31.5 31.5605.0 31.1 31.0 31.0 31.5 31.5

Timecum UCIL1 (%) UCIL2 (%) UCIL4 (%) UCIL6 (%) UCIL7 (%)
0.05.010.015.020.025.0 68.030.0 70.035.0 69.040.0 70.045.0 69.050.0 68.0 72.555.0 67.0 74.560.0 68.0 74.565.0 66.0 70.0 74.070.0 66.0 71.0 74.075.0 68.0 71.5 74.080.0 65.0 72.5 74.085.0 66.0 73.0 73.590.0 64.0 72.0 73.095.0 63.0 70.5 72.5100.0 64.0 68.5 71.0 72.5105.0 63.0 69.5 70.0 72.5110.0 60.0 67.5 69.0 72.5115.0 62.0 67.5 70.5 72.0120.0 61.0 67.0 70.5 71.0125.0 58.0 66.5 68.5 70.5130.0 57.0 65.5 68.0 70.5135.0 56.0 65.0 67.5 69.0140.0 55.0 65.5 66.0 68.5 65.5145.0 54.0 64.5 65.5 66.5 63.5150.0 53.0 64.5 64.5 66.0 63.5155.0 52.0 61.5 64.0 65.5 62.0160.0 53.0 62.5 64.5 66.0 61.0165.0 50.0 60.5 62.5 64.0 61.0170.0 50.0 58.5 62.0 62.5 57.5175.0 46.0 56.5 58.5 58.5 55.5180.0 42.0 55.5 57.5 58.5 55.5185.0 42.0 54.5 52.5 54.5 50.0190.0 43.0 54.5 52.5 53.5 50.0195.0 39.0 52.0 52.5 54.5 50.5200.0 40.0 52.0 50.5 53.5 52.5205.0 37.0 51.5 53.5 54.0 51.5210.0 41.0 52.5 51.5 54.0 51.0215.0 38.0 52.0 51.5 55.5 51.5220.0 43.0 53.0 51.0 54.0 52.0225.0 41.0 52.5 50.5 54.5 50.5230.0 39.0 51.5 51.5 53.5 50.5235.0 40.0 52.0 49.5 52.5 51.0240.0 39.0 51.0 50.0 52.0 51.0

245.0 40.0 50.5 49.5 52.5 51.0250.0 41.0 51.0 49.5 53.5 49.0255.0 41.0 51.0 49.0 51.5 49.5260.0 42.0 50.0 48.5 51.0 48.5265.0 39.0 50.5 47.5 51.0 48.5270.0 38.0 51.0 48.0 51.5 49.0275.0 40.0 50.0 46.0 51.5 49.5280.0 39.0 49.5 46.5 51.0 50.5285.0 36.0 49.0 46.0 49.5 45.0290.0 35.0 48.0 47.5 49.5 47.0295.0 34.0 48.5 45.0 50.0 48.0300.0 34.0 47.5 46.5 50.5 48.5305.0 36.0 48.0 47.0 49.5 48.5310.0 37.0 49.0 46.5 50.5 48.0315.0 36.0 49.0 46.0 49.5 47.5320.0 33.0 44.5 45.5 48.5 46.5325.0 33.0 46.5 45.5 49.0 47.5330.0 33.0 47.0 43.0 47.0 46.0335.0 33.0 46.5 44.0 48.0 48.5340.0 33.0 46.5 44.0 49.0 46.5345.0 33.0 46.5 45.5 48.5 46.0350.0 34.0 46.5 44.0 49.5 47.0355.0 32.0 45.0 45.5 48.5 45.5360.0 32.0 44.0 44.0 48.5 45.0365.0 31.0 44.0 42.0 47.0 45.0370.0 32.0 45.0 44.0 47.5 44.0375.0 32.0 45.0 41.0 46.5 44.0380.0 31.0 44.0 42.5 45.0 42.0385.0 30.0 43.5 40.0 43.5 40.0390.0 30.0 41.5 39.0 43.0 42.5395.0 31.0 41.5 39.5 43.0 43.0400.0 31.0 42.0 40.0 44.0 42.5405.0 30.0 40.0 39.0 43.0 38.5410.0 31.0 41.5 37.5 42.0 38.5415.0 38.0 49.5 44.5 50.5 50.5420.0 41.0 51.5 47.5 52.5 52.0425.0 44.0 51.5 48.5 53.5 53.5430.0 41.0 52.5 49.5 54.5 53.5435.0 41.0 51.5 49.0 53.5 53.0440.0 41.0 52.5 48.5 53.5 52.5445.0 38.0 52.5 48.5 54.5 52.5450.0 40.0 51.5 49.0 53.5 52.0455.0 40.0 54.0 49.5 53.0 52.5460.0 40.0 51.5 50.0 53.0 52.0465.0 38.0 51.0 48.5 52.5 51.5470.0 38.0 53.0 45.5 51.0 50.0475.0 37.0 50.5 44.5 51.5 50.5480.0 40.0 50.5 46.5 50.0 50.0485.0 44.0 50.5 46.0 49.5 49.5490.0 40.0 51.0 46.0 49.5 50.5495.0 39.0 51.0 47.0 52.0 50.5
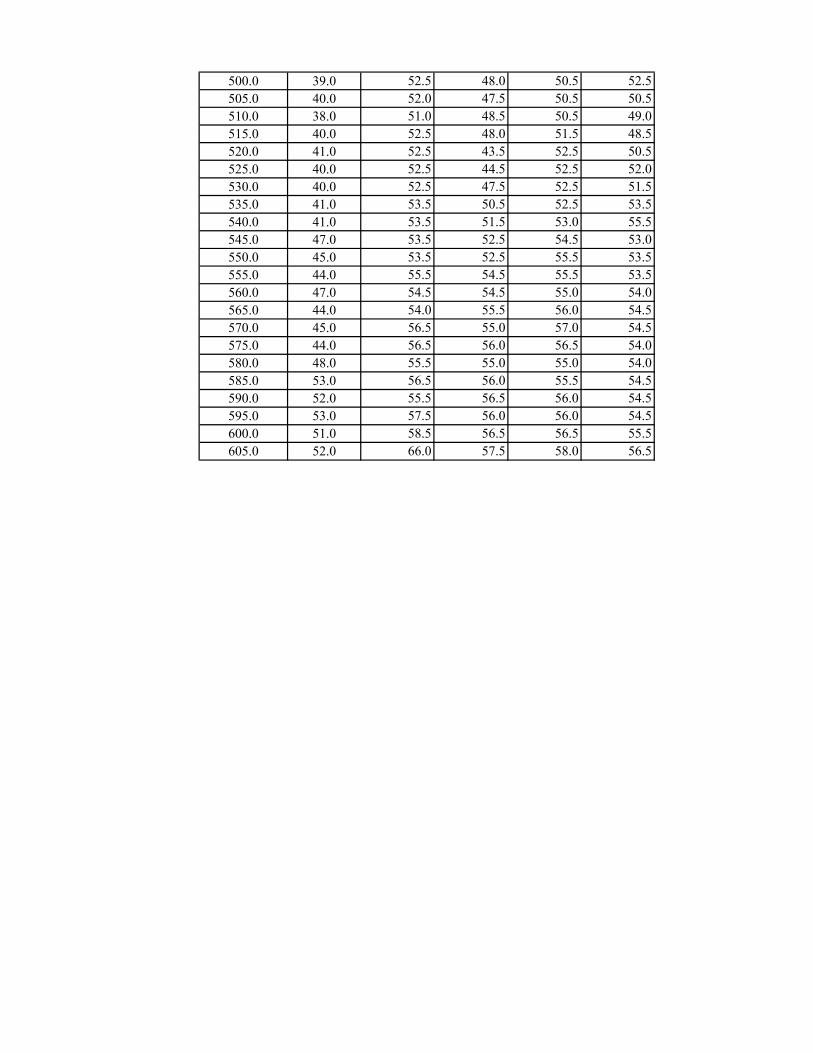
500.0 39.0 52.5 48.0 50.5 52.5505.0 40.0 52.0 47.5 50.5 50.5510.0 38.0 51.0 48.5 50.5 49.0515.0 40.0 52.5 48.0 51.5 48.5520.0 41.0 52.5 43.5 52.5 50.5525.0 40.0 52.5 44.5 52.5 52.0530.0 40.0 52.5 47.5 52.5 51.5535.0 41.0 53.5 50.5 52.5 53.5540.0 41.0 53.5 51.5 53.0 55.5545.0 47.0 53.5 52.5 54.5 53.0550.0 45.0 53.5 52.5 55.5 53.5555.0 44.0 55.5 54.5 55.5 53.5560.0 47.0 54.5 54.5 55.0 54.0565.0 44.0 54.0 55.5 56.0 54.5570.0 45.0 56.5 55.0 57.0 54.5575.0 44.0 56.5 56.0 56.5 54.0580.0 48.0 55.5 55.0 55.0 54.0585.0 53.0 56.5 56.0 55.5 54.5590.0 52.0 55.5 56.5 56.0 54.5595.0 53.0 57.5 56.0 56.0 54.5600.0 51.0 58.5 56.5 56.5 55.5605.0 52.0 66.0 57.5 58.0 56.5

Timecum UCIL1 degC
UCIL2 degC
UCIL3 degC
UCIL4 degC
UCIL5_Hh degC
UCIL6 degC
UCIL7 degC
UCIL8 degC
UCIL9_Hh degC
0.0 24.55.0 24.0 24.510.0 24.0 24.315.0 23.5 24.2 25.020.0 23.5 24.3 24.525.0 23.5 24.7 24.530.0 23.5 25.2 24.035.0 23.5 25.3 24.0 25.540.0 24.0 25.3 24.0 25.545.0 24.0 26.5 25.3 24.5 25.050.0 24.0 26.0 25.5 24.5 25.055.0 24.0 25.5 25.6 24.5 25.060.0 24.0 25.5 25.5 24.5 25.065.0 24.0 25.0 25.5 24.5 25.0 25.5 27.770.0 24.5 25.0 25.2 24.5 24.5 25.5 27.775.0 24.5 25.0 25.0 24.5 24.5 25.0 27.880.0 24.5 24.5 25.1 24.5 24.5 25.0 28.285.0 24.5 24.5 25.2 24.5 24.5 25.0 28.490.0 24.5 26.5 24.5 25.5 24.5 24.5 25.5 29.895.0 24.5 26.0 24.5 24.7 24.5 24.5 27.0 28.1100.0 24.5 25.5 24.5 25.9 24.5 24.5 30.0 28.3105.0 24.5 25.5 24.5 26.1 25.0 24.5 30.0 28.3110.0 24.5 25.5 24.5 27.4 25.0 25.0 29.5 30.2115.0 24.5 25.0 24.5 27.5 25.0 25.0 28.5 29.6120.0 25.0 25.5 25.0 27.9 25.5 25.0 28.0 29.6125.0 25.0 25.5 25.0 27.9 25.5 25.0 28.0 29.9130.0 25.5 25.5 25.0 27.2 26.0 25.5 27.5 31.0135.0 25.5 25.5 25.0 27.2 26.0 25.5 27.5 30.8140.0 25.5 28.0 25.5 25.0 27.0 26.0 25.5 27.0 30.8145.0 26.0 27.5 26.0 25.5 27.1 26.0 25.5 27.0 30.5150.0 26.0 26.5 26.0 25.5 27.0 26.0 25.5 26.5 31.2155.0 26.0 26.5 26.0 25.5 27.1 26.0 25.5 26.5 30.5160.0 26.0 26.0 26.0 25.5 27.0 26.0 25.5 26.5 30.5165.0 26.0 25.5 26.0 25.5 26.8 26.5 25.5 26.0 30.2170.0 26.0 25.5 26.0 25.5 26.5 26.5 25.5 26.5 29.9175.0 26.0 25.5 26.0 25.5 26.6 26.5 26.0 26.5 29.7180.0 26.0 25.5 26.0 25.5 26.7 26.5 26.0 26.5 30.2185.0 26.5 25.5 26.0 26.0 26.8 26.5 26.0 26.0 30.0190.0 26.5 25.0 26.5 26.0 26.7 26.5 26.0 26.5 29.6195.0 26.5 25.0 26.5 26.0 26.7 26.5 26.0 26.5 29.6200.0 26.5 25.0 26.5 26.0 26.7 26.5 26.0 26.5 30.3205.0 26.5 25.0 26.5 26.0 26.8 26.5 26.0 26.5 31.0210.0 26.5 25.0 26.5 26.0 26.7 26.5 26.0 26.5 30.9215.0 26.5 25.0 26.5 26.0 26.6 26.5 26.0 26.5 30.2220.0 26.5 25.0 26.5 26.0 26.4 26.5 26.0 26.0 29.6225.0 26.5 25.0 26.5 26.0 26.4 26.5 26.0 26.0 30.3230.0 26.0 25.0 26.5 26.0 26.3 26.5 26.0 26.0 30.1

235.0 26.0 25.0 26.5 26.0 26.4 26.5 26.0 26.0 30.4240.0 26.0 25.0 26.0 26.0 26.4 26.5 26.0 25.5 30.3245.0 26.0 25.0 26.0 26.0 26.3 26.0 26.0 25.5 29.9250.0 26.0 25.0 26.0 26.0 26.3 26.0 26.0 25.5 29.7255.0 26.0 25.0 26.0 26.0 26.3 26.0 26.0 25.5 29.9260.0 26.0 25.0 26.0 26.0 26.3 26.0 25.5 25.5 30.0265.0 26.0 25.0 26.0 26.0 26.2 26.0 25.5 25.5 30.6270.0 26.0 25.0 26.0 26.0 26.2 26.0 25.5 25.5 30.4275.0 26.0 25.0 26.0 26.0 26.2 26.0 25.5 25.5 29.8280.0 26.0 25.0 26.0 26.0 26.2 26.0 26.0 25.5 30.1285.0 26.0 25.0 26.0 26.0 26.0 26.0 26.0 25.5 29.9290.0 26.0 25.0 26.0 26.0 26.0 26.0 26.0 25.5 30.3295.0 26.0 25.0 26.5 26.0 26.0 26.0 26.0 25.5 29.9300.0 26.0 25.0 26.5 26.0 26.0 26.0 26.0 25.5 29.7305.0 26.0 25.0 26.5 26.0 26.1 26.0 26.0 25.5 30.1310.0 26.0 25.0 26.5 26.0 26.0 26.0 26.0 25.5 30.1315.0 26.0 25.0 26.0 26.0 26.0 26.0 26.0 25.5 30.0320.0 26.0 25.0 26.0 26.0 25.0 26.0 26.0 25.5 29.6325.0 25.5 25.0 26.0 26.0 25.8 26.0 25.5 25.5 29.8330.0 26.0 25.0 26.0 26.0 25.9 26.0 25.5 25.5 30.3335.0 26.0 25.0 26.0 26.0 26.1 26.0 25.5 25.5 29.8340.0 26.0 25.0 26.0 26.0 26.2 26.0 25.5 25.5 31.2345.0 26.0 25.0 26.0 26.0 26.1 26.0 25.5 25.5 31.9350.0 26.0 25.0 26.0 26.0 26.0 26.0 25.5 25.5 31.4355.0 26.0 25.0 26.0 26.0 25.9 26.0 26.0 25.5 31.0360.0 26.0 25.0 26.0 26.0 26.0 26.0 26.0 25.5 31.5365.0 26.0 25.0 26.0 26.0 26.0 26.0 26.0 25.5 30.4370.0 26.0 25.0 26.0 26.0 26.0 26.0 26.0 25.5 30.7375.0 25.5 25.0 26.0 26.0 26.0 26.0 26.0 25.5 33.0380.0 25.5 25.0 26.0 26.0 25.9 26.0 25.5 25.5 31.7385.0 25.5 25.0 26.0 26.0 25.8 26.0 25.5 25.0 30.2390.0 25.5 25.0 26.0 26.0 25.7 26.0 25.5 25.0 30.0395.0 25.5 24.5 26.0 25.5 25.7 25.5 25.5 25.0 30.0400.0 25.5 24.5 25.5 25.5 27.7 25.5 25.5 25.0 30.1405.0 25.5 24.5 25.5 25.5 25.5 25.5 25.5 25.0 29.9410.0 25.0 24.5 25.5 25.5 25.6 25.5 25.5 24.5 29.6415.0 25.0 24.5 25.5 25.5 25.5 25.5 25.5 24.5 29.8420.0 25.0 24.5 25.5 25.5 25.6 25.5 25.5 24.5 29.9425.0 25.0 24.5 25.5 25.5 25.2 25.5 25.5 24.5 30.7430.0 25.0 24.0 25.5 25.5 25.1 25.5 25.5 24.5 29.8435.0 25.0 24.0 25.5 25.5 25.1 25.5 25.5 24.5 30.4440.0 24.5 24.0 25.5 25.5 25.1 25.5 25.5 24.0 30.6445.0 24.5 24.0 25.5 25.5 25.2 25.5 25.5 24.0 30.9450.0 24.5 24.0 25.5 25.5 25.2 25.5 25.0 24.0 31.1455.0 24.5 24.0 25.5 25.5 25.4 25.5 25.0 24.0 31.4460.0 24.5 24.0 25.5 25.5 25.4 25.5 25.0 24.0 30.4465.0 24.5 24.0 25.5 25.5 25.4 25.5 25.5 24.0 30.4470.0 24.5 24.0 25.5 26.0 25.4 25.5 25.5 24.0 29.9475.0 24.5 24.0 25.5 26.0 25.4 25.5 25.5 24.0 29.5

Timecum UCIL1 (%)
UCIL2 (%)
UCIL3 (%)
UCIL4 (%)
UCIL6 (%)
UCIL7 (%)
UCIL8 (%)
0.0 65.0
5.0 65.0
10.0 65.0
15.0 65.0 62.5
20.0 67.5 62.5
25.0 67.0 64.0
30.0 67.0 63.0
35.0 66.5 63.5 61.5
40.0 67.5 63.5 62.5
45.0 67.0 62.0 64.0 63.0
50.0 65.0 63.5 64.0 63.5
55.0 66.5 63.5 64.0 63.5
60.0 66.5 63.0 64.0 63.5
65.0 64.5 63.5 64.0 63.0 64.0
70.0 65.0 63.5 62.5 62.5 64.5
75.0 63.5 63.0 62.5 62.0 63.0
80.0 64.0 63.5 63.5 62.5 64.5
85.0 65.0 64.0 63.0 63.0 64.0
90.0 64.5 61.5 63.5 62.0 63.5 64.5
95.0 64.0 61.5 64.0 63.0 63.0 71.0
100.0 64.0 62.0 64.0 63.5 63.0 62.0
105.0 62.5 63.0 62.5 63.0 62.0 62.5
110.0 63.5 62.5 62.5 60.0 62.5 55.5
115.0 63.0 62.0 62.5 61.0 61.5 55.0
120.0 62.5 62.0 62.5 58.5 61.0 55.0
125.0 62.5 63.0 61.0 58.5 58.5 55.5
130.0 61.5 61.5 61.5 58.0 58.5 57.5
135.0 60.0 60.5 61.0 57.0 58.5 56.0
140.0 60.0 59.0 61.0 60.5 57.0 58.0 57.0
145.0 59.0 56.5 61.0 59.5 57.5 58.0 56.0
150.0 59.5 58.0 60.5 59.5 56.0 58.5 57.0
155.0 60.0 58.0 59.5 59.0 56.5 57.5 56.0
160.0 59.0 57.0 59.0 60.0 57.0 58.0 57.0
165.0 59.5 58.5 59.0 60.0 57.0 58.0 58.5
170.0 58.5 59.5 59.0 60.5 56.5 58.0 58.5
175.0 59.0 60.0 59.5 57.5 57.0 58.5 59.5
180.0 59.0 61.0 59.0 58.5 56.5 58.5 59.0
185.0 59.0 61.0 59.0 58.5 56.5 58.0 59.0
190.0 59.5 59.5 59.5 59.5 57.0 58.5 59.5
195.0 60.0 60.5 59.5 59.0 57.0 58.0 58.5
200.0 59.5 60.5 59.0 58.0 55.5 57.5 59.5
205.0 59.0 62.0 59.5 57.5 56.5 58.0 59.0
210.0 59.0 61.5 58.0 58.0 56.0 58.5 59.0
215.0 58.5 59.5 57.5 59.0 56.0 57.5 59.5
220.0 58.0 60.5 58.0 58.5 56.5 58.0 59.5
225.0 59.0 61.0 58.0 58.5 55.5 58.5 60.5
230.0 58.5 61.0 59.0 59.0 56.0 58.5 61.0
235.0 59.5 62.0 59.0 59.0 57.0 58.0 61.0

240.0 60.5 61.5 59.0 59.0 57.0 59.0 62.0
245.0 61.0 62.0 60.0 59.5 58.0 59.0 61.5
250.0 62.0 63.0 60.5 60.0 57.5 59.5 62.0
255.0 59.5 62.0 59.5 58.5 57.0 58.0 62.5
260.0 61.5 62.5 59.5 59.0 57.5 58.5 61.5
265.0 61.0 62.5 59.5 59.0 58.0 59.0 62.5
270.0 61.5 62.0 60.0 59.5 57.5 59.5 62.5
275.0 62.5 63.0 60.5 61.0 60.0 60.0 63.0
280.0 64.0 63.5 61.0 62.0 61.0 61.5 64.0
285.0 65.5 65.5 62.0 62.5 61.5 62.0 64.0
290.0 65.5 65.0 63.0 62.5 61.5 62.0 64.5
295.0 65.5 64.5 63.0 62.5 61.5 62.0 65.0
300.0 66.0 65.0 63.5 63.0 62.0 62.5 66.0
305.0 66.5 65.0 64.0 63.0 63.0 63.0 67.0
310.0 66.0 65.5 64.0 63.0 62.5 62.5 67.0
315.0 66.5 65.0 64.0 62.5 62.5 63.0 66.0
320.0 66.0 65.5 64.0 62.5 62.5 63.0 66.5
325.0 65.0 64.5 63.5 62.5 62.0 63.0 66.5
330.0 66.0 64.5 64.0 62.5 62.5 63.5 66.5
335.0 66.5 64.0 63.5 62.0 62.5 63.0 67.0
340.0 65.0 64.0 63.0 62.5 62.0 62.5 66.5
345.0 65.0 64.5 62.5 61.0 60.0 62.5 66.0
350.0 66.0 63.5 62.5 61.5 60.5 62.0 64.5
355.0 65.5 64.0 62.5 62.0 61.0 62.5 65.5
360.0 62.0 64.5 61.0 62.0 61.5 62.5 65.0
365.0 62.0 64.0 61.5 62.0 61.0 62.5 65.0
370.0 61.0 64.0 60.0 61.5 58.5 62.5 65.0
375.0 60.5 63.5 60.0 59.5 58.5 61.0 64.0
380.0 62.0 63.5 59.0 59.5 58.0 60.5 63.5
385.0 63.0 62.5 60.0 59.5 57.5 58.5 63.5
390.0 63.5 62.0 60.0 58.5 57.5 59.0 64.5
395.0 61.5 62.0 60.0 58.0 58.0 59.5 64.5
400.0 62.5 62.0 59.5 58.5 57.5 60.0 64.5
405.0 62.0 63.0 59.5 58.5 58.0 60.0 64.0
410.0 62.5 62.5 59.5 59.5 58.5 60.5 64.5
415.0 64.0 63.0 60.0 59.5 58.5 60.5 64.5
420.0 64.0 63.0 61.0 59.5 58.5 60.5 64.5
425.0 66.0 64.0 61.5 60.0 58.5 60.5 64.0
430.0 66.0 64.5 61.5 60.5 59.0 61.0 64.0
435.0 65.0 65.5 62.0 60.5 59.5 61.0 65.0
440.0 66.5 64.5 62.0 60.5 60.0 61.0 65.5
445.0 66.0 64.5 62.5 60.5 59.5 61.5 65.5
450.0 66.5 65.0 62.5 61.0 59.5 61.5 66.5
455.0 65.0 65.5 62.5 62.5 60.0 62.5 66.5
460.0 64.5 65.0 62.5 62.0 60.0 63.0 66.5
465.0 65.0 64.5 63.0 64.0 60.5 64.5 67.5
470.0 65.0 66.0 63.0 63.0 60.5 63.5 67.0
475.0 66.5 66.0 63.0 62.5 61.0 63.0 67.5

Timecum UCIL1 degC
UCIL1_Hh degC
UCIL2 degC
UCIL3 degC
UCIL4 degC
UCIL6 degC
UCIL7 degC
UCIL8 degC
0.0 27.05.0 26.0
10.0 25.5 23.615.0 25.0 23.220.0 24.5 23.3 26.525.0 24.0 23.6 25.530.0 24.0 23.5 25.035.0 23.5 23.8 24.540.0 23.5 23.7 24.045.0 23.5 23.9 24.050.0 23.5 24.1 23.5 26.055.0 23.5 24.1 23.5 25.560.0 23.5 24.3 23.5 26.0 25.065.0 23.5 24.5 23.5 25.5 25.070.0 23.5 24.6 23.5 25.5 25.0 26.575.0 23.5 24.7 23.5 25.0 25.0 26.080.0 23.5 24.8 23.5 25.0 25.5 25.585.0 23.5 25.0 23.5 24.5 25.5 25.090.0 24.0 25.1 23.5 24.5 25.5 25.095.0 24.0 25.1 23.5 26.5 24.5 25.5 24.5
100.0 24.0 25.4 23.5 26.5 24.5 25.5 24.5105.0 24.0 25.4 24.0 26.0 24.5 25.5 24.5110.0 24.0 25.5 24.0 25.5 24.0 26.5 25.5 24.5115.0 24.0 25.7 24.0 25.5 24.0 25.5 25.5 24.5120.0 24.5 25.7 24.0 25.0 24.0 25.0 25.5 24.5125.0 24.5 25.7 24.0 25.0 24.0 25.0 25.5 24.5130.0 24.5 26.1 24.0 25.0 24.0 25.0 25.5 24.5135.0 24.5 25.9 24.5 25.0 24.5 24.5 25.5 24.5140.0 24.5 26.1 24.5 25.0 24.5 25.0 25.5 25.0145.0 24.5 26.1 24.5 25.0 24.5 25.0 25.5 25.0150.0 24.5 26.4 24.5 25.0 24.5 25.0 25.5 25.0155.0 24.5 26.2 24.5 25.0 24.5 25.0 25.5 25.0160.0 24.5 26.1 24.5 25.0 24.5 25.0 25.5 25.5165.0 24.5 26.4 25.0 25.5 24.5 25.0 25.5 25.5170.0 25.0 26.5 25.0 25.5 25.0 25.0 26.0 25.5175.0 25.0 26.8 25.0 25.5 25.0 25.0 26.0 25.5180.0 25.0 27.0 25.0 25.5 25.0 25.5 26.0 26.0185.0 25.0 26.6 25.0 25.5 25.0 25.5 26.5 26.0190.0 25.5 26.9 25.0 25.5 25.5 25.5 26.5 26.0195.0 25.5 27.1 25.5 26.0 25.5 26.0 26.5 26.0200.0 25.5 27.2 25.5 26.0 25.5 26.5 26.5 26.5205.0 25.5 27.2 25.5 26.0 26.0 26.5 27.0 26.5210.0 25.5 27.3 25.5 26.5 26.0 26.5 27.0 26.5215.0 26.0 27.5 25.5 26.5 26.0 26.5 27.0 26.5220.0 26.0 27.1 25.5 26.5 26.0 26.5 27.0 27.0225.0 26.0 27.1 25.5 26.5 26.5 26.5 27.0 27.0230.0 26.0 27.3 26.0 26.5 26.5 26.5 27.0 27.0235.0 26.0 27.0 26.0 26.5 26.5 26.5 27.0 27.0

240.0 26.0 27.7 26.0 27.0 26.5 26.5 27.0 27.0245.0 26.0 27.0 26.0 27.0 26.5 26.5 27.0 27.0250.0 26.0 27.4 26.0 27.0 26.5 27.0 27.0 27.0255.0 26.5 28.5 26.0 27.0 26.5 27.0 27.0 27.5260.0 26.5 27.9 26.0 27.0 27.0 27.0 27.0 27.5265.0 26.5 28.4 26.0 27.0 27.0 27.0 27.5 27.5270.0 26.5 29.0 26.0 27.0 27.0 27.0 27.5 27.5275.0 27.0 29.5 26.0 27.5 27.0 27.5 27.5 27.5280.0 27.0 28.4 26.0 27.5 27.0 27.5 27.5 27.5285.0 27.5 28.4 26.0 27.5 27.0 27.5 28.0 27.5290.0 27.5 28.3 26.5 27.5 27.5 27.5 28.0 28.0295.0 27.5 28.8 26.5 27.5 27.5 27.5 28.0 28.0300.0 27.5 27.4 26.5 28.0 27.5 28.0 28.0 28.0305.0 27.0 28.1 26.5 28.0 27.5 28.0 28.0 28.0310.0 27.5 28.6 26.5 28.0 27.5 28.0 28.0 28.0315.0 27.5 28.5 26.5 28.0 27.5 28.0 28.0 28.0320.0 27.5 28.4 26.5 28.0 27.5 28.0 28.0 28.0325.0 27.5 27.8 26.5 28.0 27.5 28.0 28.0 28.0330.0 27.5 28.2 27.0 28.0 28.0 28.0 28.0 28.5335.0 27.5 28.3 27.0 28.0 28.0 28.0 28.5 28.5340.0 27.5 28.4 27.0 28.0 28.5 28.0 28.0 28.5345.0 27.5 28.4 27.0 28.0 28.5 28.5 28.0 28.5350.0 27.5 28.2 27.0 28.5 28.5 28.5 28.5 28.5355.0 27.5 28.7 27.0 28.5 28.5 28.5 28.0 28.5360.0 27.5 28.6 27.0 28.5 28.5 28.5 28.0 28.5365.0 27.5 28.3 27.0 28.5 28.5 28.5 28.5 28.5370.0 27.5 28.7 27.0 28.5 28.5 28.0 28.5 28.5375.0 27.5 28.8 27.0 28.5 28.5 28.0 28.5 28.5380.0 27.5 29.3 27.0 28.5 29.0 28.0 28.5 28.5385.0 27.5 28.8 27.0 28.5 29.0 28.0 28.5 28.5390.0 27.5 28.6 27.0 28.5 29.0 28.0 28.5 28.5395.0 28.0 29.0 27.0 28.5 29.0 28.0 28.5 28.5400.0 28.0 28.8 27.5 28.5 29.0 28.0 28.5 28.5405.0 28.0 28.9 27.5 28.5 29.0 28.0 28.5 29.0410.0 28.0 28.7 27.5 28.5 29.0 28.0 28.5 29.0415.0 28.0 28.9 27.5 28.5 29.0 28.0 28.5 29.0420.0 28.0 29.1 27.5 28.5 29.0 28.0 28.5 29.0425.0 28.0 29.8 27.5 28.5 29.0 28.0 28.5 29.0430.0 28.0 29.2 27.5 28.5 29.5 28.0 28.5 29.0435.0 28.0 28.9 27.5 29.0 29.5 28.0 28.5 29.0440.0 28.0 28.7 27.5 29.0 29.5 28.0 28.5 29.0445.0 28.0 28.7 27.5 29.0 29.5 28.0 28.5 29.0450.0 28.0 28.8 27.5 29.0 29.5 28.0 28.5 29.0455.0 28.0 28.7 27.5 29.0 29.5 28.0 28.5 29.0460.0 28.0 28.8 27.5 29.0 29.5 28.0 28.5 28.5465.0 28.0 28.9 27.5 29.0 29.5 28.0 28.5 28.5470.0 28.0 28.7 27.5 29.0 30.0 28.0 28.5 28.5475.0 28.0 29.0 27.5 29.0 30.0 28.0 28.5 28.5480.0 28.0 28.9 27.5 29.0 30.5 28.0 28.5 28.5485.0 28.0 28.8 27.5 29.0 30.5 28.0 28.5 28.5

490.0 28.0 28.8 27.5 29.0 30.5 28.0 28.5 28.5495.0 28.0 29.0 27.5 29.0 30.5 28.0 28.5 28.5500.0 28.0 28.7 27.5 29.0 30.5 28.0 28.5 28.5505.0 28.0 28.8 27.5 29.0 30.5 28.0 28.5 28.0510.0 28.0 28.8 27.5 29.0 30.5 28.0 28.5 28.0515.0 28.0 28.7 27.5 29.0 30.5 28.0 28.5 28.5520.0 28.0 28.7 27.5 29.0 30.5 28.0 28.0 28.5525.0 28.0 28.6 27.5 29.0 30.5 28.0 28.0 28.5530.0 28.0 28.7 27.5 29.0 30.0 28.0 28.0 28.0535.0 28.0 28.6 27.5 29.0 30.0 28.0 28.0 28.0540.0 28.0 28.6 27.5 29.0 30.0 28.0 28.0 28.0545.0 28.0 28.5 27.5 29.0 29.5 28.0 28.0 28.0550.0 28.0 28.5 27.5 28.5 29.5 28.0 28.0 28.0555.0 28.0 28.4 27.5 28.5 29.0 28.0 28.0 28.0560.0 28.0 28.4 27.5 28.5 29.0 28.0 28.0 28.0565.0 28.0 28.3 27.5 28.5 29.0 28.0 28.0 28.0570.0 27.5 28.2 27.5 28.5 29.0 28.0 28.0 27.5575.0 27.5 28.0 27.5 28.5 28.5 28.0 28.0 27.5580.0 27.5 27.9 27.5 28.5 28.5 28.0 28.0 27.5585.0 27.5 27.7 27.5 28.5 28.5 27.5 28.0 27.5590.0 27.5 27.5 27.5 28.5 28.5 27.5 28.0 27.5595.0 27.5 27.3 27.0 28.5 28.5 27.5 27.5 27.5600.0 27.5 26.9 27.0 28.5 28.5 27.5 27.5 27.5605.0 27.5 26.6 27.0 28.5 28.5 27.5 27.5 27.0610.0 27.0 26.3 27.0 28.5 28.0 27.5 27.5 27.0615.0 27.0 26.1 27.0 28.5 28.0 27.5 27.5 27.0620.0 27.0 25.9 27.0 28.5 28.0 27.5 27.5 26.5625.0 26.5 25.8 26.5 28.5 28.0 27.5 27.5 26.5

Timecum UCIL1 (%)
UCIL1_Hh(%)
UCIL2(%)
UCIL3(%)
UCIL4(%)
UCIL6(%)
UCIL7(%)
UCIL8(%)
0.0 52.05.0 51.510.0 51.5 39.015.0 52.5 40.020.0 52.5 41.0 48.025.0 53.5 42.0 48.030.0 54.0 41.0 48.535.0 53.5 38.0 49.040.0 54.5 41.0 51.045.0 55.5 42.0 50.550.0 55.5 41.0 51.5 50.555.0 56.5 41.0 52.0 48.560.0 56.0 40.0 51.0 50.0 50.065.0 56.0 40.0 52.0 50.5 49.070.0 55.5 39.0 52.0 51.5 51.5 50.075.0 54.5 38.0 51.5 51.5 53.0 50.580.0 53.0 37.0 52.0 51.0 52.5 50.085.0 53.0 36.0 51.5 51.5 50.5 50.590.0 51.5 35.0 51.5 51.0 49.5 51.095.0 51.5 35.0 51.5 50.5 51.5 48.5 50.0100.0 52.5 35.0 51.0 48.5 50.0 47.5 48.5105.0 50.5 33.0 50.0 45.0 49.5 46.0 48.5110.0 48.5 32.0 46.5 45.5 49.0 42.0 47.5 48.5115.0 48.0 32.0 47.5 47.5 48.5 44.5 46.0 47.5120.0 48.5 32.0 47.5 47.5 48.5 41.0 44.5 44.0125.0 47.5 32.0 45.0 46.0 46.5 41.0 43.5 45.5130.0 43.5 29.0 45.5 46.0 46.5 39.0 43.0 44.0135.0 40.5 27.0 39.0 43.0 45.5 40.0 40.0 40.0140.0 43.0 28.0 43.0 41.0 44.0 38.5 40.5 41.0145.0 43.0 27.0 40.5 42.5 43.0 38.0 41.0 40.5150.0 43.0 27.0 42.5 40.0 43.0 36.5 41.5 41.0155.0 39.0 26.0 38.0 42.0 42.5 39.0 35.5 35.5160.0 39.0 26.0 36.0 41.0 41.0 36.5 39.0 35.0165.0 39.0 25.0 35.5 39.0 40.0 36.0 38.5 35.0170.0 37.5 25.8 39.0 38.0 40.0 35.0 36.5 37.0175.0 40.5 26.0 38.0 38.5 40.0 37.0 38.0 37.5180.0 39.0 26.0 39.0 39.5 39.5 35.5 38.0 37.0185.0 38.5 26.0 39.5 40.0 41.0 37.0 38.0 35.5190.0 42.0 26.0 39.0 38.5 39.0 35.5 38.0 35.5195.0 41.0 26.0 36.0 40.0 39.0 36.5 39.0 35.5200.0 40.0 26.0 38.0 38.0 39.0 34.0 37.0 37.0205.0 41.0 24.0 39.0 38.0 39.0 36.0 37.0 37.0210.0 38.0 24.0 38.5 36.5 38.0 35.0 36.0 36.5215.0 39.0 24.0 37.0 37.0 38.0 32.5 36.0 34.5220.0 37.0 24.0 37.0 36.0 37.5 33.5 36.0 36.0225.0 38.0 25.0 38.0 34.5 37.0 32.5 36.0 33.5230.0 39.5 25.0 35.0 36.0 37.0 33.5 36.0 33.5235.0 39.0 24.0 35.5 38.0 38.0 34.5 36.0 36.0

240.0 38.0 26.0 36.5 37.0 37.5 34.0 36.0 34.5245.0 37.5 24.0 37.5 36.0 37.0 33.5 36.0 34.5250.0 39.5 25.0 35.0 36.0 37.0 34.5 34.5 36.0255.0 38.0 24.0 37.0 38.0 36.5 34.5 35.5 35.5260.0 38.0 24.0 36.5 34.5 35.0 33.5 36.0 34.0265.0 38.0 23.0 36.5 36.5 34.5 33.5 36.0 33.0270.0 39.0 23.0 37.0 36.0 36.0 32.5 36.0 33.5275.0 36.0 22.0 35.5 37.0 36.0 32.5 34.0 33.5280.0 36.0 23.0 37.5 35.5 36.0 33.0 35.0 35.0285.0 37.0 23.0 35.5 37.0 36.0 33.5 33.5 33.5290.0 36.0 23.0 36.5 35.0 36.0 32.5 33.5 33.5295.0 35.0 23.0 35.0 36.0 36.5 32.5 34.0 33.5300.0 34.0 23.0 34.5 36.0 34.5 32.5 33.5 31.0305.0 38.0 23.0 36.0 36.5 35.0 31.5 33.5 33.0310.0 37.5 23.0 36.0 33.0 35.0 30.5 33.0 33.5315.0 36.0 23.0 37.0 35.5 34.0 31.5 33.5 33.5320.0 36.0 23.0 37.0 33.5 33.5 31.0 34.0 35.0325.0 36.0 24.0 36.0 35.0 33.5 32.5 33.0 33.5330.0 36.0 23.0 35.0 33.0 33.5 30.5 32.5 32.5335.0 37.0 23.0 34.0 33.5 35.0 31.0 32.5 32.0340.0 36.0 23.0 37.5 35.0 33.5 31.5 32.5 33.5345.0 37.0 24.0 37.5 35.5 33.5 31.5 33.5 32.0350.0 36.5 23.0 36.5 33.0 33.5 31.5 32.5 32.5355.0 36.0 23.0 37.0 34.5 33.0 31.5 32.5 32.5360.0 37.0 23.0 36.5 34.5 32.0 31.5 33.0 35.0365.0 36.0 23.0 37.0 34.5 33.5 31.5 33.5 32.0370.0 36.0 23.0 37.0 34.5 33.5 31.5 32.5 31.5375.0 36.0 23.0 36.0 35.0 33.5 32.5 32.0 31.5380.0 37.0 23.0 37.0 33.5 32.5 31.5 32.5 32.5385.0 35.0 22.0 37.0 35.0 32.5 31.5 32.5 33.5390.0 36.0 23.0 37.0 32.5 34.0 31.5 32.5 33.5395.0 36.5 23.0 38.0 33.5 32.0 32.5 32.5 33.5400.0 37.0 24.0 34.0 35.0 32.0 31.5 32.5 32.5405.0 36.0 24.0 37.0 32.0 32.5 31.5 32.5 31.5410.0 37.0 23.0 35.5 32.5 32.5 32.0 32.0 32.0415.0 35.0 23.0 34.5 32.5 31.5 32.5 32.5 32.5420.0 35.5 22.0 36.0 33.5 32.5 31.5 32.5 33.5425.0 37.0 24.0 36.0 33.5 32.5 32.5 31.5 32.5430.0 36.0 22.0 37.0 32.5 32.5 31.5 32.5 34.0435.0 36.0 23.0 35.0 32.5 32.5 32.5 32.5 32.5440.0 36.0 23.0 35.0 33.5 32.0 32.5 33.0 32.5445.0 35.0 23.0 37.0 35.0 32.0 32.5 32.5 34.0450.0 36.5 24.0 36.0 34.0 30.5 32.0 32.5 31.5455.0 35.0 23.0 37.0 34.0 31.5 31.5 33.0 32.0460.0 35.0 23.0 36.0 35.0 32.5 32.5 32.5 31.5465.0 36.0 24.0 37.0 35.0 32.5 33.0 33.0 32.5470.0 36.5 23.0 37.0 34.0 32.5 32.5 33.0 33.5475.0 37.0 23.0 37.0 34.0 32.0 32.5 33.5 32.5480.0 36.5 23.0 38.0 34.0 32.5 33.0 33.0 32.5485.0 35.0 24.0 37.0 35.0 32.0 32.5 33.5 32.5

490.0 35.5 23.0 39.0 35.0 33.0 33.5 33.5 35.0495.0 37.0 24.0 36.0 35.0 30.5 32.5 33.5 35.0500.0 37.5 25.0 37.5 35.0 31.5 33.5 33.5 35.0505.0 37.0 24.0 38.0 35.0 31.5 33.0 33.5 35.5510.0 38.0 25.0 37.5 35.0 32.0 33.5 34.5 35.0515.0 37.0 24.0 37.0 35.0 32.0 33.5 33.5 35.0520.0 37.0 24.0 38.0 35.0 31.5 33.5 33.5 35.0525.0 37.0 24.0 38.5 35.5 31.5 33.0 33.5 35.0530.0 38.0 24.0 37.5 35.0 32.0 33.5 33.5 36.0535.0 37.0 24.0 38.0 35.5 32.0 33.5 35.0 36.5540.0 37.0 24.0 38.0 35.0 32.5 34.0 35.0 35.0545.0 38.0 25.0 39.0 35.0 32.5 35.0 35.0 35.0550.0 37.5 25.0 39.0 36.0 33.0 35.0 35.0 36.0555.0 38.0 25.0 39.0 36.0 33.0 35.0 35.0 37.5560.0 39.0 25.0 39.0 36.5 34.0 35.5 35.5 37.0565.0 39.0 25.0 39.0 37.0 34.0 36.0 36.0 38.0570.0 39.0 25.0 39.0 37.0 35.0 36.0 36.0 38.0575.0 40.5 26.0 39.0 37.0 35.0 36.0 36.0 38.0580.0 39.5 27.0 39.0 37.5 35.0 36.0 36.0 37.0585.0 39.5 26.0 39.0 37.0 35.0 36.0 36.0 37.0590.0 40.5 27.0 39.0 38.0 35.0 36.0 36.0 39.0595.0 40.5 27.0 40.0 38.0 35.5 36.0 36.0 39.0600.0 40.5 28.0 40.0 38.5 35.5 37.5 37.0 40.0605.0 40.0 28.0 40.0 38.5 35.0 38.0 37.0 40.0610.0 40.0 28.0 41.0 39.5 36.0 37.0 37.0 40.0615.0 40.0 29.0 40.0 39.5 36.0 37.0 37.5 40.0620.0 40.5 30.0 40.0 39.5 36.0 38.0 37.5 40.0625.0 40.0 31.0 40.5 39.5 36.0 38.0 38.0 40.0

Appendix F: Data from the field measurement
Hatirjheel Lake_Field measurement data

Timecum UCIL1 degC
UCIL2 degC
UCIL6 degC
UCIL7 degC
UCIL8 degC
0 265 25
10 24.515 2420 2425 24.530 2435 2440 2445 2450 2455 2460 24 2865 24 2870 24.5 2775 24.5 26.5 27.580 24.5 26.5 2885 24.5 26.5 2890 24.5 26.5 27.595 25 27 27.5 27.5
100 25 27 27.5 29105 25.5 27 27.5 28110 25.5 27 27 27115 25.5 27 27 26.5120 27.3 25.5 27 27.5 26125 27.9 25.5 27 27.5 26130 28.1 26 27.5 27.5 26135 28.2 26 27.5 27.5 26140 28.1 26 27.5 27.5 26.5145 28.3 26 28 28 26.5150 28 26.5 27.5 28 26.5155 27.9 26.5 28 28 27160 28.4 26.5 28 28 27165 28.3 26.5 28 28.5 27.5170 28.2 26.5 28 28.5 27.5175 28.2 27 28 28.5 27.5180 28.5 27 28 29 27.5185 28.3 27 28.5 29 28190 28.3 27 28.5 29 28195 28.4 27 28.5 29 28200 28.4 27 28.5 29 28205 28.6 27 28.5 29 28210 28.6 27.5 28.5 29.5 28215 28.8 27.5 28.5 29.5 28220 28.8 27.5 28.5 29.5 28225 28.8 27.5 28.5 29.5 28.5230 28.7 27.5 28 29.5 28.5235 28.4 27 28.5 29 28

240 28.5 27 28.5 28.5 27.5245 28.8 27 29 29 27.5250 28.8 27.5 28.5 29.5 28255 28.9 27.5 28.5 29.5 28.5260 28.8 27.5 28.5 30 28.5265 29.3 28 29 30 29270 29.4 28 29 30.5 29.5275 29 28 29 30 29.5280 29.1 28 29 30 30285 28.9 28 29.5 30 30.5290 29.1 28 28.5 30 30.5295 29.3 28 29 30 30.5300 29.3 28 29.5 30.5 30305 29.2 28 29 30.5 30310 30.8 28 29.5 29.5 29315 31.3 27.5 29.5 29.5 29320 32 27.5 29.5 29.5 28.5325 30.5 27.5 29 29.5 29330 31.1 27.5 29 29.5 28.5335 31.6 27.5 28.5 29.5 28340 34.2 27 28.5 29.5 28345 34.7 27 29 29.5 28350 31.6 27.5 29 30 28.5355 30.4 27.5 29 30 28.5360 30.8 27.5 29 29.5 28365 30.9 27.5 29 29.5 28370 29.6 27.5 28.5 29.5 28.5375 29.6 27.5 28.5 29.5 28380 30.1 27 28.5 29.5 28385 34.8 27.5 29 29.5 28390 33.9 28 29.5 30 28.5395 33.4 28 29.5 30.5 28.5400 30 28 29.5 30.5 28.5405 30.1 28 29 30.5 28.5410 30 28 28.5 30 28.5415 29.8 28 28.5 30 28.5420 29.4 28 28.5 30 28.5425 30.3 28 28.5 29.5 28.5430 30.7 27.5 28.5 29.5 28435 31.4 27.5 29 29.5 28440 31.1 27.5 29.5 29.5 28445 32.8 27.5 29.5 29 28450 33.1 27.5 30 29.5 28455 32.9 27.5 30.5 29.5 28460 33.8 28 30.5 29.5 28.5465 34.2 28 30.5 30 28.5470 34.4 28 30 30 28.5475 34 28 30.5 30 28.5480 32.2 28 30 30 28.5485 32.8 28 29.5 30 28.5

490 39.9 28 30 29.5 28495 33.3 27.5 29.5 29.5 28500 33.7 27.5 29.5 29.5 28505 33.9 27.5 29.5 29.5 27.5510 33.4 27 29.5 29.5 28515 33 27 29.5 29.5 27.5520 32.6 27 29.5 29 27.5525 32.3 26.5 29.5 29 27.5530 31.4 26.5 29.5 29 27.5535 31.3 26.5 29 29 27540 30.7 26 29 29 27.5545 30.6 26 28.5 28.5 27550 30.1 26 28 28.5 27555 29.6 26 28 28.5 26.5560 29.4 26 27.5 28 27565 29.4 25.5 27.5 28 26.5570 29.2 25.5 27.5 27.5 26.5575 29.1 25.5 27.5 27.5 26.5580 29 25.5 27.5 27.5 26.5585 28.7 25.5 27.5 29 26.5590 28.6 25.5 27 30 26.5

Timecum UCIL1 (%) UCIL2 (%) UCIL6 (%) UCIL7 (%) UCIL8 (%)0.0 74.55.0 77.0
10.0 78.015.0 80.020.0 80.525.0 79.030.0 80.035.0 80.540.0 80.545.0 81.050.0 81.055.0 81.560.0 81.5 74.065.0 80.5 70.570.0 79.0 72.575.0 78.0 73.0 76.080.0 77.5 74.0 72.085.0 76.5 73.0 69.090.0 77.5 70.5 71.595.0 75.5 70.5 68.5 75.0100.0 75.5 70.0 69.0 70.5105.0 75.5 70.5 69.5 68.0110.0 74.0 69.5 70.5 70.5115.0 74.0 70.5 71.0 73.0120.0 58.0 74.5 70.5 70.0 72.0125.0 58.0 74.0 71.5 71.0 72.5130.0 56.0 74.5 71.0 70.5 73.5135.0 56.0 73.5 71.0 71.0 73.5140.0 57.0 73.5 71.5 71.5 73.5145.0 56.0 74.0 70.0 71.0 73.0150.0 55.0 74.0 61.0 69.0 74.0155.0 48.0 67.5 62.5 64.5 69.0160.0 48.0 63.5 63.5 62.5 67.5165.0 44.0 65.5 64.5 62.5 63.5170.0 45.0 67.0 62.5 60.5 67.5175.0 45.0 65.5 61.0 60.5 64.0180.0 41.0 64.5 58.0 60.5 59.0185.0 39.0 63.0 58.0 59.0 62.0190.0 39.0 63.0 57.5 58.0 60.5195.0 39.0 61.5 57.0 57.5 58.5200.0 38.0 58.5 53.0 56.0 56.5205.0 40.0 59.0 54.0 52.5 57.0210.0 42.0 58.5 54.0 54.5 57.0215.0 41.0 59.5 55.0 55.0 61.0220.0 40.0 58.0 56.0 54.5 56.0225.0 42.0 59.0 56.5 55.5 56.5230.0 43.0 59.0 55.0 54.5 56.5235.0 41.0 60.5 55.5 55.0 57.5240.0 42.0 60.0 54.5 57.5 63.5

245.0 42.0 60.5 54.5 54.5 62.5250.0 41.0 59.0 54.0 55.0 58.5255.0 40.0 58.0 54.0 52.5 56.5260.0 42.0 58.5 54.5 54.5 56.5265.0 41.0 58.5 54.5 54.5 56.5270.0 42.0 59.0 56.0 55.5 60.5275.0 40.0 59.0 53.0 55.5 57.0280.0 43.0 57.0 54.0 54.0 55.0285.0 41.0 58.0 53.5 54.0 55.5290.0 42.0 58.0 55.0 54.0 56.5295.0 40.0 58.0 56.0 54.0 54.5300.0 42.0 58.0 54.0 53.5 54.5305.0 41.0 58.5 56.0 53.5 55.0310.0 37.0 61.0 54.5 53.5 55.0315.0 36.0 61.0 55.0 55.5 56.0320.0 36.0 60.0 54.5 54.5 56.0325.0 38.0 59.5 55.0 55.5 58.0330.0 37.0 61.5 57.0 55.0 59.0335.0 36.0 61.0 56.5 57.0 61.0340.0 31.0 62.5 56.5 56.5 61.0345.0 31.0 62.5 55.5 56.0 59.5350.0 40.0 60.5 55.5 54.5 57.5355.0 38.0 61.0 55.5 55.5 58.0360.0 39.0 61.0 56.0 56.5 58.0365.0 38.0 62.0 56.0 58.5 60.5370.0 41.0 63.0 57.5 58.0 60.0375.0 41.0 65.0 57.0 57.0 61.5380.0 40.0 63.0 58.0 57.0 63.5385.0 31.0 62.5 58.5 56.5 60.5390.0 31.0 61.0 56.0 54.5 58.5395.0 31.0 59.5 56.5 54.0 58.5400.0 39.0 60.5 56.0 54.5 58.0405.0 38.0 64.0 57.0 55.5 62.0410.0 40.0 59.5 57.0 55.0 59.5415.0 42.0 60.0 57.5 56.5 59.0420.0 43.0 59.5 57.5 54.5 59.0425.0 42.0 59.5 57.5 56.0 58.5430.0 38.0 63.5 58.0 57.0 59.5435.0 39.0 61.0 58.5 57.0 59.5440.0 39.0 62.0 58.5 59.0 60.0445.0 36.0 62.0 57.5 58.0 60.0450.0 33.0 63.5 56.5 55.5 59.0455.0 33.0 61.0 55.5 57.5 59.0460.0 32.0 60.0 54.0 57.5 59.0465.0 30.0 60.5 54.5 56.0 58.0470.0 30.0 60.5 55.5 55.5 62.0475.0 31.0 59.5 54.5 56.0 58.0480.0 33.0 63.0 55.5 57.0 59.5485.0 33.0 62.0 55.0 56.5 59.5490.0 33.0 66.0 54.5 55.0 63.0

495.0 32.0 65.0 56.5 58.0 59.5500.0 32.0 67.5 56.0 59.0 62.5505.0 30.0 64.0 57.5 57.5 61.5510.0 31.0 65.5 56.0 58.5 63.5515.0 33.0 65.0 56.5 59.0 65.0520.0 33.0 66.5 58.0 57.5 65.0525.0 32.0 67.0 56.5 59.0 64.5530.0 34.0 67.5 57.5 59.0 67.5535.0 34.0 67.5 57.5 60.0 64.0540.0 36.0 67.5 61.0 59.0 65.5545.0 37.0 68.5 61.0 60.0 67.0550.0 46.0 69.0 61.0 59.5 67.0555.0 44.0 68.5 61.0 61.5 67.5560.0 45.0 68.5 62.0 62.5 65.0565.0 46.0 69.5 62.5 63.5 67.5570.0 45.0 69.0 64.5 64.0 69.0575.0 46.0 71.0 65.0 64.5 69.0580.0 47.0 70.5 66.0 63.5 69.5585.0 47.0 70.5 64.0 65.0 70.0590.0 48.0 70.5 64.0 61.5 70.0

Timecum UCIL1 degC
UCIL2 degC
UCIL6 degC
UCIL7 degC
UCIL8 degC
0.0 17.55.0 17.510.0 18.015.0 20.0 18.020.0 20.0 18.025.0 19.5 18.530.0 19.0 18.535.0 19.0 18.540.0 19.0 19.045.0 19.0 19.050.0 19.5 20.5 19.555.0 19.5 21.0 21.0 19.560.0 19.5 21.0 21.0 19.565.0 19.5 21.5 21.0 19.570.0 20.0 22.0 21.0 19.575.0 20.0 22.0 21.0 20.080.0 20.0 21.0 21.0 20.085.0 20.0 21.0 21.0 20.590.0 20.0 21.0 21.0 20.595.0 20.5 21.0 21.0 21.0
100.0 20.5 21.0 21.0 21.0105.0 20.5 21.5 21.0 21.5110.0 21.0 21.5 21.0 21.5115.0 21.0 21.0 21.5 21.5120.0 21.0 21.5 21.5 21.5125.0 21.0 21.5 21.5 22.0130.0 22.0 21.0 21.5 21.5 22.0135.0 22.2 21.5 21.5 21.5 22.5140.0 22.2 21.5 21.5 21.5 22.5145.0 22.2 22.0 21.5 21.5 22.5150.0 22.1 22.0 21.5 22.0 23.0155.0 22.2 22.0 22.0 22.0 23.0160.0 21.9 22.0 22.0 22.0 23.0165.0 22.2 22.5 22.0 22.0 23.0170.0 22.4 22.5 22.0 22.0 23.0175.0 22.3 22.5 22.0 22.0 23.5180.0 22.6 22.5 22.0 22.0 23.5185.0 22.5 23.0 22.5 22.5 23.5190.0 22.6 23.0 22.5 22.5 24.0195.0 22.8 23.5 22.5 22.5 23.5200.0 22.8 23.5 22.5 22.5 23.5205.0 22.9 23.5 22.5 22.5 24.0210.0 22.8 23.5 22.5 22.5 24.0215.0 23.9 24.0 22.5 22.5 24.5220.0 23.1 24.0 23.0 23.0 24.5225.0 23.2 24.0 23.0 23.0 24.5230.0 23.8 24.0 23.0 23.0 24.5235.0 23.3 24.0 23.0 23.0 24.5240.0 23.4 24.0 23.0 23.0 24.5

245.0 23.5 24.0 23.0 23.0 24.5250.0 23.7 24.5 23.5 23.5 24.5255.0 23.6 24.5 23.5 23.5 24.5260.0 23.8 24.5 23.5 23.5 24.5265.0 23.7 24.5 23.5 23.5 24.5270.0 23.6 25.0 23.5 23.5 24.5275.0 23.7 25.0 23.5 23.5 25.0280.0 23.9 25.0 23.5 23.5 25.0285.0 24.0 25.0 23.5 23.5 25.0290.0 24.1 25.0 24.0 24.0 25.0295.0 23.0 25.0 24.0 24.0 25.0300.0 24.1 25.0 24.0 24.0 25.0305.0 24.0 25.0 24.0 24.0 25.0310.0 24.0 25.0 24.0 24.0 25.5315.0 24.1 25.0 24.0 24.0 25.5320.0 24.0 25.0 24.0 24.0 25.0325.0 24.0 25.0 24.0 24.0 25.0330.0 24.2 25.0 24.0 24.0 25.5335.0 24.2 25.0 24.0 24.0 25.5340.0 24.4 25.0 24.0 24.0 25.5345.0 24.1 25.0 24.0 24.0 25.5350.0 24.1 25.5 24.0 24.0 25.5355.0 24.3 25.0 24.0 24.0 25.5360.0 24.2 25.0 24.0 24.0 25.5365.0 24.3 25.5 24.0 24.5 25.5370.0 24.3 25.5 24.5 24.5 25.5375.0 24.4 25.0 24.5 24.5 25.5380.0 24.4 25.0 24.5 24.5 25.5385.0 24.4 25.5 24.5 24.5 25.5390.0 24.4 25.0 24.5 24.5 25.5395.0 24.5 25.0 24.5 24.5 25.5400.0 24.4 25.0 24.5 24.5 25.5405.0 24.3 25.0 24.5 24.5 25.5410.0 24.5 25.0 24.5 24.5 25.5415.0 24.5 25.0 24.5 24.5 25.5420.0 24.5 25.0 24.5 24.5 25.5425.0 24.5 25.0 24.5 24.5 25.5430.0 24.5 25.0 24.5 24.5 25.5435.0 24.5 25.0 24.5 24.5 25.5440.0 24.5 25.0 24.5 24.5 25.5445.0 24.4 25.0 24.5 24.5 25.5450.0 24.5 25.0 24.5 25.0 25.5455.0 24.4 25.0 24.5 25.0 25.5460.0 24.3 24.5 24.5 24.5 25.0465.0 24.2 24.5 24.5 24.5 25.0470.0 24.2 24.5 24.5 24.5 25.0475.0 24.1 24.5 24.5 24.5 25.0480.0 24.1 24.5 24.5 24.5 24.5485.0 24.1 24.5 24.5 24.5 24.5490.0 24.1 24.5 24.5 24.5 24.5495.0 23.9 24.0 24.5 24.5 24.5

500.0 23.9 24.0 24.5 24.5 24.0505.0 23.8 24.0 24.5 24.5 24.0510.0 23.6 24.0 24.5 24.0 24.0515.0 23.6 23.5 24.5 24.0 23.5520.0 23.6 23.5 24.5 24.0 23.5525.0 23.5 23.5 24.0 24.0 23.5530.0 23.4 23.5 24.0 24.0 23.5535.0 22.2 23.5 23.5 23.5 23.0540.0 23.2 23.0 23.5 23.5 23.0

Timecum UCIL1 (%)
UCIL2 (%)
UCIL6 (%)
UCIL7 (%)
UCIL8 (%)
0.0 86.55.0 86.510.0 85.015.0 73.5 83.520.0 74.5 83.025.0 75.0 82.530.0 76.5 82.035.0 76.5 81.540.0 76.5 81.545.0 77.0 81.050.0 77.0 76.5 81.055.0 76.5 75.5 73.5 80.060.0 77.0 74.5 75.0 79.565.0 77.0 74.5 74.5 79.570.0 77.0 72.5 75.0 79.575.0 77.0 71.5 74.5 79.080.0 76.5 73.0 74.5 79.085.0 76.0 74.0 75.5 78.590.0 75.5 74.5 75.0 77.595.0 76.0 74.0 75.0 78.5
100.0 75.5 74.0 74.5 76.0105.0 75.5 74.0 74.5 75.5110.0 75.0 74.5 74.0 75.0115.0 75.0 74.0 74.0 74.5120.0 75.0 74.0 74.0 74.0125.0 74.0 74.5 74.0 73.5130.0 64.0 74.0 73.5 73.5 73.0135.0 65.0 74.5 73.5 73.5 73.5140.0 64.0 74.5 73.5 73.5 72.5145.0 64.0 73.5 73.5 73.5 71.5150.0 65.0 72.5 73.0 73.5 71.5155.0 66.0 71.5 73.5 73.0 72.0160.0 62.0 70.5 70.5 71.0 70.0165.0 60.0 70.0 71.5 71.0 70.0170.0 58.0 70.0 70.5 70.5 69.0175.0 61.0 68.0 71.5 71.0 69.5180.0 62.0 70.5 70.5 70.5 67.0185.0 60.0 69.0 70.5 70.5 68.0190.0 61.0 68.0 70.5 70.0 67.0195.0 58.0 67.5 69.5 68.5 66.5200.0 56.0 68.0 68.5 67.5 66.5205.0 55.0 67.0 67.5 66.5 68.0210.0 53.0 67.5 66.0 66.5 65.5215.0 55.0 67.0 67.0 66.5 66.0220.0 57.0 66.0 68.0 67.0 63.0225.0 57.0 66.0 68.5 67.5 62.5230.0 56.0 64.5 67.0 67.0 63.0235.0 56.0 65.0 67.5 67.5 63.0240.0 53.0 63.5 67.0 65.5 61.5

245.0 58.0 62.5 67.0 66.0 60.5250.0 52.0 62.5 64.5 63.0 62.5255.0 53.0 62.0 66.0 64.5 64.5260.0 52.0 63.0 65.5 65.0 64.0265.0 58.0 60.5 65.5 64.5 63.5270.0 52.0 62.0 64.0 64.0 64.5275.0 53.0 62.0 66.0 65.0 63.5280.0 54.0 63.0 65.5 65.0 65.0285.0 53.0 63.5 66.0 64.5 63.5290.0 51.0 62.0 66.0 64.0 63.0295.0 51.0 62.5 64.0 63.0 61.5300.0 52.0 61.5 64.5 63.0 62.0305.0 51.0 63.0 64.0 63.0 61.5310.0 52.0 61.5 64.0 63.0 61.5315.0 53.0 60.5 64.5 63.5 61.5320.0 51.0 60.5 63.5 63.5 61.5325.0 52.0 61.0 64.5 64.0 61.0330.0 51.0 60.5 64.5 63.5 58.5335.0 50.0 60.5 64.0 63.0 59.0340.0 48.0 60.0 63.5 62.0 55.0345.0 49.0 61.5 63.0 63.0 57.5350.0 48.0 60.5 62.0 61.5 58.0355.0 47.0 59.5 62.5 61.5 57.0360.0 48.0 61.0 61.0 60.0 58.5365.0 48.0 60.0 61.5 61.0 57.5370.0 46.0 58.5 61.5 61.0 57.0375.0 45.0 58.5 59.5 59.5 58.5380.0 46.0 59.0 60.5 59.0 57.5385.0 46.0 59.0 60.5 59.5 57.5390.0 44.0 58.0 59.5 57.5 58.5395.0 45.0 58.5 60.5 58.5 59.0400.0 47.0 58.5 60.5 59.0 59.0405.0 47.0 58.5 60.0 59.0 60.0410.0 46.0 58.5 61.0 59.0 58.0415.0 48.0 59.5 61.0 59.5 59.0420.0 47.0 59.5 59.5 58.5 59.5425.0 45.0 59.0 59.0 57.5 59.0430.0 48.0 58.5 59.0 58.0 58.5435.0 47.0 59.0 59.5 59.0 59.5440.0 49.0 59.5 62.0 59.5 59.5445.0 48.0 60.5 61.5 59.5 60.0450.0 49.0 59.5 62.0 60.0 59.5455.0 49.0 59.5 60.0 59.0 59.5460.0 50.0 60.5 60.5 59.5 60.0465.0 50.0 61.0 62.0 60.5 60.5470.0 51.0 61.5 62.5 61.0 61.5475.0 50.0 61.5 61.0 59.5 62.0480.0 51.0 61.5 62.0 61.0 62.5485.0 52.0 62.5 63.5 62.0 63.0490.0 52.0 62.5 63.0 62.5 64.0495.0 54.0 63.5 64.0 63.5 63.5

500.0 54.0 63.0 64.0 64.0 63.5505.0 55.0 63.5 65.0 64.0 64.0510.0 54.0 63.5 64.0 63.5 64.5515.0 55.0 64.0 64.0 63.5 64.5520.0 57.0 64.0 65.0 64.5 65.0525.0 56.0 65.0 65.0 65.0 66.0530.0 56.0 65.0 64.5 64.5 66.5535.0 56.0 65.5 65.5 65.0 67.0540.0 57.0 65.5 66.5 66.0 67.0

Timecum UCIL1 degC
UCIL1Hh degC
UCIL2 degC
UCIL2Hh degC
UCIL3 degC
UCIL4 degC
UCIL6 degC
UCIL7 degC
UCIL8 degC
UCIL8_D degC
0.05.010.015.020.025.0 26.030.0 25.035.0 24.540.0 23.545.0 23.050.0 23.055.0 24.0 22.560.0 23.5 24.3 22.065.0 23.5 25.1 22.070.0 23.0 25.8 24.0 22.075.0 23.0 25.7 24.0 22.080.0 23.0 26.7 23.5 22.085.0 23.0 25.5 23.5 25.8 22.090.0 22.5 26.0 23.5 25.6 22.595.0 22.5 26.3 23.5 26.7 22.5100.0 22.5 25.3 23.5 27.3 22.5105.0 22.5 25.2 23.5 28.8 22.5 25.0110.0 22.5 25.3 23.5 29.4 22.5 24.5115.0 23.0 25.8 23.5 29.2 23.0 24.0 24.5120.0 23.0 26.1 23.5 28.9 23.0 24.0 24.0 25.0125.0 23.0 26.3 23.5 28.5 23.0 24.0 23.5 24.5130.0 23.5 26.0 23.5 28.1 23.0 24.0 23.5 24.5135.0 23.5 26.2 23.5 27.6 23.0 24.0 23.5 24.0140.0 24.0 25.0 24.0 27.5 23.5 24.0 23.5 24.0 24.5145.0 24.0 25.3 24.0 27.6 23.5 24.0 23.5 23.5 24.5150.0 24.5 25.5 24.0 27.1 24.0 24.0 23.5 23.5 24.0155.0 24.5 25.7 24.0 27.2 24.0 24.0 23.5 23.5 24.0160.0 24.5 25.4 24.0 27.4 24.0 24.0 23.5 23.5 24.0165.0 24.5 25.5 24.5 28.1 24.5 24.0 23.5 23.5 23.5170.0 24.5 25.3 24.5 29.2 24.5 24.0 23.5 23.5 24.0175.0 24.5 25.6 24.5 29.1 24.5 24.0 24.0 23.5 24.0180.0 24.5 25.7 24.5 30.7 24.5 24.0 24.0 23.5 24.0185.0 24.0 25.6 25.0 29.4 25.0 24.5 24.0 24.0 24.0190.0 24.0 25.7 25.0 28.4 25.0 24.5 24.0 24.0 24.0195.0 24.0 25.7 25.0 28.7 25.0 24.5 24.5 24.0 24.5200.0 24.0 26.0 25.0 28.6 25.0 25.0 24.5 24.5 24.5205.0 24.0 26.0 25.0 29.2 25.5 25.5 25.0 24.5 24.5210.0 24.5 25.1 25.0 30.1 25.5 25.5 25.0 24.5 24.5215.0 24.5 26.1 25.0 29.7 25.5 25.5 25.5 25.0 24.5220.0 24.5 26.2 25.0 29.8 25.5 26.0 26.0 25.0 25.0225.0 24.5 26.4 25.5 30.0 25.5 26.5 26.0 25.0 25.0230.0 24.5 26.6 25.5 31.3 26.0 26.5 26.5 25.0 25.0235.0 24.5 26.4 25.5 31.6 26.0 27.0 26.5 25.5 25.5

240.0 25.0 26.1 25.5 29.8 26.0 27.0 26.5 25.5 25.5245.0 25.0 26.4 25.5 29.5 26.5 27.0 26.5 25.5 25.5 27.0250.0 25.0 26.6 26.0 30.8 26.5 27.5 26.5 25.5 25.5 27.0255.0 25.0 26.5 26.0 31.4 26.5 27.5 26.5 26.0 25.5 27.0260.0 25.0 26.5 26.0 31.4 26.5 27.5 27.0 26.0 26.0 27.0265.0 25.0 26.5 26.0 31.4 27.0 27.5 27.0 26.0 26.0 27.0270.0 25.0 26.6 26.5 31.5 27.0 28.0 27.0 26.5 26.0 27.0275.0 25.5 26.7 26.5 31.5 27.0 28.0 27.0 27.0 26.0 27.0280.0 25.5 26.7 27.0 32.8 27.0 28.5 27.0 27.0 26.0 28.0285.0 25.5 26.8 27.0 32.7 27.0 28.5 27.0 27.5 26.0 28.0290.0 25.5 29.6 27.5 32.5 27.5 28.5 27.5 27.5 26.5 27.0295.0 25.5 29.2 27.5 33.1 27.5 28.5 27.5 27.5 26.5 27.0300.0 25.5 30.4 27.0 32.1 27.5 28.5 27.5 28.0 26.5 28.0305.0 25.5 30.9 27.0 33.0 27.5 28.5 27.0 28.0 26.5 27.0310.0 25.5 31.5 26.5 31.5 27.5 29.0 27.0 28.0 26.5 28.0315.0 25.5 32.2 26.5 32.5 27.5 29.0 27.0 28.0 26.5 27.0320.0 26.0 30.6 26.5 33.6 27.5 29.0 27.5 28.0 27.0 28.0325.0 26.0 30.4 27.0 32.4 28.0 29.5 27.5 28.0 27.0 28.0330.0 26.0 31.4 27.0 31.5 28.0 29.5 27.5 28.0 27.0 28.0335.0 26.0 31.3 27.0 32.1 28.0 29.5 27.5 28.5 27.5 28.0340.0 26.0 31.5 27.0 33.3 28.0 29.5 27.5 28.5 27.5 28.0345.0 26.0 30.4 27.5 32.9 28.0 29.5 27.5 28.5 27.5 28.0350.0 26.0 31.7 27.5 33.7 28.5 29.5 27.5 29.0 27.5 28.0355.0 26.5 33.2 28.0 32.2 28.5 29.5 27.5 29.0 27.5 29.0360.0 26.5 32.2 28.0 33.4 28.5 29.5 27.5 29.0 27.5 29.0365.0 26.5 32.0 28.0 33.1 28.5 29.5 27.5 29.0 27.5 29.0370.0 26.5 30.9 28.0 32.3 28.5 29.5 27.5 29.0 27.5 29.0375.0 26.5 32.8 28.5 32.9 28.0 29.5 27.5 29.0 27.5 29.0380.0 26.5 32.5 28.5 32.5 28.0 29.5 27.5 29.0 27.5 29.0385.0 26.5 31.5 28.5 32.2 28.5 29.5 28.0 29.0 27.5 29.0390.0 26.5 31.8 28.5 32.7 28.5 29.5 28.0 29.0 27.5 29.0395.0 26.5 33.7 28.5 32.7 28.5 29.0 28.0 28.5 27.5 29.0400.0 26.5 31.6 28.5 32.0 28.5 29.0 28.5 29.0 27.5 29.0405.0 26.5 32.8 28.5 31.7 28.5 29.0 28.0 29.0 27.5 29.0410.0 26.5 35.5 29.0 32.5 28.5 29.0 28.0 29.0 27.5 29.0415.0 26.5 34.8 29.0 31.6 28.5 29.0 28.0 29.0 28.0 29.0420.0 27.0 33.9 29.0 32.0 28.5 29.0 28.0 29.0 28.0 29.0425.0 27.0 32.5 29.0 32.5 28.5 29.0 27.5 29.5 28.0 29.0430.0 27.0 33.0 29.0 32.2 28.5 29.0 27.5 29.5 28.0 29.0435.0 27.0 34.9 29.0 32.4 28.5 29.0 27.5 30.0 28.0 29.0440.0 27.0 33.5 29.0 32.3 28.5 29.0 27.5 30.0 28.0 29.0445.0 27.0 34.5 29.0 32.9 28.5 29.0 27.5 30.0 28.0 29.0450.0 27.0 34.2 29.5 31.9 28.5 28.5 27.5 29.5 28.0 29.0455.0 27.0 30.5 29.5 31.3 28.5 28.5 27.5 29.5 28.0 29.0460.0 27.0 30.4 29.5 32.7 28.5 28.5 27.5 29.5 28.0 29.0465.0 27.0 33.2 29.0 32.8 28.5 28.5 27.5 29.5 28.0 29.0470.0 27.0 30.1 29.0 32.9 28.5 28.5 27.5 29.0 28.0 29.0475.0 27.0 32.8 29.0 33.9 28.5 28.5 27.5 29.0 28.0 29.0480.0 27.0 30.2 29.0 33.2 28.5 28.5 27.5 29.0 28.0 29.0485.0 27.0 31.8 29.0 32.9 28.5 28.5 27.5 29.0 28.0 30.0

490.0 27.0 31.6 29.0 32.9 28.5 28.5 27.5 29.0 28.0 29.0495.0 27.0 31.2 29.0 33.5 28.5 28.5 27.5 29.0 28.0 29.0500.0 27.0 30.9 29.0 32.5 28.5 28.5 27.5 29.0 28.0 29.0505.0 27.0 31.5 29.0 33.0 28.5 28.0 27.5 29.0 28.0 29.0510.0 27.0 30.4 29.0 33.5 28.5 28.0 27.5 28.5 28.0 29.0515.0 27.0 30.2 29.0 34.2 28.5 28.0 27.5 28.5 28.0 29.0520.0 27.0 30.5 29.0 33.0 28.5 28.0 27.5 28.5 28.0 29.0525.0 27.0 30.6 29.0 33.3 28.5 28.0 27.5 28.5 28.0 29.0530.0 27.0 30.8 29.0 32.2 28.0 28.0 27.0 28.5 27.5 29.0535.0 27.0 29.3 29.0 32.2 28.0 28.0 27.0 28.0 27.5 28.0540.0 27.0 29.4 29.0 30.9 28.0 28.0 27.0 28.0 27.5 28.0545.0 27.0 29.8 29.0 32.6 28.0 28.0 27.0 28.0 27.5 28.0550.0 27.0 29.5 29.0 32.8 28.0 28.0 27.0 28.0 27.5 28.0555.0 27.0 29.1 29.0 31.3 28.0 28.0 27.0 28.0 27.5 28.0560.0 27.0 29.0 28.5 31.9 28.0 27.5 27.0 28.0 27.5 28.0565.0 27.0 28.9 28.5 32.1 28.0 27.5 27.0 27.5 27.5 28.0570.0 27.0 28.7 28.5 30.2 27.5 27.5 26.5 27.5 27.5 28.0575.0 27.0 28.7 28.5 29.6 27.5 27.5 26.5 27.5 27.5 28.0580.0 27.0 28.5 28.5 29.5 27.5 27.5 26.5 27.5 27.0 27.0585.0 27.0 28.4 28.0 30.1 27.5 27.5 26.5 27.5 27.0 27.0590.0 27.0 28.1 28.0 29.0 27.5 27.5 26.5 27.0 27.0 27.0595.0 27.0 28.2 28.0 28.9 27.0 27.0 26.5 27.0 27.0 27.0600.0 26.5 27.8 27.5 28.4 27.0 27.0 26.0 27.0 27.0 27.0605.0 26.5 27.7 27.5 28.4 27.0 27.0 26.0 27.0 26.5 27.0610.0 26.5 27.5 27.5 27.7 27.0 27.0 26.0 27.0 26.5 27.0615.0 26.5 27.3 27.5 28.2 27.0 27.0 26.0 26.5 26.5 26.0620.0 26.5 27.2 27.0 27.2 27.0 27.0 26.0 26.5 26.5 26.0625.0 26.5 27.1 27.0 27.5 26.5 26.5 25.5 26.5 26.5 26.0

Timecum UCIL1 (%)
UCIL1Hh (%)
UCIL2 (%)
UCIL3 (%)
UCIL4 (%)
UCIL6 (%)
UCIL7 (%)
UCIL8 (%)
UCIL8_D (%)
0.0
5.0
10.0
15.0
20.0
25.0 57.030.0 58.035.0 59.040.0 60.545.0 60.550.0 61.055.0 62.5 62.060.0 62.5 51.0 63.565.0 62.5 48.0 65.570.0 63.5 46.0 59.5 65.075.0 65.0 46.0 60.0 65.580.0 64.5 46.0 60.5 65.585.0 65.5 48.0 61.5 65.590.0 66.5 45.0 61.0 65.595.0 66.5 44.0 61.0 65.5100.0 67.0 48.0 61.5 65.0105.0 67.5 50.0 62.0 65.5 59.0110.0 67.5 50.0 61.5 65.5 59.5115.0 67.0 47.0 63.0 65.0 60.0 60.0120.0 67.0 26.1 63.0 65.0 60.5 61.0 59.0125.0 63.0 26.3 63.0 65.0 61.0 61.5 59.5130.0 63.0 26.0 61.5 64.5 61.5 61.5 60.0135.0 63.0 26.2 61.5 64.0 61.0 62.0 60.0140.0 62.0 25.0 60.5 64.0 61.5 62.5 60.5 60.0145.0 61.0 25.3 59.5 63.5 61.5 60.5 60.5 60.0150.0 61.0 25.5 58.0 62.0 60.5 60.5 60.0 59.0155.0 60.5 25.7 56.0 61.0 60.0 59.5 59.5 59.0160.0 60.5 25.4 58.0 60.5 60.0 60.0 59.5 58.5165.0 59.0 25.5 58.0 59.5 59.5 59.0 60.0 59.5170.0 60.0 25.3 57.5 59.5 59.0 58.0 60.0 59.5175.0 59.5 25.6 57.5 58.0 59.0 57.0 59.5 59.0180.0 58.5 25.7 55.5 58.0 58.5 56.5 60.0 59.0185.0 58.0 41.0 56.0 58.5 59.5 57.0 59.5 58.0190.0 57.0 40.0 55.0 58.5 59.5 56.5 60.5 58.0195.0 54.5 37.0 53.5 58.0 57.5 56.5 61.0 57.0200.0 55.0 36.0 53.0 56.0 56.5 55.0 59.0 54.5205.0 55.5 36.0 52.5 56.0 54.5 55.0 56.5 55.0210.0 56.5 36.0 52.0 54.5 51.0 53.5 57.5 53.5215.0 53.5 36.0 52.5 55.5 52.0 53.0 55.0 54.0220.0 54.5 36.0 54.0 55.0 53.0 54.5 53.0 54.5225.0 55.0 36.0 54.5 54.0 50.5 51.0 53.5 53.0230.0 56.5 37.0 52.5 54.5 51.5 51.5 52.5 53.5235.0 54.5 36.0 53.0 53.5 51.0 52.0 53.5 53.5

240.0 54.5 37.0 52.0 54.0 53.0 49.5 54.0 53.5245.0 54.5 36.0 51.5 54.0 51.0 50.5 53.5 52.5 44.0
250.0 54.5 36.0 53.0 52.5 51.0 51.5 54.5 52.5 44.0
255.0 54.0 36.0 51.5 53.0 49.0 51.5 52.5 52.5 44.0
260.0 52.5 36.0 51.0 52.5 49.0 51.0 53.5 53.5 46.0
265.0 53.0 35.0 48.5 51.5 50.0 49.5 55.0 51.5 42.0
270.0 52.5 35.0 49.0 51.5 49.0 48.0 52.0 50.5 42.0
275.0 51.5 34.0 48.5 51.5 48.5 48.5 50.5 50.5 41.0
280.0 52.5 35.0 47.5 50.5 48.0 47.5 52.0 50.5 42.0
285.0 53.0 35.0 47.5 51.0 47.0 48.5 50.0 50.0 41.0
290.0 53.5 32.0 49.0 50.5 46.0 49.0 48.0 50.5 43.0
295.0 52.0 31.0 47.5 50.0 47.5 49.5 50.0 50.0 42.0
300.0 50.5 29.0 48.0 51.0 46.0 49.5 48.5 49.5 44.0
305.0 51.5 28.0 47.5 51.0 46.0 50.0 48.5 49.5 42.0
310.0 51.5 28.0 53.0 50.5 46.5 49.5 48.0 48.5 42.0
315.0 51.0 27.0 48.0 49.0 44.0 50.0 47.5 47.5 42.0
320.0 51.0 28.0 47.5 50.0 46.0 48.5 49.5 48.5 42.0
325.0 50.5 28.0 48.0 50.0 46.0 51.0 48.0 49.5 41.0
330.0 50.5 28.0 48.0 48.0 43.0 46.5 47.0 48.0 40.0
335.0 50.0 28.0 48.0 48.5 44.5 49.0 47.0 49.0 40.0
340.0 49.5 27.0 50.0 48.5 45.0 49.0 48.0 47.5 41.0
345.0 48.5 28.0 47.0 48.5 44.5 47.0 46.0 47.0 40.0
350.0 48.5 27.0 46.5 47.5 42.5 47.0 47.0 47.0 39.0
355.0 49.5 25.0 44.5 48.0 43.0 46.5 45.0 46.5 39.0
360.0 48.0 25.0 45.5 47.0 42.5 45.5 45.0 46.5 38.0
365.0 47.5 25.0 45.5 47.0 41.5 44.5 42.0 45.0 36.0
370.0 48.0 26.0 42.5 44.5 41.5 45.5 43.0 45.0 36.0
375.0 48.5 26.0 43.0 45.5 40.5 44.0 42.5 45.0 38.0
380.0 48.5 25.0 43.0 44.5 40.5 43.5 43.0 43.5 36.0
385.0 48.5 26.0 42.5 44.5 41.0 44.0 43.5 45.0 36.0
390.0 48.5 26.0 43.0 45.5 41.5 44.5 44.0 45.0 38.0
395.0 47.5 23.0 42.5 44.5 42.5 44.5 45.5 46.0 37.0
400.0 45.5 25.0 42.5 43.0 41.5 43.5 42.5 43.5 36.0
405.0 45.5 24.0 41.5 43.5 41.5 44.5 43.5 44.0 35.0
410.0 45.5 22.0 42.5 43.5 41.5 43.5 44.5 43.5 36.0
415.0 48.0 22.0 41.5 44.5 41.5 44.0 42.5 43.5 36.0
420.0 47.5 22.0 43.0 45.5 42.5 45.5 44.0 45.5 37.0
425.0 47.5 24.0 42.5 44.5 42.0 44.5 45.0 45.0 36.0
430.0 47.5 23.0 42.5 46.0 42.5 44.0 45.0 43.5 36.0
435.0 47.5 22.0 42.0 44.5 42.5 44.5 44.0 44.5 37.0
440.0 48.0 23.0 43.0 46.0 42.5 45.5 43.0 44.5 38.0
445.0 48.5 23.0 42.5 46.0 43.5 45.5 44.0 44.5 38.0
450.0 47.5 22.0 43.5 46.0 42.5 48.0 43.0 44.5 38.0
455.0 48.0 26.0 42.5 46.0 43.5 45.5 45.0 44.5 38.0
460.0 47.5 26.0 42.5 46.0 43.5 45.5 42.5 45.5 38.0
465.0 46.5 23.0 42.0 46.0 43.5 45.0 43.5 45.0 37.0
470.0 47.0 25.0 41.5 45.0 43.5 44.5 43.0 45.5 37.0
475.0 46.5 24.0 41.5 45.0 43.0 44.5 43.5 45.0 37.0
480.0 46.5 26.0 42.0 45.0 43.5 45.5 45.0 45.5 37.0
485.0 47.5 25.0 42.5 45.0 44.0 45.5 45.5 44.5 36.0

490.0 46.5 25.0 42.5 44.0 43.5 45.5 45.0 44.5 36.0
495.0 45.5 25.0 41.5 45.0 43.0 45.5 43.5 44.5 37.0
500.0 47.5 25.0 41.0 44.5 43.0 46.5 43.5 43.5 37.0
505.0 46.5 25.0 41.5 45.0 44.5 44.5 43.5 44.0 37.0
510.0 47.0 26.0 42.0 44.5 43.5 45.5 43.0 45.0 38.0
515.0 47.0 26.0 42.0 44.5 44.5 45.5 44.5 44.5 38.0
520.0 45.5 25.0 41.5 45.0 44.0 45.5 44.5 44.0 38.0
525.0 46.5 26.0 42.0 45.0 44.5 45.5 45.0 44.5 39.0
530.0 46.5 26.0 41.5 45.5 44.0 45.0 44.0 44.5 37.0
535.0 46.0 27.0 41.0 45.0 44.5 45.0 44.5 44.5 38.0
540.0 45.5 27.0 41.0 45.5 44.5 45.5 45.0 44.0 38.0
545.0 46.5 27.0 41.5 45.5 44.5 46.0 44.5 44.5 38.0
550.0 46.0 27.0 42.5 45.5 44.5 47.0 45.5 45.5 40.0
555.0 46.5 27.0 41.5 45.5 44.5 48.0 45.5 44.5 39.0
560.0 47.0 27.0 41.0 45.5 44.5 47.0 46.0 45.0 39.0
565.0 47.0 28.0 41.5 46.0 45.0 46.5 46.5 45.5 39.0
570.0 46.5 28.0 42.5 46.5 44.5 46.5 45.5 45.5 39.0
575.0 47.0 29.0 42.5 46.5 44.5 47.5 46.0 45.5 40.0
580.0 47.0 29.0 42.5 46.5 45.0 47.5 46.5 45.5 41.0
585.0 47.5 29.0 43.5 46.5 44.5 48.0 46.5 46.0 40.0
590.0 48.5 30.0 42.5 46.5 45.0 48.0 46.5 46.5 42.0
595.0 47.5 29.0 43.5 46.5 45.0 48.5 46.0 46.5 42.0
600.0 47.5 30.0 44.5 46.5 45.5 48.5 46.0 46.5 43.0
605.0 48.0 30.0 43.5 47.0 45.5 48.5 47.5 46.5 44.0
610.0 47.5 30.0 46.5 47.5 45.5 49.0 48.0 47.0 44.0
615.0 47.0 30.0 45.5 47.5 45.5 50.0 48.5 47.5 45.0
620.0 47.0 31.0 45.5 47.5 47.0 50.0 49.5 47.5 45.0
625.0 48.0 31.0 45.5 47.5 47.0 51.5 49.5 48.0 46.0

Date Time BMD_T (degC) BMD_RH (%) UCIL8_T (degC) UCIL8_RH(%)
12‐Dec‐16 12:00 PM 26.8 38 29 62.5
12‐Dec‐16 3:00 PM 27 38 27 51.5
12‐Dec‐16 6:00 PM 22.6 57 22.5 64.5
12‐Dec‐16 9:00 PM 20.9 66 21 71
13‐Dec‐16 12:00 AM 19.4 75 19.5 78
13‐Dec‐16 3:00 AM 18 82 18 83.5
13‐Dec‐16 6:00 AM 16.1 90 16 88.5
13‐Dec‐16 9:00 AM 19.5 73 19.5 79.5
13‐Dec‐16 12:00 PM 24.3 49 24.5 61.5
13‐Dec‐16 3:00 PM 25.3 46 25.5 59.5
13‐Dec‐16 6:00 PM 22 62 21.5 72.5
13‐Dec‐16 9:00 PM 19.6 74 19.5 81
14‐Dec‐16 12:00 AM 18 78 18 84
14‐Dec‐16 3:00 AM 17.4 85 16.5 85.5
14‐Dec‐16 6:00 AM 15.6 89 15.5 88
14‐Dec‐16 9:00 AM 18.4 78 18.5 78.5

Appendix G: Data from the Simulation and modeling
Simulated data_Dhanmondi Lake

Timecum UCIL8 degC
UCIL7 degC
UCIL6 degC
UCIL5 degC
UCIL4 degC
UCIL3 degC
UCIL2 degC
UCIL2_a degC
UCIL2_b degC
0.00 23.20 23.20 23.20 23.20 23.20 23.20 23.20 23.20 23.205.00 26.83 25.26 26.71 27.69 26.11 27.51 28.52 28.92 29.0410.00 28.09 27.05 27.84 28.59 27.86 28.46 29.06 29.38 29.4615.00 28.67 27.72 28.30 28.84 28.42 28.77 29.14 29.42 29.4920.00 29.22 28.18 28.73 29.09 28.82 29.04 29.21 29.44 29.4825.00 29.71 28.58 29.12 29.29 29.17 29.31 29.27 29.48 29.5130.00 30.18 28.97 29.50 29.49 29.52 29.56 29.33 29.51 29.5335.00 30.62 29.34 29.86 29.68 29.85 29.80 29.40 29.54 29.5440.00 31.05 29.71 30.22 29.87 30.18 30.04 29.46 29.57 29.5545.00 31.46 30.07 30.56 30.06 30.50 30.27 29.53 29.60 29.5750.00 31.85 30.43 30.90 30.24 30.81 30.50 29.59 29.63 29.5855.00 32.23 30.77 31.23 30.42 31.12 30.72 29.66 29.66 29.5960.00 32.61 31.11 31.55 30.58 31.42 30.94 29.73 29.70 29.6165.00 32.92 31.44 31.87 30.80 31.71 31.15 29.79 29.73 29.6270.00 33.35 31.76 32.10 30.79 32.00 31.38 29.90 29.76 29.6375.00 33.63 32.08 32.44 31.09 32.27 31.56 29.94 29.79 29.6580.00 33.96 32.39 32.74 31.27 32.54 31.76 30.01 29.82 29.6685.00 34.26 32.68 33.02 31.43 32.81 31.96 30.09 29.85 29.6790.00 34.56 32.97 33.29 31.60 33.07 32.16 30.17 29.88 29.6895.00 34.85 33.26 33.56 31.76 33.32 32.35 30.24 29.91 29.70100.00 35.13 33.54 33.82 31.91 33.56 32.54 30.32 29.94 29.71105.00 35.41 33.81 34.07 32.07 33.80 32.73 30.40 29.97 29.72110.00 35.67 34.07 34.32 32.22 34.04 32.91 30.47 30.00 29.73115.00 35.93 34.33 34.56 32.37 34.26 33.09 30.54 30.03 29.75120.00 36.18 34.59 34.79 32.51 34.49 33.26 30.61 30.06 29.76125.00 36.41 34.83 35.01 32.66 34.71 33.44 30.69 30.09 29.77130.00 36.64 35.08 35.23 32.80 34.92 33.61 30.76 30.12 29.78135.00 36.86 35.31 35.44 32.94 35.13 33.77 30.83 30.15 29.80140.00 37.07 35.55 35.65 33.07 35.33 33.93 30.90 30.18 29.81145.00 37.28 35.77 35.85 33.20 35.53 34.09 30.97 30.21 29.82150.00 37.47 35.99 36.04 33.33 35.73 34.25 31.04 30.23 29.83155.00 37.66 36.21 36.22 33.46 35.91 34.39 31.11 30.26 29.85160.00 37.84 36.42 36.40 33.58 36.10 34.54 31.18 30.29 29.86165.00 38.00 36.63 36.57 33.71 36.28 34.68 31.24 30.32 29.87170.00 38.16 36.83 36.73 33.82 36.45 34.82 31.31 30.35 29.88175.00 38.31 37.02 36.88 33.93 36.62 34.95 31.37 30.37 29.89180.00 38.46 37.20 37.03 34.04 36.78 35.08 31.44 30.40 29.90185.00 38.59 37.38 37.17 34.15 36.94 35.20 31.50 30.43 29.92190.00 38.72 37.56 37.31 34.25 37.09 35.32 31.57 30.45 29.93195.00 38.85 37.73 37.44 34.36 37.24 35.44 31.63 30.48 29.94200.00 38.96 37.89 37.57 34.46 37.39 35.55 31.69 30.50 29.95205.00 39.06 38.05 37.68 34.56 37.53 35.67 31.75 30.53 29.96210.00 39.16 38.21 37.78 34.66 37.67 35.78 31.81 30.55 29.97215.00 39.24 38.36 37.87 34.75 37.80 35.88 31.87 30.58 29.98220.00 39.32 38.50 37.95 34.84 37.93 35.99 31.92 30.60 29.99225.00 39.40 38.64 38.02 34.93 38.06 36.09 31.98 30.62 30.00230.00 39.47 38.78 38.09 35.01 38.18 36.18 32.03 30.65 30.01235.00 39.55 38.90 38.16 35.09 38.30 36.28 32.09 30.67 30.02

240.00 39.61 39.02 38.23 35.18 38.42 36.37 32.14 30.69 30.02245.00 39.68 39.14 38.29 35.25 38.53 36.45 32.19 30.71 30.03250.00 39.73 39.25 38.35 35.33 38.63 36.54 32.24 30.73 30.04255.00 39.78 39.35 38.40 35.40 38.73 36.62 32.29 30.75 30.05260.00 39.83 39.45 38.45 35.47 38.83 36.69 32.33 30.77 30.06265.00 39.87 39.54 38.49 35.54 38.92 36.76 32.38 30.79 30.07270.00 39.92 39.63 38.52 35.60 39.01 36.83 32.42 30.81 30.07275.00 39.95 39.72 38.56 35.66 39.09 36.89 32.47 30.82 30.08280.00 39.98 39.80 38.58 35.71 39.17 36.95 32.51 30.84 30.09285.00 40.00 39.87 38.60 35.77 39.25 37.00 32.55 30.86 30.09290.00 40.02 39.95 38.61 35.82 39.32 37.05 32.59 30.87 30.10295.00 40.03 40.01 38.63 35.86 39.38 37.10 32.62 30.89 30.11300.00 40.03 40.08 38.63 35.91 39.44 37.14 32.66 30.90 30.11305.00 40.02 40.13 38.64 35.95 39.50 37.17 32.69 30.92 30.12310.00 40.02 40.18 38.64 35.99 39.55 37.21 32.72 30.93 30.12315.00 40.00 40.23 38.63 36.03 39.59 37.24 32.76 30.94 30.13320.00 39.98 40.27 38.62 36.05 39.64 37.26 32.78 30.95 30.13325.00 39.95 40.31 38.61 36.08 39.67 37.29 32.81 30.96 30.14330.00 39.92 40.35 38.60 36.11 39.71 37.30 32.84 30.97 30.14335.00 39.89 40.38 38.58 36.13 39.73 37.32 32.86 30.98 30.15340.00 39.83 40.40 38.56 36.15 39.76 37.33 32.89 30.99 30.15345.00 39.77 40.42 38.53 36.16 39.77 37.33 32.91 31.00 30.15350.00 39.71 40.43 38.50 36.17 39.79 37.33 32.93 31.01 30.16355.00 39.64 40.44 38.47 36.18 39.79 37.33 32.94 31.02 30.16360.00 39.57 40.44 38.43 36.19 39.80 37.33 32.96 31.02 30.16365.00 39.50 40.44 38.39 36.19 39.80 37.33 32.97 31.03 30.17370.00 39.42 40.43 38.35 36.19 39.79 37.32 32.99 31.03 30.17375.00 39.34 40.42 38.30 36.19 39.78 37.30 33.00 31.04 30.17380.00 39.26 40.41 38.26 36.18 39.77 37.29 33.01 31.04 30.17385.00 39.17 40.39 38.20 36.17 39.75 37.27 33.01 31.04 30.17390.00 39.08 40.36 38.15 36.15 39.72 37.25 33.02 31.05 30.17395.00 38.98 40.33 38.09 36.13 39.70 37.22 33.02 31.05 30.17400.00 38.88 40.30 38.03 36.11 39.66 37.19 33.03 31.05 30.17405.00 38.78 40.26 37.96 36.08 39.63 37.16 33.03 31.05 30.17410.00 38.68 40.21 37.89 36.05 39.59 37.13 33.03 31.05 30.17415.00 38.57 40.17 37.82 36.01 39.54 37.09 33.02 31.04 30.17420.00 38.46 40.11 37.74 35.97 39.49 37.05 33.02 31.04 30.17

TimecumUCIL8
(%)UCIL7
(%)UCIL6
(%)UCIL5
(%) UCIL4
(%)UCIL3
(%)UCIL2
(%)UCIL2_a
(%)UCIL2_b
(%)0.00 42.60 42.62 42.62 42.62 42.61 42.69 42.57 42.62 42.625.00 65.89 46.52 66.58 63.67 45.21 69.65 52.08 37.66 33.2110.00 65.06 47.19 65.67 62.75 45.25 68.64 51.51 37.03 32.5715.00 63.75 46.95 64.62 62.44 45.10 68.25 51.66 37.06 32.5620.00 62.40 46.28 63.68 62.08 44.50 67.79 51.72 37.10 32.6025.00 61.18 45.54 62.82 61.81 43.97 67.35 51.77 37.10 32.5730.00 60.09 44.77 62.05 61.59 43.23 66.98 51.83 37.12 32.5735.00 59.14 43.98 61.33 61.43 42.52 66.67 51.88 37.14 32.5840.00 58.19 43.29 60.63 61.22 42.09 66.38 51.95 37.16 32.5845.00 57.33 42.66 59.99 61.06 41.52 66.10 52.02 37.17 32.5950.00 56.60 41.94 59.42 60.94 40.78 65.85 52.08 37.20 32.5955.00 55.88 41.29 58.86 60.80 40.30 65.62 52.16 37.21 32.6060.00 55.21 40.79 58.37 60.73 40.00 65.43 52.23 37.24 32.6165.00 54.66 40.22 57.89 60.52 39.38 65.22 52.31 37.26 32.6170.00 54.22 39.61 57.76 61.11 38.77 65.04 52.29 37.29 32.6375.00 53.50 39.19 57.06 60.44 38.64 64.92 52.42 37.31 32.6380.00 52.94 38.81 56.62 60.31 38.43 64.79 52.47 37.34 32.6585.00 52.51 38.40 56.26 60.24 38.07 64.66 52.53 37.37 32.6690.00 52.10 37.98 55.92 60.19 37.72 64.55 52.58 37.40 32.6795.00 51.71 37.58 55.61 60.13 37.41 64.45 52.64 37.43 32.68100.00 51.35 37.17 55.32 60.09 37.02 64.36 52.70 37.46 32.69105.00 50.99 36.79 55.04 60.06 36.68 64.28 52.76 37.49 32.70110.00 50.67 36.45 54.79 60.03 36.46 64.22 52.83 37.52 32.72115.00 50.38 36.10 54.56 60.02 36.15 64.16 52.90 37.56 32.73120.00 50.13 35.73 54.36 60.02 35.76 64.12 52.98 37.59 32.74125.00 49.87 35.41 54.16 60.01 35.52 64.09 53.05 37.62 32.75130.00 49.66 35.13 54.00 60.01 35.35 64.07 53.13 37.66 32.77135.00 49.47 34.87 53.85 60.03 35.08 64.07 53.21 37.69 32.78140.00 49.30 34.62 53.71 60.05 34.88 64.07 53.29 37.73 32.79145.00 49.19 34.39 53.60 60.09 34.81 64.07 53.37 37.76 32.81150.00 49.05 34.14 53.50 60.13 34.60 64.09 53.45 37.80 32.82155.00 48.90 33.88 53.42 60.16 34.26 64.13 53.53 37.83 32.83160.00 48.86 33.66 53.35 60.22 34.20 64.16 53.61 37.87 32.85165.00 48.81 33.50 53.30 60.27 34.06 64.21 53.69 37.91 32.86170.00 48.74 33.28 53.28 60.34 33.83 64.27 53.78 37.94 32.88175.00 48.74 33.12 53.27 60.42 33.78 64.35 53.86 37.98 32.89180.00 48.73 32.97 53.28 60.49 33.73 64.44 53.95 38.02 32.90185.00 48.74 32.81 53.29 60.58 33.55 64.52 54.03 38.06 32.92190.00 48.78 32.67 53.31 60.67 33.46 64.61 54.12 38.09 32.93195.00 48.79 32.54 53.34 60.75 33.44 64.71 54.21 38.13 32.95200.00 48.80 32.38 53.38 60.84 33.22 64.80 54.29 38.17 32.96205.00 48.90 32.18 53.45 60.94 32.94 64.89 54.38 38.21 32.98210.00 48.99 32.06 53.55 61.02 32.93 64.99 54.47 38.25 32.99215.00 49.06 31.95 53.68 61.11 32.82 65.10 54.55 38.28 33.01220.00 49.22 31.81 53.84 61.23 32.61 65.20 54.64 38.32 33.02225.00 49.34 31.70 53.99 61.32 32.62 65.31 54.72 38.36 33.04230.00 49.40 31.61 54.14 61.40 32.59 65.42 54.81 38.40 33.05235.00 49.54 31.48 54.30 61.53 32.32 65.53 54.89 38.43 33.07

240.00 49.69 31.43 54.46 61.62 32.40 65.64 54.97 38.47 33.08245.00 49.83 31.42 54.61 61.72 32.41 65.75 55.05 38.51 33.10250.00 50.01 31.34 54.78 61.83 32.26 65.86 55.13 38.54 33.11255.00 50.13 31.33 54.94 61.92 32.35 65.98 55.21 38.58 33.12260.00 50.25 31.29 55.12 62.04 32.26 66.10 55.29 38.61 33.14265.00 50.43 31.16 55.31 62.15 32.01 66.23 55.37 38.65 33.15270.00 50.54 31.09 55.50 62.24 32.01 66.36 55.44 38.68 33.16275.00 50.70 31.10 55.69 62.35 32.08 66.49 55.51 38.71 33.18280.00 50.90 31.05 55.90 62.47 31.99 66.63 55.58 38.74 33.19285.00 51.06 31.05 56.11 62.56 32.05 66.76 55.65 38.78 33.20290.00 51.20 31.09 56.31 62.66 32.21 66.90 55.72 38.81 33.21295.00 51.45 31.07 56.54 62.79 32.12 67.03 55.78 38.83 33.22300.00 51.68 30.96 56.76 62.88 31.87 67.17 55.85 38.86 33.24305.00 51.81 30.95 56.96 62.96 31.93 67.32 55.91 38.89 33.25310.00 52.02 31.00 57.17 63.09 32.09 67.46 55.97 38.92 33.26315.00 52.28 31.01 57.39 63.18 32.05 67.60 56.02 38.94 33.27320.00 52.56 31.05 57.63 63.29 32.12 67.74 56.08 38.97 33.28325.00 52.80 31.08 57.86 63.40 32.15 67.89 56.13 38.99 33.28330.00 53.03 31.10 58.08 63.50 32.17 68.03 56.18 39.01 33.29335.00 53.31 31.15 58.30 63.62 32.30 68.18 56.22 39.03 33.30340.00 53.57 31.17 58.52 63.71 32.32 68.32 56.27 39.05 33.31345.00 53.87 31.18 58.74 63.81 32.30 68.47 56.31 39.07 33.32350.00 54.20 31.21 58.96 63.92 32.39 68.61 56.35 39.09 33.32355.00 54.48 31.22 59.18 64.00 32.40 68.74 56.38 39.10 33.33360.00 54.71 31.21 59.39 64.09 32.24 68.88 56.42 39.12 33.33365.00 55.03 31.21 59.61 64.20 32.23 69.00 56.45 39.13 33.34370.00 55.39 31.23 59.83 64.30 32.39 69.13 56.47 39.14 33.34375.00 55.62 31.27 60.03 64.36 32.37 69.25 56.50 39.15 33.35380.00 55.97 31.34 60.24 64.47 32.43 69.37 56.52 39.16 33.35385.00 56.27 31.44 60.45 64.55 32.56 69.48 56.54 39.17 33.35390.00 56.60 31.53 60.66 64.65 32.64 69.60 56.55 39.17 33.35395.00 56.92 31.60 60.87 64.74 32.74 69.71 56.56 39.18 33.36400.00 57.21 31.67 61.07 64.83 32.78 69.81 56.57 39.18 33.36405.00 57.54 31.73 61.27 64.93 32.77 69.91 56.58 39.18 33.36410.00 57.83 31.77 61.47 65.02 32.87 70.01 56.58 39.18 33.36415.00 58.08 31.85 61.66 65.10 32.97 70.10 56.58 39.18 33.36420.00 58.40 31.96 61.86 65.21 33.08 70.19 56.58 39.18 33.35

Timecum UCIL8
degC
UCIL7
degC
UCIL6
degC
UCIL5
degC
UCIL4
degC
UCIL3
degC
UCIL2
degC
UCIL2_a
degC
UCIL2_b
degC
0.00 23.20 23.20 23.20 23.20 23.20 23.20 23.20 23.20 23.20
5.00 23.72 23.51 23.62 23.40 23.50 23.47 23.25 23.22 23.21
10.00 24.28 23.96 24.08 23.63 23.90 23.76 23.32 23.25 23.22
15.00 24.81 24.39 24.51 23.86 24.29 24.05 23.39 23.28 23.23
20.00 25.32 24.81 24.93 24.08 24.67 24.32 23.46 23.31 23.25
25.00 25.81 25.22 25.34 24.29 25.04 24.59 23.53 23.34 23.26
30.00 26.28 25.62 25.73 24.50 25.39 24.85 23.60 23.37 23.27
35.00 26.74 26.00 26.11 24.70 25.74 25.11 23.67 23.40 23.29
40.00 27.17 26.37 26.47 24.90 26.07 25.35 23.74 23.43 23.30
45.00 27.60 26.74 26.82 25.10 26.39 25.60 23.82 23.46 23.31
50.00 28.00 27.09 27.17 25.29 26.71 25.83 23.89 23.49 23.33
55.00 28.40 27.43 27.50 25.48 27.01 26.06 23.96 23.53 23.34
60.00 28.77 27.77 27.82 25.67 27.31 26.29 24.04 23.56 23.35
65.00 29.14 28.10 28.14 25.85 27.60 26.51 24.11 23.59 23.37
70.00 29.49 28.42 28.45 26.03 27.88 26.73 24.19 23.62 23.38
75.00 29.83 28.73 28.74 26.21 28.16 26.94 24.26 23.65 23.39
80.00 30.16 29.03 29.04 26.38 28.42 27.15 24.34 23.68 23.41
85.00 30.48 29.33 29.32 26.55 28.69 27.36 24.41 23.72 23.42
90.00 30.78 29.62 29.60 26.72 28.95 27.56 24.49 23.75 23.43
95.00 31.08 29.90 29.87 26.89 29.20 27.76 24.56 23.78 23.45
100.00 31.36 30.18 30.13 27.05 29.44 27.95 24.64 23.81 23.46
105.00 31.64 30.44 30.39 27.21 29.68 28.14 24.72 23.84 23.47
110.00 31.91 30.71 30.63 27.36 29.91 28.32 24.79 23.88 23.49
115.00 32.16 30.97 30.88 27.52 30.14 28.51 24.87 23.91 23.50
120.00 32.41 31.22 31.11 27.67 30.37 28.68 24.94 23.94 23.51
125.00 32.65 31.46 31.34 27.82 30.58 28.86 25.01 23.97 23.53
130.00 32.88 31.71 31.56 27.96 30.79 29.03 25.09 24.00 23.54
135.00 33.11 31.94 31.77 28.11 31.00 29.20 25.16 24.03 23.55
140.00 33.32 32.17 31.98 28.25 31.20 29.36 25.24 24.06 23.57
145.00 33.52 32.39 32.18 28.38 31.40 29.52 25.31 24.09 23.58
150.00 33.72 32.61 32.37 28.52 31.59 29.68 25.38 24.12 23.59
155.00 33.91 32.83 32.56 28.65 31.78 29.84 25.45 24.15 23.60
160.00 34.09 33.04 32.73 28.77 31.97 29.98 25.52 24.18 23.62
165.00 34.26 33.24 32.91 28.90 32.15 30.13 25.59 24.21 23.63
170.00 34.42 33.44 33.07 29.02 32.32 30.27 25.66 24.24 23.64
175.00 34.58 33.62 33.23 29.14 32.49 30.41 25.73 24.27 23.65
180.00 34.73 33.81 33.37 29.25 32.65 30.53 25.80 24.30 23.66
185.00 34.87 33.98 33.52 29.36 32.81 30.66 25.87 24.32 23.68
190.00 35.00 34.16 33.66 29.47 32.96 30.79 25.93 24.35 23.69
195.00 35.13 34.33 33.79 29.57 33.11 30.91 26.00 24.38 23.70
200.00 35.26 34.49 33.92 29.68 33.25 31.03 26.06 24.41 23.71
205.00 35.37 34.65 34.05 29.78 33.40 31.14 26.13 24.43 23.72
210.00 35.47 34.81 34.15 29.88 33.53 31.26 26.19 24.46 23.73
215.00 35.56 34.95 34.24 29.98 33.67 31.37 26.25 24.48 23.74
220.00 35.65 35.10 34.33 30.08 33.80 31.48 26.31 24.51 23.75
225.00 35.73 35.24 34.40 30.17 33.93 31.58 26.37 24.53 23.76
230.00 35.81 35.37 34.47 30.26 34.05 31.68 26.43 24.56 23.77
235.00 35.88 35.50 34.55 30.34 34.17 31.78 26.49 24.58 23.78

240.00 35.95 35.63 34.62 30.43 34.28 31.88 26.54 24.60 23.79
245.00 35.99 35.74 34.68 30.51 34.40 31.97 26.60 24.63 23.80
250.00 36.05 35.85 34.75 30.59 34.50 32.06 26.65 24.65 23.81
255.00 36.12 35.96 34.81 30.67 34.61 32.14 26.70 24.67 23.82
260.00 36.17 36.06 34.85 30.74 34.71 32.22 26.75 24.69 23.83
265.00 36.22 36.16 34.90 30.81 34.80 32.29 26.80 24.71 23.84
270.00 36.26 36.25 34.94 30.87 34.89 32.36 26.85 24.73 23.85
275.00 36.29 36.33 34.97 30.94 34.97 32.43 26.90 24.75 23.85
280.00 36.32 36.41 35.00 31.00 35.06 32.49 26.94 24.77 23.86
285.00 36.35 36.49 35.02 31.05 35.13 32.55 26.99 24.78 23.87
290.00 36.37 36.57 35.04 31.11 35.20 32.60 27.03 24.80 23.88
295.00 36.38 36.64 35.05 31.16 35.27 32.65 27.07 24.82 23.88
300.00 36.39 36.70 35.06 31.21 35.33 32.70 27.11 24.83 23.89
305.00 36.39 36.76 35.07 31.25 35.39 32.74 27.15 24.85 23.90
310.00 36.39 36.81 35.07 31.30 35.44 32.78 27.18 24.86 23.90
315.00 36.38 36.86 35.07 31.34 35.49 32.81 27.22 24.88 23.91
320.00 36.37 36.90 35.06 31.37 35.54 32.84 27.25 24.89 23.91
325.00 36.34 36.94 35.05 31.40 35.58 32.87 27.28 24.90 23.92
330.00 36.31 36.97 35.04 31.43 35.61 32.89 27.31 24.92 23.92
335.00 36.28 37.00 35.02 31.46 35.64 32.91 27.34 24.93 23.93
340.00 36.23 37.03 35.00 31.48 35.67 32.93 27.36 24.94 23.93
345.00 36.17 37.05 34.98 31.50 35.69 32.94 27.39 24.95 23.94
350.00 36.12 37.06 34.95 31.52 35.70 32.94 27.41 24.96 23.94
355.00 36.05 37.08 34.92 31.53 35.71 32.95 27.43 24.96 23.94
360.00 35.99 37.08 34.88 31.54 35.72 32.95 27.45 24.97 23.95
365.00 35.92 37.08 34.84 31.54 35.72 32.95 27.47 24.98 23.95
370.00 35.84 37.08 34.80 31.55 35.71 32.94 27.49 24.99 23.95
375.00 35.77 37.07 34.76 31.55 35.71 32.93 27.50 24.99 23.95
380.00 35.69 37.05 34.71 31.54 35.69 32.92 27.51 25.00 23.96
385.00 35.60 37.04 34.66 31.53 35.68 32.90 27.53 25.00 23.96
390.00 35.51 37.01 34.61 31.52 35.66 32.88 27.53 25.00 23.96
395.00 35.42 36.99 34.55 31.51 35.63 32.86 27.54 25.01 23.96
400.00 35.32 36.95 34.49 31.49 35.60 32.84 27.55 25.01 23.96
405.00 35.21 36.92 34.42 31.46 35.57 32.81 27.55 25.01 23.96
410.00 35.11 36.88 34.36 31.44 35.53 32.78 27.55 25.01 23.96
415.00 35.01 36.83 34.29 31.40 35.48 32.74 27.55 25.01 23.96
420.00 34.90 36.78 34.21 31.37 35.43 32.71 27.55 25.01 23.96

Timecum UCIL8 (%)
UCIL7 (%)
UCIL6 (%)
UCIL5 (%)
UCIL4 (%)
UCIL3 (%)
UCIL2 (%)
UCIL2_a (%)
UCIL2_b (%)
0.00 42.60 42.62 42.62 42.62 42.61 42.69 42.57 42.62 42.625.00 68.33 50.48 68.34 69.46 50.68 74.90 60.95 48.64 44.7810.00 67.12 51.59 67.10 69.02 51.38 74.24 60.97 48.64 44.7815.00 65.67 50.76 65.98 68.62 50.70 73.65 60.99 48.64 44.7820.00 64.20 49.79 64.93 68.25 49.86 73.09 61.00 48.65 44.7825.00 62.92 48.86 63.98 67.91 49.05 72.59 61.03 48.65 44.7830.00 61.75 47.94 63.12 67.60 48.20 72.14 61.06 48.66 44.7835.00 60.64 47.08 62.30 67.32 47.46 71.72 61.09 48.67 44.7840.00 59.63 46.27 61.55 67.06 46.76 71.34 61.12 48.68 44.7845.00 58.69 45.52 60.88 66.83 46.09 70.99 61.16 48.69 44.7850.00 57.83 44.83 60.23 66.59 45.52 70.67 61.20 48.70 44.7955.00 57.04 44.18 59.65 66.41 44.95 70.38 61.24 48.71 44.7960.00 56.31 43.53 59.09 66.24 44.39 70.11 61.29 48.73 44.7965.00 55.65 42.88 58.58 66.06 43.81 69.87 61.34 48.74 44.7970.00 55.03 42.35 58.12 65.93 43.37 69.66 61.39 48.76 44.8075.00 54.45 41.79 57.67 65.81 42.89 69.46 61.44 48.77 44.8080.00 53.90 41.28 57.26 65.66 42.42 69.31 61.50 48.79 44.8185.00 53.43 40.83 56.88 65.58 42.06 69.13 61.56 48.81 44.8190.00 52.97 40.34 56.53 65.52 41.57 68.99 61.62 48.83 44.8295.00 52.56 39.87 56.19 65.45 41.17 68.87 61.68 48.85 44.83100.00 52.18 39.47 55.90 65.36 40.92 68.76 61.74 48.88 44.83105.00 51.81 39.09 55.61 65.31 40.55 68.67 61.81 48.90 44.84110.00 51.52 38.73 55.36 65.28 40.22 68.60 61.88 48.93 44.85115.00 51.23 38.38 55.13 65.24 39.99 68.54 61.95 48.95 44.86120.00 50.97 38.07 54.92 65.22 39.71 68.49 62.02 48.98 44.87125.00 50.73 37.73 54.73 65.21 39.43 68.46 62.10 49.01 44.87130.00 50.52 37.42 54.56 65.21 39.16 68.44 62.17 49.03 44.88135.00 50.32 37.12 54.42 65.22 38.89 68.42 62.25 49.06 44.89140.00 50.16 36.79 54.29 65.23 38.62 68.42 62.32 49.09 44.90145.00 49.99 36.49 54.16 65.26 38.33 68.42 62.40 49.12 44.91150.00 49.89 36.26 54.08 65.29 38.19 68.44 62.48 49.15 44.92155.00 49.79 36.00 54.01 65.34 37.97 68.47 62.56 49.19 44.94160.00 49.69 35.76 53.94 65.39 37.70 68.51 62.65 49.22 44.95165.00 49.64 35.51 53.90 65.44 37.55 68.55 62.73 49.25 44.96170.00 49.59 35.30 53.88 65.50 37.35 68.61 62.81 49.28 44.97175.00 49.57 35.12 53.88 65.58 37.21 68.69 62.90 49.32 44.98180.00 49.57 34.94 53.89 65.67 37.10 68.78 62.98 49.35 44.99185.00 49.57 34.76 53.92 65.76 36.92 68.88 63.07 49.39 45.01190.00 49.59 34.61 53.95 65.85 36.81 68.97 63.15 49.42 45.02195.00 49.60 34.43 53.97 65.94 36.66 69.07 63.24 49.46 45.03200.00 49.64 34.30 54.02 66.03 36.55 69.17 63.32 49.49 45.05205.00 49.71 34.15 54.08 66.13 36.43 69.27 63.41 49.53 45.06210.00 49.77 33.98 54.17 66.19 36.26 69.37 63.50 49.57 45.07215.00 49.90 33.84 54.32 66.32 36.13 69.47 63.58 49.60 45.08220.00 50.03 33.75 54.47 66.42 36.11 69.58 63.67 49.64 45.10225.00 50.16 33.67 54.64 66.53 36.04 69.70 63.76 49.68 45.11230.00 50.28 33.57 54.81 66.64 35.95 69.81 63.84 49.71 45.13235.00 50.41 33.42 54.98 66.76 35.80 69.92 63.93 49.75 45.14

240.00 50.54 33.35 55.14 66.85 35.76 70.04 64.01 49.79 45.15245.00 50.73 33.27 55.31 66.96 35.66 70.16 64.09 49.82 45.17250.00 50.88 33.15 55.46 67.07 35.55 70.28 64.18 49.86 45.18255.00 51.00 33.15 55.63 67.18 35.56 70.40 64.26 49.89 45.19260.00 51.16 33.11 55.83 67.29 35.54 70.53 64.34 49.93 45.21265.00 51.33 33.04 56.02 67.41 35.43 70.67 64.42 49.97 45.22270.00 51.49 32.94 56.23 67.52 35.34 70.82 64.50 50.00 45.23275.00 51.68 32.89 56.44 67.64 35.33 70.97 64.58 50.03 45.25280.00 51.88 32.93 56.66 67.77 35.36 71.12 64.65 50.07 45.26285.00 52.06 32.91 56.88 67.88 35.33 71.26 64.73 50.10 45.27290.00 52.26 32.88 57.11 68.00 35.29 71.41 64.80 50.13 45.28295.00 52.47 32.83 57.34 68.12 35.27 71.56 64.87 50.16 45.30300.00 52.68 32.84 57.57 68.24 35.28 71.72 64.94 50.20 45.31305.00 52.90 32.83 57.81 68.36 35.26 71.87 65.01 50.23 45.32310.00 53.14 32.81 58.05 68.47 35.25 72.04 65.07 50.26 45.33315.00 53.37 32.83 58.29 68.59 35.27 72.20 65.14 50.28 45.34320.00 53.62 32.83 58.54 68.71 35.25 72.36 65.20 50.31 45.35325.00 53.87 32.81 58.78 68.83 35.21 72.51 65.26 50.34 45.36330.00 54.14 32.80 59.02 68.95 35.25 72.67 65.32 50.36 45.37335.00 54.41 32.86 59.27 69.06 35.31 72.84 65.37 50.39 45.38340.00 54.73 32.89 59.51 69.17 35.33 73.00 65.42 50.41 45.39345.00 55.03 32.92 59.75 69.29 35.37 73.16 65.47 50.43 45.40350.00 55.36 32.95 60.00 69.41 35.40 73.33 65.52 50.45 45.41355.00 55.66 32.98 60.24 69.52 35.43 73.48 65.57 50.47 45.42360.00 55.98 33.02 60.49 69.63 35.47 73.64 65.61 50.49 45.42365.00 56.30 33.05 60.73 69.74 35.53 73.79 65.65 50.51 45.43370.00 56.64 33.12 60.97 69.85 35.58 73.93 65.68 50.53 45.44375.00 56.97 33.17 61.21 69.96 35.64 74.08 65.72 50.54 45.44380.00 57.29 33.23 61.45 70.07 35.70 74.22 65.75 50.55 45.45385.00 57.61 33.29 61.67 70.18 35.76 74.36 65.78 50.57 45.45390.00 57.95 33.35 61.91 70.28 35.83 74.49 65.80 50.58 45.46395.00 58.28 33.42 62.13 70.39 35.89 74.62 65.82 50.59 45.46400.00 58.64 33.49 62.37 70.51 35.97 74.75 65.84 50.59 45.46405.00 58.97 33.57 62.59 70.62 36.05 74.87 65.86 50.60 45.46410.00 59.29 33.65 62.81 70.73 36.13 74.99 65.87 50.61 45.47415.00 59.64 33.70 63.03 70.84 36.21 75.10 65.88 50.61 45.47420.00 59.97 33.80 63.25 70.97 36.29 75.21 65.88 50.61 45.47

Timecum UCIL8 degC
UCIL7 degC
UCIL6 degC
UCIL5 degC
UCIL4 degC
UCIL3 degC
UCIL2 degC
UCIL2_a degC
UCIL2_b degC
0.00 23.20 23.20 23.20 23.20 23.20 23.20 23.20 23.20 23.205.00 26.80 25.25 26.68 27.65 26.11 27.47 28.51 28.92 29.0410.00 28.02 27.04 27.77 28.52 27.84 28.38 29.03 29.37 29.4615.00 28.58 27.69 28.21 28.73 28.39 28.64 29.10 29.41 29.4820.00 29.09 28.15 28.60 28.95 28.78 28.88 29.14 29.43 29.4825.00 29.55 28.54 28.96 29.12 29.12 29.10 29.19 29.46 29.5130.00 29.98 28.92 29.31 29.29 29.45 29.31 29.23 29.48 29.5235.00 30.40 29.28 29.64 29.45 29.77 29.50 29.28 29.51 29.5340.00 30.79 29.64 29.96 29.60 30.09 29.69 29.32 29.53 29.5445.00 31.17 29.99 30.27 29.75 30.39 29.87 29.37 29.56 29.5550.00 31.53 30.33 30.58 29.90 30.69 30.05 29.42 29.58 29.5755.00 31.87 30.66 30.87 30.04 30.98 30.22 29.46 29.61 29.5860.00 32.23 30.98 31.15 30.17 31.26 30.39 29.51 29.64 29.5965.00 32.52 31.30 31.44 30.36 31.53 30.56 29.55 29.66 29.6170.00 32.90 31.61 31.67 30.35 31.79 30.73 29.60 29.69 29.6275.00 33.13 31.91 31.94 30.56 32.05 30.87 29.65 29.71 29.6380.00 33.41 32.20 32.19 30.69 32.31 31.03 29.70 29.74 29.6485.00 33.67 32.49 32.43 30.81 32.55 31.17 29.74 29.77 29.6590.00 33.93 32.77 32.66 30.93 32.79 31.31 29.79 29.79 29.6795.00 34.18 33.04 32.88 31.04 33.03 31.45 29.84 29.82 29.68100.00 34.42 33.30 33.10 31.15 33.25 31.59 29.88 29.85 29.69105.00 34.65 33.56 33.31 31.26 33.48 31.72 29.93 29.87 29.70110.00 34.87 33.81 33.51 31.36 33.69 31.85 29.98 29.90 29.71115.00 35.09 34.06 33.71 31.47 33.90 31.97 30.02 29.92 29.73120.00 35.29 34.30 33.90 31.57 34.11 32.09 30.07 29.95 29.74125.00 35.48 34.53 34.08 31.66 34.31 32.21 30.12 29.97 29.75130.00 35.67 34.76 34.26 31.76 34.51 32.33 30.17 30.00 29.76135.00 35.84 34.99 34.42 31.85 34.70 32.44 30.21 30.02 29.77140.00 36.00 35.20 34.59 31.94 34.88 32.54 30.26 30.05 29.78145.00 36.16 35.42 34.74 32.03 35.07 32.65 30.31 30.07 29.79150.00 36.31 35.63 34.89 32.11 35.24 32.75 30.35 30.10 29.80155.00 36.45 35.83 35.03 32.19 35.41 32.84 30.40 30.12 29.81160.00 36.58 36.03 35.16 32.27 35.58 32.94 30.44 30.14 29.83165.00 36.70 36.22 35.29 32.35 35.74 33.03 30.49 30.17 29.84170.00 36.81 36.40 35.41 32.42 35.89 33.11 30.53 30.19 29.85175.00 36.92 36.58 35.52 32.49 36.04 33.19 30.57 30.21 29.86180.00 37.02 36.75 35.63 32.56 36.19 33.27 30.62 30.23 29.87185.00 37.11 36.92 35.73 32.62 36.33 33.34 30.66 30.26 29.88190.00 37.20 37.08 35.82 32.68 36.47 33.41 30.70 30.28 29.89195.00 37.28 37.24 35.92 32.74 36.60 33.48 30.74 30.30 29.90200.00 37.36 37.39 36.00 32.80 36.73 33.55 30.78 30.32 29.90205.00 37.43 37.54 36.08 32.86 36.85 33.62 30.82 30.34 29.91210.00 37.48 37.68 36.14 32.91 36.97 33.68 30.86 30.36 29.92215.00 37.52 37.82 36.19 32.97 37.09 33.74 30.90 30.38 29.93220.00 37.56 37.96 36.24 33.02 37.21 33.80 30.94 30.40 29.94225.00 37.60 38.09 36.28 33.07 37.32 33.86 30.98 30.41 29.95230.00 37.64 38.21 36.31 33.11 37.43 33.91 31.01 30.43 29.96235.00 37.67 38.33 36.35 33.16 37.53 33.97 31.05 30.45 29.96

240.00 37.70 38.44 36.38 33.20 37.63 34.01 31.08 30.47 29.97245.00 37.72 38.55 36.41 33.24 37.73 34.06 31.11 30.48 29.98250.00 37.74 38.65 36.44 33.28 37.82 34.11 31.14 30.50 29.99255.00 37.76 38.73 36.46 33.32 37.91 34.15 31.17 30.52 30.00260.00 37.78 38.82 36.47 33.35 37.99 34.18 31.20 30.53 30.00265.00 37.78 38.91 36.48 33.38 38.07 34.21 31.23 30.55 30.01270.00 37.79 38.98 36.48 33.41 38.14 34.24 31.26 30.56 30.02275.00 37.79 39.06 36.49 33.44 38.21 34.27 31.29 30.57 30.02280.00 37.78 39.13 36.48 33.46 38.28 34.29 31.31 30.59 30.03285.00 37.77 39.19 36.48 33.49 38.34 34.31 31.34 30.60 30.03290.00 37.76 39.25 36.46 33.51 38.39 34.33 31.36 30.61 30.04295.00 37.74 39.31 36.45 33.53 38.45 34.35 31.38 30.62 30.04300.00 37.72 39.36 36.43 33.54 38.50 34.36 31.40 30.63 30.05305.00 37.69 39.41 36.41 33.56 38.54 34.37 31.42 30.64 30.05310.00 37.65 39.46 36.38 33.57 38.58 34.37 31.44 30.65 30.06315.00 37.62 39.49 36.36 33.58 38.62 34.37 31.46 30.66 30.06320.00 37.57 39.53 36.33 33.58 38.65 34.37 31.47 30.67 30.07325.00 37.52 39.56 36.29 33.59 38.67 34.37 31.49 30.68 30.07330.00 37.46 39.59 36.26 33.59 38.70 34.37 31.50 30.69 30.07335.00 37.40 39.61 36.22 33.59 38.71 34.36 31.52 30.69 30.08340.00 37.32 39.62 36.18 33.59 38.73 34.35 31.53 30.70 30.08345.00 37.24 39.64 36.13 33.58 38.74 34.33 31.54 30.71 30.08350.00 37.16 39.64 36.09 33.57 38.74 34.31 31.55 30.71 30.09355.00 37.08 39.65 36.04 33.56 38.74 34.30 31.55 30.72 30.09360.00 36.99 39.64 35.98 33.55 38.74 34.27 31.56 30.72 30.09365.00 36.90 39.64 35.93 33.54 38.73 34.25 31.57 30.72 30.09370.00 36.81 39.63 35.87 33.52 38.72 34.23 31.57 30.73 30.09375.00 36.71 39.61 35.82 33.50 38.70 34.20 31.57 30.73 30.09380.00 36.61 39.59 35.76 33.48 38.68 34.17 31.57 30.73 30.09385.00 36.51 39.56 35.69 33.46 38.65 34.14 31.57 30.73 30.10390.00 36.41 39.54 35.63 33.43 38.62 34.11 31.57 30.73 30.10395.00 36.30 39.50 35.56 33.40 38.59 34.07 31.57 30.73 30.10400.00 36.20 39.47 35.49 33.37 38.55 34.03 31.57 30.73 30.10405.00 36.09 39.42 35.42 33.33 38.51 33.99 31.56 30.73 30.09410.00 35.98 39.37 35.35 33.29 38.46 33.95 31.55 30.72 30.09415.00 35.87 39.32 35.27 33.25 38.41 33.91 31.55 30.72 30.09420.00 35.75 39.26 35.19 33.20 38.35 33.87 31.54 30.72 30.09

TimecumUCIL8
(%)UCIL7
(%)UCIL6
(%)UCIL5
(%)UCIL4
(%)UCIL3
(%)UCIL2
(%)UCIL2_a
(%)UCIL2_b
(%)0.00 42.60 42.62 42.62 42.62 42.61 42.69 42.57 42.62 42.625.00 65.80 46.50 66.45 63.58 45.19 69.55 52.05 37.65 33.2010.00 64.84 47.13 65.39 62.55 45.20 68.42 51.43 37.00 32.5615.00 63.40 46.84 64.19 62.14 45.00 67.90 51.54 37.02 32.5420.00 61.94 46.12 63.09 61.67 44.35 67.31 51.56 37.04 32.5725.00 60.59 45.32 62.08 61.26 43.76 66.74 51.57 37.02 32.5430.00 59.39 44.49 61.14 60.92 42.97 66.23 51.58 37.03 32.5435.00 58.30 43.66 60.28 60.61 42.21 65.77 51.59 37.03 32.5440.00 57.23 42.92 59.42 60.28 41.72 65.35 51.61 37.04 32.5445.00 56.25 42.23 58.63 59.98 41.12 64.94 51.62 37.03 32.5450.00 55.40 41.48 57.91 59.74 40.35 64.56 51.63 37.03 32.5355.00 54.55 40.79 57.21 59.48 39.83 64.22 51.64 37.03 32.5360.00 53.69 40.23 56.54 59.25 39.49 63.87 51.67 37.04 32.5365.00 53.10 39.62 55.89 58.87 38.84 63.54 51.68 37.04 32.5370.00 52.50 38.98 55.54 59.23 38.21 63.21 51.68 37.04 32.5375.00 51.75 38.51 54.80 58.59 38.03 62.93 51.70 37.04 32.5380.00 51.11 38.02 54.24 58.37 37.61 62.66 51.72 37.05 32.5385.00 50.55 37.56 53.76 58.20 37.27 62.41 51.74 37.05 32.5390.00 50.06 37.08 53.30 58.04 36.82 62.16 51.76 37.05 32.5395.00 49.56 36.61 52.85 57.87 36.38 61.93 51.77 37.06 32.53100.00 49.08 36.18 52.42 57.70 36.09 61.71 51.79 37.06 32.54105.00 48.66 35.76 52.03 57.56 35.74 61.50 51.81 37.06 32.54110.00 48.25 35.32 51.67 57.44 35.30 61.30 51.82 37.07 32.54115.00 47.84 34.94 51.30 57.30 34.98 61.12 51.84 37.07 32.54120.00 47.49 34.57 50.95 57.16 34.73 60.95 51.85 37.07 32.54125.00 47.18 34.19 50.66 57.06 34.37 60.78 51.87 37.08 32.54130.00 46.87 33.89 50.36 56.96 34.15 60.63 51.88 37.08 32.54135.00 46.60 33.63 50.08 56.85 33.99 60.49 51.89 37.09 32.55140.00 46.35 33.35 49.83 56.76 33.70 60.36 51.90 37.09 32.55145.00 46.12 33.07 49.58 56.66 33.58 60.23 51.92 37.10 32.55150.00 45.90 32.78 49.37 56.59 33.33 60.11 51.93 37.11 32.55155.00 45.71 32.48 49.16 56.51 32.98 60.01 51.94 37.11 32.56160.00 45.53 32.21 48.96 56.44 32.77 59.91 51.96 37.12 32.56165.00 45.38 31.97 48.79 56.38 32.62 59.82 51.97 37.13 32.56170.00 45.23 31.72 48.64 56.32 32.32 59.76 51.98 37.13 32.57175.00 45.14 31.49 48.50 56.28 32.17 59.70 51.99 37.14 32.57180.00 45.00 31.28 48.38 56.25 32.11 59.64 52.00 37.15 32.57185.00 44.89 31.07 48.28 56.21 31.87 59.60 52.01 37.16 32.57190.00 44.83 30.82 48.16 56.18 31.57 59.56 52.02 37.16 32.58195.00 44.75 30.63 48.06 56.15 31.52 59.51 52.03 37.17 32.58200.00 44.68 30.49 47.98 56.12 31.42 59.47 52.04 37.18 32.58205.00 44.65 30.39 47.92 56.09 31.39 59.43 52.05 37.19 32.59210.00 44.67 30.21 47.90 56.07 31.19 59.40 52.06 37.19 32.59215.00 44.67 30.02 47.89 56.05 30.98 59.37 52.07 37.20 32.59220.00 44.65 29.89 47.89 56.03 30.95 59.34 52.08 37.21 32.60225.00 44.67 29.73 47.92 56.01 30.83 59.32 52.09 37.22 32.60230.00 44.70 29.53 47.96 56.01 30.53 59.31 52.10 37.22 32.60235.00 44.67 29.38 47.97 55.99 30.37 59.29 52.11 37.23 32.61

240.00 44.69 29.27 47.98 55.97 30.38 59.28 52.12 37.24 32.61245.00 44.79 29.11 48.03 55.99 30.23 59.27 52.13 37.24 32.61250.00 44.79 29.00 48.06 55.98 29.96 59.26 52.14 37.25 32.61255.00 44.88 28.97 48.09 55.97 30.10 59.26 52.14 37.25 32.62260.00 44.92 28.96 48.15 55.97 30.13 59.27 52.15 37.26 32.62265.00 44.98 28.87 48.22 55.98 29.97 59.29 52.16 37.27 32.62270.00 45.04 28.79 48.30 55.99 29.88 59.31 52.16 37.27 32.62275.00 45.12 28.73 48.38 56.01 29.89 59.34 52.17 37.27 32.63280.00 45.19 28.63 48.46 56.02 29.74 59.37 52.17 37.28 32.63285.00 45.26 28.55 48.55 56.03 29.63 59.40 52.18 37.28 32.63290.00 45.37 28.50 48.65 56.05 29.66 59.43 52.18 37.29 32.63295.00 45.46 28.44 48.76 56.07 29.63 59.47 52.19 37.29 32.63300.00 45.54 28.36 48.86 56.08 29.45 59.52 52.19 37.29 32.64305.00 45.68 28.30 48.97 56.11 29.39 59.57 52.19 37.29 32.64310.00 45.82 28.27 49.08 56.14 29.45 59.62 52.19 37.30 32.64315.00 45.91 28.22 49.20 56.15 29.36 59.67 52.19 37.30 32.64320.00 46.07 28.16 49.33 56.18 29.21 59.73 52.19 37.30 32.64325.00 46.26 28.14 49.44 56.22 29.24 59.79 52.19 37.30 32.64330.00 46.42 28.16 49.58 56.25 29.31 59.85 52.19 37.30 32.64335.00 46.63 28.19 49.71 56.30 29.34 59.92 52.19 37.30 32.64340.00 46.84 28.20 49.84 56.33 29.38 59.99 52.18 37.30 32.64345.00 47.03 28.18 49.97 56.37 29.36 60.06 52.18 37.30 32.64350.00 47.26 28.15 50.11 56.41 29.25 60.14 52.17 37.30 32.64355.00 47.48 28.13 50.25 56.46 29.21 60.21 52.17 37.29 32.64360.00 47.67 28.17 50.39 56.50 29.37 60.29 52.16 37.29 32.63365.00 47.92 28.20 50.54 56.54 29.43 60.37 52.15 37.29 32.63370.00 48.17 28.18 50.69 56.60 29.31 60.44 52.15 37.28 32.63375.00 48.35 28.18 50.83 56.65 29.28 60.51 52.14 37.28 32.63380.00 48.57 28.23 50.97 56.69 29.41 60.60 52.12 37.27 32.63385.00 48.86 28.24 51.12 56.75 29.46 60.68 52.12 37.27 32.63390.00 49.06 28.25 51.29 56.82 29.38 60.75 52.11 37.26 32.62395.00 49.23 28.31 51.41 56.86 29.42 60.83 52.09 37.26 32.62400.00 49.55 28.35 51.56 56.93 29.57 60.92 52.08 37.25 32.62405.00 49.80 28.44 51.74 57.00 29.60 60.99 52.06 37.24 32.61410.00 50.02 28.51 51.88 57.06 29.62 61.06 52.05 37.23 32.61415.00 50.36 28.57 52.05 57.17 29.80 61.15 52.03 37.22 32.61420.00 50.62 28.64 52.23 57.26 29.91 61.22 52.02 37.22 32.60

Timecum UCIL8 degC
UCIL7 degC
UCIL6 degC
UCIL5 degC
UCIL4 degC
UCIL3 degC
UCIL2 degC
UCIL2_a degC
UCIL2_b degC
0.00 23.20 23.20 23.20 23.20 23.20 23.20 23.20 23.20 23.205.00 23.69 23.51 23.59 23.37 23.50 23.43 23.23 23.22 23.2110.00 24.20 23.94 24.00 23.56 23.87 23.67 23.29 23.24 23.2215.00 24.69 24.36 24.40 23.75 24.25 23.91 23.34 23.27 23.2320.00 25.15 24.76 24.77 23.92 24.61 24.13 23.39 23.30 23.2425.00 25.60 25.15 25.14 24.10 24.95 24.35 23.44 23.32 23.2630.00 26.02 25.54 25.49 24.27 25.29 24.56 23.50 23.35 23.2735.00 26.43 25.91 25.82 24.43 25.62 24.77 23.55 23.38 23.2840.00 26.82 26.27 26.15 24.59 25.93 24.96 23.60 23.40 23.2945.00 27.20 26.61 26.46 24.74 26.24 25.15 23.66 23.43 23.3050.00 27.57 26.95 26.76 24.90 26.54 25.34 23.71 23.46 23.3255.00 27.92 27.29 27.05 25.04 26.83 25.52 23.77 23.48 23.3360.00 28.25 27.61 27.34 25.19 27.11 25.69 23.82 23.51 23.3465.00 28.57 27.93 27.61 25.33 27.39 25.86 23.88 23.54 23.3570.00 28.88 28.23 27.87 25.46 27.65 26.03 23.93 23.56 23.3775.00 29.17 28.53 28.13 25.60 27.91 26.19 23.99 23.59 23.3880.00 29.46 28.82 28.38 25.73 28.16 26.35 24.04 23.62 23.3985.00 29.73 29.11 28.62 25.86 28.41 26.50 24.10 23.65 23.4090.00 29.99 29.38 28.85 25.98 28.65 26.65 24.15 23.67 23.4295.00 30.25 29.65 29.08 26.10 28.88 26.79 24.21 23.70 23.43100.00 30.49 29.91 29.30 26.22 29.11 26.94 24.26 23.73 23.44105.00 30.72 30.17 29.51 26.33 29.33 27.07 24.31 23.75 23.45110.00 30.94 30.42 29.72 26.44 29.55 27.21 24.37 23.78 23.47115.00 31.15 30.66 29.92 26.55 29.76 27.33 24.42 23.81 23.48120.00 31.36 30.90 30.11 26.66 29.97 27.46 24.48 23.84 23.49125.00 31.55 31.14 30.29 26.76 30.17 27.58 24.53 23.86 23.50130.00 31.74 31.36 30.47 26.86 30.36 27.70 24.58 23.89 23.51135.00 31.92 31.58 30.64 26.96 30.55 27.82 24.63 23.91 23.52140.00 32.09 31.80 30.80 27.06 30.74 27.93 24.69 23.94 23.54145.00 32.25 32.01 30.96 27.15 30.92 28.04 24.74 23.97 23.55150.00 32.40 32.22 31.11 27.24 31.09 28.15 24.79 23.99 23.56155.00 32.55 32.42 31.26 27.33 31.27 28.25 24.84 24.02 23.57160.00 32.69 32.61 31.39 27.41 31.43 28.35 24.89 24.04 23.58165.00 32.82 32.80 31.53 27.49 31.59 28.45 24.94 24.07 23.59170.00 32.94 32.98 31.65 27.57 31.75 28.54 24.99 24.09 23.60175.00 33.05 33.16 31.76 27.64 31.90 28.62 25.04 24.11 23.62180.00 33.15 33.33 31.87 27.71 32.05 28.70 25.08 24.14 23.63185.00 33.25 33.49 31.97 27.78 32.19 28.78 25.13 24.16 23.64190.00 33.34 33.65 32.07 27.85 32.33 28.86 25.18 24.18 23.65195.00 33.43 33.81 32.17 27.91 32.46 28.93 25.22 24.21 23.66200.00 33.51 33.96 32.26 27.98 32.59 29.01 25.27 24.23 23.67205.00 33.58 34.10 32.34 28.04 32.71 29.08 25.31 24.25 23.68210.00 33.64 34.24 32.40 28.10 32.84 29.15 25.35 24.27 23.69215.00 33.69 34.38 32.45 28.15 32.95 29.21 25.39 24.29 23.70220.00 33.73 34.51 32.50 28.21 33.07 29.27 25.44 24.31 23.71225.00 33.78 34.64 32.54 28.26 33.18 29.33 25.48 24.33 23.71230.00 33.81 34.76 32.58 28.31 33.29 29.39 25.52 24.35 23.72235.00 33.86 34.87 32.62 28.36 33.39 29.45 25.55 24.37 23.73

240.00 33.88 34.98 32.65 28.41 33.49 29.50 25.59 24.39 23.74245.00 33.90 35.09 32.69 28.45 33.59 29.55 25.63 24.41 23.75250.00 33.92 35.19 32.72 28.50 33.68 29.60 25.66 24.42 23.76255.00 33.94 35.28 32.74 28.54 33.77 29.64 25.70 24.44 23.76260.00 33.95 35.37 32.76 28.57 33.85 29.69 25.73 24.46 23.77265.00 33.96 35.46 32.77 28.61 33.93 29.72 25.76 24.47 23.78270.00 33.97 35.54 32.78 28.64 34.01 29.75 25.79 24.49 23.79275.00 33.96 35.61 32.78 28.67 34.08 29.78 25.82 24.51 23.79280.00 33.96 35.69 32.78 28.70 34.15 29.81 25.85 24.52 23.80285.00 33.95 35.75 32.78 28.73 34.21 29.83 25.88 24.53 23.81290.00 33.94 35.82 32.77 28.75 34.27 29.86 25.91 24.55 23.81295.00 33.92 35.88 32.76 28.77 34.32 29.88 25.93 24.56 23.82300.00 33.89 35.93 32.74 28.79 34.37 29.89 25.96 24.57 23.82305.00 33.86 35.98 32.72 28.81 34.42 29.90 25.98 24.58 23.83310.00 33.82 36.03 32.70 28.83 34.46 29.91 26.00 24.60 23.84315.00 33.79 36.07 32.68 28.84 34.49 29.92 26.02 24.61 23.84320.00 33.75 36.10 32.65 28.85 34.53 29.92 26.04 24.62 23.84325.00 33.71 36.14 32.61 28.86 34.55 29.92 26.06 24.63 23.85330.00 33.64 36.16 32.58 28.86 34.58 29.92 26.08 24.63 23.85335.00 33.58 36.19 32.54 28.87 34.60 29.91 26.09 24.64 23.86340.00 33.51 36.20 32.50 28.87 34.61 29.91 26.11 24.65 23.86345.00 33.42 36.21 32.46 28.86 34.62 29.89 26.12 24.66 23.86350.00 33.35 36.22 32.41 28.86 34.63 29.88 26.13 24.66 23.87355.00 33.27 36.23 32.36 28.85 34.63 29.87 26.14 24.67 23.87360.00 33.18 36.23 32.31 28.85 34.63 29.85 26.15 24.67 23.87365.00 33.09 36.22 32.26 28.83 34.62 29.83 26.16 24.68 23.87370.00 33.00 36.21 32.20 28.82 34.61 29.81 26.17 24.68 23.88375.00 32.91 36.19 32.14 28.80 34.59 29.78 26.17 24.69 23.88380.00 32.81 36.17 32.08 28.79 34.57 29.76 26.18 24.69 23.88385.00 32.72 36.15 32.02 28.77 34.55 29.73 26.18 24.69 23.88390.00 32.62 36.12 31.96 28.74 34.52 29.70 26.18 24.69 23.88395.00 32.52 36.09 31.89 28.72 34.49 29.67 26.18 24.69 23.88400.00 32.41 36.06 31.82 28.69 34.46 29.63 26.18 24.69 23.88405.00 32.31 36.01 31.76 28.65 34.42 29.60 26.18 24.69 23.88410.00 32.20 35.97 31.68 28.62 34.38 29.56 26.18 24.69 23.88415.00 32.09 35.92 31.61 28.58 34.33 29.52 26.17 24.69 23.88420.00 31.98 35.86 31.53 28.54 34.27 29.48 26.17 24.69 23.88

Timecum UCIL8 (%)
UCIL7 (%)
UCIL6 (%)
UCIL5 (%)
UCIL4 (%)
UCIL3 (%)
UCIL2 (%)
UCIL2_a (%)
UCIL2_b (%)
0.00 42.60 42.62 42.62 42.62 42.61 42.69 42.57 42.62 42.625.00 68.04 49.41 68.32 69.40 49.89 74.76 60.92 48.62 44.7810.00 66.74 50.80 66.88 68.83 50.76 73.99 60.89 48.61 44.7715.00 65.21 50.41 65.61 68.35 50.36 73.29 60.86 48.60 44.7620.00 63.77 49.60 64.45 67.88 49.63 72.63 60.83 48.58 44.7525.00 62.40 48.70 63.38 67.42 48.88 72.01 60.81 48.56 44.7530.00 61.11 47.78 62.37 66.99 48.13 71.44 60.79 48.55 44.7435.00 59.95 46.90 61.44 66.61 47.34 70.90 60.76 48.54 44.7340.00 58.86 46.05 60.56 66.25 46.54 70.39 60.74 48.52 44.7245.00 57.80 45.25 59.73 65.88 45.86 69.91 60.72 48.51 44.7250.00 56.86 44.51 58.96 65.55 45.24 69.45 60.71 48.50 44.7155.00 55.96 43.80 58.22 65.22 44.64 69.02 60.69 48.49 44.7060.00 55.14 43.13 57.53 64.93 44.07 68.62 60.67 48.48 44.7065.00 54.37 42.48 56.88 64.65 43.49 68.24 60.66 48.47 44.6970.00 53.66 41.87 56.27 64.37 42.96 67.88 60.64 48.46 44.6975.00 52.97 41.27 55.69 64.12 42.42 67.54 60.63 48.45 44.6880.00 52.34 40.70 55.14 63.87 41.94 67.21 60.61 48.44 44.6885.00 51.75 40.17 54.63 63.65 41.50 66.91 60.60 48.43 44.6790.00 51.20 39.66 54.14 63.43 41.03 66.62 60.59 48.43 44.6795.00 50.68 39.17 53.67 63.22 40.60 66.35 60.58 48.42 44.66100.00 50.20 38.71 53.23 63.03 40.19 66.09 60.56 48.41 44.66105.00 49.74 38.26 52.82 62.84 39.79 65.85 60.55 48.40 44.65110.00 49.32 37.83 52.43 62.67 39.44 65.62 60.54 48.40 44.65115.00 48.92 37.42 52.06 62.50 39.06 65.41 60.53 48.39 44.64120.00 48.53 37.01 51.70 62.34 38.66 65.21 60.53 48.39 44.64125.00 48.20 36.61 51.38 62.20 38.34 65.02 60.52 48.38 44.64130.00 47.88 36.25 51.07 62.06 38.03 64.83 60.51 48.38 44.63135.00 47.57 35.90 50.78 61.92 37.69 64.67 60.51 48.37 44.63140.00 47.32 35.55 50.52 61.81 37.41 64.51 60.50 48.37 44.63145.00 47.06 35.24 50.27 61.70 37.16 64.36 60.49 48.36 44.62150.00 46.80 34.93 50.03 61.59 36.85 64.22 60.49 48.36 44.62155.00 46.60 34.59 49.82 61.49 36.53 64.09 60.48 48.36 44.62160.00 46.40 34.32 49.62 61.40 36.35 63.98 60.48 48.36 44.62165.00 46.25 34.04 49.44 61.32 36.05 63.86 60.48 48.35 44.62170.00 46.09 33.81 49.28 61.26 35.90 63.78 60.47 48.35 44.61175.00 45.98 33.56 49.15 61.20 35.64 63.71 60.47 48.35 44.61180.00 45.88 33.32 49.04 61.16 35.43 63.65 60.47 48.35 44.61185.00 45.75 33.14 48.92 61.11 35.34 63.59 60.47 48.35 44.61190.00 45.66 32.92 48.81 61.06 35.11 63.53 60.47 48.35 44.61195.00 45.60 32.64 48.71 61.03 34.77 63.48 60.47 48.35 44.61200.00 45.50 32.49 48.61 60.98 34.77 63.42 60.47 48.35 44.61205.00 45.47 32.31 48.54 60.94 34.55 63.37 60.47 48.35 44.61210.00 45.47 32.05 48.53 60.92 34.22 63.33 60.47 48.35 44.61215.00 45.45 31.89 48.53 60.89 34.13 63.30 60.47 48.35 44.61220.00 45.43 31.75 48.52 60.85 34.09 63.27 60.47 48.35 44.61225.00 45.43 31.57 48.56 60.84 33.82 63.24 60.47 48.35 44.61230.00 45.49 31.46 48.58 60.83 33.76 63.22 60.47 48.35 44.61235.00 45.49 31.35 48.60 60.81 33.73 63.20 60.48 48.36 44.61

240.00 45.57 31.21 48.64 60.80 33.54 63.19 60.48 48.36 44.61245.00 45.61 31.09 48.67 60.78 33.42 63.18 60.48 48.36 44.61250.00 45.65 31.02 48.70 60.78 33.43 63.17 60.48 48.36 44.61255.00 45.72 30.89 48.76 60.78 33.24 63.17 60.49 48.36 44.61260.00 45.78 30.73 48.83 60.78 33.02 63.18 60.49 48.36 44.61265.00 45.83 30.64 48.89 60.78 32.98 63.20 60.49 48.37 44.61270.00 45.88 30.60 48.95 60.79 32.98 63.22 60.49 48.37 44.61275.00 46.01 30.51 49.06 60.80 32.84 63.26 60.49 48.37 44.61280.00 46.11 30.48 49.14 60.82 32.89 63.29 60.50 48.37 44.61285.00 46.23 30.41 49.25 60.83 32.80 63.32 60.50 48.37 44.61290.00 46.32 30.34 49.36 60.85 32.70 63.36 60.50 48.37 44.61295.00 46.44 30.30 49.46 60.88 32.72 63.40 60.50 48.37 44.61300.00 46.58 30.24 49.58 60.90 32.65 63.45 60.50 48.38 44.61305.00 46.70 30.12 49.70 60.91 32.44 63.52 60.50 48.38 44.61310.00 46.85 30.07 49.82 60.94 32.37 63.58 60.50 48.38 44.61315.00 47.01 30.07 49.95 60.98 32.46 63.64 60.50 48.38 44.61320.00 47.15 30.03 50.09 61.01 32.36 63.71 60.50 48.38 44.61325.00 47.30 30.00 50.23 61.05 32.29 63.77 60.50 48.38 44.61330.00 47.53 30.01 50.36 61.09 32.40 63.85 60.50 48.38 44.61335.00 47.72 29.97 50.52 61.14 32.42 63.93 60.50 48.38 44.61340.00 47.93 29.93 50.67 61.18 32.28 64.01 60.49 48.38 44.61345.00 48.16 29.94 50.81 61.23 32.21 64.09 60.49 48.37 44.60350.00 48.41 29.94 50.98 61.28 32.35 64.18 60.49 48.37 44.61355.00 48.61 29.95 51.15 61.33 32.30 64.27 60.48 48.37 44.60360.00 48.86 29.98 51.29 61.39 32.26 64.36 60.48 48.37 44.60365.00 49.13 29.98 51.46 61.45 32.35 64.45 60.47 48.37 44.60370.00 49.36 29.97 51.64 61.51 32.37 64.54 60.47 48.36 44.60375.00 49.58 29.99 51.79 61.56 32.30 64.63 60.47 48.36 44.60380.00 49.89 30.05 51.96 61.64 32.48 64.72 60.46 48.36 44.60385.00 50.12 30.08 52.13 61.70 32.50 64.82 60.45 48.35 44.60390.00 50.39 30.15 52.30 61.77 32.54 64.91 60.44 48.35 44.59395.00 50.67 30.21 52.47 61.86 32.67 65.01 60.44 48.35 44.59400.00 50.92 30.25 52.65 61.94 32.68 65.11 60.43 48.34 44.59405.00 51.20 30.31 52.81 62.02 32.66 65.20 60.42 48.34 44.59410.00 51.48 30.36 52.98 62.11 32.74 65.29 60.41 48.33 44.59415.00 51.73 30.41 53.16 62.21 32.81 65.39 60.40 48.33 44.58420.00 52.01 30.49 53.35 62.32 32.89 65.48 60.39 48.32 44.58

Timecum 2x1RH 2x1T 2x1flux 2x1aRH 2x1aT 2x1aflux 2x2RH
0.00 0.949330 23.205000 -266.190000 0.946180 23.201000 -264.490000 0.9436905.00 0.970610 29.292000 623.650000 0.972320 29.004000 577.590000 0.97392010.00 0.970990 29.500000 653.430000 0.972490 29.208000 606.650000 0.97372015.00 0.971620 29.672000 678.010000 0.973130 29.365000 628.930000 0.97444020.00 0.972140 29.844000 702.470000 0.973590 29.518000 650.620000 0.97489025.00 0.972660 30.020000 727.500000 0.974050 29.674000 672.730000 0.97533030.00 0.973180 30.197000 752.710000 0.974520 29.832000 695.010000 0.97577035.00 0.973710 30.376000 778.180000 0.974990 29.991000 717.470000 0.97622040.00 0.974240 30.557000 803.770000 0.975470 30.151000 740.090000 0.97667045.00 0.974780 30.738000 829.430000 0.975950 30.313000 762.910000 0.97712050.00 0.975330 30.923000 855.590000 0.976440 30.477000 785.930000 0.97758055.00 0.975900 31.106000 881.420000 0.976940 30.641000 809.020000 0.97804060.00 0.976440 31.293000 907.860000 0.977440 30.808000 832.400000 0.97851065.00 0.977030 31.478000 933.870000 0.977950 30.974000 855.730000 0.97898070.00 0.977580 31.665000 960.200000 0.978450 31.142000 879.310000 0.97945075.00 0.978150 31.850000 986.190000 0.978970 31.311000 902.870000 0.97993080.00 0.978720 32.036000 1012.200000 0.979490 31.480000 926.490000 0.98041085.00 0.979280 32.221000 1038.100000 0.980010 31.649000 950.120000 0.98089090.00 0.979840 32.405000 1063.900000 0.980530 31.819000 973.770000 0.98137095.00 0.980400 32.589000 1089.500000 0.981050 31.989000 997.410000 0.981860100.00 0.980960 32.772000 1115.100000 0.981570 32.159000 1021.000000 0.982350105.00 0.981520 32.955000 1140.600000 0.982100 32.328000 1044.500000 0.982830110.00 0.982080 33.137000 1165.900000 0.982620 32.498000 1068.000000 0.983320115.00 0.982630 33.318000 1191.000000 0.983140 32.666000 1091.300000 0.983820120.00 0.983190 33.498000 1216.000000 0.983670 32.834000 1114.500000 0.984310125.00 0.983740 33.677000 1240.800000 0.984190 33.001000 1137.500000 0.984800130.00 0.984280 33.854000 1265.300000 0.984700 33.166000 1160.300000 0.985290135.00 0.984820 34.031000 1289.700000 0.985210 33.330000 1183.000000 0.985770140.00 0.985360 34.206000 1313.800000 0.985720 33.493000 1205.300000 0.986260145.00 0.985900 34.379000 1337.700000 0.986230 33.654000 1227.500000 0.986740150.00 0.986430 34.551000 1361.300000 0.986730 33.814000 1249.400000 0.987220155.00 0.986960 34.721000 1384.700000 0.987230 33.972000 1271.100000 0.987690160.00 0.987470 34.890000 1407.900000 0.987710 34.129000 1292.500000 0.988150165.00 0.987990 35.057000 1430.700000 0.988210 34.284000 1313.700000 0.988620170.00 0.988500 35.222000 1453.300000 0.988690 34.436000 1334.500000 0.989080175.00 0.989010 35.384000 1475.400000 0.989170 34.587000 1355.000000 0.989540180.00 0.989510 35.544000 1497.300000 0.989640 34.735000 1375.200000 0.989990185.00 0.990000 35.702000 1518.800000 0.990100 34.882000 1395.100000 0.990440190.00 0.990480 35.857000 1539.900000 0.990560 35.025000 1414.700000 0.990880195.00 0.990960 36.009000 1560.600000 0.991000 35.167000 1433.800000 0.991310200.00 0.991420 36.159000 1580.900000 0.991450 35.306000 1452.700000 0.991730205.00 0.991880 36.305000 1600.800000 0.991880 35.442000 1471.200000 0.992150210.00 0.992320 36.449000 1620.200000 0.992300 35.576000 1489.300000 0.992560215.00 0.992760 36.589000 1639.200000 0.992720 35.707000 1507.000000 0.992960220.00 0.993190 36.727000 1657.700000 0.993130 35.835000 1524.300000 0.993360225.00 0.993610 36.861000 1675.800000 0.993530 35.961000 1541.200000 0.993750230.00 0.994010 36.991000 1693.500000 0.993920 36.083000 1557.700000 0.994130235.00 0.994410 37.119000 1710.600000 0.994300 36.202000 1573.700000 0.994490240.00 0.994790 37.243000 1727.300000 0.994660 36.319000 1589.300000 0.994850

245.00 0.995160 37.363000 1743.400000 0.995020 36.432000 1604.500000 0.995200250.00 0.995530 37.479000 1759.100000 0.995370 36.541000 1619.200000 0.995540255.00 0.995870 37.592000 1774.200000 0.995710 36.648000 1633.500000 0.995870260.00 0.996200 37.701000 1788.800000 0.996030 36.751000 1647.300000 0.996190265.00 0.996530 37.806000 1802.800000 0.996340 36.850000 1660.600000 0.996500270.00 0.996840 37.907000 1816.400000 0.996650 36.946000 1673.400000 0.996800275.00 0.997130 38.004000 1829.400000 0.996940 37.038000 1685.800000 0.997090280.00 0.997420 38.097000 1841.800000 0.997220 37.127000 1697.600000 0.997360285.00 0.997690 38.186000 1853.700000 0.997480 37.212000 1709.000000 0.997630290.00 0.997950 38.271000 1865.000000 0.997740 37.294000 1719.800000 0.997890295.00 0.998190 38.352000 1875.700000 0.997980 37.371000 1730.200000 0.998130300.00 0.998420 38.428000 1885.900000 0.998210 37.445000 1740.000000 0.998360305.00 0.998630 38.500000 1895.500000 0.998430 37.515000 1749.300000 0.998590310.00 0.998830 38.568000 1904.500000 0.998630 37.581000 1758.100000 0.998790315.00 0.999010 38.631000 1912.900000 0.998820 37.643000 1766.300000 0.998990320.00 0.999180 38.690000 1920.700000 0.998990 37.701000 1774.000000 0.999170325.00 0.999340 38.744000 1927.900000 0.999150 37.755000 1781.200000 0.999340330.00 0.999480 38.794000 1934.500000 0.999300 37.805000 1787.800000 0.999500335.00 0.999600 38.839000 1940.500000 0.999440 37.851000 1793.900000 0.999650340.00 0.999710 38.880000 1945.900000 0.999560 37.892000 1799.400000 0.999780345.00 0.999800 38.916000 1950.700000 0.999660 37.930000 1804.400000 0.999900350.00 0.999880 38.947000 1954.800000 0.999750 37.963000 1808.800000 1.000000355.00 0.999940 38.974000 1958.400000 0.999830 37.992000 1812.700000 1.000000360.00 0.999980 38.996000 1961.300000 0.999900 38.017000 1815.900000 1.000000365.00 1.000000 39.013000 1963.600000 0.999940 38.038000 1818.700000 1.000000370.00 1.000000 39.026000 1965.300000 0.999980 38.054000 1820.800000 1.000000375.00 1.000000 39.034000 1966.300000 1.000000 38.066000 1822.400000 1.000000380.00 1.000000 39.037000 1966.700000 1.000000 38.074000 1823.500000 1.000000385.00 0.999970 39.035000 1966.500000 0.999990 38.077000 1823.900000 1.000000390.00 0.999920 39.029000 1965.700000 0.999970 38.076000 1823.800000 1.000000395.00 0.999850 39.018000 1964.200000 0.999930 38.071000 1823.100000 1.000000400.00 0.999770 39.002000 1962.100000 0.999880 38.062000 1821.900000 1.000000405.00 0.999670 38.982000 1959.400000 0.999810 38.048000 1820.100000 1.000000410.00 0.999560 38.956000 1956.100000 0.999730 38.030000 1817.700000 1.000000415.00 0.999430 38.926000 1952.100000 0.999630 38.008000 1814.700000 1.000000420.00 0.999280 38.891000 1947.500000 0.999520 37.981000 1811.100000 1.000000

2x2T 2x2flux 2x21RH 2x21T 2x21flux 2x3RH 2x3T 2x3flux
23.200000 -262.960000 0.939640 23.200000 -261.950000 0.939500 23.200000 -262.46000028.768000 540.430000 0.973460 28.582000 512.190000 0.973900 28.465000 496.60000028.966000 568.460000 0.972840 28.775000 539.340000 0.973030 28.659000 524.07000029.116000 589.660000 0.973690 28.925000 560.510000 0.974020 28.813000 545.82000029.260000 609.900000 0.974170 29.066000 580.310000 0.974550 28.951000 565.32000029.406000 630.460000 0.974640 29.208000 600.330000 0.974990 29.089000 584.69000029.551000 651.010000 0.975080 29.349000 620.150000 0.975450 29.227000 604.17000029.699000 671.730000 0.975530 29.492000 640.190000 0.975900 29.367000 623.87000029.847000 692.590000 0.975980 29.636000 660.310000 0.976350 29.508000 643.61000029.998000 713.660000 0.976440 29.780000 680.540000 0.976800 29.649000 663.37000030.148000 734.760000 0.976910 29.925000 700.780000 0.977260 29.790000 683.20000030.301000 756.080000 0.977370 30.071000 721.200000 0.977730 29.932000 703.12000030.454000 777.490000 0.977840 30.218000 741.630000 0.978200 30.075000 723.14000030.608000 799.010000 0.978300 30.365000 762.170000 0.978670 30.219000 743.17000030.763000 820.650000 0.978770 30.513000 782.720000 0.979140 30.362000 763.25000030.919000 842.410000 0.979230 30.661000 803.370000 0.979620 30.507000 783.38000031.076000 864.200000 0.979700 30.810000 824.020000 0.980090 30.651000 803.48000031.233000 886.060000 0.980170 30.959000 844.710000 0.980560 30.795000 823.60000031.391000 907.980000 0.980630 31.109000 865.440000 0.981030 30.940000 843.71000031.549000 929.910000 0.981100 31.259000 886.180000 0.981500 31.085000 863.82000031.707000 951.840000 0.981570 31.409000 906.910000 0.981960 31.230000 883.90000031.866000 973.730000 0.982040 31.559000 927.630000 0.982430 31.375000 903.98000032.024000 995.570000 0.982510 31.708000 948.290000 0.982900 31.520000 924.04000032.181000 1017.300000 0.982980 31.858000 968.910000 0.983370 31.664000 944.07000032.338000 1039.000000 0.983460 32.008000 989.510000 0.983840 31.809000 964.07000032.495000 1060.600000 0.983930 32.157000 1010.100000 0.984320 31.954000 984.03000032.651000 1082.000000 0.984410 32.307000 1030.600000 0.984790 32.098000 1003.90000032.806000 1103.300000 0.984890 32.455000 1051.000000 0.985270 32.242000 1023.80000032.959000 1124.300000 0.985360 32.603000 1071.200000 0.985750 32.386000 1043.60000033.112000 1145.200000 0.985840 32.750000 1091.400000 0.986220 32.530000 1063.20000033.263000 1165.900000 0.986310 32.896000 1111.400000 0.986700 32.672000 1082.80000033.413000 1186.400000 0.986790 33.042000 1131.200000 0.987180 32.814000 1102.20000033.561000 1206.700000 0.987250 33.186000 1150.900000 0.987640 32.955000 1121.50000033.708000 1226.700000 0.987720 33.329000 1170.400000 0.988120 33.094000 1140.60000033.853000 1246.500000 0.988190 33.470000 1189.600000 0.988580 33.232000 1159.40000033.997000 1265.900000 0.988650 33.610000 1208.600000 0.989050 33.369000 1178.10000034.138000 1285.200000 0.989110 33.749000 1227.400000 0.989510 33.504000 1196.50000034.278000 1304.100000 0.989560 33.885000 1246.000000 0.989960 33.638000 1214.70000034.415000 1322.700000 0.990000 34.020000 1264.200000 0.990410 33.769000 1232.60000034.550000 1341.000000 0.990440 34.153000 1282.100000 0.990850 33.899000 1250.20000034.683000 1359.000000 0.990870 34.283000 1299.800000 0.991280 34.026000 1267.50000034.813000 1376.700000 0.991300 34.411000 1317.100000 0.991710 34.152000 1284.50000034.942000 1394.000000 0.991720 34.537000 1334.100000 0.992140 34.275000 1301.20000035.067000 1410.900000 0.992130 34.661000 1350.700000 0.992550 34.396000 1317.70000035.190000 1427.500000 0.992530 34.782000 1367.000000 0.992960 34.515000 1333.70000035.311000 1443.700000 0.992920 34.900000 1383.000000 0.993360 34.632000 1349.50000035.428000 1459.500000 0.993310 35.016000 1398.600000 0.993750 34.746000 1364.80000035.543000 1475.000000 0.993690 35.129000 1413.700000 0.994140 34.857000 1379.80000035.655000 1490.000000 0.994050 35.239000 1428.500000 0.994510 34.966000 1394.500000

35.764000 1504.600000 0.994410 35.347000 1442.900000 0.994870 35.072000 1408.80000035.870000 1518.800000 0.994760 35.451000 1456.900000 0.995230 35.175000 1422.60000035.973000 1532.500000 0.995100 35.553000 1470.600000 0.995580 35.275000 1436.10000036.072000 1545.900000 0.995430 35.652000 1483.800000 0.995910 35.373000 1449.20000036.169000 1558.800000 0.995750 35.747000 1496.500000 0.996240 35.467000 1461.90000036.262000 1571.200000 0.996060 35.840000 1508.900000 0.996560 35.559000 1474.20000036.352000 1583.200000 0.996360 35.929000 1520.800000 0.996860 35.648000 1486.10000036.438000 1594.700000 0.996640 36.015000 1532.300000 0.997160 35.733000 1497.50000036.521000 1605.800000 0.996920 36.098000 1543.300000 0.997450 35.815000 1508.50000036.601000 1616.400000 0.997190 36.178000 1553.900000 0.997720 35.894000 1519.10000036.677000 1626.600000 0.997440 36.254000 1564.000000 0.997990 35.970000 1529.20000036.750000 1636.200000 0.997690 36.327000 1573.700000 0.998240 36.043000 1538.90000036.819000 1645.400000 0.997920 36.396000 1582.900000 0.998480 36.112000 1548.10000036.884000 1654.100000 0.998140 36.462000 1591.700000 0.998710 36.178000 1556.90000036.946000 1662.300000 0.998350 36.525000 1600.000000 0.998930 36.240000 1565.30000037.004000 1670.100000 0.998540 36.584000 1607.900000 0.999130 36.299000 1573.10000037.059000 1677.300000 0.998730 36.639000 1615.200000 0.999320 36.355000 1580.50000037.109000 1684.000000 0.998900 36.691000 1622.100000 0.999510 36.407000 1587.40000037.156000 1690.200000 0.999060 36.739000 1628.500000 0.999680 36.455000 1593.90000037.199000 1695.900000 0.999210 36.784000 1634.400000 0.999830 36.500000 1599.90000037.238000 1701.100000 0.999350 36.825000 1639.800000 0.999970 36.542000 1605.30000037.274000 1705.800000 0.999470 36.862000 1644.700000 1.000000 36.579000 1610.30000037.305000 1709.900000 0.999580 36.895000 1649.200000 1.000000 36.613000 1614.80000037.333000 1713.500000 0.999680 36.925000 1653.100000 1.000000 36.643000 1618.90000037.356000 1716.700000 0.999760 36.951000 1656.500000 1.000000 36.670000 1622.40000037.376000 1719.200000 0.999840 36.973000 1659.400000 1.000000 36.692000 1625.40000037.391000 1721.300000 0.999900 36.991000 1661.800000 1.000000 36.711000 1627.90000037.403000 1722.800000 0.999940 37.006000 1663.700000 1.000000 36.727000 1629.90000037.410000 1723.800000 0.999970 37.016000 1665.100000 1.000000 36.738000 1631.50000037.414000 1724.300000 0.999990 37.023000 1666.000000 1.000000 36.745000 1632.50000037.413000 1724.200000 1.000000 37.026000 1666.400000 1.000000 36.749000 1633.00000037.409000 1723.600000 0.999990 37.025000 1666.300000 1.000000 36.749000 1632.90000037.400000 1722.500000 0.999970 37.020000 1665.600000 1.000000 36.745000 1632.40000037.388000 1720.800000 0.999940 37.011000 1664.400000 1.000000 36.737000 1631.40000037.371000 1718.600000 0.999890 36.998000 1662.700000 1.000000 36.726000 1629.80000037.350000 1715.900000 0.999830 36.981000 1660.500000 1.000000 36.710000 1627.700000

2x31RH 2x31T 2x31flux 2x4RH 2x4T 2x4flux 2x41RH 2x41T 2x41flux
0.941710 23.200000 -263.360000 0.941530 23.200000 -262.650000 0.940130 23.200000 -261.4300000.975370 28.365000 484.120000 0.976280 28.246000 465.870000 0.976840 28.124000 446.5100000.974370 28.564000 512.270000 0.975300 28.454000 495.340000 0.975920 28.343000 477.4500000.975470 28.715000 533.810000 0.976520 28.603000 516.520000 0.977250 28.490000 498.1400000.975990 28.845000 552.210000 0.977000 28.725000 533.750000 0.977680 28.605000 514.3400000.976420 28.974000 570.430000 0.977400 28.846000 550.830000 0.978080 28.719000 530.4500000.976860 29.104000 588.810000 0.977830 28.968000 568.090000 0.978480 28.835000 546.6300000.977290 29.236000 607.490000 0.978250 29.094000 585.750000 0.978880 28.953000 563.2500000.977710 29.369000 626.170000 0.978670 29.220000 603.530000 0.979290 29.073000 580.1400000.978140 29.501000 644.800000 0.979080 29.345000 621.210000 0.979700 29.193000 596.9400000.978560 29.633000 663.490000 0.979490 29.471000 638.950000 0.980110 29.314000 613.8600000.978990 29.766000 682.190000 0.979910 29.598000 656.670000 0.980520 29.434000 630.7500000.979420 29.899000 700.920000 0.980320 29.724000 674.400000 0.980920 29.555000 647.6800000.979860 30.033000 719.630000 0.980730 29.850000 692.100000 0.981320 29.676000 664.5600000.980300 30.166000 738.340000 0.981150 29.976000 709.760000 0.981710 29.796000 681.3500000.980740 30.300000 757.070000 0.981560 30.103000 727.500000 0.982110 29.917000 698.2500000.981170 30.433000 775.770000 0.981980 30.229000 745.190000 0.982510 30.038000 715.1100000.981610 30.566000 794.440000 0.982400 30.356000 762.880000 0.982900 30.159000 731.9600000.982040 30.700000 813.080000 0.982810 30.482000 780.540000 0.983300 30.281000 748.8100000.982460 30.833000 831.670000 0.983220 30.609000 798.170000 0.983700 30.402000 765.6400000.982890 30.966000 850.210000 0.983640 30.735000 815.750000 0.984100 30.523000 782.4400000.983320 31.099000 868.730000 0.984050 30.861000 833.290000 0.984500 30.643000 799.2100000.983740 31.232000 887.220000 0.984460 30.987000 850.790000 0.984900 30.764000 815.9500000.984170 31.364000 905.680000 0.984870 31.112000 868.240000 0.985300 30.885000 832.6300000.984590 31.497000 924.100000 0.985280 31.238000 885.640000 0.985710 31.005000 849.2600000.985020 31.629000 942.470000 0.985690 31.363000 903.000000 0.986110 31.125000 865.8300000.985440 31.762000 960.810000 0.986100 31.488000 920.320000 0.986510 31.244000 882.3500000.985870 31.894000 979.110000 0.986510 31.613000 937.580000 0.986900 31.363000 898.7800000.986300 32.026000 997.360000 0.986910 31.737000 954.770000 0.987300 31.482000 915.1100000.986720 32.157000 1015.500000 0.987320 31.861000 971.860000 0.987700 31.600000 931.3300000.987150 32.288000 1033.600000 0.987730 31.984000 988.860000 0.988090 31.717000 947.4400000.987580 32.419000 1051.600000 0.988130 32.106000 1005.700000 0.988480 31.833000 963.4300000.988000 32.548000 1069.500000 0.988530 32.228000 1022.500000 0.988860 31.948000 979.3100000.988420 32.678000 1087.300000 0.988930 32.349000 1039.200000 0.989240 32.063000 995.0300000.988840 32.806000 1104.900000 0.989330 32.469000 1055.700000 0.989620 32.176000 1010.6000000.989260 32.932000 1122.300000 0.989730 32.588000 1072.000000 0.990000 32.289000 1025.9000000.989670 33.058000 1139.600000 0.990120 32.705000 1088.100000 0.990370 32.400000 1041.2000000.990080 33.182000 1156.600000 0.990510 32.822000 1104.000000 0.990740 32.509000 1056.2000000.990490 33.304000 1173.400000 0.990890 32.936000 1119.700000 0.991100 32.617000 1070.9000000.990890 33.425000 1189.900000 0.991270 33.049000 1135.200000 0.991470 32.724000 1085.5000000.991290 33.544000 1206.200000 0.991650 33.161000 1150.500000 0.991820 32.829000 1099.9000000.991690 33.662000 1222.200000 0.992020 33.271000 1165.500000 0.992180 32.933000 1114.0000000.992080 33.778000 1238.000000 0.992390 33.379000 1180.300000 0.992530 33.035000 1127.9000000.992460 33.891000 1253.500000 0.992750 33.485000 1194.800000 0.992870 33.136000 1141.6000000.992830 34.003000 1268.700000 0.993110 33.590000 1209.000000 0.993210 33.235000 1155.0000000.993200 34.112000 1283.600000 0.993460 33.692000 1223.000000 0.993540 33.332000 1168.2000000.993570 34.219000 1298.100000 0.993810 33.793000 1236.600000 0.993870 33.427000 1181.1000000.993920 34.324000 1312.400000 0.994140 33.891000 1250.000000 0.994190 33.520000 1193.8000000.994270 34.426000 1326.200000 0.994470 33.987000 1263.000000 0.994500 33.611000 1206.200000

0.994600 34.526000 1339.800000 0.994790 34.081000 1275.800000 0.994810 33.700000 1218.2000000.994940 34.623000 1352.900000 0.995110 34.172000 1288.200000 0.995110 33.787000 1230.0000000.995260 34.717000 1365.800000 0.995420 34.261000 1300.300000 0.995400 33.872000 1241.5000000.995570 34.809000 1378.200000 0.995710 34.348000 1312.000000 0.995690 33.955000 1252.7000000.995870 34.898000 1390.200000 0.996000 34.432000 1323.400000 0.995970 34.036000 1263.6000000.996160 34.985000 1401.900000 0.996280 34.514000 1334.400000 0.996240 34.114000 1274.2000000.996450 35.068000 1413.200000 0.996560 34.593000 1345.100000 0.996500 34.190000 1284.4000000.996720 35.149000 1424.100000 0.996820 34.669000 1355.400000 0.996760 34.263000 1294.3000000.996990 35.226000 1434.500000 0.997070 34.743000 1365.400000 0.997000 34.334000 1303.9000000.997240 35.301000 1444.600000 0.997320 34.813000 1374.900000 0.997240 34.403000 1313.2000000.997490 35.372000 1454.200000 0.997550 34.881000 1384.100000 0.997470 34.469000 1322.0000000.997720 35.441000 1463.400000 0.997780 34.947000 1392.900000 0.997690 34.532000 1330.6000000.997950 35.506000 1472.200000 0.997990 35.009000 1401.300000 0.997900 34.593000 1338.7000000.998160 35.568000 1480.600000 0.998200 35.068000 1409.300000 0.998110 34.651000 1346.5000000.998360 35.627000 1488.500000 0.998390 35.125000 1416.900000 0.998300 34.706000 1354.0000000.998550 35.683000 1496.000000 0.998570 35.178000 1424.100000 0.998480 34.759000 1361.0000000.998730 35.735000 1503.000000 0.998750 35.229000 1430.900000 0.998650 34.809000 1367.7000000.998900 35.784000 1509.600000 0.998910 35.276000 1437.300000 0.998820 34.856000 1374.1000000.999050 35.830000 1515.800000 0.999070 35.321000 1443.200000 0.998970 34.900000 1380.0000000.999200 35.873000 1521.500000 0.999210 35.362000 1448.800000 0.999110 34.941000 1385.5000000.999330 35.912000 1526.700000 0.999340 35.400000 1453.900000 0.999250 34.979000 1390.7000000.999450 35.947000 1531.500000 0.999460 35.435000 1458.600000 0.999370 35.015000 1395.4000000.999560 35.980000 1535.800000 0.999560 35.467000 1462.900000 0.999480 35.047000 1399.7000000.999660 36.008000 1539.700000 0.999660 35.496000 1466.700000 0.999590 35.077000 1403.7000000.999750 36.034000 1543.100000 0.999750 35.521000 1470.100000 0.999680 35.103000 1407.2000000.999820 36.056000 1546.000000 0.999820 35.543000 1473.100000 0.999760 35.126000 1410.3000000.999880 36.074000 1548.500000 0.999890 35.562000 1475.600000 0.999830 35.147000 1413.1000000.999930 36.089000 1550.500000 0.999940 35.578000 1477.700000 0.999890 35.164000 1415.4000000.999970 36.100000 1552.000000 0.999980 35.590000 1479.400000 0.999940 35.178000 1417.2000000.999990 36.108000 1553.000000 1.000000 35.599000 1480.600000 0.999970 35.189000 1418.7000001.000000 36.113000 1553.600000 1.000000 35.605000 1481.300000 1.000000 35.197000 1419.8000001.000000 36.113000 1553.700000 1.000000 35.607000 1481.700000 1.000000 35.202000 1420.4000001.000000 36.111000 1553.400000 1.000000 35.606000 1481.500000 1.000000 35.203000 1420.6000000.999970 36.104000 1552.500000 1.000000 35.602000 1481.000000 1.000000 35.201000 1420.4000000.999930 36.094000 1551.200000 0.999970 35.594000 1479.900000 1.000000 35.197000 1419.8000000.999890 36.081000 1549.300000 0.999930 35.583000 1478.500000 0.999970 35.189000 1418.700000

2x5RH 2x5T 2x5flux 2x51RH 2x51T 2x51flux 2x6RH 2x6T 2x6flux
0.936620 23.200000 -258.250000 0.929740 23.200000 -255.970000 0.919470 23.200000 -254.3100000.977040 27.999000 423.600000 0.975060 27.897000 405.790000 0.970740 27.830000 393.9500000.976080 28.227000 455.460000 0.974020 28.138000 439.120000 0.969640 28.098000 430.7700000.977560 28.378000 476.440000 0.975680 28.294000 460.620000 0.971520 28.268000 454.0900000.977980 28.489000 491.900000 0.976100 28.404000 475.910000 0.972010 28.391000 470.9800000.978340 28.598000 507.130000 0.976450 28.512000 490.800000 0.972440 28.511000 487.4200000.978730 28.709000 522.520000 0.976840 28.622000 505.960000 0.972890 28.633000 504.1500000.979120 28.823000 538.380000 0.977230 28.736000 521.570000 0.973360 28.758000 521.3500000.979530 28.940000 554.700000 0.977650 28.854000 537.810000 0.973860 28.889000 539.1900000.979940 29.057000 570.930000 0.978080 28.971000 553.980000 0.974380 29.019000 556.9200000.980350 29.176000 587.330000 0.978510 29.090000 570.290000 0.974880 29.149000 574.6700000.980760 29.294000 603.740000 0.978940 29.209000 586.680000 0.975400 29.279000 592.5000000.981170 29.414000 620.250000 0.979370 29.329000 603.140000 0.975900 29.409000 610.2100000.981570 29.532000 636.640000 0.979800 29.449000 619.590000 0.976430 29.541000 628.1000000.982000 29.654000 653.450000 0.980230 29.571000 636.240000 0.976810 29.675000 646.3200000.982390 29.772000 669.690000 0.980670 29.691000 652.680000 0.977420 29.803000 663.7300000.982800 29.892000 686.220000 0.981100 29.812000 669.240000 0.977920 29.934000 681.5200000.983210 30.012000 702.750000 0.981530 29.934000 685.830000 0.978430 30.066000 699.3600000.983610 30.132000 719.260000 0.981970 30.055000 702.430000 0.978940 30.198000 717.2300000.984020 30.252000 735.750000 0.982400 30.177000 718.990000 0.979440 30.330000 735.0500000.984430 30.372000 752.210000 0.982830 30.298000 735.510000 0.979940 30.461000 752.8300000.984830 30.491000 768.640000 0.983250 30.419000 751.980000 0.980440 30.593000 770.5800000.985240 30.611000 785.010000 0.983680 30.540000 768.390000 0.980930 30.724000 788.2900000.985650 30.730000 801.320000 0.984100 30.660000 784.730000 0.981430 30.855000 805.9500000.986050 30.848000 817.560000 0.984520 30.780000 800.990000 0.981920 30.986000 823.5600000.986460 30.967000 833.740000 0.984950 30.900000 817.180000 0.982410 31.116000 841.1300000.986860 31.085000 849.860000 0.985370 31.019000 833.310000 0.982910 31.247000 858.6200000.987260 31.202000 865.880000 0.985790 31.137000 849.340000 0.983400 31.376000 875.9900000.987660 31.319000 881.790000 0.986210 31.255000 865.270000 0.983880 31.505000 893.2200000.988060 31.435000 897.600000 0.986630 31.372000 881.100000 0.984370 31.632000 910.3400000.988460 31.550000 913.290000 0.987050 31.489000 896.820000 0.984850 31.759000 927.3400000.988860 31.665000 928.870000 0.987470 31.604000 912.420000 0.985330 31.885000 944.2000000.989240 31.779000 944.350000 0.987870 31.720000 927.920000 0.985800 32.011000 960.9600000.989630 31.892000 959.690000 0.988290 31.834000 943.300000 0.986280 32.135000 977.5800000.990020 32.004000 974.900000 0.988700 31.947000 958.590000 0.986750 32.259000 994.0800000.990400 32.115000 989.960000 0.989100 32.060000 973.740000 0.987220 32.382000 1010.5000000.990780 32.225000 1004.900000 0.989510 32.172000 988.750000 0.987690 32.504000 1026.7000000.991160 32.334000 1019.600000 0.989910 32.283000 1003.600000 0.988150 32.625000 1042.7000000.991530 32.441000 1034.100000 0.990300 32.392000 1018.200000 0.988610 32.744000 1058.6000000.991900 32.547000 1048.400000 0.990690 32.499000 1032.600000 0.989070 32.863000 1074.3000000.992270 32.652000 1062.500000 0.991080 32.606000 1046.900000 0.989520 32.979000 1089.7000000.992630 32.755000 1076.400000 0.991470 32.711000 1060.900000 0.989970 33.094000 1105.0000000.992980 32.856000 1090.100000 0.991840 32.814000 1074.700000 0.990410 33.208000 1120.0000000.993330 32.956000 1103.600000 0.992220 32.916000 1088.200000 0.990840 33.320000 1134.8000000.993680 33.054000 1116.800000 0.992580 33.016000 1101.600000 0.991270 33.430000 1149.3000000.994020 33.151000 1129.700000 0.992940 33.114000 1114.700000 0.991690 33.538000 1163.6000000.994350 33.245000 1142.400000 0.993300 33.210000 1127.500000 0.992100 33.644000 1177.6000000.994680 33.338000 1154.900000 0.993640 33.305000 1140.100000 0.992510 33.748000 1191.3000000.994990 33.428000 1167.000000 0.993980 33.397000 1152.300000 0.992900 33.850000 1204.700000

0.995300 33.517000 1178.900000 0.994310 33.488000 1164.400000 0.993290 33.950000 1217.8000000.995610 33.604000 1190.500000 0.994640 33.576000 1176.100000 0.993680 34.047000 1230.7000000.995910 33.688000 1201.800000 0.994960 33.662000 1187.500000 0.994050 34.142000 1243.1000000.996200 33.770000 1212.800000 0.995260 33.746000 1198.700000 0.994410 34.235000 1255.3000000.996480 33.850000 1223.500000 0.995570 33.828000 1209.500000 0.994760 34.325000 1267.2000000.996750 33.928000 1233.900000 0.995860 33.907000 1220.000000 0.995110 34.413000 1278.7000000.997020 34.003000 1243.900000 0.996140 33.984000 1230.200000 0.995440 34.498000 1289.8000000.997280 34.076000 1253.700000 0.996420 34.059000 1240.100000 0.995770 34.581000 1300.6000000.997530 34.147000 1263.100000 0.996690 34.131000 1249.700000 0.996080 34.661000 1311.1000000.997770 34.215000 1272.200000 0.996950 34.201000 1258.900000 0.996390 34.738000 1321.2000000.998000 34.281000 1280.900000 0.997200 34.269000 1267.800000 0.996680 34.813000 1330.9000000.998220 34.344000 1289.300000 0.997440 34.333000 1276.300000 0.996960 34.884000 1340.2000000.998440 34.404000 1297.400000 0.997670 34.395000 1284.500000 0.997230 34.952000 1349.2000000.998640 34.462000 1305.000000 0.997890 34.454000 1292.300000 0.997490 35.018000 1357.7000000.998830 34.517000 1312.400000 0.998090 34.511000 1299.700000 0.997740 35.080000 1365.9000000.999020 34.569000 1319.300000 0.998290 34.565000 1306.800000 0.997970 35.140000 1373.6000000.999190 34.619000 1325.900000 0.998480 34.616000 1313.500000 0.998190 35.196000 1380.9000000.999360 34.666000 1332.100000 0.998660 34.664000 1319.900000 0.998400 35.249000 1387.9000000.999520 34.710000 1338.000000 0.998830 34.709000 1325.900000 0.998600 35.300000 1394.4000000.999660 34.751000 1343.400000 0.998980 34.752000 1331.500000 0.998790 35.347000 1400.5000000.999790 34.789000 1348.500000 0.999130 34.792000 1336.700000 0.998960 35.391000 1406.2000000.999920 34.825000 1353.200000 0.999270 34.828000 1341.500000 0.999120 35.431000 1411.5000001.000000 34.857000 1357.500000 0.999390 34.862000 1346.000000 0.999270 35.469000 1416.4000001.000000 34.887000 1361.500000 0.999510 34.893000 1350.000000 0.999400 35.503000 1420.8000001.000000 34.914000 1365.000000 0.999610 34.921000 1353.700000 0.999520 35.534000 1424.8000001.000000 34.937000 1368.200000 0.999700 34.946000 1357.000000 0.999630 35.561000 1428.4000001.000000 34.958000 1370.900000 0.999780 34.968000 1359.900000 0.999730 35.586000 1431.6000001.000000 34.976000 1373.300000 0.999850 34.987000 1362.400000 0.999810 35.607000 1434.3000001.000000 34.991000 1375.200000 0.999910 35.003000 1364.500000 0.999880 35.624000 1436.5000001.000000 35.002000 1376.800000 0.999960 35.016000 1366.200000 0.999940 35.638000 1438.4000001.000000 35.011000 1377.900000 1.000000 35.026000 1367.500000 0.999980 35.649000 1439.8000001.000000 35.017000 1378.700000 1.000000 35.033000 1368.400000 1.000000 35.656000 1440.7000001.000000 35.019000 1379.000000 1.000000 35.037000 1368.900000 1.000000 35.660000 1441.2000001.000000 35.019000 1379.000000 1.000000 35.037000 1369.000000 1.000000 35.660000 1441.2000001.000000 35.015000 1378.500000 1.000000 35.035000 1368.600000 1.000000 35.657000 1440.8000001.000000 35.008000 1377.600000 1.000000 35.029000 1367.900000 0.999990 35.650000 1440.000000

2x61RH 2x61T 2x61flux 2x7RH 2x7T 2x7flux 2x71RH 2x71T 2x71flux
0.916700 23.200000 -252.080000 0.922810 23.200000 -249.050000 0.914330 23.200000 -244.5200000.969960 27.753000 379.960000 0.972880 27.667000 363.720000 0.971530 27.565000 343.5700000.968760 28.039000 418.970000 0.971540 27.962000 403.590000 0.970120 27.884000 385.9000000.970880 28.214000 442.830000 0.973900 28.136000 426.920000 0.972680 28.053000 408.3300000.971370 28.338000 459.750000 0.974330 28.252000 442.660000 0.973030 28.168000 423.5300000.971810 28.459000 476.200000 0.974750 28.366000 457.870000 0.973440 28.280000 438.2200000.972280 28.583000 492.990000 0.975190 28.481000 473.430000 0.973860 28.393000 453.2500000.972770 28.709000 510.160000 0.975630 28.599000 489.200000 0.974290 28.508000 468.3900000.973280 28.840000 527.870000 0.976090 28.719000 505.350000 0.974730 28.626000 483.8600000.973810 28.970000 545.490000 0.976560 28.839000 521.420000 0.975170 28.744000 499.4300000.974320 29.100000 563.060000 0.977030 28.959000 537.420000 0.975630 28.864000 515.2700000.974830 29.230000 580.680000 0.977460 29.078000 553.400000 0.976100 28.984000 530.9500000.975370 29.360000 598.240000 0.977960 29.198000 569.350000 0.976540 29.116000 548.3500000.975850 29.497000 616.720000 0.978320 29.336000 587.850000 0.977230 29.213000 561.0600000.976520 29.602000 630.960000 0.979250 29.386000 594.560000 0.977550 29.443000 591.1300000.976920 29.754000 651.360000 0.979340 29.564000 618.300000 0.978030 29.481000 596.2100000.977430 29.885000 669.080000 0.979820 29.687000 634.620000 0.978510 29.604000 612.2900000.977950 30.017000 686.750000 0.980280 29.809000 650.870000 0.978980 29.727000 628.3800000.978470 30.149000 704.480000 0.980750 29.932000 667.210000 0.979470 29.852000 644.7000000.978990 30.281000 722.190000 0.981220 30.055000 683.560000 0.979960 29.979000 661.1700000.979500 30.413000 739.870000 0.981680 30.178000 699.830000 0.980450 30.105000 677.6000000.980010 30.544000 757.530000 0.982150 30.300000 716.060000 0.980940 30.231000 694.0100000.980520 30.676000 775.150000 0.982610 30.423000 732.280000 0.981440 30.357000 710.4100000.981030 30.808000 792.740000 0.983070 30.545000 748.470000 0.981920 30.483000 726.7600000.981540 30.939000 810.290000 0.983520 30.667000 764.610000 0.982410 30.608000 743.0600000.982040 31.070000 827.780000 0.983980 30.789000 780.700000 0.982890 30.734000 759.3000000.982540 31.201000 845.210000 0.984430 30.910000 796.710000 0.983370 30.858000 775.4400000.983040 31.331000 862.490000 0.984880 31.031000 812.600000 0.983840 30.982000 791.4600000.983540 31.460000 879.640000 0.985330 31.151000 828.370000 0.984310 31.105000 807.3400000.984040 31.588000 896.670000 0.985780 31.270000 844.020000 0.984780 31.227000 823.0900000.984530 31.715000 913.560000 0.986220 31.388000 859.550000 0.985240 31.348000 838.7100000.985020 31.842000 930.320000 0.986660 31.505000 874.950000 0.985700 31.468000 854.2000000.985500 31.967000 946.970000 0.987100 31.621000 890.250000 0.986160 31.587000 869.5800000.985990 32.092000 963.490000 0.987540 31.737000 905.410000 0.986610 31.705000 884.8200000.986470 32.216000 979.860000 0.987980 31.852000 920.430000 0.987060 31.823000 899.9300000.986950 32.339000 996.100000 0.988410 31.966000 935.310000 0.987510 31.939000 914.8800000.987420 32.461000 1012.200000 0.988830 32.078000 950.060000 0.987960 32.055000 929.7100000.987890 32.582000 1028.100000 0.989260 32.190000 964.630000 0.988400 32.169000 944.3600000.988360 32.701000 1043.900000 0.989680 32.300000 979.020000 0.988840 32.282000 958.8300000.988820 32.819000 1059.400000 0.990090 32.409000 993.220000 0.989270 32.393000 973.1200000.989280 32.936000 1074.800000 0.990500 32.516000 1007.200000 0.989690 32.504000 987.2200000.989740 33.051000 1090.000000 0.990900 32.622000 1021.000000 0.990120 32.612000 1001.1000000.990180 33.165000 1104.900000 0.991300 32.727000 1034.600000 0.990530 32.720000 1014.8000000.990620 33.277000 1119.600000 0.991690 32.830000 1048.000000 0.990940 32.825000 1028.3000000.991060 33.387000 1134.000000 0.992070 32.931000 1061.200000 0.991350 32.930000 1041.6000000.991490 33.496000 1148.200000 0.992450 33.031000 1074.100000 0.991750 33.032000 1054.6000000.991910 33.602000 1162.100000 0.992830 33.128000 1086.800000 0.992140 33.132000 1067.4000000.992320 33.707000 1175.800000 0.993190 33.224000 1099.200000 0.992530 33.231000 1080.0000000.992720 33.809000 1189.100000 0.993550 33.318000 1111.400000 0.992900 33.328000 1092.300000

0.993120 33.909000 1202.200000 0.993890 33.410000 1123.300000 0.993270 33.423000 1104.4000000.993510 34.007000 1215.000000 0.994240 33.500000 1134.900000 0.993640 33.516000 1116.1000000.993880 34.103000 1227.400000 0.994570 33.588000 1146.300000 0.993990 33.606000 1127.6000000.994250 34.196000 1239.600000 0.994900 33.674000 1157.300000 0.994340 33.695000 1138.9000000.994610 34.287000 1251.400000 0.995220 33.757000 1168.100000 0.994680 33.781000 1149.8000000.994960 34.375000 1262.900000 0.995530 33.838000 1178.600000 0.995010 33.865000 1160.4000000.995300 34.461000 1274.000000 0.995830 33.917000 1188.700000 0.995330 33.947000 1170.8000000.995630 34.544000 1284.800000 0.996120 33.993000 1198.500000 0.995650 34.026000 1180.8000000.995950 34.624000 1295.200000 0.996400 34.067000 1208.100000 0.995950 34.103000 1190.5000000.996270 34.702000 1305.300000 0.996680 34.139000 1217.300000 0.996250 34.177000 1199.9000000.996570 34.777000 1315.000000 0.996940 34.208000 1226.200000 0.996530 34.249000 1209.0000000.996850 34.849000 1324.300000 0.997200 34.274000 1234.700000 0.996810 34.318000 1217.7000000.997130 34.918000 1333.300000 0.997440 34.338000 1242.900000 0.997070 34.385000 1226.1000000.997390 34.984000 1341.800000 0.997680 34.399000 1250.700000 0.997330 34.449000 1234.1000000.997640 35.047000 1350.000000 0.997900 34.457000 1258.200000 0.997570 34.510000 1241.8000000.997880 35.107000 1357.800000 0.998110 34.513000 1265.300000 0.997800 34.568000 1249.2000000.998110 35.164000 1365.100000 0.998310 34.566000 1272.100000 0.998020 34.624000 1256.2000000.998320 35.218000 1372.100000 0.998500 34.616000 1278.500000 0.998230 34.677000 1262.8000000.998530 35.269000 1378.700000 0.998690 34.663000 1284.600000 0.998430 34.727000 1269.1000000.998720 35.317000 1384.800000 0.998860 34.707000 1290.200000 0.998620 34.774000 1275.0000000.998890 35.361000 1390.500000 0.999020 34.749000 1295.500000 0.998800 34.818000 1280.6000000.999060 35.403000 1395.900000 0.999160 34.787000 1300.500000 0.998960 34.859000 1285.7000000.999210 35.441000 1400.800000 0.999300 34.823000 1305.000000 0.999120 34.897000 1290.5000000.999350 35.476000 1405.300000 0.999420 34.856000 1309.200000 0.999260 34.933000 1295.0000000.999480 35.507000 1409.300000 0.999540 34.885000 1313.000000 0.999390 34.965000 1299.0000000.999590 35.536000 1413.000000 0.999640 34.912000 1316.400000 0.999510 34.994000 1302.6000000.999690 35.560000 1416.200000 0.999730 34.935000 1319.400000 0.999620 35.020000 1305.9000000.999770 35.582000 1419.000000 0.999810 34.956000 1322.000000 0.999710 35.043000 1308.8000000.999850 35.600000 1421.300000 0.999870 34.973000 1324.200000 0.999790 35.063000 1311.2000000.999900 35.615000 1423.200000 0.999930 34.987000 1326.000000 0.999850 35.079000 1313.3000000.999950 35.626000 1424.600000 0.999970 34.998000 1327.500000 0.999910 35.093000 1315.0000000.999980 35.634000 1425.600000 1.000000 35.006000 1328.500000 0.999960 35.103000 1316.3000001.000000 35.638000 1426.200000 1.000000 35.011000 1329.100000 0.999990 35.110000 1317.2000001.000000 35.639000 1426.300000 1.000000 35.013000 1329.300000 1.000000 35.114000 1317.7000000.999990 35.636000 1425.900000 1.000000 35.011000 1329.100000 1.000000 35.114000 1317.7000000.999960 35.630000 1425.100000 0.999990 35.007000 1328.500000 1.000000 35.112000 1317.400000

2x8RH 2x8T 2x8flux 2x81RH 2x81T 2x81flux 2x9RH 2x9T 2x9flux
0.900300 23.200000 -239.370000 0.885050 23.200000 -231.430000 0.868900 23.200000 -221.7900000.968470 27.464000 323.320000 0.965840 27.340000 297.040000 0.964710 27.208000 268.7600000.966940 27.808000 367.990000 0.964460 27.721000 344.820000 0.963490 27.619000 318.2200000.969690 27.977000 389.900000 0.967240 27.885000 365.470000 0.966170 27.775000 337.0500000.970030 28.096000 405.260000 0.967570 28.010000 381.050000 0.966550 27.902000 352.3200000.970440 28.208000 419.820000 0.968030 28.128000 395.900000 0.967030 28.023000 366.8300000.970870 28.324000 434.750000 0.968490 28.249000 411.050000 0.967510 28.146000 381.6000000.971290 28.439000 449.660000 0.968940 28.371000 426.290000 0.967970 28.271000 396.5100000.971730 28.557000 464.900000 0.969410 28.495000 441.690000 0.968440 28.396000 411.5300000.972170 28.677000 480.360000 0.969890 28.621000 457.430000 0.968930 28.524000 426.7900000.972670 28.802000 496.450000 0.970410 28.751000 473.610000 0.969470 28.656000 442.5500000.973150 28.930000 512.860000 0.970920 28.886000 490.400000 0.970000 28.790000 458.6000000.973740 29.058000 529.370000 0.971560 29.015000 506.440000 0.970590 28.926000 474.8500000.974250 29.187000 545.890000 0.972110 29.139000 521.880000 0.971300 29.033000 487.6400000.974740 29.377000 570.320000 0.972170 29.372000 550.850000 0.970720 29.329000 522.7800000.975210 29.438000 578.160000 0.973110 29.418000 556.570000 0.972210 29.335000 523.5500000.975790 29.573000 595.450000 0.973720 29.551000 572.940000 0.972830 29.464000 538.8700000.976290 29.701000 611.820000 0.974250 29.689000 590.040000 0.973390 29.607000 555.7900000.976800 29.830000 628.300000 0.974800 29.827000 607.120000 0.973940 29.749000 572.6900000.977340 29.962000 645.070000 0.975370 29.965000 624.160000 0.974530 29.890000 589.4000000.977870 30.093000 661.870000 0.975940 30.103000 641.160000 0.975110 30.031000 606.0800000.978410 30.225000 678.640000 0.976510 30.240000 658.130000 0.975690 30.172000 622.7400000.978950 30.357000 695.400000 0.977080 30.378000 675.090000 0.976280 30.313000 639.3800000.979480 30.488000 712.120000 0.977650 30.516000 692.010000 0.976860 30.454000 655.9900000.980020 30.619000 728.820000 0.978220 30.653000 708.900000 0.977440 30.595000 672.5500000.980550 30.751000 745.470000 0.978790 30.791000 725.750000 0.978030 30.735000 689.0700000.981080 30.881000 762.050000 0.979360 30.928000 742.550000 0.978610 30.875000 705.5200000.981610 31.011000 778.540000 0.979920 31.064000 759.250000 0.979180 31.014000 721.8500000.982140 31.141000 794.900000 0.980480 31.200000 775.840000 0.979750 31.152000 738.0500000.982660 31.269000 811.140000 0.981040 31.334000 792.310000 0.980320 31.289000 754.1100000.983180 31.397000 827.250000 0.981600 31.468000 808.660000 0.980890 31.425000 770.0200000.983700 31.523000 843.240000 0.982150 31.601000 824.890000 0.981460 31.560000 785.8000000.984200 31.649000 859.110000 0.982690 31.733000 841.000000 0.982000 31.694000 801.4600000.984710 31.774000 874.860000 0.983240 31.865000 856.980000 0.982560 31.828000 817.0100000.985220 31.898000 890.450000 0.983780 31.995000 872.830000 0.983100 31.960000 832.4400000.985720 32.021000 905.890000 0.984320 32.124000 888.550000 0.983650 32.092000 847.7900000.986220 32.143000 921.190000 0.984850 32.253000 904.140000 0.984190 32.223000 863.0600000.986710 32.263000 936.310000 0.985380 32.380000 919.570000 0.984730 32.353000 878.2000000.987200 32.383000 951.250000 0.985910 32.506000 934.830000 0.985270 32.482000 893.1900000.987690 32.500000 966.000000 0.986430 32.631000 949.900000 0.985810 32.610000 908.0200000.988170 32.617000 980.560000 0.986950 32.754000 964.790000 0.986350 32.737000 922.6700000.988640 32.731000 994.910000 0.987470 32.876000 979.480000 0.986880 32.861000 937.1200000.989110 32.845000 1009.000000 0.987970 32.996000 993.970000 0.987390 32.985000 951.3700000.989580 32.956000 1023.000000 0.988470 33.114000 1008.200000 0.987910 33.106000 965.4200000.990040 33.066000 1036.700000 0.988970 33.231000 1022.300000 0.988420 33.226000 979.2600000.990490 33.174000 1050.100000 0.989470 33.346000 1036.100000 0.988920 33.344000 992.8800000.990940 33.280000 1063.300000 0.989950 33.459000 1049.700000 0.989420 33.460000 1006.3000000.991380 33.384000 1076.300000 0.990430 33.570000 1063.000000 0.989910 33.575000 1019.4000000.991810 33.486000 1089.000000 0.990890 33.679000 1076.100000 0.990390 33.687000 1032.300000

0.992230 33.586000 1101.400000 0.991350 33.785000 1088.900000 0.990860 33.797000 1045.0000000.992650 33.684000 1113.500000 0.991810 33.890000 1101.400000 0.991330 33.905000 1057.3000000.993060 33.780000 1125.400000 0.992250 33.992000 1113.700000 0.991780 34.010000 1069.5000000.993460 33.873000 1137.000000 0.992690 34.092000 1125.600000 0.992230 34.114000 1081.3000000.993850 33.965000 1148.300000 0.993100 34.190000 1137.300000 0.992660 34.215000 1092.9000000.994220 34.053000 1159.200000 0.993520 34.284000 1148.600000 0.993090 34.313000 1104.1000000.994600 34.139000 1169.800000 0.993930 34.376000 1159.600000 0.993510 34.408000 1115.0000000.994960 34.223000 1180.200000 0.994320 34.467000 1170.400000 0.993910 34.502000 1125.7000000.995310 34.305000 1190.300000 0.994700 34.555000 1180.800000 0.994310 34.593000 1136.1000000.995650 34.383000 1200.000000 0.995070 34.640000 1191.000000 0.994690 34.681000 1146.2000000.995980 34.459000 1209.300000 0.995430 34.721000 1200.600000 0.995070 34.766000 1155.8000000.996300 34.533000 1218.500000 0.995780 34.801000 1210.100000 0.995420 34.849000 1165.3000000.996610 34.603000 1227.000000 0.996120 34.876000 1219.100000 0.995780 34.928000 1174.3000000.996900 34.671000 1235.400000 0.996440 34.950000 1227.800000 0.996110 35.004000 1183.0000000.997180 34.736000 1243.500000 0.996740 35.021000 1236.200000 0.996430 35.078000 1191.4000000.997450 34.798000 1251.000000 0.997040 35.088000 1244.200000 0.996740 35.149000 1199.4000000.997710 34.857000 1258.300000 0.997330 35.151000 1251.700000 0.997040 35.216000 1207.0000000.997960 34.913000 1265.200000 0.997600 35.213000 1259.000000 0.997330 35.281000 1214.4000000.998200 34.966000 1271.700000 0.997860 35.271000 1265.900000 0.997600 35.342000 1221.3000000.998420 35.016000 1277.800000 0.998100 35.326000 1272.400000 0.997860 35.400000 1227.9000000.998630 35.063000 1283.600000 0.998330 35.377000 1278.500000 0.998100 35.455000 1234.1000000.998820 35.107000 1289.000000 0.998550 35.426000 1284.200000 0.998330 35.506000 1239.9000000.999000 35.148000 1294.000000 0.998750 35.471000 1289.500000 0.998550 35.554000 1245.4000000.999170 35.185000 1298.600000 0.998940 35.512000 1294.400000 0.998750 35.599000 1250.5000000.999320 35.219000 1302.800000 0.999120 35.550000 1298.900000 0.998940 35.640000 1255.1000000.999470 35.251000 1306.700000 0.999280 35.587000 1303.200000 0.999120 35.679000 1259.5000000.999590 35.278000 1309.900000 0.999420 35.616000 1306.700000 0.999280 35.713000 1263.3000000.999700 35.302000 1312.900000 0.999550 35.644000 1310.000000 0.999420 35.744000 1266.8000000.999800 35.325000 1315.700000 0.999670 35.670000 1313.100000 0.999550 35.772000 1270.0000000.999880 35.343000 1317.900000 0.999760 35.692000 1315.600000 0.999660 35.796000 1272.7000000.999950 35.357000 1319.700000 0.999850 35.709000 1317.700000 0.999760 35.816000 1275.1000001.000000 35.369000 1321.100000 0.999920 35.723000 1319.400000 0.999840 35.834000 1277.0000001.000000 35.376000 1322.000000 0.999970 35.734000 1320.600000 0.999910 35.847000 1278.5000001.000000 35.382000 1322.700000 1.000000 35.742000 1321.500000 0.999960 35.857000 1279.6000001.000000 35.382000 1322.700000 1.000000 35.745000 1321.900000 0.999990 35.863000 1280.3000001.000000 35.380000 1322.400000 1.000000 35.744000 1321.800000 1.000000 35.866000 1280.600000

2x91RH 2x91T 2x91flux 2x10RH 2x10T 2x10flux 2x101RH 2x101T 2x101flux
0.831210 23.200000 -208.680000 0.770730 23.200000 -188.670000 0.603960 23.200000 -149.6600000.961200 27.097000 240.260000 0.957210 26.985000 205.810000 0.943950 26.925000 158.5300000.960050 27.540000 290.590000 0.955970 27.461000 254.630000 0.942710 27.484000 204.1200000.962580 27.696000 308.220000 0.958540 27.620000 270.950000 0.945640 27.674000 219.5900000.963150 27.831000 323.550000 0.959150 27.760000 285.310000 0.946770 27.844000 233.4300000.963660 27.960000 338.060000 0.959780 27.898000 299.400000 0.947960 28.008000 246.7200000.964200 28.091000 352.820000 0.960410 28.038000 313.750000 0.949070 28.174000 260.1500000.964720 28.222000 367.680000 0.961040 28.181000 328.310000 0.950130 28.341000 273.6800000.965280 28.356000 382.710000 0.961700 28.326000 343.100000 0.951200 28.508000 287.1600000.965820 28.490000 397.840000 0.962350 28.472000 358.040000 0.952130 28.680000 300.9900000.966430 28.628000 413.300000 0.963060 28.621000 373.200000 0.953160 28.846000 314.4100000.967010 28.768000 429.020000 0.963720 28.774000 388.760000 0.953960 29.026000 328.9500000.967670 28.910000 445.060000 0.964370 28.927000 404.280000 0.954650 29.205000 343.3300000.968460 29.027000 458.120000 0.965360 29.088000 420.590000 0.956290 29.368000 356.4200000.967150 29.393000 499.280000 0.962940 29.415000 453.750000 0.949230 29.932000 401.7500000.969430 29.339000 493.110000 0.966400 29.386000 450.760000 0.957480 29.743000 386.4600000.970160 29.473000 508.060000 0.967110 29.532000 465.520000 0.958480 29.912000 400.0300000.970750 29.622000 524.640000 0.967740 29.691000 481.560000 0.959500 30.097000 414.7600000.971340 29.771000 541.240000 0.968340 29.850000 497.620000 0.960500 30.276000 429.0600000.971980 29.918000 557.630000 0.968970 30.006000 513.270000 0.961520 30.454000 443.2500000.972610 30.065000 573.990000 0.969600 30.160000 528.830000 0.962560 30.631000 457.3400000.973240 30.212000 590.360000 0.970250 30.315000 544.310000 0.963620 30.807000 471.3200000.973860 30.359000 606.710000 0.970910 30.468000 559.670000 0.964680 30.982000 485.2200000.974470 30.506000 622.990000 0.971570 30.620000 574.910000 0.965720 31.156000 499.0500000.975090 30.652000 639.230000 0.972240 30.771000 590.060000 0.966750 31.330000 512.8000000.975700 30.799000 655.430000 0.972920 30.921000 605.090000 0.967780 31.503000 526.4800000.976330 30.945000 671.550000 0.973620 31.071000 620.060000 0.968790 31.675000 540.0800000.976950 31.089000 687.550000 0.974310 31.220000 634.960000 0.969780 31.847000 553.6200000.977570 31.233000 703.390000 0.975000 31.369000 649.790000 0.970760 32.018000 567.0700000.978200 31.376000 719.090000 0.975700 31.517000 664.540000 0.971720 32.187000 580.4000000.978830 31.517000 734.640000 0.976390 31.664000 679.200000 0.972670 32.356000 593.6400000.979450 31.657000 750.060000 0.977090 31.811000 693.770000 0.973620 32.523000 606.7600000.980060 31.797000 765.400000 0.977770 31.957000 708.300000 0.974540 32.690000 619.8100000.980670 31.936000 780.650000 0.978460 32.103000 722.750000 0.975470 32.855000 632.7700000.981270 32.074000 795.810000 0.979140 32.248000 737.100000 0.976380 33.019000 645.5800000.981870 32.212000 810.910000 0.979810 32.392000 751.360000 0.977280 33.182000 658.2500000.982470 32.349000 825.940000 0.980480 32.536000 765.530000 0.978170 33.343000 670.8000000.983070 32.486000 840.870000 0.981150 32.678000 779.580000 0.979050 33.502000 683.1900000.983670 32.622000 855.670000 0.981820 32.819000 793.480000 0.979920 33.659000 695.3800000.984260 32.756000 870.320000 0.982480 32.959000 807.240000 0.980780 33.814000 707.4000000.984850 32.889000 884.810000 0.983140 33.097000 820.830000 0.981630 33.966000 719.2300000.985440 33.020000 899.090000 0.983790 33.234000 834.250000 0.982460 34.116000 730.8600000.986010 33.150000 913.150000 0.984430 33.368000 847.480000 0.983280 34.264000 742.2700000.986580 33.277000 927.010000 0.985060 33.501000 860.510000 0.984090 34.409000 753.4800000.987140 33.403000 940.660000 0.985690 33.632000 873.360000 0.984880 34.551000 764.4700000.987690 33.527000 954.080000 0.986310 33.762000 885.980000 0.985660 34.691000 775.2400000.988240 33.649000 967.290000 0.986920 33.889000 898.400000 0.986430 34.828000 785.7800000.988780 33.769000 980.250000 0.987520 34.013000 910.580000 0.987180 34.962000 796.0900000.989310 33.887000 992.970000 0.988110 34.136000 922.530000 0.987900 35.093000 806.150000

0.989830 34.002000 1005.400000 0.988690 34.256000 934.240000 0.988610 35.221000 815.9700000.990340 34.115000 1017.600000 0.989270 34.374000 945.710000 0.989320 35.345000 825.5300000.990840 34.226000 1029.600000 0.989830 34.489000 956.910000 0.990000 35.467000 834.8200000.991340 34.335000 1041.300000 0.990380 34.602000 967.880000 0.990650 35.585000 843.8900000.991810 34.441000 1052.700000 0.990910 34.712000 978.560000 0.991290 35.700000 852.6700000.992290 34.544000 1063.700000 0.991440 34.819000 989.010000 0.991900 35.812000 861.2100000.992760 34.644000 1074.500000 0.991950 34.924000 999.170000 0.992500 35.920000 869.4600000.993200 34.742000 1085.100000 0.992450 35.026000 1009.000000 0.993080 36.025000 877.4200000.993640 34.838000 1095.300000 0.992940 35.125000 1018.600000 0.993640 36.125000 885.0800000.994060 34.930000 1105.200000 0.993410 35.221000 1027.800000 0.994170 36.223000 892.4900000.994480 35.019000 1114.700000 0.993870 35.313000 1036.800000 0.994690 36.316000 899.5900000.994870 35.106000 1124.000000 0.994320 35.403000 1045.500000 0.995180 36.406000 906.4000000.995270 35.189000 1132.900000 0.994750 35.490000 1053.800000 0.995650 36.492000 912.9400000.995640 35.269000 1141.500000 0.995170 35.573000 1061.800000 0.996110 36.573000 919.1400000.995990 35.346000 1149.700000 0.995560 35.653000 1069.600000 0.996530 36.652000 925.0800000.996340 35.421000 1157.600000 0.995950 35.730000 1077.000000 0.996920 36.726000 930.7200000.996680 35.492000 1165.200000 0.996320 35.803000 1084.000000 0.997290 36.796000 936.0300000.996990 35.559000 1172.400000 0.996670 35.873000 1090.800000 0.997650 36.862000 941.0400000.997300 35.623000 1179.200000 0.997010 35.940000 1097.200000 0.997990 36.924000 945.7300000.997590 35.684000 1185.700000 0.997330 36.003000 1103.200000 0.998290 36.982000 950.1200000.997860 35.742000 1191.800000 0.997630 36.063000 1108.900000 0.998570 37.036000 954.1800000.998120 35.796000 1197.600000 0.997920 36.119000 1114.300000 0.998830 37.086000 957.9200000.998360 35.847000 1203.000000 0.998180 36.171000 1119.300000 0.999060 37.131000 961.3500000.998580 35.894000 1208.000000 0.998440 36.220000 1124.000000 0.999270 37.172000 964.4500000.998800 35.937000 1212.600000 0.998680 36.265000 1128.300000 0.999450 37.209000 967.2200000.998990 35.978000 1216.900000 0.998890 36.306000 1132.300000 0.999600 37.242000 969.7100000.999180 36.014000 1220.800000 0.999090 36.343000 1135.800000 0.999740 37.270000 971.8100000.999340 36.047000 1224.300000 0.999270 36.377000 1139.000000 0.999850 37.294000 973.6100000.999470 36.076000 1227.400000 0.999420 36.407000 1141.900000 0.999930 37.314000 975.1300000.999600 36.102000 1230.100000 0.999570 36.433000 1144.400000 0.999980 37.329000 976.3000000.999710 36.123000 1232.400000 0.999690 36.455000 1146.600000 1.000000 37.340000 977.1100000.999800 36.141000 1234.300000 0.999790 36.474000 1148.300000 1.000000 37.347000 977.6100000.999880 36.156000 1235.800000 0.999880 36.488000 1149.700000 0.999990 37.349000 977.7700000.999940 36.167000 1237.000000 0.999950 36.499000 1150.700000 0.999930 37.347000 977.6100000.999980 36.174000 1237.700000 0.999990 36.505000 1151.300000 0.999860 37.340000 977.1200001.000000 36.176000 1238.000000 1.000000 36.508000 1151.600000 0.999760 37.329000 976.290000

2_l1116RH 2_l1116T 2_l1116flux 2x11RH 2x11T 2x11flux
0.620700 23.200000 -96.550000 0.698330 23.200000 -80.1620000.940620 26.753000 93.178000 0.941890 26.738000 76.4910000.939370 27.417000 128.010000 0.940600 27.525000 110.8400000.942210 27.668000 141.070000 0.943510 27.866000 125.6400000.943310 27.902000 153.250000 0.944830 28.175000 139.0500000.944330 28.128000 165.010000 0.946010 28.468000 151.6900000.945360 28.348000 176.470000 0.947350 28.748000 163.7600000.946430 28.566000 187.730000 0.948660 29.025000 175.6900000.947560 28.782000 198.950000 0.949990 29.302000 187.5900000.948760 28.996000 209.980000 0.951310 29.576000 199.3600000.949940 29.212000 221.110000 0.952600 29.853000 211.2100000.951180 29.426000 232.130000 0.953870 30.129000 222.9700000.952190 29.648000 243.580000 0.955200 30.405000 234.7600000.953830 29.852000 254.020000 0.955990 30.686000 246.7100000.952470 30.202000 272.160000 0.957850 30.984000 259.3500000.956060 30.280000 275.970000 0.958900 31.217000 269.2200000.957340 30.483000 286.360000 0.960200 31.475000 280.1200000.958570 30.693000 297.050000 0.961420 31.740000 291.3000000.959760 30.902000 307.710000 0.962570 32.003000 302.3600000.960940 31.109000 318.260000 0.963740 32.262000 313.2700000.962100 31.316000 328.760000 0.964880 32.520000 324.0700000.963240 31.521000 339.180000 0.966020 32.774000 334.7200000.964360 31.726000 349.540000 0.967130 33.026000 345.2400000.965470 31.929000 359.850000 0.968240 33.276000 355.6500000.966570 32.132000 370.090000 0.969330 33.523000 365.9300000.967670 32.333000 380.250000 0.970420 33.767000 376.0700000.968750 32.533000 390.330000 0.971480 34.008000 386.0700000.969830 32.731000 400.290000 0.972540 34.245000 395.9000000.970900 32.928000 410.160000 0.973590 34.479000 405.5600000.971960 33.122000 419.920000 0.974620 34.709000 415.0700000.973010 33.314000 429.540000 0.975650 34.936000 424.4000000.974040 33.504000 439.050000 0.976660 35.158000 433.5400000.975050 33.692000 448.450000 0.977630 35.378000 442.5600000.976070 33.878000 457.710000 0.978620 35.593000 451.3800000.977070 34.061000 466.830000 0.979590 35.804000 460.0000000.978060 34.241000 475.800000 0.980550 36.011000 468.4200000.979040 34.419000 484.630000 0.981490 36.213000 476.6800000.980000 34.593000 493.300000 0.982410 36.411000 484.7300000.980930 34.765000 501.820000 0.983300 36.604000 492.5800000.981850 34.934000 510.170000 0.984180 36.793000 500.2400000.982760 35.099000 518.370000 0.985040 36.978000 507.7100000.983650 35.262000 526.400000 0.985880 37.158000 514.9900000.984520 35.421000 534.260000 0.986690 37.333000 522.0700000.985370 35.577000 541.940000 0.987490 37.503000 528.9500000.986200 35.730000 549.440000 0.988260 37.669000 535.6200000.987010 35.878000 556.760000 0.989020 37.830000 542.0900000.987800 36.024000 563.910000 0.989750 37.986000 548.3600000.988570 36.166000 570.870000 0.990460 38.137000 554.4200000.989310 36.304000 577.630000 0.991140 38.283000 560.280000

0.990030 36.438000 584.200000 0.991800 38.424000 565.9200000.990740 36.568000 590.570000 0.992450 38.560000 571.3400000.991420 36.694000 596.730000 0.993070 38.690000 576.5500000.992070 36.816000 602.710000 0.993650 38.816000 581.5500000.992690 36.934000 608.470000 0.994210 38.935000 586.3000000.993300 37.048000 614.000000 0.994750 39.048000 590.8000000.993870 37.157000 619.340000 0.995260 39.156000 595.0900000.994420 37.263000 624.470000 0.995740 39.258000 599.1700000.994950 37.363000 629.380000 0.996210 39.355000 603.0300000.995450 37.460000 634.080000 0.996650 39.447000 606.6700000.995930 37.552000 638.570000 0.997060 39.533000 610.0900000.996390 37.640000 642.830000 0.997460 39.614000 613.2800000.996810 37.724000 646.890000 0.997820 39.689000 616.2700000.997220 37.802000 650.730000 0.998160 39.759000 619.0400000.997590 37.877000 654.350000 0.998460 39.823000 621.5800000.997940 37.947000 657.750000 0.998750 39.882000 623.9000000.998260 38.012000 660.910000 0.999010 39.935000 626.0000000.998560 38.073000 663.860000 0.999240 39.982000 627.8800000.998830 38.129000 666.590000 0.999450 40.024000 629.5300000.999070 38.180000 669.090000 0.999620 40.060000 630.9600000.999290 38.227000 671.350000 0.999770 40.091000 632.1700000.999480 38.269000 673.390000 0.999890 40.116000 633.1500000.999640 38.306000 675.200000 0.999990 40.135000 633.9100000.999780 38.338000 676.790000 1.000000 40.148000 634.4500000.999890 38.366000 678.130000 1.000000 40.156000 634.7600000.999970 38.389000 679.250000 1.000000 40.158000 634.8400001.000000 38.406000 680.130000 1.000000 40.154000 634.7000001.000000 38.419000 680.780000 1.000000 40.145000 634.3400001.000000 38.428000 681.210000 1.000000 40.130000 633.7400001.000000 38.431000 681.400000 0.999950 40.109000 632.9200000.999990 38.430000 681.350000 0.999840 40.082000 631.8800000.999910 38.423000 681.080000 0.999690 40.050000 630.6100000.999800 38.412000 680.560000 0.999520 40.012000 629.1100000.999660 38.396000 679.820000 0.999320 39.968000 627.4000000.999490 38.375000 678.840000 0.999090 39.919000 625.4600000.999300 38.349000 677.620000 0.998840 39.864000 623.290000

Timecum case4 (gm/S) case3 (gm/S) case2 (gm/S) case1 (gm/S)0.00 4.52 4.52 4.52 4.525.00 1.58 2.40 1.59 2.42
10.00 1.59 2.43 1.62 2.4615.00 1.61 2.46 1.64 2.5020.00 1.62 2.47 1.66 2.5325.00 1.63 2.49 1.69 2.5630.00 1.65 2.50 1.71 2.5935.00 1.66 2.52 1.74 2.6240.00 1.67 2.53 1.76 2.6545.00 1.69 2.54 1.79 2.6850.00 1.70 2.56 1.82 2.7155.00 1.71 2.58 1.84 2.7460.00 1.72 2.59 1.87 2.7865.00 1.74 2.61 1.90 2.8070.00 1.75 2.64 1.92 2.8475.00 1.76 2.64 1.95 2.8880.00 1.78 2.65 1.98 2.9085.00 1.79 2.66 2.01 2.9490.00 1.81 2.68 2.04 2.9795.00 1.82 2.69 2.07 3.00
100.00 1.83 2.71 2.10 3.04105.00 1.85 2.72 2.13 3.07110.00 1.86 2.74 2.16 3.11115.00 1.87 2.75 2.19 3.14120.00 1.89 2.77 2.22 3.18125.00 1.90 2.78 2.25 3.21130.00 1.91 2.80 2.28 3.25135.00 1.93 2.81 2.31 3.28140.00 1.94 2.83 2.34 3.32145.00 1.95 2.84 2.37 3.35150.00 1.97 2.85 2.41 3.39155.00 1.98 2.87 2.44 3.43160.00 1.99 2.88 2.47 3.46165.00 2.00 2.90 2.50 3.49170.00 2.02 2.91 2.53 3.53175.00 2.03 2.92 2.56 3.57180.00 2.04 2.94 2.59 3.60185.00 2.05 2.95 2.62 3.64190.00 2.07 2.96 2.66 3.67195.00 2.08 2.98 2.69 3.71200.00 2.09 2.99 2.72 3.74205.00 2.10 3.00 2.75 3.78210.00 2.11 3.01 2.78 3.81215.00 2.12 3.02 2.81 3.84220.00 2.14 3.04 2.84 3.88225.00 2.15 3.05 2.87 3.91230.00 2.15 3.06 2.90 3.94235.00 2.16 3.07 2.93 3.98240.00 2.17 3.08 2.95 4.01

245.00 2.18 3.09 2.98 4.04250.00 2.19 3.10 3.01 4.07255.00 2.20 3.11 3.04 4.10260.00 2.21 3.12 3.06 4.13265.00 2.22 3.12 3.09 4.16270.00 2.23 3.13 3.11 4.19275.00 2.23 3.14 3.14 4.21280.00 2.24 3.15 3.16 4.24285.00 2.25 3.16 3.19 4.26290.00 2.25 3.16 3.21 4.29295.00 2.26 3.17 3.23 4.32300.00 2.27 3.17 3.25 4.34305.00 2.27 3.18 3.28 4.36310.00 2.28 3.19 3.29 4.39315.00 2.28 3.19 3.31 4.40320.00 2.29 3.19 3.33 4.42325.00 2.29 3.20 3.35 4.44330.00 2.30 3.20 3.37 4.46335.00 2.30 3.20 3.38 4.48340.00 2.30 3.20 3.40 4.50345.00 2.31 3.21 3.42 4.51350.00 2.31 3.21 3.43 4.52355.00 2.31 3.21 3.44 4.54360.00 2.31 3.21 3.45 4.55365.00 2.32 3.21 3.47 4.56370.00 2.32 3.21 3.47 4.57375.00 2.32 3.21 3.48 4.58380.00 2.32 3.21 3.49 4.58385.00 2.32 3.21 3.50 4.59390.00 2.32 3.21 3.51 4.59395.00 2.32 3.20 3.51 4.60400.00 2.31 3.20 3.52 4.60405.00 2.31 3.20 3.52 4.60410.00 2.31 3.19 3.52 4.60415.00 2.31 3.19 3.52 4.60420.00 2.31 3.18 3.52 4.60

Case 1 Case 1 Case 1 Case 3Fetch(x) NoShadingInversionHeight(z) NSIHRHHigh NSIHRHLow ShadingInversionHeight(z)
0.0000000000 0.0038500000 0.0044920000 0.0033525000 0.00347000000.4687500000 0.0039090000 0.0045720000 0.0033933000 0.00328200000.9375000000 0.0040000000 0.0047540000 0.0034970000 0.00303000001.4062500000 0.0043600000 0.0051588000 0.0037470000 0.00296300001.8750000000 0.0047000000 0.0057260000 0.0040930000 0.00302000002.3437500000 0.0049000000 0.0058640000 0.0041780000 0.00323200002.8125000000 0.0049700000 0.0059780000 0.0042285000 0.00329000003.2812500000 0.0050500000 0.0061077000 0.0042790000 0.00329400003.7500000000 0.0050000000 0.0062050000 0.0043157000 0.00318000004.2187500000 0.0054400000 0.0066485000 0.0045795000 0.00309200004.6875000000 0.0064000000 0.0078520000 0.0053600000 0.00294000005.1562500000 0.0067290000 0.0082685000 0.0056100000 0.00287300005.6250000000 0.0063100000 0.0077640000 0.0052760000 0.00291000006.0937500000 0.0065800000 0.0081190000 0.0054860000 0.00276800006.5625000000 0.0072000000 0.0089220000 0.0060000000 0.00258000007.0312500000 0.0077500000 0.0095950000 0.0064490000 0.00236800007.5000000000 0.0079400000 0.0098300000 0.0066000000 0.00214000007.9687500000 0.0085600000 0.0106000000 0.0071100000 0.00189100008.4375000000 0.0093900000 0.0117100000 0.0077650000 0.00160000008.9062500000 0.0132500000 0.0164300000 0.0109800000 0.00153150009.2430000000 0.0165429187 0.0199650000 0.0140170000 0.00398000009.3750000000 0.0167000000 0.0197090000 0.0144240000 0.0040000000

Case 3 Case 3 Case 2 Case 4 Case 1 Case 1SIHRHHigh SIHRHLow NoShadingHeight(z) ShadingHeight(z) RHNSI TNSI
0.0040626500 0.0030767500 0.0028800000 0.0024000000 1.0000000000 39.03700000000.0038680000 0.0028910000 0.0028370000 0.0021200000 1.0000000000 38.07400000000.0036080500 0.0026421800 0.0028600000 0.0017300000 1.0000000000 37.40300000000.0035700000 0.0025736000 0.0031030000 0.0014670000 1.0000000000 37.02600000000.0036770000 0.0026099000 0.0034800000 0.0013500000 1.0000000000 36.74900000000.0039334600 0.0027880000 0.0032530000 0.0013252000 1.0000000000 36.11300000000.0040270000 0.0028358000 0.0031600000 0.0012200000 1.0000000000 35.60500000000.0040445000 0.0028290000 0.0031200000 0.0010570000 1.0000000000 35.19700000000.0039375000 0.0027275500 0.0031400000 0.0009000000 1.0000000000 35.01100000000.0038475000 0.0026309000 0.0035140000 0.0007390000 1.0000000000 35.02600000000.0037202000 0.0024765000 0.0047000000 0.0005100000 1.0000000000 35.65600000000.0036601000 0.0023985000 0.0050000000 0.0003570000 1.0000000000 35.63800000000.0037032500 0.0024390000 0.0043000000 0.0002900000 1.0000000000 35.01100000000.0035371200 0.0023090000 0.0047600000 0.0001200000 1.0000000000 35.11400000000.0033195000 0.0021520000 0.0057000000 0.0000100000 1.0000000000 35.38200000000.0030598000 0.0019547000 0.0065800000 0.0000000001 1.0000000000 35.74200000000.0027865000 0.0017615000 0.0069000000 0.0000100000 1.0000000000 35.86600000000.0024702000 0.0015440000 0.0080800000 0.0000000001 1.0000000000 36.17600000000.0021849000 0.0013454000 0.0096000000 0.0000100000 1.0000000000 36.50800000000.0020630000 0.0012094300 0.0156400000 0.0000000001 1.0000000000 37.34700000000.0049225000 0.0033870000 0.0195000000 0.0020500000 1.0000000000 38.43100000000.0050630000 0.0034745000 0.0189800000 0.0016130000 1.0000000000 40.1300000000

Case 1 Case 1 Case 1 Case 1 Case 1 Case 1tefluxxNSI HighRHNSI HighTNSI HightefluxxNSI LowRHNSI LowTNSI
1966.7000000000 1.0000000000 39.2210000000 1996.4000000000 1.0000000000 38.83800000001823.5000000000 1.0000000000 38.2510000000 1852.1000000000 1.0000000000 37.88700000001722.8000000000 1.0000000000 37.5890000000 1753.2000000000 1.0000000000 37.23200000001666.4000000000 1.0000000000 37.2060000000 1696.0000000000 1.0000000000 36.84000000001633.0000000000 1.0000000000 36.9370000000 1665.0000000000 1.0000000000 36.55200000001553.6000000000 1.0000000000 36.2800000000 1582.0000000000 1.0000000000 35.93800000001481.3000000000 1.0000000000 35.7630000000 1508.3000000000 1.0000000000 35.44500000001419.8000000000 1.0000000000 35.3540000000 1446.7000000000 1.0000000000 35.04900000001377.9000000000 1.0000000000 35.1650000000 1405.1000000000 1.0000000000 34.87200000001367.5000000000 1.0000000000 35.1830000000 1395.0000000000 1.0000000000 34.88900000001440.7000000000 1.0000000000 35.8120000000 1469.7000000000 1.0000000000 35.49800000001426.2000000000 1.0000000000 35.7900000000 1455.0000000000 1.0000000000 35.47600000001329.1000000000 1.0000000000 35.1620000000 1356.4000000000 1.0000000000 34.85800000001317.7000000000 1.0000000000 35.2620000000 1345.1000000000 1.0000000000 34.96000000001322.7000000000 1.0000000000 35.5240000000 1350.8000000000 1.0000000000 35.22900000001321.5000000000 1.0000000000 35.8810000000 1350.2000000000 1.0000000000 35.59200000001280.6000000000 1.0000000000 35.9960000000 1308.4000000000 1.0000000000 35.71700000001238.0000000000 1.0000000000 36.2860000000 1264.4000000000 1.0000000000 36.04000000001151.6000000000 1.0000000000 36.5900000000 1175.5000000000 1.0000000000 36.3900000000977.6100000000 1.0000000000 37.2640000000 990.6100000000 1.0000000000 37.3420000000681.4000000000 1.0000000000 38.3920000000 698.2300000000 1.0000000000 38.3980000000633.7400000000 1.0000000000 40.0860000000 650.5200000000 1.0000000000 40.1600000000

Case 1 Case 3 Case 3 Case 3 Case 3 Case 3LowtefluxxNSI RHSI TSI tefluxxSI HighRHSI HighTSI
1936.4000000000 1.0000000000 38.4650000000 1888.0000000000 1.0000000000 38.64300000001794.7000000000 1.0000000000 36.6690000000 1632.1000000000 1.0000000000 36.87400000001696.5000000000 1.0000000000 35.3500000000 1442.8000000000 1.0000000000 35.55100000001637.4000000000 1.0000000000 34.4300000000 1311.5000000000 1.0000000000 34.62300000001602.7000000000 1.0000000000 33.8500000000 1234.8000000000 1.0000000000 34.05300000001525.8000000000 1.0000000000 33.5360000000 1196.9000000000 1.0000000000 33.71300000001455.7000000000 1.0000000000 33.1730000000 1144.6000000000 1.0000000000 33.33900000001395.8000000000 1.0000000000 32.7990000000 1088.3000000000 1.0000000000 32.94600000001355.8000000000 1.0000000000 32.4510000000 1027.9000000000 1.0000000000 32.59900000001344.7000000000 1.0000000000 32.1000000000 969.6700000000 1.0000000000 32.25500000001414.1000000000 1.0000000000 31.6810000000 903.7500000000 1.0000000000 31.87000000001398.8000000000 1.0000000000 31.4100000000 858.8300000000 1.0000000000 31.60900000001304.0000000000 1.0000000000 31.2800000000 833.2800000000 1.0000000000 31.46200000001292.2000000000 1.0000000000 31.0020000000 780.7500000000 1.0000000000 31.18500000001296.8000000000 1.0000000000 30.6980000000 722.9600000000 1.0000000000 30.88600000001295.4000000000 1.0000000000 30.3620000000 654.9200000000 1.0000000000 30.56100000001254.7000000000 1.0000000000 30.0630000000 590.6600000000 1.0000000000 30.26400000001213.3000000000 1.0000000000 29.7550000000 518.6700000000 1.0000000000 29.96500000001129.2000000000 1.0000000000 29.4560000000 436.3400000000 1.0000000000 29.6760000000963.4300000000 1.0000000000 29.0700000000 308.0100000000 1.0000000000 29.3220000000665.9500000000 1.0000000000 30.8440000000 272.4400000000 1.0000000000 31.0460000000620.8700000000 1.0000000000 33.4980000000 318.3400000000 1.0000000000 33.6640000000

Case 3 Case 3 Case 3 Case 3 Case 2 Case 2HightefluxxSI LowRHSI LowTSI LowtefluxxSI RHNS TNS
1916.3000000000 1.0000000000 38.2900000000 1861.8000000000 1.0000000000 34.46300000001663.6000000000 1.0000000000 36.4910000000 1605.6000000000 1.0000000000 33.58300000001473.4000000000 1.0000000000 35.1780000000 1417.4000000000 1.0000000000 33.00900000001340.9000000000 1.0000000000 34.2660000000 1287.3000000000 1.0000000000 32.72800000001265.7000000000 1.0000000000 33.6710000000 1208.5000000000 1.0000000000 32.52300000001224.3000000000 1.0000000000 33.3850000000 1174.3000000000 1.0000000000 31.80600000001170.4000000000 1.0000000000 33.0370000000 1124.2000000000 1.0000000000 31.32400000001111.4000000000 1.0000000000 32.6740000000 1069.4000000000 1.0000000000 30.97200000001050.8000000000 1.0000000000 32.3270000000 1009.3000000000 1.0000000000 30.8520000000993.4000000000 1.0000000000 31.9690000000 950.4600000000 1.0000000000 30.9510000000931.7400000000 1.0000000000 31.5140000000 880.0200000000 1.0000000000 31.7170000000887.7700000000 1.0000000000 31.2410000000 834.9700000000 1.0000000000 31.7520000000859.6900000000 1.0000000000 31.1310000000 812.3600000000 1.0000000000 31.1130000000806.7400000000 1.0000000000 30.8490000000 759.8500000000 1.0000000000 31.2650000000748.9200000000 1.0000000000 30.5420000000 702.1700000000 1.0000000000 31.6010000000681.2100000000 1.0000000000 30.1930000000 633.3700000000 1.0000000000 32.0610000000615.9400000000 1.0000000000 29.8940000000 570.1300000000 1.0000000000 32.2610000000543.0600000000 1.0000000000 29.5800000000 498.8700000000 1.0000000000 32.6390000000459.1500000000 1.0000000000 29.2790000000 418.6200000000 1.0000000000 32.9900000000327.9900000000 1.0000000000 28.8600000000 291.7400000000 1.0000000000 33.6680000000284.1300000000 1.0000000000 30.6630000000 262.7100000000 1.0000000000 34.8810000000328.2200000000 1.0000000000 33.3320000000 310.4100000000 1.0000000000 36.7390000000

Case 2 Case 4 Case 4 Case 4tefluxxNS RHS TS tefluxxS
1343.5000000000 1.0000000000 33.7210000000 1239.40000000001211.8000000000 1.0000000000 32.1260000000 1008.70000000001125.2000000000 1.0000000000 30.8890000000 829.90000000001082.1000000000 1.0000000000 29.9780000000 699.19000000001056.7000000000 1.0000000000 29.4300000000 623.8800000000960.7100000000 1.0000000000 29.0960000000 579.3900000000891.2200000000 1.0000000000 28.7440000000 528.6600000000838.3100000000 1.0000000000 28.3910000000 476.7200000000811.7300000000 1.0000000000 28.1210000000 433.3700000000817.2600000000 1.0000000000 27.8410000000 390.2700000000914.7300000000 1.0000000000 27.5080000000 340.9400000000911.7400000000 1.0000000000 27.2970000000 309.0200000000816.4800000000 1.0000000000 27.1950000000 292.3200000000821.3300000000 1.0000000000 26.9860000000 259.1600000000846.7700000000 0.9997000000 26.7620000000 224.0000000000875.3500000000 0.9989800000 26.5360000000 187.9800000000862.3500000000 0.9982600000 26.3420000000 156.8000000000854.8000000000 0.9976300000 26.1360000000 124.1900000000811.0500000000 0.9968800000 25.9360000000 91.8770000000706.0000000000 0.9962100000 25.6550000000 49.7450000000519.4700000000 1.0000000000 27.5810000000 118.2400000000509.1100000000 1.0000000000 30.4080000000 198.7300000000

E‐W axis H/W=1 NE‐SW axis H/W=1 N‐S axis H/W=1 E‐W axis H/W=1 NE‐SW axis H/W=1
Timecum T1_90d17FEB24 T1_45d17FEB24 T1_0d17FEB24 T1_90d16OCT21 T1_45d16OCT21
0.00 23.337 23.329 23.329 23.337 23.329
5.00 23.668 23.562 23.575 23.665 23.567
10.00 23.993 23.793 23.820 23.991 23.798
15.00 24.313 24.019 24.064 24.315 24.030
20.00 24.631 24.241 24.309 24.635 24.271
25.00 24.950 24.460 24.553 24.952 24.504
30.00 25.262 24.672 24.806 25.267 24.732
35.00 25.577 24.879 25.060 25.580 24.967
40.00 25.893 25.100 25.316 25.895 25.200
45.00 26.207 25.319 25.591 26.210 25.428
50.00 26.518 25.532 25.865 26.523 25.650
55.00 26.828 25.749 26.142 26.843 25.878
60.00 27.134 25.969 26.422 27.169 26.142
65.00 27.439 26.181 26.746 27.492 26.408
70.00 27.742 26.386 27.072 27.810 26.670
75.00 28.043 26.586 27.404 28.123 26.930
80.00 28.342 26.818 27.771 28.416 27.186
85.00 28.637 27.057 28.134 28.706 27.434
90.00 28.930 27.302 28.504 28.991 27.692
95.00 29.220 27.546 28.872 29.273 28.005
100.00 29.507 27.790 29.236 29.552 28.315
105.00 29.790 28.028 29.650 29.826 28.649
110.00 30.070 28.265 30.060 30.097 28.990
115.00 30.356 28.548 30.472 30.358 29.323
120.00 30.638 28.838 30.891 30.615 29.667
125.00 30.917 29.147 31.307 30.865 30.003
130.00 31.192 29.477 31.727 31.108 30.330
135.00 31.463 29.799 32.173 31.348 30.654
140.00 31.731 30.131 32.610 31.582 30.983
145.00 31.989 30.461 33.046 31.810 31.316
150.00 32.243 30.783 33.487 32.032 31.665
155.00 32.489 31.100 33.965 32.249 32.009
160.00 32.727 31.417 34.439 32.461 32.346
165.00 32.962 31.743 34.902 32.670 32.709
170.00 33.191 32.081 35.366 32.875 33.073
175.00 33.414 32.422 35.818 33.075 33.447
180.00 33.629 32.755 36.260 33.275 33.825
185.00 33.840 33.111 36.719 33.471 34.196
190.00 34.047 33.467 37.181 33.665 34.565
195.00 34.250 33.830 37.629 33.857 34.921
200.00 34.449 34.210 38.069 34.045 35.264
205.00 34.644 34.580 38.469 34.231 35.595
210.00 34.839 34.949 38.846 34.412 35.940
215.00 35.029 35.309 39.213 34.588 36.277
220.00 35.219 35.657 39.567 34.767 36.609
225.00 35.405 35.991 39.904 34.946 36.963
230.00 35.588 36.329 40.230 35.122 37.306
235.00 35.769 36.667 40.536 35.292 37.647

240.00 35.945 36.997 40.778 35.457 38.027
245.00 36.120 37.348 41.011 35.616 38.389
250.00 36.296 37.696 41.230 35.770 38.733
255.00 36.472 38.033 41.437 35.917 39.060
260.00 36.641 38.409 41.595 36.064 39.377
265.00 36.805 38.785 41.745 36.208 39.680
270.00 36.962 39.142 41.884 36.347 39.970
275.00 37.114 39.482 42.008 36.469 40.248
280.00 37.250 39.806 42.121 36.576 40.531
285.00 37.369 40.121 42.209 36.678 40.811
290.00 37.485 40.420 42.256 36.774 41.073
295.00 37.598 40.710 42.294 36.862 41.320
300.00 37.704 40.989 42.322 36.945 41.546
305.00 37.806 41.282 42.337 37.024 41.735
310.00 37.901 41.559 42.339 37.097 41.906
315.00 37.991 41.819 42.309 37.164 42.063
320.00 38.077 42.066 42.271 37.226 42.204
325.00 38.158 42.281 42.215 37.273 42.332
330.00 38.234 42.468 42.116 37.286 42.448
335.00 38.304 42.635 42.016 37.295 42.514
340.00 38.368 42.791 41.909 37.301 42.562
345.00 38.428 42.929 41.802 37.314 42.583
350.00 38.482 43.056 41.666 37.325 42.586
355.00 38.524 43.166 41.532 37.333 42.577
360.00 38.549 43.226 41.394 37.343 42.558
365.00 38.573 43.268 41.243 37.348 42.518
370.00 38.595 43.285 41.094 37.345 42.456
375.00 38.612 43.282 40.940 37.334 42.371
380.00 38.632 43.269 40.788 37.323 42.269
385.00 38.645 43.246 40.635 37.312 42.159
390.00 38.645 43.203 40.479 37.295 42.030
395.00 38.616 43.138 40.325 37.268 41.880
400.00 38.589 43.048 40.156 37.230 41.713
405.00 38.561 42.939 39.986 37.188 41.544
410.00 38.528 42.819 39.819 37.146 41.364
415.00 38.490 42.686 39.656 37.100 41.183
420.00 38.448 42.538 39.496 37.049 40.996

N‐S axis H/W=1 E‐W axis H/W=2 NE‐SW axis H/W=2 N‐S axis H/W=2 E‐W axis H/W=3 NE‐SW axis H/W=3
T1_0d16OCT21 T2_90d17FEB24 T2_45d17FEB24 T2_0d17FEB24 T3_90d17FEB24 T3_45d17FEB24
23.329 23.709 23.697 23.686 23.709 23.704
23.615 23.962 23.862 23.873 23.945 23.854
23.894 24.210 24.024 24.061 24.173 24.000
24.185 24.450 24.183 24.247 24.396 24.144
24.483 24.688 24.342 24.438 24.613 24.285
24.786 24.919 24.496 24.630 24.824 24.420
25.092 25.148 24.651 24.825 25.026 24.553
25.416 25.376 24.807 25.026 25.225 24.682
25.764 25.602 24.963 25.231 25.423 24.812
26.114 25.826 25.115 25.437 25.619 24.934
26.486 26.047 25.267 25.640 25.812 25.051
26.872 26.269 25.413 25.846 26.003 25.162
27.255 26.489 25.557 26.058 26.194 25.273
27.640 26.707 25.698 26.272 26.379 25.378
28.024 26.920 25.838 26.492 26.560 25.479
28.426 27.121 25.980 26.715 26.728 25.580
28.852 27.316 26.120 26.937 26.890 25.684
29.282 27.509 26.259 27.160 27.047 25.789
29.710 27.687 26.402 27.386 27.191 25.900
30.145 27.860 26.553 27.611 27.328 26.018
30.573 28.029 26.711 27.850 27.463 26.138
31.024 28.195 26.869 28.091 27.596 26.261
31.474 28.356 27.026 28.349 27.722 26.386
31.921 28.507 27.182 28.615 27.837 26.509
32.361 28.654 27.349 28.892 27.948 26.628
32.844 28.795 27.520 29.205 28.054 26.752
33.332 28.933 27.694 29.542 28.153 26.885
33.808 29.069 27.876 29.899 28.250 27.028
34.280 29.205 28.063 30.258 28.345 27.173
34.744 29.335 28.248 30.628 28.433 27.319
35.198 29.464 28.429 31.024 28.520 27.465
35.656 29.588 28.607 31.426 28.602 27.615
36.130 29.702 28.790 31.832 28.676 27.765
36.589 29.813 28.977 32.264 28.746 27.924
37.039 29.921 29.165 32.701 28.813 28.084
37.461 30.026 29.368 33.168 28.878 28.251
37.850 30.124 29.574 33.626 28.935 28.423
38.227 30.219 29.777 34.084 28.989 28.595
38.595 30.308 29.988 34.555 29.039 28.770
38.942 30.394 30.219 35.024 29.088 28.949
39.283 30.481 30.450 35.461 29.138 29.135
39.608 30.571 30.689 35.874 29.192 29.333
39.865 30.665 30.919 36.264 29.252 29.528
40.110 30.759 31.187 36.630 29.313 29.727
40.341 30.855 31.471 36.955 29.376 29.925
40.564 30.951 31.774 37.248 29.442 30.133
40.734 31.046 32.086 37.503 29.507 30.344
40.900 31.144 32.396 37.737 29.577 30.577

41.051 31.241 32.705 37.949 29.646 30.818
41.190 31.347 33.027 38.116 29.727 31.073
41.316 31.458 33.354 38.267 29.815 31.342
41.418 31.567 33.709 38.411 29.907 31.645
41.479 31.677 34.077 38.517 30.003 31.965
41.530 31.784 34.443 38.595 30.098 32.287
41.570 31.888 34.797 38.633 30.191 32.617
41.600 31.991 35.154 38.661 30.283 32.972
41.617 32.091 35.514 38.678 30.372 33.349
41.601 32.194 35.881 38.674 30.468 33.724
41.578 32.303 36.281 38.659 30.572 34.108
41.534 32.415 36.665 38.632 30.681 34.512
41.457 32.525 37.036 38.597 30.789 34.931
41.376 32.635 37.396 38.560 30.896 35.339
41.282 32.745 37.765 38.514 31.003 35.748
41.183 32.854 38.117 38.471 31.112 36.148
41.062 32.959 38.439 38.413 31.218 36.509
40.946 33.063 38.730 38.353 31.323 36.841
40.827 33.164 38.997 38.287 31.428 37.140
40.695 33.262 39.246 38.211 31.530 37.397
40.558 33.355 39.451 38.130 31.629 37.621
40.417 33.445 39.619 38.048 31.727 37.808
40.280 33.537 39.762 37.962 31.829 37.956
40.139 33.638 39.885 37.872 31.940 38.069
39.999 33.731 39.976 37.774 32.046 38.155
39.858 33.817 40.026 37.671 32.147 38.205
39.698 33.894 40.057 37.565 32.243 38.235
39.541 33.966 40.068 37.454 32.339 38.248
39.388 34.032 40.056 37.342 32.428 38.249
39.237 34.093 40.015 37.230 32.513 38.240
39.089 34.157 39.963 37.115 32.600 38.222
38.940 34.217 39.893 37.000 32.685 38.194
38.775 34.273 39.815 36.885 32.765 38.157
38.612 34.322 39.731 36.768 32.838 38.115
38.452 34.367 39.641 36.646 32.907 38.066
38.294 34.410 39.548 36.526 32.977 38.011
38.140 34.452 39.449 36.405 33.044 37.950

N‐S axis H/W=3 E‐W axis H/W=4 NE‐SW axis H/W=4 N‐S axis H/W=4
T3_0d17FEB24 T4_90d17FEB24 T4_45d17FEB24 T4_0d17FEB24
23.686 23.693 23.698 23.676
23.857 23.957 23.834 23.841
24.028 24.211 23.966 24.009
24.197 24.454 24.096 24.175
24.369 24.691 24.224 24.340
24.544 24.919 24.346 24.505
24.721 25.134 24.464 24.671
24.899 25.336 24.579 24.841
25.079 25.529 24.691 25.013
25.256 25.720 24.799 25.187
25.433 25.901 24.904 25.360
25.610 26.079 25.006 25.531
25.797 26.253 25.105 25.705
25.984 26.422 25.199 25.885
26.171 26.585 25.290 26.065
26.363 26.739 25.380 26.249
26.553 26.891 25.468 26.432
26.746 27.041 25.557 26.618
26.945 27.182 25.653 26.809
27.146 27.321 25.753 27.004
27.352 27.454 25.856 27.200
27.565 27.581 25.960 27.399
27.782 27.694 26.064 27.602
28.004 27.798 26.171 27.809
28.228 27.899 26.277 28.019
28.464 27.995 26.389 28.242
28.713 28.089 26.507 28.477
28.978 28.176 26.639 28.716
29.267 28.256 26.771 28.976
29.573 28.324 26.903 29.237
29.905 28.387 27.034 29.512
30.257 28.444 27.166 29.813
30.634 28.493 27.300 30.169
31.046 28.541 27.440 30.558
31.466 28.586 27.582 30.976
31.907 28.625 27.731 31.418
32.368 28.652 27.883 31.880
32.843 28.671 28.038 32.383
33.325 28.689 28.194 32.897
33.815 28.708 28.352 33.418
34.263 28.727 28.519 33.895
34.688 28.754 28.692 34.326
35.066 28.791 28.867 34.700
35.404 28.832 29.049 35.034
35.714 28.877 29.235 35.318
35.978 28.924 29.424 35.550
36.196 28.973 29.619 35.731
36.384 29.025 29.826 35.850

36.539 29.080 30.040 35.946
36.655 29.143 30.266 36.023
36.752 29.215 30.496 36.090
36.816 29.295 30.748 36.135
36.867 29.377 31.017 36.172
36.897 29.457 31.300 36.193
36.919 29.538 31.610 36.204
36.931 29.618 31.941 36.208
36.938 29.698 32.283 36.207
36.934 29.782 32.651 36.197
36.920 29.875 33.041 36.179
36.896 29.970 33.448 36.150
36.864 30.064 33.873 36.116
36.827 30.156 34.309 36.075
36.781 30.247 34.744 36.032
36.736 30.338 35.172 35.985
36.683 30.433 35.559 35.932
36.626 30.529 35.913 35.878
36.566 30.624 36.220 35.812
36.493 30.718 36.498 35.741
36.418 30.810 36.734 35.670
36.345 30.899 36.932 35.600
36.271 30.984 37.095 35.526
36.194 31.071 37.223 35.448
36.111 31.161 37.319 35.364
36.023 31.256 37.394 35.276
35.932 31.350 37.445 35.187
35.838 31.441 37.483 35.099
35.744 31.536 37.508 35.007
35.650 31.633 37.519 34.911
35.556 31.726 37.521 34.813
35.454 31.814 37.514 34.716
35.352 31.905 37.499 34.621
35.249 31.992 37.476 34.524
35.144 32.077 37.446 34.429
35.040 32.158 37.410 34.335
34.938 32.235 37.370 34.242