Study of the photoinduced surface relief modulation in photopolymers caused by illumination with a...
10
Dublin Institute of Technology ARROW@DIT Articles Centre for Industrial and Engineering Optics 2010-01-01 Study of the Photoinduced Surface Relief Modulation in Photopolymers caused by Illumination with a Gaussian Beam of Light Tzvetanka Babeva Bulgarian Academy of Sciences Dana Mackey Dublin Institute of Technology, [email protected] Suzanne Martin Dublin Institute of Technology, [email protected] Izabela Naydenova Dublin Institute of Technology, [email protected] Vincent Toal Dublin Institute of Technology, [email protected] is Article is brought to you for free and open access by the Centre for Industrial and Engineering Optics at ARROW@DIT. It has been accepted for inclusion in Articles by an authorized administrator of ARROW@DIT. For more information, please contact [email protected], [email protected]. Recommended Citation Babeva, T., Mackey, D., Naydenova, I., Martin, S., Toal, V.: Study of the photoinduced surface relief modulation in photopolymers caused by illumination with a Gaussian beam of light, 2010 JOURNAL OF OPTICS, 12 124011, doi: 10.1088/2040-8978/12/12/ 124011. 2010.
Transcript of Study of the photoinduced surface relief modulation in photopolymers caused by illumination with a...

Dublin Institute of TechnologyARROW@DIT
Articles Centre for Industrial and Engineering Optics
2010-01-01
Study of the Photoinduced Surface ReliefModulation in Photopolymers caused byIllumination with a Gaussian Beam of LightTzvetanka BabevaBulgarian Academy of Sciences
Dana MackeyDublin Institute of Technology, [email protected]
Suzanne MartinDublin Institute of Technology, [email protected]
Izabela NaydenovaDublin Institute of Technology, [email protected]
Vincent ToalDublin Institute of Technology, [email protected]
This Article is brought to you for free and open access by the Centre forIndustrial and Engineering Optics at ARROW@DIT. It has been acceptedfor inclusion in Articles by an authorized administrator of [email protected] more information, please contact [email protected],[email protected].
Recommended CitationBabeva, T., Mackey, D., Naydenova, I., Martin, S., Toal, V.: Study of the photoinduced surface relief modulation in photopolymerscaused by illumination with a Gaussian beam of light, 2010 JOURNAL OF OPTICS, 12 124011, doi: 10.1088/2040-8978/12/12/124011. 2010.

Study of the photoinduced surface relief modulation in photopolymers caused by illumination with a Gaussian beam of light
Study of the photoinduced surface relief modulation in photopolymers caused by illumination with a Gaussian beam of light
T Babevaa, D Mackeyb, I Naydenovac, S Martinc and V Toalc
a Central Laboratory of Photoprocesses, Bulgarian Academy of Sciences,
Acad. G. Bonchev Str. Bl. 109, 1113 Sofia, Bulgaria b School of Mathematical Sciences, Dublin Institute of Technology, Kevin Street, Dublin 8, Ireland c Centre for Industrial and Engineering Optics, School of Physics, Dublin Institute of Technology,
Kevin Street, Dublin 8, Ireland Corresponding author e-mail: [email protected]
Abstract. The formation of surface relief profile in photopolymerisable systems when illuminated with a focused beam of light is simulated numerically using a two-way diffusion model that takes account both for monomer and short polymer chains diffusion. The concentration and spatial distribution dynamics of monomer and short and long polymer chains are calculated. The surface profile is obtained from calculated components concentrations considering different densities of monomer and polymer. The influence of the illumination time, intensity and spot diameter on the surface profiles dynamics is discussed. A good agreement between the calculated and the experimentally measured profiles is observed thus demonstrating the successful application of the two-way diffusion model to this system.
Keywords: Photopolymer, diffusion, surface relief profile, two-way diffusion model PACS: 07.05.Tp, 42.40.My, 42.70.Km, 42.70.Ln, 81.05.Mh
1. Introduction The interest in photopolymer systems has increased remarkably in the past few years. The
photopolymer materials have reached primary positions in many holographic application areas such as manufacturing of optical elements, optical interconnections, holographic data storage etc [1].
Acrylamide based photopolymer systems have been primarily developed as high sensitivity self processing photosensitive materials for volume holography [2]. In addition to the photoinduced volume refractive index changes when an acrylamide-based photopolymer surface is exposed to patterned light of appropriate wavelength, a post-exposure swelling in the illuminated area is observed following the initial shrinkage due to the polymerization. The swelling is observed routinely in gratings recorded in acrylamide-based photopolymer and has been experimentally investigated elsewhere [3-5]. The real time observation of the evolution of the surface relief profile conducted in our previous study [6] showed that two processes are clearly distinguishable: rapid increase of profile height followed by a slower decrease. We have demonstrated that the surface profile dynamics is directly connected with diffusion processes occurring in the photopolymerisable system [6] and thus the post-exposure evolution of the surface relief profile in a single illuminated spot can be used for calculation of monomer and polymer diffusion coefficients in photopolymerisable materials. To explore further the origin of the surface relief profile formation it will be a clear advantage to develop a model for its numerical simulation. Furthermore, adequate modelling will enable accurate
1
Study of the photoinduced surface relief modulation in photopolymers caused by illumination with a Gaussian beam of light
design of surface relief gratings and will open up the possibility for modelling more complicated two dimensional structures.
Recently, we have proposed a two-way diffusion model for formation of short exposure gratings in acrylamide-based photopolymer [7,8]. The model accounts for diffusion of both monomer and polymer molecules and distinguishes between short-chain polymers capable of diffusing and long-chain polymers that are immobile [7,8].
In this paper we have modified the two-way diffusion model in order to describe the surface relief formation in a single illuminated spot. The time evolution of the spatial distribution of monomer and polymer concentrations in a single illuminated spot is obtained from numerical simulations of this model and the calculated profiles are compared with the experimental results. The dependence of profile dynamics and shapes on the time and intensity of illumination are discussed.
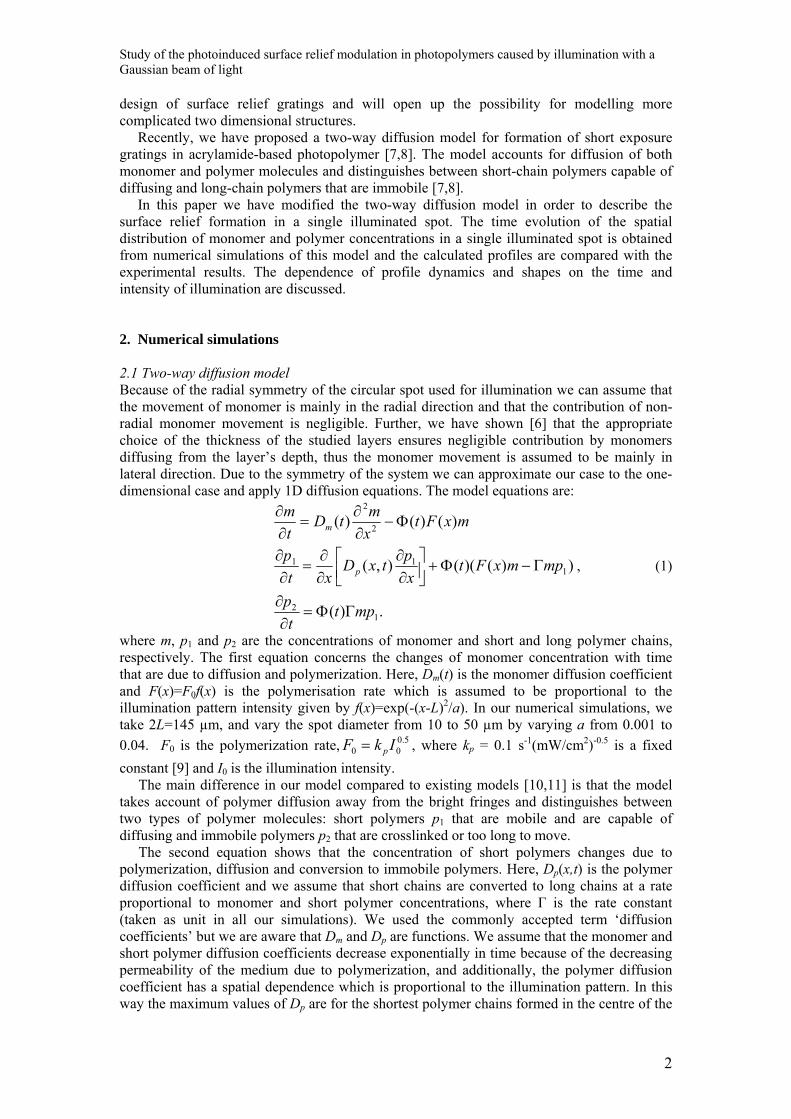
2. Numerical simulations 2.1 Two-way diffusion model Because of the radial symmetry of the circular spot used for illumination we can assume that the movement of monomer is mainly in the radial direction and that the contribution of non-radial monomer movement is negligible. Further, we have shown [6] that the appropriate choice of the thickness of the studied layers ensures negligible contribution by monomers diffusing from the layer’s depth, thus the monomer movement is assumed to be mainly in lateral direction. Due to the symmetry of the system we can approximate our case to the one-dimensional case and apply 1D diffusion equations. The model equations are:
.)(
))()((),(
)()()(
12
111
2
2
mptt
p
mpmxFtxptxD
xtp
mxFtxmtD
tm
p
m
ΓΦ=∂∂
Γ−Φ+⎥⎦⎤
⎢⎣⎡
∂∂
∂∂
=∂∂
Φ−∂∂
=∂∂
, (1)
where m, p1 and p2 are the concentrations of monomer and short and long polymer chains, respectively. The first equation concerns the changes of monomer concentration with time that are due to diffusion and polymerization. Here, Dm(t) is the monomer diffusion coefficient and F(x)=F0f(x) is the polymerisation rate which is assumed to be proportional to the illumination pattern intensity given by f(x)=exp(-(x-L)2/a). In our numerical simulations, we take 2L=145 µm, and vary the spot diameter from 10 to 50 µm by varying a from 0.001 to 0.04. F0 is the polymerization rate, , where kp = 0.1 s-1(mW/cm2)-0.5 is a fixed constant [9] and I0 is the illumination intensity.
5.000 IkF p=
The main difference in our model compared to existing models [10,11] is that the model takes account of polymer diffusion away from the bright fringes and distinguishes between two types of polymer molecules: short polymers p1 that are mobile and are capable of diffusing and immobile polymers p2 that are crosslinked or too long to move.
The second equation shows that the concentration of short polymers changes due to polymerization, diffusion and conversion to immobile polymers. Here, Dp(x,t) is the polymer diffusion coefficient and we assume that short chains are converted to long chains at a rate proportional to monomer and short polymer concentrations, where Γ is the rate constant (taken as unit in all our simulations). We used the commonly accepted term ‘diffusion coefficients’ but we are aware that Dm and Dp are functions. We assume that the monomer and short polymer diffusion coefficients decrease exponentially in time because of the decreasing permeability of the medium due to polymerization, and additionally, the polymer diffusion coefficient has a spatial dependence which is proportional to the illumination pattern. In this way the maximum values of Dp are for the shortest polymer chains formed in the centre of the
2

Study of the photoinduced surface relief modulation in photopolymers caused by illumination with a Gaussian beam of light
spot where the intensity is the highest. Hence, Dm(t)=D0mexp(-αt) and Dp(x,t)=D0pf(x)exp(-αt), where α = 0.02, D0m=5.10-11 m2/s, D0p=1.2.10-12 m2/s and f(x) is defined above. The functional form of Dm and Dp are taken from previous studies [6] where diffusion coefficients are calculated for samples exposed to uniform illumination with different duration thus achieving different degree of polymerization
Finally, the third equation describes the evolution of the long polymer concentration. We have introduced the step function, Φ(t)=1 for t < te, and Φ(t)=0 for t > te, te being the exposure time, to model the assumption that after exposure polymerisation stops and the long polymer concentration remains constant. More details about non-dimensionalising the system of equations, initial and boundary conditions and numerical integration can be found elsewhere [8]. It should be noted that by integrating (1) one can obtain the conservation law as it is expected because the total concentration of different phases (monomer, short and long polymers) remains constant:
, (2) [∫ =++L
mdxtxptxptxm2
0021 ),(),(),( ]
where m0 is the initial monomer concentration.
2.2. Influence of the recording intensity on the profiles dynamics during illumination Figure 1 presents the calculated concentration profiles of dimensionless monomer 0mmm = , short and long/immobile polymers ( 011 mpp = and 022 mpp = , respectively) and the profile height using the two-way diffusion model for polymerization rate F0= 0.5 s-1. Note that the spatial domain, 0 < x< 2L has been nondimensionalised to 0 < x <2, so the spot is centered at x = 1. The initial monomer concentration m0 is unit. It is seen that m decreases to zero due to its consumption because of photopolymerization (figure 1a). As expected due to the photopolymerization the concentrations of short (figure 1b) and long/immobile (figure 1c) polymer molecules increase.
Figure 1 Cross-sections of the calculated concentration profiles of monomer (a), short (b) and long (c) polymer chains and surface profile (d) calculated by eq.3 for spot with diameter of 50 µm and polymerization rate of 0.5 s-1
The profile in the illuminated spot (figure 1d) is due to accumulation of monomer molecules coming from non-illuminated area and the polymer molecules created due to
3

Study of the photoinduced surface relief modulation in photopolymers caused by illumination with a Gaussian beam of light
photopolymerization. Than one can assume that the height of the profile, h observed in the unit surface area, S is equal to the difference between volumes occupied by the monomer and polymer accumulated in S and the volume of the monomer before illumination divided by S:
Sppmmhmpm
/1210
⎥⎥⎦
⎤
⎢⎢⎣
⎡−
++=
ρρρ, (3)
where )( 0mmm = , )( 011 mpp = and )( 022 mpp = are taken from the model, ρm= 1.15 g/cm3 and ρp=1.30 g/cm3 are the densities of monomer and polymer, respectively and m0=1 is the initial monomer. The monomer density ρm is calculated assuming 0.6 g acrylamide with density of 1.12 g/cm3 and 0.2 g of 0.2g N,N-methylene bisacrylamide with density of 1.2 g/cm3 (see experimental details). It is seen that the initial shrinkage due to polymerization (note the negative values of the profile) is followed by growth of the profile height in the illuminated spot. This growth is due to the accumulation of incoming monomer that is polymerized. However the monomer that diffuses towards the illuminated spot doesn’t have enough time to reach the spot center and has been polymerized close to the spot boundary. Accordingly more polymers are accumulated close to the spot periphery than in its center. This is the reason for the dip observed in the profiles. Additional simulations showed that the dip disappears for spots with smaller diameter where the diffuse distances are shorter and monomer molecules manage to reach the center of the spots before being polymerized.
To study the influence of illumination intensity on the concentrations and profile dynamics we made simulations with different polymerization rates. Figure 2 presents the temporal evolution of monomer and polymer concentrations and profile height in the center of the spot at polymerization rates of 0.3, 0.5 and 1 s-1.
Figure 2 Temporal dependences of concentrations of monomer (a) and short (b) and long (c) polymer chains and profile height (d) in the center of the spot with diameter of 50 µm at different polymerization rates indicated in the figure.
4

Study of the photoinduced surface relief modulation in photopolymers caused by illumination with a Gaussian beam of light
Higher illumination intensities (higher F0) result in faster consumption of monomer and generation of more short-chain polymer molecules. This result can be explained by the higher probability of polymer chain termination and formation of short –chain polymers due to the increase in the free radicals density with the increase of the illumination intensity. It is seen that for lower intensities more long-chain polymers are formed. The reason for formation of more long-chains at lower F0 is that the termination rate is slower and the chains have more time to grow. The growth of profiles during illumination is presented in figure 2d. Following the initial shrinkage due to polymerization a growth in profile height is observed. After some time saturation is reached. Different illumination intensities result in different saturation values of profile heights. The highest profile is obtained for the smallest illumination intensity. It can also be observed that for each illumination intensity there is an optimal time of illumination. Further exposure does not lead to increase of the profile. 2.3 Influence of the spot size on the profiles dynamics The next step in our simulations was to study the components concentrations and surface profile dynamics for spots with different diameters (figure 3). It is clearly seen from figure 3 that for the smallest spot (approximately 10 µm) the rate of decrease of monomer concentration is the smallest and the rate of the increase of long-chain polymer concentration is the highest. During illumination two competitive processes take place – polymerization and diffusion. When the distance is long enough (for spot diameter of 50 µm the smallest distance that monomer should travel to reach the spot center is 25 µm) the time is not sufficient for the monomer to reach the center of the spot and to replace the monomer already consumed in the polymerization process. As a result the monomer concentration decreases faster as compared to the case of 10 µm spot where the distance from the edge to the centre of the spot is shorter and supply of monomer from outside the spot can take place. The short polymer concentration is not influenced by the spot diameters. This can be expected because the illumination intensity which governs the rate of short polymer formation is the same for all spot diameters. The availability of monomer is essential for the growth of polymer chains. In the case of the smallest spot more monomer can be found in the spot center (see Fig. 3 a). This is the possible reason for the increase of the concentration of long-chain polymer with the decrease of the spot size.
5

Study of the photoinduced surface relief modulation in photopolymers caused by illumination with a Gaussian beam of light
Figure 3 Temporal dependences of concentrations of monomer (a) and short (b) and long (c) polymer chains and profile height (d) in the center of the spot with different diameters indicated on the figure at polymerization rate of 0.5 s-1. Concerning that the profile is a linear combination of components concentrations it is expected the profile to be the highest for the smallest spot where the concentrations of both long-chain polymers and monomers are the highest. 2.4. Influence of the initial illumination times on the profiles dynamics For better control of the surface relief growth it is essential to study its post–exposure dynamics. Figure 4 presents the temporal dynamic of the profile centre for different times of initial illumination. The size of the spot is 50 µm and F0 = 0.5s-1. The case of continuous illumination is also shown for comparison.
6

Study of the photoinduced surface relief modulation in photopolymers caused by illumination with a Gaussian beam of light
Figure 4 Temporal dynamic of the profile centre in the 50 µm spot for different times of initial illumination. The arrows mark the time when light is turned off. Continuous illumination growth (solid line) is also shown for comparison (F0 = 0.5 s-1). It is seen that the highest surface profile is achieved when the polymer surface is exposed for 10 s and then the light is turned off. This means that there is an optimal time for initial illumination resulting in the greatest profile height and the deviation from the optimal time leads to lower profiles heights. 3. Validation of the model
The investigations were carried out using a photopolymer system, developed in the Centre for Industrial and Engineering Optics, Dublin Institute of Technology [12], which consists of 17.5 ml stock solution of polyvinyl alcohol (10 w/w%), 2ml triethanolamine, 0.6g acrylamide, 0.2g N,N-methylene bisacrylamide and 4ml Erythrosin B dye stock solution of concentration 1.1 mM. An amount of 0.4ml of the well mixed solution was gravity settled on a leveled 2.5 cm x 7.5 cm single glass substrate, so the upper surface of the layer was open to the air. The thickness of the layers after drying for 24h in darkness under normal laboratory conditions (To
= 21 - 23oC and 40 - 60% relative humidity) was 35±2 μm. The illumination of the samples and collection of the surface profiles were performed by
White Light Interferometric (WLI) surface profiler MicroXAM S/N 8038. The built-in diaphragm of the WLI profiler (1mm in diameter, positioned 220 mm from the sample) was imaged onto the sample surface for 30 s using light of wavelength 554 nm and controlled intensity resulting in an approximately circular spot 55μm in diameter. Immediately following the exposure the images of the sample surface were collected in dark. The advantage of single spot illumination is that one can monitor in real time the dynamic of the surface profile by taking images at different times using WLI profiler. More details concerning sample preparation, illumination and image collection can be found elsewhere [6].
Figure 5. Surface relief profiles for single spot illumination of 30 s (a) and collected 15 s (b), 45 s (c) and 300 s (d) after exposure by WLI profiler
Figure 5 presents the surface profiles after single spot illumination for 30 s and those
collected in the dark 15s, 45s and 300 s after the illumination was turned off. It can be seen that exposure causes initial shrinkage followed by the increase of the profile high. The photopolymerization visualized by the shrinkage (figure 5a) leads to the consumption of monomer in the illuminated spot. Due to the established concentration gradient monomer diffuses toward illuminated area and the profile grows. Even after exposure the gradient continues to drive monomer diffusion and the surface relief profile continues to grow (figure 5 b,c). After some time, depending on the conditions of the initial illumination, a decrease in profile height is detected. Similar processes (giving rise to an initial increase followed by a decrease in diffraction efficiency) were observed in the post-exposure dynamics of the holographic gratings recorded with short exposure times [7,13,14]. The processes were distinguished as monomer and short polymer chain diffusion processes in opposite directions [7,14]. Therefore here we assumed that the profile decrease is due to diffusion of short polymer chains away from the illuminated area.
7

Study of the photoinduced surface relief modulation in photopolymers caused by illumination with a Gaussian beam of light
Figure 6 Calculated concentration profiles of monomer (a), short (b) and long (c) polymer chains; Numerically calculated (d) and experimentally measured (e) cross-sections of the surface relief profile and post-exposure dynamics of the profile centre (f); (t=30 s is the end of exposure); height equals to zero denotes the polymer surface Figure 6 presents the post-exposure dynamics of the concentration profiles calculated by the two-way diffusion model. It is seen that m decreases to zero in the illuminated spot center due to the consumption of monomer in the illuminated area because of the photopolymerization (figure 6a). Because of the concentration gradient monomer starts to diffuse towards the center of the spot resulting in increase of monomer concentration. When the light is turned off (t=30s) no more polymer molecules are generated, hence no changes in polymer concentration are expected. However it can be seen that in the centre of the spot the short polymer concentration decreases. The reason is that short polymers are mobile and can diffuse away from the illuminated area. On the other hand the spatial distribution of the concentration of long/crosslinked polymers does not change after illumination because they are incapable of diffusing. Figure 6 d and 6e present the simulated and experimentally measured post-exposure cross sections of surface profile. Figure 6f shows measured and simulated temporal dynamics of spot centre height. It is worth noting the good agreement between the calculated (d) and measured (e) surface relief profiles, as well as the dynamics of the spot centre height (f).
To correlate the calculated profiles heights with measured values we need to estimate the initial monomer m0 (see eq.3). We calculated the amount of monomer in cylinder with radius of 1 µm and height of 40 µm. The radius is chosen in accordance with the spatial resolution of WLI profiler which is 1-3 µm, and the cylinder height of 40 µm is the thickness of the layers usually used in the experiments. The calculations showed that the amount of monomer in the cylinder with above dimensions is 2.4x10⁻¹¹ g. Using eq.3 and the calculated components we obtained that 120 s after the light is turned off the profile height reaches 3 µm. Usually the measured profile height is about 120 nm. This difference leads us to the assumption that probably not the whole amount of monomer distributed across the thickness participates in the formation of the profile. Most probably only monomers from the region close to the surface contribute to the formation of the surface profile. Our estimations showed that the area is around 1.5 - 2 µm thick. Considering that the monomer accumulation and polymerization in the illuminated spot are the main contributors to the relief one can expect higher surface relief amplitude for thicker layers where more monomer molecules are presented in the layer. However, the studies of surface relief gratings recorded in acrylamide-based photopolymer
8

Study of the photoinduced surface relief modulation in photopolymers caused by illumination with a Gaussian beam of light
[4] showed that for layer thicknesses higher than 15 µm the gratings amplitude did not depend on the thickness. This observation can be regarded as additional confirmation of the assumption that only part of monomer molecules contribute to relief formation. We are aware of the fact that the calculation of m0 should be treated with caution. But considering the good agreement between experimental and simulated values presented in Sec.3 and for the purpose of comparing the relief when varying the different parameters we are confident that the approach is sufficiently accurate. Conclusions The two-way diffusion model originally developed to account for holographic grating formation under short exposure conditions [7,8] has been successfully applied here to study the formation of surface relief in photopolymerisable systems in a single illuminated spot. The dependence of the profile on the illumination time and intensity was numerically simulated. It was found that low illumination intensity is favorable for achieving higher surface relief profiles. For certain intensity there exists an optimal time of initial illumination resulting in the greatest profile height. Generally, the numerical simulations revealed that the highest surface profile could be achieved when the photopolymerisable system is initially illuminated for a certain time and then the light is turned off.
The numerical simulations were verified by measurements of the profiles’ temporal and spatial distributions dynamics using White Light Interferometric profiler. A good agreement was observed thus demonstrating the successful application of the two-way diffusion model for this system.
The model can also be applied to surface relief grating formation in acrylamide-based photopolymer. It can also assist the design of HOE’s. Acknowledgments The financial support of COST Action MP0604 is highly appreciated. The authors would like to acknowledge the School of Physics at DIT and FOCAS, DIT, for technical support. T. Babeva would like to thank the Management Committee of COST Action MP0604 and the Centre for Industrial and Engineering Optics, DIT for the Short Term Scientific Mission. References 1. Trout T J, Schmieg J J, Gambogi W Y and Weber A M 1998, Adv. Mater. 10, 1219. 2. Calixto S 1987 Appl. Opt. 26, 3904. 3. Naydenova I, Mihaylova E, Martin S and Toal V 2005 Opt. Express 13, 4878. 4. Pavani K, Naydenova I, Martin S and Toal V 2007 J. Opt. A: Pure Appl. Opt. 9 43. 5. Gallego S, Márquez A, Marini S, Fernández E, Ortuño M and Pascual I 2009 Opt.
Express 17 18279. 6. Babeva T, Naydenova I, Martin S and Toal V 2008 Opt. Express 16 8487. 7. Naydenova I, Jallapuram R, Howard R, Martin S and Toal V 2004 Appl. Opt. 43 2900. 8. Babeva T, Naydenova I, Mackey D, Martin S and Toal V 2010 JOSA B 27 197. 9. Jallapuram R, Naydenova I, Byrne H J, Martin S, Howard R and Toal V 2008 Appl. Opt.
47 206. 10. Sheridan J T and. Lawrence J R 2000 J. Opt. Soc. Am. A 17 1108. 11. Sheridan J T, Downey M and. O’Neill F T 2001 J. Opt. A: Pure and Appl. Opt. 3 477 . 12. Martin S, Feely C A and Toal V 1997 Appl. Opt. 36 5757. 13. Colvin V L, Larson R G, Harris A L and Schilling M L 1997 J. Appl. Phys. 81 5913. 14. Havranek A, Kveton M, and Havrankova J 2007 Polymer Bulletin 58 261.
9