Evaluation of the socio economic impacts in Ecuador due to ...
Upload
khangminh22Category
view
1download
0
STUDY OF RELOCATION PROCESS AND ITS
SOCIO ECONOMIC IMPACTS ON LOCAL
PEOPLE DUE TO PRIVATE HOUSING
PROJECTS IN EASTERN FRINGE OF DHAKA
By
S. M. Shah Mahmood
MASTER OF URBAN AND REGIONAL PLANNING
Department of Urban and Regional Planning
Bangladesh University of Engineering and Technology
Dhaka, Bangladesh
June 2013

STUDY OF RELOCATION PROCESS AND ITS
SOCIO ECONOMIC IMPACTS ON LOCAL
PEOPLE DUE TO PRIVATE HOUSING
PROJECTS IN EASTERN FRINGE OF DHAKA
Submitted to the Department of Urban and Regional Planning, Bangladesh
University of Engineering and Technology in partial fulfillment of the requirement of
the degree of
MASTER OF URBAN AND REGIONAL PLANNING
By
S. M. Shah Mahmood
Student No: 1009152009 F
Department of Urban and Regional Planning
Bangladesh University of Engineering and Technology
Dhaka, Bangladesh
June 2013

The Thesis titled, “STUDY OF RELOCATION PROCESS AND ITS SOCIO
ECONOMIC IMPACTS ON LOCAL PEOPLE DUE TO PRIVATE HOUSING
PROJECTS IN EASTERN FRINGE OF DHAKA” submitted by S. M. Shah
Mahmood, Roll No: 1009152009 (F), Session: October 2009, has been accepted as
satisfactory in partial fulfillment of the requirement for the degree of MASTER OF
URBAN AND REGIONAL PLANNING (MURP) by Coursework and Thesis on 26
June, 2013.
BOARD OF EXAMINERS
Dr. Ishrat Islam
Professor
Department of Urban and Regional Planning
BUET, Dhaka, Bangladesh
Chairman ( Supervisor)
Dr. Md. Shakil Akther
Professor & Head
Department of Urban and Regional Planning
BUET, Dhaka, Bangladesh.
Member
(Ex-Officio)
Dr. Sarwar Jahan
Professor
Department of Urban and Regional Planning
BUET, Dhaka, Bangladesh.
Member
Dr. Nurul Islam Nazem
(External)
Professor
Department of Geography and Environment
University of Dhaka, Bangladesh.
Member (External)
1
1
2
1
3
1
4
1
CANDIDATE’S DECLARATION
It is hereby declared that this thesis entitled “Study of Relocation Process
and Its Socio Economic Impacts on Local People Due to Private
Housing Projects in Eastern Fringe of Dhaka” has not been, either in
whole or in part, previously submitted elsewhere for the award of any
degree or diploma.
S.M. Shah Mahmood
Roll No. 1009152009 (F)
Session- October, 2009

Dedicated to
My Parents Prof. S.M. Shah Alam and Shamsun Nahar Begum
Thank you for your love, inspiration and never ending supports and prayers
And
My Wife Fahamida Akther for her sky high inspiration

i
ACKNOWLEDGMENTS
At first, all praises belong to Almighty Allah, the cherisher and sustainer of the
world, who provides me with the opportunity to conduct this study and to submit this
report successfully.
I would like to express my deepest sincere gratitude to my supervisor Dr. Ishrat
Islam, Professor of Department of Urban and Regional Planning, Bangladesh
University of Engineering and Technology (BUET), Bangladesh for giving me a
unique opportunity to work on such a significant topic. Her continuous direction,
invaluable suggestions, affectionate encouragement and important acumen are
greatly acknowledged. Her keen interest on the topic and enthusiastic support on my
effort was a source of inspiration to carry out the study. She has paid much of the
invaluable time and the meticulous effort for the whole study. I consider myself
fortunate to work under her supervision.
I would like to convey heartiest thanks to Dr. Md. Shakil Akther, Professor & Head,
Department of Urban and Regional Planning, BUET for his valuable suggestions and
kind support. I am very grateful to Professor Hafiza Khatun of Department of
Geography and Environment, University of Dhaka, Dhaka for her cooperation and
the faculty members of Department of Urban and Regional Planning BUET for their
assistance and valuable suggestions related to study.
My special thanks to my friend Mr. Toriqul Alam and Mrs. Farhana and the students
of Shanto Mariam University of Creative Technology, providing me their useful time
and energy for my data collection in field level.
I would like to express my special indebtedness to my family and friends whose
continuous encouragement and support was unremitting source of inspiration for this
work. Lastly, I extend my sincere gratitude to my wife who always guides me with
her ever-encouraging emotional support, cooperation and empathy.
ii
ABSTRACT
Like other developing countries, urbanization in Bangladesh is a growing
phenomenon, which is steady in nature but fretfully affects urban sustainability in the
wake of lacking in good governance. In comparison to many developing countries
urbanization rate is very high in the Dhaka city. As a consequence, land market is
controlled by influential groups for high return of profit. A number of land
developers have continued their activities legally or often illegally in the fringe areas
of Dhaka city. Because of high land price in recent years, most of the land developers
forced the local people to sell their land by different ways. Though this issue was
addressed in different media for proper attention, but still now this issue ignored by
the regulatory authority and the researchers. For that reason, the objective of this
study is to find out the ways by which it would be realized how local people were
relocated by developers and try to understand the present status of local people by
comparing their socio economic condition in present and previous location.
According to the size of land projects from the year 2000 to 2010 in Dhaka City, top
four land developer companies have been selected namely Green Model Town of
Amin Mohammad Foundation Ltd, United City of Neptune Development & Holding
Ltd, Pink City of Xenovally & Ashiyan City of Ashiyan land development Ltd. Most
of the original local residents sold their land and moved to different places. But some
of the local people still lives around the project areas and provided the preliminary
information about relocated families. According to the information collected from
different sources approximately 3,920 families are considered as relocated families.
Considering 95% confidence level and confidence interval of 5 this research
conducted questionnaire survey on 350 relocated households. As original local
residents sold their land and moved to different places, this research used snowball
sampling for questionnaire survey. Data was collected using several data collection
methods, namely household questionnaire survey, in-depth interview of local
residents, expert interviews and observations. This study discovered different aspects
by which it was clarified how land developers exploited the local people. Here one
interesting matter was disclosed that the process of relocation varied from project to
project. So it was difficult to summarize specific procedure for relocation by land
developers. Four actors namely land developers, local muscleman, local officials and

iii
local people were identified who actively played various roles in this relocation
procedure. Maximum local people were displaced from their original location
through involuntary procedure. Those local people who were not interested to sell
their land used many strategies to save their land from developers. When people
search new place for living, job opportunity (33.1%) was their prime consideration.
Similarly local people tried to live within short distance from their original location
which ultimately shows their strong belongings with the existing localities. At
present, the overall socio economic condition of the relocated people are found
inferior compare to their previous locations. Which ultimately supported social
researcher’s opinion about negative effect of relocation. At present most (67.7%) of
the local people don’t own any lands but this was reverse in previous locations.
Similarly, Local people occupation structure was totally changed in present location
comparing with previous locations. At present locations most of the cases income
levels, housing condition and utility facilities were poorer situation from previous
locations. Dhaka has no option to exclude private developer activities in housing
sector where government initiative is very limited. But alarming situation is that
urban fringe is predominantly used for capital and asset accumulation of powerful
actors and relocating local people from their original location. So this issue need to
be properly mentioned and revised in existing Rules and Regulation for protecting
local people’s right. For proper development, land readjustment scheme can be used
where both parties (local people and land developers) have a chance to gain benefit
from housing development. This research would awake the policy makers to figure
out the issues in Rules and Regulation.

iv
ABBREVIATIONS
ADB Asian Development Bank
AP Affected Peoples
BBS Bangladesh Bureau of Statistics
BPDB Bangladesh Power Development Board
BUET Bangladesh University of Engineering and Technology
BR Bangladesh Railway
CS Cadastral Survey
CBO Community Based Organization
CCL Cash Compensation Under Law
DC Divisional Commissioner
DAP Detailed Area Plan
DFID UK Department for International Development
DoE Department of Environment
DITS Dhaka Integrated Transport Study
DCC Dhaka City Corporation
DIT Dhaka Improvement Trust
DMDP Dhaka Metropolitan Development Plan
DSMS Dhaka Statistical Metropolitan Area
DWASA Dhaka Water and Sewerage Authority
DMA Dhaka Metropolitan Area
DPHE Department of Public Health Engineering
EA Executing Agency
EP Entitled Persons
GIS Geographic Information System
GoB Government of Bangladesh
GD General Diaries
HC High Court
IRR Implementing Rules and Regulations
JMB Jamuna Multipurpose Bridge
JMBA Jamuna Multipurpose Bridge Authority
LAP Land Acquisition Plan
LA Land Acquisition

v
LAO Land Acquisition Officer
NGO Non Government Organization
NPRR National Policy on Resettlement and Rehabilitation
PPP Public-Private Partnership
PAP Project Affected People
PWD Public Works Department
REHAB Real Estate & Housing Association of Bangladesh
RHD Roads and Highway Department
RP Resettlement Plan
RA Republic Act
RU Resettlement Unit
SPZ Special Planning Zone
SME Small and Medium Enterprises
STP Strategic Transport Plan
TA Technical Assistance
TOR Terms of Reference
TI Act Town Improvement Act
VRW Village Resettlement Worker
UN United Nations
UAE United Arab Emirates
URP Urban and Regional Planning

vi
TABLE OF CONTENTS
Page No.
Acknowledgement vi
Abstracts vi
Abbreviations vi
Table of Content vi
List of Tables vi
List of Figures vi
List of Maps vi
List of Photographs vi
Chapter One: Introduction and Background of the Study 1-7
1.1 Background of the Study 1
1.2 Objectives of the Study with specific aims and possible Outcomes 4
1.3 Rationale of the Study 4
1.4 Scope and Limitation of the Study 5
1.5 Organization of the Study 6
Chapter Two: Theoretical Framework 8-42
2.1 Introduction 8
2.2 Key Research Concepts and issues relevant to the Study 8
2.2.1 Displaced Persons and Project Affected Persons 8
2.2.2 Relocation and Resettlement 9
2.2.3 Voluntary & Involuntary Resettlement 9
2.3 Assets 10
2.4 Growth Strategies of Fringe Areas 11
2.5 Consequence of unplanned fringe areas growth 12
2.6 Role of Private land developers in fringe areas of Dhaka city 12
2.7 Magnitude and impacts of population displacement 17
2.8 Conceptual models Perspectives on Forced Relocation 18
2.8.1 Thayer Scudder’s Stress and Settlement Process 18
2.8.2 Michael Cernea’s Impoverishment Risks and Reconstruction Model
for Resettling Displaced Populations (IRR Model)
19
2.9 Resettlement Policies 21

vii
2.9.1 The Nature of the Involuntary Resettlement Policy of different
organization
21
2.9.1.1 Asian Development Bank (ADB) 21
2.9.1.2 World Bank 22
2.10 Review of different countries systems on Involuntary Resettlement 24
2.10.1 India 24
2.10.2 People’s Republic of China 25
2.10.3 Pakistan 26
2.10.4 Philippines 26
2.10.5 Bangladesh 28
2.11 Conclusion 42
Chapter Three: Methodological Approach 43-47
3.1 Introduction 43
3.2 Formulation of Objectives 44
3.3 Selection of Study Area 44
3.4 Reconnaissance Survey 44
3.5 Data Collection 45
3.5.1 Primary Data Collection 45
3.5.2 Secondary Data 47
3.6 Conclusion 47
Chapter Four: Study Areas Profile 48-63
4.1 Introduction 48
4.2 Selection of study area and relocated people 48
4.3 Description of the Study Areas 50
4.3.1 Ashiyan City 51
4.3.2 Green Model Town 53
4.3.3 United City 55
4.3.4 Pink City 57
4.4 Profile of Relocated People 59
4.4.1 Duration of living in original locations 59
4.4.2 Relocated place and distance from original location 60
4.4.3 Land owner ship status 60
4.4.4 Occupation and land ownership pattern 60

viii
4.5 Conclusion 62
Chapter Five: Relocation Process of Local people 64-94
5.1 Introduction 64
5.2 Actors in Land Transformation Process 64
(a)Land Developer 65
(b) Middleman/Muscleman 66
(c) Local officials 68
(d) Local People 68
5.3 The four phases which linked with relocation process 69
5.3.1 Phase One: Selection of land/areas for purchase by land developers 69
5.3.2 Phase Two: Factors related with sell of land by local people 70
5.3.2.1 Causes for land selling 70
5.3.2.2 Strategies taken by the local people to save their land 80
5.3.3 Phase Three: Transfer of Land and Money 83
5.3.3.1 Key Role Player for Fixation of Land Price 83
5.3.3.2 Selling Price of Previous Land and utilization of money 84
5.3.3.3 Money Receiving Procedure and satisfaction about land price 85
5.3.4 Phase Four: Relocated to new Place 86
5.3.4. 1 Duration of Living in this Relocated Place 86
5.3.4. 2 Land Price in relocated places 86
5.3.4. 3 Reason of selecting relocated place for living 87
5.3.4. 4 Relocated place and distance between relocated and original Place
88
5.4 Major Findings of Land Acquisition Process from Local People
90
5.5 Conclusion 93
Chapter 6: Socio Economic Condition of Relocated People 95-113
6.1 Introduction 95
6.2 Land Ownership 96
6.2.1 Previous and Present Land ownership 96
6.3 Occupation Status 97
6.3.1 Previous and Present Occupation 97
6.4 Income and Expenditure 97
6.4.1 Present and Previous income and expenditure 97

ix
6.5 Social Network 99
6.5.1 Information about respondent’s Relatives and Friends in present and
previous locations
100
6.5.2 Involvement with Neighborhood Organization 100
6.6 Housing Condition 103
6.6.1 Present Resident status 103
6.6.2 Type of Housing 103
6.6.3 Satisfaction about housing condition 104
6.7 Utility Facilities 105
6.7.1 Electricity 105
6.7.1.1 Electricity Connection 105
6.7.1.2 Electricity Condition 105
6.7.2 Water 106
6.7.2.1 Water Availability 106
6.7.2.2 Water Supply Condition 107
6.7.2.3 Water Supply Provider 107
6.7.3 Gas 108
6.7.3.1 Gas Connection 108
6.7.3.2 Gas Condition 109
6.7.4 Drainage 109
6.7.4.1 Drainage Availability 109
6.7.4.2 Drainage Condition 110
6.7.4.3 Drainage Service Provider 111
6.8 Conclusion 111
Chapter 7: Conclusion 114-120
7.1 Introduction 114
7.2 Major Findings from the Study 114
7.3 Recommendations 117
7.4 Conclusion 119
Reference 121-127
Appendices 128-148
Appendix –A 128

x
List of indicators, data type and data source
Appendix –B
Questionnaire Survey Format
130
Appendix –C
Case Study Format
137
Appendix –D
Photographs regarding developer land grabbing news in media
138
Appendix –E
Survey picture with local respondent
142
Appendix –F
List of RAJUK Approved Private land developers.
143
Appendix –G
(1) Calculation of Inflation Rate
(2) Paired Samples Test between Present Income and Previous Income
(3) Paired Samples Test between Present Landownership and
Previous Landownership
146
Appendix –H
Sample Size Calculator
148

xi
LIST OF TABLES
Page No.
Table 2.1: Type of Losses, Risks and Mitigation Measures 35
Table 2.2: The types of Losses Eligible for Compensation under Donors’ Policy
and GoB Land Acquisition Ordinance
38
Table 4.1: Land ownership pattern in previous locations 61
Table 4.2: Attainment of ownership of land and Previous Occupation 61
Table 5.1: Relationship between previous Occupation and the initiatives of
residents against relocation
81
Table 5.2: Selling price of previous land (According to Katha) 84
Table 5.3: Land Price in Present location 87
Table 5.4: The present location of the relocated people 88
Table 6.1 Present and Previous Land ownership 96
Table 6.2: Valuation of money in 2006 to present 98
Table 6.3: Percentage of respondents’ relatives, friends and neighbors forced by
developers for Relocation
100
Table 6.4: Involved Neighborhood organization and Relatives, friends lived
adjacent in Previous location
102
Table 6.5: Involved Neighborhood organization and Relatives, friends lived
adjacent in Present location
102
Table 6.6: Present Resident Status 103
Table 6.7: Analysis of study findings according to ‘Cernea Model’ 112

xii
LIST OF FIGURES
Page No.
Figure 3.1: Flow diagram of the Methodology of the Study 43
Figure 4.1: Duration of living in previous/ original Place 59
Figure 5.1: Musclemen Linkage 67
Figure 5.2: Linkage among four actors 69
Figure 5.3: The reasons behind by the local people relocation decision
70
Figure 5.4: Key role player for fixation of land Price 83
Figure 5.5: Mode of utilization money 85
Figure 5.6: Duration of living in this relocated Place 86
Figure 5.7: Reason of chosen relocated Place 87
Figure 5.8: Distance between existing and original Place 88
Figure 5.9: Ashiyan City land acquisition process
90
Figure 5.10: Green Model Town land acquisition process 91
Figure 5.11: Pink City land acquisition process 91
Figure 5.12: United City land acquisition process 92
Figure 5.13: Typical land acquisition process 93
Figure 6.1: Previous and Present Occupation 97
Figure 6.2: Compare Present and Previous income 98
Figure 6.3: Relatives, Friends living adjacent in Present and Previous location 100
Figure 6.4: Involvement with Neighborhood organization in Present and Previous location
101
Figure 6.5: Present & Previous House Type 104
Figure 6.6: Satisfaction about Present & Previous housing condition 104
Figure 6.7: Present & Previous Electricity availability 105
Figure 6.8: Present & Previous Electricity condition 106
Figure 6.9: Present and Previous water supply connection 106
Figure 6.10: Present and Previous Water Supply condition 107
Figure 6.11: Present and Previous Water supply provider 108
Figure 6.12: Present and Previous Gas Connection 108
Figure 6.13: Present and Previous Gas condition 109
Figure 6.14: Present and Previous Drainage Availability 110
Figure 6.15: Present and Previous Drainage condition 110
Figure 6.16: Present and Previous Drainage service Provider 111

xiii
LIST OF MAPS
Page No. Map 4.1: Selected land projects in DAP 49
Map 4.2: Eastern Fringe Area 50
Map: 5.1 Relocated places (Greater Dhaka City) 89
xiv
LIST OF PHOTOGRAPHS
Page No.
Photograph 2.1: A local resident explaining her plight to an official 14
Photograph 4.1: Selected land projects 49
Photograph 4.2: Ashiyan City indicates in Google Earth Map 51
Photograph 4.3: Developer’s signboard on filled out land 52
Photograph 4.4: Developer’s signboard has shown their proposed medical
college, school and college.
52
Photograph 4.5: This photograph was taken after a short time when the local
people were evicted by the land developer.
52
Photograph 4.6: Land filled through sand by force 52
Photograph 4.7: Green Model town indicate in Google Earth Map 53
Photograph 4.8: Entry gate of Green Model Town 54
Photograph 4.9: Developed plots 54
Photograph 4.10: Local people cultivated on plots 54
Photograph 4.11: Surrounding low lands that are filled continuously 54
Photograph 4.12: United City indicate in Google Earth Map 56
Photograph 4.13: Entry gate 56
Photograph 4.14: Developed plots 56
Photograph 4.15: Surrounding areas of United City 56
Photograph 4.16: Land filling process 56
Photograph 4.17: Pink City Google Earth map 58
Photograph 4.18: Present project condition 58
Photograph 4.19: Surrounding areas of Pink City 58
Photograph 5.1: Surveyor interviewing Kamini Das relocated from Pink City 71
Photograph 5.2: Kamini Das original homestead (Red border) 72
Photograph 5.3: Nikil Biswas 72
Photograph 5.4: Poultry farm that closed by local Muscleman 73
Photograph 5.5: Survey team talked with Md. Kamal 73
Photograph 5.6: Previous land of Morjina Begum 74
Photograph 5.7: Sorafat Mirda Working in Green Model Town 75
Photograph 5.8: Mr. Murad Ali who was relocated by Ashiyan City, expressed
his views regarding developer’s activities in front of his demolished house.
76
Photograph 5.9: Murad Ali original homestead 77
Photograph 5.10: Jamal Ahmed was locked by developer of Ashiyan city 78

xv
Photograph 5.11: Cut down the main entry road of Mr. Jamal’s house 78
Photograph 5.12: Ashiyan City created false water logging in the study area 79
Photograph 5.13: Green Model Town dumping Waste garbage in front of local
residence houses
79
Photograph 5.14: Surrounding areas of Green Model Town 80
Photograph 5.15: Signboard for proposed religious institution 82
Photograph 5.16: Graveyard 82

1
CHAPTER 1
INTRODUCTION AND BACKGROUND OF THE STUDY
1.1 Background of the Study
The world is gradually going to be completely urbanized [22]. Twenty first century is
the urban century [43]. For the first time in human history, the world has become
predominantly urban. Already, more than half of the people live in urban areas [31].
The share of urban population in Asia is 37 per cent at present and is projected to be
45 per cent by 2015. In Bangladesh 25 per cent of the population (35 million people)
now live in urban areas; this proportion will be 34 per cent (75 million) by the year
2015 [80].The process of urbanization is linked with the economic development,
which makes an increasingly higher contribution of the national economy. However,
when the growth of urban population takes place at an exceptionally rapid rate, most
cities and towns are unable to cope with changing situations due to their internal
resources constraints and management limitations [7]. Urbanization and rapid urban
change may be a negative sign of development provided the urban problems arise
due to improper management and unplanned growth [48].Various reports suggest that
the cities of developing countries, particularly, will be facing tremendous challenges
of this unpredictable and uncontrollable urbanization which may generate a huge
suffering to the people. Currently, the rapid rate of urban growth in developing
countries does not correspond to economic development, social change, and technical
advancement. Further, the unplanned and uncontrolled physical expansion of cities
greatly exceeds the resources available and has posed economic, social, and
environmental challenges to the governments of the respective countries [45]. Dhaka,
the fastest growing mega-city in the world, is the economic heart of Bangladesh.
Dhaka alone has the highest concentration with 44.39% of the total urban population
and 8.5% of the nation population [17]. By the year 2015, Dhaka is projected to rank
as the 5th largest city in the world, where 19 million people will have to find their
house [80]. From 1951, Dhaka’s size and population has increased 17.88 and 25.09
times respectively [46].The availability of land for housing is limited, and hence the
2
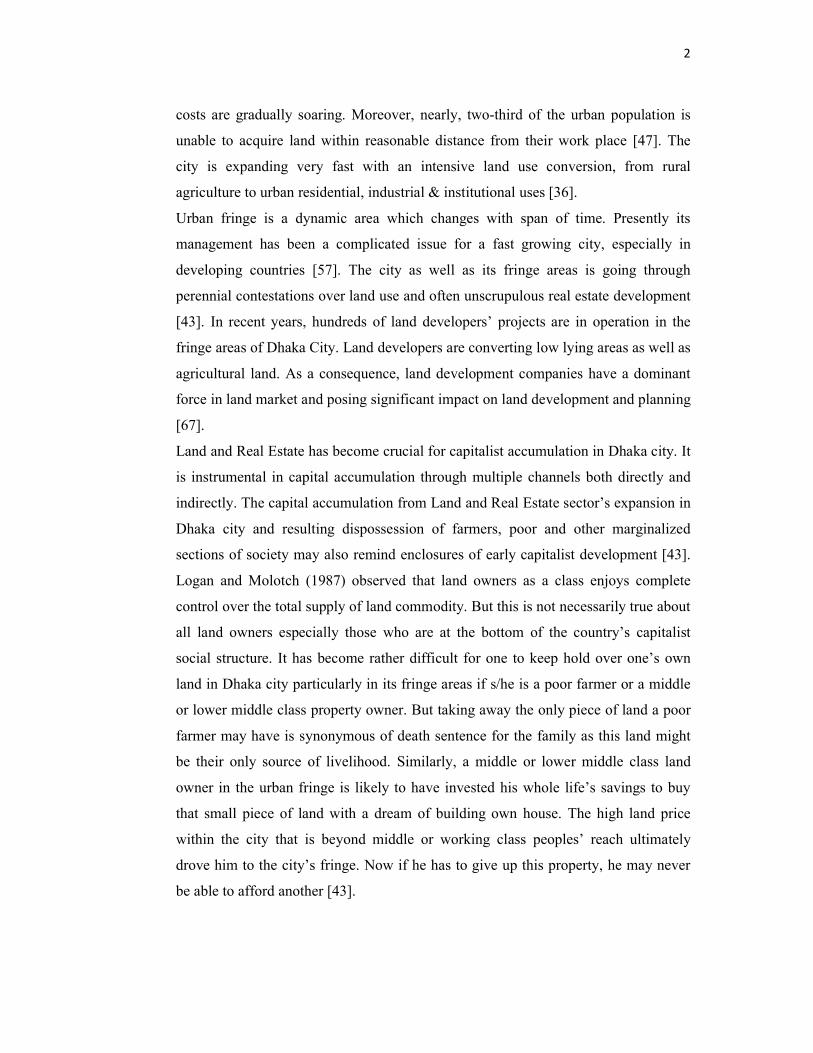
costs are gradually soaring. Moreover, nearly, two-third of the urban population is
unable to acquire land within reasonable distance from their work place [47]. The
city is expanding very fast with an intensive land use conversion, from rural
agriculture to urban residential, industrial & institutional uses [36].
Urban fringe is a dynamic area which changes with span of time. Presently its
management has been a complicated issue for a fast growing city, especially in
developing countries [57]. The city as well as its fringe areas is going through
perennial contestations over land use and often unscrupulous real estate development
[43]. In recent years, hundreds of land developers’ projects are in operation in the
fringe areas of Dhaka City. Land developers are converting low lying areas as well as
agricultural land. As a consequence, land development companies have a dominant
force in land market and posing significant impact on land development and planning
[67].
Land and Real Estate has become crucial for capitalist accumulation in Dhaka city. It
is instrumental in capital accumulation through multiple channels both directly and
indirectly. The capital accumulation from Land and Real Estate sector’s expansion in
Dhaka city and resulting dispossession of farmers, poor and other marginalized
sections of society may also remind enclosures of early capitalist development [43].
Logan and Molotch (1987) observed that land owners as a class enjoys complete
control over the total supply of land commodity. But this is not necessarily true about
all land owners especially those who are at the bottom of the country’s capitalist
social structure. It has become rather difficult for one to keep hold over one’s own
land in Dhaka city particularly in its fringe areas if s/he is a poor farmer or a middle
or lower middle class property owner. But taking away the only piece of land a poor
farmer may have is synonymous of death sentence for the family as this land might
be their only source of livelihood. Similarly, a middle or lower middle class land
owner in the urban fringe is likely to have invested his whole life’s savings to buy
that small piece of land with a dream of building own house. The high land price
within the city that is beyond middle or working class peoples’ reach ultimately
drove him to the city’s fringe. Now if he has to give up this property, he may never
be able to afford another [43].

3
In recent years, local people of fringe areas of Dhaka city are in the process of
relocation due to private housing projects. Both print and electronic media are full of
reports about wanton land grabbing by Land and Real Estate stakeholders [43]. In a
number of locations people protested against the activities of developer by forming
human chain in their own land [77]. One Land and Real Estate firm Ashiyan City has
been widely reported in media for its land grabbing and forced land purchases. But
the firm is being able to continue such activities despite Department of Environment
clamp down and widespread protest by the local residents. The strong arm techniques
applied by the firm are often not unique rather typical of the country’s Land and Real
Estate sector [43]. As a consequence, many people left their original location either
voluntarily or under pressure by the developers and resettled in new areas. This
situation is almost similar for all land developers.
The Oxford Dictionary defines resettlement as “Settle again in new or former place”
[61] while the same dictionary defines relocation as “move to a new place to live”
[61]. In relation to this study the usage of both terms are used in accordance with the
definition of physical movement of people to a new place to live other than the
previous place. Most social scientists who have studied people moving to new
locations to live have also used both relocation and resettlement terminology
[84][62][82]. The decision to shift one’s residence can be divided into processes
voluntary and involuntary. In case of voluntary shift, people move away for reason
ranging from better economic opportunities to a safe social or natural environment.
On the other hand involuntary displacement is caused by a variety of factors such as
natural disasters, ethnic, religious or political conflicts and development projects
[52]. Relocation results in a host of socio-economic impacts. Displacement of local
people from their own land has many negative social impacts [83]. During
displacement, people lose natural capital, social capital and human capital [2][5].
Socio economic impact assessment is to understand the current social and economic
environment and use it as a baseline for predictions and measurements. It can be seen
as a tool implemented in planning and decision-making [34].
The rapid pace of expansion of the city both by the private and public sector is
causing displacement of local people. It is sometimes argued that land acquisition by
government is necessary for urban development. This argument can be made over

4
land acquisition for public projects like Jamuna Bridge that benefits large sections of
population. But such argument cannot be made about land acquisition from poorer
and weaker sections of population for addressing housing demands and property
greed of different powerful actors [43]. On the other hand, in case of public projects,
there are certain policies and acts to compensate local residents who are affected by
the project. But in case of private land development projects, the process of land
transfer and other issues are very complex. Private Land and Real Estate firms may
not have the privilege and coercive powers of state land acquisition. But they have
stronger financial foundation and they can secure political backing. These enable
them to subordinate relevant governance arrangements and deploy strong arm
techniques in securing land in their own terms [43]. Thus it is important to have a
clear understanding of the relocation process in the urban fringe of Dhaka city due to
private land development projects. This research also tried to explore the socio-
economic impact of relocation on the local affected people.
1.2 Objectives of the Study with specific aims and possible Outcomes
Aims: The aim of the study is to assess the local people's conditions that are affected
by the private land developers in fringe area of Dhaka City.
Objectives:
Specific objectives of this study can be specified as below:
• To study the relocation process of local people due to private housing projects.
• To study the present status of relocated people and to assess the socio-economic
impact due to relocation.
1.3 Rationale of the Study
Urban fringe development is not only a process of transition of land from its rural use
to urban use, rather, it is a complex process that involves many concerns such as
influential actors, change in landownership pattern, land transfer process, regulatory
measures and their enforcement. The process of fringe development is not monolithic
and may be taken place either by rural actors or by urban actors, may be in formal

5
way or in informal way. There is a common understanding that urban fringe in
developed countries is a fashionable suburbs for higher income group whereas in
developing countries it is populated by poor residents arrived recently from rural
areas [1].
Presently Bangladesh government has neither sufficient technical and financial
capacity to deal with urban fringe problems, nor has sound institutional arrangement
and willingness to manage urban fringe growth [57]. A number of studies have been
conducted on land developer’s activities and government project relocation process.
For example Islam (2009) had demonstrated the social and economic forces which
related with the conversion of wetland where she indicated that local wetland owners
are exploited by private land developers, Roy (2007) had investigated the locational
aspects and trend of private residential land development projects in Dhaka
Metropolitan area since 1995, Haque (2004) had showed how private land
developers activities contribute to adverse impacts on the environmental condition,
Ahsan (2007) had concentrated his research focus on to ascertain the project affected
persons have restored the pre-project standard of living or been further
impoverishment.
So, it is important to have a clear understanding of the relocation process in the urban
fringe of Dhaka. This research also tried to identify the socio-economic impact of
relocation on the local people. No work has been yet done on relocation of local
people because of private land development projects. This research intends to focus
on the relocation process of the local people and to assess the present and previous
socio economic status of the relocated people.
1.4 Scope and Limitation of the Study
As mentioned earlier no significant research work was conducted focusing on
relocation of local people through private developers’ activities. Future researchers
can conduct more in-depth studies based on this research. In this study, sample size
was small due to time and resource constraints. Only four land projects were
considered in this study. Primary data were the main heart of this research.
Questionnaire surveys were used for primary data collection. The survey process is

6
long and time consuming work because local people were relocated from their
original location. So it was difficult task to reach them in their new places. . For time
constraints, only land owners who had land in selected land projects were considered
for this research. All other affected residents of the areas like tenants, landless people
were not included in the study. From four selected land projects, 350 relocated
household were selected for questionnaire survey. During the survey period the
passion and participation of the relocated people was outstanding. Without this types
of cooperation many hidden dimension related with relocation would not be possible
to discover. In some places, the surveyors had to face troubles by local muscleman
while collecting information at local level. On the other hand, the local
administrative persons were often non-cooperative. As a result it was not possible to
take interview of local Union Parishad Chairmans. Obviously this study is not free
from limitations but it tried to overcome as far as possible with utmost sincerity.
1.5 Organization of the Study
The study deals with various perspectives to fulfill the designated objectives and to
reach the final goal. Thus successful completion of the job is done by going through
the following arrangement of the study report.
Chapter one deals with the reason behind selecting the task along with its
justification. Besides declaring the objectives, it also contains the scope of the study
along with constrains and limitations prevailed in completion of the job. Chapter two
presents a review of literature on fringe areas growth strategies, key research
concepts considering relocation, magnitude and impacts of population displacement,
conceptual models, perspectives on forced relocation, resettlement policies in
different organization and countries including Bangladesh. The methodology and
procedural approach followed to carry out this study and steps followed for
successful completion of the job through attaining the objectives working behind the
whole activity is described in the chapter three. Chapter four contains the profile of
study area and relocated people. It incorporates maps of study areas, Google Earth
images, present project condition, proposals of Detail Area Plan (DAP) and profile of
relocated people. Chapter five brings light on relocation processes of local people

7
due to private housing projects. The data collected from field is questionnaire survey
and the indicators to realize relocation process such as original place of living, land
ownership, issues influenced relocation, land transformation process, land price,
transaction of money, mode of utilization of land selling money and relocated place
information. Next, socio economic conditions are divided into two sub group namely
social and economic are given in chapter six. Indicators under social are housing
condition, access to utilities services and social network. Similarly, indicators under
economic status are occupation, income, expenditure and land ownership. Chapter
seven presents major findings, recommendations and conclusion based on the results
from the previous chapters.

8
CHAPTER 2
THEORETICAL FRAMEWORK
2.1 Introduction
An extensive relevant literature is reviewed in this study from various research
reports, thesis, newspaper, journals, magazines, government reports etc and internet
is searched to develop the theoretical base to the study. This chapter presents a
review of literature on fringe areas growth strategies, key research concepts
considering relocation, magnitude and impacts of population displacement,
conceptual models, forced relocation issues, resettlement policies of different
organizations and countries including Bangladesh. An extensive literature survey of
the documents on relevant researches and studies both in Bangladesh and overseas
have been performed and some of them are abstracted in this chapter. A review of
literatures reveals that, no work has been yet done on relocation of local people
because of private land developers in Dhaka City, Bangladesh. Some ideas from this
review have been incorporated in the current research.
2.2 Key Research Concepts and issues relevant to the study
2.2.1 Displaced Persons and Project Affected Persons:
Populations may be displaced due to civil conflicts and war (i.e. conflict induced
displacement), natural and technological disasters (i.e. disaster induced
displacement), as well as large scale infrastructure and other development projects
(i.e. development induced displacement) such as the construction of highways, ports,
airports, dams and reservoirs etc. In relation to the definition of UN guidance
principles on internal displacement: internally displaced are persons or groups of
people who have been forced or obliged to flee or leave their homes or places of
habitual residence, in particular, as a result of, or in order to avoid the effects of
armed conflict, situations of generalized violence, violations of human rights, natural
or human-made disasters, and who have not crossed an internationally recognized
state border [79]. Lobo and Kumar (2009) noted the impact of development projects
on people’s lives in different ways. Some are forced to leave their homes and relocate

9
in different places. They are known as displaced persons. Around 10 million people,
according to the World Bank estimate, are being displaced every year all over the
world. Similarly some lose part or most of their land and their sustenance but not
physically relocated. They are known as project affected persons. People
(households) are affected by project-related changes in use of land, water or other
natural resources. Affected peoples (APS) are those who stand to lose, as a
consequence of the project, all or part of their physical and non-physical assets,
including homes; communities; productive lands; resources such as forests,
rangelands, fishing areas, or important cultural sites; commercial properties; tenancy;
income-earning opportunities; and social and cultural networks and activities [5].
2.2.2 Relocation and Resettlement:
The Oxford dictionary defines resettlement as “settle again in new or former place”
[61], while the same dictionary defines relocation as “move to a new place to live”
[61]. In relation to this study the usage of both terms are used in accordance with the
definition of physical movement of people to a new place to live other than the
previous place. Most social scientists who have studied people moving to new
locations to live have also used both relocation and resettlement terminology
[83][62][82]. Bank (1998) described that Relocation means rebuilding housing,
assets, including productive land and public infrastructure in another location.
According to World Bank (2010) Relocation is not only about rehousing people, but
also about reviving livelihoods and rebuilding the community, the environment, and
social capital. Relocation is defined as a process whereby a community’s housing,
assets, and public infrastructure are rebuilt in another location.
2.2.3 Voluntary and Involuntary Resettlement:
Lobo & Kumar (2009) in their book Land Acquisition, Displacement and
Resettlement in Gujarat: 1947-2004 noted that the decision to shift one’s residence is
voluntary and involuntary. In case of voluntary shift, people move away for reason
ranging from better economic opportunities to a safe social or natural environment.
The major factor here is the free will of the person to move. On the other side,
involuntary displacement is caused by a variety of factors such as natural disasters,

10
ethnic, religious or political conflicts and development projects. Development project
results in unavoidable resettlement losses that left affected people no option but to
rebuild their lives, incomes and asset bases elsewhere known as involuntary
resettlement [5]. Turton (2006) conceptualizes and defines forced relocation as:
“persons are forced to leave their homes or home lands for whatever reason and have
been allocated specific areas for them to settle down in their own country with at
least minimum resources and services to re-establish their lives”. Later, he broadened
the definition of the concept by including those who resettled under government
sponsored programmes that use relocation as a method of rural or urban development
or political control. As a result, Turton does not see much difference between the
concepts of forced resettlement and development induced resettlement [58].
Nevertheless, what is clear from Turton’s definition is that forced relocation involves
the use of power by one party in the form of rules, regulations etc to relocate the
other party. In this context, it is primarily a political phenomenon. In terms of the
characteristics of forced relocatees, they have less chance of returning back to their
previous place of residence; however the relevant authorities can take necessary steps
to minimize the negative impacts of the relocation in order to improve their living
standards [78].
2.3 Assets
In an attempt to explore household assets, under the context of forced relocation, it is
clear that assets are important resources in order to properly maintain their
livelihoods, and employ various livelihood strategies to ensure that they do not face
damage or loss. In the following section, the five most commonly used household
assets are discussed particularly to the context of forced relocation.
Natural Capital: The term natural capital refers to resource stocks from which
resource flows useful to livelihoods are derived. This includes land, water and
other environmental resources, particularly common pool resources [26].
Physical Capital: Physical capital includes assets such as housing, basic
infrastructure (transport, energy, water, and communication), production
equipment that people own, rent or use to engage in their livelihoods [68].

11
Financial Capital: Income from the sale of labour, which is one of the key assets
that the poor people possess, comes under financial capital. In general, urban
poor may more heavily depend on a cash income than the rural poor [39].
Human Capital: Human capital refers to the skills, knowledge, health and
physical fitness of an individual at any point during their lifetime [71].
Social Capital: Social capital is defined and identified by its function. Like other
forms of capital, social capital as a resource makes it possible to achieve certain
ends that in its absence would not be possible [25]. The World Bank says that
social capital is necessary for long term development and it is the capital of the
poor [8].
2.4 Growth Strategies of Fringe Areas
More than half of the world's population lives in areas that are classified as urban.
The border line between urban and rural landscape is called the urban fringe. Fringe
areas, proximity to the city, experience much of urbanization processes and serves as
buffer for urban development [1]. In developing countries, a substantial and growing
proportion lives in or around metropolitan areas and mega cities, including the zone
termed the 'urban fringe', where their livelihoods depend to some extent on natural
resources such as land for food, water and fuel, and space for living [33]. Land is the
main source of livelihood for many living in the fringe areas. The poorest are often
forced into temporary settlements, in urban fringe land. The urban fringe poor
depend to a greater extent on access to natural resources than do wealthier, urban-
based groups [1]. Clark (2009) noted that a primary driver of fringe development is
that of the availability of relatively low-cost land; made even more attractive, for
developers and speculators, due to lack of comprehensive planning, rules and
regulations. In response to the growing demand of housing, private land development
companies have a dominant force in land market and posing significant impact on
land development and planning [67]. Fringe areas generally fall outside the
jurisdictional boundaries of the governing bodies of the urban area. Therefore the
local governments of the fringe areas and those of the urban area are often acting
separately in terms of overall planning. This lack of an integrated advocacy group for
integrated urban planning for the fringe areas is one of the major hurdles to

12
overcome. Compounding the problem is that the local governments of the fringe
areas often have only limited town/urban planning rules, regulations or planning
capacity noted by Clark (2009). Lack of dependable institutions and absence of
government has caused problems on jurisdictional administration of these urban
hinterlands [1]. Kashem & Hafiz (2008) noted that in fringe areas of Dhaka,
urbanization is progressing very fast by filling of low-lying areas. Built-up area has
increased by about 50% between the year 1990 and 2000. Bangladesh government
has neither sufficient technical and financial capacity to deal with urban fringe
problems, nor has sound institutional arrangement and willingness to manage urban
fringe growth. Similarly, Masum (2009) noted that it is the major challenge for the
City Development Authority (RAJUK) to manage the urban spatial growth and to
meet the demand of the growing population with its limited resource.
2.5 Consequence of unplanned fringe area growth
Masum (2009) noted that, the most daunting problem associated with urban fringe in
most developing countries is development of land in informal way where associated
land development activities take place without conforming state rules and
regulations. Due to high demand of land, low lying areas are also being filled up for
various development purposes without considering any environmental impact. Arku
(2009) noted that unchecked outward urban expansion is invariably accompanied by
environmental consequences, including the loss of irreplaceable natural resources
and an increase in air pollution and traffic congestion. One major reason for the
unlimited outward expansion of urban areas is the lack of comprehensive physical
planning. Problems of urban fringe in developing countries are quite often and very
similar in nature. Most of the developing countries experience spontaneous
development pattern rather than planned growth.
2.6 Role of Private land developers in fringe areas of Dhaka city
Public agencies are failing to meet the total demand for housing units. They supply
serviced plots in planned areas to a limited extent. The government can meet only
three percent of the total demand for housing in Bangladesh [41]. By the year 2015,
Dhaka is projected to rank as the 5th largest city in the world, where 19 million

13
people will have to find their house [80]. For this reason private housing business in
our country especially in Dhaka is rapidly increasing. The scope of physical
expansion of Dhaka is limited due to unavailability of flood free land and rivers. As a
result, low-lying lands of fringe areas are attractive locations for development
activities. Islam (2009) noted that wetlands are attractive because of a number of
reasons namely availability of land in close proximity to the central city, demand for
urban land is far higher than the supply of land, lack of government control regarding
the expansion of city, availability of wetland in large tracts, socio-economic
characteristics of the owners of wetland and developments of roads and other
infrastructure. Private developers are buying lands from local people in various ways.
Hoque (2004) mentioned characteristics of Private developers, who purchase land in
the peripheral fringe areas where large reacts of undeveloped raw land are available
at low cost. Their activities include purchase of land from local residents,
development and sub division of plots and finally selling those lands to buyers.
Attractive advertisements and payments by installments are offered to prospective
buyers. Islam (2009) also described that in most of the cases land developers, at the
beginning of the projects buy small parcels of land in a scattered manner. In course
of filing their land, they intentionally spread out sand on surrounding plots. Which
make all the adjacent plots unproductive for paddy cultivation. As a consequence
owners of those plots are compelled to sell their land to the developer and the process
continues with the expansion of the project. In addition to that local owners are also
threatened by the developers to sell their land. Developers also often occupy absentee
lands and government owned (Khas) land [41]. Due to implementation of the project
a large number of families are gradually being pushed out without rehabilitation.
Kashem & Hafiz (2007) noted that due to its vicinity to the urban core of Dhaka, the
fringe area is a lucrative choice for real estate developers. Masum (2009) noted,
though the favorable government policy has encouraged the formal private sector to
expand their range of urban fringe development activities still their target is higher
and middle income groups and motivation is speculative in nature. To get land
approval, developers use political influence and personal contact with RAJUK
(approval giving authority) employees as well as bribes [57]. Tawhid (2004) noted
that Wetland Conservation Act, 2000 bars land development in water bodies

14
specially in fringe areas. But the developers and land owners have occupied and
filled the areas. A number of developers filled-up the low land for the development
of housing that is clearly marked as flood flow zone in DMDP. The Daily Star
reported on October, 17th, 2009 that around two hundred affected landowners at
Chunkutia under south Keraniganj formed a human chain in protest against alleged
land grabbing by Bashundhara Group, one of the country's leading real estate
company.
Some real facts of developers’ activities which exposed through mass media are
discussed below:
The Daily Star reported on November 17, 2011 about Ashiyan City’s illegal
activities through the title ‘Dreadful Land Development’.
The Department of Environment on November 17, 2011 fined Real Estate Company
Ashiyan City BDT 50 lakh for destroying peoples’ homes and a graveyard in Holan
of Dakkhinkhan in the capital of Bangladesh. In the photograph 2.1, a local resident
is explaining her plight to an official. The Daily Star reported on November 17, 2011
that many inhabitants of Holan and Ashkona in the capital's suburbs have been living
there for decades and generations. But they are now living in fear of eviction, as land
in their Dakkhinkhan neighbourhood has become a lucrative commodity for housing
companies. Daily Star also mentioned that it is not, however, only their homesteads
Photograph 2.1: A local resident explaining her plight to an official
Source: The Daily Star, 2011

15
and croplands that are being either forcibly purchased or grabbed for the project
Ashiyan City. The land developer of Ashiyan City project, has even filled up a two-
hundred year old graveyard in the area, where, locals say, some of their ancestors
were buried. On receiving information, a team of the Department of Environment
went to the company's Ashkona site to conduct an eviction drive on November 17,
2011. Many people spoke of their frustrations before the team. Many wept and
wailed as they described how the company had forcibly filled up their croplands.
They also narrated how some local goons and middlemen hired by the company were
intimidating and threatening them for selling their land to the company. Mr. Munir
Chowdhury, director of Department of Environment, Monitoring and Enforcement
Division, led the team, which found the allegations to be true and fined the company
Tk 50 lakh. This Team also ordered Mr. Nazrul Islam, managing director of the
company, to save the graveyard. Accompanied by members of Rapid Action
Battalion (RAB), the team also confiscated eight bulldozers and six dumper trucks
that Ashiyan had been using to knock down structures and fill up the land.
After nine months, same Daily newspaper reported that The environment ministry
has mysteriously waived BDT 45 lakh from a penalty of BDT 50 lakh slapped on the
developer of illegal housing scheme of Ashiyan City through the title ‘Ministry goes
soft on realtor’ slashes BDT 45 lakh off BDT 50 lakh fine.
Here it can be mentioned that a Dhaka Court on 1st February, 2010 sent Chairman
Nazrul Islam Bhuiyan of Ashiyan City Land Developer Ltd to jail after he
surrendered before it and sought bail in connection with an attempted land grabbing
case. Mr. Nazrul's cousin Ms Anwara Begum filed the case against 17 people,
including Mr. Nazrul Islam with Khilkhet Police Station, Dhaka on December 1,
2009. In the case statement, Ms Anwara alleged that Mr. Nazrul's musclemen
attempted to grab her 10 decimals land situated at Dakhinpara Bhuiyan Bari in the
city's Khilkhet area. Ms Anwara's brother Mr. Habullah who lived at that house was
beaten mercilessly when he resisted them during the attempt, it said. But after a few
days Nazrul Islam gained bail and continuing his activities as previous. So these
types of example also influenced people to recognize developer higher level of
linkage.

16
Considering land developers violation, The Daily Star on 10th November, 2012
reported through the title ‘Realtors real violators’. They mentioned that even
though the Department of Environment (DoE) and RAJUK have been penalizing
Real Estate firms for violations of environmental laws every now and then, many
of them and other big businesses have been constantly dodging the laws.
However, steps taken by the Department of Environment are only made public
when the regulator fines any firm in sudden visit. People remain in the dark about
the monitoring procedure during when the DoE officials allegedly favor some
businesses by giving them more time to comply with the related laws. And,
according to media reports, even though the businesses are fined, the amount of
fine could be reduced through negotiations with the officials of the ministry
concerned. This allows them and lures other unscrupulous businesses to dodge
laws even after they are being held responsible.
In May 2012, an inter-ministerial body led by the housing state minister
conditionally approved BDDL Natundhara and United City (Neptune Land
Development) in Dhaka's Eastern fringe following recommendations from
RAJUK, the real estate regulator, even though those projects were declared
illegal by the High Court last year for destroying natural wetlands and rural
homesteads. RAJUK in defence said that they had made the recommendation as
the district administration utility agencies and the DoE had given their clearances.
Two other similar projects, declared illegal by the High Court, Swarnali Abashan
and Green Model Town, were approved in August, 2012 by the same ministerial
body in the same way.
The 77 projects declared illegal by the High Court in June, 2011. The court had
directed the government to take action against the schemes developed over the
past decade by filling up low-lying wetlands, water bodies, rural homesteads and
croplands. A year before the HC directives, an expert body on Dhaka's detailed
area plan (DAP) recommended removal of BDDL Natundhara, Swarnali Abashan
and United City, showing those to be on floodplains in Bhatara, Santarkul,
Dumni and Sutibhola moujas. But still there have no meaningful progress about
this issue.

17
The Rajdhani Unnayan Kartripakkha (RAJUK) had lodged a complaint with
police against 41 real estate companies for breaching housing laws by
undertaking 43 illegal projects. The city housing authority filed a general diary
with Sher-e-Bangla Nagar Police Station on 18th December, 2011. The companies
against whom the GD has been filed were: BDDL, Ashiyan Lands Development
Ltd, Biswas Builders, Amin Mohammad Lands Development Ltd, The Dhanshiri
(BD), Bashudha Builders, Tanshir Properties, East West Properties Ltd, Well
Care Consortium, AG Properties, Metro Properties, US Bangla Group,
Heerajheel Properties Development, Nasim Group, Purbachal NRB Homes,
Sabuj Chhaya Residential Project, Glorious Land Development, MA Wahab and
Sons, Bashukunja Lands Development, Nabodoy Housing, Shatabdi Housing,
New Dhaka Alliance, Inspired Development, Atlantic Properties, Vision 21
Design & Development, Four Seasons Holdings, Kopotakkha Green City, Ideal
Real Estate, Probashi Palli Group, Yes Group, Innovative Holdings, Bangladesh
Development Company, Actual Land Development, Uttaran Properties, New
Vision Group, Udayan Properties Development, Bhulua Royal City Private Ltd,
Al Warish Properties, New Dhaka Alliance, Dakkhina Real Estate, and Invite
Properties. But RAJUK activities concentrate only by GD; no crucial action had
been taken for stopped their illegal activities.
2.7 Magnitude and Impacts of Population Displacement
Many development projects intended to alleviate poverty, ended up increasing
poverty by displacing large numbers of people without reestablishing them viably,
despite the use of compensation payments for assets lost. According to World Bank
(2010) unsuitable new sites can lead to lost livelihoods, lost sense of community and
social capital, cultural alienation, poverty, and people abandoning the new sites and
returning to the location of their original community. Risk of impoverishment is
inherent in the process of relocation of local people from their original places through
a number of sources. Once people lose their land, income and other assets and move
to new surroundings, they are unable to use their traditional skills. The productivity
of their land decline, as does their food security [64]. Ahsan (2007) expressed that
during displacement people lose natural capital, manmade capital, social capital and

18
human capital. Displacement of people from their origin and poverty has been linked
together by social scientists. Cernea’s (1999) model has been used as a framework
for a number of studies. For example Mahapatra (1999) uses a model for evaluation
of India’s resettlement from 1947 to 1997, examining each of the risk in turn.
Ramaiah (1995) noted that involuntary relocation create adverse impact on health
because of mental stress and higher work pressure.
2.8 Conceptual models Perspectives on Forced Relocation
Two conceptual models which deal with forced relocation are presented in the
following section.
1. Thayer Scudder’s (2005) conceptual model on stress and settlement process. This
is based on the concept of stress to analyze the process of resettlement based on
four distinct stages.
2. Michael Cernea’s (2000) impoverishments risks and reconstruction model for
resettling displaced populations (IRR model). Eight risks are identified that
resettlers have to cope with in order to successfully protect their lives from
impoverishment.
2.8.1 Thayer Scudder’s Stress and Settlement Process
Conducting various studies on forced resettlers (development-induced resettlers),
Thayer Scudder develops a multidimensional stress and settlement process model
[69]. This model discusses physiological, psychological and social-cultural
dimensions of stress that resettlers have to grapple with. Multi-dimensional stress is
especially prevalent during the physical removal of people from their settlements and
in the years immediately following resettlement. Resettlers can overcome this
however; it depends on the successful implementation of resettlement processes. If
not, resettlers have to grapple with stress for longer periods.
Stage One: Planning and Recruitment –This stage mainly deals with activities
relating to the pre-resettlement period, such as planning for the removal,
rehabilitation and development of the people. In order to make resettlement a
success, Scudder stresses the importance of early involvement of displaced people in
the planning and decision making process.

19
Stage Two: Coping and Adjustment –This stage begins as soon as the physical
removal of communities for resettlement has commenced. It is considered the most
painful stage as it may take a number of years, depending on the number of resettlers
and the time taken to construct new settlements. During this stage, one could expect
the living standards of the majority of resettlers to drop, owing to multidimensional
stress and the large number of adjustments that take place in order to adapt to the
new environment such as new neighbours, new economic activities, rising expenses,
the host population.
Stage Three: Community Formation and Economic Development –The majority
of resettlers show more attention to community formation activities by forming
different community based societies such as burial, farming or water use
associations, and also actively involve themselves in societal activities, constructing
various religious structures and common infrastructure such as clinics, community
centres etc. These collective activities, at the community level, and economic
development at the household level will eventually not only improve the living
standards of resettlers, but also minimize their dependency syndrome.
Stage Four: Handing Over and Incorporation - This involves the second
generation of resettlers. Successful integration of relocated populations into a
regional or national political economy will bring an end to the relocation process.
2.8.2 Michael Cernea’s Impoverishment Risks and Reconstruction Model for
Resettling Displaced Populations (IRR model)
Cernea stresses the applicability of this model as a planning and monitoring tool. The
eight risks are briefly discussed below:
(1) Landlessness: Confiscation of peoples land would eventually destroy the
foundation of productive systems, commercial activities, and livelihoods which,
in turn, is seen as a major factor of poverty as they lose both manmade and
natural capital unless they acquire land elsewhere and the productive system is
reconstructed, or replaced with steady income generating activities [24].
(2) Joblessness: The risk of losing wage employment as a result of resettlement is
very high among both rural and urban populations. To overcome this, it is
important to create more opportunities for them to acquire more skills, financial

20
assistance to start new income earning activities using these skills and also to
assist them to find employment [24].
(3) Homelessness: For many resettlers loss of shelter is only for a temporary period.
But some resettlers have to remain in temporary shelters or camps for longer
periods of time until they obtain a house to stay in or complete construction of a
new house. These risks can be avoided by adequate project financing and timely
preparation [24].
(4) Marginalization: This occurs when families loose economic power. Economic
marginalization is often accompanied by social and psychological
marginalization, which can be identified by resettlers feeling a loss of confidence
in themselves and society, a drop in social status, feelings of uncertainty,
injustice, and deepened vulnerability. When displacees resettle in new locations,
they are called “strangers or outsiders” and generally do not get equal access to
opportunities and entitlements similar to what the host community enjoys [24].
(5) Food Insecurity: Settling displaced people in new locations can increase the risk
of temporary or chronic undernourishment as their calorie-protein intake tends to
be below the minimum necessary levels for normal growth and work. There is a
close link between food insecurity related risks and morbidity and mortality risks
[24].
(6) Increased Morbidity and Mortality: Massive population relocation can lead to
serious declines in the health of resettlers as a result of relocation induced social
stress, psychological trauma and vector born diseases [24].
(7) Loss of Access to Common Property Resources: Loss of access to common
property resources that belong to relocated communities can obstruct their
income earning activities and in turn deteriorate their household income. When
displaced people’s access to common property resources are not protected, they
tend either to encroach on reserved forest or put pressure on the host
community’s common property resources which is one of the causes of social
conflicts with the host community and further environmental degradation [24].
(8) Social Disarticulation: Resettlement fragments communities, dismantles
patterns of social organization and disrupts informal networks with friends,
neighbours etc. Most importantly, all of these are uncompensated. The real loss

21
of social capital as a result of relocation has long term consequences, such as
growing alienation and anomie on one hand and lower cohesion in family
structure on the other [24].
2.9 Resettlement Policies
2.9.1 The Nature of the Involuntary Resettlement Policy of Different
Organization
2.9.1.1 Asian Development Bank (ADB)
Involuntary Resettlement Policy, 1995:
Where population displacement is unavoidable, a detailed resettlement plan with
time-bound actions specified and a budget are required. The contents and detail of
resettlement plans will vary with circumstances, especially the magnitude of
resettlement. To assist staff and project sponsors, a set of guidelines and an annotated
outline of a resettlement plan will be prepared and issued after the resettlement policy
is approved by ADB.
Handbook on Resettlement, 1998:
A full Resettlement Policy (RP) is required when resettlement effects are significant.
“Significant” is defined as meaning that 200 people or more will experience
resettlement effects; 100 people or more who are experiencing resettlement effects
are indigenous people or vulnerable as defined in the policy (for example, female
headed households, the poorest, isolated communities, including those without legal
title to assets, and pastoralists); or more than 50 people experiencing resettlement
effects are particularly vulnerable, for example, hunter-gatherers. The projects
department concerned decides, in consultation with Social Development Division, if
a full RP is required. The Handbook defines effects as “Insignificant” if they are
below the AP thresholds mentioned. Projects with insignificant resettlement effects,
as determined by the Projects Departments concerned and SOCD, will have a short
RP.
Operations Manual (OM) Section OP/F2 Issued on 29 October 2003
Projects are assigned an IR category depending on the significance of the probable IR
impacts. a. Involuntary Resettlement Category A: Significant. “Significant” means
200 or more people will experience major impacts, which are defined as (i) being

22
physically displaced from housing, or (ii) losing 10% or more of their productive
assets (income generating). Category A projects require a full RP. Some of these
projects may require a RF prior to the full RP. b. Involuntary Resettlement Category
B: Not Significant. Category B projects include IR impacts that are not deemed
significant and require a short RP. Some of these projects may require a RF prior to
the short RP. c. Involuntary Resettlement Category C. No IR effects are foreseen in
category C projects. They neither require an RP nor an RF.
Objectives and Principles of ADB Involuntary Resettlement Policy:
Involuntary resettlement should be avoided where feasible.
Where population displacement is unavoidable, it should be minimized by
exploring all viable project options.
People unavoidably displaced should be compensated and assisted, so that their
economic and social future would be generally as favorable as it would have been
in the absence of the project.
People affected should be informed fully and consulted on resettlement and
compensation options.
Existing social and cultural institutions of resettlers and their hosts should be
supported and used to the greatest extent possible, and resettlers should be
integrated economically and socially into host communities.
The absence of a formal legal title to land by some affected groups should not be
a bar to compensation; particular attention should be paid to households headed
by women and other vulnerable groups, such as indigenous peoples and ethnic
minorities, and appropriate assistance provided to help them improve their status.
As far as possible, involuntary resettlement should be conceived and executed as
a part of the project.
The full costs of resettlement and compensation should be included in the
presentation of project costs and benefits.
Costs of resettlement and compensation may be considered for inclusion in Bank
loan financing for the project.
2.9.1.2 World Bank
In 1980, when the first World Bank policy on resettlement was issued, the policy
objective was defined as “to restore [to their pre-project levels] and if possible

23
improve” the income/livelihood standards of resettlers [6]. In 1988, when the Bank’s
policy guidelines were first published by the Bank, the concept of “restoring” was
explicitly defined as reaching higher than pre-project levels; that is, reaching a level
that includes the growth that would have occurred “without the project” [28]. In
1990, the policy goal was again enhanced, being defined as “improving, or at least
restoring” (instead of the previous wording “restore and if possible improve”) the
income and livelihoods levels of resettlers. It specified further that “all involuntary
resettlement should be conceived and executed as development programs, with
resettlers provided sufficient investment resources and opportunities to share in
project benefits” [15].
According to World Bank following aspects are required for Successful
Relocation:
Relocation of communities requires risk mitigation through well-planned and
adequately financed programs that include such elements as land-for-land exchange,
employment generation, ensured food security, improved access to health services,
transportation to jobs, restoration of common properties and support for community
and economic development.
Relocation is more likely to be successful when:
Affected communities participate in critical relocation and implementation
decisions (site selection, identification of basic needs, settlement planning,
housing designs, and implementation);
Livelihoods are not site-specific and so are not disrupted;
Water, public transport, health services, markets, and schools are accessible and
affordable;
People are able to bring with them items of high emotional, spiritual, or cultural
value (religious objects, salvaged building parts, statuary or other local
landmarks);
People belonging to the same community are resettled together to a new site;
Emotional, spiritual and cultural attachment to the old site is not excessively
high;
Housing designs, settlement layouts, natural habitat, and community facilities
conform to a community’s way of life;

24
Social, environmental and hazard risk assessments confirm that risk cannot be
mitigated in the old location, while the community can be assured of the
suitability of the relocation site;
Communication with target groups is frequent and transparent, and mechanisms
to resolve grievances are effective; and
Relocation and assistance to mitigate its economic impacts are adequately funded
over a reasonable period of time.
2.10 Reviews on the Systems of Involuntary Resettlement of
Different Countries
2.10.1 India
In case of project driven involuntary resettlement of people, India used to have no
policy but relied on the Land Acquisition Act (LAA) of 1894 (amended in 1984), and
the National Highways Act 1957 which cuts some corners of the LAA. The LAA
lays down the procedures for expropriating and compensating land owners and the
amendment improved public disclosure of decisions. However, it does not directly
deal with resettlement and rehabilitation of affected persons (APs), informal
dwellers, tribal lands or land donation issues. In February 2004, the Government of
India approved a policy on involuntary resettlement. It includes the following
specifications: (i) the cost of resettlement and entitlements are to be made part of the
project cost (ii) consent award for compensation of land is allowed (this means APs
can in principle participate in the land valuation process and that the consent of
landowner is essential to finalize the award) (iii) some measure of rehabilitation
assistance is to be provided to affected persons full text (iv) assistance needs to be
provided to vulnerable groups like Below Poverty Line Marginal Farmers, Scheduled
Tribes and Scheduled Castes (although it is unclear whether squatters are included)
(v) tribal land issues are to be dealt with separately and (vi) assistance needs to be
provided to laborers losing livelihood as a result of the project.
Drawback addressed in the policy:
(i) The policy seems to be intended mainly for major infrastructural works like
dams (only one brief paragraph addresses the complexities of linear projects
like roads).

25
(ii) No assistance is specified for encroachers and squatters that need to be
moved.
(iii) The Policy does not discuss replacement value for land, structures and other
assets lost.
(iv) No provision is made for addressing loss of common property resources.
2.10.2 People’s Republic of China
Land in People’s Republic of China is owned either by the State (all land in cities,
and much ‘wasteland’ elsewhere) or by collectives (agricultural land in rural areas).
One law and two regulations have governed compulsory land acquisition and
involuntary resettlement: (i) the Land Administration Law of 1998, which includes
land compensation and involuntary resettlement subsidy issues and which deals
mainly with rural farm land owned by collectives, (ii) the Water/Hydro Power
Resettlement Regulation of 1991, and (iii) the Regulations for the Management of
Urban Residential Demolition and Eviction (1991, implemented from November
2001), applying to resettlement in towns/cities in the context of public works, where
all land is owned by the state. The Ministry of Land and Resources promulgated new
Regulations on Land and Resources Hearings in 2004, which require the land
expropriating agencies to inform affected farmers of their right to a hearing on
compensation standards and the resettlement package. Such a hearing must be held if
requested within five days after the parties are informed. Document No. 28, also
approved October 2004, takes this further and states that before the expropriation is
submitted for approval, its purposes, location, compensation standard and
resettlement and rehabilitation measures should be made known to farmers whose
land is to be taken, and the results of the survey on the existing situation of the land
proposed to be taken should be confirmed by the rural collective and farmer
households. The Ministry of Land and Resources is currently reviewing the land
compensation system, aided by World Bank technical assistance, in order to
systematize and unify this. Compensation rates for expropriation of arable land have
improved steadily in the past few years; even in remote areas, they are routinely
equivalent to between $15,000 and $50,000 per hectare of arable land. Around urban
areas these values can be doubled easily. Almost always, cash compensation is relied

26
on; this is also almost invariably favored by the farmers who lose their land. Apart
from land compensation and resettlement subsidy, the law provides for compensation
for temporary use of land and loss of young crops. The other two regulations, one for
dams and one for urban demolition have upheld more conservative compensation
rates and have been more controversial for this reason, but are currently under
revision. For urban dwellers who need to be displaced, rehabilitation assistance can
be provided but not in cash and not in the context of the project causing the
displacement; actual programs of rehabilitation are not mandated but are contingent
upon local government interest and budgets available. This policy relies on post-
resettlement plans for the rehabilitation of dam reservoir displaced persons. The
plans are not very much regulated and in practice this leads to variable rehabilitation
efforts of the local authorities.
2.10.3 Pakistan
The Land Acquisition Act (1894 with subsequent amendments) governs land
acquisition for development purposes by the Government of Pakistan. Section 4
allows preliminary notification for survey. Section 6 provides for declaration of
intended acquisition. Section 8 deals with detailed survey and planning. Sections 11
to 15 and 23 to 28 provide for inquiry by the Land Collector into claims and values,
and the setting of compensation levels, primarily through interpretation of market
value. Sections 16 and 17 provide for compulsory acquisition, while Section 18
allows for redress of grievance at the District level Civil Courts, and above, if
necessary. Each province has its own application and interpretation of the Act
through the provincial Land Revenue Department and the Land Acquisition
Collector. Generally, compensation rates are set through an officially determined
registered market value which draws upon past market prices and might not reflect
the current market cost [5].
2.10.4 Philippines
The Government of the Philippines as of yet does not have a specific law which
comprehensively addresses the complex issues of involuntary resettlement. There are
laws which provide a part of the legal framework for addressing such issues. Urban
Development and Housing Act, and lastly the Republic Act (RA) 8974 of 2000, also

27
named the Act on the Acquisition of Right of Way, Site or Location of Government
Infrastructure Projects. The Philippine Constitution guarantees payment of just
compensation for private property taken for government use. The Urban and Housing
Act defines the procedures for the relocation of illegal settlers in urban areas. RA
8974 sets the system for land acquisition and defines the procedures and valuation
methods to be use RA 8974 prescribes that land acquisition shall be done in three
ways: (i) by donation, (ii) by negotiation; and (iii) by expropriation. The act
stipulates that the first option to be considered is by donation. Property owners shall
be asked to donate the land needed for the government infrastructure projects. This is
commonly done when the land needed is not sizable as in the case of irrigation canals
or a few square meters for drainage and road improvements; and/or in situations
where the private owners stand to benefit from the government project as in the case
of irrigation or road access. If the private owners refuse the request for donation, the
act prescribes that the government initiates negotiation with the private owners. The
government shall initially offer the zonal value of the needed property as determined
by the Bureau of Internal Revenue. This zonal value is usually lower than the fair
market value and is based on values identified by real estate brokers and developers.
If this is not acceptable to the property owners, the governments continue the
negotiation to determine the fair market value of the property. The Act defines fair
market value as the value which will allow the property owner to acquire similarly
situated land of approximate size. The fair market value laid down by the Act is
essentially equivalent to the cost of replacement of the land. If the negotiation fails,
the government initiates expropriation by filing an expropriation case in court with a
mandate to pay the property owner the value of the property based on zonal valuation
of the Bureau of Internal Revenue. If the owner refuses to accept the offer, the court
shall decide within 60 days the just compensation of the property based on conditions
defined in the Act. These conditions include: (i) the classification and use for which
the property is suited based on the approved land use and zoning ordinance of the
municipality or city concerned; (ii) the development costs for improving the land;
(iii) the value declared by the property owners as shown in their latest Tax
Declaration Certificates or Sworn Statements; (iv) the current market selling price of
similar properties in the vicinity based on the records on Deeds of Sale in the Office

28
of the Register of Deeds concerned; (v) the reasonable disturbance compensation for
the removal and or demolition of certain improvements on the land and for the value
of improvements thereon; (vi) the size, shape or location, tax declaration and zonal
valuation of the land; (vii) the price of the property as manifested in the ocular
findings, oral as well as documentary evidence presented; and (viii) such facts and
events as to enable the affected property owners to have sufficient funds to acquire
similarly situated lands whose areas and values approximate those required from
them by government which will enable the property owners to rehabilitate
themselves as early as possible. The government shall then pay the property owners
the difference between the amount already paid and the compensation value defined
by the court. The Implementing Rules and Regulations (IRR) of Republic Act 8974
stipulate that the replacement cost method shall be used for determining the value of
improvements and structures on the land and the IRR defines this as the amount
necessary to replace the improvements and structures based on the current market
prices for materials, equipment, labor, contractor’s profit and overhead and all other
attendant costs associated with the acquisition and installation in place of the affected
improvements and structures. RA 7279 or the Urban Development and Housing Act
of 1992 prohibits the demolition or eviction of illegal settlements unless resettlement
sites acceptable to the relocatees are available. The Act requires that basic services
such as infrastructure, utilities and social services; and employment opportunities
shall be provided in the resettlement sites. The Implementing Rules of the Act
defines the procedures and guidelines for relocation including identification of
resettlement sites; census and tagging operations; consultation process; preparation
and development of resettlement sites; dismantling of structures; relocation and post
resettlement operations. As mentioned, the legal framework for involuntary
resettlement in the Philippines is constrained by the lack of a law which specifically
addresses involuntary resettlement. Thus compensation based on replacement cost is
limited only to the payment for land and structures; and agricultural crops affected by
government projects.
2.10.5 Bangladesh
In Bangladesh, people experience displacement from their homes and livelihood
sources due to a variety of factors such as natural disasters and development of large

29
infrastructure projects. Hundreds and thousands of people are displaced annually in
the country by public and private sector development projects due to acquisition of
land causing impoverishment of those affected and displaced. The current land laws
and regulations, including the Acquisition and Requisition of Immovable Property
Ordinance II (1982), have failed to adequately address the needs of those affected
and displaced. The land acquisition laws of 1982 and 1989 ensure only statutory cash
compensation to legal owners of the properties under acquisition, but do not
guarantee neither replacement of the acquired properties or restoration of the
standard of living of those affected by the acquisition. The acquisition laws have no
provisions for compensating people who are not property owners, but nevertheless
stand to lose from the acquisition (tenant farmers, share croppers, farm laborers and
other customary or illegal occupants of lands under acquisition). The notices for
acquisition of land (under the 1982 Ordinance) is not served to the individuals
concerned but is only made known through public notice, result frequently in
forfeiture of rights. People get to know about the government’s intention to acquire
land too late to make necessary preparations.
Land Acquisition Ordinance (LA Ordinance) of Bangladesh does not have any
provision for resettlement/rehabilitation but only the monetary compensation to the
property loser. In most of the cases this money cannot compensate for 25 percent of
tile losses [51]. For the calculation of compensation, the land acquisition officials at
the district have to depend on the available records of rights and records of transfer of
property. The common practice of under reporting the value of land in transfer deeds
(in order to avoid taxes) results in too low a level of compensation. On the other
hand, there are also a few examples of fake transfers at an artificially high level
taking place in anticipation of land being acquired, in order to raise the level of
compensation.
Non- payment or delayed payment of compensation is common practices. The policy
of transfering government funds for land acquisition in three or four installment,
spread out over the year, means that the district administration may not have
sufficient funds available when payment is due. The property owners incur high
transaction expenses for travelling to and from the district office to claim the rights
and to receive compensation. Objections against acquisition are often heard and

30
payment of compensation is normally done in the district town. This means that the
recipients not only face high costs for travelling to the district town, but also lose
income.
Related aspects regarding relocation issue in ‘Private Residential Land
Development Rules 2004’ are discussed in below:
Land ownership and conditions for the rehabilitation of the acquired land owners:
Entrepreneur of a private residential project must own precisely the complete land
area (hundred percent) without any shares, if the entrepreneur fails to own maximum
10% of the total land locally for any reason from any land or house owner (in special
case maximum 15% of the total land with the permission of the committee formed by
the government), can be proposed for land acquisition through the law and in such
circumstance the enterprenure must appeal for land acquisition with proper reason
supporting his proposal.
Under the Sub Act (1) owners of the acquired land or house (The Acquisition and
Recquisition of Immovable Property Ordinace, 1982 (Ordinance No. II of 1982)
must be paid an extra 50% value for the property according to the Ordinance.
Under the Sub Act (1) owners of the acquired land or house must be provided a
Rehabilitation Plot in the project area with 50% discount from the present rate of
the developed plot as their land or house has been acquired for the project.
All the acquired land owners must be rehabilitate and such Indigenous dwellers
must be provided with Rehabilitation Plot where accurately their previous
houses/infrastructures were and Layout Plan must be produced accordingly.
While producing Layout Plan if acquired land owner’s land is distinguished for
road, sewerage or such essential public facility then they must provided
Rehabilitation plot as near as possible to their previous plot and such owner’s
land location and Rehabilitation plot location must be showed in the Layout Plan.
NB: In this Sub Act Indigenous means such person who has been dwelling in that
house or land since 1971 or before, or has been inherited the land or house according
to the CS Record.

31
There are no specific rules and regulations for relocation/resettlement procedure of
local people in Bangladesh. Government projects that are supported by donors are
considered relocation issue from their perspective. For example Resettlement Plan of
Bhairab Bridge Construction Project carried out accordance with DFID guidelines on
Involuntary Displacement and Resettlement. Similarly Jamuna Multipurpose Bridge
authority prepared their resettlement action plan based on their donor World Bank
‘Involuntary Resettlement’ manual. But for private projects, there have no specific
guidelines for local people relocation.
In below shows two government projects case studies where relocation issue were
properly mentioned
Case 01: Jamuna Bridge Project
Jamuna Multipurpose Bridge Project mainly followed World Bank Resettlement
Objectives for addressing local people relocation. Which are mentioned in below:
a) Involuntary resettlement should be minimized where feasible, exploring all
viable alternative project design.
b) Since some displacement is unavoidable, resettlement plans should be developed.
All involuntary resettlement should be conceived and executed as development
programmers with resettles provide sufficient investment source and
opportunities to share in project benefits. Displaced persons should be (1)
Compensated for their losses at full replacement cost; (2) Assisted with the move
and supported and during the transition period in the resettlement site; and (3)
Assisted in their efforts to improve their former living standards, income earning
capacity, and production levels, or at least to restore them particular attention
should be given to the needs of the poorest groups to be resettled.
c) Community participation in planning and implementing resettlement should be
encouraged. Appropriate patterns of social and cultural institutions of resettles
and their hosts will be supported and used.
d) Resettlers should be integrated socially and economically into host communities
in such a way that host communities also benefit from the project. Consultation
between resettlers and host communities is to be realized.

32
e) Land, alternative sources of income, skill training, infrastructure and other
compensation should be provided to the adversely affected population who has
usufruct or customary right to the land or other resources taken for project.
Absence of (legal) title to land should not be a bar to compensation to those
deriving an income from the land or living on the land.
JMBA (Jamuna Multipurpose Bridge Authority) adopted a Resettlement Policy that
covers the weaknesses of the land acquisition laws and the same time would ensure
proper resettlement and rehabilitation of the project affected persons. The primary
objective of Resettlement Policy is to enable all project affected persons to at least
regain their pre acquisition standard of living and preferably to improve upon it.
The core components of this Resettlement Policy are:
i. People who are losing farm/homestead lands will be given a grant in addition
to the compensation under the law to cover the difference between the
compensation and the actual replacement cost of those properties. In addition,
they would also be provided with institutional assistance and liberal credit
facilities to purchase replacement lands from the open market.
ii. People who do not own a homestead but are displaced from their place of
residence will be given a house plot at the resettlement site or a cash grant to
purchase a similar plot elsewhere.
iii. People losing their residence and other structures will be given transfer and
reconstruction grants.
iv. Assistance in the form of maintenance grant, vocational training and
subsequent credit facilities to those who are affected by loss of sharecropped
land and/or wage employment.
The entire resettlement program will be carried out with the full cooperation and
participation of the affected population including the host area population. The
implementation of the program will be closely monitored to assess the effectiveness
of the policies and plans and modification and changes will be made whenever
required.

33
Entitlement Package:
Loss of farm land: All PAPs affected by loss of farm land are entitled for a monetary
package adequate to buy an equal area of replacement land. This package includes, in
addition to the compensation under the land acquisition Act, a cash grant to meet the
difference between the compensation and the replacement value of an equivalent area
of land. Land losing PAPs were also eligible for an additional credit up to 50 percent
of the total compensation purchase of land. This facility is primarily to safeguard
those PAPs who are, for various reasons, unable to put in their share of money
(compensation money received earlier). Commercial interest rates were charged to
discourage misuse of the credit facilities. This facility, were available to those PAPs
whose per capita residual holding is more than 33 decimals (1decimal is equal to 40
square meters).
Loss of homestead: All PAPs who have lost their normal place of residence (land
and structures owned or otherwise occupied) to project works are entitled to an
equivalent replacement homestead land. Such PAPs were not evicted from their place
of residence until a replacement homestead is provided for either by themselves or by
JMBA in a resettlement site.
Loss of residential and commercial structures: PAPs affected by loss of residential
structures are entitled to a transfer and house construction grant of BDT 7000. This
was paid in two installments BDT 2,000 at the time of relocation and BDT 5000 after
PAP has identified a homestead and vacated from their old structure(s). In the case of
commercial building, the scale of assistance is (a) dismantling and removal
assistance equal to 15 percent of the compensation under the law and (b) building
construction grant of BDT 25 per sq. ft. of floor area. PAPs who are displaced from a
rented/occupied commercial premise are entitled for a moving/transfer grant of BDT
2000.
Loss of rented in/share cropped farm, wage labour/employment: Persons affected
by such losses are entitled to a one-time maintenance grant of BDT 3600 and for
vocational training at project cost, After the vocational training, they were helped to
find employment or to obtain institutional credit for starting a suitable production

34
service activity. Alternatively these PAPs are entitled to 15 decimals of land, the cost
of which is considered equivalent to the cost of vocational training. Landless tenant
frames and farm laborers residing within areas acquired for the project were offered
an alternative option of a cash grant adequate to buy 15 decimals land. The cost of 15
decimals land is considered an equal to the cost vocational. This grant will be paid
only against purchase of land.
Case 2: Bhairab Bridge Project
Bhairab Bridge constructed over river Meghna. The bridge was completed in 2002
with the help of British expertise and funding. The bridge was constructed at a cost
of 681 Crore BDT, funded jointly by the Government of Bangladesh (58%), the UK
Department for International Development (DFID) (21%) and through a loan from
Standard Chartered Bank (21%).
Land Acquisition and Resettlement Plan of Bhairab Bridge Construction Project
carried out accordance with GoB Acquisition and Requisition of Immovable Property
Ordinance II (1982) and DFID/DAC-OECD Guidelines for Aid Agencies on
Involuntary Displacement and Resettlement in Development Projects (1992).
DAC-OECD policy requires that displaced persons should be (i) enabled to
reconstruct a land-based or employment-based productive existence; (ii)
compensated for their losses at replacement costs; (iii) assisted with the move and
during the transition period at the relocation site; and (iv) assisted in their efforts to
improve their former level of living, income earning capacity, and productive levels,
or at least to restore them.
Land acquisition and resettlement of Project Affected People carried out in
accordance with the following guidelines in a manner satisfactory to DFID.
1. Land acquisition will be minimized to the extent possible in the Project and will
be carried out in a way that it will minimize the adverse impact on the PAPs. This
will be done in consultation with the people to be affected.
2. PAPs losing land will, to the extend possible, receive replacement land for
farming and livelihoods. If land is not available, cash compensation will be paid

35
at the market value of the land. Likewise, loss of standing crops and productive
trees will be compensated at market price.
3. Owners of residential/commercial structures will be compensated at replacement
costs. RHD (Roads and Highways Department) will ensure access of SMEs,
particularly the godown owners to river front and roadside space along the new
ferry ghat to re-establish their businesses.
4. Renters/lease holders affected by loss of living quarters will receive
compensation due to indirect impact of the Project.
5. Additional compensation in the form of income restoration will be provided to
ensure no loss of income during the period of relocation and resettlement.
6. The needs of women and other vulnerable groups will be identified and
provisions made for social support, employment, and means of subsistence to
maintain their role as contributing members of their households.
7. Affected community infrastructures or common property resources, including
tubewells will be re-built or replaced at project costs.
8. RHD/SAP implementing NGO will assist PAPs and SMEs in all aspects
regarding relocation and resettlement.
9. RHD will guide, supervise and monitor the land acquisition, compensation
payments, and resettlement of the PAPs, including grievance redressal and
resolution of disputed claims for compensation.
In below major approaches which covered resettlement policies are described.
Table 2.1: Type of Losses, Risks and Mitigation Measures
Type of Losses Impact and Risks Mitigative Measures
1. Land -Privately owned Loss of commercial
land/plot due to RoW and working area requisition
Loss of agricultural land /water bodies for natural and cultured fisheries due to RoW and temporary /permanent working area
Loss of income from
land and commercial activities
May cause disruptions on existing landholdings and resource use
Loss of income of land and fisheries
May cause negative impact without residual land
Replacement land/cash
compensation at market value
Replacement land for agriculture/fisheries/cash compensation at market value
Income restoration assistance to restore income

36
2. Land - Government owned (BR/RHD)
Loss of access to land due to RoW and working area acquisition
Loss of income from leased land and cash paid in advance
Loss of access to land for business/housing
Cash compensation for loss of income
Income restoration
assistance
3. Structure- Commercial Loss of
permanent/temporary SME structures due to RoW and working area acquisition
Loss of structure and small
industries (rice mills) and factory (nail factory) due to acquisition for ferry ghat and RoW
Disruption in and
income loss from business
May cause negative impact without alternative sources of income
Loss of income from mills/factory
Loss of work/employment by workers
May cause adverse impact without assistance
Cash compensation at
replacement value of the structure
Income restoration assistance
Cash compensation for loss of business
Subsistence allowance/income restoration assistance to restore the loss
4. Structure-Residential Loss of residence by rail
workers/tenants due to RoW acquisition
Loss of housing by owners
of private structure
Loss of housing quarters by rice mill workers
Lack of housing and
living quarters by the family members of railway employees/tenants
Lack of housing and living quarters by affected family members
Lack of housing for rice mill workers
Rehousing by BR in the
existing rail colony Cash assistance to
tenants for alternative housing
Cash compensation at replacement rate to the owners of structure and shifting allowance
Cash compensation at replacement rate to owners of housing structures of rice mills
Shifting allowance to affected rice mill workers
5. Social Infrastructure/Civic amenities
Loss of social infrastructure/civic amenities like mosque, temples, library due to RoW acquisition
Impact on the quality of
social life Lack of social benefit
from community life
Reconstruction of civic
amenities within easy reach of all users
Shifting allowance as appropriate
6. Livelihood Loss of business by owners
due to dislocation Loss of secondary
household livelihood sources (e.g., homestead) to
Reduced income from
business Reduced household
income Lack of income to
Income restoration
allowance to the affected businesses, and affected workers/employees
Provisions for income

37
ensure gender needs Loss of workdays/income
by workers and employees (including ferry workers in post-construction period)
support family restoration for secondary inco-earners
Provision for assistance to ferry workers (e.g. reemployment as regular workers by RHD) or alternative source of livelihood.
Social Development Fund:
A Social Development Fund (SDF) established to assist the affected households,
particularly women and other vulnerable groups such as child workers, female-
headed households and elderly without family support to assist them in restoring
income in post-resettlement period. The implementing NGO (BRAC) conducted
needs assessment surveys during project implementation to identify programs for job
creation for women (for instance, small business, micro-credit for self-employment)
to provide long-term benefits to women and other vulnerable groups.
Steps to Ensure Community Participation:
The Project Director, through the implementation agency/NGO were published
brochure and leaflets explaining the impact of the project, compensation policies for
PAPs, resettlement options /strategies for households and SMEs, and tentative
implementation schedule of the project. Steps were taken (i) to keep the affected
people informed about land acquisition plan, compensation policy and payments, and
(ii) to ensure that PAPs involved in making decisions concerning relocation plan and
implementation of SAP. RHD/implementing NGO provided information displays in
Bangla in project sites and in affected areas, which were readily accessible to local
populations.

38
The following Table 2.1 shows the types of Losses Eligible for Compensation under
Donors’ Policy and GoB Land Acquisition Ordinance.
Table 2.2: The types of losses eligible for compensation under Donors’ Policy
and Government Land Acquisition Ordinance
SL
No.
Types of Losses/Assistance Eligible for
Compensation
Donors’
Policy
GoB LA
Ordinance
1 Loss of Land by title owners Yes (RV) Yes (CCL)
2 Loss of property on titled hind Yes (RV) Yes (CCL)
3 Loss of house or other build structures on
owned land
Yes (RV) Yes (CCL)
4 Loss of Crops Yes (RV) Yes (CCL)
5 Loss of Trees, Perennials and ponds Yes (RV) Yes (CCL)
6 Loss of’ house or other build structures on
others land
Yes No
7 Loss of property on without titled land Yes No
8 Taking away of salvageable materials by
the RAPs
Yes No
9 Shifting cost for relocation Yes No
10 Assistance to improve or at least restore
former living standards, income and
productive level
Yes No
11 Especial Income restoration Assistance to
women/vulnerable group of people
Yes No
12 Assistance for Restoration of Community
Facilities
Yes No
Source: Khatun, 2005
National Policy on Resettlement and Rehabilitation (NPRR):
Proposed National Policy on Resettlement and Rehabilitation (NPRR) is designed to
address and mitigate both “project” and “non-project”. This policy has a multiple
options for resettlement, Payments of compensation, Valuation of assets. But ADP

39
facilitated Relocation plan, is still not approved by Government and this is hanging
from the year 2007. The NPRR (2007) is based on the premise that for achieving
overall socio-economic development it is imperative to safeguard the interest of those
affected who cannot absorb the risks and costs of modern development. The key
objectives of this policy are (i) to safeguard the rights of the affected and/or displaced
households/persons (ii) to ensure appropriate mitigation measures and resettlement
plans are implemented, (iii) to ensure that appropriate assistance is provided to
affected households and communities to restore and to improve their socio-economic
conditions and (iv) to establish community social systems and networks during and
after resettlement has occurred.
The NPRR will be applied to (i) Public sector projects irrespective of sources of
funding; (ii) Private sector and also projects under Public-Private Partnership (PPP);
(iii) River erosion and eviction displaces. In the case of development project
requiring land acquisition, a Land Acquisition Plan (LAP) will be prepared for all
land to be acquired under the project and a separate Resettlement Plan (RP) will be
prepared to deal with consequence of land acquisition and displacement including
relocation, resettlement and livelihood restoration. In some cases, wherein land
acquisition may not be required due to available right-of-way (ROW), a resettlement
plan may still be necessary to deal with any informal settlements and non-title
holders affected by the project [40].
Land acquisition for public/private sector projects:
Lands may be acquire or procured for the project purposes by one or more of the
following mechanisms: (i) acquisition through eminent domain; (ii) direct purchase
on a willing-buyer and willing-seller basis; and (iii) voluntary donation, particularly
for community-based public purpose facilities. Acquisition of land through the use of
eminent domain will be used only in case of large (i.e., 50 acres or more) public
sector projects. In all other cases, direct purchase through negotiation on a willing-
buyer and willing-seller basis will be encouraged. In such cases, use of eminent
domain will be the last resort for any specific case(s) where land owner(s) are
unwilling to depart with lands despite assurances to pay market value of assets

40
acquired. Private sector and PPP projects will purchase land on a negotiated price
along with provision for resettlement of affected/displaced households, if necessary.
Further, opportunities for benefit-sharing will be explored as a mechanism for
restoration of incomes and livelihoods of those affected. In case of extractive
industries such as mining, the Government may acquire land through the use of
eminent domain only under a joint venture model. In such instances, all operational
aspects/procedures for development-induced displacement will apply. Further, the
private investors and/or corporations have to ensure compliance with internationally
established norms concerning resettlement of affected persons. Voluntary donation of
land refers to voluntary initiative by a land owner to donate his or her land without
any pressure, coercion for public use. In order to ensure that voluntary donation of
land does not adversely affect such households, the following measures will be
observed: (a) APs are fully aware of their losses and their entitlements to
compensation, allowances and rehabilitation assistance; (b) there is full consultation
with landowners and non-titled persons having interest on the land as users; (c) APs
do not belong to the vulnerable groups; (d) voluntary donations do not severely affect
the living standards of affected people and are directly linked to benefits for the
affected people, with community sanctioned measures to replace any losses that are
agreed through verbal and written record by affected people; (e) any voluntary
donation will be confirmed through verbal and written record and verified.
Valuation and compensation of assets:
All project related asset losses will be compensated at full market value which is
equivalent to the replacement value for the acquired asset. Valuation of structures,
trees, crops and others will be determined using existing rates of Public Works
Department (PWD), Department of Forests, and Agricultural Marketing Directorate,
respectively. The DC, following the 1982 Ordinance, will use the average value of
acquired lands, and provide a sum which is five times of the assessed value as cash
compensation under law (CCL) in consideration of the compulsory nature of the
acquisition and loss of productive assets. The compensation for acquired structures
will be paid at replacement value as determined by PWD. In case of any depreciation
cost deducted from affected structures in CCL by DC, the same shall be paid as

41
additional construction grant to resettlers by EA through the implementing NGO
[40].
Payments of compensation:
Compensation for acquired assets by titled owners will be paid by the concerned DC
prior to transfer of land/assets and dislocation of affected families. In case of dispute
over ownership (particularly land due to lack of proper legal papers, or up-to-date
records), the DC shall still pay for structures/trees based on user and/or possession
rights. If any asset (land or structure) is partially affected rendering it unusable,
compensation will be paid for the entire property. APs shall be allowed to take away
the salvageable materials, at no costs, from their houses and shops acquired by the
project. Similarly, displaced persons receiving compensation for trees/crops shall be
allowed to take away felled trees and standing crops for their own domestic use. For
private sector/PPP projects, the project-sponsors shall conduct a due diligence study
by a third party to assess whether affected persons/families have received their
compensation and other resettlement benefits as per agreement with the project.
Additional measures will be taken to redress grievances, if any [40].
Relocation and Resettlement:
In the case of development project, displaced persons will be given multiple options
for resettlement. The options may include (i) self-relocation with all eligible
resettlement benefits and assistance; (ii) relocation to resettlement site(s); and (iii)
relocation of businesses to newly built market/shopping complex(s). Resettlement
sites, to be developed by the project, shall provide all civic amenities like drinking
water, internal and link roads, drainage, electricity, and other services like schools,
mosques, community centres as necessary. Any common properties resources (e.g.,
school, mosque/temple, community centre, etc.) getting affected by the project will
be re-established by project cost either of same or better standards at the site in
consultation with the affected community. Resettlement site selection and various
amenities to be developed will be based on consultation with the resettlers and host
communities. One of the key considerations for site selection would be access to jobs
and income generation sources. Women will be particularly consulted prior to

42
selection of sites and development of various services. The project will also provide
for new/additional civic amenities in the host communities to enhance carrying
capacity caused by the new resettlers [40].
2.11 Conclusion
After going through various literature reviews, it can be said that though relocation
brings a number of unconstructive aspects in original life of people, in most of the
cases it is considered for government or donor fund based development projects. The
current land laws and regulations, including the Acquisition and Requisition of
Immovable Property Ordinance II (1982) and Private Residential Land Development
Rules 2004 have failed to adequately address the needs of those affected and
displaced people. According to Residential Land Development Rules 2004, if the
entrepreneur fails to own maximum 10% of the total land locally for any reason from
any land or house owner (in special case maximum 15% of the total land with the
permission of the committee formed by the government), can propose for land
acquisition through the law. But here government officials have no role to justify
developer’s claim in field level. As a consequence these types of confusion
ultimately favor for land developers. On the other side, Proposed National Policy on
Resettlement and Rehabilitation (NPRR) is designed to address and mitigate both
“project” and “non-project”. This policy has a multiple options for resettlement,
Payments of compensation, Valuation of assets. But ADP facilitated Relocation plan,
is still not approved by Government and this is hanging from the year 2007. As a
result, local people of fringe areas are facing vulnerable condition for absence of
proper rules and regulations addressing private projects relocation issue.
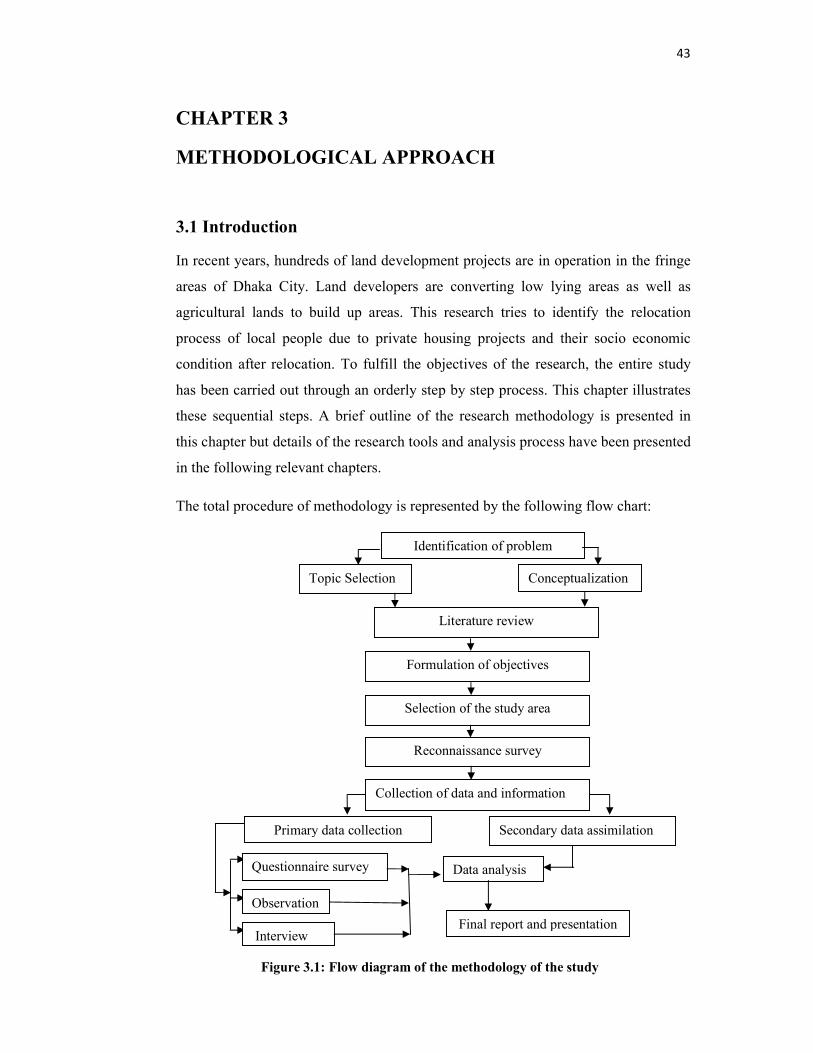
43
CHAPTER 3
METHODOLOGICAL APPROACH
3.1 Introduction
In recent years, hundreds of land development projects are in operation in the fringe
areas of Dhaka City. Land developers are converting low lying areas as well as
agricultural lands to build up areas. This research tries to identify the relocation
process of local people due to private housing projects and their socio economic
condition after relocation. To fulfill the objectives of the research, the entire study
has been carried out through an orderly step by step process. This chapter illustrates
these sequential steps. A brief outline of the research methodology is presented in
this chapter but details of the research tools and analysis process have been presented
in the following relevant chapters.
The total procedure of methodology is represented by the following flow chart:
Selection of the study area
Reconnaissance survey
Primary data collection Secondary data assimilation
Collection of data and information
Identification of problem
Conceptualization Topic Selection
Literature review
Formulation of objectives
Questionnaire survey
Interview
Observation
Data analysis
Final report and presentation
Figure 3.1: Flow diagram of the methodology of the study

44
3.2 Formulation of Objectives
In this study, the investigation starts with the question regarding relocation issue that
how relocation process worked in fringe areas of Dhaka City. This research further
inquired to know about what is the present status of relocated people. With the
backdrop of these questions, the study finally focused on the following objectives.
a) To study the relocation process of local people due to private housing projects.
b) To study the present status of relocated people and to assess their socio-economic
impact due to relocation.
3.3 Selection of Study Area
According to Private Residential Land Project Regulation, 2004, there are seventy
seven (77) private land developer companies registered by RAJUK. This research
included 5% of private land developers who have land projects in Dhaka City. So,
four land developers land projects were considered for survey. For this reason top
four developer’s four housing projects were selected for this study according to the
size of the project from the year 2000 to 2010. In this selection process, the land
projects approved by RAJUK were considered for this research. Unpublished MURP
thesis [67] and Phd Thesis [41], REHAB Website, Daily Newspaper sources were
used for collecting the list of land projects of all the registered land developers from
the year of 2000 to 2010. Then top four lands project according to size were
considered for this research. Four land projects selected for the study are Green
Model Town (200 Hectare) of Amin Mohammad Foundation Ltd, United City (73.33
Hectare) of Neptune Development & Holding Ltd, Pink City (120 Hectare) of
Xenovally and Ashiyan City (466.67 Hectare) of Ashiyan land development Ltd.
3.4 Reconnaissance Survey
Reconnaissance survey is the primary stage to get a visual appearance of the site and
perceive it in reality. This experience is required to form a preliminary idea about an
area subjected to detail surveying. In this survey, the selected land projects and their
surrounding areas were examined in order to know how the work can be executed in

45
the best possible ways. To fulfill the purpose, the selected land projects were rounded
by the surveyors on appropriate days.
3.5 Data collection
Data was collected from both primary and secondary sources to fulfill the research
objectives. In order to obtain the objectives of this research, several methods of data
collection and analysis were adopted. Following is a synopsis of methods of data
collection and analysis.
3.5.1 Primary Data Collection
This research required a substantial amount of primary data because there was no
previous study conducted on relocation of local people due to private housing
projects. An extensive questionnaire survey conducted to collect data on relocated
people, to explore the relocation process of local people, to identify factors related to
relocation, influential actors, land selling procedure, utilization of money & new land
information. Interview of officials from selected land developer companies were
conducted. To assess the present and past status of socio-economic condition of
relocated families a set of indicators were studied. Data were collected on housing
condition, services, social network, occupation, income and expenditure, land
ownership etc for fulfilling second objective.
(a) Questionnaire Survey
A questionnaire survey was conducted to find out the process of relocation and
existing socio economic condition of the relocated people. For this research,
relocated people who used to own land in selected land projects were the main
consideration for questionnaire survey. As relocated people are not living in their
previous areas, following procedure were implied to collect the information about
them.

46
Sampling
There was no authentic information and specific number of relocated families in any
government offices. It was a challenging task of this research to find out the
information of relocated families. Though original local residents sold their land and
moved to different places but some of local people still lived around the projects
areas and provided the information about relocated families. At first, survey team
collected information from those people who lived in surrounding areas of selected
land projects. Similarly, local primary school teachers, local religious leaders
(Imam), local NGOs workers and clubs which are formed by relocated people were
the sources of information about present status of the relocated people. Likewise,
focus group discussion and interviews of local resource people played another vital
role to explore the number of relocated families and their present location. After
collecting information of relocated families from above mentioned sources,
approximately 3,920 families were identified as relocated families who had land in
project areas. According to 95% confidence level and confidence interval of 5 at least
350 questionnaires need to be surveyed. This research used snowball sampling for
questionnaire survey. Snowball sampling also called network or chain sampling [60].
Residents of adjacent of land development projects were the main introducing section
for snowball sampling and data were randomly collected from field level.
(b) Interviews
The in-depth interviews were designed for key personalities who have a good
knowledge about relocation process. The researcher was able to interview Dr. Hafiza
Khatun, a Professor of Geographic and Environment Department, University of
Dhaka, Mr. Abul Gaffar, a teacher of a local primary school, Mr. Abdus Sobhan, a
Imam of a local mosque, Mrs Momtaz Begum, a local NGO worker. Though it was
interested to make an interview with the respective areas local Union Parishad
Chairmans, certainly it was not possible for their non cooperative attitude.

47
(c) Case study
Sometimes questionnaire survey cannot explore some matters in details which can be
more descriptive through case study. This research work used both qualitative and
quantitative methods of data collection. Case studies of both relocated and existing
localities (surrounding areas of selected land projects) people who were under
pressure for relocation by land developers is presented to portray the real scenarios in
these four land projects.
3.5.2 Secondary Data
Secondary data included relevant literature like published and unpublished thesis
paper, study reports, journals, books, newspapers, magazines, research publications,
seminar paper, ordinance/policy etc. related to this research topic. Information on
housing projects was collected from RAJUK, REHAB, offices of land developers
and advertisements published in media and website. Internet was another informative
source of secondary data used in this report. Similarly secondary data was collected
from various government, non government and international organizations.
3.6 Conclusion
This chapter deals with procedural approach followed to carry out the study. The
methodology of the study was classified in to several steps. The research was started
with identification of the problem and ended with the real circumstance that
happened in eastern fringe areas of Dhaka City for relocation.

48
CHAPTER 4
Profile of Study Area and Relocated People
4.1 Introduction
This research conducted investigations regarding relocation process of local people
due to private housing projects and their socio economic condition after relocation.
According to the size of the land projects from the year 2000 to 2010, top four
registered land projects of four land developer were selected and 350 relocated
households were considered for this research. As those people (relocated people)
moved from their original location to different areas, there was no option to select
any specific location for collecting relocated household information. In this chapter
briefly discussed about profile of study area and some basic information about
relocated people.
4.2 Selection of study area and relocated people
There are 77 registered private land developer companies by RAJUK till 2011. This
research included 5% of the registered (RAJUK) private land developer. According
to the size of the land projects from the year 2000 to 2010, top four land projects of
four land developer were selected namely; Green Model Town of Amin Mohammad
Foundation Ltd, United City of Neptune Development & Holding Ltd, Pink City of
Xenovally and Ashiyan City of Ashiyan land development Ltd. Then relocated
people from those selected land projects are considered for this research. Though
original local residents sold their land and moved to different places, some of local
people still lived around the projects areas and provided the preliminary information
about relocated families. Similarly, focus group discussion and interviews of local
resource people played vital role to explore the number and present location of these
families. After collecting information of relocated families from above all sources,
approximately 3,920 families were considered as relocated households from selected
four land projects.
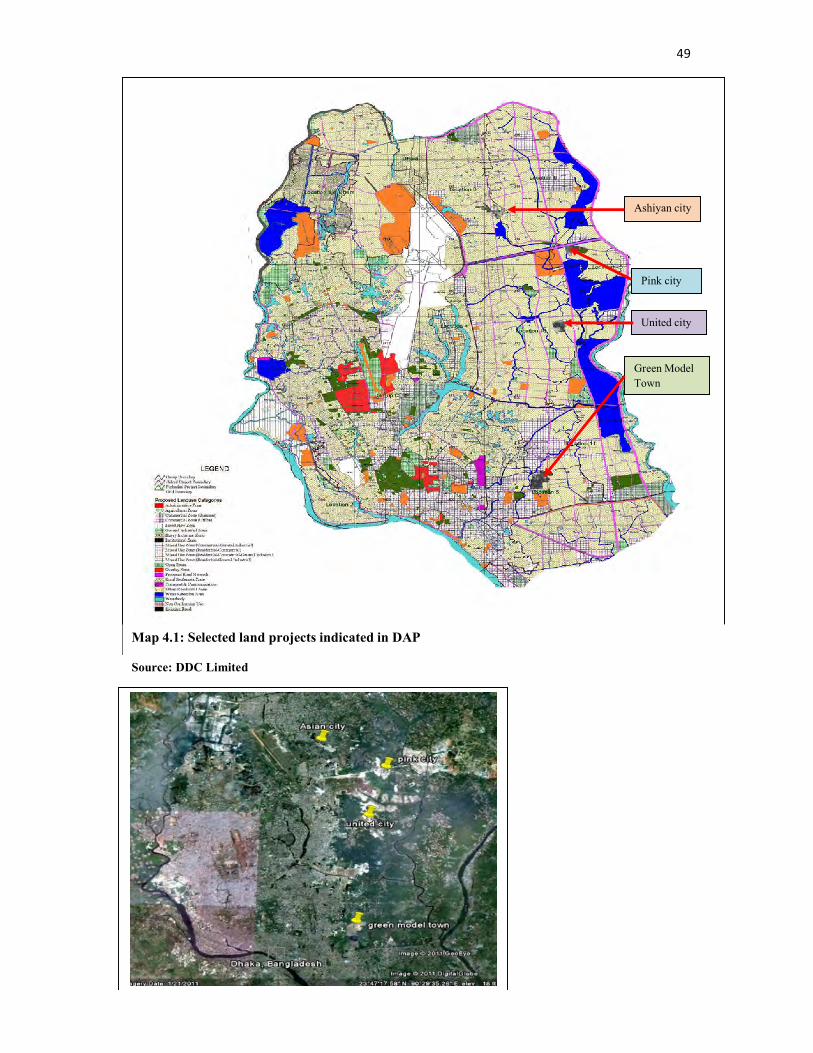
49
Map 4.1: Selected land projects indicated in DAP
Source: DDC Limited
Green Model
Town
United city
Pink city
Ashiyan city

50
4.3 Description of the Study Areas
All the selected land projects are fallen in the Eastern Fringe area of Dhaka City.
Dhaka is surrounded by rivers from all sides; there are also numerous canals, low
lying land and flood plains within the city. The Eastern Fringe of Dhaka also consists
of low lying area, lakes and flood plain and fringe area forms two third of Dhaka’s
drainage basin [42]. It is surrounded on the North by Tongi Khal, to the East by
River Balu, to the South by Demra Road and to the West by Pragati sharani. The area
is about 6-7 kilometers on the Northeast of the central business district. To the East
the proposed Eastern Bypass road and to the North there a 300 feet wide road will be
developed. The area of Eastern Fringe is about 29,531 Acres and it consists of 68
Mauzas.
Map 4.2: Eastern Fringe Area
Eastern Fringe Area

51
Present condition of four land projects and proposals of DAP about those areas are
discussed below:
4.3.1 Ashiyan City:
The Ashiyan Land development Ltd entered in the Real Estates sector as land
developer in the year of 2004 and started Ashiyan City project at Daksinkhan in
Dhaka City. Though it was calculated that the total area of land is approximately
466.67 hectare, but practically it was difficult measuring their land area accurately.
From field investigation, it was informed that the land project authority expanded
their project areas very quickly by strong political and social influence. Detail
information about developer’s activity has been discussed in following relevant
chapters.
(a) Existing condition of the Study area:
Dhaka Metropolitan Development Plan (DMDP) 1995-2015, divided entire Dhaka
metropolitan Area (DMA) into different zones and locations. The selected land
project (Ashiyan City) falls within Location 09. The development pressure has
already started occurring in the Location-9 [66]. The area facing lacks of proper
planned road network and other utility services. This area also has no planned
residential unit.
Photograph 4.2: Ashiyan City indicates in Google Earth Map

52
(b) Ashiyan City’s present condition shown below through Photographs:
(c)Proposal in DAP:
Considerable lands of Location-9 are under low-lying areas and at present are not
suitable for urban development. About one third of the total land may be reserved
for urban agriculture, one-third area for retention ponds and others are proposed for
urban development. It has been suggested to control and monitor the activities of the
developers and guided them to develop the area in a planned manner, indicated in the
DMDP plan. With implementation of the DAP, new housing estates and residential
areas will be developed through zoning system and the private housing development
Photograph 4.3: Developer’s signboard on filled out land
Source: Field Survey, 2011
Photograph 4.4: Developer’s signboard has shown their proposed medical college, school and college.
Source: Field Survey, 2011
Photograph 4.5: Existing Condition of project areas
Source: Field Survey, 2011
Photograph 4.6: Land filled through sand
Source: Field Survey, 2011

53
and construction will also be done under the jurisdiction of RAJUK. Develop more
planned settlement /housing areas with water supply, drainage, electricity, telephone,
playground, open space and recreational facilities. Stop unauthorized housing
construction by strict implementation of land use plan prepared by DMDP and DAP.
4.3.2 Green Model Town:
Amin Mohammad Foundation Ltd. started Green Model Town land project in 2002
at Sabujbag in Dhaka City. Though official document about the project area was 200
hectare but their land project is been expanded. From field investigation, it was found
that land developer expanded the amount of their land through
middleman/muscleman initiatives. Detail information about developer’s activity has
been discussed in following relevant chapters.
(a) Existing condition of the Study area
Dhaka Metropolitan Development Plan (DMDP) 1995-2015 divided entire Dhaka
metropolitan Area (DMA) into different zones and locations. The selected land
project falls within Location 05. A dense development has taken place during the last
decade. This urban growth is mostly the result of natural growth. So, most of the
construction here are unauthorized, haphazard, incompatible and therefore,
damaging. A number of land uses are mixed together and which are difficult to
differentiate. The unplanned infrastructures are incapable to accommodate the ever
increasing traffic demand [66].
Photograph 4.7: Green Model town indicate in Google
Earth Map

54
(b) Green Model Town’s present condition shown below through Photographs:
(c )Proposal in DAP
Private land developers’ approach cannot be discouraged in this area. Private land
developers must have to provide all the essential urban amenities and facilities
required for the human habitation and they must have to protect the existing khals.
So, a strict observation has been recommended on Private land developers activities
by concerned authorities.
Photograph 4.8: Entry gate of Green Model Town
Source: Field survey, 2011
Photograph 4.9: Developed plots
Source: Field survey, 2011
Photograph 4.10: local people cultivated on
plots
Source: Field survey, 2011
Photograph 4.11: Surrounding low lands
that are filled continuously
Source: Field survey, 2011

55
4.3.3 United City:
Neptune Development & Holding Ltd. started United City Project in 2004 at Satarkul
in Dhaka city. Their strategy for this project was that United City project had to be
completed very quickly. And the land selling money had to be collected at the same
time very quickly from the buyers. For this strategy, they sold their land to corporate
and high professionals and also arranged loan for their clients. As a consequence,
buyers collected loan and paid their land money at a time. This information was
collected from developer’s field office and some clients of the developer. Now total
area of United City project is 73.33 hectare and considered as a complete land
project. Detail information about developer’s activities has been discussed in
following relevant chapters.
(a) Existing condition of the Study area:
The selected land project falls within the Location 10, Spontaneous residential
development and linear commercial development in the Eastern side of Pragati
Sarani, but there was no development prevails in the inner parts [66]. Housing estates
have already purchased vast tracts of land. Development in general takes place in an
unplanned way. Some major land filling projects have been undertaken within the
location 10. Haphazard lands filling increased the frictional surface and further
reduced the velocity of water flow. As a consequence, this is creating the problem of
drainage congestion especially during the rainy season. Land grabbers are sometime
filling the natural drainage channels and khals, not keeping in mind about the
drainage congestion. This illegal land filling is aggravating the situation.
Indiscriminate and unplanned growth of settlements and shelters are major problems
for having livable environment. Settlements are developing in remote areas devoid of
adequate basic services including road networks. Development is taking place in
areas without having any standard road resulting into narrow and zigzag roads [66].

56
(b) United City’s present condition shown below through Photographs:
Photograph 4.12: United City indicates in Google
Earth Map
Photograph 4.13: Entry gate
Source: Field survey, 2011
Photograph 4.14: Developed plots
Source: Field survey, 2011
Photograph 4.15: Surrounding areas of United City
Source: Field survey, 2011
Photograph 4.16: Land filling process
Source: Field survey, 2011
57
(c ) Proposals in DAP:
Housing area should be developed through participatory approach using such
techniques as, Guided Land Development and Land Readjustment. The existing
khals are proposed to be widened and a network of khals to be created connecting
them with the retention ponds. DAP development proposals will be implemented by
various public sector agencies including RAJUK. There is also need to monitor
regular execution of DAP proposals and take action to rectify the fault. A very large
part of the zone is free from development; as such development of this area can be
implemented in a planned manner. Private developers are developing a substantial
portion of the zone. If it is coordinated and managed appropriately, planned
development will be initiated in the zone. For housing area development in the
existing developed areas, there is still scope for organized development in vacant
lands.
4.3.4 Pink City:
Xenovally started Pink City land project in 2003 at Joarshara in Dhaka City. Total
land area was 120 hectare. This land project was very popular for duplex housing.
Though land developer purchased a large portion of land from local people but at
present political situation is influencing to stop the project. In field studies, it was
informed from local residence that now a day’s they are not facing any type of
pressure from developer which they used to face five years ago. Detail information
about developer’s activity has been discussed in following relevant chapters.
(a) Existing condition of the Study area:
Dhaka Metropolitan Development Plan (DMDP) 1995-2015 divided the entire Dhaka
metropolitan Area (DMA) into different zones and locations. The selected land
project (Pink City) falls within the Location 16. There is a large fault line in this
location named Rampura Fault line along Begunbari Jirani Khal [66]. This makes the
area very vulnerable to settlement development. It has an elevation of 4-6 meters.
Flood and water logging cover almost 45% of the area. The average gross density is
also very low. All of these demonstrate that this location is not suitable for major
settlement purpose [66].

58
(b) Pink City’s present condition shown below through Photographs:
(c )Proposal in DAP:
The land use proposals are mainly considered this area remained as floodwater
retention. The irregular geophysical conditions of this area are not appropriate for
settlement planning. It has been suggested to control and monitor the activities of the
developers and guided them to develop the area in a planned manner followed by the
DMDP plan. It is suggested not to allow planned housing development in this area.
Considering the nature of the area, proposals of roads, water retention ponds, large-
scale recreation encompassing the retention ponds and urban agriculture etc. are
proposed.
Photograph 4.17: Pink City Google Earth map
Photograph 4.18: Present project condition
Source: Field survey, 2011
Photograph 4.19: Surrounding areas of Pink City
Source: Field survey, 2011

4.4 Profile of Relocated People
Primary focus of this research is
selected project areas. So the information of the relocated people is a vital element
for this research. Most of the original local residents sold their land and moved to
different places. But some of the local people still lived around the project areas and
provided the preliminary information about relocated families. At first, survey team
collected information from the people who lived in surrounding areas of selected
land projects. Similarly, primary school teachers, religious leaders (Imam), NGOs
workers and clubs which are formed by relocated people were other sources for
collecting information. Likewise, focus group discussion and interviews of local
resourced people played another vital role to explore the number and present location
of relocated families. Approximately 3,920 families are considered as relocated
families, after considering all the collected information from above mentioned
sources. Considering 95% confidence level and confidence interval of 5
conducted questionnaire survey on
4.4.1 Duration of living in original locations:
From field investigation, it was found that most of the relocated people lived in
original location for more
lived their original location from 10 to 20 years and less than 10 years respectively
(Figure 4.1).
Figure 4.1: Duration of living in previous/ original Place
Source: Field Survey, 201
4.4 Profile of Relocated People
rimary focus of this research is on relocated people who used resided of
selected project areas. So the information of the relocated people is a vital element
for this research. Most of the original local residents sold their land and moved to
different places. But some of the local people still lived around the project areas and
provided the preliminary information about relocated families. At first, survey team
collected information from the people who lived in surrounding areas of selected
nd projects. Similarly, primary school teachers, religious leaders (Imam), NGOs
workers and clubs which are formed by relocated people were other sources for
collecting information. Likewise, focus group discussion and interviews of local
played another vital role to explore the number and present location
of relocated families. Approximately 3,920 families are considered as relocated
families, after considering all the collected information from above mentioned
95% confidence level and confidence interval of 5
conducted questionnaire survey on 350 relocated households.
Duration of living in original locations:
From field investigation, it was found that most of the relocated people lived in
original location for more than 20 years. On the other side, 12.3% and 20.3% people
lived their original location from 10 to 20 years and less than 10 years respectively
Duration of living in previous/ original Place
Source: Field Survey, 2011
59
resided of in the four
selected project areas. So the information of the relocated people is a vital element
for this research. Most of the original local residents sold their land and moved to
different places. But some of the local people still lived around the project areas and
provided the preliminary information about relocated families. At first, survey team
collected information from the people who lived in surrounding areas of selected
nd projects. Similarly, primary school teachers, religious leaders (Imam), NGOs
workers and clubs which are formed by relocated people were other sources for
collecting information. Likewise, focus group discussion and interviews of local
played another vital role to explore the number and present location
of relocated families. Approximately 3,920 families are considered as relocated
families, after considering all the collected information from above mentioned
95% confidence level and confidence interval of 5 this research
From field investigation, it was found that most of the relocated people lived in their
On the other side, 12.3% and 20.3% people
lived their original location from 10 to 20 years and less than 10 years respectively

60
4.4.2 Relocated place and distance from original location:
From field investigation, it was found that because of social bondage, income source
and recognizing the place, the most of the respondents (44.6%) at present are living
the place which distance is less than 5 km from the previous places. So, social
connection among the relocated people makes the survey an easy way to find them.
From the field survey it was found that only 4.6% household live more than 15
kilometers from the previous location.
4.4.3 Land ownership status:
Due to relocation, land ownership has been changed drastically. From field survey, it
was found that the people without lands in previous location were hardly found. But
at present most of the people (67.7%) have no land. Previously, 43.1% people had
land above 10-20 katha but now its decreasing to remain 6.9% people having land
more than 10-20 katha at present. Though some people obtained land selling money
at a time from the land developers but at present most of the people could not buy
lands in any other place for high price of land.
4.4.4 Occupation and land ownership pattern:
Previously, main income sources of local people were agriculture, but nowadays
labor placed as the main occupation. Similarly, from the field investigation, it was
found that most of the land owner in previous location obtained their land through
inheritance (81.4%), the next position placed by purchasing. It was also observed
from the field investigation that the owner, living in the previous location for
duration less than 10 years, obtained the land by purchasing. Previously most of the
household acquired their own land through inheritance (Table 4.1). After relocation,
it was difficult task for most of the relocated people to purchase the new lands in
relocated areas due to its high price. Similarly, it was found that there were
significant relationship between previous occupations and attainment of ownership of
land. From field survey, it was found that those people whose previous jobs were
agriculture, acquired their land mostly through inheritance. Similarly government
service holders obtained their land through purchasing (Table. 4.2). This result had

61
significant outcome after relocation and most of the household were turned as
landless in relocated places.
Table 4.1: Land ownership pattern in previous locations
Attainment of Ownership of land Frequency Percent
By inheritance 285 81.4
By purchase 61 17.4
By gift 4 1.1
Total 350 100.0
Source: Field Survey, 2011
In below it’s shown the relationship between attainment of ownership of land and
Previous Occupation through cross tabulation.
Table 4.2: Attainment of ownership of land and Previous Occupation
Attainment of ownership of land * Previous Occupation Cross tabulation
Previous Occupation
Total
Agricu
lture
Lab
our
Govt.
se rvice
Pr ivate
Se rvice
Bu
siness
Sm
all
bu
siness
%
within
How
acquire
previou
s land
By
inheritance
Count 143 72 0 2 33 17 267
% within
How
acquire
previous
land
53.6% 27.0% .0% .7% 12.4% 6.4% 100.0
%
By Count 5 8 9 19 7 30 78

62
Source: Field Survey, 2011
Here Asymp. Sig value .000 which indicated that two variables (previous occupation
and attainment of ownership of land) were truly dependent each other.
4.5 Conclusion
It is very important to have a general picture of the study area before starting any task
related to any area. Top four land projects of four land developer from the year 2000
to 2010 were selected for this research. But four land projects accurate land size did
not collect accurately. Land developers have acquired a large portion of land from
local people but there have no official records or documents about relocated people.
For political reason, Pink City development work has been stopped since 2007 and
United City project can be considered as complete projects. Another two namely
Ashiyan City and Green Model Town are continuing their activities. Approximately
3920 families are considered as relocated people from the selected four land projects.
Because of social liabilities, relocated people tried to live within short distance from
Purchase % within
How
acquire
previous
land
6.4% 10.3% 11.5% 24.4% 9.0% 38.5% 100.0
%
By gift Count 0 0 1 0 0 4 5
% within
How
acquire
previous
land
.0% .0% 20.0% .0% .0% 80.0% 100.0
%
Total Count 148 80 10 21 40 51 350
% within
How
acquire
previous
land
42.3% 22.9% 2.9% 6.0% 11.4% 14.6% 100.0
%

63
their original location. Haque (2012) observed that a middle or lower middle class
land owner in the urban fringe is likely to have invested his whole life’s savings to
buy that small piece of land with a dream of building own house. The high land price
within the city that is beyond middle or working class peoples’ reach ultimately
drove him to the city’s fringe. Now if he has to give up this property, he may never
be able to afford another. This research also showed the same result. Most of the
local people (81.4 %) gained their land through inheritance and lived in their original
location for more than 20 years. As a result after relocation, they turned as land less
person.

64
CHAPTER 5
RELOCATION PROCESS OF LOCAL PEOPLE
5.1 Introduction
The relocation process of local people due to private housing projects is a complex
issue which can be understood through various analytical procedures. To get
information about the relocation process, a number of indicators were studied. Such
as original place of settlement, duration of living in original settlement, influential
actors, factors that influenced relocation process, selling procedure, sale price of the
land in original settlement, satisfaction of the owner regarding selling price, money
transfer procedure, utilization of money, nature of pressure faced by the local
residents in land transfer process, duration of stay in new place, factors influencing
the choice of the new place, distance from original location etc. The indicators
selected for this study were gathered from extensive literature reviews and
discussions with experts. The survey covered 350 households to collect data from
different places where the relocated people live. As original local residents sold their
land and moved to different places, this research used snowball sampling for
questionnaire survey. The questionnaire format for data collection is provided in
Appendix B.
In this research, relocation is comprised of four phase and involved four actors.
Those actors which played an influential role for relocation process are discussed
below.
5.2 Actors in Land Transformation Process
Land transformation process is a complex method. Mainly four actors played a vital
role for land transformation process. They are land developers,
middleman/musclemen, local officials and local people. Each actor played specific
role in land transformation process.

65
(a) Land Developer:
The land development activities in Dhaka City introduced from the 80’s. At the
beginning, the investment in this sector was made by the largest real estate
companies of Bangladesh such as Banasree Residential Area by Islam Group,
Bashundara City by Bashundhara Group and so on. Because of high return of profit,
a number of investors are involved in this sector. Private Land and Real Estate firms
may not have the privilege and coercive powers of state land acquisition. But they
have stronger financial foundation and they can secure political backing. These
enable them to subordinate relevant governance arrangements and deploy strong arm
techniques in securing land in their own terms. As a result not only money but also
other techniques have played as capital for this business. Land developers have been
playing a number of techniques for buying land and these procedures are discussed in
below.
Ashiyan City:
Information was found that the owner of the Ashiyan City was first involved with
Bashundhara City as a middleman, who managed the land purchasing process from
the local people. Understanding the techniques of land acquisition process, he
(Owner of the Ashiyan City) started the Ashiyan City project. One resident of Barua
village at Ashkona, Dakkhinkhan alleged that the owner of the Ashiyan City initially
bought 5 Bigha land in that village. Later he laid claim to 500 Bigha land and started
land development work there [77]. The developer of Ashiyan City established his
office in his own village and formed his own group with local young political party
leaders to buy local people’s lands by various tricks. From field investigation, it can
be said that because of the political support and existing musclemen power, the
activity of Ashiyan City is continuing very smoothly. Ashiyan City has been widely
reported in media for its land grabbing and forced land purchases [43].
Green Model Town:
Amin Mohammad Group established the Green Model Town project. The developer
did not actively play any role to acquire the land. Rather they engaged the middlemen
for that act. There is a site office of Green Model Town in their project area to
operate their activities in an easy way.

66
United City:
Neptune land developer implemented the United City project. United City authority
did not actively play any role to acquire the land. They mainly engaged middlemen
for the acquisition of land. From field investigation, it was informed that most of the
lands were sold to the corporate people, politician and high professional people. For
example, the employers of City Bank bought a large portion of lands from the United
City authority. As a consequence, United City authority got a large amount of money
at a time and implemented their project very quickly. At present, the project of
United City has been completed.
Pink city:
The owner of the Pink City is a politician. At first, the authority of the Pink City
started their journey to set up the land development project on the owner’s own land
that was 10 Bigha and acquired the surrounding land with the help of local
musclemen. For lack of the political support, at present the activity of Pink City to
acquire the land has stopped.
(b) Middleman/Musclemen:
Middleman/Musclemen is the person who creates connection between land
developers and local people. From field investigation, it was found that usually
Middlemen/Musclemen are the local residents who have good knowledge about over
all local conditions. It was informed by local people that in most of the cases
middlemen/musclemen were involved with ruling political party to get the political
favor. This situation is same for all regimes. They sometimes act as the middleman
who collect land from local people at low price and sell to the developer at a higher
price. In most of the cases, middlemen get a percentage from land developers after he
negotiates a deal between the developer and the land owner. Similarly, in some cases,
Musclemen acquires land through illegal procedure by using unwanted force. From
field experience, it was found that sometimes middleman acts as representative of
developer at root levels. For example, land developers get defective land papers and
other related information of the local people from musclemen/middleman. In some
cases, land developers engaged with the local musclemen to threat and pressurize the

67
local people for selling their land. From field investigation, it was found that though
musclemen had a social connection with previous local people but did not show any
favor for them. Musclemen conduct their activities to gain benefit within short time.
In this procedure even the relatives of the musclemen were not excused from the land
acquisition. For example, Mr. Jamal Sikder, 43, worked as a middleman for Ashiyan
City. He pressurized his neighbors’ to sell their land to developer. He added that even
his cousin was also pressurized for selling land. He also added that without immoral
activities, there was no chance to become a rich person within a short time. Relocated
people also informed that local musclemen always came from unprivileged family
and developer’s handsome offer easily motivated them to work with land developer.
So they always tried to provide maximum benefit of land developers. Local residents
also mentioned that musclemen/middleman changed their lifestyle within few years
from when they were involved with land developers. They can be considered as
wealthy person and lived in aristocratic areas for their safety and dignity. Musclemen
created their own group in root level to implement their defined activities. They also
maintain connection with political leaders, local administratives, land officers, social
influential persons and young mobsters for continuing their activities without any
interruption. In below shows the linkage that musclemen has to maintain and this
scenario was almost same in all areas.
Figure 5.1: Musclemen Linkage Source: Field Survey, 2011
As a result, it can be said that musclemen/middleman plays a vital role in the land
transformation process in the study area.
Middleman Local Administrative
body
Political leaders
Social influential
person
Young mobster
Land officers
Local People
Land Developer

68
(c) Local officials:
From focus group discussion and field experience, it can be said that the local
administrative body always favored for land developers. At the same time the land
developers also used this tool (people believe) to create rumor among local people.
As a consequence, most of the local people did not show any interest to take support
from local administrative for avoiding unnecessary harassment. Survey team was
interested to set interviews with the respective area’s local Union Parishad
Chairmans, but it was not possible for their lack of interest. Similarly the officials of
the land offices also played another vital role which ultimately provided support for
the land developer’s activities. For example, this information was collected from the
local people that middleman used the process of ‘Commission Register’ with the help
of land office. As a result of that the land registration was done in the land seller’s
house instead of office. This type of option used by land developers and local
musclemen is a common phenomenon in study areas. Local unprivileged household
expressed very negative aspects according to this issue. Sometimes musclemen
pressurized local people to sell their land through “Commission Register”. In most of
the cases, local poor people had no option to refuse musclemen initiatives. Similarly,
government and private details land information also provided by the land officers to
musclemen and land developers. It is easier for the developers to get hold of such
properties where several inheritances or dispute lands. In this process, land officers
providing information about lands and middleman/musclemen arrange false
documents of disputed piece of lands. Local people are well aware about those illegal
activities that done by local officials. Similarly musclemen/middleman also tried to
spread rumor that local officers are in favor for land developers. As a consequence,
local officials (land officers and local administrative) activities discouraged people to
take initiatives against land developer’s illegal actions. So from above discussion, it
can be said that local officials played as an actor in relocation process.
(d) Local People:
From the field investigation it was found that the main occupation of local people in
the previous area was agricultural. Most of the local people got their land through
inheritance (81.4%). Most of the respondents in the sample survey were lived in

69
their original location more than 20 years. It is evident from the field investigation
that the people of those areas were not aware of their rights. So
middleman/musclemen and land developers took advantage from the local people
having lack of awareness. Linkage among four actors is shown in figure 5.2.
Figure 5.2: Linkage among four actors Source: Field Survey, 2011
5.3 The four phases which linked with relocation process
The four phases which linked with relocation process are discussed below:
5.3.1 Phase One: Selection of land/areas for purchase by land developers:
From field investigation and literature survey, it was informed that every land
developers have specific strategy for their housing project. They always focus on
unprivileged area for land business. Because the local people of those areas are not
aware about their rights and political influence has a chance to favor land developers
activities. Similarly, four land developers of this research also had specific strategy
Administration
Land Office
Community
People
Local
musclemen/middleman
Land Developer
Weak and one way connection
Strong and two way connection

70
for buying land and those strategies were briefly discussed previous and following
chapters. So it can be said that selection of lands for purchase by developers were the
introductory part for relocation process. Then the other actors implemented the
developer’s goal in a methodical way. The others phases which occurred in a
relocation process are discussed below.
5.3.2 Phase Two: Factors related with sell of land by local people
The decision to shift one’s residence may be as either voluntary or involuntary [52].
From field investigation, it was realized that sell of land was occur both in voluntary
and involuntary manner. Factors related with sell of land by local people are
discussed below.
5.3.2.1 Causes for land selling:
Respondents in the sample survey expressed their view regarding causes for land
selling. Major issues that found from field investigation can be divided into voluntary
and involuntary categories. Voluntary causes are good land price (16%) and
commitment from developers to get a job (26%). Similarly involuntary causes are
family security (30%), false land documents of disputed piece of land parcel (15%)
and uninhabitable condition created by the developers (13%) (Figure 5.3). Case study
goes into greater depth and gets more details for qualitative research [60]. For this
reason, some case studies are discussed below for disclosing the real circumstance.
30%
13%15% 16%
26%
Family security Uninhabitable condition
False land documents of
disputed piece of land parcel
Good land price commitment from developers to get
a job
Percent
Figure 5.3: The reasons behind by the local people relocation decision
Source: Field Survey, 2011

71
(a)Family Security:
“Family security” refers to the mental and physical pressure on the people from both
developers and the local musclemen. From field investigation, it was found that the
musclemen made various types of social pressure and panic to acquire the land from
the local people such as eve-teasing, threats, throwing stone at houses in midnight
and so on. From field survey, it was found that 30% respondent indicated issue of
family security for selling their land. For example, in the Pink City, the causes of
land selling by the local people were mainly caused by family insecurity. From the
field survey, it was found that a huge Hindu religious people were relocated from the
place due to the family insecurity. Those people got different types of threats from
the musclemen and did not revolt to protect their land. The people who did not want
to sell their land to the developers took few steps against the developers’ activities,
but their protest was not successful due to the political pressure.
Case studies of two relocated household and one Vulnerable household are discussed
below:
Case Study 1: Relocated People: Pink City
Photograph 5.1: Surveyor interviewing Kamini
Das relocated from Pink City
Source: Field Survey,2011
Kamini Das, 65 years old women,
expressed the procedure by which she
was relocated from her original
homestead. She mentioned that her
family was under serious pressure to
sell their land to the Pink City. Her
two sons were abducted seven days
by the developer as a technique
to force her family to sell their land.
Primarily to secure her family safety

72
Photograph 5.2: Original homestead of Kamini
Das (Red border)
Source: Field Survey,2011
they decided to sell their land. She
also said that because of low social
status and religious (minority)
background, they had very limited
option to protect developer activities.
So her family did not try to protect
their property through any sort of
legal or social action.
Kamini Das sold her homestead (15 katha) to the land developer (Pink City) and
bought new land in India (area were not mentioned). Now she tenants a house for
living beside her previous land.
Case Study 2: Relocated people: Pink City Nikil Biswas, 60, who was relocated for
the development of Pink City housing
project. He said that local musclemen
forced (verbal death threat) him for
selling his homestead. He also
mentioned that he was involved as a
member of ruling party and had many
linkages with higher local authority. Photograph 5.3: Nikil Biswas
Source: Field Survey,2011
For these reason he had a voice against developer activities regarding his land
acquisition. To manage Mr. Biswas, developer offered him to exchange his land. It
can be said that this procedure was very rare in the study area for collecting land by
land developer. Though he had 10 katha land but developer offered 4 katha lands in

73
Nandipara. Mr. Biswas realized that it was quite better proposal rather than being
landless. So he accepted the proposal of the developer to exchange land. He also said
that he was not interested to sell his land but surrounding circumstances influenced
him to take that decision. Because developer had strong political and administrative
background, it was not possible for him to fight against them in long term. He
expressed that he is happy as he still has some land left whereas some people are
totally landless in this stage. He expressed that most of the relatives and neighbors
did not use their land selling money for productive purpose. Some of the people used
their land selling money for their daughters’ marriage purpose and in most of the
cases they sent money to India for family expenditure. At present, Mr. Biswas uses
rented house for living. Similarly, at present he turned as a day labor from a farmer.
Case Study 3: Vulnerable for Relocation: Ashiyan City Md. Kamal Hossain, 34, previously
involved with poultry business in
Holan nama para under Dakkin Khan
Union. He said that their homestead
will be occupied by developer within
short time. Developer wanted to buy
their homestead but Mr. Hossain
family was not interested to sell their
land.
Photograph 5.4: Poultry farm that closed by local Musclemen Source: Field Survey,2011
As a consequence, local musclemen
who are appointed by land developers
created pressure on him and his family
to sell their homestead. He also
informed the survey team that he had a
Poultry farm which was closed by
musclemen two months ago as a
technique to create pressure on his
family to sell their land.
Photograph 5.5: Survey team talked with Md. Kamal in front houses Source: Field Survey,2011

74
In this moment he has no work in hand. Similarly local musclemen threw stone at his
house in every night and his younger sister was facing eve teasing on road. He also
informed that though his family met with the local Union Parishad Chairman to
protect them from this situation, the chairman did not take any action regarding this
issue. One rumor also spread in this area was that the chairman was one of the
shareholders of this developer company, he added. For this reason, local poor people
were not interested to inform the chairman or other officials to avoid unnecessary
harassment. Mr Kamal added that Union Parishad Chairman, members, and even
police did not help them in saving their homes. The person also informed that his two
uncles shifted from this place around seven months ago due to musclemen pressure.
Utilities connections of his two uncles were cut off through illegal procedure by local
musclemen. As a consequence, Mr Kamal social network was not so strong like
previous and he tried to negotiate with musclemen to get a good amount of money
after selling his land.
(b) Good land price:
Good land price (16%) was another vital issue for relocating of the local people from
their original locations. Majority of the local people do not have enough education
and do not well aware of future consequence. Most of the relocated people inherited
their land. As a result, they were easily motivated by the developers for selling their
land with a handsome financial offer. Though land price per katha was 5-10 lakh in
existing locality but in some cases, land developers provided up to 15 lakh per katha
for collecting land from the local people. In below discussed case study regarding
this issue:
Case Study 04: Relocated people: United City Morjina Begum, a 67 years old woman,
permanent resident of Manda Union said
that developer paid extra money
comparing local buyer. She said that her
family willingly sold their land to United
City authority and got very handsome
amount of money comparing market
price.
Photograph 5.6: Previous land of Morjina
Begum ( Red Border)
Source: Field Survey,2011

75
She showed (Photograph 5.6) her land (12 katha) that she sold to developer for her
son’s business purpose. She also mentioned that her husband directly sold their land
to the land developer. As a result, middleman had no option to take extra money from
her family. Her family bought a new land (4 katha) within ½ km from their previous
location. Now her family lives in tenant house adjacent to previous location. She was
happy regarding her present status. She said that her land selling money brought
good result because she got money altogether and her son’s business were improving.
She also informed that her family will build a new house in their own land within
few months that they bought it after relocation.
(c) Commitment from developers to get a job:
Commitment from developers to get a job (26%) was another reason for selling the
land by the local people. From field investigation, it was common phenomenon for
Green Model Town and United City projects. The authorities gave the assurance to
the local people that if they sell their land, their relatives will get a chance to get a job
in the company. But from field experience, it was found that after selling the land,
local people had no chance to get a job in the land developer’s office. It was the land
developer’s propaganda to acquire land from the local people. In below discussed
case study regarding this issue:
Case Study 05: Relocated People: Green Model Town From field survey, it was seen that a huge
number of local people cultivated their
own land in the boundary of Green
Model Town housing project like Sorafat
Mirda. Mr. Mirda, 55, sold his land (15
katha) in the conditions that he could
cultivate his own land for five years and
his son will get job in the company.
Photograph 5.7: Sorafat Mirda Working in Green Model Town Project Source: Field Survey,2011
For this condition he got only 5 lakh BDT in exchange of his land. A huge amount of

76
the land selling money was used to pay debt. Still now son of Mr. Mirda is not
involved in this organization but he is working in his land. Now he lives 1 mile far
from Green Model Town project as a tenant. Legally, he is now considered as a
landless person.
(d)False land documents of disputed piece of land parcel:
From the field survey it was found that all the developers tried to identify disputed
piece of land surrounding their project areas. It is easier for the developers to get hold
of such properties where several inheritances. In this process, middlemen acted as a
data collectors from field level for land developers and arrange false documents of
disputed piece of lands. From field investigation, it was found that 15% relocated
household indicated that the false land document which produced by land developers
was the prime cause for their relocation.
In below discussed case study regarding this issue:
Case Study 06: Relocated people: Ashiyan City
Mr. Murad Ali, 50, a resident of Holan
Nama Para of Dakkin Khan Union
expressed the procedure by which
Ashiyan City authority acquired his
homestead. Mr. Ali informed that some
of his inherited land was sold to Ashiyan
City authority by his relatives which
ultimately played a vital role for his land
selling. By the help of local land office,
land developer produced false paper of
his land which shown the evidence of his
land selling.
Photograph 5.8: Mr. Murad Ali who was
relocated by Ashiyan City, expressed his views
regarding developer’s activities in front of his
demolished house.
Source: Field Survey,2011
Because of low economical status, he did not have any capability to file case against
the developer illegal procedure. But Mr. Ali tried to protect his homestead by social

77
negotiation (salish). For this reason, he informed the local Union Chairman. The
Union Chairman was not interested in this matter. Because of his low social status
and previous experience, he did not inform police station (Thana).
He also informed that in previous time,
some of his relatives went to police
station (Thana) but they were forced and
threaten by police asking them why they
tried to voice against the land developer.
He said quoting local representatives and
middlemen, "You should sell your
homesteads as you cannot fight against
them (land developer) for long.
Photograph 5.9: Murad Ali original homestead Source: Field Survey,2011
They (land developer) have strong connections with the government and they can do
anything they like." He was forced to sell his total homestead (6 katha) and got 5.5
lakh BDT from Developer. Mr. Ali had to give 60 thousand taka to a local
musclemen to get the whole money from the developer at a time. Rest of the money
he used for buying new land in Tongi (2.5 katha). That land was marshy and had no
chance to use for cultivation or living purpose.
(e)Uninhabitable condition created by the developers:
Uninhabitable condition defines, to create such situation that hampers local people’s
living condition. From field investigation, it was found that 13% relocated household
indicated the uninhabitable condition created by the developers was the major cause
for their relocation. For example, sometimes Ashiyan City authority cut off water and
gas line in adjacent area’s households. As a consequence, people had no option other
than selling their land to the referred developer. Similarly, sometimes false water
logging in those areas was created so that frequent movement of local resident gets
hampered.

78
In below discussed case studies regarding this issue:
Case Study 07: Vulnerable household for relocation: Ashiyan City
Mr. Jamal Ahmed, 52, lived Dakkin Khan Union since 1979. Mr. Ahmed was in
vulnerable condition in the study area for relocation by Ashiyan City authority. When
survey team visited the study area they found that he was locked by Ashiyan City
authority for two days with his family. Even his children were not allowed to go to
school.
Musclemen who worked under
Ashiyan City authority even took away
his mobile phone. So he had no option
to connect with his relatives or police
for help. All his relatives and neighbors
were relocated from his surroundings
in different period. The person was a
businessman and tried to prevent the
developer from illegal activities.
Photograph 5.10: Jamal Ahmed was locked by developer of Ashiyan City Source: Field Survey,2011
Two months ago, a case was filed
against the developer but police did not
even accept his GD, he added. The
survey team found that musclemen had
cut down the main entry road and gas
supply of Mr. Jamal’s house. As a
consequence, it was hard for Mr.
Jamal’s family to stay in this place for
long term. Here the developer’s main
aim was to create uninhabitable
condition which ultimately forced Mr.
Jamal to sell his land.
Photograph 5.11: Cut down the main entry road of Mr. Jamal’s house Source: Field Survey,2011
When this picture was taken, some of the musclemen threatened the person not to

79
talk with the survey team. The person expressed that he had no option but relocation
though he tried his best to stay here.
Case Study 08: Ashiyan City strategies to buy land from local people
When the survey team visited they found that a number of houses were empty.
Ashiyan City authority created false water logging in those areas.
This image showing inhabitable condition, created by developer, was the prime
reason for those families’ relocation. Local people expressed that those families were
pressurized by developer for relocation. Most of them did not get their land selling
money at a time. In most of the cases local musclemen played as middleman between
local land owner and developer. As a consequence, huge portion of land selling
money was taken by musclemen from local people by force. In most of the cases
developer gave money to the land owner in 2 to 4 installments.
Case Study 09: Green Model Town strategies to buy land from local people
Photograph 5.12: Ashiyan City created false water logging in the study area
Source: Field Survey, 2011
Photograph 5.13: Green Model Town dumping Waste garbage in front of local residence houses
Source: Field Survey,2011

80
Green Model Town authority filled up their surrounding areas by local wastages.
Local people told that in this process local ward commissioner also has a part in the
developer activities. Local people urged that he (Ward Commissioner) always
supported developer activities. From these pictures, it is clearly shown that some
households’ front sides were filled by wastes which ultimately created inhabitable
condition for those residents. From field survey it was found that a number of
household were relocated because of this type of unhealthy condition.
Similarly from field survey it was found that Musclemen appointed by Green Model
Town authority spreading sand around the lands of project areas by force.
Because, developer recognized that most of the people were engaged with
agriculture. So if agriculture land is filled with the sand, so they will be bound to sell
their homestead to the developer at low price.
5.3.2.2 Strategies taken by the local people to save their land:
Local people used many strategies to save their land from developers. Mainly those
households who were not interested to sell their land tried both social and legal
assistance for protecting their lands. Here some factors played an influential role in
this process. Social status had an influential role for receiving legal assistance. From
field survey, it was observed that who were poor or has low social status regarding
wealth and professional status was more vulnerable. Similarly from field survey, it
was found that Govt. service holder (100%), Private Service holder (100%) and
Businessmen (100%) tried to protect forcible relocation through social or legal
Photograph 5.14: Surrounding areas of Green Model Town
Source: Field Survey,2011
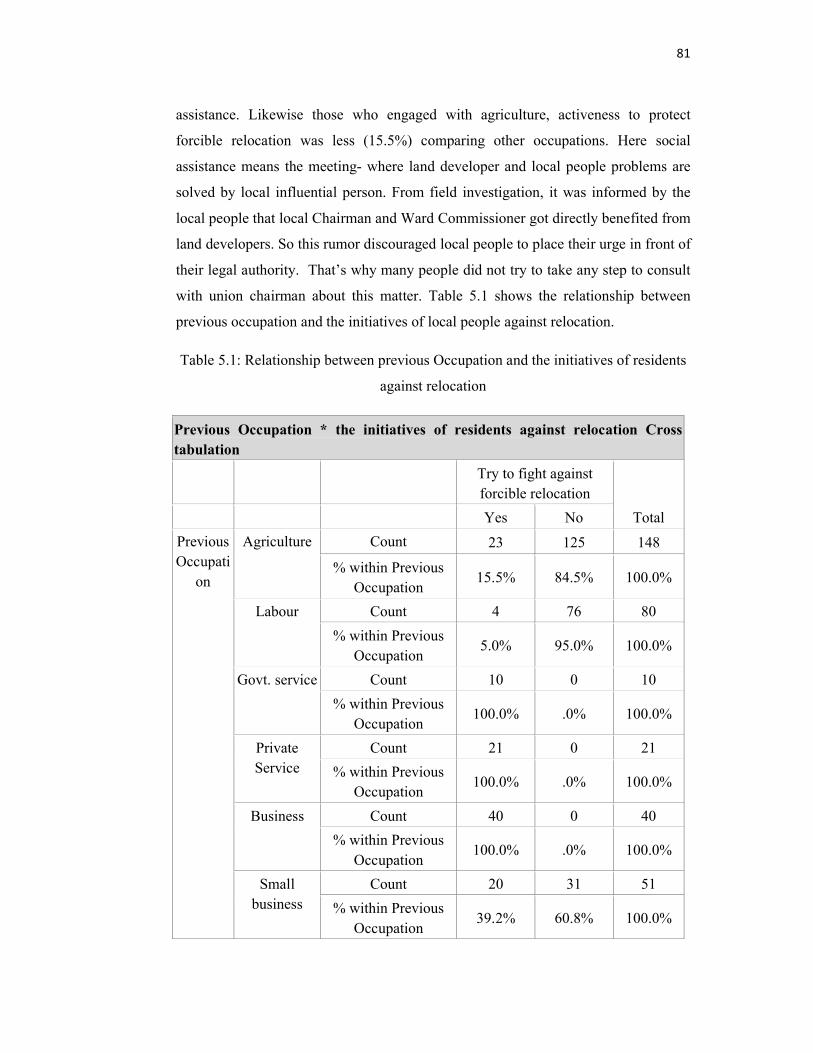
81
assistance. Likewise those who engaged with agriculture, activeness to protect
forcible relocation was less (15.5%) comparing other occupations. Here social
assistance means the meeting- where land developer and local people problems are
solved by local influential person. From field investigation, it was informed by the
local people that local Chairman and Ward Commissioner got directly benefited from
land developers. So this rumor discouraged local people to place their urge in front of
their legal authority. That’s why many people did not try to take any step to consult
with union chairman about this matter. Table 5.1 shows the relationship between
previous occupation and the initiatives of local people against relocation.
Table 5.1: Relationship between previous Occupation and the initiatives of residents
against relocation
Previous Occupation * the initiatives of residents against relocation Cross
tabulation
Try to fight against
forcible relocation
Total Yes No
Previous
Occupati
on
Agriculture Count 23 125 148
% within Previous
Occupation 15.5% 84.5% 100.0%
Labour Count 4 76 80
% within Previous
Occupation 5.0% 95.0% 100.0%
Govt. service Count 10 0 10
% within Previous
Occupation 100.0% .0% 100.0%
Private
Service
Count 21 0 21
% within Previous
Occupation 100.0% .0% 100.0%
Business Count 40 0 40
% within Previous
Occupation 100.0% .0% 100.0%
Small
business
Count 20 31 51
% within Previous
Occupation 39.2% 60.8% 100.0%

82
Total Count 118 232 350
% within Previous
Occupation 33.7% 66.3% 100.0%
Source: Field Survey,2011
Based on field survey, it can be said that major portion of the respondents in the
sample survey did not try to protect their forcible (involuntary) relocation issues by
adapting any form of social or legal assistance (66.3%). Only 33.7% of the
respondents tried to protect their relocation by social or legal assistance. Here
occupation status played imperative aspects for people initiatives to protect their
lands from developer.
On the other hand, some of the local people tried to protect their homestead through
religious strategy but developer did not even consider the graveyards. For example,
One interesting thing was found from the Ashiyan City project field survey that some
people were hanging signboard in front of their house which exposed proposed
religious institution like Madrasa (Islamic education centre). But those lands were
not saved from the eviction process of the developers.
Local people have also expressed that two old graveyards (Photograph 5.16) were
occupied by the Ashiyan City. When the survey team visited the area, they found that
one family had shown red flag to protect their grandfather‘s grave in study area.
Photograph 5.15: Signboard for proposed religious institution
Source: Field Survey,2011
Photograph 5.16: Graveyard
Source: Field Survey,2011

5.3.3 Phase Three: Transfer of Land and Money
Land transfer process is a complex issue and so many matters are occurred in this
process. It is common tendency that without satisfaction people do not get interested
to sell their land. From field investigation, it
respondents in the sample survey
only 20% were satisfied regarding the land price.
5.3.3.1 Key Role Player for Fixation of Land Price:
Determining land price is a very vital
area, it was found that in most of the cases (48.9%), local
determining the price of land between land developers and local people
From both focus group discussion and questionnaire s
relocated people that local
price.
It was informed from field investigation that in most of the cases, local political party
leaders played as musclemen
sell their land. In Most of the cases
determining land price for land developers and land owners. The next significant
percentages were 27.1% and 24% of land developers and family respectively (Figure
5.4).
Figure 5.4: Key role player for fixation of land Price
Source: Field Survey, 201
Transfer of Land and Money
Land transfer process is a complex issue and so many matters are occurred in this
It is common tendency that without satisfaction people do not get interested
From field investigation, it was informed that
respondents in the sample survey were not satisfied (79.4%) of their land price and
only 20% were satisfied regarding the land price.
Key Role Player for Fixation of Land Price:
Determining land price is a very vital issue for reassigning any land. In the study
area, it was found that in most of the cases (48.9%), local musclemen
determining the price of land between land developers and local people
From both focus group discussion and questionnaire survey, it was informed by
relocated people that local musclemen played very vital role for determining land
It was informed from field investigation that in most of the cases, local political party
musclemen and created pressure on local people by various ways to
sell their land. In Most of the cases musclemen played role as a middleman for
determining land price for land developers and land owners. The next significant
percentages were 27.1% and 24% of land developers and family respectively (Figure
: Key role player for fixation of land Price
Source: Field Survey, 2011
83
Land transfer process is a complex issue and so many matters are occurred in this
It is common tendency that without satisfaction people do not get interested
was informed that most of the
not satisfied (79.4%) of their land price and
issue for reassigning any land. In the study
musclemen was
determining the price of land between land developers and local people (Figure 5.2).
urvey, it was informed by
played very vital role for determining land
It was informed from field investigation that in most of the cases, local political party
and created pressure on local people by various ways to
played role as a middleman for
determining land price for land developers and land owners. The next significant
percentages were 27.1% and 24% of land developers and family respectively (Figure

84
Most of the cases it was found that the bargaining power of land owner was very low,
as local musclemen acted as middle man they favored the land developers by fixing
land in low price. From field investigation, it was found that determination of the
land price was based on some criteria. For example, the price of homestead was
different from the price of agricultural land. Developer had to pay more money to get
the homestead land than that of agricultural land, as it was the business policy to get
the whole land easily. The developers believed that, it would be easier for them to get
the agricultural land if they buy homestead land at first. Likewise, social and
political power of local people also determined the selling price of previous land.
Those who had strong political linkage got extra money comparing neutral household
for land selling.
5.3.3.2 Selling Price of Previous Land and Utilization of money:
Table 5.2 shows the land price per katha in previous locations.
Table 5.2: Selling price of previous land (According to Katha)
Katha/ BDT Frequency Percent
1-5 lakh 113 32.3
6-10 lakh 130 37.1
11-15 lakh 107 30.6
Total 350 100.0
Source: Field Survey, 2011
Various mode of utilization money were found among surveyed family. Most of the
households used their land selling money for business purpose (38%). Next
significant percentage was of buying new land (32%) for residential purpose or for
cultivation. similarly it was taken 27% and 3% respectively for the family purpose
and educational purpose (Figure 5.5).

5.3.3.3 Money Receiving Procedure and satisfaction about land price:
From the survey of four developers in this study, some common scenarios have been
found from money receiving procedures between the local people and developers.
The field survey reflected that most of the respondents did not get their whole money
at a time. It was found that about 28% of people got the money at a time but 72%
people did not receive whole amount of money at a time. From field investigation, it
was found that in most of the cases middlemen engaged in money transfer process
between land developers and local people. Similarly middlemen also took percentage
of the land selling money from both local people and developers. The role of the
Middleman varied from place to place and developer to developer. Sometimes
middlemen took more money from the d
people. . At the same time,
will not receive any money if they take any step against their illegal activities. As
middlemen had the political support, they e
people from their rights. From the field survey of four land projects, it was found that
there were no main offices in projects areas. That’s why people in these areas could
not make any connection with land develope
time people had to connect with the middlemen for collect land selling money.
Figure 5.5: Mode of utilization money
Source: Field Survey, 201
Money Receiving Procedure and satisfaction about land price:
From the survey of four developers in this study, some common scenarios have been
found from money receiving procedures between the local people and developers.
The field survey reflected that most of the respondents did not get their whole money
. It was found that about 28% of people got the money at a time but 72%
people did not receive whole amount of money at a time. From field investigation, it
was found that in most of the cases middlemen engaged in money transfer process
pers and local people. Similarly middlemen also took percentage
of the land selling money from both local people and developers. The role of the
Middleman varied from place to place and developer to developer. Sometimes
middlemen took more money from the developers but gave less money to the local
. At the same time, the middlemen gave threat to the local people that they
will not receive any money if they take any step against their illegal activities. As
middlemen had the political support, they exercised the power to deprive the local
people from their rights. From the field survey of four land projects, it was found that
there were no main offices in projects areas. That’s why people in these areas could
not make any connection with land developers authority. For that reason, most of the
time people had to connect with the middlemen for collect land selling money.
Mode of utilization money
Source: Field Survey, 2011
85
Money Receiving Procedure and satisfaction about land price:
From the survey of four developers in this study, some common scenarios have been
found from money receiving procedures between the local people and developers.
The field survey reflected that most of the respondents did not get their whole money
. It was found that about 28% of people got the money at a time but 72%
people did not receive whole amount of money at a time. From field investigation, it
was found that in most of the cases middlemen engaged in money transfer process
pers and local people. Similarly middlemen also took percentage
of the land selling money from both local people and developers. The role of the
Middleman varied from place to place and developer to developer. Sometimes
evelopers but gave less money to the local
the middlemen gave threat to the local people that they
will not receive any money if they take any step against their illegal activities. As
xercised the power to deprive the local
people from their rights. From the field survey of four land projects, it was found that
there were no main offices in projects areas. That’s why people in these areas could
. For that reason, most of the
time people had to connect with the middlemen for collect land selling money.

Most of the respondents in the sample survey were not satisfied (79.4%) with their
land price. And thus lack of in
20% only were satisfied regarding their land price.
5.3.4 Phase Four: Relocated to new Place
Discussion about relocated place and reason for choosing the new place for living
narrated below.
5.3.4. 1 Duration of Living in this
From field survey, it was found that most of the respondents were living in this new
place around three to five years (58.9%). Next significant portions (28.3%) were
living more than five years. Only 12.9% respon
years.
5.3.4. 2 Land Price in relocated places:
Because of flexibility in survey, data of land price has been categorized in 3
From the field survey,
present area and others do not have own land in present time.
Figure 5.6: Duration of living in this relocated Place
Source: Field Survey, 201
Most of the respondents in the sample survey were not satisfied (79.4%) with their
land price. And thus lack of interest was grown to sell lands. It was found that about
20% only were satisfied regarding their land price.
Relocated to new Place
Discussion about relocated place and reason for choosing the new place for living
Duration of Living in this Relocated Place:
it was found that most of the respondents were living in this new
place around three to five years (58.9%). Next significant portions (28.3%) were
living more than five years. Only 12.9% respondents lived less than one year to three
Land Price in relocated places:
Because of flexibility in survey, data of land price has been categorized in 3
it was found that 32% relocated people have the land in
present area and others do not have own land in present time.
Figure 5.6: Duration of living in this relocated Place
Source: Field Survey, 2011
86
Most of the respondents in the sample survey were not satisfied (79.4%) with their
t was found that about
Discussion about relocated place and reason for choosing the new place for living
it was found that most of the respondents were living in this new
place around three to five years (58.9%). Next significant portions (28.3%) were
dents lived less than one year to three
Because of flexibility in survey, data of land price has been categorized in 3 groups.
it was found that 32% relocated people have the land in

Table 5.
Source: Field Survey, 201
From field survey, it was exposed that most of the cases local people paid the land
price per katha within 10 lakh (73.46%). The less number of 26.5% people bought
their land above 10 lakh per katha
5.3.4. 3 Reason of selecting relocated place for living:
There were a number of reasons for selecting relocated place for living by local
people. From field investigation
key consideration when choosing new place for living. Because, it was found from
field survey that most of the people changed their previous occupation.
hand the significant reason for choosi
The other vital reason which influenced local people for choosing new place were
adjacent to previous location (9.4%), adjacent to relatives (5.7%),
center (4.9%), better transport facility (3
5.7)
BDT/ Katha
1-5 lakh
6-10 lakh
Above 10 lakh
Total
Figure 5.7: Reason of chosen relocated Place
Source: Field Survey, 201
Table 5.3: Land Price in Present location
Source: Field Survey, 2011
From field survey, it was exposed that most of the cases local people paid the land
price per katha within 10 lakh (73.46%). The less number of 26.5% people bought
above 10 lakh per katha (Table 5.3).
Reason of selecting relocated place for living:
There were a number of reasons for selecting relocated place for living by local
field investigation, it was found that job opportunity (33.1%) was the
consideration when choosing new place for living. Because, it was found from
field survey that most of the people changed their previous occupation.
hand the significant reason for choosing new place was based on land price (32.3%).
which influenced local people for choosing new place were
adjacent to previous location (9.4%), adjacent to relatives (5.7%), proximity to city
etter transport facility (3.4%) and low house rent (11.1%) (Figure
Frequency Percent
38 33.62
45 39.82
30 26.54
113 100
Figure 5.7: Reason of chosen relocated Place
Source: Field Survey, 2011
87
From field survey, it was exposed that most of the cases local people paid the land
price per katha within 10 lakh (73.46%). The less number of 26.5% people bought
There were a number of reasons for selecting relocated place for living by local
, it was found that job opportunity (33.1%) was the
consideration when choosing new place for living. Because, it was found from
field survey that most of the people changed their previous occupation. On the other
ng new place was based on land price (32.3%).
which influenced local people for choosing new place were
proximity to city
and low house rent (11.1%) (Figure
33.62
39.82
26.54
100
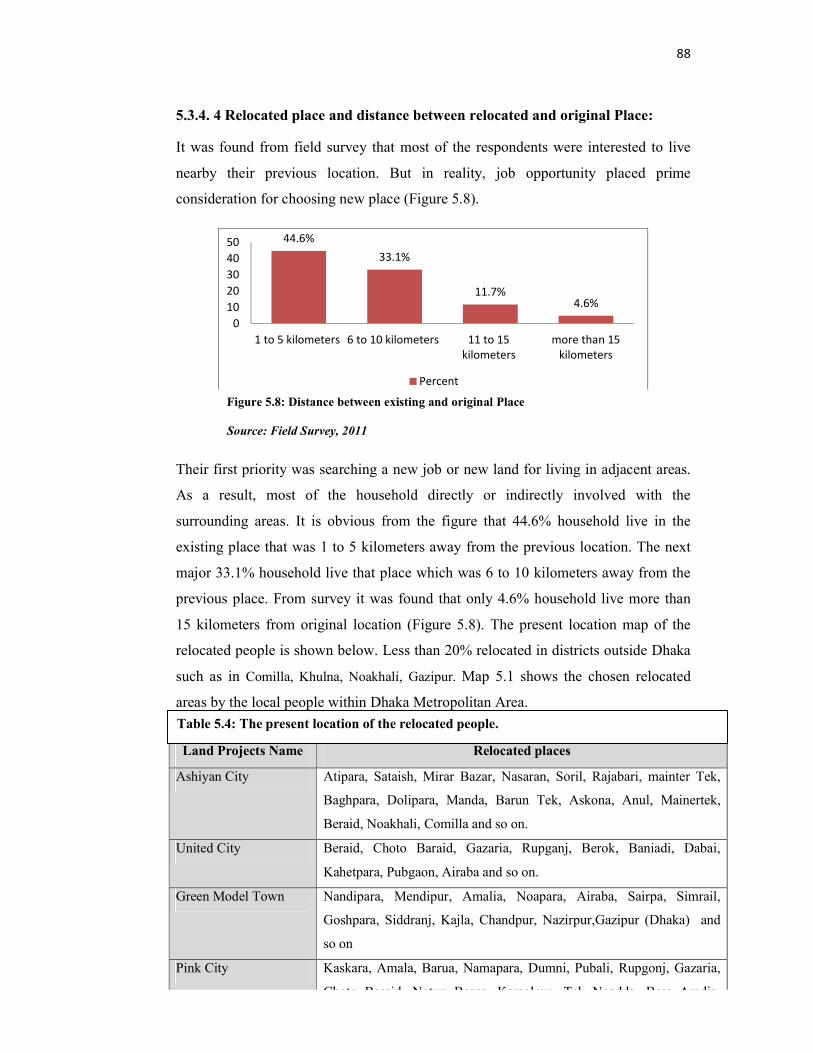
88
5.3.4. 4 Relocated place and distance between relocated and original Place:
It was found from field survey that most of the respondents were interested to live
nearby their previous location. But in reality, job opportunity placed prime
consideration for choosing new place (Figure 5.8).
Their first priority was searching a new job or new land for living in adjacent areas.
As a result, most of the household directly or indirectly involved with the
surrounding areas. It is obvious from the figure that 44.6% household live in the
existing place that was 1 to 5 kilometers away from the previous location. The next
major 33.1% household live that place which was 6 to 10 kilometers away from the
previous place. From survey it was found that only 4.6% household live more than
15 kilometers from original location (Figure 5.8). The present location map of the
relocated people is shown below. Less than 20% relocated in districts outside Dhaka
such as in Comilla, Khulna, Noakhali, Gazipur. Map 5.1 shows the chosen relocated
areas by the local people within Dhaka Metropolitan Area.
44.6%
33.1%
11.7%4.6%
0
10
20
30
40
50
1 to 5 kilometers 6 to 10 kilometers 11 to 15 kilometers
more than 15 kilometers
Percent
Land Projects Name Relocated places
Ashiyan City Atipara, Sataish, Mirar Bazar, Nasaran, Soril, Rajabari, mainter Tek,
Baghpara, Dolipara, Manda, Barun Tek, Askona, Anul, Mainertek,
Beraid, Noakhali, Comilla and so on.
United City Beraid, Choto Baraid, Gazaria, Rupganj, Berok, Baniadi, Dabai,
Kahetpara, Pubgaon, Airaba and so on.
Green Model Town Nandipara, Mendipur, Amalia, Noapara, Airaba, Sairpa, Simrail,
Goshpara, Siddranj, Kajla, Chandpur, Nazirpur,Gazipur (Dhaka) and
so on
Pink City Kaskara, Amala, Barua, Namapara, Dumni, Pubali, Rupgonj, Gazaria,
Choto Baraid, Notun Bazar, Kamalpur, Tek Noadda, Bara Amdia,
Figure 5.8: Distance between existing and original Place
Source: Field Survey, 2011
Table 5.4: The present location of the relocated people.

Map: 5.1 Relocated places (Greater Dhaka City
Source: Field Survey, 2011
Greater Dhaka City)
Ashiyan City
PInk
United
Green Model
Town
89
Ashiyan City
PInk City
United City
Green Model
Town

90
5.4 Major Findings of Land Acquisition Process from Local People
Land developers with the help of local musclemen and local officials used many
techniques to buy land from local people. More or less same techniques were used by
all land developers for acquiring local people’s land. Here people’s social status,
political influence, educational background influenced developers to choose their
techniques. In below shows the land acquisition process of local people in broad
scale for selected land projects:
Figure 5.9: Ashiyan City land acquisition process
Source: Field Survey, 2011
Ashiyan City
Selected strategies for buying land
Land Developer
Establish office on Land Developer own
village (Holan Nama Para)
Started from land developer’s own land
Price determined by land developer and
local musclemen
Established own group
Firstly Pressurized Local people who had
little landownership
Pressurized Local people who had large
landownership
Uninhabitable condition
Local administrative
Land office officials
Local young musclemen
Local influential persons
False land documents of
disputed piece of land parcel
the developers
Threat family members
Local people relocated from their original
location

91
Green Model Town
Pink City
Low social class
with less power
Appointed Middle man who had strong base at local level
Developer
Identify project areas through own sources
Selected strategies for buying land
High social class
Promise to cultivate own land
after selling lands
Commitment to get a job
False land documents of disputed
piece of land parcel the developers
Uninhabitable condition
Threat family members
Price determined by land developer and local musclemen
Local people relocated from their original location
Local people relocated from their original location
Land office officials
Union Parishad Administrative
Local young musclemen
Politicians
Owner of the Pink City involved in Politics
At first bought 10 Biga land
Established own group
First priority was to buy land from minority people
who had land in surrounding project areas.
Threat family members Spread Rumor
Middleman tried to negotiation with other parties (local
people) to buy their land
If failed then pressured
Create uninhabitable
condition for living Threat family
members
False land documents of disputed piece of land parcel
Land sells to the developer
Figure 5.11: Pink City land acquisition process Source: Field Survey,
2011
Figure 5.10: Green Model Town land acquisition process Source: Field Survey, 2011

92
Figure 5.12: United City land acquisition process Source: Field Survey, 2011
It is evident from the field survey that the land acquiring process from the local
people in four the land development project contains some similar techniques but not
all of them are identical. All the developers treated the local people according to their
size of land ownership, social status, political involvement etc. All the developers
used their political and social power to pressurize the land owners to sell their land
but the extent varied. For example in case of Ashian City, the middle man used all
the techniques to terrorize the local people to sell the land. On the other hand, Green
Model Town used some techniques of negotiation such as they said the local people
can cultivate their land for long time but when it was necessary they also used treat
and pressure.
United City
Handsome financial
offer
Land sells to the developer
Commitment from
developers to get a job
Price determinant by middleman and local people
Relocate from their original location
In most of the cases people disappointed after
selling their land.
Land Developer
Middleman, who possessed
Applied various techniques on local
people by middleman
Land buying experience in field
level
Strong political linkage with upper
level.

93
Following Figure 5.13 is a generalized diagram showing the typical land acquisition
process.
Figure 5.13: Typical land acquisition process
Source: Field Survey, 2011
5.5 Conclusion
Though both voluntary and involuntary procedures were used for relocation, this
research outcome clearly showed that maximum local people were displaced from
their original location through involuntary procedure. Four actors namely, land
developers, local musclemen, local officials and local people being identified
actively played various roles in this relocation procedure. From survey findings, it
can be said that those local people who were not interested to sell their land used
many strategies to save their land from developers. After getting land selling money
from the developers, people search new place for living and prime consideration was
Middleman
Motivated local people to sell land
If rejected than setup strategies
Low economic Class High economic class Minority people
Land Developer
Identify project areas through own source
Financial offer, Threat family members, Commitment from developers to get a job,
Uninhabitable condition , False land documents of disputed piece of land parcel
Price determined by local musclemen
Local people relocated from their original
location

94
job opportunity. Local people tried to live within short distance from their original
location which ultimately showed their strong belongings with the existing localities.
It can be said that suitable relocation should follow some stages as like ‘Thayer
Scudder’s conceptual model’ (See 2.8.1). Scudder (2005) considered first stage as
Planning and Recruitment stage. This stage deals with activities relating to the pre-
resettlement period, such as planning for the removal, rehabilitation and development
of the people. Next stage is Coping and Adjustment stage where adjustments that
take place in order to adapt to the new environment such as new neighbours, new
economic activities, rising expenses, the host population. Community Formation and
Economic Development takes in third stage. Here community formation activities
and constructing various religious structures and common infrastructure is
established for relocated people. Successful integration of relocated populations into
a regional or national political economy will bring an end to the relocation process in
Stage Four. But this research findings show that there had no specific pre-
resettlement plan for local people from land developers. Similarly coping and
adjustment in new location regarding environment, social condition and economic
activities were not considered for relocated people. Likewise there had no provision
for community formation activities and construction of various religious structures
for relocated people. From the research finding, it can be said that the process of
relocation could not be defined in an exact way as it varied from place to place,
developer to developer, people to people, time to time, society to society in selected
four land projects. There were no specific guidelines for local people relocation from
their original location. As a consequence, local people were relocated from their
original location though various procedure by land developers. Land developers with
the help of local musclemen and officials’ displaced local people without considering
any humanities background, only monetary matters are considered. As a result, local
people rights are not properly maintained in relocation process.

95
CHAPTER 6
SOCIO ECONOMIC CONDITIONS OF RELOCATED
PEOPLE
6.1 Introduction
Present status of relocated people and their socio-economic impact due to relocation
is a vast issue which can be recognized through various analytical procedures. Ahsan
(2007) expressed that during displacement people lose natural capital, manmade
capital, social capital and human capital. Displacement of people from their origin
and poverty are linked together by social scientists. Cernea’s model [30] has been
used as a framework for a number of studies. For example, Mahapatra [59] uses the
model to evaluate India’s resettlement from 1947 to 1997, examining each of the risk
in turn. Displacement of local people from their own land has many negative social
impacts [83]. Ramaiah (1995) noted that involuntary relocation creates adverse
impact on health because of mental stress and higher work pressure. Similarly, once
people lose their land, income, other assets and move to new surroundings, they are
unable to use their traditional skills. The productivity of their land declines, as does
their food security [64]. Resettlement fragments communities, dismantles patterns of
social organization and disrupts informal networks with friends, neighbours etc.
Indicators to study present status and socio economic condition are divided into two
sub groups namely social and economical. Indicators under social are housing
conditions, access to services namely water supply, power and sanitation, social
network. Similarly, indicators under economical are occupation, income &
expenditure and land ownership. The indicators chosen for this study was selected
from extensive literature reviews and discussions with experts.
The household surveys were carried out in parallel with reconnaissance survey for
better understanding of relocation process. The survey covered 350 households to
collect data for relocation process from fringe areas. The questionnaire survey was
randomly collected. As original local residents sold their lands and relocated in

96
different places, this research used snowball sampling for questionnaire survey. The
questionnaire format used to collect data is provided in Appendix B.
6.2 Land Ownership
6.2.1 Previous and Present Land Ownership:
Due to relocation, land ownership has been changed drastically. From field survey, it
was found that the people without lands in previous location were hardly found. But
at present most of the people (67.7%) have no land. Previously, 43.1% people had
land above 10-20 katha but now it’s decreasing to remain 6.9% people having land
more than 10-20 katha at present. Though some people got the money at a time from
the developers by selling their lands but most of the people could not buy lands in
any other place for high price of land.
Table 6.1 Present and Previous Land Ownership
Land size Previous Land Ownership (%) Present Land Ownership (%)
Above 20 katha 3.4 0
10-20 katha 43.1 6.9
5-9 katha 28.0 .9
1-4 katha 25.4 24.6
No land 0 67.7
Total 100 100.0
Source: Field Survey, 2011
To justify result (Table 6.1) through statistical analysis, Paired Sample ‘T’ test was
applied for respondent’s previous and present land ownership status. From Paired
Sample ‘T’ test, it was found that the calculated value of t=31.79 At 0.05 significance
level and with 349 degrees of freedom, the critical value is 1.96 found from the table
of t distribution. So it was found that computed value of t (31.79) falls in the rejected
region, the Null hypothesis is rejected. From the hypothesis test, it was found that
there would be huge change regarding land ownership among the relocated people of
the studied area between two time periods. (Calculation appendix-G)

6.3 Occupation Status 6.3.1 Previous and Present Occupation: From field survey it can be said
totally changed from previous
percentage were dramatically changed between two periods. Agriculture percentages
were 42.3% and 16.6% according to previous
percentages are increased from 22.9% to 56.6%. At
and large business percentage are reduced from previous to present. One interesting
point was that private and government service holder
percentage in both periods. Only overseas employees added new job sector in present
and it was totally absent in previous locations (
6.4 Income and Expenditure:
6.4.1 Present and Previous
From field survey, it can be said that overall income range is reduced from previous
to present. Only (20,000
(present and previous) places (6.2% & 8.5%).
0
20
40
6042.3%
22.9%16.6%
56.6%
Previous occupation
Figure 6.1: Previous and Present Occupation
Source: Field Survey, 2011
Occupation Status
Previous and Present Occupation:
From field survey it can be said that at present local people’s occupation structure is
totally changed from previous locations. For example, agriculture and labour
percentage were dramatically changed between two periods. Agriculture percentages
were 42.3% and 16.6% according to previous and present locations. Similarly labor
percentages are increased from 22.9% to 56.6%. At the same time, small business
business percentage are reduced from previous to present. One interesting
point was that private and government service holders had shown the same
percentage in both periods. Only overseas employees added new job sector in present
and it was totally absent in previous locations (Figure 6.1).
Income and Expenditure:
Present and Previous Income and Expenditure:
From field survey, it can be said that overall income range is reduced from previous
to present. Only (20,000- 25,000) earning people showed adjacent results in both
(present and previous) places (6.2% & 8.5%).
22.9%
2.9% 6%11.4% 14.6%
0
56.6%
2.9% 6% 4%11.4%
2.6%
Present occupation
: Previous and Present Occupation
97
occupation structure is
. For example, agriculture and labour
percentage were dramatically changed between two periods. Agriculture percentages
and present locations. Similarly labor
the same time, small business
business percentage are reduced from previous to present. One interesting
s had shown the same
percentage in both periods. Only overseas employees added new job sector in present
From field survey, it can be said that overall income range is reduced from previous
25,000) earning people showed adjacent results in both
2.6%
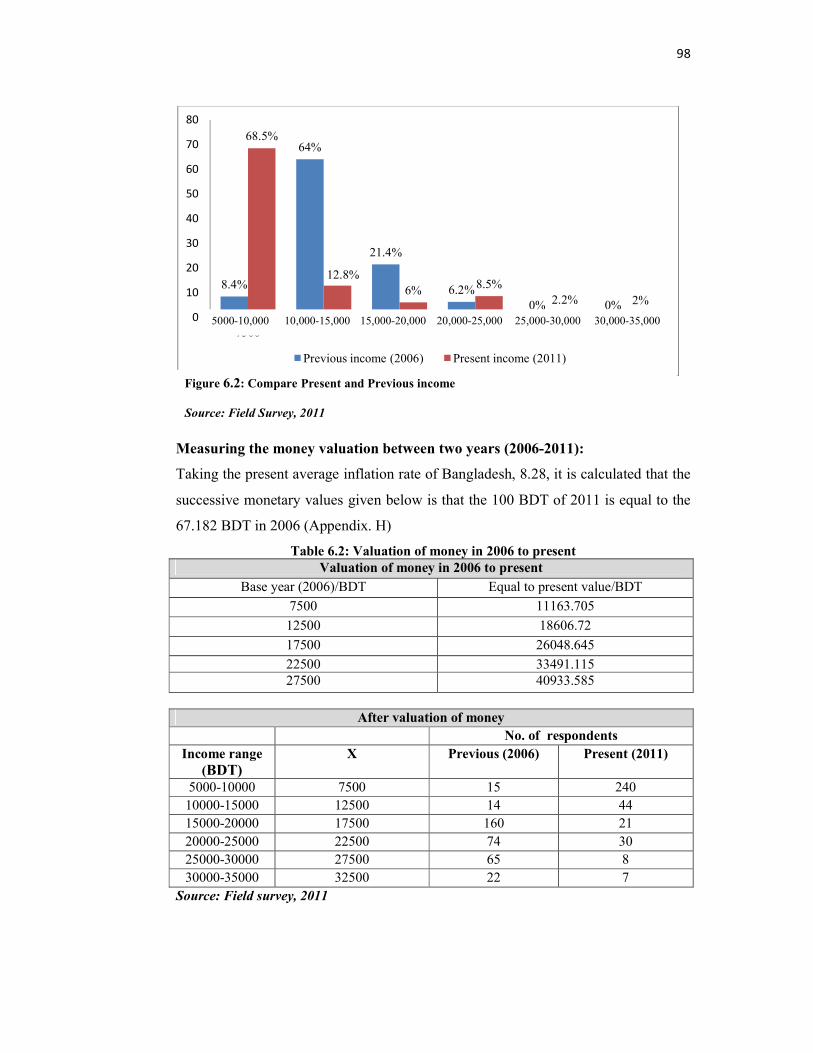
98
Measuring the money valuation between two years (2006-2011):
Taking the present average inflation rate of Bangladesh, 8.28, it is calculated that the
successive monetary values given below is that the 100 BDT of 2011 is equal to the
67.182 BDT in 2006 (Appendix. H)
Table 6.2: Valuation of money in 2006 to present Valuation of money in 2006 to present
Base year (2006)/BDT Equal to present value/BDT
7500 11163.705
12500 18606.72
17500 26048.645
22500 33491.115 27500 40933.585
After valuation of money
No. of respondents
Income range (BDT)
X Previous (2006) Present (2011)
5000-10000 7500 15 240
10000-15000 12500 14 44
15000-20000 17500 160 21
20000-25000 22500 74 30
25000-30000 27500 65 8
30000-35000 32500 22 7
Source: Field survey, 2011
8.4%
64%
21.4%
6.2%0% 0%
68.5%
12.8%
6% 8.5%
2.2% 2%
0
10
20
30
40
50
60
70
80
7500 12500 17500 22500 27500 32500
Previous income (2006) Present income (2011)
Figure 6.2: Compare Present and Previous income
Source: Field Survey, 2011
5000-10,000 10,000-15,000 15,000-20,000 20,000-25,000 25,000-30,000 30,000-35,000

99
After valuation of money, it can be said that in previous locations most of the
people’s income ranged between 15,000 BDT to 20,000 BDT but at present it ranges
from 5,000 BDT to 10,000 BDT shown by the highest percentage. So it can be said
that local people’s actual income was reduced at present than previous locations.
To justify result (Figure 6.2) through statistical analysis, Paired Sample ‘T’ test was
applied for local people of Present and Previous Income range. From paired sample
‘T’ test, it was found that the calculated value of t= 13.30. At 0.05 significance level
and with 349 degrees of freedom, the critical value is 1.96 found from the table of t
distribution. So it was found that computed value of t (13.30) falls in the rejected
region, the Null hypothesis is rejected. From the hypothesis test, it can be said that
there would be huge income change among the relocated people of the studied area
between two time periods. (Calculation appendix-H)
As there is no saving money by the studied people between two time periods due to
money both income and expenditure were equal. So in the study expenditure is not
explained broadly.
6.5 Social Network: It is the universal truth that people always want to live in a secured place. The socio
economic study of Dhaka shows that 60 to 70 percent of families of Dhaka have their
close relatives living in the same area [75]. Similarly friendship develops among
relatively homogenous type of people [21]. As a result Resettlement fragments
communities, dismantles patterns of social organization and disrupts informal
networks with friends, neighbours etc. It’s also important to determine social network
in any place. In the present study, primary social network was described by relatives
and friendship networks within neighborhood. Similarly secondary social network in
the neighbourhood was described by the level of participation of the respondents in
the activities of the neighbourhood based organizations.
It was found from field survey that most of the household respondents were positive
regarding their relatives, friends and neighbors forced relocation issue (67.7%). Only
32.3% household showed negative response in this aspect (Table 6.3). So it can be

100
said that forced relocation is a crucial and concerning issue for fringe areas in Dhaka
city.
Table 6.3: Percentage of respondents’ relatives, friends and neighbors forced by
developers for Relocation
Response Frequency Percent
Yes 237 67.7
No 113 32.3
Total 350 100.0
Source: Field Survey, 2011
6.5.1 Information about respondent’s Relatives and Friends in present and previous locations:
It was understood from field survey that maximum local people lived adjacent to
their relatives, friends in previous locations (70.6%). On the other hand this
percentage was half in present locations in comparison to the previous locations (See
Figure 6.3).
6.5.2 Involvement with Neighborhood Organization: It is important to recognize involvement with Neighborhood Organization for
measuring social network. The ultimate nature of bonding with the neighbourhood
can be understood by the concerns of the residents towards problems of
35.7%
70.6%
64.3%
29.4%
0 10 20 30 40 50 60 70 80
Living adjacent with Relatives, Friends in Present location
Living adjacent with Relatives, Friends in Previous location
No Yes
Figure 6.3: Relatives, Friends living adjacent in Present and Previous location Source: Field Survey, 2011

neighbourhood and initiatives taken by them for solving these problems and for
upgrading the overall socio economic environmental condition of the neighbourhood.
Residents of a neighbourhood usually do these activities by forming a neighb
based club or organization
development club, sports club, religious club and so on.
that only 36.9% were involved with neighborhood organization in present locations.
But this percentage was 73.1% in previous locations (Figure 6.
Somity (Sports club) was established by H
Union, Dhaka. Similarly, residence of adjacent areas of
many clubs like as “Dumni
club was arranged so many
locations ceiling number of respondents live on rental basis. This played a vital role
for involvement with neighbourhood organizations.
not have provision of membership or have no chance to control a club.
they feel alienated in the neighborhood and
issues.
Involvement with Neighborhood organization in Previous
Involvement with Neighborhood organization in Present
Figure 6.4: Involvement with Neighborhood organization in Present and Previous location
Source: Field Survey, 2011
neighbourhood and initiatives taken by them for solving these problems and for
upgrading the overall socio economic environmental condition of the neighbourhood.
Residents of a neighbourhood usually do these activities by forming a neighb
based club or organization [23]. For example, cultural club,
, sports club, religious club and so on. From survey, it was found
that only 36.9% were involved with neighborhood organization in present locations.
But this percentage was 73.1% in previous locations (Figure 6.4). For example, J
ports club) was established by Holan Nama Para’s resident in DakkinKhan
Similarly, residence of adjacent areas of Pink City established so
many clubs like as “Dumni Somaj Unnayan’ (Neighborhood development club)
so many social events such as, Eid Prayer in the area.
locations ceiling number of respondents live on rental basis. This played a vital role
for involvement with neighbourhood organizations. As, families of rental houses, do
not have provision of membership or have no chance to control a club.
they feel alienated in the neighborhood and have no voice regarding various
0 10 20 30 40 50 60
Involvement with Neighborhood organization in Previous
Involvement with Neighborhood organization in Present 36.9%
26.9%
No Yes
Involvement with Neighborhood organization in Present and Previous location
101
neighbourhood and initiatives taken by them for solving these problems and for
upgrading the overall socio economic environmental condition of the neighbourhood.
Residents of a neighbourhood usually do these activities by forming a neighbourhood
cultural club, neighborhood
From survey, it was found
that only 36.9% were involved with neighborhood organization in present locations.
For example, Jubo
dent in DakkinKhan
ity established so
(Neighborhood development club). This
social events such as, Eid Prayer in the area. In present
locations ceiling number of respondents live on rental basis. This played a vital role
As, families of rental houses, do
not have provision of membership or have no chance to control a club. As a result,
various social
70 80
73.1%
63.1%
Involvement with Neighborhood organization in Present and Previous location

102
Involved Neighborhood organization in previous location and Relatives, friends living adjacently in previous location Cross tabulation: Table 6.4: Involved Neighborhood organization and Relatives, friends lived adjacent in
Previous locations
Involve Neighborhood organization in previous locations * Relatives, friends living
adjacent in previous location Cross tabulation
Relatives, friends living
adjacent in previous
location
Total Yes No
Involve
Neighborhood
organization in
previous location
Yes % within Relatives,
friends living adjacent
in previous location
94.7% 21.4% 73.1%
No % within Relatives,
friends living adjacent
in previous location
5.3% 78.6% 26.9%
Total % within Relatives,
friends living adjacent
in previous location
100.0% 100.0% 100.0%
Source: Field Survey, 2011
From Table 6.4 it can be said that those who lived with their relatives and friends in
previous locations, enrollment in neighborhood organizations were higher than those
who did not live adjacent to their friends and relatives.
Similarly Involved Neighborhood organization in Present and Relatives, friends, living adjacent in Present locations Cross tabulation: Table 6.5: Involved Neighborhood organization and Relatives, friends lived adjacent in
Present location
Involve Neighborhood organization in present * Relatives, friends, living adjacent in
present Cross tabulation
Relatives, friends, living
adjacent in present
Total Yes No
Involve
Neighborhood
organization in
Yes % within involve
Neighborhood
organization in present 84.5% 15.5% 100.0%

103
present No % within involve
Neighborhood
organization in present 7.2% 92.8% 100.0%
Total % within involve
Neighborhood
organization in present 35.7% 64.3% 100.0%
Source: Field Survey, 2011
From Table 6.5 cross tabulation it can be said that those who lived with their relatives
and friends in present locations, enrollment in neighborhood organizations were
higher than those who did not live adjacent with their friends and relatives.
6.6 Housing condition: 6.6.1 Present Resident Status:
It was found from field survey that most of the respondents in the sample survey
lived in rented houses in present locations (67.7%), only 32.3% lived in their own
home. On the other side in previous locations, 100% people lived in their own home
(Table 6.6).
Table 6.6: Present Resident Status
Ownership Pattern of Respondents Frequency Percent
Own home 113 32.3%
Tenant 237 67.7%
Total 350 100.0
Source: Field Survey, 2011
6.6.2 Type of Housing:
It was found from field survey that at present 33.7% household house types were
katcha but this percentage were 7.7% in previous locations. Similarly at present Semi
Pucca house types reduced 9.5% from previous locations. Likewise 27.7% household
were Pucca house in previous locations which were 11.1% regarding to that in
present locations (Figure 6.5).

6.6.3 Satisfaction about Housing Condition: In this study, satisfaction is
condition and family pleasure. Most of the respondents, 61%, in the sample survey
expressed their positive views with satisfaction about previous housing condition,
likewise only 25.1% expressed
housing condition. Similarly, 15.7% respondents
previous housing condition whereas 55.1% expressed same result considering present
housing condition (Figure 6.
0
10
20
30
40
50
60
70
Katcha
33.7%
0
10
20
30
40
50
60
70
Satisfied
25.1%
Satisfaction Present housing
Figure 6.5: Present & Previous House Type
Source: Field Survey, 201
Figure 6.6: Satisfaction about Present & Previous housing condition
Source: Field Survey, 201
Satisfaction about Housing Condition:
In this study, satisfaction is illustrated by the overall housing condition, interior space
condition and family pleasure. Most of the respondents, 61%, in the sample survey
expressed their positive views with satisfaction about previous housing condition,
likewise only 25.1% expressed their view regarding satisfaction about present
housing condition. Similarly, 15.7% respondents did not satisfy regarding their
previous housing condition whereas 55.1% expressed same result considering present
housing condition (Figure 6.6).
Katcha Semi Pucca Pucca
33.7%
55.1%
11.1%7.7%
64.6%
27.7 %
Present House Type Previous House Type
Satisfied Moderately satisfied
Not satisfied
25.1%19.7%
55.1%60.9%
23.4%15.7%
Satisfaction Present housing Satisfaction Previous housing
Present & Previous House Type
Source: Field Survey, 2011
Satisfaction about Present & Previous housing condition
Source: Field Survey, 2011
104
by the overall housing condition, interior space
condition and family pleasure. Most of the respondents, 61%, in the sample survey
expressed their positive views with satisfaction about previous housing condition,
their view regarding satisfaction about present
regarding their
previous housing condition whereas 55.1% expressed same result considering present

6.7 Utility Facilities: 6.7.1 Electricity: 6.7.1.1 Electricity Connection: From field survey, it was found that in previous locations, most of the households
(92.9%) had electricity connection. On the other hand, at present 37.1% of
households have no electricity connection whereas 62.9% were with electricity
connection (Figure 6.7).
6.7.1.2 Electricity Condition:
At present, a huge number of sample households connected electricity through illegal
way from their surroundings. That’s why the concerned
disconnects the electricity line. Side
the electricity line in legal way because of lack of affordable money.
As a result their satisfactions regarding electricity condition were only 28.
present locations and were 49.4% in previous location. Next moderately satisfied
were nearby in both places. But not satisfied extended 9.3% from previous locations
to 32.1% in present locations (Figure 6.
0
20
40
60
80
100
Previous Electricity Connection
Figure 6.7: Present & Previous Electricity availability
Source: Field Survey, 201
Utility Facilities:
Electricity Connection:
it was found that in previous locations, most of the households
(92.9%) had electricity connection. On the other hand, at present 37.1% of
households have no electricity connection whereas 62.9% were with electricity
.
Electricity Condition:
At present, a huge number of sample households connected electricity through illegal
way from their surroundings. That’s why the concerned authority sometimes
disconnects the electricity line. Side-by-side they did not have opportunity to connect
the electricity line in legal way because of lack of affordable money.
As a result their satisfactions regarding electricity condition were only 28.
present locations and were 49.4% in previous location. Next moderately satisfied
were nearby in both places. But not satisfied extended 9.3% from previous locations
to 32.1% in present locations (Figure 6.8).
Previous Electricity Connection
Present Electricity Connection
92.9%
62.9%
7.1%
37.1%
Connected Not Connected
Present & Previous Electricity availability
Source: Field Survey, 2011
105
it was found that in previous locations, most of the households
(92.9%) had electricity connection. On the other hand, at present 37.1% of
households have no electricity connection whereas 62.9% were with electricity
At present, a huge number of sample households connected electricity through illegal
authority sometimes
side they did not have opportunity to connect
As a result their satisfactions regarding electricity condition were only 28.1% in
present locations and were 49.4% in previous location. Next moderately satisfied
were nearby in both places. But not satisfied extended 9.3% from previous locations

6.7.2 Water: 6.7.2.1 Water Availability: It was found from field survey that most of the households had water availability in
their house in previous locations (91.4%). Only 8.6% did not
they mainly collected from their neighbors. On the other hand, 68.9% household had
water availability and 31.1% did not have the water connection in their house at
present locations (Figure 6.9).
from surroundings. But most of the respondents did not show good response
regarding their relationship with neighbors. As a consequence, social quarrel was
common scenario in present locations.
0
10
20
30
40
50
Satisfied
28.1%
Present Electricity condition
0%
20%
40%
60%
80%
100%
Figure 6.8: Present &
Source: Field Survey, 201
Figure 6.9: Present and Previous water supply connection Source: Field Survey, 201
Water Availability:
It was found from field survey that most of the households had water availability in
their house in previous locations (91.4%). Only 8.6% did not have their own supply,
they mainly collected from their neighbors. On the other hand, 68.9% household had
water availability and 31.1% did not have the water connection in their house at
Figure 6.9). As a result, a huge percentage collected their water
from surroundings. But most of the respondents did not show good response
regarding their relationship with neighbors. As a consequence, social quarrel was
common scenario in present locations.
Satisfied Moderately satisfied
Not satisfied
28.1%
39.8%32.1%
49.4%41.4%
9.3%
Present Electricity condition Previous Electricity condition
Present water Supply Connection
Previous water Supply Connection
68.9%91.4%
31.1%8.6%
Connected Not Connected
Previous Electricity condition
Source: Field Survey, 2011
Present and Previous water supply connection
Source: Field Survey, 2011
106
It was found from field survey that most of the households had water availability in
have their own supply,
they mainly collected from their neighbors. On the other hand, 68.9% household had
water availability and 31.1% did not have the water connection in their house at
collected their water
from surroundings. But most of the respondents did not show good response
regarding their relationship with neighbors. As a consequence, social quarrel was

6.7.2.2 Water Supply Condition: It was found from sample survey that 52.2% were satisfied regarding their previous
water supply condition and only 24.4% were satisfied regarding
supply condition. On the other hand 38.4% and 31.8% expressed moderate
satisfaction in previous and present water supply accordingly. In present location
43.8% respondent did not satisfy regarding their present water supply condition b
this percentage were only 9.4% in previous locations (Figure 6.10).
6.7.2.3 Water Supply Provider: It was found from field survey that in previous locations
(38.4%) and private initiatives (61.6%) were the main source for water. In present
locations government provided water supply to 26.9% households and private
initiative provided water supply to 66.9% households. Community Based
organization (CBO) did not play any role as water provider in previous locations. On
the other hand, 6.2% household got water supply through CBO i
locations (Figure 6.11).
0
10
20
30
40
50
60
Satisfied
52.2%
Previous Water Supply condition
Figure 6.10: Present and Previous Water Supply condition Source: Field Survey, 201
Water Supply Condition:
It was found from sample survey that 52.2% were satisfied regarding their previous
water supply condition and only 24.4% were satisfied regarding their present water
supply condition. On the other hand 38.4% and 31.8% expressed moderate
satisfaction in previous and present water supply accordingly. In present location
43.8% respondent did not satisfy regarding their present water supply condition b
this percentage were only 9.4% in previous locations (Figure 6.10).
Water Supply Provider:
It was found from field survey that in previous locations mainly government supply
(38.4%) and private initiatives (61.6%) were the main source for water. In present
locations government provided water supply to 26.9% households and private
initiative provided water supply to 66.9% households. Community Based
ganization (CBO) did not play any role as water provider in previous locations. On
the other hand, 6.2% household got water supply through CBO initiative in present
Satisfied Moderately satisfied
Not satisfied
52.2%
38.4%
9.4%
24.4%31.8%
43.8%
Previous Water Supply condition Present Water Supply condition
Present and Previous Water Supply condition
Source: Field Survey, 2011
107
It was found from sample survey that 52.2% were satisfied regarding their previous
their present water
supply condition. On the other hand 38.4% and 31.8% expressed moderate
satisfaction in previous and present water supply accordingly. In present location
43.8% respondent did not satisfy regarding their present water supply condition but
mainly government supply
(38.4%) and private initiatives (61.6%) were the main source for water. In present
locations government provided water supply to 26.9% households and private
initiative provided water supply to 66.9% households. Community Based
ganization (CBO) did not play any role as water provider in previous locations. On
nitiative in present
Present Water Supply condition

6.7.3 Gas: 6.7.3.1 Gas Connection: It was found from field survey that in previous locations 74.9% households were
under gas supply whereas this percentage were only 25.1% in present locations
(Figure 6.12). As at present most of the respondents lived in rented houses, their
present residential status played a vital role for showing this result. So gas supply
was not like previous locations.
0
10
20
30
40
50
60
70
Government
26.9%
Present water supply provider
0
20
40
60
80
100
Figure 6.11: Present and Previous water supply providerSource: Field Survey, 201
Figure 6.12: Present and Previous gas Connection Source: Field Survey
Gas Connection:
It was found from field survey that in previous locations 74.9% households were
under gas supply whereas this percentage were only 25.1% in present locations
present most of the respondents lived in rented houses, their
present residential status played a vital role for showing this result. So gas supply
was not like previous locations.
Government Private CBO
26.9%
66.9%
6.2%
38.4%
61.6%
0
Present water supply provider Previous water supply provider
Previous gas Connection
Present gas Connection
74.9%
31.1%
25.1%
68.9%
Connected Not Connected
Present and Previous water supply provider Source: Field Survey, 2011
Present and Previous gas Connection
Source: Field Survey, 2011
108
It was found from field survey that in previous locations 74.9% households were
under gas supply whereas this percentage were only 25.1% in present locations
present most of the respondents lived in rented houses, their
present residential status played a vital role for showing this result. So gas supply

6.7.3.2 Gas Condition: Comparing between present and previous gas condition, it was found from field
survey that in previous locations 45.4% were satisfied with their gas condition
whereas at present this percentage were 19.3%. On the other hand
(40.4%) was satisfied considering their gas condition at present locations (
6.13).
6.7.4 Drainage: 6.7.4.1 Drainage Availability:
It was found from field survey that in previous locations 72.6% household were
under drainage facility whereas this percentage were 56.0% in present locations. On
the other hand, without
previous locations to 44.0% in present locations (Figure 6.1
0
10
20
30
40
50
Satisfied
19.3%
Present gas condition
Figure 6.13: Present and Previous gas condition
Source: Field Survey, 201
Comparing between present and previous gas condition, it was found from field
survey that in previous locations 45.4% were satisfied with their gas condition
whereas at present this percentage were 19.3%. On the other hand a huge percentage
considering their gas condition at present locations (
Drainage Availability:
It was found from field survey that in previous locations 72.6% household were
under drainage facility whereas this percentage were 56.0% in present locations. On
without drainage connections percentage increasing from 27.4% in
locations to 44.0% in present locations (Figure 6.14).
Satisfied Moderately satisfied
Not satisfied
19.3%
40.4% 40.4%45.4%
48.5%
6.1%
Present gas condition Previous gas condition
Present and Previous gas condition
Source: Field Survey, 2011
109
Comparing between present and previous gas condition, it was found from field
survey that in previous locations 45.4% were satisfied with their gas condition
a huge percentage
considering their gas condition at present locations (Figure
It was found from field survey that in previous locations 72.6% household were
under drainage facility whereas this percentage were 56.0% in present locations. On
increasing from 27.4% in

6.7.4.2 Drainage Condition: In present locations 26.0% respondents were satisfied with their drainage
whereas 35.2% were moderately satisfied and 38.8% did not satisfy regarding their
drainage condition. On the other side in previous locations, 49.6% were satisfied,
42.9% were moderately satisfied and only 7.5% did not satisfy considering their
drainage condition (Figure
0
20
40
60
80
Previous Drainage
0
10
20
30
40
50
Satisfied
26%
Present Drainage condition
Figure 6.14: Present and Source: Field Survey, 201
Figure 6.15: Present and Previous Drainage condition
Source: Field Survey, 201
Drainage Condition:
In present locations 26.0% respondents were satisfied with their drainage
whereas 35.2% were moderately satisfied and 38.8% did not satisfy regarding their
drainage condition. On the other side in previous locations, 49.6% were satisfied,
42.9% were moderately satisfied and only 7.5% did not satisfy considering their
Figure 6.15).
Previous Drainage Availability
Present Drainage Availability
72.6%
56%
27.4%
44%
Available Not Available
Satisfied Moderately satisfied
Not satisfied
26%
35.2%38.8%
49.6%42.9%
7.5%
Present Drainage condition Previous Drainage condition
Present and Previous Drainage Availability Source: Field Survey, 2011
Present and Previous Drainage condition
Source: Field Survey, 2011
110
In present locations 26.0% respondents were satisfied with their drainage condition
whereas 35.2% were moderately satisfied and 38.8% did not satisfy regarding their
drainage condition. On the other side in previous locations, 49.6% were satisfied,
42.9% were moderately satisfied and only 7.5% did not satisfy considering their

6.7.4.3 Drainage Service Provider: Among government, private and CBO initiatives as drainage service provider, only
government initiatives were reduced from previous locations (46.5%) to present
locations (16.3%). On the other side private initiative increased from 48.4% in
previous locations to 65.3% in present locations. Similarly CBO’s roles being only
5.1% in previous location
6.8 Conclusion:
Though socio economic
only few indicators are considered for data collection.
research supported social scientists’ opinion about consequence of relocation.
Displacement of people from their origin
scientists. For example,
India’s resettlement from 1947 to 1997, examining each of the risk in
found from the research findings
degraded from previous location
about consequence of relocation
have lands but this was reverse
occupation structure was totally changed in present location comparing with previous
0
10
20
30
40
50
60
70
Government
16.3%
Present Drainage service Provider
Figure 6.16: Present and Previous Drainage service Provider
Source: Field Survey, 201
Drainage Service Provider:
Among government, private and CBO initiatives as drainage service provider, only
initiatives were reduced from previous locations (46.5%) to present
locations (16.3%). On the other side private initiative increased from 48.4% in
previous locations to 65.3% in present locations. Similarly CBO’s roles being only
5.1% in previous locations were shown 18.4% in present locations (Figure
ocio economic analysis is a vast issue, in the study, due to time constraints
only few indicators are considered for data collection. Survey findings of this
research supported social scientists’ opinion about consequence of relocation.
Displacement of people from their origin and poverty are linked together by social
For example, Mahapatra (1999) uses ‘Cernea Model’ for evaluation of
India’s resettlement from 1947 to 1997, examining each of the risk in
from the research findings that local people over all socio economic condition
previous location which ultimately supported social scientists opinion
about consequence of relocation. At present most (67.7%) of the local people don’t
have lands but this was reversed in previous locations. Similarly, Local people
occupation structure was totally changed in present location comparing with previous
Government Private CBO
16.3%
65.3%
18.4%
46.5% 48.4%
5.1%
Present Drainage service Provider Previous Drainage service Provider
Present and Previous Drainage service Provider
Source: Field Survey, 2011
111
Among government, private and CBO initiatives as drainage service provider, only
initiatives were reduced from previous locations (46.5%) to present
locations (16.3%). On the other side private initiative increased from 48.4% in
previous locations to 65.3% in present locations. Similarly CBO’s roles being only
Figure 6.16).
is a vast issue, in the study, due to time constraints
Survey findings of this
research supported social scientists’ opinion about consequence of relocation.
and poverty are linked together by social
for evaluation of
India’s resettlement from 1947 to 1997, examining each of the risk in turn. It was
over all socio economic condition
which ultimately supported social scientists opinion
of the local people don’t
Local peoples’
occupation structure was totally changed in present location comparing with previous
Previous Drainage service Provider

112
locations. Likewise, at present locations most of the cases income levels, housing
condition and utility facilities were degraded from previous locations. Here social
network played a vital role. Local people not only moved from their residence but
also were deprived of major potential in original location. Also, most of the local
people lived in rented house in present locations which has an influential role for
their low satisfaction level in housing condition and utility facilities. Table 6.7 shows
the analysis of study findings according to ‘Cernea Model’
Table 6.7: Analysis of study findings according to ‘Cernea Model’
Eight risks after relocation Before Relocation After Relocation
Findings from study area
Landlessness: land would eventually destroy the foundation of productive systems, commercial activities, and livelihoods.
0% landless 67.7% landless In previous, maximum people land ownership between 10-20 katha
Joblessness: The risk of losing wage employment as a result of resettlement is very high among both rural and urban populations.
42.3% involved with agriculture
56.6% people are day labor
Day labor had no fixed income and had no job security.
Homelessness: Many resettlers loss of shelter is only for a temporary period.
100% people had own home
32.3% have home
Maximum local people turned as landless people
Marginalization: Economic marginalization is often accompanied by social and psychological marginalization, which can be identified by resettlers feeling a loss of confidence in themselves and society, a drop in social status, feelings of uncertainty, injustice, and deepened vulnerability
Most of the People income was range between 10,000-15,000
Most of the People income range between 5,000-10,000
Evaluate income range between two locations based on inflation rate
Food Insecurity: Settling displaced people in new locations can increase the risk of temporary or chronic undernourishment as their calorie-protein intake tends to be below the minimum necessary levels for normal growth and work.
Most of the People income was range between 10000-15000
Most of the People income range between 5000-10000
Relocated people in vulnerable condition
Increased Morbidity and Mortality: Massive population relocation can lead to serious declines in the health of
Not considered in this study

113
resettlers as a result of relocation induced social stress, psychological trauma and vector born diseases Loss of Access to Common Property Resources: Loss of access to common property resources that belong to relocated communities can obstruct their income earning activities and in turn deteriorate their household income.
Not considered in this study
Social Disarticulation: Resettlement fragments communities, dismantles patterns of social organization and disrupts informal networks with friends, neighbours etc.
■ 70.6% people lived beside relatives and friends. ■ 73.1% people had involvement with neighborhood organization.
■ 35.7% people lived beside relatives and friends. ■ 36.9% people have involvement with neighborhood organization.
Primary social network described by relatives and friendship networks, secondary social network described by the level of participation in the neighbourhood organizations.
Source: Field Survey, 2011
From overall research findings, it can be said that local people socio economic
condition was ruined at present comparing with previous locations.

114
CHAPTER 7
MAJOR FINDINGS, RECOMMENDATION AND
CONCLUSION
7.1 Introduction:
This chapter summarizes the findings about relocation process and socio economic
condition of the relocated people. In conclusion, some general recommendations are
added regarding local people’s relocation procedure.
7.2 Major Findings from the Study
All the preceding chapters presented alarming picture of forcible relocation of local
people of fringe locality of Dhaka Metro area. If the current trend of relocation
process continues, it would cause a serious social unsustainable condition in fringe
areas of Dhaka City. It is a difficult task to protect the interest of local people in
fringe areas like Dhaka where land is limited and land price is increasing immensely.
The alarming rate of land grabbing by land developers in Dhaka city has made the
policy makers, administrative body, and planners concerned about the issue. Mass
media focused on various reports on that but so far no significant attempts were
applied to prevent the land developers’ illegal activities.
Though relocation process brings a number of disturbances in peoples’ regular life, in
most of the cases this issue is considered as development project based on
government or donor fund. Government projects that are supported by donors are
considered relocation issue from their perspective. For example, Resettlement Plan of
Bhairab Bridge Construction Project carried out accordance with DFID guidelines on
Involuntary Displacement and Resettlement. Similarly Jamuna Multipurpose Bridge
authority prepared their resettlement action plan based on their donor World Bank
‘Involuntary Resettlement’ manual. Private project relocation aspects are not
properly considered regarding Rules and Regulation in Bangladesh. Private
Residential Land Development Rules, 2004 has not served yet the local people who

115
are affected by private land developer’s activities. Similarly, ADP facilitated
Relocation plan is still not approved by Government and this is hanging from the
year 2007.
Local people’s relocation from their origin locations occurred in various ways and
various techniques were applied by land developers. For this reason, the household
surveys were carried out in parallel with reconnaissance survey for better
understanding of relocation process. The survey covered 350 households to collect
data for relocation process from fringe areas. The questionnaire survey was randomly
collected. As original local residents sold their land and relocated in different places,
this research used snowball sampling for questionnaire survey.
Land transformation process is a complex method. From field investigation it was
found that there were mainly four actors who played a vital role for land
transformation process. They are land developers, middleman/muscleman, local
officials and local people. Each actor played precise role in land transformation
process. From field investigation it was informed that four land developers have
specific techniques for transferring local people from their original location.
Most of the local people got their land through inheritance (81.4%) and it was
evident from the field investigation that the people of those areas were not aware of
their rights. So middleman/muscleman and land developers took advantage of the
local peoples’ lack of awareness.
Relocation can be occurred either in voluntary or involuntary process. From field
investigation, it was found that both ways were used by land developers for local
people relocation. Voluntary causes were good land price (16%) and commitment
from developers to get a job (26%). Similarly involuntary causes are family security
(30%), false land documents of disputed piece of land pieces (15%) and
uninhabitable condition created by the developers (13%).
Finally it was informed from field survey that most of the respondents in the sample
survey were not satisfied (79.4%) about their land price that they sold to the land
developers. In most of the cases (48.9%), local muscleman determined the price of
land between land developers and local people. As a consequence local people were

116
deprived from getting real market price and faced serious trouble in collecting land
selling money.
Local people used so many strategies to save their land from developers. Here social
status played an influential role in this process. Most of the respondents (66.3%) in
the sample survey did not try to protect their forcible relocation issues by adapting
any form of social or legal assistance. Here people’s social status, political power,
occupation and rumor have influenced to protect their relocation process.
Local people used their land selling money in various modes. Most of the households
used their land selling money for business purpose (38%). Next significant
percentage was of buying new land (32%) for residential purpose or for cultivation.
There were a number of reasons for selecting relocated place for living by local
people. From field investigation, it was found that job opportunity (33.1%) was the
key consideration when choosing new place for living. It was found from field
survey that most of the people changed their previous occupation after relocation.
The other vital reasons that influenced local people for choosing new place were
adjacent to previous location (9.4%), proximity to city center (4.9%), better transport
facility (3.4%), adjacent to relatives (5.7%) and low house rent (11.1%). From field
survey it was also found that most of the respondents were living in this new place
for three to five years (58.9%).
From the above study, it can be understood that the relocation process is a vast issue
and cannot be defined in a specific way, as it varies from place to place, developer to
developer, people to people, time to time, society to society and so on.
This study also tries to find out the socioeconomic condition of relocated people.
Displacement of people from their origin and poverty are linked together by social
scientists. As socioeconomic is an enormous issue, only few related issues were
discussed in the previous chapter. Due to relocation, land ownership has been
changed in a drastic way in this research. Previously there were no people without
lands. But at present most of the people (67.7%) are landless. Though some people
got the money at a time from the developers by selling their land but most of the
people could not buy lands in any other place for high price of land. From field
117
survey it can be said that at present local people’s occupation is totally changed from
previous. For example, agriculture and labor percentage were dramatically changed
between two periods.
It was found from field investigation that most of the relocated people were not
satisfied with their present housing condition and they had to live in the present
locations without the proper utility facilities such as electricity, sanitation, water and
so on. It was found from field survey that at present 33.7% household house types
were katcha but this percentage were 7.7% in previous locations. Though land
developers are selling their land in high price to higher income groups but original
land owners were dissipated and displaced from their homestead. So, it can be said
without any confusion that the socioeconomic status of the maximum local people is
decreased after relocation.
7.3 Recommendations
This Study briefly recommends some broad steps that need to be considered for
relocation issue. The recommendations are as following:
Good governance is a prime consideration for fringe area development. Adequate
transparency, accountability, decentralization, participation, coordination should
be incorporated for development which are missing in Bangladesh. As a
consequence land developers are exploiting local people’s basic rights and
violating existing laws. Here rule of law should be implemented for encouraging
local people to protect local people’s right. In some of the cases, court had
directed the government to take action against the schemes developed over the
past decade by filling up low-lying wetlands, water bodies, rural homesteads and
croplands. But still there has not been any meaningful progress about this issue.
Private sector relocation issue should be incorporated in all the existing rules and
regulations. The current land laws and regulations, including the Acquisition and
Requisition of Immovable Property Ordinance II (1982), have failed to
adequately address the needs of those affected and displaced. Proposed National
Policy on Resettlement and Rehabilitation (NPRR) is designed to address and
mitigate both “project” and “non-project” induced impacts and displacement with

118
provision for appropriate assistance and rehabilitation. This policy has a multiple
options for resettlement, Payments of compensation, Valuation of assets. But
unfortunately National Policy on Resettlement and Rehabilitation (NPRR) is not
approved by government till now. So National Policy on Resettlement and
Rehabilitation, 2007 should be implemented as soon as possible to protect the
land right of local people. Similarly, Private Residential Land Development
Rules 2004 should be more focused on people’s right. According to Private
Residential Land Development Rules 2004, if the entrepreneur fails to own
maximum 10% of the total land locally for any reason from any land or house
owner (in special case maximum 15% of the total land with the permission of the
committee formed by the government), can propose for land acquisition through
the law. But here government officials have no role to justify developer’s claim
in field level. Land project approved from RAJUK should be properly monitored,
so that land developers would have no chance to take illegal procedure for plan
approval. At the same time, it should be prerequisite that people relocation
procedure should be mentioned properly in proposal level by land developers.
Local people participation should be encouraged in local level planning. Because
stakeholders’ participation can make a fertile ground for good governance and
can be a potentially useful vehicle to enhance the quality of governing system in
land management in root level. Land readjustment tools have a good chance for
fringe area’s proper development by people participation. These tools should be
encouraged where both land developers and local people can directly participate
for residential area development. Local officials should also have a part in this
process.
Lastly mass media can play a vital role for increasing people’s awareness about
land developers’ activities so that any unwanted situation can be minimized.
From field survey, it was observed that a huge number of people are not well
aware of developers land grabbing process. Land developers’ hidden activities
should be exposed by media.

119
7.4 Conclusion
Local people relocation is a complex issue. This study has unfolded the procedure of
local people relocation in Dhaka City. Land developers with the help of local
musclemen and local officials used many techniques to buy land from local people.
Both voluntary and involuntary procedures were used for relocation. About 3920
household relocated because of four land projects. Though this research outcome
clearly shown that maximum local people were displaced from their original location
through involuntary procedure. This research also identified socio economic
condition of relocated people. The research shows that overall socio economic
conditions of local people were inferior comparing with previous locations which
ultimately supported social researcher’s opinion [2][30] about negative effect of
relocation. A proper relocation process should follow some strategies such as,
conceptual model of Thayer Scudder (2005). Scudder (2005) describes that
relocation procedure should follow four stages. But from field investigation, it was
found that four land developers had different techniques for acquiring local people
land without considering the right of the local people. Land developers had followed
their own strategies. Social status, political involvement and educational background
of local people influenced developer to select their strategies.
As a developing country’s capital city, Dhaka has no option to exclude private
developer’s activities in housing sector where government initiative has very limited
scale. But alarming reports is that urban fringe is predominantly used for capital and
asset accumulation of powerful actors and relocating people from their original
location. So this issue should be properly mentioned and revised in existing rules and
regulation for protecting local people’s right. Similarly Proposed National Policy on
Resettlement and Rehabilitation (NPRR) should be implemented as soon as possible.
From research findings, it can be said that family security (30%) was the prime cause
for people relocation. For this reason rule of law should be developed for improving
people safety and security. For proper development, land readjustment scheme can be
used where both parties (local people and land developers) have a chance to gain
benefit from housing development. This study findings and recommendations must
be disseminated and implemented in Rules and Regulations by the Government to
protect local people’s land precisely. Similarly, this research opens a vast field of

120
study for the future researchers to work on private developer’s relocation issues in
different perspective as like environmental impacts, proper relocation procedure,
common property resources, food insecurity and so on.

121
REFERENCE
[1] Adesina, A., “Socio-Spatial Transformations and The Urban Fringe Landscape In Developing Countries,” in United Nation University Institute For Environment And Human Security (UNU-UHS) Summer Academy On Social Vulnerability And Resilience Building In Mega city, July 2007, Germany, (2007). [2] Ahsan, Md., Involuntary Resettlement in Jamuna Bridge Project: Impoverishment Risks and Reconstruction Measures, unpublished MDS Thesis, Development Studies Program, BRAC University, Dhaka, Bangladesh, 2007. [3] Arku, G., “Rapidly Growing African Cities Need to Adopt Smart Growth Policies to Solve Urban Development Concerns,” Urban Forum, 2009. [4] Authority, J. M. B., “Revised Resettlement Action Plan”, Jamuna Multipurpose Bridge Authority, Dhaka, 1993.
[5] Bank, A. D., “Handbook on Resettlement: A Guide to Good Practice,” Asian Development Bank, Manila, 1998. [6] Bank, W., “Social Issues in Bank Financed Project with Involuntary Resettlement”, World Bank, Washington DC, 1980. [7] Bari, F.M., and Hasan, M., “Effect of Urbanization on Storm Runoff Characteristics of Dhaka City,” Tsinghua University Press, XXIX IAHR Congress, Beijing, 2001. [8] Bank, W., “World Development Report 2000/2001,” The World Bank, Washington DC, 2002. [9] Bourdieu, P., “The Forms of Capital,” In Halsey, A., Lauder, H., Brown, P. and Wells A., (Eds) Education: Culture, Economy and Society, Oxford University Press, Oxford, 1998. [10] Bindha, T., “Land Utilization and Urbanization the Rural-Urban Fringe,” Delhi, India, 1991. [11] Bank, W., “Safer Homes, Stronger Communities: A Handbook for Reconstructing after Natural Disasters,” World Bank, Washington DC, 2010. [12] Burdge, R.J., “The Concepts, Process and Methods of Social Impact Assessment,” Social Ecology Press, Wisconsin, 2004. [13] Bank, A. D., “Involuntary Resettlement Safeguards Evaluation study,” Asian Development Bank, 2006.

122
[14] Bank, W., “Operations Policy Issues in the Treatment of Involuntary Resettlement Operational Policy Note 10.08,” The World Bank, Washington DC, 1986. [15] Bank, W., “Operational Directive 4.30: Involuntary Resettlement,” The World Bank, Washington DC, 1990. [16] Branch, K., and Hooper, D.A., “Thompson, J. and Creighton, J., Guide to Social Assessment: A Framework for Assessing Social Change,” West view Press, London, 1984. [17] BBS, “Population and housing census 2011 socio-economic and demographic report,” Bangladesh Bureau of Statistics, Statistics and Informatics Division (SID), Ministry of Planning, Government Republic of Bangladesh, Dhaka, 2012. [18] Bromley, R., “Working in the Streets of Cali, Colombia: Survival Strategy, Necessity, or Unavoidable Evil?” In Gugler, J., (Eds.) Cities in the Developing World –Issues, Theory and Policy, Oxford University Press, Oxford, pp. 124-138, 1997. [19] Blaikie, P., Cannon, T., and Wisner, B., "At Risk, People’s Vulnerability and Disasters," Rutledge, London and New York, 1994. [20] Bank, W., "Safer Homes, Stronger Communities: A Handbook for Reconstructing after Natural Disasters,” World Bank, 2010.
[21] Brown, H., “Man and his Environment: A Psychological Introduction, in city as a social system,” urban Development unit, Open University press, Bletehley, pp.13-43, 1973.
[22] Beall, J., & Fox, S., “Cities and Development,” Routledge, London, 2009.
[23] Coulthard, M., Walker, A., and Morgan, A., “People’s perceptions of their Neighbourhood and community Involvement,” National Statistics Publication, London, 2002.
[24] Cernea, M., “Risks, Safeguards and Reconstruction: A Model for Population Displacement and Resettlement,” The World Bank, Washington D.C., 2000.
[25] Coleman, J. S., “Social Capital in the Creation of Human Capital,” In Halsey, H., Lauder, H., Brown, P., and Wells, A., (Eds). Education: Culture Economy and Society, Oxford University Press, Oxford, 1998.
[26] Carney, D., “Sustainable Rural Livelihoods: What Contribution Can We Make,” Department for International Development, UK, 1998.
[27] Clark, D. A. L., “Environmental Challenges to Urban Planning: Fringe areas, Ecological Footprints and Climate Change. Key Challenges in the Process of Urbanization in Ho Chi Minh City,” Governance, Socio-Economic, and Environmental Issues, Vietnam, 2009.

123
[28] Cernea, M. M., “Involuntary Resettlement in Development Projects. Policy Guidelines for World Bank Financed Projects,” The World Bank, Washington DC, 1998.
[29] Correspondent, “Victims protest land grabbing by Bashundhara Form human chain at Keraniganj,” The Daily Star, Dhaka. Bangladesh, 2009.
[30] Cernea, M. M., “The Need for Economic Analysis of Resettlement: A Sociologist’s View,” The World Bank, Washington DC, 1999.
[31] Cohen, B., “Urbanization in developing countries: current trends, future projections, and key challenges for sustainability,” Technology in Society, p.28 & pp. 63–80. 2006.
[32] Cheema, G., “The Challenge of Urban Management: Some Issues” in Chemma, G. and Ward, S. (eds.), Urban Management Policies and Innovations in Developing Countries. London, 1993.
[33] DFID, “Sustainable Livelihood Guidance Sheets,” Department for International Development, London, 1999.
[34] DEAT, “Socio-Economic Impact Assessment, Integrated Environmental Management Information,” Series 22, Department of Environmental Affairs and Tourism (DEAT), Pretoria, South Africa, 2006.
[35] Farrington, J., Ramasut, T. and Walker, J., “Sustainable Livelihood Approach in Urban Areas: General Lessons with Illustrations from Indian Cases”, Swedish International Development Cooperation Agency, Department for Infrastructure and Economic Cooperation, Sweden, 2002.
[36] Fatema, R., Analysis of land Suitability for Urban development in the Easter fringe area of Dhaka city: An application of Multicriteria Evaluation Technique, MURP Thesis, Department of Urban & Regional Planning, Bangladesh University of Engineering and Technology (BUET), Dhaka, Bangladesh, 2003.
[37] Fernandes, N, Das, J.C., and Rao, S., “Development and Rehabilitation: An Estimate of Extent and Processes”, in W. Fernandes and E. Ganguli-Thukral (eds.), Development, Displacement, and Rehabilitation, Indian Social Institute, New Delhi, 1989.
[38] Fernando, Nishara., Forced relocation after the indian ocean tsunami, 2004:Case study of vulnerable populations in three relocation settlements in galle, Sri lanka, PhD Thesis, Institute of Geography, University of Bonn, Colombo, Sri Lanka, 2010.
[39] Farrington, J., Ramasut, T., and Walker, J., “Sustainable Livelihood Approach in Urban Areas: General Lessons with Illustrations from Indian Cases”, Swedish International Development Cooperation Agency, Department for Infrastructure and Economic Cooperation, Sweden, 2002.
[40] Government of the People’s Republic of Bangladesh & Asian Development Bank, “National Policy on Resettlement and Rehabilitation”, Dhaka, 2007.

124
[41] Haque, M. J., Impact of Private Land Development on the Environment of the Eastern Fringe area of Dhaka, Phd Thesis, Department of Urban & Regional Planning, Bangladesh University of Engineering and Technology (BUET), Dhaka, Bangladesh, 2004.
[42] Haque, A.N., Climate Change Adaptation assessment: A Case Study of the Eastern Fringe of Dhaka, Bangladesh, MSc Thesis, Department of Urban Management and Development, Netherland, 2010.
[43] Haque, K. N.H., “The political Economy of Urban Space: Land and Real Estate in Dhaka City,” Institute of Governance Studies, BRAC University, Bangladesh, 2012.
[44] Hindmarsh, R., “The need for effective assessment: Sustainable development and the social impacts of biotechnology in the Third World,” Environmental Impact Assessment Review, 1990.
[45] Hardoy, J., “Environmental Problems in an Urbanized World. Finding Solutions for Cities in Africa, Asia and Latin America,” London, 2001.
[46] Islam, I., “Wetlands of Dhaka Metro Area: A study from social, Economic & Institutional perspectives,” A H Development Publishing House, Dhaka, Bangladesh. 2009.
[47] Islam, N., “The Bangladesh situation in urban management capacity CUS Bulletin on Urbanization and Development, No. 24 and 25,” Center for Urban Studies, Dhaka, Bangladesh, 1993.
[48] IRIN (UN Office for the Coordination of Humanitarian Affairs) (2006). Nigeria: Lagos, the mega-city of slums. Accessed February 8, 2008, from http://www.energypublisher.com/article.asp?id=5307.
[49] Inter organizational Committee on Principles and Guidelines for Social Impact Assessment, “US Principles and Guidelines – Principals and guidelines for social impact assessment in the USA,” Social Ecology Press, Wisconsin, 2004.
[50] Kashem, M. S. B., and Hafiz, P. D. R., "Sustainability of Development Trends in the Urban Fringe: A Case Study on North-Eastern Dhaka City," Protibesh, Volume 12, Issue 2 pp. 55-67 Dhaka, Bangladesh, 2008.
[51] Khatun, H., "Development Induced Displacement and Rehabilitation In Bangladesh: Challenges and Perspectives," Oriental Geographer, Vol 49. No.2, 2005.
[52] Lobo, L., and Kumar, S., “Land Acquisition, Displacement and Resettlement in Gujrat: 1947-2004,” SAGE publication, Delhi, India, 2009.
[53] Logan, J., and H. Molotch., “Urban Fortunes: The Political Economy of Place,” University of California Press, Berkley, 1987. [54] Lasgorceix, A., and Kothari, A., “A Synthesis and Analysis of Case Studies,” Economic & Political Weekly, 2009.

125
[55] Malan, L., “Social Impact Assessment Basics. International Association of Impact Assessment Workshop,” CSIR, Pretoria, 2001. [56] Mahmud, Md. Akter., “Corruption in Plan Permission Process in RAJUK: A Study of Violations and Proposals,” Transparency International Bangladesh, Dhaka, 2007. [57] Masum, Fahria., “Urban Fringe Management and Role Of Good Governance: Integrating Stakeholders in Land Management Process,” in 7th FIG Regional Conference, Hanoi, Vietnam, 19-22 October 2009. [58] McDowell, C., “Involuntary Resettlement, Impoverishment Risks and Sustainable Livelihood,” Australian Journal of Disaster and Trauma Studies, 2002.
[59] Mahapatra, LK., “Testing the Risks and Reconstruction Model on India’s Resettlement Experience” In M. Cernea (ed.) The Economics of Involuntary Resettlement: Questions and Challenges, Washington, DC, The World Bank, 1999.
[60] Neuman, Lawrence., “Social Research Methods Qualitative and Quantitative Approaches,” Allyn and Bacon, USA, 1997.
[61] Oxford Dictionary, “Oxford (9th Ed.),” Oxford University Press, 1995.
[62] Perry, R., and Lindell, M., “Principles of Managing Community Relocation Hazard Mitigation Measure,” Journal of Contingencies and Crisis Management, Vol. 5(1), pp. 49-59, 1997.
[63] Pearce, D., “Methodological Issues in the Economic Analysis for Involuntary Resettlement Operations,” The World Bank, Washington DC, 1999.
[64] Pokharel, J. C., “Population Displacement and Compensation Planning in Kulekhani Hydro-Electric Project, Nepal,” in Hari Mohan Mathur (ed). op. cit. pp. 139-150, 1995.
[65] Ramaiah, S., “Health Implications of Involuntary Resettlement and Rehabilitation in Developmental Projects in India”, Society for Health Education and Learning Packages, Vol.01, New Delhi, India, 1995.
[66] RAJUK and Ministry of Housing and Public Works, “Preparation of Detailed Area Plan for Dhaka Metropolitian Development Planning (DMDP),” Rajdhani Unnayan kartripakkha, Dhaka, 2010.
[67] Roy, S., A Study on Private Residential Land Development Activities in Dhaka and their Compatibility with DMDP Structure plan (1995-2015), MURP Thesis, Department of Urban & Regional Planning, Bangladesh University of Engineering and Technology (BUET), Dhaka, Bangladesh, 2007.
[68] Rakodi, C. and Lloyd- Jones T. (Eds.), “Urban Livelihoods – A People Centred Approach to Reducing Poverty,” Earthscan Publications Limited, London, 2002.
[69] Scudder, T., “The Future of Large Dams: Dealing with Social, Environmental and Political Costs,” Earthscan Publications Limited, London, 2005.

126
[70] Sorensen, B., “Relocated Lives: Displacement and Resettlement within Mahaweli Project,” VU University press, Sri Lanka, 1996.
[71] Scoones, I., “Sustainable Rural Livelihoods: A Framework for Analysis. Institute for Development Studies, ” University of Sussex, 1998.
[72] Sinha, R. L. P., “Fringe: Approaches and Policy Options,” ITPI Journal, 1997.
[73] Shi, Guoqing and Hu, W., “Comprehensive Evaluation and Monitoring of Displaced Persons Standards of Living and Productions,” Hohai University, Nanjing, China, 1994.
[74] Shi, Guoqing., Qing, S., and Songling, Y., “Risks Control and the Design of a Social Security System for Resettlers: A Case Study in Xiaolangdi Reservoir Resettlement in China,” in International Conference on Resettlement and Social Development, China, (2002).
[75] Siddique, K., “Social formation of Dhaka City- A study in Third World Urban Society”, Dhaka University Press Limited, 1991.
[76] Tawhid, K. G., Causes and Effects of Water Logging in Dhaka City, Bangladesh, Master thesis, Department of Land and Water Resource Engineering, Royal Institute of Technology, Stockholm, 2004.
[77] The Daily Star, “Wrongly Set-up Pillars: Fresh grabbing narrows Turag, ” The Daily Star, 28 December, 2011. [78] Turton, D., “Who is a Forced Migrant? In: De Wet, C. J., (Ed.): Development-Induced Displacement: Problems, Policies and People,” Berghahn books, Oxford, 2006.
[79] UNOCHA (1998) “Guiding Principles on Internal Displacement”, URL: http://www.unhchr.ch/html/menu2/7/b/principles.htm accessed on 6th November 2010.
[80] Uddin, A.K.M. Riaz, “Strengthening the Role of Private Sector Housing in: Bangladesh Economy: The Policy Challenges,” Report No. 64, Centre for Policy Dialogue (CPD) and Real Estate and Housing Association of Bangladesh (REHAB), Dhaka, Bangladesh, 2003.
[81] Werellagama, D., Jeyavijithan, V., Manathunga, J. and Nakayama, M. (2004) “Lessons Learned from Communities Displaced by the Mahaweli Multipurpose Development Project SriLanka”,URL:http://www.wrrc.dpri.kyotou.ac.jp/~aphw/APHW2004/proceedings/LFP/56-LFP-A364/56-LFP-A364.pdf accessed on 5th November 2010. [82] Yan, T., and Qian, W., “Rural Resettlement and Land Compensation in Flooded Areas: The Case of Three Gorges Project, China,” Asia Pacific Viewpoint, Vol. 44(1), pp. 35-50, 2003.
[83] Yuefang, D. and Steil, S., “Three Gorges Project Resettlement: Policy, Planning and Implementation,” Journal of Refugee Studies, Vol.16, pp. 422-443, 2003.

127
[84] Zaman, Q., “Development and Displacement in Bangladesh,” Asian Survey, XXXVI, pp. 691-703, 1996.

128
SL Indicators Data source
1 For how long period you had been staying at your previous/ original place of settlement?
Duration of living original place of settlement
Questionnaire survey
2 Who made the decision for relocation? Relocation determining factor
Questionnaire survey
3 Why did you take the decision of relocation?
Influence for relocation
Questionnaire survey
4 How much you owned previously and how much you sold?
Amount of land previously owned and sold
Questionnaire survey
5 Through what procedure did you sell the land?
Selling procedure Questionnaire survey
6 What was the selling price and cost price of the previous land?
Purchase and sale price of previous land
Questionnaire survey
7 Who fixed the price of land? Price determinant Questionnaire survey
8 Were you satisfied with the price of land?
Satisfaction of selling price
Questionnaire survey
9 Did you take the whole money together? Money receiving procedure
Questionnaire survey
10 In which mode did you utilize the money received after sell?
Utilization of money Questionnaire survey
11 How many times you as local people had encountered pressure of forcible relocation
No. of times for being pressured
Questionnaire survey
12 Did you try to protect the forcible relocation issues by adopting any form of social/ legal assistance?
Protective measures Questionnaire survey
13 How long are you staying in the new place?
Duration of stay in new place
Questionnaire survey
14 Who contributed in the decision of your choice regarding the new areas of living?
Influencing personnel
Questionnaire survey
APPENDICES
Appendix –A
List of indicators, data type and data source

129
Objective 2: To study the present status of relocated people and to assess their socio-economic impact due to relocation.
15 Why have you choose this place? Causes to choose the new place
Questionnaire survey
16 What is the distance from original place?
Distance from original location
Questionnaire survey
17 How much is the amount and price of new land?
New land particulars Questionnaire survey
Socio-economic
Indicators Data source
Present & previous Housing condition.
Questionnaire
Survey
Present and previous access to services (water
supply, power and sanitation)
Present & previous Social network.
Primary social network: Kinship & friendship
network in the neighborhood.
Secondary social network:
Involvement with neighborhood organization
Present & previous Occupation
Present & previous Income & expenditure
Present & previous Land ownership

130
Appendix –B
Questionnaire for original resident in selected land development projects
STUDY OF RELOCATION PROCESS AND ITS SOCIO ECONOMIC IMPACTS ON
LOCAL PEOPLE DUE TO PRIVATE HOUSING PROJECTS IN EASTERN
FRINGE OF DHAKA
ID No……………………. Date & Time :…………………….
Name of the Respondent:
1. What is your present address: (a) Village/ Area/ Road:……………………………………
(b) Ward/Union:………………………….(c) District:……………………………………..
2. How long do you have been in this area?..................................
3. How long did you have been in your previous/ original place? ……………(Year)
4. What is the distance between existing and original place?………………….(km)
5. What is your Present & Previous Land Ownership?
6. How did acquire your previous land?
a) By inheritance
b) By Purchase
c) By gift
d) By others (pls specific)……………………
7. What is the amount and price of new land?
Present Land ownership (katha) Previous Land ownership (katha)
New land Size (Katha) New land price (BDT)

131
8. Why do you have chosen this place for living? (Please tick)
9. Did the whole family shift in the new place?
Yes No
10. What is your Present & Previous Occupation?
Present Occupation Previous Occupation Code
(1) Agriculture (2) Labour (3) Govt. service (4) Private Service (5) Business (6) Unemployment (7) Small business (8) Overseas employee (9) Others (Specific)
11. What is your Present & Previous Income?
Present Income (BDT) Previous Income (BDT)
12. What is your present resident status?
(a) Own home (b) Tenant (c) Others (pls specific)……………………
Low land price
Proximity to city center
Adjacent to previous location
Better transport facility
Adjacent to relatives
Job opportunity
Family members educational purpose
Security
Others (Pls specific)

132
13. What is your Present & Previous Housing Condition?
14. What is your level of satisfaction regarding your present and previous housing condition?
(Please tick)
14. What is your Present & Previous Utility service condition? (Please tick)
Present Housing Condition
Previous Housing Condition
House Type Use Code
House Type Use Code House Type
Use Code 1) Katcha 1) Residential
2) Semi Pucca
2) Commercial
3) Pucca 3) Mixed
4) Cultivated
Level of Satisfaction
Present Housing Condition Previous Housing Condition
(a) Satisfied (b) Moderately satisfied (c) Not satisfied
(a) Satisfied
(b) Moderately satisfied
(c) Not satisfied
Present Utility service condition
Utility service Available Not available Service Standard
Good Moderate Bad
Electricity
Water Supply
Gas
Drainage

133
16. Who are the providers of utility services?
Previous Utility Service condition
Utility service Available Not available Service Standard
Good Moderate Bad
Electricity
Water Supply
Gas
Drainage
Present Utility Service Provider
Electricity Water Supply Gas Drainage
Government
Private
NGOs
CBO
Others……………..
Previous Utility Service Provider
Electricity Water Supply Gas Drainage
Government
Private
NGOs
CBO
Others……………..
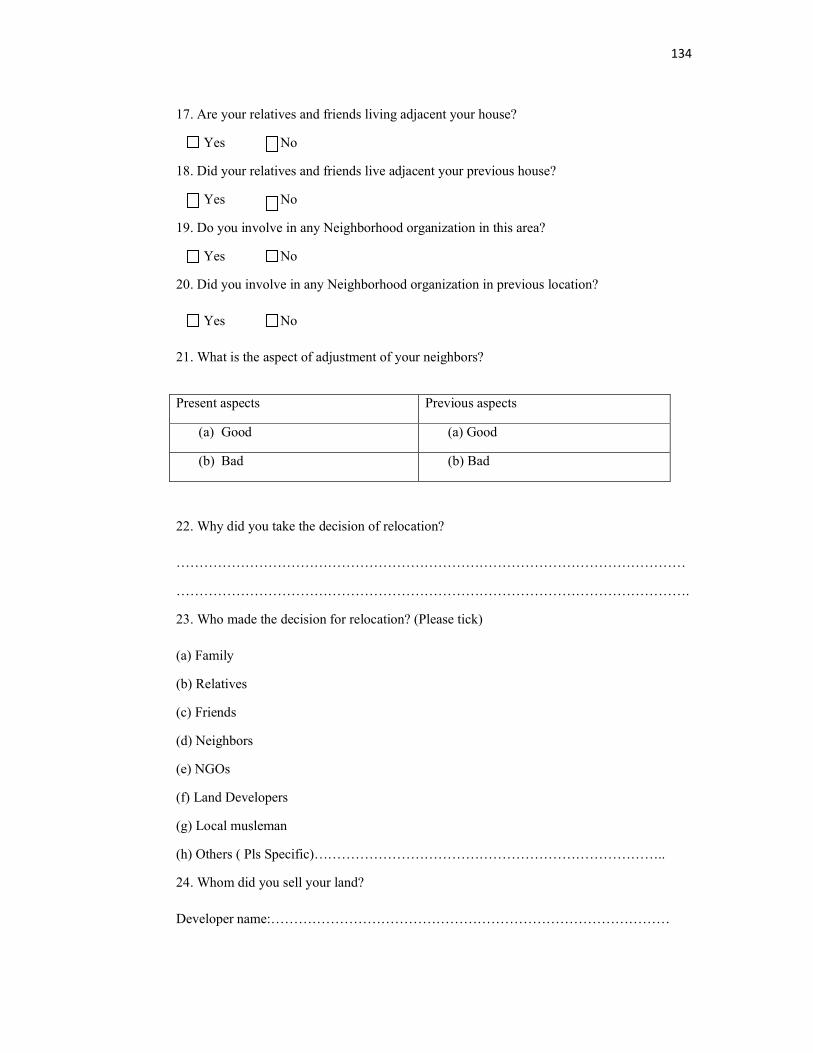
134
17. Are your relatives and friends living adjacent your house?
Yes No
18. Did your relatives and friends live adjacent your previous house?
Yes No
19. Do you involve in any Neighborhood organization in this area?
Yes No
20. Did you involve in any Neighborhood organization in previous location?
Yes No
21. What is the aspect of adjustment of your neighbors?
22. Why did you take the decision of relocation?
…………………………………………………………………………………………………
………………………………………………………………………………………………….
23. Who made the decision for relocation? (Please tick)
(a) Family
(b) Relatives
(c) Friends
(d) Neighbors
(e) NGOs
(f) Land Developers
(g) Local musleman
(h) Others ( Pls Specific)…………………………………………………………………..
24. Whom did you sell your land?
Developer name:……………………………………………………………………………
Present aspects Previous aspects
(a) Good (a) Good
(b) Bad (b) Bad
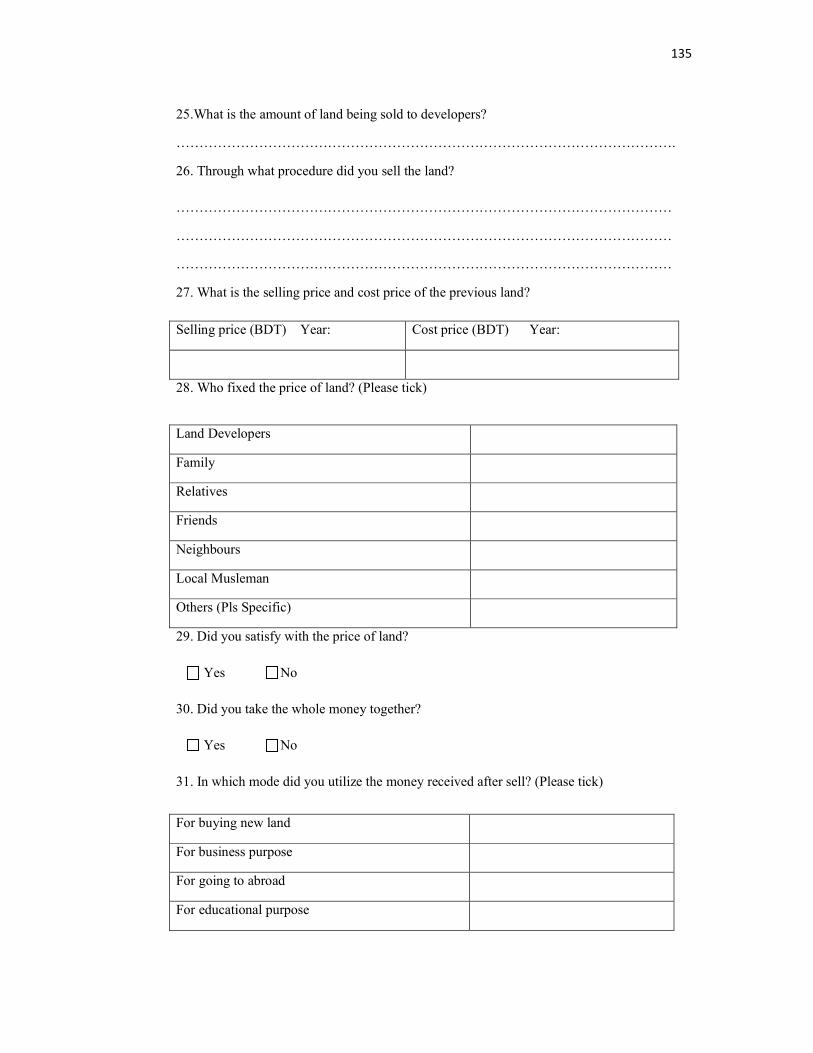
135
25.What is the amount of land being sold to developers?
……………………………………………………………………………………………….
26. Through what procedure did you sell the land?
………………………………………………………………………………………………
………………………………………………………………………………………………
………………………………………………………………………………………………
27. What is the selling price and cost price of the previous land?
28. Who fixed the price of land? (Please tick)
29. Did you satisfy with the price of land?
Yes No
30. Did you take the whole money together?
Yes No
31. In which mode did you utilize the money received after sell? (Please tick)
Selling price (BDT) Year: Cost price (BDT) Year:
Land Developers
Family
Relatives
Friends
Neighbours
Local Musleman
Others (Pls Specific)
For buying new land
For business purpose
For going to abroad
For educational purpose

136
32. How many times did you as local people have encountered pressure of forcible
relocation?……………………………………………………………………………………
…
33. Did you try to protect the forcible relocation issues by adopting any form of social/ legal assistance? If yes please mention
………………………………………………………………………………………………….
………………………………………………………………………………………………….
…………………………………………………………………………………………………
34. Were your relatives / friends/ neighbors forced for relocation? If yes mention number and relocated new place?
………………………………………………………………………………………………….
………………………………………………………………………………………………….
35. Do you know the rules and regulation regarding relocation in Bangladesh?
Yes No
36. What is the feeling/view as local people regarding the relocation process in the eastern
fringe area of Dhaka City?
………………………………………………………………………………………………….
………………………………………………………………………………………………….
………………………………………………………………………………………………….
Duration of Interview: :
For family purpose
Others (Pls specific)
………………………….
Signature of Interviewer

137
Appendix –C
Case Study Format:
Introduction Key
Components:
• Thank you
• Your name
• Purpose
• Confidentiality
• Duration
• How interview
will
be conducted
• Opportunity for
questions
• Signature of
consent
I want to thank you for taking the time to meet with me today.
My name is S.M. Shah Mahmood and I would like to talk to
you about your experiences regarding relocation.
The interview should take less than an hour. I will be writing
the session because I don’t want to miss any of your comments.
All responses will be kept confidential. This means that your
interview responses will only be shared with teachers and will
ensure that all information will be included for thesis report
only. Remember, you don’t have to talk about anything you
don’t want to and you may end the interview at any time. Are
there any questions about what I have just explained? Are you
willing to participate in this interview?
…………………………………..
Interviewee
Questions
• No more than
15 open-ended
questions
• Use probes as
needed
1. For how long period you had been staying at your previous/
original place of settlement?
2. Would you tell what happens about your relocation?
3. Would you tell about your previous land selling procedure?
4. In which mode did you utilize the money received after
sell?
5. Could you elaborate your activities regarding protect
relocation?
6. Would you tell about reason behind for chosen this place?
7. Would you tell me about your Present & previous Housing
condition?
8. Can you compare your Present and previous access to
services (water supply, power and sanitation)?
9. Would you tell about your Present & previous Social
network?
10. Would you tell about your Present & previous Occupation

138
Appendix –D
Photographs regarding developer land grabbing news in media:
status?
11. Would you tell about your Present & previous Land
ownership?
Closing Key
Components:
• Additional
comments
• Thank you
Is there anything more you would like to add?
Thank you for your time.
Source: The Daily Sokalar Khobor Source: The Daily Star
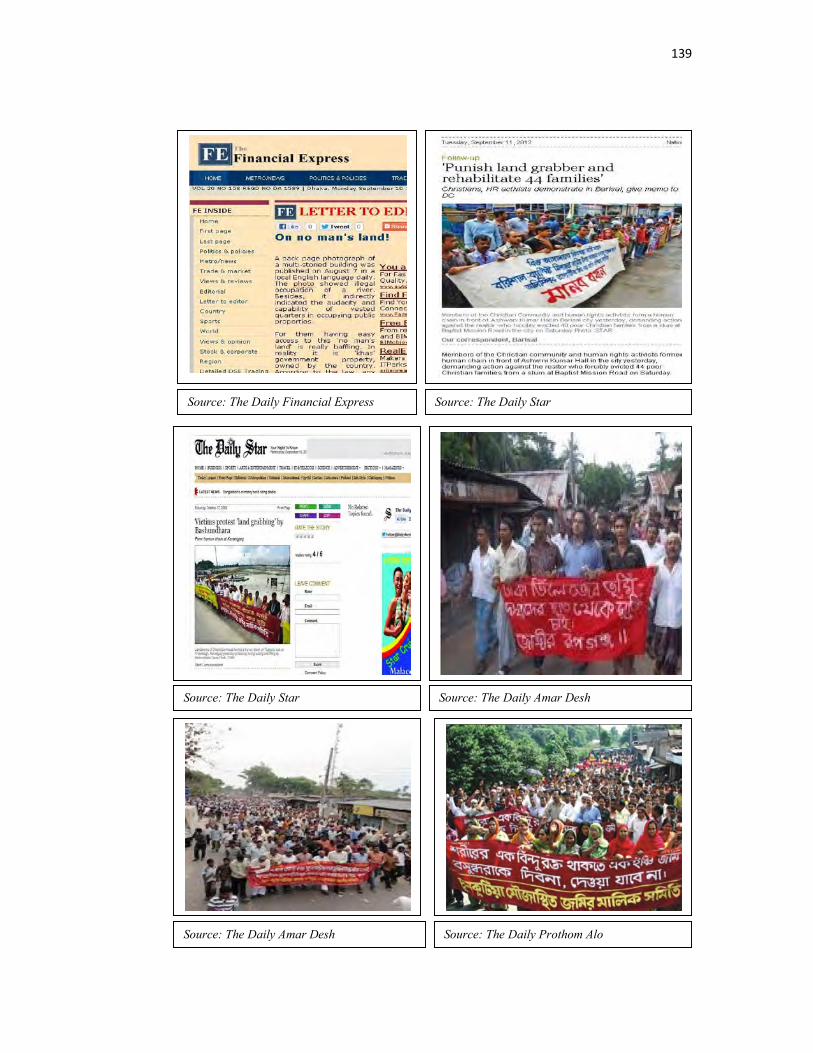
139
Source: The Daily Financial Express Source: The Daily Star
Source: The Daily Star Source: The Daily Amar Desh
Source: The Daily Amar Desh Source: The Daily Prothom Alo

140
Source: The Daily Star
Source: The Daily Star
Source: The Daily New Age
Source: The Daily New Age
Source: The Daily Star

141
Source: The Daily Star
Source: The Daily Star
Source: The Daily Star

142
Appendix –E
Survey picture:

143
Appendix –F
Registered 77 land developers name and registration number under Private
Residential Land Development Rules, 2004:
Serial no
Registration no Promoter name Apply Date Registration given Date
01. RD No-001 Concord Condominium Ltd.
23.05.04 08.07.04
02. RD No-002 Capital Land Development Ltd.
19.05.04. 08.07.04
03. RD No-003 Concord Lands Ltd. 19.05.04 08.07.04 04. RD No-004 Metro Makers &
Developers Ltd. 13.05.04 08.07.04
05. RD No-005 Concord Real-state Building Products Ltd.
07.06.04 08.07.04
06. RD No-006 Shades Properties Ltd. 08.07.04 07. RD No-007 Jenoveli Model Town
(Pvt) Ltd. 19.05.04 08.07.04
08. RD No-008 Neptune Land Development Ltd.
19.05.04 08.07.04
09. RD N o-009 Northern Holdings Ltd. 18.05.04 08.07.04 10. RD No-010 Concord Real-state &
Development Ltd. 30.05.04 08.07.04
11. RD No-011 Concord Entertainment Com. Ltd.
11.05.04 08.07.04
12. RD No-012 Bangladesh Development Com. Ltd.(BDC)
02.06.04 -
13. RD No-013 Bangladesh Infrastructure & Roads Development Ltd (BIRD)
02.06.04 -
14. RD No-014 Century Reality Ltd. 25.05.04 - 15. RD No-015 Bonani Property
Development (Pvt) Ltd. 25.05.04 -
16. RD No-016 East West Property Development (Pvt) Ltd.
23.05.04 08.07.04
17. RD No-017 Concord Architects & Interior Décor Ltd.
09.05.04 20.07.04
18. RD No-018 Eastern Housing Ltd. 07.06.04 24.08.04 19. RD No-019 Arshinogor Development
Society. 11.09.04 05.02.05
20. RD No-020 Darul Islam Housing Ltd. 11.09.04 05.02.05 21. RD No-021 Sharif Housing Com. Ltd. 14.07.04 15.02.05 22. RD No-022 Jamuna Builders Ltd. 06.03.05 23. RD No-023 Amin Mohammad Plants
Development Ltd 30.03.05
24. RD No-024 Navana Real-state Ltd 18.07.04 02.02.05 25. RD No-025 Rupayan Housing State 30.03.05

144
Ltd 26. RD No-026 Paiyoniar Holdings Ltd. 10.06.04 11.04.05 27. RD No-027 Notun dhara Housing
Com. Ltd. 02.05.05
28. RD No-028 Shan Holdings Ltd. 01.07.04 07.05.05 29. RD No-029 Shah-jalal Lake View
Housing (Pvt) Ltd. 09.08.04 17.05.05
30. RD No-030 Reliance Development Associates Ltd.
26.08.04 29.05.05
31. RD No-031 M.A. Ohab Properties Ltd. 29.10.04 17.05.05 32. RD No-032 Mission Energy &
Properties Ltd. 11.06.06 .04.12.04
33. RD No-033 North-South Housing (Pvt) Ltd.
18.12.06
34. RD No-034 Ashian Lands Devt. Ltd. 19.04.06 09.04.07 35. RD No-035 Pacific Real Ltd. 28.08.05 09.04.07 36. RD No-036 N.M. Housing Ltd. 24.11.04 12.11.07 37. RD No-037 Lake-hurt Apartment Ltd 12.02.05 17.04.07
38. RD No-038 Vulua Royal City (Pvt) Ltd.
23.07.06 12.04.07
39. RD No-039 Urban Property Devt. Com. (Pvt) Ltd
20.09.06 24.04.07
40. RD No-040 Nobodoy Housing Ltd. 05.11.06 25.04.07 41. RD No-041 Shotabdi Housing Ltd. 20.04.05 30.04.07 42. RD No-042 Memsons International 13.02.06 23.05.07 43. RD No-043 Great wall Land Property
Ltd. 05.10.06 11.07.07
44. RD No-044 Bishash Builders Ltd. 05.04.07 09.08.07 45. RD No-045 Hamid Real-state
Construction Ltd. 09.04.06 08.10.07
46. RD No-046 Prianka Trading Ltd. 21.11.04 08.10.07 47. RD No-047 Hazi Gofur Land
Developers Ltd. 28.06.06 09.10.07
48. RD No-048 M.N.H. Real state Ltd. 29.08.07 02.01.08 49. RD No-049 Dokhina Real-state (Pvt)
Ltd. 21.10.04 03.01.08
50. RD No-050 Ecub Housing Com.(Pvt) Ltd.
18.09.07 07.01.08
51. RD No-051 Sheltec (Pvt).Ltd. 20.07.07 09.01.08 52. RD No-052 Configure Housing Ltd. 15.11.07 10.01.08 53. RD No-053 East Baridhara Housing
Ltd 13.02.08
54.
RD No-054
Diamond Vali Homes Ltd 08.10.07
18.02.08
55. RD No-055 Hira-zhil Property Devt.(Pvt) Co. Ltd.
02.01.07 25.02.08
56. RD No-056 Uttoron Properties Ltd. 11.05.07 08.04.08 57. RD No-057 Share & Care Developers
Ltd. 04.03.08 02.06.08
58. RD No-058 Darul Makan Housing 18.03.08 15.06.08

145
Ltd. 59. RD No-059 Anwar Real-state (Pvt)
Ltd. 12.06.08 30.07.08
60. RD No-060 Ashaloy Housing & Developers Ltd.
19.06.08 19.08.08
61. RD No-061 Nasim Real-state Ltd. 06.08.08 20.08.08 62. RD No-062 Haveli Property Devt.Ltd. 07.09.08 29.01.09 63. RD No-063 Inspired Devt. Ltd. 07.09.08 29.01.09 64. RD No-064 Onnodhara Consotium
(Pvt) Ltd. 16.11.08 29.09.09
65. RD No-065 BDDL Notun dhara Housing Ltd.
02.12.08 21.02.09
66. RD No-066 Care-i Ltd. 01.02.06 09.02.09 67. RD No-067 Q.C Holdings Ltd. 12.04.09 20.04.09 68. RD No-068 Tanshir Properties Ltd. 05.05.09 06.07.09 69. RD No-069 Noman Properties Ltd. 20.04.09 18.08.09 70. RD No-070 Bangladesh Export &
Import Ltd. 26.04.09 03.09.09
71. RD No-071 Tanin Kunjo Housing Prokolpo Ltd.
20.12.09 13.09.09
72. RD No-072 Safa-Maroa Housing Ltd. 10.04.08 13.09.09 73. RD No-073 Sobuz –Saya Abashon
Project Ltd. 23.04.09 16.09.09
74. RD No-074 S.M. Abashon Ltd. 05.03.09 13.09.09 75. RD No-075 Al hamra Real-state Ltd. 23.04.09 29.09.09 76. RD No-076 Jamuna-Basundhara
Housing Development Ltd.
14.06.09 03.09.09
77. RD No-077 Dishari Real-state & Co. Ltd.
03.07.06 16.09.09
Source: RAJUK Website

146
Appendix –G
(1) Calculation of Inflation Rate:
The average inflation rate of Bangladesh in 2010 to 2012 is 8.28.
Present value =������ �����
(���
���)�
Let the present valuation of money is 100 BDT.
The average money inflation rate of Bangladesh is 8.28
So the valuation of money in 2 years ago is given below =
=���
(���.��
���)�
=���
(�.����)�
= 67.182 this is the successive monetary value between 5 years
From the calculation of the valuation between two years, it would be observed that
the present value of 100 BDT is equal to 67.182 BDT of two years ago
(2) Paired Samples Test between Present Income and Previous Income:
Paired Samples Test
Paired Differences
t df
Sig. (2-
tailed)
Mean
Std.
Deviati
on
Std.
Error
Mean
95%
Confidence
Interval of
the
Difference
Lower
Uppe
r

147
(3) Paired Samples Test between Present Landownership and Previous
Landownership:
Paired Samples Test
Paired Differences
t df
Sig.
(2-
tailed)
Mean
Std.
Deviation
Std.
Error
Mean
95%
Confidence
Interval of
the
Difference
Lowe
r Upper
Pair 1 Previous
land (katha)
– Present
land (katha)
7.494 4.410 .236 7.031 7.958 31.79
2 349 .000
Pair 1 Previous
income –
present
income
2537.1
43
3566.4
05 190.632 2162.210
2912.
076 13.309 349 .000
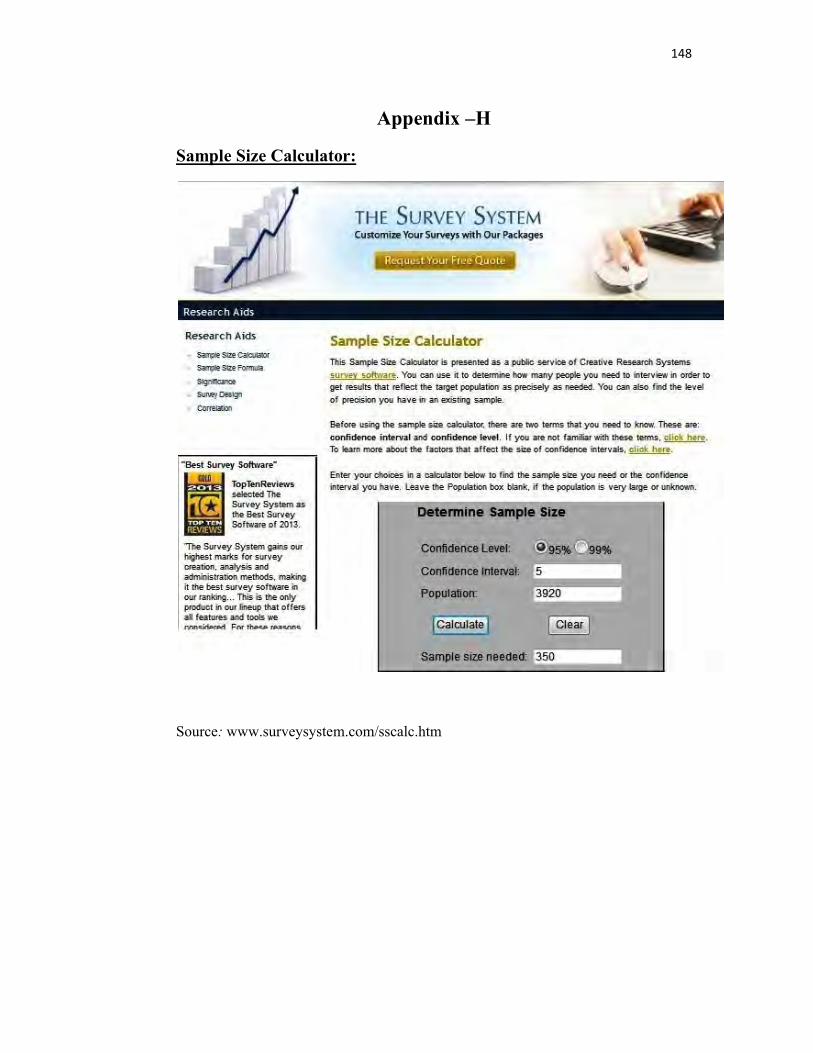
148
Appendix –H
Sample Size Calculator:
Source: www.surveysystem.com/sscalc.htm
Copyright © 2022 FDOKUMEN