Sartorial Manoeuvres in the Dusk: Blue Jeans in Socialist Hungary
Upload
khangminh22Category
view
1download
0
Study of Denim Jeans Pants Production Chain: Using Emergy
EDUARDO FERREIRA BLATTUNIVERSIDADE PAULISTA - [email protected]
ISSN: 2359-1048Dezembro 2017
1
Study of Denim Jeans Pants Production Chain: Using Emergy
Abstract Brazilian Textile Industry sector has a strategic participation in the economy,
employing more than one million workers and using intensive environmental, social, and economic resources. The industry decisions makers of this sector that want to implement Cleaner Production actions depend on to identify the items with more significance at each textile production step. Emergy accounting attempts to measure the environmental work required to generate goods and services that can be used by humans. The case study of a Brazilian textile production chain comprehends with the spinning mill that transforms cotton bales into yarn bobbins delivering to the weaving mill that produces dyed denim fabric, which is the major material to produce the garment (basic five pockets denim jeans pants) at the apparel mill and at last delivered to the market at the pants shops, and highlight the items with major relevance in Emergy terms. The Environment Sustainability Index (ESI) for the denim jeans pants in case study equal 0.0062, considered sustainable in short term, and the production process depends almost exclusively from resources that come from the economy (F).
Keywords: Emergy; environmental accounting; Denim Jeans Pants, environmental sustainability metrics in the textile industry.
1 - Introduction
The Brazilian textile industry is the fifth largest in the world, having the Vicunha Textile Group ones of the largest producers of jeans fabric in the World. ABIT (Brazilian Association of Textile Industry) and EMBRAPA (Brazilian Organization of Applied Research for Agriculture), promote researchers to improve the industrial techniques and genetic evolution of Brazilian cotton seeds. Sectorial Report of the Brazilian Textile Industry – (IEMI,2016).
The boundaries of this case study research begin at spinning mill that transforms cotton bales into yarn bobbins delivering to the weaving mill that produces dyed denim fabric, which is the major material to produce the garment (basic five pockets denim jeans pants) at the apparel mill and at last delivered to the market at the pants shops. (Investment project, 2015)
Emergy accounting was employed as a tool to analyze the environmental efforts applied at the textile production chain in this case study, and determine the most influents items. Emergy is the solar energy available and used directly or indirectly to obtain a product or service, including contributions from nature and economy. (Odum,1996)

2
2 - Bibliographic Review
The production flow as an Industrial Ecology that deals with flows of material and energy within and outside of industrial systems (Lieder & Rashid, 2016), (Morandi, Campbell, Pulselli, & Bastianoni, 2015). Discuss radical changes in the textile design and production to obtain a better sustainable industrial system - (Niinimäki & Hassi, 2011). Is a trend at engineering to research a sustainable development at industry system and use resources better - (Wan Alwi, Manan, Klemeš, & Huisingh, 2014).
Models and methods as support for sustainable decision-making with a focus on legal operationalization, which Emergy analysis, an environmental accounting, and assessment method take a wider grip embracing both ecology and economy. (Carlman, Grönlund, & Longueville, 2015), (Rydberg & Jansén, 2002), (Giannetti, Agostinho, Moraes, Almeida, & Ulgiati, 2015). Emergy method treats environmental impacts and labor as particular forms of energy and all forms of energy can be quantified by solar transformity, which is expressed in EmJoules as a common unit. (Chen, Feng, Wang, & Höök, 2017), (Carlman, Grönlund, & Longueville, 2015), (Häyhä & Franzese, 2014), (Chen, Liu, Luo, Webber, & Chen, 2016), (Giannetti, Agostinho, Moraes, Almeida, & Ulgiati, 2015). With the approach of the donor value model in Emergy accounting in the context of ecosystem services. (Grönlund, Fröling, & Carlman, 2015), (Häyhä & Franzese, 2014). Studies on environmentally sustainable agricultural and industrial development require a tool that can assess and quantifying interactions between the environment and the economy. The environmental accounting in Emergy allowed this evaluation. Developed by Odum, Howard T. (Odum, 1996), Emergy Environmental Accounting simultaneously accounts for the contributions of nature (renewable and non-renewable natural resources) and the economy (purchased resources) into a common metric. It is necessary to have full knowledge of the flows of mass and energy because through them understood the relationship with the environment.
Emergy accounting present indicators inherent to the tool to evaluate the efficiency of used resources, yield, environmental loading, and sustainability (Odum, 1996). They are: (EYR, Emergy yield ratio), (EIR, Emergy investment ratio), (ELR, environmental loading ratio) and (ESI, environmental sustainability index). It is described in the material and method chapter.

3
3. – Materials and Method 3.1. Textile and Apparel Production Flow
Cotton agriculture occurs almost at every Brazilians state, although 65% of production in the state of Mato Grosso, after the harvest the cotton is cleaned and packaged into bales of 180 kg at cotton gin mills, generally they are close to the cotton plantation, 20 km.
The boundaries of this case study begin at spinning mill process, placed at the state of Ceará, receiving the cotton bales from Mato Grosso at 3698 km. The spinning mill average production capacity is 8000 ton per year and the finish goods is cotton bobbins of 2 kg, which is the raw material for weaving mills, at this case study the weaving mill is placed at 54 km far from the spinning mill cotton bobbins supplier at Fortaleza-Ceará suburb, producing 11905 ton per year of dyed denim fabric.
The last productive link is the apparel mill, located at Pernambuco state distance at 722 km. Apparel mills process convert the fabric into basic five pockets denim jeans pants with 750 grams, at this case study the production capacity is 263 ton per year, and it basically depends on the human labor force. (Lin, Li, & Yang, 2011). The major consumer market in Brazil placed in São Paulo, the distance at 2605 km. The study case pants store sells 103000 pants per year. Emergy metrics applied to textile, apparel & retail chain (Case Study from (3) to (6))
Figure 01 – Production flow of the representative’s textile facilities for denim jeans in Brazil
4
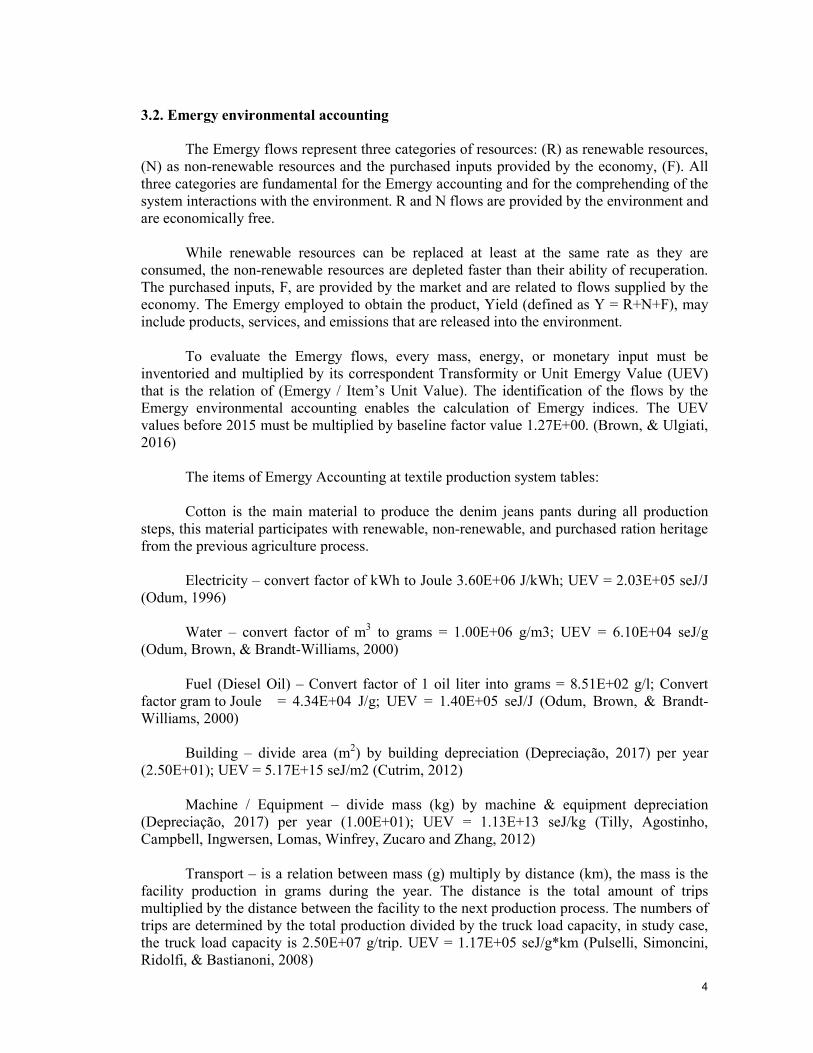
3.2. Emergy environmental accounting
The Emergy flows represent three categories of resources: (R) as renewable resources, (N) as non-renewable resources and the purchased inputs provided by the economy, (F). All three categories are fundamental for the Emergy accounting and for the comprehending of the system interactions with the environment. R and N flows are provided by the environment and are economically free.
While renewable resources can be replaced at least at the same rate as they are consumed, the non-renewable resources are depleted faster than their ability of recuperation. The purchased inputs, F, are provided by the market and are related to flows supplied by the economy. The Emergy employed to obtain the product, Yield (defined as Y = R+N+F), may include products, services, and emissions that are released into the environment.
To evaluate the Emergy flows, every mass, energy, or monetary input must be inventoried and multiplied by its correspondent Transformity or Unit Emergy Value (UEV) that is the relation of (Emergy / Item’s Unit Value). The identification of the flows by the Emergy environmental accounting enables the calculation of Emergy indices. The UEV values before 2015 must be multiplied by baseline factor value 1.27E+00. (Brown, & Ulgiati, 2016)
The items of Emergy Accounting at textile production system tables:
Cotton is the main material to produce the denim jeans pants during all production steps, this material participates with renewable, non-renewable, and purchased ration heritage from the previous agriculture process.
Electricity – convert factor of kWh to Joule 3.60E+06 J/kWh; UEV = 2.03E+05 seJ/J (Odum, 1996)
Water – convert factor of m3 to grams = 1.00E+06 g/m3; UEV = 6.10E+04 seJ/g (Odum, Brown, & Brandt-Williams, 2000)
Fuel (Diesel Oil) – Convert factor of 1 oil liter into grams = 8.51E+02 g/l; Convert factor gram to Joule = 4.34E+04 J/g; UEV = 1.40E+05 seJ/J (Odum, Brown, & Brandt-Williams, 2000)
Building – divide area (m2) by building depreciation (Depreciação, 2017) per year (2.50E+01); UEV = 5.17E+15 seJ/m2 (Cutrim, 2012)
Machine / Equipment – divide mass (kg) by machine & equipment depreciation (Depreciação, 2017) per year (1.00E+01); UEV = 1.13E+13 seJ/kg (Tilly, Agostinho, Campbell, Ingwersen, Lomas, Winfrey, Zucaro and Zhang, 2012)
Transport – is a relation between mass (g) multiply by distance (km), the mass is the facility production in grams during the year. The distance is the total amount of trips multiplied by the distance between the facility to the next production process. The numbers of trips are determined by the total production divided by the truck load capacity, in study case, the truck load capacity is 2.50E+07 g/trip. UEV = 1.17E+05 seJ/g*km (Pulselli, Simoncini, Ridolfi, & Bastianoni, 2008)
5
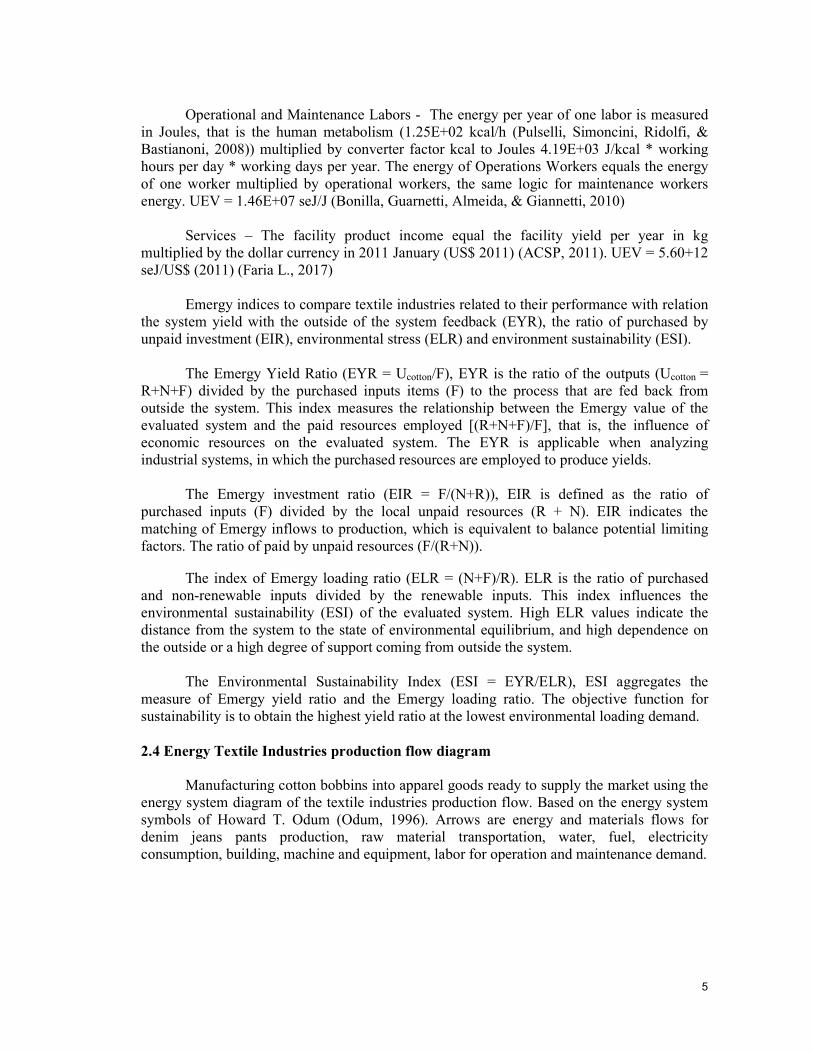
Operational and Maintenance Labors - The energy per year of one labor is measured in Joules, that is the human metabolism (1.25E+02 kcal/h (Pulselli, Simoncini, Ridolfi, & Bastianoni, 2008)) multiplied by converter factor kcal to Joules 4.19E+03 J/kcal * working hours per day * working days per year. The energy of Operations Workers equals the energy of one worker multiplied by operational workers, the same logic for maintenance workers energy. UEV = 1.46E+07 seJ/J (Bonilla, Guarnetti, Almeida, & Giannetti, 2010)
Services – The facility product income equal the facility yield per year in kg multiplied by the dollar currency in 2011 January (US$ 2011) (ACSP, 2011). UEV = 5.60+12 seJ/US$ (2011) (Faria L., 2017)
Emergy indices to compare textile industries related to their performance with relation the system yield with the outside of the system feedback (EYR), the ratio of purchased by unpaid investment (EIR), environmental stress (ELR) and environment sustainability (ESI).
The Emergy Yield Ratio (EYR = Ucotton/F), EYR is the ratio of the outputs (Ucotton = R+N+F) divided by the purchased inputs items (F) to the process that are fed back from outside the system. This index measures the relationship between the Emergy value of the evaluated system and the paid resources employed [(R+N+F)/F], that is, the influence of economic resources on the evaluated system. The EYR is applicable when analyzing industrial systems, in which the purchased resources are employed to produce yields.
The Emergy investment ratio (EIR = F/(N+R)), EIR is defined as the ratio of purchased inputs (F) divided by the local unpaid resources (R + N). EIR indicates the matching of Emergy inflows to production, which is equivalent to balance potential limiting factors. The ratio of paid by unpaid resources (F/(R+N)).
The index of Emergy loading ratio (ELR = (N+F)/R). ELR is the ratio of purchased and non-renewable inputs divided by the renewable inputs. This index influences the environmental sustainability (ESI) of the evaluated system. High ELR values indicate the distance from the system to the state of environmental equilibrium, and high dependence on the outside or a high degree of support coming from outside the system.
The Environmental Sustainability Index (ESI = EYR/ELR), ESI aggregates the measure of Emergy yield ratio and the Emergy loading ratio. The objective function for sustainability is to obtain the highest yield ratio at the lowest environmental loading demand. 2.4 Energy Textile Industries production flow diagram
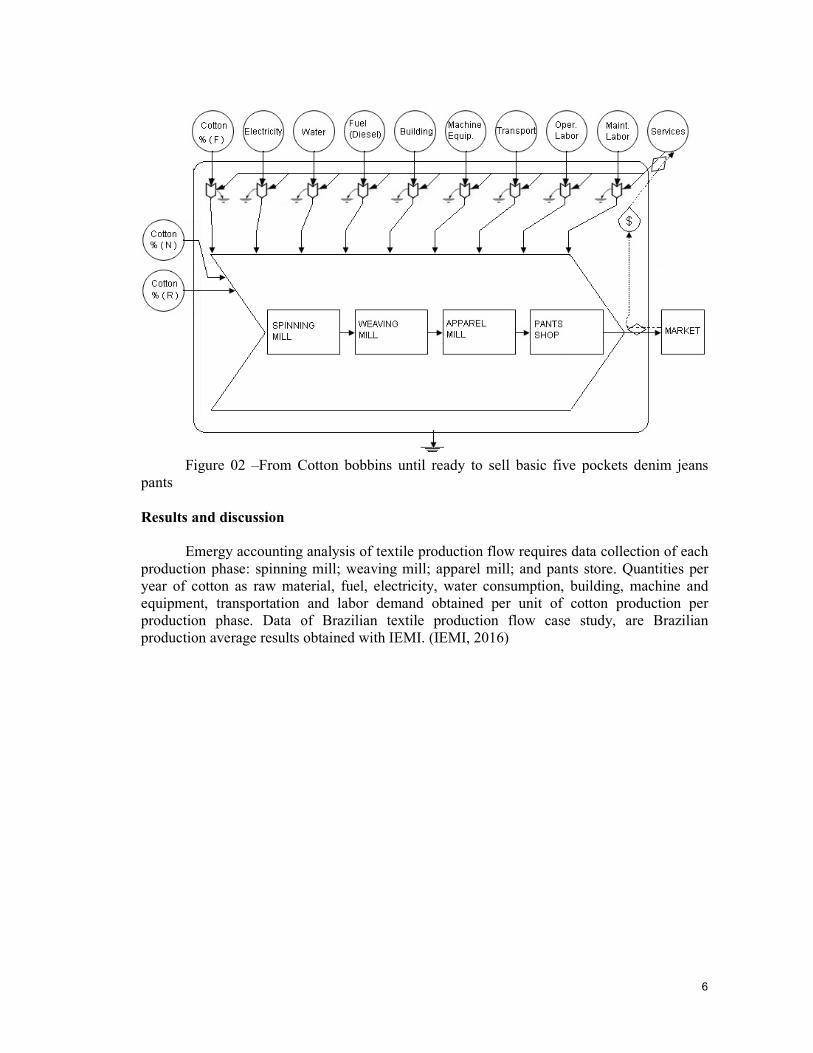
Manufacturing cotton bobbins into apparel goods ready to supply the market using the energy system diagram of the textile industries production flow. Based on the energy system symbols of Howard T. Odum (Odum, 1996). Arrows are energy and materials flows for denim jeans pants production, raw material transportation, water, fuel, electricity consumption, building, machine and equipment, labor for operation and maintenance demand.
6
Figure 02 –From Cotton bobbins until ready to sell basic five pockets denim jeans
pants Results and discussion
Emergy accounting analysis of textile production flow requires data collection of each production phase: spinning mill; weaving mill; apparel mill; and pants store. Quantities per year of cotton as raw material, fuel, electricity, water consumption, building, machine and equipment, transportation and labor demand obtained per unit of cotton production per production phase. Data of Brazilian textile production flow case study, are Brazilian production average results obtained with IEMI. (IEMI, 2016)
7
2.4.1. Emergy Spinning Mill Accounting Unit Solar Solar Em$ %
Data EMERGY EMERGY Value Without
Note Item Unit (units/yr) (seJ/unit) (seJ/yr) US$ (2011)/yr
Service
Energy inputs
Electric energy J 3.84E+13 2.03E+05 7.81E+18 1.39E+06 0.73%
Water g 1.60E+10 6.10E+04 9.76E+14 1.74E+02 0.0001%
Fuel (Diesel Oil) J 1.42E+13 1.40E+05 1.98E+18 3.54E+05 0.18%
Material (Renewable)
0,92% Cotton (Lint Bale) g 7.56E+07 1.26E+11 9.53E+18 1.70E+06 0.89%
Material (Non-Renewable)
00,03% Cotton (Lint Bale) g 2.87E+06 1.26E+11 3.62E+17 6.47E+04 0.03%
Material (Purchased)
99,05% Cotton (Lint Bale) g 8.17E+09 1.26E+11 1.03E+21 1.84E+08 95.82%
Material (Total)
100,00% Cotton (Lint Bale) g 8.25E+09 1.26E+11 1.04E+21 1.86E+08
Construction and Equipment
Building área m2 4.00E+02 5.17E+15 2.07E+18 7.27E+06 0.19%
Machine and Equipment kg 1.66E+05 1.13E+13 1.87E+18 3.34E+05 0.17%
Transport
Transport by Truck g.km 1.38E+14 1.17E+05 1.61E+19 2.88E+06 1.499%
Operation and Maintenance
Operational Labors J 2.77E+11 1.46E+07 4.05E+18 7.24E+05 0.38%
Maintenance Labors J 8.04E+10 1.46E+07 1.17E+18 2.10E+05 0.11%
Sum of purchased inputs
1.07E+21 1.97E+08
Emergy without services
1.08E+21
100.00%
Services US$ 4.00E+07 5.60E+12 2.24E+20 4.00E+07
Emergy with services
1.30E+21
TRANSFORMITIES, calculated
Total Yield without services g 8.00E+09 1.34E+11 seJ/g
J 1.36E+14 7.91E+06 seJ/J
Total Yield with services g 8.00E+09 1.62E+11 seJ/g
J 1.36E+14 9.55E+06 seJ/J
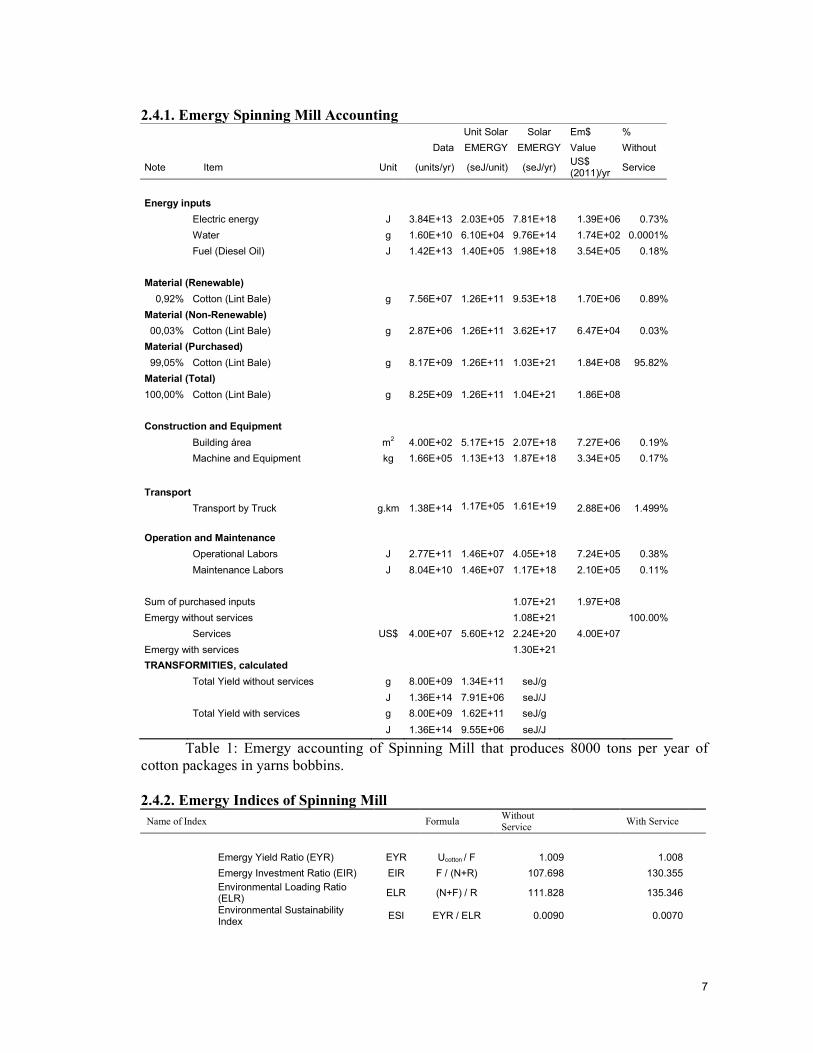
Table 1: Emergy accounting of Spinning Mill that produces 8000 tons per year of cotton packages in yarns bobbins. 2.4.2. Emergy Indices of Spinning Mill
Name of Index Formula Without Service
With Service
Emergy Yield Ratio (EYR) EYR Ucotton / F 1.009
1.008
Emergy Investment Ratio (EIR) EIR F / (N+R) 107.698
130.355
Environmental Loading Ratio (ELR)
ELR (N+F) / R 111.828
135.346
Environmental Sustainability Index
ESI EYR / ELR 0.0090
0.0070
8
2.4.3. Emergy Weaving Mill Accounting Unit Solar Solar Em$ %
Data EMERGY EMERGY Value Without
Note Item Unit (units/yr) (seJ/unit) (seJ/yr) US$ (2011)/yr Service
Energy inputs
Electric energy J 5.22E+13 2.03E+05 1.06E+19 1.90E+06 0.47%
Water g 6.61E+11 6.10E+04 4.03E+16 7.20E+03 0.002%
Fuel (Diesel Oil) J 1.77E+14 1.40E+05 2.48E+19 4.43E+06 1.10%
Material (Renewable)
0,89% Cotton (yarn) g 1.13E+08 1.34E+11 1.52E+19 2.72E+06 0.68%
Material (Non-Renewable)
00,03% Cotton (yarn) g 4.31E+06 1.34E+11 5.79E+17 1.03E+05 0.03%
Material (Purchased)
99,08% Cotton (yarn) g 1.27E+10 1.34E+11 1.70E+21 3.04E+08 75.88%
Dyestuff (Indigo Vat Dye) g 8.16E+07 2.14E+09 1.74E+17 3.11E+04 0.01%
Chemicals g 8.71E+08 2.14E+09 1.86E+18 3.32E+05 0.08%
Material (Total)
100,00% Cotton (yarn) g 1.28E+10 1.34E+11 1.72E+21 3.07E+08
Construction and Equipment
Building área m2 8.48E+02 5.17E+15 4.39E+18 1.54E+07 0.20%
Machine and Equipment kg 8.47E+04 1.13E+13 9.54E+17 1.70E+05 0.04%
Transport
Transport by Truck g.km 4.09E+15 1.17E+05 4.78E+20 8.54E+07 21.31%
Operation and Maintenance
Operational Labors J 2.29E+11 1.46E+07 3.35E+18 5.98E+05 0.15%
Maintenance Labors J 6.97E+10 1.46E+07 1.02E+18 1.82E+05 0.05%
Sum of purchased inputs 2.23E+21 4.13E+08
Emergy without services 2.24E+21 100,00%
Services US$ 7.11E+07 5.60E+12 3.98E+20 7.11E+07
Emergy with services 2.64E+21
TRANSFORMITIES, calculated
Total Yield without services g 1.19E+10 1.88E+11 seJ/g
J 2.02E+14 1.11E+07 seJ/J
Total Yield with services g 1.19E+10 2.22E+11 seJ/g
J 2.02E+14 1.31E+07 seJ/J
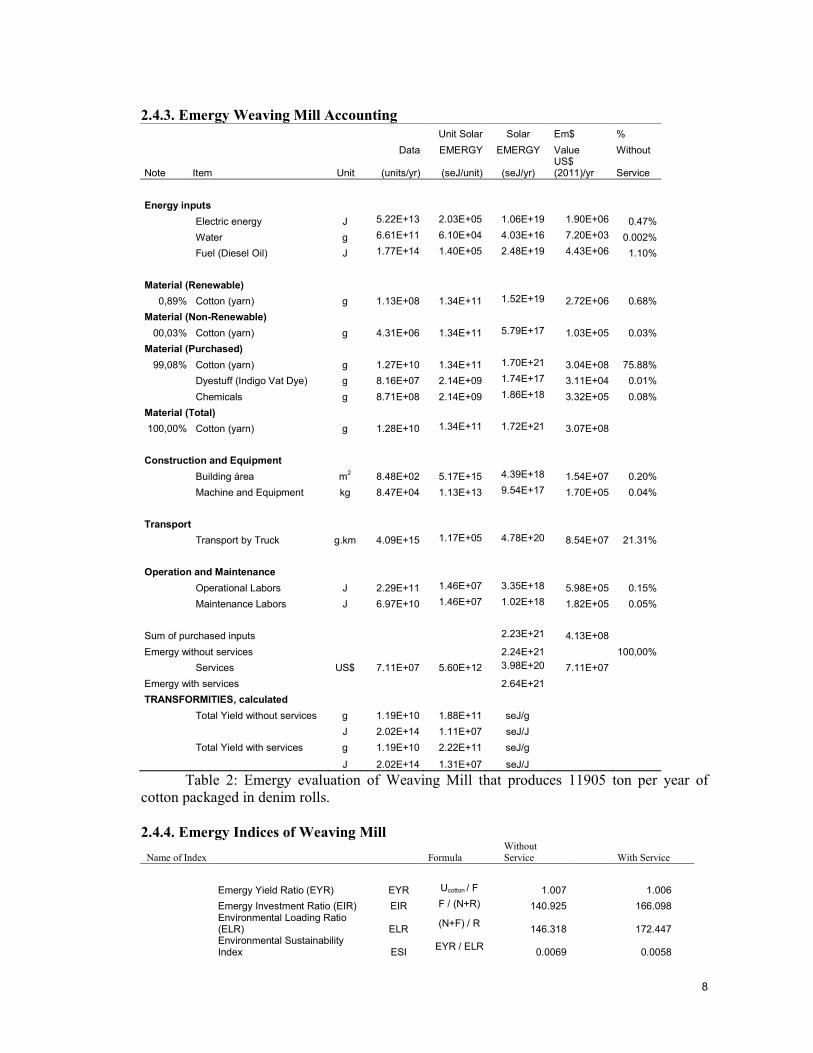
Table 2: Emergy evaluation of Weaving Mill that produces 11905 ton per year of cotton packaged in denim rolls. 2.4.4. Emergy Indices of Weaving Mill
Name of Index Formula Without Service With Service
Emergy Yield Ratio (EYR) EYR Ucotton / F 1.007 1.006
Emergy Investment Ratio (EIR) EIR F / (N+R) 140.925 166.098 Environmental Loading Ratio (ELR) ELR
(N+F) / R 146.318 172.447
Environmental Sustainability Index ESI
EYR / ELR 0.0069 0.0058
9
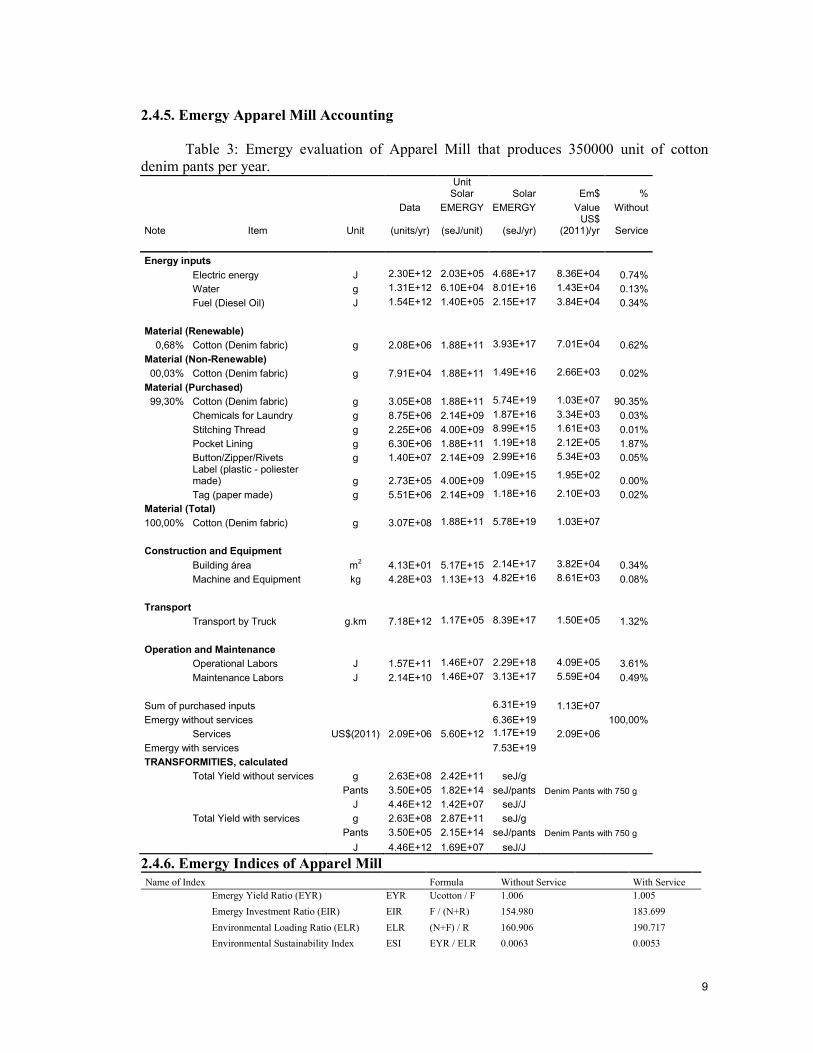
2.4.5. Emergy Apparel Mill Accounting
Table 3: Emergy evaluation of Apparel Mill that produces 350000 unit of cotton denim pants per year.
Unit
Solar Solar Em$ %
Data EMERGY EMERGY Value Without
Note Item Unit (units/yr) (seJ/unit) (seJ/yr) US$
(2011)/yr Service
Energy inputs
Electric energy J 2.30E+12 2.03E+05 4.68E+17 8.36E+04 0.74%
Water g 1.31E+12 6.10E+04 8.01E+16 1.43E+04 0.13%
Fuel (Diesel Oil) J 1.54E+12 1.40E+05 2.15E+17 3.84E+04 0.34%
Material (Renewable)
0,68% Cotton (Denim fabric) g 2.08E+06 1.88E+11 3.93E+17 7.01E+04 0.62%
Material (Non-Renewable)
00,03% Cotton (Denim fabric) g 7.91E+04 1.88E+11 1.49E+16 2.66E+03 0.02%
Material (Purchased)
99,30% Cotton (Denim fabric) g 3.05E+08 1.88E+11 5.74E+19 1.03E+07 90.35%
Chemicals for Laundry g 8.75E+06 2.14E+09 1.87E+16 3.34E+03 0.03%
Stitching Thread g 2.25E+06 4.00E+09 8.99E+15 1.61E+03 0.01%
Pocket Lining g 6.30E+06 1.88E+11 1.19E+18 2.12E+05 1.87%
Button/Zipper/Rivets g 1.40E+07 2.14E+09 2.99E+16 5.34E+03 0.05% Label (plastic - poliester made) g 2.73E+05 4.00E+09
1.09E+15 1.95E+02 0.00%
Tag (paper made) g 5.51E+06 2.14E+09 1.18E+16 2.10E+03 0.02%
Material (Total)
100,00% Cotton (Denim fabric) g 3.07E+08 1.88E+11 5.78E+19 1.03E+07
Construction and Equipment
Building área m2 4.13E+01 5.17E+15 2.14E+17 3.82E+04 0.34%
Machine and Equipment kg 4.28E+03 1.13E+13 4.82E+16 8.61E+03 0.08%
Transport
Transport by Truck g.km 7.18E+12 1.17E+05 8.39E+17 1.50E+05 1.32%
Operation and Maintenance
Operational Labors J 1.57E+11 1.46E+07 2.29E+18 4.09E+05 3.61%
Maintenance Labors J 2.14E+10 1.46E+07 3.13E+17 5.59E+04 0.49%
Sum of purchased inputs 6.31E+19 1.13E+07
Emergy without services 6.36E+19 100,00%
Services US$(2011) 2.09E+06 5.60E+12 1.17E+19 2.09E+06
Emergy with services 7.53E+19
TRANSFORMITIES, calculated
Total Yield without services g 2.63E+08 2.42E+11 seJ/g
Pants 3.50E+05 1.82E+14 seJ/pants Denim Pants with 750 g
J 4.46E+12 1.42E+07 seJ/J
Total Yield with services g 2.63E+08 2.87E+11 seJ/g
Pants 3.50E+05 2.15E+14 seJ/pants Denim Pants with 750 g
J 4.46E+12 1.69E+07 seJ/J
2.4.6. Emergy Indices of Apparel Mill Name of Index Formula Without Service With Service
Emergy Yield Ratio (EYR) EYR Ucotton / F 1.006 1.005
Emergy Investment Ratio (EIR) EIR F / (N+R) 154.980 183.699
Environmental Loading Ratio (ELR) ELR (N+F) / R 160.906 190.717
Environmental Sustainability Index ESI EYR / ELR 0.0063 0.0053
10
2.4.8. Emergy Accounting – Denim Jeans Pants Shop Unit Solar Solar Em$ %
Data EMERGY EMERGY Value Without
Note Item Unit (units/yr) (seJ/unit) (seJ/yr) US$
(2011)/yr Service
Energy inputs
Electric energy J 3.93E+10 2.03E+05 8.00E+15 1.43E+03 0.04%
Material (Renewable)
0,62% Cotton (Denim fabric) g 4.79E+05 2.42E+11 1.16E+17 2.07E+04 0.61%
Material (Non-Renewable)
00,02% Cotton (Denim fabric) g 1.82E+04 2.42E+11 4.41E+15 7.87E+02 0.02%
Material (Purchased)
99,36% Cotton (Denim fabric) g 7.71E+07 2.42E+11 1.87E+19 3.33E+06 97.90%
Envelope (plastic - poliester made) g 2.48E+06 4.00E+09 9.94E+15 1.78E+03 0.05%
Cardboard Bag (paper made) g 1.09E+07 2.14E+09 2.32E+16 4.14E+03 0.12%
Material (Total)
100,00% Cotton (Denim fabric) g 7.76E+07 2.42E+11 1.88E+19 3.36E+06
Construction and Equipment
Building área m2 7.80E+00 5.17E+15 4.04E+16 1.42E+05 0.21%
Machine and Equipment kg 2.22E+02 1.13E+13 2.49E+15 4.45E+02 0.01%
Operation and Maintenance
Operational Labors J 1.21E+10 1.46E+07 1.76E+17 3.15E+04 0.92%
Maintenance Labors J 1.34E+09 1.46E+07 1.96E+16 3.50E+03 0.10%
Sum of purchased inputs 1.89E+19 3.52E+06
Emergy without services 1.91E+19 100,00%
Services US$(2011) 1.55E+06 5.60E+12 8.69E+18 1.55E+06
Emergy with services 2.78E+19
TRANSFORMITIES, calculated
Total Yield without services g 7.76E+07 2.46E+11 seJ/g
pants 1.03E+05 1.84E+14 seJ/pants Denim Pants with 750 g
J 1.32E+12 1.45E+07 seJ/J
Total Yield with services g 7.76E+07 3.58E+11 seJ/g
pants 1.03E+05 2.68E+14 seJ/pants Denim Pants with 750 g
J 1.32E+12 2.10E+07 seJ/J
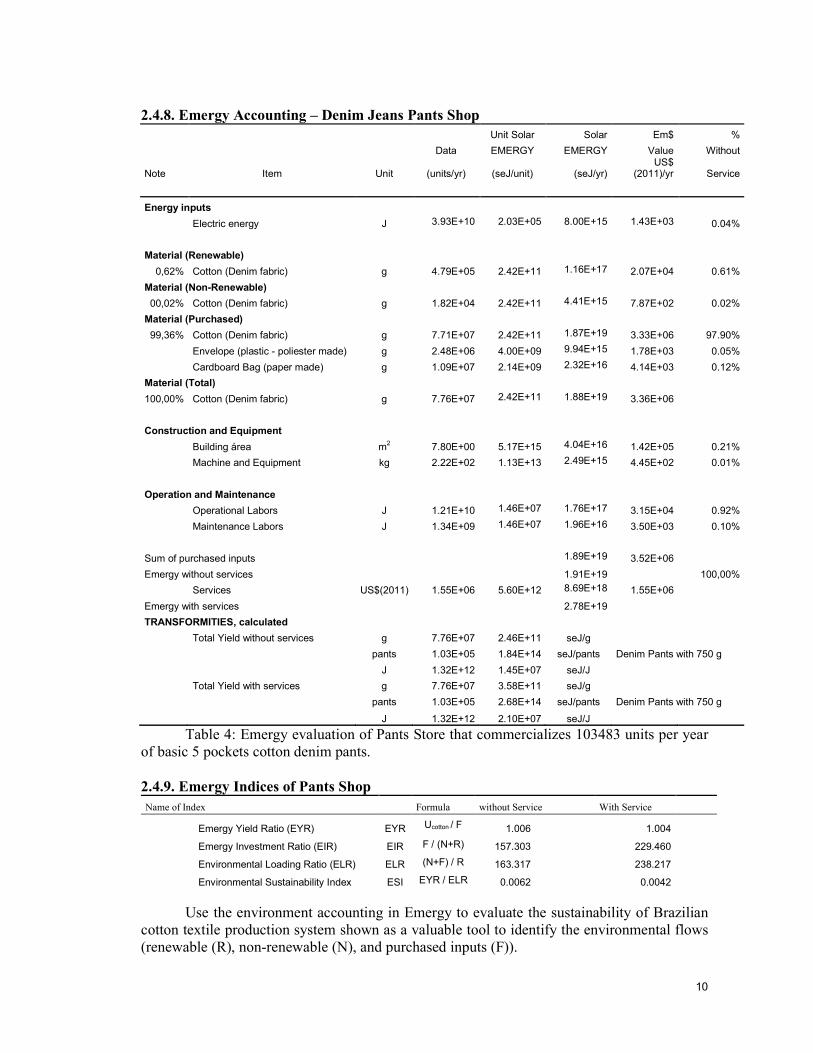
Table 4: Emergy evaluation of Pants Store that commercializes 103483 units per year of basic 5 pockets cotton denim pants. 2.4.9. Emergy Indices of Pants Shop
Name of Index Formula without Service With Service
Emergy Yield Ratio (EYR) EYR Ucotton / F 1.006 1.004
Emergy Investment Ratio (EIR) EIR F / (N+R) 157.303 229.460
Environmental Loading Ratio (ELR) ELR (N+F) / R 163.317 238.217
Environmental Sustainability Index ESI EYR / ELR 0.0062 0.0042
Use the environment accounting in Emergy to evaluate the sustainability of Brazilian cotton textile production system shown as a valuable tool to identify the environmental flows (renewable (R), non-renewable (N), and purchased inputs (F)).
11
UNIT Table 01 Table 02 Table 03 Table 04 Table 05 Table 06
Total
Description - Cotton
Agriculture Cotton Gin
Mill Spinning
Mill Weaving
Mill Apparel
Mill Pants Store
Product Description - kg / (ha=
10,000m2) kg / bale kg/yarn
cone kg/fabric
roll kg/denim
pants kg/denim
pants
Unit quantity -
3,924.11
180.00
5.00
20.00 0.75
0.75
Cotton Yield % 0.0% 68.0% 3.0% 6.9% 14.4% 0.0%
Cotton Demand/Pants kg/Pants
3.033
0.971
0.941
0.877
0.750
0.750
Mkt Price/kg US$(2011)
0.55
3.84
5.00
5.97 7.96
20.00
Cotton Demand/Pants US$(2011)
1.67
3.73
4.71
5.23 5.97
15.00
Production ton/yr
4
7,000
8,000
11,905 263
78
Pants Production Pants
1,294
7,212,637
8,497,952
13,582,691
350,000
103,483
Built/Agric Area m2 1.00E+04 3.40E+03 1.00E+04 2.12E+04 1.03E+03 1.95E+02 4.58E+04 m2
Built participation %
- 0.08% 0.19% 0.20% 0.34% 0.21%
Mach/Equip (Steel) G 5.12E+04 1.47E+08 1.66E+09 8.47E+08 4.28E+07 2.22E+06 2.70E+09 G Mach/Equip participation % 1.22% 0.02% 0.17% 0.04% 0.08% 0.01% Cotton Demand Production kg
15
21,875,000
8,247,423
12,786,790
306,777
77,612
Cotton Demand Production % 2.11% 3.74% 96.74% 75.97% 90.99% 98.53%
Workers quantity
0.015
77
207
223 133
10 650 Workers
Workers participation % 9.12% 0.10% 0.49% 0.19% 4.10% 1.03% Distance Next Process Km
20
3,698
54
722
2,605 - 7,099 Km
Distance Participation % 0.02% 95.90% 1.50% 21.31% 1.32% -
UEV WithOutService seJ/g 1.51E+09 1.26E+11 1.34E+11 1.88E+11 2.42E+11 2.46E+11
UEV WithService seJ/g 4.59E+09 1.48E+11 1.62E+11 2.22E+11 2.87E+11 3.58E+11
ESI WithOutService - 0.4358 0.0093 0.0090 0.0069 0.0063 0.0062
ESI WithService - 0.0956 0.0080 0.0074 0.0058 0.0053 0.0042
UEV WithOutService seJ/pants 1.82E+14 1.84E+14
UEV With Service seJ/pants 2.15E+14 2.68E+14
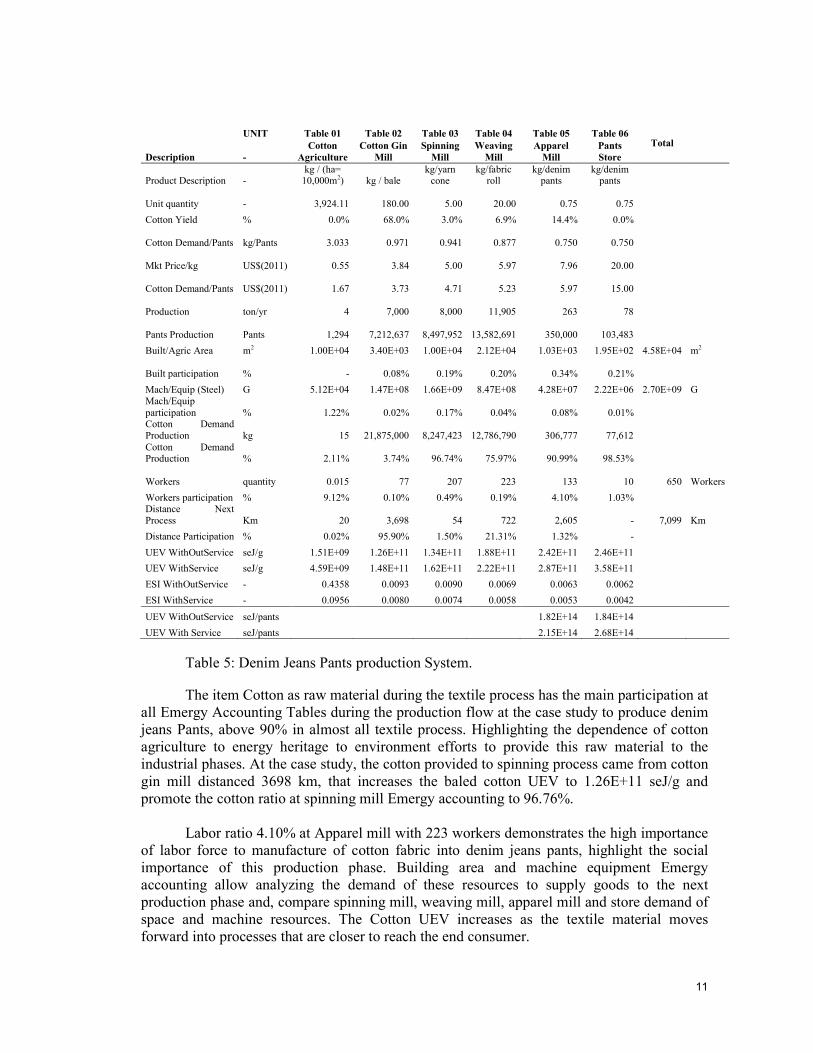
Table 5: Denim Jeans Pants production System.
The item Cotton as raw material during the textile process has the main participation at all Emergy Accounting Tables during the production flow at the case study to produce denim jeans Pants, above 90% in almost all textile process. Highlighting the dependence of cotton agriculture to energy heritage to environment efforts to provide this raw material to the industrial phases. At the case study, the cotton provided to spinning process came from cotton gin mill distanced 3698 km, that increases the baled cotton UEV to 1.26E+11 seJ/g and promote the cotton ratio at spinning mill Emergy accounting to 96.76%. Labor ratio 4.10% at Apparel mill with 223 workers demonstrates the high importance of labor force to manufacture of cotton fabric into denim jeans pants, highlight the social importance of this production phase. Building area and machine equipment Emergy accounting allow analyzing the demand of these resources to supply goods to the next production phase and, compare spinning mill, weaving mill, apparel mill and store demand of space and machine resources. The Cotton UEV increases as the textile material moves forward into processes that are closer to reach the end consumer.
12
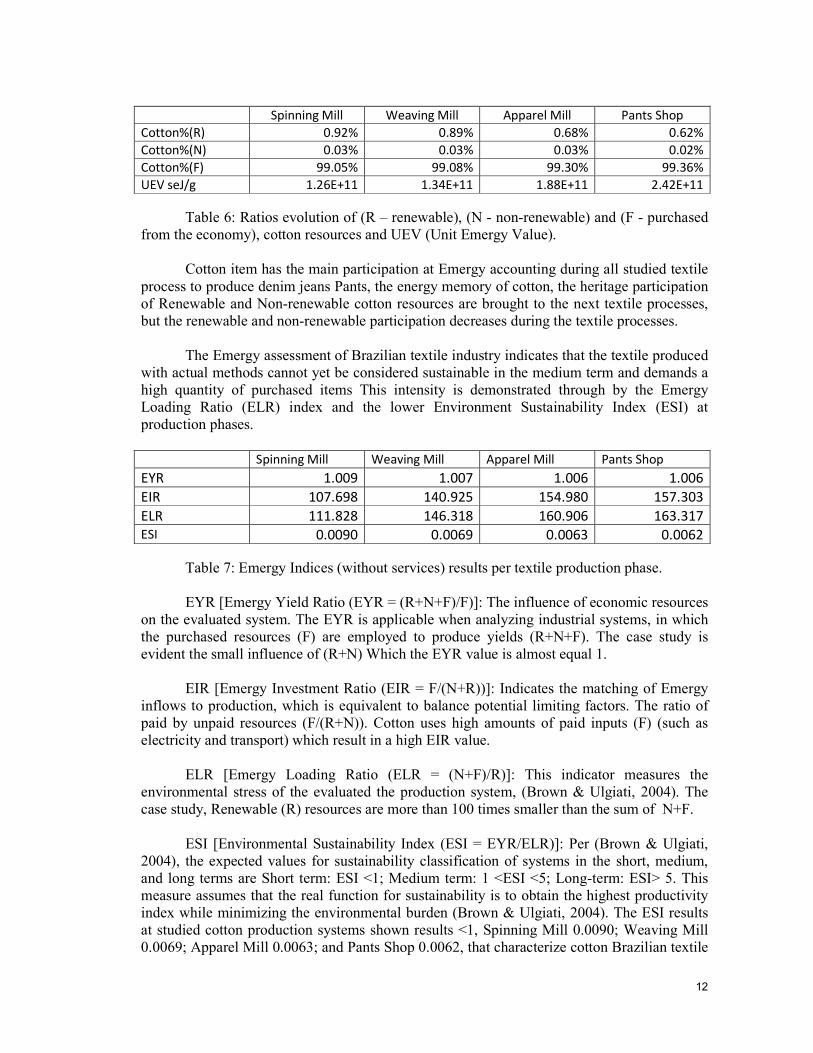
Spinning Mill Weaving Mill Apparel Mill Pants Shop Cotton%(R) 0.92% 0.89% 0.68% 0.62% Cotton%(N) 0.03% 0.03% 0.03% 0.02% Cotton%(F) 99.05% 99.08% 99.30% 99.36% UEV seJ/g 1.26E+11 1.34E+11 1.88E+11 2.42E+11
Table 6: Ratios evolution of (R – renewable), (N - non-renewable) and (F - purchased from the economy), cotton resources and UEV (Unit Emergy Value).
Cotton item has the main participation at Emergy accounting during all studied textile process to produce denim jeans Pants, the energy memory of cotton, the heritage participation of Renewable and Non-renewable cotton resources are brought to the next textile processes, but the renewable and non-renewable participation decreases during the textile processes.
The Emergy assessment of Brazilian textile industry indicates that the textile produced with actual methods cannot yet be considered sustainable in the medium term and demands a high quantity of purchased items This intensity is demonstrated through by the Emergy Loading Ratio (ELR) index and the lower Environment Sustainability Index (ESI) at production phases. Spinning Mill Weaving Mill Apparel Mill Pants Shop
EYR 1.009 1.007 1.006 1.006
EIR 107.698 140.925 154.980 157.303
ELR 111.828 146.318 160.906 163.317 ESI 0.0090 0.0069 0.0063 0.0062
Table 7: Emergy Indices (without services) results per textile production phase.
EYR [Emergy Yield Ratio (EYR = (R+N+F)/F)]: The influence of economic resources on the evaluated system. The EYR is applicable when analyzing industrial systems, in which the purchased resources (F) are employed to produce yields (R+N+F). The case study is evident the small influence of (R+N) Which the EYR value is almost equal 1.
EIR [Emergy Investment Ratio (EIR = F/(N+R))]: Indicates the matching of Emergy
inflows to production, which is equivalent to balance potential limiting factors. The ratio of paid by unpaid resources (F/(R+N)). Cotton uses high amounts of paid inputs (F) (such as electricity and transport) which result in a high EIR value.
ELR [Emergy Loading Ratio (ELR = (N+F)/R)]: This indicator measures the
environmental stress of the evaluated the production system, (Brown & Ulgiati, 2004). The case study, Renewable (R) resources are more than 100 times smaller than the sum of N+F.
ESI [Environmental Sustainability Index (ESI = EYR/ELR)]: Per (Brown & Ulgiati,
2004), the expected values for sustainability classification of systems in the short, medium, and long terms are Short term: ESI <1; Medium term: 1 <ESI <5; Long-term: ESI> 5. This measure assumes that the real function for sustainability is to obtain the highest productivity index while minimizing the environmental burden (Brown & Ulgiati, 2004). The ESI results at studied cotton production systems shown results <1, Spinning Mill 0.0090; Weaving Mill 0.0069; Apparel Mill 0.0063; and Pants Shop 0.0062, that characterize cotton Brazilian textile

13
process to produce denim jeans pants as a short-term value for Emergy Sustainability classification. Conclusions
Environment Sustainability Index (ESI) to considered sustainable in the medium term with a value between 1.0 until 5.0. The textile process the case study for Denim Jeans Pants has ESI = 0.0062, it means that the textile process analyzed through Emergy concepts is considered sustainable in short term process and depends almost exclusively from resources that come from the economy(F). References ACSP, 2011 Cotação do Dólar Janeiro 2011. Associação Comercial de São Paulo http://portal.acsp.com.br/assets/html/indicadores/indicadores_iegv/iegv_dolar.html (Accessed August 10, 2017) Bonilla, S. H., Guarnetti, R. L., Almeida, C. M. V. B., & Giannetti, B. F. (2010). Sustainability assessment of a giant bamboo plantation in Brazil: exploring the influence of labour, time and space. Journal of Cleaner Production, 18(1), 83–91. https://doi.org/10.1016/j.jclepro.2009.07.012 Brown, M. T., & Ulgiati, S. (2016). Assessing the global environmental sources driving the geobiosphere: A revised Emergy baseline. Ecological Modelling, 339, 126–132. https://doi.org/10.1016/j.ecolmodel.2016.03.017 Brown, M. T., & Ulgiati, S. (2004). Energy quality, Emergy, and transformity: H.T. Odum’s contributions to quantifying and understanding systems. Ecological Modelling, 178(1–2), 201–213. https://doi.org/10.1016/j.ecolmodel.2004.03.002 Carlman, I., Grönlund, E., & Longueville, A. (2015). Models and methods as support for sustainable decision-making with focus on legal operationalisation. Ecological Modelling, 306, 95–100. https://doi.org/10.1016/j.ecolmodel.2014.10.010 Chen, D., Liu, Z., Luo, Z., Webber, M., & Chen, J. (2016). Bibliometric and visualized analysis of Emergy research. Ecological Engineering, 90, 285–293. https://doi.org/10.1016/j.ecoleng.2016.01.026 Chen, Y., Feng, L., Wang, J., & Höök, M. (2017). Emergy-based energy return on investment method for evaluating energy exploitation. Energy, 128, 540–549. https://doi.org/10.1016/j.energy.2017.04.058 Cutrim,2012. Construção Edificações Jorge Creso Cutrim 2012. PIS Prédio de Interesse Social pág 267. Sem serviço. Tese de doutorado UNIP. https://www2.unip.br/ensino/pos_graduacao/strictosensu/eng_producao/download/eng_jorgecresocutrimdemetrio.swf (Accessed August 10, 2017) Depreciação, 2017. Taxas de depreciação de bens do ativo imobilizado, (Retificado(a) no DOU de 13/04/2017, pág 53). Receita Fazenda. http://normas.receita.fazenda.gov.br/sijut2consulta/link.action?visao=anotado&idAto=81268#1706802 (Accessed August 10, 2017) Faria, Luciana. (2017) O desempenho econômico, ambiental e social do Brasil: de 2012, sob a perspectiva dos planos do governo. 132 f Doctoral Thesis. UNIP. https://www2.unip.br/ensino/pos_graduacao/strictosensu/eng_producao/download/eng_lucianafaria.pdf . (Accessed August 10, 2017)
14
Giannetti, B. F., Agostinho, F., Moraes, L. C., Almeida, C. M. V. B., & Ulgiati, S. (2015). Multicriteria cost–benefit assessment of tannery production: The need for breakthrough process alternatives beyond conventional technology optimization. Environmental Impact Assessment Review, 54, 22–38. https://doi.org/10.1016/j.eiar.2015.04.006 Grönlund, E., Fröling, M., & Carlman, I. (2015). Donor values in Emergy assessment of ecosystem services. Ecological Modelling, 306, 101–105. https://doi.org/10.1016/j.ecolmodel.2014.10.011 Häyhä, T., & Franzese, P. P. (2014). Ecosystem services assessment: A review under an ecological-economic and systems perspective. Ecological Modelling, 289, 124–132. https://doi.org/10.1016/j.ecolmodel.2014.07.002 IEMI, (2016). Brasil Têxtil 2016: relatório macroeconômico da Indústria Têxtil e Confeccionista. Inteligência de Mercado. http://www.iemi.com.br/ (Accessed August 10, 2017) Investment project, 2015 – Consulate general of the Federal Democratic Republic of Ethiopia in China. http://www.ethiopiaemb.org.cn/invest_project_8.htm (Accessed August 10, 2017) Lieder, M., & Rashid, A. (2016). Towards circular economy implementation: a comprehensive review in context of manufacturing industry. Journal of Cleaner Production, 115, 36–51. https://doi.org/10.1016/j.jclepro.2015.12.042 Morandi, F., Campbell, D. E., Pulselli, F. M., & Bastianoni, S. (2015). Emergy evaluation of hierarchically nested systems: application to EU27, Italy and Tuscany and consequences for the meaning of Emergy indicators. Ecological Modelling, 315, 12–27. https://doi.org/10.1016/j.ecolmodel.2015.04.001 Niinimäki, K., & Hassi, L. (2011). Emerging design strategies in sustainable production and consumption of textiles and clothing. Journal of Cleaner Production. https://doi.org/10.1016/j.jclepro.2011.04.020 Odum HT, Brown MT, Brandt-Williams S. Introduction and global budget, Handbook of Emergy evaluation. Gainesville, USA: Center for Environmental Policy, University of Florida; 2000. Folio no. 1. Odum, Howard T. Environmental Accounting: Emergy and Environmental Decision Making. Wiley; 1 edition (December 12, 1995) 384 pages. ISBN-13: 978-0471114420 Pulselli, R. M., Simoncini, E., Ridolfi, R., & Bastianoni, S. (2008). Specific Emergy of cement and concrete: An energy-based appraisal of building materials and their transport. Ecological Indicators, 8(5), 647–656. https://doi.org/10.1016/j.ecolind.2007.10.001 Rydberg T, Jansén J. Comparison of horse and tractor traction using Emergy analysis. Ecological Engineering 19 (2002); 13–28, PII: S 0 9 2 5 - 8 5 7 4 ( 0 2 ) 0 0 0 1 5 - 0 Tilley, D.R., Agostinho, F., Campbell, E., Ingwersen, W., Lomas, P., Winfrey, B., Zucaro, A., Zhang, P., 2012. The ISAER transformity database. International Society for Advancement of Emergy Research. www.Emergydatabase.org (Accessed August 10, 2017). Wan Alwi, S. R., Manan, Z. A., Klemeš, J. J., & Huisingh, D. (2014). Sustainability engineering for the future. Journal of Cleaner Production, 71, 1–10. https://doi.org/10.1016/j.jclepro.2014.03.013
Copyright © 2022 FDOKUMEN