Comparison of typical mega cities in China using emergy synthesis
10
Comparison of typical mega cities in China using emergy synthesis L.X. Zhang a , B. Chen a , Z.F. Yang a, * , G.Q. Chen a,b , M.M. Jiang a , G.Y. Liu a a State Key Laboratory of Water Environment Simulation, School of Environment, Beijing 100875, China b National Laboratory for Complex Systems and Turbulence, Department of Mechanics, Peking University, Beijing 100871, China article info Article history: Received 22 December 2007 Received in revised form 25 February 2008 Accepted 1 March 2008 Available online 2 June 2008 PACS: 87.23.n 89.60.k Keywords: Emergy Resource structure Resource use efficiency Mega urban system abstract An emergy-based comparison analysis is conducted for three typical mega cities in China, i.e., Beijing, Shanghai and Guangzhou, from 1990 to 2005 in four perspectives including emergy intensity, resource structure, environmental pressure and resource use efficiency. A new index of non-renewable emergy/money ratio is established to indicate the utiliza- tion efficiency of the non-renewable resources. The results show that for the three mega urban systems, Beijing, Shanghai and Guangzhou, the total emergy inputs were 3.76E+23, 3.54E+23, 2.52E+23 sej in 2005, of which 64.88%, 91.45% and 72.28% were imported from the outsides, respectively. As to the indicators of emergy intensity involving the total emergy use, emergy density and emergy use per cap, three cities exhibited similar overall increase trends with annual fluctuations from 1990 to 2005. Shanghai achieved the highest level of economic development and non-renewable resource use efficiency, and meanwhile, lower proportion of renewable resource use and higher environmental pres- sure compared to those of Beijing and Guangzhou. Guangzhou has long term sustainability considering an amount of local renewable resources used, per capita emergy used, energy consumption per unit GDP and the ratio of waste to renewable emergy. It can be concluded that different emergy-based evaluation results arise from different geographical locations, resources endowments, industrial structures and urban orientations of the concerned mega cities. Ó 2008 Elsevier B.V. All rights reserved. 1. Introduction Urban economic and ecological systems are physically connected by the throughput of energy and matter from natural ecosystems, and by other environmental goods and services which sustain economic activities. Since mechanisms that link regional economy and ecosystem dynamics exist, a proper understanding of their properties requires explicit investigation of these system–environment relations [1]. Monetary valuation of ecosystem service and natural capital may be useful to dem- onstrate their economic value but insufficient to measure the intrinsic worth of the life-support function of ecosystem. Assessing the intrinsic value of the environment in providing life-support services requires a new accounting system that can assure the contribution of a non-market oriented natural environment to the economic systems [2]. Emergy analysis is such an accounting method that can be used to assess complex relationships between the economy and its support envi- ronment because the work of both is expressed in equivalent terms [3,4]. The intrinsic value of ecosystems in biological terms is emphasized, whether human preference fully recognizes that value or not [2]. By introducing the emergy concept, Odum re-directed his focus from the interface between human societies and fossil sources to that between human societies and the environment, identifying the free ‘environmental work’ as the donor of resources supporting human activities [5]. 1007-5704/$ - see front matter Ó 2008 Elsevier B.V. All rights reserved. doi:10.1016/j.cnsns.2008.03.018 * Corresponding author. Tel.: +86 10 58807951; fax: +86 10 58800397. E-mail address: [email protected] (Z.F. Yang). Commun Nonlinear Sci Numer Simulat 14 (2009) 2827–2836 Contents lists available at ScienceDirect Commun Nonlinear Sci Numer Simulat journal homepage: www.elsevier.com/locate/cnsns
Transcript of Comparison of typical mega cities in China using emergy synthesis

Commun Nonlinear Sci Numer Simulat 14 (2009) 2827–2836
Contents lists available at ScienceDirect
Commun Nonlinear Sci Numer Simulat
journal homepage: www.elsevier .com/locate /cnsns
Comparison of typical mega cities in China using emergy synthesis
L.X. Zhang a, B. Chen a, Z.F. Yang a,*, G.Q. Chen a,b, M.M. Jiang a, G.Y. Liu a
a State Key Laboratory of Water Environment Simulation, School of Environment, Beijing 100875, Chinab National Laboratory for Complex Systems and Turbulence, Department of Mechanics, Peking University, Beijing 100871, China
a r t i c l e i n f o a b s t r a c t
Article history:Received 22 December 2007Received in revised form 25 February 2008Accepted 1 March 2008Available online 2 June 2008
PACS:87.23.�n89.60.�k
Keywords:EmergyResource structureResource use efficiencyMega urban system
1007-5704/$ - see front matter � 2008 Elsevier B.Vdoi:10.1016/j.cnsns.2008.03.018
* Corresponding author. Tel.: +86 10 58807951; fE-mail address: [email protected] (Z.F. Yang).
An emergy-based comparison analysis is conducted for three typical mega cities in China,i.e., Beijing, Shanghai and Guangzhou, from 1990 to 2005 in four perspectives includingemergy intensity, resource structure, environmental pressure and resource use efficiency.A new index of non-renewable emergy/money ratio is established to indicate the utiliza-tion efficiency of the non-renewable resources. The results show that for the three megaurban systems, Beijing, Shanghai and Guangzhou, the total emergy inputs were3.76E+23, 3.54E+23, 2.52E+23 sej in 2005, of which 64.88%, 91.45% and 72.28% wereimported from the outsides, respectively. As to the indicators of emergy intensity involvingthe total emergy use, emergy density and emergy use per cap, three cities exhibited similaroverall increase trends with annual fluctuations from 1990 to 2005. Shanghai achieved thehighest level of economic development and non-renewable resource use efficiency, andmeanwhile, lower proportion of renewable resource use and higher environmental pres-sure compared to those of Beijing and Guangzhou. Guangzhou has long term sustainabilityconsidering an amount of local renewable resources used, per capita emergy used, energyconsumption per unit GDP and the ratio of waste to renewable emergy. It can be concludedthat different emergy-based evaluation results arise from different geographical locations,resources endowments, industrial structures and urban orientations of the concernedmega cities.
� 2008 Elsevier B.V. All rights reserved.
1. Introduction
Urban economic and ecological systems are physically connected by the throughput of energy and matter from naturalecosystems, and by other environmental goods and services which sustain economic activities. Since mechanisms that linkregional economy and ecosystem dynamics exist, a proper understanding of their properties requires explicit investigation ofthese system–environment relations [1]. Monetary valuation of ecosystem service and natural capital may be useful to dem-onstrate their economic value but insufficient to measure the intrinsic worth of the life-support function of ecosystem.Assessing the intrinsic value of the environment in providing life-support services requires a new accounting system thatcan assure the contribution of a non-market oriented natural environment to the economic systems [2]. Emergy analysisis such an accounting method that can be used to assess complex relationships between the economy and its support envi-ronment because the work of both is expressed in equivalent terms [3,4]. The intrinsic value of ecosystems in biologicalterms is emphasized, whether human preference fully recognizes that value or not [2]. By introducing the emergy concept,Odum re-directed his focus from the interface between human societies and fossil sources to that between human societiesand the environment, identifying the free ‘environmental work’ as the donor of resources supporting human activities [5].
. All rights reserved.
ax: +86 10 58800397.

2828 L.X. Zhang et al. / Commun Nonlinear Sci Numer Simulat 14 (2009) 2827–2836
The theoretical and conceptual basis for emergy analysis is grounded in energetics and systems ecology. Emergy analysisconsiders all systems to be networks of energy flows and determines the emergy value of the systems involved through asynthetic approach, providing a general accounting mechanism that allows us to view the economy and the environmenton the same income statement and balance sheet [6]. Readers interested in more detailed descriptions and relevant analyz-ing procedures may consult Refs. [3,7–9]. Since the early 1980s, the emergy framework has been widely used to analyze sys-tems as diverse as ecosystems, industries, and economies [10–14]. In addition, the thermodynamic concept of emergy isextraordinary useful for the systematic evaluation of urban ecosystem, since it is necessary to obtain not only a reliable eval-uation of a system’s or region’s performance over a period of time, but also the system’s or region’s sustainability comparedwith those of other systems or regions [15]. Therefore, emergy synthesis has also been employed in the evaluation of urbanareas in recent years [2,15–19].
In this paper, a comparison analysis was conducted based on emergy for urban systems of Beijing, Shanghai and Guangz-hou, three typical and representative mega cities in China from 1990 to 2005. Time-series based comparison analysis of thesecities would shed light on both overall evolvement trends and regional variations.
2. Study areas
Different from other countries, the urban classification in China was made according to the non-agricultural populationsize (fei nong ye ren kou) in urban districts, excluding the county population under the jurisdiction of the city, of which megacities refer to those with population over 2 million [20]. According to the official statistical yearbook [21], the number of Chi-nese mega cities had reached 13 at the end of 2005, among which Beijing, Shanghai and Guangzhou are three most repre-sentative urban economic centers and internationally linked cities (Fig. 1). It is necessary to make a distinction that thewhole administrative region, i.e., the central urban districts plus the counties under the jurisdiction, were considered in prac-tice of our analysis, however. In other words, when we refer to a city, Beijing for example, its boundary covers the wholeadministrative area of Beijing rather than the central urban area.
General situations of Beijing, Shanghai and Guangzhou are listed in Table 1. Beijing, the capital city of China, is in thenorth of China and located at 115�250–117�300E and 39�280–41�250N in the temperate climatic zone with a mean annual tem-perature of 12 �C. Precipitation averages 640 mm per annum [22,23]. Recent years, heavy industries in Beijing are gradually
Fig. 1. Locations of Beijing, Shanghai and Guangzhou.

Table 1General situations of Beijing, Shanghai and Guangzhou in 2005
Item Beijing Shanghai Guangzhou
Area (km2) 16410.54 6340.50 7434.4Rainfall (mm) 410.7 1059.8 1938.2Associated river basin Haihe River basin Yangtse River basin Pearl River basinTotal population (104) 1538.0 1352.39 750.53Population density (person/km2) 937 2133 1010GDP (1010 USD) 8.40 11.2 6.44Per capita GDP (USD) 5464.29 8213.00 6784.13Per capita water resources (m3) 212.61 203.71 993.26Water consumption per thousand USD GDP (m3) 61.79 152.76 160.36Energy consumption per thousand USD GDP (tce) 0.98 1.07 0.95The proportion of the three industries 1.4:29.5:69.1 0.9:48.9:50.2 2.53:39.68:57.79
L.X. Zhang et al. / Commun Nonlinear Sci Numer Simulat 14 (2009) 2827–2836 2829
being replaced by the less-polluting industries such as financial and other service industries, and high-technology manufac-turing. Located in the middle of China’s mainland coastline (120�510–122�120E, 30�400–31�530N) and at the estuary of theYangtse River, Shanghai has an area of 6340.5 km2, with a mean annual temperature of 15 �C and a mean annual precipita-tion of 1100 mm. As the economic center of eastern China, its industrial structure includes heavy industries, such as steel,petrol, and automobile production, along with export processing and financial and other service industries [24,25]. Guangz-hou is located in south China between 112�570–114�30E and 22�260–23�560N, with an area of 7434.4 km2 and annual precip-itation of 1689.3–1876.5 mm. It lies in the piedmont and coastal plain physiographic regions, declining from the mountainareas in the north to sea level at the confluence of the Pearl River in the south. As an intensive agricultural area embeddedwith a dike-pond system, Guangzhou has experienced rapid economic development and urbanization over the past decades,with the value of GDP being 64.43 billion USD in 2005, double that of what it was in 1999 [26].
These concerned three cities share the same characteristics with most metropolitan regions in the world, being located atthe mouths of the three big rivers and originated from the fertile plains of these rivers, i.e., Yongding River (one branch ofHaihe River system), Yangtse River and Pearl River, respectively. Flat topography, fertile soils resulting from sedimentationfrom upstream areas and rivers set the fundamental natural resource basis for the urban development as shown in Fig. 1.However, all the three cities are confronted with many similar problems including pollutions, shortage of water resource,lost of the high-yield agricultural land, large floating population from rural areas and increased disaster risk.
3. Methodology
With regard to the varied qualities of energy inherent in the hierarchy of system components, emergy is defined as theavailable energy (exergy) of one kind previously used up directly and indirectly to make a service or product, usually quan-tified in solar energy equivalents and expressed as solar emJoules (sej) [27]. The amount of input emergy dissipated (avail-ability used up) per unit output exergy is termed as solar transformity and correspondingly, the solar emergy of a product orservice is calculated by multiplying units of energy by transformity [5,28]. It represents the emergy investment per unitproduct, and as such it is a measure of the way solar exergy is transformed and degraded [5].
Based on the energy circuit language introduced by Odum [8], the conceptual ecological economic system of an urbanarea can be represented to illustrate the material and energy flows and the organization of major components that utilizethose resources (Fig. 2). Pathways and interactions show the activities related to resources (e.g., production, consumption,import, export and accompanied economic exchanges) [6]. The ecological energetic flows into urban system can be aggre-gated into local free renewable resources (R) and non-renewable resources (N), materials (G), fuels (F) and services (S) fromoutside, and the corresponding outputs of city include products and waste (W). The relevant indices and ratios based onemergy flows can be used to evaluate the behavior of ecological economic systems. For the present case, it is appropriateto introduce the indices used in our analysis (see Table 2). A new index of non-renewable emergy/money ratio is establishedto indicate the resource use efficiency of non-renewable parts. The non-renewable emergy/money ratio is the ratio of totalnon-renewable emergy flow in the economy of a region or nation to the GDP of the region or nation, reflecting the non-renewable resources investment per unit product.
The emergy-based comparison analysis of case cities mainly focuses on four aspects, i.e., emergy intensity, resource struc-ture, environmental pressure and resource use efficiency. Meanwhile, previous evaluation results of Taipei by Huang [29]and Macao by Lei [15,19] are also incorporated for cross-references. Two years’ results are available for Taipei, i.e., 1991and 1998, while seven years’ results for Macao, i.e., 1990, 1993, 1995, 1997, 2000, 2003 and 2004.
Statistical data is then collected for detailed information on local production and consumption, imports and exports, andthe economy, as well as on local geomorphology (solar irradiation, rain, soil erosion, ore deposits, water resource, etc.) duringthe concerned period from 1990 to 2005 [21,30–32] and processed by transforming mass quantities (kg) and energy quan-tities (Joule) into equivalent sej through multiplying by the appropriate transformities. All the transformities refer to the15.83 baseline. Transformity references for respective row number of Tables 3–5 in Section 4 are as follows: rows 1, 2, 3,

Fig. 2. Systems diagram of the urban ecological economic system.
Table 2Emergy-based indices for comparison of case cities
Emergy index Expression
1 Renewable emergy flow R2 Flow from indigenous non-renewable reserves N3 Imported fuels F4 Imported goods G5 Imported services S6 Waste emergy W7 Total emergy used (sej) U = N + R + G + S + F8 Fraction used, locally renewable R/U9 Emergy self-sufficiency (R + N)/U10 Emergy density (sej/km2) U/area11 Per capita emergy used (sej per cap) U/population12 Ratio of waste to total emergy used W/U13 Fuel and electricity use per GDP (sej/USD) (F + electricity)/GDP14 Non-renewable emergy/money ratio (sej/USD) (N + G + F)/GDP
2830 L.X. Zhang et al. / Commun Nonlinear Sci Numer Simulat 14 (2009) 2827–2836
4, 6, 21 from [33]; rows 5 from [34]; rows 7, 11, 15, 18, 22, 23 from [8]; rows 8, 9, 10, 14 from [35]; rows 12, 24, 25 from [28];row 13 from [36]; rows 16, 17,19, 20 from [37].
In terms of emergy supply, the resources consumption of urban system involves local inputs, renewable or non-renew-able, and energies, materials and services imported from outside, domestic or aboard. The energy inputs from environmentalsources are sunlight, wind and rain. Due to their limited natural resources and relatively urbanized land uses, the emergyflows from renewable sources and local non-renewable sources to the urban economy in urban areas are relatively small.The degree of dependence on other ecosystems shows a weakness in the competitive capacity of a territorial system, becausethe availability of resources for development and maintenance is not under the system’s control [27]. In the long run, onlyprocesses with high percentage of renewable inputs are sustainable [38].
4. Results and discussion
The spread sheets of emergy accounting for Beijing, Shanghai and Guangzhou are listed in Tables 3–5, from which we cancalculate the total emergy uses of the three case cities to be 3.76E+23, 3.54E+23, 2.52E+23 sej in 2005, respectively. The totalemergy uses of three cities exhibited overall increase trends during the concerned period with different annual growth rates
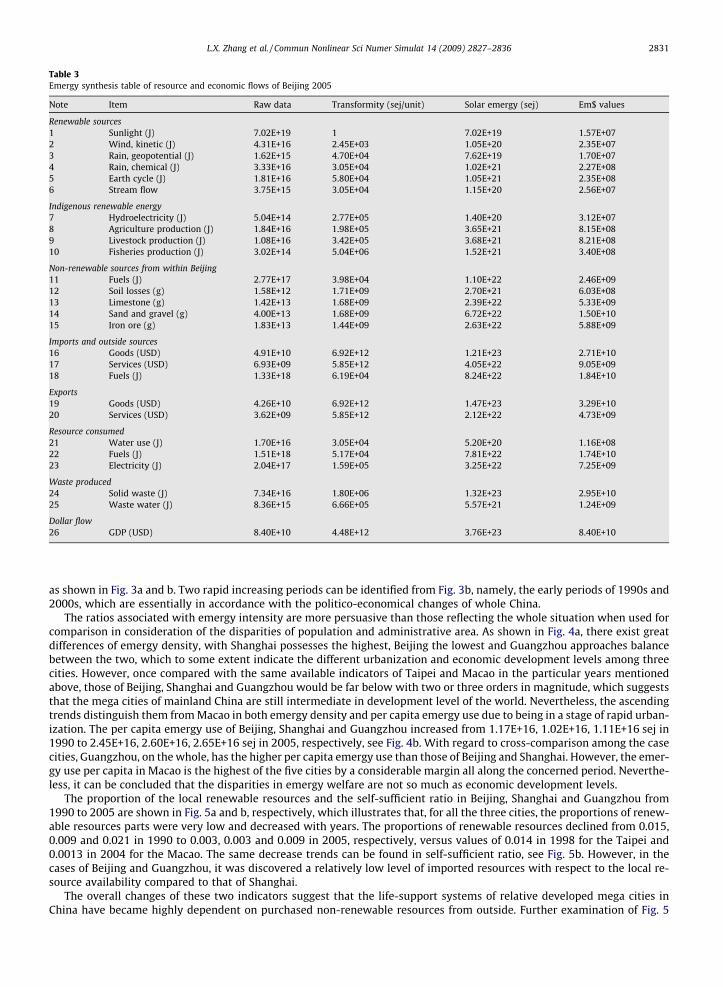
Table 3Emergy synthesis table of resource and economic flows of Beijing 2005
Note Item Raw data Transformity (sej/unit) Solar emergy (sej) Em$ values
Renewable sources1 Sunlight (J) 7.02E+19 1 7.02E+19 1.57E+072 Wind, kinetic (J) 4.31E+16 2.45E+03 1.05E+20 2.35E+073 Rain, geopotential (J) 1.62E+15 4.70E+04 7.62E+19 1.70E+074 Rain, chemical (J) 3.33E+16 3.05E+04 1.02E+21 2.27E+085 Earth cycle (J) 1.81E+16 5.80E+04 1.05E+21 2.35E+086 Stream flow 3.75E+15 3.05E+04 1.15E+20 2.56E+07
Indigenous renewable energy7 Hydroelectricity (J) 5.04E+14 2.77E+05 1.40E+20 3.12E+078 Agriculture production (J) 1.84E+16 1.98E+05 3.65E+21 8.15E+089 Livestock production (J) 1.08E+16 3.42E+05 3.68E+21 8.21E+0810 Fisheries production (J) 3.02E+14 5.04E+06 1.52E+21 3.40E+08
Non-renewable sources from within Beijing11 Fuels (J) 2.77E+17 3.98E+04 1.10E+22 2.46E+0912 Soil losses (g) 1.58E+12 1.71E+09 2.70E+21 6.03E+0813 Limestone (g) 1.42E+13 1.68E+09 2.39E+22 5.33E+0914 Sand and gravel (g) 4.00E+13 1.68E+09 6.72E+22 1.50E+1015 Iron ore (g) 1.83E+13 1.44E+09 2.63E+22 5.88E+09
Imports and outside sources16 Goods (USD) 4.91E+10 6.92E+12 1.21E+23 2.71E+1017 Services (USD) 6.93E+09 5.85E+12 4.05E+22 9.05E+0918 Fuels (J) 1.33E+18 6.19E+04 8.24E+22 1.84E+10
Exports19 Goods (USD) 4.26E+10 6.92E+12 1.47E+23 3.29E+1020 Services (USD) 3.62E+09 5.85E+12 2.12E+22 4.73E+09
Resource consumed21 Water use (J) 1.70E+16 3.05E+04 5.20E+20 1.16E+0822 Fuels (J) 1.51E+18 5.17E+04 7.81E+22 1.74E+1023 Electricity (J) 2.04E+17 1.59E+05 3.25E+22 7.25E+09
Waste produced24 Solid waste (J) 7.34E+16 1.80E+06 1.32E+23 2.95E+1025 Waste water (J) 8.36E+15 6.66E+05 5.57E+21 1.24E+09
Dollar flow26 GDP (USD) 8.40E+10 4.48E+12 3.76E+23 8.40E+10
L.X. Zhang et al. / Commun Nonlinear Sci Numer Simulat 14 (2009) 2827–2836 2831
as shown in Fig. 3a and b. Two rapid increasing periods can be identified from Fig. 3b, namely, the early periods of 1990s and2000s, which are essentially in accordance with the politico-economical changes of whole China.
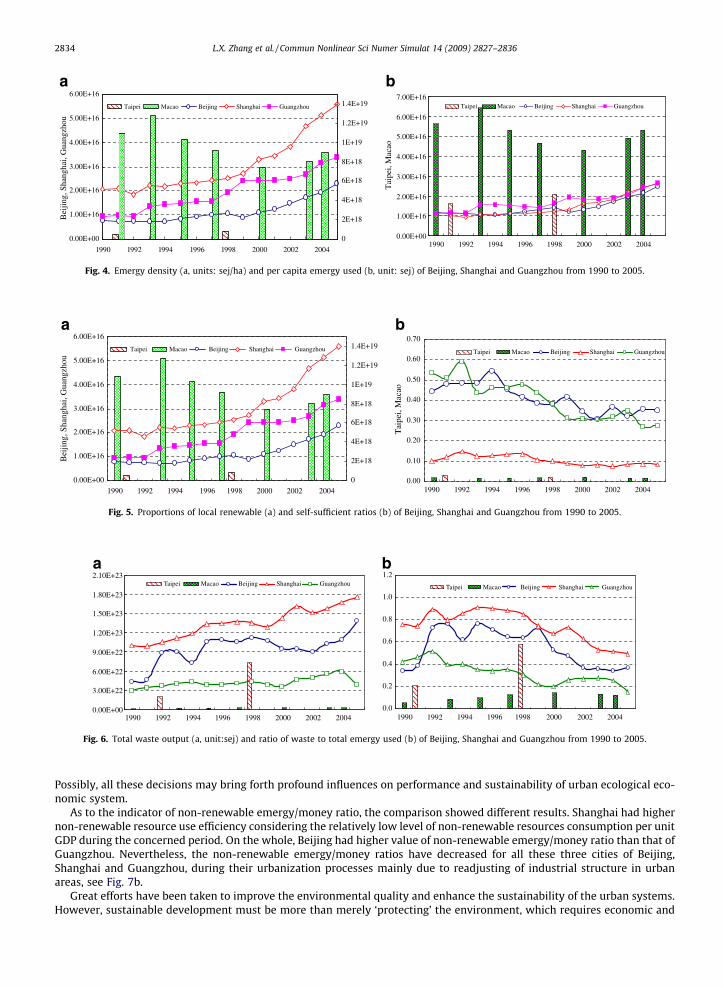
The ratios associated with emergy intensity are more persuasive than those reflecting the whole situation when used forcomparison in consideration of the disparities of population and administrative area. As shown in Fig. 4a, there exist greatdifferences of emergy density, with Shanghai possesses the highest, Beijing the lowest and Guangzhou approaches balancebetween the two, which to some extent indicate the different urbanization and economic development levels among threecities. However, once compared with the same available indicators of Taipei and Macao in the particular years mentionedabove, those of Beijing, Shanghai and Guangzhou would be far below with two or three orders in magnitude, which suggeststhat the mega cities of mainland China are still intermediate in development level of the world. Nevertheless, the ascendingtrends distinguish them from Macao in both emergy density and per capita emergy use due to being in a stage of rapid urban-ization. The per capita emergy use of Beijing, Shanghai and Guangzhou increased from 1.17E+16, 1.02E+16, 1.11E+16 sej in1990 to 2.45E+16, 2.60E+16, 2.65E+16 sej in 2005, respectively, see Fig. 4b. With regard to cross-comparison among the casecities, Guangzhou, on the whole, has the higher per capita emergy use than those of Beijing and Shanghai. However, the emer-gy use per capita in Macao is the highest of the five cities by a considerable margin all along the concerned period. Neverthe-less, it can be concluded that the disparities in emergy welfare are not so much as economic development levels.
The proportion of the local renewable resources and the self-sufficient ratio in Beijing, Shanghai and Guangzhou from1990 to 2005 are shown in Fig. 5a and b, respectively, which illustrates that, for all the three cities, the proportions of renew-able resources parts were very low and decreased with years. The proportions of renewable resources declined from 0.015,0.009 and 0.021 in 1990 to 0.003, 0.003 and 0.009 in 2005, respectively, versus values of 0.014 in 1998 for the Taipei and0.0013 in 2004 for the Macao. The same decrease trends can be found in self-sufficient ratio, see Fig. 5b. However, in thecases of Beijing and Guangzhou, it was discovered a relatively low level of imported resources with respect to the local re-source availability compared to that of Shanghai.
The overall changes of these two indicators suggest that the life-support systems of relative developed mega cities inChina have became highly dependent on purchased non-renewable resources from outside. Further examination of Fig. 5
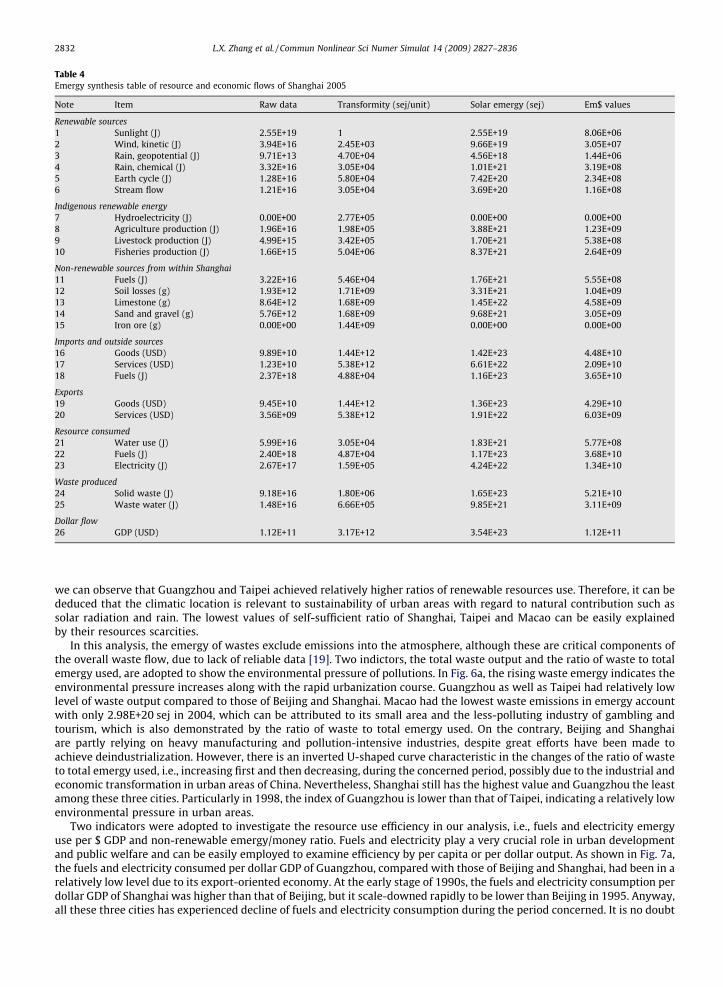
Table 4Emergy synthesis table of resource and economic flows of Shanghai 2005
Note Item Raw data Transformity (sej/unit) Solar emergy (sej) Em$ values
Renewable sources1 Sunlight (J) 2.55E+19 1 2.55E+19 8.06E+062 Wind, kinetic (J) 3.94E+16 2.45E+03 9.66E+19 3.05E+073 Rain, geopotential (J) 9.71E+13 4.70E+04 4.56E+18 1.44E+064 Rain, chemical (J) 3.32E+16 3.05E+04 1.01E+21 3.19E+085 Earth cycle (J) 1.28E+16 5.80E+04 7.42E+20 2.34E+086 Stream flow 1.21E+16 3.05E+04 3.69E+20 1.16E+08
Indigenous renewable energy7 Hydroelectricity (J) 0.00E+00 2.77E+05 0.00E+00 0.00E+008 Agriculture production (J) 1.96E+16 1.98E+05 3.88E+21 1.23E+099 Livestock production (J) 4.99E+15 3.42E+05 1.70E+21 5.38E+0810 Fisheries production (J) 1.66E+15 5.04E+06 8.37E+21 2.64E+09
Non-renewable sources from within Shanghai11 Fuels (J) 3.22E+16 5.46E+04 1.76E+21 5.55E+0812 Soil losses (g) 1.93E+12 1.71E+09 3.31E+21 1.04E+0913 Limestone (g) 8.64E+12 1.68E+09 1.45E+22 4.58E+0914 Sand and gravel (g) 5.76E+12 1.68E+09 9.68E+21 3.05E+0915 Iron ore (g) 0.00E+00 1.44E+09 0.00E+00 0.00E+00
Imports and outside sources16 Goods (USD) 9.89E+10 1.44E+12 1.42E+23 4.48E+1017 Services (USD) 1.23E+10 5.38E+12 6.61E+22 2.09E+1018 Fuels (J) 2.37E+18 4.88E+04 1.16E+23 3.65E+10
Exports19 Goods (USD) 9.45E+10 1.44E+12 1.36E+23 4.29E+1020 Services (USD) 3.56E+09 5.38E+12 1.91E+22 6.03E+09
Resource consumed21 Water use (J) 5.99E+16 3.05E+04 1.83E+21 5.77E+0822 Fuels (J) 2.40E+18 4.87E+04 1.17E+23 3.68E+1023 Electricity (J) 2.67E+17 1.59E+05 4.24E+22 1.34E+10
Waste produced24 Solid waste (J) 9.18E+16 1.80E+06 1.65E+23 5.21E+1025 Waste water (J) 1.48E+16 6.66E+05 9.85E+21 3.11E+09
Dollar flow26 GDP (USD) 1.12E+11 3.17E+12 3.54E+23 1.12E+11
2832 L.X. Zhang et al. / Commun Nonlinear Sci Numer Simulat 14 (2009) 2827–2836
we can observe that Guangzhou and Taipei achieved relatively higher ratios of renewable resources use. Therefore, it can bededuced that the climatic location is relevant to sustainability of urban areas with regard to natural contribution such assolar radiation and rain. The lowest values of self-sufficient ratio of Shanghai, Taipei and Macao can be easily explainedby their resources scarcities.
In this analysis, the emergy of wastes exclude emissions into the atmosphere, although these are critical components ofthe overall waste flow, due to lack of reliable data [19]. Two indictors, the total waste output and the ratio of waste to totalemergy used, are adopted to show the environmental pressure of pollutions. In Fig. 6a, the rising waste emergy indicates theenvironmental pressure increases along with the rapid urbanization course. Guangzhou as well as Taipei had relatively lowlevel of waste output compared to those of Beijing and Shanghai. Macao had the lowest waste emissions in emergy accountwith only 2.98E+20 sej in 2004, which can be attributed to its small area and the less-polluting industry of gambling andtourism, which is also demonstrated by the ratio of waste to total emergy used. On the contrary, Beijing and Shanghaiare partly relying on heavy manufacturing and pollution-intensive industries, despite great efforts have been made toachieve deindustrialization. However, there is an inverted U-shaped curve characteristic in the changes of the ratio of wasteto total emergy used, i.e., increasing first and then decreasing, during the concerned period, possibly due to the industrial andeconomic transformation in urban areas of China. Nevertheless, Shanghai still has the highest value and Guangzhou the leastamong these three cities. Particularly in 1998, the index of Guangzhou is lower than that of Taipei, indicating a relatively lowenvironmental pressure in urban areas.
Two indicators were adopted to investigate the resource use efficiency in our analysis, i.e., fuels and electricity emergyuse per $ GDP and non-renewable emergy/money ratio. Fuels and electricity play a very crucial role in urban developmentand public welfare and can be easily employed to examine efficiency by per capita or per dollar output. As shown in Fig. 7a,the fuels and electricity consumed per dollar GDP of Guangzhou, compared with those of Beijing and Shanghai, had been in arelatively low level due to its export-oriented economy. At the early stage of 1990s, the fuels and electricity consumption perdollar GDP of Shanghai was higher than that of Beijing, but it scale-downed rapidly to be lower than Beijing in 1995. Anyway,all these three cities has experienced decline of fuels and electricity consumption during the period concerned. It is no doubt
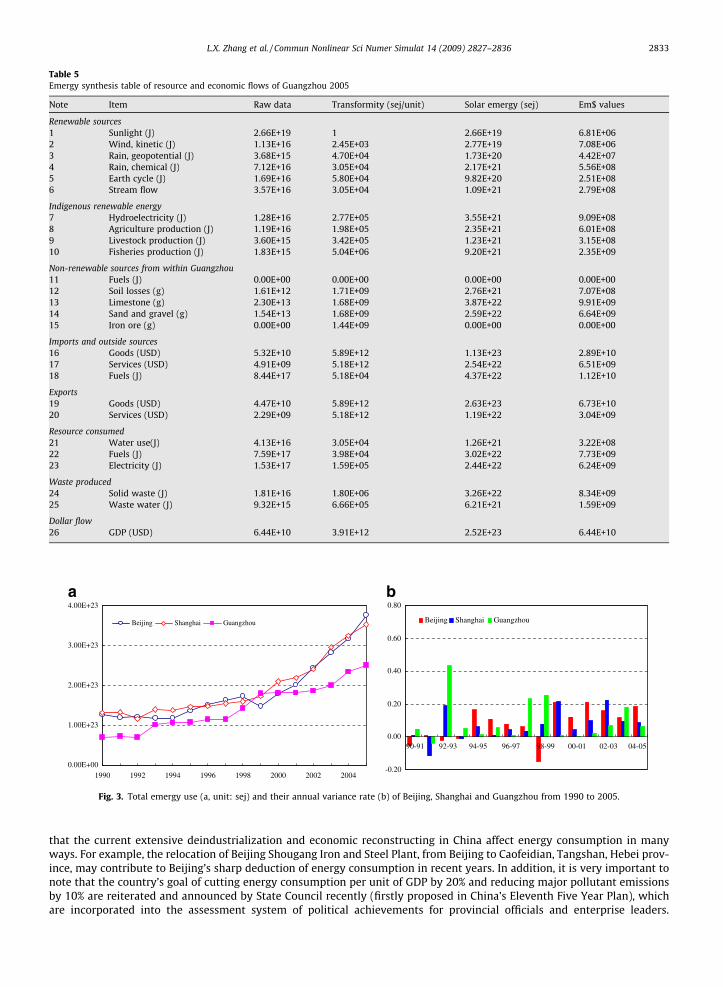
Table 5Emergy synthesis table of resource and economic flows of Guangzhou 2005
Note Item Raw data Transformity (sej/unit) Solar emergy (sej) Em$ values
Renewable sources1 Sunlight (J) 2.66E+19 1 2.66E+19 6.81E+062 Wind, kinetic (J) 1.13E+16 2.45E+03 2.77E+19 7.08E+063 Rain, geopotential (J) 3.68E+15 4.70E+04 1.73E+20 4.42E+074 Rain, chemical (J) 7.12E+16 3.05E+04 2.17E+21 5.56E+085 Earth cycle (J) 1.69E+16 5.80E+04 9.82E+20 2.51E+086 Stream flow 3.57E+16 3.05E+04 1.09E+21 2.79E+08
Indigenous renewable energy7 Hydroelectricity (J) 1.28E+16 2.77E+05 3.55E+21 9.09E+088 Agriculture production (J) 1.19E+16 1.98E+05 2.35E+21 6.01E+089 Livestock production (J) 3.60E+15 3.42E+05 1.23E+21 3.15E+0810 Fisheries production (J) 1.83E+15 5.04E+06 9.20E+21 2.35E+09
Non-renewable sources from within Guangzhou11 Fuels (J) 0.00E+00 0.00E+00 0.00E+00 0.00E+0012 Soil losses (g) 1.61E+12 1.71E+09 2.76E+21 7.07E+0813 Limestone (g) 2.30E+13 1.68E+09 3.87E+22 9.91E+0914 Sand and gravel (g) 1.54E+13 1.68E+09 2.59E+22 6.64E+0915 Iron ore (g) 0.00E+00 1.44E+09 0.00E+00 0.00E+00
Imports and outside sources16 Goods (USD) 5.32E+10 5.89E+12 1.13E+23 2.89E+1017 Services (USD) 4.91E+09 5.18E+12 2.54E+22 6.51E+0918 Fuels (J) 8.44E+17 5.18E+04 4.37E+22 1.12E+10
Exports19 Goods (USD) 4.47E+10 5.89E+12 2.63E+23 6.73E+1020 Services (USD) 2.29E+09 5.18E+12 1.19E+22 3.04E+09
Resource consumed21 Water use(J) 4.13E+16 3.05E+04 1.26E+21 3.22E+0822 Fuels (J) 7.59E+17 3.98E+04 3.02E+22 7.73E+0923 Electricity (J) 1.53E+17 1.59E+05 2.44E+22 6.24E+09
Waste produced24 Solid waste (J) 1.81E+16 1.80E+06 3.26E+22 8.34E+0925 Waste water (J) 9.32E+15 6.66E+05 6.21E+21 1.59E+09
Dollar flow26 GDP (USD) 6.44E+10 3.91E+12 2.52E+23 6.44E+10
0.00E+00
1.00E+23
2.00E+23
3.00E+23
4.00E+23
1990 1992 1994 1996 1998 2000 2002 2004
Beijing Shanghai Guangzhou
-0.20
0.00
0.20
0.40
0.60
0.80
Beijing Shanghai Guangzhou
90-91 92-93 94-95 96-97 98-99 00-01 02-03 04-05
a b
Fig. 3. Total emergy use (a, unit: sej) and their annual variance rate (b) of Beijing, Shanghai and Guangzhou from 1990 to 2005.
L.X. Zhang et al. / Commun Nonlinear Sci Numer Simulat 14 (2009) 2827–2836 2833
that the current extensive deindustrialization and economic reconstructing in China affect energy consumption in manyways. For example, the relocation of Beijing Shougang Iron and Steel Plant, from Beijing to Caofeidian, Tangshan, Hebei prov-ince, may contribute to Beijing’s sharp deduction of energy consumption in recent years. In addition, it is very important tonote that the country’s goal of cutting energy consumption per unit of GDP by 20% and reducing major pollutant emissionsby 10% are reiterated and announced by State Council recently (firstly proposed in China’s Eleventh Five Year Plan), whichare incorporated into the assessment system of political achievements for provincial officials and enterprise leaders.
0.00E+00
1.00E+16
2.00E+16
3.00E+16
4.00E+16
5.00E+16
6.00E+16
1990 1992 1994 1996 1998 2000 2002 2004
Bei
jing,
Sha
ngha
i, G
uang
zhou
0
2E+18
4E+18
6E+18
8E+18
1E+19
1.2E+19
1.4E+19Taipei Macao Beijing Shanghai Guangzhou
0.00E+00
1.00E+16
2.00E+16
3.00E+16
4.00E+16
5.00E+16
6.00E+16
7.00E+16
1990 1992 1994 1996 1998 2000 2002 2004
Taipei Macao
Tai
pei,
Mac
ao
Beijing Shanghai Guangzhou
a b
Fig. 4. Emergy density (a, units: sej/ha) and per capita emergy used (b, unit: sej) of Beijing, Shanghai and Guangzhou from 1990 to 2005.
0.00
0.10
0.20
0.30
0.40
0.50
0.60
0.70
1990 1992 1994 1996 1998 2000 2002 2004
Taipei Macao
Tai
pei,
Mac
ao
Beijing Shanghai Guangzhou
0.00E+00
1.00E+16
2.00E+16
3.00E+16
4.00E+16
5.00E+16
6.00E+16
1990 1992 1994 1996 1998 2000 2002 2004
Bei
jing,
Sha
ngha
i, G
uang
zhou
0
2E+18
4E+18
6E+18
8E+18
1E+19
1.2E+19
1.4E+19Taipei Macao Beijing Shanghai Guangzhou
a b
Fig. 5. Proportions of local renewable (a) and self-sufficient ratios (b) of Beijing, Shanghai and Guangzhou from 1990 to 2005.
0.00E+00
3.00E+22
6.00E+22
9.00E+22
1.20E+23
1.50E+23
1.80E+23
2.10E+23
1990 1992 1994 1996 1998 2000 2002 2004
Taipei Macao Beijing Shanghai Guangzhou
0.0
0.2
0.4
0.6
0.8
1.0
1.2
1990 1992 1994 1996 1998 2000 2002 2004
Taipei Macao Beijing Shanghai Guangzhou
a b
Fig. 6. Total waste output (a, unit:sej) and ratio of waste to total emergy used (b) of Beijing, Shanghai and Guangzhou from 1990 to 2005.
2834 L.X. Zhang et al. / Commun Nonlinear Sci Numer Simulat 14 (2009) 2827–2836
Possibly, all these decisions may bring forth profound influences on performance and sustainability of urban ecological eco-nomic system.
As to the indicator of non-renewable emergy/money ratio, the comparison showed different results. Shanghai had highernon-renewable resource use efficiency considering the relatively low level of non-renewable resources consumption per unitGDP during the concerned period. On the whole, Beijing had higher value of non-renewable emergy/money ratio than that ofGuangzhou. Nevertheless, the non-renewable emergy/money ratios have decreased for all these three cities of Beijing,Shanghai and Guangzhou, during their urbanization processes mainly due to readjusting of industrial structure in urbanareas, see Fig. 7b.
Great efforts have been taken to improve the environmental quality and enhance the sustainability of the urban systems.However, sustainable development must be more than merely ‘protecting’ the environment, which requires economic and

0.00E+00
5.00E+11
1.00E+12
1.50E+12
2.00E+12
2.50E+12
3.00E+12
3.50E+12
1990 1992 1994 1996 1998 2000 2002 2004
Beijing Shanghai Guangzhou
0.00E+00
2.00E+12
4.00E+12
6.00E+12
8.00E+12
1.00E+13
1.20E+13
1.40E+13
1990 1992 1994 1996 1998 2000 2002 2004
Beijing Shanghai Guangzhou
a b
Fig. 7. Fuels and electricity emergy use per $ GDP (a, unit: sej/$) and non-renewable emergy/money ratio (b, unit: sej/$) of Beijing, Shanghai and Guangzhoufrom 1990 to 2005.
L.X. Zhang et al. / Commun Nonlinear Sci Numer Simulat 14 (2009) 2827–2836 2835
social changes to reduce the need for environmental protection [39]. Nevertheless, the politico-economical changes, no mat-ter macro-controls or strategic adjustments, will play an essential role in reshaping urban systems in China. Therefore, it isno doubt that the current extensive deindustrialization and economic reconstructing in China will further affect the evolve-ment process of urban systems in many ways with regard to sustainability.
5. Conclusions
Systematic evaluation of urban systems is crucial to achieve the mega city’s goal of sustainable development. With emer-gy analysis based on ecological thermodynamics, comparative investigations have been made among typical mega cities ofBeijing, Shanghai and Guangzhou in the perspective of evolutionary process from 1990 to 2005. Three cities exhibited similaroverall trends of increase of total emergy use with annual fluctuations from 1990 to 2005. Although the mega cities of main-land China are intermediate in development level in the world, their life-support systems have become highly dependent onnon-renewable and purchased resources from outside. Concluded from the indicators such as emergy density, Shanghaiachieved highest levels of economic development and urbanization among the three case cities. However, the unfavorableaspects associated with urban system of Shanghai were also very obvious, e.g., lower proportion of renewable resource useand higher environmental pressure compared to those of Beijing and Guangzhou, which would definitely imperil its sustain-ability to some extent. Comparatively, Guangzhou has long term sustainability considering the fairly ideal indicators of lo-cally renewable fraction used, per capita emergy used, energy consumption per unit GDP and the ratio of waste to renewableemergy.
This paper presents a preliminary comparison analysis of typical mega cities and much more work needs to be done toextend analysis to urban agglomerations (between or within) or to find out to what extent the deindustrialization processaffects the urban sustainability. In addition, it is still important to note that although emergy analysis offers powerful indicesfor evaluating urban system performance, an integrated indicator system aimed at regional comparison of ecological com-petitive power of urban system remains a problem for the further research.
Acknowledgement
This work is supported by the National Basic Research Program of China (973 Program, Grant No. 2005CB724204) andNational Natural Science Foundation (Grant No. 40701023).
References
[1] Pulselli R, Rustici M, Marchettini N. An integrated framework for regional studies: emergy based spatial analysis of the province of Cagliari. EnvironMonit Assess 2007;133:1–13.
[2] Huang SL. Urban ecosystems, energetic hierarchies, and ecological economics of Taipei metropolis. J Environ Manage 1998;52:39–51.[3] Odum HT. Self-organization, transformity, and information. Science 1988;242:1132–9.[4] Campbell DE. Emergy analysis of human carrying capacity and regional sustainability: an example using the state of Maine. Environ Monit Assess
1998;51:531–69.[5] Sciubba E, Ulgiati S. Emergy and exergy analyses: complementary methods or irreducible ideological options? Energy 2005;30:1953–88.[6] Campbell D, Meisch M, Demoss T, Pomponio J, Bradley M. Keeping the books for environmental systems: an emergy analysis of West Virginia. Environ
Monit Assess 2004;94:217–30.[7] Odum HT. Environment, power, and society. New York: Wiley; 1971.[8] Odum HT. Environmental accounting: emergy and environmental decision making. New York: Wiley; 1996.[9] Brown M T, Ulgiati S. Energy quality, emergy, and transformity: H.T. Odum’s contributions to quantifying and understanding systems. Ecol Modell
2004;178:201–13.[10] Ulgiati S, Odum HT, Bastianoni S. Emergy use, environmental loading and sustainability an emergy analysis of Italy. Ecol Modell 1994;73:215–68.[11] Nelson M, Odum HT, Brown MT, Alling A. Living off the land: resource efficiency of wetland wastewater treatment. Adv Space Res 2001;27:1547–56.

2836 L.X. Zhang et al. / Commun Nonlinear Sci Numer Simulat 14 (2009) 2827–2836
[12] Ulgiati S, Brown MT. Quantifying the environmental support for dilution and abatement of process emissions: the case of electricity production. J CleanProd 2002;10:335–48.
[13] Lefroy E, Rydberg T. Emergy evaluation of three cropping systems in southwestern Australia. Ecol Modell 2003;161:193–209.[14] Zhang LX, Yang ZF, Chen GQ. Emergy analysis of cropping–grazing system in inner Mongolia autonomous region, China. Energy Policy
2007;35:3843–55.[15] Lei K, Wang Z. Emergy synthesis of tourism-based urban ecosystem. J Environ Manage. doi:10.1016/j.jenvman.2007.04.009.[16] Huang SL, Wu SC, Chen WB. Ecosystem, environmental quality and ecotechnology in the Taipei metropolitan region. Ecol Eng 1995;4:233–48.[17] Huang SL, Hsu WL. Materials flow analysis and emergy evaluation of Taipei’s urban construction. Landscape Urban Plan 2003;63:61–74.[18] Higgins JB. Emergy analysis of the Oak openings region. Ecol Eng 2003;21:75–109.[19] Lei K, Wang Z, Ton SS. Holistic emergy analysis of Macao. Ecol Eng 2008;32:30–43.[20] Roger CK, Zhao ZX. The relationship between administrative hierarchy position and city size development in China. GeoJournal 2002;56:97–112.[21] CCSY. China city statistical yearbook 2006. Beijing: China Statistical Press; 2007.[22] Li F, Wang R, Paulussen J, Liu X. Comprehensive concept planning of urban greening based on ecological principles: a case study in Beijing, China.
Landscape Urban Plan 2005;72:325–36.[23] He C, Okada N, Zhang Q, Shi P, Zhang J. Modeling urban expansion scenarios by coupling cellular automata model and system dynamic model in
Beijing, China. Appl Geogr 2006;26:323–45.[24] Wang JY, Da LJ, Song K, Li BL.Temporal variations of surface water quality in urban, suburban and rural areas during rapid urbanization in Shanghai,
China. Environ Pollut. doi:10.1016/j.envpol.2007.06.050.[25] Chan CK, Yao X. Air pollution in mega cities in China. Atmos Environ 2008;42:1–42.[26] Yu XJ, Ng CN. Spatial and temporal dynamics of urban sprawl along two urban-rural transects: a case study of Guangzhou, China. Landscape Urban
Plan 2007;79:96–109.[27] Pulselli RM, Pulselli FM, Rustici M. Emergy accounting of the Province of Siena: towards a thermodynamic geography for regional studies. J Environ
Manage 2008;86:342–53.[28] Huang SL, Chen CW. Theory of urban energetics and mechanisms of urban development. Ecol Modell 2005;189:49–71.[29] Huang SL. Energy basis for urban ecological economic system. Taiwan: James Publishing House; 2004.[30] BSY. Beijing statistical yearbook 1991–2006. Beijing: China Statistics Press; 1992–2007.[31] SSY. Shanghai statistical yearbook 1991–2006. Beijing: China Statistics Press; 1992–2007.[32] GSY. Guangzhou statistical yearbook 1991–2006. Beijing: China Statistics Press; 1992–2007.[33] Odum HT, Brown MT, Brandt-Williams S. Handbook of emergy evaluation, Folio #1. Gainesville: University of Florida; 2000.[34] Odum HT. Handbook of emergy evaluation, Folio #2. Gainesville: University of Florida; 2000.[35] Cohen MJ, Brown MT, Shepherd KD. Estimating the environmental costs of soil erosion at multiple scales in Kenya using emergy synthesis. Agric
Ecosyst Environ 2006;114:249–69.[36] Brandt-Williams SL. Handbook of emergy evaluation, Folio #4. Gainesville: University of Florida; 2001.[37] Jiang MM, Chen GQ. Emergy analysis of Chinese society 1980–2005. Systems ecology reports, National Laboratory for Turbulence and Complex
Systems, Peking University; 2007.[38] Brown MT, Ulgiati S. Emergy-based indices and ratios to evaluate sustainability: monitoring economies and technology toward environmentally sound
innovation. Ecol Eng 1997;9:51–69.[39] Huang SL, Wong JH, Chen TC. A framework of indicator system for measuring Taipei’s urban sustainability. Landscape Urban Plan 1998;42:15–27.