STUDY MATERIAL FOR B.COM ECONOMICS FOR COMPETITIVE ...
46
STUDY MATERIAL FOR B.COM ECONOMICS FOR COMPETITIVE EXAMINATION - I SEMESTER - III, ACADEMIC YEAR 2020 - 21 Page 1 of 46 UNIT CONTENT PAGE Nr I INTRODUCTION TO ECONOMICS 02 II CONSUMPTION 08 III PRODUCTION AND DISTRIBUTION 25 IV PRODUCT PRICING 36 V INVESTMENT 43
-
Upload
khangminh22 -
Category
Documents
-
view
1 -
download
0
Transcript of STUDY MATERIAL FOR B.COM ECONOMICS FOR COMPETITIVE ...

STUDY MATERIAL FOR B.COM ECONOMICS FOR COMPETITIVE EXAMINATION - I
SEMESTER - III, ACADEMIC YEAR 2020 - 21
Page 1 of 46
UNIT CONTENT PAGE Nr
I INTRODUCTION TO ECONOMICS 02
II CONSUMPTION 08
III PRODUCTION AND DISTRIBUTION 25
IV PRODUCT PRICING 36
V INVESTMENT 43
STUDY MATERIAL FOR B.COM ECONOMICS FOR COMPETITIVE EXAMINATION - I
SEMESTER - III, ACADEMIC YEAR 2020 - 21
Page 2 of 46
UNIT – I INTRODUCTION OF ECONOMICS
Introduction of Economics
Economics deals with the day to day activities of human being’s life. In all, human beings are enjoying the economic activities such as consumption, production, exchange and distribution. In simple terms economics is concerned with the aspects of human behavior.
Meaning of Economics ThetermEconomicsisderivedfromthetwoGreekwords„Oikos‟(meanshouse)and “Nomos‟ (means manage). If these two words are merged “Oikonomia” it gives the meaning ‘household management’. Definition of Economics
“Economics is a science of wealth”. Adam Smith Adam Smith is commonly known as the ‘Father of Economics’ There are four important definitions of economics to understand the basic concept of
economics. They are, 1. Wealth Definition - Adam Smith 2. Welfare Definition - Alfred Marshall 3. Scarcity Definition - Lionel Robbins 4. Growth Definition - Paul. A.Samuelson
Wealth
The classical economists defined economics as the science of wealth. Adam Smith in his famous book, “An Enquiry into the Nature and Causes of the Wealth of Nations”, which was published in 1776, described economics systematically.
Definition
“Economics is an enquiry into the nature and causes of the wealth of nations”. Adam Smith
Welfare Alfred Marshall, definitions are described as “Welfare Definitions”. Alfred Marshall in
his famous book “Principles of Economics” published in 1980.
Definition “Economics is a study of mankind in the ordinary business of life”.
Alfred Marshall Scarcity
In 1932, Lionel Robbins brought out his famous book entitled “An Essay on the Nature and Significance of Economics science” and introduced „the scarcity definition‟ of economics.
Definition
“Economics is a science which studies human behavior as a relationship between ends and scarce means which have alternative uses”.
STUDY MATERIAL FOR B.COM ECONOMICS FOR COMPETITIVE EXAMINATION - I
SEMESTER - III, ACADEMIC YEAR 2020 - 21
Page 3 of 46
Lionel Robbins Lionel Robbins‟ definition is based on the following facts:
1. Economics is a Science 2. Wants are unlimited 3. Means are scarce 4. Means have alternative uses
Growth
Modern economics is growth oriented. The growth economics is the major concern of all economic theories. The modern economists describe economics as follows:
Definition
“Economics is the study of how men and society end up choosing, with or without the use of money, to employ scarce productive resources that could have alternative uses, to produce various commodities and distribute them for consumption, now or in the future, among various persons and groups in society. It analyses the costs and benefits of improving patterns of resource allocation” Paul A. Samuelson
1. Human behavior 2. Allocation of scarce resources 3. Alternative uses of resources
Scope (or) Subject - Matter of Economics
1. Economics is a social science. 2. It deals with human beings. 3. It deals with man and his efforts to satisfy wants. 4. Human wants are the starting point of all economic activities. 5. Human wants are unlimited. 6. Human beings spent efforts to earn income. 7. He uses that income to satisfy his wants.
8. Wants Efforts Wealth Satisfaction” this is called as the circle of economics.
BASIC CONCEPT OF ECONOMICS Utility
1. Value 2. Price 3. Wealth 4. Goods
Wants
Satisfaction Efforts
Wealth

STUDY MATERIAL FOR B.COM ECONOMICS FOR COMPETITIVE EXAMINATION - I
SEMESTER - III, ACADEMIC YEAR 2020 - 21
Page 4 of 46
Utility Utility is the want satisfying quality of goods. The forms of utility are natural utility, form
utility, place utility, time utility and service utility.
Value There are two kinds of value - value in use and value in exchange. Free goods have no
value in exchange. 1. .It must possess utility. 2. It must be scarce. 3. It must be transferable.
Price
Value expressed in terms of money is called price. Value and price are two different concepts. They are not interchangeable.
Wealth
In economics, anything which has value is called wealth. 1. Wealth possesses utility 2. It is scarce 3. It is transferable
Individual wealth, public wealth, national wealth, international wealth, potential wealth representative wealth and negative wealth are the main types of wealth.
Goods
All things that satisfy human wants are called goods‟ in economics. intangible or invisible items -like services of a teacher, doctor, advocate, nurse.
Tangible or visible items - like table, chair, pen, car, bread, fan, soap, gas, wine, rice.
TYPES (OR) KINDS (OR) CLASSIFICATION OF GOODS There are two classifications of goods as follows:
1. Free goods 2. Economic goods 3. Consumer goods 4. Producer goods 5. Material goods 6. Non-material goods 7. Transferable goods 8. Non-transferable goods 9. Durable goods 10. Perishable goods 11. Private goods 12. Public goods
STUDY MATERIAL FOR B.COM ECONOMICS FOR COMPETITIVE EXAMINATION - I
SEMESTER - III, ACADEMIC YEAR 2020 - 21
Page 5 of 46
Free Goods
Free goods are the gifts of nature. These are not produced by man. Man need not to pay for them.
For example, Air, Sunshine, Sea water are free good provided by nature.
Economic goods All the goods which are made by man, these goods are available at a price. Economic
goods are also known scarce goods. For example, a pen, a car, a chair, petrol, milk, wheat.
Consumer goods Consumer goods are those goods which can be used for ultimate consumption. For example, food, pen, fruits, vegetables, bread, biscuits are frequently used consumer
goods.
Producer goods Producer goods are those goods which are not consumed directly. They are used to
produce other goods. For example, Machines, tools, factory buildings.
Material goods Goods which are tangible or visible are material goods. For example, a table, a chair, a black board, buildings, roads, a pen, a bed, land, cash,
books, a mirror, a wash basin, etc.
1.Non-material goods Non-material goods are cannot be seen and cannot be touched. They do not have a
particular shape. For example, services of doctors, advocates, teachers, pilots, drivers, electricians,
nurses, workers.
2.Transferable Goods This classification is based on the basis of ownership of goods. These can be moved from
one place to another, can be transferred from one person to another and from one use to another.
3.Non-transferablegoods
Some attributes or qualities like intelligence, skill, ability, adventure, and energy cannot be transferred from person to another. These are personal qualities.
4.Durable goods
Goods which are useful for a long period of time are called durable goods. For examples, a fan, a table, a house, a road, a railway line, a pen, a bed and a chair.

STUDY MATERIAL FOR B.COM ECONOMICS FOR COMPETITIVE EXAMINATION - I
SEMESTER - III, ACADEMIC YEAR 2020 - 21
Page 6 of 46
5.Perishable goods Non-Durable goods are those goods which are perishable goods. These goods are losing
their value within short period. For examples, fruits, vegetables, milk, butter, curd, eggs,etc.
6.Private goods These goods are the property of private individuals. For examples, Our houses, shops, farms, household items, hotels, showrooms, factories,
private buses, taxies.
7.Public goods In socialist countries, most of the goods are public goods. They can be used by all
persons. For examples, Government hospitals, colleges, schools, roads, railways, public parks,
bridges and Government buses.
DEMAND In economics, demand is the quantity of a good that consumers are willing and able to
purchase at various prices during a given period of time. The relationship between price and quantity demanded is also known as the demand
curve. Demand for a specific item is a function of item's perceived necessity, item's price, item's perceived quality, convenience of item, available alternatives, purchasers' disposable income, purchasers' tastes, and many other factors.
COST REVENUE
Cost of revenue is the total cost of producing and distributing of products and services of a company.
Cost of revenue can be found in income statement of a company. Generally, any costs
that are directly connected with manufacturing and distribution of goods and services can be added to cost of revenue (i.e. direct costs). Indirect costs (e.g. depreciation, salaries paid to management or other fixed costs) are not included.
Cost of revenue can be termed as the overall cost included in the manufacturing as well
as the distribution of the product finally to the customer. Also, any cost incurred while production or distribution can be added to the cost of revenue.
Cost of revenue is different from Costs of Goods Sold (COGS) in the way that it includes
additional costs such as distribution, marketing and other.
CAPITAL In economics, capital consists of assets that can enhance one's power to perform
economically useful work. For example, a stone or an arrow is capital for a hunter-gatherer who can use it as a hunting instrument; similarly, roads are capital for inhabitants of a city. Capital is distinct from land and other non-renewable resources in that it can be increased by human labor, and does not include certain durable goods like homes and personal automobiles that are not used in the production of saleable goods and services. Adam Smith defined capital as "that part of man's stock which he expects to afford him revenue". In economic models, capital is an input in the function. The total physical capital at any given moment in time is referred to as

STUDY MATERIAL FOR B.COM ECONOMICS FOR COMPETITIVE EXAMINATION - I
SEMESTER - III, ACADEMIC YEAR 2020 - 21
Page 7 of 46
the capital stock (not to be confused with the capital stock of a business entity). Capital goods, real capital, or capital assets are already-produced, durable goods or any non-financial asset that is used in production of goods or services.
In Marxian economics, capital is money used to buy something only in order to sell it
again to realize a profit. For Marx, capital only exists within the process of the economic circuit (represented by M-C-M') it is wealth that grows out of the process of circulation itself, and for Marx it formed the basis of the economic system of capitalism. In more contemporary schools of economics, this form of capital is generally referred to as "financial capital" and is distinguished from "capital goods".
STUDY MATERIAL FOR B.COM ECONOMICS FOR COMPETITIVE EXAMINATION - I
SEMESTER - III, ACADEMIC YEAR 2020 - 21
Page 8 of 46
UNIT - II CONSUMPTION
Meaning of Consumption Consumption is a branch of economic which deals with satisfaction of human wants.
Definition of Consumption “Use of goods for satisfying human wants”
J.R.Hicks Meaning of Human Wants
Want means desire for goods. The nature of wants will differ from person to person. Feature (or) Characteristics of Wants Human wants have certain characteristics or features which are explained below:
Wants are unlimited Human wants are unlimited. Marshall said that human wants and desires are countless in number and various in kind. As one want is satisfied, another takes its place and so on. Any Particular want insatiable
Though one cannot satisfy all one’s wants, it is possible to satisfy a particular want. For instance, if a man wants a car, he can have it and he will be satisfied. If he is hungry, he takes food and the want is satisfied. Thus a particular want can be satisfied provided one has enough means for the purpose.
Wants are competitive
Our wants are unlimited but the means to satisfy them are limited. We cannot satisfy all our wants. When all the wants seek satisfaction at the same time, they become competitive to each other. Therefore, we have to make a choice regarding the satisfaction of wants keeping in view the money available for maximum satisfaction. Thus wants are competitive.
Certain wants are complementary
In many cases, the act of satisfaction of a particular want at a time requires the use of more than one thing. The wants for such goods are regarded as complementary in nature.
Wants are alternative
There are several alternative to satisfy a single want. Thirst can be satisfied with water or cold drink etc. There are different alternatives open to us. The final choice depends upon their relative prices and the means at our disposal.
Wants are variable
Human wants vary from individual to individual, place to place and from time to time. For example, for the satisfaction of hunger, one man wants vegetarian meals whereas
another wants non-vegetarian ones.
Wants turn in to habits
STUDY MATERIAL FOR B.COM ECONOMICS FOR COMPETITIVE EXAMINATION - I
SEMESTER - III, ACADEMIC YEAR 2020 - 21
Page 9 of 46
When a want is satisfied repeatedly and continuously over a period of time, it becomes a habit.
For example, the repeated and regular satisfaction of wants for tobacco or cigarettes becomeshabit.
Wants are immediate and remote
Some human wants are immediate and some are remote. A want for medicine for a patient is an immediate want, whereas a want for money to purchase a car for him is a remote one.
Wants are permanent and temporary
Some human wants are permanent, whereas some are temporary. Wants for food, clothes and shelter are permanent wants, whereas that for medicine is a temporary one because medicine is required only when a person is sick.
Wants are alternative
There are several alternative to satisfy a single want. Thirst can be satisfied with water or cold drink etc. There are different alternatives open to us. The final choice depends upon their relative prices and the means at our disposal.
Wants are variable
Human wants vary from individual to individual, place to place and from time to time. For example, for the satisfaction of hunger, one man wants vegetarian meals whereas another wants non-vegetarian ones.
Wants turn in to habits
When a want is satisfied repeatedly and continuously over a period of time, it becomes a habit. For example, the repeated and regular satisfaction of wants for tobacco or cigarettes becomes habit
Wants are immediate and remote
Some human wants are immediate and some are remote. A want for medicine for a patient is an immediate want, whereas a want for money to purchase a car for him is a remote one.
Wants are permanent and temporary
Some human wants are permanent, whereas some are temporary. Wants for food, clothes and shelter are permanent wants, whereas that for medicine is a temporary one because medicine is required only when a person is sick.
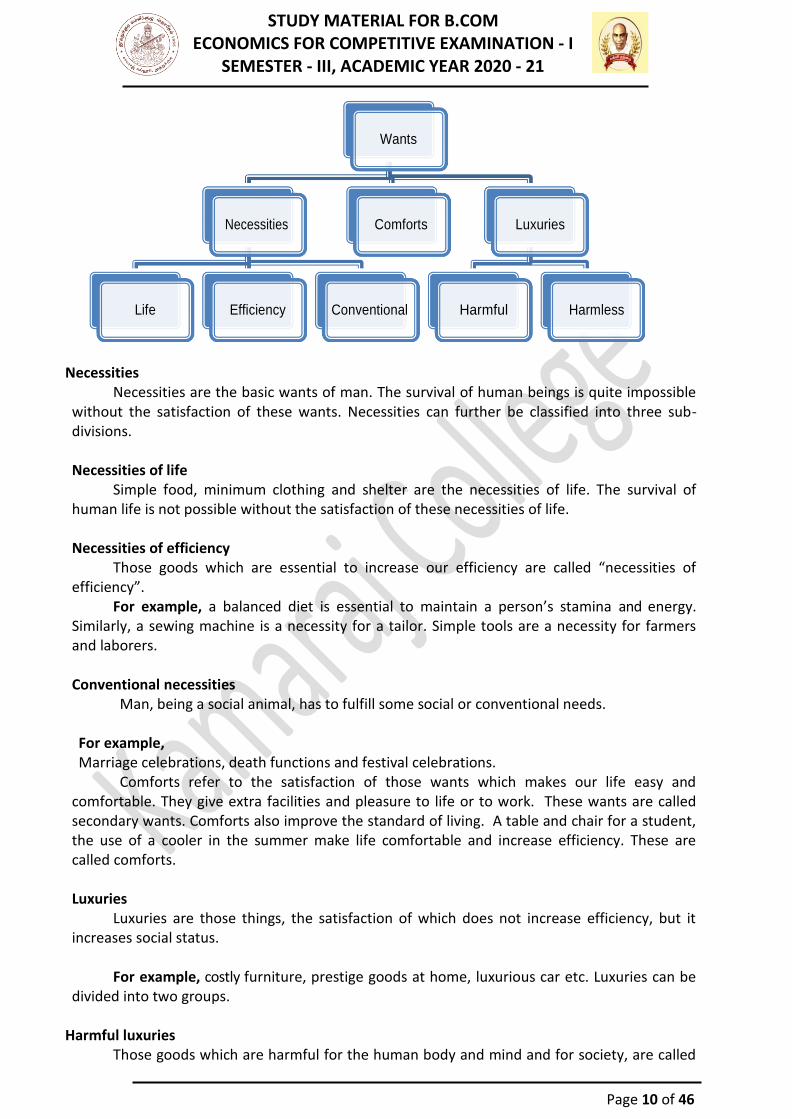
Classification of Wants
1. Necessities 2. Comforts 3. Luxury
STUDY MATERIAL FOR B.COM ECONOMICS FOR COMPETITIVE EXAMINATION - I
SEMESTER - III, ACADEMIC YEAR 2020 - 21
Page 10 of 46
Necessities Necessities are the basic wants of man. The survival of human beings is quite impossible
without the satisfaction of these wants. Necessities can further be classified into three sub-divisions.
Necessities of life
Simple food, minimum clothing and shelter are the necessities of life. The survival of human life is not possible without the satisfaction of these necessities of life.
Necessities of efficiency
Those goods which are essential to increase our efficiency are called “necessities of efficiency”.
For example, a balanced diet is essential to maintain a person’s stamina and energy. Similarly, a sewing machine is a necessity for a tailor. Simple tools are a necessity for farmers and laborers.
Conventional necessities
Man, being a social animal, has to fulfill some social or conventional needs. For example, Marriage celebrations, death functions and festival celebrations.
Comforts refer to the satisfaction of those wants which makes our life easy and comfortable. They give extra facilities and pleasure to life or to work. These wants are called secondary wants. Comforts also improve the standard of living. A table and chair for a student, the use of a cooler in the summer make life comfortable and increase efficiency. These are called comforts.
Luxuries
Luxuries are those things, the satisfaction of which does not increase efficiency, but it increases social status.
For example, costly furniture, prestige goods at home, luxurious car etc. Luxuries can be
divided into two groups.
Harmful luxuries Those goods which are harmful for the human body and mind and for society, are called
Wants
Necessities Comforts Luxuries
Life Efficiency Conventional Harmful Harmless
STUDY MATERIAL FOR B.COM ECONOMICS FOR COMPETITIVE EXAMINATION - I
SEMESTER - III, ACADEMIC YEAR 2020 - 21
Page 11 of 46
harmful luxuries. For example, tobacco, drinks etc., are harmful luxuries.
Harmless luxuries Those good which neither decrease the efficiency nor destroy the health are called
harmless luxuries. For example, Costly jeweler, costly garments, an air-conditioner, a car and a palatial
house are a few examples of harmless luxuries.
LAW OF DIMINISHING MARGINAL UTILITY Meaning
Law of diminishing marginal utility explains the mode of consumer’s satisfaction from consuming a commodity. It is drawn from the simple law of diminishing utility which indicates that, “as the stock of goods for consumption increases the utility derived from it decreases or diminishes”.
For example, when you consume the first glass of mango shake in summer, you get the maximum utility. The second glass of mango shake gives less utility than the first because the first has already quenched your thirst to some extent. From the third glass, the utility derived will be still less. If this process goes on, the stage will come when the addition utility from another glass will become zero. If you still go on consuming, it will even becomenegative.
Definition
According to “Marshall”, “The additional benefit which a person derives from a given increase in his stock of a thing diminishes with every increase in the stock that he already has”.
Assumptions Rational consumer
The consumer is rational and he wants to take maximum satisfaction from his given money income.
Cardinal measurement of utility
Utility is a cardinal concept. It can be measured in quantitative numbers like 1,2,3…
Independent Utility The utility of a thing depends on its own quantity is not influenced by the quantities of
other commodities.
Continuous consumption There is no time lag during the consumption of the commodities.
Homogeneous units All the units of the commodity are homogeneous in every respect that is, in size, color,
taste and so on.
Constant prices There is no change in the income of the price of the commodity and its related goods.

STUDY MATERIAL FOR B.COM ECONOMICS FOR COMPETITIVE EXAMINATION - I
SEMESTER - III, ACADEMIC YEAR 2020 - 21
Page 12 of 46
Constant income
There is no change in the income of the consumer.
Constant taste, customs and fashions There is no change in the tastes, habits, customs and fashions of the consumer.
Explanation of the Law The law of diminishing marginal utility can be demonstrated with the help of the table
and diagram given below:
No. of Bananas Marginal Utility Total Utility
1 8 8
2 6 14
3 4 18
4 2 20
5 0 20
6 -2 18
The table clearly shows that: 1.As the number of bananas goes on increasing, the marginal utility goes on diminishing.
Upto the consumption of the 4th unit, the marginal utility is positive and total utility is increasing but at a decreasing rate.
2.With the consumption of the 5th unit of banana, the marginal utility becomes zero and the total utility is maximum that is 20units.
3.As the 6th unit of bananas is consumed, the marginal utility becomes negative and total utility decreases to 18units.
In the above figure AM is the marginal utility is positive and ABT is the total utility curve.
Up to the 4th unit the marginal utility is positive and total utility curve AB rises upward. At the 5th unit and at point S, AM touches the x-axis and ABT reaches its peak. It means that the
STUDY MATERIAL FOR B.COM ECONOMICS FOR COMPETITIVE EXAMINATION - I
SEMESTER - III, ACADEMIC YEAR 2020 - 21
Page 13 of 46
marginal utility is zero and total utility is at maximum. It is also known as the point of saturation. When the 6th unit of Bananas are consumed, AM goes down the x-axis and ABT starts falling. Here marginal utility has become negative and total utility starts decreasing. DEMAND ANALYSIS Meaning of Demand:
Demand is the willingness to buy a commodity or service which is backed by necessary resources. Demand is an effective desire. It is a desire backed by power to buy and willingness to buy. In economics demand has the following three attributes.
1. Desire to possess or use a commodity or service. 2. Willingness to possess it. 3. Capacity to buy it.
For example,
Suppose a person is willing to buy a car when its price is Rs.2 lakhs. He is in a position to pay this price. It is demand for a car. But if the price of the car goes up to Rs.3 lakhs, he may not afford to buy it. Or he may not think it worthwhile to spend so much money on it. It is no longer a demand. So, demand is always expressed with reference to price.
Definition
“Demand is the quantitative expression of preferences”. Chapman
Types of Demand Joint demand
When a number of goods and services are demanded for a joint purpose, it is called joint demand.
For example, for the construction of a house, several items like cement, sand bricks, iron, wood and labour are required. This is a case of joint demand.
Direct demand
Direct demand is the demand for direct use or consumption. It is the demand for the ultimate object.
For example, demand for a car, a house, or a piece of cloth.
Derived demand The demand for various goods and services to manufacture goods to meet the ultimate or
direct demand of purchasers is called derived demand.
Composite demand The demand for goods or services which can be put to several uses is called composite
demand. For example, milk is in demand to prepare tea, coffee, butter, ghee, sweets, curd,
paneer and also for direct consumption. Complementary demand
When two or more than two goods are demanded because, they complement each other’s role. It is called complementary demand.
For example, pen and ink, bread and butter, car and petrol are some examples of

STUDY MATERIAL FOR B.COM ECONOMICS FOR COMPETITIVE EXAMINATION - I
SEMESTER - III, ACADEMIC YEAR 2020 - 21
Page 14 of 46
complementary demand.
Competitive demand A large number of goods compete with each other as substitutes to fulfill the same need. For example, tea and coffee, roadways and railways, wheat and rice, vegetable oil and
pure ghee are substitutes or near substitutes of each other. Demand for them is called competitive demand.
LAW OF DEMAND
Meaning Law of demand explains the relationship between the price of a commodity and its
quantity demanded over a certain period of time.
Definition According to this law, “The amount demanded increases with a fall in price and
diminishes with a rise in prices”. Marshall
Assumptions of the law of demand 1.Income of the consumer remains unchanged. 2.Prices of other related goods remain constant. 3.Tastes of the consumers remain unchanged during the period of time. 4.The consumers, expectations about future prices are neutral. 5.The effect of advertising is ruled out.
6.Other relevant factors like the size of the population, seasonal and climatic factors, habits of the people and all other factors influencing demand remain unchanged.
Types of Demand Schedule 1. Individual demand schedule 2. Market demand schedule
Individual Demand Schedule
“A demand schedule is a table showing how the quantity demanded of some product during a specified period of time changes as the price of that product changes, holding all other determinants of quantity demanded constant”. Baumol
In other words, a demand schedule indicates how much a consumer is willing and able to buy at different price levels during a certain period of time.
Price Quantity demanded
0 10
1 9
2 8
3 7
4 6
5 5

STUDY MATERIAL FOR B.COM ECONOMICS FOR COMPETITIVE EXAMINATION - I
SEMESTER - III, ACADEMIC YEAR 2020 - 21
Page 15 of 46
6 4
Demand schedule of a person for commodity shows an inverse relationship between the
price and its quantity demanded. When the price is 1 rupee its demand is 9 kilograms. When the price is 6 rupees its
demand is 4 kilograms with the rise in its price, its demand starts falling. The inverse relationship also holds good if we start moving upward from below, the price
of X being 20 rupees per kilogram, its demand is zero. In other words, the consumer is not willing to buy the commodity at all. But when its price starts falling, the quantity demanded begins to increase.
Demand Curve
“The Picturisation of the demand schedule is called the demand curve”.
Samuelson Individual’s demand curve
An individual’s demand curve is the graphical depiction of the quantity demandedby him at different levels of price. It is the graphical representation of an individual’s demand schedule.
Market Demand Schedule Market demand schedule for a commodity is the sum of the demand schedules of the
individual consumers. In other words, the market demand schedule represents the preference scale of all the consumers taken together. It shows how much quantity is demanded at different price levels by the society.
Price of X
A’s demand (QA)
B’s demand (QB)
C’s demand (QC)
Total Demand (QDX)
5 0 0 0 0
4 1 2 3 6
3 2 4 6 12
2 3 6 9 18
1 4 8 12 24
0 5 10 15 30
DemandforX
10
8
6
4
2
0
1 2 3 4 5 6 7 8 9
STUDY MATERIAL FOR B.COM ECONOMICS FOR COMPETITIVE EXAMINATION - I
SEMESTER - III, ACADEMIC YEAR 2020 - 21
Page 16 of 46
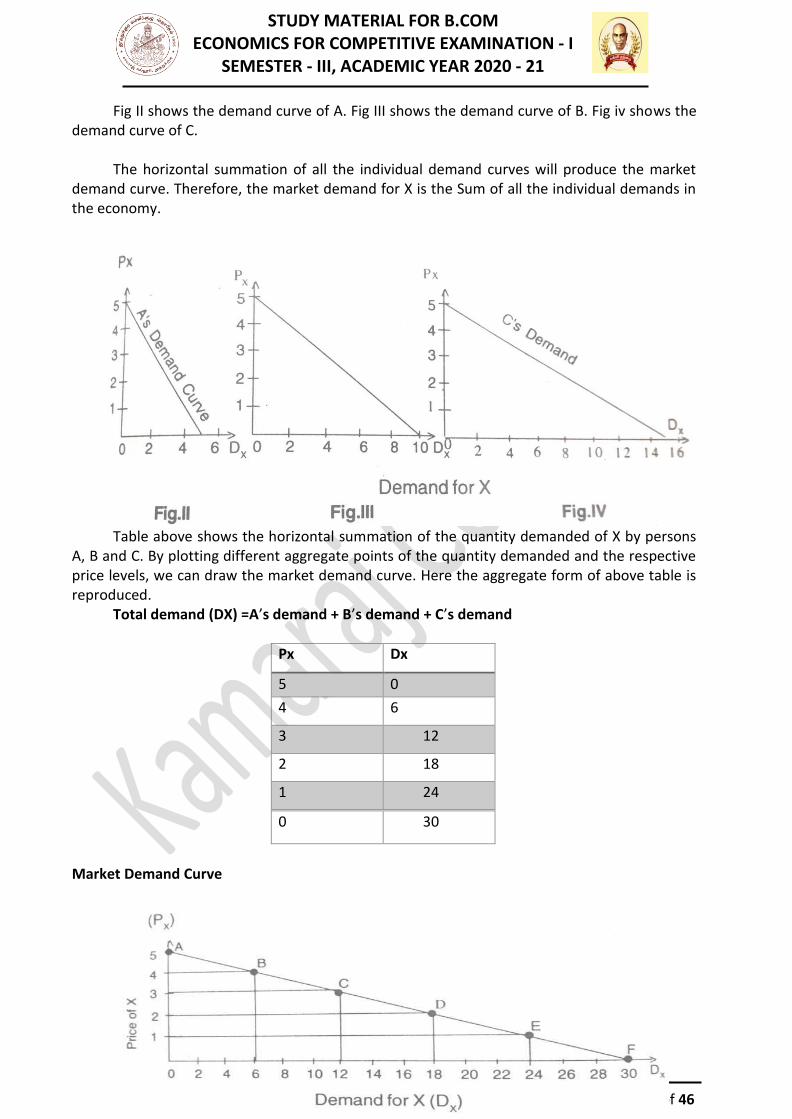
Fig II shows the demand curve of A. Fig III shows the demand curve of B. Fig iv shows the demand curve of C.
The horizontal summation of all the individual demand curves will produce the market
demand curve. Therefore, the market demand for X is the Sum of all the individual demands in the economy.
Table above shows the horizontal summation of the quantity demanded of X by persons A, B and C. By plotting different aggregate points of the quantity demanded and the respective price levels, we can draw the market demand curve. Here the aggregate form of above table is reproduced.
Total demand (DX) =A’s demand + B’s demand + C’s demand
Px Dx
5 0
4 6
3 12
2 18
1 24
0 30
Market Demand Curve

STUDY MATERIAL FOR B.COM ECONOMICS FOR COMPETITIVE EXAMINATION - I
SEMESTER - III, ACADEMIC YEAR 2020 - 21
Page 17 of 46
Above figure depicts the market demand curve on the basis of the market demand schedule shown in table above. It is the summation of individual’s demand schedule in horizontal form.
The different point on the market demand curve show the willingness of the society to
buy a particular quantity of the commodity X at its different price levels. The law of demand states that other things being constant, there is an inverse
relationship between the price of various commodities and their quantity demanded over a certain period of time. In other words, with the increase in the price of a commodity, there is a fall in its demand and with the decrease in its price, there is a rise in its demand.
Why Demand Curves Slope Downwards? The following specific factors are responsible for the downward slope of a demand curve,
1. With the fall in the price/prices of commodity or commodities, the value of a unit of money increases. The same unit of money can buy more goods at lower prices than at higher prices.
2. Rise in real income takes place with the fall in the price of a commodity. Most probably, a part of the rise in the real income is spent on the same commodity the price of which has fallen.
3. It is observed that a large number of goods are substitutes of several goods in some ways or the other. With the fall in the price of a commodity, the cheaper commodity is preferred to the commodities whose prices have not changed.
4. A commodity is put to several uses when it becomes cheaper. a. For example, when tomatoes become cheaper, tomato sauce is prepared by the
housewives. 5. The fall in the price of a commodity has a psychological effect also. People like and enjoy
buying more, which they were unable to do at higherprices. Factors Affecting Demand
Some of the important factors which influence the demand for goods and services are listed in the following paragraphs.
Income of the household
The income is a decisive variable which greatly influences the volume of quantity demanded as well as its quality. An increase or decrease in income increases or decreases the demand for a commodity.
Prices of other commodities
Many goods have a definite relationship with each other. Some are substitutes of and some are complementary to other goods. Even, goods which are not substitutes in the strict economic sense are competitive in some way or the other.
Any rise or fall in the prices of substitutes of a commodity will affect its demand and shift
the demand curve to the right or the left.
STUDY MATERIAL FOR B.COM ECONOMICS FOR COMPETITIVE EXAMINATION - I
SEMESTER - III, ACADEMIC YEAR 2020 - 21
Page 18 of 46
For example, the rise in the price of tea will expand the demand for coffee. Tastes and preferences
Tastes and preferences of people highly influence the demand for goods. The tastes, habits and preferences of the people vary from area to area and from time to time. The varying social, religious, economic and environmental conditions of different people influence their choice of food, clothing, living conditions, houses, entertainment and what not.
Advertising
Modern ages are the age of advertising and the media - both print and visual - are highly affecting the life style of people. An aggressive advertising campaign tends to shift the demand curve of a particular commodity to the right.
Product life-cycle
The product life-cycle model states that demand pattern for a commodity undergoes some typical changes at different stages of the life-cycle. The life-cycle concept is very relevant in case of durable goods like TVs, cars and computers.
Size and composition of population
The size of population of a country determines the level of demand for all goods and services. The larger the population of a country, the larger the quantity of goods and services demanded by it. If there are many to be fed, clothed and housed, demand is supposed to be high.
Distribution of income
Uneven distribution of income and wealth greatly squeezes the demand level in an economy. It is a common fact that the rich sections of society have a low propensity to consume. Their demand pattern encourages the demand for comforts and luxuries.
Scientific and technological development
Science and technology are there to revolutionize the life style of people. Almost all economic activities are being speeded up by scientific discoveries and inventions. Thousands of new products are entering our daily life. New wants are emerging. Daily arrival of new products, new machines and new services had greatly influenced the demand pattern of the society.
State of the economy
The state of economy i.e. whether it is developed or under developed, experiencing inflation or deflation also influences the demand for goods and very services. The people of developed countries enjoy a very high standard of living. Their size of demand is very high, as compared to the people of under developed world.
Changes in money supply
Increase in money supply raises the money income of people. People get enhanced purchasing power. The increase in money supply which is generally the outcome of increased economic activities of the state puts a lot of money in the hands of the people. Their demand level increase day by day.
Miscellaneous factors
1. Changes in fashion raise the demand for the goods which are in vogue. Goods which are
STUDY MATERIAL FOR B.COM ECONOMICS FOR COMPETITIVE EXAMINATION - I
SEMESTER - III, ACADEMIC YEAR 2020 - 21
Page 19 of 46
out of fashion are not purchased by people even at lower prices. 2. Changing weather and climatic conditions also influence the demand for several goods.
Demand for woolen clothes increases during winter. Eggs are more in demand during winter as compared to summer.
3. Changing habits also alter the demand conditions in an economy. Increasing demand for tea, coffee, cold drinks, eggs, non-vegetarian food items, snacks and ice creams is being witnessed because of changing habit and tastes of the people.
4. A system of progressive taxation particularly income and wealth taxes, reduces the disposable income of the high income group. Demand for comforts and luxuries are greatly affected by it.
5. Religious and social factors have their own role to play in influencing the demand for goods and services. Demand for sweets increases considerably on every Tuesday because the Hindus offer “parsad” in temples on that day.
Elasticity of Demand Meaning
The elasticity of demand is the responsiveness of demand to the changes in the price of a commodity, income of the consumers and the prices of related goods.
Definition “The ratio of the percentage changes in demand to the percentage change in price” Prof. Lipsey
Price Elasticity of Demand Meaning
A proportionate change in quantity demanded brought by a proportionate change in price is called the price elasticity of demand.
Definition
Elasticity of demand may be defined as “the percentage change in the quantity demanded by the percentage change in price”.
Alfred Marshall
= Proportionate change in quantity demanded
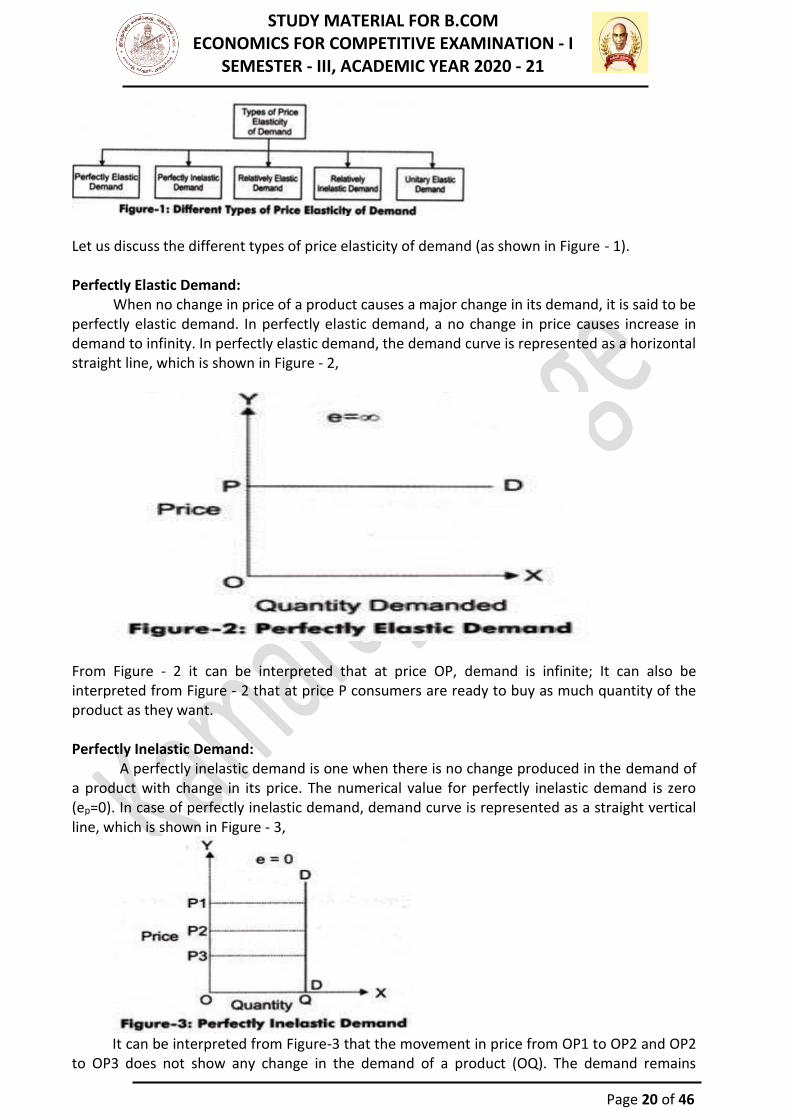
Proportionate change in price Types of Price Elasticity of Demand
The extent of responsiveness of demand with change in the price is not always the same. The demand for a product can be elastic or inelastic, depending on the rate of change in the demand with respect to change in price of a product. Elastic demand is the one when the response of demand is greater with a small proportionate change in the price. On the other hand, inelastic demand is the one when there is relatively a less change in the demand with a greater change in the price.
For better understanding the concepts of elastic and inelastic demand, the price elasticity
of demand has been divided into five types, which are shown in Figure - 1,
STUDY MATERIAL FOR B.COM ECONOMICS FOR COMPETITIVE EXAMINATION - I
SEMESTER - III, ACADEMIC YEAR 2020 - 21
Page 20 of 46
Let us discuss the different types of price elasticity of demand (as shown in Figure - 1). Perfectly Elastic Demand:
When no change in price of a product causes a major change in its demand, it is said to be perfectly elastic demand. In perfectly elastic demand, a no change in price causes increase in demand to infinity. In perfectly elastic demand, the demand curve is represented as a horizontal straight line, which is shown in Figure - 2,
From Figure - 2 it can be interpreted that at price OP, demand is infinite; It can also be interpreted from Figure - 2 that at price P consumers are ready to buy as much quantity of the product as they want. Perfectly Inelastic Demand:
A perfectly inelastic demand is one when there is no change produced in the demand of a product with change in its price. The numerical value for perfectly inelastic demand is zero (ep=0). In case of perfectly inelastic demand, demand curve is represented as a straight vertical line, which is shown in Figure - 3,
It can be interpreted from Figure-3 that the movement in price from OP1 to OP2 and OP2
to OP3 does not show any change in the demand of a product (OQ). The demand remains

STUDY MATERIAL FOR B.COM ECONOMICS FOR COMPETITIVE EXAMINATION - I
SEMESTER - III, ACADEMIC YEAR 2020 - 21
Page 21 of 46
constant for any value of price. In case of essential goods, such as salt, the demand does not change with change in price. Therefore, the demand for essential goods is perfectly inelastic.
Relatively Elastic Demand:
Relatively elastic demand refers to the demand when the proportionate change produced in demand is greater than the proportionate change in price of a product. The numerical value of relatively elastic demand ranges between one to infinity. Mathematically, relatively elastic demand is known as more than unit elastic demand (ep>1). For example, if the price of a product increases by 20% and the demand of the product decreases by 25%, then the demand would be relatively elastic. The demand curve of relatively elastic demand is gradually sloping, as shown in Figure - 4,
It can be interpreted from Figure-4 that the proportionate change in demand from OQ1 to OQ2 is relatively larger than the proportionate change in price from OP1 to OP2. Relatively elastic demand has a practical application as demand for many of products respond in the same manner with respect to change in their prices. For example, the price of a particular brand of cold drink increases from Rs. 15 to Rs. 20. In such a case, consumers may switch to another brand of cold drink. However, some of the consumers still consume the same brand. Therefore, a small change in price produces a larger change in demand of the product.
Relatively In elastic Demand
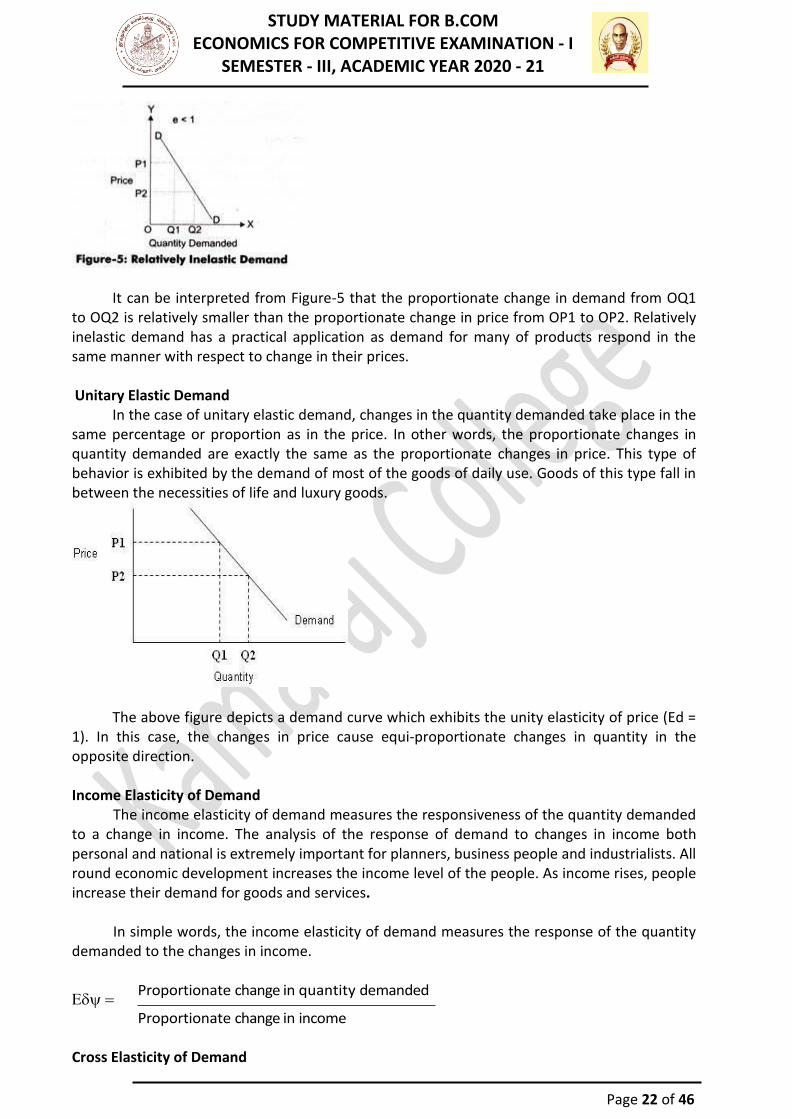
Relatively inelastic demand is one when the percentage change produced in demand is less than the percentage change in the price of a product. For example, if the price of a product increases by 30% and the demand for the product decreases only by 10%, then the demand would be called relatively inelastic. The numerical value of relatively elastic demand ranges between zero to one (ep<1). Marshall has termed relatively inelastic demand as elasticity being less than unity. The demand curve of relatively inelastic demand is rapidly sloping, as shown inFigure – 5,
STUDY MATERIAL FOR B.COM ECONOMICS FOR COMPETITIVE EXAMINATION - I
SEMESTER - III, ACADEMIC YEAR 2020 - 21
Page 22 of 46
It can be interpreted from Figure-5 that the proportionate change in demand from OQ1
to OQ2 is relatively smaller than the proportionate change in price from OP1 to OP2. Relatively inelastic demand has a practical application as demand for many of products respond in the same manner with respect to change in their prices.
Unitary Elastic Demand
In the case of unitary elastic demand, changes in the quantity demanded take place in the same percentage or proportion as in the price. In other words, the proportionate changes in quantity demanded are exactly the same as the proportionate changes in price. This type of behavior is exhibited by the demand of most of the goods of daily use. Goods of this type fall in between the necessities of life and luxury goods.
The above figure depicts a demand curve which exhibits the unity elasticity of price (Ed = 1). In this case, the changes in price cause equi-proportionate changes in quantity in the opposite direction.
Income Elasticity of Demand
The income elasticity of demand measures the responsiveness of the quantity demanded to a change in income. The analysis of the response of demand to changes in income both personal and national is extremely important for planners, business people and industrialists. All round economic development increases the income level of the people. As income rises, people increase their demand for goods and services.
In simple words, the income elasticity of demand measures the response of the quantity
demanded to the changes in income.
= Proportionate change in quantity demanded
Proportionate change in income Cross Elasticity of Demand

STUDY MATERIAL FOR B.COM ECONOMICS FOR COMPETITIVE EXAMINATION - I
SEMESTER - III, ACADEMIC YEAR 2020 - 21
Page 23 of 46
The cross elasticity of demand measures the responsiveness of quantity demanded to a change in the prices of the related goods. A large number of goods are related to each other either in the form of substitutes or as complements. For example, tea and coffee, butter and margarine, fuel wood and cooking gas, refined oil and vanaspati ghee are substitutes of each other. A fountain pen and ink, a car and petrol are complementary goods. Now a day, a large number of brands of a commodity are entering the markets daily. They are competing with one another for a larger share of the market. In a broader sense, they are very near substitutes of one another.
The cross elasticity of demand refers to the responsiveness of demand for a commodity
to changes in the prices of other related goods (substitutes or complements).
Exy =Proportionate change in demand for commodity X Proportionate change in price of
commodity Y Measurement of Elasticity of Demand The following are the methods used to calculate elasticity of demand,
1. Proportionate method. 2. Point method. 3. Arc method. 4. Expenditure method. 5. Revenue method.
Proportionate method
The price elasticity of demand is defined as the proportionate change in the quantity demanded in response to a change in price. This method can also be used by converting our data into percentage form because the elasticity of demand is also defined as a percentage change in quantity demanded due to a percentage change in price.
Elasticity of Demand (ED) = Proportionate Change in Demand
Proportionate Change in Price Point Method
The point price elasticity of demand is the measurement of price elasticity of demand at a particular point on the demand curve.
“Elasticity computed at a single point on the curve for an infinitely small change in price, is point elasticity”. Arc elasticity or arc method
The arc elasticity of demand measures the price elasticity of demand between two points on a demand curve.
According to Left witch, “when elasticity is computed between two separate points on a demand curve, the concept is called arc elasticity”.
Arc elasticity is the price elasticity of demand between two points on a demand curve. It can be computed both for linear and non-linear demand curves. Expenditure method
The elasticity of demand and the total expenditure have the following relationship. ➢ If a fall in price increases the total expenditure and a rise in price reduces it, the elasticity
of demand is more than unity i.e., Ed>1. ➢ If a fall in price reduces total expenditure and a rise in price increases it, the elasticity of
demand in less than unity i.e., Ed<1.
STUDY MATERIAL FOR B.COM ECONOMICS FOR COMPETITIVE EXAMINATION - I
SEMESTER - III, ACADEMIC YEAR 2020 - 21
Page 24 of 46
➢ If a rise or fall in price does not affect the total expenditure, the elasticity of demand is unity i.e. Ed=1.
Revenue method
Average revenue, marginal revenue and the elasticity of demand have a definite relationship which is presented in the following form:
Ed = Average Revenue
Average Revenue –Marginal Revenue THE CONCEPTS OF CONSUMER SURPLUS
In mainstream economics, economic surplus, also known as total welfare or Marshallian surplus (after Alfred Marshall), refers to two related quantities. Consumer surplus or consumers' surplus is the monetary gain obtained by consumers because they are able to purchase a product for a price that is less than the highest price that they would be willing to pay. Producer surplus or producers' surplus is the amount that producers benefit by selling at a market price that is higher than the least that they would be willing to sell for; this is roughly equal to profit (since producers are not normally willing to sell at a loss, and are normally indifferent to selling at a breakeven price.
STUDY MATERIAL FOR B.COM ECONOMICS FOR COMPETITIVE EXAMINATION - I
SEMESTER - III, ACADEMIC YEAR 2020 - 21
Page 25 of 46
UNIT - III PRODUCTION AND DISTRIBUTION
Meaning of Production
Production is the creation of utilities for sale. The creation of all types of goods and services for sale is called production.
Definition
“Production may be defined as the creation of utilities i.e. wants satisfying power, in economic goods”.
Raymond Bye FACTORS OF PRODUCTION
The purpose of production which makes use of producer goods and services in the economic activities is to create utilities by providing and endless flow of goods and service. In order to achieve the production of utilities, the resources available to mankind are mobilized. These resources are called factors of production.
The modern economics have classified the factors of production into four groups,
1. Land 2. Labour 3. Capital 4. Entrepreneur
Land Land is the original and basic factor of production. In economics, the term „land‟ is used in
a broader sense. It includes all the natural resources or gifts of nature. It does not include only surface land but also forests, mountains, sea, climate, air and so on. The term land includes all the natural resources on the surface (soil, plots), below the surface (minerals) and above the surface (climate, air).
As compared to other factors of production, land has certain special characteristics like
limited supply, being a free gift of nature, indestructibility and immobility. Land is the primary factor of production. No production is possible without land. Land is the basis of the primary sector (agriculture and allied), secondary sector (industries) and tertiary sector (trade, transport and communication). It is also the basis of power and energy which play a key role in the economic development of a country.
Labour
Labour is an active agent of production. In economics, the term labour stand for all types of physical or mental work which is done in expectation of some reward in kind or cash. Labour is inseparable from the laborer. A labourer is unlike other commodities. In case of commodities other than labour, the ownership changes in the process of sale purchase. A labourer sells his labour power or capacity to work. Labour is perishable, mobile, differs in efficiency and has consciousness and power of judgments. Capital
Capital is a very crucial factor of production. It enables labour to effectively utilize the gifts of nature. In modern times, because of scientific and technological developments which involve a lot of capital investment, the role of capital has increased further.
STUDY MATERIAL FOR B.COM ECONOMICS FOR COMPETITIVE EXAMINATION - I
SEMESTER - III, ACADEMIC YEAR 2020 - 21
Page 26 of 46
For an economist, capital is that form of wealth which helps in production. In other words, capital is that part of private or public wealth which further generates income or contributes to production.
Capital also includes human capital. Capital is produced by man; hence its supply is elastic. It is a mobile and transferable factor of production. Capital is a passive factor and labour activates it to work.
Capital is necessary for production. It increases the productivity and efficiency of workers. It plays a vital role in the economic development of a country and helps in creating employment opportunities.
Entrepreneur
In order to produce something in an organized manner on a sufficient scale, land, labour and capital have to be arranged. They are brought together and set to work. The person who initiates this process of organizing factors of production is usually called the entrepreneur. He stands for bearing those risks and uncertainties which are associated with the ownership of an industrial or business concern.
The entrepreneur conceives and initiates the project, takes production decisions, arranges finance, man and materials. He combines the other factors of production in the right proportion to produce goods and services. These days his main functions include marketing of the product and working as innovator.
Production Function
Production is the outcome of the combined efforts of land, labour, capital and entrepreneur. The entrepreneur arranges land, labour and capital, combines them in required proportions and sets them to work. Production function expresses the functional relationship between resources (inputs) and output (goods and services). In fact, given the state of technology, production function shows the technological-physical relationship between inputs and output.
It is observed that in the short-run some of the inputs are fixed. They are difficult to change in the short-run. The laws of returns deal with the short-run production function. Let us have a look at a simple production function which is given below, O = f(L, Lab, K,T) Where, O = Output, L = Land, Lab = Labour, k = Capital T = Technology) Production Function Through ISO - Quant Curves
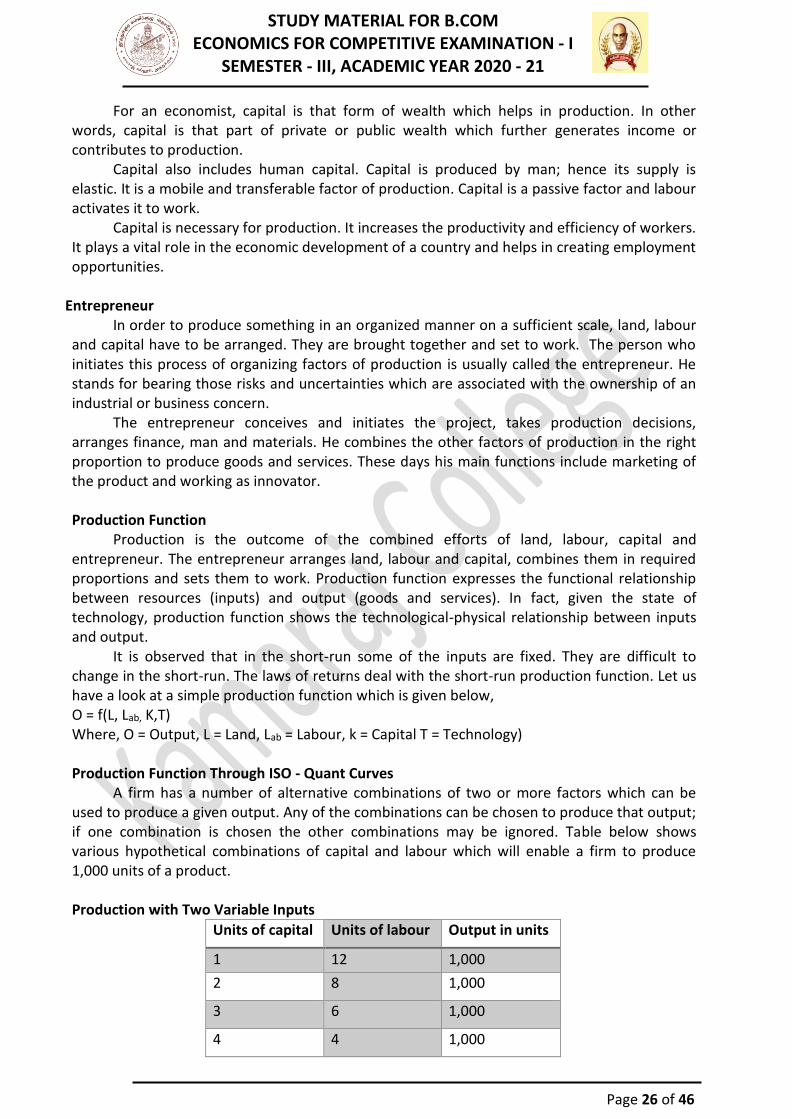
A firm has a number of alternative combinations of two or more factors which can be used to produce a given output. Any of the combinations can be chosen to produce that output; if one combination is chosen the other combinations may be ignored. Table below shows various hypothetical combinations of capital and labour which will enable a firm to produce 1,000 units of a product.
Production with Two Variable Inputs
Units of capital Units of labour Output in units
1 12 1,000
2 8 1,000
3 6 1,000
4 4 1,000

STUDY MATERIAL FOR B.COM ECONOMICS FOR COMPETITIVE EXAMINATION - I
SEMESTER - III, ACADEMIC YEAR 2020 - 21
Page 27 of 46
5 2 1,000
The hypothetical table shows clearly that an output of 1,000 units of commodity can be
produced either by 1 units of capital and 12 units of labour, or 2 units of capital and 8 units of labour, of by any of the combinations mentioned above. All combinations are equally suitable, as all of them can produce the same output. Table is illustrated in the following figure,
In the above figure, the horizontal axis represents labour and the vertical axis represents
capital. The curve IQ shows the different combinations that produce 1,000 units of output. Each of the points R1, R2, R3, R4 and R5 on the curve shows a capital-labour combination that can produce 1,000 units of output. For example, point R1 indicate a combination of 1 unit of capital and 12 units of labour, point R2 represents a combination of 2 units of capital and 8 units of labour, and so on. But all the combinations of inputs represent the same output and the firm can use any one of the combinations to produce the output of 1,000units.
The indifference curve in above figure is known as an equal product curve or an iso- quant curve or an iso-quant curve (iso=equal; quant=quantity).
LAW OF RETURNS The law of return takes three forms:
1. Law of diminishing return 2. Law of constant returns 3. Law of increasing returns
Law of diminishing returns
The law of diminishing returns is one of the oldest and most controversial parts of economic theory. This law states that if the quantity of one factor, say land, is fixed and to increase output, more and more units of labour and capital are applied, increase in output will take place at a decreasing rate. In other words, the marginal increase in output will be comparatively smaller than the increase in labour and capital.
Assumptions of the law
1. The technique of production remains constant. 2. The co-efficients of production are variable, i.e., factor proportions are variable. 3. Some factors can be held constant. 4. The units of variable factor are homogeneous.
STUDY MATERIAL FOR B.COM ECONOMICS FOR COMPETITIVE EXAMINATION - I
SEMESTER - III, ACADEMIC YEAR 2020 - 21
Page 28 of 46
Law of constant returns The law of constant returns states that the increase in output or marginal physical
product is that the same rate as that in the units of labour and capital. Additional units of labour and capital yield the same return. The per unit cost of production remains the same at all levels of output.
Law of increasing returns
The law of increasing returns states that the marginal increase in output is proportionately higher than the increase in the units of labour and capital. When more and more units of labour and capital are applied, they bring increasing returns or raise total output at an increasing rate. The law of increasing returns is based on the assumption that there always remains ample scope for improvements in the techniques of production. The improvements in the methods of production, use of modern machines and increased division of labour raise the productivity. The theory also assumes that some of the factors or at least one factor is indivisible. Most of the remaining factors are divisible. The law of increasing returns states that an addition in units of inputs brings higher and higher levels of marginal output.
Law of Variable Proportion
Law of variable proportions establishes the short run relationship between the changes in output and the changes in inputs. In the short period, some factors are fixed and some are variable. So in the short run, if we want to increase the output, we have to vary the variable factors only. The law is called the law of variable proportions because when in the short run, increasing doses of variable factors are applied upon some fixed factors, the factor proportion changes.
The law of variable proportions which comprises three stages applies in all economic fields. Prof. Samuelson has stated that an increase in some inputs relative to other comparatively fixed inputs will cause output to increase; but after a point, the extra output resulting from the same additions of inputs will become less and less; this falling of extra returns is a consequence of the fact that the new doses of varying resources have less and less of the constant resources to work with.
The law of variable proportions comprises three stages. At the initial level when a variable
factor is increased on some fixed factors, the factor proportion becomes favorable. It increases the marginal output at an increasing rate.
After some time, when the factor proportion becomes optimum, marginal output reaches
the maximum level. For a while, the optimum level is not disturbed by an increase in variable inputs. So the marginal output remains constant for a few doses.
But when the variable factor is increased further, the optimum factor proportion is
disturbed. It becomes unfavorable. The marginal output starts declining. At this stage the law of diminishing returns starts operating. The law of diminishing returns is based on the following assumptions:
1. Only one factor is variable while others are held constant. 2. All units of the variable factor are homogeneous. 3. There is no change in technology. 4. It is possible to vary the proportions in which different inputs are combined. 5. It assumes a short-run situation, for in the long-run all factors are variable.
STUDY MATERIAL FOR B.COM ECONOMICS FOR COMPETITIVE EXAMINATION - I
SEMESTER - III, ACADEMIC YEAR 2020 - 21
Page 29 of 46
6. The product is measured in physical units, i.e., in quintals, tonnes, etc. Explanation of the law:
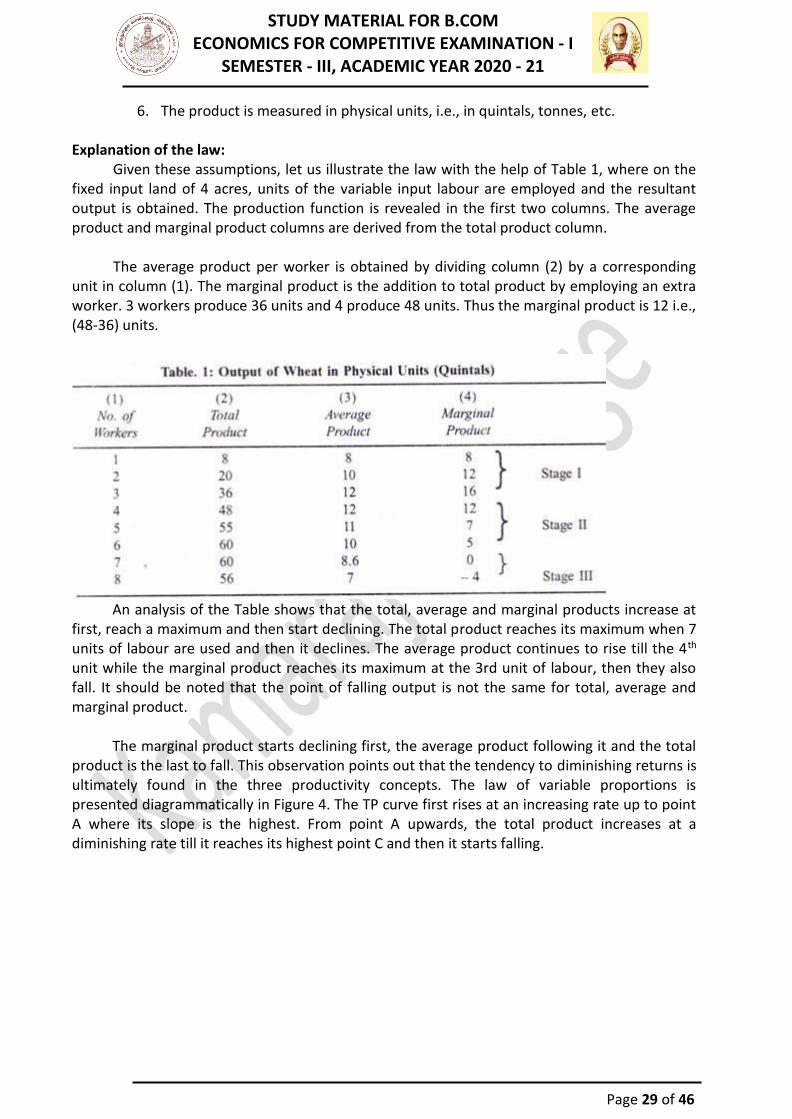
Given these assumptions, let us illustrate the law with the help of Table 1, where on the fixed input land of 4 acres, units of the variable input labour are employed and the resultant output is obtained. The production function is revealed in the first two columns. The average product and marginal product columns are derived from the total product column.
The average product per worker is obtained by dividing column (2) by a corresponding
unit in column (1). The marginal product is the addition to total product by employing an extra worker. 3 workers produce 36 units and 4 produce 48 units. Thus the marginal product is 12 i.e., (48-36) units.
An analysis of the Table shows that the total, average and marginal products increase at
first, reach a maximum and then start declining. The total product reaches its maximum when 7 units of labour are used and then it declines. The average product continues to rise till the 4th unit while the marginal product reaches its maximum at the 3rd unit of labour, then they also fall. It should be noted that the point of falling output is not the same for total, average and marginal product.
The marginal product starts declining first, the average product following it and the total
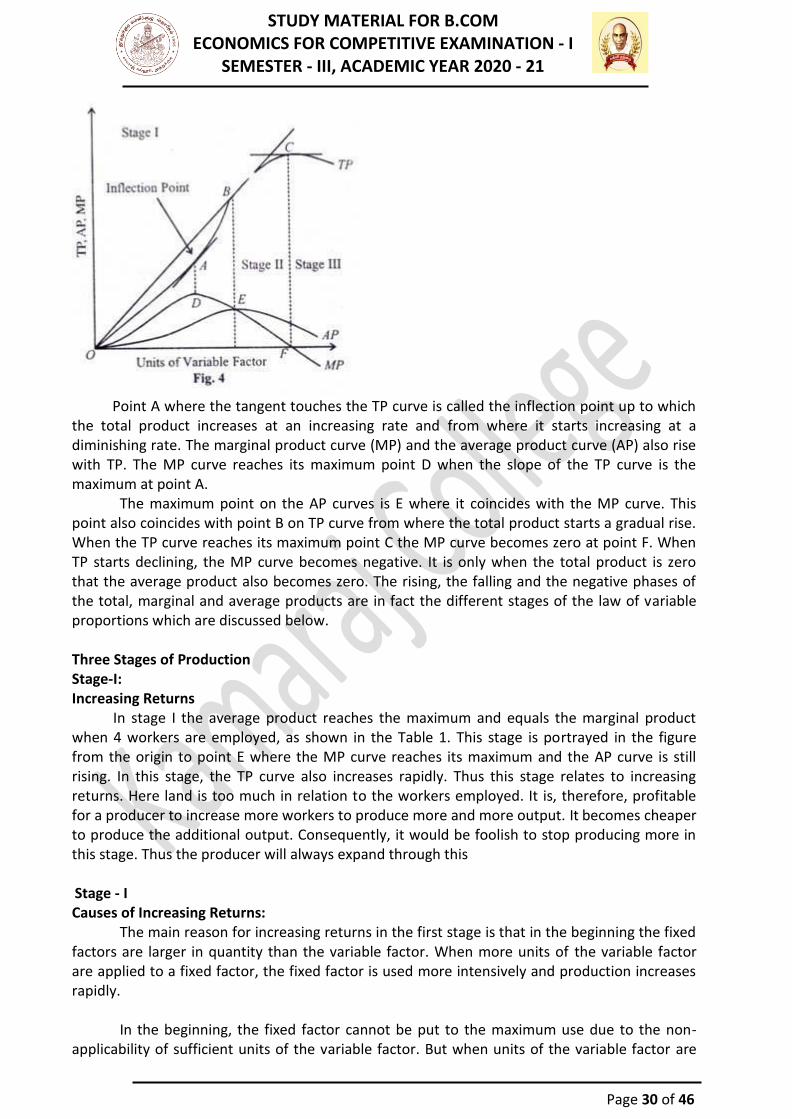
product is the last to fall. This observation points out that the tendency to diminishing returns is ultimately found in the three productivity concepts. The law of variable proportions is presented diagrammatically in Figure 4. The TP curve first rises at an increasing rate up to point A where its slope is the highest. From point A upwards, the total product increases at a diminishing rate till it reaches its highest point С and then it starts falling.
STUDY MATERIAL FOR B.COM ECONOMICS FOR COMPETITIVE EXAMINATION - I
SEMESTER - III, ACADEMIC YEAR 2020 - 21
Page 30 of 46
Point A where the tangent touches the TP curve is called the inflection point up to which
the total product increases at an increasing rate and from where it starts increasing at a diminishing rate. The marginal product curve (MP) and the average product curve (AP) also rise with TP. The MP curve reaches its maximum point D when the slope of the TP curve is the maximum at point A.
The maximum point on the AP curves is E where it coincides with the MP curve. This point also coincides with point В on TP curve from where the total product starts a gradual rise. When the TP curve reaches its maximum point С the MP curve becomes zero at point F. When TP starts declining, the MP curve becomes negative. It is only when the total product is zero that the average product also becomes zero. The rising, the falling and the negative phases of the total, marginal and average products are in fact the different stages of the law of variable proportions which are discussed below.
Three Stages of Production Stage-I: Increasing Returns
In stage I the average product reaches the maximum and equals the marginal product when 4 workers are employed, as shown in the Table 1. This stage is portrayed in the figure from the origin to point E where the MP curve reaches its maximum and the AP curve is still rising. In this stage, the TP curve also increases rapidly. Thus this stage relates to increasing returns. Here land is too much in relation to the workers employed. It is, therefore, profitable for a producer to increase more workers to produce more and more output. It becomes cheaper to produce the additional output. Consequently, it would be foolish to stop producing more in this stage. Thus the producer will always expand through this
Stage - I Causes of Increasing Returns: The main reason for increasing returns in the first stage is that in the beginning the fixed factors are larger in quantity than the variable factor. When more units of the variable factor are applied to a fixed factor, the fixed factor is used more intensively and production increases rapidly. In the beginning, the fixed factor cannot be put to the maximum use due to the non- applicability of sufficient units of the variable factor. But when units of the variable factor are
STUDY MATERIAL FOR B.COM ECONOMICS FOR COMPETITIVE EXAMINATION - I
SEMESTER - III, ACADEMIC YEAR 2020 - 21
Page 31 of 46
applied in sufficient quantities, division of labour and specialization lead to per unit increase in production and the law of increasing returns operate. Another reason for increasing returns is that the fixed factors are indivisible which means that they must be used in a fixed minimum size. When more units of the variable factor are applied on such a fixed factor, production increases more than proportionately. This point towards the law of increasing returns. Stage-II: Diminishing Returns
It is the most important stage of production. Stage II starts when at point E where the MP curve intersects the AP curve which is at the maximum. Then both continue to decline with AP above MP and the TP curve begins to increase at a decreasing rate till it reaches point C. At this point the MP curve becomes negative when the TP curve begins to decline, table 1 show this stage when the workers are increased from 4 to 7 to cultivate the given land. In figure 1, it lies between BE and CF. Here land is scarce and is used intensively.
More and more workers are employed in order to have larger output. Thus the total product increases at a diminishing rate and the average and marginal product decline. This is the only stage in which production is feasible and profitable because in this stage the marginal productivity of labour, though positive, is diminishing but is non-negative. Hence it is not correct to say that the law of variable proportions is another name for the law of diminishing returns. In fact, the law of diminishing returns is only one phase of the law of variable proportions. The law of diminishing returns in this sense has been defined by Prof. Benham thus: “As the proportion of one factor in a combination of factors is increased, after a point, the average and marginal product of that factor will diminish”.
Stage-III: Negative Marginal Returns
Production cannot take place in stage III either. For in this stage, total product starts declining and the marginal product becomes negative. The employment of the 8th worker actually causes a decrease in total output from 60 to 56 units and makes the marginal product minus 4. In the figure, this stage starts from the dotted line CF where the MP curve is below the A‟-axis. Here the workers are too many in relation to the available land, making it absolutely impossible to cultivate it.
The Best Stage:
In stage I, when production takes place to the left of point E, the fixed factor is excess in relation to the variable factors which cannot be used optimally. To the right of point F, the variable input is used excessively in Stage III. Therefore, no producer will produce in this stage because the marginal production is negative.
Thus the first and third stages are of economic absurdity or economic nonsense. So production will always take place in these stage in which total output of the firm increases at a diminishing rate and MP and AP are the maximum, then they start decreasing and production is optimum. This is the optimum and best stage of production.
Law of Returns to Scale
In the long run, expansion of output can be achieved by variation in the use of all factors as all factors are variable. The laws of returns to scale refer to the effects of changes in the scale of production. In the long run, output can be increased by effecting a change in the use of all factors keeping the same proportion or by changes in different proportions.
STUDY MATERIAL FOR B.COM ECONOMICS FOR COMPETITIVE EXAMINATION - I
SEMESTER - III, ACADEMIC YEAR 2020 - 21
Page 32 of 46
Meaning The degree of responsiveness of output to a proportionate change in the quantity of all
inputs is called returns to scale. There are three possibilities via; (a) constant returns to scale, (b) increasing returns to scale and (c) decreasing returns to scale. Constant Returns to Scale
In the case of constant returns to scale, when all factor of production is increased in a given proportion, the output would also increase in the same proportion. For example, if the quantity of labour and capital is increased by 10%, output also increases by 10%. If labour and capital are doubled, output also doubles. Similarly, if all inputs are reduced by a given proportion, output is reduced by the same proportion.
Increasing Returns to Scale
In the case of increasing returns to scale, when all factors are increased in a given proportion, output increases by a greater proportion. For example, if the amount of labour and capital is increased by 10%, output increases by more than 10%. If the quantity of labour and capital doubles, output more than doubles.
Decreasing Returns to Scale
In the case of decreasing returns to scale, output increases in a smaller proportion than the increase in all inputs, i.e., in this case as inputs are increased by a particular proportion, output increases less than proportionately. For example, if inputs are increased by 10% output increases by less than 10%. If inputs double, outputs will less than double.
Economics and Diseconomies of Scale Economics of Scale
A business firm expands its scale of production to earn profit. It derives many turn, help in lowering the cost of production and increasing its productive efficiency.
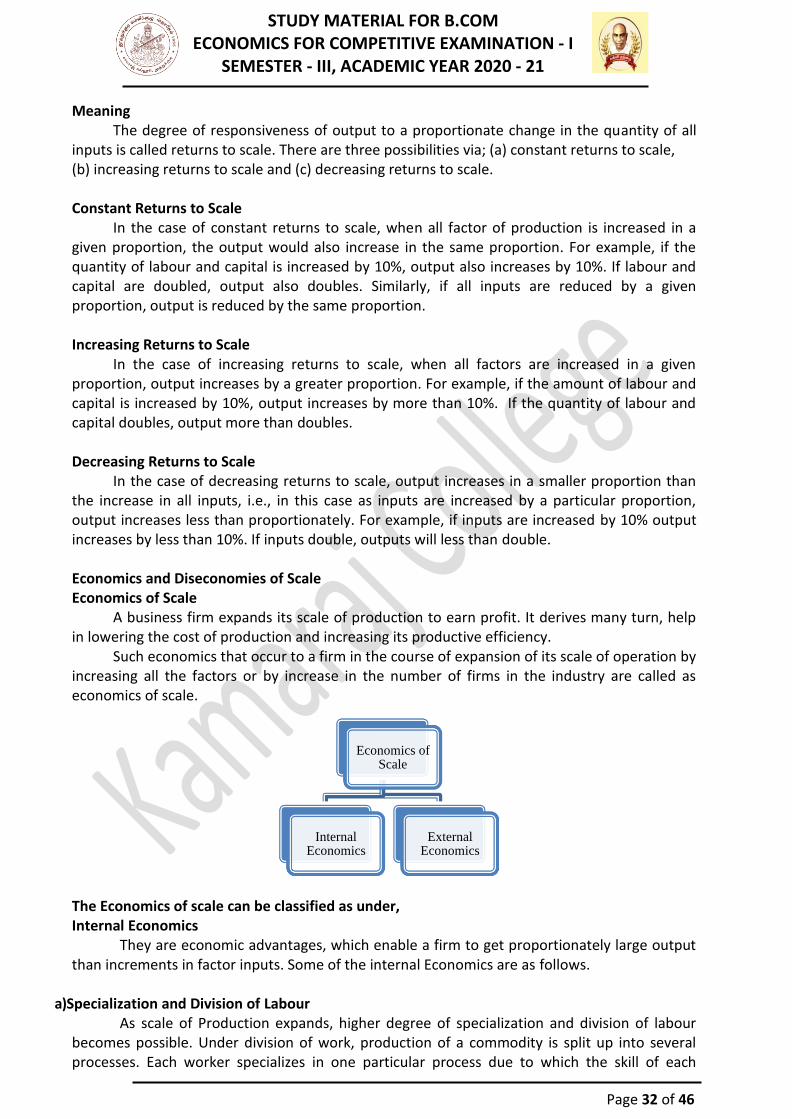
Such economics that occur to a firm in the course of expansion of its scale of operation by increasing all the factors or by increase in the number of firms in the industry are called as economics of scale.
The Economics of scale can be classified as under, Internal Economics
They are economic advantages, which enable a firm to get proportionately large output than increments in factor inputs. Some of the internal Economics are as follows.
a)Specialization and Division of Labour
As scale of Production expands, higher degree of specialization and division of labour becomes possible. Under division of work, production of a commodity is split up into several processes. Each worker specializes in one particular process due to which the skill of each
Economics of Scale
Internal Economics
External Economics
STUDY MATERIAL FOR B.COM ECONOMICS FOR COMPETITIVE EXAMINATION - I
SEMESTER - III, ACADEMIC YEAR 2020 - 21
Page 33 of 46
worker is improved.
b)Technical Economics This economics arise from the greater efficiency of large size of plants and capital
equipment’s, which the large firm can afford to employ superior, more specialized and automatic machines can be installed by them.
c)Production Economics
The large firm is able to utilize all its waste materials for the development of by product industry. Thus, it enjoys the economy of the use of by-product. For example, the waste left over after manufacturing sugar from the sugarcane can be used for producing paper by installing a plant for this purpose.
d)Managerial Economics
This economics are due to better and more elaborate management, which only the large firm can afford. In a large firm, the owner can concentrate on fundamental problems of policy-making and business expansion, delegating the routine jobs and details to highly qualified subordinates.
e)Marketing Economics
As the firm expands in its size, it is able to buy raw materials at cheaper rates as it buys regularly and in bulk quantities. It can secure concessions from railways and transport companies. It can also enjoy prompt delivery careful attention and considerate treatment from all intermediaries.
f)Financial Economics
The large firm with a large asset base and goodwill in the market is able to secure the necessary funds either as block capital or for meeting the working capital needs of the enterprise.
g)Risk and Survival Economics
Every firm has to face general and particular risks for its existence. While the former occur during general business depression due to insufficient demand, latter refers to market fluctuations for one product. Small firms cannot survive in the face of such risks and go into liquidation.
h)Economics of Employee welfare schemes
A large firm with adequate resources can provide employee welfare facilities for its managerial and technical staff, both within and outside the factory. These measures enhance the motivation, morale and commitment of the employees of the firm and its objectives. It leads to efficiency of the human capital and hence production. External Economics
When many firms expand in a particular area, each member firm sources a number of economic advantages, which are known as external economics. Some of the external economics are as follows:
1. The availability of better transportation and communication at cheaper rates. 2. Provision of better and more adequate sources of power, water and electricity. 3. Growth and development of ancillary industries, making use of waste matter by giving it
STUDY MATERIAL FOR B.COM ECONOMICS FOR COMPETITIVE EXAMINATION - I
SEMESTER - III, ACADEMIC YEAR 2020 - 21
Page 34 of 46
the shape of by-products. 4. Establishment of technical and engineering institutions ensuring continuous supply of
skilled man power. 5. Better housing, public health and recreational facilities.
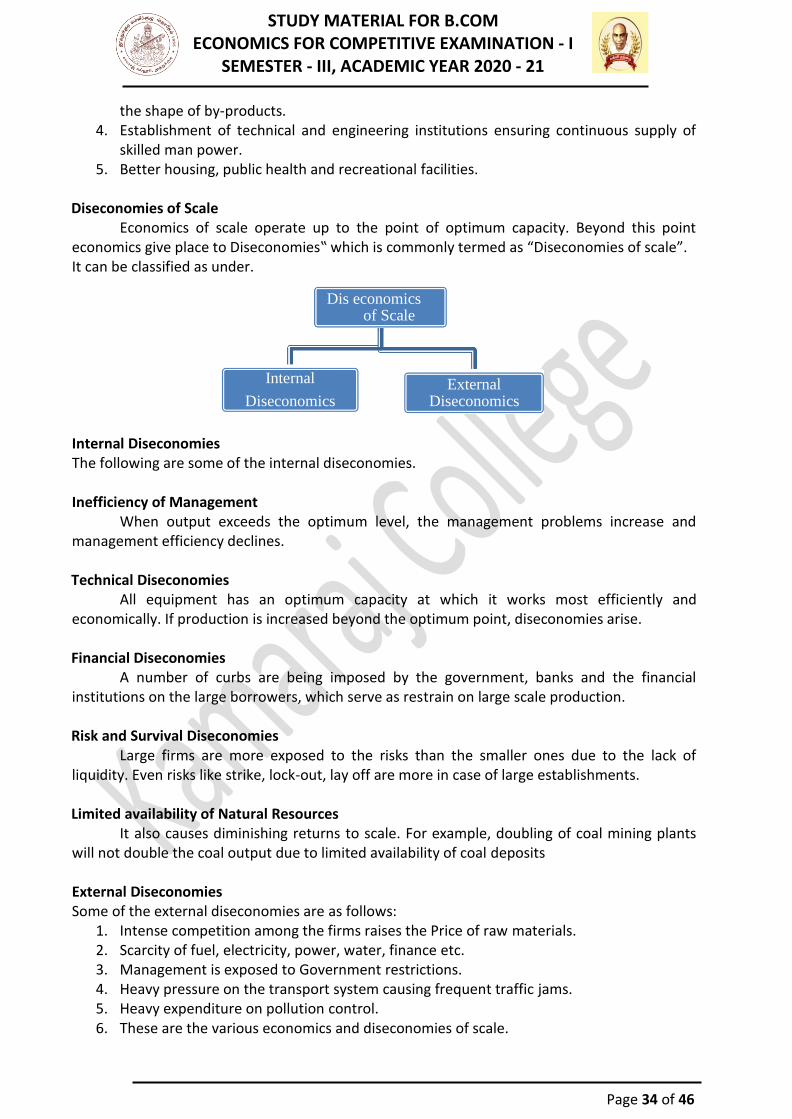
Diseconomies of Scale
Economics of scale operate up to the point of optimum capacity. Beyond this point economics give place to Diseconomies‟ which is commonly termed as “Diseconomies of scale”. It can be classified as under.
Internal Diseconomies The following are some of the internal diseconomies.
Inefficiency of Management When output exceeds the optimum level, the management problems increase and
management efficiency declines.
Technical Diseconomies All equipment has an optimum capacity at which it works most efficiently and
economically. If production is increased beyond the optimum point, diseconomies arise.
Financial Diseconomies A number of curbs are being imposed by the government, banks and the financial
institutions on the large borrowers, which serve as restrain on large scale production.
Risk and Survival Diseconomies Large firms are more exposed to the risks than the smaller ones due to the lack of
liquidity. Even risks like strike, lock-out, lay off are more in case of large establishments.
Limited availability of Natural Resources It also causes diminishing returns to scale. For example, doubling of coal mining plants
will not double the coal output due to limited availability of coal deposits External Diseconomies Some of the external diseconomies are as follows:
1. Intense competition among the firms raises the Price of raw materials. 2. Scarcity of fuel, electricity, power, water, finance etc. 3. Management is exposed to Government restrictions. 4. Heavy pressure on the transport system causing frequent traffic jams. 5. Heavy expenditure on pollution control. 6. These are the various economics and diseconomies of scale.
Dis economics of Scale
Internal
Diseconomics External
Diseconomics
STUDY MATERIAL FOR B.COM ECONOMICS FOR COMPETITIVE EXAMINATION - I
SEMESTER - III, ACADEMIC YEAR 2020 - 21
Page 35 of 46
RENT Renting, also known as hiring or letting, is an agreement where a payment is made for
the temporary use of a good, service or property owned by another. A gross lease is when the tenant pays a flat rental amount and the landlord pays for all property charges regularly incurred by the ownership. An example of renting is equipment rental. Renting can be an example of the sharing economy.
WAGES
A wage is monetary compensation (or remuneration, personnel expenses, labor) paid by an employer to an employee in exchange for work done. Payment may be calculated as a fixed amount for each task completed (a task wage or piece rate), or at an hourly or daily rate (wage labour), or based on an easily measured quantity of work done. Wages are part of the expenses that are involved in running a business.
Payment by wage contrasts with salaried work, in which the employer pays an arranged
amount at steady intervals (such as a week or month) regardless of hours worked, with commission which conditions pay on individual performance, and with compensation based on the performance of the company as a whole. Waged employees may also receive tips or gratuity paid directly by clients and employee benefits which are non-monetary forms of compensation. Since wage labour is the predominant form of work, the term "wage" sometimes refers to all forms (or all monetary forms) of employee compensation. INTEREST
Interest, in finance and economics, is payment from a borrower or deposit-taking financial institution to a lender or depositor of an amount above repayment of the principal sum (that is, the amount borrowed), at a particular rate. It is distinct from a fee which the borrower may pay the lender or some third party. It is also distinct from dividend which is paid by a company to its shareholders (owners) from its profit or reserve, but not at a particular rate decided beforehand, rather on a pro rata basis as a share in the reward gained by risk taking entrepreneurs when the revenue earned exceeds the total costs.
PROFIT
Profit, in accounting, is an income distributed to the owner in a profitable market production process (business). Profit is a measure of profitability which is the owner's major interest in the income-formation process of market production. There are several profit measures in common use.
Income formation in market production is always a balance between income generation and income distribution. The income generated is always distributed to the stakeholders of production as economic value within the review period. The profit is the share of income formation the owner is able to keep to himself/herself in the income distribution process. Profit is one of the major sources of economic well-being because it means incomes and opportunities to develop production. The words "income", "profit" and "earnings" are synonyms in this context.
STUDY MATERIAL FOR B.COM ECONOMICS FOR COMPETITIVE EXAMINATION - I
SEMESTER - III, ACADEMIC YEAR 2020 - 21
Page 36 of 46
UNIT - IV PRODUCT PRICING
PERFECT COMPETITION Competition is an important feature of a perfect market. There exists competition
between buyers and buyers for buying a product and sellers for selling a product. According to Joan Robinson, “Perfect competition prevails, when the demand for the output is perfectly elastic”.
Conditions (features)
The following are the features of perfect competition. 1. Large number of buyers and sellers 2. Homogeneous product 3. Free entry or exit 4. Perfect knowledge 5. Free mobility of factors 6. Absence of transport cost 7. Uniform price
1.Large number of buyers and sellers
There are large number of buyers and seller for a product. So a single buyer or seller cannot influence the price.
2.Homogeneous product
The product sold by all the sellers should be homogeneous in all respect.
3.Free entry or exit There should be complete freedom for the entry of new firms or exit of the existing firms
from the industry.
4.Perfect Knowledge The buyers and sellers should have clear knowledge about the market.
5.Free mobility of factors There should be no restrictions on the movement of factors of production. It is essential
in order to enable the sellers (firms) to adjust their supply to demand.
6.Absence of transport cost There should be no transport cost for the movement of goods from one place to
another.
7.Uniform price All the units of a product should be sold at the same price. This condition makes the
demand curve (Revenue curve) as a perfectly elastic one.

STUDY MATERIAL FOR B.COM ECONOMICS FOR COMPETITIVE EXAMINATION - I
SEMESTER - III, ACADEMIC YEAR 2020 - 21
Page 37 of 46
8. Demand The demand for a product may be elastic or inelastic. If the demand for his commodity
is elastic, then he cannot fix high price. Because the demand for the product may be decreased due to this low sales volume, profit may be reduced. He cannot maximize his profits.
9. Supply: The monopolist should consider the conditions of supply.
1. Law of diminishing cost. 2. Law of increasing cost. 3. Law of constant cost.
IMPERFECT COMPETITION
In economic theory, imperfect competition is a type of market structure showing some but not all features of competitive markets.
Forms of imperfect competition include: Monopolistic competition
A situation in which many firms with slightly different products compete. Production costs are above what may be achieved by perfectly competitive firms, but society benefits from the product differentiation.
Monopoly
A firm with no competitors in its industry. A monopoly firm produces less output, has higher costs, and sells its output for a higher price than it would if constrained by competition. These negative outcomes usually generate government regulation.
Oligopoly
An industry with only a few firms. If they collude, they form a cartel to reduce output and drive up profits the way a monopoly does.
Duopoly
A special form of Oligopoly, with only two firms in an industry
Monopsony A market with a single buyer and many sellers
Oligopsony
A market with a few buyers and many sellers
Price and Output Determination Under Monopoly A monopolist is the sole seller of product which has no close substitutes. The aim of a monopolist is get maximum profits.
1. He may fix the price and allow the supply to be determined by demand. 2. He may fix the supply and allow the price to be determined by the demand.
Under monopoly market, price of the goods is determined by the forces of demand and supply. Monopolist is the sole seller of particular products. So, he can control the supply of
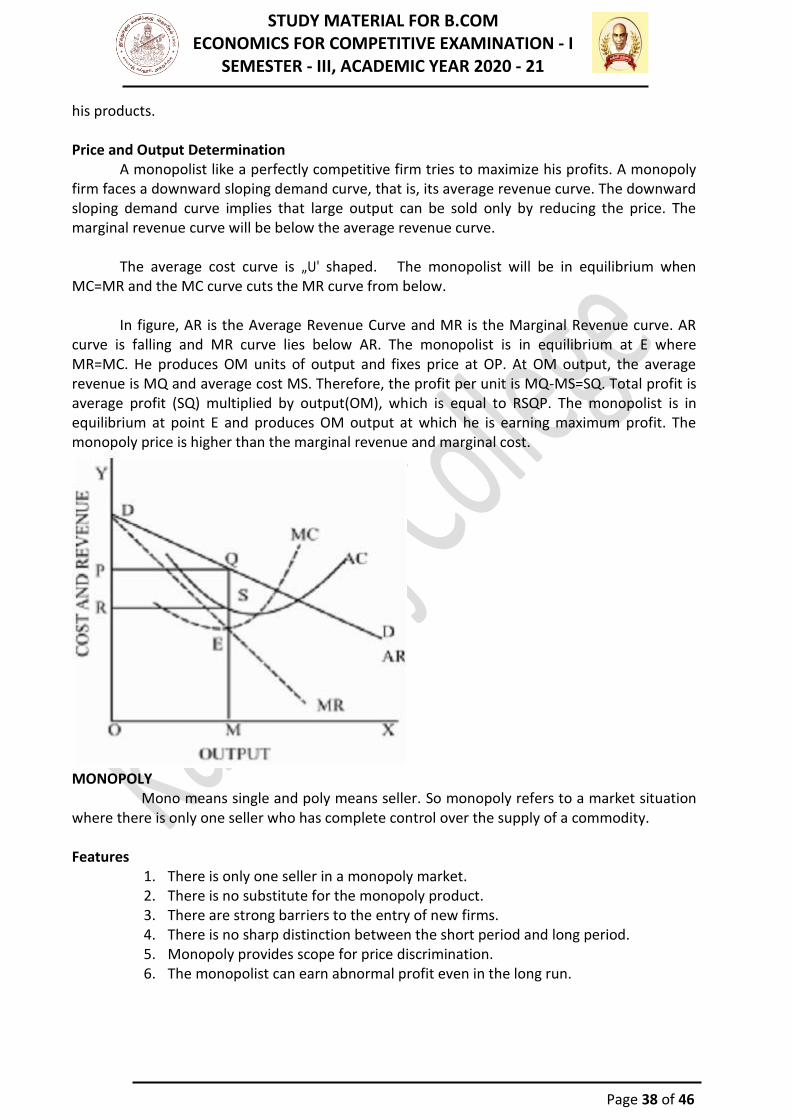
STUDY MATERIAL FOR B.COM ECONOMICS FOR COMPETITIVE EXAMINATION - I
SEMESTER - III, ACADEMIC YEAR 2020 - 21
Page 38 of 46
his products. Price and Output Determination
A monopolist like a perfectly competitive firm tries to maximize his profits. A monopoly firm faces a downward sloping demand curve, that is, its average revenue curve. The downward sloping demand curve implies that large output can be sold only by reducing the price. The marginal revenue curve will be below the average revenue curve.
The average cost curve is „U‟ shaped. The monopolist will be in equilibrium when
MC=MR and the MC curve cuts the MR curve from below. In figure, AR is the Average Revenue Curve and MR is the Marginal Revenue curve. AR
curve is falling and MR curve lies below AR. The monopolist is in equilibrium at E where MR=MC. He produces OM units of output and fixes price at OP. At OM output, the average revenue is MQ and average cost MS. Therefore, the profit per unit is MQ-MS=SQ. Total profit is average profit (SQ) multiplied by output(OM), which is equal to RSQP. The monopolist is in equilibrium at point E and produces OM output at which he is earning maximum profit. The monopoly price is higher than the marginal revenue and marginal cost.
MONOPOLY Mono means single and poly means seller. So monopoly refers to a market situation where there is only one seller who has complete control over the supply of a commodity. Features
1. There is only one seller in a monopoly market. 2. There is no substitute for the monopoly product. 3. There are strong barriers to the entry of new firms. 4. There is no sharp distinction between the short period and long period. 5. Monopoly provides scope for price discrimination. 6. The monopolist can earn abnormal profit even in the long run.

STUDY MATERIAL FOR B.COM ECONOMICS FOR COMPETITIVE EXAMINATION - I
SEMESTER - III, ACADEMIC YEAR 2020 - 21
Page 39 of 46
Causes for Monopoly 1. Where the monopoly has acquired control over the supply of an important raw
materials. 2. Where huge capital is necessary. 3. In the case of public utilities. 4. Where legal restrictions prevent the entry of new firms.
Kinds of Monopoly On the basic of ownership monopoly can be classified into private and public monopoly.
1. Private monopoly is that which is owned and operated by private individuals for the sole purpose of profit.
2. Public or Government monopoly is one that is run by the public authorities to increase economic welfare. Some economists call it as welfare monopoly.
3. Simple monopoly is that which charges single or uniform price from all the buyers. 4. Discriminating monopoly charges more than one price for the same product from
different buyers.
Characteristics of Monopoly 1. Single Seller:
There is only one seller; he can control the price or supply of his product. But he cannot control demand for the product, as there are many buyers.
2. No close substitutes: There are no close substitutes for the product. The buyers have no alternatives or choice. Either they have to buy the product or go without it.
3. Price: The monopolist has control over the supply so as to increase the price. Sometimes he may adopt price discrimination. He may fix different prices for different sets of consumers. A monopolist can either fix the price or quantity of output; but he cannot do both, at the same time.
4. No Entry: There is no freedom to other producers to enter the market as the monopolist is enjoying monopoly power. There are strong barriers for new firms to enter. There are legal, technological, economic and natural obstacles, which may block the entry of new producers.
5. Firm and Industry: Under monopoly, there is no difference between a firm and an industry. As there is only one firm, that single firm constitutes the whole industry.
Monopolistic Competition Prof. E.H. Chamberlin describes the real world market as a market of monopolistic competition. He has written a book entitled ‘Theory of monopolistic competition’ in 1933. Mrs. Joan Robinson has brought out the same idea in her book. “The Economics of imperfect competition” Features Many buyers and sellers: There are many buyers and sellers in an imperfect market. So individual firms have
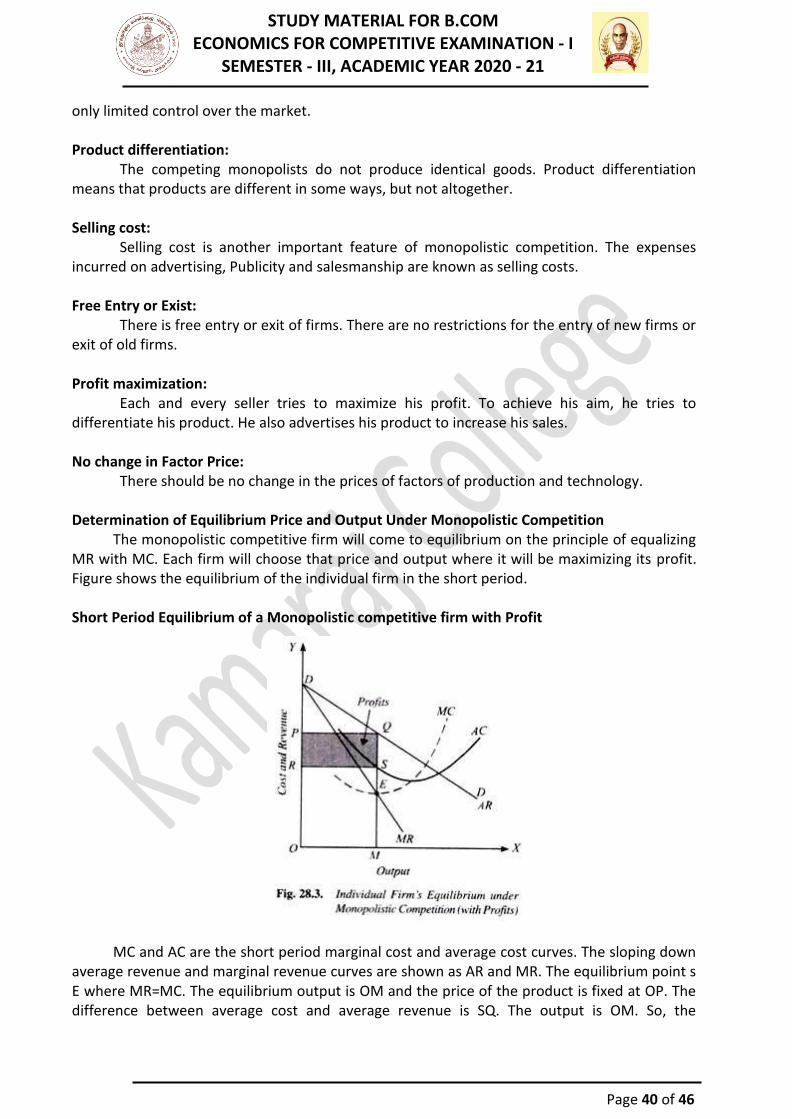
STUDY MATERIAL FOR B.COM ECONOMICS FOR COMPETITIVE EXAMINATION - I
SEMESTER - III, ACADEMIC YEAR 2020 - 21
Page 40 of 46
only limited control over the market. Product differentiation:
The competing monopolists do not produce identical goods. Product differentiation means that products are different in some ways, but not altogether. Selling cost:
Selling cost is another important feature of monopolistic competition. The expenses incurred on advertising, Publicity and salesmanship are known as selling costs. Free Entry or Exist: There is free entry or exit of firms. There are no restrictions for the entry of new firms or exit of old firms. Profit maximization: Each and every seller tries to maximize his profit. To achieve his aim, he tries to differentiate his product. He also advertises his product to increase his sales. No change in Factor Price: There should be no change in the prices of factors of production and technology. Determination of Equilibrium Price and Output Under Monopolistic Competition
The monopolistic competitive firm will come to equilibrium on the principle of equalizing MR with MC. Each firm will choose that price and output where it will be maximizing its profit. Figure shows the equilibrium of the individual firm in the short period.
Short Period Equilibrium of a Monopolistic competitive firm with Profit
MC and AC are the short period marginal cost and average cost curves. The sloping down
average revenue and marginal revenue curves are shown as AR and MR. The equilibrium point s E where MR=MC. The equilibrium output is OM and the price of the product is fixed at OP. The difference between average cost and average revenue is SQ. The output is OM. So, the
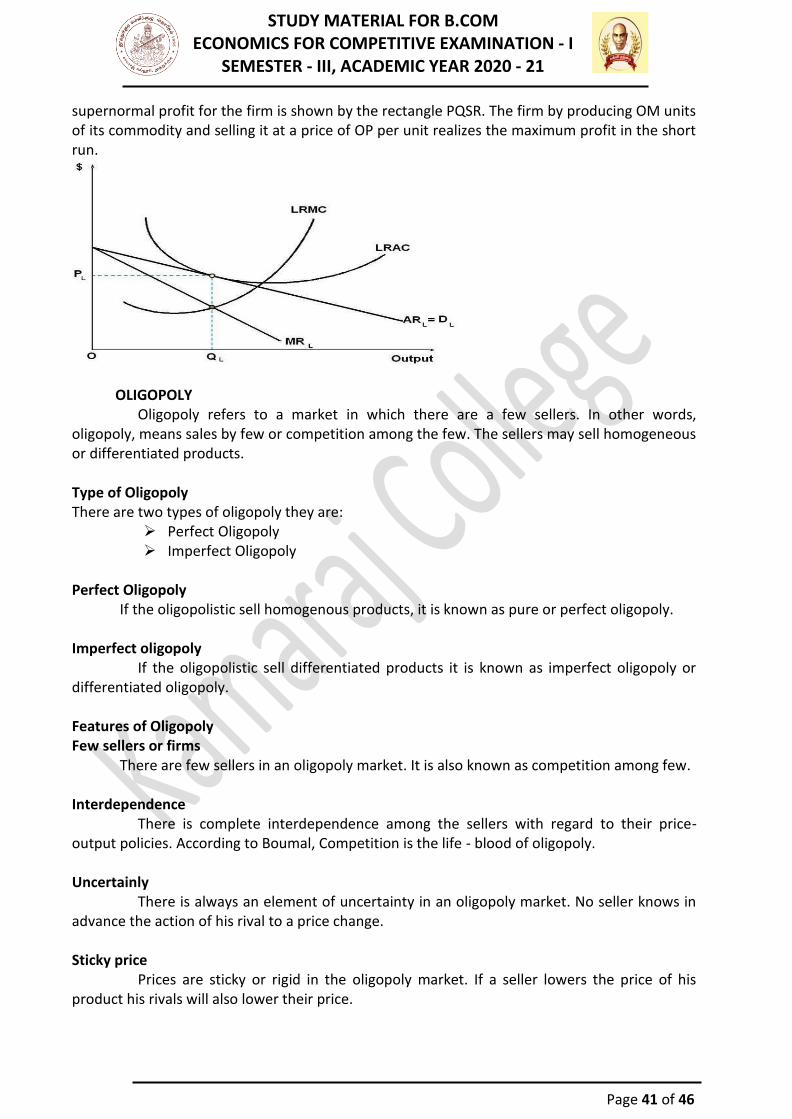
STUDY MATERIAL FOR B.COM ECONOMICS FOR COMPETITIVE EXAMINATION - I
SEMESTER - III, ACADEMIC YEAR 2020 - 21
Page 41 of 46
supernormal profit for the firm is shown by the rectangle PQSR. The firm by producing OM units of its commodity and selling it at a price of OP per unit realizes the maximum profit in the short run.
OLIGOPOLY Oligopoly refers to a market in which there are a few sellers. In other words, oligopoly, means sales by few or competition among the few. The sellers may sell homogeneous or differentiated products. Type of Oligopoly There are two types of oligopoly they are:
➢ Perfect Oligopoly ➢ Imperfect Oligopoly
Perfect Oligopoly If the oligopolistic sell homogenous products, it is known as pure or perfect oligopoly. Imperfect oligopoly If the oligopolistic sell differentiated products it is known as imperfect oligopoly or differentiated oligopoly. Features of Oligopoly Few sellers or firms There are few sellers in an oligopoly market. It is also known as competition among few. Interdependence There is complete interdependence among the sellers with regard to their price-output policies. According to Boumal, Competition is the life - blood of oligopoly. Uncertainly There is always an element of uncertainty in an oligopoly market. No seller knows in advance the action of his rival to a price change. Sticky price Prices are sticky or rigid in the oligopoly market. If a seller lowers the price of his product his rivals will also lower their price.

STUDY MATERIAL FOR B.COM ECONOMICS FOR COMPETITIVE EXAMINATION - I
SEMESTER - III, ACADEMIC YEAR 2020 - 21
Page 42 of 46
Lack of uniformity There is lack of uniformity in the size of firms. Some may be small while others are very large. Advertising Each oligopoly use advertisement as a form of non-price competition. Characteristics of Oligopoly Interdependence The most important feature of oligopoly is interdependence in decision-making. Since there are a few firms, each firm closely watches the activities of the other firm. Group Behaviour Firms may realize the importance of mutual co-operation. Then they will have a tendency of collusion.
Price Rigidity Another important feature of oligopoly is price rigidity. Price is sticky or rigid at the prevailing level due to the fear of reaction for the rival firms. If an oligopolistic firm lowers its price, the price reduction will be followed by the rival firms.
STUDY MATERIAL FOR B.COM ECONOMICS FOR COMPETITIVE EXAMINATION - I
SEMESTER - III, ACADEMIC YEAR 2020 - 21
Page 43 of 46
UNIT - V INVESTMENT
Meaning of Investment An investment is an asset or item acquired with the goal of generating income or
appreciation. In an economic sense, an investment is the purchase of goods that are not consumed today but are used in the future to create wealth. In finance, an investment is a monetary asset purchased with the idea that the asset will provide income in the future or will later be sold at a higher price for a profit.
TYPES OF INVESTMENT
There are many different types of investments that you can put your money in. All of them have their upside and downsides. Gold, real estate, bonds, and stocks are just a few examples of investment types. You’ve probably come across a few of these in researching what to do with your money. Let’s get into what they all mean and what you can do with them.
Gold
First, you can invest in gold. But keep this in mind, gold is a commodity — so if you are investing in gold, be aware that your protection against a price drop, your moat, is based on scarcity and fear. If you think the world is going to be a more fearful place in the future, gold is good.
Real Estate
You can invest in housing and real estate. I like any good investment – Publicly traded businesses, private businesses, apartments, farms and trailer parks are all good as long as you treat them the same as an investment.
The hardest part about investing in real estate is getting a house that is 50% off of what
it’s worth. If you can do that though, you can make some decent returns investing in real estate.
However, it might be easier to invest in the stock market, make the same returns or better, and not have to deal with having a bunch of rental properties to take care of.
Bonds
When you invest in bonds, you lend your money to the issuer in exchange for periodic interest payouts, along with the returns on the investment amount. Bonds are issued by corporations, municipalities and government agencies.
Bond might only net you a 3% return on your money over multiple years. When you take
your money out of the bond, you’ll have less buying power than when you put it in because the growth rate could even keep up with the rate of inflation. There is nothing “safe” about running out of money in retirement because your rates of return couldn’t keep up with inflation.
Non - Investments
Kinds of things are NOT investments like a new car, your TV, your couch or bed. Things that lose value over time from you owning them are not considered investments.
STUDY MATERIAL FOR B.COM ECONOMICS FOR COMPETITIVE EXAMINATION - I
SEMESTER - III, ACADEMIC YEAR 2020 - 21
Page 44 of 46
Stocks and Equities Stocks and equities are one of the most common types of growth-oriented investment
avenues that can help you grow the value of your original investment over a medium to long time interval. While you can receive higher dividends, there is always a higher level of risk. The investment returns and risks for stocks vary, as per the economy, political scene, company’s performance, and other stock market indices.
Debt Mutual Funds
Debt mutual funds are a mix of fixed income securities, such as Treasury Bills, Government Securities, Corporate bonds, liquid or money-market funds, short-term income funds, gilt funds, and other debt securities of different time horizons. These have a fixed maturity date and pay a fixed rate of interest. The returns include interest income and capital appreciation or depreciation in the value, due to market fluctuations.
Fixed Deposits
Fixed Deposits are financial instruments where you can invest a lumpsum amount, to earn guaranteed returns. Your investment can be locked in for a specified period, during which your interest gets accumulated. This interest is pre-decided and unaffected by market forces, so you can get guaranteed returns.
This certainty of returns can help you plan your finances in a better way. Fixed
Deposit enables you to earn higher returns, with flexible tenors and options to choose periodic payouts as per your convenience.
While investing in growth-oriented investment avenues can help you earn high returns,
it is also important to balance your portfolio by including stable investment options like fixed deposits. Provident Funds
The Provident Fund is a major part of your retirement funds, which must be kept securely for your future. It is the sum of savings accrued, with contributions made by an employee, during the time he/she worked in the organization, along with an equal contribution from the employer. These savings can be withdrawn at the end of the employment or during retirement. Insurance
Term life insurance, unlike permanent life insurance, does not have any cash value and therefore does not have any investment component. However, you can think of term life insurance as an investment in the sense that you are paying relatively little in premiums in exchange for a relatively large death benefit. Bank Deposit
Bank deposits consist of money placed into banking institutions for safekeeping. These deposits are made to deposit accounts such as savings accounts, checking accounts and money market accounts.

STUDY MATERIAL FOR B.COM ECONOMICS FOR COMPETITIVE EXAMINATION - I
SEMESTER - III, ACADEMIC YEAR 2020 - 21
Page 45 of 46
Advantages of Savings Schemes Long - term benefits
Individuals can achieve their long-term goals such as retirement plans, children’s education, and children’s marriage by investing in savings schemes.
Various savings schemes
The number of savings scheme currently available is large. The benefits vary according to the scheme and the sector. For example, the Pradhan Mantri Jan Dhan Yojana is designed to help people who are below poverty line and the Sukanya Samriddhi Yojana helps a girl child financially.
Hassle - free
The maintenance and investment towards the schemes are very simple and most of the contributions made towards the schemes can be done online.
Security and safety
The contributions that are made towards the schemes are minimal on risk as well as safe and secure since the schemes are launched by the Indian Government.
Small Savings Schemes (SSS) Public Provident Fund (PPF)
The Public Provident Fund (PPF) scheme is one of the most popular and safest investment options that is available in the country. Under Section 80C of the Income Tax Act, contributions made towards the scheme as well as the interest that is generated from the contributions is also tax exempt.
Employees’ Provident Fund (EPF)
The Employees’ Provident Fund Organisation (EPFO ) launched the EPF scheme with the main aim of helping employees save money for their retirement. It is mandatory for organizations with more than 20 employees to contribute towards the EPF scheme. The employee and employer each contribute 12% of the employee’s Dearness Allowance (DA) and basic salary towards the scheme.
National Pension System (NPS)
The NPS was launched by the Central Government with the main aim of providing individuals a regular income after their retirement. Employees can avail the benefits of the scheme by paying a small amount of premium.
Employees will receive a lump sum amount at the time of their retirement as well as a certain percentage will be paid back as pension on a monthly basis after their retirement.
Sukanya Samriddhi Yojana Account (SSY)
The Sukanya Samriddhi Yojana (SSY) scheme was launched by Prime Minister Narendra Modi to help secure the future of a girl child. The current rate of interest offered by the scheme is 8.5% and an SSY account can be opened at post offices or banks.
Atal Pension Yojana (APY)
The main aim of the scheme is to help individuals who are below the poverty line. The

STUDY MATERIAL FOR B.COM ECONOMICS FOR COMPETITIVE EXAMINATION - I
SEMESTER - III, ACADEMIC YEAR 2020 - 21
Page 46 of 46
scheme also benefits people who work in the unorganised sector and require financial support from the government. Individuals pay a very low premium towards the scheme and receive a pension after their retirement. However, it is mandatory that individuals have an active savings account in order to avail benefits from the scheme. Voluntary Provident Fund (VPF)
Employees can opt for the VPF scheme on a voluntary basis. Under the VPF scheme, employees are allowed to contribute their entire basic salary towards the scheme, unlike the EPF scheme, where only 12% of the basic salary can be contributed.
Kisan Vikas Patra (KVP)
The Kisan Vikas Patra certificate scheme is offered by post offices in India. The rate of interest that is offered by the scheme at the moment is 7.7% and it is compounded on an annual basis. The minimum contribution that must be towards the scheme is Rs. 1,000 and there is no maximum limit. Over the course of 112 months, the amount invested towards the scheme doubles.
Senior Citizens Savings Scheme (SCSS)
The SCSS was launched with the aim of helping individuals who are 60 years and above. Individuals who are between the ages of 55 years and 60 years and have chosen for Voluntary Retirement Scheme (VRS) can also avail the benefits of the SCSS.
National Savings Certificate (NSC)
The NSC scheme is one of the most popular schemes in India. Since the scheme is backed by the Indian Government, guaranteed returns and tax benefits are provided. The duration of the scheme is 5 years and individuals can invest in the scheme at post offices. The Indian Government decides the interest rates of the scheme on a quarterly basis. Post Office Savings Scheme
The various savings schemes that are offered by India Post are very popular as the risks are very minimal and most of the schemes provide guaranteed returns. The process to open any saving schemes accounts at the post office is simple and quick. The many good features offered by the schemes also make them popular.