European Exploration, Trade and Colonization Grade Level: Fifth Grade (Geography and World History
Upload
khangminh22Category
view
2download
0

Geography
Study & Master
Helen Collett • Norma Winearls • Caron Olivier
Grade 10Teacher’s Guide
University Printing House, Cambridge CB2 8BS, United Kingdom
One Liberty Plaza, 20th Floor, New York, NY 10006, USA
477 Williamstown Road, Port Melbourne, VIC 3207, Australia
314–321, 3rd Floor, Plot 3, Splendor Forum, Jasola District Centre, New Delhi – 110025, India
79 Anson Road, #06–04/06, Singapore 079906
The Water Club, Beach Road, Granger Bay, Cape Town 8005, South Africa
Cambridge University Press is part of the University of Cambridge.
It furthers the University’s mission by disseminating knowledge in the pursuit of education, learning and research at the highest international levels of excellence.
www.cambridge.org Information on this title: www.cambridge.org/9781107381636
© Cambridge University Press 2012, 2020
This publication is in copyright. Subject to statutory exceptionand to the provisions of relevant collective licensing agreements,no reproduction of any part may take place without the writtenpermission of Cambridge University Press.
First published 2012Updated 2020Reprinted 2021
ISBN 978-1-107-38163-6
Editor: Barbara HuttonTypesetter: Brink Publishing & DesignIllustrator: James Whitelaw……………………………………………………………………………………………………………
Acknowledgements Photographs: Alex Guth: page 48; OSIS (Ocean Satellite Imaging Systems) Landstat image: page 101; Wikipedia: page 101Maps: Department: Rural Development & Land Reform. Republic of South Africa. Directorate: National Geo-spatial Information: pages 234, 257 and 258 Cover image: Masked weaver bird, juvenile © Anthony van Tonder/ Independent Contributors/Africa Media Online ……………………………………………………………………………………………………………
Cambridge University Press has no responsibility for the persistence or accuracy of URLs for external or third-party internet websites referred to in this publication, and does not guarantee that any content on such websites is, or will remain, accurate or appropriate. Information regarding prices, travel timetables and other factual information given in this work are correct at the time of first printing but Cambridge University Press does not guarantee the accuracy of such information thereafter.……………………………………………………………………………………………………………notice to teachers
The photocopy masters in this publication may be photocopied or distributed [electronically] free of charge for classroom use within the school or institution which purchases the publication. Worksheets and copies of them remain in the copyright of Cambridge University Press and such copies may not be distributed or used in any way outside the purchasing institution.……………………………………………………………………………………………………………
Every effort has been made to trace the copyright holders. Should any infringement have occurred, please inform the publishers who will correct these in the event of a reprint.……………………………………………………………………………………………………………If you want to know more about this book or any other Cambridge University Press publication, phone us at +27 21 4127800, fax us at +27 21 419-8418 or send an e-mail to [email protected]

1. Introduction 1
2. Lesson-by-lesson 17
3. Formal assessment 199
4. Resources 263
5. Documents 323
Contents


1. INTRODUCTION
1
1. Curriculum and Assessment Policy Statement (CAPS) 2
2. Geography as a subject 2
3. How Study & Master Geography Grade 10 works 4
4. Grade 10 Year Plan 6

2 S E C T I O N 1 • I N T R O D U C T I O N
1. Curriculum and Assessment Policy Statement (CAPS)A single Curriculum and Assessment Policy Statement (CAPS) exists for each school subject. The CAPS for each subject details the minimum outcomes and standards of the learning process as well as assessment processes and procedures.
For more information on the CAPS, please see Section 1 of the CAPS document for Geography.
2. Geography as a subjectAimsGeography is an elective subject that focuses on the study of the human and the physical environments. There are different branches of Geography (for example, Physical Geography and Human Geography) but they all focus on the concept of space in a continuously changing environment.
Geography in Grades 10 to 12 seeks to develop the following knowledge, skills and attitudes in the learners:• explaining and interpreting both physical and human geographical
processes • describing and explaining the dynamic interrelationship between the
physical and human worlds • developing knowledge about where places are and the nature of a range
of different places at different scales • practising essential transferable skills – literacy, numeracy, oracy,
graphicacy • promoting the use of new technologies, such as Information
Communication Technology (ICT) and Geographical Information Systems (GIS)
• developing a commitment towards sustainable development • creating awareness and sensitivity for inequality in the world • fostering empathy, tolerance and fairness • making and justifying informed decisions and judgements about social
and environmental issues.
Geography topicsThe topics in the Geography CAPS (Grades 10–12) can be explored by focussing on the ‘big ideas’ of place, spatial processes, spatial distribution patterns and, the interaction between the human and natural environment. These, coupled with the posing of key questions, provide a launching pad for geographical explorations and investigations.
METHOD OF ENQUIRY KEY QUESTIONS CONCEPTS Observation What is it?
What is it like? Who or what is affected?
physical and human processes, awareness, perception, characteristics, similarities and differences
Description Where does it occur? Why is it there?
location, place, region, space, distribution, pattern, scale, spatial association

3S E C T I O N 1 • I N T R O D U C T I O N
METHOD OF ENQUIRY KEY QUESTIONS CONCEPTS Analysis and explanation
What happened or is happening? Why did it happen? How is it changing?
interdependence, causes and processes
Evaluation and prediction
What are the effects? What is likely to happen?
environmental impact, social impact, interdependence, spatial interaction, spatial organisation, human–environment interaction, cause, process, time, behaviour, consequence, justice, quality of life, environmental quality, welfare, costs and benefits
Geographical knowledge, skills and techniques should be taught in an integrated way in each of the following topics in Grade 10:• The atmosphere (Term 1)• Geomorphology (Term 2)• Population (Term 3)• Water resources (Term 4).
For more information on Geography as a subject, please see Section 2 of the CAPS document.
Time allocation Geography is allocated four hours of teaching time per week in Grades 10 to 12. Revision, consolidation and assessment (formal and informal) are included in this allocation. It is recommended that in addition to this, six hours of fieldwork be undertaken by the learners. Most of this will need to be completed outside of lesson time.
The topics are weighted differently in terms of time allocation. This weighting should not be seen as a statement about the relative importance of the topics since each is equally important. In Grade 10 the topics are weighted as shown on the table which follows:

4 S E C T I O N 1 • I N T R O D U C T I O N
Topic Focus Time allocation Term
The atmosphere Geographical knowledge
27 hours Term 1
Geographical skills and techniques
6 hours
Assessment and consolidation
3 hours
Geomorphology Geographical knowledge
24 hours Term 2
Geographical skills and techniques
10 hours
Assessment and consolidation
2 hours
Population Geographical knowledge
26 hours Term 3
Geographical skills and techniques
4 hours
Assessment and consolidation
6 hours
Water resources Geographical knowledge
15 hours Term 4
Geographical skills and techniques
6 hours
Assessment and consolidation
3 hours
3. How Study & Master Geography Grade 10 worksCourse componentsStudy & Master Geography Grade 10 consists of a:• Learner’s Book• Teacher’s Guide.
Learner’s BookThe Learner’s Book is divided into eight modules that cover the four Geography topics. There are two modules allocated to each topic. The first module focuses specifically on the geographical knowledge associated with the topic while the second module focuses on the geographical skills and techniques associated with it.
Each module is further divided into units and activities. Each module has three or more units each of which covers an area of the topic. There is a Review section at the end of each term which learners can use to revise the term’s work in preparation for tests and examinations. In addition, examination practice is provided at the end of the Learner’s Book. This consists of examination papers which the learners can complete.

5S E C T I O N 1 • I N T R O D U C T I O N
Fieldwork is provided for in a practical and enjoyable way. It is included in the activities of Module 2 for the topic, ‘The atmosphere’. For the other topics in Grade 10, fieldwork activities are suggested at the end of Modules 3, 5 and 7. Fieldwork activities provide learners with an opportunity to apply and deepen their geographical knowledge, skills and techniques as they use what they have learnt to explore and investigate their environment first-hand. As such, these activities are an integral part of learning and help learners to experience the relevance of what they learn in the classroom and transfer it to outside the classroom.
All formal assessment activities (controlled tests and assessment tasks (essay and mapwork) and examinations) are provided in the Teacher’s Guide.
Teacher’s GuideThe Teacher’s Guide provides information and guidance on:• Geography as a subject (Section 1)• planning for the Grade 10 year and lessons (Sections 1 and 4)• using the modules and units in the Learner’s Book to create lessons
(Section 2)• suggested answers for all activities in the Learner’s Book (Section 2)• suggested consolidation and extension activities (Section 2)• informal assessment suggestions (Section 2)• a programme of assessment (Section 3)• controlled tests and assessment tasks (essay and mapwork) (Section 3)• alternative assessment tasks to the ones that appear in the
Learner’s Book• model mid-year and end-of-year examination papers (Section 3)• guidance on the assessment of all Formal Assessment Tasks (Section 3)• memorandums for all Formal Assessment Tasks (Section 3)• recording and reporting on formal assessment (Section 3)• a list of useful websites (Section 4)• classroom materials that can be made with scrap/waste materials
(Section 4)• additional worksheets and activities on all Geography topics (Section 4).
Section 3 mirrors the Learner’s Book and is divided into modules. It indicates how the modules and units in the Learner’s Book can be used to create lessons.
Inclusivity An important part of teaching is to accommodate all learners, including those who experience barriers to learning. Study & Master Geography takes into account that learners come from different backgrounds and have different abilities. So it offers learning material that learners can relate to, while extending their learning and experiences. There are a variety of types of activities – activities that appeal to learners of all levels and backgrounds, and that offer opportunities to work individually, in pairs, in groups or as a whole class. This Teacher’s Guide also provides consolidation and extension activities for each unit which teachers need when they have to manage a class of diverse learners. Section 4 (Resources) also provides further worksheets for learners and ideas for activities.
5

6 S E C T I O N 1 • I N T R O D U C T I O N
4. G
rade
10
Year
Pla
nT
he ta
ble
belo
w in
dica
tes h
ow S
tudy
& M
aste
r Geo
grap
hy G
rade
10
cove
rs a
ll re
quire
men
ts o
f th
e C
APS
for G
eogr
aphy
and
how
it is
inte
nded
for u
se
in e
ach
of th
e 40
wee
ks in
the
scho
ol y
ear.
Term
Wee
k/s
Mod
ule
Uni
t no
.U
nit t
itle
No.
of h
ours
Geo
grap
hy C
APS
con
tent
Reso
urce
s
11
Mod
ule
1 Th
e at
mos
pher
e: G
eogr
aphi
cal
know
ledg
e
1Co
mpo
sitio
n an
d st
ruct
ure
of
the
atm
osph
ere
5Co
mpo
sitio
n an
d st
ruct
ure
of th
e at
mos
pher
e •
Impo
rtan
ce o
f the
atm
osph
ere.
• Th
e co
mpo
sitio
n an
d st
ruct
ure
of
the
atm
osph
ere
– tr
opos
pher
e,
stra
tosp
here
, mes
osph
ere,
th
erm
osph
ere.
• Th
e oz
one
laye
r – in
the
stra
tosp
here
.
• Ca
uses
and
effe
cts
of o
zone
de
plet
ion.
• W
ays
to re
duce
ozo
ne d
eple
tion.
Lear
ner’s
Boo
k pp
. 10–
19; T
each
er’s
Gui
de p
p. 1
8–25
12–
42
Hea
ting
of th
e at
mos
pher
e8
Hea
ting
of th
e at
mos
pher
e •
Proc
esse
s as
soci
ated
with
the
heat
ing
of th
e at
mos
pher
e –
inso
latio
n, re
flect
ion,
sca
tter
ing,
ab
sorp
tion,
radi
atio
n, c
ondu
ctio
n,
conv
ectio
n.
• Th
e gr
eenh
ouse
effe
ct –
impa
ct o
n pe
ople
and
the
envi
ronm
ent.
• Fa
ctor
s th
at a
ffect
the
tem
pera
ture
of
diff
eren
t pla
ces
arou
nd th
e w
orld
–
latit
ude,
alti
tude
, oce
an c
urre
nts,
dist
ance
from
oce
ans.
• G
loba
l war
min
g –
evid
ence
, cau
ses,
and
cons
eque
nces
with
refe
renc
e to
Afr
ica.
• Th
e im
pact
of c
limat
e an
d cl
imat
e ch
ange
on
Afr
ica’s
env
ironm
ent a
nd
peop
le –
des
erts
, dro
ught
s, flo
ods,
risin
g se
a le
vels
.
Lear
ner’s
Boo
k pp
. 20–
39; T
each
er’s
Gui
de p
p. 2
5–36
; atla
ses;
trac
ing
pape
r/w
ax p
aper

7S E C T I O N 1 • I N T R O D U C T I O N
Term
Wee
k/s
Mod
ule
Uni
t no
.U
nit t
itle
No.
of h
ours
Geo
grap
hy C
APS
con
tent
Reso
urce
s
14–
63
Moi
stur
e in
the
atm
osph
ere
8M
oist
ure
in th
e at
mos
pher
e•
Wat
er in
the
atm
osph
ere
in
diffe
rent
form
s –
wat
er v
apou
r, liq
uid
• Pr
oces
ses
asso
ciat
ed w
ith
evap
orat
ion,
con
dens
atio
n an
d pr
ecip
itatio
n.
• Th
e co
ncep
ts o
f dew
poi
nt,
cond
ensa
tion
leve
l, hu
mid
ity,
rela
tive
hum
idity
– fa
ctor
s aff
ectin
g re
lativ
e hu
mid
ity.
• H
ow a
nd w
hy c
loud
s fo
rm.
• Cl
oud
nam
es a
nd a
ssoc
iate
d w
eath
er c
ondi
tions
.
• D
iffer
ent f
orm
s of
pre
cipi
tatio
n –
hail,
sno
w, r
ain,
dew
, fro
st.
• M
echa
nism
s th
at p
rodu
ce
diffe
rent
kin
ds o
f rai
nfal
l – re
lief,
conv
ectio
nal,
fron
tal.
Lear
ner’s
Boo
k pp
. 40–
53; T
each
er’s
Gui
de p
p. 3
6–43
; atla
ses;
ther
mom
eter
s;
clot
h; c
otto
n/co
rd/s
trin
g; w
ater
; tin
ca
ns; i
ce
16–
74
Read
ing
and
inte
rpre
ting
syno
ptic
wea
ther
map
s6
Read
ing
and
inte
rpre
ting
syno
ptic
w
eath
er m
aps
• W
eath
er e
lem
ents
– te
mpe
ratu
re,
dew
-poi
nt te
mpe
ratu
re, c
loud
co
ver,
win
d di
rect
ion,
win
d sp
eed,
at
mos
pher
ic p
ress
ure.
(N
ote:
the
conc
ept o
f atm
osph
eric
pr
essu
re is
onl
y in
trod
uced
her
e; it
is
dev
elop
ed m
ore
fully
in G
rade
11)
• W
eath
er c
ondi
tions
– e
.g. r
ain,
dr
izzl
e, th
unde
rsto
rms,
hail,
sno
w
as il
lust
rate
d on
sta
tion
mod
els.
• Re
adin
g an
d in
terp
retin
g a
sele
ctio
n of
syn
optic
wea
ther
map
s.
Lear
ner’s
Boo
k pp
. 54–
64; T
each
er’s
Gui
de p
p. 4
3–49
17
Revi
ew: T
erm
1
Activ
ities
1–4
1A
sses
smen
t and
con
solid
atio
nLe
arne
r’s B
ook
pp. 8
1–82
; Tea
cher
’s G
uide
pp.
62–
63
18
Cont
rol t
est 1
The
atm
osph
ere
1A
sses
smen
t and
con
solid
atio
nTe
ache
r’s G
uide
pp.
201
; 206
–209

8 S E C T I O N 1 • I N T R O D U C T I O N
Term
Wee
k/s
Mod
ule
Uni
t no
.U
nit t
itle
No.
of h
ours
Geo
grap
hy C
APS
con
tent
Reso
urce
s
18
Mod
ule
2Th
e at
mos
pher
e: G
eogr
aphi
cal
skill
s an
d te
chni
ques
1G
eogr
aphi
cal I
nfor
mat
ion
Syst
ems
(GIS
)1
Geo
grap
hica
l Inf
orm
atio
n Sy
stem
s•
Reas
ons
for t
he d
evel
opm
ent
of G
IS.
• H
ow re
mot
e se
nsin
g w
orks
.
• Sa
telli
te im
ages
rela
ted
to
met
eoro
logy
and
clim
atol
ogy.
Lear
ner’s
Boo
k pp
. 65–
69; T
each
er’s
Gui
de p
p. 5
0–53
; atla
ses
18–
92
Fiel
dwor
k an
d pr
actic
al w
ork
4Fi
eldw
ork
and
prac
tical
wor
k •
Usi
ng m
aps
and
othe
r gra
phic
al
repr
esen
tatio
ns –
atla
ses,
syno
ptic
w
eath
er m
aps,
tem
pera
ture
gra
phs.
• Co
llect
ing
and
reco
rdin
g da
ta u
sing
a
varie
ty o
f tec
hniq
ues
– us
ing
wea
ther
inst
rum
ents
, col
lect
ing
wea
ther
info
rmat
ion
from
the
med
ia.
• Pr
oces
sing
, col
latin
g an
d pr
esen
ting
field
wor
k fin
ding
s –
line
grap
hs, b
ar g
raph
s, m
aps,
diag
ram
s, sy
nopt
ic w
eath
er m
aps.
Lear
ner’s
Boo
k pp
. 70–
75; T
each
er’s
Gui
de p
p. 5
3–58
; atla
ses;
dai
ly lo
cal
new
spap
er/s
19
3U
sing
atla
ses
1U
sing
atla
ses
• M
ap re
adin
g –
com
parin
g in
form
atio
n fr
om d
iffer
ent m
aps.
• A
tlas
inde
x –
loca
ting
phys
ical
and
co
nstr
ucte
d fe
atur
es.
Lear
ner’s
Boo
k pp
. 76–
78; T
each
er’s
Gui
de p
p. 5
8–59
; atla
ses
19
Revi
ew: T
erm
1
Activ
ity 5
1A
sses
smen
t and
con
solid
atio
nLe
arne
r’s B
ook
p. 8
3; Te
ache
r’s G
uide
p.
63
110
Ass
essm
ent T
ask
1: E
ssay
The
atm
osph
ere
1 hr
(com
plet
e as
hom
ewor
k)A
sses
smen
t and
con
solid
atio
nTh
e at
mos
pher
e: E
ssay
Teac
her’s
Gui
de p
p. 2
10–2
12
110
Revi
sion
3A
sses
smen
t and
con
solid
atio
n

9S E C T I O N 1 • I N T R O D U C T I O N
Term
Wee
k/s
Mod
ule
Uni
t no
.U
nit t
itle
No.
of h
ours
Geo
grap
hy C
APS
con
tent
Reso
urce
s
21–
2M
odul
e 3
Geo
mor
phol
ogy:
Geo
grap
hica
l kn
owle
dge
1Th
e st
ruct
ure
of th
e Ea
rth
6Th
e st
ruct
ure
of th
e Ea
rth
• Th
e in
tern
al s
truc
ture
of t
he E
arth
.
• Cl
assi
ficat
ion
of ro
cks
– ig
neou
s, se
dim
enta
ry, m
etam
orph
ic.
• Th
e ro
ck c
ycle
.
• In
trus
ive
igne
ous
activ
ity a
nd
asso
ciat
ed fe
atur
es –
bat
holit
hs,
lacc
olith
s, m
onol
iths,
dyke
s, si
lls,
pipe
s.
• O
verv
iew
of l
andf
orm
s as
soci
a ted
w
ith ig
neou
s, se
dim
enta
ry,
met
amor
phic
rock
s.
Lear
ner’s
Boo
k pp
. 86–
102;
Teac
her’s
G
uide
pp.
64–
72; h
ard-
boile
d eg
gs;
shar
p kn
ives
; res
ourc
e bo
oks
on ro
cks;
vi
nega
r
22–
32
Plat
e te
cton
ics
6Pl
ate
tect
onic
s •
Chan
ges
in th
e po
sitio
n of
co
ntin
ents
ove
r tim
e.
• Ev
iden
ce fo
r the
mov
emen
t of
cont
inen
ts o
ver t
ime.
• Pl
ate
tect
onic
s –
an e
xpla
natio
n fo
r th
e m
ovem
ent o
f con
tinen
ts.
• Th
e m
echa
nics
of p
late
mov
emen
ts.
• Pr
oces
ses
and
land
form
s as
soci
ated
w
ith d
iffer
ent k
inds
of p
late
bo
unda
ries.
• Th
e w
orld
’s v o
lcan
ic a
nd
eart
hqua
ke z
ones
.
Lear
ner’s
Boo
k pp
. 103
–113
; Tea
cher
’s G
uide
pp.
73–
78; h
ard-
boile
d eg
gs
24
3Fo
ldin
g an
d fa
ultin
g4
Fold
ing
and
faul
ting
• Th
e pr
oces
s of
rock
fold
ing
– lin
k t o
pl
ate
mov
emen
t.
• La
ndfo
rms
asso
ciat
ed w
ith fo
ldin
g.
• Th
e pr
oces
s of
faul
ting
– lin
k to
pl
ate
mov
emen
t.
• D
iffer
ent t
ypes
of f
aults
.
• La
ndfo
rms
asso
ciat
ed w
ith
faul
ting,
e.g
. rift
val
leys
and
blo
ck
mou
ntai
ns.
Lear
ner’s
Boo
k pp
. 114
–121
; Tea
cher
’s G
uide
pp.
79–
83

10 S E C T I O N 1 • I N T R O D U C T I O N
Term
Wee
k/s
Mod
ule
Uni
t no
.U
nit t
itle
No.
of h
ours
Geo
grap
hy C
APS
con
tent
Reso
urce
s
25
4Ea
rthq
uake
s4
Eart
hqua
kes
•
How
and
whe
re e
arth
quak
es o
ccur
.
• Th
e re
latio
nshi
p be
twee
n ea
rthq
uake
s an
d te
cton
ic fo
rces
.
• M
easu
ring
and
pred
ictin
g ea
rthq
uake
s.
• H
ow e
arth
quak
es a
nd ts
unam
is
affec
t peo
ple
and
sett
lem
ents
–
diffe
renc
es in
vul
nera
bilit
y.
• St
rate
gies
to re
duce
the
impa
ct o
f ea
rthq
uake
s.
• Ca
se e
xam
ples
of t
he e
ffect
s of
se
lect
ed e
arth
quak
es.
Lear
ner’s
Boo
k pp
. 122
–131
; Tea
cher
’s G
uide
pp.
83–
88
26
5Vo
lcan
oes
4Vo
lcan
oes
•
Type
s of
vol
cano
es –
ext
rusi
ve,
intr
usiv
e, a
ctiv
e, d
orm
ant,
extin
ct.
• St
ruct
ure
of v
olca
noes
.
• Im
pact
of v
olca
noes
on
peop
le a
nd
the
envi
ronm
ent –
pos
itive
and
ne
gativ
e.
• Ca
se s
tudi
es o
f diff
eren
t vol
cani
c er
uptio
ns.
Lear
ner’s
Boo
k pp
. 132
–140
; Tea
cher
’s G
uide
pp.
89–
93; p
last
icin
e/pl
ay d
ough
/pa
pier
mâc
hé; p
aint
27
Fiel
dwor
k 1
Extr
a-cu
rric
ular
ou
ting
(app
rox.
2½
hrs
)
Six
hour
s of
ext
ra-m
ural
fiel
dwor
k is
re
com
men
ded
in G
rade
10.
Lear
ner’s
Boo
k pp
. 141
; Tea
cher
’s G
uide
p.
94;
pap
er; p
enci
ls; c
amer
as/
cellp
hone
s; re
sour
ce b
ooks
on
rock
s
27
Mod
ule
4G
eom
orph
olog
y: G
eogr
aphi
cal
skill
s an
d te
chni
ques
1M
apw
ork
skill
s2
Map
wor
k sk
ills
• Lo
catin
g ex
act p
ositi
on –
deg
rees
, m
inut
es a
nd s
econ
ds.
• Sc
ale
– w
ord,
ratio
, fra
ctio
n an
d lin
e sc
ale.
Lear
ner’s
Boo
k pp
. 145
–149
; Tea
cher
’s G
uide
pp.
97–
100;
atla
ses;
wal
l map
s w
ith d
iffer
ent s
cale
s (o
ptio
nal)

11S E C T I O N 1 • I N T R O D U C T I O N
Term
Wee
k/s
Mod
ule
Uni
t no
.U
nit t
itle
No.
of h
ours
Geo
grap
hy C
APS
con
tent
Reso
urce
s
27–
82
Topo
grap
hic
map
s4
Topo
grap
hic
map
s •
Sout
h A
fric
an 1
:50
000
map
re
fere
ncin
g sy
stem
.
• 1:
50
000
map
s –
conv
entio
nal s
igns
an
d sy
mbo
ls.
• N
avig
atin
g po
sitio
n us
ing
com
pass
di
rect
ions
(16
poin
ts).
• D
irect
ion
– tr
ue a
nd m
agne
tic
bear
ing.
• La
ndfo
rms
and
cont
ours
.
• Si
mpl
e cr
oss-
sect
ions
.
Lear
ner’s
Boo
k pp
. 150
–163
; Tea
cher
’s G
uide
pp.
100
–106
; atla
ses;
pro
trac
tors
; ru
lers
; gra
ph o
r qua
d pa
per;
topo
grap
hic
map
s (o
ptio
nal)
28
3Ae
rial p
hoto
grap
hs a
nd
orth
opho
to m
aps
2A
eria
l pho
togr
aphs
and
ort
hoph
oto
map
s•
Phot
ogra
phs
of la
ndsc
apes
.
• O
bliq
ue a
nd v
ertic
al a
eria
l pho
tos.
• O
rtho
phot
o m
aps
to b
e us
ed in
co
njun
ctio
n w
ith 1
:50
000
map
s an
d ae
rial p
hoto
s.
Lear
ner’s
Boo
k pp
. 164
–170
; Tea
cher
’s G
uide
pp.
106
–108
; dra
win
g of
an
aero
plan
e; m
atch
box
/sm
all b
ox
29
4U
sing
atla
ses
9U
sing
atla
ses
• A
tlas
inde
x –
loca
ting
phys
ical
and
co
nstr
ucte
d fe
atur
es.
• Fo
ur-d
igit
grid
refe
renc
e (la
titud
e an
d lo
ngitu
de, d
egre
es a
nd
min
utes
) to
iden
tify
and
loca
te
feat
ures
on
map
s.
• Co
ncep
t of m
ap p
roje
ctio
ns:
exam
ples
of e
qual
are
a an
d tr
ue
dire
ctio
n pr
ojec
tions
– c
ritic
al
eval
uatio
n.
Lear
ner’s
Boo
k pp
. 171
–175
; Tea
cher
’s G
uide
pp.
109
–112
; atla
ses;
tenn
is/
socc
er b
alls
(opt
iona
l); p
aper
(opt
iona
l);
glob
e (o
ptio
nal)
27
Ass
essm
ent T
ask
2: M
apw
ork
Map
wor
kH
omew
ork
Ass
essm
ent a
nd c
onso
lidat
ion
Geo
mor
phol
ogy:
Map
wor
kTe
ache
r’s G
uide
pp.
212
–216
29
Revi
ew: T
erm
2
Activ
ities
1–6
1 hr
(com
plet
e as
hom
ewor
k)A
sses
smen
t and
con
solid
atio
nLe
arne
r’s B
ook
pp. 1
76–1
82; T
each
er’s
Gui
de p
p. 1
12–1
14
29–
10M
id-y
ear e
xam
inat
ions
Ass
essm
ent a
nd c
onso
lidat
ion
Teac
her’s
Gui
de p
p. 2
02–2
03; 2
21–2
34
12 S E C T I O N 1 • I N T R O D U C T I O N
Term
Wee
k/s
Mod
ule
Uni
t no
.U
nit t
itle
No.
of h
ours
Geo
grap
hy C
APS
con
tent
Reso
urce
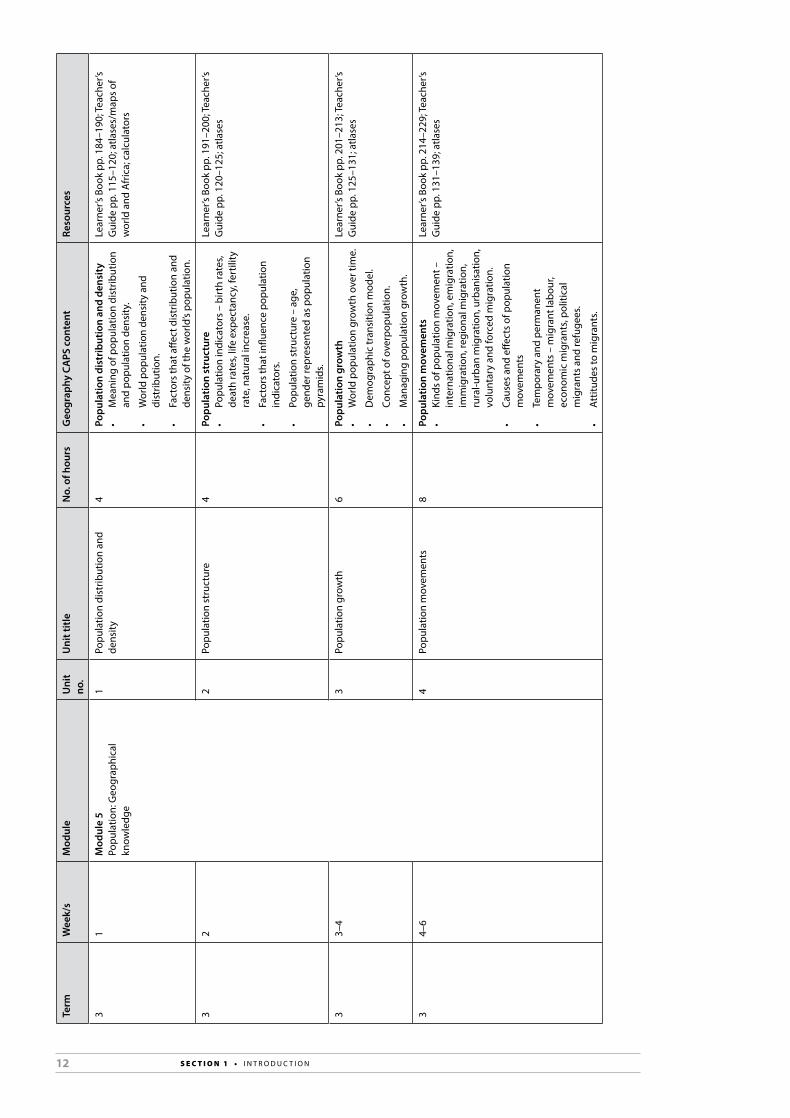
s
31
Mod
ule
5Po
pula
tion:
Geo
grap
hica
l kn
owle
dge
1Po
pula
tion
dist
ribut
ion
and
dens
ity4
Popu
latio
n di
stri
butio
n an
d de
nsit
y •
Mea
ning
of p
opul
atio
n di
strib
utio
n an
d po
pula
tion
dens
ity.
• W
orld
pop
ulat
ion
dens
ity a
nd
dist
ribut
ion.
• Fa
ctor
s th
at a
ffect
dis
trib
utio
n an
d de
nsity
of t
he w
orld
’s po
pula
tion.
Lear
ner’s
Boo
k pp
. 184
–190
; Tea
cher
’s G
uide
pp.
115
–120
; atla
ses/
map
s of
w
orld
and
Afr
ica;
cal
cula
tors
32
2Po
pula
tion
stru
ctur
e4
Popu
latio
n st
ruct
ure
• Po
pula
tion
indi
cato
rs –
birt
h ra
tes,
deat
h ra
tes,
life
expe
ctan
cy, f
ertil
ity
rate
, nat
ural
incr
ease
.
• Fa
ctor
s th
at in
fluen
ce p
opul
atio
n in
dica
tors
.
• Po
pula
tion
stru
ctur
e –
age,
ge
nder
repr
esen
ted
as p
opul
atio
n py
ram
ids.
Lear
ner’s
Boo
k pp
. 191
–200
; Tea
cher
’s G
uide
pp.
120
–125
; atla
ses
33–
43
Popu
latio
n gr
owth
6Po
pula
tion
grow
th
• W
orld
pop
ulat
ion
grow
th o
ver t
ime.
• D
emog
raph
ic tr
ansi
tion
mod
el.
• Co
ncep
t of o
verp
opul
atio
n.
• M
anag
ing
popu
latio
n gr
owth
.
Lear
ner’s
Boo
k pp
. 201
–213
; Tea
cher
’s G
uide
pp.
125
–131
; atla
ses
34–
64
Popu
latio
n m
ovem
ents
8Po
pula
tion
mov
emen
ts
• Ki
nds
of p
opul
atio
n m
ovem
ent –
in
tern
atio
nal m
igra
tion,
em
igra
tion,
im
mig
ratio
n, re
gion
al m
igra
tion,
ru
ral-u
rban
mig
ratio
n, u
rban
isat
ion,
vo
lunt
ary
and
forc
ed m
igra
tion.
• Ca
uses
and
effe
cts
of p
opul
atio
n m
ovem
ents
• Te
mpo
rary
and
per
man
ent
mov
emen
ts –
mig
rant
labo
ur,
econ
omic
mig
rant
s, po
litic
al
mig
rant
s an
d re
fuge
es.
• A
ttitu
des
to m
igra
nts.
Lear
ner’s
Boo
k pp
. 214
–229
; Tea
cher
’s G
uide
pp.
131
–139
; atla
ses
13S E C T I O N 1 • I N T R O D U C T I O N
Term
Wee
k/s
Mod
ule
Uni
t no
.U
nit t
itle
No.
of h
ours
Geo
grap
hy C
APS
con
tent
Reso
urce
s
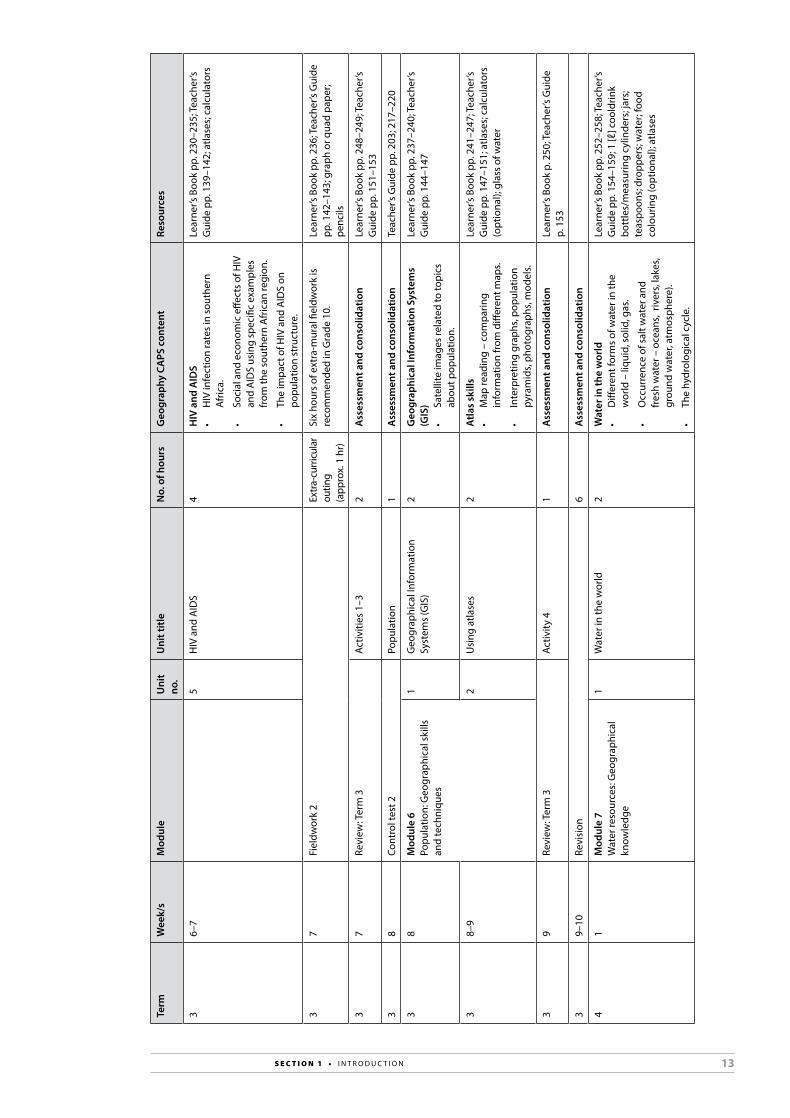
36–
75
HIV
and
AID
S4
HIV
and
AID
S
• H
IV in
fect
ion
rate
s in
sou
ther
n A
fric
a.
• So
cial
and
eco
nom
ic e
ffect
s of
HIV
an
d A
IDS
usin
g sp
ecifi
c ex
ampl
es
from
the
sout
hern
Afr
ican
regi
on.
• Th
e im
pact
of H
IV a
nd A
IDS
on
popu
latio
n st
ruct
ure.
Lear
ner’s
Boo
k pp
. 230
–235
; Tea
cher
’s G
uide
pp.
139
–142
; atla
ses;
cal
cula
tors
37
Fiel
dwor
k 2
Extr
a-cu
rric
ular
ou
ting
(app
rox.
1 h
r)
Six
hour
s of
ext
ra-m
ural
fiel
dwor
k is
re
com
men
ded
in G
rade
10.
Lear
ner’s
Boo
k pp
. 236
; Tea
cher
’s G
uide
pp
. 142
–143
; gra
ph o
r qua
d pa
per;
penc
ils
37
Revi
ew: T
erm
3Ac
tiviti
es 1
–32
Ass
essm
ent a
nd c
onso
lidat
ion
Lear
ner’s
Boo
k pp
. 248
–249
; Tea
cher
’s G
uide
pp.
151
–153
38
Cont
rol t
est 2
Popu
latio
n1
Ass
essm
ent a
nd c
onso
lidat
ion
Teac
her’s
Gui
de p
p. 2
03; 2
17–2
20
38
Mod
ule
6Po
pula
tion:
Geo
grap
hica
l ski
lls
and
tech
niqu
es
1G
eogr
aphi
cal I
nfor
mat
ion
Syst
ems
(GIS
)2
Geo
grap
hica
l Inf
orm
atio
n Sy
stem
s (G
IS)
• Sa
telli
te im
ages
rela
ted
to to
pics
ab
out p
opul
atio
n.
Lear
ner’s
Boo
k pp
. 237
–240
; Tea
cher
’s G
uide
pp.
144
–147
38–
92
Usi
ng a
tlase
s2
Atla
s sk
ills
• M
ap re
adin
g –
com
parin
g in
form
atio
n fr
om d
iffer
ent m
aps.
• In
terp
retin
g gr
aphs
, pop
ulat
ion
pyra
mid
s, ph
otog
raph
s, m
odel
s.
Lear
ner’s
Boo
k pp
. 241
–247
; Tea
cher
’s G
uide
pp.
147
–151
; atla
ses;
cal
cula
tors
(o
ptio
nal);
gla
ss o
f wat
er
39
Revi
ew: T
erm
3Ac
tivity
41
Ass
essm
ent a
nd c
onso
lidat
ion
Lear
ner’s
Boo
k p.
250
; Tea
cher
’s G
uide
p.
153
39–
10Re
visi
on6
Ass
essm
ent a
nd c
onso
lidat
ion
41
Mod
ule
7W
ater
reso
urce
s: G
eogr
aphi
cal
know
ledg
e
1W
ater
in th
e w
orld
2W
ater
in th
e w
orld
• D
iffer
ent f
orm
s of
wat
er in
the
wor
ld –
liqu
id, s
olid
, gas
.
• O
ccur
renc
e of
sal
t wat
er a
nd
fres
h w
ater
– o
cean
s, ri
vers
, lak
es,
grou
nd w
ater
, atm
osph
ere)
.
• Th
e hy
drol
ogic
al c
ycle
.
Lear
ner’s
Boo
k pp
. 252
–258
; Tea
cher
’s G
uide
pp.
154
–159
; 1 [ℓ
] coo
ldrin
k bo
ttle
s/m
easu
ring
cylin
ders
; jar
s;
teas
poon
s; d
ropp
ers;
wat
er; f
ood
colo
urin
g (o
ptio
nal);
atla
ses

14 S E C T I O N 1 • I N T R O D U C T I O N
Term
Wee
k/s
Mod
ule
Uni
t no
.U
nit t
itle
No.
of h
ours
Geo
grap
hy C
APS
con
tent
Reso
urce
s
41–
22
The
wor
ld’s
ocea
ns4
The
wor
ld’s
ocea
ns
• O
cean
s as
sou
rces
of o
xyge
n, fo
od,
ener
gy.
• O
cean
circ
ulat
ion
– w
arm
and
col
d cu
rren
ts.
• O
cean
cur
rent
s an
d th
eir
impo
rtan
ce fo
r fish
ing,
trad
e an
d to
uris
m.
• Re
latio
nshi
p be
twee
n oc
eans
and
pe
ople
– p
ollu
tion,
ove
r-fis
hing
, de
salin
atio
n.
• St
rate
gies
for m
anag
ing
the
wor
ld’s
ocea
ns.
Lear
ner’s
Boo
k pp
. 259
–274
; Tea
cher
’s G
uide
pp.
159
–165
; atla
ses
42–
33
Wat
er m
anag
emen
t in
So
uth
Afr
ica
5W
ater
man
agem
ent i
n So
uth
Afr
ica
• Ri
vers
, lak
es a
nd d
ams
in S
outh
A
fric
a.
• Fa
ctor
s in
fluen
cing
the
avai
labi
lity
of w
ater
in S
outh
Afr
ica.
• Ch
alle
nges
of p
rovi
ding
free
ba
sic
wat
er to
rura
l and
urb
an
com
mun
ities
in S
outh
Afr
ica.
• Ro
le o
f gov
ernm
ent –
initi
ativ
es
tow
ards
sec
urin
g w
ater
–in
terb
asin
tr
ansf
ers;
bui
ldin
g da
ms.
• Ro
le o
f mun
icip
aliti
es –
pro
visi
on,
wat
er p
urifi
catio
n.
• St
rate
gies
tow
ards
sus
tain
able
use
of
wat
er –
role
of g
over
nmen
t and
in
divi
dual
s.
Lear
ner’s
Boo
k pp
. 275
–284
; Tea
cher
’s G
uide
pp.
166
–171
15S E C T I O N 1 • I N T R O D U C T I O N
Term
Wee
k/s
Mod
ule
Uni
t no
.U
nit t
itle
No.
of h
ours
Geo
grap
hy C
APS
con
tent
Reso
urce
s
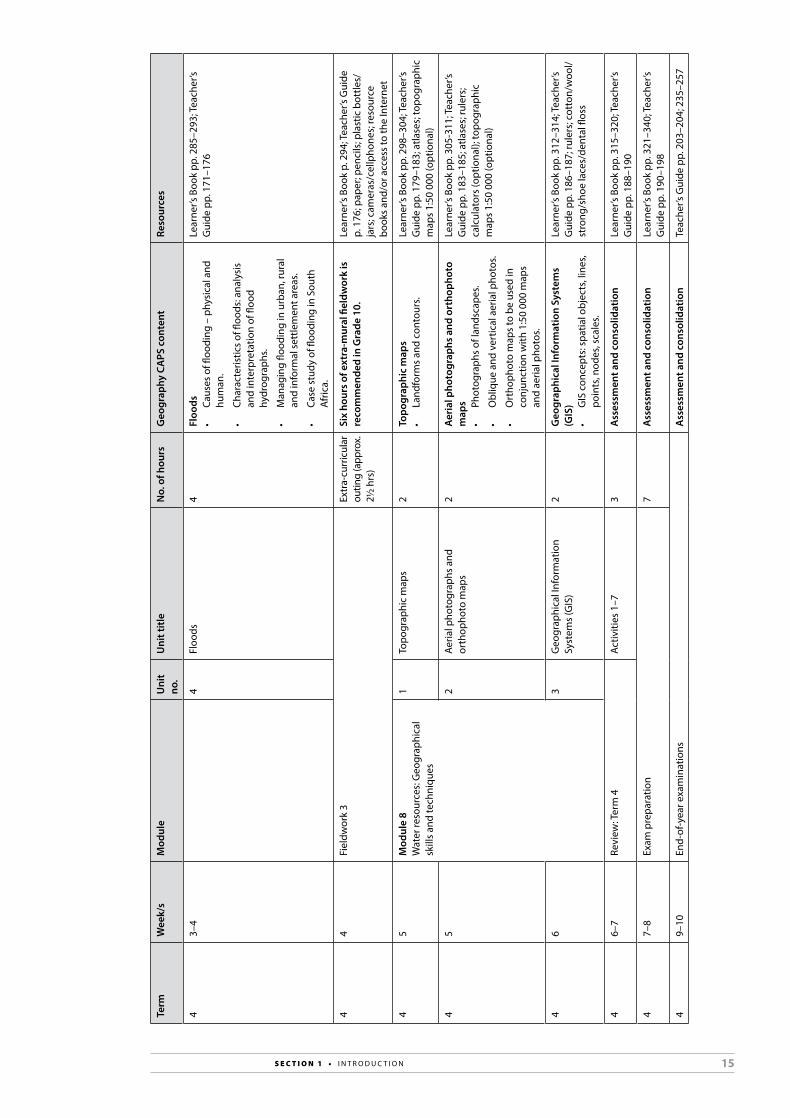
43–
44
Floo
ds4
Floo
ds•
Caus
es o
f floo
ding
– p
hysi
cal a
nd
hum
an.
• Ch
arac
teris
tics
of fl
oods
: ana
lysi
s an
d in
terp
reta
tion
of fl
ood
hydr
ogra
phs.
• M
anag
ing
flood
ing
in u
rban
, rur
al
and
info
rmal
set
tlem
ent a
reas
.
• Ca
se s
tudy
of fl
oodi
ng in
Sou
th
Afr
ica.
Lear
ner’s
Boo
k pp
. 285
–293
; Tea
cher
’s G
uide
pp.
171
–176
44
Fiel
dwor
k 3
Extr
a-cu
rric
ular
ou
ting
(app
rox.
2½
hrs
)
Six
hour
s of
ext
ra-m
ural
fiel
dwor
k is
re
com
men
ded
in G
rade
10.
Lear
ner’s
Boo
k p.
294
; Tea
cher
’s G
uide
p.
176
; pap
er; p
enci
ls; p
last
ic b
ottle
s/ja
rs; c
amer
as/c
ellp
hone
s; re
sour
ce
book
s an
d/or
acc
ess
to th
e In
tern
et
45
Mod
ule
8W
ater
reso
urce
s: G
eogr
aphi
cal
skill
s an
d te
chni
ques
1To
pogr
aphi
c m
aps
2To
pogr
aphi
c m
aps
• La
ndfo
rms
and
cont
ours
.Le
arne
r’s B
ook
pp. 2
98–3
04; T
each
er’s
Gui
de p
p. 1
79–1
83; a
tlase
s; to
pogr
aphi
c m
aps
1:50
000
(opt
iona
l)
45
2Ae
rial p
hoto
grap
hs a
nd
orth
opho
to m
aps
2A
eria
l pho
togr
aphs
and
ort
hoph
oto
map
s•
Phot
ogra
phs
of la
ndsc
apes
.
• O
bliq
ue a
nd v
ertic
al a
eria
l pho
tos.
• O
rtho
phot
o m
aps
to b
e us
ed in
co
njun
ctio
n w
ith 1
:50
000
map
s an
d ae
rial p
hoto
s.
Lear
ner’s
Boo
k pp
. 305
-311
; Tea
cher
’s G
uide
pp.
183
–185
; atla
ses;
rule
rs;
calc
ulat
ors
(opt
iona
l); to
pogr
aphi
c m
aps
1:50
000
(opt
iona
l)
46
3G
eogr
aphi
cal I
nfor
mat
ion
Syst
ems
(GIS
)2
Geo
grap
hica
l Inf
orm
atio
n Sy
stem
s (G
IS)
• G
IS c
once
pts:
spa
tial o
bjec
ts, l
ines
, po
ints
, nod
es, s
cale
s.
Lear
ner’s
Boo
k pp
. 312
–314
; Tea
cher
’s G
uide
pp.
186
–187
; rul
ers;
cot
ton/
woo
l/st
rong
/sho
e la
ces/
dent
al fl
oss
46–
7Re
view
: Ter
m 4
Activ
ities
1–7
3A
sses
smen
t and
con
solid
atio
nLe
arne
r’s B
ook
pp. 3
15–3
20; T
each
er’s
Gui
de p
p. 1
88–1
90
47–
8Ex
am p
repa
ratio
n7
Ass
essm
ent a
nd c
onso
lidat
ion
Lear
ner’s
Boo
k pp
. 321
–340
; Tea
cher
’s G
uide
pp.
190
–198
49–
10En
d-of
-yea
r exa
min
atio
nsA
sses
smen
t and
con
solid
atio
nTe
ache
r’s G
uide
pp.
203
–204
; 235
–257

16 S E C T I O N 1 • I N T R O D U C T I O N

2. LESSON-BY-LESSON
17
This section contains teaching notes for the modules in the Learner’s Book and answers to all the activities. It also provides informal assessment suggestions and suggested consolidation and extension activities.
General 18
Module 1 18
Module 2 50
Extension 1 60
Review: Term 1 62
Module 3 64
Fieldwork 1 94
Extension 2 95
Module 4 97
Review: Term 2 112
Module 5 115
Fieldwork 2 142
Module 6 144
Review: Term 3 151
Module 7 154
Fieldwork 3 176
Extension 3 176
Module 8 179
Review: Term 4 188
Examination preparation 190

18 S E C T I O N 2 • L E S S O N - B Y - L E S S O N
General• Many of the activities are bite-sized, quick and easy to do. Because of this
you can often work through as many as two or three activities in a lesson.• The information boxes (those with a magnifying glass), case studies and
other information in boxes in the Learner’s Book provide additional information, examples or applications for some teaching points in the main body text.
• Use a variety of approaches for reading these boxes – for example, read the box to the class, ask a learner to read the box to the class, or ask learners to read the box on their own (use this approach for short, easy-to-read boxes).
• In most cases, these boxes are there for teaching and learning purposes (they are always linked to activities), but not for revision purposes. Point out to your learners that when they use the book for revision, they need only focus on the main body text.
• In this Teacher’s Guide, the instruction, ‘Instruct the learners to work on Activity x’, includes going through the answers with the class once they have completed the activity, unless the activity is set for, or finished off, as homework. In this case, remember to go through the answers to the activity at the start of the next lesson.
THE ATMOSPHERE:
GEOGRAPHICAL KNOWLEDGE
Term 1Learner’s Book pages 9–64Duration: 29 hours
MODULE 1
This module on the atmosphere covers important concepts that relate to the weather and environmental issues, such as ozone depletion and global warming. Learners often have a shaky or garbled concept of the greenhouse effect. Watch out for this so that you can correct any misconceptions.
Curriculum and Assessment Policy Statement (CAPS)
Composition and structure of the atmosphere • Importance of the atmosphere.• The composition and structure of the atmosphere – troposphere,
stratosphere, mesosphere, thermosphere.• The ozone layer – in the stratosphere.• Causes and effects of ozone depletion.• Ways to reduce ozone depletion.
Heating of the atmosphere • Processes associated with the heating of the atmosphere – insolation,
reflection, scattering, absorption, radiation, conduction, convection.• The greenhouse effect – impact on people and the environment.• Factors that affect the temperature of different places around the
world – latitude, altitude, ocean currents, distance from oceans.• Global warming – evidence, causes, and consequences with reference
to Africa.• The impact of climate and climate change on Africa’s environment
and people – deserts, droughts, floods, rising sea levels.

19M O D U L E 1 • T H E AT M O S P H E R E : G E O G R A P H I C A L K N O W L E D G E
Moisture in the atmosphere• Water in the atmosphere in different forms – water vapour and liquid.• Processes associated with evaporation, condensation and
precipitation. • The concepts of dew point, condensation level, humidity, relative
humidity – factors affecting relative humidity.• How and why clouds form.• Cloud names and associated weather conditions.• Different forms of precipitation – hail, snow, rain, dew, frost.• Mechanisms that produce different kinds of rainfall – relief,
convectional, frontal.
Reading and interpreting synoptic weather maps• Weather elements – temperature, dew-point temperature, cloud
cover, wind direction, wind speed, atmospheric pressure. (Note: the concept of atmospheric pressure is only introduced here; it is developed more fully in Grade 11.)
• Weather conditions – e.g. rain, drizzle, thunderstorms, hail, snow as illustrated on station models.
• Reading and interpreting a selection of synoptic weather maps.
Key geographical skills • Using verbal, quantitative and symbolic data forms such as text, pictures,
graphs tables, diagrams and maps.• Practising field observation and mapping, interviewing people,
interpreting sources and working with statistics.• Applying communication, thinking, practical and social skills.• Practising the following specific skills:
– identifying questions and issues– collecting and structuring information – processing, interpreting, and evaluating data – making decisions and judgements– deciding on a point of view– suggesting solutions to problems– working co-operatively and independently.
Key words/conceptsatmosphere; air; atmospheric pressure; density; thermosphere; mesosphere; stratosphere; troposphere; ozone; ozone layer; chlorofluorocarbons (CFCs); hydrofluorocarbons (HCFs); solar radiation; insolation; reflection; absorption; scattering; radiation; evaporation; latent heat; convection; conduction; albedo; lapse rate; ocean current; moderating effect; greenhouse effect ; greenhouse gas; global warming; climate change; water cycle; condensation; precipitation; humidity; wet-and-dry bulb thermometer; relative humidity; saturated air; dew point; dew; frost; cloud; mist; fog; condensation level; condensation nuclei; stratus cloud; cumulus cloud; cirrus cloud; rain; hail; snow; front; relief rainfall/orthographic rainfall; rain shadow; convectional rainfall; frontal rainfall/cyclonic rainfall; weather forecast; synoptic weather map; station model; warm front; cold front; isobar

20 S E C T I O N 2 • L E S S O N - B Y - L E S S O N
UNIT 1 Composition and structure of the atmosphere
TERM 1, WEEKS 1–2
Learner’s Book pages 10–19Duration: 5 hours
Curriculum and Assessment Policy Statement (CAPS) contentComposition and structure of the atmosphere• Importance of the atmosphere.• The composition and structure of the atmosphere – troposphere,
stratosphere, mesosphere, thermosphere.• The ozone layer – in the stratosphere.• Causes and effects of ozone depletion.• Ways to reduce ozone depletion.
Resources• Learner’s Book pages 10–19• Websites (optional)
– Two useful sites for your learners are: www.learnersgeo.com/geography-for-learners/0042-composition-of-the-atmosphere.php and www.geography4kids.com/files/atm_intro.html
– A useful site for you or for advanced learners is: www.ucar.edu/learn– For a cartoon on ozone depletion: http://www.epa.gov/ozone/
science/missoz
Preparation• Read through the unit and familiarise yourself with the content that you
will need to teach. Think about what the learners may already know about the topics and any areas of difficulty that you think they might encounter.
• For Activity 1, learners will need compasses to draw circles and rulers. Remind them to bring their compasses and rulers to class for Lesson 1.
• For Lessons 3 and 4, try to collect some cartoons on ozone depletion to display in class. See the website above for one example. You can find many more by going to Google Images and typing in ‘cartoon, ozone hole’ or ‘cartoon, ozone depletion’. Select a few of the best ones.
Teaching the unit
Lesson 1
• Read through, or ask learners to read through, the Module 1 introductory paragraph on page 10. You can use it as the basis of an opening discussion to assess what learners already know. If necessary, write up and display the Key questions on the board for the duration of the module. Point out that the NASA photograph shows the layers of the atmosphere.
• Read through, or ask learners to read through, the Unit 1 introductory paragraph on page 11. Point out to that the Key questions for each unit form the headings in the units.
• Work through the sections, ‘Why is the atmosphere essential for life on Earth?’ (page 11) and ‘What is air made up of ?’ (page 12). Emphasise that except for argon (a noble gas), trace gases such as carbon dioxide, ozone

21M O D U L E 1 • T H E AT M O S P H E R E : G E O G R A P H I C A L K N O W L E D G E
and methane are present in the air in very small and variable (changing) amounts. The amount of water vapour in the air also varies from 1–5%.
Activity 1• Instruct learners to work on Activity 1.• Be available to help them with their scale drawings if necessary.
Activity 2• Instruct learners to work on Activity 2. • Remind them of prior Natural Sciences or Life Sciences knowledge.
For example, what do they know about the nitrogen cycle and the carbon cycle?
• If necessary, set this activity for homework.
Lesson 2
• If Activity 2 was completed for homework, quickly go through the answers with the class.
• Work through the sections, ‘How does the atmosphere change the higher above the Earth you go?’ (page 13) and ‘What are the layers of the atmosphere?’ (page 13).
• To help learners understand the concept of atmospheric pressure, describe how we live at the bottom of a ‘sea’ of air. Also ask them to think of the individual particles of air or molecules of gas as ping pong balls. The stronger the pull of gravity, the closer together the air particles or ping pong balls are. The weaker the pull of the gravity, the more space there is between the air particles or ping pong balls.
• For interest: The more water vapour there is in the air, the lower the air pressure. This is because, surprisingly, the mass of a water molecule is less than the average mass of the molecules that make up air.
• Use Figure 1.1.3 as you work through the layers of the atmosphere. It also serves as a good summary. The order of the layers in the text matches the order of the layers in Figure 1.1.3, from top to bottom. Point out the margin tip that explains where the names of the layers come from. Learners are more likely to remember the names if they understand the meaning of the names.
Activity 3• Instruct learners to work on Activity 3. This activity takes them step-by-
step through the temperature-altitude graph.
Lesson 3
• Read the features, ‘Climbing Mount Everest in thin air’ (page 15) and ‘The auroras: an atmospheric phenomenon’ (page 15). Use the features as a starting point for class discussion, for example:– Who knows anyone who has climbed Everest?– Who has seen the auroras on a documentary on TV?
Activity 4• Instruct learners to work on Activity 4 in pairs. This activity provides
good consolidation of the concept of atmospheric pressure.
Activity 5• If necessary, allow learners to complete this activity for homework. It
consolidates one of the layers of the atmosphere – the mesosphere.

22 S E C T I O N 2 • L E S S O N - B Y - L E S S O N
Lesson 4
• Go through the answers to Activities 4 and 5 with the class.• Work through the section, ‘Why is the ozone layer important?’ (pages
16–17). Read through the feature, ‘It’s not always fun in the Sun’ (page 16).
Activity 6• Instruct learners to work on Activity 6.• If necessary, allow learners to complete this activity for homework.
Lesson 5
• If Activity 6 was completed for homework, go through the answers with the class.
• Complete and consolidate the section on the ozone layer. • Read the case study, ‘Patching the hole in the ozone’ (page 17).
Activity 7• Instruct learners to work on Activity 7.• Use this activity to assess learners’ comprehension and ability to interpret
graphs (see the section, Informal assessment below).• If necessary, allow learners to complete this activity for homework.
Answers Activity 1
Earth
Drawn to scale1 cm = 2 000 km
13 000 km
limit of atmosphere700 km thick
the part of the atmosphere that contains most of the air100 km thick
This is half the size of the scale that your learners will use. In other words, their drawings should be double this size.

23M O D U L E 1 • T H E AT M O S P H E R E : G E O G R A P H I C A L K N O W L E D G E
Activity 2
Gas in air Proportion by percentage (%)
Importance
Nitrogen 78% Bacteria in the soil turn this gas into nitrates that plants can use for growth.
Oxygen 20% Plants and animals use this gas for respiration. Plants produce this gas as a waste product of photosynthesis.
Carbon dioxide 0,03% Plants use this gas for photosynthesis.
Water vapour variable, 1–5% This gas is the source of rain.
Activity 31. colder, decrease2. colder3. hotter, increase4. hotter5. a) temperatures decrease with height
b) temperatures increase with height
Activity 41. about 16 km 2. 8 850 m above sea level3. halfway4. the pull of gravity decreases the higher it gets/ with altitude5. the concentration of air molecules is lower, i.e. the molecules of air are
further apart6. i) 20%
ii) 20%7. 100 000 (i.e. 300 000 ÷ 3)8. dizziness, shortness of breath, tiredness, inability to think clearly, nausea
(any three; nausea is not mentioned in the extract)
Activity 51. shimmering lights that are sometimes seen in the night sky in the
polar circles2. thermosphere3. Charged particles from the Sun (the solar wind) are trapped by the
Earth’s magnetic field and collide with the air molecules, giving off light.4. the Earth’s magnetic field is strongest at the poles
Activity 61. a form of oxygen, made up of three atoms of oxygen2. stratosphere3. it absorbs or screens out most of the Sun’s harmful UV rays (UV-B)4. southern parts of South America and Australia, South Africa5. The thinning of the ozone layer/ size of the ozone hole increased
dramatically between September 1979 and October 1989. The satellite images for October 2006 and October 2010 show that the hole is still large, but it hasn’t grown any bigger.

24 S E C T I O N 2 • L E S S O N - B Y - L E S S O N
Activity 71. chlorine-containing chemicals/ chlorofluorocarbons (1) (used in aerosol
cans and refrigeration systems) that destroy ozone in the stratosphere (1)2. 1985 (or 1980s) (1)3. an international treaty or agreement introduced to protect the ozone
layer by stopping CFC production (1); 1987 (1); 1996 (1)4. a) 1989 (1)
b) no (1), but it dropped a lot/ significantly (1)c) about 8 times (2)
5. a) 1993 (1)b) CFCs are long-lasting (1)c) ozone levels are starting to go up again/ recover (1)
[14 marks]
Informal assessmentActivity 1• Check on learners as they draw their circles.• Draw an approximate version on the board so that learners can check
their work.
Activity 2• Go through the answers with the class, asking learners for the answers.
Activity 3• Go through the answers with the class, asking individual learners
to offer answers. Ask who had trouble following or interpreting the graph. Spend time with these learners in a group, taking them carefully through the graph.
Activity 4• Ask learners to swap books with a partner and check each other’s work as
you go through the answers with the class.
Activity 5• Ask learners to swap books with a partner and check each other’s work as
you go through the answers with the class.
Activity 6• Go through the answers with the class. Ask learners to offer answers.
Activity 7• Take in learners’ books and mark their work according to the mark
allocation given in the Answers section. Use this to informally assess learners’ comprehension skills and ability to interpret graphs. Provide them with feedback on how they are progressing.
Consolidation/extensionConsolidation: • Learners who struggled with Activity 7 will need help with
comprehension and/or interpreting the bar graph. If necessary, set them another bar graph exercise for extra practice. For example, ask them to plot the percentage of nitrogen, oxygen and trace gases on a bar graph, to show the composition of air.

25M O D U L E 1 • T H E AT M O S P H E R E : G E O G R A P H I C A L K N O W L E D G E
100%
80%
60%
40%
20%
0%
Nitrogen Oxygen Traces gases
Watervapour
A bar graph showing the composition of air
Extension: • Learners can get more information on ozone and ozone depletion from
the Ozone Hole Tour on the University of Cambridge website: www.atm.ch.cam.ac.uk/tour/index.html
UNIT 2 Heating of the atmosphere
TERM 1, WEEKS 2–4
Learner’s Book pages 20–39Duration: 8 hours
Curriculum and Assessment Policy Statement (CAPS) contentHeating of the atmosphere • Processes associated with the heating of the atmosphere – insolation,
reflection, scattering, absorption, radiation, conduction, convection. • The greenhouse effect – impact on people and the environment. • Factors that affect the temperature of different places around the world –
latitude, altitude, ocean currents, distance from oceans. • Global warming – evidence, causes, and consequences with reference
to Africa. • The impact of climate and climate change on Africa’s environment and
people – deserts, droughts, floods, rising sea levels.
Resources• Learner’s Book pages 20–39• Atlas• Activity 2: If you choose to set this up as a demonstration (see Figure
1.2.6), you will need a gas burner or electric hotplate and a pot of water. A pot with metal handles (i.e. non-insulated handles) is good for demonstrating heat conduction.
• Activity 9: Provide learners with tracing paper or wax paper, or ask them to bring their own.
• If you do the extension suggested in Lesson 4 as a demonstration activity, you will need two identical plastic lunchboxes and two weather thermometers or thermometers that range from 0 °C to 100 °C.

26 S E C T I O N 2 • L E S S O N - B Y - L E S S O N
• Websites (optional) • A useful general site for you or advanced learners: www.ucar.edu/learn• www.climatecrisis.net/the_evidence.php – this page gives a brief
explanation on global warming and shows photographic evidence. There is also a 12 Tips downloadable page. If learners go to the ‘Take action’ banner and click on the ‘Become carbon neutral’ page, they can calculate their household’s carbon emissions output, although the questionnaire is designed for Americans.
• For a description of some of the effects of climate change go to:– www.en.wikipedia.org/wiki/Effects_of_global_warming – this
gives a comprehensive overview– www.climate.nasa.gov/effects – if you scroll down, you will find
a list of impacts by region – for example, North America, Latin America, Europe, etc.
– www. soer.deat.gov.za/174.html – this Department of Environmental Affairs site describes the effects of climate change in South Africa.
– An inconvenient truth – Al Gore’s 2006 documentary film on global warming. Read more about the film on Wikipedia: www.en.wikipedia.org/wiki/An_Inconvenient_Truth
Preparation• Unit 2 is probably the most difficult unit in this module. Read through
the unit and familiarise yourself with the content that you will need to teach. Think about what learners may already know about the topics and any areas of difficulty that you think they might encounter.
• See the resources needed for Activity 2 and Activity 9 as well as for the extension activity for Lesson 4 listed above.
Teaching the unit
Lesson 1
• Read through, or ask learners to read through, the Unit 2 introductory paragraph on page 20. Ask learners what they know about the greenhouse effect and global warming. This will give you a chance to address any misconceptions they might have as you work through the unit.
• Work through the sections, ‘How is the atmosphere heated?’ (page 20) and ‘What happens to incoming sunlight?’ (page 21). The important messages here are:1) The Sun’s radiation consists of:
• short-wave visible light and UV light, and • long-wave infrared heat.
2) The gases in the atmosphere are transparent to the short-waves, which pass through the atmosphere, strike the Earth, warm up the Earth, and are radiated back into the atmosphere as long-wave infrared heat.
• Focus on Figure 1.2.3 (on page 21) for the section on ‘What happens to incoming sunlight?’ Point out to that the number of incoming and outgoing lines represents the proportion of radiation that’s reflected, absorbed and scattered. For example, there are 10 incoming lines and 3 of these are reflected (i.e. 3 out of 10 is 30%).
• Begin the section, ‘How does the Earth heat up the atmosphere?’ (page 22).
27M O D U L E 1 • T H E AT M O S P H E R E : G E O G R A P H I C A L K N O W L E D G E
Activity 1• Instruct learners to work on Activity 1.• If there is not enough time, learners can do or complete this activity
for homework.
Lesson 2
• If Activity 1 was completed for homework, go through the answers with the class.
• Continue the section, ‘How does the Earth heat up the atmosphere?’ (page 22).
• Activity 2 should help learners recognise how radiation, convection and conduction are methods of heat transfer. The heat transferred by these methods can be felt.
• For latent heat, emphasise that the word ‘latent’ means hidden and that this form of heat cannot be felt. The latent heat stored in water vapour does not make the air warmer.
Activity 2• Instruct learners to work on Activity 2.• The concepts of the heat transfer methods are difficult. The purpose of
this activity is to help learners relate these methods of heat transfer to something they know, or have observed.
• You could set this up as a class demonstration with a gas ring or hot plate and a pot of water.
Activity 3• Allow learners to complete Activity 3 for homework.• Prepare learners by asking them if they have ever noticed the difference
in early morning temperature on a clear day versus an overcast or cloudy day.
Lesson 3
• Go through the answers for Activity 3.• Begin the section, ‘Which factors affect the temperature of different
places?’ (page 24).• For ‘latitude’, focus on Figure 1.2.7 (page 24). • For ‘albedo’, ask learners for examples of:
– surfaces that reflect more heat than they absorb, for example white or shiny silver surfaces
– surfaces that absorb more heat than they reflect, for example dark-coloured or black surfaces.
• You can relate this to some everyday examples. For example:– Lorry tankers that carry milk or petrol are shiny silver to reflect the
heat. Shiny silver has high albedo (reflecting power).– Black cars have low albedo (reflecting power) and get a lot hotter than
white cars, because they absorb a lot of heat.• Suggest a simple experiment that learners could carry out for themselves
– see the Extension section on page 36 of this Teacher’s Guide.
Activity 4• Instruct learners to work on Activity 4.• Activity 4 looks at the effect of latitude on temperature, but also relates
to albedo (see Question 4).

28 S E C T I O N 2 • L E S S O N - B Y - L E S S O N
• Continue with the section, ‘Which factors affect the temperature of different places?’ For ‘Altitude’ (page 26), ask learners which method of heat transfer is mainly responsible for heating up the layer of air closest to the Earth. The answer is conduction.
Activity 5• Instruct learners to work on Activity 5.• Remind learners to refer to the Tip box to help them.
Activity 6• Allow the learners to complete Activity 6 for homework.• Prepare learners for this activity by pointing out what seems like a
mystery: Kilimanjaro is very close to the equator, but it is capped with snow. Snow at the equator? How is this possible?
Lesson 4
• Go through the answers for Activity 6 with the class.• Continue the section, ‘Which factors affect the temperature of different
places?’ (pages 27–28).– For ‘Ocean currents’, point out that in the same way that warm air
and cold air is mixed by convection, warm water and cold water is mixed by convection.
– For ‘Distance from the oceans’, suggest a simple experiment that learners could carry out for themselves, or do it as a demonstration – see the Extension section (page 36 in this guide).
Activity 7• Instruct learners to work on Activity 7. • Learners can do this activity in pairs. One learner looks up the latitude of
Port Nolloth while the other looks up the latitude of Durban.
Activity 8• In this activity, learners practice reading temperature graphs.• Allow learners to complete the activity for homework.
Lesson 5
• Go through the answers for Activity 8.• Work through the section, ‘What is the greenhouse effect and how do we
contribute to it?’ (page 29).• Emphasise that the greenhouse effect is a natural effect, but that the huge
increase in greenhouse gas emissions now means that the heat balance is being disturbed. Refer to Figure 1.2.13A.
• Point out that other greenhouse gases are: nitrous oxide, ozone, CFCs and HFCs.
• Begin the section, ‘What is global warming?’(page 30).• If necessary, you can spend a bit of discussion time on the dissenter’s
view of global warming. For example, some scientists acknowledge that global temperatures are rising, but dispute that this is caused by humans. Their view is that like the ice ages of the past, changes in global temperatures are a natural phenomenon and are unavoidable. Point out that although there is controversy around global warming, it is now accepted as the mainstream scientific view.
• Read the case study, ‘The Vostok ice core’ (page 32).

29M O D U L E 1 • T H E AT M O S P H E R E : G E O G R A P H I C A L K N O W L E D G E
Activity 9• Instruct learners to work on Activity 9. • This activity shows the link between greenhouse gas levels and
temperature.• Ideally, this activity should be done in class, rather than for homework
– it’s just more fun and sociable – but learners can finish it off for homework if necessary.
Lesson 6
• Continue the section ‘What is the greenhouse effect and how do we contribute to it?’ (page 29).– For ‘What are the consequences of global warming’, emphasise
that there is a feedback-effect in global warming that accelerates the effect, or makes it even worse. For example, as more snow and ice melt at the poles, the less heat the Polar Regions reflect, and the more quickly they heat up.
Activity 10• Instruct learners to work on Activity 10.• The answer for Question 2 relates to the moderating effect. If necessary,
tell learners that the answer is one of the factors that affect the temperature of different places. Ask them to remember them: latitude, albedo, altitude, ocean currents and distance from the oceans/ the moderating effect of the sea. They must then identify the factor that best explains why certain regions on the map are warming faster.
• Read the case study ‘The melting polar ice caps’ (page 34).
Activity 11• Instruct learners to work on Activity 11. If there is not enough time,
learners can complete this activity for homework.
Lesson 7
• If Activity 11 was completed for homework, go through the answers with the class.
• Work through the section, ‘How will global warming and climate change affect Africa?’ (page 35).– Point out that global warming disturbs the balance. As it gets
warmer, the evaporation of water increases, producing heavier rains in rainy places. On the other hand, arid or semi-arid regions are likely to become hotter and drier.
– For more information on the effects of climate change, see some of the suggested websites under the Resources section on page 26 in this guide.
• Read the feature, ‘The shrinking ice fields of Kilimanjaro’ (page 36).
Activity 12• Let learners complete Activity 12. In this activity, learners practise
comprehension, map reading and numeracy. • If you think learners might have difficulty with this activity, allow them
to work in pairs.
30 S E C T I O N 2 • L E S S O N - B Y - L E S S O N
Activity 13• Let learners complete Activity 13. If there is not enough time, learners
can complete this activity for homework.
Lesson 8
• If Activity 13 was completed for homework, go through the answers with the class.
• Work through the section, ‘What action must we take to stop global warming and climate change?’ (page 38).
• List on the board the climate change convention events that have involved the international community.
• Talk about our responsibility as individuals and how we can try to limit climate change. Lead into a discussion of the two topics set in Activity 14.
Activity 14 • See the suggested answers in the Answers section below to help you
guide the discussion.• Also note:
– A nice analogy for global warming is this: The crew on a huge, slow oil tanker spots a massive iceberg in the distance. Although they are half an hour’s travelling distance from the iceberg, the tanker can’t change its course in time to avoid crashing into it. Although the accident hasn’t happened yet, it will happen. The tanker is on an inevitable collision course. The same scenario might apply to global warming. The disaster hasn’t happened yet, but have we already reached a point of no return? Or can we mobilise and take corrective action fast enough?
– Here’s an interesting quote from Oliver Morton’s book, Photosynthesis: Eating the sun: ‘What to call this extraordinary state of affairs, in which we add almost a hundred watts of warming power to the planet for every watt we make deliberate use of ? It is most often discussed under the rubric of ‘global warming’, but this lacks both accuracy and a sense of danger. The change in climate brought about by our enhancement of the greenhouse effect is not going to be a monotonic warming, and its effects will differ markedly in different parts of the world (some bits, though very few, might be conceivably cool). Warming also sounds both gentle and broadly pleasant; what we are doing is unlikely, for most people, to be either. [James] Lovelock, deeply alarmed on the subject, prefers to speak of ‘global heating.’
– If you think this quote is too sophisticated for your learners, you could just suggest to them the part about global warming sounding mild and pleasant. And that rather, we should talk of global heating.
– And here’s a quote by the Russian astronaut Vladimir Shatalov: ‘Beyond [the atmosphere] there is only emptiness, coldness and darkness. The blue sky, which gives us breath and protects us from endless black and death, is but an infinitesimally thin film. How dangerous it is to threaten even the smallest part of this gossamer, this conserver of life.’
Activity 15• Allow the learners to complete this activity as homework.• Use the activity to assess learners’ ability to read and interpret data
in a table (see Informal assessment section).

31M O D U L E 1 • T H E AT M O S P H E R E : G E O G R A P H I C A L K N O W L E D G E
Answers Activity 11. incoming sunlight/ radiation2.
Insolation Terrestrial radiation
heats up the Earth’s surface heats up the atmosphere
consists of light (short-wave radiation) and infrared heat (long-wave radiation)
consists of infrared heat (long-wave radiation)
takes place during the day takes place during the day and at night
Activity 21. (1) radiation; (2) conduction; (3) convection; (4) convection2. (4)
Activity 31. a) higher minimum temperatures are linked to cloud cover
b) radiation
Activity 41. between the equator (0°) and 23 °N and S/ 23 °N to 23 °S2. the polar regions 66.5 °– 90 °N and S3. a lot is reflected by clouds4. Map of the Earth’ surface; the variable pattern of insolation is due to
differences in albedo – some surfaces reflect more insolation than others
Activity 5
Altitude (m) Temperature (°C)
1 400 30
2 000 26,1*
3 000 19,6
4 000 13,1
5 000 6,6
6 000 0,1
* Calculated like this:2 000 m −1 400 m = 600 m600 m ÷ 100 m = 6 30 °C − (6 × 0,65) °C = 30 °C – 3,9 °C = 26,1 °C
Then − 6.5 °C for every drop in 1 000 m, for example:26,1 °C – 6,5 °C = 19,6 °C19,6 °C – 6,5 °C = 13,1 °C, etc.

32 S E C T I O N 2 • L E S S O N - B Y - L E S S O N
Activity 6Learners can draw their outlines of the mountains on a scale of 1 cm = 2 000 km or 1 cm = 1 000 km. This is a scale of 1 cm = 2 000 km.
1.
4 478 m
8 848 m
5 875 m
MountKilimanjaro
MountEverest
Matterhorn
5 500 m 4 800 m
2 800 m
2. higher
Activity 71. Port Nolloth 29°15' S; Durban 29°53' S2. 6 °C3. The cold Benguela Current makes Port Nolloth colder than it would
otherwise be. The warm Mozambique Current makes Durban warmer than it would otherwise be.
Activity 81. Pietermaritzburg2. Pietermaritzburg3. a) about 12,5 °C;
b) about 18 °C; Note: accept one or two degrees on either side of these values
4. Pietermaritzburg5. Durban is a coastal town. The ocean moderates temperatures.
Pietermaritzburg is an inland town. There is no moderating effect.
Activity 91–3 Learners should see that all three graphs follow the same up and
down pattern.4. a) decreases/ drops/ falls
b) increases/ rises5. about 0,7 °C (from – 0,4 °C at 1900 to – 0,3 °C at 2000; it’s really about
0,5 °C, but it looks like 0,7 °C on the graph)
Activity 101. the northern hemisphere 2. It is because of the moderating effect of the sea. The northern
hemisphere has a bigger land mass. Land heats up faster than the sea.
Activity 111. The North Pole (the Arctic) is a frozen sea. The South Pole (the
Antarctic) is a frozen continent.

33M O D U L E 1 • T H E AT M O S P H E R E : G E O G R A P H I C A L K N O W L E D G E
2. a) autumn in the Arctic, late summer/early autumn in the Antarcticb) at the top left-hand side of the map; South Americac) at the bottom of the map; Australia
Activity 121. Tanzania2. Kilimanjaro is high enough for temperatures at the top to be low.3. 4 500 m4. a) 85%
b) 50% (the Fürtwangler glacier is centre left on the map)5. The inhabitants use the snowmelt for irrigation of crops.6. Job creation – tourists need accommodation, transport and guides.
Income – tourists buy food, supplies and curios.7. Example: No, the glaciers are shrinking so fast and are so sensitive to
global warming that it is unlikely they can be saved.
Activity 131. Example: If global temperatures have increased by 0,5 °C in 100 years,
then the maximum time would be 200 years, i.e. 2 200. But this is if the rate of global warming is constant/ not accelerating. It could easily increase by 2 °C this century.
2. 90%3. Coffee farmers will no longer be able to cultivate the easy-to-grow
robusta coffee as a cash crop. It means a loss of income because:• it will be hard to replace this crop with another type of coffee that
grows as easily• coffee is a crop that fetches good prices.
Activity 14Here are some example arguments on the two topics.Is it too late to stop global warming?
No, because:• Green technologies/ ways of generating electricity and powering cars are
being developed.• Humans are good at controlling their environment, thanks to scientific
knowledge and technology.• The ozone layer is recovering thanks to action taken. We could do the
same with global warming.
Yes, because:• The world is not yet committed to renewable forms of energy. Only
a small percentage of the world’s fuel and electrical energy/ power is generated by renewable technologies.
• Most people in developed countries are unwilling to sacrifice their high standard of living which includes unlimited transport and high energy use.
• Many people don’t care. They hope that the problem won’t affect them in their lifetime. They don’t care about future generations.
Who should be held responsible for global warming?• Governments and politicians – they are responsible for environmental
policies.

34 S E C T I O N 2 • L E S S O N - B Y - L E S S O N
• Our capitalist society. Capitalism is an economic system based on development and production. Capitalism is money-driven, not environment-driven.
• The oil companies and coal-powered electricity companies who have a vested interest in continuing with fossil fuels.
• Developed or industrialised countries. The output of carbon emissions per person in a developed country is far more than the output per person in a developing country.
• Everyone on the planet. We all use the Earth’s resources.– We contribute to carbon emissions directly by driving our cars or
burning fuel for fires.– We contribute to carbon emissions indirectly by using electricity
generated by burning coal or by eating meat or rice. The large-scale cattle farming and cultivation of rice in rice paddies produces significant amounts of methane – a potent greenhouse gas.
Activity 151. China (1) and the United States (1)2. 27,8% + 15,2% + 9,8% = 52,8% i.e. just more than half (3)3. China is actively growing its economy, has a huge manufacturing output
and a growing middle class. (3)4. Country Percentage of the
global totalPer capita emissions (tonnes per person)
1 Saudi Arabia 1,7% 18,6
2 United States 15,2% 16,1
3 Canada 1,6% 16,1
4 South Korea 2,1% 13,6
5 Russia 4,6% 12,1
6 Japan 3,4% 9,4
7 Germany 2,1% 9,2
8 Iran 1,9% 8,9
9 China 27,8% 8,0
10 India 7,3% 1,9
Give 1 mark each for South Korea at number 4, Russia at number 5, Japan at number 6, Germany at number 7, and China at number 9. (5)
5. Canada (1), South Korea (1)6. India (1)7. Australia ranks second (1) and South Africa ranks eighth (1)
[18 marks]
Informal assessmentActivity 1• Write up the completed table on the board.
Activity 2• Ask learners to swap books with a partner and check each other’s work as
you quickly go through the answers with the class.

35M O D U L E 1 • T H E AT M O S P H E R E : G E O G R A P H I C A L K N O W L E D G E
Activity 3• Quickly go through the answers with the class.
Activity 4• Go through the answers with the class. Ask learners to offer answers.
Activity 5• Write up the completed table on the board. For those learners who
struggled with the calculation, also write up the workings out on the board.
Activity 6• Draw the answer on the board according to scale. Or ask three learners
to each quickly draw one of the three mountains on the board according to scale.
Activity 7• Go through the answers with the class. Ask learners to offer answers.
Activity 8• Ask learners to swap books with a partner and check each other’s work
as you go through the answers with the class.
Activity 9• Go through the answers with the class. Ask learners to offer answers.
Activity 10• Go through the answers with the class. Ask learners to offer answers.
If you chose not to prepare the learners for Question 2 as suggested in the section, Teaching the unit, congratulate those who got the correct answer because it is quite tricky to work it out.
Activity 11• Go through the answers with the class.
Activity 12• Ask learners to swap books with a partner and check each other’s work
as you go through the answers with the class.
Activity 13• Go through the answers with the class. Ask learners to offer answers.
Activity 14• Use this discussion activity to informally assess learners’ ability to express
a point of view or argue a point. Try to encourage those learners who are shy about offering their opinions. You can take a Yes/No class vote on the question of whether it’s too late to stop global warming as a way of making learners feel that their opinion counts.
Activity 15• Write up the table for Question 4 on the board. Ask learners to offer
answers to the other questions.• Alternatively, mark this activity yourself according to the mark allocation
given in the Answers section. • Use this activity to informally assess learners’ ability to read and interpret
data in a table.

36 S E C T I O N 2 • L E S S O N - B Y - L E S S O N
Consolidation/extensionConsolidation: • Learners who struggled with Activity 5 probably need help with their
numeracy skills. After you have talked them through the calculations for the answers, then let them complete Worksheet 1 (page 266) in the Resources section of this Teacher’s Guide.
• They can also complete Worksheet 2 (pages 266–267) in the Resources section of this Teacher’s Guide. This activity focuses on the heating of the atmosphere and its effect on temperature in different places. It would also serve as a good revision activity for all learners.
Extension: • For the concept of albedo (Lesson 3), suggest that learners try one or
more of the following:– On a hot day, in a parking lot, find a white car parked next to a black
car. To feel the temperature, put your hand on the roof of the white car, then on the black car. Which feels hotter and why? Answer: The black car. It has lower albedo than the white car and absorbs more of the Sun’s radiation.
– On a hot, sunny day, put identical jars of water, closed with lids, in the Sun. The one is covered with a tight-fitting sleeve of black paper, the other with a sleeve of white paper. After half an hour to an hour, feel the temperature of the water in the two jars with your finger or measure it with a thermometer. Which is hotter and why?
• To demonstrate the ‘Distance from the oceans’ effect (Lesson 4) let learners complete the experiment in Worksheet 3 (page 269) in the Resources section of this Teacher’s Guide. You could also do this experiment as a demonstration, or suggest learners try a variation of this experiment at home, or even just talk about this experiment.
• Let learners complete Worksheet 4 (pages 270–271) in the Resources section of this Teacher’s Guide. It focuses on the depletion of the ozone in the atmosphere.
• Ask learners to make a ‘Stop global warming’ poster. For some examples, try this website: www.consultoresprado.eu/ui-global-warming-drawings
UNIT 3 Moisture in the atmosphere
TERM 1, WEEKS 4–6
Learner’s Book pages 40–53Duration: 8 hours
Curriculum and Assessment Policy Statement (CAPS) contentMoisture in the atmosphere• Water in the atmosphere in different forms – water vapour, liquid. • Processes associated with evaporation, condensation and precipitation. • The concepts of dew point, condensation level, humidity, relative
humidity – factors affecting relative humidity. • How and why clouds form. • Cloud names and associated weather conditions. • Different forms of precipitation – hail, snow, rain, dew, frost. • Mechanisms that produce different kinds of rainfall – relief,
convectional, frontal.

37M O D U L E 1 • T H E AT M O S P H E R E : G E O G R A P H I C A L K N O W L E D G E
Resources• Learner’s Book pages 40–53• Atlases• If you do the extension suggested in Lesson 1, you will need glass
jars with lids, water, table salt and teaspoons. Ask learners to bring jars to class.
• Activity 3 (per group): two thermometers, cloth, cotton/ cord/ string, water.
• Activity 5 (per group): one thermometer, one tin can, ice and water.• Websites (optional)
– The Frequently Asked Questions section at the bottom of the South African Weather Services (SAWS) homepage includes interesting and useful information for you and your learners: www.weathersa.co.za
– A useful site for you or your learners which covers types of precipitation: http://en.wikibooks.org/wiki/Adventist_Youth_Honors_Answer_Book/Nature/Weather
– A useful site for you or advanced learners: http://www.ucar.edu/learn/– For rainfall data for 16 main cities or towns in South Africa,
from 1960 to 2001 – daily, monthly and 24 hour maximum: www.1stweather.com/regional/data/data_daily_rain.shtml
Preparation• Read through the unit and familiarise yourself with the content that you
will need to teach. Think about what the learners may already know about the topics and any areas of difficulty that you think they might encounter.
• Activities 3 and 5 are practical activities, which you will need to prepare for. Also, you need to do Activity 3 on two different weather days: 1) a dry, windy day; and 2) a rainy, hot or humid day. See the resources for these two activities listed above.
• Be prepared for thermometer breakages if learners are going to use thermometers. Read ‘How to safely clean up a broken thermometer’ on www.vtvets.org/pdf/broken_thermometer.pdf
Teaching the unit
Lesson 1
• Read through, or ask learners to read through, the Unit 3 introductory paragraph on page 40. Ask them for everyday signs of water vapour in the air. Examples are: – salt clumps or gets stuck in the salt cellar– old coffee granules turn sticky– biscuits that aren’t stored in airtight containers become soggy– droplets of water condense on the outside of a glass filled with cold
water or a cold drink– freezers ice up and often need defrosting– dew collects on the grass, on surfaces and windows of cars– fog, mist and clouds form.
• Work through the section, ‘What are the three different forms of water?’ (page 40) and ‘What are the three important processes in the water cycle?’ (page 41).
• If you choose to do the extension activity (see the Extension section), set up a glass jar on a sunny window sill as a demonstration, or ask learners to set up their own jars.

38 S E C T I O N 2 • L E S S O N - B Y - L E S S O N
Activity 1• Let learners complete Activity 1. This activity should be quick and easy
for most of them.
Lesson 2
• Work through the section, ‘What is humidity?’ (pages 41–42). • Remind learners of the examples they gave that show water vapour in
the air. • Point out that evaporation always takes place, even at very low
temperatures. But when evaporation takes place faster than condensation (the reverse process), then humidity is high.
• Carefully go through the principle of the wet-and-dry-bulb thermometer: Evaporation takes place at the wet bulb and causes cooling, relative to the dry bulb.
• Carefully go through the concept of relative humidity: It is the amount of water vapour in the air relative to how much water vapour the air could contain. For this reason it is expressed as a percentage.
Activity 2• Let learners complete Activity 2. This activity consolidates the principle of
the wet-and-dry- bulb thermometer and the concept of relative humidity.
Lesson 3
Activity 3• Let learners complete Activity 3, which is a practical activity.• Learners should do this activity in groups of 3–6. The smaller
the group the better, but you will be restricted by the number of thermometers you have.
• Safety warning: Point out to learners that thermometers contain red-dyed alcohol or mercury. Warn them that mercury is poisonous and that glass thermometers break easily, so they should use them carefully and take care not to drop them. If a learner breaks a thermometer, they must let you know immediately, rather than try to clean it up themselves.
• Keep a watchful eye throughout the activity and be available to help or answer questions.
• Take your own measurements or record the thermometer readings from one or two groups so that you have a sense of the correct measurements for that particular day.
• Depending on what sort of day it is, you will then have to identify another day, as soon as possible for learners to complete the activity/ take another set of measurements.
Activity 4• Read the feature, ‘Humidity makes it extra hot’ (page 44).• Once learners have set up their thermometers for Activity 3, they can
work on the feature and Activity 4.
Lesson 4
• Work through the section, ‘What are dew, frost and dew point?’ (pages 44–45).

39M O D U L E 1 • T H E AT M O S P H E R E : G E O G R A P H I C A L K N O W L E D G E
• Carefully explain the concept of dew point – it is a difficult concept. Emphasise that dew point is a temperature and is related to relative humidity – how much water vapour there is in the air.
Activity 5• Let learners complete Activity 5, which is a practical activity, in pairs
or groups of 3–4.• Safety warning: Remind learners to work carefully with their
thermometers to avoid breaking them.• Take your own measurements or record the thermometer readings from
one or two groups so that you have a sense of the correct measurements for that particular day.
• Keep a watchful eye and be available to help or answer questions.
Lesson 5
• Work through the section, ‘How do clouds form?’ (page 46). • Begin the lesson by asking learners what a cloud is and if they know the
names of some cloud types.• For the concept of condensation level (the height at which the base of a
cloud forms), refer closely to Figure 1.3.10.
Activity 6• Let learners complete Activity 6, which will help them grasp the concept
of condensation level.• Learners can work in pairs or on their own for this activity.• Be available to help learners who struggle to use the graph, or ask those
learners who quickly get the hang of it to show others.
• Begin working through the section ‘Types of clouds and weather’ (page 48).
Lesson 6
• Continue the section, ‘Types of clouds and weather’ (page 48).• Ask learners to pay attention to the clouds in the sky for the next few
days or weeks and to try to identify them. Point out that there are often many types of cloud that they can see in the sky at one time.
• If appropriate cloud-wise, take the class outside briefly to study the clouds.
Activity 7• Let learners complete Activity 7 individually. This is a simple revision
activity based on types of clouds.
Activity 8• Let learners complete Activity 8 individually. This activity gives them
some practice at identifying some basic cloud types.
Lesson 7
• Work through the section, ‘What is precipitation?’ (page 50). This is a simpler section than the other material in Unit 3.
• Ask learners: Who has seen snow? Who has seen hail? Point out that hail is common to the eastern half of the country which has summer rainfall and thunderstorms.

40 S E C T I O N 2 • L E S S O N - B Y - L E S S O N
• Begin the section, ‘What is the difference between relief, convectional and frontal rainfall?’ (pages 51–53). – Begin by asking learners what makes air rise. They will probably
be most familiar with the convection method. Focus on the three different ways that air can rise, as shown in Figure 1.3.17.
– Read, ‘Mechanisms of rainfall’ with learners. For ‘Relief rainfall’:
– Point out that because mountains act as obstacles that force air to rise and cool, they create their own weather. Mountains are often capped with clouds. (Ask learners if they have noticed how on relatively cloudless day, clouds ‘collect’ or form over mountains.)
– Ask learners to turn to a map of South Africa in their atlases. Ask them to find George and Oudtshoorn, and the Outeniqua Mountains between them. Point out that George receives a much larger amount of rain than Oudtshoorn because it is close to the coast and not in the rain shadow of the Outeniqua Mountains. For example, if George receives a high rainfall of 200 mm, the rainfall in Oudtshoorn might be only 40−65 mm.
For ‘Convectional rainfall’, point out that this type of rainfall:– takes place in South Africa’s interior– is often associated with thunderstorms and hail– can cause turbulence for aeroplanes.
Lesson 8
• Continue the section ‘What is the difference between relief, convectional and frontal rainfall?’ (pages 51–53).– Remind learners that they are looking at mechanisms of rainfall.
Recap the two types you have looked at so far – relief and convectional.
– For ‘Frontal rainfall’, point out that this type of rainfall takes place in the Western Cape. Because of the frontal rainfall, this region, unlike the rest of the country, is a winter rainfall region.
Activity 8• Let the learners complete Activity 8 which is a simple revision exercise on
the three mechanisms of rainfall.
AnswersActivity 11. a) evaporation
b) precipitationc) evaporationd) condensation
2. a) coolingb) heatingc) heatingd) cooling
Activity 21. Dry bulb: 30 °C. Wet bulb: 23 °C2. 7 °C3. 55%4. 0 °C

41M O D U L E 1 • T H E AT M O S P H E R E : G E O G R A P H I C A L K N O W L E D G E
Activity 34. Here is an example of results. The main thing is that the temperature
difference between the dry bulb and wet bulb is larger on a windy day than on a rainy day. Ideally, you should have taken your own set of measurements on the two days on which learners did the experiment. Substitute the values in the table below.
Temperature of dry bulb
Temperature of wet bulb
Temperature difference
Dry/windy day 31 °C 25 °C 6 °C
Rainy/humid day 26 °C 24 °C 2 °C
5. more, lower
Activity 41. 31 °C2. 46 °C3. Example: On a humid day, you sweat less and so you don’t feel the
cooling effect of evaporation.
Activity 54. Here is an example of results. Once again, the main thing is that the
difference between the air temperature and the dew point temperature is larger on a windy day than on a rainy day.
Ideally, you should have taken your own set of measurements on the day on which learners did the experiment. Substitute the values in the table below.
Air temperature Dew point temperature
Dry/windy day 28 °C 5 °C
Rainy/humid day 27 °C 15 °C
5. a) lowerb) higher
Activity 61. f ) For cloud 2, learners should get a condensation level of 1 km, as
shown in Figure 1.3.10.2. a) Condensation level
b) higherc) lowerd) 6 °C, 20 °Ce) 18° C, 8 °C
Activity 71. stratus, cumulus, cirrus2. cirrus, cirrocumulus, cirrostratus, cumulonimbus (sometimes)3. nimbostratus, cumulonimbus4. stratus/ stratocumulus/ nimbostratus5. cumulonimbus

42 S E C T I O N 2 • L E S S O N - B Y - L E S S O N
Activity 8A cirrusB cirrocumulusC cumulusD cumulonimbus
Activity 9
Region 3 2 1
Type of rainfall relief convectional frontal
How the air rises
air is forced to rise over a mountain
warm air rises on a hot day by convection
warm air rises over cold air
Type of cloud thick, low cloud (cap or lenticular cloud*)
cumulonimbus nimbostratus
Form of rain drizzle heavy, short light, long
* Your learners aren’t expected to know the terms for this type of cloud. It is included here for their interest.
Informal assessmentActivity 1• Quickly go through the answers with the class.
Activity 2• Ask learners to swap books with a partner and check each other’s work as
you go through the answers with the class.• For learners who got more than one answer incorrect, set another similar
activity for homework (see the Consolidation section).
Activity 3• Write up an example of the results on the board, preferably with
measurements that match the experiment on the two days, rather than the ones given in the Answer section above.
• Take in learners’ books (or at least one from each group) and scan through their work to informally assess how well they have managed to do the experiment and record their results.
Activity 4• Go through the answers with the class. Ask learners to offer answers.
Activity 5• Write up an example of the results on the board, preferably with
measurements that match the experiment on the two days, rather than the ones given in the Answer section above.
• Take in learners’ books (or at least one from each group) and scan through their work to informally assess how well they have managed to do the experiment and record their results.
Activity 6• Go through the answers with the class.

43M O D U L E 1 • T H E AT M O S P H E R E : G E O G R A P H I C A L K N O W L E D G E
Activity 7• Go through the answers with the class. Ask learners to offer answers.
Activity 8• Go through the answers with the class. Ask learners to offer answers.
Activity 9• Write up the completed table on the board.
Consolidation/extensionConsolidation: • For learners who struggled with Activity 2 or want more practice, let
them complete Worksheet 5 (page 272) in the Resources section of this Teacher’s Guide.
Extension: • You can extend Lesson 1 by making a very simple model of the water
cycle that shows how the Earth’s water cycle takes place in a closed system. The instructions for how to make this model may be found in Worksheet 6 (page 273) in the Resources section of this Teacher’s Guide.
UNIT 4 Reading and interpreting synoptic weather maps
TERM 1, WEEKS 6–7
Learner’s Book pages 54–64Duration: 6 hours
Curriculum and Assessment Policy Statement (CAPS) contentReading and interpreting synoptic weather maps• Weather elements – temperature, dew-point temperature, cloud cover,
wind direction, wind speed, atmospheric pressure. • Weather conditions – e.g. rain, drizzle, thunderstorms, hail, snow as
illustrated on station models. • Reading and interpreting a selection of synoptic weather maps.
Resources• Learner’s Book pages 54–64• If you do the extension activity suggested for Lesson 1 (continued
in Lessons 5 and 6), you will need to supply or ask learners to bring materials for making their own simple weather instruments. For example:– For wind vanes: heavy paper, drinking straws, glue, dowels, nails and
a hammer (see Worksheet 7 on page 274 of this Teacher’s Guide)– For rain gauges: plastic 2 litre cooldrink bottles, scissors, Plaster of
Paris, marker pens and rulers– For anaeroid barometers: tins or glass jars, broken balloons, strong
rubber bands, glue, sticky tape, white card, drinking straws.• Websites (optional)
– The South African Weather Service’s (SAWS) website for weather forecasts: www.weathersa.co.za
– A useful site for you or your learners which includes details on how weather instruments work and pointers on how to make a simple wind vane or rain gauge: http://en.wikibooks.org/wiki/Adventist_Youth_Honors_Answer_Book/Nature/Weather

44 S E C T I O N 2 • L E S S O N - B Y - L E S S O N
– For a PDF document on weather instruments and how to record the weather: http://www.rmets.org/pdf/simweameasurements.pdf
– For information on barometers and instructions on how to make a simple anaeroid barometer: http://www.home-weather-stations-guide.com/make-a-barometer.html
– This site posts a daily synoptic weather chart for South Africa: www.koolasun.co.za/weather/sa-weather-chart.html
Preparation• Read through the unit and familiarise yourself with the content that you
will need to teach. Think about what the learners may already know about the topics and any areas of difficulty that you think they might encounter.
• See the resources needed for Lesson 1 extension activity listed above.
Teaching the unit
Lesson 1
• Begin the lesson by focusing on the term ‘meteorology’, which is the science of the atmosphere. Point to the Tip box that gives the origins of the word – meteros means ‘high in the sky’. Ask learners if they are familiar with the term ‘MET office’. MET is short for meteorological. – Remind learners that the atmosphere is the source of our weather. – Encourage learners to pay attention to the weather forecasts in the
media – TV, radio, or newspapers.– Point out that South Africa’s weather forecasts come from the South
African Weather Services (SAWS), which falls under the Department of Environmental Affairs. Encourage learners to look at the SAWS website if they are not already familiar with it.
• Introduce the section, ‘What are the weather elements? (page 54)’ by generating a list on the board from the learners’ suggestions.
• Read through this section in the Learner’s Book.• If you choose to do the extension activity (see the Extension section),
learners can begin making simple weather instruments such as a wind vane, a rain gauge or an anaeroid barometer. They can complete these in Lessons 5 and 6.
Lesson 2
• Work through the section, ‘What is a weather forecast? (page 54), and ‘The South African Weather Service’ (pages 55–56).
Activity 1• Let learners complete Activity 1. Remind them that weather forecasts
(such as the one in Figure 1.4.2 that they are using) are available on the South African Weather Service’s (SAWS) website.
• This activity gives learners practice using an online five-day weather forecast.
Activity 2• Read the feature, ‘What does it mean when there’s a 30% chance of rain?’
(page 55) then, as a class, discuss the answers to the questions in Activity 2.• This is a discussion-based activity that needs to be done in class.

45M O D U L E 1 • T H E AT M O S P H E R E : G E O G R A P H I C A L K N O W L E D G E
Lesson 3
• Work through the section, ‘What is a synoptic weather map?’ (pages 56–58). Point out that synoptic weather maps or aspects of them are useful to people who do wind and water sports, for example, surfers, windsurfers, sailors and paragliders.
• Point out the synoptic weather map example in Figure 1.4.7.• Carefully talk learners through the station model in Figure 1.4.4.
Activity 3• Let learners complete Activity 3 in pairs. It gives them practice in reading
the information on station models.
Activity 4• Remind learners of the concept of dew point before they work through
this activity, i.e. that it is a temperature and that it indicates the amount of water vapour in the air.
• If there is not enough time, learners can do or complete this activity for homework.
Lesson 4
• If Activity 4 was completed for homework, go through the answers with the class.
• Work through the section, ‘Frontal weather systems’ (page 59). • Refer to Figure 1.4.8 which shows the difference between a warm front
and a cold front. Emphasise that the ‘warm’ or ‘cold’ refers to the air that is approaching behind the front.
• Work through the section, ‘Pressure patterns’ (page 60). • Refer to Figure 1.4.9 that shows isobars. Remind learners that the units
for the values are hectopascals, not millibars.• Work through the section, ‘Wind patterns’ (page 60). • Refer to Figures 1.4.10 and 1.4.11 that show how the wind spirals around
high and low pressure systems. • Tell learners that when they look at ocean currents (Module 3), they will
see how they also follow a circular pattern. This is because of the turning of the Earth.
• As an interesting aside, point out that, it is commonly believed that the Coriolis effect affects the direction that water spirals down a plug-hole, i.e. clockwise down the plug-hole in the northern hemisphere and anti-clockwise down the plug-hole in the southern hemisphere. But the Coriolis effect is not strong enough to affect the flow of bathwater. They can find out more about this misconception on:– en.wikipedia.org/wiki/Coriolis_effect under the heading ‘Draining
in bathtubs and toilets’– www.guardian.co.uk/notesandqueries/ query/0,5753,-20326,00.html
• Refer to the synoptic weather map in Figure 1.4.12 that shows wind patterns.
Activity 5• If there is not enough time, learners can complete this activity
for homework.

46 S E C T I O N 2 • L E S S O N - B Y - L E S S O N
Lesson 5
• If Activity 5 was completed for homework, go through the answers with the class.
Activity 6• Learners can do this activity in pairs and then go through the activity
with the whole class.• If learners are doing the extension activity (see the Extension section
on page 49 of this Teacher’s Guide), they can spend the rest of the lesson making their simple weather instrument.
Lesson 6
• Go through the feature, ‘Weather satellites: A view of the weather from space’ (page 63).
Activity 7• This is a simple, but important exercise that helps learners relate the
cold front system seen in a satellite image to its depiction on a synoptic weather map.
• If learners are doing the extension activity (see the Extension section on page 49 of this Teacher’s Guide), they can spend the rest of the lesson making their simple weather instrument.
AnswersActivity 11 a) minimum: 23°C; maximum: 27°C
b) 20 kmph; north-eastc) 1012 hPad) 90%e) humidity is high, so temperatures feel hotter than they really are
2. five-day3. a) 30%
b) 5 mm c) 20 kmph north-eastd) 20 kmph south-west
Activity 2Learner’s own answers. For example, learners might say in (2) that they thought that a 30% chance of rain meant drizzle or that it rains for 30% of the day. Others may have already had a more accurate impression.

47M O D U L E 1 • T H E AT M O S P H E R E : G E O G R A P H I C A L K N O W L E D G E
Activity 3
274
35
10
14
5
Air temperature 27 °C 35 °C 14 °C
Dew point 4 °C 10 °C 5 °C
Precipitation none thunderstorms fog
Cloud cover clear overcast 2 eighths
Wind direction south-east north north-west
Wind speed 25 knots 20 knots 15 knots
Allocate 1 mark per answer (18)
Activity 41. 2010-08-03, 14:00 SAST2. Gough Island is at the bottom left, Marion Island at the bottom right3. dew points are low4. dew points are high/er5. dew point = – 6 °C; clear/no cloud cover6. dew point = 5 °C; six-eighths/heavy cloud cover7. more
Activity 51. cold front2. cloudy, rainy weather3. 1028 hPa; above4. 988 hPa and 980 hPa; below5. far apart6. close together7. low pressure
Activity 61. a) B, C, A
b) movement of warm airc) movement of cold aird) The warm front is shown in maps B and C – see the red bumps.
Note that:• the cold air is ahead of the warm front, i.e. on the side of the red
bumps • the warm air is behind the warm front, i.e. on the opposite side
of the red bumps.e) cold, warm
2. a) Ab) Cc) B

48 S E C T I O N 2 • L E S S O N - B Y - L E S S O N
Activity 71. Examples: A polar-orbiting satellite goes around the poles, perpendicular to the
direction that the Earth turns in. This means it covers the whole of the Earth after several orbits.
A geostationary satellite follows the speed and direction that the Earth turns in. This means that it covers a fixed area above the Earth.
2.
cold air
warm air
Informal assessmentActivity 1• Go through the answers with the class. Ask learners to offer answers.
Activity 2• Informally assess learner’s old and new understanding of the percentage
chance of rain. Ask learners if the explanation in the feature was helpful.
Activity 3• Write up the table of answers on the board or, mark this activity
according to the mark allocation given in the Answers section. • Use the activity to informally assess how well learners can read the
station models.
Activity 4• Go through the answers with the class. Ask learners to offer answers.
Activity 5• Ask learners to swap books with a partner and check each other’s work as
you go through the answers with the class.

49M O D U L E 1 • T H E AT M O S P H E R E : G E O G R A P H I C A L K N O W L E D G E
Activity 6• Go through the answers with the class. Ask learners to offer answers.
Activity 7• Check learners’ overlays as they do this activity.
Consolidation/extensionConsolidation: • For learners who struggled with Activity 2, or need more practice, ask
them to interpret the station models for one or more of the following towns on the synoptic weather map in Figure 1.4.7 on page 58 of the Learner’s Book: Cape Town, Port Elizabeth, Durban, Bloemfontein and Pretoria.
They should draw up and complete the table below. If they have trouble only with reading wind direction, for example, then they need only focus on wind direction.
Cape Town Port Elizabeth
Durban Bloemfontein Pretoria
Air temperature
14 °C 18 °C 23 °C 21 °C 23 °C
Dew point 5 °C 9 °C 17 °C −4 °C −15 °C
Cloud cover 6 eights 1 eighth 2 eighths clear Clear
Wind direction
west south-west
west south-west
north north-west
west south-west
due west
Wind speed 10 knots 25 knots 10 knots 10 knots 15 knots
Extension: • Let learners make their own simple weather instruments. Refer to the
relevant websites suggested in the Resources section above or let them follow the instructions to make a simple wind vane in Worksheet 7 (page 274) in the Resources section of this Teacher’s Guide.

50 S E C T I O N 2 • L E S S O N - B Y - L E S S O N
Term 1Learner’s Book pages 65–78Duration: 6 hours
MODULE 2
THE ATMOSPHERE: GEOGRAPHICAL
SKILLS AND TECHNIQUES
In this module we deal with Geographical Information Systems (GIS), fieldwork and practical work, and using atlases.
Geographical Information Systems are the outcome of our increasing access to computers and our ability to use them to process a wide range of information. Satellite photos are beamed down to the Earth, and then the data is stored, sorted and analysed. Computer technology helps us to quickly retrieve and work with stored information. Maps can be created and information on them manipulated electronically, by adding layers of information for specific tasks. One result of GIS is our use of Garmin or TOM-TOM maps that can instantly direct us to where we need to go when we key in name places.
Fieldwork and practical work involves working with instruments to collect information. It means we use first-hand information, such as observation of weather, or collection of rainfall figures from a rain gauge, or secondary sources such as the media. The data can then be processed in a variety of ways such as in graphs, diagrams or synoptic weather maps.
When we want to find out where a place is situated in the world, we use an atlas. An atlas gives us scale and a sense of distance, and gives us information about relief and oceans. Most atlases also give information about climate, vegetation, agriculture and fishing, infrastructure, comparison of wealth, urban sizes, population details, travel, and tourism facts.
Curriculum and Assessment Policy Statement (CAPS)
Geographical Information Systems• Reasons for the development of GIS.• How remote sensing works.• Satellite images related to meteorology and climatology.
Fieldwork and practical work • Using maps and other graphical representations – atlases, synoptic
weather maps, temperature graphs. • Collecting and recording data using a variety of techniques – using
weather instruments, collecting weather information from the media. • Processing, collating and presenting fieldwork findings – line graphs,
bar graphs, maps diagrams, synoptic weather maps.
Using atlases • Map reading – comparing information from different maps.• Atlas index – locating physical and constructed features.
Key geographical skills • Using verbal, quantitative and symbolic data forms such as text, pictures,
graphs, tables, diagrams and maps.

51M O D U L E 2 • T H E AT M O S P H E R E : G E O G R A P H I C A L S K I L L S A N D T E C H N I Q U E S
• Practising field observation and mapping, interviewing people, interpreting sources, working with statistics.
• Applying communication, thinking, practical and social skills.• Practising the following specific skills:
– identifying questions and issues– collecting and structuring information– processing, interpreting, and evaluating data– making decisions and judgements– deciding on a point of view– suggesting solutions to problems– working co-operatively and independently.
Key words/conceptsGeographical Information Systems (GIS); satellite; spatial information/ data; remote sensing; electromagnetic radiation (EMR); spectral characteristic; spectral reflectance/ reflection; spectral reflectance curve; Raster model; Vector model; pixel; point; co-ordinate; geostationary orbit; climate graph; synoptic weather map; climate; latitude; longitude
UNIT 1 Geographical Information Systems (GIS)
TERM 1, WEEK 8
Learner’s Book pages 65–69Duration: 1 hour
Curriculum and Assessment Policy Statement (CAPS) contentGeographical Information Systems• Reasons for the development of GIS.• How remote sensing works.• Satellite images related to meteorology and climatology.
Resources• Learner’s Book pages 65–69• Atlases• A cell phone or other electronic device which has a navigation or
mapping instrument on it (optional)• Website (optional)
• www.gis.com
Preparation• Read through the unit and familiarise yourself with the content that you
will need to teach. Think about what the learners may already know about the topics and any areas of difficulty that you think they might encounter.
Teaching the unit
Lesson 1
• A good way to start this topic is to ask learners how many of them own a cell phone. Some of them may have Blackberry’s and iPhones. Some learners may have their own Notebooks and iPads. Learners may have their own computer, or access to a computer, and to the Internet. The parents of some of the learners may have a Garmin or Tom-Tom in their

52 S E C T I O N 2 • L E S S O N - B Y - L E S S O N
cars for directions and maps. The school may own a Garmin which it uses for a bus route.
• Explain to learners that the wide use of the above items shows how GIS has been made accessible to most of us in some form or another.
• Read through, or ask learners to read through the Module 2 introductory paragraph on page 65.
• Read through, or ask the learners to read through the Unit 1 introductory paragraph on page 66. Read through the Key questions and explain which Key questions the lesson will deal with.
• It will help to summarise answers to these Key questions on the board as your go through the information on pages 66–69 with the learners. Focus on the factual content, for example: ‘Why were Geographical Information Systems (GIS) developed?’ can be summarised by the factual points: to store, to retrieve, to analyse information.
• You can develop this further, by asking questions such as: Why or how do we store information? What has made GIS better and more efficient than what was used in the past?
• Read through, or ask learners to read through the section, ‘Why were Geographical Information Systems (GIS) developed?’ (page 66).
• Ask if learners have seen a satellite. Explain that anyone can see a satellite by watching the sky at night. Satellites pass overhead and move like a star on a pathway or course as far as the eye can see.
• When you explain how remote sensing works (pages 67–68) you can talk about X-rays at a hospital, which work on a similar principle.
• The word ‘Raster’ refers to the line-by-line scanning of information by a computer. A ‘Raster scan’ is the rectangle shown on a computer monitor or TV screen.
• The word, ‘pixel’ was first used in the 1960s in America. It comes from two words: ‘picture’ and ‘elements’. It refers to the smallest unit of a photo or picture.
• Go through the section, ‘Which satellites are used in meteorology and climatology?’ (page 69).
Activity 1• Ask learners to do Activity 1 for homework or in class if there is time. • This is work which can be done individually to summarise the main
points of the lesson and consolidate learning.
AnswersActivity 11. Suggested answers to a point-form summary on GIS:
a) GIS was developed to respond to the need for:• immediate, up-to-the-minute information• rapid use of information for disaster management, war and civil
disturbance, and severe weather warnings• data that can be added to maps, amended, altered, upgraded or
manipulated. For example, the use of layers of information on maps allows town planners to plot traffic on street maps. Town planners can add a layer of information about traffic lights. With observation of peak-time traffic, traffic lights can be staggered to help ease the flow of traffic.
b) Remote sensing works using electromagnetic radiation or EMR:• There is no physical contact between the sensor and the object.• Each object has a unique signature or ‘spectral characteristic’

53M O D U L E 2 • T H E AT M O S P H E R E : G E O G R A P H I C A L S K I L L S A N D T E C H N I Q U E S
• A spectral characteristic is reflected to the sensor.• The ‘spectral reflectance curve’ is processed into information for
us to analyse.c) Satellites used in meteorology and climatology are:
• TIROS satellites• Geostationary Operational Environmental Satellites (GOES)• Meteostat satellites• MetOP satellites.
Informal assessmentActivity 1• Ask learners to read out their answers. Summarise the points on the
board as they do this. • Ask learners if anyone had anything different that you can add to
the summary.
Consolidation/extensionConsolidation: • Allow learners more time to read through this module. Help them to
focus on finding the main points.
Extension: • If you have Internet availability, allow learners to investigate the
development of GIS further. Direct them to use a search engine such as GOOGLE. They can type in any of the following words, and read up on background information: GIS; EMR; remote sensing; TIROS; geostationary satellites; Raster; Vector. This will help prepare them for additional work with GIS.
UNIT 2 Fieldwork and practical work
TERM 1, WEEKS 8–9
Learner’s Book pages 70–75Duration: 4 hours
Curriculum and Assessment Policy Statement (CAPS) content• Using maps and other graphical representations – atlases, synoptic
weather maps, temperature graphs.• Collecting and recording data using a variety of techniques – using
weather instruments, collecting weather information from the media.• Processing, collating and presenting fieldwork findings – line graphs, bar
graphs, synoptic weather maps.
Resources• Learner’s Book pages 70–75• Atlases• The local newspaper on a daily basis while doing this section. You can
ask the librarian/ or another teacher/ or a parent/ or task a child with cutting out only the weather section and dating each piece for use in plotting weather data (optional).
• Websites (optional) – www.weathersa.co.za– www.southafricanweather.co.za– www.koolasun.co.za– www.weatherphotos.co.za

54 S E C T I O N 2 • L E S S O N - B Y - L E S S O N
Preparation• Read through the unit and familiarise yourself with the content that you
will need to teach. Think about what learners may already know about the topics and any areas of difficulty that you think they might encounter.
• Be prepared for the lessons by having available an example of: (a) a synoptic weather map; (b) a climate graph; (c) weather instruments, such as a rain gauge, thermometer or barometer. You can have photos of the weather instruments if they are not available.
Teaching the unit
Lesson 1
• Read through the Unit 2 introduction (page 70) with the class. • On the board, write the key question: ‘What is a climate graph and how
is it used?’• On the board, show learners what a climate graph is, emphasising that each
graph must have a heading and place reference; and labels for the degrees Celsius temperature, for the rainfall in mm, for the months of the year.
• You can do this by following these steps: Construct a climate graph on the board for an imaginary place. Make a heading, ‘Diagram to show a climate graph of (give an imaginary name)’. On the vertical axis on the left, show temperature in degrees Celsius. On the vertical axis on the right show precipitation (rainfall) in mm. On the horizontal axis show time. Make a bar graph to show rainfall. Make a line graph that shows the temperature (remember the seasons of the year: you must have high temperatures for summer and low for winter).
• Point out the following: along the horizontal axis are the months of the year. In the southern hemisphere, the months of Jan, Feb, Mar and then Oct, Nov, Dec form the summer season; winter occupies the months of April, May, June, July, Aug, Sept.
• Teach the learners to check in which season the maximum rain falls. They can do this by looking when the line graph shows high temperatures for summer and low temperatures for winter. (Remind them that in the southern hemisphere, the summer season is in December/ January and the winter season is in June/ July. It is the opposite in the northern hemisphere.)
• Teach the learners to check in which hemisphere this imaginary place is. They can do this by checking when the temperatures are high in summer (summer in the northern hemisphere is during our winter: from April through to September).
• Read through the information on page 70 with learners, ‘What is a climate graph and how is it used?’
Activity 1• The learners will need an atlas for the activity.• You can begin the activity in class focusing on the first place (Moscow)
to ensure that learners know how to use an atlas, and where to look for information for the answers.
• Then let learners complete the activity at home.
Lesson 2
• Remind the class about synoptic weather maps. You can refer to one by placing a copy on the board. Remind them of the symbols used on a synoptic weather map and what they mean.

55M O D U L E 2 • T H E AT M O S P H E R E : G E O G R A P H I C A L S K I L L S A N D T E C H N I Q U E S
• Read the information on page 71 with the learners, ‘What is a synoptic weather map and how is it used?’
Activity 2• Go through Activity 2 in class. Use the learner’s answers for comment
and teaching.• Check their understanding of normal pressure at sea level (1 013 mb);
anything above is High and anything below is Low. • Look at the isobar intervals on the synoptic map (Figure 2.2.2).• Point out the South Atlantic High pressure cell; the Indian Ocean High
Pressure cell; the Low pressure over SA.• Point out that this is a feature of summer synoptic maps. The temperature
over the land causes air to rise, creating low pressure. The sea is cooler by contrast, and higher pressure is found over the sea in summer.
Lesson 3
• Introduce the practical aspect of this lesson, which is to do with collecting information from primary sources (e.g. the amount of rain) or secondary sources (using TV, radio or newspaper information). Read the information on page 71, ‘How do you collect and record weather data?’ Go through the activities with the learners.
Activities 3 and 4• Activity 3 and 4 are similar and will take a week. Once you have explained
this to learners, set up the investigation task for homework.• Encourage learners to use computer resources, or the library, or to bring
information they have collected to class. Or take the learners out to show them what to do to record features of the weather.
• They can begin Activity 3 and 4 in the classroom and fill in the table for each day of the week, completing it at home or in class.
Lesson 4
• Read the information, ‘How meteorologists process, put together and present fieldwork’ (page 73) with learners. This section explains the terms synoptic weather map, climate and weather, and discusses the four factors affecting climate.
• Use Figures 2.2.3A and B to show synoptic weather maps typical for summer and winter.
• Point out the similarities – both have isobars; and the differences – the cold fronts across the south-west Cape in winter, and the High pressure over the interior in winter; while in summer the Low pressure is over the interior because of the heat of the land and rising air, and the sea is relatively cooler than the land and so has High pressure cells over it in summer.
Activity 5• Do Activity 5 as a class exercise if you have the time; or begin in the class
and learners can complete it for homework.• Discuss Figures 2.2.3 and 2.2.4. Talk about the different way in which
information is shown in each of them, and what the information is.

56 S E C T I O N 2 • L E S S O N - B Y - L E S S O N
AnswersActivity 12. Moscow: latitude 55 °N; Port Nolloth: latitude 29 °S; Singapore: latitude
1°N3. Moscow: inland; Port Nolloth: Benguela Current, cold; Singapore:
Equatorial Current, warm4. Moscow: 0–200 m; Port Nolloth: 0–200 m; Singapore: 0–200 m5. Moscow: inland approximately 900 km; Port Nolloth: on the coast;
Singapore: on the coast6. Moscow: Rainfall is throughout the year; maximum rainfall in August
and September; maximum rainfall is approximately 75 mm in August; yearly rainfall is a total annual rainfall of approximately 650 mm. Temperature ranges from 10 °C to 25 °C (a range of 35 °C); maximum temperatures in June, July and August. Port Nolloth: Rainfall is less than 1 mm each month, with slightly more in May to August; the yearly rainfall is a total annual rainfall of approximately 6 mm. Temperature ranges from 7,5 °C to 20 °C (a range of 12,5 °C); maximum temperatures in January, February, November and December. Singapore: Rainfall is between 175 mm to 250 mm each month, with November, December and January recording the largest amounts; the yearly rainfall is a total annual rainfall of approximately 2 420 mm. Temperatures range from 27,5 °C to 32,5 °C; maximum temperatures are in May, June and July.
7. Port Nolloth has a dry climate because it is next to a cold current (air sinks over a cold current; cold air does not have the capacity to carry water vapour).
Activity 21. no2. 1 016 mb3. low4. Indian Ocean High Pressure Cell
Activity 3The answers may vary a little depending on whether learners do this from home, and the accuracy with which they use instruments if they have any. If this is done using instruments from school, there should be no variation. If it is done from data from the newspaper or radio, there should be no variation.
Activity 4This is a practical exercise making use of secondary sources. Everyone’s answers should be the same because they are using the same sources for the area in which they live, or one town that you choose for the activity.
Activity 51. Currents are warm or cold. Air rises over a warm current, and is warmer.
Warm air can hold more moisture. Warm temperatures accelerate evaporation. Rainfall occurs more frequently along coasts where there is a warm ocean current. This affects the climate and vegetation. Cold currents have cold, dense air above them. This cannot hold moisture and there is little evaporation because of the cold temperature. The climate is drier along the coast where there is a cold current.
2. altitude or height above sea level

57M O D U L E 2 • T H E AT M O S P H E R E : G E O G R A P H I C A L S K I L L S A N D T E C H N I Q U E S
3. Distance from the sea leads to a climate of extremes: higher summer temperatures and colder winter temperatures than if you were near the coast. This is similar to the temperature found in Russia on the ‘steppes’, a flat region characterised by climatic extremes and distance from the sea.
Informal assessmentActivity 1• Remind learners about the factors which affect climate: LOAD (latitude,
ocean currents, altitude and distance from the sea).• Go through the answers in class; check who understands how to use
an atlas and has managed to do the activity; find out what difficulties learners have.
Activity 2• Assess learners’ responses to the questions to ensure that they understand
they key features of a synoptic weather map.
Activity 3• You can complete the activity at the same time as the learners. This will
help you to assess their answers.• Let learners mark each other’s work. Make a copy of your answers for
each learner or you can put the answers on the board.• Ask learners if anyone has anything different as an answer, and comment
on why that may have happened. (For example, if a rain gauge is used, it needs to be in an open area away from a wall or a tree that will shelter it from the rain, or the figures will be different from those recorded in an open area.)
Activity 4• Ask a learner to draw the table on the board and get learners to check
that all the labels are correct.• Ask another learner to complete the rows.• Correct any inaccuracies with a memorandum that you will have
prepared for that time period and that area or town, so that all answers cover the same time period and geographical area.
• Go over the work with learners who did not understand the activity.
Activity 5• Ask learners for their answers and discuss these in class.
Consolidation/extensionConsolidation: • Practise interpretation of other climate graphs if necessary, after Lesson 1.• Spend more time with the learners who found Activity 5 difficult. Discuss
each of the factors (LOAD) and their effect on climate.
Extension: • Focus on climate graphs of: (a) high altitude areas; (b) areas far from the
sea; (c) areas along the equator; (d) areas along the West coasts where there are cold currents; (e) areas along the East coasts where there are warm currents. Let learners compare similarities and dissimilarities.
• You can extend Activity 4 by creating a lengthier assignment, for example, for the second term they must create a wall chart to show the weather in

58 S E C T I O N 2 • L E S S O N - B Y - L E S S O N
the area. They can summarise their findings and present this to the class at the end of the term.
• Refer learners who need an extension of Activity 5 to the websites: www.koolasun.co.za and to www.weatherphotos.co.za to get more practice with a variety of images.
UNIT 3 Using atlases
TERM 1, WEEK 9
Learner’s Book pages 76–78Duration: 1 hour
Curriculum and Assessment Policy Statement (CAPS) content• Map reading – comparing information from different maps.• Atlas index – locating physical and constructed features.
Resources• Learner’s Book pages 76–78• Atlases
Preparation• Read through the unit and familiarise yourself with the content that
you will need to teach. Think about what the learners may already know about the topics and any areas of difficulty that you think they might encounter.
• You will need to make sure that there is at least one atlas for every two learners to share.
Teaching the unit
Lesson 1
• You can ask a learner to read through the introductory paragraph and the text under ‘How do you use maps to compare information?’ (page 76).
• Ask the class to explain the relevance of Figure 2.3.1. Remind the class of the link between cold water – cold dense air – no evaporation – no moisture; and warm water – warm air – plenty of evaporation – plenty of moisture.
• Ask the class to comment on the relevance of Figure 2.3.2. Remind the class of currents, moisture and vegetation. Remind the class about the four factors (LOAD) that affect climate.
Activity 1• Let learners complete Activity 1 for homework. It will help them to
consolidate the climate work.• Read the information on page 78, ‘How do you read an atlas index?’ • Ask the class to turn to the index in their atlases. Let them look up the
example of ‘Taung’. Show them the boxed example in the Learner’s Book (page 78).
Activity 2• Allow learners to complete the activity in the class. They will need the
atlases to complete it.

59M O D U L E 2 • T H E AT M O S P H E R E : G E O G R A P H I C A L S K I L L S A N D T E C H N I Q U E S
AnswersActivity 11. West side of continent2. Cold current3. A cold current has little evaporation above it; there is little precipitation;
the land is dry; the vegetation is desert-like.4. Tropical and equatorial rain forests mostly5. A warm current has rising air and evaporation; warm air can hold
more moisture; there is more precipitation; the land has moisture; the vegetation is lush.
6. It is very cold in the extreme North and South; little evaporation; little moisture; an ice desert
7. The link is: cold current – little moisture – dry desert-like vegetation; warm current – moisture – abundant vegetation
8. A suggested answer could be: Vegetation regions overlap with climate regions because vegetation is dependent on rainfall. Rainfall is dependent on moisture in the atmosphere. Moisture in the atmosphere is dependent on warm rising air from a warm ocean current.
Activity 21. a) On the Asian continent
b) Chinac) Asiad) Egypt, Africae) In the West of Sudan, Africa
2. a) 34°S 18º20´E b) 33°S 27º55´E c) 29°45S 31ºEd) 26°30´S 30ºE e) 25°40´S 28º15´E
Informal assessmentActivity 1• As this activity is a summary of what has been taught, you may choose to
take the books in to check if the learners have understood this.• Alternatively, you can get learners to swap books and check their answers
against suggested answers you have put on the board.
Activity 2• Call out the answers for learners and ask them to mark their own. Ask
them to indicate by a show of hands who found each of the places. Consolidation/extensionConsolidation: • Give the names of a number of places that learners can locate using the
index of their atlases. This can be like a treasure hunt for learners to make it more fun.
Extension:• Ask the class to give an important fact about each of these places, or
you could pin the names onto a map of the world, with one fact about each place.

60 S E C T I O N 2 • L E S S O N - B Y - L E S S O N
Extension 1 The atmosphere
TERM 1, WEEK 10
Geography topic: Climate graphs (geographical skills and techniques)
Resources• Learner’s Book pages 79–80• Quad or graph paper• Rulers
Background• This task focuses on Module 2 of Study & Master Geography Grade 10 and
therefore should be scheduled for after the learners have completed this module and had time to do some revision activities. (See year plan on page 8.)
• The skills covered in this task are drawing graphs; working with data and doing calculations; and analysing and synthesising information.
• Allow 1 hour of class time for the learners to begin the task. Learners who have not completed the task in class, should do so for homework.
Preparing the learners• Remind the learners that they should work on their own and answer
all questions.• Let them read through the task and ask questions about any part of the
task that they do not understand.• Remind them that they can consult Modules 1 and 2 in the Learner’s
Book if they need to.• Give them a due date for their completed tasks.
The taskYou will find Geography in practice 1 on pages 79–80 of the Learner’s Book. A marking memorandum is supplied below under the heading, Assessment guidance.
Assessment guidanceMemorandum: Geography in practice Task 1 (Learner’s Book pages 79–80)Activity 1 (12 marks)1. temperature, rainfall, time (3)2. June, July (1)3. June, July (1)4. Northern hemisphere (1)5. The Northern hemisphere has its summer in June and July hence
the hotter temperatures then. (1)6. 45 °C (from –20 to 25) (1)7. Manaus is 3 °S, which is almost on the equator and close to the sea,
so there is very little variation (1). Winnipeg is 50 °N and far from the ocean, so the temperatures are extreme (1). (2)
8. Any two of the following: latitude; ocean currents; altitude; distance from the sea (2)
[12]
© Cambridge University Press. You may photocopy this page for use with Study & Master Geography Grade 10.

61M O D U L E 2 • T H E AT M O S P H E R E : G E O G R A P H I C A L S K I L L S A N D T E C H N I Q U E S
Activity 2 (13 marks)
22
20
18
16
14
12
10
8
6
4
0
San Francisco, California
Jan Feb Mar Apr May Jun Jul Aug Sep Oct Nov Dec
Tem
pera
ture
(oC
)
average temperature average rainfall
300
280
260
240
220
200
180
160
140
120
100
80
60
40
20
0
Rai
nfal
l (m
m)
[13]Activity 3 (15 marks)1. August and September (2)2. Northern hemisphere, (1) as it has summer (1) in June, July, August
and September (1). (3)3. Winter (1), which is January, February, March (½) and, November
and December (½). (2)4. a Mediterranean climate (2)5. Approximately 20 °C (2)6. There is no rain in the summer (2) so this may cause droughts (1)
or fires (1). (4)[15]
[Total marks: 40]
© Cambridge University Press. You may photocopy this page for use with Study & Master Geography Grade 10.

62 S E C T I O N 2 • L E S S O N - B Y - L E S S O N
Learner’s Book pages 81–84
REVIEW TERM 1
These activities provide an opportunity for learners to consolidate concepts and skills learnt in Term 1. Learners can complete them in class or as homework. It is suggested that they complete the activities individually as a means of self-assessment.
You can write the answers on the board for the learners and/or call them out where more appropriate. However, if possible, it is suggested that you photocopy the answers and give them to the learners so that they have them for revision purposes.
Activity 11. Temperature decreases with altitude.2. 1) The lower atmosphere is heated from the ground up. Only the layer
of air closest to the ground is warmed by the Earth by conduction. 2) The higher up you go the thinner the air gets. Air molecules hold heat.3. 6,5 °C4. lapse rate5. troposphere6. The air is thinner or less dense at 6 000 m. Gravity decreases with altitude
therefore the pull on air particles is strongest close to the Earth.
Activity 21. insolation2. See Figure 1.2.7 on page 24 of the Learner’s Book 3. convection – it circulates the heat4. Non-solar geysers are heated with electricity. Most of South Africa’s
electricity is generated at coal-burning power stations, which produce carbon emissions. Carbon emissions trap in the infrared heat that the Earth radiates – enhancing the greenhouse effect. Therefore solar geysers, which don’t use electricity, don’t contribute to the greenhouse effect.
Activity 31. saturated/ filled with water2. saturation3. decreases4. less than5. 100%6. dew or fog7. more8. higher
Activity 41. Geographical Information Systems2. storage, retrieval and analysis of data3. image-taking from a distance4. an X-ray or a satellite photograph5. Vector and Raster
© Cambridge University Press. You may photocopy this page for use with Study & Master Geography Grade 10.

63M O D U L E 2 • T H E AT M O S P H E R E : G E O G R A P H I C A L S K I L L S A N D T E C H N I Q U E S
6. A possible answer could include: Vector – uses points, nodes and represents rectangles; is considered more accurate but not for continuous data representation; Raster – uses pixels; is best suited to maps for whole or continuous spatial data such as forests, cultivated land or soil types; difficult to show line networks.
Activity 51. a) the weight of the air that presses down on the Earth
b) barometerc) hectopascalsd) isobars
2. a) 18 °Cb) 0 °Cc) none/cleard) 20 knotse) westerly
3. Winter. The map shows a cold front sweeping across the country. The maximum temperatures are low.
© Cambridge University Press. You may photocopy this page for use with Study & Master Geography Grade 10.

64 S E C T I O N 2 • L E S S O N - B Y - L E S S O N
MODULE 3Term 2Learner’s Book pages 86–140Duration: 24 hours
GEOMORPHOLOGY:
GEOGRAPHICAL KNOWLEDGE
This module focuses on geology – the study of rocks – and the theory of plate tectonics. Plate tectonics explains all sorts of fascinating changes in the Earth’s crust, for example, the change in the position and shape of the continents over millions of years and the spreading of the sea floor. It also explains large-scale features such as mid-ocean ridges and rift valleys; and phenomena such as earthquakes and volcanoes.
Curriculum and Assessment Policy Statement (CAPS)
The structure of the Earth• The internal structure of the Earth.• Classification of rocks – igneous, sedimentary, metamorphic.• The rock cycle.• Intrusive igneous activity and associated features – batholiths,
laccoliths, monoliths, dykes, sills, pipes.• Landforms associated with igneous, sedimentary, metamorphic
rocks.
Plate tectonics• Changes in the position of continents over time.• Evidence for the movement of continents over time.• Plate tectonics – an explanation for the movement of continents.• The mechanics of plate movements.• Processes and landforms associated with different kinds of plate
boundaries.• The world’s volcanic and earthquake zones.
Folding and faulting• The process of rock folding – link to plate movement.• Landforms associated with folding.• The process of faulting – link to plate movement.• Different types of faults.• Landforms associated with faulting, e.g. rift valleys and block
mountains.
Earthquakes• How and where earthquakes occur.• The relationship between earthquakes and tectonic forces.• Measuring and predicting earthquakes.• How earthquakes and tsunamis affect people and settlements –
differences in vulnerability.• Strategies to reduce the impact of earthquakes.• Case examples of the effects of selected earthquakes.

65M O D U L E 3 • G E O M O R P H O L O G Y : G E O G R A P H I C A L K N O W L E D G E
Volcanoes• Types of volcanoes – extrusive, intrusive, active, dormant, extinct.• Structure of volcanoes.• Impact of volcanoes on people and the environment – positive
and negative.• Case studies of different volcanic eruptions.
Key geographical skills • Using verbal, quantitative and symbolic data forms such as text, pictures,
graphs tables, diagrams and maps.• Practising field observation and mapping, interviewing people,
interpreting sources, working with statistics.• Applying communication, thinking, practical and social skills.• Practising the following specific skills:
– identifying questions and issues– collecting and structuring information – processing, interpreting and evaluating data – making decisions and judgements– deciding on a point of view– suggesting solutions to problems– working co-operatively and independently.
Key words/conceptsmantle; crust; silicate; continental crust; oceanic crust; igneous rock; magma; sedimentary rock; fossil; metamorphic rock; rock cycle; igneous intrusion; batholith; laccolith; lopolith; dyke; sill; volcanic pipe; weathering; erosion; tor; hogsback; cuesta; mesa; Pangea; Gondwanaland; continental drift; lithosphere; tectonic plate; divergent boundary; convergent boundary; transform fault boundary; mid-ocean ridge; sea-floor spreading; subduction; island arc; ocean trench; fold mountain; fault line; folding; anticline; syncline; faulting; normal fault; reverse fault/thrust fault; strike-slip fault; graben; horst; rift valley; block mountain; transform fault; earthquake; seismic wave; focus; epicenter; seismograph; seismogram; seismometer; Richter scale; moment scale; tsunami; volcano; lava; igneous extrusion; hot spot; shield volcano; stratovolcano/composite volcano; cinder cone; active volcano; dormant volcano; extinct volcano; vent, pipe; crater; caldera; lava lake; lava plateau; volcanic plug; geyser; hot spring
UNIT 1 The structure of the Earth
TERM 2, WEEKS 1–2
Learner’s Book pages 86–102Duration: 6 hours
Curriculum and Assessment Policy Statement (CAPS) contentThe structure of the Earth• The internal structure of the Earth.• Classification of rocks – igneous, sedimentary, metamorphic.• The rock cycle.• Intrusive igneous activity and associated features – batholiths, laccoliths,
monoliths, dykes, sills, pipes.• Landforms associated with igneous, sedimentary, metamorphic rocks.

66 S E C T I O N 2 • L E S S O N - B Y - L E S S O N
Resources• Learner’s Book pages 86–102• Activity 1: Hardboiled eggs, several sharp knives (and some salt and
pepper – learners can eat the eggs afterwards).• Activity 7: Resource books on rocks and some vinegar for testing for
calcite rocks, such as limestone.• Websites (optional)
– For a very good overview of all the content covered in this module: http://rst.gsfc.nasa.gov/Sect2/Sect2_1a.html
– A useful site for your learners that covers most of the content in this module; it includes an explanation on the Earth’s magnetic field: www.geography4kids.com/files/earth_intro.html
– This site is directed at UK learners and has good information on the rock cycle and types of rocks: www.geolsoc.org.uk/gsl/site/GSL/lang/en/rockcycle
– The University of Cape Town’s (UCT) Geology Department website has a photogallery section: web.uct.ac.za/depts/geolsci/photo_galleries.htm
– The University of KwaZulu-Natal (UKZN) has a good website. If you are in the KZN area, they have schools education programmes linked to their Science and Technology Education Centre: www.geology.ukzn.ac.za/StudyingGeology.html
– This page on the SANBI site gives information on the geology of Kirstenbosch and Table Mountain: www.sanbi.org/index.php?option=com_content&view=article&id=832&Itemid=511
– Books (optional): Your public library, especially the children’s section, is likely to have books on rocks. Look out for E.Explore: Rock and Mineral, by John Farndon, Dorling Kindersley (2005) – it’s a very helpful book with beautiful pictures.
• Rock samples (optional): If you are looking for a rock kit and are in KZN, the Science and Technology Education Centre at UKZN usually gives rock kits to teachers for free after they attended their rock box workshop. They have a limited stock of kits only. To arrange a workshop, contact the Science and Technology Education Centre by emailing [email protected] for details. They also offer posters in English and isiZulu for free.
Preparation• Read through the unit and familiarise yourself with the content that you
will need to teach. Think about what the learners may already know about the topics and any areas of difficulty that you think they might encounter.
• For Activity 1, ask each learner to bring a hardboiled egg to class unless you plan to supply the hardboiled eggs yourself.
Teaching the unit
Lesson 1
• Read through, or ask learners to read through, the Module 3 introductory paragraph on page 86. You can use it as the basis of an opening discussion to assess what learners already know.– Ask questions such as: What is the Earth made up of ? How many
main layers are there? Why does the Earth have a magnetic field/ magnetic poles?
– If necessary, write up and display the Key questions on the board for the duration of the module.

67M O D U L E 3 • G E O M O R P H O L O G Y : G E O G R A P H I C A L K N O W L E D G E
• Read through, or ask learners to read through, the Unit 1 introductory paragraph on page 87.
• Point out to learners that the focus in this module is the study of the Earth’s crust.
• Work through the section ‘What is the Earth like inside?’ (page 87). • As one of those useless, but fun facts, you could point out that the
pressure is so high at the centre of the Earth that if anyone were to reach it, they would be squashed to the size of a marble.
• Point out that minerals make up the Earth’s crust. Rocks are made up of grains of minerals.
• Point out that there are three main types of minerals: 1) Metals, such as gold, which occur in pure form; and iron which
occurs in combination with other minerals (as iron ore)2) Non-metals that occur in pure form, such as sulfur; and graphite and
diamond (which are both forms of carbon)3) Composite minerals that are mixtures of minerals – often metals
combined with non-metals. Examples are silicates (mixtures of silicon and oxygen) and gypsum (a mixture of calcium, which is a metal, sulfur and oxygen). Most of the Earth’s minerals are composites.
• Emphasise that continental crust consists mainly of granite; and that oceanic crust consists mainly of basalt. Also that oceanic crust, although thinner, is denser than continental crust.
Activity 1• Learners can do this activity in pairs or small groups, but it is more fun if
they can each work with an egg themselves.• Ask learners to wash their hands beforehand and/or work hygienically so
that they can eat their eggs afterwards.
Activity 2• This is a simple revision or summary activity on the layers of the Earth.
Lesson 2
• Begin the section, ‘What are the three main types of rocks and how do they form?’ (page 89)
• For ‘Igneous rock’ (page 89), emphasise that it can be divided into: – intrusive – which solidifies below the ground, cools slowly and
therefore forms large crystals, e.g. granite– extrusive – which solidifies above the ground, cools fast and therefore
forms fine crystals, e.g. basalt. This is volcanic rock.
Activity 3• This activity questions learners fairly thoroughly on igneous rocks. It
should help them form a good understanding of the different types of igneous rocks and the relationship between them.
• Work through the section, ‘Sedimentary rock’ (page 90).• Ask learners to begin looking for rock samples for a class rock collection
(see Activity 7).
Activity 4• Let learners complete this activity as homework. It is a simple revision
activity on types of sedimentary rock.

68 S E C T I O N 2 • L E S S O N - B Y - L E S S O N
Lesson 3
• Go through the answers for Activity 4 with the class.• Work through ‘Metamorphic rock’ (page 92). Note that gneiss is
pronounced ‘nice’.• Emphasise that the parent rock of metamorphic rock can be any type
of rock.• Focus on Figure 3.1.11 which shows contact metamorphism – how a
body of rock close to a magma intrusion can become metamorphic rock when it comes into contact with the heat.
Activity 5• This is a simple revision activity on types of metamorphic rock.
Activity 6• This activity helps learners summarise the different types of rock. If there
is not enough time for the learners to complete it in class, then let them do so for homework.
• Remind learners to look out for rock samples for the class rock collection for the next lesson (Activity 7). Ask learners to read the guidelines for Activity 7.
Lesson 4
• Work through the section, ‘How are rocks recycled?’ (page 94). • Talk learners through Figure 3.1.14, which shows the rock cycle.• Set learners to work on Activity 7 for the rest of the lesson. In this activity
they try to classify some of their rock samples.
Activity 7• Let learners use the rest of the lesson for this activity which requires
them to classify some of their rock samples.• Learners should work in small groups for this activity. They can continue
working on this activity in Lesson 5.• Be available to guide learners with their identifications by making
suggestions and offering clues where possible. Unless you have a strong geology background, it is unlikely that you yourself will be able to identify all the rock samples!
Activity 8• This activity helps learners summarise the rock cycle. Let the learners
complete it as homework.
Lesson 5
• Go through the answers for Activity 8 with the class.• Work through the section, ‘What is intrusive igneous activity?’ (page 95). • Ask learners for examples of intrusive rock – for example granite, gabbro
and dolerite.• Refer closely to Figure 3.1.16 which shows the different shapes of
the intrusions.
Activity 9• Point out to that in the pictures which they must use to identify the type
of intrusion, the darker rock is the igneous intrusion.
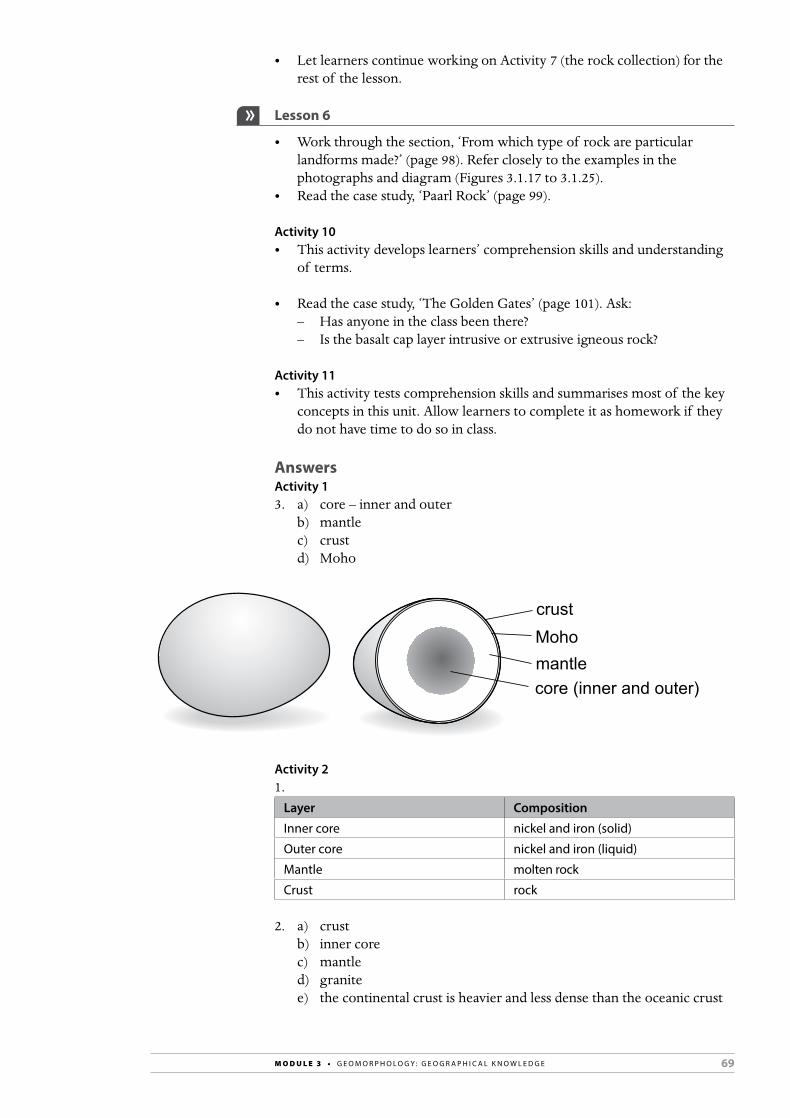
69M O D U L E 3 • G E O M O R P H O L O G Y : G E O G R A P H I C A L K N O W L E D G E
• Let learners continue working on Activity 7 (the rock collection) for the rest of the lesson.
Lesson 6
• Work through the section, ‘From which type of rock are particular landforms made?’ (page 98). Refer closely to the examples in the photographs and diagram (Figures 3.1.17 to 3.1.25).
• Read the case study, ‘Paarl Rock’ (page 99).
Activity 10• This activity develops learners’ comprehension skills and understanding
of terms.
• Read the case study, ‘The Golden Gates’ (page 101). Ask:– Has anyone in the class been there?– Is the basalt cap layer intrusive or extrusive igneous rock?
Activity 11• This activity tests comprehension skills and summarises most of the key
concepts in this unit. Allow learners to complete it as homework if they do not have time to do so in class.
AnswersActivity 13. a) core – inner and outer
b) mantlec) crustd) Moho
crustMohomantlecore (inner and outer)
Activity 21.
Layer Composition
Inner core nickel and iron (solid)
Outer core nickel and iron (liquid)
Mantle molten rock
Crust rock
2. a) crustb) inner corec) mantled) granitee) the continental crust is heavier and less dense than the oceanic crust

70 S E C T I O N 2 • L E S S O N - B Y - L E S S O N
Activity 31. • The grey parts are quartz
• The pink parts are feldspar• The black parts are mica
2. basalt3. pumice4. crystals are bigger than gabbro (it is medium-grained)5. crystals of rhyolite and basalt are smaller
Activity 41. pebbles (and sand) – conglomerate; clay – shale; sand – sandstone2. quartz3. calcite4. dolomite5. coal6. because the dead remains of plants and animals often end up in the layers
of sediment; OR sedimentary rock, unlike igneous rock is never molten. Hot molten rock would destroy the remains.
Activity 51. gneiss (is banded)2. The pale layers are quartz and feldspar. The grey layers are mica.3. shale4. No. It has been ‘cooked’ and changed its mineral structure.5. anthracite
Activity 61.
METAMORPHICIGNEOUS
Intrusive
basaltrhyolitepumice
SEDIMENTARY
Rock debris
coal
Banded
slate
cooked, pressurised rockformed from layers ofcompacted sediment
formed from magma(molten rock)
granitegabbrodolerite
Extrusive
sandstoneconglomerate
breccialimestone gneiss
quartzitemarble
anthracite
Dead living-matter
Non-banded
Note: The above diagram includes all three examples that were covered in the Learner’s Book. For the activity, learners can give any two of the three examples.
2. They are very hard-wearing. Slate and marble are both metamorphic. Granite has cooled slowly and it is very crystalline.

71M O D U L E 3 • G E O M O R P H O L O G Y : G E O G R A P H I C A L K N O W L E D G E
Activity 7The learners’ answers will depend on the rocks they collected.
Activity 8These are the labels for numbers 1–5 on the rock cycle diagram:1. weathering2. heat and pressure3. melting4. crystallisation5. uplift
Activity 91. A – sill; B - batholith; C – dyke2. the igneous rock (intrusions) is a dark-coloured rock
Activity 101. a geological feature, such as a mountain, that is made up of a single mass
of very hard rock – usually igneous or metamorphic2. a) Paarl Rock b) Uluru/Ayres Rock (it is sedimentary)3. Paarl Rock and Uluru have formed in very different ways. Paarl Rock
is part of a massive underground granite intrusion, whereas Uluru is sedimentary. Although they can both be classified as ‘monoliths’, they have very different origins.
Activity 111. Free State (1)2. i) c (1)
ii) b (1)3. all three rock types – igneous, sedimentary and metamorphic OR
five different types of rock in total (1)4. sandstone (1)5. basalt (1)6. sandstone (1)7. It formed from those sandstone layers that were in close contact with the
hot lava flow, which turned these layers into metamorphic rock. (1)[8]
Informal assessmentActivity 1• Go through the answers with the class. Ask learners to offer answers.
Activity 2• Write up the completed table on the board. Go through the answers to
Question 2 orally.
Activity 3• For Question 1, refer learners to the picture of granite in Figure 3.1.6
and point out the different minerals.• Go through the rest of the answers. Ask learners to offer answers.
Activity 4• Go through the answers with the class. Ask learners to offer answers.

72 S E C T I O N 2 • L E S S O N - B Y - L E S S O N
Activity 5• Go through the answers with the class. Ask learners to offer answers. • For Question 2, refer learners to the picture of gneiss in Figure 3.1.10
and point out the different minerals.
Activity 6• Write up the completed summary diagram on the board. Ask learners
to offer their answers to this and to Question 2.
Activity 7• Observe and guide learners as they work on identifying their
rock samples.• You can use this activity to informally assess:
– how well learners understand the different rock types– their ability to work co-operatively.
Activity 8• Write up the answers on the board.
Activity 9• Go through the answers with the class. Ask learners to offer answers.
Discuss the pictures with the class.
Activity 10• Go through the answers with the class. Ask learners to offer answers.
Activity 11• You can mark this activity according to the mark allocation given in
the Answers section. Use this activity to informally assess learners’ comprehension and provide feedback to them on whether they have grasped the concepts covered in this unit.
• Alternatively, ask learners to swap books with a partner and check each other’s work as you go through the answers with the class.
Consolidation/extensionConsolidation: • For learners who struggled with Activity 10, or need extra practice, ask
them to read the case study, ‘The Golden Gates’ (page 101) again and then let them complete Worksheet 8 (page 275) in the Resources section of this Teacher’s Guide.
Extension: • Encourage learners to look at some of the websites suggested in the
resources section. • Encourage learners to find and look at books on rocks – from the public
library, school library or home.• Let learners complete Worksheet 9 (pages 276–278) in the Resources
section of this Teacher’s Guide. It focuses on the different types of rocks and their formation.

73M O D U L E 3 • G E O M O R P H O L O G Y : G E O G R A P H I C A L K N O W L E D G E
UNIT 2 Plate tectonics
TERM 2, WEEKS 2–3
Learner’s Book pages 103–113Duration: 6 hours
Curriculum and Assessment Policy Statement (CAPS) contentPlate tectonics• Changes in the position of continents over time.• Evidence for the movement of continents over time.• Plate tectonics – an explanation for the movement of continents.• The mechanics of plate movements.• Processes and landforms associated with different kinds of plate boundaries.• The world’s volcanic and earthquake zones.
Resources• Learner’s Book pages 103–113• Activity 3: Hardboiled eggs (and some salt and pepper – learners can eat
the eggs afterwards).• Websites (optional)
– The following website gives an excellent overview on plate tectonics and the rest of the content covered in this module for you and advanced learners: http://platetectonics.com/book/index.asp
– For a simulation or animation of how continents have moved over the last 800 million years: www.enchantedlearning.com/subjects/astronomy/planets/earth/Continents.html
– For: ‘The Great Continental Drift Mystery’, an article on the evidence for continental drift – for you and advanced learners: www.yale.edu/ynhti/curriculum/units/1991/6/91.06.05.x.html
Preparation• Read through the unit and familiarise yourself with the content that you
will need to teach. Think about what learners may already know about the topics and any areas of difficulty that you think they might encounter.
• Unless you plan to supply the hardboiled eggs yourself, for Activity 3, ask each learner to bring a hardboiled egg to class.
Teaching the unit
Lesson 1
• Read through the Unit 2 introductory paragraph on page 103. • Gauge what learners already know about tectonic plates.• Emphasise that the theory of plate tectonics is relatively new. It became
mainstream scientific theory only in the 1960s.• Work through the section ‘What is continental drift?’ (page 103). • Focus on Figure 3.2.1 and draw attention to Pangea and Gondwanaland.
Talk about the origin of the names. Pangea means ‘all lands’ (refer learners to the Tip in their books) and Gondwanaland is named after a part of India (see Activity 1) – India was a part of Gondwanaland.
• You could also point out that:– the Earth is 4,5 billion years old– 1 billion years ago, the continents all formed another supercontinent
called Rhodinia– 200 million years from now, the continents will all come together again.

74 S E C T I O N 2 • L E S S O N - B Y - L E S S O N
Activity 1• This activity gets learners to focus on the maps in Figure 3.2.1 that show
the change in the position of the continents over time.• Let the learners complete this activity in class.
Lesson 2
• Work through the section ‘What is the evidence for continental drift?’ (page 104). It focuses on the father of plate tectonics, Alfred Wegener, and his strong supporter, South Africa’s own Alexander du Toit. Ask: Who has heard of either of these scientists before?
• Read the two features, ‘Mesosaurus – fossil evidence for continental drift’ (page 105) and ‘A South African’s contribution to continental drift’ (page 105).
• Spend a bit of time talking about fossils.• Point out that the climate of the Karoo has changed over time: it was
very cold, then a swamp, and now it is semi-desert.• Why was it once covered with glaciers? Ask learners to look at the map
of Pangea in Figure 3.2.1 and see how the region of the Karoo once lay in the polar circle. 320 to 270 million years ago, Gondwanaland, which was still part of Pangea at this stage, was over the South Pole.
• How did it become a swamp? As the glaciers began to melt at the end of the ice age, sea levels rose and flooded the land. It was covered with inland seas, swamps and deltas.
• Refer to the ‘basalt caps’ in ‘A South African’s contribution to continental drift’. Point out that dramatic volcanic activity took place about 183 million years ago and was on an enormous scale – there were huge outpourings of lava. The eruptions lasted about one million years. These are the same basalt outpourings that capped the Drakensberg (remind learners about the feature on ‘The Golden Gates’).
Activity 2• Point out that the two short articles are important as they contain
content information on the evidence for continental drift.
Lesson 3
• Work through the section, ‘What are tectonic plates?’ (page 106). • Draw attention to the map of tectonic plates in Figure 3.2.9. Point out
that this is a very important map which they’ll refer to many times during the course of the module.
Activity 3• If necessary, do this activity with the class as a demonstration, or talk
them through the steps of the activity and discuss the answers to the questions as they do it.
• Learners can do this activity in pairs or small groups, but it is more fun if they can each work with an egg themselves.
• Ask learners to wash their hands beforehand and/or work hygienically so that they can eat their eggs afterwards.
Activity 4• This activity gets learners to engage with the map of tectonic plates
in Figure 3.2.9.

75M O D U L E 3 • G E O M O R P H O L O G Y : G E O G R A P H I C A L K N O W L E D G E
• If there is not enough time, learners can complete this activity for homework.
Lesson 4
• If Activity 4 was completed for homework, go through the answers with the class.
• Work through the section, ‘Why do the plates move?’ (page 107). – Refer learners again to the map of tectonic plates in Figure 3.2.9 and
point out the key to the plate boundaries – divergent, convergent and transform fault.
Activity 5• This quick activity may only be necessary for those learners who need
help with understanding the different types of plate boundaries. Or you can do this activity as a demonstration by holding up pieces of paper against the board.
• Work through the section, ‘What happens when the plates move?’ (page 108).
• Draw attention to Figure 3.2.13 which summarises the features of divergent and convergent plate boundaries. Point out that this is another important diagram in this module.
Activity 6• This activity gets learners to engage with the diagram in Figure 3.2.13.
The diagram is important because it gives an overview of what happens at divergent and convergent plate boundaries.
Lesson 5
Activity 7• Read the case study, ‘Iceland and the Mid-Atlantic Ridge’ (page 110).• Let learners work in pairs to answer questions on an example of a mid-
ocean ridge, which forms at divergent ocean-to-ocean plate boundaries.
Activity 8• Read the case study, ‘The Mariana Trench in the Pacific’ (page 111).• Let learners complete this activity individually. In it, they answer
questions on an example of a deep sea trench, which forms at divergent ocean-to-continent plate boundaries.
• If there is not enough time, learners can do or complete this activity for homework.
Lesson 6
• If Activity 8 was completed for homework, go through the answers with the class.
• Work through the section, ‘Where are the world’s volcanic and earthquake zones?’ (page 112).
Activity 9• Read the case study, ‘The Pacific Ring of Fire’ (page 113).• The main purpose of this activity is for learners to link the pattern of the
Pacific Ring of Fire to the pattern of convergent and fault boundaries in the Pacific.

76 S E C T I O N 2 • L E S S O N - B Y - L E S S O N
AnswersActivity 11. Continental drift is the slow movement of the continents relative to each
other over time.2. Pangea3. South America, Africa, Antarctica, Australia (also Sri Lanka)4. North America, Europe and Asia5. Tethys Sea6. 5 km7. a) 225 million years (refer to Figure 3.2.1 – the Permian period);
b) 11,5 cm per million years (2 580 km ÷ 225 million years)
Activity 21. Sri Lanka2. Mesosaurus3. Glossopteris4. a) tillite
b) coalc) dune deposits
Activity 31. a) The shell and thin membrane represent the tectonic plates.
b) The egg white represents the mantle.
Activity 41. 62. North American Plate, South American Plate, Eurasian Plate, African
Plate, Indo-Australian Plate, Antarctic Plate3. continental crust and oceanic crust4. Pacific Plate5. North American Plate, South American Plate, Eurasian Plate, African Plate6. Arabian Plate7. San Andreas Fault; Los Angeles lies on the Pacific Plate, not the North
American Plate
Activity 5
Divergent Convergent Transform
Activity 61. divergent – ocean (2) divergent – continent (2) convergent – ocean-to-continent (2) convergent – ocean-to-ocean (2)

77M O D U L E 3 • G E O M O R P H O L O G Y : G E O G R A P H I C A L K N O W L E D G E
2. a) in the ocean (1) b) heavier (1)c) made (1)d) melted down (1)e) newer (1) [13]
Activity 71. North American Plate and Eurasian Plate 2. The pattern of the Ridge matches the pattern of the divergent
boundary line.3. As two ocean plates move apart, magma rises from the Earth’s mantle
to form new crust. The magma eruptions form a chain of underwater mountains – a mid-ocean ridge.
4. a) sea-floor spreadingb) yesc) The tectonic plates that carry the continents that are on either side of
the Atlantic Ocean are moving away from each other.
Activity 81. a convergent ocean-to-continent boundary2. Philippine Plate (ocean) and Eurasian Plate (continent)3. Philippine Plate4. the Philippines and Japan
Activity 92. Pattern of the plate boundaries: The line of volcanic activity matches the
convergent boundaries and transform fault boundaries.3. Pacific Plate and North American Plate; Cocos Plate, Nacza Plate and
South American Plate4. by the Nacza Plate converging with or pushing against the South
American Plate 5. (2) Pattern of the plate boundaries: The line of volcanic activity matches
the convergent boundaries and transform fault boundaries. (3) Indo-Australian Plate and Pacific Plate; Philippine Plate and Pacific Plate; Okhotsk Plate and Pacific Plate
6. Pacific, Okhotsk, Philippine, Indo-Australian, North American, Cocos, Nacza, South American
7. a) 11b) i) ocean-to-continent ii) subduction zone
Informal assessmentActivity 1• Ask learners to swap books with a partner and check each other’s work as
you go through the answers with the class.
Activity 2• Ask learners to swap books with a partner and check each other’s work as
you go through the answers with the class.

78 S E C T I O N 2 • L E S S O N - B Y - L E S S O N
Activity 3• Informally assess learners’ understanding of the concept of tectonic
plates as you talk the class through this activity. You can gauge understanding by any questions learners ask.
Activity 4• Go through the answers with the class. Ask learners to offer answers.
Activity 5• If learners do this activity themselves, check to see that they have got the
concept of divergent, convergent and transform fault boundaries. Then demonstrate, holding the pieces of paper up against the board so that learners can see if they did it correctly.
Activity 6• You can mark this activity according to the mark allocation given in the
Answers section. Use this activity to informally assess and give learners’ feedback on their understanding of tectonic plate boundaries and general processes.
• Alternatively, you could ask learners to swap books with a partner and check each other’s work as you go through the answers with the class.
Activity 7• Go through the answers with the class. Ask learners to offer answers.
Activity 8• Go through the answers with the class. Ask learners to offer answers.
Activity 9• Go through the answers with the class. Ask learners to offer answers.
Consolidation/extensionConsolidation: • For learners who struggled with Activity 6, ask them complete the
table in Worksheet 10 (page 279) in the Resources section of this Teacher’s Guide.
• Learners who require more practice with the concepts in Unit 2 could complete Worksheet 11 (page 280) in the Resources section of this Teacher’s Guide.
Extension: • Get learners fired up to find out more about the geology (rocks and
mountains) of their area. Two helpful books are:– Geological Journeys, by Nick Norman and Gavin Whitfield (Struik)
is a general book for the whole of South Africa, but quite advanced.– The Rocks and Mountains of Cape Town, by John S Compton (Double
Storey) is suitable for learners in Cape Town.• Let the learners complete Worksheet 12 (pages 281–282) in the Resources
section of this Teacher’s Guide. The worksheet gives learners a sense of geological time and an overview of South Africa’s geology. It also gives learners practice in applying their knowledge on the different types of rocks (Unit 1).

79M O D U L E 3 • G E O M O R P H O L O G Y : G E O G R A P H I C A L K N O W L E D G E
UNIT 3 Folding and faulting
TERM 2, WEEK 4
Learner’s Book pages 114–121Duration: 4 hours
Curriculum and Assessment Policy Statement (CAPS) contentFolding and faulting• The process of rock folding – link to plate movement.• Landforms associated with folding.• The process of faulting – link to plate movement.• Different types of faults.• Landforms associated with faulting, e.g. rift valleys and block mountains.
Resources• Learner’s Book pages 114–121• Websites (optional)
– This website includes a very good section on folding and faulting: http://rst.gsfc.nasa.gov/Sect2/Sect2_1a.html
– This site also has good information on folding and faulting, as well as simple animations of the three different types of fault: www.physicalgeography.net/fundamentals/10l.html
– For a simple summary on folding and faults for learners: www.geography4kids.com/files/earth_intro.html
– For a slideshow that has some lovely photos of rock folds from slide 26 onwards: www.wiziq.com/tutorial/9182-Fold-Structure
– For more excellent photos of rock folds and faults: http://ualberta.ca/~jwaldron/gallerypages/folds.html and http://ualberta.ca/~jwaldron/gallerypages/faults.html
– This PDF has useful and interesting information on mountains, including volcanic mountains (which are covered in Unit 4): http://facstaff.unca.edu/ahuang/2011_Spring/atms379/chapter_2b_mountain_environment.pdf
– For some good photos of folds and faults: www.geology.wisc.edu/~chuck/Classes/Mtn_and_Plates/rock_deformation.html
– For information on the San Andreas Fault: http://platetectonics.com /book/page_15.asp
Preparation• Read through the unit and familiarise yourself with the content that you
will need to teach. Think about what learners may already know about the topics and any areas of difficulty that you think they might encounter.
• If you choose to do the Lesson 1 extension activity, and have access to computers, book computer time for this lesson. Check that the slideshow is still available online.

80 S E C T I O N 2 • L E S S O N - B Y - L E S S O N
Teaching the unit
Lesson 1
• Read through, or ask learners to read through, the Unit 3 introductory paragraph on page 114. Emphasise that:– A fold is a bend/ buckle in the rock or crust– A fault is a break/crack in the rock or crust.
• Work through the section ‘What is the process of rock folding?’ (pages 114–115).
• Demonstrate folding, or ask learners to demonstrate folding, by pushing together two ends of a piece of paper.
• Draw attention to the different types of folding patterns shown in Figure 3.3.1. Point out that:– Synclines are troughs and anticlines are domes.– Symmetrical folds have sides or limbs with similar dips.– Asymmetrical folds have one side or limb much steeper than the other.– Isoclinal folds are very tight folds – the limbs are almost parallel to
one another.– In overturned folds, the fold axis is at an angle, it is not vertical, as it is
in a symmetrical fold. The fold axis is an imaginary line through the centre of a fold.
– Heavily overturned folds are recumbent folds; the folds lie on their sides.– Chevron folds are pointed folds; most other fold types are rounded.
Activity 1• This is a revision-type activity on the different fold types.• If you are doing the extension activity (see the Extension section,
page 81 in this guide), set learners at computers to look at the photos of rock folds. If you have a computer projection system with Internet connection, you can present photos to the class as a slide show.
Lesson 2
• Work through the section ‘Which landforms are associated with fold mountains?’ (page 115).
• Focus on the map of the world’s fold mountains in Figure 3.3.5. Learners should be familiar with some of these mountain ranges. Before they look at the map, you could ask them to close their books and have a class quiz. For example: Can you name the fold mountains in North Africa?
Activity 2• In this activity, learners classify fold mountains of the world as old or new.
Activity 3• Read the case studies, ‘How the Cape Fold Mountains formed’ and
‘How the Himalayan Mountains formed’ (page 117).• Let learners work in pairs to complete the questions.
Lesson 3
• Begin the section, ‘How do faults form?’ (page 118).• Remind learners that a fault is a break/crack in rock or the Earth’s crust.• Work through ‘Types of fault’ (page 118) and refer learners to Figure
3.3.9 which illustrates these.• Emphasise that a reverse fault (also called a thrust fault) is the opposite of
a normal fault.
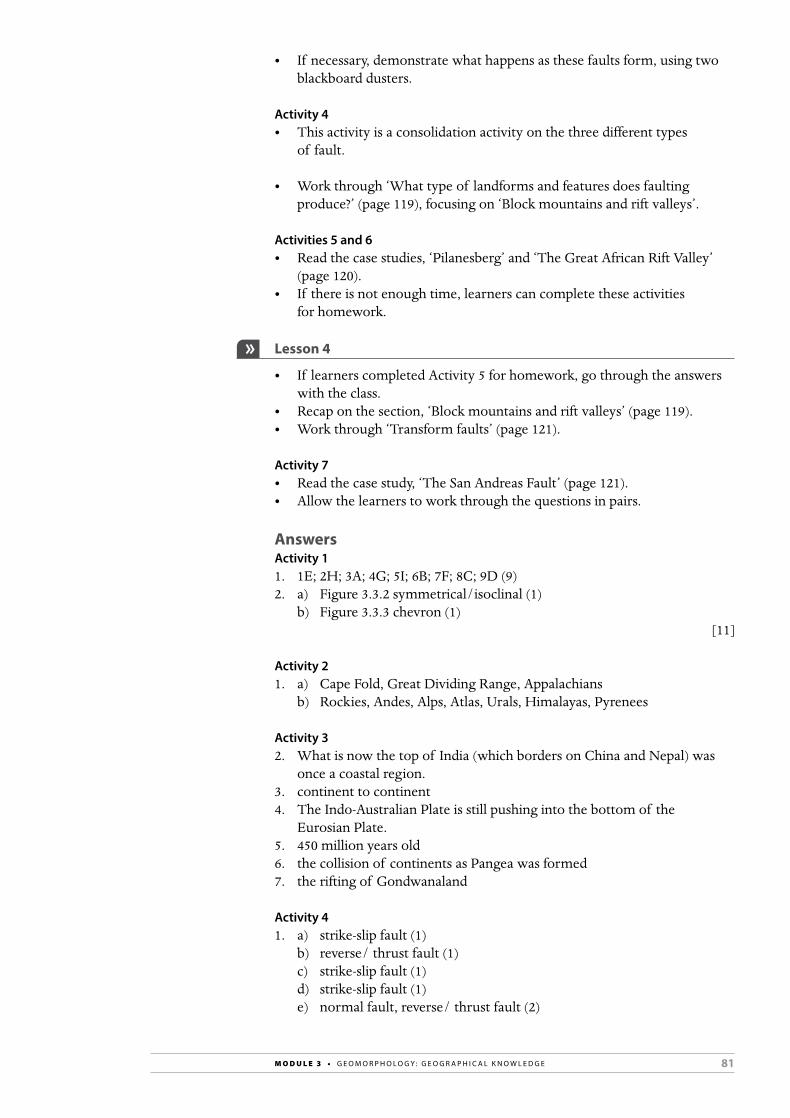
81M O D U L E 3 • G E O M O R P H O L O G Y : G E O G R A P H I C A L K N O W L E D G E
• If necessary, demonstrate what happens as these faults form, using two blackboard dusters.
Activity 4• This activity is a consolidation activity on the three different types
of fault.
• Work through ‘What type of landforms and features does faulting produce?’ (page 119), focusing on ‘Block mountains and rift valleys’.
Activities 5 and 6• Read the case studies, ‘Pilanesberg’ and ‘The Great African Rift Valley’
(page 120).• If there is not enough time, learners can complete these activities
for homework.
Lesson 4
• If learners completed Activity 5 for homework, go through the answers with the class.
• Recap on the section, ‘Block mountains and rift valleys’ (page 119).• Work through ‘Transform faults’ (page 121).
Activity 7• Read the case study, ‘The San Andreas Fault’ (page 121).• Allow the learners to work through the questions in pairs.
AnswersActivity 11. 1E; 2H; 3A; 4G; 5I; 6B; 7F; 8C; 9D (9)2. a) Figure 3.3.2 symmetrical/isoclinal (1)
b) Figure 3.3.3 chevron (1)[11]
Activity 21. a) Cape Fold, Great Dividing Range, Appalachians
b) Rockies, Andes, Alps, Atlas, Urals, Himalayas, Pyrenees
Activity 32. What is now the top of India (which borders on China and Nepal) was
once a coastal region.3. continent to continent4. The Indo-Australian Plate is still pushing into the bottom of the
Eurosian Plate.5. 450 million years old6. the collision of continents as Pangea was formed7. the rifting of Gondwanaland
Activity 41. a) strike-slip fault (1)
b) reverse/ thrust fault (1)c) strike-slip fault (1)d) strike-slip fault (1)e) normal fault, reverse/ thrust fault (2)

82 S E C T I O N 2 • L E S S O N - B Y - L E S S O N
2. A normal or reverse/thrust (one can’t tell which of the two it is from the limited view in the photo);
B strike-slip (2) [8]
Activity 51. normal faulting2. Somalian Plate3. rift valleys and block mountains4. Ruwenzori – Uganda; Mitumba – Burundi and the Democratic Republic
of Congo
Activity 61. California, USA2. strike slip/transform fault3. Pacific Plate (left) and North American Plate (right)4. The Pacific Plate is moving north and turning anti-clockwise.
Informal assessmentActivity 1• Ask learners to swap books with a partner and check each other’s work
as you go through the answers with the class.• If you choose, you can ask learners to mark their partner’s answers
according to the mark allocation given in the Answers section. Ask those learners who got less than 9/11 to do the consolidation activity (see page 81).
Activity 2• Go through the answers with the class. Ask learners to offer answers.
Activity 3• Go through the answers with the class. Ask learners to offer answers.
Activity 4• Ask learners to swap books with a partner and check each other’s work
as you go through the answers with the class.• If you choose, you can ask learners to mark their partner’s answers
according to the mark allocation given in the answers section. Ask those learners who got less than 6/8 to do the consolidation activity (see page 81).
Activity 5• Go through the answers with the class. Ask learners to offer answers.
Activity 6• Go through the answers with the class. Ask learners to offer answers.
Activity 7• Go through the answers with the class. Ask learners to offer answers.

83M O D U L E 3 • G E O M O R P H O L O G Y : G E O G R A P H I C A L K N O W L E D G E
Consolidation/extensionConsolidation: • Let learners who struggled with Activity 1 and/or Activity 4, complete
Worksheet 13 (pages 283–284) in the Resources section of this Teacher’s Guide. This activity is also useful practice for all learners. Learners can do it in a revision lesson or for homework.
Extension: • You can extend Lesson 1 by allowing learners to spend some time
looking at rock fold photos on www.wiziq.com/tutorial/9182-Fold-Structure, from slide 26 onwards, or http://ualberta.ca/~jwaldron/gallerypages/folds.html
• Extend Lesson 3 by giving the following website address for photos of faults: http://ualberta.ca/~jwaldron/gallerypages/faults.html. Or, if you have a computer projection system with Internet connection, you can present photos to the class as a slide show.
• Extend Lesson 4 by printing out one or more copies of the following PDF and allowing learners to browse through the pages for enrichment: http://facstaff.unca.edu/ahuang/2011_Spring/atms379/chapter_2b_mountain_environment.pdf.
UNIT 4 Earthquakes
TERM 2, WEEK 5
Learner’s Book pages 122–131Duration: 4 hours
Curriculum and Assessment Policy Statement (CAPS) contentEarthquakes• How and where earthquakes occur.• The relationship between earthquakes and tectonic forces.• Measuring and predicting earthquakes.• How earthquakes and tsunamis affect people and settlements –
differences in vulnerability.• Strategies to reduce the impact of earthquakes.• Case examples of the effects of selected earthquakes.
Resources• Learner’s Book pages 122–131• Websites (optional)
– This website has a good page on earthquakes: http://platetectonics.com/book/index.asp
– An excellent overview for learners on measuring and predicting earthquakes: http://en.wikibooks.org/wiki/High_School_Earth_Science/Measuring_and_Predicting_Earthquakes
– A 2-page PDF, ‘Locating, measuring and predicting earthquakes – how do we do it?’ http://scearthquakes.cofc.edu/educators/factsheets/SCEEPFactSheets_5.pdf
– A comprehensive PDF factsheet on earthquakes and a list of earthquake events: http://www.geolsoc.org.uk/webdav/site/GSL/shared/pdfs/education%20and%20careers/Earthquakes-fact-sheet. A PDF with a section that focuses on earthquakes in the UK.
– For more information for you or learners on seismic waves: http://www.proofofconcepts.com/webtextbook/earth_internal_processes/

84 S E C T I O N 2 • L E S S O N - B Y - L E S S O N
earthquakes/calcepicnt.htm (Note: the Virtual Earthquake Lab link doesn’t seem to work)
– The US Geological Survey website has up-to-date information on seismic events: http://earthquake.usgs.gov
– An animation on earthquakes with an overview of the Earth’s structure: www.youtube.com/watch?v=30SFfPvcss0
– A short documentary feature that shows the effects of earthquake tremors: www.youtube.com/watch?v=CtBXTvtFaCU&NR= 1&feature=fvwp
– Animations of how a tsunami forms: www.youtube.com/watch?v=4Xebwzb3dDE&feature=related or http://science.howstuffworks.com/nature/natural-disasters/tsunami3.htm
– A simulation of the wave pattern effect of the Indian Ocean tsunami: www.youtube.com/watch?v=IC4xWwZ60BE&feature=related
– Footage of flood effect of 2011 tsunami in Japan: www.youtube.com/watch?v=TGYJpGkFoW8&NR=1&feature=fvwp
Preparation• Read through the unit and familiarise yourself with the content that you
will need to teach. Think about what learners may already know about the topics and any areas of difficulty that you think they might encounter.
• Over the year, collect newspaper cuttings about earthquakes events or source newspaper articles on the Internet on past earthquakes (for future lessons).
Teaching the unit
Lesson 1
• Read through, or ask learners to read through, the Unit 4 introductory paragraph on page 122. As a class, brainstorm recent or past earthquake events.
• Work through the section, ‘What causes an earthquake?’ (page 122).• Focus on the key terms: seismic wave, focus and epicentre.• Work through the section, ‘How are earthquakes linked to plate
tectonics?’ (page 122).• Ask learners to look at the maps of the world’s volcanoes (page 113) and
the Pacific Ring of Fire (page 113) again.
Activity 1• Read the case study ‘South Africa measures four earthquakes’ (page 123).• If there is not enough time, learners can do or complete this activity
for homework.
Lesson 2
• If learners completed Activity 2 for homework, go through the answers with the class.
• Work through the section, ‘How are earthquakes measured?’ (page 124).• Emphasise the difference between a seisomograph and a seismogram. It’s
easy to mistake a seisomograph for being a plot of an earthquake.• You can point out that P-waves are primary and S-waves are secondary
waves. S-waves are the destructive waves.

85M O D U L E 3 • G E O M O R P H O L O G Y : G E O G R A P H I C A L K N O W L E D G E
• Work through ‘The measurement scale’ (page 125). Emphasise that the Richter scale is no longer used and explain why. Unlike the moment scale, it measures only the size of the jolt and not the length or duration of the jolt. Refer learners to Figure 3.4.6 to get a sense of the scale.
• Work through the section, ‘How are earthquakes predicted?’ (page 125).
Activity 2• Read the case study: ‘Predicting earthquakes – hit and miss’ (page 126).• This activity summarises some aspects of measuring and predicting
earthquakes.
Lesson 3
• Work through the section, ‘How do earthquakes and tsunamis impact on people and the environment?’ (page 127).
• Briefly talk about tsunami incidents learners may know of – for example, the 2004 Indian Ocean tsunami and the 2011 Pacific Ocean tsunami in Japan.
• Read the feature: ‘A geography lesson saves lives’ (page 127) and talk about the warning signs of a tsunami.
Activity 3• Read the case studies: ‘The Indian Ocean Tsunami of 2004’ (page 128)
and ‘2010 earthquake in Haiti’ (page 129).• This works well as a class or group discussion activity.
Lesson 4
• Work through the section ‘How can the impact of earthquakes be reduced?’ (page 130).– Point out, for example, that people in countries like Japan are
generally well-prepared for earthquakes. Learners are drilled to take refuge under their desks if an earthquake strikes in class.
Activity 4• Learners can do this activity on their own or in pairs. The activity gives
them practice in working with data.• If necessary, talk learners through the information Table 3.4.1 beforehand.
Activity 5• Read the feature, ‘The Milnerton Fault, Cape Town’ (page 131). Discuss
how prepared Cape Town is for an earthquake and lead a brief class discussion. Refer learners to the section headed ‘How can the impact of earthquakes be reduced?’ on page 130 as a reference.
AnswersActivity 11. focus – the focus is the point underground at which the earthquake takes
place (whereas the epicentre is the point at the surface)2. Human activity such as mining, deep drilling and dam building can cause
earthquakes. Mining and deep drilling creates gaps and spaces in the rock. This weakens the rock and means that it can give way under pressure. The weight of the water in a dam can relax the tension in a fault, making it possible to move further apart.
3. South Africa does not lie on any tectonic plate boundaries.4. natural (due to an ancient fault line)

86 S E C T I O N 2 • L E S S O N - B Y - L E S S O N
Activity 21. a scientist who studies earthquakes2. the shocks or tremors that often come before the main shock or
earthquake3. the old scale for measuring the size of an earthquake; it goes from 0 to 10 4. It is costly and disruptive. It requires personnel to organise and carry out
the evacuation, transport, temporary shelter to house people, and so on.
Activity 32. Haiti is a developing country. Many of its inhabitants are poor.4. Here is an example mind-map.
impact ofearthquakes
tsunami
damages settlements/homes, buildings and
infrastructure
if underseabed
drowns peopleand animals
damagescoastal
ecosystems
people lose their homes
people arekilled and
injured
collapsed buildingsand structures a lot of rubble thathas to be cleared
water suppliesare damaged orcontaminatedoutbreak ofwater-borne
diseases, e.g cholera
Activity 41. The 2010 Haiti earthquake (1); the 2008 Sichuan earthquake, China (1);
the 2004 earthquake off the West Coast of Northern Sumatra (1)2. The 2004 earthquake off the West Coast of Northern Sumatra (1)3. The 2006 Kuril Islands earthquake and the 2003 Hokkaido earthquake,
Japan; both magnitude 8.3 (3)4. The 2008 Sichuan earthquake, China (1); the 2004 earthquake off the
West Coast of Northern Sumatra (1)5. Average magnitude = 8.39 (3); total fatalities = 317 660 (3)
The average is calculated like this: (8.8 + 8.1 + 7.9 + 8.5 + 8.3 + 8.6 + 9.1 + 8.3 + 7.9 + 8.4) ÷ 10 The total is calculated like this: 507 + 192 + 87 587 + 25 + 0 + 1 313 + 227,898 + 0 + 0 + 138
6. Average magnitude = 7.38 (3); total fatalities = 677 819 (3) The average is calculated like this: (7.0 + 7.5 + 7.9 + 8.0 + 6.3 + 7.6 + 9.1 + 6.6 + 6.1 + 7.7) ÷ 10 The total is calculated like this: 222 570 + 1 117 + 87 587 + 514 + 5 749 + 80 361 + 227 898 + 31 000 + 1 000 + 20 023
7. It depends where the earthquake takes place:• If it is in an isolated place, it may not kill people. (2)• Developing countries are more vulnerable/ usually more badly
affected. For example, informal structures collapse more easily and recovery operations require money and infrastructure. (2)

87M O D U L E 3 • G E O M O R P H O L O G Y : G E O G R A P H I C A L K N O W L E D G E
8.
0 50 000 100 000 150 000 200 000 250 000
Five earthquakes with the highest death tolls
Fatalities
Northern Sumatra
Haiti
Sichuan
Pakistan
Iran
This graph has fatalities on x-axis and countries on y-axis. Learners may also plot fatalities on y-axis and countries on x-axis.
Assign 10 marks for the bar graph as follows:• heading (1)• labeling of x-axis with something like ‘Fatalities’ or ‘Numbers dead’ (1)• numbers along x-axis (1)• correct use of scale (1)• labeling of y-axis with names of countries (1)• each bar correctly plotted per country, plotting can be approximate (5)
[25]
Activity 5One could argue that Cape Town is partly prepared for an earthquake because:• the risk of an earthquake taking place has been assessed• there are building regulations in place that specify that new buildings
must be built with high-strength concrete that can withstand earthquakes.
One could argue that Cape Town is not prepared for an earthquake because:• most of the city’s buildings are not built or engineered to withstand
earthquakes• the informal settlements on the Cape Flats are very vulnerable to
earthquakes• residents do not have experience of an earthquake and have not been
drilled in preparation.
Informal assessmentActivity 1• Go through the answers with the class. Ask learners to offer answers.
Activity 2• Go through the answers with the class. Ask learners to offer answers.
Activity 3• Draw an example of the mind-map on the board which learners can use
to assess whether their own mind-maps were comprehensive.

88 S E C T I O N 2 • L E S S O N - B Y - L E S S O N
• Alternatively, you can construct a mind-map on the board as learners offer answers.
Activity 4• You can mark this activity, or just the bar graph (Question 8), according
to the mark allocation given in the Answers section. Use this activity to informally assess learners’ graph drawing skills and their ability to work with data. Give them feedback on these areas.
• Alternatively, go through the answers with the class. Ask learners to offer answers. Draw the bar graph on the board so that learners can compare their own graphs with this.
Activity 5• Monitor learners’ contributions to the class discussion and look for
evidence of the application of geographical knowledge about earthquakes.
Consolidation/extensionConsolidation: • For learners who struggled with Activity 4, ask them to plot a bar graph
of the magnitude of the 10 deadliest earthquakes, beginning with 2001 and ending with 2010.
• Their graph should look similar to this (which has been plotted with magnitude on x-axis and countries on y-axis, but it’s just as good to plot this the other way around):
0 1 2 3 4 5 6 7 8 9 10
Deadliest earthquakes 2001–2010
Magnitude
Haiti
Southern Sumatra, Indonesia
Eastern Sichuan, China
Near the coast of central Peru
Java, Indonesia
Pakistan
Off west coast of northern Sumatra
Southeastern Iran
Hindu Kush region
Haiti
20102009
20082007
20062005
20042003
20022001
Extension: • You can extend Lesson 3 by giving learners the website addresses for
some of the animations and videos listed under the Resources section, or if you have a computer projection system with Internet connection, you can show some of these to the class. You could also suggest they look at these for homework.
• Recommend some of the websites to learners that are listed under the Resources section above.

89M O D U L E 3 • G E O M O R P H O L O G Y : G E O G R A P H I C A L K N O W L E D G E
UNIT 5 Volcanoes
TERM 2, WEEK 6
Learner’s Book pages 132–140Duration: 4 hours
Curriculum and Assessment Policy Statement (CAPS) contentVolcanoes• Types of volcanoes – extrusive, intrusive, active, dormant, extinct.• Structure of volcanoes.• Impact of volcanoes on people and the environment – positive and
negative.• Case studies of different volcanic eruptions.
Resources• Learner’s Book pages 132–140• Activity 3: You will need materials such as plasticine (which is expensive),
or play dough (see recipe on page 264), or papier mâché (see recipe on page 264) and paints, unless learners do this activity at home.
• Websites (optional) – For a map of the Decade Volcanoes, as well as a feature article,
‘Living with volcanoes’: http://ngm.nationalgeographic.com/2008/01/volcano-culture/decade-volcano-map-interactive
– For general information and features on the Decade Volcanoes: http://www.sciencedaily.com/articles/d/decade_volcanoes.htm
– This page on the US Geological Survey website gives general information on the Hawaiian hot spot volcanoes; there are other pages that feature some of the important Hawaiian volcanoes and give details of hazards: http://hvo.wr.usgs.gov/volcanoes
– On the Greek volcanic island Santorini, see the introduction and the section ‘Volcanic eruptions’: http://en.wikipedia.org/wiki/Santorini#Volcanic_eruptions
– On the Indonesian volcanic island of Krakatoa: http://en.wikipedia.org/wiki/Krakatoa
• Books (optional):– Krakatoa: The Day the World Exploded, by Simon Winchester. This is a
good read for you or learners who are advanced readers of English.– Planet Earth: Volcano (Time-Life Books). This is an old book
(1982/1989), but it has some excellent information and exciting features on volcanic eruptions. You might be able to get a copy at the public library or at a second-hand bookshop.
Preparation• Read through the unit and familiarise yourself with the content that you
will need to teach. Think about what learners may already know about the topics and any areas of difficulty that you think they might encounter.
• Over the course of the year, collect newspaper cuttings about volcanic eruptions (for future lessons).
• For Activity 3 (optional), you might need to prepare play dough and papier mâché (see the recipes in the Resources section).
90 S E C T I O N 2 • L E S S O N - B Y - L E S S O N
Teaching the unit
Lesson 1
• Read through, or ask learners to read through, the Unit 5 introductory paragraph on page 132.
• You can begin with a brainstorming session, asking learners to name well-known volcanic mountains or volcanic islands.
• Point out that islands are divided into:– continental islands – islands that sit on the continental shelf (these are
always close to a continent), and – oceanic islands – islands that are not on the continental shelf, but often
in the middle of the ocean (unless they are at an ocean-to-continent convergent boundary). Most of these oceanic islands are volcanic.
• Work through the section, ‘What makes a volcano?’ (page 132). Ask learners to offer answers to this question to assess what they already know.
• Work through the section, ‘Where do volcanoes form?’ (page 133).• Make sure learners turn back to the map of the world’s volcanoes in
Figure 3.2.18 on page 113.• Focus on the list of volcanic features or activity at subduction zones and
rift zones. Figure 3.5.2 is a repeat of Figure 3.2.13. Remind learners that this is an important overview diagram.
• Emphasise that the three types of volcanic islands are: volcanic island arcs, ocean rift volcanic islands and volcanic hot spot islands.
• Point out, for interest’s sake, that an atoll is formed from a coral reef that has grown on an eroded, sunken volcanic island (in other words, a submarine volcanic island). The Maldives is a famous series of atolls.
Activity 1• Read the case study, ‘The origin of the Hawaiian Islands’ (page 134). • For other hot spot island examples (2a), learners are given the South
Atlantic Ocean as a clue for Tristan da Cunha. As a clue for the Maldives, ask them to look in an atlas just north of the equator in the Indian Ocean.
Lesson 2
• Work through the section, ‘What types of volcanoes are there?’ (page 135).
• Focus learners’ attention on Figure 3.5.7 which shows examples of each of the three types of volcano.
• Work through these terms – active, dormant and extinct. Learners should be able to work out their meanings. Point out that dormant means ‘at rest or sleeping’.
• Read the feature, ‘The Prince Edward Islands are shield volcanoes’ (page 135).
Activity 2• This activity focuses on a shield volcano example and reinforces some
terms.• Let learners complete the activity in pairs.
• Work through the section, ‘What is the structure of the stratovolcano?’ (page 136).
• Let learners begin planning their models for Activity 3, or you can ask them to do this as a homework project.

91M O D U L E 3 • G E O M O R P H O L O G Y : G E O G R A P H I C A L K N O W L E D G E
Lesson 3
Activity 3• This activity will reinforce the structure of a composite volcano/
stratovolcano.• If learners use ready-made play dough, it will be quick for them to make
simple models.• You could also save this activity for a later stage – for if and when there is
lesson time to fill or as a revision activity.
• Go through the section, ‘Which features or landforms do volcanoes produce?’ (page 136).
Activity 4• This is a quick activity in which learners identify volcanic features
and landforms.
• Begin the section, ‘How do volcanoes impact on people and the environment?’ (page 137).
Lesson 4
• Read the three case studies, ‘Mount St Helens blows its top’ (page 138), ‘Eyjafjallajökull erupts and disrupts air travel and air freight’ (page 138) and ‘The Decade Volcanoes and Mount Nyiragongo’ (page 139).
Activity 5• Set Activity 5 for homework. (Make a note to go through the answers with
the class in the next lesson, or take in learners’ books to mark this activity.)• This is a small revision type activity based on two of the features.
Activity 6• This activity is based on the three features.• It is a class discussion activity that needs your participation. You need
to facilitate the discussion and construct or help with the construction of the mind-map on the board. Refer learners to the list of some of the negative effects of volcanoes on page 137 as a reference/ starting point. Ask learners to try to identify some of these effects in the features.
AnswersActivity 11. a place of high volcanic activity, not usually at a plate boundary2. They formed as the Pacific Plate has slowly moved over the hot spot.3. Nihue4. Big Island/ Hawaii5. The Tristan da Cunha group (in the South Atlantic Ocean) and the
Maldives (in the Indian Ocean) are some of the probable hot spot islands. (You can point out that the Maldives are not confirmed as a hotspot).
6. No (Learners need to refer to atlases for this.)
Activity 21. In the southern Indian Ocean, slightly east of Port Elizabeth, between
South Africa and the Antarctic.

92 S E C T I O N 2 • L E S S O N - B Y - L E S S O N
2. a) A shield volcano is a large, flat, broad volcano formed from runny lava and effusive eruptions. A cinder cone is a small volcano that spews mostly rock fragments and ash. (Note that Marion Island is a large shield volcano populated with many cinder cones.)
b) An active volcano is a volcano that has erupted recently (normally within living memory). An extinct volcano is a volcano that no longer erupts.
Activity 3For this activity, learners make a model of a stratovolcano/ composite volcano. The models, whether simple or fancy, should show: • a tallish cone with steep sides• successive layers – in two colours or textures – that represent the layers of
lava and ash.Learners might also embellish their volcanoes with representations of fire and debris to show that they are explosive.
Activity 4A geyserB volcanic plugC calderaD lava lake
Activity 51. a tall, steep volcano (1) formed from successive layers of lava and ash (2)2. a deep crater-like hollow (1) formed by the collapse or explosion of the
top of a volcano (1)3. a fast-flowing air current (1) in the lower atmosphere (1), usually at the
tropopause – the boundary between the troposphere and the stratosphere 4. a scientist/ geologist who studies volcanoes (1)5. a crater filled with lava (1)6. the Great African Rift Valley (1)7. Virunga Mountains (2) [12]
Activity 62. An example of a mind-map that shows the negative effects of volcanoes.
rains down, coveringcars and homes, andclogging swimmingpools
cloud/ash in jet-streamdisrupts air travel andair freight - causesinconvenience andeconomic loss kill people and
wildlife
causes asphyxiation
carbon dioxidegas
eruptionstemporarily orpermanently
displace people
ash
the negativeeffects ofvolcanoes
debris andblasts
destroy forests
bury/collapsebuildings
93M O D U L E 3 • G E O M O R P H O L O G Y : G E O G R A P H I C A L K N O W L E D G E
Informal assessmentActivity 1• Go through the answers with the class. Ask learners to offer answers.
Activity 2• Go through the answers with the class. Ask learners to offer answers.
Activity 3• Display the models in class so that learners can compare their model
with others.• Comment on some of the best models.• Use this activity to informally assess learners’ model building skills,
i.e. their ability to depict or represent something.
Activity 4• Ask learners to swap books with a partner and check each other’s work as
you go through the answers with the class.
Activity 5• You can mark this activity according to the mark allocation given in
the Answers section. Use this activity to informally assess learners’ comprehension skills and to give them feedback on whether they have grasped some of the terms covered in this unit.
• Alternatively, go through the answers with the class. Ask learners to offer answers.
Activity 6• Informally assess learners’ comprehension skills and their ability to
identify key or relevant points and to group or structure these points.
Consolidation/extensionConsolidation: • Let learners complete Worksheet 14 (page 285) in the Resources section
of this Teacher’s Guide. This is a worthwhile consolidation, revision or summary activity for all learners. It also draws on content from Unit 2 in this module.
Extension: • Recommend some of the websites to learners that are listed under the
Resources section (page 87 of this Teacher’s Guide).• Suggest that learners also take a look at:
– the following Wikipedia entry on the Volcanic Seven Summit – the highest volcanic peaks on each of the seven continents: http://en.wikipedia.org/wiki/Volcanic_Seven_Summits
– this Wikipedia entry on the geography of the Maldives: http://en.wikipedia.org/wiki/Geography_of_the_Maldives
• Suggest that learners look for additional animations or videos of volcanic eruptions on the Internet.
• Recommend the book, Krakatoa: The Day the World Exploded to learners who are strong readers. They can look for it at the public library.

94 S E C T I O N 2 • L E S S O N - B Y - L E S S O N
FIELDWORK 1 TERM 2
This fieldwork task is linked to the content of Module 3, Unit 1 and will provide the learners with practical experience of the rock cycle. It would be best to plan the fieldtrip for after the learners have completed Unit 1.
Here is an example of how a learner could present their fieldwork findings on the rock cycle, after a visit to the Drakensberg:
igneous rock
magma
sedimentary rock
metamorphic rock
I saw signs ofweathering and erosion
rock debrisat foot of
slope
Drakensberg
basaltsediments
basalt lava flows capped
the Drakensberg
upliftedsedimentaryrock formedthe base of the mountain
dolerite
the top layer of sandstone sediments
were turned to quartziteby contact metamorphism
I saw doleritedykes (intrusions)
I found somepieces of quartzite
debris
Note: This is a cohesive example that focuses on the Drakensberg. It is just as valid for learners to include evidence of the rock cycle from observations taken in a number of different places.
Learner’s Book page 141
95M O D U L E 3 • G E O M O R P H O L O G Y : G E O G R A P H I C A L K N O W L E D G E
Extension 2 Geomorphology (assignment)
TERM 2, WEEK 7
Geography topic: Geomorphology
ResourcesLearner’s Book pages 142–144Background• This task focuses on Module 3 of Study & Master Geography Grade 10 and
therefore should be scheduled for after the learners have completed this module and had time to do some revision activities. (See year plan on pages 9–10.)
• The skills covered in this task are reading and interpreting maps; labeling diagrams; analysing and synthesising information; and writing paragraphs.
• The questions for this task are mainly (although not exclusively) lower order questions (knowledge and remembering), which makes this a relatively easy task.
• Allow some class time in Week 7 to go through the task with the learners. Let the learners complete the task for homework.
Preparing the learners• Remind the learners that they should work on their own and answer
all questions.• Let them read through the task and ask questions about any part of the
task that they do not understand.• Remind them that they can consult Module 3 in the Learner’s Book if
they need to.• Give them a due date for their completed tasks.
The task• You will find Geography in practice Task 2 on pages 142–144 of the
Learner’s Book.• A marking memorandum is supplied below under the heading,
Assessment guidance.
Assessment guidanceMemorandum: Geography in practice 2 (Learner’s Book pages 142–144)Activity 1 (16 marks)1. a) extruded magma/molten rock that erupts from a volcano (1)
b) the hollow at the top of a volcano (1)c) a very large crater formed by collapse or explosion of the top
of a volcano (1)d) a volcano that is inactive, but not extinct/a volcano that has
not erupted for a very long time (1)e) a volcano that does or still can produce lava (1)
2. stratovolcano/composite volcano (1)3. Tanzania (1)4. its animal wildlife; its grassland plains (any one) (1)5. The volcanic ash hardens like cement in the rain, making it difficult
for tree roots to penetrate deep into the soil. (2)

96 S E C T I O N 2 • L E S S O N - B Y - L E S S O N
6. Tourists wish to see:• the spectacular volcanic mountains• the large herds of grazing animals and their predators that
are supported by the grasslands – the volcanic ash makes the soil fertile (2)
7. a) A graben/rift valley; B horsts (2)b) block mountains. (1)
8. Lake Turkana (1)[16]
Activity 2 (14 marks)1. DRC or Rwanda (1)2. It measures the total energy of large earthquakes – not only the size of
the quake, but also the length/duration of the quake (2)3. seismometer (1)4. Define these terms:
a) two parts of a plate or masses of rock are pulled apart; one part drops down (1)
b) two parts of a plate or masses of rock are pulled in a direction that is parallel to the fault OR shearing of two parts of a plate or masses of rock so that they slide past each other (1)
c) the point at the Earth’s surface closest to the earthquake (1)5. East Africa is a developing region. It does not have the infrastructure
for easy evacuations or rescue and relief operations (2)6. Volcanic activity and earthquakes are caused by movements/
disturbances in the Earth’s crust, which is broken up into tectonic plates (1). 65 million years ago, the African Plate began to split in two – the Nubian Plate ( Plate A, that carries the bulk of the continent) (1) and the Somalian Plate (Plate B, which carries the horn of Africa) (1). A rift zone has formed (1) and continues to develop at this divergent continental-continental boundary (1). (5)
[14][Total marks: 30]

97M O D U L E 4 • G E O M O R P H O L O G Y : G E O G R A P H I C A L S K I L L S A N D T E C H N I Q U E S
Term 2Learner’s Book pages 145–175Duration: 10 hours
GEOMORPHOLOGY: GEOGRAPHICAL
SKILLS AND TECHNIQUES
MODULE 4
Learners need mapwork skills to locate places on maps. They need to understand the various map scales, and which scale shows more area but less detail, or more detail but a smaller area. Geography deals with space, and spatial relationships. With a basic understanding of mapwork skills, learners can ‘read’ a topographical map. In this module, learners study the 1:50 000 topographical maps. They learn about direction and bearing, how to recognise landforms from contours, and how to draw a simple cross-section of a map.
Maps are brought to life with the use of aerial photographs and orthophotos. Learners will learn to use these photos in combination with the topographic maps. They will also practise using the atlas index again, and learn about the four-digit grid reference to locate features. Map projections are explained, and the reason for the variety of projections is shown, as well as which projection is appropriate to which application.
Curriculum and Assessment Policy Statement (CAPS)
Mapwork skills• Locating exact position – degrees, minutes and seconds.• Scale – word, ratio, fraction and line scale.
Topographic maps• South African 1:50 000 referencing system.• 1:50 000 maps – conventional signs and symbols.• Navigating position using compass directions (16 points).• Direction – true and magnetic bearing.• Landforms and contours.• Simple cross-sections.
Aerial photographs and orthophoto maps• Photographs of landscapes.• Oblique and vertical aerial photos.• Orthophoto maps to be used in conjunction with 1:50 000 maps and
aerial photos.
Using atlases• Atlas index – locating physical and constructed features.• Four-digit grid reference (latitude and longitude, degrees and
minutes) to identify and locate features on maps.• Concept of map projections: examples of equal area and true
direction projections – critical evaluation.
Key geographical skills • Using verbal, quantitative and symbolic data forms such as text, pictures,
graphs, tables, diagrams and maps.• Applying communication, thinking, practical and social skills.

98 S E C T I O N 2 • L E S S O N - B Y - L E S S O N
• Practising the following specific skills:– identifying questions and issues– collecting and structuring information– processing, interpreting and evaluating data– making decisions and judgements– deciding on a point of view– suggesting solutions to problems– working co-operatively and independently.
Key words/conceptsorthophoto map; topographic map; reference grid; true bearing; true north; magnetic north; magnetic declination; cross-section; aerial; map projection; cylindrical projection; conical projection; azimuthal projection; conformal map; equal area map
UNIT 1 Mapwork skills
TERM 2, WEEK 7
Learner’s Book pages 145–149Duration: 2 hours
Curriculum and Assessment Policy Statement (CAPS) contentMapwork skills• Locating exact position – degrees, minutes and seconds.• Scale – word, ratio, fraction and line scale.
Resources• Learner’s Book pages 145–149• Atlases• Wall maps with different scales (optional)
Preparation• Read through the unit and familiarise yourself with the content that you
will need to teach. Think about what learners may already know about the topics and any areas of difficulty that you think they might encounter.
• Locate wall maps or maps in the learners’ atlases with different scales.
Teaching the unit
Lesson 1
• Read through the introduction to the module on page 145 of the Learner’s Book with learners.
• Work through the information, ‘How do we locate an exact position on a map? (page 146) with learners.
• You will need to teach this lesson by explaining the concept of co-ordinates, degrees and minutes. Use the steps below to help you.
• Write the co-ordinates for Johannesburg in the introductory paragraph, on the board. Write the co-ordinates to show ‘degrees’ (°) and to show ‘minutes’ (´), so that it looks like this: Johannesburg 26°10´S 28°2´E.
• Ask learners what is meant by ‘co-ordinates’. Ask them which of the numbers refer to latitude and which to longitude.
• Draw three parallel lines across the board. Draw three lines crossing these at right angles to make a grid. Use the squares on the grid to refer to 1 degree of latitude/longitude.

99M O D U L E 4 • G E O M O R P H O L O G Y : G E O G R A P H I C A L S K I L L S A N D T E C H N I Q U E S
• Mark the top horizontal line 25 °S, the middle line 26 °S, and the bottom line 27 °S. These are the lines of latitude. Now label the lines running downwards: the first line is 27 °E, followed by 28 °E and 29 °E.
• Each degree of latitude and longitude is divided into 60 minutes. You can quarter each square into four squares with a broken line to signify the difference between the new lines and the existing latitude and longitude lines.
• Each broken line represents 30´. Ask learners how to show where 15´ or 45´ are in each block. Ask them how they would find 10´ or 02´.
• Ask in which of the blocks on the board they would shade in the location of Johannesburg, and why.
Activity 1• Let learners complete this activity in pairs.• If you want to make the activity more challenging, give them a time limit
on finding each place.• Go through the answers with the class.
Lesson 2
• If you have maps with different scales, put these up on the board. If not, refer to different maps in the learners’ atlases.
• Read through the information in the sections, ‘What does scale mean on a map?’ (page 147) and ‘How is scale represented on a map?’ (page 149).
• Teach learners that a large scale is a map on which objects are relatively large, while a small scale means that objects on the maps are relatively small. You can remind them about fractions: 1 _ 2 is a larger fraction than 1 __ 10 ; so too is 1 _____ 10 000 a larger fraction than 1 _____ 50 000 .
• On the board, explain the four ways in which scale can be represented: in written words; as a ratio; as a fraction; and with a line scale.
• Refer to the scale on the wall maps you have displayed and/ or to different maps in the learners’ atlases. Let the learners interpret each of the scales.
Activities 2 and 3• These are short activities in which learners apply the information in
the unit.• If there is time, allow learners to complete them in class. Otherwise, set
them as homework.
AnswersActivity 11. Polokwane2. New York3. Mumbai4. Mexico city5. Rio de Janeiro
Activity 21. Africa map has a scale of 1: 40 000 000; Johannesburg map has a scale of
1:250 000.2. More detail is shown on the 1:250 000 map.3. The larger the scale, the less detail can be shown; the smaller the scale,
the greater the detail that can be shown.
100 S E C T I O N 2 • L E S S O N - B Y - L E S S O N
Activity 31. c) 1 _____ 20 000 ; b) 1 cm on the map is equal to ½ km in reality; a) 1 ______ 650 000 2. a) 1 cm on the map is equal to 650 000 cm on the ground
b) 1:20 000; 1 cm on the map is equal to 20 000 in realityc) 1:50 000; 1 _____ 50 000
Informal assessmentActivity 1• Ask learners for their answers. You can help them by showing how to
‘approximate’. This means, find the nearest latitude and longitude lines (normally rounded off in an atlas), and then judge where the exact line is that is wanted.
• Remind them to check in which hemisphere it is in (N, S, E, W).
Activity 2• Go through the answers with the whole class. By going over the answers,
you will help those who are not quite sure of this concept.
Activity 3• Ask learners to write answers on the board.• Some learners may also use a line scale. Remember that 1 cm of the
line scale will be equal to either (a) 650 000 cm, or (b) 20 000 cm, or (c) 50 000 cm.
Consolidation/extensionConsolidation: • If learners require further practice with using co-ordinates to locate
places on a map (Activity 1), divide them into pairs and ask each pair to find five places on different maps in their atlases and to write down the co-ordinates of these places on a sheet of paper. (They should write down their answers too!) Let each pair give their sheet of paper to another pair of learners who have to find the places listed. This activity can also be used for revision.
• Find towns in South Africa. Write them on the board. Get learners to find the four-grid reference for these, using their atlases.
Extension• Complete the first consolidation activity, but set time limits for writing
down the co-ordinates of places as well as for locating them.
UNIT 2 Topographic maps
TERM 2, WEEKS 7–8
Learner’s Book pages 150–163Duration: 4 hours
Curriculum and Assessment Policy Statement (CAPS) contentTopographic maps• South African 1:50 000 referencing system.• 1:50 000 maps – conventional signs and symbols.• Navigating position using compass directions (16 points).• Direction – true and magnetic bearing.• Landforms and contours.• Simple cross-sections.
101M O D U L E 4 • G E O M O R P H O L O G Y : G E O G R A P H I C A L S K I L L S A N D T E C H N I Q U E S
Resources• Learner’s Book pages 150–163• Atlases for consolidation and extension especially in Lesson 4• A display of signs and symbols used on 1:50 000 maps• A large protractor and ruler for use on the board for demonstration
purposes• Learners will need their own protractors or Maths sets for the work on
direction and bearing.• Learners may find either graph paper or quad books (the ones with
squares often used by Maths teachers) useful for the cross-section activity.• Topographic maps 1:50 000 from Chief Director of Surveys and
Mapping, Mowbray (optional)• Websites to use (optional)
– Google ‘Maps’. You can use these in colour and in 3D to show how the landforms would look in reality.
– Websites to use to order maps, or to check what is available, include: www.ngi.gov.co.za, and www.chiefdirectorate:surveys
Preparation• Read through the unit and familarise yourself with the content that you
will need to teach. Think about what learners may already know about the topics and any areas of difficulty that you think they might encounter.
• It is a good idea to have a 1:50 000 topographic map of the area in which you live, to put up on the board and refer to. This will be interesting to learners who will recognise features. See the list of Resources above for where to get a map of your area.
• It is a good idea to have a display prepared of the signs and symbols of a 1:50 000 map. You can do this on a large sheet of paper, on an overhead projector, or as a PowerPoint Presentation.
Teaching the unit
Lesson 1
• Display the map of your area or refer to a map in the learners’ atlases.• Read through the introductory paragraph on page 150 with learners.• On the board, draw a square. Sub-divide it into four squares. (Refer
learners to Figures 4.2.1 A and B.) Put the letters, ‘A’ and ‘B’ inside the top two squares; below them put the letters ‘C’ and ‘D’. Inside each of the four squares, make another four squares and label them in the same way. You will now have 16 squares.
• Ask a learner to give the latitude of the map you displayed/ selected. Place the latitude on the first line across for your square; the longitude is for the first line down. Ask someone else for the longitude of your map. Alternatively ask for the latitude from Figure 4.2.2. and the longitude.
• Ask a learner to give the two letter reference on your map. (Alternatively use the grid reference from Fig 4.2.2.) The first of the two letters refers to one of the first four squares; the second of the letters is for one of the squares of the second, smaller four squares within the first. Shade this in. This is where the map is. This four-digit grid reference is how the country is sub-divided into smaller areas that are each covered by 1:50 000 maps.

102 S E C T I O N 2 • L E S S O N - B Y - L E S S O N
Activity 1• The purpose of this activity is to familiarise learners with the four-digit
grid reference system.• Let learners complete this activity in class so that you can assist those
who have difficulty with these skills and concepts. • If necessary, allow more able and confident learners to work
independently while you work step-by-step through the activity with the other learners.
• Refer to the signs and symbols on pages 152–154 of the Learner’s Book and/or to the display you created. Remind learners to refer to these signs and symbols for all 1:50 000 topographical maps.
Activity 2• Set this activity as homework. It consolidates the material covered thus
far in Unit 2.
Lesson 2
• Go through learners’ answers to Activity 2.• On the board, write the heading: Compass direction. Mark the cardinal
points: N, S, E, W. Move in a clockwise direction from N; ask the learners for the points between N and E; then between E and S; and complete this. Now go from N clockwise towards NE. Ask learners for the compass direction mid-way between N and NE. Continue this until you have all 16 compass directions.
• Point out that your compass is a circle – it has 360˚.• Read through the section, ‘How do we navigate position using compass
directions (16 points)?’ with learners (page 155).• Explain Figure 4.2.6 (page 158) on the board. Try a few more examples
until you feel that learners have understood the concept.• Explain that the compass directions only take up 16 points of the 360˚.
Ask what a possible problem could be for someone needing to more accurately locate a place.
• ‘Bearing’ is a way of finding direction using all 360˚. The angle of declination is usually on the west side of north. A magnetic compass always points to the magnetic north, which is not true north. Show the formula on how to calculate for the declination angle.
• Read through the section, ‘How do we measure true and magnetic bearing’ (page 158).
• Work through the examples in the text on how to find true bearing and magnetic bearing.
• Make up some more examples of bearing for (a) true bearing, and (b) magnetic bearing. Magnetic declination is generally between 1˚ and 29˚ West.
Lesson 3
• Go over how to find true and magnetic bearing with learners.
Activity 3• Let learners work in pairs to complete this activity.• Go through the answers with the class. Ask learners to volunteer their
answers and provide explanations about how they arrived at them.• Read through the section, ‘How do we interpret landforms and
contours?’ (pages 159–163). Refer to Figure 4.2.8 (page 160), making sure that learners understand the difference between how these landforms are depicted with contours.

103M O D U L E 4 • G E O M O R P H O L O G Y : G E O G R A P H I C A L S K I L L S A N D T E C H N I Q U E S
Lesson 4
• Remind learners about how the shape and distance of contour lines depict different landforms. Briefly refer to Figure 4.2.8 again.
• Refer to Figure 4.2.7 to show learners contour lines on a map. Find examples of contour lines on the map on page 161. Ask learners to find the spot heights of these lines. Point out what the ‘contour interval’ is (this is the difference in height shown in metres between two contour lines). Point out that where the land is steep on the Robberg Peninsula, the contour lines are close together.
• Go through the information on simple cross-sections ensuring that learners understand how a contour map is one view of the land, while a cross-section provides another view. Draw their attention to the spot heights on the contour map, the markings on the piece of paper and the cross-section in Figure 4.2.8.
Activity 4• Let learners complete steps 1–3 of this activity in pairs and step 4
individually. They can complete it for homework if there is insufficient time in class.
Activity 5• Do this activity as a class discussion.
AnswersActivity 11. latitude: 26˚; longitude: 28˚; A is the big square; second A is inside the
previous big ‘D’ square2.
A B
C D
4 cm 4 cm2528 A B
C D
2 cm
2 cm
3. RHODES (Because this is a small piece of the map 3027DD RHODES, the small village of Rhodes doesn’t show. However, each topographical map in a block of 16 takes its name from the most obvious physical or human feature on that sheet.)

104 S E C T I O N 2 • L E S S O N - B Y - L E S S O N
Activity 21. 34 ˚ and 35 ˚South2. 3 ˚and 24 ˚East3.
A B
C D
3423 AB
4. 3423AD5. Approximately 34˚25´; 23˚45´6. a) Lighthouse or Marine Beacon
b) sand banksc) trees of a forest or plantationd) buildings or settlementse) main roads
Activity 31. South-south east2. 150˚3. 150° + 23 = 173° (true bearing plus magnetic declination)
Activity 41. NW/SE2. The road runs parallel to the mountain ranges, and along a river valley
which makes a natural gap.3. a) 2
b) 1c) 2d) 6e) 5 f ) 3 g) 7
4. a) – g)
Heightsin
metres
DistanceA B
400300200100
0
4003002001000
A cross-section

105M O D U L E 4 • G E O M O R P H O L O G Y : G E O G R A P H I C A L S K I L L S A N D T E C H N I Q U E S
Activity 51. and 2.
Figure 4.2.10 Fold mountains, the Great Rift Valley, block mountains
Figure 4.2.11 Mt Kilimanjaro, a volcano
3. Rift valley is where the line of lakes are found. 4. A volcano is Mt Kilimanjaro.
Informal AssessmentActivity 1• Go through the activity with the whole class and let learners mark their
own work.
Activity 2• Go through the activity with the whole class explaining how each
answer was arrived at. This provides another opportunity for learners to consolidate their understanding.
• Let learners mark their own work.
Activity 3• Work through this activity with the class.
106 S E C T I O N 2 • L E S S O N - B Y - L E S S O N
• If you note that learners have difficulty completing the activity, use the map in Figure 4.2.5 and find other examples for them to answer the same questions on.
Activity 4• Take in the learners’ books to check their cross-section.• Alternatively, create a memorandum for this cross-section and allow
learners to swap books to check.Activity 5• Assess learners’ ability to identify the features as they participate in
the activity.
Consolidation/extensionConsolidation:• Let learners find other examples of conventional typographic map
symbols on the map in Figure 4.2.5.• Use Worksheet 15 (pages 286–287) in the Resources section of this
Teacher’s Guide for learners who struggled with the concepts and skills in Unit 2. This worksheet focuses on scale, co-ordinates, direction, magnetic bearing and conventional symbols. It could also be used as a revision activity for the whole class.
• Provide extra examples of cross-sections. Divide learners into mixed-ability groups and give each group a different cross-section to practise with. Use learners who understand this section to be team leaders in the groups to keep everyone on the right track. Allow learners to check their answers by making a memorandum for each of the examples.
• Divide learners into groups. Let them use their atlases and follow the instructions below:1. Find a physical map of Africa. 2. Find the Great Rift Valley. Show the extent of this. 3. Find the Atlas Mountains and the south-west Cape mountains.
These are fold mountains. 4. Find the dormant volcanoes in Africa (e.g. Mt Cameroon,
Mt Ruwenzori, Mt Kenya).
Extension:• Let learners complete Worksheet 16 (pages 288–290) in the Resources
section of this Teacher’s Guide. It focuses on contours.• Let learners use their atlases to locate a physical map of North America
and then to find out which of the following features are volcanoes, rift valleys, block mountains or fold mountains: (a) the Rockies; (b) Mt Ranier; (c) Death Valley; (d) Gulf of California; (e) Appalachians.
UNIT 3 Aerial photographs and orthophoto maps
TERM 2, WEEK 8
Learner’s Book pages 164–170Duration: 2 hours
Curriculum and Assessment Policy Statement (CAPS) content• Photographs of landscapes.• Oblique and vertical aerial photos.• Orthophoto maps to be used in conjunction with 1:50 000 maps and
aerial photos.

107M O D U L E 4 • G E O M O R P H O L O G Y : G E O G R A P H I C A L S K I L L S A N D T E C H N I Q U E S
Resources• Learner’s Book pages 164–170• A drawing of an aeroplane, cut it out; and a matchbox
(or any other small box)
Preparation• Read through the unit and familarise yourself with the content that you
will need to teach. Think about what learners may already know about the topics and any areas of difficulty that you think they might encounter.
Teaching the unit
Lesson 1
• With the class, read through the introductory paragraph and the information on page 164 on how aerial photographs are taken. It gives some history of the development of aerial photography which you can discuss with learners.
• Use the rough sketch of an aeroplane and attach the matchbox to the underside of it, as if it is the lens of the camera pointed directly down, at 90˚ to the horizontal. If you tilt the angle of the camera, you can vary what the lens will see. A tilted lens gives an oblique (or angled) photo.
• Read the information on oblique aerial photographs (page 165) with learners.
• Refer them to Figure 4.3.3 A and B. Point out the advantages and limitations of oblique aerial photographs and find examples of these in the photographs in Figure 4.3.3.
• Read the information on vertical aerial photographs (page 166) with learners.
• Refer them to Figure 4.3.4 and discuss the photo in relation to the information that comes before it.
• Refer to Figures 4.3.3 A and B and 4.3.4. Point out how you can tell what time of the day the photo was taken. Ask what they think the best time would be for aerial photos and why. (Answer: Between 10 am and 2 pm because there are the least shadows). Ask them which would be the worst times and why. (Answer: Early morning or late afternoon because of long shadows.) Point out how a vertical aerial photo has the least shadows. Emphasise that shadows are a map interpreter’s nightmare because nothing can be seen in the shadow.
Lesson 2
• Read the information in the section, ‘How are orthophoto maps used together with 1:50 000 maps and aerial photos?’ (page 167)
• Introduce Figures 4.3.5; 4.3.6 and 4.3.7 as being different mechanisms of capturing visual information of the same location. Ask learners to examine them and to find the similarities and differences.
• Point out the storage dams or reservoirs and mostly seasonal rivers. Point out the river valley which is cultivated. There is a symbol for a monument ‘the Livingstone Mission 1843–1846’ on the topographic map.
Activity 1• Let learners complete the activity in pairs.• Allow some time for discussion of the learners’ answers to the questions.

108 S E C T I O N 2 • L E S S O N - B Y - L E S S O N
AnswersActivity 11. a) They show the same area of land; the mountains and ‘gap’ or river
valley pass can be seen in both; the road can be seen in both; both have contour lines; the settlement can be seen on the eastern side of the gap.
b) The orthophoto is black and white but the topographic is in colour; the contours on the orthophoto are at 5 m intervals but the topographic map is 20 m intervals; the orthophoto shows more detail of a smaller area but the topographic shows more area in less detail; the orthophoto has a larger scale (1:10 000) but the topographic has a relatively smaller scale (1:50 000).
2. a) orthophoto map scale is 1:10 000; topographic map scale is 1:50 000b) orthophoto contour interval is 5 m; topographic is 20 m
3. a) topographic map; b) aerial photo and orthophoto map; c) topographic map; d) orthophoto and aerial photo; e) all three; f ) topographic map
4. a) topographic map for large area and symbolsb) orthophoto for more detail but less area; and aerial photo for
understanding surrounding buildings better surrounding buildings better
c) topographic map for larger aread) orthophoto for more detail; aerial photo for understanding
surroundings bettere) need all three maps: topographic for larger area and understanding
perspective; orthophoto and aerial photo for understanding impact on immediate surroundings
f ) topographic for large area to choose a suitable site for a farm
Informal assessmentActivity 1• This is a nice activity to mark with the class because it provides an
opportunity for explanation and discussion. • Point out how the choice of one map over the other has to do with scale,
and clarity of information. Something which is community linked, such as a hospital, will need a scale which focuses on a small area, but in great detail. Buying a farm will need an understanding of a much greater area, and less detail is needed.
Consolidation/extensionExtension:• Find additional features to look for in Figures 4.3.5, 4.3.6 and 4.3.7. If
there is data on one that isn’t on the other, it may be due to the maps being made at different times. You can discuss with the class which came first in their opinion – the cultivated fields visible on the topographic map, or the vacant flood plain of the orthophoto.
• Direct learners to the origins of orthophotos and aerial photography. They can use the library or computers to access information about the pigeon corps, Robert Goddard and satellites. They can find out how aerial photos were first used for military planning.

109M O D U L E 4 • G E O M O R P H O L O G Y : G E O G R A P H I C A L S K I L L S A N D T E C H N I Q U E S
UNIT 4 Using atlases
TERM 2, WEEK 9
Learner’s Book pages 171–175Duration: 2 hours
Curriculum and Assessment Policy Statement (CAPS) contentUsing atlases• Atlas index – locating physical and constructed features.• Four-digit grid reference (latitude and longitude, degrees and minutes) to
identify and locate features on maps.• Concept of map projections: examples of equal area and true direction
projections – critical evaluation.
Resources• Learner’s Book pages 171–175• Atlases • Tennis balls, soccer balls or netballs (optional)• Paper (optional)• A globe of the Earth or a ball – to show the difficulty of making maps
(optional)
Preparation• Read through the unit and familarise yourself with the content that you
will need to teach. Think about what learners may already know about the topics and any areas of difficulty that you think they might encounter.
• For Lesson 2, a good idea is to ask the class to bring in tennis balls, or footballs or netballs.
Teaching the unit
Lesson 1
• Read the introductory paragraph on page 171 with learners.• Remind them about this tip for remembering whether the longitude
or latitude information comes first in a four-digit grid reference: ‘a’ in latitude comes before ‘o’ in longitude, therefore the latitude information always comes first.
Activity 1• Let learners work in pairs or groups to complete the activity.• If the learners’ atlases do not have all of these physical features in the
index, use an actual map of Africa in the atlas or a wall map of Africa to find the features. If it has degrees of latitude and longitude, adapt the activity by letting learners create the four-digit code for the features.
• Go through the section, ‘How to practise using the four-digit grid reference?’ (page 171). After learners have looked at Figure 4.4.1, ask them to interpret the four-digit grid reference. (Answer: latitude is 28 °S and longitude is 30 °E.)
Activity 2• Let learners complete the activity individually.

110 S E C T I O N 2 • L E S S O N - B Y - L E S S O N
Lesson 2
• Ask learners to bring a tennis ball, soccer ball or netball to show the concept of a map projection. If possible, have a globe available. This is a good teaching resource.
• Ask learners to place a sheet of paper against the curved surface of their balls. When they do this they will see that only part of the paper has contact with the sphere. This shows the difficulty mapmakers had.
• Read through the introductory information in the section, ‘What are map projections?’ (page 172) with the learners. Refer to Figures 4.4.2A–C and 4.4.3.
• Use a ball and paper to show how a cylindrical projection would occur. Use the balls for examining how paper can be placed along the ‘equator’ of the ball. Show what happens to the North and South Poles – the paper doesn’t touch the sphere; latitude has to be stretched to accommodate the ‘poles’.
• Make a cone hat with the paper (like a lamp-shade). Put this over the ‘North Pole’ (one end of the ball). Now show that when the focus is on one area of the sphere; other areas get distorted.
• Read through the information on conformal maps in the section, ‘True direction projection’ (page 174). Figure 4.4.4 shows a Mercator projection which is an example of a conformal map. This is used for accuracy in shape and scale. The North and South Poles are exaggerated in size. Mapmakers loved to use this map projection to show the Empires of Britain, Portugal, Spain, the Netherlands, and France as it made them appear far larger than their colonies!
• Read through the information on ‘Equal area maps’ (page 174). Figure 4.4.5 shows a Peters projection, which is an example of an equal area map. While the actual comparative area of countries is shown, the shape of the continents is distorted.
Activity 3• This activity deals with economic geography: the rich North versus the
poor South. Encourage learners to think about differences in wealth, in use of resources, in population numbers, in medical and educational infrastructure in the North and the South.
• Use this activity for class discussion or group discussion with a whole class feedback session afterwards.
• Remind learners about the North-South divide and how it originated. • Remind them about independence for the colonies, which began in 1947.

111M O D U L E 4 • G E O M O R P H O L O G Y : G E O G R A P H I C A L S K I L L S A N D T E C H N I Q U E S
AnswersActivity 1The answers will depend on the atlas learners have used.
Activity 21. – 5.
A BC D
2830 DDa b
c d
a b
c da b
c d
a b
c d
2831 CC
2830 AA
2830 BC
2830 CB
Activity 3Examples of answers:1. If countries in the North look larger than they really are, then it
magnifies or exaggerates their importance. 2. The Peters projection shows things as they really are: the former
colonies are larger than their ‘mother’ countries; they could demand support, economic aid, or a measure of representation on international organisations equal to their size. This could give them a potential advantage over their ‘mother’ countries when it comes to voting in the United Nations, for example.
Informal assessmentActivity 1• Mark this activity in class by asking learners to share and compare answers.
Activity 2• Use the chalkboard to draw the 16 squares to fill in the answers. Let
learners mark their own work.
Activity 3• Assess learners’ ability to critically evaluate the use of map projections
during the course of the group and/or class discussion.

112 S E C T I O N 2 • L E S S O N - B Y - L E S S O N
Consolidation/extensionConsolidation:• Write down the names of capital cities in Africa. Let learners use the
index in their atlases to locate the four-digit grid reference. (You may wish to put the learners into mixed-ability groups for this activity so that the stronger learners can guide and assist the others in the group.)
• Refer to Figure 4.4.1 to create more four-digit grid references, for example, 2730AB and 2730BC. Ask learners to create a 16 square block and label the top left corner 2730. They can shade in where AB is and where BC is.
Extension:• Refer to Figure 4.4.1, and ask learners to find out the answers to these
questions: What is the reference for the map to the east of 2730AB? south-east of AB? south-west? south?
• Encourage learners to investigate people involved with map-making. They can use the library or the Internet to research Mercator and Peters.
• Let learners research The Brandt Report as well as the United Nation’s reason for the adoption of the Peters’ projection. Learners can report back to the class.
Learner’s Book pages 176–182
REVIEW TERM 2
These activities provide an opportunity for learners to consolidate concepts and skills learnt in Term 2. Learners can complete them in class or as homework. It is suggested that they complete the activities individually as a means of self-assessment.
You can write the answers on the board for the learners and/or call them out where more appropriate. However, if possible, it is suggested that you photocopy the answers and give them to the learners so that they have them for revision purposes.
Activity 11. South America, Africa, Antarctic, Australia, India2. continental drift; the movement of the tectonic plates3. volcanic activity4. a) 180 million years old
b) 250-500 million years old5. magma is molten rock below the Earth’s surface; lava is magma that
flows out onto the Earth’s surface6. a) extrusive
b) dark grey, hard-wearing, fine-grained (any two)7. a) sedimentary
b) igneousc) igneous
8. a) sandstoneb) shalec) shaled) mudstone
9. A – sills; B – dykes
© Cambridge University Press. You may photocopy this page for use with Study & Master Geography Grade 10.

113M O D U L E 4 • G E O M O R P H O L O G Y : G E O G R A P H I C A L S K I L L S A N D T E C H N I Q U E S
Activity 2• Learners need to refer to ‘What happens when the plates move?’ (pages
108–109) and ‘Where do volcanoes form?’ (page 133).• Here is an example of a point-form summary:
Features that form at rift zones:– At a rift zone, two plates pull apart, or one plate begins to break
into two. The features that form depend on the type of plate.• An ocean rift zone produces a mid-ocean ridge – a long undersea
mountain range.• A continental rift zone produces a rift valley and block mountains.
Features that form at subduction zones:– At a subduction zone, one plate (the lighter plate) is pushed under the
other (the heavier plate). The features that form depend on the type of plate:• An ocean-to-ocean subduction zone produces arc islands/island arcs. • An ocean-to-continent subduction zone produces a deep ocean
trench and volcanic mountains along the coast.
Activity 31. a crack or break in the rock, caused by movement 2. Folding is caused by blocks of rock or tectonic plates pushing together.
Faulting is caused by blocks of rock or tectonic plates pushing together, as well as pulling apart or sliding past each other. When folding rock can bend no more, it cracks – faults.
3. a) A: Rockies B: Andes
C: Cape Fold D: Himalayas E: Great Dividing Range
b) A: transform B: convergent D: convergent F: divergent
c) A: transform B: normal – in pairs
d) A: San Andreas Fault B: Great African Rift/East African Rift
e) block mountains4. a) Pacific Ring of Fire
b) An earthquake is a sudden movement in a fault region (that relieves the build-up of strain; in other words, the strain accumulates until something gives). A volcano is an eruption of magma in a rift zone or a subduction zone.
c) These are examples covered in the features: A: Mount St Helens or Mount Paricutin; F: Mount Nyiragongo or Mount Kilimanjaro
© Cambridge University Press. You may photocopy this page for use with Study & Master Geography Grade 10.

114 S E C T I O N 2 • L E S S O N - B Y - L E S S O N
Activity 41. 1 cm on the map is equal to 50 000 cm in reality.2. huts3. Sample answer: the huts are mostly below the road facing east for the
Sun, close to the river, on the less steep contour lines, below 400 m, above and away from the flood plain of the Tugela River.
4. Use the reference for help in identifying features from the map.5. It is the road running to Stanger and Vryheid6. Approximately 23 cm. Calculations: 23 __ 1 × 1 _ 2 = 11,5 km.7. 484 m; 464 m8. SSE 9. 174°10. 174°+ 14°7´= 188°7´
Activity 51. a) degrees
b) minutes2. a) Johannesburg
b) Polokwanec) Nelspruit
Activity 61. both show features; both have a scale; both have contour lines; both show
spot heights2. orthophoto is black and white; scale is 1:10 000; contour interval is 5 m;
topographic map is colour; scale is 1:50 000; contour interval is 20 m3. orthophoto shows actual features; shows shadows; shows trees or hedges;
while topographic map must use symbols to represent features4. (b)5. between 10 am and 2 pm so that the shadows cast by objects are very small6. long shadows hide features; we can’t tell what is there7. The shadows will fall to the west of an object if it is taken in the morning;
the shadows fall to the east of an object if taken in the afternoon.
© Cambridge University Press. You may photocopy this page for use with Study & Master Geography Grade 10.

115M O D U L E 5 • P O P U L AT I O N : G E O G R A P H I C A L K N O W L E D G E
Term 3Learner’s Book pages 184–235Duration: 26 hours
POPULATION:
GEOGRAPHICAL KNOWLEDGE
MODULE 5
Population distribution and density explains where people live in the world and the reasons why they live in either dense or sparsely populated settlements. In this module, demographic terms such as, population, birth rate, death rate, life expectancy, fertility rate and natural increase, are defined and unpacked, and the factors that affect them are explained. Learners study ways of interpreting and analysing population statistics, such as the population pyramid, which shows population structure.
The historical changes in the size of the world’s population are shown graphically, and the model for studying changes in a population – the demographic transition model – is presented to help learners understand the demography of countries of the world. This model helps us view the standard of living or stage of economic development of a country and provides a projected forecast for what the countries, continents and the world will look like in the future.
Overpopulation does not mean too many people in one place, but rather too few available resources for the number of people in the area. The concern over the increase in the world’s population and our interventionist approach to managing population growth has much to do with our over-utilisation and unsustainable use of available resources.
Throughout history people have moved from one place to another – either voluntarily or forcibly. This module reviews some of the causes and effects of various forms of migration, especially the stereotypical fears attached to migrants.
Diseases affecting the population, such as malaria, TB, HIV and AIDS all have a social and economic effect on a population. These diseases sap the wealth and capacity of a nation, and lead to a drop in productivity, dysfunctional family units, and a reduced life span for its inhabitants. The impact of HIV and AIDS, particularly in southern Africa, is studied.
Curriculum and Assessment Policy Statement (CAPS)
Population distribution and density • Meaning of population distribution and population density. • World population density and distribution. • Factors that affect distribution and density of the world’s population.
Population structure • Population indicators – birth rates, death rates, life expectancy,
fertility rate, natural increase. • Factors that influence population indicators. • Population structure – age, gender represented as population pyramids.

116 S E C T I O N 2 • L E S S O N - B Y - L E S S O N
Population growth • World population growth over time. • Demographic transition model.• Concept of overpopulation. • Managing population growth.
Population movements (includes the use of case studies)• Kinds of population movement – international migration,
emigration, immigration, regional migration, rural-urban migration, urbanisation, voluntary and forced migration.
• Causes and effects of population movements.• Temporary and permanent movements – migrant labour, economic
migrants, political migrants and refugees. • Attitudes to migrants.
HIV and AIDS • HIV infection rates in southern Africa. • Social and economic effects of HIV and AIDS using specific examples
from the southern African region. • The impact of HIV and AIDS on population structure.
Key geographical skills • Using verbal, quantitative and symbolic data forms such as text, pictures,
graph tables, diagrams and maps.• Practising field observation and mapping, interviewing people,
interpreting sources, working with statistics.• Applying communication, thinking, practical and social skills.• Practising the following specific skills:
– Identifying questions and issues– Collecting and structuring information– Processing, interpreting and evaluating data– Making decisions and judgements– Deciding on a point of view– Suggesting solutions to problems– Working co-operatively and independently.
Key words/concepts population distribution; ecumene area; abiotic, biotic; non-ecumene area; population density; population indicators; birth rate; death rate; zero population growth; life expectancy; fertility rate; natural increase or decrease in population; dependency ratio; carrying capacity; demographic transition model; negative growth rate; sub-replacement fertility stage; overpopulation; migrants; emigration; regional migration; rural-urban migration; depopulated; urbanisation; megacity; voluntary migration; forced migration; counter-urbanism/ suburbanism; temporary migrants; permanent migrants; migrant labour; economic migrants; political migrants; refugees; asylum seekers

117M O D U L E 5 • P O P U L AT I O N : G E O G R A P H I C A L K N O W L E D G E
UNIT 1 Population distribution and density
TERM 3, WEEK 1
Learner’s Book pages 184–190Duration: 4 hours
Curriculum and Assessment Policy Statement (CAPS) contentPopulation distribution and density• Meaning of population distribution and population density.• World population density and distribution.• Factors that affect distribution and density of the world’s population.
Resources• Learner’s book pages 184–190• Atlases/maps of the world and Africa• Calculator • Useful websites (optional)
– www.worldpopulation.wikipedia – www.worldpopulationdistribution.un
Preparation• Read through the unit and familiarise yourself with the content that you
will need to teach. Think about what learners may already know about the topics and any areas of difficulty that you think they might encounter.
Teaching the unit
Lesson 1
• Read through the module introduction (page 184) with learners. Focus on the key questions that this module addresses. Remind learners that they can use these questions to do quick self-assessments of their understanding and skills as they proceed through the module.
• Read the unit introduction and the information on population distribution on page 185 with learners.
• Write two headings on the board: ecumene and non-ecumene. Explain the meanings of the words to the class. Ask the class for factors which they think would encourage learners to live in an area. Write them on the board.
• Ask the class which of the points on the board are biotic, and which are abiotic.
• Read through the ‘Ecumene and non-ecumene areas’ in the Learner’s Book (pages 185-187). Add factors to your list on the board that the class missed out.
• Refer to Figure 5.1.1 on world distribution of people.• Use the atlases to work co-operatively at locating the countries with the
least distribution of people, and those with most.
Activity 1• You can choose to do this as a whole class activity. This will encourage
discussion about the suitability of using one dot to represent 100 000 people.
• Learners may need the atlases in order to complete question 4.

118 S E C T I O N 2 • L E S S O N - B Y - L E S S O N
Lesson 2
• Read the introduction on population density (page 187) with the class.• Let learners check the figures on population density of the world that are
in the introduction as practice in working with figures.• Discuss Figure 5.1.2. This map uses shading to represent numbers of
people. Its problem is that it shades in an entire country to represent density. For example, in Egypt, it shows 75–99 people per km.The area alongside the Nile will have a much higher density, and there will be a much lower density to the south and west of the country, away from the coast and the river. This results in a broad ‘generalisation’, because exact, precise information is not given.
Activity 2• Let learners complete this activity in pairs.• The activity looks at ways of representing information. Try to encourage
learners to think of the most fitting way to show this on a map.
Lesson 3
• Read through the section, ‘Population density in Africa’ (page 188) with learners.
• Ask the class why the European population density approximately 500 years ago was so much higher than that of Africa. Put their answers on the board. Some of these may be: Europe had a temperate climate; Europe had perennial rivers and adequate rain; European cultivation of crops was easier; In Europe transport routes used rivers; natural vegetation in Europe was easier to keep under control and use; urban settlements developed in Europe more quickly because of access to transport routes.
• Refer to Figure 5.1.3 to find where most people live in Africa.• Use atlases and pair/group work to help learners identify areas of sparse
population density, and those areas more densely populated. The atlases have information about climatic regions and natural vegetation, and show rivers and physical features that either attract people or make settlement difficult.
Activity 4• Learners will need atlases to identify the countries in West Africa.• Let them work in pairs or individually to complete this activity.
Lesson 4
• Read through the section, ‘Population distribution and density in South Africa’ (page 189) with learners.
• Figure 5.1.4 refers to the density of people in South Africa. Let learners study this graph and ask them questions to help them interpret it. For example: Which province has the highest population? (Answer: Gauteng) Can you think of a reason/s for this? (Answer: Many people go to Gauteng to look for work. It is a business centre and consists largely of urbanised areas that have higher concentrations of people.)
• Ask learners to work together to use an atlas to study the provinces of South Africa, climatic and natural vegetation regions, and physical relief. Explain and show that they can find natural resources in an atlas, which explain why people settle in an area. They can also find communication networks, which explain transport and settlement patterns.

119M O D U L E 5 • P O P U L AT I O N : G E O G R A P H I C A L K N O W L E D G E
• Read through the section, ‘Why are people scattered unequally over the Earth?’ (page 190) to summarise what you have discovered with the class. As you do this, refer to the maps in the Learner’s Books and in the atlas.
• If you have enough time, return to the key questions for the unit on page 185 and suggest that learners work in pairs to answer the questions.
AnswersActivity 11. One dot represents 100 000 people2. No. Between 1 and 99 999 people would not be represented. This gives
a picture of no one being in the un-dotted areas, which is not true. It is inaccurate.
3. use gradations of shading across the continent without breaking for political borders of countries
4. a) flat land; abundant water; good transport accessb) plentiful water; alluvial, fertile soil; river transportc) plentiful water; monsoon rains; perennial rivers; flat plains; river
transport
Activity 21. both use a reference or key; both show the entire world; both deal with
population numbers2. Figure 5.1.1 does not show political borders, but Figure 5.1.2 does; Figure
5.1.1 uses dots to represent people, but Figure 5.1.2 uses shading per country; Figure 5.1.1 shows population distribution, but Figure 5.1.2 shows population density.
3. The shading used is the same gradation for an entire country; it does change from country to country dependent on population density.
4. A difficulty is in choosing parameters and shading that are most appropriate to representing the population density in the world.
Activity 3
1. 6,8 billion divided by 60 ___ 100 × 150 million km² = 75,56 people per km²
Activity 41. desert conditions: the Sahara in north Africa; the Namib in south-west
Africa; factors include lack of water; high temperatures2. Nigeria, Togo, Ghana, Cote d’Ivoire, Liberia, Sierra Leone, Guinea,
Cameroon, Central African Republic, Gabon, Republic of the Congo3. This type of map is inaccurate: one shade for a whole country cannot
show the density of people living in one region of the country. The map shows Egypt with the area alongside the Nile densely populated; the remainder of Egypt is sparsely populated because of desert conditions. One colour does not reflect this.
4. it is useful because it gives a broad, general picture of which countries have a certain population density; it is not useful because it represents the country falsely (because the density is not uniform but in patches)

120 S E C T I O N 2 • L E S S O N - B Y - L E S S O N
Informal assessmentActivity 1• Use the class discussion to assess whether learners have understood how
population distribution is represented on maps as well as reasons for the patterns of distribution.
Activity 2• Go through the answers to the questions and let learners mark a
partner’s book.• Alternatively, provide an overhead with the answer memorandum on it,
or ask learners for their answers and write them on the board.
Activity 3• Complete the sum on the board and ask learners to mark their
own work.
Activity 4• Mark this in class by asking learners for their answers and writing the
correct points on the board. Allow learners to mark their own work.• This will encourage discussion and consolidate of the work.
Consolidation/extensionConsolidation• Encourage learners to figure out which countries are the ecumene areas
of the world and which countries are not, by accessing information in the atlases.
• For learners who need extra practice with population distribution and density let them complete Worksheet 17 (pages 291–293) in the Resources section of this Teacher’s Guide. This worksheet can also be used for revision purposes.
Extension• Learners can use the websites on population distribution and density and
on ecumene areas of the world, to learn more about the factors which affect distribution and density.
UNIT 2 Population structure
TERM 3, WEEK 2
Learner’s Book pages 191–200Duration: 4 hours
Curriculum and Assessment Policy Statement (CAPS) contentPopulation structure• Population indicators – birth rates, death rates, life expectancy, fertility
rate, natural increase.• Factors that influence population indicators.• Population structure – age, gender represented as population pyramids.
Resources• Learner’s Book, pages 191–200• Atlases

121M O D U L E 5 • P O P U L AT I O N : G E O G R A P H I C A L K N O W L E D G E
Preparation• Read through the unit and familiarise yourself with the content that you
will need to teach. Think about what learners may already know about the topics and any areas of difficulty that you think they might encounter.
Teaching the unit
Lesson 1
• Read through the introduction to the unit (page 191) and the information in the sections, ‘What are population indicators?’ and ‘Birth and death rates’ (pages 191–192) with the class.
• The birth and death rate formulae need to be understood and the concepts studied.
• Clarify the concept of ‘Zero population growth’ (page 192) by reading this section carefully with the class, and encouraging discussion as to why Austria, Germany and Poland had a near zero population growth rate. Possible reasons include: high standards of living; later marriages; fewer children born in a marriage; migration of younger people for economic opportunities elsewhere.
• Refer to the vertical and the horizontal bar graphs in Activities 1 and 2. You may need to remind learners of the two axes: the vertical ‘y’ and the horizontal ‘x’ axis, and the way in which the information is shown.
Activity 1• Let learners work with a partner or on their own to complete this activity.
Activity 2• Use whole class discussion to complete this activity.• Let learners work in pairs for (1). They will need to use their atlases to
find the countries mentioned in Figures 5.2.4 and 5.2.5.• You can use this activity to discuss the reasons for high birth rates and
show a relationship to position of the countries and reasons for this.
• Discuss the concept of life expectancy and ask learners which factors may affect this. Ask learners which age groups are most likely to be affected by: (a) heart disease; (b) war; (c) contaminated water and infections; (d) HIV/AIDS, and discuss reasons for this. Reasons include: (a) gender and lifestyle for 30–50 year old men; (b) 16–50 year olds because they are physically active and risk-takers; (c) the elderly and very young who do not have good immunity; (d) breast-fed babies or the sexually active population who are receptive to the disease.
• Read the information in the section, ‘Life expectancy’ (pages 193–195) and ‘Fertility rate’ (page 195) and study the map and the table with learners.
Activity 3• Complete this activity as a class discussion.• Refer to Figure 5.2.7 and let learners answer (1) and (2). • In (3) learners discuss reasons why the trend was falling in the average
number of births per women in South Africa between 1960 and 2008. You need to point show that it is access to education that will cause a fertility trend to decline, and that it is access to sanitation that will indicate a higher standard of living, which is also a reason for a drop in the fertility rate. Increased levels of education also yield later marriages and increased family planning.

122 S E C T I O N 2 • L E S S O N - B Y - L E S S O N
Lesson 2
• Read through the information in the section, ‘Natural increase in population’ (page 195) with learners. Remind the class about the population indicators and ask learners to suggest factors which influence population indicators. Write these on the board to encourage discussion.
• Read through ‘What factors influence population indicators?’ (page 196) with learners and add to your list on the board, if necessary.
Activity 4• Use the atlases or a world map to refer to Afghanistan. Ask the class if they
can think of topical items to do with Afghanistan. They may mention the opium trade; the American and British troops presently there; the Taliban; the Russians who had invaded prior to the Taliban’s presence.
• You can use this activity to establish the relationship between life expectancy, infant mortality and lack of sanitation, no clean water, insecurity, danger, and war, as well as the fact that war brings disturbance to the secure standards that existed: education may be disrupted; there may be new rules and regulations; any of which may impact on women’s status and access to control over their lives and bodies.
• Let learners read the case study on Afghanistan on their own and then complete the activity individually (page 197).
Lesson 3
• Read through the information in the section, ‘Why is it important to find out about the age and gender of a population?’ (pages 197-198) and ‘The dependency ratio’ (page 198) with the class.
• Discuss the importance of the dependency ratio with learners. The economically active people must use their taxes to build up and maintain the infrastructure of the country, or increase it on behalf of the elderly and the young. If there is a small economically active population, then the elderly and young will suffer because of a lack of investment in their welfare.
Activity 5• This activity shows the relationship between wealth and a low
dependency ratio, and developing countries where there is still a high dependency ratio.
• Learners should use an atlas to identify continents and countries where the dependency ratio is high or low.
• Let learners complete the activity in pairs.• Refer to figure 5.2.10. Use atlases and work co-operatively to name the
countries with a small age dependency ratio and those with high ratios. Ask the class if they notice a relationship between the wealthy North and the less developed South, and dependency ratios. They may see that rich countries have a low dependency ratio; poorer countries have a high dependency ratio.
Lesson 4
• In this lesson learners explore population pyramids. The chief areas of focus will be age, gender and numbers or percentages of the population.
• Read through the information in the section, ‘What information can population pyramids provide?’ (page 199) with the class.

123M O D U L E 5 • P O P U L AT I O N : G E O G R A P H I C A L K N O W L E D G E
• Refer to Figures 5.2.11–5.2.13. Point out the male and female population representation on the left and right side of the central axis; the age groups; the histogram or horizontal bars that represent population numbers either in millions or thousands or as a percentage.
Activity 6• Let learner complete (1) to (3) with a partner and then (4) on their own.
AnswersActivity 11. The birth rate is fairly even, dropping gradually from 2003 to 2007 until
2008 when there is a slight increase, and again, a gradual decline until 2010.2. The death rate is uneven: it rises between 2003 and 2004; then it is stable
until 2006 when it rises until 2007. It falls steeply in 2008, but slowly rises after 2008 until 2010.
Activity 22. All except Afghanistan are in west or central Africa.3.
Birth rate Death rate
1 Urbanisation HIV/AIDS
2 Good sanitation Droughts
3 Good climate Tropical jungle
4 Deserts
5 Swamps
6 Malaria
7 Harsh climate
8 Conflict
9 Poor sanitation
4. apart from Sierra Leone, they are all in southern Africa5. People have a higher standard of living close to the coast; they are
exposed to European standards in education and lifestyle, later marriages, and access to doctors and clinics is easier.
6. the populations would begin to fall in number
Activity 31. 1960–20082. The trend is for the fertility rate to decrease or decline or fall.3. All of them can account for the fall in fertility rate.
Activity 41. war; oppression of women; insecurity; lack of education2. In war, urban areas are first taken captive. This can affect access to both
sanitation and clean water; bombardment of settlements means that it is unsafe to go to where there is clean water; fighting and bombardments can destroy pipes and access to sanitation and water.
3. Lack of contraceptives and education would mean more babies born to younger females and older females where this could be injurious to their health and the baby’s health. This would cause a decrease in life expectancy and a higher infant mortality.

124 S E C T I O N 2 • L E S S O N - B Y - L E S S O N
Activity 51. they cover the area of the developed countries of the world where the
dependency ratio is low2. the dependency ratio is generally high3. in Central America and some of the South American countries4. Iraq and Afghanistan have been involved in conflict; people are
inaccessible; there has been no census of the population; records have been destroyed
5. A high dependency ratio means a large group who do not work, and who are dependent on those who do. They can be both young or old or both. In poor countries, people don’t often live to ages over 65, so the economically dependent group is largely the younger group.
6. Cultural reasons for having large families – to work in the fields and to look after you in your old age – account for the high dependency ratios; lack of access to clinics and contraceptives maintain a high birth rate.
Activity 61. all have histograms showing male and female population, age groups and
numbers of the population2. a) the ages between 0 and 14 have decreased since 1990
b) the ages between 15 and 64 declined from 1990 to 2000, but increased slightly in 2010
c) over the age of 65 has increased slowly since 19903. In 1990 the female graph decreased evenly from a large number of young
females, to a small number of older females. In 2000, there were more females over 80 years than between 75 and 79, then the decline is even until the age group of 10–14 years. Below 14 years there is a steep drop in the numbers of females; in 2010, the ages 75 and over are almost the same. There is an increase which is even until 30–34 years, when there is a steep growth between the ages of 15–29 years. There is a sharp drop in numbers from 15 years down to 0.
4. A suggested answer is: The demographic trend in the South African population pyramids for the years 1990 to 2010 has been for a drop in the number of births, and an increase in the economically active and older people.
Informal assessmentActivity 1• Go through the answers to the questions and let learners mark a
partner’s book.• Alternatively you can provide a memo on an overhead, or ask learners for
their answers and write these on the board.
Activity 2• Use the class discussion to assess whether learners have understood what
birth and death rates are and what information can be derived from studying them.

125M O D U L E 5 • P O P U L AT I O N : G E O G R A P H I C A L K N O W L E D G E
Activity 3• Use the class discussion to assess whether learners have understood what
the fertility rate is and what factors influence it.
Activity 4• Go through the answers to the questions and let learners mark their own
work. Encourage debate.
Activity 5• Work with the whole class and encourage learners to give their answers
to develop a discussion about the role of standards of living, and security in establishing favourable dependency ratios.
Activity 6• Take in the learners’ books and mark the activity yourself. • Assess the learners’ ability to interpret population pyramids as well as
how well they communicate their findings.
Consolidation/extensionConsolidation:• Let learners work with percentage changes in the population figures
using the population pyramids for South Africa.• Let learners find the world life expectancy patterns for southern African
countries and contrast these with the top ten countries in the world, by using the website: www.ciaworldfactbook.
Extension:• Learners can research various diseases including malnutrition, malaria,
TB, HIV/AIDS to see what is being done in Africa to combat them. They can then report back to the class.
• Learners can research areas of conflict in Africa and make a presentation to the class on the effect this has on the populations.
UNIT 3 Population growth
TERM 3, WEEK 3–4
Learner’s Book pages 201–213Duration: 6 hours
Curriculum and Assessment Policy Statement (CAPS) contentPopulation growth• World population growth over time.• Demographic transition model.• Concept of overpopulation.• Managing population growth.
Resources• Learner’s Book pages 201–213• Atlases
Preparation• Read through the unit and familiarise yourself with the content that you
will need to teach. Think about what learners may already know about the topics and any areas of difficulty that you think they might encounter.

126 S E C T I O N 2 • L E S S O N - B Y - L E S S O N
Teaching the unit
Lesson 1
• Read through the introductory paragraph (page 201) with the class. • Refer to Table 5.3.1 which indicates the pace at which the world
population reached each billion milestone. Ask learners why they think the table shows that the world’s population increased so rapidly between 1927 and 1960. (Answer: This is the longest period between figures so the average annual rate of increase was 30 303. Between 1974 and 1987, the average annual rate of increase was 76 923.)
• Read through the information in the section, ‘How do we explain the huge population growth since the 1800s?’ (pages 201–202) with the class.
Activity 1• Figure 5.3.1 is an unusual look at the world and its countries, based on
the size of the population. • Let learners use an atlas to find the countries mentioned here, and their
geographical size, for comparison.
Activity 2• Let learners complete this activity in pairs and then feedback their
answers to the rest of the class.
Lesson 2
Activity 3• Use the lesson to allow learners to complete Activity 3.• Let them work in pairs but each learner should record their answers in
their own books.• You can begin by doing 1 (a) and (b) on the board, and plotting one or
two of the numbers in the table in Figure 5.3.2 to set them off correctly.
• Complete the lesson by reading the paragraph and studying the graph on page 204 (Figure 5.3.3) with learners.
• At the end of the paragraph learners are asked to think of possible reasons for the decline. Let them share their ideas. (Answer: In the 1980s in SA the deaths numbered approximately 25% of all births. This has increased. It is now forecast that by 2021 the deaths will be approximately 90% of all births. There are two reasons for this: the deaths caused by HIV/AIDS; the lower fertility rate amongst women. The lowered fertility rate is due to education and contraception.)
Lesson 3
• Read through the information in the section, ‘What does the demographic transition model explain or describe?’ (pages 204–205) with the class. Also refer to Figure 5.3.4. If you can draw this on the board you will find it useful to shade in areas and refer to them to point out a period with an increasing population.
• Read the paragraph on page 205 to learners. Relate the population pyramids in Figure 5.3.5 to the stages of the demographic transition model in Figure 5.3.4.

127M O D U L E 5 • P O P U L AT I O N : G E O G R A P H I C A L K N O W L E D G E
• Use use the flow chart on page 206 to spell out the characteristics of each stage of the demographic transition model. Encourage learners to try to synchronise all three ways of portraying a similar thing: changes in a population caused over time by increases in standards of living in a country.
Activity 4• This exercise ties the stages in the demographic transition model to
population pyramid recognition and the flow chart model. All three say the same thing but use a different visual model to do so.
• Let learners complete the activity individually and allow time for feedback at the end of the lesson. If there is insufficient time, mark the activity with learners at the beginning of the next lesson.
Lesson 4
• Read the information on overpopulation on pages 208–209 with learners.• Make sure that learners understand that overpopulation means that a
country is in a position where over-consumption of resources makes it dependent on others for survival.
• You can use an atlas to look at the resources in the world; and look at the North-South divide. Show the relationship between the wealthy North dependent on the South for raw materials; and the South dependent on the North for final products.
• Investigate where the countries in Table 5.3.3 are in the world, and find out how they rate in terms of wealth and economic development. (Answer: Countries belonging to the developed North are economically developed; those belonging to the developing South are neither wealthy nor rank high with regard to economic development.)
• Instruct learners to read the paragraph at the top of page 210 and then the cartoon in Figure 5.3.11.
• With learners, discuss what problem the cartoon shows. The point it makes is that the rich North, with 20% of the world’s population, consumes 80% of the world’s resources; while the poorer nations, with 80% of the population, only use 20% of the world’s resources.
Activity 5• Let learners complete this activity individually in class or at home.
Remind them to draw on the class discussion about the cartoon.
Lesson 5
• Read through the information in the section, ‘How can population growth be managed?’ (page 211) with the class.
• Refer to the posters in Figure 5.3.12 A and B which show the happiness and wealth or prosperity that comes with having only one child in a family.
• Read through the case study on India and Kenya. Refer to and discuss the posters with learners. Figure 5.3.13A shows problems that come with having a large family, and contrasts this with Poster B, which shows the happiness and prosperity associated with a small family. Figures 5.3.14A shows an educated man being allowed in to his place of work while the uneducated people are kept out at the gate; B shows what is important for Kenya: family planning to enable a family to feed, clothe and educate their children.

128 S E C T I O N 2 • L E S S O N - B Y - L E S S O N
Activity 6• Let learners complete the activity individually and write responses to
the questions.• Allow some time at the end of the lesson or at the beginning of the next
lesson for learners to share and mark their responses.
Lesson 6
• Read through the information in the section, ‘Approaches to managing population growth’ (page 213) with the class.
• Discuss these approaches with the class by asking learners to comment on how effective they think these measures might be and what some of the pitfalls/drawbacks might be.
• Use the rest of the lesson to recap and summarise the chief factors to take into account in reasons for population growth over time, the demographic transition model and the concept of overpopulation.
• For further consolidation, return to the key questions for the unit (page 201) and ask learners to work in pairs to answer them.
AnswersActivity 11. it is based on population size, not spatial size2. it makes a visual impact; we can immediately see similarities in
population sizes and compare this with the size of the country. Great Britain is so much smaller geographically than South Africa, but larger with regard to population.
3. Distress is first found in the lesser-developed countries amongst the poor, because of lack of resources to cope with diseases.
Activity 21. Asia and Europe2. Asia is rapidly expanding economically, while Europe is regarded as a
developed area with a high standard of living. 3. North and South America and Oceania have the most stable
population growth.4. All of these can be applied to explain a decline in population growth
in various countries. (A decline in population growth can be caused by positive advances for women, which makes them set back the time of having babies, and then they have fewer. If the death rate is stable, and the birth rate drops below the number needed to replace those that die, then there is a shrinking of the population. If the number of births is less than the number of deaths and less than the replacement number needed to maintain or expand the population, the population would decline in growth. This would apply to economically developed countries. However, a decline in population growth can also be due to negative factors such as conflict, famine and diseases like cholera, which cause a high death rate.)
5. Level of health and access to clinics, sanitation and clean water, absence of disease. (It is mostly the positive factors that have led to less infant deaths and less deaths amongst the older population, meaning that population has expanded.)

129M O D U L E 5 • P O P U L AT I O N : G E O G R A P H I C A L K N O W L E D G E
Activity 31.
76,5
65,5
54,5
43,5
32,5
21,5
10,5
0
1650
Human Population Growth
1850 1950
Num
ber o
f peo
ple
Time1750 2050
2. It is a very gradual increase in the population line graph. Before 1800, the population growth was slow: From 0,5 billion people in 1650 to 0,7 billion a hundred years later and up to 1 billion by 1850.
3. The population line graph rises rapidly. After 1800, the growth accelerated from 1 billion in 1850 to 2 billion by 1925. In the next 26 years the population increased by 0,5 billion people, and in the following 10 years, it increased by 0,8 billion to 3,3 billion by 1966. By 1976 it had increased 0,7 billion to reach 4 billion people. It took from 1976 to 1980 to notch up another 0,4 billion people.
4. The graph is likely to show a rise in population which should eventually begin to stabilize into a gentler line of increase.
5. A suggested answer may be: Afghanistan and Bosnia have endured wars recently; their population growth is either zero or close to zero as a result.
6. Malthus did not predict the way in which inventions, discoveries, adaptations, high-rise buildings, mariculture, hybrid seeds, and new uses for existing products, would enable the Earth to support an ever-increasing population.
Activity 41. a) Nigeria = Stage 1 – expanding
b) South Africa = Stage 2 – expandingc) Italy = Stage 4 – contracting
2. a) This is a steep concave pyramid. Birth and death rates are high and balance each other so population growth has not taken off. Children are needed as workers which explains the high birth rates; high death rates are due to lack of access to education, sanitation and medicine.
b) This is a fairly even pyramid due to birth rates not having fallen yet, but death rates beginning to fall as a result of improvements in sanitation, education and access to medical treatment, as well as access to food.

130 S E C T I O N 2 • L E S S O N - B Y - L E S S O N
c) Birth rates have decreased, resulting in negative growth rate, while death rates are low or stable.
Activity 51. A suggested answer is: The cartoon shows a rich representative from the
developed countries and a poor person from the developing countries. The argument given by the wealthy nations is that family planning and population control must happen in the poor nations because the world’s resources cannot continue to support the growing numbers of people. The reply from the poor person is that the wealthy 20% of the world’s population over-consume the world’s available resources (80%) . It is not a problem of overpopulation but of over-consumption.
2. Yes. It is an historic colonial tradition of using resources from colonies for the wealth of the ‘mother’ country.
Activity 61. They both show a mother and father with one child. The cock represents
wealth and prosperity in Poster B. In A and B, the toys and access to the country for recreation show prosperity.
2. They seem equal in their impact. A shows the problems of a large family; B shows prosperity and peace with a small family.
3. B shows the positive spin-off from a smaller family: clothing, shoes and walking happily to school; while a poor, large family struggles without shoes and clothing.
4. Figure 5.3.13A shows the negative effects of a large family; Figure 5.3.14A shows that a lack of education prevents access to a good job (man in a suit means money!), while B contrasts a small family with a large family; the small family illustrates prosperity and happiness.
5. possibly Figure 5.3.14A as it is more difficult to see the immediate effect of a small family with that of a happy man in a suit being let in to his place of work
6. Parents might want girl children more and so focus on this, thus reducing the number of boys.
Informal assessmentActivity 1• You can mark this in class by asking learners for their answers. These
answers are open-ended, which means you will get various answers.• You could write the answers given by learners on the board and discuss
any interesting opinions.
Activity 2• Go through the answers to the questions and let learners mark their
own work.
Activity 3• You will need to ensure that their graphs are an accurate representation
of what is asked. You can do this by taking in the learner’s books or allowing the learners to mark their own work as you complete the graph on the board and go through the other answers.
Activity 4• Go through the answers to the questions and let the learners mark a
partner’s book.
131M O D U L E 5 • P O P U L AT I O N : G E O G R A P H I C A L K N O W L E D G E
Activity 5• Use the class discussion to assess whether learners have understood the
North-South imbalance in consumption of the world’s resources.• Also take in their books and assess how well they have been able to
communicate their view in writing. Look for opinions that are supported by facts or information. Provide feedback to learners on how well they did this.
Activity 6• You will find different responses as these questions are open-ended and
encourage learners to express their own opinions.• Ask a few learners to read their responses to each question to the class.
Encourage discussion. • If a response is clearly not on track, discuss the reasons why with the class.
Consolidation/extensionConsolidation• Ask learners to summarise the demographic transition model, the
population pyramid stages of transition diagrams, and the flow chart until they feel they understand these.
Extension• Ask learners to comment on the different ways in which information
is shown in Module 3 – tables, maps, 3-D compound line graphs, pie-graphs, population pyramid diagrams, cartoons and posters. Ask them to think of other ways to display the information, or to assess the visual impact of the methods used.
UNIT 4 Population movements
TERM 3, WEEKS 4–6
Learner’s Book pages 214–229Duration: 8 hours
Curriculum and Assessment Policy Statement (CAPS) contentPopulation movements• Kinds of population movement – international migration, emigration,
immigration, regional migration, rural-urban migration, urbanisation, voluntary and forced migration.
• Causes and effects of population movements.• Temporary and permanent movements – migrant labour, economic
migrants, political migrants and refugees.• Attitudes to migrants.
Resources• Learner’s Book pages 214–229• Atlases • Websites (optional)
– www.migration.org.za; www.unhcr.org
Preparation• Read through the unit and familiarise yourself with the content that you
will need to teach. Think about what learners may already know about the topics and any areas of difficulty that you think they might encounter.
132 S E C T I O N 2 • L E S S O N - B Y - L E S S O N
Teaching the unit
Lesson 1
• Go through the key questions for the unit with learners. Use them to find out what learners may already know about the content of this unit.
• Read through the introduction to the unit (page 214) and the information in the section, ‘What are the different types of migration?’ and ‘International migration’ (page 215) with the class.
Activity 1• Let learners work in pairs and use their atlases to locate the five countries.• Complete the rest of the activity with the whole class. • Ask volunteers to name the continents. • Draw the table on the board and let learners provide the information to
complete it (see 3).• Let learners copy the table into their books.
Lesson 2
• Read the information on emigration and immigration (page 216) with learners.
• Let learners use an atlas and work in pairs to locate the countries in Table 5.4.2.
Activity 2• If learners are unsure of how to find a percentage increase (see question 3),
explain that you subtract the first smaller figure from the second larger figure; place the answer over the first figure and multiply by 100 over 1 to get the percentage.
• Ask learners to imagine what factors would make them decide to immigrate to South Africa. Write these on the board. You can then look at them as push and pull factors.
• Table 5.4.3 provides a summary of push and pull factors. Check the class’s responses against those in the table.
Activity 3• Let learners complete this activity as a homework task.
Lesson 3
• Go through learners’ answers to Activity 3.• Explain that regional migration occurs on all continents. Ask learners
to think of a reason for regional migration in South Africa in the 1800s. (Answer: The rush to Kimberley first in 1868, and to Johannesburg in 1886 in response to the discovery of diamonds and gold.)
• Read through the information in the section, ‘Regional migration’ (page 218) with the class.
• Figure 5.4.3 shows the effect of migration into Pilbara, Australia, in 2001. Ask learners what they notice about the newcomers in terms of age and gender. (Answer: There are more males and most of the migrants are between the ages of 20 and 54. These are the risk-takers and the economically active.)
• Read through the information in the section, ‘Rural-urban migration’ with the class.

133M O D U L E 5 • P O P U L AT I O N : G E O G R A P H I C A L K N O W L E D G E
Activity 4• Refer to Figure 5.4.4 to see where urban development really took off.
Point out that the horizontal axis has a time scale that changes in terms of years.
• Let learners work in pairs to complete the activity. • Allow time at the end of the lesson to go though the answers with learners.• It is an open-ended question that encourages discussion and a variety of
answers. For example, in Question 3, all of the options can contribute to urban increase. Try to find out from learners why or in what way each has contributed to urban increase. Ask if they can classify the possible answers as pull or push factors.
Lesson 4
• Begin the lesson by summarising the main points about rural-urban migration.
Activity 5• Let learners complete the activity in pairs.• Allow time for learners to share and discuss their answers with the rest of
the class.
• Read through the information in the section, ‘What is the rate of urbanisation in different areas of the world?’ (page 221) and ‘The development of megacities’ (page 222) with the class.
• In Time magazine (2 May 2011) it is explained that, ‘nine of the ten urban areas experiencing the highest GDP growth from 2007 to 2025 are in China, and of the top 25 growth cities, 21 are in the developing world... urbanization is lifting more people out of poverty than any movement in history’.
• Refer to Tables 5.4.4 and 5.4.5 to study the rate of urbanisation around the world and the world’s largest cities. Ask learners to find the places mentioned in their atlases.
• Encourage discussion about megacities: Many large industries move their business from the developed to the developing cities where labour is cheaper; this in turn encourages more people from rural areas to come into the cities for jobs.
Activity 6• Point out to the learners that questions 1–5 have specific answers that are
either right or wrong and that questions 6–7 are open-ended. Encourage learners to give reasons for their answers.
• Let learners work on the activity individually and complete it for homework, if necessary.
Activity 7• Let learners complete this activity for homework.
Lesson 5
• Go through answers to Activities 6 and 7 with learners.• Read the information on voluntary and forced migration (page 223) with
learners. In particular, read through the reasons in Table 5.4.6 that explain these movements.
• Go through the flow chart of global migration (page 224) with learners.

134 S E C T I O N 2 • L E S S O N - B Y - L E S S O N
• Ask learners for their thoughts on the effects of migration, and put their ideas on the board under the headings, ‘positive’ and ‘negative’ effects.
• Table 5.4.7 summarises the positive and negative effects of migration. Look at it with learners and add anything omitted from your lists on the board.
• Read the feature, ‘Urban problems’ with the learners. Let them examine the photographs and suggest which urban problems are shown in each. (Answers: (A) South African informal settlement; (B) Factory emissions – pollution; (C) Favelas or informal settlements – Rio de Janeiro; (D) Overcrowding, car pollution.)
Lesson 6
• Read the information on why people migrate and the case study on page 226 with learners.
• You have already discussed with learners why they might migrate to Australia. Point out that in this section you will be covering some of that material again.
• Read the information on economic migrants and the case study on page 227 with learners.
• The case study, ‘The United Kingdom and immigrants’ highlights the reaction of the British public to immigrants. Discuss the public’s views in light of the facts provided. In the light of this, ask learners why they think that the British public holds these views.
Activity 8• Let learners complete questions 1 and 2 individually.• Go through their answers and have a short discussion on question 3.
Draw a mind-map on the board to capture the learners’ suggestions.
Lesson 7
• Ask the class what they think a political migrant is. Also ask whether they think political migrants are different to economic migrants, and if so, how they are different. Encourage discussion.
• Introduce the words ‘voluntary’ and ‘forced’ to describe these two types of migrations.
• Read the information on political migrants on page 228.
Activity 9• Refer to Table 5.4.8 and the five countries with their refugee numbers.• Let learners work in pairs to locate the places in their atlases.• Complete question 2 orally with the class.
Activity 10• Most of these questions are open-ended and so the activity would
work best as a small group or class discussion. However, if there is insufficient time, learners can complete the activity as a written assignment for homework.
Lesson 8
• If learners completed Activity 10 for homework, allow some time at the beginning of the lesson to go through their answers.

135M O D U L E 5 • P O P U L AT I O N : G E O G R A P H I C A L K N O W L E D G E
• Ask learners to list their emotions and feelings concerning refugees and migrants in South Africa. Write their responses on the board and use this as a basis for discussion about the complex responses we sometimes have to people entering our country.
• Refer to Figure 5.4.9 to underline their feelings.• Discuss xenophobia, which is a global problem. It means a fear or dislike
of foreigners. In South Africa, during the years of struggle against apartheid, the countries of Africa took in South African refugees and gave them asylum. It seems however that we have not been able to show the same welcome that our citizens received.
Activity 11• Let learners answer the questions in pairs and then discuss the questions
with the class as a whole.• Use the activity to encourage discussion about the reasons for
xenophobia and the results of xenophobia. Make the point that xenophobia goes against the spirit of the Constitution of South Africa.
• If there is time at the end of the lesson, return to the key questions for the unit (page 214) and ask learners to work in pairs to answer the questions. This provides an opportunity for consolidation.
AnswersActivity 12. Afghanistan, Iraq and Burma are in the Middle East and Asia; Somalia
and the DRC are in Africa.3.
Source of Refugees Reasons for moving
1 Afghanistan Invasion
2 Iraq Invasion
3 Somalia Civil war; famine
4 DRC Civil war; famine
5 Burma Political unrest
Activity 21. There was an overall decrease in the numbers of immigrants to Southern
Africa between 1990 and 2000.2. Botswana; Lesotho; Namibia; South Africa; Swaziland.3. (a) Swaziland; and (b) Namibia4. (a) South Africa; and (b) South Africa5. Namibia6. Experience; skills; cultural richness; languages; positive attitude;
entrepreneurship; courage.
Activity 31. Hong Kong2. USA3. The USA has so many people, that immigrants represent a smaller
percentage than those in Hong Kong, where with a smaller number of people the immigrants form a higher percentage
4. Immigrants come in to these countries seeking employment opportunities.

136 S E C T I O N 2 • L E S S O N - B Y - L E S S O N
Activity 41. it is a steeply rising trend2. approximately 20043. famine; the building of the first shopping malls; commercial farming;
industry; jobs; suburban rapid transport systems4. lack of mechanisation meant more hands were needed on the farms;
people supported themselves on farms; commercial farming had not yet taken over from subsistence farming
5. the urban line will increase and the rural will drop; the world global trend will be towards urbanisation
Activity 51. ‘Push’ factors: lack of land, poor agricultural land; ‘pull’ factors: repeal of
discriminatory laws, job opportunities, and government initiatives such as the Urban Renewal Programme.
2. The removal of the Group Areas Act in 1991 allowed people to live where they chose or could afford.
3. 1820 population was 15; in 1854 it was 55 000; in 1899 it was 1 698 575. (Some learners may give the numeric differences in the photos, while others may show what has changed visually with more urban structures developing. Both descriptions are correct.)
4. it was a myth that there was instant wealth; people had to get jobs but may not have had the necessary qualifications; this would have reduced them to poorly paid jobs, if any, and living conditions that were poor and unsanitary
5. By 1990 in the USA nearly 75% of the population were urbanised; in China in 1986 only 37% were urbanised. The USA had freedom of movement whereas the Chinese were subjected to political restrictions on the movement of people. (Point out to learners the differences between America with its free-market economy and China with a command economy: Americans are free to respond to the urban movement and seek jobs where they want to; the Chinese are told where to go, for how long, and in what job capacity.)
6. A common thread was the freedom from restrictions to follow opportunities.
Activity 61. Europe, Northern America and Oceania; Africa, Asia and Latin America
and the Caribbean belong to the South2. South3. Africa4. Asia5. Oceania6. Possible answers may include: Africa lagged behind because of difficulties
in communication and a hostile climate and vegetation; trade routes and domestication of animals and sufficient food allowed urban life to develop in Europe, Northern America and Oceania.
7. People want to return to the quiet of rural living or suburban living; computers make working from home a possibility.

137M O D U L E 5 • P O P U L AT I O N : G E O G R A P H I C A L K N O W L E D G E
Activity 71. Tokyo is similar; New York, Mexico City, Delhi, Sao Paulo, Mumbai
are different2. New York is extensive as it has many boroughs or suburbs extending
across from Manhattan. It is a huge port on a river that extends into the centre of America for trade; it is the commercial capital; it houses international organisations. Few other cities in the world attract this type of representation.
3. Developing countries are expanding and developing their industries; this provides work opportunities for people formerly in rural areas.
Activity 81. Qualities may include: entrepreneurship; industriousness; energy;
courage; risk-taking.2. a) construction worker – migrant labourer
b) electrician – economic migrantc) au pair help – migrant labourerd) technician – economic migrante) nurse – economic migrantf ) restaurant staff – migrant labourg) fruit-packer – migrant labourh) draughtsman – economic migranti) stevedore – migrant labourj) radiologist – economic migrant
3. Possible answers may include: jealousy; anger; xenophobia; threats; unkindness; hatred; conflict; hostility; discrimination
Activity 92. Four of the countries are in Africa.
Activity 101. Possible answers may include: apprehensive; fearful; anxious; nervous2. Possible answers may include: forced because no one would choose to flee
under those circumstances; or voluntary because no one is sending them out but they are choosing a different country with more opportunities
3. two, but seven in the whole picture4. men are risk-takers; men earn money and send it back home; women
have to look after families5. Possible answers may include: yes, because our people had refugee status
in African countries during the years of the struggle; yes, because we are economically developed and offer job opportunities; no, because the way we have treated the refugees with xenophobic attacks is not acceptable.
6. South Africa offers economic strengths which some of the surrounding southern African countries do not have. (Point out that South Africa is a leading nation in Africa, particularly in southern Africa, and offers stability, an excellent Bill of Rights and Constitution, and job opportunities which makes it attractive to refugees and asylum seekers.)
Activity 111. Example: The reference to ‘brother’ and ‘sister’ emphasises how we are
all connected, like a family. This poster is to make people aware that migrants belong here as much as South African citizens do.
2. Possible answers may include: jealousy; fear for their jobs; fear of foreigners getting housing before the local people do

138 S E C T I O N 2 • L E S S O N - B Y - L E S S O N
Informal assessmentActivity 1• Use the atlas work to identify learners that need some assistance with
their atlas and map-reading skills.• Use the learners’ contributions in the rest of the activity to assess
whether they are able to identify and understand the reasons that refugees move.
Activity 2• Go through the answers to the questions with the class and let learners
mark their own work.
Activity 3• Go through the answers to the questions with the class and let learners
mark a partner’s book.
Activity 4• Use the class discussion after the activity to assess whether learners have
been able to interpret the statistics and can differentiate between push and pull factors.
Activity 5• Mark this in class by asking learners for their answers and encouraging
discussion of these answers. Allow learners to mark their own work.
Activity 6• Go through the answers to questions 1–5 with the class and let learners
mark their own work.• Take in the learners’ books and mark questions 6 and 7 assessing whether
they have understood the patterns of urbanisation.
Activity 7• Go through the answers with the class and let learners mark their
own work.
Activity 8• Let learners share their answers to questions 1 and 2 with the class and let
them mark their own work.• Use the class discussion to assess whether learners have understood the
problems facing migrant workers.
Activity 9• Use the atlas work to identify learners that need assistance with their
atlas and map-reading skills.
Activity 10• If you used group or class discussion in the activity, use learners’
contributions to assess whether they understand the issues around political migration.
• If learners complete the activity as homework, allow some of them to share their answers with the class but take in the learners’ books and mark their work to assess whether they understand the issues around political migration.

139M O D U L E 5 • P O P U L AT I O N : G E O G R A P H I C A L K N O W L E D G E
Activity 11• Use learners’ contributions to the class discussion to assess whether they
understand some of the issues around xenophobia.
Consolidation/extensionConsolidation• Ask learners to make a list of the various categories of migration. They
can find an example for each kind and list whether it is voluntary or forced migration.
• Learners can write a paragraph on their experiences as: (a) a refugee in a strange land; (b) emigrating from South Africa; or (c) the experiences of being a migrant worker in Europe.
Extension• Learners can research some of the major migrations in history and make
a presentation to the class. This can be either an oral, or a PowerPoint Presentation, or a number of posters to show the story of an historic migration of people.
UNIT 5 HIV and AIDS
TERM 3, WEEKS 6–7
Learner’s Book pages 230–235Duration: 4 hours
Curriculum and Assessment Policy Statement (CAPS) contentHIV and AIDS• HIV infection rates in southern Africa.• Social and economic effects of HIV and AIDS using specific examples
from the southern African region.• The impact of HIV and AIDS on population structure.
Resources• Learner’s Book pages 230–235• Calculator • Atlases • Websites (optional)
– www.avert.org/safricastats.htm– www.unaids.org– www.aid.org.za
Preparation• Read through the unit and familiarise yourself with the content that you
will need to teach. Think about what learners may already know about the topics and any areas of difficulty that you think they might encounter.
• Copy Table 5.5.1 on the board before the lesson.
Teaching the unit
Lesson 1
• Read through the introduction (page 230) and the information on the HIV infection rate in South Africa (page 230) with the class. Point out that HIV has spread rapidly from its identification in 1983 to the position the world is in now.

140 S E C T I O N 2 • L E S S O N - B Y - L E S S O N
• Allow learners to share what they know about HIV and AIDS. Challenge any prejudices and/or misconceptions that they may have but be respectful of what the learners share.
Activity 1• Use atlases to locate the southern African countries in Table 5.5.1.• For question 1, you may need to remind them how to calculate
percentages: Divide the number of people with HIV/AIDS in a country by the total population; then multiply the answer by 100 to get the percentage.
• Let learners complete the activity individually.
Lesson 2
• Go through learners’ answers to Activity 1. Encourage discussion of questions 4 and 5 and make sure that they give reasons for their answers.
• With learners, brainstorm the social and economic effects of HIV and AIDS. Capture the learners’ ideas on a mind-map on the board.
• Refer to Table 5.5.2. Add any of these ideas to your mind-map, if necessary.
• Divide learners into groups. Let them discuss each of the social and economic effects and decide which effects they consider the most important. Encourage them to give reasons for their answers.
• Allow the groups to share their views and reasoning with the rest of the class.
Lesson 3
• Read through the South African (pages 231–232) and Zimbabwean (page 233) case studies with learners.
• Ask the class to summarise the chief points from the case studies. Write the points on the board and discuss their effect on the social and economic life of South Africa and Zimbabwe.
Activity 2• Let learners complete the activity in pairs but they should record their
answers in their own books.• Allow some time for learners to share their responses.• Ask the class for solutions to the problems they identified in case studies and
summarised on the board. Put these in a separate column on the board.
Lesson 4
• Read the information on the impact of HIV and AIDS on the population structure (pages 233–235) with the class.
• Use the population pyramids to show the position of HIV/AIDS amongst seven southern African countries in 2000, and the estimate in 2025, which shows a decline.
• Be positive in affirming the role of medication in controlling the effects of HIV and AIDS and preventing HIV Transmission from Mother-To-Child.
Activity 3• Let learners complete questions 1–3 with a partner and question 4 on
their own.• Go through learners’ answers to questions 1–3 with them asking
volunteers to explain their answers to the rest of the class.• Complete questions 5 and 6 with the whole class using discussion.

141M O D U L E 5 • P O P U L AT I O N : G E O G R A P H I C A L K N O W L E D G E
AnswersActivity 11–3
Country % of total population Ranking: % of population living with HIV and AIDS
1 Angola 15,63% Botswana
2 Botswana 16,8% Angola
3 Lesotho 13,8% Swaziland
4 Malawi 6,01% Lesotho
5 Mozambique 6,11% South Africa
6 Namibia 8,18% Zimbabwe
7 South Africa 11,35% Namibia
8 Swaziland 15% Zambia
9 Zambia 7,59% Mozambique
10 Zimbabwe 9,63% Malawi
4. If we know the rate of infection, we can work out how many people in a year will become infected with HIV/AIDS. This can help with planning for medication such as anti-retrovirals, as well as hospitals, clinics and orphanages needed to cope with the epidemic.
5. The disease could place great demands on the social infrastructure that looks after the welfare of the country. The economically-active may be ill so there is no tax to go towards welfare and jobs don’t get done.
Activity 21. If women between the ages of 20–40 become ill, they are unable to
maintain their jobs; they cannot look after their families; they may infect their babies through breast-feeding; also through blood transmission. A family without a mother puts strain on the older daughter or son to look after the family.
2. A possible answer may include: businesses recruit and train three times the number of people for one job, because of illness and the death rate; absenteeism means reduced productivity or output; money is spent on health care and benefits for sick employees.
3. the economy will be less productive; it will slow down; fewer firms will create jobs because of the cost of maintaining a workforce; this means less money in circulation in the economy; it will cause poverty
Activity 31. 30–342. 25–293. females4. A possible answer may include: There will be a decline in the fertility rate
of the country; infants will die if the disease is transmitted through birth or feeding; the economically-active are most affected.
5. during birth; in bodily fluids; through breast-feeding6. Possible ideas may be: (a) medication; cleanliness with regard to bodily
fluids, especially blood; the use of condoms; (b) use of gloves; supply of anti-retrovirals; education about safe sex; access to condoms; (c) posters and information highlighting the problem; access to condoms in toilet facilities; education of travellers; warnings and advice to tourists;

142 S E C T I O N 2 • L E S S O N - B Y - L E S S O N
(d) posters advising how to prevent transmission of the disease; education as to cleanliness; use of gloves; condoms; safe sex; abstinence; (e) education; posters; gloves available in case of a cut; cover cuts or open wounds with plasters; availability of condoms; (f ) education about transmission of the disease; advice on safe sex; abstinence; availability of condoms; use of gloves; covering of open wounds
Informal assessmentActivity 1• Go through the learners’ answers to the activity. Draw the table on the
board before the lesson starts and then complete it using the learners’ responses.
• Use this to assess the learners’ understanding of the challenge of HIV and AIDS in southern Africa, as well as their ability to work with statistical data.
Activity 2• Use learners’ answers and their contribution to the discussions to assess
whether they are able to identify points relevant to a topic and whether they understand the tremendous impact that HIV and AIDS have had on society and the economies of countries.
Activity 3• Take in the learners’ books and mark questions 1–4. Assess learners’
ability to interpret information and to use it to comment on the impact of HIV and AIDS.
Consolidation/extensionConsolidation• Let learners summarise the social and economic effects of HIV/AIDS
and list as many solutions to the problems as they can find.
Extension• Learners can access websites and research the different African countries’
efforts to deal with HIV/AIDS. A presentation can be made to the class either as an oral, or in poster form, or as a PowerPoint.
• Let learners complete Worksheet 18 (pages 294–295) in the Resources section of this Teacher’s Guide. It draws on all the concepts in Module 5 and focuses on interpreting population data.
Learner’s Book page 236
FIELDWORK 2 TERM 3
This fieldwork task is linked to the content of Module 5 and will provide learners with practical experience of graph drawing. Allow learners to complete the graph in pairs and display them in the classroom once they have finished. Their graphs should look something like the one on the next page:
• Provide written feedback to learners on how well they achieved the aims of the activity

143M O D U L E 5 • P O P U L AT I O N : G E O G R A P H I C A L K N O W L E D G E
Answers
2,552,502,452,402,352,302,252,202,152,102,052,00
2000
Line Graph to show Lesotho Population, 2000 – 2010
2005 2010
x y2,10 2000
2,14 2001
2,19 2002
2,23 2003
2,28 2004
2,32 2005
2,36 2006
2,40 2007
2,45 2008
2,49 2009
2,54 2010
The line graph indicates that the population of Lesotho is gradually increasing over time.

144 S E C T I O N 2 • L E S S O N - B Y - L E S S O N
POPULATION: GEOGRAPHICAL
SKILLS AND TECHNIQUES
MODULE 6Term 3Learner’s Book pages 237–247Duration: 4 hours
Population geography is an area of great interest to everyone as it makes us increasingly aware of our environment and the demands made on it for ever-more resources. We are now able to collect and analyse data about population very quickly through the use of Geographical Information Systems (GIS) which has been available in South Africa since the 1990s. This information is used by municipalities for traffic analysis, cabling, sewerage and to obtain and maintain accurate records for schools, clinics and electoral use.
Unlike the GIS, an atlas contains information in print which is static and does not have the same real-time value as GIS data which can be instantly updated on a computer. However, we learn from atlases how to compare information and read maps with understanding.
The interpretation of graphs, population pyramids, photographic information and models is a skill. Part of this skill is the ability to be aware of and recognise bias or the manipulation of information which is presented as facts in the form of text, graphs or symbols.
Curriculum and Assessment Policy Statement (CAPS)
Geographical Information Systems (GIS)• Satellite images related to topics about population.
Atlas skills• Map reading – comparing information from different maps.• Interpreting graphs, population pyramids, photographs, models.
Key geographical skills• Using verbal, quantitative and symbolic data forms such as text, pictures,
graphs tables, diagrams and maps.• Practising mapping, interviewing people, interpreting sources, working
with statistics.• Applying communication, thinking, practical and social skills.• Practising the following specific skills:
– Identifying questions and issues– Collecting and structuring information– Processing, interpreting and evaluating data– Making decisions and judgements– Deciding on a point of view– Suggesting solutions to problems– Working co-operatively and independently.
Key words/conceptspoint of origin; Total Fertility Rate; Gross Reproduction Rate; Net Production Rate

145M O D U L E 6 • P O P U L AT I O N : G E O G R A P H I C A L S K I L L S A N D T E C H N I Q U E S
UNIT 1 Geographical Information Systems (GIS)
TERM 3, WEEK 8
Learner’s Book pages 237–240Duration: 2 hours
Curriculum and Assessment Policy Statement (CAPS) contentGeographical Information Systems• Satellite images related to topics about population.
Resources• Learner’s Book pages 238–240• Websites (optional)
– www.planetgis.co.za – www.ngi.gov.za – www.nationsonline.org– www.maplandia.com– www.maps.google.co.za – www.populationpyramid.net– www.census.gov
Preparation• Read through the unit and familiarise yourself with the content that you
will need to teach. Think about what learners may already know about the topics and any areas of difficulty that you think they might encounter.
Teaching the unit
Lesson 1
• Remind learners what they learnt about GIS in Module 2. Refer them back to this module in the Learner’s Book.
• Read the key questions with learners and then read the unit introduction and the information on page 237.
• Write the words Raster, Vector and pixel on the board. Ask the class what the words mean.
• Refer to the diagrams in Figure 6.1.1 to indicate the difference in presentation of a Raster and Vector model. Ask learners to identify the similarities and differences between A and B. (Answer: The Vector model uses different numbering to indicate population distribution. It shows more discrete areas of population using lines or vectors. The Raster model uses pixels, is less discrete and uses shading to show large numbers of people. Both cover the same area and show population distribution.)
• Refer to Figure 6.1.2 and let learners compare these models in the same way.
• Let learners work in pairs to create a mind-map in their books that summarises the uses of GIS and the advantages and disadvantages of the Raster and Vector models. They should consult the information in Module 6 Unit 1 and Module 2 Unit 1.
146 S E C T I O N 2 • L E S S O N - B Y - L E S S O N
Lesson 2
Activity 1• Learners can work individually to complete questions 1 and 2 and then
go through the answers with the class.• Spend some time discussing questions 3 and 4 with the whole class.
Write learners’ ideas on the board.• Let learners complete questions 3 and 4 in their books, using the
information you wrote on the board.
AnswersActivity 11. Raster model: uses more people in each population group; is built in
layers of groups upon other groups; is able to pin-point exact areas of greater population density; shows information more precisely; shows more information because of higher numbers; uses pixels. Vector model: uses fewer people in each population grouping; it is less precise because large areas are shaded in; uses rectangles and blocks; shows less information because of lower numbers in its groups; uses an ‘either-or’ approach to shading in population.
2. Vector model: lines, nodes, less differentiation; Raster model: pixels, more differentiation
3. GIS can be used in the following ways to classify, store or create layers of information in:a) An urban area: for population distribution; population density; traffic
routing; cable routingb) A rural area: for soil types; for natural vegetation types; for
communication routes; for forestryc) A provincial area: for population distribution; population density;
electoral and census information; access to clinics and schoolsd) A national area; for population distribution; population density;
economic wealth; electricity supply; telecommunicationse) A continental area: resources; vegetation types; rainfall; temperature;
population language groupsf ) A global area: population distribution and density; trade routes;
electrical consumption; CO2 output.4. GIS is important because: it has changed our way of storing information;
speeded up our retrieval of information; aided the integration of different types of information; helped us to create maps which are relevant to the issues at hand, the moment they are required.
Informal assessmentActivity 1• This can be completed and marked in class using a mixture of
independent and co-operative methods.• Write the answers to questions 1 and 2 on the board for consolidation
and discussion. Encourage learners to give additional answers until you feel that you have a good sample of correct answers.
• For questions 3 and 4, let learners swap books and mark each other’s work, comparing it with what you have written on the board during the discussion.

147M O D U L E 6 • P O P U L AT I O N : G E O G R A P H I C A L S K I L L S A N D T E C H N I Q U E S
Consolidation/extensionConsolidation• Encourage learners who find the activity difficult, to go back to Module 2
and read through that before re-doing the activity.
Extension• Encourage learners to spend some time looking at how GIS is used. Let
them access the websites www.planetgis.co.za and www. ngi.gov.za. The latter is the portal for the department of surveys and mapping, and deals with all geo-spatial information.
UNIT 2 Using atlases
TERM 3, WEEKS 8–9
Learner’s Book pages 241–247Duration: 2 hours
Curriculum and Assessment Policy Statement (CAPS) contentAtlas skills• Map-reading – comparing information from different maps.• Interpreting graphs, population pyramids, photographs, models.
Resources• Learner’s Book pages 241–247 • Calculator (optional)• Glass of water
Preparation• Read through the unit and familiarise yourself with the content that you
will need to teach. Think about what learners may already know about the topics and any areas of difficulty that you think they might encounter.
Teaching the unit
Lesson 1
• Read the unit introduction on page 241 with learners.
Activity 1• You may wish to answer these questions based on the satellite
interpretation as a quick question-and-answer session with learners. Alternatively, you can let learners work individually and write the answers in their books.
• Encourage learners to look at the colour of the imagery: the deeper blue signifies greater depth in the ocean off Cape Town. In New York, it is more difficult to distinguish between the darker blue and lighter colour in the water of the Hudson River. The lighter colour would refer to sandbanks and shallow water.
• Comment on the areas of greenery in New York and Cape Town. To the west of the Hudson River in New York is New Jersey which has more open spaces and greenery. This is because land is comparatively less expensive and can be conserved as open parkland.

148 S E C T I O N 2 • L E S S O N - B Y - L E S S O N
• Read through the information in the section, ‘Interpreting graphs’ (page 244) with the class. The interpretation of graphs is something that learners do in most subjects and so will have had practice.
• You will need to explain the three concepts of TFR, GRR and NRR to remind the learners of work done in Module 5.
Activity 2• This activity focuses on reading, understanding and analysing graphs:
the axes, the type of graph, the variables used, and the trend of the information.
• Let learners complete questions 1–6 on their own; questions 7 and 8 require more focus and discussion.
• Use class discussion to complete this part of the activity.• Remind learners that they learnt about negative population growth and
government interventions and incentives offered to boost population figures, in Module 5. Also point out that war causes disruption to normal life, and so there is often an increase in births after a war as people commit to returning ‘normality’ again.
Lesson 2
• Read through the information on the manipulation of data (pages 245–246) with the class and discuss the examples.
• Manipulation of data is an important concept. Have a glass of water which is half filled. Ask the class if it is half full or half empty, and the effect on morale of choosing one description over the other. Explain how truth can be distorted, and why in history we use many sources rather than rely on one source to interpret events.
Activity 3• The activity practices reading and analysing statistical information from
a table. • Remind learners of the time intervals used. Point out that much of this
data is not reliable because it is projected information. We cannot yet tell what the figures will be in 2050.
• Let learners complete questions 1 to 3 on their own and then go through the answers with them.
• Before starting questions 4 and 5 have a general class discussion about the social advantages and disadvantages of economic development in Africa, Asia and Europe. Discuss the issues of foreign aid to countries and changes to traditional lifestyles. For example, ask: ‘Is it a good thing to impose ‘western’ values on Africa and Asia?’
• Complete questions 4 and 5 by discussing them as class. Let learners write these answers in their books for homework as consolidation.
Activity 4• This activity provides further practice in interpreting population
pyramids and so consolidates work covered in Module 5.• Let learners begin the activity in class and complete it for homework.• Allow time at the start of the next lesson to go through the answers.

149M O D U L E 6 • P O P U L AT I O N : G E O G R A P H I C A L S K I L L S A N D T E C H N I Q U E S
AnswersActivity 11. both taken from a great height; both are satellite images; both in colour;
both include densely populated areas; both include waterways/sea; both show urban areas with patches of open parkland; both show road networks
2. Grey is representative of built-up areas as in a typical urban area.3. Green shows trees or open grass areas.4. trees take in CO2 and give out O2 ; this gives the city ‘fresh’ air essential
for our respiration; aesthetically, green is calming and ‘pretty’; green areas provide recreational space
5. There is not enough evidence to support the statement that Cape Town is more densely populated than New York because the satellite images do not give us the scale used, so it is difficult to get precise details of comparative size. However, New York appears more densely populated than Cape Town. This is because the grey (indicating urban areas) appears as a mass; in Cape Town this is more widely spread and interspersed by more greenery indicating open areas.
Activity 21. horizontal axis2. five year interval3. line graph4. NRR: no information available; GRR: 3,25; TFR: 6,755. NRR: 1,0; GRR: 1,25; TFR: 2,66. NRR trend: this begins in 1950 with a value of 2,0 and increases slowly
until 1970 where it is approximately 2,125, before dropping down gradually to 1,0 in 2000. GRR trend: this begins in 1945 at 3,25 and very gradually drops to 1,25 in 2000. TFR trend: this begins at 6,75 in 1945, rising slightly to 6,85 in 1950, and then dropping evenly until 1975 when it reaches 5,3. After this the drop is steeper until 1995 when it is 2,75. It slows to 2,6 in 2000. The trend in each line is to decrease over time.
7. Significance: 1 is the figure for replacement of population; more than 1 would mean more girls would survive to increase the population; less than 1 would mean that there would be no females to continue reproduction
8. The end of World War II was in 1945. The population needed to re-generate to make up for the loss of life; men and women were re-united and family life could continue without the disruption of war.
Activity 31. Africa2. Europe3. To calculate the percentage, subtract the smaller from the larger amount.
Place the difference over the original figure (4,91) and multiply this by 100 over 1, to work out the percentage change. Example: the smaller figure is 2,4 and the larger is 4,91. The difference is 2,51. 2,51
___ 4,91 × 100 ___ 1 = 51,12%4. TFR in Africa will decline because of: civil-wars; starvation; refugee status;
dire poverty as well as access to birth-control; access to education; delayed births; greater wealth; urban living. All these factors affect the number of births a woman may have in her life time. The TFR in Europe will increase because: movement of people into Europe establishing new lives; greater economic freedoms; government intervention to encourage more births.

150 S E C T I O N 2 • L E S S O N - B Y - L E S S O N
5. Asia has the largest number of people. The TFR may be lower than Europe, but because it is a factor of reproduction for a large base population, the outcome will be larger than the higher TFR in Europe, which has a smaller base population figure.
Activity 41. Mexico2. Japan3. negative growth: Japan; rapid growth: Mexico; slow growth: Norway4. Similarities: each have female on the right, male on the left; each have a
vertical axis with age groups; each have a horizontal axis with population figures. Differences: Mexico and Japan have population in millions but Norway in thousands; Mexico and Japan have intervals of 1 million but Norway has intervals of 50 000; Japan shows the smallest number of people in the age group of 0–4 but in Norway and Mexico it is over 85.
5. A visual comparison could be misleading because Norway’s graph is for thousands, while the graphs for Mexico and Japan are for millions.
6. Mexico7. Social problem: there aren’t enough people to look after the aged or
the young. Economic problem: there isn’t enough tax revenue from the economically active to pay for the welfare of the elderly and young.
8. Japan9. Social advantages: there is a large population to help service the needs of
the young and elderly. Economic advantages: tax revenues can go to the elderly for old age homes, health and welfare schemes and pensions, as well as providing for clinics, pre-school and school education and welfare for the young.
10. Women’s oestrogen helps combat the build up of cholesterol which leads to heart attacks and strokes; women have less testosterone which contributes to a less risky lifestyle; women traditionally occupy less dangerous jobs; in many countries, women are made to live at home; there is a chivalric tradition of ‘protecting’ women; women are occupied with the nurture of children and are less exposed to risk.
Informal assessmentActivity 1• Use learners’ response to assess whether they are able to interpret
satellite images.
Activity 2• Go through the answers to questions 1–6 and let learners mark a
partner’s work.• Alternatively, provide an overhead with an answer memorandum on it,
or ask learners for their answers and write them on the board.
Activity 3• Go through the answers to questions 1–3 and let learners mark their
own work.• Take in learners’ books and mark questions 4–5. Note whether learners
have recorded the essence of the class discussion each time.
Activity 4• Mark this in class by asking learners to share their answers. Allow
learners to mark their own work.• This will encourage discussion and consolidate the work.

151M O D U L E 6 • P O P U L AT I O N : G E O G R A P H I C A L S K I L L S A N D T E C H N I Q U E S
Consolidation/extensionConsolidation• For learners who struggled with Activity 1 or need extra practice, let them
use their atlases to find similarities and differences between maps. Look at urban areas, scale, transport routes, suburbs, industrial areas, green areas, forestry and recreational areas. Look for features such as canals, reservoirs, rivers and lakes. Schools, hospitals and churches give a good indication of the level of infrastructure available in a particular area. You can contrast a densely populated city with a smaller town, for example.
• Learners may need extra practice with calculating percentages. You can choose figures from Table 6.2.1 for them to practise.
• Show learners where the continents are and remind them of the concept of the North-South divide between more advanced countries and those that are less economically advanced. Discuss what this means to the people in terms of access to birth control, education, work and opportunities for self-advancement. Mention the role of poverty, malnutrition, refugees, civil wars, genocide, xenophobia, and climate change in threatening the security of people.
• Remind learners about the concepts of population pyramids covered in Module 5. You may find other population pyramids in the atlases, or use those in Figure 6.2.5 to discuss the concepts of dependency ratio; economically active population; the grey population; ageing of a population; a small, young population or a large, young population.
• Ask learners to draw the outline of the three types of population pyramids found in Module 5, and to summarise the pros and cons associated with the shape of each. This will help them recognise the features in a population pyramid, and read the information with greater ease.
Extension• Learners may be encouraged to access more satellite images and contrast
the population density of other areas by accessing the websites: www.nationsonline.org; www.maplandia.com; and www.maps.google.co.za.
• Ask learners to research the effects of World War II and the ‘baby-boomers’, and report back to the class.
• Learners can work in groups, each group taking one of the continents. Ask learners to research demographic trends in the continents. They can look at factors that affect demographics such as wars, migration, economic down or upturns, political interventions, and the effects of severe weather phenomena. The groups can make a poster that summarises their investigation. They can present a PowerPoint slide to the class or report back verbally.
• Learners can access the following websites for more information on population pyramids: www.populationpyramid.net; www.census.gov.
Learner’s Book pages 248–250
REVIEW TERM 3
These activities provide an opportunity for learners to consolidate concepts and skills learnt in Term 3. Learners can complete them in class or as homework. It is suggested that they complete the activities individually as a means of self-assessment.

152 S E C T I O N 2 • L E S S O N - B Y - L E S S O N
You can write the answers on the board for the learners and/or call them out where more appropriate. However, if possible, it is suggested that you photocopy the answers and give them to the learners so that they have them for revision purposes.
Activity 11. a) Africa = 890 _____ 6 433 × 360º ____ 1 = 49,80º
Asia = 3 900 _____ 6 433 × 360º ____ 1 = 218,24º
Europe = 720 _____ 6 433 × 360º ____ 1 = 40,29º
South America = 560 _____ 6 433 × 360º ____ 1 = 31,33º
North America = 330 _____ 6 433 × 360º ____ 1 = 18,46º
Oceania = 33 _____ 6 433 × 360º ____ 1 = 1,84º
b) World population in millions in 2005c) and d)
Africa
North AmericaOceania
South AmericaEuropeAsia
Degrees
Africa 49,8
Asia 218,24Europe 40,29
S America 31,33N America 18,46Oceania 1,84
Total 359,96
Activity 21. j2. h3. f4. i5. a6. b7. c8. d9. g10. e
© Cambridge University Press. You may photocopy this page for use with Study & Master Geography Grade 10.

153M O D U L E 6 • P O P U L AT I O N : G E O G R A P H I C A L S K I L L S A N D T E C H N I Q U E S
Activity 31. It is a campaign by the SA National AIDS Council to encourage
responsibility and co-operation for our sexual behaviour.2. Answers will vary. Possible answers for a list may be from 1–10: use
condoms; get tested every six months; organise a testing campaign; offer support and advice to the people in our lives who may be engaging in risky sexual behaviour; talk to our family, friends and colleagues; organise or host a community dialogue to talk; provide care and support to those affected; work together to stop discrimination to minimise the stigma; wear red ribbons to show our collective support; talk to the youth in our lives to encourage them to delay their sexual debut.
3. Acquired Immuno-deficiency Syndrome4. Human Immunodeficiency Virus5. social: orphans; death of a parent; shorter life expectancy; high infant
mortality. Economic: economic stress for those supporting the family; low productivity at work; high absenteeism; medical costs
6. the sexually active from 15 upwards; young infants through transmission from an infected mother
Activity 41. 6,6 billion2. South3. (c ) declining4. 744 million people (add Oceania, North America and Europe)5. 943 million people6. They are projected to continue rising after 2010.7. Answers may vary. A possible answer is: Less developed countries will
decline in the future if the demographic transition model has any credit. Countries move through stages of expansion until contraction or shrinkage or negative growth occurs.
8. a) Developing: Stage 2b) Developed: Stage 4 or 5
9. a) they are expanding; birth rates are still high, death rates are reducing because of better medical science and access to this, as well as better sanitation and more money
b) They are going through a period of increasing aging of the population as the death rate is reduced, but the birth rate has also decreased due to lifestyle and later marriage, causing a declining population or one where the replacement rate is lower than the death rate.
10. A suggested answer may include: Social problems may be lack of facilities, homes and food for the developing countries and especially the poor. Economic problems for the poor may be: no job opportunities because of lack of education; access to the world’s resources may be fought over as the wealthy continue to need them but the developing countries now want them for job creation.
© Cambridge University Press. You may photocopy this page for use with Study & Master Geography Grade 10.

154 S E C T I O N 2 • L E S S O N - B Y - L E S S O N
Term 4Learner’s Book pages 252–293Duration: 15 hours
WATER RESOURCES:
GEOGRAPHICAL KNOWLEDGE
MODULE 7
This module focuses on these aspects of water as a resource in the world and in South Africa: the water cycle, the oceans, water supply and water provision. It also looks at floods, which are a natural part of the water cycle, and at how floods can be managed.
The time allocation for this module is less than for the other modules, but the content is not as technical. It should therefore be quicker to work through.
Curriculum and Assessment Policy Statement (CAPS)
Water in the world• Different forms of water in the world – liquid, solid, gas.• Occurrence of salt water and fresh water – oceans, rivers, lakes,
ground water, atmosphere.• The hydrological cycle.
The world’s oceans• Oceans as sources of oxygen, food, energy.• Ocean circulation – warm and cold currents.• Ocean currents and their importance for fishing, trade and tourism.• Relationship between oceans and people – pollution, overfishing,
desalination.• Strategies for managing the world’s oceans.
Water management in South Africa• Rivers, lakes and dams in South Africa.• Factors influencing the availability of water in South Africa.• Challenges of providing free basic water to rural and urban
communities in South Africa.• Role of government – initiatives towards securing water – interbasin
transfers; building dams.• Role of municipalities – provision, water purification.• Strategies towards sustainable use of water – role of government
and individuals.
Floods• Causes of flooding – physical and human.• Case study of flooding in South Africa.• Characteristics of floods: analysis and interpretation of flood
hydrographs.• Managing flooding in urban, rural and informal settlement areas.
Key geographical skills • Using verbal, quantitative and symbolic data forms such as text, pictures,
graphs tables, diagrams and maps.
155M O D U L E 7 • W AT E R R E S O U R C E S : G E O G R A P H I C A L K N O W L E D G E
• Practising field observation and mapping, interviewing people, interpreting sources, working with statistics.
• Applying communication, thinking, practical and social skills.• Practising the following specific skills:
– identifying questions and issues– collecting and structuring information – processing, interpreting and evaluating data – making decisions and judgements– deciding on a point of view– suggesting solutions to problems– working co-operatively and independently.
Key words/conceptssalt water; fresh water; aquifer; glacier; groundwater; hydrological cycle; runoff; infiltration; transpiration; water vapour; phytoplankton; photosynthesis; food chain/food web; fossil fuel; off-shore drilling; wave energy; tidal energy; tide; ocean current; warm current; cold current; fishing bank; continental shelf; upwelling; commercial fishing; subsistence fishing; mariculture; pollution; over-fishing; by-catch; desalination; river; lake; dam; free basic water; water transfer scheme/interbasin transfer; hydroelectricity; water conservation; water management; flood; flash flood; storm surge; hydrograph; discharge; flood/storm hydrograph; lag time; floodline
UNIT 1 Water in the world
TERM 4, WEEK 1
Learner’s Book pages 252–258Duration: 2 hours
Curriculum and Assessment Policy Statement (CAPS) contentWater in the world• Different forms of water in the world – liquid, solid, gas.• Occurrence of salt water and fresh water – oceans, rivers, lakes,
groundwater, atmosphere).• The hydrological cycle.
Resources• Learner’s Book pages 252–258• Activity 1: 1 litre plastic cooldrink bottles or measuring cylinders; jars;
teaspoons and droppers; food colouring (optional); water• Atlases• Websites (optional):
– For a good, general article on water resources: http://en.wikipedia.org/wiki/Water_Resources
– www.nasa.gov/vision/earth/.../warm_wetworld.html
Preparation• Read through the unit and familiarise yourself with the content that you
will need to teach. Think about what learners may already know about the topics and any areas of difficulty that you think they might encounter.
• Create a ‘fact/quote’ poster relating to water, for the classroom. Write some quotes and facts on a large sheet of card, for example:– The Pacific Ocean alone covers half the globe. You can fly across it
non-stop for 12 hours and still see nothing more than a speck of land.

156 S E C T I O N 2 • L E S S O N - B Y - L E S S O N
– Between the Earth and its atmosphere; the amount of water remains constant – not a drop more; not a drop less.
– About 1,1 billion people don’t have access to safe drinking water.– 2 million people die every year from unsafe water; most of these are
children.– It takes 1 000 tons of water to produce 1 ton of grain…Aquifer
depletion is largely an invisible threat; but that does not make it any less real.
– Water is the oil of the 21st century.– Wa(r)ter.
Teaching the unit
Lesson 1
• Read through or ask learners to read through the Module 7 introductory paragraph on page 252. Give learners a chance to reflect on the importance of water – as a habitat for plants and animals and as a resource on which all life depends.– Point out that the presence of life on other planets depends on the
presence of water. For example, the moon is lifeless because there is no water.
– If you have used the quotes (see pages 151–152 above), discuss them briefly with the class.
• Read through or ask learners to read through the Unit 1 introductory paragraph on page 253. Most learners should already be familiar with the water cycle. – Ask learners why the water cycle is nature’s water desalination
system. Answer: The process of evaporation desalinates salt water. The water evaporates and the dissolved salt is left behind.
• Work through the section, ‘What are the three forms of water?’ (page 253). Emphasise that water is unique – it occurs naturally as ice, water and water vapour.
• Work through the section, ‘How much of the Earth’s water is fresh water?’ (page 254).
Activity 1• This is a simple, practical activity that shows learners that:
– only 3% of the Earth’s total water supply is fresh water (i.e. 30 ml out of 1 000 ml or 1 litre);
– only 0,3% of the fresh water supply is surface water (i.e. 0,1 ml out of 30 ml) which means that only 0,01% of the Earth’s total water supply is fresh surface water (i.e. 0,1 ml out of 1 000 ml). It really is just a drop!
– If you don’t have measuring cylinders or measuring spoons, use a teaspoon to measure out 30 ml. 1 teaspoon is about 5 ml, so 6 teaspoons makes 30 ml.
– A drop from a dropper equals 0,1 ml
Activity 2 • Read the feature, ‘What’s the difference between oceans and seas?’
(page 255).• In this activity on seas, learners expand their general knowledge.• The learners will need their atlases to identify the seas.• Let them complete the activity individually or in pairs.

157M O D U L E 7 • W AT E R R E S O U R C E S : G E O G R A P H I C A L K N O W L E D G E
Lesson 2
• Read the feature, ‘What’s the difference between glaciers, ice sheets, ice caps and icebergs?’ (page 256). Draw attention to Figure 7.1.5.
Activity 3• This activity is quick to work through. Allow about 2 minutes, once you
have read through the feature.• Let learners volunteer answers. Work with the whole class.
• Work through the section, ‘How does the hydrological cycle work?’ (page 257). – Learners should by now be familiar with the concepts of evaporation
and condensation (from Module 1). Focus on the processes of runoff – which produces surface water supplies in rivers and lakes; and infiltration – which produces ground water supplies.
Activity 4 • This is an easy summary activity on the water cycle – terms and concepts.• Set this activity as a homework task.
Activity 5• Spend the rest of the lesson on Activity 5 – the class quiz.• Get learners fired up to be the first to answer the questions in this quiz.
Let them work in groups of 3 or 4 to complete the task as quickly as possible (i.e. it is a race against time). Alternatively; divide the class into two teams and ask each team a different question until all questions have been completed.
• The learners need access to atlases to help them answer these questions.
Answers Activity 15. a) 3% (i.e. 30 ml/1 000 ml × 100 = 3%)
b) 0,01% (i.e. 0,1 ml/1 000 ml × 100 = 0,01%) 6. The pie chart under ‘Earth’s total water’ in Figure 7.1.2 shows that only
0,01% of fresh water is surface liquid water. How is this calculated? 3% of Earth’s total water is fresh. Now look at ‘Earth’s fresh water’ (a pie chart in the form of a rain drop) in Figure 7.1.2: only 0,01% of this is surface water (rivers and lakes). 0,3% of 3% = 0,3 × 3% = 0,009% which we can round up to 0,01%.
Activity 21. a) Mediterranean and Red Sea
b) Mozambique Channelc) Strait of Gibraltar
3. a) the Yellow Sea is between China and Korea; North Pacific Oceanb) the Labrador Sea is between Canada and Greenland; North Atlantic
Oceanc) the Black Sea is a landlocked sea between eastern Europe; Russia
and Turkey; it is connected to the North Atlantic Ocean via the Mediterranean Sea
d) the Caspian Sea is surrounded Russia; Kazakhstan; Turkmenistan; Iran; and Azerbaijan; it is not linked to any ocean
e) the Aral Sea is between Uzbekistan and Kazakhstan; it is not linked to any ocean

158 S E C T I O N 2 • L E S S O N - B Y - L E S S O N
Activity 31. True2. True3. False4. True
Activity 4 1. A4; B5; C7; D1; E2; F6; G32. a) the higher the temperature; the faster and the more evaporation
b) the more air movement; the more evaporationc) the higher the water content of the air; the less evaporation
Activity 51. a) Nile; Africa
b) Amazon; South Americac) Lake Superior; USAd) Lake Baikal; Russiae) Caspian Sea; Eastern Europe/Middle Eastf ) Dead Sea; Middle Eastg) Lambert Glacier; Antarctica
2. a) Lake Vostokb) Pacificc) Congod) Lake Victoriae) Lake Karibaf ) Okavango Delta
Informal assessment Activity 1• Display the models in class so that learners can compare their model
with others.• Comment on some of the best models.• Use this activity to informally assess learners’ model building skills,
i.e. their ability to depict or represent something.
Activity 2• Go through the answers with the class. Ask learners to offer answers.
Allow learners to mark their own work.
Activity 3• Indicate to learners whether their answers are correct as they offer them.
Activity 4• Ask learners to swap books with a partner and check each other’s work as
you go through the answers with the class.
Activity 5• If learners worked in groups to find the answers, go through the answers
with the class asking learners to offer answers. • If you had a class quiz, award 1 mark to the team for each correct answer
and ½ a mark if the question is correctly answered by the other team.

159M O D U L E 7 • W AT E R R E S O U R C E S : G E O G R A P H I C A L K N O W L E D G E
Consolidation/extensionExtension: • Suggest the website feature, ‘A warmer world might not be a wetter one’
for advanced learners. Website address: www.nasa.gov/vision/earth/.../warm_wetworld.html.
UNIT 2 The world’s oceans
TERM 4, WEEKS 1–2
Learner’s Book pages 259–274Duration: 4 hours
Curriculum and Assessment Policy Statement (CAPS) contentThe world’s oceans• Oceans as sources of oxygen, food, energy.• Ocean circulation – warm and cold currents.• Ocean currents and their importance for fishing, trade and tourism.• Relationship between oceans and people – pollution, overfishing,
desalination.• Strategies for managing the world’s oceans.
Resources• Learner’s Book pages 259–274• Atlases• Website (optional)
– The University of the Western Cape has an education page on coastal conservation: www.bcb.uwc.ac.za/envfacts/facts/coastal.htm
• DVDs (optional): – Blue Planet (2001) by David Attenborough. This is a BBC documentary
series on the oceans. It is available as a 3-disc set – try your public library or a DVD store. These episodes are especially relevant for your Geography learners: The Deep; Frozen Seas and Tidal Seas. Disc 3 of the set includes another documentary, Deep Trouble, which exposes some shocking fishing practices.
– Oceans (2009) is a documentary movie on the Earth’s five oceans.• Facts sheets and posters: Coastcare has a useful Fact Sheet and poster
series. The Fact Sheet series covers a wide range of topics, many of which are relevant for this unit. Coastcare is a project of the Department of Environmental Affairs.
Preparation• Read through the unit and familiarise yourself with the content that you
will need to teach. Think about what learners may already know about the topics and any areas of difficulty that you think they might encounter.
• A word of warning: There is a lot of content to cover in this unit. You will need to plan these lessons carefully in order to get through all the material.
Teaching the unit
Lesson 1
• Read through or ask learners to read through the Unit 2 introductory paragraph on page 259.

160 S E C T I O N 2 • L E S S O N - B Y - L E S S O N
• Work through the section, ‘In what ways are the oceans a useful resource?’ on pages 259–261.– Write up the three main resources on the board: oxygen, food, energy.– For ‘A source of oxygen’, point out that the phytoplankton of the
oceans are as important as the plants on the land. Learners should be familiar with the process of photosynthesis.
– For ‘A source of food’, point out that phytoplankton makes up the ‘grasslands’ of the oceans. Learners should be familiar with the concept of food chains and food webs. Phytoplankton are the producers of the oceans.
– For ‘A source of energy’, emphasise that oceans are a source of: • Non-renewable energy – oil and natural gas• Renewable energy – wave energy and tidal energy.
Refer to Figure 7.2.3 that shows how the tidal energy barrage system works.
Activity 1• In this activity learners summarise the advantages and disadvantages of
fossil fuel energy and wave and tidal energy. • Let learners complete this activity on their own or in pairs.
• Work through the section, ‘What drives the ocean currents?’ (page 261).– Remind learners that they learnt of convection as a method of heat
transfer or heat re-distribution in air in Module 2.
Activity 2• This is a quick activity. Allow about 5 minutes.• Complete the activity with the whole class but allow learners to write the
answers in their books so that they can consult them later when revising.• If there is not enough time, learners can do this activity for homework.
Lesson 2
• If learners completed Activity 2 for homework, go through the answers with the class.
• Work through the section, ‘Why are the ocean currents important?’ (page 263).– Write up the three sectors on the board: fishing, trade, tourism.– For ‘Fishing’; focus on the mechanism of cold upwelling – it’s an
important phenomenon. Refer to the Interest box that explains why the water in Cape Town is often colder in summer than it is in winter.
– Talk briefly about fishing, focusing on these terms: commercial fishing; subsistence fishing; mariculture.
• Read the feature, ‘The sardine run’ (page 264).
Activity 3• This activity is based on the feature on the sardine run.• Let learners work individually on it, writing the answers in their books.
• For ‘Trade’ (page 265), ask learners to think about how ocean currents might affect shipping. Then highlight their effect on fuel consumption and on the European ports in winter.
Activity 4• Do this activity in one of two ways:

161M O D U L E 7 • W AT E R R E S O U R C E S : G E O G R A P H I C A L K N O W L E D G E
1) Collectively as a class: Learners offer suggestions and you write up each correct suggestion on the board until the list is complete.
2) Learners work in groups: The groups race to see who can come up with the full, correct list first.
• Give clues if necessary to help learners complete the list.• Let learners use an atlas to help them.
• For ‘Tourism’ (page 265), ask who has spent a holiday or day visiting the seaside. Ask which coast in South Africa is more popular – east or west – and why. Briefly talk about the effect of cold currents on water temperature and climate.
• Read the feature, ‘Some of South Africa’s beaches’ (page 265).
Activity 5• This activity is based on the feature on some of South Africa’s beaches.• Let learners complete this activity for homework.
Lesson 3
• Go through the answers for Activity 5 with the class.• Begin the section, ‘How do humans impact on the oceans?’ (page 267). • Write up these three aspects on the board: pollution, over-fishing, mining,
settlements and tourism.• For ‘Pollution’ (page 267), refer to the table that summarises the sources
and effects of sea pollution. Ask learners to identify:– the biggest pollutant of the oceans– a big source of nutrient pollution– the effect of dumping sewage in the sea– the problem with plastics and the effect of plastic litter on sea animals.– Read through the case study, ‘The BP/Gulf of Mexico oil disaster’
(pages 268–269) and the feature, ‘The impact of shipping on marine pollution in South Africa’ (page 269).
Activity 6• Learners summarise details of the cause, clean-up and impact of the
BP oil spill. They then answer questions on marine pollution.• Let them work in pairs or individually.• If there is not enough time, learners can complete this activity for homework.
• For ‘Solutions to pollution’ (page 270), ask learners for their thoughts and ideas before going through the information in the Learner’s Book.
Lesson 4
• If learners completed Activity 6 for homework, go through the answers with the class.
• Continue the section, ‘How do humans impact on the oceans?’ by looking at over-fishing.
• For ‘Over-fishing’ (page 270), ask learners what they think the term means.
• If necessary touch briefly on responsible consumerism. For example; dolphins are common by-catch in tuna fisheries. Some brands of tuna carry a ‘dolphin-friendly’ label, although this still doesn’t guarantee that the tuna you eat was caught without dolphins being harmed or killed.

162 S E C T I O N 2 • L E S S O N - B Y - L E S S O N
• For ‘Solutions to over-fishing’ (page 270), focus on Figure 7.2.13 which illustrates five ways of regulating over-fishing.
• Briefly talk about the reason behind fishing permits and fishing seasons and how it is important that even recreational fishermen comply.
• You might also want to briefly talk about abalone poaching and why this is a big problem in South Africa.
Activity 7• This activity is based on the pocket guide for fish consumers.• Encourage learners to make their parents and family members aware of
it (if they aren’t already).• Let learners work individually to complete the activity, writing the
answers in their books.• If there is not enough time for the learners to complete this activity in
class they can do so for homework.
• For ‘Mining, settlements and tourism’ (page 271), ask learners to suggest how these each can harm oceans and coasts.
• Briefly talk about the process of desalination – its advantages and disadvantages.
• Work through the section, ‘How can we protect our oceans and coastal resources?’ (page 274). Ask learners for their thoughts and ideas.
Activity 8• Do this as a class or group discussion activity. You will need to co-
ordinate and guide the discussion.
AnswersActivity 11. Table 1: Fossil fuel energy
Advantages Disadvantages
• Our cars and power stations are designed for using fossil fuels.
• A non-renewable resource. / The energy supply will not last forever.
• Non environmentally-friendly. /Burning fossil fuels generates carbon emissions, which contribute significantly to the greenhouse effect and global warming.
2. Table 2: Wave and tidal energyAdvantages Disadvantages
• Renewable resources. / The energy supply will last forever.
• Limited to coastal areas.
• Environmentally-friendly. / Do not contribute to the greenhouse effect.
• Not many coastal areas have a high enough tidal range to make use of tidal energy.
• Development costs are high.
• Maintenance costs are high because salt water rusts equipment.
Activity 21. a) clockwise
b) anti-clockwise
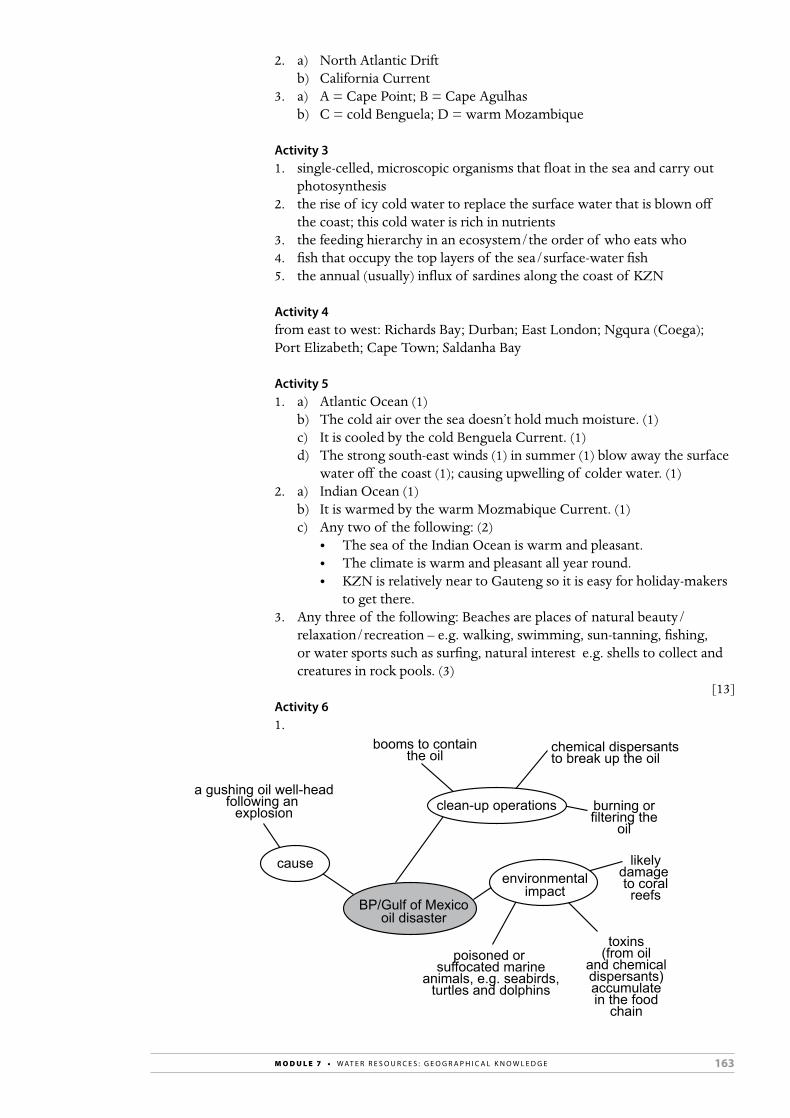
163M O D U L E 7 • W AT E R R E S O U R C E S : G E O G R A P H I C A L K N O W L E D G E
2. a) North Atlantic Driftb) California Current
3. a) A = Cape Point; B = Cape Agulhasb) C = cold Benguela; D = warm Mozambique
Activity 31. single-celled, microscopic organisms that float in the sea and carry out
photosynthesis2. the rise of icy cold water to replace the surface water that is blown off
the coast; this cold water is rich in nutrients 3. the feeding hierarchy in an ecosystem/the order of who eats who 4. fish that occupy the top layers of the sea/surface-water fish5. the annual (usually) influx of sardines along the coast of KZN
Activity 4from east to west: Richards Bay; Durban; East London; Ngqura (Coega); Port Elizabeth; Cape Town; Saldanha Bay
Activity 51. a) Atlantic Ocean (1)
b) The cold air over the sea doesn’t hold much moisture. (1)c) It is cooled by the cold Benguela Current. (1)d) The strong south-east winds (1) in summer (1) blow away the surface
water off the coast (1); causing upwelling of colder water. (1)2. a) Indian Ocean (1)
b) It is warmed by the warm Mozmabique Current. (1)c) Any two of the following: (2)
• The sea of the Indian Ocean is warm and pleasant.• The climate is warm and pleasant all year round.• KZN is relatively near to Gauteng so it is easy for holiday-makers
to get there. 3. Any three of the following: Beaches are places of natural beauty/
relaxation/recreation – e.g. walking, swimming, sun-tanning, fishing, or water sports such as surfing, natural interest e.g. shells to collect and creatures in rock pools. (3)
[13]Activity 61.
chemical dispersantsto break up the oil
environmentalimpact
clean-up operations
booms to containthe oil
burning orfiltering the
oil
likelydamage to coralreefs
poisoned or suffocated marine
animals, e.g. seabirds,turtles and dolphins
toxins(from oil
and chemicaldispersants)accumulatein the food
chain
BP/Gulf of Mexicooil disaster
cause
a gushing oil well-headfollowing an
explosion
164 S E C T I O N 2 • L E S S O N - B Y - L E S S O N
2. a) Ships are likely to run aground and spill their cargoes during bad weather and sea conditions
b) oil spills; spillage of toxic cargoes such as nuclear waste; littering/disposing of rubbish into the sea; introduction of alien marine species attached to hulls or released in discharged ballast water. (Note: Ships need a certain amount of weight (ballast) to keep them stable. Sometimes seawater is carried as ballast.)
Activity 71. Any fish on the green list, for example: anchovy; angelfish; dorado;
snoek; yellowtail2. a) langoustine; prawns; sole
b) trawling damages the seabed – for example, it breaks coral and uproots seaweed; trawling has a high by-catch
3. a) Any four of the following: Only fish above a certain size can be caught. Equipment control: fishing nets must have a minimum net size. Catch limits: A limit is set for the number of fish species that can be caught in an area. Zoning: fishing is controlled in some areas. Quotas: each fishing company is allowed to catch a fixed amount of fish within a certain period.
b) Any fish on the red list, for example: galjoen; seventy-four; white musselcracker; white steenbras
c) they are highly endangered/at risk of extinction4. a) orange
b) No, because it is over-fished and I don’t want to contribute to over-fishing. OR Yes, because it is only a caution/the fish has already been caught.
Activity 8Here are some examples of how tourism can put pressure on coastal environments:• Many people build holidays homes close to the beach. Development
spoils the natural beauty of the coast, causes loss of habitat for animals and seabirds, and destabilises dunes.
• Beach activity, such as the driving of vehicles on the sand, damages dunes. Driving on the beach is now banned.
• Tourists and visitors to the beach often litter! Plastic bags can blow into the sea where they are sometimes swallowed or eaten by marine animals, such as seals that mistake them for jelly-fish.
• Large numbers of beach bathers/swimmers can pollute sea water with bacteria. Small children often wee (or do worse) in the sea.
Also:• The population of small seaside towns can increase dramatically
during the Christmas summer holidays, putting pressure on the towns’ infrastructure such as its water resources. Examples of such towns are Sedgefield and Kenton-on-Sea. Towns such as these are forced to explore desalination options. Although there are advantages to desalination, the process can impact on ocean ecosystems.
Informal assessmentActivity 1• Draw the tables on the board. Complete them using the learners’
answers. This will encourage discussion and consolidate the work.• Allow learners to mark their own work.

165M O D U L E 7 • W AT E R R E S O U R C E S : G E O G R A P H I C A L K N O W L E D G E
Activity 2• Correct learners as you work through the activity with them. Use their
responses to assess how well they are able to interpret the map.
Activity 3• Go through the answers with the class. Ask learners to offer answers.
Allow learners to mark their own work.
Activity 4• Assess learners’ general knowledge as they suggest the names of the
important ports.
Activity 5• Take in the learners’ books and mark the activity. • Assess the learners’ ability to use their geographical knowledge to find
reasons for the statements in the extract. • You can mark this activity according to the mark allocation given in the
Answers section.
Activity 6• Ask two learners to write up their mind-maps on the board. Select
learners who would be able to provide good models of the mind-map.• Let learners use the mind-maps on the board to assess a partner’s
mind-map.• Also take in their books and assess how well they have been able to
summarise the case study. Provide feedback to learners on how well they did this.
• Go through the answers to (2) with the class.
Activity 7• Go through the answers with the class. Ask learners to offer answers. • Allow learners to mark their own work.
Activity 8• Use the discussion to informally assess learners’ sense of environmental
awareness.
Consolidation/extensionConsolidation: • Ask learners who struggled with this unit to draw a simple and
uncluttered mind-map to summarise the unit. You could also give them a photocopy of Worksheet 19 (page 296) to do this. (See Resources in this Teacher’s Guide.)
Extension: • If you have a Coastcare Fact Sheet File (see the Resources section above),
allow learners to browse through it.• If possible, show learners an ocean documentary (see the Resources
section).

166 S E C T I O N 2 • L E S S O N - B Y - L E S S O N
UNIT 3 Water management in South Africa
TERM 4, WEEKS 2–3
Learner’s Book pages 275–284Duration: 5 hours
Curriculum and Assessment Policy Statement (CAPS) contentWater management in South Africa• Rivers, lakes and dams in South Africa.• Factors influencing the availability of water in South Africa.• Challenges of providing free basic water to rural and urban communities
in South Africa.• Role of government – initiatives towards securing water – interbasin
transfers, building dams.• Role of municipalities – provision, water purification.• Strategies towards sustainable use of water – role of government
and individuals.
Resources• Learner’s Book pages 275–284• Websites (optional):
– The sections in this general article on water resources are relevant: Uses of fresh water; Water stress; and World water supply and distribution: http://en.wikipedia.org/wiki/Water_Resources
– The Department of Water Affairs website has a page that list projects and programmes: http://www.dwa.gov.za/projects.aspx
– The excellent State of the Environment website, courtesy of the Department of Environmental Affairs, has a good section on Inland water with pages on: Water quality and Water availability, http://soer.deat.gov.za/23.html
– For information on the Lesotho Highlands Water Project, try these sites: www.dwaf.gov.za/orange/Up_Orange/lhwpover.htm www.lhwp.org.ls/overview/overview.htm
– Water transfer schemes: For information on the Palmiet Pumped Storage Scheme: www.eskom.co.za/live/content.php?Item_ID=186 www.eskom.co.za/content/Palmiet%20FA%20Pg%2001–08.pdf
– For a summary page on free basic water implementation, from which you can also access data for each province (under Project status): http://www.dwaf.gov.za/dir_ws/f bw/department of environmental affairs; South Africa
Preparation• Read through the unit and familiarise yourself with the content that you
will need to teach. Think about what learners may already know about the topics and any areas of difficulty that you think they might encounter.
Teaching the unit
Lesson 1
• Read through, or ask learners to read through, the Unit 3 introductory paragraph on page 275. Point out to learners that this unit is about:

167M O D U L E 7 • W AT E R R E S O U R C E S : G E O G R A P H I C A L K N O W L E D G E
– keeping South Africa’s water balance positive – by not overdrawing on water supplies; and
– keeping South Africa’s bank balance positive – by making sure that water provision for all is done in a financially sustainable way.
• Work through the section, ‘What are South Africa’s water resources?’ (page 275). – Ask learners to name rivers and dams in your region.– Refer to the map of dams and rivers in Figure 7.3.1. Ask learners to
identify the significant rivers and dams in your province.
Activity 1• Learners can do this activity on their own as a written activity, or you can
do it as a class activity – in the form of a quiz.
Activity 2• Read the feature, ‘Lake Sibhayi/Sibaya – South Africa’s largest freshwater
lake’ (page 277). Point out the inset map on Figure 7.3.3 that shows where the lake is.
• Read the feature, ‘Zeekoevlei – once the home of the hippopotamus’ (page 277).
• Let learners work individually to write answers to the questions on the two extracts.
Lesson 2
• Work through the section, ‘What influences the availability of water in South Africa?’ (page 278).
• Ask learners to offer suggestions in answer to the question.• Focus on the two maps that show rainfall distribution (Figure 7.3.5) and
water availability per person (Figure 7.3.6).
Activity 3• Learners refer to the two maps to answer questions.• Let them work in pairs to complete the activity.
• Work through the sections, ‘What is the role of the government in water management?’ (page 279).
• Emphasise that the role of government is to make the laws and policy on the management of South Africa’s water resources and water supply. For example:– The National Water Act is responsible for the protection,
development and use of South Africa’s water resources. The act acknowledges that ‘water is a natural resource that belongs to all people’. It is concerned with:• sustainability: balancing the drive for development with the need
for protection • equity: the fair sharing of the water resources• efficiency: using water without wasting it.
– The Water Services Act deals with:• provision of water to households• sanitation
– Emphasise that the role of municipalities is to provide water.

168 S E C T I O N 2 • L E S S O N - B Y - L E S S O N
Lesson 3
• For ‘Developing water transfer schemes’ (page 279), write up the four main water transfer schemes on the board.
Activity 4• Let learners work in pairs to identify rivers and dams that are part of
water transfer schemes. Ask them to write down their answers.
Activity 5• Read the feature, ‘The Lesotho Highlands Water Project’ (page 280).• Let learners work individually to answer the questions.
Lesson 4
• Work through the section, ‘What is the role of municipalities in water management?’ (page 281).
• Emphasise that responsibility for water supply involves ensuring safe drinking water and responsibility for sanitation involves waste water treatment.
• Read the case study, ‘Challenging the adequacy of free basic water in Phiri, Soweto’ (page 282).
• Have a class discussion in which learners share their opinions. Remember to encourage them to provide reasons for their opinions.
Activity 6• Learners can do this activity on their own or in pairs. • Let them complete (1) to (6) and (9) in class and (7) and (8) as homework.
Lesson 5
• Work through the section, ‘How can we use water sustainably?’ (page 283).
• Point out or ask learners if they have seen the notices in some towns such as Grahamstown and Sedgefield declaring: ‘This is a water-stressed area’.
• Spend some time talking about:– competing demands for water (see the scheme in Figure 7.3.11) – practical and creative ways of saving water.
Activity 7• In this activity learners look at data on past and future water-use.• Learners can do this activity on their own or in pairs.
AnswersActivity 11. Orange/Gariep River; Limpopo River2. Namibia (Orange River); Botswana (Molopo River); Botswana and
Zimbabwe (Limpopo River) – it goes through Mozambique where it empties into the sea; but it doesn’t form part of the boundary
3. Breede River; Olifants River4. uTukela/Tugela River5. Gariep Dam6. they’re concentrated in the highest rainfall region

169M O D U L E 7 • W AT E R R E S O U R C E S : G E O G R A P H I C A L K N O W L E D G E
Activity 21. it serves as supply of water, so it needs to be protected from pollution;
it is part of the iSimangaliso Wetland Park, an important wetland habitat for animals.
2. a shallow lake 3. slightly salty water; it is linked to the sea4. a hippopotamus (in Afrikaans); zeekoe is the Dutch version of
hippopotamus – the lake was named after the hippopotamuses that inhabited it long ago
Activity 31. KwaZulu-Natal, parts of Mpumalanga and the Eastern Cape2. Northern Cape and parts of the Western Cape and Eastern Cape3. The cold Benguela Current makes the water of the Atlantic Ocean on
the west coast of the country cold. This means that the air over this part of the sea brings very little moisture to the neighbouring part of the country.
4. Orange/Gariep River5. rivers and dams and occasionally lakes – for example, Lake Sibaya6. Upington has low rainfall and low water availability; both Cape Town
and Johannesburg have a relatively high rainfall but low water availability. Cape Town and Johannesburg are water-stressed because they are heavily populated cities.
7. Gauteng
Activity 41. Palmiet/Boland water scheme – Palmiet River; Steenbras Dam2. Gariep/Orange River scheme – Gariep/Orange River; Gariep Dam;
Vanderkloof Dam3. Lesotho Highlands Water Transfer Scheme/Project – Katse Dam;
Vaal River4. Tugela-Vaal scheme – Tugela River; Sterkfontein Dam; Vaal River
Activity 51. a) hydroelectricity
b) Excess water from one dam or reservoir is pumped to another dam or reservoir higher up. This store of water serves as an extra water supply and a source of water for generating hydroelectricity – by letting the water flow downhill again.
2. a) Katse Damb) loss of habitat for animals; disrupt the natural flow of rivers; can
reduce the river water supply downstream; trap fertile sediment
Activity 61. from using/drinking water contaminated with cholera bacteria (1)2. it’s the handing over of government-based services that have been
traditionally provided by government to private companies/The transfer of government services to the private sector. (2)
3. it is Zulu for ‘conserve/save water’ (1)4. Many households have a high number of occupants which means the free
basic allowance per person works out to be very low. (2) Some households don’t or can’t pay for the water they use above the free basic quota – sometimes the supply is cut off once the allowance is used up. (2)

170 S E C T I O N 2 • L E S S O N - B Y - L E S S O N
5. 6 000 litres ÷ 30 (assuming 30 days in the month) = 200 litres per day (2) 200 litres ÷ 8 people = 25 litres per person per day (2)
6. 12,5 litres (i.e. 25 litres ÷ 2) (2) 7. Learner’s own answer. Award one mark for completion of the
information. (1)8. Learner’s own answer. Award two marks for completion of the
information. (2)9. Example answers are: No. People have a right to water for basic needs.
The poor people in our society need to be supported by government or subsidised by the rich people in our society. (3) OR Yes. The poor are getting a basic amount of water for free, they should pay for the extra that they use. Not paying for services encourages a culture of non-payment. (3)
[20]
Activity 71. Copy of Table 7.3.12. Percentage increase: × 106 m3 per year/annum
Sector Urban & domestic
Mining & industry
Irrigation & afforestation
Total use
Maximum available
1996 2 171 1 598 12 344 20 045 33 290
2030 6 936 3 380 15 874 30 415 33 290
Percentage increase
319% 212% 128% 152%
3. a) i) For 1996, the total use is 60,2% of the maximum available, i.e. 20 045 ÷ 33 290 × 100
ii) For 2030, the total use is 91,4% of the maximum available, i.e. 30 415 ÷ 33 290 × 100
b) The population is growing and urbanisation and development/economic activity/industrialisation are increasing.
c) irrigation and afforestation – in other words, agricultured) i) increase most: urban and domestic
ii) increase least: irrigation and afforestation
Informal assessmentActivity 1• If learners completed the activity as a written task, go through the
answers with the class. Ask learners to offer answers and allow them to mark their own work.
• If they complete the activity as a quiz, award 1 mark for each correct answer and ask the learners to add up their scores at the end of the quiz.
Activity 2• Go through the answers with the class. Ask learners to offer answers and
allow them to mark their own work.
Activity 3• Go through the answers to the questions and let learners mark a
partner’s book.
Activity 4• Go through the answers with the class. Ask learners to offer answers and
allow them to mark their own work.

171M O D U L E 7 • W AT E R R E S O U R C E S : G E O G R A P H I C A L K N O W L E D G E
• Use the activity to assess the learners’ map reading skills as well as their knowledge of the South African water transfer schemes.
Activity 5• Take in the learners’ books and mark the activity. • Assess learners’ ability to interpret information as well as their ability to
express their ideas in writing.
Activity 6• Go through the answers with the class. Ask learners to offer answers. • Alternatively, you can mark this activity according to the mark allocation
given in the Answers section.You can use this activity to informally assess learners’ comprehension skills and ability to do simple calculations.
Activity 7• Go through the answers with the class. Ask learners to offer answers. • Ask who had trouble calculating the percentage increases.
Consolidation/extensionConsolidation: • For learners who struggled with calculating percentages in Activity 7,
or with the calculation in Activity 6, show them how to do percentage calculations. Then give them Worksheet 20 (page 297) in the Resources section of this Teacher’s Guide, to complete. You could also use this worksheet for revision purposes.
• Let learners complete Worksheet 21 (pages 298–299) in the Resources section of this Teacher’s Guide. It focuses on water resources and their management. You could also use this worksheet for revision purposes.
Extension: • Let learners complete Worksheet 22 (pages 300–301) in the Resources
section of this Teacher’s Guide. It focuses on the debate around fracking for gas in the Karoo.
• Ask learners to find out more about a water transfer scheme. See suggested websites for the Lesotho Highlands Water Project and the Palmiet Pumped Storage Scheme listed in the Resources section above.
• Suggest learners look at and comment on the free basic water implementation status for your province on: www.dwaf.gov.za/dir_ws/fbw.
UNIT 4 Floods
TERM 4, WEEKS 3–4
Learner’s Book pages 285–293Duration: 4 hours
Curriculum and Assessment Policy Statement (CAPS) contentFloods• Causes of flooding – physical and human.• Case study of flooding in South Africa.• Characteristics of floods: analysis and interpretation of flood
hydrographs. • Managing flooding in urban, rural and informal settlement areas.

172 S E C T I O N 2 • L E S S O N - B Y - L E S S O N
Resources• Learner’s Book pages 285–293 • Websites (optional)
– For information on floods for you or your learners: http://environment.nationalgeographic.com/environment/natural–disasters/floods–profile www.esa.int/esaKIDSen/SEMD0LXJD1E_Earth_0.html http://library.thinkquest.org/5818/floods.html
– For an interview: see the article ‘Managing Flooding on the Orange River’ relating to the 2011 floods on http://ipsnews.net/news.asp?idnews=55245
Preparation• Read through the unit and familiarise yourself with the content that you
will need to teach. Think about what learners may already know about the topics and any areas of difficulty that you think they might encounter.
• Collect newspaper cuttings about floods.
Teaching the unit
Lesson 1
• Read through, or ask learners to read through, the Unit 4 introductory paragraph on page 285.
• Work through the section, ‘How are floods caused?’ (page 285) and ‘River floods’ (page 285).
• Emphasise that rivers flood after long or heavy rains.• Point out the margin notes on the deadliest flood in China and the high
incidence of floods in Asia, particularly in Bangladesh.• For ‘Sea floods’(page 286), point out that sea floods can be:
– estuarine – sea tidal surges caused by high tides and storm surges/cyclones can flood river mouths, or the stretch of the river upstream, with sea water
– coastal – storm surges or tsunamis can flood coastal areas with sea water.
• For ‘How human activity contributes to flooding’ (page 286), go through the list of examples. Draw attention to the map of the Netherlands (Figure 7.4.4) to show how in some coastal cities the sea is pushed back, i.e. land is reclaimed from the sea.
Activity 1• This is a quick and easy activity that links to the water cycle.• Let learners work individually and write their answers to the questions.• If there is time at the end of the lesson, go through the learners’ answers.
Otherwise you will need to allow time for this at the beginning of Lesson 2.
Lesson 2
• Work through the section, ‘Can we predict river floods?’ (pages 287–288). – Emphasise that discharge is how much water passes a point in the
river at a particular time. Discharge is velocity × volume. In other words, discharge is a measure of how fast the river flows and the amount of water in the river.
– Point out that a hydrograph shows the change in river flow over time.

173M O D U L E 7 • W AT E R R E S O U R C E S : G E O G R A P H I C A L K N O W L E D G E
– Emphasise that a flood hydrograph shows how a river responds to a particular storm and can be used to predict flooding.
– Talk learners through the flood hydrograph in Figure 7.4.5. For example:• When the rain starts to fall, the runoff first has to make its way to
the river. Also, if infiltration is good, it takes a while for the soil to become soaked with water and the amount of runoff to increase. This is why there is a lag time.
• For flash floods, the river rises quickly soon after the rain begins. In other words, the lag time is short.
Activity 2• In this activity learners practice interpreting a flood hydrograph.• Let them work in pairs to complete the activity.• Go through their answers before moving on to the next section of
the unit.
• Work through the section, ‘What are the effects of floods?’ (page 289). Point out, for the negative effects that:– the primary effects of floods are loss of life and damage to roads,
bridges, pipes, cars, crops, etc.– the secondary effects of floods are contamination of water supplies,
outbreaks of disease, food shortages, etc. These are consequences of the primary effects.
Lesson 3
• Work through the section, ‘How can floods be managed or prevented?’ (page 289)– Point out that these types of structures are used to control floods:
• levees or dykes – slopes or walls or embankments often used for coastal cities
• dams or reservoirs – to store or temporarily hold back flood water• weirs – small overflow dams.
• Read the features, ‘The Thames Flood Barrier’ (page 290) and ‘Planning for a stormy season’ (page 290).
Activity 3• Learners answer questions on the feature, ‘Planning for a stormy season’.• Let them complete this individually or in pairs.• Go through the learners’ answers with them or if the learners need to
complete the activity for homework, do this at the beginning of the next lesson.
Lesson 4
• Work through the section, ‘Case study: The 2010–2011 southern African floods’ (pages 291–293).
• Ask learners what they remember of this flood event or their experience of these floods.
• Read through all the features that make up this section.
Activity 4• Let the learners discuss (1) to (4) as a class or in groups.

174 S E C T I O N 2 • L E S S O N - B Y - L E S S O N
• If you use group discussion allow some time for the groups to share their answers with the rest of the class.
• Let learners complete (5) individually.
AnswersActivity 11. Infiltration is the trickling or soaking of water into the soil and the air
spaces in permeable rock. Runoff is the surface flow of water towards lower ground – it collects in rivers and lakes.
2. a) heavy rainb) steep slopesc) compacted soild) naked land
Activity 21. the amount of water that passes a point at a particular time (2) OR it is a
measure of the volume (1) and speed of water flow (1)2. a) B (1)
b) A (1)c) A (1)d) B (1)
3. A (1)[7]
Activity 31. a rise in sea level caused by strong winds, usually at the time of high tides2. it is flat and low-lying/more or less at sea level; water tables are high3. Proactive means taking the initiative or acting in advance to deal with
an expected difficulty. The city’s plan is proactive because it is taking measures to prevent or reduce the problem of flooding before the rainy winter season/before it takes place.
4. a flood disaster action plan; effective drainage systems5. Water runoff on tarred streets/roads is high. If stormwater drains are
blocked, the streets (and nearby areas) flood.
Activity 4(1) to (4) are points for class discussion. Learners will then incorporate some of these in their mind-maps1. measuring rainfall and river flow (with hydrographs); monitoring the
weather closely2. Informal settlements are often built on river banks (for close access to
water/the river; or because space/land is limited).3. The damage caused by the floods included:
• loss of life• homes flooded and some informal shacks swept away• cars damaged and washed away• crop losses (because of flooding of agricultural fields)• infrastructure such as bridges; roads and stormwater drainage and
sewage systems damaged• rail freight disrupted (because of flooded tracks or danger); causing
export delays and financial losses4. Rescue and relief operations included:
• army placed on standby for evacuations• non-government organisations donated relief supplies• police and traffic police closing flooded roads

175M O D U L E 7 • W AT E R R E S O U R C E S : G E O G R A P H I C A L K N O W L E D G E
5.
2010─2011 floods
location
cause
response
impact
South Africa
other parts of southern Africa,
e.g. Mozambique
warnings on TV and to motorists army and police on standby for evacuations Agriculture Ministerassesses damage to crops relief to those left homeless government prioritises repair
heavy summerrains associated with La Nina
loss of life – more than 100high crop damage – agricultural losses in North West Province and Northern Cape 6 000 people displaced homes and cars damaged and washed away roads flooded and closed to motorists dams full/ over full/ above capacity damage to infrastructure, such aswater supply systems, sewage system and bridges
FLOODS
Informal assessmentActivity 1• Mark this in class by asking learners for their answers and allowing
learners to mark their own work.
Activity 2• Ask learners to swap books and mark each other’s work according to the
mark allocation (given in the Answers section) as you go through the answers with the class.
• Ask who struggled with this activity and provide them with the consolidation activity below. They should complete this for homework.
Activity 3• Go through the answers with the class. Ask learners to offer answers and
allow them to mark their own work.
Activity 4• During the discussion, informally assess learners’ comprehension and
ability to pick out the main points, as well as their understanding of the effects and management of floods.
• Once learners have done their mind-maps, put up an example mind-map on the board. Allow learners to mark their own mind-map, adding anything to it that they may have omitted.
FLOODS

176 S E C T I O N 2 • L E S S O N - B Y - L E S S O N
Consolidation/extensionConsolidation: • For learners who struggled with the hydrograph in Activity 2, or would
like more practice, ask them to refer to the flood hydrograph in Figure 7.4.5 of the Learner’s Book and complete Worksheet 23 (page 302) in the Resources section of this Teacher’s Guide. This worksheet can also be used for revision purposes.
Extension: • Ask learners to find out more about monsoon floods in Asia and
examples of monsoon flood events.
Learner’s Book page 294
FIELDWORK 3 TERM 4
This fieldwork task is linked to the content of Module 7, Unit 3 and will provide learners with practical experience of water resources. It would be best to plan the fieldtrip for during or after Unit 3.
The learners’ reports should include:• a title• headings• the name and location of the fresh water resource• if it is not evident from the name, what type of water resource it is• other water resources it is linked to• who uses the resource and how they use it• the condition or state of health of the resource• the water level• factors that affect the water level
In addition to assessing the above, consider how well learners have structured their reports and made use of words (paragraphs, headings and captions) and visual material (diagrams, photographs and pictures) to communicate their findings.
Extension 3 Water resources (case study)
TERM 4, WEEK 4
Geography topic: Water resources
ResourcesLearner’s Book pages 295–297
Background• This task focuses on Module 7 of Study & Master Geography Grade 10 and
therefore should be scheduled for after the learners have completed this module and had time to do some revision activities. (See year plan on pages 13–15.)

177M O D U L E 7 • W AT E R R E S O U R C E S : G E O G R A P H I C A L K N O W L E D G E
• The skills covered in this task are reading and interpreting graphs; analysing and synthesising information; working with data and doing calculations; writing paragraphs; expressing and supporting a point of view.
• The questions for this task are mainly middle order questions (understanding and applying), which makes this a challenging task.
• Allow 1 hour of class time for the learners to begin the task. Learners who have not completed the task in class, should do so for homework.
Preparing the learners• Remind the learners that they should work on their own and answer
all questions.• Let them read through the task and ask questions about any part of the
task that they do not understand.• Remind them that they can consult Module 7 in the Learner’s Book if
they need to.• Give them a due date for their completed tasks.
The taskYou will find Geography in practice 3 on pages 295–297 of the Learner’s Book. A marking memorandum is supplied below under the heading, Assessment guidance.
Assessment guidanceMemorandum: Geography in practice 3 (Learner’s Book pages 295–297)
1. An allocation of 60 kilolitres of free water every month (1) to needy households (1). (2)
2. It formed a Water Services Trust which has upgraded infrastructure and developed a plan and strategy for water use (1). It is recycling water – sewage effluent water is treated and sold to the mines (1). (Water for mine operations does not need to be high-quality drinking water). (2)
3. a) i) about 55% (1)ii) about 78% (1)
b) Any two of the following: community standpipes; boreholes; water from pools, streams; springs (2)
4. a) Polokwane – 10 kilolitres; Rustenburg – 12 kilolitres (2) b) increases; increases OR decreases; decreases (2)c) Polokwane (1)d) 12 kilolitres – 10 kilolitres FBW = 2 kilolitres 2 kilolitres at R5,10 per kilolitre = R10,20 (2)e) i) 12 kilolitres × R5,68 per kilolitre = R68,16 (2)
ii) 50% of R68,16 = R68,16 × 50/100 = R34,08 (or just divided by 2) (2)
iii) R0 (1)5. a) i) 14% + 10% + 7% = 31% (accept answers that range from
28% to 34% to allow for approximate readings of values from the bar graph) (2)
ii) 21% + 26% + 14% = 61% (accept answers that range from 58% to 64% to allow for approximate readings of values from the bar graph) (2)
b) Rustenburg (1)

178 S E C T I O N 2 • L E S S O N - B Y - L E S S O N
6. Here is an example paragraph; other possible/valid points are listed below. Learners need to include 5 points.
Providing free basic water is a challenge to municipalities for two main reasons: 1) the cost of free basic water has to be recovered from elsewhere –
for example, from other municipality revenue or from the those who can afford to pay more for their water to subsidise the poor. (1)
2) fair assessment of the income or means of households is a big, expensive administrative task. (1)
I think South Africa has made good progress with water services delivery because:• the free basic water policy means that most households in
towns or informal settlements get at least some safe water, which is better than nothing (1)
• a lot more South Africans have access to water now than ever before (1)
• it is very expensive and impractical to supply tapped water to every scattered rural household. (1)
Other valid points are:Providing free basic water is a challenge to municipalities because:• There is the problem of what to do when poor households use
more than their free basic quota. Although this is usually because households have a high number of occupants and the allowance per person is low, it can encourage a culture of non-payment where citizens could expect services for free.
South Africa has made good progress with water services delivery because: • The country’s Constitution has enshrined access to safe water as
a basic need and taken action to achieve this – it is a human rights success story.
South Africa has not made good progress with water services delivery/could have made better progress because:• Many households still do not have access to piped water (1).
For example, according to 2009 figures (see the graph in the section headed, ‘Proportion of households with piped water’, on page 296 of the Learner’s Book), only 55% of residents in the Polokwane municipality have access (1). (Note that most of these are rural residents in scattered settlements.)
• The free basic water allowance of 6 kilolitres per month is too low for households with a high number of occupants or AIDS patients. These households could run out of water before the end of the month.
• There are problems with water quality. In some municipalities, the quality of piped water is much better than in others. (5)
[Total marks: 30]

179M O D U L E 8 • W AT E R R E S O U R C E S : G E O G R A P H I C A L S K I L L S A N D T E C H N I Q U E S
Term 4Learner’s Book pages 298–314Duration: 6 hours
WATER RESOURCES: GEOGRAPHICAL
SKILLS AND TECHNIQUES
MODULE 8
In this module we apply the work we have done with topographical maps, photographs of landscapes, oblique and vertical aerial photos and orthophotos, to study the effect that water makes on the landscape. We work with topographic maps to practise recognising features, especially those associated with running water and the sea.
We use orthophotos together with aerial photos and topographical maps to interpret landforms and practise our map reading skills. Contours, symbols and scale on electronic maps generated by GIS are explored and further practice with Raster and Vector models is given.
Curriculum and Assessment Policy Statement (CAPS)
Topographic maps• Landforms and contours.
Aerial photographs and orthophoto maps• Photographs of landscapes.• Oblique and vertical aerial photos.• Orthophoto maps to be used in conjunction with 1:50 000 maps
and aerial photos.
Geographical Information Systems (GIS)• GIS concepts: spatial objects, lines, points, nodes, scales.
Key geographical skills• Using verbal, quantitative and symbolic data forms such as text, pictures,
graphs tables, diagrams and maps.• Practising field observation and mapping, interviewing people,
interpreting sources, working with statistics.• Applying communication, thinking, practical and social skills.• Practising the following specific skills:
– Identifying questions and issues– Collecting and structuring information– Processing, interpreting and evaluating data– Making decisions and judgements– Deciding on a point of view– Suggesting solutions to problems– Working co-operatively and independently.
Key words/conceptsbraiding; sandbank; island; alluvial soil; mudflat; wetland; spatial objects; spatial database; point; node; line; polygon

180 S E C T I O N 2 • L E S S O N - B Y - L E S S O N
UNIT 1 Topographic maps
TERM 4, WEEK 5
Learner’s Book pages 298–304Duration: 2 hours
Curriculum and Assessment Policy Statement (CAPS) contentTopographic maps• Landforms and contours.
Resources• Learner’s Book pages 298–304• Atlases• Topographic maps 1:50 000 (optional)• Websites (optional)
– www.ngi.gov.za– www.googleearth – www.nationsonline.org
Preparation• Read through the unit and familarise yourself with the content that you
will need to teach. Think about what learners may already know about the topics and any areas of difficulty that you think they might encounter.
Teaching the unit
Lesson 1
• Read the module (page 298) and unit introductions (page 299) and the information on identifying coastal waters and freshwater rivers on maps (page 299) with the learners.
• Ask learners to find Upington in their atlases, or show the class where it is on a map of South Africa.
Activity 1• The learners can begin Activity 1 in class and complete it for homework.• The activity provides consolidation of work related to running water
geomorphology.• Let them work individually on the activity.
Lesson 2
• Go through the learners’ answers to Activity 1.• Ask learners to find Plettenberg Bay on a map or in their atlases. • Ask learners what type of a town it is: commercial, industrial, fishing,
recreational, retirement, educational or judicial centre. • Look at a map of South Africa and try to judge distances of travel by car
to visit Plettenberg Bay from various cities in South Africa. • Discuss the impact of the increase in petrol prices on people visiting
Plettenberg Bay.• Ask learners to find Durban on a map or in an atlas. • Ask learners what sort of town they think it is, based on the size of its
harbour and urban, industrial extent, as well as its beaches.

181M O D U L E 8 • W AT E R R E S O U R C E S : G E O G R A P H I C A L S K I L L S A N D T E C H N I Q U E S
• Talk about the tourist attractions in Durban that they may know about (e.g. uShaka Marine World and the Moses Mabhida Stadium.
• The activities that follow focus on coastal, marine features and rivers affected by tidal action, so remind learners of the work they have completed in Module 7.
Activities 2 and 3• Let learners complete the activities in pairs. They can begin them in class
and complete them for homework.• Activity 2 relates to marine and coastal geomorphology.• Activity 3 focuses on marine features shaped by tidal and wind action, as
well as urban development and the ability to read different types of maps.
AnswersActivity 11. Examples of braiding: below the ‘N’ of Upington 28º27´S; 21º17´–19´E
sandbank: (white in river) 28º27´S; 21º17´–19´E island: ‘Die Eiland’ at 28°27´–28´S; 21º15´E bridge: (across the Orange River) 28°15´S; 21º15´20´́ E (which is one third between 15´ and 16´E)
2. sensible because access to water for irrigation, domestic, commercial and industrial use is assured; not sensible because too close to the water if there are floods
3. approximately 800 m4. they are only between 1–10 m above the level of the river5. The ‘green Kalahari’ owes its name to the commercial farming and
intensive agriculture along the banks, with vineyards and orchards making this a very green area.
6. Alluvial soil is rich in nutrients; it leaves a top layer over the fields that it floods. This acts as a natural fertiliser.
7. There are numerous non-perennial rivers flowing into the Orange River.8. There is evidence of canals and wind pumps.
Activity 21. The Robberg shoreline is rocky. This is shown on the map by the
hachuring, or very close indents made along the shore, and an absence of sand.
2. The Piesang and Keurbooms Rivers have fairly narrow mouths into the sea; there are mud banks in both of them; and they are shallow.
3. Mudflats and wetlands are important to the environment because: they sustain eco-systems; they act as a sponge for the water and reduce the effects of flooding; they are the breeding ground for rare birds; they can be beautiful for painters, photographers and people interested in wildlife and birds.
4. Sea erosion has an effect on:a) Seagull breeding colonies: it removes their sandbank, or sand
spit, habitatb) Tourism: it reduces the available beach area by removing sandc) Water-sports: it may reduce surfers and fishermen because of an
absence of beachd) Estuarine fishing: the fishing will not be protected by sandbankse) Housing, caravan parks and developments along the shore do not
have a safe river estuary; they are exposed to the tidal range of the sea which is dangerous.

182 S E C T I O N 2 • L E S S O N - B Y - L E S S O N
Activity 31. There is little or no evidence of rocks along the Durban shoreline. It is a
sandy area.2. The topographic map section of Durban is clearer than the satellite
image or atlas map. This is because of the scale used in it, which is larger than the others appear to be. This means we see less of the map, but what we do see, is in great detail.
3. The land is built up as an urban area to the north of the harbour. It has road and rail transport including a railway station and industrial area alongside the harbour. This would require fairly level land.
4. Durban harbour is a safe port because: it has two long breakwaters protecting the entrance from sea swells; it is large; it offers protection from the sea; there is ample room for industry, railways and sheds around the harbour.
5. The Umgeni River mouth is closed to the sea; it is a narrow river; there are sandbanks extending from both sides of the river to close the mouth; there is evidence of braiding in the river; there are sandbanks in the river. These factors mean the river is shallow.
6. If the Umgeni River flooded, there would be the following negative effects:a) Industries: there would be flood damage to machinery and goodsb) Recreational areas: games could not be played if fields were flooded;
facilities could be destroyedc) The transport route: this would be disrupted; bridges could be
washed away7. Factors for a safe harbour include: deep anchorage; protection from the
sea swells; protection from prevailing winds; ample space for off-loading goods; ample space for sheds; ample space for railways and roads.
Informal assessmentActivity 1• Mark this in class by asking learners for their answers and writing the
correct points on the board. This will consolidate the work.• Allow learners to mark their own work.
Activity 2• Go through the answers to the questions and let learners mark a
partner’s book.• Alternatively, provide an overhead with the answer memorandum on it,
or ask learners for their answers and write them on the board.• Question 3 can open up discussion on conservation and eco-tourism:
bird-watching, fishing and beach recreation.
Activity 3• Go through the answers to the questions and let learners mark a
partner’s book.• Alternatively, provide an overhead with the answer memorandum on it,
or ask learners for their answers and write them on the board.
Consolidation/extensionConsolidation• Look for marine features on the maps such as headlands, marine beacons,
breakwaters, jetties, and ask learners to find these. • Let learners compare Durban and Plettenberg Bay in terms of what the
two settlements and the coastline have in common.

183M O D U L E 8 • W AT E R R E S O U R C E S : G E O G R A P H I C A L S K I L L S A N D T E C H N I Q U E S
Extension• Learners can research the Gariep River and how it got its various names,
and make a presentation to the class.• Learners can research the history of Port Natal or Durban and discuss its
tourist attractions.• The ‘Garden Route as a tourist destination’ can be a research topic, with
environmental and eco-tourist ventures being a focus of the investigation.
UNIT 2 Aerial photographs and orthophoto maps
TERM 4, WEEK 5
Learner’s Book pages 305–311Duration: 2 hours
Curriculum and Assessment Policy Statement (CAPS) contentAerial photographs and orthophoto maps• Photographs of landscapes.• Oblique and vertical aerial photos.• Orthophoto maps to be used in conjunction with 1:50 000 maps and
aerial photos.
Resources• Learner’s Book pages 305–311• Rulers• Atlases• Calculators (optional) • 1:50 000 topographic maps to use in the lesson or refer to on the
board (optional)• orthophoto maps for the lesson or board (optional)• Website (optional)
– www.aerialimage.co.za
Preparation• Read through the unit and familarise yourself with the content that you
will need to teach. Think about what learners may already know about the topics and any areas of difficulty that you think they might encounter.
Teaching the unit
Lesson 1
• Put three headings on the board: ‘topographic maps’, ‘orthophotos’ and ‘aerial’ photos. Let learners copy these headings into their books and use them to make a summary of the similarities and differences between the three types of maps/photos.
• Remind the class about topographic maps, using the Upington topographic excerpt: scale is 1:50 000 which means 1 cm on the map is a ½ km in reality; the contour intervals are in 20 m with every 100 m in a darker line; altitude is shown with spot heights, benchmarks, trig beacons or contours; there is a reference with symbols representative of what is on the map; magnetic north and the magnetic declination is always shown; true north is shown; it is in colour; there is latitude and longitude along the sides for co-ordinates; it has a four-digit reference and two letters which refer to its exact place amongst some 1 900 other topographic maps in South Africa.

184 S E C T I O N 2 • L E S S O N - B Y - L E S S O N
• Remind the class about orthophoto maps: scale is 1:10 000 which means 1 cm on the map is 100 m in reality; the contour intervals are 5 m with a darker contours every 20 m; spot heights are shown; there is no reference given, but symbols are the same as found on the topographic map; there is no indication of direction, magnetic declination or bearing; latitude and longitude is marked along the side; it is in black and white; it has a four-digit reference and two letters, plus a number – this shows where the precise area is on the topographic map, if cut into 9 squares.
• Remind the class about aerial photographs: scale is not used; no contour lines; no spot heights; no reference or symbols; direction is shown but no magnetic declination given; it may be direct, high oblique or low oblique; shadows can hide features; it can be in colour or black and white. Its advantage lies in showing the real object. However, there is a distortion of reality because of perspective.
• Learners may need help with calculations. Remind them about reading scale. There are 100 000 cm in 1 km, therefore an orthophoto with a scale of 1:10 000 has a scale of 1 cm on the map being equal to 1 __ 10 km, (or 100 m).
• Remind learners about landform recognition and contours from Module 4.• Read through the introduction to the unit (page 305) and the information
on using orthophotos with topographic maps and/or aerial photographs with the class.
Activity 1• Locate the area on a wall map of South Africa and/or let learners do this
in their atlases. Ask learners to trace the Orange River from its source to its mouth. Comment on the landscape it flows through and its value to South Africa. Point out the Gariep Dam.
• This activity focuses on the effects of a river and the features it creates.• Let learners work individually on this activity, begin it in class and
complete it in the next lesson.
Lesson 2
• This is a continuation of working with aerial photos, orthophotos and topographic maps.
• Discuss the role of Upington as a junction town or node, and a central point for the surrounding farmers. Ask learners why tourists would travel to this area.
• Remind learners that the orthophoto distance is multiplied by 100 m because 1 cm is equal to 10 000 cm, which is the same as 100 m.
Activity 2• Let learners work individually on this activity.
AnswersActivity 11. Similarity: both show the same area; both have the same code.
Difference: an orthophoto is in black and white and the topographic map is in colour.
2. 1:10 0003. 5 m4. a) convex slope is steep at the bottom and levels off gradually at the top
b) concave slope is gentle at the bottom but becomes steep towards the top

185M O D U L E 8 • W AT E R R E S O U R C E S : G E O G R A P H I C A L S K I L L S A N D T E C H N I Q U E S
5. a) yes – but if the tide is out, the sand is exposed and it is not a true ‘island’b) yes
6. The sand dunes and sand bars from both sides of the river mouth have joined across the river mouth.
7. too much sand moved by the waves, tidal currents or the wind8. a) it has good views; it has immediate access to the beach
b) sand dunes are unstable, causing cracks in the buildings; sand blows everywhere; high tides or storm damage could erode the foundations
9. the south-west side has a gradual slope; the north-east side is very steep
Activity 21. 2 cm on the orthophoto; calculation: scale of orthophoto is 1:10 000
which means 1 cm on the map is equal to 10 000 cm in reality or 100 m. Therefore 2 cm on the map is equal to 2 x 100 m = 200 m
2. An aerial photo does not have scale.3. yachts and small boats tied up to jetties4. Advantage: an orthophoto has a larger scale than a topographic map; we
see more detail. Disadvantage: an orthophoto is in black and white, and we cannot make out what is in the shadow.
5. Suggested answer: I agree that it is better to use an orthophoto in combination with a topographic map rather than an aerial photo, because they have scale which allows us to measure the size of objects and distance. The contour intervals help us read how steep or gradual a slope is. The shadow on an orthophoto can indicate what time of the day it was taken (there is no shadow on a topographic map), but too much shadow will hide objects. The clarity and detail of an orthophoto is greater than that of a topographic map, because the scale is larger. Information is given on a topographic map in its ‘reference’ or ‘key’, which helps us to read detail. Directions can be given because of latitude and longitude, as well as the topographic and orthophoto maps always pointing to true north.
Informal assessmentActivity 1• Mark this in class by asking learners for their answers and writing the
correct points on the board. Allow learners to mark their own work.• This will encourage discussion and consolidate the work. Activity 2• Mark this in class by asking learners for their answers and writing the
correct points on the board. Allow learners to mark their own work.
Consolidation/extensionConsolidation• Give more practice with measuring distances on: (a) a topographic map;
and (b) an orthophoto.• Allow learners more opportunities to contrast and compare the
topographic map, orthophoto map and aerial photograph.

186 S E C T I O N 2 • L E S S O N - B Y - L E S S O N
UNIT 3 Geographical Information Systems (GIS)
TERM 4, WEEK 6
Learner’s Book pages 312–314Duration: 2 hours
Curriculum and Assessment Policy Statement (CAPS) contentGeographical Information Systems (GIS)• GIS concepts: spatial objects, lines, points, nodes, scales.
Resources• Learner’s Book pages 312–314• Ruler• Cotton/ wool/ string/ shoe lace/ dental floss• Websites (optional)
– www.nationsonline.org.za– www.googlemaps – www.ngi.com.za– www.maplandia.com
Preparation• Read through the unit and familarise yourself with the content that you
will need to teach. Think about what learners may already know about the topics and any areas of difficulty that you think they might encounter.
• You may wish to refer to Modules 2 and 6 to refresh your memory of the GIS component, and Raster and Vector models in particular.
Teaching the unit
Lesson 1
• Read through the introductory paragraph (page 312) with learners. Remind them of GIS work covered in Modules 2 and 6.
• Read through ‘How information is shown on a GIS map?’ (page 312) and refer to Figure 8.3.1. You can ask learners how they would imagine the same map to be shown if it used a Raster model and not a Vector model (Answer: Pixels showing equal altitude would be shaded in various colours with a key for example.) Ask learners how they imagine a non-perennial river would appear on a Raster map.
• Read the information in the section, ‘Spatial objects’ (page 313) with learners.
• Refer to Figure 8.3.2 which shows the tools for a Vector model, and Figure 8.3.3 which shows how these tools are implemented.
Activity 1• This activity is largely a consolidation of work done in Modules 2 and 6. • Let learners begin the activity in class and complete it for homework.
They should work on it individually.
Lesson 2
• Go through the learners’ answers to Activity 1.• Read through the information on scale with the class (page 314). Point
out that the map in Figure 8.3.4 was electronically generated.

187M O D U L E 8 • W AT E R R E S O U R C E S : G E O G R A P H I C A L S K I L L S A N D T E C H N I Q U E S
Activity 2• The learners may need help with measurement. Explain that using
cotton thread or similar material (see Resources section on page 186 of this Teacher’s Guide) they should follow the curves of the road and then straighten out the thread against a ruler in order to get a measurement.
• Let learners to work in pairs as they can help each other with the measuring.
AnswersActivity 11. Vector; both Figures 8.3.1 and 8.3.3 use nodes, lines, polygons and points2. A geographer can create layers of information electronically.3. Example: I would start with soil types, then vegetation, then transport
routes, and water pipes, electricity cabling, and housing.4. Example: A municipality uses electronic data captured by satellite
imagery to understand population density and distribution, peak traffic along routes, to locate all telecommunication cabling, all water and electricity distribution forms, and public or government offices, such as police stations, clinics and schools.
Activity 21. 8,5 cm distance on the map2. 1 cm on the map is equal to 204,08 km in reality. (Usually a line scale is
marked off in 1 cm units. If the actual distance is 1 734,74 km and the measured distance on the map is approximately 8,5 cm, then 1 cm of the line scale will be equal to 1 734,74
______ 8,5 = 204,08km. There may be a little variation in the initial measurement, but take the above as your guide.)
Informal assessmentActivity 1• Mark this in class by asking learners for their answers and writing the
correct points on the board. Allow learners to mark their own work.• (2)–(4) are open-ended questions. Encourage discussion, writing the best
points on the board.
Activity 2• Go through the answers to the questions and let learners mark a
partner’s book.
Consolidation/extensionConsolidation:• Learners will benefit from the opportunity of accessing interactive maps
as found on the recommended websites in the Resources section.• An atlas is good for practising measurements, calculating scale, or using
the scale to calculate exact distances.
Extension• Encourage learners to access electronic maps of the areas in which they
live and then to zoom in and out. If their map does not have a scale attached, it will be impossible to calculate distance. The altitude from which the image is taken will affect what can be seen and learners can research the optimum altitude for seeing road names in the area in which they live.
188 S E C T I O N 2 • L E S S O N - B Y - L E S S O N
Learner’s Book pages 315–320
REVIEW TERM 4
These activities provide an opportunity for learners to consolidate concepts and skills learnt in Term 4. Learners can complete them in class or as homework. It is suggested that they complete the activities individually as a means of self-assessment.
You can write the answers on the board for learners and/or call them out where more appropriate. However, if possible, it is suggested that you photocopy the answers and give them to learners so that they have them for revision purposes.
Activity 11. A. evaporation; D. infiltration2. a) infiltration – D
b) condensation – Bc) precipitation – C
3. 1: 97%; 2: 2%; 3: 1%; 4: 0,01%4. fertiliser5. oil spills
Activity 21. a) the amount of water that passes a particular point in a given time
b) the time between the peak in the rainfall and the peak in the discharge2. A: stream flow after urbanisation; B: stream flow before urbanisation; 3. The removal of vegetation and tarring or paving of surfaces increases
runoff. Wetlands are often drained or destroyed – they play a role in natural flood control.
4. Any two: maintenance of stormwater drains; no settlements on the banks of rivers below the floodline; river maintenance; flood disaster action plan; etc.
Activity 31. high tidal range and, constricted/narrow bay2. A barrage system is a barrier system. As the tide flows in, the barrage/
barrier/gates are opened. Before the tide flows out, the gates are closed. The water level behind the barrier is then higher than the level of the sea. Falling water from behind the barrier is then used to turn/drive turbines to generate electricity – in the same way that hydroelectricity is used to generate a dam.
3. the trapping of sediment4. no carbon emissions; a renewable form of power generation5. no, tidal range isn’t big enough6. Cabora Bassa Dam, Lesotho Highlands Water Project, Gariep Dam,
Palmiet water transfer scheme/Steenbras Dam
Activity 41. low rainfall, uneven rainfall, not many big rivers2. Tourists significantly increase the number of water-users during the
December holiday season. December is the dry season in the southern Cape.
© Cambridge University Press. You may photocopy this page for use with Study & Master Geography Grade 10.

189M O D U L E 8 • W AT E R R E S O U R C E S : G E O G R A P H I C A L S K I L L S A N D T E C H N I Q U E S
3. Salt is removed from sea water – either by distillation or reverse osmosis (filtering through a membrane with very small holes.) In the process of distillation, the water is boiled so that it evaporates; the water vapour is then cooled so that it condenses. The condensed water is salt-free.
4. sea water is plentiful; salt is a by-product5. It is an energy-expensive process that requires electricity to heat or pump
the water. Maintenance costs are high because the salty sea water rusts equipment.
6. household water that has been used for washing7. Any one of: cholera, typhoid, amoebic dysentery, hepatitis 8. • Long-term planning to meet growing water demands
• Implementing innovative/creative technologies, such as water harvesting and water recycling
• Monitoring/ensuring water quality of stored water/water in dams and reservoirs/of supplied water/healthy dams.
Activity 52. Zimbabwe and Zambia3. Sinyati River (Some atlases may not show this in detail; Google maps will
show it)4. yes5. yes; it collects water from the catchment area surrounding it6. Lake Kariba is approximately 220 km long7. People are forced to move their homes, their work, their subsistence
agriculture; wildlife has to be moved or it will drown.8. development removal9. Answers will vary. A suggested answer may include: Social results of a
large lake are: loss of recreation, loss of housing, loss of wildlife, loss of agricultural land, villages and cultural history, but bird-watching and fishing will increase. Economical results are: tourism will grow because of bird-watching and fishing; commercial fishing and hydroelectricity will occur, there is the creation of industry and jobs, irrigation and farming because of abundant water.
10. the border between Zambia and Zimbabwe
Activity 61. There is so much of the blue oceans and seas visible from space.2. Tiros, meteosat3. In layers, an oceanographer can have the area of the Indian ocean, off
the coast of Durban mapped in spatial extent, then a layer of its differing temperatures, and water density variations, and water depth, and ocean currents.
4. GIS could show: (1) the area; (2) the access routes; (3) the closest clinics.
Activity 71. Learners work independently and locate this on the map.2. steep-sided gorge or ravine3. move in a west direction4. approximately 5 km (use a piece of twine along the path of the map)5. No, people walk approximately 4 km in one hour. This may take longer
because it is along the coast and care has to be taken. It also passes a stream entering the sea.
6. 40 m
© Cambridge University Press. You may photocopy this page for use with Study & Master Geography Grade 10.

190 S E C T I O N 2 • L E S S O N - B Y - L E S S O N
7. There are two river mouths to negotiate: the Elandbos and Lottering Rivers. The contours are steep on either side of these mouths, making climbing a necessity and possibly swimming – depends on the tide.
8. Contours are closely packed which indicates steep slopes. This demands fitness and agility as you are climbing up and down all the time.
9. No. There are power/telephone lines near Oakhurst Hut but these are on the plateau above where you will be hiking.
10. A suggested answer would include: This area sustains the ecology as it is a nature reserve. There is no pollution or noise, and it is unspoilt. The views of the ocean and the river valleys will be lovely. It offers a place to enjoy recreation in a healthy way, and encourages eco-tourism.
Learner’s Book pages 321–340
EXAMINATION PREPARATION
These exam papers help learners to prepare for the end-of-year examination. Learners can complete the papers in class or as homework. It is suggested that they complete them individually as a means of self-assessment.
You can write the answers on the board for learners and/or call them out where more appropriate. However, if possible, it is suggested that you photocopy the answers and give them to learners so that they have them for revision purposes.
Memorandum: Model Exam Paper 1: The Atmosphere, Geomorphology, Mapwork (Learner’s Book page 322)TOTAL MARKS: 150Question 1: The Atmosphere (60 marks)1.1.1 H1.1.2 F1.1.3 D1.1.4 E1.1.5 B1.1.6 A1.1.7 C1.1.8 G1.1.9 O1.1.10 I1.1.11 J1.1.12 N1.1.13 K1.1.14 L1.1.15 M
[15]
1.2.1 A = nitrogen, B = oxygen, C = argon/noble gases (3)1.2.2 The weight of the air (1) in the atmosphere pressing down (1) on the
Earth’s surface (2)1.2.3 Air pressure decreases (1), because air becomes less dense/air
molecules become further apart (1) as the pull of gravity decreases (1). (3)
© Cambridge University Press. You may photocopy this page for use with Study & Master Geography Grade 10.

191E X A M P R E P A R AT I O N
1.2.4 Temperatures are low at high altitude/Temperature decreases with altitude (1) because as the air becomes thinner, less solar radiation is absorbed (1). (2)
1.2.5 0,65 °C (1), lapse rate (1) (2)1.2.6 The snow line would be lower (1), an effect of latitude (1) (2)1.2.7 Snow reflects a large amount of insolation/has a high albedo. (1)
[15]
1.3.1 a H (1) b D (1) c B (1) d G (1)1.3.2 a The use of chlorofluorocarbons/CFCs as propellants in aerosol
cans and coolants in fridges). (2) b banning CFCs/replacing CFCs with HFCs (1) c Any one: increased UV exposure; skin cancer; eye cataracts;
killing of phytoplankton; disruption of photosynthesis; reduced crop yields (1)
1.3.3 a The insulating effect of gases in the atmosphere (water vapour, carbon dioxide and methane) which trap heat/keep the Earth warm (2)
b Greenhouse effect increases/More heat is trapped. This leads to global warming – the gradual increase in the Earth’s average temperature – and overall climate change. The effects of climate change include: melting of polar ice and glaciers, rise in sea levels, weather extremes. (3)
c Any one: burning of fossil fuels (coal for power, petrol and diesel for transport), deforestation (clearing land for agriculture), industrial activities such as smelting (1)
d Any one: large-scale, intensive cattle farming; large-scale, intensive rice cultivation (1)
[15]
1.4.1 Moist air blowing off the sea/onshore (1) is pushed up the side of the mountain (1) – the windward side . As the air rises, it cools and condenses (1). Thick cloud forms and rain falls mainly as drizzle on the windward side (1). This is relief/orographic rainfall (1). As the air descends on the other side (1) – the leeward side – it warms, and the rain dries up (1). This leeward side of the mountain and the lowlands of the Klein Karoo lie in the rain shadow (1) and are therefore dry. (8)
1.4.2 a A (1) b As air rises, it cools (because temperature decreases with
altitude). (1) c Moisture condenses when the air mass reaches the height –
condensation level (1) – at which its temperature is lowered to the dew point (1). (2)
d airport = 550 mm, Newlands = 2 000 mm (2) e Rainfall around Cape Town/the Cape Peninsula varies a lot
OR Mountains can create their own weather. (1)[15]
[60 marks]
© Cambridge University Press. You may photocopy this page for use with Study & Master Geography Grade 10.

192 S E C T I O N 2 • L E S S O N - B Y - L E S S O N
Question 2: Geomorphology (60 marks)2.1.1 C2.1.2 D2.1.3 C2.1.4 B2.1.5 B2.1.6 B2.1.7 A2.1.8 D2.1.9 A2.1.10 A2.1.11 C2.1.12 B2.1.13 B2.1.14 A2.1.15 D
[15]
2.2.1 granite, gabbro, dolerite (3)2.2.2 granite; quartz, feldspar and mica (4)2.2.3 Stage 1: Magma welled up beneath the Earth’s surface (1) and
solidified to form a massive batholith (A) (1). This is a form of igneous intrusion (1). Stage 2: Over millions of years, the overlying layers of rock were eroded to expose (1) the round top of the batholith (B). In this form it is known as a dome or monolith (1). Stage 3: Over time, cracks and joints in the dome are eroded (1) to form rounded cornerstones/a stack of rocks (C) (1). This landform is called a tor (1). (8)
[15]
2.3.1 paragraphs 3 and 4 (2)2.3.2 A scientific theory that states that the Earth’s outer crust/lithosphere
is divided into plates that move and interact with each other at the boundaries (2)
2.3.3 a limestone (1) b continental drift (1) c mantle (1) d subduction (1)
2.3.4 a i) basalt (1) ii) granite (1) b It is melted by the pressure and the heat. (1) c an ocean trench, e.g. Mariana Trench (2) d island arcs, e.g. the Philippines/Tonga/the Aleutian Islands (2)
[15]
2.4.1 convergent (1), ocean-to-continent (1) (2)2.4.2 Pacific Ring of Fire (1)2.4.3 three (1)2.4.4 stratovolcano/composite volcano (1)2.4.5 It can still erupt/it erupted less than 300 years ago. (1)2.4.6 moment scale (1)2.4.7 It measures the total energy of an earthquake/it measures not only
size but duration. (1)
© Cambridge University Press. You may photocopy this page for use with Study & Master Geography Grade 10.

193E X A M P R E P A R AT I O N
2.4.8 Until the main earthquake has taken place, it is difficult to tell the difference between foreshock and earthquake. (1)
2.4.9 a large destructive wave caused by an earthquake (1)2.4.10 Any two: drown people and animals; wash away and damage
settlements and infrastructure; infiltrate soil with salt water, damaging crops or vegetation; deposit large amounts of debris (2)
2.4.11 The generators were damaged by tsunami flood water (1). As a result, the cooling system shut down/the reactors overheated (1). (2)
2.4.12 The walls or foundations of the dam can crack. (1)2.4.13 by damaging or toppling telephone lines, cellphone masts and
internet cables (1)[15]
[60 marks]
Question 3: Mapwork (30 marks)1.1 True bearing (measured with a protractor) from Seal Island to the Mossel
Bay Station is 142°. Declination is 24°6’ west of true north, so add this to 142°. This gives a
bearing of 166°6’. (3)1.2 There are three spot heights in the fields: 11 m, 14 m and 10 m. So: 11 + 14 + 10 = 35 ÷ 3 = 11,67 m. (4)1.3 Measure the distance between Seal Island, and the mouth of the Mossel
Bay Harbour with a ruler or simply on a piece of paper and place this on the scale line of a 1: 50 000 map. The true, straight line distance is 7,2 cm = 3,6 km. Allow 10% error. (3)
[10]2.1.1 False 2.1.2 True2.1.3 True 2.1.4 False (4 × 1 = 4)
2.2 Accept any of the following answers:a: sand bar, river mouth b: beach, coast line, coastc: rocks, rock outcropsd: vlei, marsh, wetlande: river, stream, channel, meanderf: hill, koppieg: stream, gap, poort, gorgeh: ridge, spur (8 × 1 = 8)
[12]
3.1 A GIS is a computer-based software program used to plot and store spatial (geographical) information. Their use is unlimited; from planning purposes, to storing information about physical Earth features. (3)
3.2 Raster and vector models. Raster uses a collection of dots or pixels (bitmap) while vector uses lines (paths) or shapes to plot and store information in layers. (4)
3.3 Remote Sensing is the technique of obtaining information (for example, by camera) of an object or landscape without being directly in contact with that object or landscape. (1)
[8][30 marks]
TOTAL: 150 marks
© Cambridge University Press. You may photocopy this page for use with Study & Master Geography Grade 10.

194 S E C T I O N 2 • L E S S O N - B Y - L E S S O N
Paper 2Question 1: Population Geography (60 marks)1.1.1 a Population distribution refers to the spread of people over the
landscape. Population density refers to how densely clustered/grouped/concentrated the population is.
b Biotic refers to living things (plants and animals). Abiotic refers to non-living things in the natural landscape, usually the geology.
c Ecumene areas are areas that are inhabited by people. Non-ecumene areas are areas that are not, or cannot support people.
d Birth rates refer to the number of people being born in a population. Death rates refer to the number of people dying in a population.
e Age refers to how old people are. Gender refers to the sex of people (male or female). (5)
1.1.2 a Dependency ratio: the number of people dependent on a bread winner
b Population pyramid: a statistical pyramid-shaped graph of age groups and genders for a population
c Population growth: describes the increase, or rate of increase, in a population
d Demographics: to do with the study and statistics relating to populations (people)
e Overpopulation: where there are too many people to be supported by the available resources (5)
1.1.3 a Because of the level of development and wealth. Developed countries have healthier populations, with better medical resources, so people live longer.
b The movement of people into or out of an area, or country. c People emigrate (leave) a region or country and immigrate
(arrive) in another region or country. d When people move from the countryside (rural areas) to the
towns and cities of a country. e A very large city, typically with over 10 million people. (5)
[15]
1.2.1 Because of both natural factors and human factors. People settle and thrive in areas which offer the following:
• a climate that is neither too hot nor too cold • natural vegetation that is mainly made up of grasslands • soil that is deep and fertile, possibly left by rivers flooding their
banks • water supplies that are reliable • a physical landscape that is flat • the absence of insects that cause diseases such as malaria and
sleeping-sickness. The following human (biotic) factors encourage dense settlements: • the ability of people to create extra or surplus food from the
cultivation of the land • an effective way of organising labour with different roles taken on
by different people • the ability to organise communication systems for trade and
social purposes
© Cambridge University Press. You may photocopy this page for use with Study & Master Geography Grade 10.

195E X A M P R E P A R AT I O N
• the centralisation of power in an area• a peaceful and structured government. Conversely, regions that do not have all or some of the above
advantages will be sparsely settled. (8)1.2.2 i) If the birth rate is greater than the death rate, the population will
grow (increase in numbers). ii) If the death rate is greater than the birth rate, the population will
decline (decrease in numbers). (2)1.2.3 The fertility rate is the average number of births (children born) to
women of child-bearing age in a country in their lifetimes. South Africa’s fertility rate is decreasing, which means women are having fewer children. (5)
[15]
1.3.1 Relatively young; There are bulges in the lower part of the pyramid (children and young adults). The pyramid is more compact towards the top, meaning fewer old people in comparison to young people. (5)
1.3.2 75 to 79, and 80+. More women. (3)1.3.3 Because everyone ultimately dies, and the chances of dying increase
with age. (3)1.3.4 The world’s population has grown rapidly since around the year 1800
because of technical advancement, meaning food security, better health and nutrition, and a higher standard of living for many people. Diseases that previously killed millions have been largely brought under control. (4)
[15]
1.4.1 Urbanisation is the migration of people from the rural areas to the urban areas. It is a world-wide phenomenon. It is driven by push and pull factors (rural poverty is a push factor, job opportunities in the city is a pull factor). (3)
1.4.2 Developing countries, because a transition is underway. In developed countries, urbanisation took place up to two centuries ago (during and after the Industrial Revolution). (5)
1.4.3 Any four: Mexico City, London, New York, Tokyo, Delhi, Shanghai, São Paulo, Dhaka, Cairo, Beijing (4)
1.4.4 Overcrowding, slums, shortage of water, crime, disease, traffic jams. (3)
[15][60 marks]
Question 2: Water Resources (60 marks)2.1.1 a Water vapour is water in gas (gaseous) form; ice is water in solid
form. b Fresh water is (usually) drinkable water in lakes and rivers; salt
water has high concentrations of sodium chloride (salt) and is found in seas and oceans.
c Oceans are very large areas of sea water surrounding continents; seas are sea water surrounded by land masses.
d Glaciers are snow-fed bodies of ice on land; icebergs break of from glaciers or ice sheets when these reach the sea, and float in the oceans.
e Ice caps are found in high altitude, continental areas; ice sheets cover whole islands or continents. (5)
© Cambridge University Press. You may photocopy this page for use with Study & Master Geography Grade 10.

196 S E C T I O N 2 • L E S S O N - B Y - L E S S O N
2.1.2 a Runoff: rain water running over a land surface b Transpiration: water given out by the leaves of plants and
returned to the atmosphere c Evaporation: water returning to the atmosphere from a solid or
liquid form, to a gas (water vapour) d Condensation: the change of water vapour (gas) to liquid water e Precipitation: rain, snow or hail, originating in the atmosphere
(clouds) (5)
2.1.3 a They are used for fishing, as transport routes, for desalination of water, and for recreation.
b Wave energy is generated from wave action, and tidal energy from the power of incoming and outgoing tides.
c Differences in temperature in the oceans. d Any pollution (usually liquid or solid) impacting on the ocean and
marine life. e Overfishing happens when more fish are caught than are replaced
through natural breeding. (5)[15]
2.2.1 ‘The water cycle’ or ‘The hydrological cycle’ (1)2.2.2 1: evaporation
2: precipitation (rainfall) 3: moisture (or wind) 4: evapotranspiration (or transpiration, or evaporation) 5: cloud 6: glacier 7: infiltration (or seepage) 8: runoff (or river) 9: throughflow (9)
2.2.3 Oceans provide fishing grounds, control climate, are used for trade and transport, sea water can be desalinated, used as a source of energy (tides), offshore oil and gas fields. (5)
[15]
2.3.1 a) South Africa has a very long coastline. This makes it difficult to control some activities along the coast. The oceans around South Africa are impacted by oil pollution from passing ships, raw sewerage, which is pumped into the oceans at places, overfishing and, importantly, poaching of marine resources such as abalone and rock lobster. Illegal mining, dumping and fishing in marine reserves is also a problem. All these things impact on our oceans. (8)
2.3.2 By educating people about the oceans and their importance, by declaring areas as marine reserves, by patrolling our coastal waters and by combating poaching. (4)
2.3.3 Storage dams are large bodies of fresh water, created by blocking the flow of a river with a dam wall. Because South Africa is such a dry country, water is a valuable resource, and storage dams help to control floods, and store water for urban areas in the interior, as well as provide water for agriculture. (3)
[15]
© Cambridge University Press. You may photocopy this page for use with Study & Master Geography Grade 10.

197E X A M P R E P A R AT I O N
2.4.1 Water is scarcer in some parts of South Africa than it is in others. The availability of water varies with place and time of year. South Africa’s water supplies are under pressure because:
• It is a semi-arid (dry) country with an annual rainfall that is below world average.
• Rainfall is uneven – the west side of the country receives a lot less rain than the east, and rainfall is seasonal, meaning there will be a dry season each year.
• It has only a few big rivers such as the Vaal, the Gariep (Orange) and the Limpopo.
• The demand for water grows as the population grows, and as urbanisation and industrialisation increases.
• Wasteful use of water and water pollution threatens water supplies. (8)
2.4.2 Four important water transfer schemes in South Africa: • Tugela-Vaal scheme; transfers water from the uThukela (Tugela)
River in KwaZulu-Natal to the Vaal River via the Sterkfontein Dam.
• Lesotho Highlands Water Project transfers water to the Vaal River from the upper Gariep (Orange) River basin in Lesotho.
• Gariep (Orange) River scheme; Eskom generates hydroelectricity at Gariep Dam and Vanderkloof Dam. The scheme provides irrigation water in the Gariep (Orange) River basin and in the Eastern Cape, via the Orange-Fish tunnel.
• Palmiet/Boland water scheme – pumps excess water from the Palmiet River in the winter rainfall season into an upper reservoir (Rockview Dam). It is then transferred to Steenbras Dam for Cape Town consumers. (5)
2.4.3 When a river cannot cope with the amount of water arriving in its catchment, water levels rise, and the river may burst its banks. Surrounding, low-lying areas are then flooded. People living close to the river are at risk, as are people trying to cross swollen rivers. Both property and lives may be lost. (2)
[15][60 marks]
Question 3: Mapwork (30 marks)1.1 Map distance is 5,5 cm. Scale 1 cm represents 4 km. So, real distance is
5,5 × 4 = 22 km. (3)1.2.1 The point on North Pier and Addington Hospital: 281° (1)1.2.2 Battery Beach and Country Club Beach: 360° (1)1.3.1 1:50 000 (1)1.3.2 1:10 000 (1)1.4 Because it is a natural harbour or bay, entirely enclosed by land except for
the mouth of the port. (2)1.5 Any two: Sastri College, Howard College (University of KwaZulu-Natal),
Durban Training College. (1)[10]
2.1.1 False2.1.2 False2.1.3 True2.1.4 True 2.1.5 False (5 × 1 = 5)
© Cambridge University Press. You may photocopy this page for use with Study & Master Geography Grade 10.
198 S E C T I O N 2 • L E S S O N - B Y - L E S S O N
2.2.1 Suburbs’ names and street patterns in the northern half of the map indicate it is more residential, while roads, railway lines, the harbour, oil tanks and warehouses suggest industrial land use in the south. (2)
2.2.2 At least three: Oil tanks, dry dock, Umbilo Industrial Bayhead, Fish Wharf, Yacht Club, Ocean Terminal (3)
2.2.3 North: more green spaces, Greyville race course, various parks, botanical gardens. (2)
[12]
3.1 A GIS is made up of a number of maps (spatial layers) in digital format, one on top of the other. These, combined, can provide a variety of information and data about an area. (3)
3.2.1 A = point (or node) B = line C = polygon (3)3.2.2 Node (1)3.3 True (1)
[8][30 marks]
TOTAL: 150 marks
© Cambridge University Press. You may photocopy this page for use with Study & Master Geography Grade 10.

3. FORMAL ASSESSMENT
199
1. Assessment in Geography in Grade 10 200
2. Programme of assessment 200
3. Formal assessment: tasks, tests and examinations 201
4. Recording and reporting 205
5. Photocopiable assessment resources 205

200 S E C T I O N 3 • F O R M A L A S S E S S M E N T
1. ASSESSMENT IN GEOGRAPHY
IN GRADE 10
Assessment in Grade 10 is made up of:• informal or daily assessment• formal assessment.
In Study & Master Geography Grade 10:• informal assessment advice in given as part of the lesson guidance in the
Lesson-by-lesson section (pages 18–192) of this Teacher’s Guide• formal assessment guidance and assessment tools are provided below.
2. PROGRAMME OF ASSESSMENT
The programme of assessment provided in Study & Master Geography Grade 10 is in line with the Curriculum and Assessment Policy Statement for Geography and the Abridged Section 4: FET Grade 10–11 CAPS amendments (implementation in January 2020), and thus spreads out the formal assessment tasks throughout the year. It is made up of two tasks, two controlled tests and two examinations. For promotion purposes, a year mark is added to the end-of-year examination mark. The year mark is made up of marks obtained in the tasks, controlled tests and mid-year examination. This is reflected in the table below.
Term Week Type of formal assessment
Content and skills focus of assessment
Teacher’s Guide page reference
Total number of marks
Contribution to year mark
Term 1 8 Controlled test 1 The atmosphere pp. 206–209 60 marks 20 marks
Term 1 10 Assessment Task 1: Essay
The atmosphere pp. 210–212 100 marks 20 marks
Term 2 7 Assessment Task 2: Mapwork
Geomorphology pp. 212–216 60 marks 20 marks
Term 2 9–10 Mid-year examination
Work covered in Terms 1 and 2
pp. 221–234 150 marks 20 marks
Term 3 8 Controlled test 2 Population pp. 217–220 60 marks 20 marks
Term 4 9–10 End-of-year examination
Work covered throughout year
pp. 235–257 300 marks 300 marks
For more information on formal assessment, see the CAPS in Section 5 of this Teacher’s Guide.

201S E C T I O N 3 • F O R M A L A S S E S S M E N T
3. FORMAL ASSESSMENT: TASKS,
TESTS AND EXAMINATIONS
Controlled test 1 The atmosphere
TERM 1, WEEK 8
Geography topic: The atmosphere
ResourcesPhotocopy of Controlled test 1 (Term 1) (pages 206–207)
Background• This test focuses on Module 1 of Study & Master Geography Grade 10 and
therefore should be scheduled for after the learners have completed this module and had time to do some revision activities. (See year plan on pages 6–7.)
• Allow between 45 minutes and 1 hour for the test, depending on your learners.
• The test is out of 60 marks. You will need to convert this to a mark out of 40 for this assessment to contribute to the year mark. (See page 258 * footnote.)
Preparing the learners• Remind the learners that they should answer all questions.
The testYou will find a test on the ‘the atmosphere’ on pages 206–207 of this Teacher’s Guide. You may photocopy the test.
Assessment guidanceYou will find a memorandum for Controlled test 1 on pages 208–209 of this Teacher’s Guide. You may photocopy this memorandum if you wish.

202 S E C T I O N 3 • F O R M A L A S S E S S M E N T
Mid-year examination
TERM 2, WEEKS 9–10
Geography topics: The atmosphere, Geomorphology (geographic knowledge, skills and techniques, mapwork)
Resources• Photocopies of the mid-year exam (Teacher’s Guide pages 221–230.)• Quad or graph paperBackground• The mid-year examination focuses on all material covered in Terms 1
and 2 and the questions require lower order, middle order and higher order thinking skills from the learners. The examination consists of one paper only and has a time allocation of 3 hours. It is divided into three questions as follows:– Question 1: The atmosphere (60 marks). Consists of:
• short, objective questions (15 marks)• 3 questions of 15 marks each on The Atmosphere, with ONE
paragraph question of 8 marks in any of the three questions (45 marks)
– Question 2: Geomorphology (60 marks). Consists of:• short, objective questions (15 marks)• 3 questions of 15 marks each on Geomorphology, with ONE
paragraph question of 8 marks in any of the three questions (45 marks)
– Question 3: Mapwork (30 marks). Consists of:• map skills and calculations (10 marks)• map interpretation (12 marks) • GIS (8 marks)
• The mid-year examination is out of 150 marks. You will need to convert this to a mark out of 20 for this assessment to contribute to the year mark. (See page 259 ** footnote.)
Preparing the learners• At the beginning of Term 2, spend some time discussing with the
learners the material they will need to cover in the examination.• In week 4 or 5 of Term 2, spend some time discussing the format of
the examination with the learners, including how much time they will be given to complete it. You can refer to the notes in the section, Background (above) to help you with this explanation.
• Remind the learners that they will need to revise all the work covered in Modules 1 to 4.
• Explain that the way that the examination is structured means that they will not be able to leave out any sections of work as they prepare for it.
The mid-year examYou will find a mid-year examination that you could use on pages 221–230 of this Teacher’s Guide. You may photocopy this examination.
203S E C T I O N 3 • F O R M A L A S S E S S M E N T
Assessment guidanceYou will find a memorandum for the mid-year exam on pages 231–234 of this Teacher’s Guide. You may photocopy this memorandum if you wish.
Controlled test 2 (Term 3) Population
TERM 3, WEEK 8
Geography topic: Population
ResourcesPhotocopies of Controlled test 2 (pages 217–218)
Background• This test focuses on Module 5 of Study & Master Geography Grade 10 and
therefore should be scheduled for after the learners have completed this module and had time to do some revision activities. (See year plan on pages 12–13.)
• Allow 60 minutes for the test.• The test is out of 60 marks. You will need to convert this to a mark out of
20 for this assessment to contribute to the year mark. (See Recording and reporting, on page 259.)
Preparing the learners• Remind the learners that they should answer all questions.
The testYou will find a test on ‘Population’ on pages 217–218 of this Teacher’s Guide. You may photocopy it. A marking memorandum for the test is supplied below under the heading, Assessment guidance.
Assessment guidanceYou will find a memorandum for Controlled test 2 on pages 219–220 of this Teacher’s Guide. You may photocopy this memorandum if you wish.
End-of-year examination
TERM 4, WEEKS 9–10
Geography topics: The atmosphere, Geomorphology, Population, Water resources (geographic knowledge, skills and techniques, mapwork)
ResourcesPhotocopies of the end-of-year exam (pages 235–244 and 249–252)

204 S E C T I O N 3 • F O R M A L A S S E S S M E N T
BackgroundPaper 1• Question 1: The atmosphere (60 marks). Consists of:
– short, objective questions (15 marks)– 3 questions of 15 marks each on The Atmosphere, with ONE
paragraph question of 8 marks in any of the three questions (45 marks)
• Question 2: Geomorphology (60 marks). Consists of:– short, objective questions (15 marks)– 3 questions of 15 marks each on Geomorphology, with ONE
paragraph question of 8 marks in any of the three questions (45 marks)
• Question 3: Mapwork (30 marks). Consists of:– map skills and calculations (10 marks)– map interpretation (12 marks) – GIS (8 marks)
Paper 2• Question 1: Population Geography (60 marks). Consists of:
– short, objective questions (15 marks)– 3 questions of 15 marks each on Development Geography and Urban
Settlement, with ONE paragraph question of 8 marks in any of the three questions (45 marks)
• Question 2: Water Resources (60 marks). Consists of:– short, objective questions (15 marks)– 3 questions of 15 marks each on Resources and Sustainability of
South Africa, with ONE paragraph question of 8 marks in any of the three questions (45 marks)
• Question 3: Mapwork (30 marks). Consists of:– map skills and calculations (10 marks)– map interpretation (12 marks) – GIS (8 marks)
Preparing the learners• At the beginning of Term 4, spend some time discussing with the
learners the material they will need to cover in the examination.• In week 4 or 5 of Term 4, spend some time discussing the format of
the examination with the learners, including how much time they will be given to complete it. You can refer to the notes in the section, Background (above), to help you with this explanation. Refer the learners to page 321 of the Learner’s Book where this information appears.
• Remind the learners that will need to revise all the work covered during the year.
• Explain that the way that the examination is structured means that they will not be able to leave out any sections of work as they prepare for it.
The end of year examYou will find an end-of-year examination that you could use on pages 235–244 and 249–252 of this Teacher’s Guide. You may photocopy this examination.
Assessment guidanceYou will find a memorandum for the end-of-year exam on pages 245–248 and 253–257 of this Teacher’s Guide. You may photocopy this memorandum if you wish.

205S E C T I O N 3 • F O R M A L A S S E S S M E N T
4. RECORDING AND REPORTING
The results of all formal assessments should be recorded and are used for reporting on learners’ performance each term. The Programme of assessment (page 200) details how the learner’s Geography mark for each term is calculated.
The following photocopiable assessment recording tools are provided in this guide:• Record sheet for formal assessment: Term 1 (page 258)• Record sheet for formal assessment: Term 2 (page 259)• Record sheet for formal assessment: Term 3 (page 260)• Record sheet for formal assessment: Term 4 (page 261)
Reporting on the learners’ progress in Geography should be done using the following rating codes and descriptors:
Rating Code Description of competence Percentage
7 Outstanding achievement 80–100
6 Meritorious achievement 70–79
5 Substantial achievement 60–69
4 Adequate achievement 50–59
3 Moderate achievement 40–49
2 Elementary achievement 30–39
1 Not achieved 0–29
5. PHOTOCOPIABLE ASSESSMENT
RESOURCES
The following assessment resources may be photocopied for use with Study & Master Geography Grade 10.

206 S E C T I O N 3 • F O R M A L A S S E S S M E N T
Controlled test 1 (Term 1) The atmosphere
TOTAL MARKS: 60 Time: 45 minutes
Answer all the questions.
1. Choose the correct definition in Column B to match the term in Column A. Write down only the numbers and letters.
Term Definition
1.1 Relative humidity a) The temperature at which condensation takes place.
1.2 Dew point b) When water vapour cools and changes into tiny droplets.
1.3 Condensation c) The amount of water vapour in the air compared to how much water vapour the air can hold at a specific temperature.
1.4 Saturated air d) The amount of water vapour in the air.
1.5 Humidity e) When the amount of water vapour entering by evaporation equals the amount leaving by condensation.
[5]
2. Draw a diagram of the structure of the atmosphere and fill in the following labels:2.1 the seven different layers of the atmosphere (7)2.2 a line showing the changes in temperature (2)2.3 the layer in which ozone is found (1)
[10]
3. Name the layer of the atmosphere that relates to the following:3.1 the auroras or northern lights form here3.2 stretches 80–90 km above the Earth’s surface3.3 this layer is the source of Earth’s weather3.4 the reaction between sunlight and the ozone takes place here [4]
4. 4.1 What is ozone and why is it important? (4)4.2 Name two effects of ozone depletion. (2)
[6]
5. List four ways in which the Earth heats up the atmosphere. [4]
© Cambridge University Press. You may photocopy this page for use with Study & Master Geography Grade 10.

207S E C T I O N 3 • F O R M A L A S S E S S M E N T
6. Use the diagram below to write a description on the effect of latitude on temperature. [4]
90o NNorth Pole
0o equator
7. What is the ‘temperature lapse rate’? [2]
8. How does the Benguela Ocean Current affect temperatures in Cape Town? [2]
9.9.1 Define the greenhouse effect. (4)9.2 Look at the Greenpeace cartoon below. Why is it a good cartoon
about greenhouse gases? (4)
9.3 Name three causes of greenhouse gases. (3)[11]
10. Write a paragraph on the impact of climate change in Africa. [8]
11.11.1 Which two countries are the largest carbon emitters? (2)11.2 Discuss why the carbon emissions in developed countries
differ from those in developing countries? (2)[4]
[Total: 60 marks]
© Cambridge University Press. You may photocopy this page for use with Study & Master Geography Grade 10.

208 S E C T I O N 3 • F O R M A L A S S E S S M E N T
Memorandum: Control test 1 (Term 1) on The atmosphere (Teacher’s Guide page 206–207)1. One mark each:
1.1 c1.2 a1.3 b1.4 31.5 d [5]
2.
[10]3. One mark each:
3.1 thermosphere3.2 mesosphere3.3 troposphere3.4 stratosphere [4]
4. 4.1 Ozone is a tri-atomic oxygen (1) molecule of blue gas (1).
It protects us (1) from ultra-violet radiation from the sun (1). (4)4.2 Any two of the following: skin cancer; cataracts; damage to DNA;
kills phytoplankton; disrupts photosynthesis. (2)[6]
5. terrestrial radiation (1); evaporation and release of latent heat (1); convection (1); conduction (1) [4]
6. The Sun’s rays strike the Earth at right angles at the equator (1)/ therefore the heat is distributed over a smaller surface area than at the Poles (1). The Sun’s rays also pass through less atmosphere at the equator (1) and so lose less heat through absorption, scattering and reflection (1). [4]
7. The rate at which temperatures decrease (1) with altitude (1) [2]
8. The Benguela Current is a cold ocean current (1) and so causes temperatures to decrease in Cape Town (1). [2]
© Cambridge University Press. You may photocopy this page for use with Study & Master Geography Grade 10.

209S E C T I O N 3 • F O R M A L A S S E S S M E N T
9.9.1 The insulating effect of gases (1) in the lower atmosphere (1) that
absorb and trap radiated long-wave heat (1), keeping the Earth’s average temperatures warm (1). (4)
9.2 This is a good cartoon because just as the glass of a greenhouse allows short-wave solar radiation to pass through it (1), it traps long-wave terrestrial radiation, making the greenhouse warm (1). The greenhouse gases in the atmosphere allow short-wave solar radiation to pass through the atmosphere (1), but trap the long- wave terrestrial radiation, keeping the Earth warm (1). (4)
9.3 Any three of the following: carbon dioxide from burning fossil fuels (1); methane from flatulence in cows and rotting vegetation (1); emissions from factories (1); pollution from cars (1) (3)
[11]
10. Points that should be included in the paragraph. Any eight points:• Drought: Southern Africa is likely to become warmer and is at risk
of drought (1).• This leads to decreased food production and famine (1).• Expanding deserts (1): As land becomes desert-like subsistence
farmers lose their livestock and livelihood (1).• Floods (1): East Africa could experience higher rainfall and floods (1).• Rising sea levels (1): Low lying coastal areas are vulnerable (1).• Shrinking tropical glaciers (1): Mount Kilimanjaro’s glaciers are
shrinking (1). [8]
11.11.1 United States and China (2)11.2 Developed countries are far more industrialised than
developing countries. (2)[4]
[Total: 60 marks]
© Cambridge University Press. You may photocopy this page for use with Study & Master Geography Grade 10.

210 S E C T I O N 3 • F O R M A L A S S E S S M E N T
© Cambridge University Press. You may photocopy this page for use with Study & Master Geography Grade 10.
Assessment Task 1: Essay Global warming
TERM 1
Refer to the map below, which shows worldwide contribution to greenhouse gas emissions.
SLOVENIA
0 2.5 5 10 50
Kilogrammes of carbon dioxide per capita
CO2 emissions per capita
Write an essay of 500–600 words that addresses the following:• What is the greenhouse effect and how does it relate to global warming? • How much is Africa to blame for global warming, and what are the
impacts of climate change in Africa?
For information, use one or more of these sources:• Your Learner’s Book, pages 29–39• The internet. Here are three helpful sites or articles:
– https://climatekids.nasa.gov/greenhouse-effect/– https://climate.nasa.gov/causes/– https://350africa.org/8-ways-climate-change-is-already-affecting-africa/
• Newspaper articles• Information from TV programmes.
Marks will be given for:• giving a clear and simple explanation of concepts and terms (e.g.
greenhouse effect, global warming, greenhouse emissions)• interpreting and evaluating the figure above• expressing a point of view that is well supported by facts• putting together the information in a way that makes sense and easy to
understand• using your own words.
Total: 100
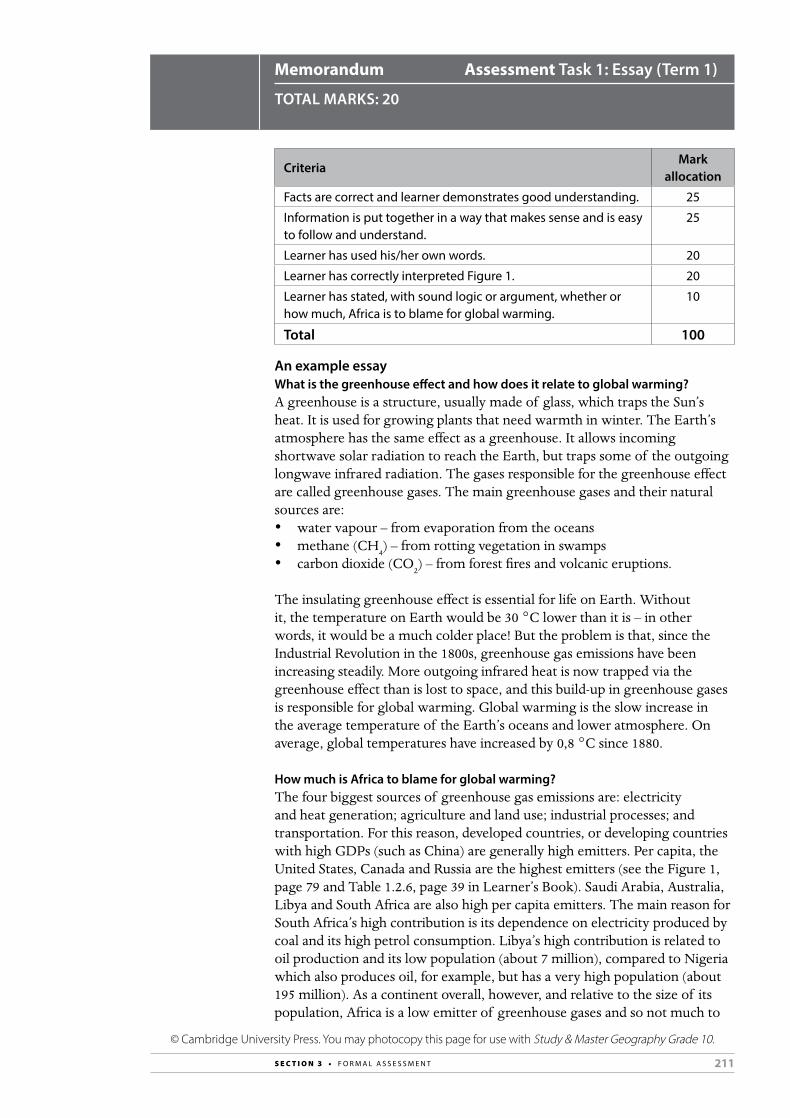
211S E C T I O N 3 • F O R M A L A S S E S S M E N T
Memorandum Assessment Task 1: Essay (Term 1)
TOTAL MARKS: 20
CriteriaMark
allocation
Facts are correct and learner demonstrates good understanding. 25
Information is put together in a way that makes sense and is easy to follow and understand.
25
Learner has used his/her own words. 20
Learner has correctly interpreted Figure 1. 20
Learner has stated, with sound logic or argument, whether or how much, Africa is to blame for global warming.
10
Total 100
An example essayWhat is the greenhouse effect and how does it relate to global warming?A greenhouse is a structure, usually made of glass, which traps the Sun’s heat. It is used for growing plants that need warmth in winter. The Earth’s atmosphere has the same effect as a greenhouse. It allows incoming shortwave solar radiation to reach the Earth, but traps some of the outgoing longwave infrared radiation. The gases responsible for the greenhouse effect are called greenhouse gases. The main greenhouse gases and their natural sources are:• water vapour – from evaporation from the oceans• methane (CH4) – from rotting vegetation in swamps • carbon dioxide (CO2) – from forest fires and volcanic eruptions.
The insulating greenhouse effect is essential for life on Earth. Without it, the temperature on Earth would be 30 °C lower than it is – in other words, it would be a much colder place! But the problem is that, since the Industrial Revolution in the 1800s, greenhouse gas emissions have been increasing steadily. More outgoing infrared heat is now trapped via the greenhouse effect than is lost to space, and this build-up in greenhouse gases is responsible for global warming. Global warming is the slow increase in the average temperature of the Earth’s oceans and lower atmosphere. On average, global temperatures have increased by 0,8 °C since 1880.
How much is Africa to blame for global warming?The four biggest sources of greenhouse gas emissions are: electricity and heat generation; agriculture and land use; industrial processes; and transportation. For this reason, developed countries, or developing countries with high GDPs (such as China) are generally high emitters. Per capita, the United States, Canada and Russia are the highest emitters (see the Figure 1, page 79 and Table 1.2.6, page 39 in Learner’s Book). Saudi Arabia, Australia, Libya and South Africa are also high per capita emitters. The main reason for South Africa’s high contribution is its dependence on electricity produced by coal and its high petrol consumption. Libya’s high contribution is related to oil production and its low population (about 7 million), compared to Nigeria which also produces oil, for example, but has a very high population (about 195 million). As a continent overall, however, and relative to the size of its population, Africa is a low emitter of greenhouse gases and so not much to
© Cambridge University Press. You may photocopy this page for use with Study & Master Geography Grade 10.
212 S E C T I O N 3 • F O R M A L A S S E S S M E N T
blame for global warming. In the same way that the world’s rich minority consume the majority of resources, Africa will have to nevertheless cope with the consequences of climate change.
What are the impacts of climate change on Africa?Human-generated climate change due to global warming has become a major environmental issue. As in all parts of the world, the impact is already being felt, and much worse is to come. Already the tropical glaciers such as those of Mount Kilimanjaro have radically shrunk. These ice caps serve as water reservoirs, which feed rivers with snow melt in the dry season. People depend on water from the rivers for irrigation of cash crops.
Africa has many arid regions, such as the Sahel and large parts of southern Africa. Temperatures are predicted to increase on average by 1 to 4 °C by 2050. Arid regions in Africa are particularly vulnerable to climate change, with frequent droughts and flash floods. With droughts come severe water shortages, crop losses and decreased food production, which threatens food security and increases the risk of famine. The poor are worst affected by drought. When crops fail and livestock dies, it becomes a life-and-death matter.
Climate change is characterised by more extreme weather. East Africa (countries such as Somalia, Ethiopia, Kenya and Tanzania) have experienced higher than normal rainfall with flash floods, landslides and other rain-triggered disasters. Floods lead to an increase in insect- and water-borne diseases and damage infrastructure such as roads, bridges and buildings.
Assessment Task 2: Mapwork Geomorphology
TERM 2
• Because it forms part of the Programme of Assessment for Grade 10, this task involves each Learner working individually.
• The task is out of 60 marks. You will need to convert it to a mark out of 20 for this assessment to contribute to the year mark. (See page 259* footnote.)
Answer all the questions in all three sections.
© Cambridge University Press. You may photocopy this page for use with Study & Master Geography Grade 10.

213S E C T I O N 3 • F O R M A L A S S E S S M E N T
Section A: Topographical maps (30 marks)Refer to the topographical map extract from the map 3125CA Tafelberg and answer the following questions:1. Give the map code of the map directly to the west of
Tafelberg 3225CA. (2)2. What is the scale of the topographical map 3125CA Tafelberg? (2)3. Calculate the length in kilometres of the powerline running from
block A3 to block E6 on the map. (2)4. Give the direction and true bearing from:
4.1 Spot height 1159 in block D5 to spot height 1225 in block E2. (2)4.2 Oskop in block B3 to Volminskop in block A2. (2)
5. Give the latitude and longitude coordinates of:5.1 Gryskop (2)5.2 Oskop (2)
6. Draw a cross-section from spot height 1205 in block F2 to spot height 1190 in block F4. Use a vertical scale of 1 cm to represent 100 m. (6)
7. Identify the landform in the cross-section you have just drawn. (2)8. Name the map convention sign located at 31°34’15”S and 25°08’45’E. (2)9. Using evidence from the map, give three reasons to suggest that
Tafelberg receives a low average annual rainfall. (6)[30]
Section B: Geographical Information Systems (16 marks)1. What is a Geographical Information System? (2)2. What are the two types of image (bitmaps) used on GIS systems? (2)3. Explain what remote sensing is and how it works. (6)4. List six components of remote sensing. (6)
[16]
Section C: Graphs (14 marks) 1. Use the temperature and rainfall data below to construct:
1.1 a line graph representing temperature (7)1.2 a bar graph representing rainfall. (7)
Month Temperature in °C Rainfall in mm
January 20 243
February 20 212
March 19 186
April 17 71
May 15 34
June 12 19
July 12 23
August 14 28
September 16 62
October 18 128
November 19 169
December 20 213
[14][Total: 60 marks]
© Cambridge University Press. You may photocopy this page for use with Study & Master Geography Grade 10.
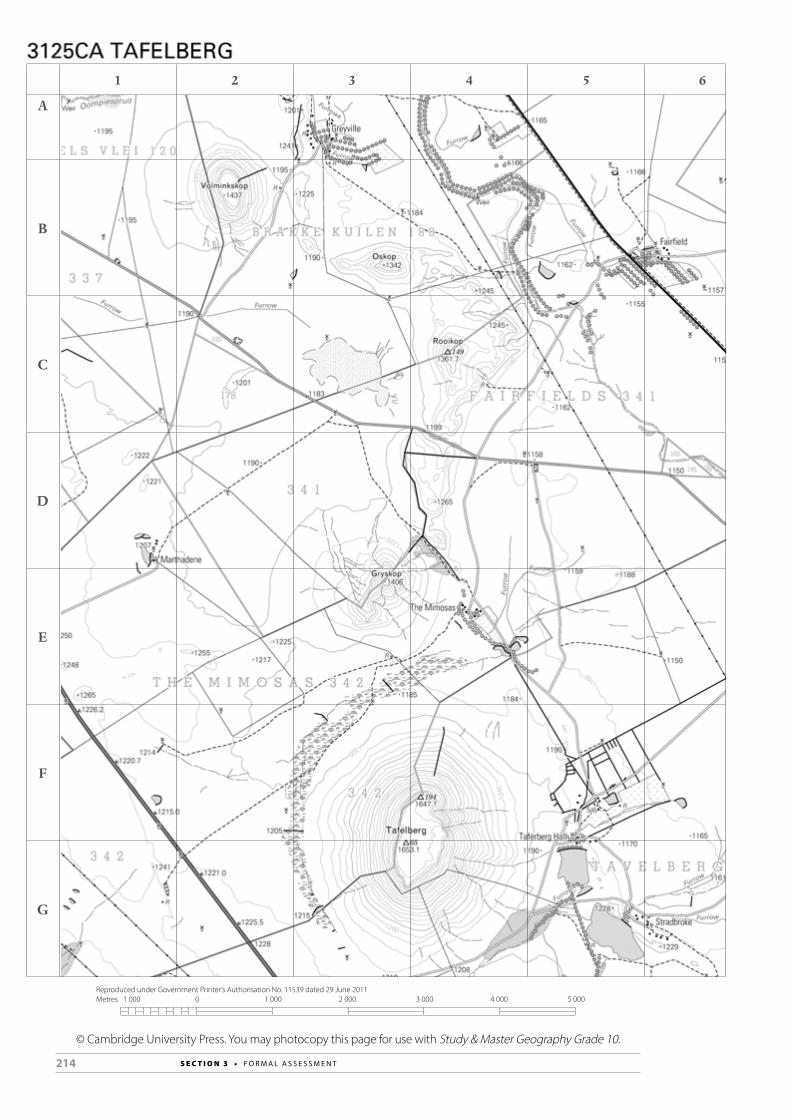
214 S E C T I O N 3 • F O R M A L A S S E S S M E N T
© Cambridge University Press. You may photocopy this page for use with Study & Master Geography Grade 10.
1 2 3 4 5 6
A
B
C
D
E
F
G
Reproduced under Government Printer’s Authorisation No. 11539 dated 29 June 2011Metres 1 000 0 1 000 2 000 3 000 4 000 5 000

215S E C T I O N 3 • F O R M A L A S S E S S M E N T
Memorandum Assessment Task 2: Mapwork (Term 2)
TOTAL MARKS: 20
Section A: Topographical maps1. 3124DB (2)2. 1:50 000 (2)3. 17 cm × 0.5 = 8,5km (2)
4.1 246° SW (2)4.2 294°NW (2)5.1 31°36’40”S and 25°09’35”E (2)5.2 31°34’30”S and 25°09’30”E (2)
6. H
eigh
t in
met
res
1600
1500
1400
1300
1200
1100
11901205 (6)7. A mountain or hill (2)8. Windmill/wind pump (2)9. Any three of the following: absence of cultivated land, windmills
(wind pumps) furrows, non-perennial streams (6)[30]
Section B: Geographical Information Systems1. A Geographical Information System (GIS) is a computer-based
program (software), in which spatial data is stored, can be manipulated (worked with) and presented in map form. (2)
2. Raster and Vector (2)3. Remote sensing is a technique or method whereby information
regarding a part of the Earth’s surface, or Earth surface features can be gathered without the sensor (a camera, or electromagnetic sensor in a satellite) coming into contact with whatever is being sensed. Remote sensing works on capturing visible light, or reflected, invisible waves in the electromagnetic spectrum, such as infrared radiation. (6)
4. Energy source, platform for the sensor (satellite), sensors, computer for handling and storing data, photographic or digital processor, a home base where data is interpreted (remote sensing laboratory) (6)
[16]
© Cambridge University Press. You may photocopy this page for use with Study & Master Geography Grade 10.

216 S E C T I O N 3 • F O R M A L A S S E S S M E N T
Section C: Graphs (14 marks)1.1 and 1.2 Line graph representing temperature, and a bar graph representing rainfall, on the same set of axes.
Tem
pera
ture
in D
egre
es C
elsi
us
Rainfall in Millim
etres
20
19
18
17
16
15
14
13
12
11
10
250
200
150
100
50
[14][Total: 60 marks]
© Cambridge University Press. You may photocopy this page for use with Study & Master Geography Grade 10.

217S E C T I O N 3 • F O R M A L A S S E S S M E N T
Controlled test 2 Population
TOTAL MARKS: 60 Time: 45 minutes
Answer all the questions.
1. Define the following terms:a) Population distributionb) Population densityc) Non-ecumene areasd) The natural increase in populatione) Fertility rate [10]
2. How is population density measured? [2]
3. Study the table below and answer the questions.Province Population in millions Area in square
kilometresGauteng 7,35 17 010Northern Cape 0,84 361 830
a) Calculate the population density of each province. Show all your workings and round off your answers to one decimal place. (4)
b) Which province has the highest population density? (2)c) Give two reasons for the differences in population density in
each province. (4)[10]
4. Study the population pyramid of Germany below and answer the questions.
Male Female100+95–9990–9485–8980–8475–7970–7465–6960–6455–5950–5445–4940–4435–3930–3425–2920–2415–1910–145–90–4
4
Population (in millions)3,2 2,4 1,6 0,8 0,0 0,0 0,8 1,6 2,4 3,2 4
Germany – 2009
Population (in millions)
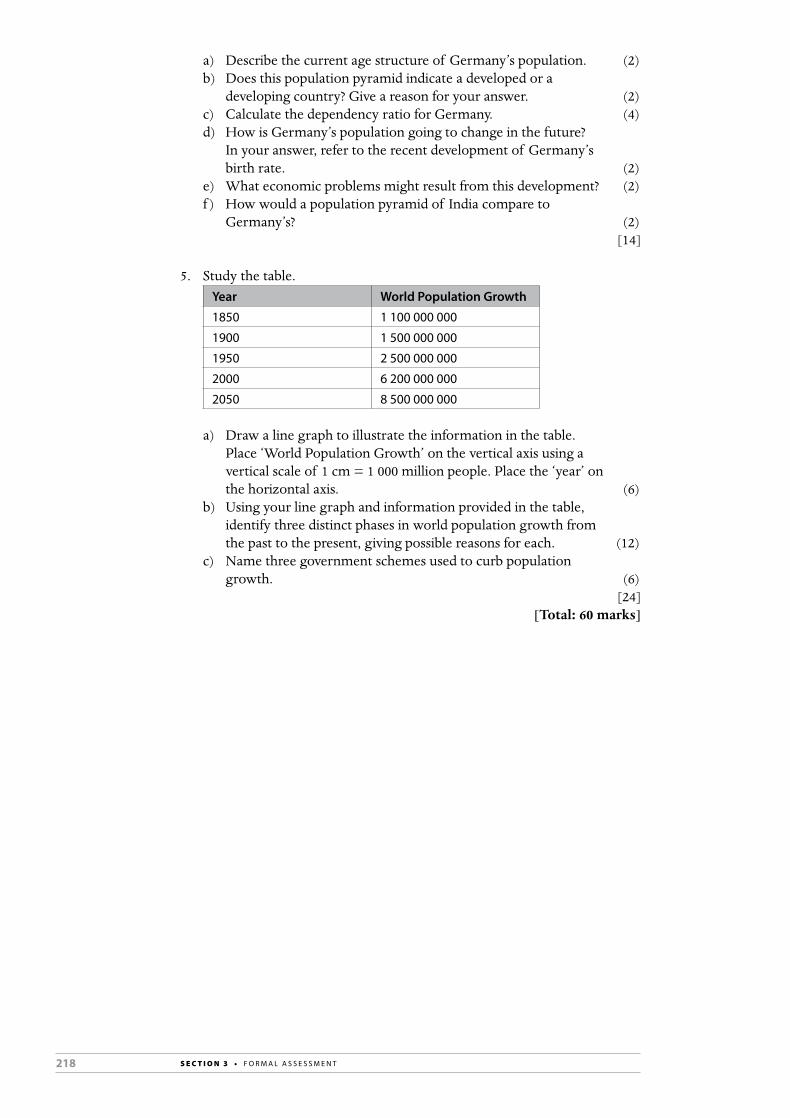
218 S E C T I O N 3 • F O R M A L A S S E S S M E N T
a) Describe the current age structure of Germany’s population. (2)b) Does this population pyramid indicate a developed or a
developing country? Give a reason for your answer. (2)c) Calculate the dependency ratio for Germany. (4)d) How is Germany’s population going to change in the future?
In your answer, refer to the recent development of Germany’s birth rate. (2)
e) What economic problems might result from this development? (2)f ) How would a population pyramid of India compare to
Germany’s? (2)[14]
5. Study the table.Year World Population Growth
1850 1 100 000 000
1900 1 500 000 000
1950 2 500 000 000
2000 6 200 000 000
2050 8 500 000 000
a) Draw a line graph to illustrate the information in the table. Place ‘World Population Growth’ on the vertical axis using a vertical scale of 1 cm = 1 000 million people. Place the ‘year’ on the horizontal axis. (6)
b) Using your line graph and information provided in the table, identify three distinct phases in world population growth from the past to the present, giving possible reasons for each. (12)
c) Name three government schemes used to curb population growth. (6)
[24][Total: 60 marks]

219S E C T I O N 3 • F O R M A L A S S E S S M E N T
Memorandum: Control test 2 on Population (Teacher’s Guide, pages 217–218)1. a) where people live in the world (2)
b) the number of people living on each square kilometer in the world (2)c) areas where there is little sign of human or even animal life (2)d) the difference between the number of births per 1 000 people and
the number of deaths per 1 000 people (2)e) the average number of children a woman will have (2)
[10]
2. Population density = Total population of a country ÷ the area of the country [2]
3. a) Gauteng 7,35 × 1 000 000 ÷ 17 010 = 432,1 people per square kilometer (2)
Northern Cape 0,84 × 1 000 000 ÷ 361 830 = 2,3 people per square kilometer (4)
b) Gautengc) Gauteng is highly urbanised (1) and people migrate to Gauteng in
search of work/business opportunities (1). The Northern Cape is a chiefly rural province (1) with very few big towns (1). (4)
[10]
4. a) There are fewer people between 0–14 years (½); more between 15 and 60 years (½) and then a decrease above 60 years (1). (2)
b) developed (1); low birth rate and low death rate (1) (2) c) approximately 50%d) There will be a decrease in the total population. (2)e) There will not be enough people in the workforce (1) to sustain
the country economically (1). (2)f ) A high birth rate and high death rate (1) so it would be triangular
shaped (1). (2)[14]
5. a) Phase 1
Pop
ulat
ion
in b
illio
ns
9876543210
Phase 2 Phase 3
Year1850
19001950
20002050
(6)b) Phase 1: Pre-1900 (1): small population growth (1) due to high
birth and death rates (1) due to early stages of development of science and medicine (1). (4)
Phase 2: 1900–2000 (1): 1900–1950 – slightly larger growth in population (1); 1950–2000 – enormous increase in population (1) due to vast advances in technology (1) which lead to lower death rates and higher birth rates (1). (5)

220 S E C T I O N 3 • F O R M A L A S S E S S M E N T
Phase 3: 2000-2050 (1): tapering off of increase in population (1) due to increasingly materialistic lifestyles of people (1) – lower birth rates and death rates (1). (3)
c) China’s (1) one child only policy (1); Kenya (1) developed a family planning campaign (1); India (1) encouraged women to develop economically, academically and socially (1). (6)
[24][TOTAL: 60 marks]
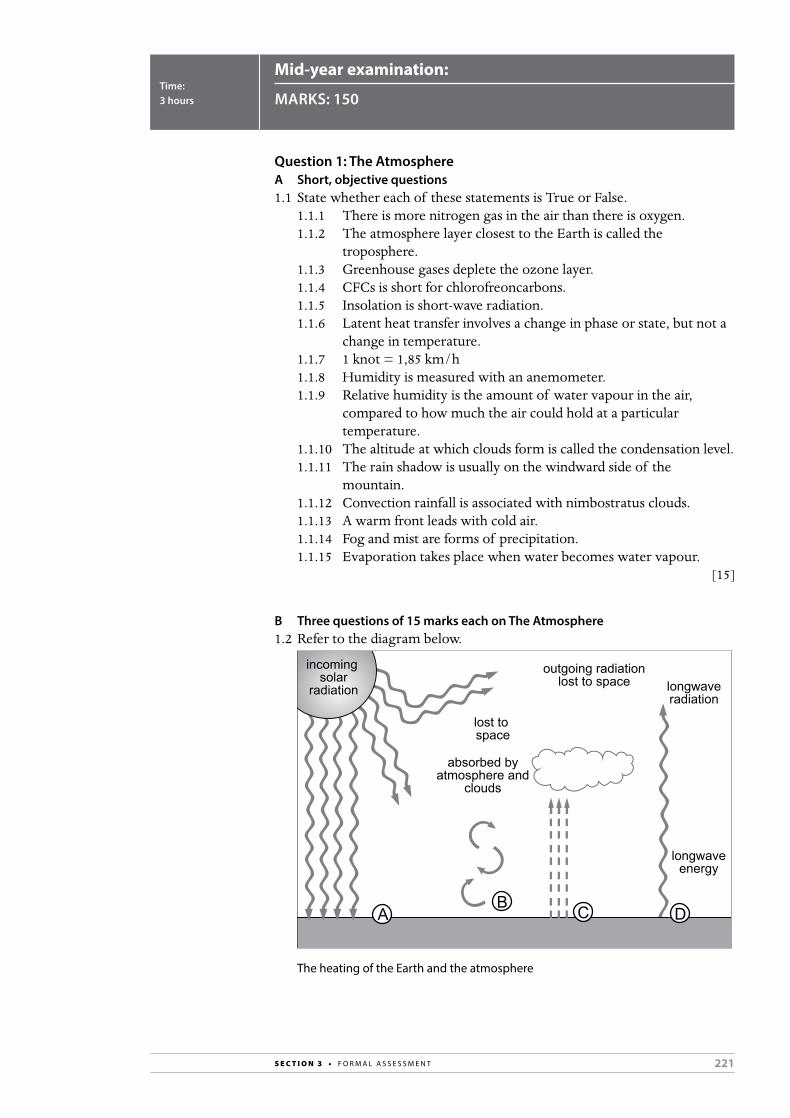
221S E C T I O N 3 • F O R M A L A S S E S S M E N T
Mid-year examination:
MARKS: 150 Time: 3 hours
Question 1: The Atmosphere A Short, objective questions1.1 State whether each of these statements is True or False.
1.1.1 There is more nitrogen gas in the air than there is oxygen.1.1.2 The atmosphere layer closest to the Earth is called the
troposphere.1.1.3 Greenhouse gases deplete the ozone layer.1.1.4 CFCs is short for chlorofreoncarbons.1.1.5 Insolation is short-wave radiation.1.1.6 Latent heat transfer involves a change in phase or state, but not a
change in temperature.1.1.7 1 knot = 1,85 km/h1.1.8 Humidity is measured with an anemometer. 1.1.9 Relative humidity is the amount of water vapour in the air,
compared to how much the air could hold at a particular temperature.
1.1.10 The altitude at which clouds form is called the condensation level.1.1.11 The rain shadow is usually on the windward side of the
mountain.1.1.12 Convection rainfall is associated with nimbostratus clouds.1.1.13 A warm front leads with cold air.1.1.14 Fog and mist are forms of precipitation.1.1.15 Evaporation takes place when water becomes water vapour.
[15]
B Three questions of 15 marks each on The Atmosphere 1.2 Refer to the diagram below.
outgoing radiationlost to space
lost to space
longwaveradiation
longwaveenergy
absorbed byatmosphere and
clouds
AB C D
incoming solar
radiation
The heating of the Earth and the atmosphere

222 S E C T I O N 3 • F O R M A L A S S E S S M E N T
1.2.1 Name three ways in which incoming solar radiation is lost in the atmosphere. (3)
1.2.2 What percentage of solar radiation reaches the Earth’s surface? (1)1.2.3 Which of the three process in 1.2.1 is illustrated by A? (1)1.2.4 Which of the three processes in 1.2.1 is linked to albedo? (1)1.2.5 The Earth, rather than incoming sunlight, heats up the
atmosphere. a Explain why. (2) b Identify three heat transfer processes B, C, and D, and briefly
describe each process. (3 × 2 = 6) c Give the term that explains, in a nutshell, how the atmosphere
keeps the Earth warm. (1)[15]
1.3 Refer to the diagram below.
condensationlevel = 2,5 km
condensationlevel = 1 km
26 °C
6 °C
26 °C
18 °C
Cloud 1
Cloud 2
How clouds form at different altitudes
1.3.1 What is a cloud? Give a definition. (2)1.3.2 a Give the term for the small solid or liquid particles that are
important in the formation of clouds. (1) b Give two examples of what these small particles consist of. (2)
1.3.3 Give two terms for clouds that form close to the ground, or at ground level. (2)
1.3.4 Explain how a cloud forms and why there is a difference in condensation levels for the two clouds shown in the diagram. (8)
[15]

223S E C T I O N 3 • F O R M A L A S S E S S M E N T
1.4 Refer to the synoptic map below.
Biera
Harare
Walvis Bay Windhoek
Bulawayo
Gaborone
Upington
Durban
Cape Town 15
10
14
2
11
Pretoria
-318
14
L
L
L
L
Gough
14
Maputo
5 16
5
-5
2 Bloemfontein-5
17
0
11
2
-4
Lüderitz
-12
-4
-10
-4
8
0
-13
-7
19
27
32
Port ElizabethEast London4
-10
5
29
-4
-7
18
19
19
40
510
35
15
45
30
10
105
0
25
20
15
25
35
35
20 25 30 3540
40
45
45
4035
45
20
15
30
DE
SC
RIP
TION
BE
SP
RE
KIN
G
1028
1024
1020
1016
1012
1008
1004
1000
996992988984980L
1004
1016
1016
1012
L
10161012100810041000996
988998
50
SY
NO
PTIC
WE
ATHE
R M
AP
SIN
OP
TIES
E W
EE
RK
AA
RT
12:00 LT - 14:00 SA
ST: 2010-08-03
Marion
1012
13
19
20
8
15
1
25
27
1
28
-1Mowe 30
29
29
73
7
17 818
147
-225
14
0
-8
21
22
-10
2321
20
19
9
30
27
26
27
4
31
26
310
-3
26
7
33
-7
348
23
-15
274
2317
164
21
25
2829
25
25
19
5
15
19
27
20
Antananarivo
AB
Synoptic map
1.4.1 Give the date (day, month and year) and time for these recorded weather conditions. (2)
1.4.2 What do we call the lines of atmospheric pressure? (1)1.4.3 State the units of atmospheric pressure. (1)1.4.4 Give the values for:
a the high pressure cell in the Atlantic. (1) b the low pressure centre of the cold front passing over South
Africa. (1)1.4.5 a A and B indicate the air masses associated with the cold front.
Which letter indicates the warm air mass, and which letter indicates the cold air mass? (2)
b Give another term for a cold front. (1)1.4.6 For the temperatures for Upington:
a What is the 17 °C? (1) b What is the 2 °C? (1)
1.4.7 Compare the set of temperatures for Upington with the set of temperatures for Mossel Bay or Springbok. Complete this statement by choosing the correct option:
The closer the two temperatures, the more/less cloud cover there is. (2)
1.4.8 Give the wind direction and windspeed for Port Elizabeth. (2)[15]
[60 marks]
© Cambridge University Press. You may photocopy this page for use with Study & Master Geography Grade 10.

224 S E C T I O N 3 • F O R M A L A S S E S S M E N T
Question 2: Geomorphology A Short, objective questions Choose the correct answer from the four options given. Write down only the number and the letter of the correct answer.2.1.1 The Mohorovicic discontinuity is the contact zone between …
A the crust and the mantle. B the mantle and the core. C the crust and the core. D the crust and the lithosphere.
2.1.2 When two plates collide with a continent, the following is formed: A peripheral fold mountains. B a rift valley. C a mid-oceanic ridge D intracratonic fold mountains.
2.1.3 Stratification is usually found in … A sedimentary rocks. B metamorphic rocks. C igneous rocks. D a mixture of igneous and metamorphic rocks.
2.1.4 The following is not found in granite: A quartz. B feldspar. C mica. D breccia.
2.1.5 Hogsbacks are formed from … A tilted sedimentary rocks. B horizontal sedimentary rocks. C inclined igneous rocks. D horizontal igneous rocks.
2.1.6 Seafloor spreading occurs when a plate with … A a continent moves away from a plate with an ocean floor. B a continent moves away from a plate with a continent. C an ocean floor moves away from a plate with an ocean floor. D an ocean floor moves towards a plate with an ocean floor.
2.1.7 The instrument that is most accurate in the measurement of earthquakes is the …
A moment scale. B Richter scale. C seismograph. D seismometer.
2.1.8 A very tall volcano with steep slopes is called a … A stratovolcano. B cinder cone. C shield volcano. D caldera.
2.1.9 Mount St Helens is an active volcano in … A North America. B Italy. C Japan. D New Zealand.
© Cambridge University Press. You may photocopy this page for use with Study & Master Geography Grade 10.

225S E C T I O N 3 • F O R M A L A S S E S S M E N T
2.1.10 A fault that forms due to rock being under tension is called a … A normal fault. B reverse fault. C strike-slip fault. D thrust fault.
2.1.11 A block of the Earth’s crust, displaced downwards between two faults, is called …
A a horst. B a graben. C a plateau D a strike-slip.
2.1.12 The San Andreas Fault is … A a transform fault. B a strike-slip fault. C both A and B. D neither A nor B.
2.1.13 The side of a fold is called the … A anticline. B syncline. C limb. D fold centre.
2.1.14 The … are much older fold mountains than the Alps and the Himalayas.
A Rockies B Andes C Pyrenees D Cape Fold Mountains
2.1.15 Which of the following is not true of seismic waves? A P waves are primary waves. B S waves are secondary waves. C S waves move faster than P waves. D P waves are longitudinal waves; S waves are transverse waves.
[15]
B Three questions of 15 marks each on Geomorphology2.2.1 The figure below is a cross-section of the internal structure of the
Earth.
ab
cd
a Supply labels a) to d). (4) b Which layer is composed of solid nickel and iron? (1) c Which layer composed of liquid nickel and iron? (1) d Which layer is composed of molten rock? (1)
© Cambridge University Press. You may photocopy this page for use with Study & Master Geography Grade 10.

226 S E C T I O N 3 • F O R M A L A S S E S S M E N T
2.2.2 The figure below represents the outer layer of the Earth.
oceanocean
a
bc
d
e
a Match the following labels for a) to e): sial, sima, sediments, mantle, Moho discontinuity. (5)
b Give the rock composition for a). (1) c Give the rock composition for c). (1) d Which is the thinner, denser layer – a) or c)? (1)
[15]
2.3.1 Refer to the figure below and complete the question.
TRIASSIC - 200 million years agoPERMIAN - 225 million years ago
CRETACEOUS - 65 million years agoJURRASIC - 135 million years ago
The change in position of the continents over the last 250 million years
How do we know that continental drift has occurred? Write a paragraph that:• gives five pieces of evidence to support this theory.• includes the names of the German and South African scientists who
discovered the evidence• includes the name of the giant continent that consisted of South
America, Africa, Antarctica and Australia 200 million years ago. (8)
© Cambridge University Press. You may photocopy this page for use with Study & Master Geography Grade 10.

227S E C T I O N 3 • F O R M A L A S S E S S M E N T
2.3.2 Refer to the figure below. For zones 1–4, which represents …
0 200 km
Scale
Eurasian Plate
Arabian Plate
Pacific Plate
Philippine Plate
Indo-AustralianPlate
Antarctic Plate
South American
Plate
NazcaPlate
Pacific Plate
CocosPlate
North American
Plate
AfricanPlate
Iran Plate
AnatolianPlate
CaribbeanPlate
1 2
3 4Somalian
Plate
The tectonic plates
a a divergent boundary? (1)b a convergent boundary? (1)c part of the Pacific Ring of Fire? (1)d one plate dividing into two? (1)e a constructive boundary? (1)f Why is the boundary indicated in (e) called a constructive
boundary? (2)[15]
2.4.1 Refer to the figure below.
BA C
Types of faults
a Identify the three types of fault A–C. (3)b Which type faulting occurs in the Himalayas in India? Give a
reason for your answer. (2)c Which type of faulting occurs in the Great Rift Valley in Africa?
Give a reason for your answer. (2)d Which type of faulting occurs in the San Andreas Fault
(see figure on the next page). Give a reason for your answer. (2)
© Cambridge University Press. You may photocopy this page for use with Study & Master Geography Grade 10.
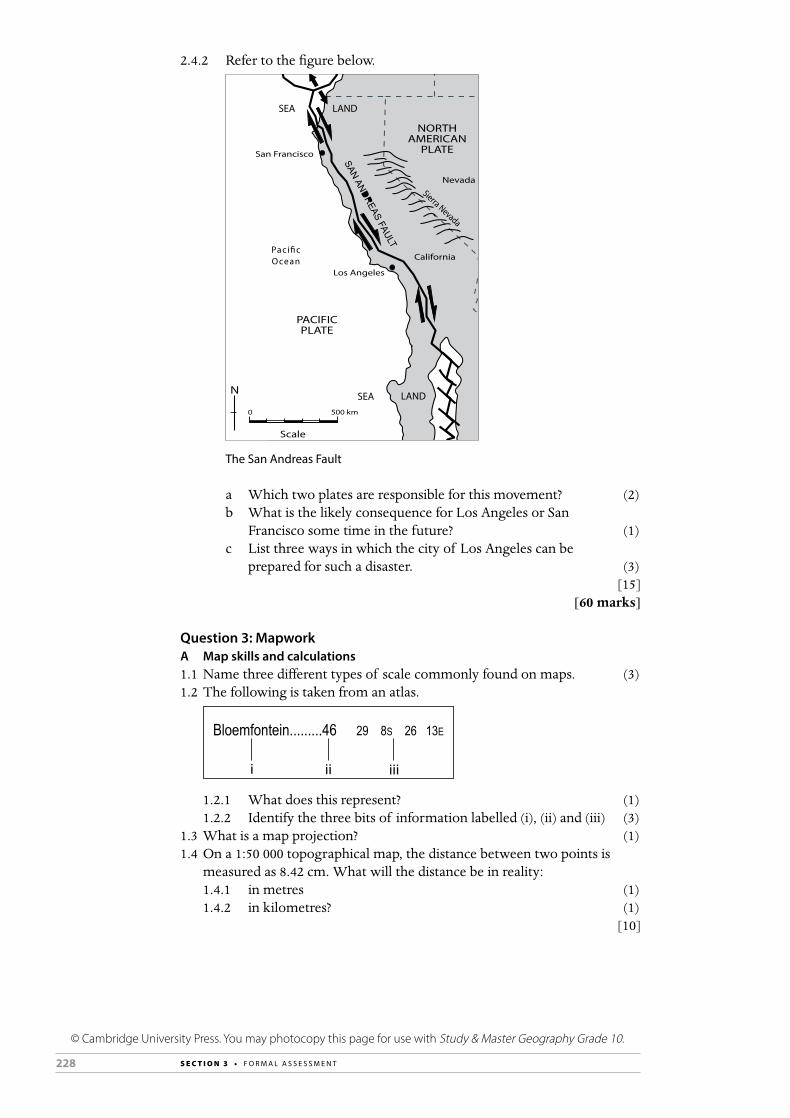
228 S E C T I O N 3 • F O R M A L A S S E S S M E N T
2.4.2 Refer to the figure below.
San Francisco
NORTHAMERICAN
PLATE
PACIFICPLATE
Sierra Nevada
N
Los Angeles
California
Nevada
0 500 km
Scale
Paci�cOcean
SEA LAND
SEA LAND
The San Andreas Fault
a Which two plates are responsible for this movement? (2)b What is the likely consequence for Los Angeles or San
Francisco some time in the future? (1)c List three ways in which the city of Los Angeles can be
prepared for such a disaster. (3)[15]
[60 marks]
Question 3: MapworkA Map skills and calculations1.1 Name three different types of scale commonly found on maps. (3)1.2 The following is taken from an atlas.
Bloemfontein.........46 29 8S 26 13E
i ii iii
1.2.1 What does this represent? (1)1.2.2 Identify the three bits of information labelled (i), (ii) and (iii) (3)
1.3 What is a map projection? (1)1.4 On a 1:50 000 topographical map, the distance between two points is
measured as 8.42 cm. What will the distance be in reality:1.4.1 in metres (1)1.4.2 in kilometres? (1)
[10]
© Cambridge University Press. You may photocopy this page for use with Study & Master Geography Grade 10.

229S E C T I O N 3 • F O R M A L A S S E S S M E N T
B Map interpretation 2. Study the following topographical map extract from 2830DA Collessie
and answer the questions that follow:
2.1 Would you describe the physical landscape of this area as flat, or hilly? Explain your answer. (2)
2.2 Name the relief feature Ntshongweni indicated by an arrow. (1)2.3 What is the main tributary of the uThukela (Tugela) River? (1)2.4 Which physical feature forms the greatest obstacle to transport
routes between the northern and southern portions of the map? (1)2.5 Is there any evidence of a railway line in the area? (1)2.6 Is there any evidence of urban settlement in the area? Explain
your answer. (1)2.7 Is there any evidence of large-scale commercial farming in
the area? Explain your answer. (1)2.8 What do the many black dots scattered across the landscape
represent? (1)2.9 Which appears to be the most densely settled part of the
landscape, the north west, or the north east? Explain your answer. (2)
2.10 Does a national road run through this area? (1)[12]
© Cambridge University Press. You may photocopy this page for use with Study & Master Geography Grade 10.

230 S E C T I O N 3 • F O R M A L A S S E S S M E N T
GIS 3.1 What does GIS stand for? (1) 3.2 The following diagram represents a GIS. Study the diagram and answer
the questions that follow:
RiverIndustries
Urban area
Dam
Power station
B
A
3.2.1 What is shown in the diagram? (1)3.2.2 What is represented by A? (1)3.2.3 What is represented by B? (1)
3.3 Give three uses of GIS. (3)3.4 What is another name for information found in a GIS in digital form? (1)
[8][30 marks]
TOTAL: 150 marks
© Cambridge University Press. You may photocopy this page for use with Study & Master Geography Grade 10.

231S E C T I O N 3 • F O R M A L A S S E S S M E N T
Memorandum Mid-year examinationTOTAL MARKS: 150
Question 1: The Atmosphere1.1.1 True1.1.2 True1.1.3 False1.1.4 False1.1.5 True1.1.6 True1.1.7 True1.1.8 False1.1.9 True1.1.10 True1.1.11 False1.1.12 False1.1.13 True1.1.14 False1.1.15 True
[15]
1.2.1 absorption, reflection, scattering (3)1.2.2 50% (1)1.2.3 absorption (1)1.2.4 reflection (1)1.2.5 a Most of the short-wave radiation (light energy) passes through
the atmosphere/cannot be absorbed, but is absorbed by the Earth and emitted back as long-wave radiation (infrared heat). (2)
b B = convection – air closest to the Earth’s surface warms, expands and rises. As it rises, it cools and sinks – in this way warm and cool air is circulated. (2)
C = evaporation (latent heat transfer) – heat energy is used for evaporation and is released back into the atmosphere when water vapour condenses. (2)
D = terrestrial radiation – the transfer of heat in the form of waves.
c greenhouse effect (1)[15]
1.3.1 a mass of water droplets suspended in the air/a floating mass of condensed water vapour (2)
1.3.2 a condensation nuclei (1) b any two: dust, smoke, salt (2)
1.3.3 mist, fog (2)1.3.4 A cloud forms as follows: Warm air containing water vapour rises.
(1) As the air rises, it cools. (1) When the air has risen high enough to reach a temperature that matches the dew point, (1) the water vapour condenses into tiny water droplets. (1) The height at which this takes place is called the condensation level. (1) For a particular surface air temperature (e.g. 26 °C), the higher the relative humidity, the higher the dew point temperature (1) and the lower the condensation level/
© Cambridge University Press. You may photocopy this page for use with Study & Master Geography Grade 10.

232 S E C T I O N 3 • F O R M A L A S S E S S M E N T
the less the air needs to rise. (1) Therefore cloud 1 is formed under lower relative humidity conditions (1) than cloud 2. (8)
[15]
1.4.1 12:00 or noon or mid-day; 2010-08-03 or 3 August 2010 (2)1.4.2 isobars (1)1.4.3 hectopascals or millibars (1)1.4.4 a 1 028 hPa (1)
b 980 hPa (1)1.4.5 a A = cold air, B = warm air (2)
b mid-latitude cyclone (1)1.4.6 a maximum temperature (1)
b dew point (1)1.4.7 more (2)1.4.8 south-west (or west south-west), 25 knots (2)
[15][60 marks]
Question 2: Geomorphology2.1.1 A2.1.2 D2.1.3 A2.1.4 D2.1.5 A2.1.6 C2.1.7 D2.1.8 A2.1.9 A2.1.10 A2.1.11 B2.1.12 C2.1.13 C2.1.14 D2.1.15 C
[15]
2.2.1 a a = crust, b = mantle, c = outer core, d = inner core (4) b d (1) c c (1) d b (1)
2.2.2 a a = sial, b = sediments, c = sima, d = Moho discontinuity, e = mantle (5)
b granite (1) c basalt (or gabbro) (1) d c (1)
[15]
2.3.1 The German scientist Alfred Wegener (1) proposed the theory of continental drift based on the following two pieces of evidence: 1) the coastlines of South America and Africa fit together like the pieces of a jigsaw puzzle, (1) and 2) similar kinds of plants and animals are found on both continents, (1) suggesting they were once part of a much larger continent referred to as Gondwanaland. (1) The South
© Cambridge University Press. You may photocopy this page for use with Study & Master Geography Grade 10.
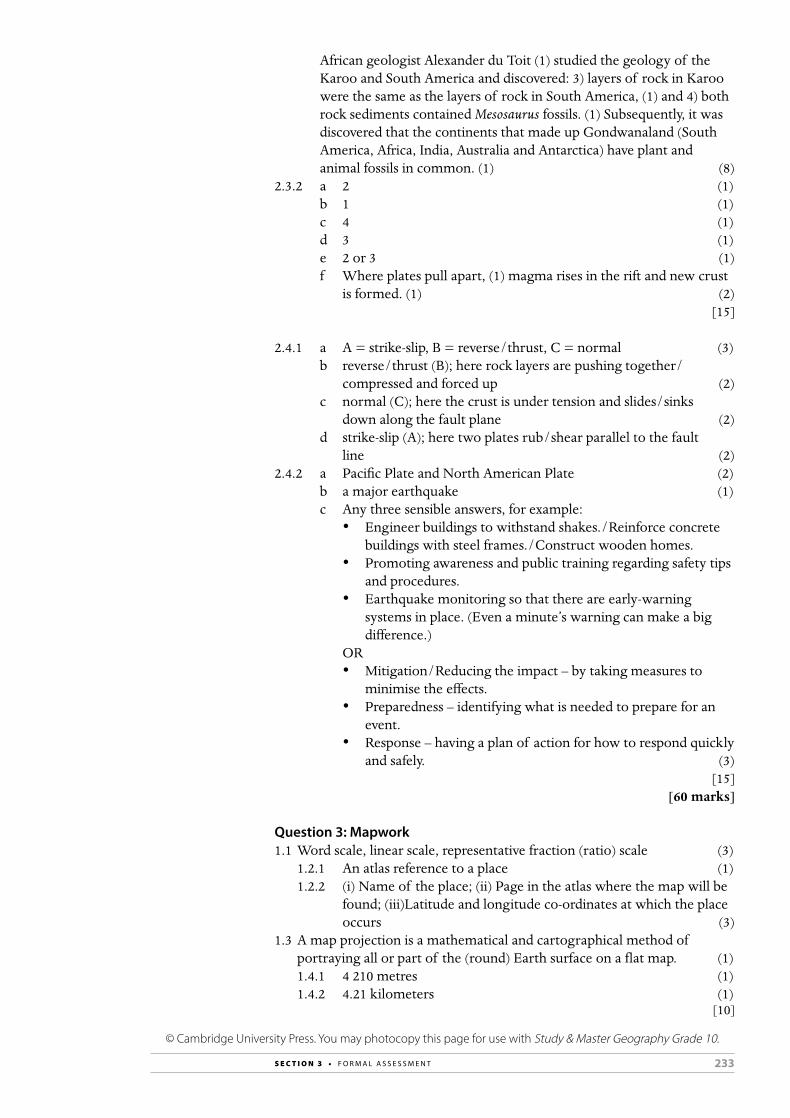
233S E C T I O N 3 • F O R M A L A S S E S S M E N T
African geologist Alexander du Toit (1) studied the geology of the Karoo and South America and discovered: 3) layers of rock in Karoo were the same as the layers of rock in South America, (1) and 4) both rock sediments contained Mesosaurus fossils. (1) Subsequently, it was discovered that the continents that made up Gondwanaland (South America, Africa, India, Australia and Antarctica) have plant and animal fossils in common. (1) (8)
2.3.2 a 2 (1) b 1 (1) c 4 (1) d 3 (1) e 2 or 3 (1) f Where plates pull apart, (1) magma rises in the rift and new crust
is formed. (1) (2)[15]
2.4.1 a A = strike-slip, B = reverse/thrust, C = normal (3) b reverse/thrust (B); here rock layers are pushing together/
compressed and forced up (2) c normal (C); here the crust is under tension and slides/sinks
down along the fault plane (2) d strike-slip (A); here two plates rub/shear parallel to the fault
line (2)2.4.2 a Pacific Plate and North American Plate (2)
b a major earthquake (1) c Any three sensible answers, for example:
• Engineer buildings to withstand shakes./Reinforce concrete buildings with steel frames./Construct wooden homes.
• Promoting awareness and public training regarding safety tips and procedures.
• Earthquake monitoring so that there are early-warning systems in place. (Even a minute’s warning can make a big difference.)
OR • Mitigation/Reducing the impact – by taking measures to
minimise the effects. • Preparedness – identifying what is needed to prepare for an
event. • Response – having a plan of action for how to respond quickly
and safely. (3)[15]
[60 marks]
Question 3: Mapwork 1.1 Word scale, linear scale, representative fraction (ratio) scale (3)
1.2.1 An atlas reference to a place (1)1.2.2 (i) Name of the place; (ii) Page in the atlas where the map will be
found; (iii)Latitude and longitude co-ordinates at which the place occurs (3)
1.3 A map projection is a mathematical and cartographical method of portraying all or part of the (round) Earth surface on a flat map. (1)1.4.1 4 210 metres (1)1.4.2 4.21 kilometers (1)
[10]
© Cambridge University Press. You may photocopy this page for use with Study & Master Geography Grade 10.

234 S E C T I O N 3 • F O R M A L A S S E S S M E N T
2.1 Hilly; numerous contours and height differences in the landscape (2) 2.2 Hill or koppie or butte (1)2.3 Buffelsrivier or Buffels River (1)2.4 the uThukela River (1)2.5 No (1)2.6 No; no recognisable town or urban street patterns or names (1)2.7 No; no flat land, or evidence of cultivated fields (1)2.8 Traditional homes or huts (1)2.9 The north west is more densely populated; far more evidence of
settlement (houses and huts) (2)2.10 No (1)
3.1 Geographical Information System(s) (1)3.2.1 Layers of a GIS (1)3.2.2 Raster data (layer) (1)3.2.3 Vector data (layer) (1)
3.3 Any three suitable answers: • Compiling maps and data of physical landscapes• Planning purposes• Educational purposes• Any other spatial example (3)
3.4 Data or digital data or spatial data (information) (1)[8]
[30 marks]TOTAL: 150 marks
© Cambridge University Press. You may photocopy this page for use with Study & Master Geography Grade 10.

235S E C T I O N 3 • F O R M A L A S S E S S M E N T
End-of-year examination: Paper 1 (The Atmosphere, Geomorphology, Mapwork)TOTAL MARKS: 150
Time:3 hours
Question 1: The Atmosphere A Short, objective questions 1.1 Choose the correct answer from the four options. Write down only the
number and the letter of the correct answer.1.1.1 A cloud that grows to a height of 10 km and causes heavy rain is …
A cumulus. B stratus. C cumulonimbus. D cirrus.
1.1.2 Orographic rain is caused by … A convection currents. B mountain barriers. C cold fronts. D tropical cyclones.
1.1.3 The instrument used to measure humidity is called … A an anemometer. B a hygrometer. C a rain gauge. D a barometer.
1.1.4 A synoptic weather map indicates … A wind patterns. B pressure patterns. C temperatures. D all of the above.
1.1.5 The following is not a greenhouse gas: A carbon dioxide. B oxygen. C methane. D water vapour.
1.1.6 The region between 50 and 80 kilometers above the Earth’s surface is the …
A stratosphere. B troposphere. C mesosphere. D thermosphere.
1.1.7 The outer layer of the atmosphere is called the … A stratosphere. B troposphere. C heterosphere. D mesosphere.
1.1.8 … is the transfer of heat between adjacent air molecules in contact.
A Convection B Conduction C Radiation D Insolation
© Cambridge University Press. You may photocopy this page for use with Study & Master Geography Grade 10.

236 S E C T I O N 3 • F O R M A L A S S E S S M E N T
1.1.9 The change of temperature with increasing height is the … A condensation level. B dew point. C relative humidity. D lapse rate.
1.1.10 Albedo is a measure of sunlight … A absorbed B reflected. C scattered. D conducted.
1.1.11 When relative humidity is high, A the amount of water vapour in the air is low. B air temperature increases. C temperature feels hotter than air temperature. D air temperature decreases.
1.1.12 The highest clouds in the sky are … A cirrus. B cumulus. C stratus. D nimbus.
1.1.13 The process by which plants release water vapour into the air is called …
A evaporation. B condensation. C infiltration. D transpiration.
1.1.14 When relative humidity is 100% ... A the air is saturated with water vapour. B the air holds the maximum amount of water vapour. C both A and B are true. D both A and B are false.
1.1.15 Terrestrial radiation is … A also called insolation. B long-wave radiation. C short-wave radiation. D heat from deep within the Earth’s core.
[15]
© Cambridge University Press. You may photocopy this page for use with Study & Master Geography Grade 10.

237S E C T I O N 3 • F O R M A L A S S E S S M E N T
B Three questions of 15 marks each on The Atmosphere 1.2 Refer to the graph below and answer the questions that follow.
Alti
tude
20
18
16
14
12
10
8
6
4
2
0
-60 -40 -20 0 20Temperature
Troposphere
Tropopause
Stratosphere
C
km
Lapse rate 6.4 C/1000m
60 000
50 000
40 000
30 000
20 000
10 000
0
ft
o
o
The temperature lapse rate under typical conditions1.2.1 What is a temperature lapse rate? (1)1.2.2 What is the temperature lapse rate in Celsius under typical
conditions? (2)1.2.3 Under typical conditions, what would be the temperature at
10 km above the Earth? (2)1.2.4 Calculate the temperature under typical conditions at 10 metres
above the Earth’s surface if the temperature at the surface were 20 °C. (3)
1.2.5 Define the tropopause. (2)1.2.6 Describe what happens to the temperature in the stratosphere? (1)1.2.7 What is this temperature pattern called? (1)1.2.8 Explain why this temperature pattern occurs in the
stratosphere. (2)1.2.9 In which other layer of the atmosphere does this pattern
occur? (1)[15]
1.3 Clouds play an important role in balancing the Earth’s energy budget. Refer to the figure below and answer the questions.
–4 °C 2 °C 7 °CThe effect of cloud cover on night-time temperatures
© Cambridge University Press. You may photocopy this page for use with Study & Master Geography Grade 10.

238 S E C T I O N 3 • F O R M A L A S S E S S M E N T
1.3.1 Clouds reflect almost 20% of incoming solar radiation back into space. a Would this process be called short-wave cooling or long-wave
warming? (1)b Give a reason for your answer in a. (1)
1.3.2 Clouds also trap the radiation that would otherwise be lost to space. a Would this process be called short-wave cooling or long-wave
warming? (1)b Give a reason for your answer in a. (1)
1.3.3 Clouds vary in their albedo. Of cumulus and cirrus clouds, which hasa a high albedo (1)b a low albedo? (1)
1.3.4 Give a reason for your answers in 1.3.3. (1)1.3.5 Write a short paragraph explaining why early morning temperatures
are colder on clear nights than they are on cloudy nights. (8)[15]
1.4 Refer to the synoptic map below.
Biera
Harare
Walvis Bay Windhoek
Bulawayo
Gaborone
Upington
Durban
Cape Town 15
10
14
2
11
Pretoria
-318
14
L
L
L
L
Gough
14
Maputo
5 16
5
-5
2 Bloemfontein-5
17
0
11
2
-4
Lüderitz
-12
-4
-10
-4
8
0
-13
-7
19
27
32
Port ElizabethEast London4
-10
5
29
-4
-7
18
19
19
40
510
35
15
45
30
10
105
0
25
20
15
25
35
35
20 25 30 3540
40
45
45
4035
45
20
15
30
DE
SC
RIP
TION
BE
SP
RE
KIN
G
1028
1024
1020
1016
1012
1008
1004
1000
996992988984980L
1004
1016
1016
1012
L
10161012100810041000996
988998
50
SY
NO
PTIC
WE
ATHE
R M
AP
SIN
OP
TIES
E W
EE
RK
AA
RT
12:00 LT - 14:00 SA
ST: 2010-08-03
Marion
1012
13
19
20
8
15
1
25
27
1
28
-1Mowe 30
29
29
73
7
17 818
147
-225
14
0
-8
21
22
-10
2321
20
19
9
30
27
26
27
4
31
26
310
-3
26
7
33
-7
348
23
-15
274
2317
164
21
25
2829
25
25
19
5
15
19
27
20
Antananarivo
AB
Synoptic chart
1.4.1 Compare the spacing of the isobars for the low-pressure frontal system south of South Africa with the high-pressure cell west of South Africa. What does the isobar spacing for the low-pressure system mean? (2)
1.4.2 In which direction is air spiralling around the low-pressure system? (1)1.4.3 Compare the weather in Cape Town and Pretoria giving, where
relevant, the units of measurement: a Temperature (2) b Dew point (2) c Cloud cover (2)
1.4.4 Explain the relationship for 1.4.3 between temperature, dew point and cloud cover. (3)
© Cambridge University Press. You may photocopy this page for use with Study & Master Geography Grade 10.

239S E C T I O N 3 • F O R M A L A S S E S S M E N T
1.4.5 a What windspeeds come with gale warning? (1) b Do any windspeeds shown on the map merit a gale warning? Give
a reason for your answer. (2)[15]
[60 marks]
Question 2: Geomorphology A Short, objective questions 2.1 Match the term with the correct description. Write only the number and
the matching letter.
Term Description
2.1.1 core A. the granitic rocks of the continental crust
2.1.2 igneous rock B. an igneous rock landform
2.1.3 tor C. a sunken fault block bounded by normal faults
2.1.4 cuesta D. forms the ocean floors
2.1.5 sedimentary rock E. the outermost layer of the Earth
2.1.6 sima F. the hot, dense inner portion of the Earth consisting of iron and nickel
2.1.7 sial G. rock consisting of particles laid down in layers
2.1.8 metamorphic rock H. rock formed from molten magma material
2.1.9 horst I. a sedimentary rock landform
2.1.10 syncline J. a type of sedimentary rock
2.1.11 fault K. a type of igneous rock
2.1.12 hot spot L. the summit opening of a volcano
2.1.13 vent M. the opening of a volcano at the Earth’s surface
2.1.14 shale N. an upward fold forming an arch
2.1.15 rhyolite O. a downward fold forming a trough
P. a region over a mantle plume
Q. a crack in a body of rock or the Earth’s crust
R. rock changed by extreme heat and pressure
S. a raised fault block bounded by normal faults
[15]
B Three questions of 15 marks each on Geomorphology (45 marks)2.2 Refer to the diagram and answer the questions.
A
CD
E F
BG
Igneous intrusions and extrusions
© Cambridge University Press. You may photocopy this page for use with Study & Master Geography Grade 10.

240 S E C T I O N 3 • F O R M A L A S S E S S M E N T
2.2.1 a Identify the igneous extrusions in the diagram. Give the letter and the type of extrusion. (2)
b Give two examples of extrusive igneous rock. (2)2.2.2 a Identify the igneous intrusions in the diagram. Give the letter and
type of intrusion. (5) b Give two examples of intrusive igneous rock. (2)
2.2.3 For labels A–G, which matches the following landforms? a Half Dome in Yosemites, North America (1) b Mount Nyiragongo in the Democratic Republic of Congo (1)
2.2.4 For G, what do the grey and white layers represent? (2)[15]
2.3 Refer to the diagram below and answer the questions that follow.
asthenosphere
oceanic crust
continental crust
lithosphere
A B
lithosphere
A subduction zone
2.3.1 Describe, in terms of tectonic plate movement, what happens at a subduction zone. (3)
2.3.2 Is the process destructive or constructive? Give a reason for your answer. (2)
2.3.3 When subduction takes place between an oceanic plate and a continental plate, which plate is subducted, and why? (2)
2.3.4 a Identify the landforms labelled A and B. (2)b Describe how A forms. (3)c Name the world’s most famous version of A. (1)d Explain why B forms. (2)
[15]
© Cambridge University Press. You may photocopy this page for use with Study & Master Geography Grade 10.

241S E C T I O N 3 • F O R M A L A S S E S S M E N T
2.4 Refer to the table below and answer the questions.Largest earthquakes Deadliest earthquakes
Year Date Magnitude Fatalities Region Date Magnitude Fatalities Region
2010 02/27 8.8 507Offshore Maule,
Chile01/12 7.0 222 570 Haiti
2009 09/29 8.1 192Samoa Islands
region09/30 7.5 1 117
Southern Sumatra, Indonesia
2008 05/12 7.9 87 587Eastern Sichuan,
China05/12 7.9 87 587
Eastern Sichuan, China
2007 09/12 8.5 25Southern Sumatra,
Indonesia08/15 8.0 514
Near Coast of Central Peru
2006 11/15 8.3 0 Kuril Islands 05/36 6.3 5 749 Java, Indonesia
2005 03/28 8.6 1 313Northern Sumatra,
Indonesia10/08 7.6 80 361 Pakistan
2004 12/26 9.1 227 898Off west coast of
Northern Sumatra12/26 9.1 227 898
Off west coast of Northern Sumatra
2003 09/25 8.3 0Hokkaido, Japan
Region12/26 6.6 31 000 Southeastern Iran
2002 11/03 7.9 0 Central Alaska 03/25 6.1 1 000Hindu Kush Region,
Afghanistan
2001 06/23 8.4 138 Near Coast of Peru 01/26 7.7 20 023 India
Table 2.4 The largest and deadliest earthquakes between 2001 and 2010
2.4.1 a Where and when did the largest and deadliest earthquake occur? (2)
b Give the magnitude of this earthquake. (1)c Name the measurement scale that would have been used to
record the magnitude. (1)d What is the problem with the Richter scale of measurement? (1)
2.4.2 Where and when did the second deadliest earthquake occur? (2)2.4.3 Write a paragraph explaining why each of the two earthquakes
mentioned in 2.4.1 and 2.4.2 had such a devastating impact. (8)[15]
[60 marks]
Question 3: Mapwork (30 marks)Use the map extract 2931BA GINGINDLOVU and the vertical aerial photograph of Gingindlovu and answer the following questions:
A Map skills and calculations (10 marks)1.1 Calculate the distance along the railway line from the station in
Gingindlovu to the Nyezane siding (block B5). (2)1.2 Give the direction and bearing from:
1.2.1 The Dokodweni interchange (block E4) to the next interchange travelling south on the N2 (block G2) (2)
1.2.2 Gingindlovu station to Hwebede (block C5) (2)1.3 Choose the correct answer. Any coordinate on this map would start with:
A 3129 B 2931 C minutesD seconds (2)
1.4 Calculate the real area of that part of the map covered in block A4. (2)[10]
© Cambridge University Press. You may photocopy this page for use with Study & Master Geography Grade 10.

242 S E C T I O N 3 • F O R M A L A S S E S S M E N T
B Map interpretation (12 marks)2.1 In what way does a vertical aerial photograph differ from oblique
photographs? (2)2.2 Name two advantages of a vertical aerial photograph over a map. (2)2.3 Looking at the map extract, and the vertical aerial photograph, on
which one is it easier to make out main roads? Explain your answer. (2)2.4 Looking at the map extract, and the vertical aerial photograph, on
which one is it easier to make out rows and clumps of trees? Explain your answer. (2)
2.5 Looking at the map extract, and the vertical aerial photograph, on which one is it easier to make out the names of places? Explain your answer. (2)
2.6 What evidence, in terms of names on southern part of the map, suggests that this area was originally inhabited by indigenous African people? (1)
2.7 Is there any evidence of heavy industry on the map? (1)[12]
C GIS (8 marks)3.1 What is a Geographical information System? (2)3.2 What is the difference between spatial and attribute data in a GIS? (2)3.3 Explain the main difference between a raster and a vector model in GIS. (2)3.4 Give any two examples of where a GIS might be used. (2)
[8][30 marks]
TOTAL 150 marks

243S E C T I O N 3 • F O R M A L A S S E S S M E N T
1 2 3 4 5 6
A
B
C
D
E
F
G
Reproduced under Government Printer’s Authorisation No. 11539 dated 29 June 2011Metres 1 000 0 1 000 2 000 3 000 4 000 5 000

244 S E C T I O N 3 • F O R M A L A S S E S S M E N T
© Cambridge University Press. You may photocopy this page for use with Study & Master Geography Grade 10.
Reproduced under Government Printer’s Authorisation No. 11539 dated 29 June 2011Metres 1 000 0 1 000 2 000 3 000 4 000 5 000
Vertical aerial photograph of Gingindlovu

245S E C T I O N 3 • F O R M A L A S S E S S M E N T
Memorandum End-of-year examination: Paper 1TOTAL MARKS: 150
Question 1: The Atmosphere1.1.1 C1.1.2 B1.1.3 B1.1.4 D1.1.5 B1.1.6 C1.1.7 C1.1.8 B1.1.9 D1.1.10 B1.1.11 C1.1.12 A1.1.13 D1.1.14 C1.1.15 B
[15]
1.2.1 The rate at which temperature decreases with altitude. (1)1.2.2 6,5 °C/1 000 m or 0,65 °C/100 m (2)1.2.3 approximately –45 °C (2)1.2.4 0,65 °C × 10 m = 6,5 (1); 20 °C – 6,5 = 13,5 °C (2) (3)1.2.5 the boundary/interface/transition between the troposphere and
the stratosphere (2)1.2.6 Temperature increases with altitude. (1)1.2.7 temperature inversion (1)1.2.8 This is the layer where ozone is found. Ozone absorbs the
ultraviolet (UV) radiation (1) and so the temperature increases (1). (2)1.2.9 the thermosphere (1)
[15]
1.3.1 a short-wave cooling (1) b Reflected sunlight/insolation is short-wave radiation. (1)
1.3.2 a long-wave warming (1) b Heat absorbed by the Earth and emitted, i.e. terrestrial
radiation, is long-wave radiation. (1)1.3.3 a cumulus (1)
b cirrus (1)1.3.4 Cumulus clouds are thick/dense with condensed water vapour
and therefore more reflective. OR Cirrus clouds are thin and therefore allow the solar radiation to pass through. (1)
1.3.5 At night, when there is no incoming solar radiation, (1) the surface of the Earth cools due to terrestrial radiation. (1) If the sky is cloudless, (1) most of this radiated heat is lost to space. (1) If the sky is cloudy, (1) clouds trap much of this radiated heat (1) and it is emitted back to earth. (1) In this way, clouds have an insulating effect. (1) (8)
[15]
© Cambridge University Press. You may photocopy this page for use with Study & Master Geography Grade 10.

246 S E C T I O N 3 • F O R M A L A S S E S S M E N T
1.4.1 Compared to the high-pressure cell, the isobars for the low-pressure system are closely spaced. (1) This means the air pressure gradient is higher for the low-pressure cell OR Isobars close together indicate unstable weather. (1) (2)
1.4.2 clockwise (1)1.4.3 a CT = 14 °C, Pretoria = 23 °C (2)
b CT = 5 °C, Pretoria = –15 °C (2) c CT = 6 eighths (or 3 quarters), Pretoria = clear (2)
1.4.4 Dew point is never greater than air temperature. The closer the air temperature and the dew point, the more likely there will be cloud cover or precipitation (dew or rain). (1) The difference in air temperature and dew point for CT is 9 °C and there is some cloud cover. (1) The difference in air temperature and dew point for Pretoria is 38 °C and skies are clear. (1) (3)
1.4.5 a Gale warnings are given for wind speeds above 34 knots or 65 km/h. (1)
b The highest windspeeds indicated are 25 knots (Port Elizabeth), so no gale warning is necessary. (2)
[15][60 marks]
Question 2: Geomorphology2.1.1 F2.1.2 H2.1.3 B2.1.4 I2.1.5 G2.1.6 D2.1.7 A2.1.8 R2.1.9 S2.1.10 O2.1.11 Q2.1.12 P2.1.13 M2.1.14 J2.1.15 K
[15]
2.2.1 a B = basalt flood, G = stratovolcano (2) b Any two: basalt, rhyolite, pumice (2)
2.2.2 a A = sill, C = dyke, D = laccolith, E = lopolith, F = batholith (5) b Any two: granite, dolerite, gabbro (2)
2.2.3 a F/batholith (1) b G/stratovolcano (1)
2.2.4 lava and ash (2)[15]
2.3.1 Two plates (both oceanic plates, or one oceanic plate and one continental plate) push together/converge/collide. (1) The heavier plate plunges beneath the other the plate, (1) into the Earth’s mantle. (1) (3)
2.3.2 Destructive. (1) Old crust/lithosphere is destroyed/melted down. (1) (2)
© Cambridge University Press. You may photocopy this page for use with Study & Master Geography Grade 10.
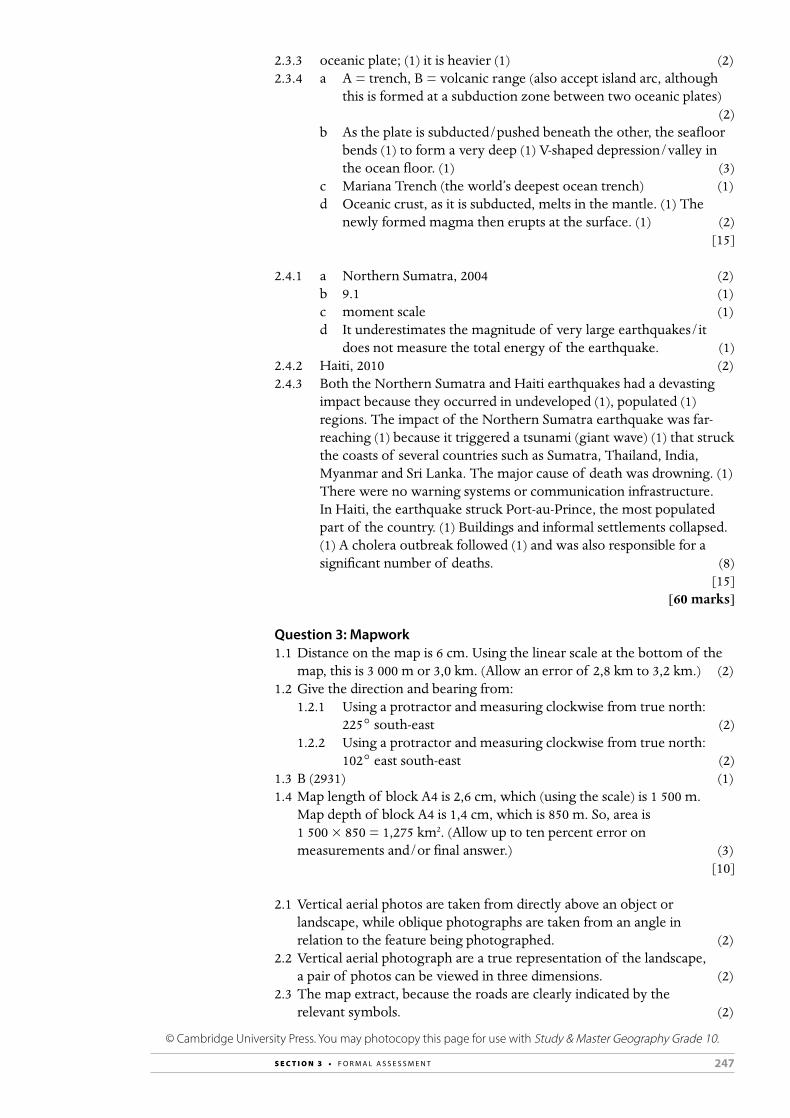
247S E C T I O N 3 • F O R M A L A S S E S S M E N T
2.3.3 oceanic plate; (1) it is heavier (1) (2)2.3.4 a A = trench, B = volcanic range (also accept island arc, although
this is formed at a subduction zone between two oceanic plates) (2)
b As the plate is subducted/pushed beneath the other, the seafloor bends (1) to form a very deep (1) V-shaped depression/valley in the ocean floor. (1) (3)
c Mariana Trench (the world’s deepest ocean trench) (1) d Oceanic crust, as it is subducted, melts in the mantle. (1) The
newly formed magma then erupts at the surface. (1) (2)[15]
2.4.1 a Northern Sumatra, 2004 (2) b 9.1 (1) c moment scale (1) d It underestimates the magnitude of very large earthquakes/it
does not measure the total energy of the earthquake. (1)2.4.2 Haiti, 2010 (2)2.4.3 Both the Northern Sumatra and Haiti earthquakes had a devasting
impact because they occurred in undeveloped (1), populated (1) regions. The impact of the Northern Sumatra earthquake was far-reaching (1) because it triggered a tsunami (giant wave) (1) that struck the coasts of several countries such as Sumatra, Thailand, India, Myanmar and Sri Lanka. The major cause of death was drowning. (1) There were no warning systems or communication infrastructure. In Haiti, the earthquake struck Port-au-Prince, the most populated part of the country. (1) Buildings and informal settlements collapsed. (1) A cholera outbreak followed (1) and was also responsible for a significant number of deaths. (8)
[15][60 marks]
Question 3: Mapwork1.1 Distance on the map is 6 cm. Using the linear scale at the bottom of the
map, this is 3 000 m or 3,0 km. (Allow an error of 2,8 km to 3,2 km.) (2)1.2 Give the direction and bearing from:
1.2.1 Using a protractor and measuring clockwise from true north: 225° south-east (2)
1.2.2 Using a protractor and measuring clockwise from true north: 102° east south-east (2)
1.3 B (2931) (1)1.4 Map length of block A4 is 2,6 cm, which (using the scale) is 1 500 m.
Map depth of block A4 is 1,4 cm, which is 850 m. So, area is 1 500 × 850 = 1,275 km2. (Allow up to ten percent error on measurements and/or final answer.) (3)
[10]
2.1 Vertical aerial photos are taken from directly above an object or landscape, while oblique photographs are taken from an angle in relation to the feature being photographed. (2)
2.2 Vertical aerial photograph are a true representation of the landscape, a pair of photos can be viewed in three dimensions. (2)
2.3 The map extract, because the roads are clearly indicated by the relevant symbols. (2)
© Cambridge University Press. You may photocopy this page for use with Study & Master Geography Grade 10.

248 S E C T I O N 3 • F O R M A L A S S E S S M E N T
2.4 The vertical aerial photograph, as the vegetation can actually be seen as it is in reality. (2)
2.5 The map, because names are indicated (printed) on the map. (2)2.6 Zulu names (1)2.7 No (1)
[12]
3.1 A computer-based software system that works with spatial information and data. (2)
3.2 Spatial data records special objects and their co-ordinates; attribute data records additional information about spatial objects, such as the name of a city and its size? (2)
3.3 Vector points are simply XY coordinates, while raster data is made up of pixels. (2)
3.4 Accept any two reasonable answers, e.g. town planning, physical landscape data, spatial distributions of anything geographical where data is associated with points or places (2)
[8][30 marks]
TOTAL: 150 marks
© Cambridge University Press. You may photocopy this page for use with Study & Master Geography Grade 10.

249S E C T I O N 3 • F O R M A L A S S E S S M E N T
End-of-year examination: Paper 2 (Population Geography, Water Resources, Mapwork)TOTAL MARKS: 150
Time:3 hours
Question 1: Population Geography A Short, objective questions (15 marks)1.1.1 Explain the difference between:
a Population distribution and population density b Population increase and population decrease c Fertility and mortality d Birth rates and death rates e Age and gender (5)
1.1.2 Explain the following terms: a Life expectancy b Population pyramid c Dependency ratio d Demographics e Overpopulation (5)
1.1.3 Answer the following in one or two sentences: a Why is life expectancy higher in some countries than in others? b What is a demographic transition model? c What is the difference between immigration and emigration? d What is rural-urban migration? e What is a megacity? (5)
[15]
B Three questions of 15 marks each on Development Geography and Urban settlement (45 marks)
1.2.1 What factors cause the population of the World to not be evenly distributed over the Earth’s surface? (8)
1.2.2 Explain what will happen to the size of a country’s population if a the birth rate is greater than the death rate b the death rate is greater than the birth rate. (2)
1.2.3 Explain what is meant by the fertility rate in a population. Is South Africa’s fertility rate increasing or decreasing? (5)
[15]
© Cambridge University Press. You may photocopy this page for use with Study & Master Geography Grade 10.

250 S E C T I O N 3 • F O R M A L A S S E S S M E N T
1.3 Look at the following population pyramids for South Africa and Italy and answer the questions that follow:
Male Female
Population (in millions)
0,00,51,01,52,02,5 0 0,5 1,0 1,5 2,0 2,5
Italy: 1992
80–8485+
75–7970–7465–6960–6455–5950–5445–4940–4435–3930–3425–2920–2415–1910–14
5–90–4
Male Female
Population (in millions)
0,00,51,01,52,02,53,0 0,0 0,5 1,0 1,5 2,0 2,5 3,0
South Africa: 1991
80+75–7970–7465–6960–6455–5950–5445–4940–4435–3930–3425–2920–2415–1910–14
5–90–4
1.3.1 Which country has a relatively young population, and which has a relatively old population? Explain your answer. (5)
1.3.2 Which country appears to have the longest life expectancy? Explain your answer. (3)
1.3.3 Explain why both population pyramids become narrower right towards the top. (2)
1.3.4 Gender wise, in both countries, which gender appears to live longer? (1)
1.3.5 From the population information on the two pyramids, which is the more developed country: South Africa or Italy? Explain your answer. (4)
[15]
1.4.1 Explain why people the world over tend to migrate or move from one place to another? (5)
1.4.2 List some of the social and economic effects of HIV/AIDS, particularly with regard to South Africa. (5)
1.4.3 Since 1994, South Africa has experienced rapid urbanisation. Explain what this means, and why it has happened. (5)
[15][60 marks]
© Cambridge University Press. You may photocopy this page for use with Study & Master Geography Grade 10.

251S E C T I O N 3 • F O R M A L A S S E S S M E N T
Question 2: Water Resources (60 marks)A Short, objective questions (15 marks)2.1.1 Explain the difference between:
a Water vapour, and water b Water and ice c Oceans and lakes d Surface water and ground water e Infiltration and runoff (5)
2.1.2 Explain the following terms: a Food chain b Ocean waves c Ocean tides d Condensation e Precipitation (5)
2.1.3 Answer the following in a few words or one sentence: a What drives ocean currents? b What is meant by ocean upwelling? c Explain why cold currents are particularly important for fishing. d Name one of the ocean currents that flows along the coastline of
South Africa. e Explain the term overfishing. (5)
[15]
B Three questions of 15 marks each on Resources and Sustainability; South Africa (45 marks)
2.2 Look at the diagram of the hydrological cycle.
cloud
2 1
9
5
3
4
6
7
8
2.2.1 Give another word for hydrological. (1)2.2.2 Identify the features labelled 1 to 9. (9)2.2.3 Explain how human activities impact on the world’s oceans. (5)
[15]
2.3.1 Explain the role of rivers, dams and lakes as water resources in South Africa. (6)
2.3.2 What are floods, and in what ways can they disrupt the lives and property of South Africans? (4)
2.3.3 How can floods be managed or prevented? (5)[15]
© Cambridge University Press. You may photocopy this page for use with Study & Master Geography Grade 10.

252 S E C T I O N 3 • F O R M A L A S S E S S M E N T
2.4.1 Explain the important role of local government (municipalities) in providing fresh water to South Africans. (8)
2.4.2 How can we, as South Africans, make sure we use water sustainably? (7)
[15][60 marks]
Question 3: Mapwork (30 marks)Use the map extract 2931BA GINGINDLOVU (page 244) and the vertical aerial photograph of Gingindlovu (page 245) to answer the following questions:
A Map skills and calculations (10 marks)1.1 Calculate the straight-line distance between the Dodokdweni
interchange on the N2 road to the N2 bridge over the Matigulu River. (4)1.2 Calculate the area of block D2 on the map extract (4)1.3 What is the altitude (height difference) between:
1.3.1 Beacon 152 Wangu (block G3) and the coast? (1)1.3.2 Beacon 152 Wangu (block G3) and Beacon 14 Ngulule
(block E2/3)? (1)[10]
B Map interpretation (12 marks)2.1 Which part of the map appears to show more evidence of development
infrastructure, the northern or the southern part? Explain your answer. (3)2.2 Which part of the map appears to show more evidence of rural
settlement, the northern or the southern part? Explain your answer. (3)2.3 Why, do you think, does the N2 road cross the Matigulu River where it
does, and not closer to the mouth of the river? (2)2.4 There is evidence of extensive agriculture in the northern part of the
map. Why might it be found here, rather than further south? (2)2.5 What is there in the extreme south of the map to indicate that the
coastal environment here is protected? (1)2.6 Why might so many transport routes (roads and railway lines) converge
(come together at Gingindlovu town? (1)[12]
C GIS (8 marks)3.1 Explain the concept of layers of information and data on a GIS map. (3)3.2 Look at the following GIS concepts and answer the questions that
follow:
A B C
3.2.1 What is represented by each of A, B and C? (3)3.2.2 Symbol A, especially when it is connected as in B, can be given
another name. What is it? (1)3.3 Why is it necessary to have a fairly powerful computer in order to run
a GIS? (1)[8]
[30 marks]TOTAL: 150 marks
© Cambridge University Press. You may photocopy this page for use with Study & Master Geography Grade 10.

253S E C T I O N 3 • F O R M A L A S S E S S M E N T
Memorandum End-of-year examination: Paper 2TOTAL MARKS: 150
Question 1: Population Geography1.1.1 a Population distribution refers to the spread of people
(settlement) over the landscape; population density shows how closely packed (or far apart) the population is. (1)
b Population increase refers to a growing population; and population decrease refers to a population that is declining or shrinking in numbers. (1)
c Fertility refers to births; mortality refers to deaths. (1)d Birth rates show the total number of babies born alive per
1 000 population each year, while death rates show the total number of deaths per 1 000 of the population each year. (1)
e Age refers to how old (or young) a population is while gender refers to the ratio of women to men. (1)
1.1.2 a Life expectancy is the number of years a person can be expected to live for. (1)
b A population pyramid shows, in graphic (pyramid-shaped) form, age groups and the number of men and women in each age group. (1)
c Dependency ratio is the number of people who rely for support on a breadwinner, or worker. (1)
d Demographics is the statistical information related to a population (demography). (1)
e Overpopulation implies too many people for the available resources in a population to support. (1)
1.1.3 a Because developed countries are wealthy, and the population enjoys better nutrition, living conditions and medical care than populations in developing, poorer countries, which enables them to live for longer. (1)
b A demographic transition model is a four-stage model of changes in birth and death rates as a country becomes more and more developed and wealthier. (1)
c Immigration is people arriving in a country; emigration is people leaving a country. (1)
d People or populations leaving the countryside (rural areas) and moving to the cities (urban areas), typically in search of work and opportunities. (1)
e A very large city or urban area made up of one or more cities, typically home to more than 10 million people. (1)
[15]
© Cambridge University Press. You may photocopy this page for use with Study & Master Geography Grade 10.

254 S E C T I O N 3 • F O R M A L A S S E S S M E N T
1.2.1 Both biotic (natural environmental) (1) and abiotic (human impacts) (1) will influence the distribution of populations (people) over the surface of the Earth. These factors include: ideal climate, the natural vegetation of a region, fertile soil, flat land, and an absence of insect pests and diseases such as malaria. (3) From the human side, a stable government, peaceful conditions, economic prosperity and the ability to produce surplus food (possibly through technological innovation) (3) will impact on population distribution. (8)
1.2.2 a The size of the population will increase. (1)b The size of the population will decrease. (1)
1.2.3 The fertility rate is not the same as the rate of population increase, but it impacts directly on the rate of increase. It refers to the average number of births per woman. In South Africa, the fertility rate is decreasing (on average, mothers are giving birth to fewer children than in the past). (5)
[15]
1.3.1 South Africa has a relatively young population, shown by the broader bars in the lower age groups, while Italy has an older population, shown by the broader bars higher up the pyramid. (5)
1.3.2 Italy has the longer life expectancy, shown by the (relative to South Africa) broad bars in the highest age categories. (3)
1.3.3 Because, as people grow older, they are more likely to die. Very few people reach the age of 90 and above. (2)
1.3.4 Females live longer. (1)1.3.5 Italy is more developed. It is at a later stage in the demographic
transition model than South Africa. South Africa has a large number of young people; Italy has an ageing population. (4)
[15]
1.4.1 People migrate, either from country to country, or within a country, typically because of better opportunities. Economic migration is when people migrate to find work. Forced or political migration also occurs, when people move to escape persecution. People may migrate to be with family, or for a change in lifestyle. (5)
1.4.2 Social effects: families lose parents, poverty, health services cannot cope, education not completed. Economic effects: poverty, economic impact on the country, cost of treatments, and so on (5)
1.4.3 Apartheid laws prevented black people from migrating to the cities. This changed in 1994. Rural populations have moved to the cities (urbanisation) looking for work and opportunities not available in the poorer, rural areas. (5)
[15][60 marks]
© Cambridge University Press. You may photocopy this page for use with Study & Master Geography Grade 10.

255S E C T I O N 3 • F O R M A L A S S E S S M E N T
Question 2: Water Resources 2.1.1 a Water vapour is water in gas (gaseous) form; water is in
liquid form. (1)b Water is in liquid form; ice is water in frozen (solid) form. (1)c Oceans are salt water bodies completely surrounding the
Earth’s land masses. Lakes are (usually) freshwater bodies on continental land masses. (1)
d Surface water is water on the surface of the Earth. Ground water is water stored naturally below the surface. (1)
e Infiltration is rain and surface water that soaks into the earth, and runoff is water that flows, under gravity, until it reaches a river. (1)
2.1.2 a The feeding relationship between organisms in which organisms survive and grow by consuming plants or animals below them in the chain. (1)
b Ocean waves are disturbances on the ocean surface generated by the wind blowing over the surface. (1)
c Ocean tides are the rise and fall of sea levels (visible on the coast) due to the gravitational pull of the Moon and Sun. (1)
d Condensation is the change of a substance from gas form to liquid (through cooling, or a pressure increase). (1)
e Precipitation is atmospheric water that reaches the Earth’s surface as rain, hail or snow. (1)
2.1.3 a Wind (1)b Rise of deep, cold, sea water to the surface, usually where a
current collides with a land mass. (1)c Because cold water upwelling contains plankton (bottom of
the food chain) on which fish thrive. (1)d Benguela or Mozambique (1)e Catching more fish than can naturally reproduce to make up
the numbers. (1)[15]
2.2.1 Water (1)2.2.2 1: evaporation
2: precipitation (rain) 3: wind 4: evaporation/evapotranspiration 5: cloud 6: glacier/ice 7: infiltration 8: runoff/river 9: throughflow/ground water (9)
2.2.3 Pollution (oil pollution and plastics in particular) pollute the oceans. Overfishing, deep sea mining and oil exploration, as well as coastal settlement (release of sewerage into the ocean, for example) and even tourism, as well as poaching, impact on the oceans. (5)
[15]
© Cambridge University Press. You may photocopy this page for use with Study & Master Geography Grade 10.

256 S E C T I O N 3 • F O R M A L A S S E S S M E N T
2.3.1 Rivers provide water for urban industrial and agricultural use (e.g. the Vaal and Orange Rivers). Large storage dams (e.g. Vaal Dam, Theewaterskloof ) store water for urban and industrial use. The Gariep Dam provides some HEP and controls flooding, and provides water for irrigation. Lakes can provide fresh water, and are part of the natural ecosystems in, for example, KwaZulu-Natal. (6)
2.3.2 Floods occur when the drainage system (rivers in rural areas, canals and stormwater systems in urban areas) cannot handle the volume of (rain) water at a particular time. Water levels rise, and flooding of land, roads and buildings occurs, with damage to property, disruption to communications, and even loss of life. (4)
2.3.3 By opening and closing sluice gates on large dams, water flow may be controlled. Building proper drainage systems, and keeping river channels free of debris also helps. River canalisation works, but it is environmentally unfriendly. Early warning (weather forecasts) can help people prepare for flood events. (5)
[15]
2.4.1 Municipalities are responsible for water purification (1) and waste-water treatment of sewage and effluent. (1) They must supply clean, drinkable water to the areas they serve. (1) All households need water for drinking, cooking and washing (1) but poor rural areas and informal settlements lag behind. (1) Most municipalities buy water in bulk and then purify it and pipe it to their consumers. (1) The municipality is responsible for local water supply infrastructure. (1) Cities such as Cape Town have their own storage dams and are responsible for every aspect of water supply. (1) (8)
2.4.2 By not wasting water. By adhering to water restrictions, and by not polluting water sources (dams and rivers) or vandalising infrastructure (pipelines, purification works). Monitoring water resources, not over-exploiting ground water, planning ahead in terms of water provision, fixing water leaks, recycling water and desalination all help towards the sustainable use of water. (Accept any seven appropriate actions.) (7)
[15][60 marks]
Question 3: Mapwork 1.1 Distance on map is 4,5 cm, which (using the linear scale) is a
distance of 2 700 m or 2,7 km (allow 10% error). (4)1.2 Block D2 is 3,0 cm × 3,5 cm, which (using the linear scale) is
1 500 × 1 750 m = 2 625 000 m2, which is 2,65 km2 (allow 10% error either side of the answer). (4)1.3.1 137,1 m (1)1.3.2 137,1 m – 133,3 m = 3,8 m (1)
[10]2.1 The northern part; (1) there are more roads, the urban settlement
(town) of Gingindlovu, and infrastructure such as powerlines. (2) (3)2.2 The southern part; (1) the small dots which represent traditional
dwellings (huts). (2) (3)
© Cambridge University Press. You may photocopy this page for use with Study & Master Geography Grade 10.
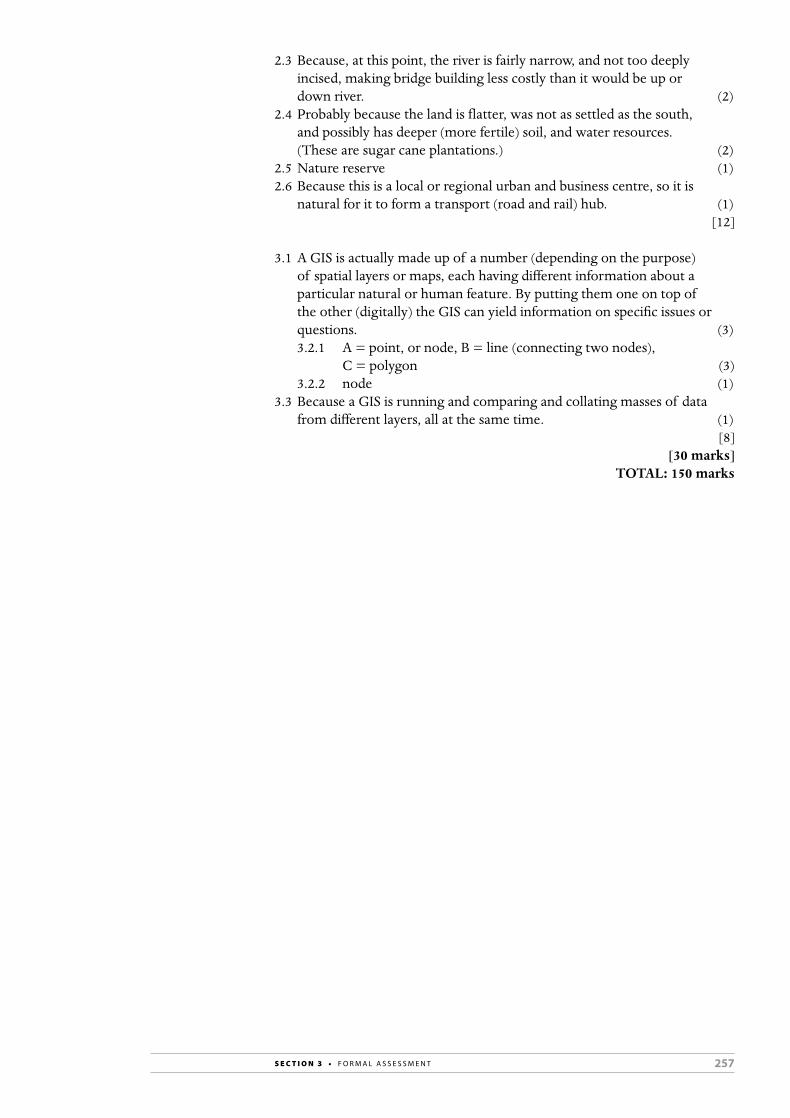
257S E C T I O N 3 • F O R M A L A S S E S S M E N T
2.3 Because, at this point, the river is fairly narrow, and not too deeply incised, making bridge building less costly than it would be up or down river. (2)
2.4 Probably because the land is flatter, was not as settled as the south, and possibly has deeper (more fertile) soil, and water resources. (These are sugar cane plantations.) (2)
2.5 Nature reserve (1)2.6 Because this is a local or regional urban and business centre, so it is
natural for it to form a transport (road and rail) hub. (1)[12]
3.1 A GIS is actually made up of a number (depending on the purpose) of spatial layers or maps, each having different information about a particular natural or human feature. By putting them one on top of the other (digitally) the GIS can yield information on specific issues or questions. (3)3.2.1 A = point, or node, B = line (connecting two nodes),
C = polygon (3)3.2.2 node (1)
3.3 Because a GIS is running and comparing and collating masses of data from different layers, all at the same time. (1)
[8][30 marks]
TOTAL: 150 marks

258 S E C T I O N 3 • F O R M A L A S S E S S M E N T
Reco
rd s
heet
for f
orm
al a
sses
smen
t: Te
rm 1
Cla
ss:
Year
:
Lear
ner’s
nam
esTe
st m
ark
(60
mar
ks)
Cont
ribu
tion
to y
ear
mar
k (4
0 m
arks
)*A
sses
smen
t Tas
k 1
(Ess
ay) m
ark
(1
00 m
arks
)
Cont
ribu
tion
to y
ear
mar
k (2
0 m
arks
)**
Term
1 m
ark
(6
0 m
arks
)***
Term
1
perc
enta
ge~
Ratin
g co
de
Ratin
g co
des
and
desc
ript
ors:
7:
Out
stan
ding
ach
ieve
men
t (80
%–1
00%
)
6: M
erito
rious
ach
ieve
men
t (70
%–7
9%)
5:
Sub
stan
tial a
chie
vem
ent (
60%
–69%
)
4: A
dequ
ate
achi
evem
ent (
50%
–59%
)
3: M
oder
ate
achi
evem
ent (
40%
–49%
) 2:
Ele
men
tary
ach
ieve
men
t (30
%–3
9%)
1:
Not
ach
ieve
d (0
%–2
9%)
* D
ivid
e th
e le
arne
r’s te
st m
ark
by 6
and
mul
tiply
by
4.
**
Div
ide
the
lear
ner’s
Ess
ay m
ark
by 5
.**
* A
dd th
e C
ontr
olle
d te
st m
ark
and
the
Essa
y m
ark.
Thi
s mar
k is
out o
f 60
.~
D
ivid
e th
e nu
mbe
r in
the
prev
ious
col
umn
by 6
0 an
d m
ultip
ly b
y 10
0.
© Cambridge University Press. You may photocopy this page for use with Study & Master Geography Grade 10.

259S E C T I O N 3 • F O R M A L A S S E S S M E N T
Reco
rd s
heet
for f
orm
al a
sses
smen
t: Te
rm 2
Cla
ss:
Year
:
Lear
ner’s
nam
esA
sses
smen
t Tas
k 2
(Map
wor
k) m
ark
(6
0 m
arks
)
Cont
ribu
tion
to
year
mar
k
(20
mar
ks)*
Mid
-Yea
r exa
m
(150
mar
ks)
Cont
ribu
tion
to
year
mar
k
(20
mar
ks)*
*
Term
2 m
ark
(2
10 m
arks
)***
Term
2 p
erce
ntag
e ~
Ratin
g co
de
Ratin
g co
des
and
desc
ript
ors:
7:
Out
stan
ding
ach
ieve
men
t (80
%–1
00%
)
6: M
erito
rious
ach
ieve
men
t (70
%–7
9%)
5:
Sub
stan
tial a
chie
vem
ent (
60%
–69%
)
4: A
dequ
ate
achi
evem
ent (
50%
–59%
)
3:
Mod
erat
e ac
hiev
emen
t (40
%–4
9%)
2: E
lem
enta
ry a
chie
vem
ent (
30%
–39%
)
1: N
ot a
chie
ved
(0%
–29%
)
* D
ivid
e th
e m
ark
in th
e pr
evio
us c
olum
n by
3.
**
Div
ide
the
mar
k in
the
prev
ious
col
umn
by 1
5 an
d th
en m
ultip
ly th
e an
swer
by
2.**
* A
dd th
e m
arks
in C
olum
ns 2
and
4.
~
Div
ide
the
mar
k in
the
prev
ious
col
umn
by 2
1 an
d th
en m
ultip
ly th
e an
swer
by
100.
© Cambridge University Press. You may photocopy this page for use with Study & Master Geography Grade 10.

260 S E C T I O N 3 • F O R M A L A S S E S S M E N T
Reco
rd s
heet
for f
orm
al a
sses
smen
t: Te
rm 3
Cla
ss:
Year
:
Lear
ner’s
nam
esCo
ntro
lled
test
mar
k (6
0 m
arks
)Co
ntri
butio
n to
yea
r mar
k (4
0 m
arks
)*Te
rm 3
mar
k (6
0 m
arks
)**
Term
3 p
erce
ntag
e***
Ratin
g co
de
Ratin
g co
des
and
desc
ript
ors:
7:
Out
stan
ding
ach
ieve
men
t (80
%–1
00%
)
6: M
erito
rious
ach
ieve
men
t (70
%–7
9%)
5:
Sub
stan
tial a
chie
vem
ent (
60%
–69%
)
4: A
dequ
ate
achi
evem
ent (
50%
–59%
)
3: M
oder
ate
achi
evem
ent (
40%
–49%
) 2:
Ele
men
tary
ach
ieve
men
t (30
%–3
9%)
1:
Not
ach
ieve
d (0
%–2
9%)
* D
ivid
e th
e le
arne
r’s te
st m
ark
by 6
and
then
mul
tiply
the
answ
er b
y 4.
**
T
his i
s the
sam
e m
ark
that
app
ears
in C
olum
n 2.
***
Div
ide
the
num
ber i
n th
e pr
evio
us c
olum
n by
6 a
nd m
ultip
ly b
y 10
.
© Cambridge University Press. You may photocopy this page for use with Study & Master Geography Grade 10.

261S E C T I O N 3 • F O R M A L A S S E S S M E N T
Reco
rd s
heet
for f
orm
al a
sses
smen
t: Te
rm 4
Cla
ss:
Year
:
Lear
ner’s
nam
esYe
ar-e
nd e
xam
: Pa
per 1
mar
k
(150
mar
ks)
Year
-end
exa
m:
Pape
r 2 m
ark
(1
50 m
arks
)
Tota
l mar
k fo
r Ye
ar-e
nd e
xam
(3
00 m
arks
)*
Year
mar
k
(100
mar
ks)*
*Te
rm 4
mar
k (4
00 m
arks
)***
Term
4 p
erce
ntag
e~Ra
ting
code
Ratin
g co
des
and
desc
ript
ors:
7:
Out
stan
ding
ach
ieve
men
t (80
%–1
00%
)
6: M
erito
rious
ach
ieve
men
t (70
%–7
9%)
5:
Sub
stan
tial a
chie
vem
ent (
60%
–69%
)
4: A
dequ
ate
achi
evem
ent (
50%
–59%
)
3:
Mod
erat
e ac
hiev
emen
t (40
%–4
9%)
2: E
lem
enta
ry a
chie
vem
ent (
30%
–39%
)
1: N
ot a
chie
ved
(0%
–29%
)
* A
dd th
e m
arks
in C
olum
ns 2
and
3.
**
To w
ork
out t
he y
ear m
ark
of fo
r eac
h le
arne
r add
the
mar
ks in
the
colu
mns
indi
cate
d fr
om th
is ta
ble
and
the
tabl
es fo
r the
oth
er te
rms:
Term
1, C
olum
n 3
+
Term
1, C
olum
n 5
+ T
erm
2, C
olum
n 3
+ T
erm
2, C
olum
n 5
+ T
erm
3, C
olum
n 3
+ T
erm
4, C
olum
n 4
***
Add
the
mar
ks in
Col
umns
4 a
nd 5
.~
D
ivid
e th
e m
ark
in C
olum
n 6
by 4
.
© Cambridge University Press. You may photocopy this page for use with Study & Master Geography Grade 10.


4. RESOURCES
263
1. Useful websites p264
2. Recipes p265
3. Photocopiable worksheets p266
4. Answers for photocopiable worksheets p304
5. Lesson plan template p322

264 S E C T I O N 4 • R E S O U R C E S
© Cambridge University Press. You may photocopy this page for use with Study & Master Geography Grade 10.
1. USEFUL WEBSITES
The following websites are suggested for both you and the learners to consult. They contain information and features that would be of general use to you as a teaching tool for Grade 10 Geography:• http://www.dailymail.co.uk/sciencetech/index.html• http://www.geography4kids.com/index.html• http://gis.com• http://www.google.com/earth/index.html• http://maps.google.co.za• http://www.nasa.gov/home/index.html• http://www.nationalgeographic.com• http://www.un.org/en/development• http://www.weathersa.co.za
For website information that links specifically with the content of each module and unit, please consult the Resources section of the lessons in the Lesson-by-lesson part of this Teacher’s Guide (pages 17–198).

265S E C T I O N 4 • R E S O U R C E S
© Cambridge University Press. You may photocopy this page for use with Study & Master Geography Grade 10.
2. RECIPES
Recipe for papier mâché
Materials• flour• water• old newspapers• bucket• spoon
Method1. Mix one part flour to two parts water to make a runny, but sticky glue.2. If you are using a frame to build your model, tear up strips of newspaper
and dip them in the glue. Build up the strips around the frame.3. If you are using the papier mâché as a sort of modeling clay, then tear
up pieces of newspaper and add them to the paste to make a thick mash.
TipAllow plenty of drying time for your model before painting it with poster paints. You can apply a coat of varnish on top.
Recipe for play dough
Materials for 1 kg play dough• 5 cups of flour• 1 cup of water• 2 cups of salt• half a cup of oil• food colouring
Method1. Mix the flour, salt and oil, then add the water.2. Mix and knead well.3. For different colours, divide up the mixture and add enough drops
of food colouring to give a strong colour.
Tips• Store the play dough in a plastic bag or airtight container to prevent
it from drying out and getting hard.• To extend the life of a play dough model, bake it in a warm oven for
about half an hour. Or put it in the hot sun.

266 S E C T I O N 4 • R E S O U R C E S
© Cambridge University Press. You may photocopy this page for use with Study & Master Geography Grade 10.
3. PHOTOCOPIABLE WORKSHEETS
The following worksheets may be photocopied for use with Study & Master Geography Grade 10. Please refer to the Lesson-by-lesson section of this Teacher’s Guide for suggestions on when to use these worksheets. The consolidation worksheets can also be used for revision purposes. Answers for the photocopiable worksheets are provided on pages 303–320 of this section.

267S E C T I O N 4 • R E S O U R C E S
© Cambridge University Press. You may photocopy this page for use with Study & Master Geography Grade 10.
Worksheet 1 (consolidation)
Temperature and altitude
The lapse rate is a temperature decrease of 6,5 °C for every 1 000 m in altitude. Using the information already given in the table, calculate the temperature at the top of Mount Everest.
Altitude (m) Temperature (°C) Working out
2 000 29,9
3 000
4 000
5 000
6 000
7 000
8 000
8 800

268 S E C T I O N 4 • R E S O U R C E S
© Cambridge University Press. You may photocopy this page for use with Study & Master Geography Grade 10.
Worksheet 2 (consolidation)
The heating of the atmosphere and its effect
1. How is the atmosphere heated? 1.1 Choose the correct term from those in brackets to complete
the sentences.a) The Sun’s energy is called (terrestrial/solar) radiation.b) Short waves of the electromagnetic spectrum are
(visible light/infrared heat).c) The Sun’s radiation is (long-wave/shortwave) radiation.d) The atmosphere can only trap (long-wave/shortwave) radiation.e) The Earth radiates (long-wave/shortwave) radiation.
1.2 Name the tri-molecular oxygen molecule that absorbs the ultraviolet radiation from the Sun.
1.3 What percentage of incoming solar radiation is absorbed by the Earth?
1.4 Name three ways in which the rest is lost to the atmosphere.
1.5 Describe how latent heat is released into the atmosphere.
1.6 What is the difference between convection and conduction of heat?
2. Factors which affect differences in temperature2.1 Study the table below representing the temperature, latitude and height
above sea level of Durban, Johannesburg, Cape Town and Kimberley.
Place Latitude Average hottest month
Average coldest month
Annual temperature range
Height above sea level in metres
Johannesburg 26 ºS 20,0 ºC 10,0 ºC 10,0 1 665
Cape Town 34 ºS 21,7 ºC 12,8 ºC 8,9 12
Durban 30 ºS 23,9 ºC 16,7 ºC 7,2 5
Kimberley 29 ºS 25,0 ºC 10,0 ºC 15,0 1 197

269S E C T I O N 4 • R E S O U R C E S
© Cambridge University Press. You may photocopy this page for use with Study & Master Geography Grade 10.
a) Explain why Kimberley’s temperature range is higher than that of Durban.
b) Use the data from the table to explain how altitude above sea level affects temperature.
c) Which factor is responsible for Durban having the highest average hottest month?
d) What causes the average temperatures in Cape Town to be lower than in Durban?
3. With the aid of a fully labeled diagram, explain how latitude influences temperature.
4. What is meant by albedo?
5. How does albedo affect differences in temperature?

270 S E C T I O N 4 • R E S O U R C E S
© Cambridge University Press. You may photocopy this page for use with Study & Master Geography Grade 10.
Worksheet 3 (extension)
The effect of distance from the ocean on temperature
Task To demonstrate the ‘distance from the oceans’ effect and show that water is slower to cool than land or air.
Materials• 2 identical or equal-sized plastic lunchboxes • 2 weather or 1–100 °C thermometers, or 2 teaspoons
Method1. Put a thermometer in each plastic lunchbox. (If you do not have 2
weather thermometers or 0–100 °C thermometers put a teaspoon in each box and then feel which one is colder.)
2. Fill 1 lunchbox with water.3. Place both lunchboxes in the fridge or freezer.4. Check the thermometers after 15 minutes.
ResultsCan you predict which box will have cooled more quickly – the one filled with air or the one filled with water? Predicted result:Actual result:
Record or describe the difference in temperature:

271S E C T I O N 4 • R E S O U R C E S
© Cambridge University Press. You may photocopy this page for use with Study & Master Geography Grade 10.
Worksheet 4 (extension)
Depletion of ozone in the atmosphere
1. Read the newspaper article below and then answer the questions.
Hole in Arctic ozone layer is ‘growing at record rate’ Geneva, 5 April 2011 GENEVA 5 APRIL 2011The ozone layer protects us from the Sun’s harmful rays. However, according to scientists, 2011 saw the highest recorded levels of ozone depletion over the Arctic. The World Meteorological Organization (WMO) warned that ozone column loss reached 40 per cent in the spring of 2011. They blame this on a combination of a long, cold winter and lingering CFCs and halons in the atmosphere.
The Montreal Protocol on Substances That Deplete the Ozone Layer came into force on January 1 1989 as an international treaty aimed at phasing out the production of ozone-depleting chemicals, such as CFCs and halons. CFCs were once used in refrigerators, spray cans and fire extinguishers, but have now been phased out. However CFCs and halons have a long lifetime in the atmosphere and the ozone layer is only expected to recover by 2050, if everyone adheres to the Protocol.
Scientists know that levels of ozone at the poles do change with the seasons. Every year there is a large ozone loss over the Antarctica. However this is not the case in the Arctic stratosphere, where meteorological conditions vary much more each year. Over the past 15 years, the highest ozone loss recorded over the Arctic was about 30 per cent. Now in 2011, with a 40 per cent loss of ozone, we can expect more harmful UV light to be able to reach the Earth’s surface. This increases our risk of sunburn, skin cancer, eye damage and damage to the human immune system. Crops and marine life may also be harmed.
A spokesperson from WMO stated: “Depletion of the ozone… has reached an unprecedented level over the Arctic this spring because of the continuing presence of ozone-depleting substances in the atmosphere and a very cold winter in the stratosphere. If the ozone depleted area moves away from the pole and towards lower latitudes one can expect increased ultraviolet (UV) radiation as compared to the normal season. Some crops and forms of marine life can also suffer adverse effects.”
The areas of low ozone have shifted towards Greenland and Scandinavia. Scientists have warned that as the lower ozone areas move away from the Arctic, other parts of the world could face increased UV ray exposure. Everyone is urged to check their national UV forecasts and to take the appropriate measures to protect themselves.Source: Adopted from http://www.wmo.int/pages/mediacentre/press_releases/pr_912_en.html

272 S E C T I O N 4 • R E S O U R C E S
© Cambridge University Press. You may photocopy this page for use with Study & Master Geography Grade 10.
a) Where is the Arctic?
b) What has caused the depletion of ozone over the Arctic?
c) What is ozone?
d) In which layer of the atmosphere is ozone found?
e) Why is the presence of ozone in the atmosphere essential to human life?
f ) What is the WMO?
g) What are the functions of the WMO?
h) What have UV-B rays been linked to?
i) What was the aim of the Montreal Protocol?
j) Has this had any effect on the loss of ozone?
2. Imagine that you are a member of WMO and have been asked to write an article for a magazine on the causes, effects and possible solutions of ozone depletion. Write the article which must:• be at least 150 words long• have an interesting heading.

273S E C T I O N 4 • R E S O U R C E S
© Cambridge University Press. You may photocopy this page for use with Study & Master Geography Grade 10.
Worksheet 5 (consolidation)
Temperature difference and relative humidity
1. Use the dry bulb and wet bulb temperature readings on the table to work out:a) the temperature differenceb) the relative humidity.
Tips• Temperature difference = dry bulb temperature – wet bulb
temperature.• To work out the relative humidity, refer to Table 1.3.2 on page 43 of
the Learner’s Book.
Dry bulb temperature
Wet bulb temperature
Temperature difference
Relative humidity
30 °C 28 °C
30 °C 23 °C
24 °C 21 °C
24 °C 17 °C
20 °C 19 °C
20 °C 15 °C
20 °C 13 °C
2. Complete the sentence by underlining the correct word:a) When the temperature difference between the wet and dry bulbs is
small, the relative humidity is low/high.b) When the temperature difference between the wet and dry bulbs is
big, the relative humidity is low/high.

274 S E C T I O N 4 • R E S O U R C E S
© Cambridge University Press. You may photocopy this page for use with Study & Master Geography Grade 10.
Worksheet 6 (extension)
Water cycle model
Make a simple model of the water cycle that shows how the Earth’s water cycle takes place in a closed system.
Materials • jar with a lid• water• teaspoon of salt• marker pen/ tape
Method1. Half fill a jar with water and stir in a teaspoon of salt until it is dissolved
(this represents sea water). 2. Close the jar with a lid, mark the level of the water with a marker pen or
tape; and place it in a warm place. 3. Notice how much water evaporates. 4. Taste the condensed water droplets under the lid of the jar (which
represent fresh water precipitation). Do the droplets taste salty? Why or why not?
5. If a lot of water droplets collect, see how their weight pulls them down the sides of the jar and they run back into the water in the bottom (this represents the water runoff that returns to the sea).

275S E C T I O N 4 • R E S O U R C E S
© Cambridge University Press. You may photocopy this page for use with Study & Master Geography Grade 10.
Worksheet 7 (extension)
Make a wind vane
Make a wind vane by following the instructions.
Materials• strip of thick paper/ thin cardboard• drinking straw• glue• dowel stick/ broom stick/ other similar stick• nail• hammer
Method1. Bend a strip of paper in half.2. Put the top end of the drinking straw in the bend of the paper, making
sure that the straw does not stick out.3. Glue the two sides of the paper together.4. Put the stick into the ground where you want to measure the
wind direction.5. Hammer a nail into the top end of the stick.6. Place the straw over the nail so that it can move freely. When the wind
blows, the straw and paper (the wind vane) will swivel on the nail and indicate the direction of the wind.

276 S E C T I O N 4 • R E S O U R C E S
© Cambridge University Press. You may photocopy this page for use with Study & Master Geography Grade 10.
Worksheet 8 (consolidation)
Metamorphic rock landforms
Read the case study, ‘The Golden Gates’ on page 101 of the Learner’s Book and complete the questions below.
1. Which famous Free State and Lesotho mountains are the Golden Gatebuttresses part of ?
2. What is a buttress?
3. Refer to Figure 3.1.25 on page 101 in the Learner’s Book.a) Complete this table.
Rock layer Colour How long ago it formed (millions of years ago)
Type of rock
Eliot mudstone
Clarens sandstone
Calcified sandstone
Quartzite
Drakensberg basalt
b) Which rock layer is the oldest?
c) Which rock layer is the newest?
d) Explain how sedimentary rock forms.
e) Of the sedimentary rock layers, which one is made up of the finest particles?
f ) Part of which rock layer turned to quartzite?
g) Why is the quartzite layer right next to the basalt? Explain, using the term ‘contact metamorphism’.
h) What is basalt formed from?
i) Classify basalt as intrusive or extrusive.
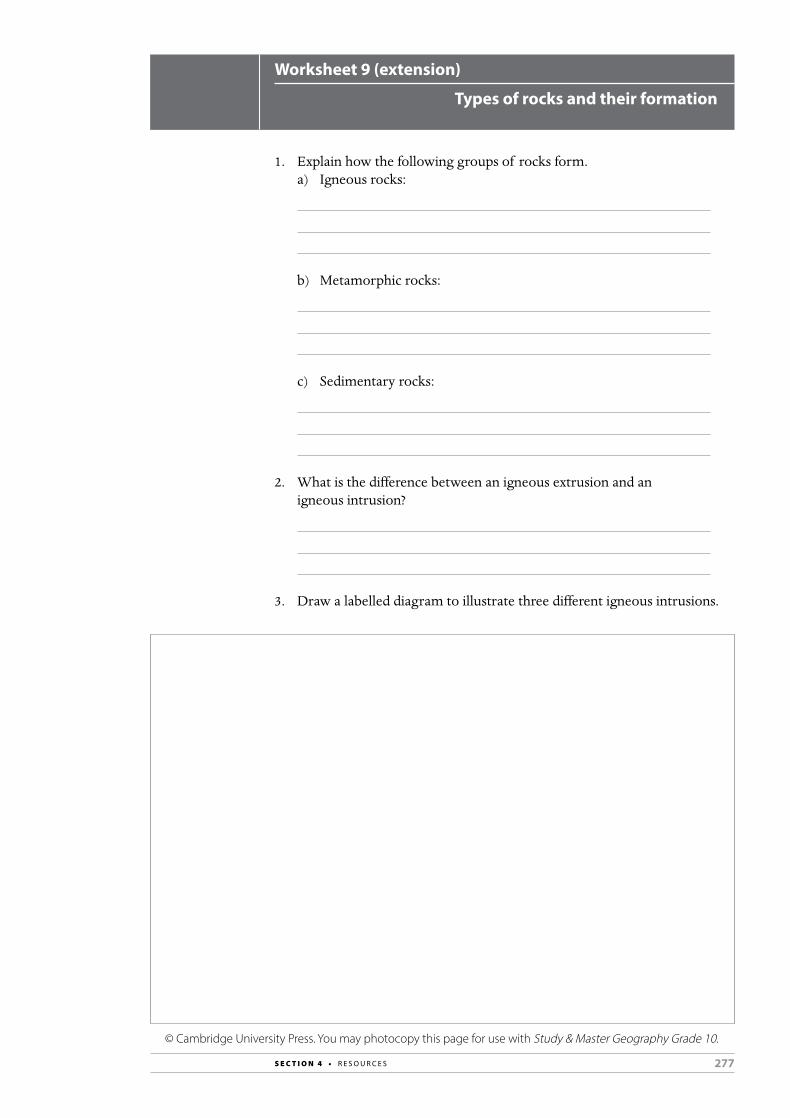
277S E C T I O N 4 • R E S O U R C E S
© Cambridge University Press. You may photocopy this page for use with Study & Master Geography Grade 10.
Worksheet 9 (extension)
Types of rocks and their formation
1. Explain how the following groups of rocks form.a) Igneous rocks:
b) Metamorphic rocks:
c) Sedimentary rocks:
2. What is the difference between an igneous extrusion and an igneous intrusion?
3. Draw a labelled diagram to illustrate three different igneous intrusions.

278 S E C T I O N 4 • R E S O U R C E S
© Cambridge University Press. You may photocopy this page for use with Study & Master Geography Grade 10.
4. Which rock group contains crystals?
5. Which rock group is usually layered?
6. Which sedimentary rock is formed from pebbles cemented together?
7. Which sedimentary rock is formed from organic matter such as plants?
8. What type of metamorphic rock forms from limestone?
9. From which type of rock did the metamorphic rock slate form?
10. What type of rock forms the top half of Table Mountain?
11. Name a place in the Western Cape where granite can be observed easily.
12. What type of rock is granite?
13. How is granite formed?
14. There are three minerals found in granite. Name the three minerals and explain how you would be able to identify them.

279S E C T I O N 4 • R E S O U R C E S
© Cambridge University Press. You may photocopy this page for use with Study & Master Geography Grade 10.
15. In the diagram below, identify the igneous rock landforms A, B and C. Explain the process of how landform C developed from landform A.
GEOG10TF_280a
GEOG10TF_280b
GEOG10TF_280c
A
B
C

280 S E C T I O N 4 • R E S O U R C E S
© Cambridge University Press. You may photocopy this page for use with Study & Master Geography Grade 10.
Worksheet 10 (consolidation)
Plate boundaries and the movement of plates
Refer to Figure 3.2.13 on pages 108 and 109 of the Learner’s Book and complete the table below.
Plate boundaryDirection of movement
Constructive or destructive*
Features or landforms
Diverging
Ocean–ocean
Continent–continent
Converging
Ocean–ocean
Ocean–continent
Continent–continent
*Constructive forms new crust, destructive breaks down crust

281S E C T I O N 4 • R E S O U R C E S
© Cambridge University Press. You may photocopy this page for use with Study & Master Geography Grade 10.
Worksheet 11 (consolidation)
Plate tectonics
1. Label the eight tectonic plates on the map below.
2. Fill in the missing word/s in the information on plate tectonics.Ocean floors can be divided into a number of _________________ each bordered by a _________________. Convection currents in the _________________ cause plates to constantly move. When plates move apart, _________________ plate boundaries are formed. When plates move towards each other _________________ plate boundaries are formed. When plates move past each other a _________________ boundary is formed.
When plates push together, the heavier plate sinks into the mantle. This is called _________________. The melted material from the sunken plate then pushes up through the weakened edge of the lighter plate to form _________________.
When a plate with an ocean floor and a plate with a continent push together the two resultant landforms are a _________________ and _________________ mountains.
When a plate with a continent and a plate with a continent move towards each other, it produces _________________.
When two plates move past each other, they catch or stick. The strain produces a crack called a _________________ . These can result in an _________________.
When a plate with an ocean floor moves apart from a plate with an ocean floor a _________________ is formed. This process is called _________________.

282 S E C T I O N 4 • R E S O U R C E S
© Cambridge University Press. You may photocopy this page for use with Study & Master Geography Grade 10.
Worksheet 12 (extension)
Geological time and different rock types
The map below shows a simplified version of South Africa’s geology. The southern African region has had six main periods of tectonic activity: the first gave rise to the greenstone belts – metamorphosed volcanic belts; the sixth and last gave rise to the Cape Fold Mountains.
4 500
Million years ago
3 750 3 000 2 250 1 500 750 0
The Earth forms
GEOG10TF_284
GEOG10TF_283
7
6
5
4
3
2
1
N
0 200 400 km
Key
Explanation of map key1. The Barberton and other greenstone belts (more than 3 000 mya)2. Witwatersrand gold-bearing conglomerate reefs (2 900–2 800 mya)3. Transvaal dolomites (2 600–2 400 mya)4. Sedimentary and volcanic rocks5. Cape Fold Mountains, including Table Mountain (250 mya)6. Karoo sediments covered by Karoo dolerite intrusions and
Drakensberg basalt extrusions (183 mya)7. Karoo sedimentsmya stands for ‘million years ago’
1. Refer to the map and its key. a) Which are South Africa’s oldest rocks?

283S E C T I O N 4 • R E S O U R C E S
© Cambridge University Press. You may photocopy this page for use with Study & Master Geography Grade 10.
b) Identify the type of rock and give a brief description:i) conglomerate
ii) dolomite
iii) dolerite
iv) basalt
c) The Cape Fold Mountains were formed by the continents of Pangea coming together.i) Which continents made up Pangea?
ii) What type of boundary is formed when tectonic plates come together?
iii) When did Pangea begin to break up?
2. Which is older, Table Mountain or the Drakensberg?
3. Complete the timeline below by filling in the geological events above the vertical lines. Use the information in the map above and also include these three geological events:• 2 000 mya: Igneous intrusions in Bushveld complex, which are rich in
platinum and other metals• 1 100–1 000 mya: Namaqualand Mountains formed from sedimentary
and igneous rock/volcanic intrusions • 540 mya Intrusion of Cape granites
4 500
Million years ago
3 750 3 000 2 250 1 500 750 0
The Earth forms

284 S E C T I O N 4 • R E S O U R C E S
© Cambridge University Press. You may photocopy this page for use with Study & Master Geography Grade 10.
Worksheet 13 (consolidation)
Folding and faulting
1. Refer to the diagram.
fold axis
AC
D B
a) Identify the type of fold in the rock layers.
b) If the fold axis were inclined (at an angle), what type of fold would it be?
c) If the folds were sharp peaks, instead of rounded, what type of fold would it be?
d) Match these parts to A, B and C: syncline, anticline, limb.
e) Identify the type of fault at D.
f ) Explain what caused the folding and the fault.

285S E C T I O N 4 • R E S O U R C E S
© Cambridge University Press. You may photocopy this page for use with Study & Master Geography Grade 10.
2. Refer to the diagram.
The Alps
Plate APlate B
disappearing sea(Mediterranean)
Plate BPlate A
Lithosphere
Continental crust
continental crust
lithoshpere collection zone
a) The Alps span seven countries. Name three of these.
b) Name one of the Alps’ highest peaks.
c) What type of mountains are the Alps?
d) Are they young or old mountains?
e) Identify Plate A and Plate B.
f ) The lithosphere is broken up into tectonic plates. Which parts of the Earth does the lithosphere consist of ?
g) Lithos is an ancient Greek word. What does it mean?
h) Name the plate boundary at the collision zone.
i) Explain why, over time, the Mediterranean Sea will disappear.

286 S E C T I O N 4 • R E S O U R C E S
© Cambridge University Press. You may photocopy this page for use with Study & Master Geography Grade 10.
Worksheet 14 (consolidation)
Volcanoes
Refer to pages 132–136 in the Learner’s Book. Complete the table by filling in examples.
Feature Type Examples covered in the Learner’s Book
Other examples
Volcanic islands
island arcs
ocean rift islands
hot spot islands
Volcanic mountains
stratovolcanoes
shield volcanoes
cinder cones

287S E C T I O N 4 • R E S O U R C E S
© Cambridge University Press. You may photocopy this page for use with Study & Master Geography Grade 10.
Worksheet 15 (consolidation)
Mapwork: scale, co-ordinates, direction, magnetic bearing,
conventional symbols
Refer to the map of Paarl on the next page and answer the following questions.
1. The map code of Paarl is 3318DB. What do the numbers 33 and 18 represent?
2. Give the map codes of the maps:a) Directly south of 3318DB
b) North-east of 3318D
3. What is the scale of the map?
4. Write the map scale in words.
5. Give the co-ordinates of the following:a) Trig Beacon 352 [Block C5]
b) Trig Beacon 170 [Block B5]
c) Trig Beacon 179 [Block C1]
6. Give the direction and bearing from:a) Trig Beacon 352 to Trig Beacon 170
b) Trig Beacon 179 to Trig Beacon 352
c) Trig Beacon 352 to Trig Beacon 179
7. What is the magnetic declination of the map for July 2002?
8. Calculate the magnetic bearing from Trig Beacon 179 to Trig Beacon 352.
9. What is the mean annual change of the magnetic declination?
10. Draw the map symbols for the following:
a) Power lines b) Wind pump

288 S E C T I O N 4 • R E S O U R C E S
© Cambridge University Press. You may photocopy this page for use with Study & Master Geography Grade 10.
c) Police station d) Cemetery
11. What type of farming takes place in the Paarl area? (Use your knowledge of conventional signs.)

289S E C T I O N 4 • R E S O U R C E S
© Cambridge University Press. You may photocopy this page for use with Study & Master Geography Grade 10.
Worksheet 16 (extension)
Mapwork: contours
1. On the map below:a) fill in the contour lines using a contour interval of 100 mb) shade the area of height below 100 m in (green)c) shade the area of height between 100 m and 200 m in (yellow)d) shade the area of height above 200 m in (brown).
240315
250
300210
200
175190
200300
320
305240
120
150
10050
80
2. On the maps below indicate the following features:a) a valleyb) a spurc) a potential waterfalld) a possible rivere) a clifff ) a gentle slopeg) a steep slope
GEOG10TF_290a
240
315
250
300210
200
175190
200300
320
305240
120
150
100
50
80
GEOG10TF_290b GEOG10TF_290c
1600
1700
1720
1740

290 S E C T I O N 4 • R E S O U R C E S
© Cambridge University Press. You may photocopy this page for use with Study & Master Geography Grade 10.
3. Refer to Map F and complete the following:
GEOG10TF_291
635
799
729
F
Q
E
GH
C
D
B
A
P
1:50 000 CI = 30m
N
3.1 Calculate the straight line distance between:a) A and B
b) P and Q
3.2 Calculate the length of the railway line.

291S E C T I O N 4 • R E S O U R C E S
© Cambridge University Press. You may photocopy this page for use with Study & Master Geography Grade 10.
3.3 Draw a cross-section from P to Q. • Use a vertical scale of 1 cm represents 30 m.• Indicate the railway, road and river on your cross-section.
3.4 Give direction and bearing from:a) A to B _______________b) D to C _______________
4. Draw two contour diagrams, one illustrating a convex slope and one illustrating a concave slope.

292 S E C T I O N 4 • R E S O U R C E S
© Cambridge University Press. You may photocopy this page for use with Study & Master Geography Grade 10.
Worksheet 17 (consolidation)
Population distribution and density
1. Match the definition in Column B with the population concept in Column A.
Column A Column B
1. population distribution a) where both abiotic and biotic factors combine to attract large numbers of people to settle in one area
2. non-ecumene areas b) the number of people living on each square kilometre of land
3. population density c) where there is little sign of human or animal life
4. ecumene areas d) where people live in the world
2. Name eight factors which could be responsible for the differences in population density around the world.
3. Give one reason for the high population density in each of the following places:a) Gauteng Province
b) Nile River

293S E C T I O N 4 • R E S O U R C E S
© Cambridge University Press. You may photocopy this page for use with Study & Master Geography Grade 10.
c) City of Durban
d) North-eastern USA
4. Name four areas in the world which have low population densities and suggest one reason for each of these low densities.
5. a) Use the information in the table to calculate the population densities of each of the countries.
Country Population size in thousands
Area in square kilometres in thousands
India 1 171 000 3 288
South Africa 50 700 1 220
Australia 12 900 7 687
China 1 331 400 9 597
Namibia 2 200 825
United Kingdom 61 000 243,3

294 S E C T I O N 4 • R E S O U R C E S
© Cambridge University Press. You may photocopy this page for use with Study & Master Geography Grade 10.
b) Which country has the highest population density?
c) Which country has the lowest population density?
6. Describe the impact on the natural resources of a country that has a high population density.
7. Suggest one solution to try to curb high population densities in an area.

295S E C T I O N 4 • R E S O U R C E S
© Cambridge University Press. You may photocopy this page for use with Study & Master Geography Grade 10.
Worksheet 18 (extension)
Population data and interpretation
1. Study the world population data represented in the table below and answer the questions that follow.
Country BotswanaUnited
KingdomIndia
Population size in millions
2 13 171
Births per 1 000 population
25 9 23
Deaths per 1 000 population
12 0,4 7
Percent urban 60 80 29
Percent of population with HIV/AIDS
23,9 0,2 0,3
Projected percent of population change 2009–2050
39 24 49
Population per square kilometre
3 255 356
a) Which country has the highest birth rate?
b) Give two reasons for this high birth rate.
c) Which country has the highest death rate?
d) Why do you think the death rate is so high in this country?
e) Which country has the highest population density?
f ) Describe the effects of a high population density on the natural resources of a country.

296 S E C T I O N 4 • R E S O U R C E S
© Cambridge University Press. You may photocopy this page for use with Study & Master Geography Grade 10.
g) Which country is the most urbanised?
h) What does urbanisation mean?
i) Why do people move from rural to urban areas?
j) Which country shows the highest percentage of the population living with HIV/AIDS?
k) What does the acronym AIDS stand for?
l) Why do you think the prevalence of this disease is prominent in this particular country?
m) What do you think could be done to decrease the prevalence of AIDS?
n) Calculate the estimated population size for each of the three countries for the year 2050.
2. On a separate sheet of paper, write a 300 word essay describing the difference between developed and developing countries in terms of:• birth rate• death rate• urbanisation• HIV/AIDS prevalence.
Give reasons for the differences. You may use the data above as examples in your essay. Give your essay a suitable heading and make sure that it has a clear introduction and conclusion.

297S E C T I O N 4 • R E S O U R C E S
© Cambridge University Press. You may photocopy this page for use with Study & Master Geography Grade 10.
Worksheet 19 (extension)
The oceans
Summarise Unit 2 of Module 7, ‘The world’s oceans’ by using the Study & Master Geography Grade 10 Learner’s Book to complete the mind-map.
human impact
a resource
oceans
ocean currents

298 S E C T I O N 4 • R E S O U R C E S
© Cambridge University Press. You may photocopy this page for use with Study & Master Geography Grade 10.
Worksheet 20 (consolidation)
Calculating percentages
The tables below show the March 2011 figures for free basic water delivery at a national level. Calculate and fill in the percentages in each one.
Summary view
Households Total Poor
Total 13 106 206 5 839 848
Served 11 284 325 5 054 454
%
Service level view
Total Households Served
Service Level
Above RDP
at RDPBelow RDP
No Infrastructure
Total
Total 9 630 980 2 405 502 604 960 464 764 13 106 206
Served 8 497 275 2 200 909 557 230 28 912 11 284 325
%
Service level view
Total Poor Households Served
Service Level
Above RDP
at RDPBelow RDP
No Infrastructure
Total
Total 3 814 885 1 363 852 350 201 310 910 5 839 848
Served 3 504 919 1 210 947 324 957 13 632 5 054 454
%
[Source: Department of Water Affairs, www.dwaf.gov.za/dir_ws/f bw/]

299S E C T I O N 4 • R E S O U R C E S
© Cambridge University Press. You may photocopy this page for use with Study & Master Geography Grade 10.
Worksheet 21 (consolidation)
Water resources
1. List five factors that influence the availability of water in South Africa.
2. On the map of South Africa below, draw in and label the following water resources (use your atlas to help you): a) Orange River g) Vaal Damb) Gariep Dam h) Sundays Riverc) Limpopo River i) Sterkfontein Damd) Tugela River j) Steenbras Dame) Vaal River k) Vanderkloof Damf ) Fish River l) Palmiet River
3. On the same map use four different symbols to indicate the four main inter-basin water transfer schemes. Give the map a key.
KEY:

300 S E C T I O N 4 • R E S O U R C E S
© Cambridge University Press. You may photocopy this page for use with Study & Master Geography Grade 10.
4. Name two South African dams where hydroelectricity is generated.
5. Why do you think Gauteng needs so much water?
6. Why do you think storage of water in Cape Town dams is necessary?
7. What is the role of each of the following in providing water to South Africans:a) Department of Water Affairs
b) Local government
c) Municipalities
8. What is meant by ‘free basic water’?
9. List five problems with ‘free basic water’.
10. List three ways in which we can use water sustainably.

301S E C T I O N 4 • R E S O U R C E S
© Cambridge University Press. You may photocopy this page for use with Study & Master Geography Grade 10.
Worksheet 22 (extension)
Fracking for gas in the Karoo
1. Read the article below and answer the questions that follow.
Proposed fracking for gas in the Karoo by Shell
Fracking (hydraulic fracturing) is a process of drilling 1 to 5 km under the surface of the Earth to a layer of shale where natural gas is trapped. Using millions of litres of water, sand and an array of chemicals (many of which are carcinogenic, endocrine-disrupting or just plain toxic), the rock is repeatedly fractured by high pressure explosions underground, allowing the gas to be collected. Tens of thousands of wells have been dug in 32 American States and many other parts of the world, and a groundswell of popular protest has started. This is because groundwater has frequently been contaminated as a result of fracking, either with methane or the chemicals used.
People have complained that water coming out of their taps is undrinkable and becomes flammable when contaminated with methane and oil. They suffer from lesions, cancers and tumours. Their livestock is poisoned, sometimes with radioactive substances brought up from underground as waste material. Arsenic and other substances poison their vegetables and crops.
Shell was asked if it could give an assurance that groundwater and therefore the health, livelihoods, communities and towns in the Karoo, would not be affected. The response was that Shell had never had any incident of contamination while doing exploratory fracking. They also said that the only ones to benefit would be Shell and the government (which owns all underground minerals, gas and oil).
One man who has property and roots in the Karoo said: “We are not against responsible exploration or extraction; we are against Russian roulette.”
Shell still has no idea where the millions of litres of water needed for fracking will come from. Possibilities at this stage include treated surface water, deep saline aquifers and seawater trucked in by train.
The president of Agri-Eastern Cape who farms in the affected district emphasised the importance of groundwater. The recent crippling drought in the Somerset East Region was just a reminder. He said, “I spent all my time trying to pump up more groundwater to keep going. So we want to know with certainty what the effects will be on the underground water supply.”
When asked if there was any kind of possibility that contamination could happen, Dodson from Shell pursed his lips and looked down.
Source: www.greenpeace.org
a) Explain what ‘fracking’ is.

302 S E C T I O N 4 • R E S O U R C E S
© Cambridge University Press. You may photocopy this page for use with Study & Master Geography Grade 10.
b) Where in South Africa does Shell want to do fracking for gas?
c) How much water is needed for the process of fracking?
d) Where does Shell propose to get this water from?
e) Besides water, which other substances are used in the fracking process?
f ) What effect could these substances have on the groundwater?
g) Why do you think farmers and residents in the area are so reliant on groundwater?
h) What are the consequences for residents if the groundwater becomes contaminated?
i) Who owns the rights to underground minerals, oil and gas in South Africa?
j) Who will stand to make money from this venture?
k) What is meant by one resident saying: “We are not against responsible exploration or extraction; we are against Russian roulette”?
2. Imagine you are a resident of Somerset East, in the Karoo. Write a letter to the company, Shell, explaining the potential damage that fracking could have on the water in your area and urging them to reconsider their proposal of fracking in the Karoo. Remember to use the correct format for a formal letter.

303S E C T I O N 4 • R E S O U R C E S
© Cambridge University Press. You may photocopy this page for use with Study & Master Geography Grade 10.
Worksheet 23 (consolidation)
Hydrographs
Refer to the flood hydrograph in Figure 7.4.5 on page 288 of the Learner’s Book and answer the questions below.
1. Give the peak rainfall in mm.
2. Give:a) the units for cumecs
b) the normal discharge of the river in cumecs
c) the size of the discharge peak in cumecs
3. a) Give the lag time in hours.
b) Explain why there is a lag time.

304 S E C T I O N 4 • R E S O U R C E S
4. ANSWERS FOR PHOTOCOPIABLE
WORKSHEETS
Worksheet 1 (consolidation) Answers
Temperature and altitude
Altitude (m) Temperature (°C) Working out
2 000 29,9
3 000 23,4 29,9 – 6,5
4 000 16,9 23,4 – 6,5
5 000 10,4 16,9 – 6,5
6 000 3,9 10,4 – 6,5
7 000 −2,6 3,9 – 6,5
8 000 −9,1 −2,6 – 6,5
8 800 −15 −9,1 – (8000/8800 × 6,5)
Worksheet 2 (consolidation) Answers
The heating of the atmosphere and its effect
1.1 a) The Sun’s energy is called terrestrial radiation.b) Short waves of the electromagnetic spectrum are visible light.c) The Sun’s radiation is shortwave radiation.d) The atmosphere can only trap long-wave radiation.e) The Earth radiates long-wave radiation.
1.2 Ozone
1.3 50%
1.4 reflection by clouds 30%; absorption by dust particles 20%; scattering by dust particles
1.5 Heat is used to evaporate water on the Earth’s surface. This evaporated heat is stored in water vapour as latent heat. When the water vapour condenses, the latent heat is released into the atmosphere.
1.6 Convection is the transfer of heat by the circulation of warm and cold air. Conduction is the transfer of heat between substances that are in direct contact with each other.

305S E C T I O N 4 • R E S O U R C E S
2.1 a) Kimberley is landlocked, whereas Durban is on the coast. The sea has a moderating affect on temperatures in Durban.
b) As altitude increases temperature decreases. Johannesburg is 1 665 m above sea level and the average coldest month is 10 ˚C.
c) The warm Mozambique Current off the coast of Durban causes temperatures to be higher.
d) Cape Town’s temperatures are influenced by the cold Benguela Current which flows past the West Coast of South Africa – thus causing temperatures in Cape Town to be lower than in Durban.
3.
North Pole
South Pole
D
C
B
A
D
C
Earth
At A-B, the Sun’s rays strike the Earth’s surface at a 90˚angle. More heat is spread over a smaller surface area at the equator than towards the Poles C-D where the Sun’s rays strike the Earth at a more oblique angle. The solar radiation at the equator also passes through less atmosphere and so less heat is lost through absorption, reflection and scattering. So ultimately the surface of the Earth at the equator will be warmer than those areas further north and south of the equator.
4. Albedo is measure of a surface’s reflectivity.
5. Dark colours absorb heat increasing temperature, while light colours reflect heat causing temperatures to decrease.
Worksheet 3 (consolidation) Answers
The effect of distance from the ocean on temperature
The lunchbox filled with air (the empty one) should be colder. This demonstrates that water is slower to cool than air.

306 S E C T I O N 4 • R E S O U R C E S
Worksheet 4 (extension) Answers
Depletion of ozone in the atmosphere
1. a) The North Poleb) long cold winters and lingering CFCs in the atmospherec) a tri-atomic oxygen molecule O3; a blue gasd) in the stratospheree) It protects us from ultra-violet radiation from the Sun.f ) World Meteorological Organisationg) • to record the amount of ozone and other meteorological findings
in the atmosphere • to reveal their findings to people and warn people of any dangersh) UV-B rays have been linked to skin cancer, cataracts and damage to
the human immune systemi) to stop CFC production; all CFCs were to be replaced with HFCs
by 1996j) no
2. The article should have a catchy/interesting title and should include the following points: • Causes: CFCs, which are chlorine-containing chemicals, in the
atmosphere caused by propellants in aerosol sprays and coolants in refrigerators and air conditioning systems
• Effects: damage DNA and cause skin cancers; cataracts; kill phytoplankton and disrupt the marine food web; disrupt photosynthesis and reduce growth and yield of food crops
• Solutions: Replace CFCs with HFCs – a non-ozone depleting chemical; safe disposal of old refrigerators and cooling systems
Worksheet 5 (consolidation) Answers
Temperature difference and relative humidity
1. Dry bulb temperature
Wet bulb temperature
Temperature difference (dry bulb temperature – wet bulb temperature)
Relative humidity
30 °C 28 °C 2 °C 86%
30 °C 23 °C 7 °C 55%
24 °C 21 °C 3 °C 77%
24 °C 17 °C 7 °C 57%
20 °C 19 °C 1 °C 91%
20 °C 15 °C 5 °C 59%
20 °C 13 °C 7 °C 44%
2. a) When the temperature difference between the wet and dry bulbs is small, the relative humidity is high.
b) When the temperature difference between the wet and dry bulbs is big, the relative humidity is low.

307S E C T I O N 4 • R E S O U R C E S
Worksheet 6 (extension) Answers
Water cycle model
4. No, because when the water evaporated, the salt was left behind.
Worksheet 8 (consolidation) Answers
Metamorphic rock landforms
1. Drakensberg2. A smaller ridge or slope that seems to prop up or support a main peak.3. a)
Rock layer Colour How long ago it formed (millions of years ago)
Type of rock
Eliot mudstone red 200 sedimentary
Clarens sandstone
yellow 196 sedimentary
Calcified sandstone
yellow Later than 196* sedimentary
Quartzite yellow 190–160** metamorphic
Drakensberg basalt
grey/black 190–160 igneous
In ‘The Golden Gates’ case study extract, no dates are given for the formation of the calcified limestone and quartzite, but learners can work out that:
* The calcified sandstone layer formed after the formation of the Clarens sandstone.
** The quartzite layer formed during the Drakensberg basalt outpourings, i.e. this is when metamorphism of the top sandstone layer took place.
b) Eliot mudstone (it is at the bottom; it formed 200 million years ago)c) Drakensberg basalt (it is on the top; it formed 190–160 million
years ago)d) Layers of sediment (made up of particles or rock debris or dead living
matter) accumulate and are squashed together. Over time, these layers are deeply buried and the particles become cemented together.
e) Eliot mudstonef ) Clarens sandstoneg) As the hot basalt flowed out on top of the sandstone layer, the part
that was in contact with the hot basalt was turned to quartzite/ metamorphic rock by the heat. This process is called contact metamorphism.
h) magma/ lava/ molten rocki) extrusive

308 S E C T I O N 4 • R E S O U R C E S
Worksheet 9 (extension) Answers
Types of rocks and their formation
1. a) Igneous rocks are formed by the solidification of magma material.b) Metamorphic rocks are formed by a process in which already
consolidated rock undergoes a change in texture, composition or chemical and physical structure. These changes are brought about through heat and pressure.
c) Sedimentary rock is formed from the deposition of sediments and particles laid down in layers and cemented together.
2. Igneous extrusion is when magma solidifies below the ground. Igneous extrusion is when magma erupts to the surface as lava.
3. dyke
pile
sill
lopolithbatholith
laccolith
4. igneous
5. sedimentary
6. conglomerate
7. coal
8. marble
9. shale
10. Table Mountain sandstone
11. Paarl Rock
12. igneous
13. Magma solidifies beneath the Earth’s surface to form granite.

309S E C T I O N 4 • R E S O U R C E S
14. quartz – crystals, mica – black, feldspar – white
15. Stage 1: Magma welled up beneath the Earth’s surface and solidified to form a massive batholith, shown in diagram A.
Stage 2: Over millions of years the overlying layers of earth were eroded away to expose the dome-shaped top of the batholith now known as a monolith in diagram B.
Stage 3: Over time the cracks and joints in the monolith create corestones which are rounded and the landform is called a tor in diagram C.
Worksheet 10 (consolidation) Answers
Plate boundaries and the movement of plates
Plate boundaryDirection of movement
Constructive or destructive*
Features or landforms
Diverging
Ocean–ocean away from each other
Constructive mid-ocean ridges/ seafloor spreading
Continent–continent rift valleys
Converging
Ocean–ocean towards each other
Destructive volcanic arc islands
Ocean–continent ocean trenches
Continent–continent fold mountains
*Constructive forms new crust, destructive breaks down crust
Worksheet 11 (consolidation) Answers
Plate tectonics
1.
Eurasian Plate
Pacific Plate
AustralianPlate
Antarctic Plate
South American
Plate
NazcaPlate
Pacific Plate
North American
Plate
AfricanPlate
310 S E C T I O N 4 • R E S O U R C E S
2. Ocean floors can be divided into a number of plates, each bordered by a plate boundary. Convection currents in the mantle cause plates to constantly move. When plates move apart, constructive plate boundaries are formed. When plates move towards each other destructive plate boundaries are formed. When plates move past each other a transform fault boundary is formed.
When plates push together, the heavier plate sinks into the mantle. This is called subduction. The melted material from the sunken plate then pushes up through the weakened edge of the lighter plate to form volcanoes.
When a plate with an ocean floor and a plate with a continent push together the two resultant landforms are a trench and peripheral fold mountains.
When a plate with a continent and a plate with a continent move towards each other, it produces fold mountains.
When two plates move past each other, they catch or stick. The strain produces a crack called a fault line. These can result in an earthquake.
When a plate with an ocean floor moves apart from a plate with an ocean floor a mid-oceanic ridge is formed. This process is called seafloor spreading.
Worksheet 12 (extension) Answers
Geological time and different rock types
1. a) the greenstone beltsb) i) sedimentary rock; formed from pebble sediments
ii) sedimentary rock; a type of limestone formed from calcium magnesium carbonate (limestone is formed from calcium carbonate)
iii) igneous rock, intrusive; it has a finer grain structure than granite or gabbro because it forms nearer the surface and cools more quickly
iv) igneous rock, extrusive; it is grey/dark-coloured and has a fine grain structure
c) The Cape Fold Mountains were formed by the continents of Pangea coming together.i) all the continentsii) convergent iii) about 180 mya
2. Table Mountain

311S E C T I O N 4 • R E S O U R C E S
3.
4 500
Million years ago
3 750 3 000 2 250 1 500 750 0
The Earth forms
(a)
(b)
(d)
(c)
(e)(f )
(g)
(h)
a) the Barberton and other greenstone belts b) Witwatersrand gold-bearing conglomerate reefs c) Transvaal dolomites d) igneous intrusions in Bushveld complex e) Namaqualand Mountains f ) intrusion of Cape granites g) Cape Fold Mountains, including Table Mountain h) Karoo dolerite intrusions and Drakensberg basalt extrusions
Worksheet 13 (consolidation) Answers
Folding and faulting
1. a) symmetrical foldsb) overturned fold/ recumbent foldc) chevron foldd) A syncline; B limb; C anticlinee) reverse/ thrustf ) Compression forces made the rock layers bend (fold). Where the
stress in the rock was highest, when the rock could bend no more, it cracked (faulted).
2. a) Any three of the following: Austria, Slovenia, Italy, Switzerland, Liechtenstein, Germany, France
b) Mont Blanc, Matterhorn (any one)c) fold mountainsd) younge) A Eurasian; B Africanf ) the crust and the upper part of the mantleg) rocky or rock/ stoneh) convergent; continent to continenti) As the two plates push together, the African Plate will continue to
rise/ uplift near the plate boundary until it is above sea level.

312 S E C T I O N 4 • R E S O U R C E S
Worksheet 14 (consolidation) Answers
Volcanoes
Feature Type Examples covered in the Learner’s Book
Other examples
Volcanic islands
island arcsPhilippines, Japan
Mariana, Tonga, Aleutian
ocean rift islands Iceland Jan Mayen
hot spot islands Hawaiian Islands
Tuamoto Archipelago, Tristan da Cunha, Réunion
Volcanic mountains
stratovolcanoes
Mount Fuji, Kilimanjaro, Mount St Helens, Eyjafjallajökull, Mount Nyiragongo (DRC)
Mount Etna and Mount Vesuvius (Italy), Mount Kenya
shield volcanoesMauna Loa, Kilauea
Fernandina (Galapagos), Nyamuragira (DRC), Erta Ale (Ethiopia)
cinder cones ParicutinCerro Negro (Nicaragua)

313S E C T I O N 4 • R E S O U R C E S
Worksheet 15 (consolidation) Answers
Mapwork: scale, co-ordinates, direction, magnetic bearing,
conventional symbols
1 33 represents latitude; 18 represents longitude
2. a) 3318DDb) 3319AC
3. 1:50 000
4. One centimetre on the map represents fifty thousand centimetres in reality.
5. a) 33˚ 42’58’’S 18˚ 56’50’’Eb) 33˚ 41’30’’S 8˚ 56’30’’Ec) 33˚ 42’25’’S 18˚ 52’30’’E
6. a) 355˚ NNWb) 100˚ ESEc) 280˚ WNW
7. 23˚ 33’ west
8. 100˚ + 23˚ 33’ = 123˚ 33’
9. Mean annual change is 6’ westwards
10. a)
GEOG10TF_311
4 500
Million years ago
3 750 3 000 2 250 1 500 750 0
The Earth forms
(a)
(b)
(d)
(c)
(e)(f)
(g)
(h)
GEOG10TF_313
a)
b)
c)
d)
PS
b)
GEOG10TF_311
4 500
Million years ago
3 750 3 000 2 250 1 500 750 0
The Earth forms
(a)
(b)
(d)
(c)
(e)(f)
(g)
(h)
GEOG10TF_313
a)
b)
c)
d)
PSc)
GEOG10TF_311
4 500
Million years ago
3 750 3 000 2 250 1 500 750 0
The Earth forms
(a)
(b)
(d)
(c)
(e)(f)
(g)
(h)
GEOG10TF_313
a)
b)
c)
d)
PS
d)
GEOG10TF_311
4 500
Million years ago
3 750 3 000 2 250 1 500 750 0
The Earth forms
(a)
(b)
(d)
(c)
(e)(f)
(g)
(h)
GEOG10TF_313
a)
b)
c)
d)
PS
11. Vineyards and orchards

314 S E C T I O N 4 • R E S O U R C E S
Worksheet 16 (extension) Answers
Mapwork: contours
1.
240315
250
300210
200
175190
200300
320
305240
120
150
10050
80GREEN
YELLOW
BROWNBROWN
2.
GEOG10TF_314a
240
315
250
300210
200
175190
200300
320
305240
120
150
100
50
80
GREEN
YELLOW
BROWNBROWN
GEOG10TF_314b GEOG10TF_314c
cliff
gentleslope
steep slopespur
1600
1700
1720
1740
waterfall
river
3. 3.1 a) 6 cm x 0,5 = 3 km
b) 23 cm x 0,5 = 11,5 km3.2 8,5 cm x 0,5 = 4,25 km

315S E C T I O N 4 • R E S O U R C E S
3.3
790760730700670640610
P Q
spruit spruit
railway
road
3.4 a) 43˚ NEb) 220˚ SW
4.
convex slope500
100200300
400
concave slope
100
200
400300500
600

316 S E C T I O N 4 • R E S O U R C E S
Worksheet 17 (consolidation) Answers
Population distribution and density
1. 1. d; 2. c; 3. b; 4. a
2. • A climate that is neither too hot nor too cold is preferred.• Soil that is deep and fertile with plenty available water is preferred. • A physical landscape which is flat is preferred. • Water supplies which are reliable and areas with good annual average
rainfall are preferred.• The absence of insects which cause diseases is preferred.• The ability of people to create extra or surplus food from the
cultivation of land. • The effective way of organising labour with different roles taken on
by different people.• Areas with good communication systems and infrastructure
(transportation) are preferred. • A peaceful and structured government is preferred.• Safety and security is obviously preferred.• Availability of good job opportunities.
3. a) Gauteng is the economic hub of South Africa. There are job opportunities available with high wages; the infrastructure is excellent; and the availability of gold and other minerals.
b) The Nile River produces a reliable source of water and very fertile soil for growing crops.
c) Area of high rainfall and the largest harbour/ port in South Africa; transportation of goods in and out of the area – busiest harbour in South Africa.
d) Lack of diseases and pests; good communication accessibility.
4. The Sahara Desert – too hot and dry; Alaska – too cold; the Amazon – dense forest; the Himalayas – too mountainous
5. a) India population density is 11 71 000 ÷ 3 288 = 356 people per square kilometre; South Africa’s population density is 50 700 ÷ 1 220 = 42 people per square kilometre; Australia’s population density is 12 900 ÷ 7 687 = 2 people per square kilometre; China’s population density is 1 331 400 ÷ 9 597 = 139 people per square kilometre; Namibia’s population density is 2 200 ÷ 825 = 3 people per square kilometre; United Kingdom’s population density is 61 000 ÷ 243,3 = 251 people per square kilometer.
b) Indiac) Australia
6. The impact on natural resources such as clean drinking water and food availability is enormous. Water is usually a problem as there is not always enough clean water to sustain the growing population. Water is also used for farming and industry thereby putting more pressure on the natural resources.
7. inter-basin water transfer schemes; government incentives
317S E C T I O N 4 • R E S O U R C E S
Worksheet 18 (extension) Answers
Population data and interpretation
1. a) Botswanab) tradition; low levels of education; contraception not accessiblec) Botswanad) HIV/AIDS; poor access to medical supplies and facilitiese) Indiaf ) There is a huge demand on water which could lead to water shortages.g) United Kingdomh) An increasing number of people living in urban rather than rural areas.i) to seek better job opportunities and higher wages, better standard
of livingj) Botswanak) Acquired Immune Deficiency Syndromel) This is a developing country. Access to clinics and contraception
is limited.m) To make contraceptives more accessible and to provide education
about HIV and AIDS.n) Botswana – 2 780 000; United Kingdom –16 120 000;
India – 179 379 000
2. The essay should have a suitable title and include the following points: Developed countries: Low birth rates; low death rates; high rate of
urbanisation; low prevalence of HIV/AIDS. Developed countries have a high level of industrialisation; highly developed infrastructure; easy access to hospitals, clinics and medical supplies. People have a high level of education and most of the workforce is involved in secondary and tertiary economic activities. Level of communication and technology is also very high. From the data, we can see that the United Kingdom falls into this category: birth rate is 9 births per 1 000 people; death rate is 0,4 per 1 000 people; AIDS prevalence is 0,2%; and percentage of the population living in urban areas is 80%.
Developing countries: high birth rate; high death rate; low rate of urbanisation; high prevalence of HIV/AIDS. Developing countries usually have a low level of industrialisation; poorly developed infrastructure; limited access to hospitals, clinics and medical supplies. People have lower levels of education and most of the workforce is involved in primary and secondary economic activities. Level of communication and technology is low. From the data, we can see that Botswana falls into this category: birth rate is 25 per 1 000 people; death rate is 12 per 1 000 people; HIV/AIDS prevalence is 23.9%; and percentage of the population living in urban areas is 60%.

318 S E C T I O N 4 • R E S O U R C E S
Worksheet 19 (consolidation) Answers
The oceans
Own answers.
Worksheet 20 (consolidation) Answers
Calculating percentages
Summary view
Households Total Poor
Total 13 106 206 5 839 848
Served 11 284 325 5 054 454
% 86,10% 86,55%
Service level view
Total Households Served
Service Level
Above RDP
at RDP Below RDP
No Infrastructure
Total
Total 9 630 980 2 405 502 604 960 464 764 13 106 206
Served 8 497 275 2 200 909 557 230 28 912 11 284 325
% 88,23% 91,49% 92,11% 6,22% 86,10%
Service level view
Total Poor Households Served
Service Level
Above RDP
at RDP Below RDP
No Infrastructure
Total
Total 3 814 885 1 363 852 350 201 310 910 5 839 848
Served 3 504 919 1 210 947 324 957 13 632 5 054 454
% 91,87% 88,79% 92,79% 4,38% 86,55%
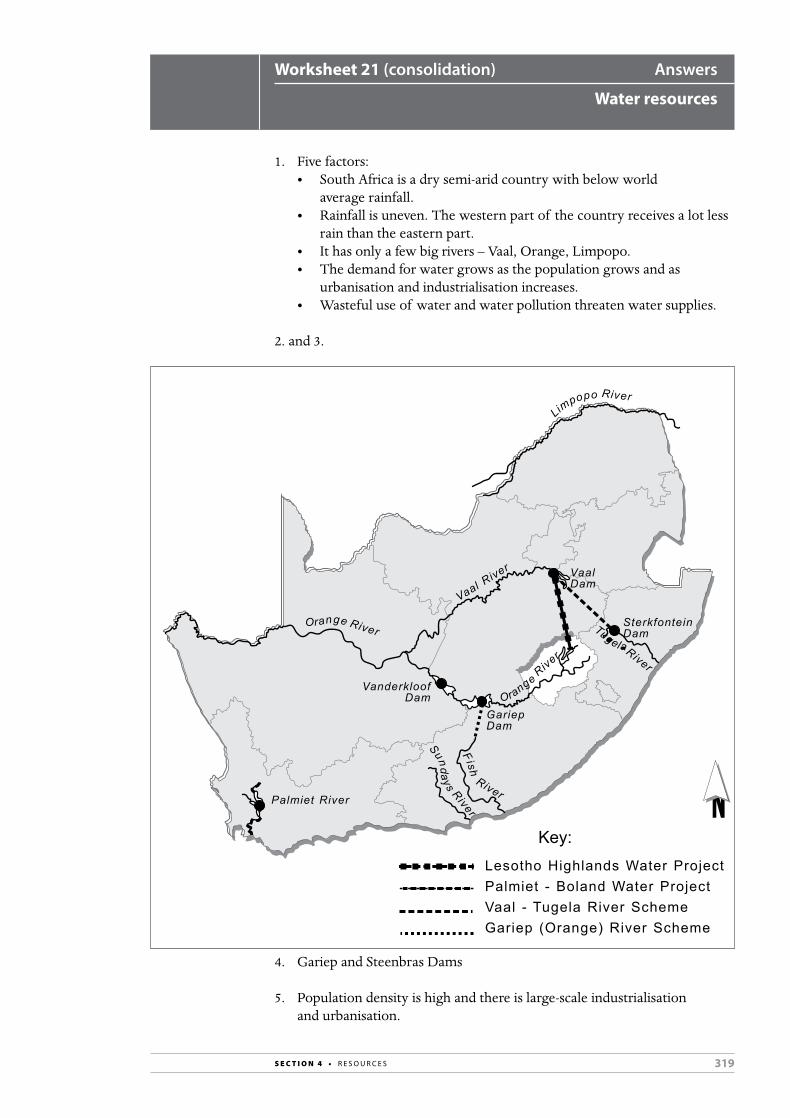
319S E C T I O N 4 • R E S O U R C E S
Worksheet 21 (consolidation) Answers
Water resources
1. Five factors:• South Africa is a dry semi-arid country with below world
average rainfall.• Rainfall is uneven. The western part of the country receives a lot less
rain than the eastern part.• It has only a few big rivers – Vaal, Orange, Limpopo.• The demand for water grows as the population grows and as
urbanisation and industrialisation increases.• Wasteful use of water and water pollution threaten water supplies.
2. and 3.
NPalmiet River
VanderkloofDam
GariepDam
VaalDam
SterkfonteinDam
Lesotho Highlands Water ProjectPalmiet - Boland Water ProjectVaal - Tugela River SchemeGariep (Orange) River Scheme
Key:
River
RiverRiver
River
Vaal River
River
River
4. Gariep and Steenbras Dams
5. Population density is high and there is large-scale industrialisation and urbanisation.

320 S E C T I O N 4 • R E S O U R C E S
6. Cape Town has winter rainfall and long, hot, dry summers so it is essential to store water in the rainy season.
7. a) Department of Water Affairs is in charge of policy for managing water resources and water supply.
b) Local government use water boards to help them provide bulk water services and manage dams and interbasin transfer schemes.
c) Municipalities play a role in providing water and sanitation services. They are responsible for water purification and waste water treatment.
8. Free basic water is the 6 000 litres of free water that is provided to poor households each month.
9. • Many households have a high number of occupants.• The cost to the government of providing water is high.• Free basic water supply system leads to unauthorised or illegal
connections that leak water and waste water.• Some households do not pay for the water they use above 6 000 litres.• It is difficult for the government to identify those who cannot pay
for water.
10. • fixing and maintaining leaking supply pipes• avoiding wasteful irrigation methods• encouraging a culture of water saving in households
Worksheet 22 (extension) Answers
Fracking for gas in the Karoo
1. a) Fracking is a process of drilling 1 to 5 km under the surface of the Earth to a layer of shale where natural gas is trapped. Using water, sand and chemicals, the rock is repeatedly fractured by high pressure explosions underground, allowing the gas to be collected.
b) in the Karooc) Millions of litres of waterd) treated surface water, deep saline aquifers and seawater trucked in
by traine) sand and an array of chemicals (many carcinogenic, endocrine-
disrupting and plain toxic)f ) Groundwater will become contaminated with methane or chemicals.g) The average annual rainfall in this area is extremely low so residents
depend heavily on groundwater for farming and domestic use.h) suffer from lesions, cancers and tumours; their livestock could be
poisoned; arsenic could poison their vegetablesi) The governmentj) Shell and the governmentk) He means that there is no assurance that the water will not become
contaminated, so going ahead with fracking is taking a big risk and they will be unable to reverse the process.

321S E C T I O N 4 • R E S O U R C E S
2. The learners’ letters should contain the following: • a fictitious address in Somerset East• the date• Shell’s address• a greeting (Dear Sir/Madam)• a heading (e.g. Complaint about proposed fracking in the Karoo)• an introduction which explains why the letter is being written• the body of the letter which provides information, deals with the
dangers of fracking and suggest a course of action• a conclusion • ‘yours sincerely’ and name
Worksheet 23 (consolidation) Answers
Hydrographs
1. about 50 mm2. a) cubic metres per second or m3/s
b) it ranges from about 5–13 cumecsc) about 35 cumecs
3. a) 7,75 hours ( just under 8 hours)b) The runoff has to make its way to the stream or river. And/ or it
takes a while for the soil to saturate with water before the runoff increases.

322 S E C T I O N 4 • R E S O U R C E S
© Cambridge University Press. You may photocopy this page for use with Study & Master Geography Grade 10.
5. LESSON PLAN TEMPLATE
Topic of lesson:
Time
Curriculum and Assessment Policy (CAPS) content
Resources
The lesson
Introduction
Main part of lesson
Conclusion
Informal assessment

323
This section is for you to file the Curriculum and Assessment Policy Statement (CAPS) for Geography (Grades 10–12) and any other documents supplied by the Department of Basic Education.
5. DOCUMENTS

Copyright © 2022 FDOKUMEN