Studies of Post-1841 Irish Family Structures - 桃山学院大学
285
Monograph Series 30 Studies of Post-1841 Irish Family Structures YOSHIFUMI SHIMIZU with the assistance of JANE GRAY Research Institute, St. Andrew’ s University Monograph Series 30 Studies of Post-1841 Irish Family Structures YOSHIFUMI SHIMIZU with the assistance of JANE GRAY Research Institute, St. Andrew’ s University ISBN 978-4-944181-22-3
-
Upload
khangminh22 -
Category
Documents
-
view
0 -
download
0
Transcript of Studies of Post-1841 Irish Family Structures - 桃山学院大学

Monograph Series 30
Studies of Post-1841 Irish Family Structures
YOSHIFUMI SHIMIZUwith the assistance of JANE GRAY
Research Institute,St. Andrew’s University
Monograph Series 30
Studies of Post-1841 Irish Family Structures
YOSHIFUMI SH
IMIZU
with the assistance of JA
NE GRA
Y
Research Institute,St. A
ndrew’s University
ISBN 978-4-944181-22-3
Research Institute,St. Andrew’s University
Studies of Post-1841 Irish Family Structures
YOSHIFUMI SHIMIZUwith the assistance of JANE GRAY
Monograph Series 30

Monograph Series 30
Studies of Post-1841 Irish Family Structures
Yoshifumi Shimizu
Professor of Sociology
Research Institute,
Momoyama Gakuin University (St. Andrew’s University)
1-1 Manabino, Izumi, Osaka, 594-1198, Japan
Printed by
Tomono Printing Inc., Osaka
Publication DataYoshifumi Shimizu, 1948-
p.cm.
Studies of Post-1841 Irish Family Structures/ Yoshifumi Shimizu
Includes bibliographical references and index
ISBN 978-4-944181-22-31. Irish family-Ireland-History-19th to 20th century.
2. Agriculture-Ireland-History-19th to 20th century.
3. Population-Ireland-History-19th to 20th century.
4. Immigration-Ireland-History-19 century-England & Wales-USA.
5. Data-Irish Census Returns-History-19th to 20th century. I. Title.
Printed in Japan

i
IllustrationsAcknowledgmentRecommendation of Studies of Post-1841 Family Structures in Ireland Louis M. Cullen
1. Introduction Jane Gray 2. Comparative Perspective of the Family Composition 3. Theoretical Framework of Irish Family from early Nineteenth to early
Twentieth Century 4. Household Structure in early Nineteenth Century Ireland 5. Regional Variations in Household Structure in early Twentieth Century
Ireland 6. Household Structure of County Mayo in Ireland at early Twentieth
Century 7. The Structure of Irish Households of early Twentieth Century:
comparing results for County Clare and County Meath 8. Household Structures in the City of Dublin in early Twentieth Century 9. Household Structure of Irish Immigrants In Britain and America in
1880/110. Conclusion
BibliographyIndexAbout the Author
iixixv
11121
3371
105
143
169191
217
227245260
ContentsSection Page

ii
Figures
2.1. TheRelationshipofTypeandClassificationoffamilybyMorioka3.1. Schematic Plan of a Typical Farmer’s House and Farmyard in
County Clare4.1. A Sample of 1821 Census Returns in County Cavan4.2. Distribution of Landholding Categories by County, 18214.3. ClassificationofLandholdingsbyCountyin18214.4. Types of Households by Category of Landholdings and County in
1881 4.5. Household Category by Age Cohort of Household Head (Ireland,
1821)4.6. Household Category by Age Cohort of Household Head (County
Cavan, 1821)4.7. Households Category by Age Cohort of Household Head (County
Galway, 1821)4.8. Household Category by Age Cohort of Household Head (County
Meath, 1821)4.9. Age Cohort of Household Heads and Household Relationships in
Ireland (1821)4.10. Age Cohort of Household Heads and Household Relationships in
County Cavan (1821)4.11. Age Cohort of Household Heads and Household Relationships in
County Galway (1821)4.12. Age Cohort of Household Heads and Household Relationships in
County Meath (1821)6.1. Land Endowment of Mayo’s Seasonal Migrants (Migrants with
under 15 acres) 6.2. Population Change of Connacht (1821-1911)6.3. Rate of Marriage, Birth and Death in County Mayo
1824
42434458
60
61
61
62
64
65
65
66
122
124125
IllustrationsSection Page

iii
6.4. Age Cohort of Household Heads and Household Relationships in County Mayo (1901)
6.5. Age Cohort of Household Heads and Household Relationships in County Mayo (1911)
7.1. Land Holding in County Clare & County Meath (1901)7.2. Area under crops and pasture in County Clare7.3. Areas under Crops and Pasture in County Meath7.4. Number of Live Stock in County Clare7.5. Number of Live Stock in County Meath7.6. Number of Livestock in County Clare & County Meath in 19017.7. Population Change in County Clare & County Meath (1821-1911) -17.8. Population Change in County Clare & County Meath (1821-1911) -27.9. Age of Household Heads in County Clare & County Meath (1901
and 1911)7.10. Percentage of Celibacy in County Clare & County Meath (1901 and
1911)7.11. Percentage of Marriages among Household Heads in County Clare
and County Meath7.12. Size of Households in County Clare & County Meath (1901 and
1911)7.13. Number of Children in County Clare & County Meath (1901 and
1911)7.14. Number of Servants, Boarders, Lodgers and Visitors in County
Clare & County Meath (1901 and 1911)7.15. Type of Households in County Clare & County Meath (1901 and
1911)7.16. Percentage of Kin in County Clare & County Meath (1901 and
1911)7.17. Age Cohort of Household Heads and Household Relationships in
County Clare (1911) 7.18. Age Cohort of Household Heads and Household Relationships in
County Meath (1911)8.1. Population Growth of Dublin
137
137
147148148149149150151151152
153
154
157
158
158
160
165
166
166
173
iv
8.2. Age of Household Heads and Household Relationships in City of Dublin (1911)
9.1. E. Todd’s Family Types
Maps
4.1. Position of Five Counties of this Chapter5.1. Traditional Family Systems of Europe by E. Todd5.2. Traditional Farming System of Europe by E. Todd5.3. Average Size of Landholdings, 1851-1911 (excluding holdings under
1 acre) 5.4. Landholdings Under 1 Acre by County, 19115.5. Landholdings 1 to Less Than 30 Acres by County, 19115.6. Landholdings 30 to Less Than 100 Acres by County, 19115.7. Landholdings of 100 or More Acres by County, 19115.8. LandClassificationsasaPercentageofTotalAreabyCounty,19115.9. Total Crop Acreage Relative to Total Area by County, 19115.10. Average Head of Cattle per Stockholder by County, 19115.11. Marriage Rate per 1000 by County and Boroughs of Belfast and
Dublin, 19115.12. Birth Rate per 1000 by County and Boroughs of Belfast and
Dublin, 19115.13. Death Rate per 1000 by County and Boroughs of Belfast and
Dublin, 19115.14. Farming Households as a Percentage of All Households by County,
19115.15. Mean Age of Household Heads by Counties Ireland, 19115.16. Married People as a Percentage of all Household Heads by County,
19115.17. Average Household Size by Counties Ireland, 19115.18. Mean Size of Household Where Household Head is a Farmer, by
County, 19115.19. Mean Number of Children per Household Where Household Head
is a Farmer, by County, 1911
189
192
40969697
9797989898989999
99
99
100
100100
100101
101

v
5.20. Mean Number of Children per Household, by County, 19115.21. Map of Solitaries by Counties Ireland, 19115.22. Map of No family by Counties Ireland, 19115.23. Simple Family Household by Counties Ireland, 19115.24. Extended Family Household by Counties Ireland, 19115.25. Multiple Family Household by Counties Ireland, 19115.26. Solitaries as a Percentage of All Farming Households by County,
19115.27. Multiple Family Households as a Percentage of All Farming
Households by County, 19115.28. Parents and Kin per 100 Households, by County, 19115.29. Servants per 100 Households, by County, 19116.1. Map of Ireland, Showing the Districts Scheduled as Congested,
18916.2. Map of Ireland, Showing the Districts Scheduled as Congested,
19096.3. The Core and Peripheral Religions of County Mayo7.1. County Clare and County Meath in Ireland 8.1. Dublin in Ireland9.1. The Irish Immigrants in England and Wales, 18819.2. Number of Persons born in Ireland in USA, 18809.3. Geographical Settlement of Irish Immigrants in USA, 18809.4. Geographical Settlement of Irish immigrants in USA, New York,
Massachusetts and Pennsylvania, 1880
Tables
2.1. Composition of Households by Hammel=Laslett2.2. HouseholdClassificationbyR.Wall2.3. Percentage Distribution of Household Composition by Race, United
States, 1880-1980 2.4. Percentage of Japanese Households Types (1920, %)4.1. Attribute of Data of Census Returns of Five Counties
101101102102102102103
103
103103106
107
108144172201203203204
131415
1741

vi
4.2. Percentage of Age Distribution of Household Heads by County, 1821
4.3. Age Distribution of Household Heads by Age Cohort, Occupation and County in 1821
4.4. Percentage of Occupation of Household Heads by County in 18214.5. Percentage of Household Size in Percentages of Total Household
Heads by County in 18214.6. Percentage of Size of Household Heads by Occupation in 18214.7. Average Size of Households by Age Cohort of Household Head and
by County in 18214.8. Average Size of Household by Category of Landholding and by
County in 18214.9. Percentage of Children by Household and by County in 18214.10. Percentage of Children by Age Cohort and by County in 1821 4.11. Percentage of Composition of Household by Household Category
and County in 1821 (%)4.12. Percentage of Composition of Household by Category, Class and
County in 18214.13. Percentage of Distribution of Household Types by Household Heads
Occupation and by County in 18214.14. Number of Resident Relatives and Others per 100 Households by
County in 18214.15. Average Age of Member of Households by County in 1821 5.1. Amount and Rate of Change in the population of Ireland 1821-19115.2. Population of Ireland by Province 1821-19115.3. Rate of Marriage per 1000 persons by Province 1865-19115.4. Percentage never Married among Population Aged 45-54 years by
Sex and Province, 1841-19115.5. Rate of Birth per 1000 persons by Province 1865-19115.6. Rate of Death per 1000 persons by Province 1865-19115.7. Rate of Emmigration per 1000 by County in Ireland5.8. Emigration Rate per 1000 by Age in Census Years5.9. Age of Household Heads in County Antrim, County Clare, County
Mayo and County Meath
48
48
5051
5252
52
545455
56
58
62
6676777778
7980818284
vii
5.10. Average Age of Marriage of Household Heads and Spouses, 1911 5.11. Size of Households in County Antrim, County Clare, County Mayo
and County Meath5.12. Percentage of Number of Children in County Antrim, County
Clare, County Mayo and County Meath5.13. Composition of Households in County Antrim, County Clare,
County Mayo and County Meath5.14. Composition of Households in County Antrim, County Clare,
County Mayo and County Meath, 1901, 19115.15. Movement of Household Type from 1901 to 1911 in County Antrim,
County Clare, County Mayo and County Meath5.16. Resident Relatives and Others by Relationship to Household Heads
in County Antrim, County Clare, County Mayo and County Meath6.1. Land Holding of County Mayo, County Clare and County Meath in
1901 and 1911 (Acers)6.2. Proportion of Land under Crops, Grass and Waste in County Mayo,
County Clare and County Meath (%)6.3. Number of Stockholding per Holder in County Mayo, County Clare
and County Meath (Number) 6.4. Proportion of Holding of various Sizes in County Mayo by Poor
Law Union (unit=acres)6.5. Proportion of Land under Crops, Grass and Waste by Poor Law
Union in County Mayo, 1851-1911, Acres6.6. The Extent of Land under Crops by Poor Law Union in County
Mayo in 1901 (Acres)6.7. Number of Livestock Possession per Stockholder by Poor Law
Union in County Mayo (number)6.8. Age of Household Heads by Age Cohort in County Mayo, 1901,
19116.9. Occupation of Household Heads in Co. Mayo, 1901, 19116.10. Size of Household by Poor Law Union in County Mayo, 19016.11. Size of Households by Poor Law Union in County Mayo, 19116.12. Number of Children in County Mayo (1901, 1911, %)6.13. Percentage of Unmarried Children in County Mayo, 1901, 1911
8485
86
87
87
89
92
113
114
115
116
118
118
120
127
128129129130131

viii
6.14. Composition of Households by Category in County Mayo, 1901, 1911
6.15. Composition of Households by Category and Class in County Mayo, 1901, 1911
6.16. Percentage of Type of Household by Age of Household Heads in County Mayo, 1911
6.17. Resident Relatives and Others by Relationship to Household Heads in County Clare, County Meath and County Mayo
6.18. Annual Income and Expenditure Estimate for two Families in Ballycroy of County Mayo in 1890’s
7.1. Percentage of Age of Household Heads in County Clare and County Meath, 1901, 1911
7.2. Percentage of Married Household Heads in County Clare and County Meath, 1901, 1911
7.3. Percentage of Occupation of Household Heads in County Clare and County Meath, 1901, 1911
7.4. Percentage of Children in Households in County Clare and County Meath, 1901, 1911
7.5. Percentage of Unmarried Children by Age Cohort in County Clare and County Meath, 1901, 1911
7.6. Composition of Households in County Clare and County Meath, 1901, 1911
7.7. Composition of Household by Occupation in County Clare, 1901, 1911
7.8. Composition of Households by Occupation in County Meath, 1901, 1911
7.9. Resident Relatives and others by Relationship to Household Head in County Clare & County Meath by per 100 households
8.1. Marriage Rate, Birth Rate and Death Rate in County Dublin, County Clare and County Meath, 1865-1911
8.2. Rate of Mortality by Age in County Dublin (County and City), County Meath and County Clare, 1911
8.3. Survival Rate of Children in the Household in the City of Dublin, 1911, %
132
132
134
135
138
152
153
155
157
159
160
163
163
165
173
174
176

ix
8.4. Birthplace of Residents in Dublin (City and County Combined)8.5. Age of Household Heads by County and Age Cohort, 19118.6. Occupations of Household Heads for Dublin (City) and Dublin
(County area only). 1911, %8.7. Household Size in County Clare, County Meath, City of Dublin and
County Dublin, 19118.8. Number of Children in Household in County Clare, County Meath,
City of Dublin and County Dublin, 19118.9. Age of Children in County Clare, County Meath, City of Dublin
and County Dublin, 19118.10. Composition of Households by Category in County Clare, County
Meath, City of Dublin and County Dublin, 19118.11. Composition of Households by Class in County Clare, County
Meath, City of Dublin and County Dublin, 19118.12. Resident Relatives and Others by Relationship to Household Heads
in County Clare, County Meath, City of Dublin and County Dublin, 1911
9.1. Population of Ireland 1821 to 19269.2. Emigrants from Each Provinces, 1880-19009.3. Destination in Percentage of the Emigrants from each Province (%)9.4. Number of Population of England and Wales by Division, 18819.5. Percentage of Birth by Country in the USA, 18809.6. Age Structure of Household Heads in England & Wales and USA9.7. Marital Status of Household Heads in England & Wales and USA9.8. Percentage of Married Household Heads by Age in England &
Wales and USA9.9. Percentage of Endogamy in England & Wales and USA9.10. Occupations of Household Heads by Irish and English People, 18819.11. Percentage of Occupations of Household Heads in the United
States, 18809.12. Size of Households in England & Wales and USA, 1880/819.13. Average Number of Children in Households in England & Wales
and USA
177178180
181
182
183
184
185
187
197197198200202205206207
208209210
211211

x
9.14. Number of Children under 19 years old in England & Wales and USA
9.15. Number of Children under 5 years old in England & Wales and USA
9.16. Household Composition by Category in England & Wales and USA, 1880/81
9.17. Household Composition by Class in England & Wales and USA, 1880/81
9.18. Resident Relatives by Relationships to Household Heads in England & Wales and USA, 1880/81
Photographs
6.1. Irish harvesters at a form in Yorkshire 1920s8.1. A tenement room on Francis Street in 1913
212
212
213
214
215
123175

xi
Acknowledgment
It took more than 20 years to complete this book. I began research on the historyofIrishfamiliesinafull-fledgedmanneraround1993whenImetthelateProfessor Taro Matsuo at Hosei University. Professor Matsuo introduced me to Professor Louis Cullen (currently professor emeritus) at Trinity College, and I was a visiting academic for one year from 1995 to 1996 at the college. During my stay at Trinity College, I studied the history of Irish families from the perspective of comparing them with traditional Japanese families. However, since census reports had limitations to use as research data, I decided to use Irish census returns. I collected census returns at the National Archives of Ireland by first selecting some survey areas from several counties in the 1901 and 1911 censuses and then making copies, taking pictures and copying them by hand. I spent a great deal of time in collecting the data. I also had to visit many researchers to ask for their advice on literature and methods of analysis, since there were not many previous studies on the research theme. Accordingly, my research goal was to clarify the Irish stem family for bottom up from the above census returns based on a study of Arensberg and Kimball. However, in 2003, I was able to obtain complete England/Wales census data for 1881 from Dr. M. Woollard at the University of Essex (currently a professor at the UK Data Archive). He also told me that the NAPP (North Atlantic Population Project) at the Minnesota Population Center had the complete U. S. census data for 1880. I visited Professor S. Ruggles at the University of Minnesota after attending the Social Science History Conference in Chicago in November and obtained the data from him. Later, I was allowed to use the Cub of the center several times and was able to collect the U. S. census data of IPUMS-USA (Integrated Public Use Microdata Series USA). I owe it to Professor Ruggles that I was able to collect all these data and would like to extend my sincerest appreciation to him. Later, the digitization of literature was widely practiced and the census returns of the National Archives of Ireland became available on the Web,makingitsignificantlyeasierformetoaccessdataandeventuallyverifythehistory of Irish families from a macro perspective. At the University of Essex, I received a great deal of assistance from Professor
xii
K. Schurer (currently a professor at the University of Leicester), Professor E. Higgs and Mr. R. Wall (former researcher at the Cambridge Group) and his wife, Dr. Beatrice Moring. It was Mr. Wall who encouraged me to join the Cambridge Group for the History of Population and Social Structure as a visiting academic for 2010 to 2011. I was sorry to hear that Mr. Wall passed away due to illness while I was staying in Cambridge. I had visited his house in Cambridge several times and received valuable advice from him. It was incredibly fortunate for me to have been able to receive his kind advice. After staying one year at Cambridge, Professor G. Alter received me as a visiting academic of ICPSR (Inter-University Consortium for Political and Social Research), University of Michigan for about two months from August 2011. InIreland,IreceivedasignificantamountofadviceandhelpfromProfessorC.Curtin, Senior Lecturer T. Varley and A. Byrne at NUI Galway in Ireland, from Professor W. Smyth and the late Lecturer Tucker at University College Cork, and Professor C. Ó Gráda and W. Nolan at University College Dublin. In England, Vice President (currently professor emeritus) M. Anderson at the University of Edinburgh and Professor K. Kennedy at Queens University Belfast also gave me some valuable advice. Dr. N. Cunningham (currently a lecturer at Durham University) helped me with the creation of GIS maps. In the United States, in addition to many staff of Minnesota Population Center, University of Minnesota, Associate Professor K. O’Neill at Boston College rendered some advice to me and gave me an opportunity to give a lecture on Irish families, my research theme, in his class. I also received valuable advice from Professor K. Miller, a well-known researcher on Irish immigrants in the United States, and Professor L. H. Lees (University of Pennsylvania), a researcher on Irish immigrants in London. Professor L. Comitas (Columbia University) and Professor T. C. Bester (Harvard University) helped me collect data concerning the survey of Ireland by Arensberg and Kimball. This book is based on papers I have made at the Social Science History Conference each year since 2007. In a conference three years ago, I had the honor of meeting and talking with Professor Emeritus Antoinette Fauve-Chamoux on the stem family, a renowned researcher on the history of French families. Moreover, Associate Professor A. Solli at the University of Bergen, Norway helped me many times with data processing and the creation of GIS maps.

xiii
Thanks to him, I was able to create materials for this book. In Belgium, I received valuable information from Professor P. Solar. I visited more than 50 researchers in Ireland, England, the United States, Canada, Austria, Sweden, and Iceland, from whom I received precious advice. Taking this opportunity, I would like to express my deep appreciation to them. In Japan, I received much help from Professor Saburo Honda (Osaka Keizai University), Professor Tadashi Yamamoto (Osaka Keizai University), Professor Shinichi Takagami (Osaka Sangyo University) and Professor Akihiro Takei (Osaka Gakuin University) in Kansai and Professor Eiri Saito (Musashino University), Professor Hiroko Goto (Hosei University) and Associate Professor Shunsuke Katsuta (Tokyo University) in Tokyo. For the collection of historical materials, I owe much to the National Archives of Ireland, the National Library of Ireland, the Libraries of UCD, Trinity College, University College Cork, NUI Galway, Maynooth University, Queen’s University Belfast, the University of Liverpool, and the University of Essex, the Peabody Museum of Archeology and Ethnology at Harvard University, the ICPSR Library at the University of Michigan, the Newberry Library in Chicago, the National Anthropological Archives Smithsonian Institute in Washington, D. C., and public libraries in the counties of Ireland. I must express my utmost appreciation to Professor Louis Cullen for his kind cooperation rendered to complete this book, such as the review of each chapter and writing a recommendation for this book. Through the past 20 years, I visited Ireland almost once a year, and the kind welcome that I received from Professor Cullen each time encouraged me to continue my research. He even crowned my annual visit with the name “a migratory bird”. I am more than happy that Senior Lecturer Jane Gray in the Department of Sociology, Maynooth University has kindly written the introduction of this book. ImetherthreetimesinherofficeanddiscussedwithherontheIrishfamilystudyeverytime.Atthattime,wehaveconfirmedthatwehadthesameinterestintheIrish family research. Therefore, I asked her to write introduction, she gave me readily agreed to my request. By virtue of her introduction, so I think this book also became more deep content, and I again say a lot of thanks to her. However, if there should be any problems related to this book, the author am the one to blame.

xiv
In addition, I have benefitted from the Grand –in Aid Scientific Research (C) and the Designated Research Projects of Momoyama Gakuin University. Last, I would like to thank my wife Sumiko for her long support for my research life.
xv
Recommendation of Studies of Post-1841 Family Structures in Ireland
Ireland is seen as a country which, in part because of absence in the past of economic change and of the limited impact of town life on rural society, retained a traditional character long after it had been lost in much of Europe. Porutugal and Ireland were sometimes seen as the last outposts of past ways. That was the case through in the 1930s and arguably in Ireland the old characer survived in pockets beyond the 1950s, in a few locations even into the early 1970s. Visitors writingofIrelandoftenwroteoffindingthemselvesinanolderworld.Inmorerecent times, change came quickly, the old word becoming a distant memory withinlittlemorethanonegeneration.Itwouldbedifficultnowtofindareasstillliving in the past at least in a material sense. A large literature exists in an unanalytical fashion on old lifestyles, simple farming, and lack of change. Professor Shimizu at the outset provides an account of a literature reaching back into the early nineteenth century. From the 1930s onward studies which were theoretical in approach began to appear. The early seminal work was Arensberg and Kimball’s books, The Irish Countryman, in 1934 and Family and Community in Ireland, in 1940. In Profesor Shimizu’s words. Arensberg and Kimball chose Ireland for their study as it was a homogeneous society, and “the last frontier region”. They chose the three districts of Lough, Rynamona and InaghinruralClarefortheirfieldwork.Similarstudies,based on an anthropological approach and in the same style on compact districts, followed in later decades. Arensberg and Kimball’s work encountered challenges as to its methodology, and as to how representative the districts were of conditions at thetime.Therearedifficultieswithstudieslikethispartlybecausetheyarebased on observations at a point in time, but also and perhaps more importantly, because they rest on rather static assumptions about the functional behaviour of households rather than on conclusions drawn on a wider range of evidence for a long span of time and a wider region. A prime concern in all these studies was an examination of the nuclear family (simple household consisting of parents and children) and of the stem family (parents, a son designated as heir, and variably home-based children
xvi
and collaterals) which was seen as becoming in time the dominant household pattern in rural society. The driving force in change, as Professor Shimizu rightly observes, was the move from partible inheritance to impartible inheritance, and to match-making and dowry as the factors which managed change. But all these practices existed before the Great Famine, and while in no sense universal were pursuedinvariablybylargerlandholdersandalsobyasignificantnumberofquitesmall landholders. Of course in reality the response varied from family to family, and from region to region. Change is also less clear for the mid-decades of the century, in large measure because full census returns have survived only for 1901 and 1911. The data for those years reveal that in some regions, as Professor Shimizu has shown, change came slowly. But where change came earlier the absence of census returns makes the intervening responses relatively obscure. In a study by Carney in 1977 quoted by Professor Shimizu, 66 percent of a sample drawn from census enumeration forms for some districts in 1821 were simple households, while for matching returns fron the 1911 census the percentage had fallen to 10 percent. Working on much larger data base for both 1821 and 1911, Professor Shimazu suggests a diffetennt and more nuanced pattern. In 1821, the number of compound families -15percent,-wassignificanlysmaller than Carney’s 27 percent of the households, though it points to the fact that compound families already existed. However in poorer regions as Cousins showed in articles many decades ago, the older pattern was very resistant to change: in some remote and marginal areas in the west of Ireland the pre-Famine pattern reasserted itself in the 1850s with population rising again. In Professor Shimizu’s paper on household structure in Mayo in the early twentieth century, the nuclear family had remained almost general to the end of the nineteenth century. As he observes “the impartible inheritance system; was finallyincorporatedintotheexistingpartible inheritance system in County Mayo very slowly. In County Mayo small holdings were the norm, and the percentage of small holdings was higher than in any other country. In Mayo there were contrasts between on the one hand the very broad regions of minute landholdings on poor lands and on the other hand pockets of larger and propertied farmers in more favoured locations. The argument that impartible inheritance, along with its supporting mechanisms of the match and the dowry, began only from the time of the Great
xvii
Famine poses problems. But they all elements existed before the Famine, it is not clear that they were the norm of family. However, in no sense did the Famine bring about the introduction of the pattern. Death and emigration reduced the number of marginal famlies. As a result nuclear households, those of poorer families and of poorer areas became fewer (in most though not all areas). The change away from nuclear family and towards the stem family was tiedupwithpropertydefinedverylooselyaseither leasehold or simply assured informal tenure of a small holding. Moreover the change is tied up also with inequality in the sense that those with property rights (what would now fashionably be describe as “entitlements”), however modest the property rights were, stood at an advantage. In poor nuclear families the whole family often disappeared from a district, perhaps either migrated or even emigrated. On the other hand, better-off families even before the Famine were able to retaim members in the household, notably the son who was to inherit the farm. In some instances on the evidence of wills (the survival of whch is admittedly rather modest) they were able to retain children and even to provide a right of permanent maintenance for those unable to leave or who returned expecting or claiming maintenance. OneofthemostimportantofProfessorShimizu’sfindingsfromhisstatisticalanalysis is that the patterns within the stem family system were varied with a wider range of household reaponses among the better-off householders. Thus, household patterns were more numerous in a county like Meath, in contrast to County Clare (the county which was the centre of the Arensberg and Kimball study) with a narrower range of responses but embracing relatively numerous extended and multiple households. In the words of Professor Shimizu
This resulted from the presence in eastern Ireland of both landless labourers and large farmers. In the case of occupiers of large farms, the family head typically held on to headship and landownership until death. Resultant family situations included delay of prospective heirs’ inheritance and marriage, early departure from home of sons, and even lack of heirs due to non-marriage of household heads....While households in both County Meath and County Clare were based on the stem family norm, family situational factors controlling the stem family became more varied
xviii
in County Meath, resulting in lower occurences of extended and multiple family household. and greater degrees of family dissolution and diversity in household formation ccmpared to County Clare.
While researchers like Arensberg and Kimball concentrated on a small region and on observations at a point of time, Professor Shimizu has sought to understand the patterns in the country as a whole and to identify the variations in household types from full returns in the 1901 and 1911 census reports. His evidence is also supplemented from the published census returns of preceding decades. In a sense post-1841 there is a statistical age, while the earlier years are a pre-statistical one. Professor Shimizu has made a wide study of census material, and his papers are a sophisticated analysis of the evidence. His work admits, with the help of study of age cohorts, of both generalisation for the families within a county and, in identifying the differences between counties, of tracing the dynamic ofchange.Whilehisworkamplyconfirmstheadvanceof thestem family, his statistical analyis underlines the complexity of the changes and the differing patterns between counties or even regions within a county. In other words, it is not a simple tale of an abstract stem family replacing a nuclear family but one of wide variations both of the nuclear family for decades holding its own in some regions, and within the stem family, especially in more prosperous regions, of a wide range of household types.
The papers in this book successively look at 1. Household Structure in early Niineteenth Century Ireland. (drawing on
the limited surviving data for the 1821 census) (Chapter 4 of book) 2. Regional Variation in Household Structure in early Twentieth Century
Ireland. (Chapter 5, including also observations on County Antrim) 3. Household Structure of County Mayo in early Twentieth Century.
(Chapter 6) 4. The Structure of Ir ish Households of early Twentieth Century:
comparing results for County Clare and County Meath. (Chapter 7)
This far reaching study is complemented by study of family patterns as families
xix
moved away from home, from the evidence of other regions. 1. Household Structure in the City of Dublin in early Twentieth Century.
(Chapter 8) 2. Household Structure of Irish Immigrants in Britain and America in
1880/1. (drawing also on British and American census data). (Chapter 9)
This study achieves an advance from the limited generalisation feasible in local studies, and provides from a wealth of statistical detail, evidence on a broader canvas for the changing pattern and the complexity of household structures in Ireland.
Louis M. Cullen, Pofessor emieritus of modern Irish HistoryTrinity College, Dublin


Chapter 1Introduction
The history of the family and household in Ireland has occupied a place in the literature disproportionate to the size of this small country on the western edge of Europe, principally because of the work of two American scholars, Conrad Arensberg and Solon Kimball, who carried out an ethnography in the mid-western Irish county of Clare in the 1930s, leading to the publication of what has become an iconic text [Arensberg and Kimball 2001, (1940)]. In the context of an exceptional demographic regime, characterized by late age at marriage, a high rate of marital fertility and very high levels of emigration, the Harvard anthropologists developed a compelling narrative describing the operation of a ‘traditional’ stem system of family formation through carefully arranged marriage, inheritance by a single heir and dispersal of non-inheriting siblings, in a twentieth century, western European country. Family and Community in Ireland continues to have an overweening influence, both on scholarly and lay understandings of Irish demographic and household history in the 19th century, and on the transformation of Irish family life in the twentieth century. Furthermore, in their qualitative, ethnographic approach, and in their concern with the relationships between family, household and community, Arensberg and Kimball anticipated – albeit with different theoretical premises – many of the current topics that occupy contemporary sociologists and social historians. In this introduction I discuss how many of the twentieth century debates surrounding Arensberg’s and Kimball’s work, and the criticisms of their conclusions, occurred in the context of inadequate quantitative knowledge about the structure and distribution of Irish households in the nineteenth and early twentieth centuries. Irish scholars were limited by the absence of comprehensive and accessible nineteenth century census or parish register data, of the kind used by the Cambridge Population Group to develop their influential analyses of western European household systems from the 1960s onwards. In Ireland, the fragmentary nature of nineteenth century sources, together with the burden of compiling representative samples from the early twentieth century census manuscripts and the comparative underdevelopment of the field of social and
2 Chapter 1
economic history, meant that what we knew about the structure and distribution of historic Irish households was limited to analyses of small opportunistic samples, principally from census records. Furthermore, such analyses as existed often failed to use standard systems of householdclassificationthatwouldhaveenabled comparison with other cases. Against this background, Professor Shimizu’s extraordinary work in harvesting population data from the recently digitized census records, now available online from the National Archives, and his systematic and thorough analysisofthedatausingthestandardHammel=Laslettsystemofclassification[Hammel and Laslett, 1974], closes a chapter on the socio-historical analysis of Irishhouseholdsandopensanewone.Wenowhavedefinitiveanswerstomanyof the questions about Irish families that pre-occupied twentieth century social scientistsandsocialhistoriansandcanbuildonthesefindingstoaskdifferentquestions of the historical record and to develop a deeper understanding of family, household and kinship processes. In the following paragraphs, by way of an introduction, I provide an overview of the twentieth century debates about historic Irish families and discuss how Professor Shimizu’s research addresses them,beforebrieflydiscussinghowthefindingsinthisbookprovideafoundationfor new questions. I conclude with a brief summary of the contents of the chapters to come. Twentieth century debates about historic Irish families and households can be summarized under three broad headings: 1. How common were the multi-generational households associated with a
stem-family system in early twentieth century Ireland and how were they regionally distributed?
2. To what extent did the household and family systems, observable in early twentieth century rural Ireland, represent a ‘post-Famine’pattern that was fundamentally different from the family and household practices that pertained before the mid-nineteenth century subsistence crisis – the Great Famine.
3. How were Irish family processes during the ‘long’ nineteenth century structured by inequalities of class and gender, and how did these processes interact with long term patterns of social and economic change?

3Introduction
Beginning in the late 1970s, Arensberg and Kimball’s portrayal of Irish rural family systems was subjected to critique by sociologists Peter Gibbon [1973] and Chris Curtin [1978], who argued that the practices described in Family and Community, rather than being traditional and‘immemorial,’ were in fact limited to medium sized farm holdings in the mid-western region studied by the ethnographers. Furthermore, they suggested, the American ethnographers had beenmisledintheirunderstandingofthesignificanceoftheseprocesseswithinIrish social life by the prevailing ‘pro-peasant’ political ideology in Ireland at the time. Taking a somewhat contrary perspective, sociologist Damien Hannan [1979] argued that the system described by Arensberg and Kimball was characteristic of a culturally and socially distinctive small-farm regime that pertained in the western parts of the country where class differences were considerably less developed than in the more commercialized farming regions of the east, and that persisted at least until the Second World War. These debates amongst sociologists took place in the context of a wider critique within the discipline of the kind of structural-functionalist thinking exemplifiedbyArensberg and Kimball’s work. However, through their analysis samples of records from the 1911 census, Gibbon and Curtin [1978] initiated a series of similar analyses based on opportunistically or theoretically selected townlands from the two early twentieth century censuses, including by Fitzpatrick [1983], Birdwell-Pheasant [1992] and Guinnane [1997]. Aside from theproblemofnon-representativesamples,thereisasignificanttechnicaldebateabout the extent to which it is possible to draw inferences about the prevalence of stem-family practices from evidence about multi-generational household composition. Guinnane [T. Guinnane, 1997, 146] concluded that, generally speaking, the evidence from these studies suggested that early twentieth century Irish households were characterized by relatively high proportions of extended families, but insufficient numbers of multiple-couple households to support the proposition that stem families were the norm. Alone and almost unnoticed amongst studies of the time, Corrigan [1993] constructed and analysed a national, statistically representative sample of household records from the 1911 census. She found that extended family households were most common amongst farmers and in the western province of Connacht, but that ‘the stem household, in all instances,occupiedaminorityposition’ andthatitssignificancehadbeenover-
4 Chapter 1
stated by Arensberg and Kimball and other writers. In Chapter 4 of this book, Shimizu provides a comprehensive analysis of household structure across Ireland in the early twentieth century that addresses the debates described above. He shows that extended and multiple-family households were most common amongst farmers in Connacht and in parts of Munster. Even more interestingly, however, by linking data from the two censuses for four counties (Antrim, Clare, Mayo and Meath), he is able to show that a pattern of movement from a simple family to multiple family household occurred in the two western counties, but not in County Meath. While there appear to be differences between Clare and Mayo that bear further analysis, the evidence presented by Shimizu seems to support Hannan’s thesis that a socio-culturallyspecificmodeloffamilyandhousehold formation persisted in the west of Ireland through the early part of the twentieth century. Arensberg and Kimball’s work impacted on understandings of nineteenth centuryfamilyandhouseholddynamicsthroughtheir influenceontheworkofhistorical demographer Kenneth Connell [1950; see the discussion in Guinnane, 1997]. Connell argued that the Great Famine of 1845-50 created a rupture in Irish household formation systems, from early marriage and partible inheritance within a simple family system before the Famine to late marriage and impartible inheritance within a stem family system after the Famine. Connell reasoned that before the Famine, the availability of waste land for reclamation and of the potato as a source of food, together with the absence of opportunity for social improvement under the landlord system, encouraged early marriage and land subdivision leading to rapid – and ultimately unsustainable – levels of population growth. The ‘shock’ of the Famine, together with the loss of population to death and emigration, led surviving Irish farm households to change their inheritance strategy in favour of impartible transition to a single heir. While it has acquired the status of ‘common sense’ in scholarly and lay understandings of Irish family history, Connell’s argument has been subjected to critique. In particular, Ó Gráda [1994] pointed out that Connell rather oddly treated pre-Famine marriage as an ‘inferior good,’ something resorted to in the absence of socio-economic opportunities, in contrast to more conventional models that explain household behaviour in terms of responding positively to economic circumstances in order to maximize their well-being. The growing

5Introduction
availability of income from rural industry, especially in the northern half of the country, represented one economic trend that might have provided an incentive for early marriage, partible land subdivision and simple family formation [E. Almquist, 1979]. Assessing the evidence on household systems before the Famine proved difficult, given the fragmentary and uneven availability of census and parish records before 1901. Before the digitization of the surviving pre-Famine census records, a number of scholars carried out analyses of samples drawn from the 1821, 1841 and 1851 fragments with a view to understanding pre-Famine household formation systems, including Carney [1980], Cohen [1990], Gray [2005, 2006, 2012], McKernan [1995], Morgan and Macafee [1984] and O’Neill [1984]. Not all of these scholars used the Hammel=Laslett (or any other standard) system of householdclassification,makingitdifficult todrawinferencesaboutdifferences between household structure before and after the Famine. In general, the evidence suggested both the presence of a substantial minority of complex family households before the Famine and considerable regional variation in the distribution of household forms [see Gray 2012]. Moreover, comparison with the early twentieth century data indicated that the mostsignificantchangeinIrishhouseholdstructuresincetheFaminelayintheincreased proportions of solitaries and no-family households due to rising rates of celibacy from the late nineteenth century onwards. In this context, Shimizu’s thorough analysis of the 1821 census records for Cavan, Femanagh, Meath and Galway will provide considerable food for thought for scholars of nineteenth century Ireland. His findings are consistent with existing research insofar as he shows that while simple family household systems appear to predominate, complex households consistent with a stem family system were also present. Moreover, he shows that simple family households were most common in those counties (Cavan and Fermanagh) where small farm households combined subsistence agriculture with ancillary commercial activities (most notably, textile production), whereas complex family households were more common amongst farmers in areas of commercially oriented livestock production (Kings County and Meath). The evidence from Galway presents an anomaly, insofar as it appears to have been characterized by a combination of very small farms and complex households. Shimizu concludes that this was not evidence of a stem family system, but rather of a strategy of retaining children at home to care

6 Chapter 1
for parents in their old age. Shimizu further argues that the shift to commercial grazing in counties such as Meath explain the evidence for the emergence of stem family practices in these areas. However, as Guinnane [1997] has noted, it is odd, therefore, that stem families had become less common amongst farm households in these areas by the early twentieth century, given that they maintainedtheiradvantageoverwesterncountieswithrespecttotheprofitabilityof their agriculture. Shimizu suggests in Chapter 5 that sons in households in County Meath were more likely to wait at home in anticipation of inheriting the property and less likely to emigrate, perhaps because the value of the inheritance was greater, leading to increasing proportions of co-resident adult siblings in the context of delayed inheritance. The relationship between household formation systems and socio-economic development During the 1970s and eighties, new analyses of the relationships amongst household formation systems and socio-economic patterns emerged in the form of the theories of ‘proto-industrialization’ and the ‘industrious revolution.’ More recently, scholars have continued to develop these ideas in attempts to explain the ‘great divergence’ in economic development between Europe and China from the end of the eighteenth century. Central to these arguments is the idea that the European marriage pattern created a f lexible supply of labour – especially of women’s labour – that could be expanded to meet the growing demand for textiles and other manufactured goods from the sixteenth century onwards. Furthermore, these theories suggested that the growing availability of income from household based industries altered the inter-generational balance of power and created incentives for earlier marriage and land subdivision. In some regions, land fragmentation and population increase gave rise to a pattern of rural immiseration that was closely integrated to processes of class formation during the transition to machine-driven, capitalist industry [or an overview see Gray 2005]. While these theories have been subjected to considerable critique, they are nevertheless important insofar as they raise interesting questions about the relationships amongst changing household formation systems, inheritance practices, population growth and socio-economic development. Furthermore, they are much more attentive to unequal class and gender relationships as dynamic properties of households giving rise to variation and change. Given the

7Introduction
influence these theories have had in European scholarship, their comparative neglect in Irish social and economic history is surprising, especially since Ireland dominated the Atlantic linen industry during the eighteenth and early nineteenth centuries – the period most important for understanding the development of pre-Famine household systems. While not engaging directly with theories of proto-industrialization in this book, Shimizu is attentive to class differences throughout (between farmers and labourers, and between farmers occupying different sized holdings) and develops an explanation of the transition from the simple-family system to a stem-family system with reference to the commercialization of agriculture. His analysis of County Mayo is particularly interesting in this regard. Here he finds evidence of a late transition to the stem family system, partly owing to the persistence of domestic industry as a means of survival in this county and to the availability of other means of supporting the small farm system through seasonal migration, the sale of eggs and access to commonage after the domestic linen industry succumbed to the mechanization of spinning in east Ulster during the 1840s. In summary, Shimizu’s detailed and comprehensive analysis of Irish historic census records tends to confirm the classical interpretation that linked stem family processes to a post-Famine agricultural regime centered particularly on medium sized farm holdings in the west of Ireland. Notably, however, his analysis reveals the extent to which Irish family systems exhibited what he describes as considerable ‘flexibility due to situational elements,’ and that in this regard the Irish stem family form differed from the more rigid practices that prevailed in Japan.Itisworthnoting,also,thatthisfindingofflexibilityisconsistentwiththeargument presented by Fauve-Chamoux and Arrizabalaga [2005], that European stem family systems included a capacity for ‘branching out’ – that is, for some partibility – when circumstances permitted. Birdwell-Pheasant’s depiction of Irish farm family practices being centered on a long-cycle ‘home place’ that could incorporate short-cycle households under particular circumstances is also consistent with this image of a ‘f lexible’ stem family system. The arguments do, however, reveal some of the limitations of household analyses based on censusdocumentsusingclassificationsystemslikethatofHammel and Laslett. In order to really test these hypothesis, we need to develop analyses of family and household practices that incorporate understandings of intra-household and
8 Chapter 1
kinship relationships. In the remainder of this introduction, I provide a brief overview of the contents of the book. Chapter 2 introduces the Hammel=Laslett household classification system and argues that, despite the criticisms that have been directed at this, it does not make sense to proliferate classification systems. Instead, the author adopts the more pragmatic approach of modifying the system as necessary according to local requirements, while retaining a standard system for the purposes of comparison. Chapter 3 introduces the idea of the Irish stem family system as it has derived from Arensberg’s and Kimball’s work and proposes the hypothesis that there was a transition from a simple family to a stem family system in Ireland during the nineteenth century. Chapter 4 provides a comprehensive analysis of the author’s collation of data that have been digitized from the surviving 1821 census manuscripts. Shimizu puts forward evidence that, while stem families certainly existed in some contexts before the Famine, the simple family system predominated. His regional analysis suggests that the transition to the stem family system was more advanced in areas of commercial grazing than in small-farm and proto-industrial contexts. In Chapter 5, the author presents a comprehensive analysis of regional variation in household structure in early twentieth century Ireland, incorporating Geographical Information Systems and record linkage across the two censuses (1901 and 1911). This analysis strongly supports the argument that there was a regional difference between the west and the east, with stem family processes being more widespread in the west at this time and also more common amongst small and medium farm households. Chapter 6 presents an in-depth analysis of household structure in County Mayo. This represents an interesting case for detailed study, because according to Shimizu, the simple family system remained in place longer in this county than elsewhere in Ireland. He documents an increase in the proportion of complex households between 1901 and 1911 and links this to the introduction of the old-age pension. Chapter 7 examines differences between County Clare and County Meath in detail. Here, Shimizu pays particular attention to class differences in the two counties, with Clare being characterized by small to medium farm households

9Introduction
and Meath by larger farm holdings together with a class of landless labourers. Shimizu attributes the different household structures observed in these counties early in the twentieth century in part to these class differences. In Chapter 8 the author examines a neglected topic in Irish social and economic history, namely urban families and households. He finds that simple family household forms predominated in Dublin. Finally, Chapter 9 provides a fascinating analysis of family and household structure amongst Irish immigrants to Great Britain and the United States. Overall, Shimizu concludes that, while Irish immigrants tended to form somewhat larger households than other families in their host societies, these families tended to conform to local norms insofar as simple family systems predominated. It would be fascinating to extend this analysis to a comparison between Irish immigrant families and those of other immigrant groups.
Jane Gray Senior Lecturer of Sociology Maynooth University, Ireland

Chapter 2Comparative Perspective of the Family Composition
Introduction
At first the author will elucidate a household classification to become the important key concept for characterizing the Irish family structure in this book. Particularly, the author examine a concept of the household classification of further valuable Hammel=Laslett though there is much criticism until now. Incidentally existing householdclassificationsforanalyzinghouseholdstructurescanbedividedintothefollowingtwo:thefamilyclassificationbasedonthestem family system prevalent in Japan, and the classification based on the nuclear family system dominant in Europe and the United States. By comparing the stem-family-based household classification developed by family sociology in Japan, and the Hammel=Laslett classification, which is representative of the nuclear family based householdclassification, thischapterreexaminesthevalueof theHammel=Laslett householdclassification,andbyapplyingtheHammel=Laslettscheme to an analysis from 19th century to the early twentieth century Irish household structures aims to identify characteristics of family structures in Ireland. In accordance with Laslett, the study simply defines households as indicating “the fact of shared location, kinship and activity” [P. Laslett, 1972, 28] and therefore includes “solitaries” and “servants” as household members.
Study of Household Formation: Europe and the United States
InEuropetheclassificationoffamilybyFrédéricLePlay’swasthefirstandfamous typology. According to Steven Ruggles,thefirstsystematicinvestigationofchangeintheconfigurationoffamilieswasconductedbythereactionarymid-nineteenth century social scientist Frédéric Le Play’s [1855, 1871, and 1872]. Le Play gathered case studies describing individual families across Europe and Western Asia and concluded that there were just three family systems found at all times and places: the joint family (famille patriarcale), the stem family (famille souche), and the nuclear family (famille instable) [S. Ruggles, 2012, 427].

12 Chapter 2
He summarized three type of family by Le Play’s in the following [S. Ruggles, 2012, 427].
Joint families and stem families are both multigenerational. In joint families, “parents always retain near them all their married sons, and the children issuing from such marriages,” whereas in stem families, “the father transmitshisfiresideandplaceof labour to that one of his children which he thinks most capable,” and sends the other children out into the world. Le Play observed joint families mainly in Eastern Europe, and argued that stem families predominated in many parts of Western Europe, including parts of France.
ThenuclearfamiliesLePlayidentifiedweremainlylocatedinEnglandand the manufacturing districts of Western Europe. There, “the young adults leavetheirparentalfiresidesassoonas theygainanyconfidenceinthemselves” (Le Play1872, 41). The result was disastrous: “the parents are isolated in their old age and die abandoned” (Le Play 1871, 9). Stem families, LePlaybelieved,were ideal.Theyofferedgreaterflexibility than jointfamilies without the instability of nuclear families. Accordingly, Le Play was alarmed by what he saw as a gradual shift from stem families to nuclear families. In part, he blamed Napoleonic inheritance law, which mandated equal division of property among all heirs, eliminating the power of the patriarch to designate his successor. At the root, however, he saw the changing organization of labour as a fundamental threat to the stem family. For the stem family to succeed, the patriarch must be the proprietor of the family farm or workshop. With the rise of large commercial and manufacturing populations, the tie between work and family was severed, and the stem family was undermined. In these circumstances, the younger generation was vulnerable to the lure of high wages and the “attractions of city life”.
Above mentioned Leplay’sfamilyclassificationwasgiventhegreatinfluencemaking of the household classification by P. Laslett, one of member of the Cambridge Group for the History of Population and Social Structure. In Britain it is a nuclear family system based approach Laslett proposed, in Household and Family in Past Times published in 1972, five household classes based on

13Comparative Perspective of the Family Composition
conjugal family units (CFU). These are simple family households, extended family households and multiple family households, plus solitaries and no family households, the latter two being classes that do not constitute conjugal families. Laslett’s household classification is characterized by the presence of sub-categories under each class (Table 2.1). For instance, extended family households and multiple family households are divided into ones that are seen to extend upward if the conjugal family units of the parent-generation is the householder, downward if the CFU of child-generation is the householder, and laterally if the household includes two or more CFUs comprising siblings or cousins. In terms of diagrammatic representation, methods used by cultural anthropology for
Table 2.1. Composition of Households by Hammel=Laslett
Categories Classes Totalpercent
1 Solitaries1a Windowed
1b Single, or of unknown marital status
2 No family
2a Coresident siblings
2b Coresident relations of other kinds
2c Parsons not evidently related1
3Simple family households
3a Married couples alone
3b Married couples with child(ren)
3c Windowers with child(ren)
3d Windows with child(ren)
4Extended family households
4a Extended upwards
4b Extended downwards
4c Extended laterally
4d Combinations of 4a-4c
5Multiple family households
5a Secondary units UP
5b Secondary units DOWN
5c Secondary units lateral
5d Frérèches
5e Other multiple family households
6 Incompletelyclassifiablehouseholds1, 2, 3
(continued next page) TOTALS 100%
Source: E. A. Hammel & P. Laslett, 1974, 96

14 Chapter 2
illustratingconjugalrelationsweremodified,leadingtoamorerefinedhousehold classification. This contribution was made by cultural anthropologist Hammel, which is why the scheme is called the Hammel=Laslett householdclassification. Among criticisms of the Hammel=Laslett typology voiced by L. M. Berkner [L. M. Berkner, 1972], S. Ruggles, and R. Wall, this chapter will look at the one by R. Wall, who was Laslett’s very close assistant. Wall argues that from the viewpoint of kinship relationships, the individual should be made the unit of householdclassification,unlikeLaslett’ssystemwhichisbasedonCFUs,becausethe CFU framework fails to capture economical and other support extended to parents by married children who live apart [R. Wall, 1983, 6-7]. In other words, Wall’s criticism was made from a viewpoint of the kinship system, that the rigid application of CFUs to household classifications failed to pay due attention to relatives excluded household head, spouse and children [R. Wall, 1983, 7-8]. To consistently compensate for what he considered a shortcoming of Laslett’s household typology, Wall proposed a formula for working out the number of relatives and kinship relationships for a unit of 100 households.
Wall proposed a new household classification, shown in Table 2.2. This classification, however, is based on the nuclear family system, and was a classificationnecessaryforstudyingtheelderlypopulation,meaningitfallsshortof a fundamental criticism of the entire Hammel=Laslett scheme. Similar intentions are evident in S. Ruggles’s work during the 1980s. The United States in 1850 had a low frequency of the extended households. This was due to premature deaths, late marriages and high birthrates, and from the
Table2.2. HouseholdClassificationbyR.Wall1. Alone2. Non-relatives only3. Married couple4. Married couple with unmarried children5. Married couple with relatives6. Married couple with non-relatives7. Lone parent with unmarried children8. Lone parent with unmarried children, relatives9. Lone parent with unmarried children, non-relatives
Source: Author’s interview with Richard Wall
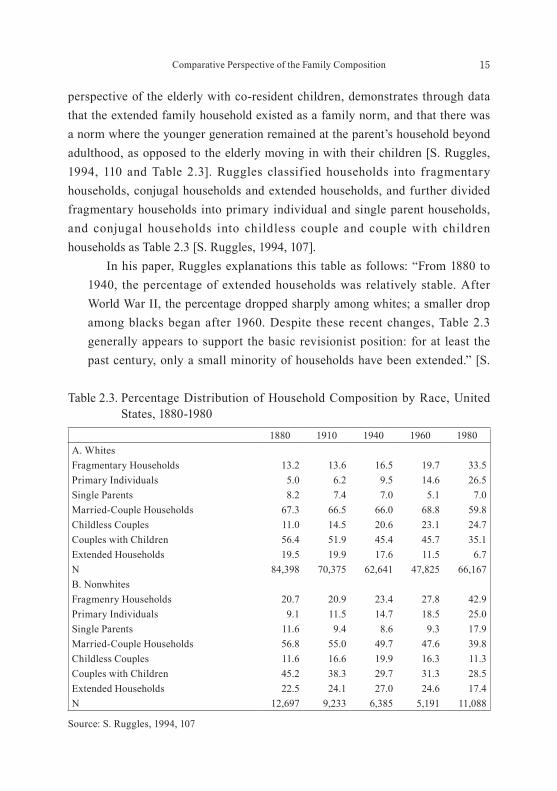
15Comparative Perspective of the Family Composition
perspective of the elderly with co-resident children, demonstrates through data that the extended family household existed as a family norm, and that there was a norm where the younger generation remained at the parent’s household beyond adulthood, as opposed to the elderly moving in with their children [S. Ruggles, 1994, 110 and Table 2.3]. Ruggles classified households into fragmentary households, conjugal households and extended households, and further divided fragmentary households into primary individual and single parent households, and conjugal households into childless couple and couple with children households as Table 2.3 [S. Ruggles, 1994, 107]. In his paper, Ruggles explanations this table as follows: “From 1880 to
1940, the percentage of extended households was relatively stable. After World War II, the percentage dropped sharply among whites; a smaller drop among blacks began after 1960. Despite these recent changes, Table 2.3 generally appears to support the basic revisionist position: for at least the past century, only a small minority of households have been extended.” [S.
Table 2.3. Percentage Distribution of Household Composition by Race, United States, 1880-1980
1880 1910 1940 1960 1980A. WhitesFragmentary Households 13.2 13.6 16.5 19.7 33.5Primary Individuals 5.0 6.2 9.5 14.6 26.5Single Parents 8.2 7.4 7.0 5.1 7.0Married-Couple Households 67.3 66.5 66.0 68.8 59.8Childless Couples 11.0 14.5 20.6 23.1 24.7Couples with Children 56.4 51.9 45.4 45.7 35.1Extended Households 19.5 19.9 17.6 11.5 6.7N 84,398 70,375 62,641 47,825 66,167B. NonwhitesFragmenry Households 20.7 20.9 23.4 27.8 42.9Primary Individuals 9.1 11.5 14.7 18.5 25.0Single Parents 11.6 9.4 8.6 9.3 17.9Married-Couple Households 56.8 55.0 49.7 47.6 39.8Childless Couples 11.6 16.6 19.9 16.3 11.3Couples with Children 45.2 38.3 29.7 31.3 28.5Extended Households 22.5 24.1 27.0 24.6 17.4N 12,697 9,233 6,385 5,191 11,088
Source: S. Ruggles, 1994, 107
16 Chapter 2
Ruggles, 1993, 108], That is, the percentage of extended households decreased after 1960, but it was the ratio of 20 percent till then, and Steven Ruggles emphasizes the existence of extended family in United States.
However, when Laslett created the householdclassification,hehadalreadyfocused on the stemfamilyandpreparedfourclassificationitemsforit.Inthis,weseetheunderlyinginfluenceofFilmer’s patriarchal theory, which Laslett had studied earlier. Nonetheless, criticisms of Hammel=Laslett are based on classifications dependent on the perspective of each researcher. Despite feeling a strong need to examine the meaning of the collateral relative’s presence when analyzing lineal families, we are confident that the Hammel=Laslett household classification is indispensable for comparative family research, since an essential criticism against it has yet to be found.
Study of Household Formation: Japan
Thefirstpersontostudyhousehold formation in Japan was Teizo Toda. To understand the traditional lineal family in Japan, Toda used a 1/1000 sample of Japan’sfirstnationalcensus, takenin1920.Toda’sstudyverifiedthatJapanesehousehold sizes were small at the time, when households were predominantly stem families under the Ie system. Toda initially assumed the Ie or traditional Japanese family to be large and predominantly to be no stem families. However, the analysis revealed the mean family size to be 4.9 persons nationwide, 4.4 to 4.6 persons in urban areas, and 5.3 to 5.6 persons in rural areas, with stem families accounting for 30 percent of households. Although the results contradicted his assumptions, they enabled Toda to develop a theoretical construction of the small family [Toda, 1970, 143]. It is notable that Toda was proposing a small family theory in 1937, preceding the appearance of Murdock’s nuclear family theory in 1949. Toda’sworkwasalsothefirstseriousstudyofthefamilyinJapan.Atthetime Todadidnotconductadetailedclassificationofhouseholds,butproposed42 types of families based on relationships of family members obtained from the national census. These include 21 types composed of the householder’s lineal relatives, plus 21 types that include collateral relatives [Toda, 1970, 306-310]. As mentioned below, it is also remarkable that Toda had already compiled region-by-
17Comparative Perspective of the Family Composition
region data revealing the size of co-resident relatives as shown by R. Wall, a fact pointed out by Saito [O. Saito, 1998, 172]. Takashi Koyama succeeded Toda’s research. Koyama initially studied large families in well-known Japanese villages such as Gokayama village in Toyama Prefecture and Shirakawa village in Gifu Prefecture. He subsequently conducted factualinvestigationsofEdo-periodandpostwarJapanesefamiliesandclassifiedfamily forms, a task left undone by Toda. As shown in Table 2.4, Koyama classified family compositions into three basic forms: a) conjugal families, consisting of married couples and unmarried children; b) stem families, including other lineal relatives; and c) joint families, including collateral relatives. These three were further divided into seven family types.
Koyama can be regarded as a successor to Toda’s family theory, since the 21 types proposed by Toda are set down alongside Koyama’s own classifications [Koyama, 1959, 213-215]. Table 2.4 shows that in 1920, conjugal families accounted for 54 percent of households, and stem families for 30 percent. Koyama also analyzed a total of 1,556 households based on Yamanashi Prefecture’s population registers or ninbetsu-cho for the period from 1802 to 1861, and revealed that 40.5 percent were conjugal families, 29.0 percent were stem families, and 16.1 percent were joint families. This precedes the research currently conducted by the Hayami group on the history of the family based on
Table 2.4. Percentage of Japanese Households Types (1920, %)
Sub-Type Japan (1930) Rural Urban
Elementary Form
Ⅰ Single 6.0 5.2 9.1
Ⅱ Married couple without children 10.3 9.4 14.3
Ⅲ Married couple with unmarried children 43.7 42.3 49.8
Stem Family
Ⅳ Married couple with marr ied child couple and grandchildren 2.3 2.6 1.1
Ⅴ Married couple with lineal ancestor kin 2.8 2.6 3.6
Ⅵ Married couple with lineal ancestor kin and lineal descendant kin 25.2 27.9 13.6
Joint Family Ⅶ Household with collateral kin and other kin 1.0 1.0 0.9
Source:TakashiKoyama,Classificationoffamilycomposition,1959,216,Table2
18 Chapter 2
Edo-period population registers or shushi aratame-cho [Koyama, 1959, 70-72]. As seen above, the study of family sociology in Japan has rested on theories about lineal families, and as a result, detailed family and householdclassificationsremains underdeveloped.
TheApproachoftheClassificationofHouseholds
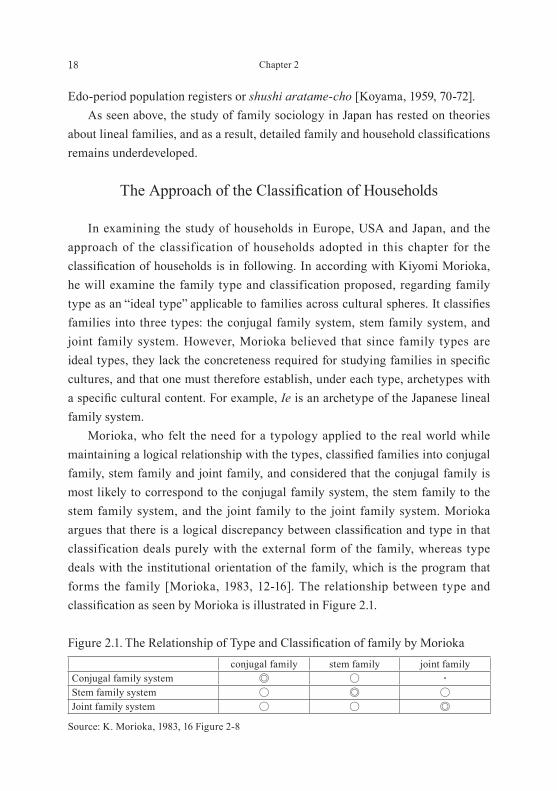
In examining the study of households in Europe, USA and Japan, and the approach of the classification of households adopted in this chapter for the classificationofhouseholdsisinfollowing.InaccordingwithKiyomiMorioka, he will examine the family type and classification proposed, regarding family typeasan “idealtype” applicabletofamiliesacrossculturalspheres.Itclassifiesfamilies into three types: the conjugal family system, stem family system, and joint family system. However, Morioka believed that since family types are idealtypes,theylacktheconcretenessrequiredforstudyingfamiliesinspecificcultures, and that one must therefore establish, under each type, archetypes with aspecificculturalcontent.Forexample,Ie is an archetype of the Japanese lineal family system. Morioka, who felt the need for a typology applied to the real world while maintainingalogicalrelationshipwiththetypes,classifiedfamiliesintoconjugalfamily, stem family and joint family, and considered that the conjugal family is most likely to correspond to the conjugal family system, the stem family to the stem family system, and the joint family to the joint family system. Morioka arguesthatthereisalogicaldiscrepancybetweenclassificationandtypeinthatclassification deals purely with the external form of the family, whereas type deals with the institutional orientation of the family, which is the program that forms the family [Morioka, 1983, 12-16]. The relationship between type and classificationasseenbyMorioka is illustrated in Figure 2.1.
Figure2.1. TheRelationshipofTypeandClassificationoffamilybyMoriokaconjugal family stem family joint family
Conjugal family system ◎ ○ ・Stem family system ○ ◎ ○Joint family system ○ ○ ◎
Source: K. Morioka, 1983, 16 Figure 2-8

19Comparative Perspective of the Family Composition
Based upon the preceding studies mentioned above, we believe that there is little meaning in simply criticizing household classifications, and that essentially, what is important is the relationship between householdclassificationand household type. As Morioka pointed out, family types are ideal types that are cross-cultural, and because they are concepts that are composed in a logically consistent manner, they are effective for understanding meanings and characteristics of actual conditions, but are limited in their capacity to sift diverseexamples.Classificationisthereforenecessarytosupplementtype,anditis necessary to think of it as a category for processing actual conditions without omissions or overlaps [Morioka, 1983, 14-15]. When it comes to comparing Japanese lineal families with those in Ireland, theclassificationsproposedbyJapanesescholarssuchasKoyama and Morioka are too sweeping, and in that sense the Hammel=Laslett household classification is more effective. It is ultimately impossible to universalize householdclassifications,andareasonablemethodwouldbetoregardhousehold classificationsascategoriesoroperationalconceptsthataremodifiedaccordingto the household type being studied.
Conclusion
Many theories on lineal families have been developed to understand the Ie, or traditional Japanese family. Most recently, the Hayami group is studying historical demography and the history of the family using Edo-period shushi aratame-choassourcedata.Inthefieldoffamilysociology,althoughstudyofthe lineal family was continued throughout the prewar and postwar periods by Toda, Koyama and Morioka, classifications of families and households were underdeveloped,becausethefieldfocusedmoreonthetheoreticalstudyoftheIe. The Cambridge Group for the History of Population and Social Structure in the United Kingdom commenced research on the history of the family in the 1960s, and in the 1970s the Hammel=Laslett household classification was proposed and became adopted worldwide. Although the Hammel=Laslett classif icat ion is not f ree of cr it icism, a fundamental cr it icism of the Hammel=Laslett classif ication has yet to be identif ied, and many of the criticisms in fact argue for modifications to the Hammel=Laslett scheme. For

20 Chapter 2
example, Laslett’s research partner Hammel in his work “Household structure in fourteenth-century Macedonia” extracts 50 household types from surveyed households,andclassifiesthemintonuclear family households, lineally extended family households, collaterally extended family households and lineally and collaterally extended family households. Hammel further divides nuclear family households into four classes, lineally extended households and collaterally extended family households into two classes respectively, and with these nine classes of households reveals the household structure of a large family unit called zadruga [E. A. Hammel, 1980, 260-261]. Likewise the author of the present chapter’s preferred approach is to modify the Hammel=Laslett household classification as necessitated by household types corresponding to the locality being studied.
Chapter 3Theoretical Framework of Irish Family
from early Nineteenth to early Twentieth Century
Research on the Stem Family by Arensberg and Kimball
The author introduces the pioneer study of the Irish family by Arensberg and Kimball, and based on it, we examines the theoretical framework of Irish stem family study to take up with this book in this chapter First and foremost, a common understanding is necessary that in general, families consist of two elements, family norms and family situations (ownership status of production and consumption means), and that families are structured by the mutually defining relationship of these two elements. Especially we definedtheelementsofnormofstem family are eldest son residual, paternal co-residence, family estate and land inherited by the eldest son, and including the marriage customs (dowry or bride price), and the family situation factors are included family number, land tenure scale, farm management, farm income and part-time income. Generally, in the history of family comparisons, the approaches used can be divided into two major categories: the nuclear family system approach and the stem family system approach. The representative study using the nuclear family approach is by the Cambridge Group in England. In Germany, Mitterauer takes the position of the nuclear family system, and interprets the formation of stem families as a step in the family life cycle or in relation to the retirement system [Mitterauer, M. & R. Sider, 1982, 19, Mitterauer, M, 1990, 95-96]. According to Saito, the European approach towards studies of families is basically that families have the possibility of forming stem families as a part of the family cycle, but this is considered a variation of the nuclear family system and the approach explores the conditions under which formation of such a family is observed. On the other hand, the Japanese approach views stem family from the point of view of the stem family system, in which family forms can become either nuclear family or stem family depending on the family cycle [Saito, O., 1998, 167-8]. The author believes that both approaches are necessary in order to
22 Chapter 3
understand Irish families in Ireland. In The Explanation of Ideology, E. Toddhasalreadyconfirmedtheexistenceof four different types of families in Europe: exogamous community family, authoritarian family, egalitarian nuclear family, and absolute nuclear family considering Irish families to represent the stem family type [Todd, E., 1985, 31, 1987, 53 and Map4.1]. It is well known that The Irish Countryman by Arensberg and Family and Community in Ireland by Kimball, both American cultural anthropologists, constitute the pioneering studies on the Irish family. However, it is not widely known that their studies were part of the projects in the Harvard Irish Survey, which was led by E. Hooton of Harvard University, and comprised of cultural anthropology, archaeology and physical anthropology projects [Anne Byrne, Ricca Edmondson and Tony Varley, 2001, 17]. The reason that Harvard researchers chose Ireland as the target region of their study was based on their recognition that Ireland was a highly homogeneous society [Arensberg, C. & Kimball, 2001], and that it was the last frontier region in Europe. Their studies started from the Yankee City study conducted by the Harvard group, and constituted the application of the theoretical paradigm of Yankee City to a contemporary civil society in the West. In the summer of 1931, W. Lloyd Warner (who had already started a study on the Irish American community as part of the Yankee City Study), who was well known as a researcher on Yankee City in the cultural anthropology project, conducted an interview-based preliminary survey in various parts of Ireland together with Arensberg. As a result of the survey, they came to recognize that County Clare was a microcosm of Ireland and selected it as a target region [Anne Byrne, Ricca Edmondson and Tony Varley, 2001, 44]. Consequently, the three districts of Lough, Rynamona, and Inagh in County Clarewereselectedasthetargetareasofthefieldwork.Later,Warner went home and Kimball joined Arensberg as a research collaborator. Eventually, Arensberg and Kimball took charge of the research project on Irish communities, which was completed in 1934 [Anne Byrne, Ricca Edmondson and Tony Varley, 2001, 22]. While the details of their research are discussed later, some criticisms on their research methods and theories came from Gibbon, who claimed from a historical and methodological perspective that social changes could not be fully

23Theoretical Framework of Irish Family from early Nineteenth to early Twentieth Century
explained by functionalist theory [Gibbon, P., 1973, 491], and Brody who claimed that the traditional farm life and the values of farming communities had already collapsed in western Ireland due to modernization [Brody, H. 1974, 70]. Despite such criticisms, many researchers conducted research based on the studies by Arensberg and Kimball after World War II up to the present [Wilson, T. M. & H. Donnan, 2006, 22]. Even today, the studies on Ireland by Arensberg and Kimball areconsideredsignificant. Their research framework follows the framework of Warner’s Yankee City study: It features the functionalist theory, which focuses not on individual lives or events, but on relationships between individuals, and regards the mutual dependency in social relationships as a social system. According to Arensberg and Kimball’s research, the characteristics of the stem family can be described by the three keywords of dowry system, matchmaking, and inheritance system. Conceptually speaking, a stem family is formed by the cohabitation of parents, and their married son and his family, and it is matchmaking that acts as the impetus for the formation of a stem family [Arensberg, C., 1951, 72-80]. However, as preconditions to matchmaking, the transfer of the patriarchal rights to a son designated by the patriarch and the one-child land inheritance system were required, which represented the inheritance of the patriarchal rights by a son and the rite of passage from childhood to adulthood [Arensberg, C. 1959, 58-59]. Thus matchmaking took place upon the transfer of the patriarchal rights from the patriarch to a son. A matchmaker made arrangements with the families and negotiated for a dowry between the bride and bridegroom’s families. This negotiation was an important event for the two families [Arensberg, C. 1951, 72-80, Arensberg, C. & Kimball, S. 2001, 135-139]. While the dowry was a payment for a bride to establish her social status in the bridegroom’s family [Arensberg, C. 1959, 77], the bridegroom’s family appropriated it to defray the costs of a dowry of a daughter, retirement income, the settlement of debts, or house renovation costs [Breen, R. 1980, 255-272]. Thus, the dowry system served as a guarantee of the success of matchmaking, and the matchmaking system was tightly combined with impartible inheritance, although Arensberg and Kimball gave little attention to the inheritance system in their research papers. The marriage of a son via matchmaking led to the moving of his parents into the west room as discussed below.
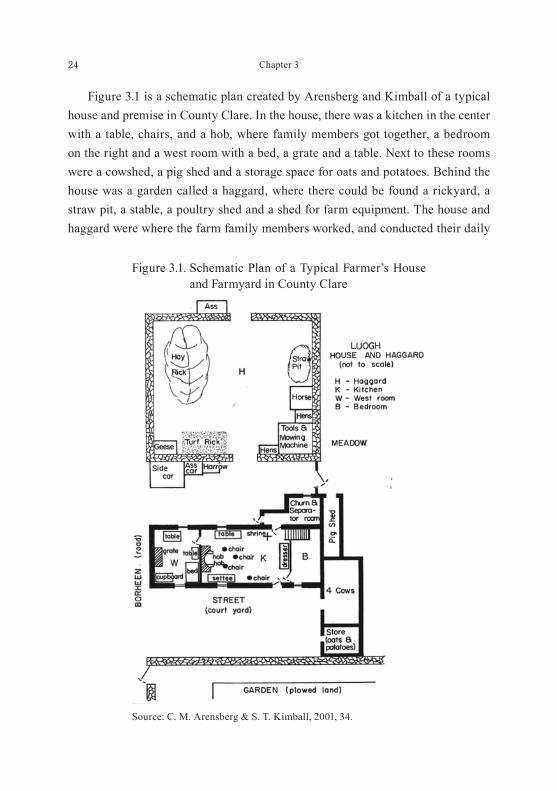
24 Chapter 3
Figure 3.1 is a schematic plan created by Arensberg and Kimball of a typical house and premise in County Clare. In the house, there was a kitchen in the center with a table, chairs, and a hob, where family members got together, a bedroom on the right and a west room with a bed, a grate and a table. Next to these rooms were a cowshed, a pig shed and a storage space for oats and potatoes. Behind the house was a garden called a haggard, where there could be found a rickyard, a straw pit, a stable, a poultry shed and a shed for farm equipment. The house and haggard were where the farm family members worked, and conducted their daily
Figure 3.1. Schematic Plan of a Typical Farmer’s House and Farmyard in County Clare
Source: C. M. Arensberg & S. T. Kimball, 2001, 34.

25Theoretical Framework of Irish Family from early Nineteenth to early Twentieth Century
activities. The west room was viewed as a reserved room for the use of the patriarch and his wife, into which they moved after the marriage of their heir [Arensberg, C. 1959, 27]. The moving of the patriarch, and his wife to the west room was understood as follows: While the new status they had acquired led to a change in their behavior in and attitude to human relationship [Arensberg, C. 1959, 28], moving to the west room was viewed as something to ensure the formation and maintenance of a stem family, not as a change that allowed the family system to deviate from the stem family system. This is where the use of structural functionalism by Arensberg and Kimball can be seen. Before the 19th century, a consanguine community called a clachan comprising domestic groups, whose houses formed a compact village within the lands held the group on the rundale system, existed in Ulster and Connacht [Taro Matsuo, 1973, 132]. Families in this community had farm land and common land inside the community of congested houses. However, in the mid-19th century, the clachan system collapsed surely not generally as you say at end of para that the system lasted to end of century in west and the land was redistributed within the group who now lived in separate dwellings each surrounded by its own lands. Farmers worked and lived in the spaces of their homes, and farm land in the wake of the collapse of the rundale system.Therefore,manyoftheactivitiesthatdefinedhumanrelationshipswithinthese spaces were conducted by separate family unites. However, the rundale system remained in County Mayo and Connacht until the latter half of the 19th century. Thus a stem family was formed by the combination of the aforementioned variables such as matchmaking, the dowry system, the inheritance system, and the west room, and this was the ideal type of the stem family formulated by Arensberg and Kimball. Now, in Family and Community in Ireland, a pioneering research on study of families in Ireland by American cultural anthropologists C. M. Arensberg and S. T. Kimball, explain the stem family through the dowry, matchmaking and inheritance system, and conclude that the rural communities of Ireland in the 1930shadawell-unifiedandrelativelystablesocietyduetothesestemfamilies[Arensberg, C. & Kimball, S. T., 105-6].
26 Chapter 3
Their work was a descriptive study of Irish families, but the mainstream of Irish family research that followed was quantitative investigation of families from the 19th century to the early 20th century based on census data. Representative scholars of such research were F. J. Carney [1977, 1980], P. Gibbon & C. Curtin [1978], T. G. M., Gabriel [1977], Been, R. J. [1980], D. Fitzpatrick [1982, 1983], K. O’Neill [1984], Morgan & W. Macafee [1987], C. Corrigan [1989, 1993], D. Birdwell-Phesant [1992] and T. Guinnane [1997]. The first study was of that of F. J. Carney on family structure from the nineteenth century to the early twentieth century, based on census data. He took the census samples from 1821 and 1911, and focused on the change of families from simple family households to extended family households, as well as the miniaturization of household size that took place during this period. However, what brought greater impact onto later Irish family research was the work of P. Gibbon and C. Curtin. The characteristics of their work is that they used sample data of 15 townlands from seven states in the 1911 census returns, and associated stem families with element of norms and element of situation; they identified that stem families are easily formed in mid-sized farming areas [P. Gibbon, & C. Curtin, 1978, 443-4]. Plus, the fact that by using the 1911 census returns which had just been made available for use, their research opened up the research route of using census data, a primary historical resource, and this must receive high recognition. However, since their research is based on the data from the census of only 1911, the research result is limited.
Theoretical Framework of the Irish Family
Based on the previous studies by Arensberg and Kimball, the author propose the following hypothesis about a change in the form of the Irish family: In the early nineteenth century, the nuclear family based on the partible land inheritance system was predominant in Ireland. Around the mid-nineteenth century, however, the inheritance system among landholders changed from the partible inheritance system to the impartible inheritance system due to the following reasons: the Great Famine in 1845, land integration via enclosure by landlords, which resulted from the eviction of tenant farmers, resistance by landlords to land fragmentation, depletion of farmland, industrial underdevelopment in Ireland, and the collapse

27Theoretical Framework of Irish Family from early Nineteenth to early Twentieth Century
of the domestic linen industry, which represented proto-industrialization in the area around Belfast [Clarkson, L. A. 1981, 237]. Along with these changes, the one-child inheritance system was established, where the patriarch designated his heir, and passed the patriarchal rights over to the heir at some point in time. The combination of this inheritance system and the dowry-based matchmaking system led theoretically to form the stem family, and the family situations that support the norm were established. The dowry-based matchmaking system is said to have existed before the Great Famine as the stem family norm [Shoji Yonemura, 1981, 143]. However, in light of Fitzpatrick’s 1852 theory [Fitzpatrick, David, 1982, 58], Collins’ theory of 1850 and later [Collins, Brenda, 1993, 368], and Breen’s theory of a change after the Great Famine [Breen, Richard, 1980, 252], a hypothesis can be proposed that the stem family was formed along with a change in the inheritance system after the mid-19th century. After the formation of the stem family norm, patriarchs had and maintained strong control over land and agricultural labour, and began to cherish a strong desire to leave their family names on their land [Gabriel, Tom, 1977, 73]. In reality, patriarchs tended to continue holding patriarchal power and postpone the designation of their heirs and the transfer of family assets to the heirs. Consequently, the designated sons were forced to postpone their marriage and inheritance until the aging or deaths of their parents, leading to an increase inlateornon-marriagecases.Thistendencywasintensifiedbythepenetration of celibacy and late marriage practices across Ireland at the time. Sons other than the heir had to settle for some financial compensation and to work in Dublin, Belfast, or Cork, or emigrate to England or America, or remain home. Thus, the stem family norm was most prevalent in Ireland from the end of the 19th century to the early twentieth century. Based on the understanding of how the nuclear family system shifted to the stem family system as discussed above, the author propose a theoretical framework that the Irish family system changed drastically to around the time of the Great Famine. The dowry-based matchmaking system, and the impartible inheritance system were established, and in the early twentieth century stem families, not conventional nuclear families, were predominant in Ireland. On the other hand, a regional variation in the Irish stem family existed there

28 Chapter 3
were more stem families among small to medium farmers in western Ireland than among large farmers in eastern Ireland. Arensberg and Kimball, who conducted theirfirstsurveyinagriculturalvillagesinIrelandintheearly1930s,confirmedthe existence of stem families in the medium farming area in County Clare, suggesting that the regional variation resulted from the difference in situational elements, which supported the stem family norm. At this point, the author tentatively regards peasant society as the conceptual social structure of agricultural villages in western Ireland. D. F. Hannan pointed out the three basic features of the peasant. Its main features a familial economy, where farms are owned or securely rented and are large enough to support a family but not large enough to employ labour, (2) a subsistence economy, where production for market is not the dominating purpose of production, (3) where impartible inheritance was the norm, as in Ireland, stem family arrangements characterize the social structure. [D. F. Hannan, 1982, 142-3] In such a peasant society, while small farmers had to have a side job or work as migrant workers to make a living, medium farmers were able to make a living by farming solely by family members and did not require any wage-earners. Therefore, in peasant society in western Ireland, traditional farmers selected the transfer of land to their heirs, rather than having them leave home to work outside, as an effective family strategy. Heirs waiting for inheritance and children other than heirs remaining home tended to marry late or stay single. On the other hand, different from peasant society in western Ireland, large farmers in eastern Ireland constituted a commercial agricultural society as they could not manage their farms by family members alone and required agricultural labourers and agricultural servants. The farmers in eastern Ireland adopted an adaptive strategy where while designated boys became heirs, children other than the heir worked in Dublin, which had capital and commercial functions, or already industrialized Belfast, or emigrated to America after receiving some financial compensation. The agricultural labourers employed by large farmers were landless workers, who were able to get married if their economic conditions allowed, or stayed single. The adaptive family strategy for these workers was either to form simple family households if they could get married, or to form solitaries or no-family households if marriage was not possible. I am as follows if I summarize the above-mentioned theoretical framework.

29Theoretical Framework of Irish Family from early Nineteenth to early Twentieth Century
The family system in Ireland prior to the Great Irish Famine in 1845 typically took the form of the nuclear family. In the nuclear family system, the family consists of a married couple and their single children, with some special circumstances such as a child receiving partible inheritance early on or leaving the family without inheriting, and in the end, the family, now consisting only of the aged couple, is terminated by their deaths. The nuclear family system is formed within certain family circumstances that have the norm of the nuclear family; certain circumstances that supported the norm of the nuclear family before 1840 included the existence of extensive wasteland, the ease of land subdivision, an abundant potato harvest, high marriage rate, high birthrate, early marriages, and a large number of labourers and development of proto-industrialization that absorbed labour power. In addition, such families had the possibility of forming stem families as well, depending on the family cycle, by living with parents of either the husband or the wife in order to reduce the economic risks of the newly-weds. On the other hand, Irish families began to change from around 1840, and the tendency towards stem families can be observed. Deliberation of Irish stem family system from the elements of its members and inheritance is as follows. First, the members of the family would consist of a married couple and their children, and second, the child designated by the father as the heir (normally, the oldest son tended to be chosen) would form a new family with the dowry from the partner and the matchmakingsystem,andthefirstcoupleandthenewcouple living under one roof would complete the typical stem family within the stem family system. And, due to the one-heir norm from the 1850s onwards, the possibility for the children marrying later becomes very high. In other words, the power of the older couple as the head of a household is prolonged, and the heir cannot marry until the said power is forfeited or transferred, thus resulting in a high percentage of single people or later marriages. The non-heir must make a choice around the time the heir is determined to either leave the family by emigration, employment, or marriage into the wife’s family, or to remain single in the original household. If the Fitzpatrick theory is employed for the element of inheritance, it can be said that partible inheritance up to 1852 was replaced by impartible inheritance, creating a land ownership norm. It is observed that in farms, the inheritance

30 Chapter 3
norm is that most of the land is inherited by one person; the farm, the house and the assets are passed from father to son, resulting in a one-heir patrilineal inheritance, and this is especially prominent in land inheritance. However, this does not necessarily mean a strict one-heir inheritance, since support is provided for women that are not the heir by way of dowry. With such a family norm, certain family circumstances such as reduced dependency on potatoes after the famine, the landlords evicting tenant farmers in order to unify lands instead of dividing lands, and realize commercial agriculture, limitation of arable lands, decrease of farm labourers and general labourers caused by emigration to UK and America after the Great Famine, convergence of the agricultural management, drop in marriage rate, and increase in single people and late marriages are seen as what would supported the stem family system [Clarkson, L. A., 1977, 15, 1981, 237]. With the above understanding of the nuclear family system and the stem family system, the author would like to make and deliberate on the hypothesis that Irish families went through drastic changes from the time of the Great Famine onwards, which is around the time when the systems of dowry, matchmaking system and impartible inheritance were established, and by the early 20th century, the form of stem family had replaced the form of nuclear family as the majority. Research from this perspective had hardly been conducted in studies of Irish families before. But with the above the Irish family who spoke, it is the model that the changes from the nuclear family with the nuclear family system early in the 19th century to the mid-19th century to the stem family with the stem family system are like an ideal types. Therefore, in reality, together there is variations by region, it may also be necessary to consider that sometimes be differed to that stage practically. In chapter 3, I examine the family structure of 5 provinces by using the census returns of 1821, namely County Meath and County King’s of large-scale agricultural areas, County Cavan and County Fermanagh of medium-sized agricultural area and County Galway of small-scale regional area. It reveals that the nuclear family by the nuclear family system was the dominant family form during this period. In chapter 4, we are using the 1901 and census microdata of 1911 (100 percentdata),firstIrelandoveralleconomicstructure,andtoclearthepopulation

31Theoretical Framework of Irish Family from early Nineteenth to early Twentieth Century
structure, the same be considered in association with the family structure. As a result, it revealed that the stem family is formed more in the western part of Ireland than eastern Ireland.


Chapter 4Household Structure in early Nineteenth Century Ireland
Introduction
In this chapter, Ireland of the rural family has changed greatly from the nineteenth century to the twentieth century. Therefore, we want to clear the featuresofthefirstearlynineteenthcenturyoffamilystructurebythedataofthe1821 census returns in Ireland. Studies in the early nineteenth century were based mainly on the tour by A. Young [1892], and on studies by W. S. Mason [1819], and E. Wakefield[1812]andthe Poor Inquiry in 1836. Moreover, only after 1841 did reliable census statistics became available. In addition while statistics on marriage, birth, and death did not became available until 1864, agricultural statistics had become available from 1841. In other words, statistical data before these years are lacking. Due to the limited data, there have been no established views or theories in social and economic research for the period from the end of the eighteenth century to the early nineteenth century. The dispute on population growth before the Great Famine among Connell [1950], Drake [1963], and Lee [1968] can be cited as a typical example of such a situation. The following chapters examined the family structure of Ireland in the early twentieth century based on the records of the 1901 and 1911 census returns. These chapters advanced the hypothesis that the family structure in early nineteenth century Ireland, was based on the nuclear family system, shifting to the stem family system in the mid-nineteenth century due to the integration of the dowry-based matchmaking system and impartible inheritance. In addition the papers examined the family structure of the early twentieth century by verifying the hypothesis from the 1901 and 1911 census returns. Studies on the Irish family structure in the early nineteenth century have been incomplete since they were based on the analysis of limited samples from census data that existed only in some counties. However, recently, a database on based on the remnants of early census returns was compiled, opening the door to more detailed analyses. Therefore, this chapter aims to elucidate the household structure of Ireland in
34 Chapter 4
relation to the economic conditions of Ireland based on the remaining the record of the 1821 censusreturns.Inthefollowing,theauthorfirstexaminesprecedingstudies by F. J. Carney and J. Gray, then proposes a hypothesis on the family structureintheearlynineteenthcentury,andfinallyverifiesthehypothesisbasedon the records of the 1821 census returns. The author believes that this chapter will contribute to the elucidation of the household structure in Ireland, because this chapter provides an analysis based on surviving census returns, although the data themselves are not complete.
Family Studies in early Nineteenth Century
The studies using the records of the 1821 census returns include research papers by Carney and Gray. Carney wrote two research papers: Aspects of Pre-Famine Irish Household Size: Composition and Differentials (1977, hereinafter referred to as the First Paper) and Household Size and Structure in Two Areas of Ireland, 1821 and 1911 (1980, hereinafter referred to as the Second Paper). The details of these two papers examined in an earlier paper [Shimizu, 2003] will bereviewedbrieflyhere.TheFirstPaperwasananalysisof2,663householdsinCavan, Meath, Fermanagh, King’s, and Galway, based on a sample of one in six households extracted from the 1821 census. Carney divided households into the three categories of houseful size, household size, and family size, and explained the characteristics of households with the average household size and the average family size as major indexes. He then compared the average household size (5.5 persons) and the average family size (5.0 persons) with those in England at that time (4.45 persons and 3.82 persons respectively) and concluded that the household size in Ireland was greater than in England. Moreover, according to the average household size, he divided the five counties into three groups: the firstgroupcomprisingGalwaywheretheaveragehousehold size was highest (5.6 persons), the second group comprising Cavan (5.54 persons) and Fermanagh (5.49 persons), and the third group comprising King’s (5.34 persons) and Meath (5.26 persons). He then showed that the household size had regional characteristics and was closely correlated with the age of the heads of households: The household size reached peaked in the age group of 45 to 54. While credit should be given to Carney in that his study clearly showed that the family life cycle was correlated

35Household Structure in early Nineteenth Century Ireland
with household size, his First Paper lacked a detailed explanation of the household type. The Second Paper focused on the comparison between household size and household structure based on the 1821 and 1911 census returns. The data used a sample of one in six households obtained from the 1821 and 1911 census returns, and a total of 1,034 households in two counties (528 households in Galway and 506 households in Meath) were analyzed. It was shown that the household size increased from 5.95 persons in 1821 to 6.62 persons in 1851, and decreased afterwards falling to 5.09 persons in 1911. He argued that the changes in household size corresponded to changes in family size, the number of married couples in households, and the number of adults in the households. Moreover, he also examined changes in household types from 1821 to 1911 based on the Hammel=Laslett classification. In 1821, while the simple family household predominated (65.8 percent), the compound family households (extended family households and multiple family households) also existed (27 percent). In 1911, however, the simple family households and the compound family households both decreased (65.8 percent to 58.1 percent and 27 percent to 21.5 percent respectively), whereas solitaries and no family households increased from 7.2 percent to 20.4 percent. However, the data of Carney is sample data of County Meath and County Galway, and it is conformed a ratio of compound family households in Galway (27 percent)morethan15.3percentofthetotaldataincludingfivecounties(Cavan,King’s, Fermanagh, Meath and Galway). Therefore, we need to notice that there is a regional bias in his data. This regional bias is proved to mention it later, because there are considerably many compound families of Galway. In 1821, the number of simple family households was largest in household age groups aged of 35 to 44 and 45 to 54, whereas the number of extended family households was largest in the age group of 40 or older and that of multiple family households was largest in the age group of 55 or older. These differences were explained by family life cycle. However, the household structure in 1911 was diversified, and all household types were formed by elderly household heads leading to the conclusion that household type cannot be explained simply by the life cycle of the heads of households. In short, the analytical framework for the household structure by Carney was

36 Chapter 4
based on a nuclear family system. While the system could explain the household structure of 1821, it could not explain that of 1911. What was required for the explanation of the household structure of 1911 was the perspective of a stem family system. Another researcher who used the 1821 census returns was Gray. Her studies include two papers: Household formation, inheritance and class-formation in nineteenth century Ireland where she used samples from the records of census returns of County Fermanagh, and Gender composition and household labour strategies in pre-Famine Ireland where she used samples from the census returns of County Cavan. Since the latter paper deals with the relationships between farm households and gender, only the former paper is reviewed here. Gray questioned the traditional understanding that the family structure in nineteenth century Ireland shifted in a discontinuous manner from a simple family system resulting from early marriage and partible inheritance to a stem family system resulting from late marriage and impartible inheritance after the Great Famine (research by Arensberg, Kimball [2001], and Connell [1950]). In the paper, she states the purpose of the paper as follows: “This chapter makes a contribution to this developing scholarship through a detailed examination of household and landholding patterns in two parishes in County Fermanagh between 1821 and 1862” [Gray,2012,153].Inthefirsthalfofthepaper,shefirstgave a clear explanation of the socioeconomic background of County Fermanagh inthefirsthalfofthenineteenthcenturybyoutlininglandholdingpatternsinthenineteenth century in light of research on marriage, household formation, and inheritance system around the Great Famine, and then made a detailed analysis of the family and the household structure in two parishes. In the latter half, she concluded as follows: “I concluded by arguing that the changes in marriage and household formation that occurred in nineteenth century Ireland might more fruitfully be understood as adaptation within a dynamic system of inheritance, than as consequences of a transformation from one system to another” [Gray, 2012, 154]. The interesting point relevant to this paper is that for the household types in County Fermanagh, it made clear that while the simple family household was more prominent in Aghalurcher Parish (82.1 percent) than in Derryvallan Parish (69.3 percent), the compound family households were higher in Derryvallan Parish (21.6 percent) than in Aghalurcher Parish (10.9 percent).

37Household Structure in early Nineteenth Century Ireland
Moreover, her study also showed that Aghalurcher Parish comprised medium farmers and landless spinners and workers and that sons, and cohabitants in farm households engaged in linen weaving. The practice of linen weaving served to diversify household income sources, and provided a family strategy to delay the departure or independence of children from their homes. The development of the extended family household was explained by this family strategy [Gray, 2012, 165-168]. On the other hand, the socioeconomic pattern predominant in Derryvallan Parish was small holder farming and these small landholding farmers adopted a strategy of having family members engage in farming and rural industrial production. Mainly the heads of small farm households engaged in weaving. They were younger than other landholders. The household structure of these small farm households had the characteristics that would lead to the formation of the simple family household, although their inheritance strategies remained ambiguous [Gray, 2012, 165-168]. Regarding the aforementioned papers by Gray, the following knowledge and viewpoint should be noted: the knowledge that while the formation of households in the early nineteenth century involved a nuclear family system as a family norm,itwassignificantlyinfluencedbyfamilyconditionsandtheviewpointthatthe change from the predominance of the nuclearfamilysysteminthefirsthalfofthe nineteenth century to the stem family system after the Great Famine was not a discontinuous, but a continuous process.
Analytical Hypothesis about the Household Structure in early Nineteenth Century
Generally, family structure is determined by the family norm and family conditions. The present chapter proposes, therefore, a hypothesis that while the nuclear family form based on the nuclear family system was dominant in the early nineteenth century, the stem family form based on the stem family system would become dominant after the mid-nineteenth century. Based on that hypothesis, the author analyzed the household structure in the early twentieth century based on the 1901 and 1911 census returns [Y. Shimizu, 2011, 2013, 2014a, 2014b and 2015].

38 Chapter 4
It has been found from previous studies that the household structure in the nineteenth century must be based on the social class and regional characteristics at the time. Cullen divided the social classes into the following categories based onthe1841census:Thefirstcategorycomprisedlandownersandfarmers holding land of 50 acres or more; the second category comprised skilled workers and farmers holding land of 5 to 50 acres; and the third category comprised workers and small farmers holding land of 5 acres or less. Based on these criteria, he divided Ireland into three regions [L. Cullen, 1972, 111]. ThefirstregionincludesLeinster and the eastern part of Ulster (i.e. excludes the western counties of Donegal and Fermanagh). In this region, the population of the first and second categories accounted for 34 percent and County Louth and County Meath occupied 32 percent. This region suffered poverty due to a decline in the linen industry. In surrounding areas other than Belfast, the linen industry declined due to the introduction of wet spinning in the late 1820s, and the domestic industry declined due to the mechanization in the linen spinning industry. The second region included the western counties of Leinster, Munster (except County Clare, southwestern Cork, and peninsular Kerry), the eastern part of County Galway, and part of County Roscommon, County Leitrim, and County Sligo.Inthisregion,thepopulationofthefirstandsecondcategoriesaccountedfor 35 percent in County Limerick, 33 percent in County Tipperary, and 28 percent in county Cork. This region, however, was poorer on the whole than the firstregion. The third region included County Donegal, County Sligo, County Leitrim, County Roscommon, County Mayo, County Galway, and County Clare. In this region, the percentage of people in the first and second categories was low 23 percent or less. Particularly in each county, a sharp contrast was found between the coastal areas where poverty prevailed and the inland areas that were relatively wealthy [L. Cullen, 1972, 111-2]. Based on the aforementioned regional classification and the remaining censuses,itcanbesaidthatCountyMeathandCountyKing’sbelongtothefirstregion while County Cavan and County Fermanagh are in the second region, and County Galway is in the third region. Coupled with regionality and the social class, the following analytical hypothesis about the household structure can be

39Household Structure in early Nineteenth Century Ireland
proposed. In County Meath and County King’s first region, the average landholding ratio was higher than in the other two regions and there were many farmers holding of 20 acres or more. These larger farmers had to employ agricultural labourers, and farm servants because they could not manage their farms with family members alone. This region, where the domestic linen industry declined relatively early, featured a mixture of people who still engaged in domestic industry in the northern part of County Meath, larger farmers employing labourer who shifted from grain farming to livestock farming and the presence of a market town, such as Kells. The examination of the family system in this region showed that large farmers tended to delay the succession of their properties to their sons, which resulted in the marriages of sons based on matchmaking and dowries in contrast to labourers who married early, even at the time of the Poor Inquiry in the 1830s [S. Yonemura 1981, 141-145]. Children who could not expect to inherit their parents’ properties found a job in the country or emigrated to America, leading to an increase in emigrants. On the other hand, labourers and farmers with small landholdings were able to get married by paying some money to priests, and therefore, marriage within their economic conditions was their family strategy. Thus, such a social context in this region facilitated the formation of the simple family households among labourers and the predominance of the extended family households and multiple family households among farmers. In the second region of County Cavan and County Fermanagh, there were many farmers with small and medium landholdings, and the partible inheritance system based on the rundale system was widely practiced. For example, each of the five Cooke brothers in Killanure Townland, Crooserlough Parish, County Cavan, held 12 acres, which demonstrated that the family farm was divided amongthefivesons.Inthisregion,small farmers and labourers were able to earn income easily from weaving (males) and spinning (females) as the domestic linen industry expanded in eastern Ulster Province. Therefore, farm management based on the early partible inheritance system, and the matching of small farming and the manufacturing of linen textiles and yarn at home were regarded as effective family strategies. Such family conditions supported the nuclear family system, leading to the predominance of the simple family households as a family form. In the third region of County Galway, landless labourers and smallholders

40 Chapter 4
were predominant. This was a poor region where people in the second, and third categories accounted for 80 percent. While small farming was the core industry, a variety of work forms existed: people who engaged in domestic manufacturing, such as hemp weaving and spinning, employed labourers who engaged in farming or road construction or port labourer, and people who engaged in fishingin the costal and peninsular areas. While partible inheritance made possible by the rundale system, existed late inheritance due to either parents’ expectation of being taken care of by their heirs in their old age or the postponement of the heir’s marriage or a married her living in the households were considered effective family strategies. Such family strategies or conditions accelerated the formation of the compound family households (the extended family households + the multiple family households). However, the compound family households form was organized not by the stem family norm, but by the nuclear family norm
Map 4.1. Position of Five Counties of this Chapter

41Household Structure in early Nineteenth Century Ireland
andwassignificantlyinfluencedbyfamilyconditionsastheearly marriage. The formation of the compound family households were positively correlated with the age of household heads due to the life cycle in the nuclear family system. In the following, the hypothesis by which the country was divided into the threeregionsisverifiedbasedonthe1821census returns.
Data Attributes
The first substantive census in Ireland was the 1821 census. The census returns of 1861, 1871, 1881 and 1891 were disposed of early on, and the census returns for 1821, 1841, and 1851 were almost completely lost when the National Archives burnt down in 1922 during the Irish Civil War currently, the census returns that still remain in the National Archives are County Cavan, County Fermanagh, County Galway, County Meath and County King’s for 1821 (Map 4.1), County Cavan for 1841, and County Antrim and a part of County Cork for 1851; the only returns that are complete are 1901 and 1911. Normally, public records in England and Ireland are not supposed to be disclosed for 100 years, but the Irish government deemed these to be historical documents of the colonial period, and disclosed the 1911 census early. The data used herein are the remaining data of the 1821 census returns. As shown in Map 4.1, it includes the five counties of County Cavan, County Fermanagh, County Galway, County King’s, and County Meath. Table 4.1 shows the data attributes by county. When the C and F items of the data are examined, County Cavan ranked at the top in terms of total population, and percentage
Table 4.1. Attribute of Data of Census Returns of Five CountiesCavan Fermanagh Galway King’s Meath
A. Total population 195,076 130,997 397,374 131,088 159,183B. Sample of census 85,791 9,930 12,188 17,124 18,840C. Percentage of B÷A 44.0 7.6 3.6 13.1 11.8 D. No of house 34,148 22,585 54,180 22,564 27,942E. Sample of household 15,076 1,699 2,128 2,115 3,363F. Percentage of E÷D 44.1 7.5 3.9 13.8 12.8 G. Percentage of sample 59.6 6.9 8.5 11.9 13.1
Note: The sample was excludes the member of institutions, for example, hospitals, schools, and churches

42 Chapter 4
of sample households (44 percent). The percentage of sample households in other counties ranged from the 3.6 level to the 13 percent level. Therefore, the possibility of data bias should be considered. As the G item shows, the percentage of samples was highest in County Cavan (60 percent) while it was lowest in County Fermanagh (6.9 percent). As Figure 4.1 shows, the 1821 census returns had seven separate columns as follows [Gilligan, P., 2013, 6].Colum 1: A Number is given to each house.Colum 2: The number of storeys in each house.Colum 3: The name of householders, male or females, name and names of those
residing in the household and their relationship to the householder. Colum 4: The age of each person listed.Colum 5: The occupation (if any) of persons.Colum 6: The number of acres each householder held.Colum 7: Other observations, if any.
Figure 4.1. A Sample of 1821 Census Returns in County Cavan
Source: National Archives Dublin
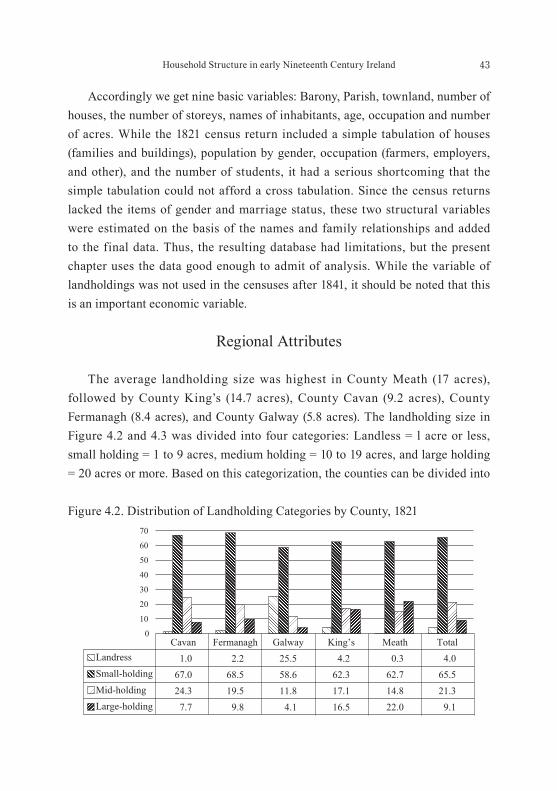
43Household Structure in early Nineteenth Century Ireland
Accordingly we get nine basic variables: Barony, Parish, townland, number of houses, the number of storeys, names of inhabitants, age, occupation and number of acres. While the 1821 census return included a simple tabulation of houses (families and buildings), population by gender, occupation (farmers, employers, and other), and the number of students, it had a serious shortcoming that the simple tabulation could not afford a cross tabulation. Since the census returns lacked the items of gender and marriage status, these two structural variables were estimated on the basis of the names and family relationships and added to the final data. Thus, the resulting database had limitations, but the present chapter uses the data good enough to admit of analysis. While the variable of landholdings was not used in the censuses after 1841, it should be noted that this is an important economic variable.
Regional Attributes
The average landholding size was highest in County Meath (17 acres), followed by County King’s (14.7 acres), County Cavan (9.2 acres), County Fermanagh (8.4 acres), and County Galway (5.8 acres). The landholding size in Figure 4.2 and 4.3 was divided into four categories: Landless = l acre or less, small holding = 1 to 9 acres, medium holding = 10 to 19 acres, and large holding = 20 acres or more. Based on this categorization, the counties can be divided into
0
10
20
30
40
50
60
70
2.268.519.59.8
25.558.611.84.1
4.262.317.116.5
0.362.714.822.0
4.065.521.39.1
Landress
Small-holding
Mid-holdingLarge-holding
Cavan Fermanagh Galway King’s Meath Total1.0
67.024.37.7
Figure 4.2. Distribution of Landholding Categories by County, 1821

44 Chapter 4
the following three regions: the region of County Cavan and County Fermanagh where small and medium holdings were predominant; the region of County King’s and County Meath where large holdings were predominant with some small holdings; and the region of Galway where landless and small holdings were predominant. Theexaminationofthedetailsofthesecountiesbasedonfigure4.3showedthat in County Meath, the number of small landholders (1 to 9 acres) was highest (63 percent), followed by large landholders (20 acres or more) (22 percent) and medium landholding farmers (10 to 19 acres) (14.8 percent). Here, it is noteworthy that farmers holding land of 50 acres or more accounted for 8.3 percent. In short, it can be said that County Meath was a county featuring large farmers. In 1830, twenty families, each holding land of 3 to 14 acres, were evicted in Lower Kells, and their houses and buildings were torn down. Their lands were leased to a large farmer (800 acres) and were converted to grass. Moreover, in the same barony, 18 to20families,includingfivesmall farmers and 5 to 14 labourers, were expelled, and their houses were torn down. Their lands were integrated into one farm, and the small tenants on the farm became labourers [Poor inquiry, Appendix (F), 97]. Thus, since the productivity of small holders was inferior to large farmers in terms of both quality and quantity, they did not enjoy the favor of their landlords. Since then, the formation of large farmers, and the shift in farming from grain to
Cavan Fermanagh Galway King’s TotalMeath
0.6
1.3
7.2
21.3
38.2
27.34.0
0.2
0.9
6.6
24.3
44.9
22.11.0
0.1
0.6
9.1
19.5
34.6
33.92.2
0.4
0.7
3.0
11.8
25.3
33.325.5
2.5
3.3
10.7
17.1
19.8
42.54.2
2.9
5.3
13.8
14.8
21.6
41.10.3
100~
50~99
20~49
10~19
5~9
1~4
0102030405060708090
100100~
50~99
20~49
10~19
5~9
1~4
~0.9
~0.9
Figure4.3. ClassificationofLandholdingsbyCountyin1821

45Household Structure in early Nineteenth Century Ireland
livestock accelerated in County Meath. In County King’s, small landholdings (1 to 9 acres) accounted for 62.3 percent, followed by medium landholdings (10 to 19 acres) (17.1 percent), and large landholdings (20 acres or more) (16.5 percent). Thus, County King’s had similar characteristics to County Meath, but large landholdings (50 acres or more) were smaller in number than County Meath (5.8 percent). According to the Poor Inquiry, the average size of landholding was 15 acres, and on the whole, the farm size was shrinking due to the partible inheritance system. However, there were also farmers who increased the size of their holdings, although they were small in number. Landlords preferred to lease their land to secure farmers than to small farmers. Consequently, small farming centering on grain farming decreased, and large farming shifted from grain farming to livestock farming [Poor inquiry, Appendix (F), 93]. In summary, landlords in County Meath and County King’s tried to streamline their land management by expelling inefficient small landholding farmers and leasing their land to large farmers. These large farmers shifted from cereal cultivation to livestock farming after the Napoleonic Wars (after 1815), which resulted from an increase in food exports due to the expansion of the food market in England [E. Hynes 1988, 164]. As the result, with respect to land holding, in response to landlords’ intentions, we should consider that the impartible inheritance in County Meath and County King’s begun to more gradually penetrate than the partible inheritance. County Cavan was a region featuring small and medium landholdings as 1 to 9-acre landholdings accounted for 70 percent, followed by 10 to 19-acre landholdings (24 percent) and landholdings of 20 acres or more (8 percent). In the barony of Loughtee located in the southeastern part of County Cavan, the average landholding size was 8 acres. The landholding size in this area decreased with population growth. It was reported that farmers could only leave small pieces of land to their heirs, and that landlords did nothing to expand the land of these farmers despite receiving higher rents per acre from them [Poor inquiry, Appendix (F), 125]. Consequently, the heirs of these farmers became cottiers. In addition, land division was practiced widely, leading to population growth. Since there was not enough land for livestock farming, livestock farmers were few in number. Therefore, small farmers were poor and engaged in growing

46 Chapter 4
potatoes and grain-leading to an increase in the production volume of potatoes and cereals. Moreover, cereal cultivation was conducted in crop rotation which included wheat, f lax, barley, oats and potatoes. [Poor inquiry, Appendix (F), 310]. Due to the very limited land for livestock farming, only a small number of sheep and young cattle were grazed [Poor inquiry, Appendix (F), 126]. Based on thesefindings,itcanbesaidthatsmallandmediumlandholdingsbasedonlanddivisionprevailedinCountyCavan.However,asinfluencedbythedevelopmentof the domestic linen industry in eastern Ulster, there were small farmers who grew f lax and sold f lax yarns, and the families whose members engaged in domestic linen manufacturing, such as the heads of households and sons as weavers, and wives, daughters and their employers as spinners. In County Cavan, the domestic linen industry and population growth were closely related due to early marriage and a high birth rate [L. A. Clarkson, 1989, 266]. As was the case with County Cavan, it can be said that County Fermanagh was a region where small and medium landholdings predominated with 1 to 9-acre landholdings accounting for a little less than 70 percent, followed by 10 to 19-acre landholdings (19.5 percent), and landholdings of 20 acres or more (10 percent).ThePoorInquiryshowedthatthefarmsizerangedfromfiveto50acresand the average farm size was 10 to 12-acres, and that the landholding size was shrinking due to the division of land to heirs, which was widely practiced among farmers. However, landlords had no intention of consolidating farmlands, and did not expel tenants as long as they paid their land rents. While the production volume of small landholder in one barony was less than that of large farmers, their expenditures were also less than those of large farmers. They were able to cover the expenditures by family labour. They consumed what they produced, although they were not better off than labourers. The land rent was two pounds per acre [Poor inquiry, Appendix (F), 129-30]. In this barony, cottiers rented cottages and small patches of land under the conacre system from landlords or tenant farmers, and grew potatoes for subsistence [Poor inquiry, Appendix (F), 33]. Thus, in County Fermanagh and County Cavan, small and medium farming based on the partible inheritance system played a core role in its economy, and smallholders and landless labourers engaged in weaving and spinning at home as a family strategy to earn their living. Compared to the other two regions, County Galway featured much smaller
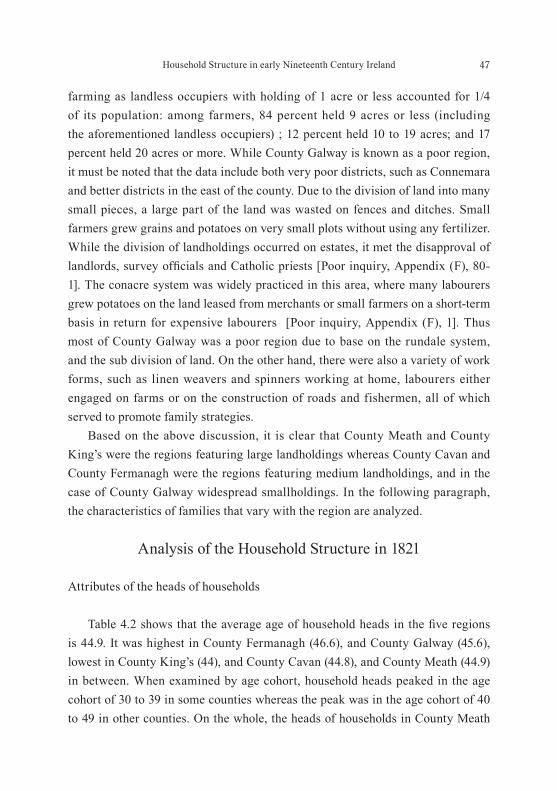
47Household Structure in early Nineteenth Century Ireland
farming as landless occupiers with holding of 1 acre or less accounted for 1/4 of its population: among farmers, 84 percent held 9 acres or less (including the aforementioned landless occupiers) ; 12 percent held 10 to 19 acres; and 17 percent held 20 acres or more. While County Galway is known as a poor region, it must be noted that the data include both very poor districts, such as Connemara and better districts in the east of the county. Due to the division of land into many small pieces, a large part of the land was wasted on fences and ditches. Small farmers grew grains and potatoes on very small plots without using any fertilizer. While the division of landholdings occurred on estates, it met the disapproval of landlords,surveyofficialsandCatholicpriests [Poor inquiry, Appendix (F), 80-1]. The conacre system was widely practiced in this area, where many labourers grew potatoes on the land leased from merchants or small farmers on a short-term basis in return for expensive labourers [Poor inquiry, Appendix (F), 1]. Thus most of County Galway was a poor region due to base on the rundale system, and the sub division of land. On the other hand, there were also a variety of work forms, such as linen weavers and spinners working at home, labourers either engaged on farms or on the construction of roads and fishermen, all of which served to promote family strategies. Based on the above discussion, it is clear that County Meath and County King’s were the regions featuring large landholdings whereas County Cavan and County Fermanagh were the regions featuring medium landholdings, and in the case of County Galway widespread smallholdings. In the following paragraph, the characteristics of families that vary with the region are analyzed.
Analysis of the Household Structure in 1821
Attributes of the heads of households
Table 4.2 shows that the average age of householdheadsinthefiveregionsis 44.9. It was highest in County Fermanagh (46.6), and County Galway (45.6), lowest in County King’s (44), and County Cavan (44.8), and County Meath (44.9) in between. When examined by age cohort, household heads peaked in the age cohort of 30 to 39 in some counties whereas the peak was in the age cohort of 40 to 49 in other counties. On the whole, the heads of households in County Meath

48 Chapter 4
and County King’s were somewhat younger than those in County Cavan, County Fermanagh, and County Galway. Table 4.2 shows the difference more clearly. Table 4.3 is the cross-tabulation of the three occupation categories of household heads (farmers, labourers, and other), their age and county. According to Table 4.3, the average age of labourers was lower than both the average age of farmers and the aforementioned average age of the household heads in each county. A clear difference was found between farmers and labourers in that while farmers were most numerous in age from 42 to 47, labourers were on ages 43 to 44. The breakdown of these two occupation categories showed that while labourers were few in number in the age cohort of 10 to 19, they accounted for around 13 percent in the age cohort of 20 to 29. On the other hand, farmers
Table 4.2. Percentage of Age Distribution of Household Heads by County, 1821Cavan Fermanagh Galway King’s Meath Total
10~19 0.3 0.4 0.2 0.1 0.3 0.3 20~29 10.3 11.6 10.9 11.8 10.6 10.7 30~39 26.3 21.8 23.3 26.9 24.3 25.5 40~49 23.6 24.2 24.9 26.1 25.2 24.3 50~59 20.9 20.4 20.4 18.6 20.4 20.5 60~69 13.8 15.0 14.2 11.9 14.4 13.8 70~79 4.0 4.7 4.7 3.6 3.4 4.0 80~ 0.9 1.9 1.5 0.9 1.3 1.1 Total 100.0 100.0 100.0 100.0 100.0 100.0
N 15,065 1,698 2,128 3,106 3,556 25,553Mean 44.8 46.6 45.6 44.0 44.9 44.9
Table 4.3. Age Distribution of Household Heads by Age Cohort, Occupation and County in 1821
20~29 30~39 40~49 50~59 60~69 70~79 80~ 90~ Total(%) N Mean
CavanFarmer 10.1 26.1 23.0 21.8 14.2 4.0 0.7 0.1 100.0 9,054 45.0 Labourer 12.9 28.2 24.6 18.9 12.2 2.8 0.4 0.0 100.0 3,171 42.9
FermanaghFarmer 10.8 21.2 23.3 22.3 16.4 4.5 1.3 0.3 100.0 1,027 47.1 Labourer 13.7 22.7 32.0 19.0 9.3 2.2 1.1 0.0 100.0 269 43.7
GalwayFarmer 10.0 23.0 25.1 20.5 15.1 4.6 1.5 0.1 100.0 1,169 46.1 Labourer 13.0 25.9 27.9 18.2 9.5 4.0 1.2 0.2 100.0 401 43.4
King’sFarmer 10.1 26.3 24.6 18.4 15.9 3.6 1.1 0.0 100.0 832 45.2 Labourer 13.9 31.2 25.0 19.3 8.1 2.2 0.2 0.0 100.0 947 41.7
MeathFarmer 7.4 18.5 23.9 25.2 18.7 4.6 1.4 0.3 100.0 658 48.2 Labourer 13.0 27.2 25.0 18.4 12.7 2.7 0.9 0.1 100.0 1,267 43.3

49Household Structure in early Nineteenth Century Ireland
accounted for 10 percent in County Fermanagh, and 7 percent in County Meath. In the age cohort of 30 to 39, the percentages of labourers increased (23 to 31 percent) whereas the percentages of farmers remained low (19 to 26 percent). This clearly indicates that labourers formed households earlier than farmers. It can be said that the aforementioned difference between labourers and farmers suggests that labourers married earlier than farmers. According to thePoorInquiry, theageoffirstmarriageamongmenwas18to25inCountyFermanagh, 20 to 25 in County Meath, 17 to 20 in King’s, and 18 to 21 in County Galway[PoorInquiry,AppendixH,1836].Thesefiguresseemtocorrespondtolabourers. In County Galway, it was relatively easy for labourers to get married as what they needed for marriage was 1.1 pounds, from which they paid 5 shillings to a priest and 10 pence to a clerk [Poor Inquiry, Appendix (D), 93]. Farmers, however, seemed to marry later than labourers, although some small farmers were able to marry early. According to the Poor Inquiry, the family strategy among labourers and servants was to marry early, whereas that among farmers heirs had to wait for inheritance of property from their parents while engaging in various types of work at home and married only after inheritance in the property. As was the case in County Cavan and County Fermanagh, people who engaged in weaving linen fabrics, and spinning yarns also had the potential for early marriage. While the partible inheritance system was widely practiced in County Cavan, County Fermanagh, and County Galway, in County Meath and King’s, children left their homes by obtaining a job or emigrating to other countries, although there were some children who waited for inheritance. Table 4.4 shows the percentage of household heads engaged in occupations with 0.3 percent or more among the 414 occupational categories [Schurer K. & M. Woollard, 2002, 46-52]. According to the table, 27 types of occupations accounted for 0.3 percent or more of 414 occupations. In County Cavan, County Fermanagh, and County Galway, farmers ranked at the top (58 percent to 65 percent), followed by labourers (12 to 21 percent), and workers in the textile industry (4 percent). It is noteworthy that fishermen accounted for 2.8 percent in Galway. On the other hand, in County King’s and County Meath, labourers ranked at the top (35 percent and 43 percent respectively), followed by farmers (32.7 percent and 23.4 percent), agricultural labourers (2.0 percent and 1.7 percent), weavers (2.2 percent and 1.9 percent) and shoemakers (2.2 percent and 1.3 percent).

50 Chapter 4
From the above, it can be said that County Cavan, County Fermanagh and County Galway had a multiple work pattern whereas County King’s and County Meath had a combined pattern of large farmers, and agricultural labourers as discussed in relation to the landholding size. In other words, these occupational differences ref lect the regional economic differences between the small and
Table 4.4. Percentage of Occupation of Household Heads by County in 1821
Code Occupation Cavan Fermanagh Galway King’s Meath33 Teacher 0.3 0.5 0.4 0.8 0.6 56 Domestic Indoor Servant 0.2 0.2 0.1 0.5 0.5 60 OtherServiceOfficeKeeper 0.0 0.4 0.0 0.0 0.1 85 Carman, Carrier, Carter, Haulier 0.1 0.3 0.2 0.4 0.4 89 Bargeman, Lighterman, Waterman 0.0 0.0 0.3 0.0 0.0
100 Farmer, Grazier 64.5 62.8 58.4 32.7 23.4 102 Farmer Bailiff 0.0 0.1 0.1 0.7 0.6 103 Agricultural Labourer 0.5 1.2 1.7 2.0 1.7 104 Sheperd 0.1 0.0 1.2 0.0 0.0 112 Gardener (not domestic) 0.1 0.1 0.4 0.7 0.6 121 Fisherman 0.0 0.0 2.8 0.0 0.0 168 Carpenter, Joiner 0.5 0.6 0.7 1.5 1.9 170 Mason 0.3 0.6 0.4 1.0 1.0 171 Slater, Tiler 0.0 0.0 0.1 0.3 0.2 197 Saddler, Harness, Whip Maker 0.0 0.1 0.0 0.3 0.2 214 Innkeeper, Hotel Keeper, Publican 0.1 0.1 0.1 1.7 0.4 225 Bucher, Meat Salesman 0.1 0.2 0.3 1.2 0.9 269 Weaver 1.5 4.0 3.1 2.2 1.9 271 Factory Hand Textile 3.3 0.0 0.6 0.2 0.0 280 Hatter, Hat Manufacture 0.1 0.1 0.1 0.3 0.1 282 Tailor 0.8 1.0 1.0 1.6 1.4 290 Shoe, Boot-Maker, Dealer 0.6 0.7 0.7 2.2 1.3 325 Cooper, Hoop Maker, Bender 0.2 0.2 0.3 0.4 0.5 377 Blacksmith 0.4 0.4 0.8 1.1 1.3 399 General Shopkeeper, Dealer 0.3 0.0 0.2 1.6 1.2 404 General Labourer 20.9 12.3 17.8 34.6 42.6 406 Artizan, Mechanic 0.2 0.2 0.2 0.6 0.4
Total 95.1 86.1 92.0 88.6 83.2 N 14,051 1,637 1,911 2,539 2,822
Note: over 0.3% of total occupation

51Household Structure in early Nineteenth Century Ireland
middle farmer’s areas as the counties of County Cavan, County Fermanagh and County Galway and the large farmer’s areas as County King’s and County Meath.
Size of household
According to Table 4.5 showing the size of households, the average household size was high among County Cavan (5.66 persons), County Fermanagh (5.8 persons), and County Galway (5.67 persons), and low in County King’s (5.44 persons), and County Meath (5.24 persons). While the number of household members was five across all counties, the percentage of five persons or more was 65.8 percent in County Cavan, 66.3 percent in County Fermanagh, and 67.3 percent in Galway, whereas it was 60.9 percent in King’s and 58.6 percent in County Meath. Thus, the size of households can be divided into two groups with fiveastheborderlinenumber.Inshort,therewasadistinctivecharacteristicthatwhilethereweremanyhouseholdswithfivemembersormoreinCountyCavan,County FermanaghandCountyGalway, thereweremanyhouseholdswithfivemembers less in County King’s and County Meath. This difference in the size of households was also found in the size of families: while the average size of family was 5.13 persons in Cavan, 5.0 persons in Fermanagh, and 5.23 persons in
Table 4.5. Percentage of Household Size in Percentages of Total Household Heads by County in 1821
Person Cavan Fermanagh Galway King’s Meath Total1 1.6 1.9 1.7 2.6 2.9 1.9 2 6.6 6.1 6.2 8.3 9.3 7.1 3 11.4 11.7 10.3 13.3 13.6 11.9 4 14.7 14.0 14.5 14.9 15.5 14.8 5 16.0 14.2 17.0 14.9 16.5 15.9 6 15.0 13.9 15.8 14.3 14.5 14.9 7 13.0 12.3 12.6 12.1 10.5 12.5 8 8.5 10.8 9.9 7.2 7.4 8.5 9 6.3 7.9 5.9 5.5 3.6 5.9 10 3.6 3.6 2.8 3.0 2.8 3.3
11~ 3.4 3.6 3.3 3.9 3.3 3.4 Total 100.0 100.0 100.0 100.0 100.0 100.0
N 15,076 1,698 2,128 3,115 3,563 25,580Mean 5.66 5.80 5.67 5.44 5.24 5.58

52 Chapter 4
Table 4.7. Average Size of Households by Age Cohort of Household Head and by County in 1821
Cavan Fermanagh Galway King’s Meath Total~24 3.88 3.75 3.57 3.36 3.58 3.73
25~34 4.82 5.09 4.85 4.92 4.74 4.84 35~44 6.06 6.48 5.97 6.08 5.66 6.03 45~54 6.49 6.61 6.26 5.92 5.84 6.32 54~64 5.80 5.83 6.09 5.42 5.20 5.70
65~ 5.19 5.04 5.58 5.03 5.02 5.17 Total 5.69 5.85 5.73 5.50 5.29 5.63
Table 4.8. Average Size of Household by Category of Landholding and by County in 1821
Micro-holdings Small-holding Mid-holding Large-holding TotalCavan 5.44 5.80 7.01 8.45 6.30
Fermanagh 4.83 6.14 7.35 7.18 6.55 Galway 6.16 5.88 6.94 8.74 6.19 King’s 5.50 6.01 6.76 8.15 6.46 Meath 6.00 5.57 7.28 7.89 6.54 Total 5.91 5.85 7.02 8.43 6.33
Table 4.6. Percentage of Size of Household Heads by Occupation in 1821Farmer Labourer Other Total
1 0.7 1.3 4.9 3.2 2 3.2 8.6 13.1 10.1 3 7.9 15.2 16.4 14.4 4 11.9 18.7 16.7 16.3 5 14.9 19.4 14.7 16.0 6 16.6 14.9 11.6 14.3 7 15.1 10.8 9.0 10.6 8 11.4 5.4 5.7 7.0 9 8.4 3.1 3.6 4.5 10 5.0 1.7 1.8 2.1
11~ 5.1 1.0 2.5 1.5 Total 100.0 100.0 100.0 100.0
N 12,745 6,056 6,781 25,582Mean 6.3 5.0 4.8 5.1

53Household Structure in early Nineteenth Century Ireland
County Galway, it was 4.95 persons in King’s and 5.07 persons in County Meath. Thesefigurescorrespondedtothesize of households. Table 4.6 shows the size of households by occupation. The average size of households among farmers was 6.3 persons while it was 5.0 persons among labourers and 4.8 persons in other. A distinct difference was found between farmers and labourers: that is, the average size of households among farmers (6 or more) was greater than that among labourers. This result clearly indicates that the farmer households were large in size and the labourer households were small in size. Table 4.7 shows the average size of households by age of household heads. The size of households started increasing from the age cohort of 25 to 34, reached its peak in the agecohortof45to54,andstarteddecreasingafterthatinallfivecounties. This verified that Carney’s hypothesis was attributable to family life cycles [F. J. Carney, 1980, 162]. Based on this result, it can be said that while there was a clear contrast between the household structure of farmers, and that of labourers, both household structures included nuclear family life cycles. Table 4.8 shows the average size of households by county and by landholding category. In each county, the four landholding categories, and the household size were correlated positively. In other words, this result shows that the size of households increased as the size of landholdings increased from micro and small landholdings to medium and large landholdings. It clearly indicates that the family size and the labour force were required to have levels adequate to each landholding size. In other word, in each counties, the greater the landholding size, it is possible to recognize the features that the average household size is also increased. The landholding size have shown that determine the labour scale and household size. Since the size of households seems to be related to the number of children, the number of children is reviewed below:
Number of children
Table 4.9 shows the number of children by county. The average number of children was highest in County Cavan (3.59), followed by County King’s (3.5), County Fermanagh (3.45), County Galway (3.37), and County Meath (3.24). The

54 Chapter 4
households with three children or less accounted for 54 percent to 60 percent in each county, and there was no big difference among counties although the number of households with three children or less was highest in County Meath. However, County Cavan and County Fermanagh were higher than other counties in the categories of six children or more. When the average number of children was examined by occupation, it was higher among farmers (3.9) than labourers (3.1), suggesting that poor labourers had their children start working earlier. Table 4.10 shows the distribution of children by age. While there were more children aged 14 or younger in King’s and County Meath than in County Cavan, County Fermanagh and County Galway, the situation reverses in the age cohort of 15 to 24. For the number of children by gender, while the male-to-female ratio
Table 4.9. Percentage of Children by Household and by County in 1821Cavan Fermanagh Galway King’s Meath
1 16.1 18.8 15.8 16.2 18.6 2 19.2 20.3 22.5 20.5 21.2 3 18.2 15.7 18.6 19.1 20.5 4 15.8 16.8 17.4 15.6 17.2 5 12.8 11.0 12.6 12.6 10.1 6 8.6 9.3 7.3 7.6 6.6 7 5.2 4.8 3.5 4.5 3.3 8 2.5 2.4 1.8 2.2 1.8 9 1.1 0.6 0.2 1.2 0.3
10~ 0.5 0.2 0.3 0.6 0.2 Total 100.0 100.0 100.0 100.0 100.0
N 12,961 1,432 1,796 2,508 2,881Mean 3.59 3.45 3.37 3.50 3.24
Table 4.10. Percentage of Children by Age Cohort and by County in 1821 Cavan Fermanagh Galway King’s Meath
Male Female Male Female Male Female Male Female Male Female0~14 65.7 69.2 63.3 63.9 63.6 67.7 69.2 70.3 69.9 69.0 15~24 27.1 26.6 28.1 27.9 25.8 26.1 23.8 25.5 24.9 25.2 25~34 6.5 3.6 7.5 6.8 9.1 5.1 6.4 3.6 7.1 4.9
35~ 0.8 0.5 1.2 1.4 1.6 1.1 0.5 0.6 1.1 0.9 Total 100.0 100.0 100.0 100.0 100.0 100.0 100.0 100.0 100.0 100.0
N 23,771 22,171 2,496 2,397 3,157 2,739 4,465 4,255 4,816 4,405Mean 11.8 10.9 12.2 12.1 12.4 11.3 11.2 10.6 11.6 11.2
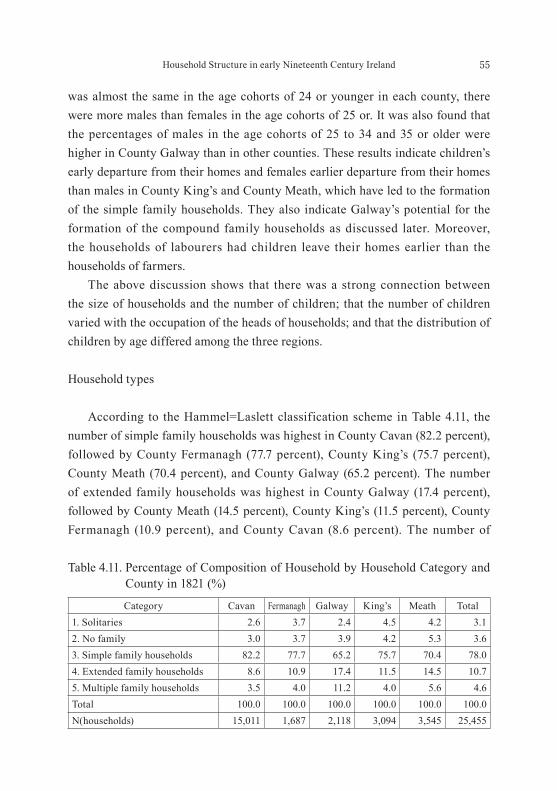
55Household Structure in early Nineteenth Century Ireland
was almost the same in the age cohorts of 24 or younger in each county, there were more males than females in the age cohorts of 25 or. It was also found that the percentages of males in the age cohorts of 25 to 34 and 35 or older were higher in County Galway than in other counties. These results indicate children’s early departure from their homes and females earlier departure from their homes than males in County King’s and County Meath, which have led to the formation of the simple family households. They also indicate Galway’s potential for the formation of the compound family households as discussed later. Moreover, the households of labourers had children leave their homes earlier than the households of farmers. The above discussion shows that there was a strong connection between the size of households and the number of children; that the number of children varied with the occupation of the heads of households; and that the distribution of children by age differed among the three regions.
Household types
According to the Hammel=Laslett classification scheme in Table 4.11, the number of simple family households was highest in County Cavan (82.2 percent), followed by County Fermanagh (77.7 percent), County King’s (75.7 percent), County Meath (70.4 percent), and County Galway (65.2 percent). The number of extended family households was highest in County Galway (17.4 percent), followed by County Meath (14.5 percent), County King’s (11.5 percent), County Fermanagh (10.9 percent), and County Cavan (8.6 percent). The number of
Table 4.11. Percentage of Composition of Household by Household Category and County in 1821 (%)
Category Cavan Fermanagh Galway King’s Meath Total1. Solitaries 2.6 3.7 2.4 4.5 4.2 3.1 2. No family 3.0 3.7 3.9 4.2 5.3 3.6 3. Simple family households 82.2 77.7 65.2 75.7 70.4 78.0 4. Extended family households 8.6 10.9 17.4 11.5 14.5 10.7 5. Multiple family households 3.5 4.0 11.2 4.0 5.6 4.6 Total 100.0 100.0 100.0 100.0 100.0 100.0 N(households) 15,011 1,687 2,118 3,094 3,545 25,455

56 Chapter 4
multiple family households was outstandingly high in County Galway (11.2 percent) whereas it accounted for 4 to 5 percent in other counties. In other words, simple family households were more predominant in County Cavan and County Fermanagh than in other counties, whereas the percentage of compound family households (extended family households + multiple family households) was outstandingly high in County Galway and relatively high in County Meath and County King’s. Next, household types were examined by class according to Table 4.12. While most simple family households take the form of nuclear families, there were also widowers with children (3c), and widows with children (3d), which resulted from the deaths of their spouses. In County Galway where the percentage of extended family households was highest, while vertically extended family households (4a and 4b) accounted for 9.5 percent, there were also laterally extended family households (4c, 6.5 percent). This indicated that within extended family households (4a + 4b) accounted for 55 percent and (4c) 37 percent, demonstrating
Table 4.12. Percentage of Composition of Household by Category, Class and County in 1821
Category Class Cavan Fermanagh Galway King’s Meath Total
1. Solitaries1a Widow 2.6 3.6 2.4 4.5 4.1 3.1 1b Single 0.0 0.1 0.0 0.0 0.0 0.0
2. No family2a Coresidence siblings 2.2 2.5 3.4 2.9 4.0 2.7 2b Coresidence kins 0.7 1.2 0.4 1.2 1.4 0.8 2c Persons not related 0.1 0.0 0.0 0.2 0.0 0.1
3. Simple family households
3a Married couple 5.5 5.2 4.3 6.7 5.1 5.5 3b Married couple with children 61.6 56.3 47.1 55.7 48.8 57.6 3c Widowers with children 5.5 6.2 5.3 4.2 5.5 5.4 3d Widows with children 9.6 10.0 8.4 9.0 11.1 9.7
4. Extended family households
4a Extended upwards 3.3 3.3 4.9 3.9 4.1 3.6 4b Extended downwards 2.1 3.0 4.6 3.4 4.3 2.8 4c Extended laterally 3.0 4.3 6.5 3.9 5.8 3.9 4d Combinations of 4a-4c 0.2 0.4 1.4 0.4 0.3 0.4
5. Multiple family households
5a Secondary units upwards 1.6 1.4 3.8 1.8 2.8 2.0 5b Secondary units downwards 1.8 2.2 6.5 1.9 2.4 2.3 5c Secondary units lateral 0.1 0.5 0.8 0.3 0.4 0.3 5d Frdreches 0.0 0.0 0.0 0.0 0.0 0.0 5e Other multiple family households 0.0 0.0 0.0 0.0 0.0 0.0
Total 100.0 100.0 100.0 100.0 100.0 100.0 N 15,011 1,687 2,118 3,094 3,544 25,454
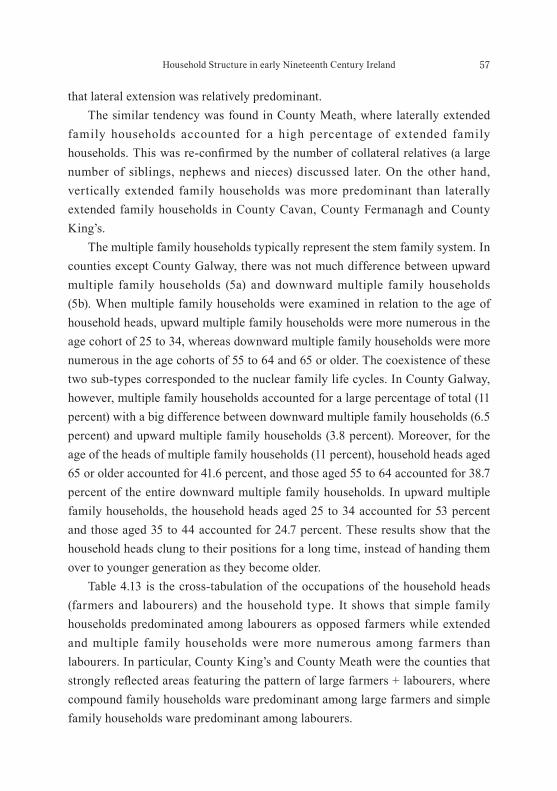
57Household Structure in early Nineteenth Century Ireland
that lateral extension was relatively predominant. The similar tendency was found in County Meath, where laterally extended family households accounted for a high percentage of extended family households.Thiswasre-confirmedbythenumber of collateral relatives (a large number of siblings, nephews and nieces) discussed later. On the other hand, vertically extended family households was more predominant than laterally extended family households in County Cavan, County Fermanagh and County King’s. The multiple family households typically represent the stem family system. In counties except County Galway, there was not much difference between upward multiple family households (5a) and downward multiple family households (5b). When multiple family households were examined in relation to the age of household heads, upward multiple family households were more numerous in the age cohort of 25 to 34, whereas downward multiple family households were more numerous in the age cohorts of 55 to 64 and 65 or older. The coexistence of these two sub-types corresponded to the nuclear family life cycles. In County Galway, however, multiple family households accounted for a large percentage of total (11 percent) with a big difference between downward multiple family households (6.5 percent) and upward multiple family households (3.8 percent). Moreover, for the age of the heads of multiple family households (11 percent), household heads aged 65 or older accounted for 41.6 percent, and those aged 55 to 64 accounted for 38.7 percent of the entire downward multiple family households. In upward multiple family households, the household heads aged 25 to 34 accounted for 53 percent and those aged 35 to 44 accounted for 24.7 percent. These results show that the household heads clung to their positions for a long time, instead of handing them over to younger generation as they become older. Table 4.13 is the cross-tabulation of the occupations of the household heads (farmers and labourers) and the household type. It shows that simple family households predominated among labourers as opposed farmers while extended and multiple family households were more numerous among farmers than labourers. In particular, County King’s and County Meath were the counties that stronglyreflectedareasfeaturingthepatternoflarge farmers + labourers, where compound family households ware predominant among large farmers and simple family households ware predominant among labourers.
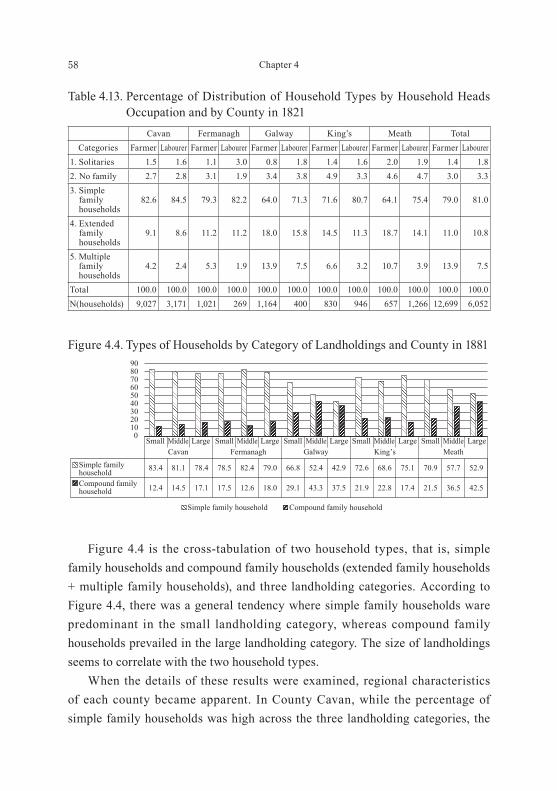
58 Chapter 4
Figure 4.4 is the cross-tabulation of two household types, that is, simple family households and compound family households (extended family households + multiple family households), and three landholding categories. According to Figure 4.4, there was a general tendency where simple family households ware predominant in the small landholding category, whereas compound family households prevailed in the large landholding category. The size of landholdings seems to correlate with the two household types. When the details of these results were examined, regional characteristics of each county became apparent. In County Cavan, while the percentage of simple family households was high across the three landholding categories, the
Table 4.13. Percentage of Distribution of Household Types by Household Heads Occupation and by County in 1821
Cavan Fermanagh Galway King’s Meath TotalCategories Farmer Labourer Farmer Labourer Farmer Labourer Farmer Labourer Farmer Labourer Farmer Labourer
1. Solitaries 1.5 1.6 1.1 3.0 0.8 1.8 1.4 1.6 2.0 1.9 1.4 1.8 2. No family 2.7 2.8 3.1 1.9 3.4 3.8 4.9 3.3 4.6 4.7 3.0 3.3 3. Simple
family households
82.6 84.5 79.3 82.2 64.0 71.3 71.6 80.7 64.1 75.4 79.0 81.0
4. Extended family households
9.1 8.6 11.2 11.2 18.0 15.8 14.5 11.3 18.7 14.1 11.0 10.8
5. Multiple family households
4.2 2.4 5.3 1.9 13.9 7.5 6.6 3.2 10.7 3.9 13.9 7.5
Total 100.0 100.0 100.0 100.0 100.0 100.0 100.0 100.0 100.0 100.0 100.0 100.0 N(households) 9,027 3,171 1,021 269 1,164 400 830 946 657 1,266 12,699 6,052
LargeMeath
Simple familyhouseholdCompound familyhousehold
0102030405060708090
Simple family household Compound family household
Small Middle LargeSmall Middle Large Small Middle Large Small Middle Large Small MiddleCavan Fermanagh Galway King’s
83.4 81.1 78.4 78.5 82.4 79.0 66.8 52.4 42.9 72.6 68.6 75.1 70.9 52.957.7
12.4 14.5 17.1 17.5 12.6 18.0 29.1 43.3 37.5 21.9 22.8 17.4 21.5 42.536.5
Figure 4.4. Types of Households by Category of Landholdings and County in 1881
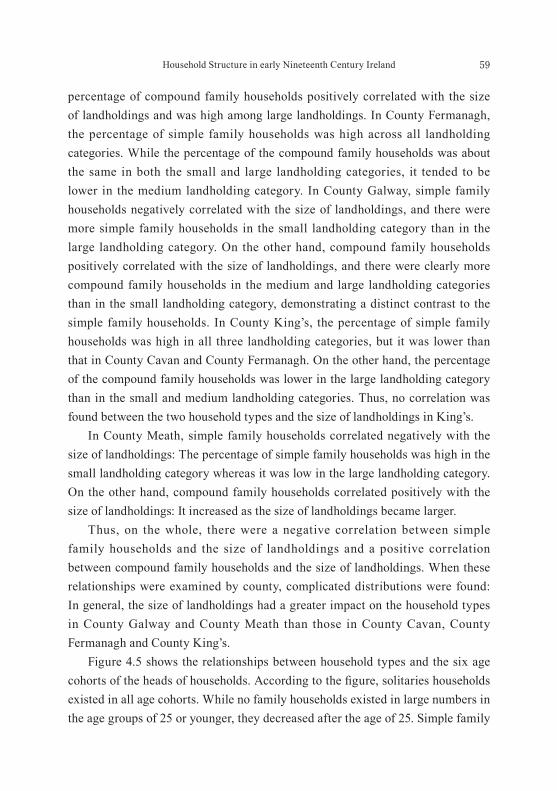
59Household Structure in early Nineteenth Century Ireland
percentage of compound family households positively correlated with the size of landholdings and was high among large landholdings. In County Fermanagh, the percentage of simple family households was high across all landholding categories. While the percentage of the compound family households was about the same in both the small and large landholding categories, it tended to be lower in the medium landholding category. In County Galway, simple family households negatively correlated with the size of landholdings, and there were more simple family households in the small landholding category than in the large landholding category. On the other hand, compound family households positively correlated with the size of landholdings, and there were clearly more compound family households in the medium and large landholding categories than in the small landholding category, demonstrating a distinct contrast to the simple family households. In County King’s, the percentage of simple family households was high in all three landholding categories, but it was lower than that in County Cavan and County Fermanagh. On the other hand, the percentage of the compound family households was lower in the large landholding category than in the small and medium landholding categories. Thus, no correlation was found between the two household types and the size of landholdings in King’s. In County Meath, simple family households correlated negatively with the size of landholdings: The percentage of simple family households was high in the small landholding category whereas it was low in the large landholding category. On the other hand, compound family households correlated positively with the size of landholdings: It increased as the size of landholdings became larger. Thus, on the whole, there were a negative correlation between simple family households and the size of landholdings and a positive correlation between compound family households and the size of landholdings. When these relationships were examined by county, complicated distributions were found: In general, the size of landholdings had a greater impact on the household types in County Galway and County Meath than those in County Cavan, County Fermanagh and County King’s. Figure 4.5 shows the relationships between household types and the six age cohortsoftheheadsofhouseholds.Accordingtothefigure,solitaries households existed in all age cohorts. While no family households existed in large numbers in the age groups of 25 or younger, they decreased after the age of 25. Simple family
60 Chapter 4
households started to increase at the age of 25, reached its peak at the age cohort of 45 to 54 and slightly decreased afterwards. Extended family households existed in large numbers at the age cohort of 25 to 34, and continued to exist afterwards while slightly decreasing, which indicated that extended family households ware differentiated into the upward and downward ends. Multiple family households existed in large numbers up to the age 35, decreased until the age of 54 along with an increase in the number of simple family households, and increased again after the age of 55, which indicated that multiple family households ware differentiated into the upward and downward ends. Below is the detailed examination of such dynamics in relation to the age of the heads of households in County Cavan (Figure 4.6), County Galway (Figure 4.7), and County Meath (Figure 4.8). The dynamics of County Cavan were represented by the large number of simple family households. The dynamics of County Galway were represented by the facts that compound family households were numerous up to the household heads from 45 to 54 years old whereas simple family households increased afterwards, and that compound family households increased again after the heads of households reached 55. The dynamics of County Meath were represented by the fact that compound family households decreased when household heads were between 45 and 54 and increased again afterwards. In short, these dynamics had
0%
10%
20%
30%
40%
50%
60%
70%
80%
90%
100%
~24 25~34 35~44 45~54 55~64 65~
5. Multiple family households
4. Extended family households
3. Simple family households
2. No family
1. Solitaries
Figure 4.5. Household Category by Age Cohort of Household Head (Ireland, 1821)

61Household Structure in early Nineteenth Century Ireland
two stages that branched off at the age cohort of 45 to 54. From the above analysis of household types, it can be said that on the whole, simple family households ware predominated. Compound family households also existed across the three counties, although their distributions varied from county
0%
10%
20%
30%
40%
50%
60%
70%
80%
90%
100%
~24 25~34 35~44 45~54 55~64 65~
5. Multiple family households
4. Extended family households
3. Simple family households
2. No family
1. Solitaries
Figure 4.6. Household Category by Age Cohort of Household Head (County Cavan, 1821)
0%
10%
20%
30%
40%
50%
60%
70%
80%
90%
100%
~24 25~34 35~44 45~54 55~64 65~
5. Multiple family households
4. Extended family households
3. Simple family households
2. No family
1. Solitaries
Figure 4.7. Households Category by Age Cohort of Household Head (County Galway, 1821)

62 Chapter 4
to county in the rage of 12 to 28 percent. However, compound family households should be understood as one stage in the life cycle of the nuclear family system.
Number of kin members
ThefiguresinTable 4.14 show the relationships between co-resident kin and
Table 4.14. Number of Resident Relatives and Others per 100 Households by County in 1821
Cavan Fermanagh Galway King’s MeathParents 4.1 4.2 6.1 5.3 6.3Parents in law 1.2 1.1 3.1 1.2 1.5Sibling 10.6 10.3 20.1 12.0 17.3Siblings in law 1.1 2.3 4.6 1.9 3.3Chidren in law 2.0 2.5 6.9 2.0 2.6Nephews and Nieces 3.7 5.5 7.7 7.0 10.4Grandchildren 8.3 13.7 17.9 10.7 9.8Other relatives 0.6 1.1 4.3 1.0 1.3Total kin 31.4 40.7 70.7 41.1 52.5Servants 36.9 40.8 27.1 29.3 31.2Lodgers 15.9 41.3 19.3 23.7 17.9Visitors 0.7 1.5 1.8 0.8 0.1
0%
10%
20%
30%
40%
50%
60%
70%
80%
90%
100%
~24 25~34 35~44 45~54 55~64 65~
5. Multiple family households
4. Extended family households
3. Simple family households
2. No family
1. Solitaries
Figure 4.8. Household Category by Age Cohort of Household Head (County Meath, 1821)

63Household Structure in early Nineteenth Century Ireland
the heads of households and the size of kinship per 100 households, which were computed based on the method proposed by R. Wall in 1983. The total number of kin members was highest in County Galway (70.7 persons), followed by County Meath (52.5 persons), County King’s (41.1 persons), County Fermanagh (40.7 persons), and County Cavan (31.4 persons). It was low in County Cavan and County Fermanagh where the simple family households were predominant and high in County Galway and County Meath where the compound family households were predominant. The close examination of kinship showed the following: In County Galway, siblings were largest in number (20.1), followed by grandchildren (17.9), children-in-law (6.9), and parents and parents-in-law (9.2). While these kin members constituted the core of the households, they seem to be members of the stem family, which supports the fact that the compound family households existed in large numbers particularly in County Galway. In County Cavan where the total number of kin members was smallest, siblings (10.6) and grandchildren (8.3) accounted for 60 percent, which seems to be linked to the emergence of the simple family households. County Fermanagh and King’s seem to have the same characteristics as County Cavan, except that the number of siblings and of grandchildren was higher than in County Cavan. County Meath falls between County Galway and County Cavan, and features the large number of collateral relatives, such as siblings, nephews and nieces. It should be noted that servants (40.8) and lodgers (41.8) were exceptionally numerous in County Fermanagh. It can be said that this was due to the large number of people who engaged in linen domestic manufacturing as weavers and spinners and lodgers who also worked as spinners.
Life Course
As discussion below, It reveals the life course in household cohort analysis. Generallyacohortisdefinedbytheyearofbirthofhousehold head, but in this chapteracohortisdefinedbyafive-yearbirthinterval.Inthiswayweunderstandthe cohort, when an age cohort of household heads shifts to the next age cohort, a household cohort analysis is the way to see what kind of change a household members. Figure 4.9 shows the overall household head’s life course of five counties.

64 Chapter 4
Children left their homes early (before 15 years of age) as servants or employed labourers. While some siblings continued to stay at home until around 30, it seems highly likely that many of them were already married. While household heads made their appearance as an age cohort in the late 20s, they were most numerous age cohort of the 50s to 60s. Their spouses, in response to the heads, appeared in their early 20s and reached their peak in their 30s to 40s. Parents started appearing at around the peak of the heads of households and continued increasing afterward, suggesting that a change in the head of the household took place early in 1821. Abundance percentage of the parents means that they were quickly households substitution children, as the resulting, it would form a simple family households, but there means the family formation based on the nuclear family system. Servants appeared in their teens, reached their peak when they were 20 to 24, and decreased afterward, which can be understood as the characteristics of life-cycle servants limited to young households. That is to say, the life-cycle servant referred to here is, according to Laslett, that the young teens leaved the parental home to work in another family and worked for living [P. Laslett, 1965, 4]. Below is the examination of regionality of County Cavan, County Galway and County Meath as opposed to the aforementioned overall tendencies. County
Parents
Kin
Servants
Others
Sibling
Children
Spouse
Head0%
10%
20%
30%
40%
50%
60%
70%
80%
90%
100%
0~4 5~910~14
15~1920~24
25~2930~34
35~3940~44
45~4950~54
55~5960~64
65~6970+
Figure 4.9. Age Cohort of Household Heads and Household Relationships in Ireland (1821)

65Household Structure in early Nineteenth Century Ireland
Cavan (Figure 4.10) had the aforementioned unique characteristics, and the same overall characteristics. As discussed in the previous section on the number of kin members, in County Galway (Figure 4.11), parents were numerous in age cohorts of household heads in their in their late 50s, but It indicates the
Parents
Kin
Servants
Others
Sibling
Children
Spouse
Head0%
10%
20%
30%
40%
50%
60%
70%
80%
90%
100%
0~4 5~910~14
15~1920~24
25~2930~34
35~3940~44
45~4950~54
55~5960~64
65~6970+
Figure 4.10. Age Cohort of Household Heads and Household Relationships in County Cavan (1821)
Parents
Kin
Servants
Others
Sibling
Children
Spouse
Head0%
10%
20%
30%
40%
50%
60%
70%
80%
90%
100%
0~4 5~910~14
15~1920~24
25~2930~34
35~3940~44
45~4950~54
55~5960~64
65~6970+
Figure 4.11. Age Cohort of Household Heads and Household Relationships in County Galway (1821)

66 Chapter 4
parent has expanded over the 70-year-old from the second half of 50-year-old distribution. Wherever the combination of this parent’s distribution with the large number of extended family households and multiple family households was the characteristics of Galway (Figure 4.11). While County Meath (Figure 4.12) had the life course similar to that of County Galway, it showed characteristic awkward distributions after the age of 65, which resulted from the continuous distributions of kin (siblings, nephews, and nieces), servants and other. Table 4.15 shows the average age of household members by county. According to the table, the average age of the heads of households was 44 to 47; that of spouses was 39 to 40, that of children was 12; that of parents was 64 to 69; and
Parents
Kin
Servants
Others
Sibling
Children
Spouse
Head0%
10%
20%
30%
40%
50%
60%
70%
80%
90%
100%
0~4 5~910~14
15~1920~24
25~2930~34
35~3940~44
45~4950~54
55~5960~64
65~6970+
Figure 4.12. Age Cohort of Household Heads and Household Relationships in County Meath (1821)
Table 4.15. Average Age of Member of Households by County in 1821
Cavan Fermanagh Galway King’s Meath TotalHousehold Head 44.7 46.6 45.6 44.0 44.9 44.9 Spouse 38.7 40.3 38.7 37.7 39.0 38.7 Children 11.5 12.3 12.2 11.0 11.6 11.6 Parents 65.3 68.5 66.0 66.8 63.5 65.4 Kin 17.5 19.3 18.5 18.6 20.5 18.5 Servant 20.5 23.5 23.8 24.3 23.1 21.7 Other 28.5 28.8 30.5 29.8 32.0 29.4

67Household Structure in early Nineteenth Century Ireland
that of servants were 21 to 24. It can be said that these results clearly represent a household life cycle and correspond to a family life course.
Conclusion
In this present chapter County Meath and County King’s are put forward as the first of three regions identified at an earlier stage, County Cavan and County Fermanagh as the second region and Galway as the third region. The chapter has also sought to verify an hypothesis based on the 1821 census returns. The analytical framework used was that of families in early nineteenth century Ireland, where the nuclear family based on the nuclear family system was predominant. In reality, however, the stem family must also have existed. Such stem families, it has been assumed, were supported by family conditions, and their presence reflected a life cycle with the early marriage in the nuclear family system. Moreover, it was also assumed that the differences among family conditions arose from regionality and occupational differences (farmers and labourers). Below are the analysis results based on the 1821 census: In County Meath and County King’s, in the more utilitarian management approach of landlords, large farmers gradually changed their farming from grain to livestock. Since the partible inheritance system was not practiced, children other than heirs left their homes or emigrated early after obtaining the share to which they were entitled of their parents’ property in immovable or movables. They worked as artisans (carpenters, masons, or coopers) in surrounding cities or stores or emigrated to other countries. On the other hand, heirs stayed at home working on the farm in anticipation of inheriting the farm at which stage they someone arranged by their parents [S. J. Connolly, 1985, 80]. On the other hand, labourers worked on large farms or obtained other jobs. Consequently, labourers were able to get married as soon as they earned a certain amount of income. In other words, it is unknown whether the marriage of the worker will get wealth in the future, but they judged to be based on the calculating strategy that it is said so that there is well-being life than a single person for them by the marriage. However, marriage was not what symbolized their future prospects, but rather their immediate family strategy. A predominance of compound family households among large landholding farmers and of simple family households
68 Chapter 4
among labourersreflectedthefamilystrategiesbehindeachhouseholdtype. In County Cavan and County Fermanagh, small and medium landholding were predominant due to the division of land based on the rundale system. While farmers could make a living by farming if they had land of medium size or greater, small farmers needed the support of both farming and manufacturing linen yarn and textiles at home. In other words, they adopted the family strategy of manufacturing linen as weavers and spinners. This family strategy among small landholding farmers included early marriage based on the land subdivision, leading to the predominance of the simple family household. In County Galway, the partible inheritance system was predominant. However, since farmers held only small pieces of land, they were not able to make a living from farming alone and had to engage in the manufacturing of linen textiles and yarns or in fishing, or else to engage of work as labourers in agriculture or in road construction. The family strategy of householders in this poor region was to retain children at home so that the children would take care of them in their old age. This accounts for an unexpectedly large number of compound family households. In other word, although compound family households in Galway were dominants, but it was not mean it that type was based on a direct stem family norms, also we should understand it was one phase of the life cycle on based by the nuclear family norms. The household structure in the early twentieth century, it has been argued, was controlled by regionality, which was in essence based on economic differences in agriculture and the occupation categories of farmers and labourers. On the whole, simple family households were predominant among small and medium landholder due to the ready division of land, whereas compound family households were predominant among larger farmers. Labourers formed simple family households, which to be based the nuclear family system, through early marriage. These structures, however, there remained the possibility of these households taking the form not of nuclear family, but of the stem family depending on family situational conditions. Therefore, the structure of compound family households, which were formed in County Galway where small landholdings prevailed may have begun in the nuclear family system. In County Meath, a region featuring large farmers, the conditions to shift to the stem family system already existed in the mid-nineteenth century. Such an

69Household Structure in early Nineteenth Century Ireland
understanding admitted of change as a smooth transition from the nuclear family system to the stem family system.

Chapter 5Regional Variations in Household Structure
in early Twentieth Century Ireland
Introduction
It was examined the structure of the Irish family in the early nineteenth century in the previous chapter. In this chapter, it is a challenge is to clarify the overall features of the Irish rural family in the early twentieth century with 100 percentcensusdataof1901and1911.Inparticular, itverifiedbyGIS map that has been created by the census data. Incidentally, let’s first look at the Europe of the family type of Map 5.1 by E. Todd. E. Todd defined the extended family in his L’Invention De L’Europe as follows: Extended families with several generations living under one roof. One child – generally, but not always, the eldest – marries and has children that remain in the household in order to preserve the lineage. The rest have the choice of remaining unmarried within the household or of marrying, and leaving the home or becoming soldiers or priests. The house and the land are inherited by the son who stays at home. Others may receive some financial compensation. The inheriting son, who stays at home, remains under the formal authority of the father [E. Todd, 1990: 38] The map 5.1 created by Todd shows that families in Ireland constituted stem families. While stem families existed across Ireland, there were also some regional differences. Since some regional variation was found in the formation of the stem family in eastern and western Ireland during the period from the latter half of the nineteenth century to the early twentieth century, Todd’s map needs to be revised. In the following paragraphs, we first examine Family and Community in Ireland by Arensberg and Kimball, which presented the stem family system in Irishruralcommunitiesforthefirsttimeinthe1930s,thenproposeahypothesisof regional variation in the stem family system based on the examination results, and verify the hypothesis by using census data. While the author conducted research on the Irish family based on the census data by county [Y. Shimizu,

72 Chapter 5
2011, 2012, 2014a, 2014b], we used the census returns of Ireland this time. This is theirfirstIrishfamilyresearchattemptbasedonananalysisof100percentofthecensus returns of 1901 and 1911.
Theoretical Framework of the Irish Family
Based on the previous studies by Arensberg and Kimball, the author proposes the following hypothesis about a change in the form of the Irish family: In the early nineteenth century, the nuclear family based on the partible land inheritance system was predominant in Ireland. If we understand the stem family from regional perspective, a regional variation in the Irish stem family existed there were more stem families among small to medium farmers in western Ireland than among large farmers in eastern Ireland. Arensberg and Kimball,whoconductedtheirfirstsurveyinagriculturalvillagesinIrelandintheearly1930s,confirmedtheexistenceofstemfamiliesinthe medium farming area in County Clare, suggesting that the regional variation resulted from the difference in situational elements, which supported the stem family norm. At this point, the author tentatively regards peasant society as the conceptual social structure of agricultural villages in western Ireland. D. F. Hannan pointed out the three basic features of the peasant: ⑴ Its main features a familial economy, where farms are owned or securely rented and are large enough to support a family but not large enough to employ labour. ⑵ A subsistence economy, where production for market is not the dominating purpose of production. ⑶ Where impartible inheritance was the norm, as in Ireland, stem family arrangements characterize the social structure. [D. F. Hannan, 1982, 142-3]. In such a peasant society, while small farmers had to have a side job or work as migrant workers to make a living, medium farmers were able to make a living by farming solely by family members and did not require any wage-earners. Therefore, in peasant society in western Ireland, traditional farmers selected the transfer of land to their heirs, rather than having them leave home to work outside, as an effective family strategy. Heirs waiting for inheritance and children

73Regional Variations in Household Structure in early Twentieth Century Ireland
other than heirs remaining home tended to marry late or stay single. On the other hand, different from peasant society in western Ireland, large farmers in eastern Ireland constituted a commercial agricultural society as they could not manage their farms by family members alone, and required agricultural labourers and agricultural servants. The farmers in eastern Ireland adopted an adaptive strategy, where while designated boys became heirs, children other than the heir worked in Dublin, which had capital and commercial functions, or already industrialized Belfast, or emigrated to America after receiving some financial compensation. The agricultural labourers employed by large farmers were landless workers, who were able to get married if their economic conditions allowed, or stayed single. The adaptive family strategy for these workers was either to form simple family households, if they could get married, or to form solitaries or no-family households if marriage was not possible. Thus, the difference in the family situational element of farming scale, such as small, medium, or large farming, had a causal relationship with the family strategy for the formation of the stem family. The author assumes, therefore, that the difference in the family situational element had a great impact on the formation of the stem family and propose a hypothesis about a regional variation that while the stem family norm in western Ireland was supported by the family situational element, the stem family norm was weak in eastern Ireland, leading to the predominance of simple family households, which were determined by the family situational element in eastern Ireland. The author attempts to verify the aforementioned hypothesis about the regional variation in the formation of the Irish stem family by using the GIS (Geographical information system) and linkage techniques based on the census returns of 1901 and 1911. The regional variation is examined below through variables such as landholding scale, farm management, demographic variables (solitaries, marriage rate, birth rate, death rate and marriage age), and the age of household heads, household size, household formation, and the number of kin. This chapter is based on the facts obtained from the analysis of 1901 and 1911 census returns. The 1901 and 1911 census returns were used for this chapter: The population was 4,429,861, and the number of households was 874,045 in 1901, while the population was 4,375,691, and the number of households was 908,881 in 1911.

74 Chapter 5
The linkage data include 80,780 households (hits: 33.8 percent) in County Antrim (Ulster), County Mayo (Connacht), County Clare (Munster), and County Meath (Leinster), which were selected randomly from the four provinces during the ten-year period from 1901 to 1911. Name, gender, and age were used as variables of the linkage data.
Agriculture in Ireland
The map of the traditional farming system of Europe by Todd shows that while small farming by land owners was concentrated in western Ireland, eastern Ireland featured large tenant farming, which seems to be almost meaning distributed (Map 5.2). The achievements of Todd’s research are discussed in detail below. The number of landholders from 1851 to 1911 was 60,800 in 1851, 57,800 in 1881 and 60,800 in 1911. While the number of landholders temporarily declined due to the mini-famine in 1881, it recovered its 1851 level in 1911. When the farmers during this period were classified into four categories (landholdings of less than 1 acre, landholdings of 1 to less than 30 acres, landholdings of 30 to less than 100 acres, and landholdings of 100 acres or more), there was a clear difference between eastern and western Ireland with a line from Dundalk Bay to Galway Bay. The map 5.3 of average landholdings in 1851, 1881 and 1911 [M. Turner 1993, 90] showed similar distributions across all three years: Landholdings of less than 1 acre were concentrated in Leinster and Munster, whereas landholdings of 1 to less than 30 acres were concentrated in Ulster and Connacht, and landholdings of 100 acres or more were concentrated in Leinster and Munster. Moreover, these distributions corresponded with the distribution of the average estimated value of land by province. While in western Ireland, landholdings of less than 1 acre were few in number, landholdings of less than 30 acres accounted for more than 70 percent, demonstrating that western Ireland was a small to medium farming region. On the other hand, in eastern Ireland, although landholdings of less than 1 acre (landless farmers) were greater in number than in western Ireland, landholdings of 100 acres or more were much more numerous than in western Ireland, demonstrating that eastern Ireland was a large farming region. Landholders of
75Regional Variations in Household Structure in early Twentieth Century Ireland
less than 1 acre were employed by large farms. Landholdings of 1 to 30 acres were more evident in western Ireland than in eastern Ireland, demonstrating that western Ireland was a small farming region where side jobs were required to make a living. In particular, there were many seasonal migrants to England and Scotland in County Mayo, County Sligo, and County Roscommon. Landholdings of 30 to 100 acres in the southwestern part of Ireland show that this area was characterized by medium farmers managed their farms with assistance of family members. Landholdings of 100 acres or more, large farmers, were concentrated in eastern Ireland, particularly in County Meath, County Waterford, and County Cork. These were areas where commercial livestock farming was conducted by employing agricultural workers. These maps made the difference in landholding scale in Ireland clear: small to medium farming was practiced in Connacht, and Ulster whereas large farming was practiced in Munster and Leinster. (Map 5.4~5.7) An examination of land use in Ireland showed that to the west of line from most of western Ireland was occupied by mountains, particularly in County Donegal, County Mayo, and County Kerry, where mountains accounted for about 50 percent of the land. While part of the remaining land was used for hay and grass, the land area for the cultivation of cereals was very limited. On the other hand, in eastern Ireland, there were few mountains and the land area used for hay, and grass was remarkably large. Part of the land was also used for the cultivation of cereals. In short, eastern Ireland was blessed with better conditions for farming than westernIreland.Therichlandwasalsofitforcommercial livestock farming. (Map 5.8) While in eastern Ireland except County Wexford and County Carlow, tillage centered on Ulster, most tillage in western Ireland was used for the cultivation of potatoes mainly for personal consumption. (Map 5.9) An examination of the average number of cattle per cattle breeder to the east of a line from Dundalk Bay and Galway Bay shows (Map 5.10) that it was high with cattle breeders with more than 12 head of cattle in County Meath, County Kildare, County Tipperary, County Limerick, County Waterford and County Kerry. However, since cattle of over 2 years of age centered on eastern Ireland, such as County Meath and County Kildare and cattle of one year of age or younger centered on western Ireland, such as County Kerry, County Limerick, and County Clare, it can be
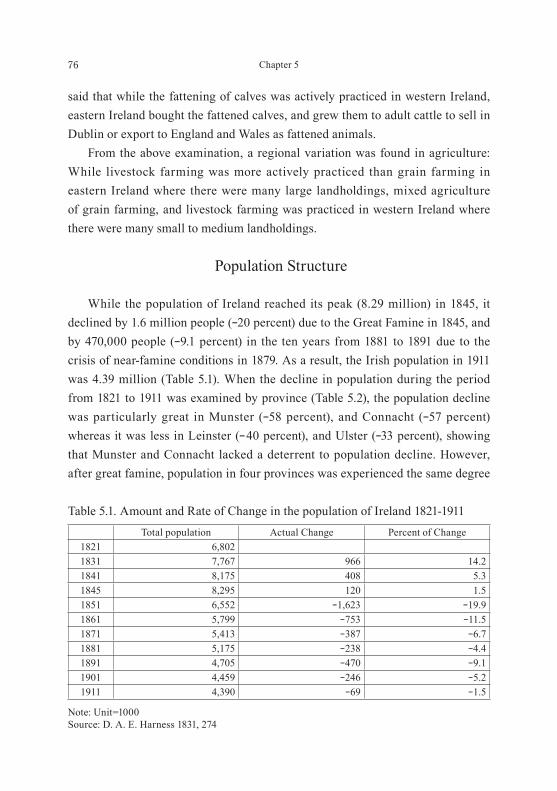
76 Chapter 5
said that while the fattening of calves was actively practiced in western Ireland, eastern Ireland bought the fattened calves, and grew them to adult cattle to sell in Dublin or export to England and Wales as fattened animals. From the above examination, a regional variation was found in agriculture: While livestock farming was more actively practiced than grain farming in eastern Ireland where there were many large landholdings, mixed agriculture of grain farming, and livestock farming was practiced in western Ireland where there were many small to medium landholdings.
Population Structure
While the population of Ireland reached its peak (8.29 million) in 1845, it declined by 1.6 million people (-20 percent) due to the Great Famine in 1845, and by 470,000 people (-9.1 percent) in the ten years from 1881 to 1891 due to the crisis of near-famine conditions in 1879. As a result, the Irish population in 1911 was 4.39 million (Table 5.1). When the decline in population during the period from 1821 to 1911 was examined by province (Table 5.2), the population decline was particularly great in Munster (-58 percent), and Connacht (-57 percent) whereas it was less in Leinster (-40 percent), and Ulster (-33 percent), showing that Munster and Connacht lacked a deterrent to population decline. However, after great famine, population in four provinces was experienced the same degree
Table 5.1. Amount and Rate of Change in the population of Ireland 1821-1911Total population Actual Change Percent of Change
1821 6,8021831 7,767 966 14.21841 8,175 408 5.31845 8,295 120 1.51851 6,552 -1,623 -19.91861 5,799 -753 -11.51871 5,413 -387 -6.71881 5,175 -238 -4.41891 4,705 -470 -9.11901 4,459 -246 -5.21911 4,390 -69 -1.5
Note: Unit=1000Source: D. A. E. Harness 1831, 274

77Regional Variations in Household Structure in early Twentieth Century Ireland
of decline, but Leinster and Ulster did a population decline until 1871, and did not decrease at that of small famine after it too much. On the other hand, in Munster population decline was experienced after famine every ten years. In addition, it was Connacht a population decline was accepted in the same degree. In other words, push factor was vulnerable to Munster and Connacht, and there was little job opportunity in the city and the UK and the United State were accepted after the small famine. Wethinksixmainfactorsinfluencedpostfaminedemographicdevelopment:the changing rural class structure, rising age at marriage, declining marriage and birth rate, a static death rate and emigration. The combination of these six factors was unique to Ireland [J. Lee, 1973, 1]. In this chapter, the Irish population is examined based on the following four
Table 5.2. Population of Ireland by Province 1821-1911
Leinster Munster Ulster Connacht Ireland1821 1.8 2.0 2.0 1.1 6.8 1831 1.9 2.2 2.3 1.3 7.8 1841 2.0 2.4 2.4 1.4 8.2 1851 1.7 1.9 2.0 1.0 6.6 1861 1.5 1.5 1.9 0.9 5.8 1871 1.3 1.4 1.8 0.8 5.4 1881 1.3 1.3 1.7 0.8 5.2 1891 1.2 1.2 1.6 0.7 4.7 1901 1.2 1.1 1.6 0.6 4.5 1911 1.2 1.0 1.6 0.6 4.4
Note: the unit of population is million personsSource: W. E. Vaughan and A. J. Fitzpatrick, 1978, 3-16
Table 5.3. Rate of Marriage per 1000 persons by Province 1865-1911
1865 1871 1881 1891 1901 1911 Leinster 5.3 5.6 5.0 5.0 5.3 5.6 Munster 5.5 5.5 3.7 4.0 4.6 5.1 Ulster 5.5 5.3 4.5 5.2 5.6 5.8 Connacht 4.6 5.0 3.3 3.3 4.0 4.3 Ireland 5.3 5.4 4.2 4.6 5.1 5.4
Source: Annual Reports of Registrar-General of Marriages, Births and Death in Ireland, 1865, 1871, 1881, 1891, 1901 and 1911

78 Chapter 5
factors: regional crude marriage rate, crude birth rate, crude death rate, and emigration rate by province. First of all, the examination of changes in the crude marriage rate (the number of marriages per 1,000 population) showed (Table 5.3) that it declined from 7 before the Great Famine to 5 in 1871, and then to 4 due to food shortages caused by the mini-famine in 1879, and recovered to the 5 level in 1911. While the crude marriage rate did not decline in Leinster, it declined in the provinces of Munster, Ulster and Connacht. Particularly in Connacht, where the near-famine had a great impact as people there lived in part on potatoes, the crude marriage rate radically declined from 5 in 1865 to 3 in 1881. In short, marriage rate in 1911 showed a high-east, low-west distribution. (Map 5.11)
This decline in the marriage rate was related to the percentages of never married people aged 45 to 54 (Table 5.4). Among the never married people in 1851 after the Great Famine, males accounted for 10 percent, and females accounted for 13 percent. The percentages gradually increased to 20 percent and 18.5 percent, respectively, in 1891 and radically rose to 75 percent and 55 percent in 1911 [C. Ó Gráda, 1994, 215]. The non-marriage rate among people aged 25 to 34 was 43 percent for males and 28 percent for females before the Great Famine. It then increased and reached 75 percent and 55 percent, respectively, in 1911 [J. P. Kent, 2002, 530]. The non-marriage rate by province in 1911 was 81 percent in Connacht, which was higher than Munster (76 percent), Leinster (69 percent) and Ulster (62 percent) [L. Kennedy and L. A. Clarkson, 1993, 168]. This was due
Table 5.4. Percentage never Married among Population Aged 45-54 years by Sex and Province, 1841-1911
Men WomenIreland Leinster Munster Ulster Connacht Ireland Leinster Munster Ulster Connacht
1841 10 13 9 10 7 13 14 11 15 8 1851 12 15 10 13 7 13 14 10 15 8 1861 15 19 12 16 10 14 17 12 16 10 1871 17 21 13 19 12 17 19 13 19 12 1881 17 22 14 19 11 17 21 13 20 10 1891 20 25 17 21 14 19 22 14 23 10 1901 24 28 21 24 19 22 25 17 26 14 1911 27 31 27 26 25 25 28 22 27 18
Source: D. Fitzpatrick, 1985, 129

79Regional Variations in Household Structure in early Twentieth Century Ireland
partly to late marriage among heirs, which was caused by the prolonged holding of patriarchal rights by fathers, as discussed later. The marriage age seems to have increased during the period from 1845 to 1911 among males from 25 to 33 and females from 25 to 28 [J. Lee, 1973, 3]. The 1911 data showed that the age forthefirstmarriageamongmaleswas30.4and26.7amongfemales.Whentheageof thefirstmarriagewasexaminedbyprovince,Connacht was highest (33 among males and 28 among females), followed by Munster (31 and 27), Leinster (30 and 26), and Ulster (30 and 26), demonstrating that people in western Ireland tended to marry later than people in eastern Ireland. Moreover, the increase in the number of single people in Munster and Connacht in 1911 was attributable not only to the low marriage rate and famines, but also to the enforcement of Catholic doctrine by priests [E. E. McKenna, 1978, 239-240]. Thus, the decline in the marriage rate was associated not only with the number of never married people, but also with the late marriage of heirs due to the delayed inheritance of farmland,andthedifficultyingettingmarriedamongnon-heirs.
For the birth rate (Table 5.5), it was high in Ireland before the mini-famine and it rapidly declined after the crisis of 1879, which equally impacted all provinces. The birth rate in 1911, however, clearly showed a high-west, low-east pattern. The decline in the birth rate was largely attributable to tendencies to marry late or stay single. The average number of children in 1911 was highest in Connacht (5.9), followed by Munster (5.8), Leinster (5.1), and Ulster (5.1). (Map 5.12) This result and the fact that the marriage rates in Munster and Connacht were lower than Leinster and Ulster seem to suggest that Connacht and Munster wereprolificprovinces,whichwassupportedbytheaveragenumber of children
Table 5.5. Rate of Birth per 1000 persons by Province 1865-1911
1865 1871 1881 1891 1901 1911Leinster 23.6 25.7 24.5 23.0 22.4 23.5Munster 25.4 29.4 24.1 22.2 22.0 22.8Ulster 26.1 27.6 24.7 21.0 23.9 23.7Connacht 24.5 29.8 23.5 22.0 21.2 22.3Ireland 25.0 28.1 24.5 23.1 22.7 23.3
Source: Annual Report of Registrar-General of Marriages, Births and Deaths in Ireland, 1865, 1871, 1881, 1891, 1901 and 1911

80 Chapter 5
in 1911: 6 in County Mayo, 5.9 in County Galway, 5.8 in County Roscommon, and 5.5 in County Sligo in Connacht, while 6.2 in County Kerry, 6.1 in County Clare, 5.7 in County Limerick, and 5.6 in County Cork in Munster.
While the death rate in Ireland (Table 5.6) rose temporarily in 1881 and 1891 due to the mini-famine, it recovered its pre-famine levels after 1891. When the death rate was examined by province, it was high in Leinster and Ulster during the period from 1865 to 1911 and low in Munster and Connacht (high-east, low-west pattern). This fact was supported by the map 5.13 of the death rate per 1,000 persons in 1911. Compared to other countries in Europe, the death rate in Ireland was lowest, which was attributable to the country’s low infant mortality rate [J. Lee, 1973, 6]. The aforementioned analysis of marriage rate, birth rate, and death rate showed that there had been natural population growth due to the high birth rate and low death rate despite a decline in the marriage rate in Ireland: The natural population growth per 1,000 persons was 8.3 during the period from 1861 to 1871, 8 from 1871 to 1881, 5.3 from 1881 to 1891, 5.3 from 1891 to 1901, and 5.6 from 1910 to 1911. The decline in population due to emigration during these periods was -15.2, -12.5, -16.5, -16.3, and -11.9, respectively [C. Ó Gráda, 1994, 225]. As a result, the population structure during these periods showed a population decline due to the cancellation of natural population growth by emigration. According to the First Annual Report of the Registrar-General of Marriages, Births and Deaths in Ireland, during the year 1864 the number of persons who left the ports of Ireland amounted to 114,169, of these 60,692 were males and 53,477 females. Of the whole number 17.3 percent were from Leinster, 42.4 percent
Table 5.6. Rate of Death per 1000 persons by Province 1865-1911
1865 1871 1881 1891 1901 1911Leinster 18.5 19.0 20.2 19.8 20.0 18.5 Munster 15.7 16.5 17.2 17.2 16.4 15.5 Ulster 16.4 15.0 17.5 19.3 18.6 16.8 Connacht 12.8 13.0 13.3 15.2 13.8 14.0 Ireland 16.2 16.4 17.5 18.4 17.8 16.6
Source: Annual Report of Registrar-General of Marriages, Births and Deaths in Ireland, 1865, 1871, 1881, 1901 and 1911
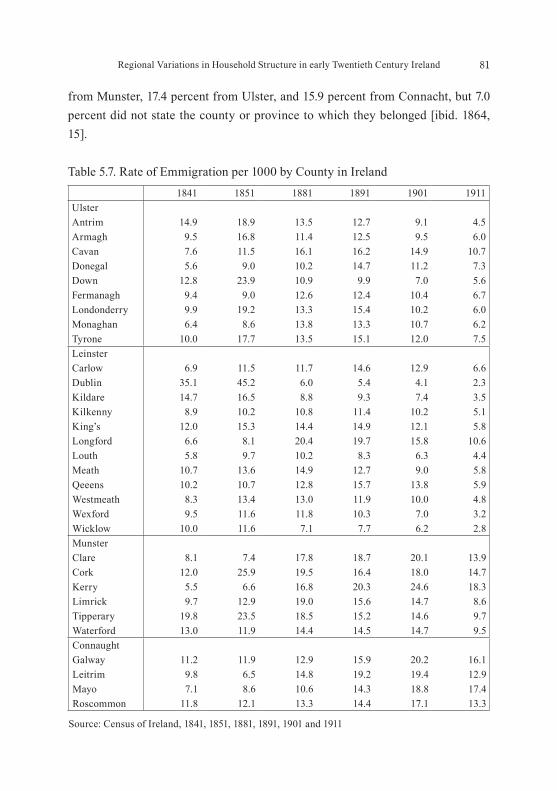
81Regional Variations in Household Structure in early Twentieth Century Ireland
from Munster, 17.4 percent from Ulster, and 15.9 percent from Connacht, but 7.0 percent did not state the county or province to which they belonged [ibid. 1864, 15].
Table 5.7. Rate of Emmigration per 1000 by County in Ireland1841 1851 1881 1891 1901 1911
UlsterAntrim 14.9 18.9 13.5 12.7 9.1 4.5 Armagh 9.5 16.8 11.4 12.5 9.5 6.0 Cavan 7.6 11.5 16.1 16.2 14.9 10.7 Donegal 5.6 9.0 10.2 14.7 11.2 7.3 Down 12.8 23.9 10.9 9.9 7.0 5.6 Fermanagh 9.4 9.0 12.6 12.4 10.4 6.7 Londonderry 9.9 19.2 13.3 15.4 10.2 6.0 Monaghan 6.4 8.6 13.8 13.3 10.7 6.2 Tyrone 10.0 17.7 13.5 15.1 12.0 7.5 LeinsterCarlow 6.9 11.5 11.7 14.6 12.9 6.6 Dublin 35.1 45.2 6.0 5.4 4.1 2.3 Kildare 14.7 16.5 8.8 9.3 7.4 3.5 Kilkenny 8.9 10.2 10.8 11.4 10.2 5.1 King’s 12.0 15.3 14.4 14.9 12.1 5.8 Longford 6.6 8.1 20.4 19.7 15.8 10.6 Louth 5.8 9.7 10.2 8.3 6.3 4.4 Meath 10.7 13.6 14.9 12.7 9.0 5.8 Qeeens 10.2 10.7 12.8 15.7 13.8 5.9 Westmeath 8.3 13.4 13.0 11.9 10.0 4.8 Wexford 9.5 11.6 11.8 10.3 7.0 3.2 Wicklow 10.0 11.6 7.1 7.7 6.2 2.8 MunsterClare 8.1 7.4 17.8 18.7 20.1 13.9 Cork 12.0 25.9 19.5 16.4 18.0 14.7 Kerry 5.5 6.6 16.8 20.3 24.6 18.3 Limrick 9.7 12.9 19.0 15.6 14.7 8.6 Tipperary 19.8 23.5 18.5 15.2 14.6 9.7 Waterford 13.0 11.9 14.4 14.5 14.7 9.5 ConnaughtGalway 11.2 11.9 12.9 15.9 20.2 16.1 Leitrim 9.8 6.5 14.8 19.2 19.4 12.9 Mayo 7.1 8.6 10.6 14.3 18.8 17.4 Roscommon 11.8 12.1 13.3 14.4 17.1 13.3
Source: Census of Ireland, 1841, 1851, 1881, 1891, 1901 and 1911

82 Chapter 5
In 1881, according to the returns obtained by the Royal Irish Constabulary and Metropolitan Police, who acted as enumerators at the several Irish seaports, number of emigrants who left Ireland during the year 1881 amounted to 78,417, of these, 40,106 were, and males were and 38,311 females. Of the whole number, Ulsterwasalotoffirst,30.7percent,butMunster 27.7 percent, Connacht 20.8 percent, Leinster 20.7 percent. Of the emigrants in 1881, 14.7 percent were under 15 years of age, 76 percent were between 15 and 35 years, and 9.3 percent were 35 or upward [ibid. 1881, 29]. In 1891, the number of the emigrants was 59,623 people, of which males were 30,046 and females 29,577, and Munsterwasalotoffirst41.4percent,followedby Ulster (22.2 percent), Connacht (20.8 percent), and Leinster (15.6 percent) [ibid. 1891, 20]. In 1901, the number decreased to 39,613 than front of it, of which females were more (21,486) than males (18,127). There were the still most Munster and a ratio of emigrant was 41.4 percent, and in the following the order was Connacht (28 percent), Ulster (22.1 percent), and Leinster (8.6 percent) [ibid. 1901, 20]. While after the famines, the number of emigrants increased in Ulster, Munster, and Leinster, it decreased after 1881. On the other hand, the number of emigrants to America radically increased in Connacht, an impoverished region, after 1881 (Table 5.8). Before the mini-famine, the partible inheritance system existed in Connacht, which enabled most people to live on the inherited land. However, after the inheritance system shifted to the impartible inheritance system, Connacht suffered greatly from the mini-famine in 1879, and the emigration rate in Connacht increased radically in 1881 to 18.7 percent, and continued to be higher than the emigration rates of other provinces despite a
Table 5.8. Emigration Rate per 1000 by Age in Census Years
Provinces1881 1891 1901 1911
United States Other United
States Other United States Other United
States Other
Leinster 10.9 1.8 6.9 0.8 2.4 0.6 2.6 1.1Munster 12.7 3.7 18.3 2.9 12.4 2.8 6.8 0.6Ulster 8.8 5.0 6.7 1.5 3.1 2.4 3.5 4.1Connacht 18.7 1.3 16.3 0.9 16.7 0.4 10.5 0.4
Source: T. J. Hatton and J. G. Williamson, 1993, 587

83Regional Variations in Household Structure in early Twentieth Century Ireland
gradual decline thereafter (16.3 percent in 1891, 16.7 percent in 1901, and 10.5 percent in 1911). Based on the above analysis, it became clear that the population structure of Ireland suffered not only from the Great Famine in 1845, but also from the 1879 crisis showed a radical population decline as the natural growth of the population was cancelled out by an increase in emigrants. It was also characterized by a decrease in the marriage rate, an increase in the number of the never married people, and late marriage among heirs in rural villages, and these demographic features were closely related to the family structure of Ireland.
Household Structure
Age of household heads
For the occupation of household heads, the percentage of farmers was more than 50 percent in western Ireland with a line connecting County Donegal, County Cavan, County Clare, and County Kerry as the boundary, whereas it was less than 50 percent in eastern Ireland. The average age of household heads was high in western Ireland (over 57) (under the almost same boundary), whereas it was under 56 in eastern Ireland. That is, the age of household heads was higher in western Ireland where there were more householders. (Map 5.14~5.16) The average age of householders in County Antrim, which was selected for linkage data, was 47.0 in 1901, and 48.7 in 1911, whereas it was 52.3 and 54.3 in County Meath, 53.3 and 56.2 in County Clare, and 53.5 and 57.5 in County Mayo. The results show that the average age of householders was higher in western Ireland than in eastern Ireland (Table 5.9). The higher age of householders in western Ireland seemed to have resulted from the predominance of agriculture, prolonged holding of patriarchal rights by patriarchs and late marriage among heirs. This situation coupled with late marriage discussed later led to the predominance of the multiple family household. For the marital status of householders (Table 5.10), while the percentage of married household heads was over 60 percent in Connacht and Munster, there were many counties in Ulster, except County Antrim and County Down (where the percentage was over 60 percent), and Leinster in eastern Ireland where the

84 Chapter 5
percentage was 55 percent or less. Since County Antrim and County Dublin had the big cities of Belfast and Dublin, respectively, there were many employed workers, who tended to marry early.
Table 5.10. Average Age of Marriage of Household Heads and Spouses, 1911
County Male Female County Male FemaleAntrim 27.7 24.8 Qeeens 33.2 27.6 Armagh 30.0 26.3 Westmeath 32.4 26.7 Cavan 31.7 28.4 Wexford 31.0 27.1 Donegal 32.3 27.4 Wicklow 31.1 26.3 Down 28.5 25.3 Clare 32.8 28.0 Fermanagh 32.2 27.4 Cork 30.4 26.1 Londonderry 30.2 26.2 Kerry 31.1 27.0 Monaghan 32.9 27.8 Limerick 31.2 26.9 Tyrone 32.1 27.4 Tipperary 31.8 27.2 Carlow 31.7 27.2 Waterford 30.7 26.3 Dublin 28.2 24.5 Galway 32.0 27.3 Kildare 30.7 25.9 Leitrim 31.2 29.0 Kilkenny 31.6 27.4 Mayo 32.0 27.6 King’s 32.0 27.1 Roscommon 32.8 28.2 Longford 33.1 28.8 Sligo 32.3 28.3 Louth 30.6 26.2 Ireland 30.1 26.4 Meath 32.5 26.9
Source: Census Returns of Ireland, 1911, National Archives of Ireland
Table 5.9. Age of Household Heads in County Antrim, County Clare, County Mayo and County Meath
County Year ~19 20~29 30~39 40~49 50~59 60~69 70~79 80~89 90~ Total N
Antrim1901 0.1 7.5 17.1 20.7 20.6 19.5 10.8 3.5 0.3 100.0 38,7741911 0.2 6.2 16.8 20.5 19.7 17.2 15.4 3.6 0.3 100.0 39,204
Clare1901 0.1 4.4 13.3 20.5 23.3 22.6 11.4 4.0 0.5 100.0 20,9371911 0.1 2.7 12.3 19.1 21.1 20.8 20.0 3.4 0.4 100.0 20,559
Mayo1901 0.2 3.8 13.3 18.5 23.1 25.6 10.9 4.1 0.5 100.0 37,1791911 0.2 2.4 11.4 18.3 18.6 21.0 23.2 4.4 0.5 100.0 37,054
Meath1901 0.2 5.5 14.1 19.8 23.7 23.5 10.3 2.7 0.2 100.0 15,3021911 0.2 4.8 15.2 19.6 19.1 19.6 18.3 2.9 0.3 100.0 14,856
Source: Census Returns of Ireland, 1901 and 1911

85Regional Variations in Household Structure in early Twentieth Century Ireland
Household size
The sizes of households can be roughly grouped into the following three areas, one to the west of a line from County Mayo to County Waterford, another to the east of a line from County Fermanagh to County Meath, and the third a region between these two areas. (Map 5.17 and 5.18) While relatively large families were concentrated in western Ireland, there were smaller families in eastern Ireland. For the average household size in the four counties (Table 5.11), it was 4.8 in 1901 and 4.6 in 1911 in County Antrim, 4.6 in 1901 and 4.8 in 1911 in County Meath, 5.4 in 1901, and 5.1 in 1911 in County Clare, and 5.3 in 1901, and 5.2 in 1911 in County Mayo. Moreover, according to the sizes of households in the four counties, the household size reached a peak of two to three persons in County Meath and County Antrim, whereas it reached a peak of four persons in County Clare and County Mayo. The latter two counties continued to show higher numbers than the former two counties after the peak. This result reconfirmed that the size of households in western Ireland was greater than in eastern Ireland. It was assumed that this difference in the size of households arose from the difference in the number of children.
Number of children
On a map with a line of County Londonderry, County Tipperary and County Cork, the average number of children was higher to the west than to the east.
Table 5.11. Size of Households in County Antrim, County Clare, County Mayo and County Meath
County Year 1 2 3 4 5 6 7 8 9 10 Total(%) N Average
Antrim1901 6.4 13.5 16.8 16.8 15.2 11.8 8.1 5.2 3.2 4.0 100.0 38,843 4.81911 8.6 15.5 15.1 14.8 13.2 10.4 8.0 5.7 3.6 4.1 100.0 39,336 4.6
Clare 1901 5.9 11.9 13.0 14.2 13.3 11.4 9.5 7.4 5.5 8.0 100.0 20,965 5.41911 6.4 12.5 14.7 15.2 13.8 11.3 8.9 6.5 4.5 6.3 100.0 20,662 5.1
Mayo1901 4.7 10.8 13.3 14.9 14.1 12.4 10.0 7.7 5.2 6.9 100.0 37,241 5.31911 5.4 11.6 13.6 14.8 14.1 12.0 10.1 7.4 5.0 6.0 100.0 37,164 5.2
Meath1901 10.3 16.2 16.4 14.4 12.2 9.9 7.0 5.1 3.6 4.9 100.0 15,325 4.61911 10.9 17.7 16.2 15.0 12.5 9.3 6.9 4.6 3.0 4.0 100.0 14,930 4.8
Source: Census Returns of Ireland, 1901 and 1911
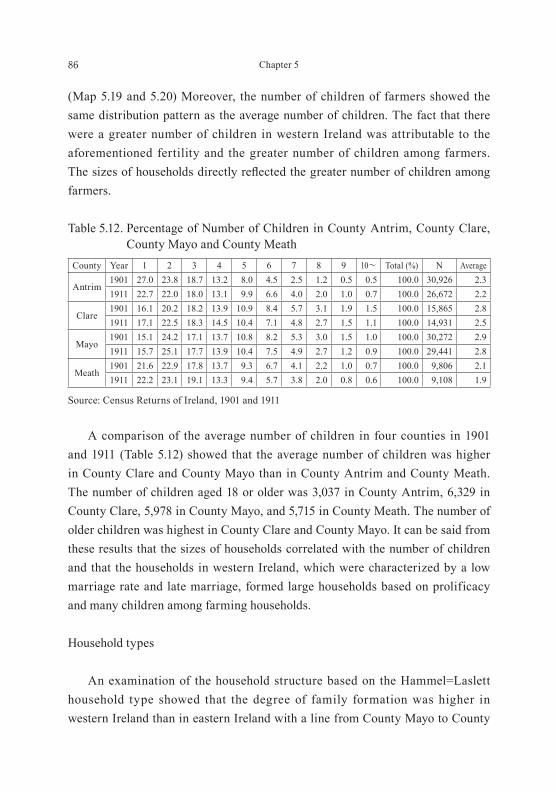
86 Chapter 5
(Map 5.19 and 5.20) Moreover, the number of children of farmers showed the same distribution pattern as the average number of children. The fact that there were a greater number of children in western Ireland was attributable to the aforementioned fertility and the greater number of children among farmers. Thesizesofhouseholdsdirectlyreflectedthegreaternumber of children among farmers.
A comparison of the average number of children in four counties in 1901 and 1911 (Table 5.12) showed that the average number of children was higher in County Clare and County Mayo than in County Antrim and County Meath. The number of children aged 18 or older was 3,037 in County Antrim, 6,329 in County Clare, 5,978 in County Mayo, and 5,715 in County Meath. The number of older children was highest in County Clare and County Mayo. It can be said from these results that the sizes of households correlated with the number of children and that the households in western Ireland, which were characterized by a low marriage rate and late marriage, formed large households based on prolificacy and many children among farming households.
Household types
An examination of the household structure based on the Hammel=Laslett household type showed that the degree of family formation was higher in western Ireland than in eastern Ireland with a line from County Mayo to County
Table 5.12. Percentage of Number of Children in County Antrim, County Clare, County Mayo and County Meath
County Year 1 2 3 4 5 6 7 8 9 10~ Total (%) N Average
Antrim1901 27.0 23.8 18.7 13.2 8.0 4.5 2.5 1.2 0.5 0.5 100.0 30,926 2.31911 22.7 22.0 18.0 13.1 9.9 6.6 4.0 2.0 1.0 0.7 100.0 26,672 2.2
Clare 1901 16.1 20.2 18.2 13.9 10.9 8.4 5.7 3.1 1.9 1.5 100.0 15,865 2.81911 17.1 22.5 18.3 14.5 10.4 7.1 4.8 2.7 1.5 1.1 100.0 14,931 2.5
Mayo1901 15.1 24.2 17.1 13.7 10.8 8.2 5.3 3.0 1.5 1.0 100.0 30,272 2.91911 15.7 25.1 17.7 13.9 10.4 7.5 4.9 2.7 1.2 0.9 100.0 29,441 2.8
Meath1901 21.6 22.9 17.8 13.7 9.3 6.7 4.1 2.2 1.0 0.7 100.0 9,806 2.11911 22.2 23.1 19.1 13.3 9.4 5.7 3.8 2.0 0.8 0.6 100.0 9,108 1.9
Source: Census Returns of Ireland, 1901 and 1911

87Regional Variations in Household Structure in early Twentieth Century Ireland
Tipperary serving as the boundary (Map 5.21~5.27). The multiple family households, a typical stem family, predominated in counties Donegal, County
Table 5.13. Composition of Households in County Antrim, County Clare, County Mayo and County Meath
Antrim Clare Mayo Meath1901 1911 1901 1911 1901 1911 1901 1911
Solitaries 7.3 10.8 7.9 8.0 5.9 6.4 13.4 14.3 No family 9.3 11.7 7.0 9.7 5.4 6.9 13.1 14.5 Simple family households 63.8 63.9 65.1 61.7 68.9 64.9 61.0 58.8 Extended family households 16.8 10.5 14.7 15.4 12.0 13.0 10.0 9.9 Multiple family households 2.9 3.1 5.1 5.2 7.8 8.8 2.5 2.5 Total 100.0 100.0 100.0 100.0 100.0 100.0 100.0 100.0 N 38,766 39,257 20,887 20,598 37,154 37,104 15,263 14,894
Source: Census Returns of Ireland, 1901 and 1911
Table 5.14. Composition of Households in County Antrim, County Clare, County Mayo and County Meath, 1901, 1911
Categories ClassAntrim Clare Mayo Meath
1901 1911 1901 1911 1901 1911 1901 1911
1. Solitaries1a. Widowed 3.3 3.6 3.3 2.7 2.6 2.4 3.5 3.1 1b. Single 3.9 7.2 4.7 5.3 3.3 4.0 10.0 11.2
2. No family2a. Co-residence siblings 3.6 7.8 5.2 6.2 4.2 4.9 10.8 11.1 2b. Co-residence kins 5.6 3.1 1.6 1.7 1.1 1.3 2.1 2.3 2c. Persons not related 0.1 0.8 0.2 1.7 0.1 0.6 0.2 1.0
3. Simple family households
3a. Married couples 5.9 7.4 5.9 5.9 5.1 5.0 6.7 7.5 3b. Married couples with children 43.6 43.3 42.3 39.6 47.4 44.3 37.7 35.8 3c. Widowers with children 4.9 4.4 4.9 4.7 5.0 4.7 5.2 4.6 3d. Widows with children 9.4 8.8 12.0 11.5 11.4 10.9 11.5 10.9
4. Extended family households
4a. Extended upwards 3.1 2.7 5.9 5.9 4.8 5.1 2.1 1.9 4b. Extended downwards 4.2 3.4 3.4 3.0 3.1 2.8 3.0 3.1 4c. Extended laterally 8.6 3.3 4.3 4.8 3.5 3.9 3.9 3.7 4d. Combinations of other extentions 1.0 1.1 1.2 1.7 0.6 1.2 0.8 1.2
5. Multiple family households
5a. Secondary unit upwards 0.9 0.8 2.2 2.6 1.0 1.3 0.7 0.6 5b. Secondary unit downwards 1.7 2.1 2.8 2.5 6.8 7.4 1.7 1.8 5c. Secondary units latteral 0.2 0.1 0.2 0.2 0.1 0.1 0.2 0.1 5d. Frdreches 0.0 0.0 0.0 0.0 0.0 0.0 0.0 0.0 5e. Other multiple family households 0.0 0.0 0.0 0.0 0.0 0.0 0.0 0.0
Total 100.0 100.0 100.0 100.0 100.0 100.0 100.0 100.0 N 38,766 39,257 20,887 20,598 37,154 37,104 22,624 14,894
Source: Census Returns of Ireland, 1901 and 1911, National Archives of Ireland

88 Chapter 5
Roscommon, County Clare, and County Kerry. On the other hand, along a line from Londonderry to Limerick, there were more solitaries to the east than to the west. The simple family households existed more in urban areas, such as County Antrim including Belfast and Dublin, and in western Ireland where solitaries were relatively few in number. An examination of the household structure by province showed that the percentage of the Extended family households ware higher percentages again in Connacht (12.3 percent) and Munster (12.9 percent) than in Leinster (11.1 percent) and Ulster (11.0 percent). The percentage of the multiple family households were higher in Connacht (7.1 percent), and Munster (4.7 percent) than Leinster (2.7 percent), and Ulster (3.4 percent). For the household structure among farmers, it became clear that the number of solitaries showed a high-east, low-west pattern, while the number of multiple family households was characterized by a high-west and low-east pattern. A closer examination of household types in four counties showed that the percentages of solitaries and no-family households were particularly high in County Meath in 1901 (27 percent), and 1911 (29 percent) whereas the percentage of extended family and multiple family households was about 13 percent in each year. Since simple family households were also relatively few in number in County Meath, family formation in County Meath seems to have been weak. County Antrim was similar to County Meath in that while there were many solitaries and no family households, multiple family households were few in number. On the other hand, in County Mayo, the percentage of multiple family households was 7.8 percent in 1901, and 8.8 percent in 1911, and the percentage of extended family households was 12 percent and 13 percent, respectively, whereas the percentages of solitaries and no family households were both low. (Table 5.13, 5.14) In County Clare, while the percentage of both extended and multiple family households was 20 percent, the percentages of solitaries and no family households were similar to those in County Antrim. From these results, it became clear that the percentage of the stem family was high in County Mayo and County Clare, and low in County Antrim and County Meath, demonstrating a regional variation that the stem family was more prevalent in western Ireland than in eastern Ireland. Next, the author examined the family structure based on the linkage data of the four counties in 1901 and 1911 (Table 5.15). In County Antrim and County

89Regional Variations in Household Structure in early Twentieth Century Ireland
Meath, the persistency of the solitaries (S) household was 42.5 percent in 1901, and 47.8 percent in 1911, while that of the no-family household (NF) was 42.5 percent and 49.5 percent. On the other hand, it was 35.4 percent and 33.0 percent in County Clare, and 33.3 percent and 29.7 percent in County Mayo. A comparison of these results suggests that the degree of family formation was higher in County Clare and County Mayo than in County Antrim and County Meath. In County Mayo with many stem families, the rate of shifting from the simple family households (SFH) to the extended family households (EFH) was 9.2 percent, and that from SFH to the multiple family households (MFH) was 7.5 percent. In County Clare, the rate of shifting from SFH to EFH was 10.1 percent, and that from SFH to MFH was 4.3 percent. On the other hand, in County Antrim, where the percentage of stem family was low, the rate of change from SFH to EFH was 8.2 percent, and that from SFH to MFH was 3.6
Table 5.15. Movement of Household Type from 1901 to 1911 in County Antrim, County Clare, County Mayo and County Meath
County Categories 1 2 3 4 5 Total(%) N
Antrim
1. Solitaries 42.5 13.2 34.9 7.5 1.9 100.0 1062. No family 25.8 42.5 24.7 6.5 0.5 100.0 1863. Simple family households 4.0 1.9 82.2 8.2 3.6 100.0 1,5124. Extended family households 4.7 17.5 56.1 18.5 3.3 100.0 4285. Multiple family households 6.9 9.2 56.3 19.5 6.9 100.0 87
Clare
1. Solitaries 35.4 6.3 45.7 9.4 3.1 100.0 1272. No family 14.5 33.0 38.0 10.6 3.9 100.0 1793. Simple family households 3.5 2.6 79.5 10.1 4.3 100.0 2,2064. Extended family households 1.7 3.6 61.4 29.5 3.8 100.0 6345. Multiple family households 2.0 5.4 46.9 32.0 13.6 100.0 147
Mayo
1. Solitaries 33.3 7.1 44.0 3.6 10.7 100.0 842. No family 9.9 29.7 44.0 14.3 2.2 100.0 833. Simple family households 3.6 2.3 77.4 9.2 7.5 100.0 1,9714. Extended family households 1.4 2.5 66.4 24.7 4.7 100.0 3595. Multiple family households 3.4 1.7 53.8 12.0 29.1 100.0 117
Meath
1. Solitaries 47.8 11.0 30.9 8.4 1.8 100.0 3912. No family 14.5 49.5 27.0 8.0 1.0 100.0 3913. Simple family households 4.4 3.4 82.2 7.4 2.7 100.0 2,5284. Extended family households 3.5 7.0 57.9 27.7 3.9 100.0 4585. Multiple family households 8.6 9.9 44.4 13.6 23.5 100.0 81
Note and Source: Census Returns of Ireland, 1901 and 1911, National Archives Dublin1=Solitaries, 2=No family, 3=Simple family households, 4=Extended family households, 5=Mulitiple family households

90 Chapter 5
percent. In County Meath, the rate of change from SFH to EFH was 7.4 percent, and that from SFH to MFH was 2.7 percent. These results showed that the rate of change from the simple family households to the stem family was higher in western Ireland than in eastern Ireland, suggesting that the stem family norm was more firmly maintained in western Ireland than in eastern Ireland. In the para below alter shifting to change or the extended family households, in County Antrim, while the persistence of the extended family households ware weak (18.5 percent), and the rate of change from EFH to SFH (56.3 percent), and that from EFH to NF (17.5 percent) were rather high, the rate of change from EFH to MFH was relatively low (3.3 percent). In County Clare, the persistence of EFH was 29.5 percent, while the rate of change from EFH to SFH was 61.4 percent, and that from EFH to MFH was 3.8 percent. In County Mayo, the persistence of EFH was 24.7 percent, while the rate of change from EFH to SFH was 66.4 percent, and that from EFH to MFH was 4.7 percent. In County Meath, the persistence of EFH was relatively high (27.7 percent), while the rate of change from EFH to SFH was 57.9 percent, and that from EFH to MFH was 3.9 percent. In short, EFH was characterized by a short persistence period, the high rate of change to SFH, and the low rate of change to MFH. For the multiple family households (MFH), the persistence of MFH was high in County Mayo (29.1 percent) and County Meath (23.5 percent), and low in County Clare (13.6 percent) and County Antrim (6.9 percent). The rate of change from MFH to SFH was high in all counties. However, in County Clare, while the rate of change from MFH to SFH (46.9 percent), and that to EFH (32 percent) were high, the rate of change to S and that to NF were low. In County Mayo, due to the long persistence of the multiple family households, the rate of change from MFH to SFH was 53.8 percent, and that to EFH was 12.0 percent. In County Meath, while MFH lasted a long time, there were diverse patterns with the lowest change to EFH, the highest change to SFH, and some changing to S and NF. In County Antrim, the persistence of MFH was low, and there were diverse changing patterns, including MFH to SFH, MFH to EFH, and MFH to S, and MFH to NF. Based on the aforementioned dynamic analysis of household forms in 1901 and 1911, the fact that County Clare and County Mayo were better positioned than County Meath and County Antrim in terms of moving from the simple
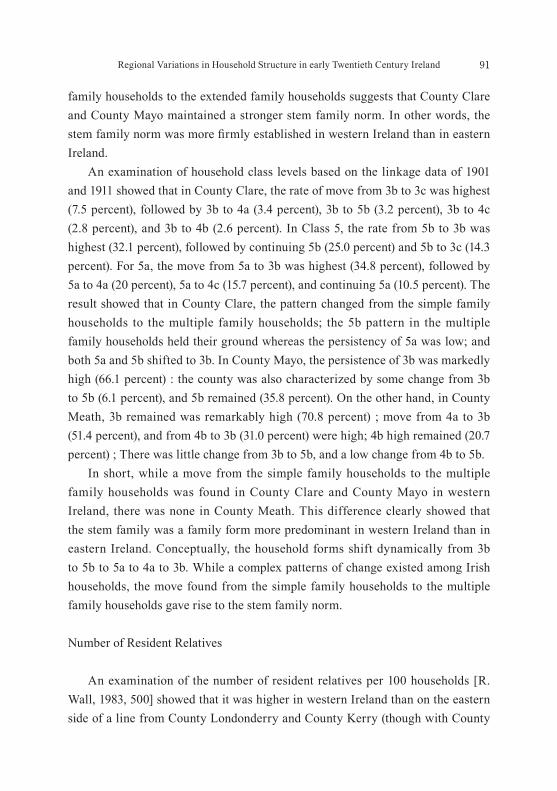
91Regional Variations in Household Structure in early Twentieth Century Ireland
family households to the extended family households suggests that County Clare and County Mayo maintained a stronger stem family norm. In other words, the stem familynormwasmorefirmlyestablishedinwestern Ireland than in eastern Ireland. An examination of household class levels based on the linkage data of 1901 and 1911 showed that in County Clare, the rate of move from 3b to 3c was highest (7.5 percent), followed by 3b to 4a (3.4 percent), 3b to 5b (3.2 percent), 3b to 4c (2.8 percent), and 3b to 4b (2.6 percent). In Class 5, the rate from 5b to 3b was highest (32.1 percent), followed by continuing 5b (25.0 percent) and 5b to 3c (14.3 percent). For 5a, the move from 5a to 3b was highest (34.8 percent), followed by 5a to 4a (20 percent), 5a to 4c (15.7 percent), and continuing 5a (10.5 percent). The result showed that in County Clare, the pattern changed from the simple family households to the multiple family households; the 5b pattern in the multiple family households held their ground whereas the persistency of 5a was low; and both 5a and 5b shifted to 3b. In County Mayo, the persistence of 3b was markedly high (66.1 percent) : the county was also characterized by some change from 3b to 5b (6.1 percent), and 5b remained (35.8 percent). On the other hand, in County Meath, 3b remained was remarkably high (70.8 percent) ; move from 4a to 3b (51.4 percent), and from 4b to 3b (31.0 percent) were high; 4b high remained (20.7 percent) ; There was little change from 3b to 5b, and a low change from 4b to 5b. In short, while a move from the simple family households to the multiple family households was found in County Clare and County Mayo in western Ireland, there was none in County Meath. This difference clearly showed that the stem family was a family form more predominant in western Ireland than in eastern Ireland. Conceptually, the household forms shift dynamically from 3b to 5b to 5a to 4a to 3b. While a complex patterns of change existed among Irish households, the move found from the simple family households to the multiple family households gave rise to the stem family norm.
Number of Resident Relatives
An examination of the number of resident relatives per 100 households [R. Wall, 1983, 500] showed that it was higher in western Ireland than on the eastern side of a line from County Londonderry and County Kerry (though with County

92 Chapter 5
Wexford in eastern Ireland and County Sligo in western Ireland as exceptions). (Map 5.28) For servants, they were concentrated in the southeastern part of Ireland, which corresponded with the commercial large farming region. In this region, the farming scale was too large to be managed only by family members with assistance and therefore, servants and agricultural workers were required. (Map 5.29) A comparison of the number of resident relatives among the four counties (Table 5.16) showed that it was highest in County Mayo in both 1901 and 1911 (65 and 67, respectively), followed by County Clare (51 and 54), County Antrim (50 and 51), and County Meath (47 and 49). While kin in County Clare and County Mayo included many stem family members, such as parents, siblings in law, and grandchildren, kin in County Meath included many collateral relatives, such as siblings, nephews, and nieces. While the number of resident relatives in County Antrim was similar to that in County Clare, the resident relatives in County Antrim did not include many parents, but included many siblings, nephews, and nieces, demonstrating that the formation of the multiple family household was weak.
Table 5.16. Resident Relatives and Others by Relationship to Household Heads in County Antrim, County Clare, County Mayo and County Meath
County County Antrim County Clare County Meath County MayoYear 1901 1911 1901 1911 1901 1911 1901 1911Parents 4.3 4.0 8.7 9.6 2.7 2.3 5.9 6.8 Siblings 15.4 16.2 14.2 16.8 21.6 20.9 10.5 12.2 Siblings in law 1.6 1.8 2.0 2.1 1.8 1.8 1.6 1.8 Children in law 2.3 2.5 3.5 3.4 1.2 2.5 7.8 8.6 Nephews and Nieces 9.6 9.3 7.4 6.5 9.1 8.4 6.6 6.2 Grandchildren 14.2 13.7 12.7 11.8 8.9 9.8 30.9 28.9 Other relatives 2.8 3.2 2.8 3.7 1.6 3.3 2.0 2.9 Total kin 50.2 50.7 51.3 53.9 46.9 49.0 65.3 67.2 Servants 17.2 15.4 18.1 15.9 27.1 23.3 9.4 8.5 Lodgers 1.6 1.2 2.0 1.9 1.8 1.4 1.3 1.1 Boarders 8.2 9.2 4.6 5.0 5.2 6.5 3.4 3.8 Visitors 3.4 2.9 4.2 3.3 3.2 3.1 2.5 2.1
Note: unit=personsSource: Census Returns of Ireland, 1901 and 1911
93Regional Variations in Household Structure in early Twentieth Century Ireland
Conclusion
In this chapter, the author proposed the hypothesis that while the Irish family system moved from a nuclear family system, which had existed until the mid-nineteenth century, to the stem family system, some regional variation characterised the formation of the stem family between western and eastern Ireland.Thehypothesiswasverifiedbyusingthecensus returns of 1901 and 1911, and GIS and linkagetechniques.Thisverificationprocesscanbesummarizedasnoted below. In western Ireland, while the marriage rate was lower than eastern Ireland, the birth rate was high and the death rate was low. After the 1870s, the number of never-married persons increased in Ireland, particularly in Leinster and Ulster. The causes of this increase served to lower the rate of household formation. While the number of never-married persons increased in Connacht and Munster, it was cancelled out by fertility and low mortality, leading to the formation of households larger than the households in other provinces. On the other hand, while the population in Connacht and Munster showed a natural increase, it was cancelled out by increased emigrants to America, leading to the demographic structure characterized by population decline. In western Ireland, the age of never-married persons increased in 1911 compared to 1901. This was due to the prolonged holding of patriarchal rights by household heads. The fact that the household heads did not pass their patriarchal rights to their heirs early, and kept them waiting for inheritance without getting married led to an increase in the number of late marriages and unmarried persons. In particular, this tendency was stronger among households in western Ireland as the late marriage of heirs due to waiting for inheritance, and the departure of children other than heirs as emigrants were considered to be effective strategies for the well-being of the family in western Ireland. On the other hand, in eastern Ireland, it was easier for children other than heirs to find jobs within Ireland, such as in Dublin and Belfast or emigrate to America or England. Moreover, there were many landless agricultural workers and servants in eastern Ireland. These people had an option of forming a family or staying single depending on their economic situation. These people formed simple family households, which inhibited the formation of the stem family.

94 Chapter 5
For the forms of households, in Connacht and Munster in western Ireland, the percentages of the extended family households and the multiple family households were 18.2 percent and 18.9 percent (among farmers: 20.4 percent and 24 percent), respectively, in 1901, and 19.4 percent and 18.6 percent (among farmers: 21.7 percent and 26.5 percent) in 1911. On the other hand, in eastern Ireland including Ulster and Leinster, the percentages were 17 percent and 16.6 percent (among farmers: 19.5 percent and 19 percent) in 1901, and 14.4 percent and 13.8 percent (among farmers: 17 percent and 18.9 percent) in 1911. Thus, the two forms of households showed a high-west and low-east pattern. The percentages of the two household forms were high among farmers in all four provinces and higher in 1911 than 1901. The percentage of farmers was higher in western Ireland than in eastern Ireland. Based on the aforementioned analyses, it was found that there were more stem families in western Ireland than in eastern Ireland, forming a peasant society in the small to medium agricultural region where subsistence farming was practiced. Strictly speaking, however, western Ireland here means Connacht and part of Munster (County Clare and County Kerry). In eastern Ireland, a commercial agricultural community meant that while some stem families were found, the degree of family formation was weak through family factors, such as ease of leaving home, and high potential of choosing a simple family household among landless agricultural labourers. Therefore the formation of stem family was weak in eastern Ireland. Because the norm of stem family in eastern Ireland was weaker than western Ireland, and the family situational factor of eastern Ireland less supported a direct norm of stem family. As a result, there was little formation of the stem family in Ireland more than western Ireland. That when a landless worker forms a household, being easy to form a simple family household and a life bachelorhood person are not less likely to form a family; is due to; of the direct stem family was not more likely to be formed. In other words, in eastern Ireland which is commercial agriculture society, stem family is formed also. Nevertheless because eastern Ireland area approached the labour market of Dublin City and Belfast City, eastern Ireland was easy to begin work, and a reason that it was easy to emigrate again from Dublin Port and the Dundalk Port was considered to be a family situational factor. As a result, I was more likely to form a simple family household when a

95Regional Variations in Household Structure in early Twentieth Century Ireland
landless worker formed a household. In addition, it is thought that the increase in single person prevented the formation of stem family throughout the life. In the end as a mentioned through stem families existed in eastern Ireland, they were relating far fewer than in western Ireland. Moreover, the linkage data showed that while the simple family household became to the multiple family households, in other words, typical stem families, in western Ireland, such a change was weak in eastern Ireland. In short, in western Ireland, the stem family norm was strongly held by families and the norm was supported by family situational factors. On the other hand, in eastern Ireland, while the stem family norm existed, it was not supported by family situationalfactors.Fromthesefindings,itwasverifiedthattherewasaregional variation in the formation of the stem family in western and eastern Ireland. While the correlation between stem families and small to medium farming was strong and weak in regions of large farming.

96 Chapter 5
Map 5.1. Traditional Family Systems of Europe by E. Todd
Source: G. Durnaton et al. 2007, 8.
Map 5.2. Traditional Farming System of Europe by E. Todd
Source: E. Todd, L’Invension de L’Europe, 1990.

97Regional Variations in Household Structure in early Twentieth Century Ireland
Map 5.3. Average Size of Landholdings, 1851-1911 (excluding holdings under 1 acre)
Source: Michael Turner, 1993, 307.
Map 5.4. Map 5.5.

98 Chapter 5
Map 5.6.
Map 5.8.
Map 5.7.
Map 5.9.

99Regional Variations in Household Structure in early Twentieth Century Ireland
Map 5.10.
Map 5.12.
Map 5.11.
Map 5.13.

100 Chapter 5
Map 5.14.
Map 5.16.
Map 5.15.
Map 5.17.

101Regional Variations in Household Structure in early Twentieth Century Ireland
Map 5.18.
Map 5.20.
Map 5.19.
Map 5.21.

102 Chapter 5
Map 5.22.
Map 5.24.
Map 5.23.
Map 5.25.

103Regional Variations in Household Structure in early Twentieth Century Ireland
Map 5.26.
Map 5.28.
Map 5.27.
Map 5.29.


Chapter 6Household Structure of County Mayo in Ireland
at early Twentieth Century
Introduction
In the previous chapter we revealed that the farmer’s family structure in the twentieth century Ireland has a large difference in the west of Ireland and eastern Ireland. In this chapter, the author examines the family structure of small farmers in County Mayo in the western Ireland. In the next chapter, we has analysed the household structure in County Meath [Y. Shimizu, 2011] where large farm holdings were common, and County Clare with smaller or intermediate holdings [Y. Shimizu, 2012]. County Mayo was the poorest county in Ireland, and it was no surprise, therefore, that it was hard hit by the Great Famine in Ireland in 1845. Generally, in County Mayo we know population growth between 1851 and 1861, because it is due to the fact that was able to arable land clearing the waste land. Accordingly, the poorer peasantry were unwilling to leave or unable to go for lack of means [S. H. Cousens, 1961, 282]. The mini-famine in 1879 due to the failure of the potato crop since 1876, coupled with a decrease in the number of emigrants to England and the occurrence of fowl cholera, gave the farmers in County Mayo a painful blow again. It is well known that the Irish National Land League was founded in County Mayo at the time of the mini-famine in 1879 [Matsuo, 1998, 38-39]. Its marginal conditions were reflected later in the fact that the benefits of the Congests Districts Act in 1891 were later extended to the whole county. It was in fact the sole county where this was the case. In 1891, the Congested District Board for Ireland was established by A. J. Balfour with the aim of alleviating poverty and congested living conditions and developing owner farmers in the western part and part of the northwestern part of Ireland based on the local ratable property value of 30 shillings or less per capita. While central County Mayo was not designated as a congested district at the beginning in 1891, the entire County Mayo was designated as such in 1909.

106 Chapter 6
County Mayo presents acute problems for study in that the conditions varied within and between poor law unions (PLU). There was a core of unions in which conditions admitted of commercial livestock grazing, and which contained a number of substantial farmers. These core poor law unions accounted also for the location of the county’s main urban centres, Ballina, Castlebar, Westport, and Ballinrobe, which were active and to a degree prosperous towns. Study is all the more challenging in that within the core unions, there was a marked contrast between better off districts and very marginal areas dominated by very small occupiers. But even in favoured districts, grazing conditions were relatively poor,
Map 6.1. Map of Ireland, Showing the Districts Scheduled as Congested, 1891
Source: C. Breathnach, 2005, 183.
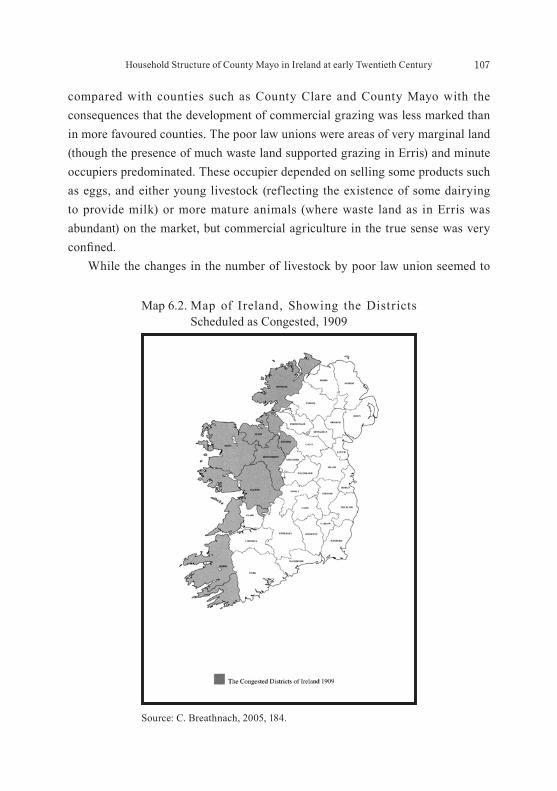
107Household Structure of County Mayo in Ireland at early Twentieth Century
compared with counties such as County Clare and County Mayo with the consequences that the development of commercial grazing was less marked than in more favoured counties. The poor law unions were areas of very marginal land (though the presence of much waste land supported grazing in Erris) and minute occupiers predominated. These occupier depended on selling some products such as eggs, and either young livestock (reflecting the existence of some dairying to provide milk) or more mature animals (where waste land as in Erris was abundant) on the market, but commercial agriculture in the true sense was very confined. While the changes in the number of livestock by poor law union seemed to
Map 6.2. Map of Ireland, Showing the Districts Scheduled as Congested, 1909
Source: C. Breathnach, 2005, 184.
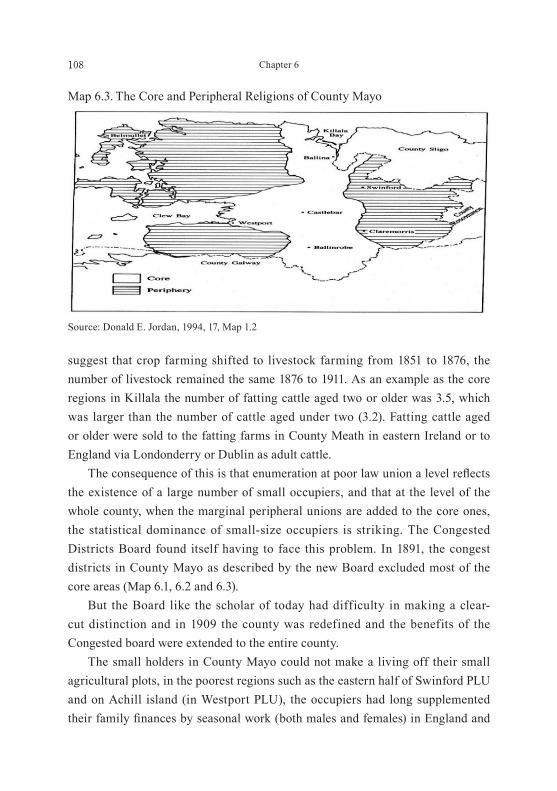
108 Chapter 6
suggest that crop farming shifted to livestock farming from 1851 to 1876, the number of livestock remained the same 1876 to 1911. As an example as the core regions in Killala the number of fatting cattle aged two or older was 3.5, which was larger than the number of cattle aged under two (3.2). Fatting cattle aged or older were sold to the fatting farms in County Meath in eastern Ireland or to England via Londonderry or Dublin as adult cattle. The consequence of this is that enumeration at poorlawunionalevelreflectsthe existence of a large number of small occupiers, and that at the level of the whole county, when the marginal peripheral unions are added to the core ones, the statistical dominance of small-size occupiers is striking. The Congested Districts Board found itself having to face this problem. In 1891, the congest districts in County Mayo as described by the new Board excluded most of the core areas (Map 6.1, 6.2 and 6.3). But the Board like the scholar of today had difficulty in making a clear-cut distinction and in 1909 the county was redefined and the benefits of the Congested board were extended to the entire county. The small holders in County Mayo could not make a living off their small agricultural plots, in the poorest regions such as the eastern half of Swinford PLU and on Achill island (in Westport PLU), the occupiers had long supplemented theirfamilyfinancesbyseasonalwork(bothmalesandfemales)inEnglandand
Map 6.3. The Core and Peripheral Religions of County Mayo
Source: Donald E. Jordan, 1994, 17, Map 1.2
109Household Structure of County Mayo in Ireland at early Twentieth Century
Scotland. When the Land Acts began to make possible the change from tenant status to that of owner, the economic weakness of small holders ensured that change was slower in County Mayo than in other counties, County Clare and County Meath. Special provision proved necessary under the Board to make feasible a change in ownership. In County Mayo partible inheritance was widespread before the Great famine in 1845. The population of the County reached a record high in 1841. While impartible inheritance spread in other areas in the mid-19th century, partible inheritance remained common in County Mayo. As a result, in the early twentieth century, County Mayo was at county level the region where small farming was most actively practiced in Ireland. In some districts within Mayo, even in the wake of the Great famine, population growth resumed and by the 1880s population numbers had come close to their pre-Famine level. That is to say, Cousens pointed out in the following. Natural increase was much greater in the west than in the east, a pattern inherited from the pre-Famine period [S. H. Cousens, 1964, 320]. In the case of County Mayo, after Famine, Cousins clarifiedthattherewerefewemigrantsthoughtheexileofthefarmer was carried out widely in the County Mayo. Though in County Mayo the overall slight loss in comparison with the amount of eviction arose from the close juxtaposition of diverse landlord policies in neighbouring areas. Whilst some localities lost heavily, others gained dramatically. In addition the extent on waste lands was great in Mayo, and despite eviction on a considerable scale, many found a footing elsewhere [S. H. Cousens, 1964, 286]. The whole period from 1851 to 1881 was distinct phase in demographic history of Ireland, bridging the gap between the period of great increase in the west and a lesser increase in the east of the early nineteenth century [S. H. Cousens, 1964, 321]. But It may be said that there were not rapid decreases in County Mayo’s population by such a reason. This chapter aims to propose a hypothesis based on the census returns of the 1901 and 1911, and relating it to the demographic and economic structures of the County. The 100 percent data used herein are based on a population of 195,602, and 37,676 households in 1901, and a population of 189,516, and 36,793 households in 1911.

110 Chapter 6
Analysis and Hypothesis about the Household Structure in County Mayo
The author has adopted the following theoretical framework for Irish families: While the nuclear family was predominant until the mid-nineteenth century, the stem family system was established after the mid-19th century due to the interlinked progression of a dowry-based matchmaking system and a shift from partible inheritance to impartible inheritance. The entire county had benefited from its proximity to Ulster in which the linen industry, in a pattern of proto-industrialization, had expanded from the seventeenth century until much later in after the early decades of the mid-nineteenth century into began to contract to the immediate environs of Belfast. In County Mayo, many smallholders engaged in hand spinning and weaving of linen as a domestic industry [E. L. Almquist, 1977, 20]. Engagement in the domestic industry of linen in County Mayo afforded a new source of income for the occupiers of plots created by the partible inheritance system. It thus reinforced the pattern of easy family creation made possible by the nuclear family system. However, after 1820 when water-powered spinning frames were introduced into the province of Ulster, the linen domestic industry declined in County Mayo. In addition, the Great Famine in 1845 had a significant impact on the nuclear family system that had been promoted under the conventional family strategies. Though a result, many smallholders emigrated to England or America, the migration also helped the pattern of small holdings to survive. While the land holding system in Ireland began to change from partible inheritance to impartible inheritance from the mid-nineteenth century, partible inheritance system continued the norm in County Mayo, and County Mayo became the county with the highest proportion of land held by small holders. The impartible inheritance system (with a single child as heir) was finally incorporated into the existing partible inheritance system in County Mayo very slowly. Not until the early twentieth century did the stem family system begin to show signs of becoming predominant in County Mayo. Its emergence in County Mayo was strongly supported by the following three family situational elements: conventional seasonal working away (in some areas) from home, the production and sale of eggs by housewives, and at the very end

111Household Structure of County Mayo in Ireland at early Twentieth Century
the Old Age Pension Act of 1908. Consequently, patriarchs came to have a strong desire to hold patriarchal rights for a long time and pass down their land to their heirs to carry on their family names [T. M. G. Gabriel, 1977, 26]. Moreover, after the death of a patriarch, a widow temporarily took over the patriarchal rights instead of passing them down to the heir immediately. Such stem families with such a stem family norm became predominant in County Mayo in the early 20th century. Among the stem families, many of the heirs-to-be or heir candidates chose to inherit the land in a less risky manner, that is, by leaving home to emigrate to England or America or by obtaining a job elsewhere in the country. That meant that very frequently they had a strong tendency to wait to inherit the land without getting married until on the death of the father they inherited the holding. As a result, they tended to get married late or stay single. Children other than heirs had nochoicebuttoemigratetoEnglandorAmericaortofindajobinthecountry.Among those who did not emigrate, single men worked in local communities as precariousoccupiersofsmallplots,orasfishermen,weavers,orcobblers,whilesingle women worked as servants or cooks for land owners or as seamstresses [T. M. G. Gabriel, 1977, 128]. In cases where the income from farming the small plots of land was insufficient, it was supplemented with cash income (in some areas from working as seasonal migrants to England or Scotland), and more universal from the production and sale of eggs by housewives [E. L. Almquist, 1977, 248-251, 254-259]. By 1911 the percentage of stem families in County Mayo, the poorest county, was higher than in County Clare, where medium farming was predominant. Would it be correct to say that this was an abrupt change compared with 1901 and hence a statistical or at least quite novel phenomenon? The implication of an abrupt change in family pattern seems odd. The change wouldseemmorelikelytohaveasignificant impactontheconditionsofstemfamilies because it was already under way before 1908. The old age pension system targeted people aged 70 or older. Taking the base-line reports on incomes of smallholders in the congested districts, those with an annual income under ₤31receivedamaximumoffiveshillingsaweek[C.Ó Gráda, 2000, 4], which amounted to ₤12 a year. Compared to the average weekly income of 10 shillings and 9 pence of small holders as estimated by the Congested Districts Board

112 Chapter 6
studies, the annual old age pension of ₤12wasasignificantelementinthefamily budget [T. W. Guinnane, 1996, 108-9]. That is to say, after the old age pension system, the annual income of an smallholder families in County Mayo at the time was around ₤20. For people of Mayo, it is certain that had a great interest inpensionbenefits.Because,itisunderstoodthattheyappearinthediscrepancyof age in the census of 1911 and 1901. It cannot be said that the income by the pension was connected for the change that is in a household form that is the increase in compound family households directly, but, as for amounting and it is thoughttosomeextentit’shavingdoneinfluenceforthehouseholdchange. From the above discussion, the following hypothesis can be proposed: the adoption of a family strategy that combines the aforementioned stem family norm and family situations was considered to contribute to the well-being of the family, leading to the larger percentage of stem families in County Mayo than in other counties.
Economic Structure in County Mayo
Matsuo classified occupiers in Ireland into the following four groups [T. Matsuo, 1987, 231-234] : occupiers with landholdings of less than 5 acres, smallholders with a side job, and holdings of 5 to 30 acres, family farming with holdings of 30 to 100 acres, big farmers responsible for hiring agriculture labourer with landholdings of 100 acres or more. Table 6.1 shows changes in landholdings from 1851 to 1911 in County Mayo, and the survey targets of the author’s research, County Clare and County Meath. An examination of Table 6.1 based on the typology of Matsuo showed the persistence of the group of occupiers with holdings under 5 acres. However small, an occupiers of under 5 acres decreased from 17 percent in 1851 to 15 percent in 1911, stagnation in the group of farmers with a side job and landholdings of 5 to 30 acres (67 percent and 68 percent), an increase in the group of family farming with landholdings of 30 to 100 acres (from 11 percent to 13 percent), and stagnation in the group of farmers with landholdings of 100 acres or more in County Mayo. In each year, farmers with landholdings of 15 acres or less accounted for 55 to 60 percent, and those with landholdings of 30 acres or less accounted for 83 to 86 percent, demonstrating that landholdings in County Mayo were very small in scale.

113Household Structure of County Mayo in Ireland at early Twentieth Century
In 1876, while the group with landholdings of 15 acres or less accounted for 61.0 percent, and the group with landholdings of 30 acres or less accounted for 86.1 percent in County Mayo, it was 32.3 percent and 58.1 percent in County Clare, and 49.3 percent and 63.7 percent in County Meath. While the percentages of the two strata in County Mayo slightly decreased to 56.1 percent, and 83.5 percent in 1911 (a period of 35 years), they increased in County Clare (35.1 percent and 60.3 percent), and County Meath (59.5 percent and 73.3 percent). Overall, the small scale of landholdings in County Mayo stood out. On the contrary, large farming with landholdings of 100 acres or more accounted for 3.6 percent in 1876 and 1911 in County Mayo, 7.3 percent and 6.8 percent in County Clare, and 13.5 percent and 10.8 percent in County Meath. This result made it clear that landholdings were small in scale in County Mayo, medium in County Clare, and large in County Meath. Moreover, according to the pattern of landholdings in 1911, occupiers who had become owners under the Land Acts accounted for 38 percent, and tenant farmers were 62 percent in County Mayo, 58 percent and 42 percent in County Clare, and 60 percent and 40 percent in County Meath. The high percentage of tenant farmers in County Mayo stood out.
Table 6.1. Land Holding of County Mayo, County Clare and County Meath in 1901 and 1911 (Acers)
Year ~1 ~5 5~15 15~30 30~50 50~100 100~200 200~500 500~ Total N Owned Tenanted
Mayo
1851 2.9 14.2 44.0 23.4 6.7 4.4 2.4 1.4 0.5 100.0 34,8101876 5.7 12.7 42.6 25.1 6.7 3.6 1.8 1.2 0.6 100.0 37,0261901 5.6 9.7 41.5 27.0 7.8 4.7 2.1 1.2 0.5 100.0 36,2041911 6.0 9.1 41.0 27.4 8.3 4.5 2.0 1.1 0.5 100.0 36,974 37.8 62.2
Clare
1851 5.0 9.0 21.2 28.7 18.0 11.6 4.4 1.9 0.3 100.0 18,4191876 6.7 7.9 17.7 25.8 20.2 14.4 5.1 1.9 0.3 100.0 18,2761901 8.5 7.9 17.6 24.9 19.3 14.7 4.9 1.9 0.3 100.0 19,0581911 9.3 8.5 17.3 25.2 18.4 14.4 4.8 1.7 0.3 100.0 19,541 58.3 41.7
Meath
1851 13.7 16.2 22.4 16.4 9.9 9.2 7.5 4.0 0.6 100.0 12,9871876 12.0 15.5 21.8 16.9 9.8 10.6 7.8 5.0 0.7 100.0 11,7061901 23.4 13.4 18.8 14.4 9.1 9.2 6.8 4.2 0.7 100.0 13,2691911 27.3 11.8 18.6 13.8 9.0 8.7 6.4 3.8 0.6 100.0 14,189 59.3 40.7
Ireland
1851 6.3 13.8 31.8 23.4 11.6 8.3 3.3 1.3 0.2 100.0 603,0661876 9.0 11.6 28.3 23.6 12.5 9.5 3.8 1.4 0.3 100.0 581,7531901 12.6 10.7 26.2 22.7 12.6 9.7 3.9 1.4 0.3 100.0 590,1751911 14.3 10.3 25.4 22.5 12.6 9.7 3.7 1.3 0.3 100.0 607,960 64.1 35.9
Source: Census of Ireland for the Year 1851, Pt.2. Returns of Agricultural Production in 1851, Agricultural Statistics Ireland 1876, 1901 and 1911

114 Chapter 6
When the aforementioned landholding scale was examined in light of arable land conditions (Table 6.2), the land under crops in County Mayo decreased after 1851 and reached 7.1 percent in 1911. The land under grass increased from 35 percent in 1851 to 41 percent in 1911, whereas the land under waste remained the same since 1851 (in the 50 percent range). On the other hand, in County Clare, the land under crops radically decreased from 21.4 percent in 1851 to 5.1 percent in 1911. On the contrary, the land under grass increased from 49 percent in 1851 to 72 percent in 1911, and the land under waste decreased from 30 percent to 23 percent. In County Meath, the land under crops radically decreased from 39 percent in 1851 to 6.3 percent in 1911, whereas the land under grass increased from 52 percent to 86 percent, and there was no change in the percentage of land under waste. In County Mayo after the Great Famine, the number of cattle increased from 79,148 in 1847 to 116,930 in 1851, and from 173,596 in 1876 to 202,700 in 1911, leading to an increase of 256 percent during the 52 year period. On the other hand, while the acreage for grass, meadow, and clover increased by 44.9 percent from 485,651 acres in 1851 to 595,843 acres in 1901, the crop acreage decreased from 10.6 percent to 7.2 percent. This result showed that agriculture in County Mayo made a major shift after the Great Famine from crop farming to livestock farming [D. E. Jordan, 1994, 130]. For land use, County Clare and County Meath showed a change from arable land to grassland. In County Mayo, while there was also a shift from arable land to grassland to some extent, the area of grassland was limited due to extensive marshes. Thus, County Mayo with many marshes, turf bogs, wastelands and mountains, developed livestock farming gradually by shifting arable land to
Table 6.2. Proportion of Land under Crops, Grass and Waste in County Mayo, County Clare and County Meath (%)
County Area under crops Area under grass Area under wasteYear 1851 1876 1901 1911 1851 1876 1901 1911 1851 1876 1901 1911Mayo 12.7 13.8 11.6 7.1 35.4 39.7 38.9 41.4 51.9 46.5 49.5 51.5 Clare 21.4 18.3 18.3 5.1 49.1 63.0 60.9 71.7 29.5 18.6 20.8 23.2 Meath 39.0 24.3 29.9 6.3 52.1 68.4 45.2 86.2 8.9 7.3 9.2 7.6 Ireland 28.8 25.6 22.7 11.5 43.1 51.7 52.0 60.7 28.1 22.7 25.1 27.7
Note and Source: Census of Ireland for the Year 1851, Pt.2. Returns of Agricultural Produce in 1851, Agricultural Statistics Ireland 1876, 1901 and 1911, Grass includes hay and grass in 1911

115Household Structure of County Mayo in Ireland at early Twentieth Century
grassland little by little.
According to Table 6.3, which shows the number of livestock per farmer, all types of livestock slightly increased in County Mayo from 1851 to 1911. While the increase in cattle was small, poultry made a marked increase from 8 hens to 25, which was related to the production and sale of eggs, which will be discussed later. In County Clare and County Meath, the number of cattle per farmer increased significantly: In particular, in County Meath where large livestock farming was practiced, it increased from 8 head in 1851 to 18 in 1911. The increase in the number of cattle was greater in County Clare than in County Mayo. In short, while farming in County Mayo shifted from crop farming to livestock farming to some extent, the livestock farming in County Mayo was small in scale compared to that in County Clare and County Meath. Based on the aforementioned results, it can be said that in contrast to County Mayo’s pattern of small farming of crop production combined with the rearing of young livestock, the emphasis in County Clare, and County Meath was on
Table 6.3. Number of Stockholding per Holder in County Mayo, County Clare and County Meath (Number)
Year Horse Cattle Sheep Pig Poultey No.of Holder
County Mayo
1851 0.3 3.3 3.5 0.7 7.7 35,2361876 0.5 4.6 7.3 1.5 18.7 38,1001901 0.5 5.4 9.7 2.0 25.4 36,5291911 0.6 5.8 6.8 2.2 37.1 35,221
County Clare
1851 0.7 5.7 4.5 2.2 12.3 19,0181876 0.8 8.9 7.6 2.7 23.6 18,7801901 0.9 9.5 6.3 2.2 23.4 19,5281911 1.2 11.3 6.5 2.7 33.5 16,945
County Meath
1851 1.4 8.0 8.2 1.4 16.3 13,9401876 1.3 14.3 18.2 1.4 26.4 11,9381901 1.2 15.8 16.6 0.9 30.2 13,3811911 1.3 17.8 17.8 1.1 40.6 12,667
Ireland
1851 1.2 4.6 3.3 1.7 11.7 640,2851876 1.0 7.8 7.6 2.7 25.7 529,3201901 0.9 7.6 7.1 2.0 30.5 616,4191911 1.1 8.1 6.7 2.4 43.8 581,340
Source: Census for Ireland for the Year 1851, Pt.2, Returns of Agricultural Produce in 1851, Agricultural Statistics Ireland, 1876, 1901, 1911
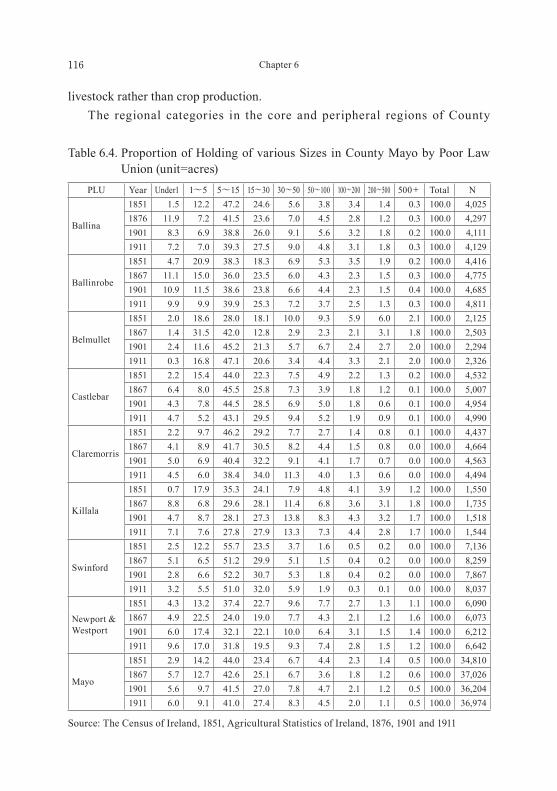
116 Chapter 6
livestock rather than crop production. The regional categories in the core and peripheral regions of County
Table 6.4. Proportion of Holding of various Sizes in County Mayo by Poor Law Union (unit=acres)
PLU Year Under1 1~5 5~15 15~30 30~50 50~100 100~200 200~500 500+ Total N
Ballina
1851 1.5 12.2 47.2 24.6 5.6 3.8 3.4 1.4 0.3 100.0 4,0251876 11.9 7.2 41.5 23.6 7.0 4.5 2.8 1.2 0.3 100.0 4,2971901 8.3 6.9 38.8 26.0 9.1 5.6 3.2 1.8 0.2 100.0 4,1111911 7.2 7.0 39.3 27.5 9.0 4.8 3.1 1.8 0.3 100.0 4,129
Ballinrobe
1851 4.7 20.9 38.3 18.3 6.9 5.3 3.5 1.9 0.2 100.0 4,4161867 11.1 15.0 36.0 23.5 6.0 4.3 2.3 1.5 0.3 100.0 4,7751901 10.9 11.5 38.6 23.8 6.6 4.4 2.3 1.5 0.4 100.0 4,6851911 9.9 9.9 39.9 25.3 7.2 3.7 2.5 1.3 0.3 100.0 4,811
Belmullet
1851 2.0 18.6 28.0 18.1 10.0 9.3 5.9 6.0 2.1 100.0 2,1251867 1.4 31.5 42.0 12.8 2.9 2.3 2.1 3.1 1.8 100.0 2,5031901 2.4 11.6 45.2 21.3 5.7 6.7 2.4 2.7 2.0 100.0 2,2941911 0.3 16.8 47.1 20.6 3.4 4.4 3.3 2.1 2.0 100.0 2,326
Castlebar
1851 2.2 15.4 44.0 22.3 7.5 4.9 2.2 1.3 0.2 100.0 4,5321867 6.4 8.0 45.5 25.8 7.3 3.9 1.8 1.2 0.1 100.0 5,0071901 4.3 7.8 44.5 28.5 6.9 5.0 1.8 0.6 0.1 100.0 4,9541911 4.7 5.2 43.1 29.5 9.4 5.2 1.9 0.9 0.1 100.0 4,990
Claremorris
1851 2.2 9.7 46.2 29.2 7.7 2.7 1.4 0.8 0.1 100.0 4,4371867 4.1 8.9 41.7 30.5 8.2 4.4 1.5 0.8 0.0 100.0 4,6641901 5.0 6.9 40.4 32.2 9.1 4.1 1.7 0.7 0.0 100.0 4,5631911 4.5 6.0 38.4 34.0 11.3 4.0 1.3 0.6 0.0 100.0 4,494
Killala
1851 0.7 17.9 35.3 24.1 7.9 4.8 4.1 3.9 1.2 100.0 1,5501867 8.8 6.8 29.6 28.1 11.4 6.8 3.6 3.1 1.8 100.0 1,7351901 4.7 8.7 28.1 27.3 13.8 8.3 4.3 3.2 1.7 100.0 1,5181911 7.1 7.6 27.8 27.9 13.3 7.3 4.4 2.8 1.7 100.0 1,544
Swinford
1851 2.5 12.2 55.7 23.5 3.7 1.6 0.5 0.2 0.0 100.0 7,1361867 5.1 6.5 51.2 29.9 5.1 1.5 0.4 0.2 0.0 100.0 8,2591901 2.8 6.6 52.2 30.7 5.3 1.8 0.4 0.2 0.0 100.0 7,8671911 3.2 5.5 51.0 32.0 5.9 1.9 0.3 0.1 0.0 100.0 8,037
Newport & Westport
1851 4.3 13.2 37.4 22.7 9.6 7.7 2.7 1.3 1.1 100.0 6,0901867 4.9 22.5 24.0 19.0 7.7 4.3 2.1 1.2 1.6 100.0 6,0731901 6.0 17.4 32.1 22.1 10.0 6.4 3.1 1.5 1.4 100.0 6,2121911 9.6 17.0 31.8 19.5 9.3 7.4 2.8 1.5 1.2 100.0 6,642
Mayo
1851 2.9 14.2 44.0 23.4 6.7 4.4 2.3 1.4 0.5 100.0 34,8101867 5.7 12.7 42.6 25.1 6.7 3.6 1.8 1.2 0.6 100.0 37,0261901 5.6 9.7 41.5 27.0 7.8 4.7 2.1 1.2 0.5 100.0 36,2041911 6.0 9.1 41.0 27.4 8.3 4.5 2.0 1.1 0.5 100.0 36,974
Source: The Census of Ireland, 1851, Agricultural Statistics of Ireland, 1876, 1901 and 1911

117Household Structure of County Mayo in Ireland at early Twentieth Century
Mayo created by Jordan (Map 6.3) are effective in examining the details of the agricultural structure in County Mayo. In County Mayo, the relatively wealthy poor law unions in the core region were Ballina, Ballinrobe, Castlebar, and Killala and the poor law unions in the peripheral region were Belmullet, Claremorris, Swinford, and Westport. This categorization did not match perfectly, but almost corresponded with the congested district areas that were designated in 1891. Below, the characteristics of landholding groups in the poor law unions of County Mayo (Table 6.4) from 1851 to 1911 were examined in the light of core and peripheral categorization. In Killala, a typical poor law union in the core region, the percentage of the landholding group of 1 to 5 acres decreased from 19 percent to 15 percent, and that of 5 to 30 acres, a core group, decreased from 60 percent to 56 percent, whereas the percentage of the landholding group of 30 to 100 acres increased from 13 percent to 21 percent, and that of 100 acres or more remained the same. On the other hand, in Swinford, a typical poor law union in the peripheral region in eastern Ireland, the percentage of the landholding group of 1 to 5 acres decreased from 14.7 percent to 8.7 percent: that of 5 to 30 acres was highest (in the 80 percent range) ; that of 30 to 100 acres slightly increased from 5.3 percent to 7.8 percent; and that of 100 acres or more remained at almost 0 percent. While the landholding group of 5 to 30 acres constituted a core group in both poor law unions, the landholding group of 30 acres or less accounted for 90 percent in Swinford, and most farmers in this group had a side job. The persistence of small farming in Swinford resulted from the continuation of the land subdivision based on the rundale system up to the 20th century [D. E. Jordan, Jr., 1994, 132]. The above examination showed that there was a clear difference in the distribution of landholding size-based farmer groups between poor law unions in the core region and those in the peripheral region. While the difference in the size of land holdings in County Mayo was discussed above, the characteristics of County Mayo are discussed in light of farming below. A close examination of Table 6.5, which shows the proportion of land under crops, grass and marshes from 1851 to 1911, showed that in Ballina, Ballinrobe, Killala, and Claremorris in the fertile core region, there was a clear shift from

118 Chapter 6
crop land to grassland. In particular, in Ballinrobe the area of crop land decreased from 18.6 percent in 1851 to 7.8 percent in 1911, whereas that of grassland increased from 45 percent to 59 percent. The grassland in Ballinrobe was the best of its kind in County Mayo. In County Mayo, the shift to grassland was limited to poor law unions in the core region. An examination of farmland in County Mayo in 1901 by poor law union (Table 6.6) showed that while the total area of farmland was 1.32 million acres,
Table 6.6. The Extent of Land under Crops by Poor Law Union in County Mayo in 1901 (Acres)
PLU Wheat Oats Barley Rye Potatoes Turnip Mangel Wurzel Cavage Hay Total Total NBallina 0.0 27.7 0.2 1.2 24.8 6.4 2.2 1.8 34.3 98.6 18,741Ballinrobe 4.0 22.1 0.0 0.6 21.2 7.5 2.2 1.6 40.1 98.7 19,398Belmullet 0.0 22.7 3.5 2.8 26.4 4.7 1.2 2.1 36.6 100.0 9,272Castlebar 0.6 22.4 0.0 0.7 23.0 3.8 1.7 1.9 45.0 99.1 20,704Claremorris 0.0 31.3 0.0 0.2 23.7 4.7 1.3 1.4 38.8 99.6 23,120Killala 0.0 25.8 0.8 0.4 24.2 6.4 1.7 0.4 38.8 98.5 7,345Swinford 0.0 27.5 0.0 1.1 27.4 3.1 1.1 2.0 37.1 99.3 31,481Westport 0.4 21.1 0.3 3.1 24.8 3.3 1.6 2.0 42.6 96.1 23,755Mayo 0.7 25.4 0.3 1.2 24.5 4.7 1.6 1.7 39.1 99.2 153,816
Source: Agricultural Statistics of Ireland 1901
Table 6.5. Proportion of Land under Crops, Grass and Waste by Poor Law Union in County Mayo, 1851-1911, Acres
Poor Law UnionArea under crops Area under grass Area under waste
1851 1876 1901 1911 1851 1876 1901 1911 1851 1876 1901 1911Ballina 16.4 15.8 12.5 8.5 31.3 35.7 36.2 45.0 52.3 48.5 47.0 46.5 Ballinrobe 18.6 16.5 13.4 7.8 44.7 55.0 55.1 58.6 36.7 28.5 29.1 33.6 Belmullet 4.4 5.8 5.2 4.2 32.0 12.6 13.3 18.9 63.6 81.6 81.4 78.1 Castlebar 14.1 16.8 14.7 8.5 43.0 49.0 48.8 53.1 42.9 34.1 35.5 38.4 Claremorris 23.7 25.5 20.9 13.8 51.2 56.9 61.3 71.6 25.1 17.6 17.8 15.5 Killala 8.6 9.5 7.0 4.3 23.9 31.0 35.8 31.4 67.5 59.5 56.4 64.3 Swinford 20.7 23.5 20.8 12.8 35.8 47.6 53.5 63.6 43.5 28.6 25.7 23.6 Newport/Westport 6.0 7.2 6.9 3.4 30.1 38.0 29.6 23.3 63.9 54.8 63.5 73.3 Mayo 12.7 13.8 11.6 7.1 35.4 39.7 38.9 41.4 51.9 46.5 49.5 51.5
Note and Source: Census of Ireland for the Year 1851, Pt.2. Returns of Agricultural Produce in 1851, Agricultural Statistics, 1876, 1901 and 1911. Grass includes meadow, clover and grass. Waste includes woods and plantaions, bogs and marsh, barren mountain and water. The Newport and Westport were conbined after 1876

119Household Structure of County Mayo in Ireland at early Twentieth Century
the arable land accounted for only about 50 percent, and the rest were marshes, wastelands, and mountains. Compared with County Clare where the arable land accountedfor78percent,landinCountyMayowasunfitforcrop farming. In County Mayo, wheat farming was not practiced at all very wrong except in Ballinrobe and the largest cultivated area was for hay. While the percentage of cultivated land used for hay was highest in Castlebar (45 percent), it was 30 to 40 percent in all other poor law unions. The percentage of cultivated land used for oats was highest in Claremorris (31.3 percent), followed by Ballina (27.7 percent) and Swinford (27.5 percent). It was in the 20 percent range in other poor law unions. The percentage of cultivated land for potatoes was highest in Swinford (27.4 percent), whereas it was in the 20 percent range in other poor law unions (Table 6.6). Thus, it became clear that in County Mayo, wheat cultivation was not practiced; that the cultivated land used for crops was only for oats (25.4 percent) and potatoes (24.5 percent) and that a focus was placed on hay (39.1 percent). As discussed later, potatoes were cultivated as a cash crop as well as a subsistence crop, which indicated that a shift from cropland to grassland was taking place. According to Table 6.7 which shows the number of livestock per farmer in 1911, in County Mayo, the number of horses was 0.6 head; that of cattle was 5.8; that of sheep was 6.8; that of pigs was 2.2; and that of poultry was 37.1. The number of all categories of livestock except sheep was lower than the average number of corresponding livestock per farmer in Ireland. The poor law unions in County Mayo in light of the number of cattle, sheep and poultry, are examined below. The poor law unions where the number of livestock increased from 1851 to 1911 were Killala, Ballina, Ballinrobe, and Castlebar, which were all in the core region. For poor law unions in the peripheral region, while the number of livestock increased in Belmullet and Claremorris, it remained more or less the same in Swinford and Westport. During the 60 years from 1851 to 1911, in Ballinrobe, one of the poor law unions in the core region, the number of cattle doubled; that of sheep increased 2.3 times; and that of poultry quintupled. In Ballina, another poor law union in the core region, the number of cattle increased 1.6 times; that of sheep doubled; and that of poultry quadrupled. On the other hand, in Swinford, one of the poor law unions in the peripheral regions, the
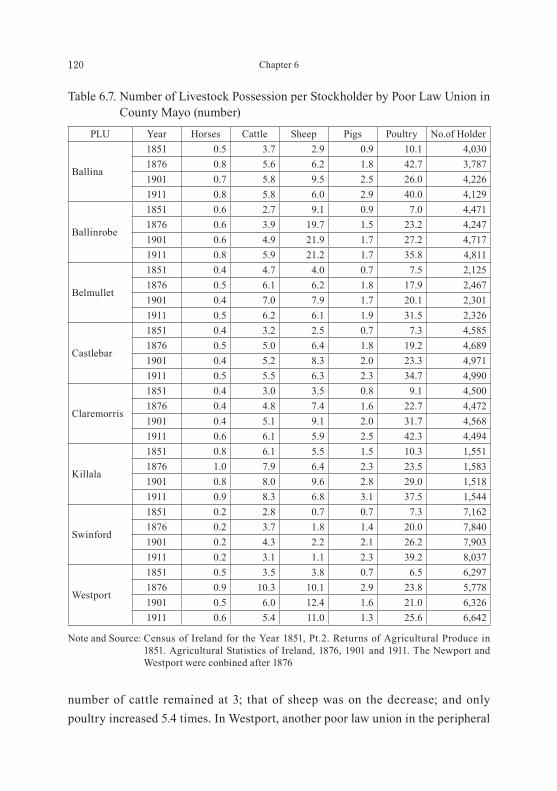
120 Chapter 6
number of cattle remained at 3; that of sheep was on the decrease; and only poultry increased 5.4 times. In Westport, another poor law union in the peripheral
Table 6.7. Number of Livestock Possession per Stockholder by Poor Law Union in County Mayo (number)
PLU Year Horses Cattle Sheep Pigs Poultry No.of Holder
Ballina
1851 0.5 3.7 2.9 0.9 10.1 4,0301876 0.8 5.6 6.2 1.8 42.7 3,7871901 0.7 5.8 9.5 2.5 26.0 4,2261911 0.8 5.8 6.0 2.9 40.0 4,129
Ballinrobe
1851 0.6 2.7 9.1 0.9 7.0 4,4711876 0.6 3.9 19.7 1.5 23.2 4,2471901 0.6 4.9 21.9 1.7 27.2 4,7171911 0.8 5.9 21.2 1.7 35.8 4,811
Belmullet
1851 0.4 4.7 4.0 0.7 7.5 2,1251876 0.5 6.1 6.2 1.8 17.9 2,4671901 0.4 7.0 7.9 1.7 20.1 2,3011911 0.5 6.2 6.1 1.9 31.5 2,326
Castlebar
1851 0.4 3.2 2.5 0.7 7.3 4,5851876 0.5 5.0 6.4 1.8 19.2 4,6891901 0.4 5.2 8.3 2.0 23.3 4,9711911 0.5 5.5 6.3 2.3 34.7 4,990
Claremorris
1851 0.4 3.0 3.5 0.8 9.1 4,5001876 0.4 4.8 7.4 1.6 22.7 4,4721901 0.4 5.1 9.1 2.0 31.7 4,5681911 0.6 6.1 5.9 2.5 42.3 4,494
Killala
1851 0.8 6.1 5.5 1.5 10.3 1,5511876 1.0 7.9 6.4 2.3 23.5 1,5831901 0.8 8.0 9.6 2.8 29.0 1,5181911 0.9 8.3 6.8 3.1 37.5 1,544
Swinford
1851 0.2 2.8 0.7 0.7 7.3 7,1621876 0.2 3.7 1.8 1.4 20.0 7,8401901 0.2 4.3 2.2 2.1 26.2 7,9031911 0.2 3.1 1.1 2.3 39.2 8,037
Westport
1851 0.5 3.5 3.8 0.7 6.5 6,2971876 0.9 10.3 10.1 2.9 23.8 5,7781901 0.5 6.0 12.4 1.6 21.0 6,3261911 0.6 5.4 11.0 1.3 25.6 6,642
Note and Source: Census of Ireland for the Year 1851, Pt.2. Returns of Agricultural Produce in 1851. Agricultural Statistics of Ireland, 1876, 1901 and 1911. The Newport and Westport were conbined after 1876

121Household Structure of County Mayo in Ireland at early Twentieth Century
region, the number of cattle decreased after a temporal increase; that of sheep remained at around 10 to 12 after 1867; and only poultry increased 3.9 times (Table 6.7). As example as peripheral regions in Swinford, horses, cattle, and sheep were fewer in number, and only poultry was larger in number compared to other poor law unions. The large number of poultry led to the production and sale of eggs, which were exported to England via brokers in the surrounding areas. The income from the sale of eggs was used for living expenses. The poor law unions other than the typical poor law union in the core and peripheral regions can be positioned between the two typical groups. Thus, farming in County Mayo shifted from crop farming of oats, potatoes, and hay to livestock farming from 1851 to 1876. However, the development of livestock farming after 1876 differed significantly between the core region and the peripheral region: When viewed by poor law union, while a focus was placed on livestock farming in the wealthy core region, small mixed farming of crop production and livestock farming was focused in the peripheral region. Compared to County Clare, a medium farming region, farming in County Mayo clearly illustrated small farming in the poorest region. In particular, in poor law unions in the peripheral region, small farming that required a side job to earn a livelihood was practiced, leading to seasonal migrants to England and Scotland to earn extra cash. According to Ó Gráda [C. Ó Gráda, 1973, 49], the origin of Irish agricultural migrant workers in Britain dates back to the early 18th century, and the number of such migrants in Connacht increased in and after the 19th century. Most of these temporary agricultural workers engaged in hay gathering in Lancashire, grain harvesting in Lincolnshire and Cambridge, and potato harvesting in Warwickshire, Stafford, and Cheshire in England and potato harvesting in Scotland.Inmostcases, theseasonalworkperiodwasforfivetosevenmonthsfrom around May, and these seasonal migrants were called “Achill men,” “Connacht men,” or “Donegal men” depending on the region they were from [E. L. Almquist, 1977, 249-50, Agricultural Statistics, Ireland, 1910-1911, Irish Agricultural Labourers, 6-8]. Compared to 1841, the number of these workers doubled in 1880, and the increased number of workers continued until 1905. After 1905, it rapidly declined due to agricultural mechanization in Britain. At the time,

122 Chapter 6
each of these workers brought home cash income of ₤8 to ₤10 [E. L. Almquist, 1977, 250-1], with which they cleared their debts from spring and summer [T. Matsuo, 1998, 42]. On the other hand, there were also some among these seasonal migrants who never went back to County Mayo, but became permanent residents of the country where they worked.
Figure 6.1 shows the number of seasonal migrants in the landholding group of 15 acres or less by poor law union over the period from 1880 to 1910. According to the Figure, while there were a total of 10,000 seasonal migrants in County Mayo in 1880, it decreased to 6,000 in 1910, about half of the seasonal migrants in 1880. The large number of seasonal migrants in the impoverished district of Swinford stands out: 50 percent of males in Swinford went to England as seasonal workers and brought home cash income of ₤8 to ₤10 (per worker), sometimes even ₤15. Suppose the average cash income of a worker is ₤10, this means that a total of ₤50,000flewintothepoor law union of Swinford. Therefor smallholders in County Mayo continued to work as seasonal migrants every year. The rapid decline in the number of these workers after 1905, however, deprived the county of a precious source of cash income. (Photo 6.1) During the period when household heads migrated as seasonal workers, their wives earned cash by producing and selling eggs (in place of the home linen industry that had declined) to English markets while engaging in farming. The
Source: Agricultural Statistics Ireland, Report Agricultural Labourers, appropriate years
02,0004,0006,0008,000
10,00012,000
1880189019001910
509521642636
34881
31555
1,188964
1,396598
1,8301,1591,413
578
122
4326
5,0053,3183,6782,376
1,0261,9581,6021,294
10,2018,1259,5755,802
Ballina Belmulett283122486241
Ballinrobe Castlebar Cleamorris Killala Swinford Westport Total
1880 1890 1900 1910
Figure 6.1. Land Endowment of Mayo’s Seasonal Migrants (Migrants with under 15 acres)
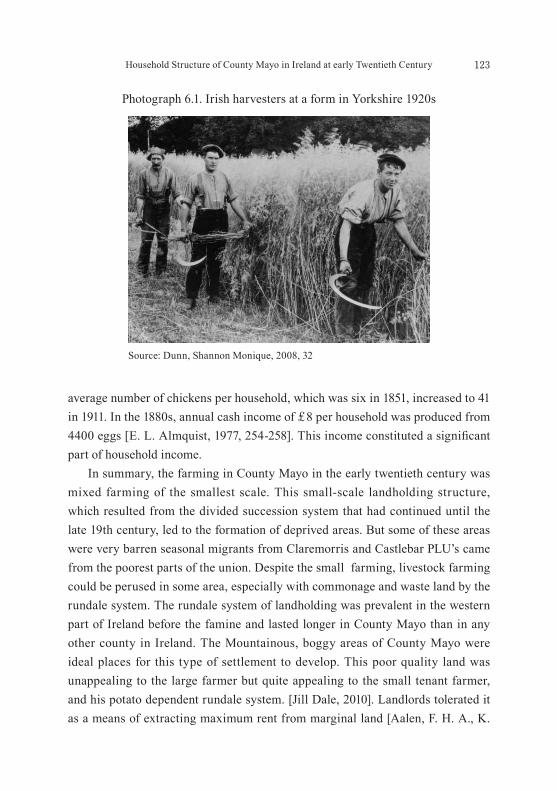
123Household Structure of County Mayo in Ireland at early Twentieth Century
average number of chickens per household, which was six in 1851, increased to 41 in 1911. In the 1880s, annual cash income of ₤8 per household was produced from 4400 eggs [E. L. Almquist, 1977, 254-258]. This incomeconstitutedasignificantpart of household income. In summary, the farming in County Mayo in the early twentieth century was mixed farming of the smallest scale. This small-scale landholding structure, which resulted from the divided succession system that had continued until the late 19th century, led to the formation of deprived areas. But some of these areas were very barren seasonal migrants from Claremorris and Castlebar PLU’s came from the poorest parts of the union. Despite the small farming, livestock farming could be perused in some area, especially with commonage and waste land by the rundale system. The rundale system of landholding was prevalent in the western part of Ireland before the famine and lasted longer in County Mayo than in any other county in Ireland. The Mountainous, boggy areas of County Mayo were ideal places for this type of settlement to develop. This poor quality land was unappealing to the large farmer but quite appealing to the small tenant farmer, and his potato dependent rundale system. [Jill Dale, 2010]. Landlords tolerated it as a means of extracting maximum rent from marginal land [Aalen, F. H. A., K.
Photograph 6.1. Irish harvesters at a form in Yorkshire 1920s
Source: Dunn, Shannon Monique, 2008, 32

124 Chapter 6
Whelan & M. Stout, 1997, 83]. Moreover, households were maintained by income from seasonal migration to England and Scotland, and cash income from the production and sale of eggs by wives. After 1905 when the source of income from seasonal migration was lost, the pension system, which was introduced in 1908, served as an alternative source of income. Thus, the economic structure based on a family strategy where all family members contributed to the livelihood of the household was formed in County Mayo.
Demographic Structure of County Mayo
According to Figure 6.2 which shows the population change in Connacht from 1821 to 1911, the population of County Mayo reached its peak of 390,000 in 1841, and radically decreased to 275,000 in 1851 due to the Great Famine. The increase in population before the famine was due to factors such as the linen domestic industry, the partible inheritance of land, and potatoes being the staple food. The population radically declined temporarily due to the deaths from the Great Famine and emigration to Britain and America.
The reason that the population decline in County Mayo was rather gradual compared to other counties was not due to the permanent emigration to Britain
1821 1831 1841 1851 1861 1871 1881 1891 1901 1911Galway 337,374 414,684 440,198 321,684 271,478 248,458 242,005 214,712 192,549 182,224Leitrim 124,785 141,524 155,297 111,897 104,744 95,562 90,372 78,618 69,343 63,582Mayo 293,112 366,328 388,887 274,499 254,796 246,030 245,212 219,034 199,166 192,177Roscommon 208,720 249,613 253,591 173,436 157,272 140,670 132,490 114,397 101,791 93,956Sligo 146,229 171,765 180,886 128,515 124,845 115,493 111,578 98,013 84,083 79,045
050,000
100,000150,000200,000250,000300,000350,000400,000450,000500,000
Sligo
Roscommon
Galway
Mayo
Leitrim
Figure 6.2. Population Change of Connacht (1821-1911)

125Household Structure of County Mayo in Ireland at early Twentieth Century
or America, but largely due to the seasonal labour movement to England and Scotland. In particular, the number of seasonal migrants was greatest (91.6/1000) in Swinford, a poor law union, in 1880 [Moran, G., 1988, 25]. But seasonal migrationwasquietconfinedtoafewregion.
Figure 6.3 shows changes in the rate of marriage, crude birth, and crude death in County Mayo from 1865 to 1911. The rate of marriage reached its peak (5.7) in 1871 and then declined. This peak rate was the highest in Ireland. The division inheritance is continued until about 1870, and marriage is considered to have been easy by a potato of the staple food, the income of the seasonal migrant worker to mention it later. However, later, as a result of inheritance system has been changed to impartible inheritance, it reduces the marriage rate therefore, unmarried reduction, late marriage, and a lifetime bachelor of became remarkable. After all we can be determined that there were more extended family households in Mayo than Clare by the family condition such as the late of marriage and bachelorhood. For the crude birth rate, it reached its peak (32) in 1871, and declined to 23 to 24 after 1881. For the crude death rate, the increases in 1881, and 1891 were due to the second famine in 1879 to 1880 [E. L. Almquist, 1977, 262-3].
1865 1871 1881 1891 1901 1911Rate of marriage 5.2 5.7 3.4 3.2 3.9 4.1Rate of crude of birth 26.0 32.0 24.5 23.1 23.0 24.3Rate of crude of death 12.0 12.6 13.4 15.2 12.3 13.9
0.0
5.0
10.0
15.0
20.0
25.0
30.0
35.0
Num
ber
Figure 6.3. Rate of Marriage, Birth and Death in County Mayo
Source: Annual Report of the Registrar General for Ireland containing a General Abstract of the Numbers of Marriages, Births and Deaths Registered in Ireland, appropriate years.
126 Chapter 6
The facts that the crude death rate remained at almost the same level over the period from 1865 to 1911 except the temporary increase in 1891, and that the rate had been lower than the crude birth rate show that there was natural population growth. A comparison of the rates of marriage, crude birth, and crude death over a 10-year period from 1901 to 1911 also proved that there was natural population growth: the rate of marriage increased slightly from 3.9 to 4.1; the crude birth rate increased from 23 to 24.3; and the crude death rate increased from 12.3 to 13.9. The increase in the rate of marriage seems to have resulted from the fact that the loosening of the patriarchal rights. From the above, the population structure of County Mayo can be summarized as follows: the population of County Mayo reached its peak before the Great Famine, and radically decreased due to the Famine, but the population decrease after the Famine was slower than that in other regions. The marriage and birth rates of County Mayo had been higher than those of County Clare and County Meath until 1881, and the death rate had been at the same level as County Clare. It can be said, therefore, that the population structure of County Mayo is of a “high birth rate, and low death rate” type, and the natural population growth, which served as a deterrent against population decrease, worked to accelerate poverty.
Household Structure in County Mayo
Attributes of household heads
According to the age structure of household heads in Table 6.8, the average age of household heads was 54.5 in 1901 and 59.9 in 1911, suggesting the aging of household heads: In 1901, the age cohort of 60 to 69 constituted the largest group, followed by that of 50 to 59 and 40 to 49, that is, the household heads aged 40 to 69 constituted the core cohort . In 1911, however, the largest age cohort shifted upward to the age cohort of 70 to 79, followed by the age cohorts of 60 to 69, 50 to 59, and 40 to 49 in this order, expanding the core cohort of household heads to 40 to 79. When the household heads were examined by gender, it was found that female household heads were one third of male heads in 1901. The age cohort of

127Household Structure of County Mayo in Ireland at early Twentieth Century
60 to 69 was largest among both male and female cohorts, followed by that of 50 to 59 and 40 to 49. In 1901, the percentage of female household heads was larger than that of male household heads in the age cohort of 60 or older, suggesting a shift from male household heads to female household heads due to the deaths of male household heads. It should be noted that while the core age cohort of male household heads shifted upward in 1911, the percentage of the age cohort of 40 to 49 slightly increased compared to 1901. When the household heads aged 60 or older were examined by gender, it was found that the shift from male to female household heads moved upward to the age cohort of 70 or older in 1911 along with the aging of male household heads. In summary, it became clear from the comparison between 1901 and 1911 that the aging of household heads was found in 1911; that the cohort of males aged 40 to 49 expanded in 1911; and that there was a shift from male to female household heads. In particular, the polarization of the age of male household heads in 1911 suggests that the transfer of patriarchal rights before death began: This was due to the introduction of the pension system which allowed household heads to live not on landholding, but on a pension. Table 6.9 shows the occupations of household heads, which account for more than 0.3 percent of the total. According to the table, farmers were predominant,
Table 6.8. Age of Household Heads by Age Cohort in County Mayo, 1901, 1911
1901 1911Male Female Total Male Female Total
~19 0.1 0.3 0.2 0.1 0.1 0.1 20~29 4.0 3.7 3.9 2.4 2.4 2.4 30~39 15.0 8.3 13.4 13.0 6.1 11.4 40~49 19.5 15.2 18.5 20.5 10.7 18.2 50~59 22.9 23.3 23.0 19.9 14.7 18.6 60~69 24.1 30.1 25.5 20.1 24.1 21.1 70~79 10.3 12.6 10.8 19.7 34.9 23.3 80~89 3.5 5.9 4.1 3.9 6.3 4.4 90~ 0.5 0.7 0.5 0.5 0.6 0.5 Total 100.0 100.0 100.0 100.0 100.0 100.0
N 28,562 9,067 37,629 28,044 8,862 36,706Mean 53.9 56.2 54.5 58.6 63.7 59.9
Source: Census of Ireland, County Mayo, 1901, 1911

128 Chapter 6
and accounted for 72.6 percent in 1901, and 70.4 percent in 1911. Other occupations that ranked high in 1901 included domestic indoor servants (2.5 percent), agricultural labourers (2.0 percent), general labourers (2.0 percent), and general shop keepers (1.3 percent) whereas those in 1911 were general labourers (2.0 percent), agricultural labourers (1.3 percent), and general shop keepers (1.0 percent). Compared to County Clare, the occupations of household heads in County Mayo featured a larger number of farmers and a smaller number of agricultural and general labourers (due to lack of labour markets in the neighbourhood),reflectingthepredominanceofsmallfarminginCountyMayo.It also showed that there were two statuses, that is, the status of a farmer and that of an agricultural labourer, in County Mayo. From the above age and occupation analyses, it became clear that most of the household heads in County Mayo were small farmers and that the aging of the household heads was taking place.
Table 6.9. Occupation of Household Heads in Co. Mayo, 1901, 1911
Code Occupation 1901 191133 Teacher 0.5 0.6 56 Domestic Indoor Servant 2.5 0.7
100 Farmer 72.6 70.4 103 Agricultural Laborer 2.0 1.3 104 Shepherd 0.6 0.3 168 Carpenter, Joiner 0.4 0.4 214 Innkeeper, Hotel Keeper, Publican 0.7 0.6 236 Grocer 0.0 0.3 282 Tailor 0.5 0.4 290 Shoe, Boot-Maker, Dealer 0.5 0.4 377 Blacksmith 0.3 0.3 399 General Shopkeeper, Dealer 1.3 1.0 404 General Laborer 2.0 2.0
Total 83.9 78.7 N 37,670 36,793
Note: over 0.3% of total occupationSource: Census Returns of Ireland, County Mayo, 1901, 1911

129Household Structure of County Mayo in Ireland at early Twentieth Century
Household size
Table 6.10 and 6.11 show the household size in 1901 and that in 1911,
Table 6.11. Size of Households by Poor Law Union in County Mayo, 1911
Ballina Ballinrobe Belmullet Castlebar Claremorris Killala Swinford Westport Total1 4.6 7.5 3.4 4.7 4.7 3.5 5.5 4.6 5.0 2 10.7 14.3 8.4 12.3 11.4 9.9 11.4 10.9 11.4 3 13.8 14.9 9.8 14.0 13.8 13.5 14.1 12.5 13.5 4 15.1 14.4 13.1 15.5 15.3 14.9 15.0 14.1 14.8 5 14.6 13.2 14.1 13.8 15.0 15.0 14.7 13.2 14.2 6 12.1 10.4 14.2 12.1 11.6 13.7 11.9 12.8 12.1 7 10.4 8.5 12.5 10.4 9.6 11.0 10.3 10.4 10.2 8 7.2 6.9 9.7 7.4 7.3 7.3 7.0 8.2 7.5 9 5.1 4.7 6.5 4.8 5.0 4.7 4.8 5.8 5.1
10 2.9 2.5 4.3 2.9 3.4 3.2 2.9 3.7 3.2 11- 3.2 2.6 4.0 2.2 2.9 3.3 2.2 3.8 2.9
Total 100.0 100.0 100.0 100.0 100.0 100.0 100.0 100.0 100.0 N 4,428 4,123 2,502 4,905 4,686 1,479 8,436 6,210 36,769
Mean 5.2 4.8 5.7 5.1 5.1 5.3 5.1 5.4 5.2
Source: Census Returns of Ireland, County Mayo, 1911
Table 6.10. Size of Household by Poor Law Union in County Mayo, 1901
Ballina Ballinrobe Belmullet Castlebar Claremorris Killala Swinford Westport Total1 4.8 6.6 3.3 4.4 4.7 4.2 4.5 4.3 4.7 2 10.9 13.5 7.5 11.2 10.5 9.5 11.4 10.8 10.9 3 12.4 14.9 11.4 14.8 13.0 14.1 13.9 12.6 13.5 4 13.9 14.1 13.4 15.9 15.2 16.0 16.5 14.2 15.0 5 14.5 13.8 13.6 14.8 13.7 14.0 15.0 13.8 14.3 6 12.1 11.7 14.5 11.9 11.7 13.8 12.5 12.9 12.5 7 10.7 8.7 12.8 9.2 11.1 10.2 9.2 10.5 10.1 8 7.3 6.9 10.1 7.5 7.3 7.2 7.5 8.3 7.7 9 6.3 4.7 6.2 4.6 5.9 5.1 4.3 5.4 5.2 10 3.4 2.6 4.0 3.0 3.4 3.1 2.8 3.7 3.2 11- 3.7 2.6 3.2 2.5 3.5 2.9 2.3 3.6 3.0
Total 100.0 100.0 100.0 100.0 100.0 100.0 100.0 100.0 100.0 N 4,589 4,312 2,420 5,064 4,835 2,643 7,497 6,309 37,669
Mean 5.3 4.9 5.6 5.1 5.3 5.2 5.1 5.4 5.2
Source: Census Returns of Ireland, County Mayo, 1901
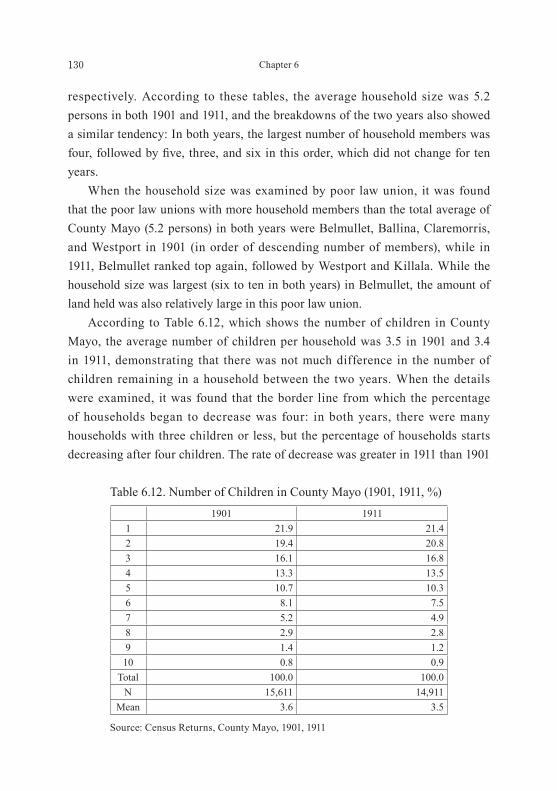
130 Chapter 6
respectively. According to these tables, the average household size was 5.2 persons in both 1901 and 1911, and the breakdowns of the two years also showed a similar tendency: In both years, the largest number of household members was four,followedbyfive,three,andsixinthisorder,whichdidnotchangefortenyears. When the household size was examined by poor law union, it was found that the poor law unions with more household members than the total average of County Mayo (5.2 persons) in both years were Belmullet, Ballina, Claremorris, and Westport in 1901 (in order of descending number of members), while in 1911, Belmullet ranked top again, followed by Westport and Killala. While the household size was largest (six to ten in both years) in Belmullet, the amount of land held was also relatively large in this poor law union. According to Table 6.12, which shows the number of children in County Mayo, the average number of children per household was 3.5 in 1901 and 3.4 in 1911, demonstrating that there was not much difference in the number of children remaining in a household between the two years. When the details were examined, it was found that the border line from which the percentage of households began to decrease was four: in both years, there were many households with three children or less, but the percentage of households starts decreasing after four children. The rate of decrease was greater in 1911 than 1901
Table 6.12. Number of Children in County Mayo (1901, 1911, %)1901 1911
1 21.9 21.4 2 19.4 20.8 3 16.1 16.8 4 13.3 13.5 5 10.7 10.3 6 8.1 7.5 7 5.2 4.9 8 2.9 2.8 9 1.4 1.2
10 0.8 0.9 Total 100.0 100.0
N 15,611 14,911Mean 3.6 3.5
Source: Census Returns, County Mayo, 1901, 1911

131Household Structure of County Mayo in Ireland at early Twentieth Century
amongthegroupswithfiveormore. The total number of children was 103,000 in 1901 and 95,000 in 1911. The average number of remaining children also decreased from 3.15 to 2.71. A decrease in both the total number of children, and the average number of children (3.15 to 2.71) can be interpreted as due to a decrease in the number of children who remained in the household. According to the 1911 census, to which a new category of the number of living children was added, the average number of living children was 5.25, suggesting that children left home earlier in 1911 than 1901. Table 6.13, a cross tabulation of the age and the number of children in 1901 and 1911, shows that the number of unmarried sons aged 10 to 24 was greater in 1901 than 1911 whereas the number of unmarried sons aged 25 or older was greater in 1911 than 1901. This means that more sons tended to remain home in 1901 than 1911, and that sons tended to leave home earlier in 1911 than 1901. On the other hand, it also means that more sons aged 25 or older, who seem to be heirs, stayed home unmarried waiting for the succession.
Household types
According to Table 6.14, which was created according to the classification
Table 6.13. Percentage of Unmarried Children in County Mayo, 1901, 1911
1901 1911Male Female Male Female
0~4 15.9 16.0 15.3 17.1 5~9 18.4 19.2 17.5 19.7
10~14 20.3 21.0 18.3 19.7 15~19 18.2 21.2 16.6 18.5 20~24 13.3 13.8 12.4 11.2 25~29 7.9 5.8 8.2 6.5 30~34 3.8 1.8 5.5 3.7 35~39 1.3 0.6 3.4 1.8 40~44 0.6 0.3 1.6 0.9 45~49 0.3 0.2 1.1 0.8 Total 100.0 100.0 100.0 100.0
N 52,632 50,431 50,666 43,938
Source: Census Returns of Ireland, County Mayo, 1901, 1911

132 Chapter 6
of households by Hammel=Laslett, simple family households accounted for 65 percent in 1901, and 61.4 percent in 1911, showing that this family type decreased over time. On the other hand, the percentage of extended family households
Table 6.14. Composition of Households by Category in County Mayo, 1901, 1911
Categories 1901 19111. Solitaries 4.7 5.0 2. No family 7.2 7.9 3. Simple family households 65.0 61.4 4. Extended family households 18.4 20.3 5. Multiple family households 4.8 5.4 Total 100.0 100.0 N (households) 37,627 36,748
Source: Census Returns of Ireland, Co. Mayo, 1901 and 1911
Table 6.15. Composition of Households by Category and Class in County Mayo, 1901, 1911
Categories Class 1901 1911
1. Solitaries1a Widow 2.6 2.3 1b Single 2.1 2.7
2. No family2a Coresidence siblings 3.2 3.9 2b Coresidence kins 2.6 2.6 2c Persons not related 1.4 1.4
3. Simple family households
3a Married couple 5.1 5.1 3b Married couple with children 42.5 40.5 3c Widowers with children 4.7 4.4 3d Widows with children 12.6 11.5
4. Extended family households
4a Extended upwards 8.8 10.0 4b Extended downwards 5.5 5.5 4c Extended laterally 3.3 3.9 4d Combinations of 4a-4c 0.8 0.8
5. Multiple family households
5a Secondary units upwards 0.6 1.0 5b Secondary units downwards 3.9 4.2 5c Secondary units lateral 0.1 0.1 5d Frdreches 0.0 0.0 5e Other multiple family households 0.1 0.0
Total 100.0 100.0 N 37,627 36,704
Source: Census Returns of Ireland, County Mayo, 1901, 1911
133Household Structure of County Mayo in Ireland at early Twentieth Century
increased from 18.4 percent in 1901 to 20.3 percent in 1911, and that of multiple family households also increased from 4.8 percent in 1901 to 5.4 percent in 1911. The increase in the combined percentages of these two types from 23.2 percent to 25.7 percent characterizes the households in County Mayo. The combined percentages of these two types in County Mayo were higher than those in County Clare (22.2 percent and 22.5 percent, which are based on a survey by C. Arensberg and S. T. Kimball) [C. Arensberg & S. T. Kimball, 2001]. When these characteristics were examined by class listed in Table 6.15, there was not much difference between the percentage of solitaries in County Mayo (widows: 2.6 percent in 1901, and 2.3 percent in 1911, and singles: 2.1 percent in 1901, and 2.7 percent in 1911), and that in County Clare (widows: 3.2 percent in 1901, and 2.4 percent in 1911, and singles: 3 percent in 1901, and 3.7 percent in 1911). However, there was a major difference between County Mayo and County Meath (widows: 3.2 percent and 3.1 percent and singles: 7.1 percent and 7.8 percent). For no family households, the percentages of co-residence with siblings (2a), co-residence with kin (2b), and co-residence with non-kin (2c) were all lower in County Mayo than in County Clare. All the above percentages suggest that the households in both County Mayo and County Clare were not in conditions of family breakup as in County Meath, but the household formation where farmer families’accountfor87to88percentwasfirmlyformed. For simple family households, the percentage of the nuclear family (3b) was 42.5 percent in 1901, and 40.5 percent in 1911 in County Mayo, which was higher than that in County Clare (38.6 percent and 37.9 percent), and the percentage of widows with children (3d) was low. For extended family households, it is worth noting that vertical extension (such as 4a (8.8 percent) and 4b (5.5 percent) in 1901, and 4a (10.0 percent) and 4b (5.5 percent) in 1911) was greater than the lateral extension (3.3 percent in 1901 to 3.9 percent in 1911). The fact that the vertical extension was greater in County Mayo than in County Clare (9 percent and 12.8 percent), and that the lateral extension was lower than County Clare (4.3 percent and 4.9 percent) shows that the stem familysystemfirmlyestablishedinCountyMayo.Moreover,inmultiple family households, the upward extension was 0.6 percent in 1901, and 1.0 percent in 1911, while the downward extension was 3.9 percent in 1901, and 4.2 percent in 1911. When they were compared with the upward extension (1.7 percent and 2.0

134 Chapter 6
percent), and the downward extension (2.0 percent and 1.8 percent) in County Clare, the downward extension in County Mayo was prominent. From the above analysis which showed large percentages of extended family households and multiple family households, and stronger vertical extension than lateral extension, it can be said that among the households in County Mayo, the stemfamilysystemwasfirmlyestablished. Moreover, according to Table 6.16, a cross tabulation on household type and age in 1911 for extended family households, the percentage of household heads aged 70 to 79 was highest (29.2 percent), followed by the age groups of 40 to 49, 60 to 69, and 50 to 59 in this order. While the higher age groups showed downward extension, the lower age groups showed upward extension. For multiple family households, the high percentage of 46.7 percent for the age group of 70 to 79 indicates downward extension, suggesting that household heads did not transfer their patriarchal rights to heirs, but formed stem families while maintaining the rights.
Number of Kin
Table6.17showsthefiguresobtainedbyusingthemethodpresentedbyR.
Table 6.16. Percentage of Type of Household by Age of Household Heads in County Mayo, 1911
Solitaries No family Simple family households
Extended family households
Multiple family household Total
~19 0.3 1.1 0.0 0.0 0.0 0.1 20~29 3.9 12.7 1.3 1.7 0.8 2.4 30~39 11.1 21.0 10.2 12.2 7.7 11.3 40~49 12.5 19.7 19.4 18.1 7.9 18.2 50~59 13.6 14.9 22.5 13.2 5.2 18.6 60~69 18.4 13.5 24.2 16.4 16.9 21.1 70~79 33.2 15.0 19.6 29.2 46.7 23.3 80~89 6.4 2.1 2.6 7.9 13.6 4.4 90~ 0.6 0.1 0.3 1.1 1.4 0.5 Total 100.0 100.0 100.0 100.0 100.0 100.0
N 1,849 2,872 22,519 7,448 1,973 36,661
Source: Census Returns of Ireland, County Mayo, 1901, 1911

135Household Structure of County Mayo in Ireland at early Twentieth Century
Wall in 1983, and which represent the relationships and size of co-resident kin per 100 households [R. Wall, 1983, 499-501]. This is one of the methods that address problems inherent in the household categorization based on conjugal family unit (CFU) by Hammel=Laslett. According to the table, the total number of kin was 65.4 in 1901, and 67.2 in 1911 in County Mayo, which was greater than that in the other two counties. When the details of the kinship were examined, the largest group of kin was grandchildren (30.9 in 1901 and 28.9 in 1911), followed by siblings (10.5 and 12.2), spouses of children (children in law) (7.8 and 8.6), parents (5.9 and 6.8), and nephews and nieces (6.6 and 6.2) in this order. The greatest difference found by a comparison between County Mayo, and the other two counties was the high percentage of lineal consanguinity, that is, parents, spouses of children, and grandchildren, in County Mayo. The high percentage of lineal consanguinity supports the hypothesis that the stem family was formed during the period between 1901 and 1911. On the other hand, non-kin, such as servants, lodgers, boarders, and visitors, were very small in number in County Mayo compared to the other two counties, demonstrating that small farming in County Mayo afforded little room for non-
Table 6.17. Resident Relatives and Others by Relationship to Household Heads in County Clare, County Meath and County Mayo
County County Clare County Meath County MayoYear 1901 1911 1901 1911 1901 1911Parents 8.7 9.6 2.7 2.3 5.9 6.8 Siblings 14.2 16.8 21.6 20.9 10.5 12.2 Siblings in law 2.0 2.1 1.8 1.8 1.6 1.8 Children in law 3.5 3.4 1.2 2.5 7.8 8.6 Nephews and Nieces 7.4 6.5 9.1 8.4 6.6 6.2 Grandchildren 12.7 11.8 8.9 9.8 30.9 28.9 Other relatives 2.8 3.7 1.6 3.3 2.0 2.9 Total kin 51.3 53.9 46.9 49.0 65.3 67.2 Servants 18.1 15.9 27.1 23.3 9.4 8.5 Lodgers 2.0 1.9 1.8 1.4 1.3 1.1 Boarders 4.6 5.0 5.2 6.5 3.4 3.8 Visitors 4.2 3.3 3.2 3.1 2.5 2.1
Note: unit=personsSource: Census Returns of Ireland, Co. Mayo, 1901, 1911

136 Chapter 6
kin. Theaboveanalysisofkinshipconfirmstheassumptionabouttheformation of the stem family, which was made in the aforementioned household categorization.
Life Course
As previously mentioned, since household heads had a strong intention to maintain the land succession right as long as possible to leave the family name on the land, they would not pass the right to their heirs early on. Consequently, the heirs were forced to stay single as part of the workforce of their families. Below, the author examines the characteristics of the household formation process in County Mayo in light of the life course of household heads. Since the life course of household heads in 1901, and that in 1911 are almost the same (see Figure 6.4 and 6.5), the author centres the discussion below on the life course of 1911. Household heads form a bell curve from their late 20s to 80s, to which spouses join from their late 20s through 90s. Parents begin to appear when the household heads are in their late 40s, suggesting that this is when the transition of power to the next generation takes place. Children (heirs) remain home until the household heads are in their 50s and siblings continued to stay home from their late teens to 70s, although in small proportions. These results show the household dynamics where children or heirs stay home until the household heads pass down the property to them, and where parents appear after the inheritance process is completed. On the other hand, other kin are present until when the household heads are in their late 20s, later disappear temporarily, and re-appear when the household heads are in their 70s. These kin include temporary co-resident grandchildren, nephews, nieces, and co-resident elderly people, such as uncles and aunts. Servants who are non-kin appear from the household heads’ late teens to their 30s and disappear afterward. This is due to the fact that smallholders in County Mayo did not need servants. It became clear from the above analysis of the life course of household heads that household heads did not pass the property down to their heirs early, but continued to hold their patriarchal rights for a long time, and kept their heirs waiting as they regarded the heirs as part of the workforce of their families.

137Household Structure of County Mayo in Ireland at early Twentieth Century
Parents
Kin
Servants
Others
Sibling
Children
Spouse
Head0%
10%
20%
30%
40%
50%
60%
70%
80%
90%
100%
0~4 5~910~14
15~1920~24
25~2930~34
35~3940~44
45~4950~54
55~5960~64
65~6970+
Figure 6.4. Age Cohort of Household Heads and Household Relationships in County Mayo (1901)
Source: Census Returns of Ireland, County Mayo, 1901
Parents
Kin
Servants
Others
Sibling
Children
Spouse
Head0%
10%
20%
30%
40%
50%
60%
70%
80%
90%
100%
0~4 5~910~14
15~1920~24
25~2930~34
35~3940~44
45~4950~54
55~5960~64
65~6970+
0%
10%
20%
30%
40%
50%
60%
70%
80%
90%
100%
0~4 5~910~14
15~1920~24
25~2930~34
35~3940~44
45~4950~54
55~5960~64
65~6970+
Figure 6.5. Age Cohort of Household Heads and Household Relationships in County Mayo (1911)
Source: Census Returns of Ireland, County Mayo, 1911
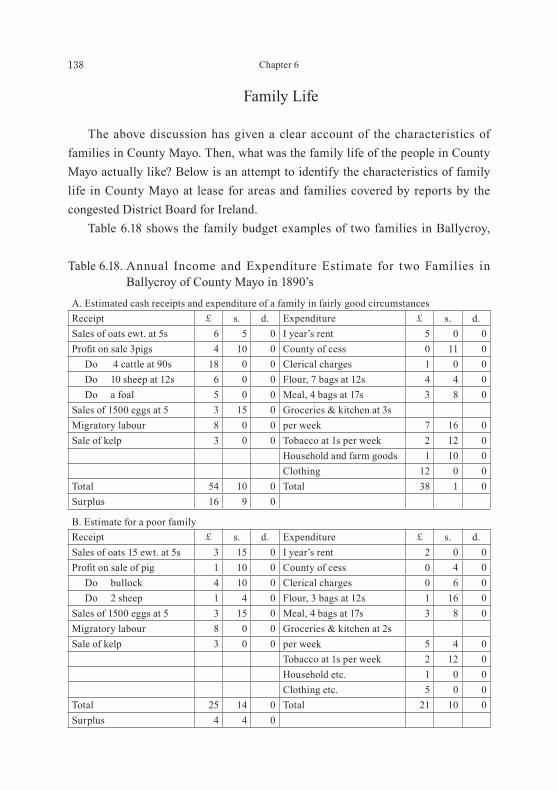
138 Chapter 6
Family Life
The above discussion has given a clear account of the characteristics of families in County Mayo. Then, what was the family life of the people in County Mayo actually like? Below is an attempt to identify the characteristics of family life in County Mayo at lease for areas and families covered by reports by the congested District Board for Ireland. Table 6.18 shows the family budget examples of two families in Ballycroy,
Table 6.18. Annual Income and Expenditure Estimate for two Families in Ballycroy of County Mayo in 1890’s
A. Estimated cash receipts and expenditure of a family in fairly good circumstances Receipt £ s. d. Expenditure £ s. d.Sales of oats ewt. at 5s 6 5 0 I year’s rent 5 0 0Profitonsale3pigs 4 10 0 County of cess 0 11 0 Do 4 cattle at 90s 18 0 0 Clerical charges 1 0 0 Do 10 sheep at 12s 6 0 0 Flour, 7 bags at 12s 4 4 0 Do a foal 5 0 0 Meal, 4 bags at 17s 3 8 0Sales of 1500 eggs at 5 3 15 0 Groceries & kitchen at 3sMigratory labour 8 0 0 per week 7 16 0Sale of kelp 3 0 0 Tobacco at 1s per week 2 12 0
Household and farm goods 1 10 0Clothing 12 0 0
Total 54 10 0 Total 38 1 0Surplus 16 9 0
B. Estimate for a poor familyReceipt £ s. d. Expenditure £ s. d.Sales of oats 15 ewt. at 5s 3 15 0 I year’s rent 2 0 0Profitonsaleofpig 1 10 0 County of cess 0 4 0 Do bullock 4 10 0 Clerical charges 0 6 0 Do 2 sheep 1 4 0 Flour, 3 bags at 12s 1 16 0Sales of 1500 eggs at 5 3 15 0 Meal, 4 bags at 17s 3 8 0Migratory labour 8 0 0 Groceries & kitchen at 2sSale of kelp 3 0 0 per week 5 4 0
Tobacco at 1s per week 2 12 0Household etc. 1 0 0Clothing etc. 5 0 0
Total 25 14 0 Total 21 10 0Surplus 4 4 0

139Household Structure of County Mayo in Ireland at early Twentieth Century
Westport Poor Law Union. The average cultivated land area in Ballycroy was 3.25 acres, and the appraised value of land was ₤4 or less. The cultivated area for oats was 1.5 acres, that for potatoes was 1.5 acres, and that for hay was 0.25 acres. Tenant farmers had commonage for large portions in mountain and barren regions, where they were allowed to pasture their cattle. Tenant famers used to fattenoxenuntiltheoxenbecamefourtofiveyearsold,andsellthematperiodicmarkets in Bangor, Erris, Mulranny, and Newport. In Ballycroy, 5,000 eggs were sent out weekly to Crossmolina and Westport to sell there. Moreover, about 125 people migrated to Lancashire as seasonal workers each year from June to October. The income of ₤8 obtained from the seasonal work is posted in the receipt section. The annual income of the wealthy family was ₤54, and that of the poor family was ₤25, about half of the income of the wealthy better off family. The reason for the difference in income lies in the difference in the area of the land held by each family (which can be seen in the land rent of ₤5 and ₤2 for respective family),whichinturnisreflectedinthenumberoflivestockheldbyeachfamily.The expenditures of the two families showed that the amount of money spent on wheat, food, and clothing by the poor family was half of that by the wealthy better off family. In this district, food and clothing were mainly purchased at a large Cleary shop [The Congested District Board for Ireland, Base Report, 331-333]. A survey report on the 18 districts of County Mayo was included in the report by the Congested District Board for Ireland. In the survey report, a family budget example of a wealthy family and that of a poor family in each of the 18 districts were given. It was found from these budget examples that the income range for wealthy families was from ₤32 to ₤75, while that for poor families was from ₤9 to ₤35, showing a major difference in income between wealthy and poor families. The poverty line was ₤30. The difference in income arose from differences in the amount of land held (expenditure for land rent), the total sales of livestock and eggs, and the income from seasonal work away from home. The increased income was used to purchase products at stores, which included cigarettes, f lowers, bacon, tea, sugar, clothing, shoes, and hats, etc. [E. L. Almquist, 1977, 274-76]. Hence, it indicates that the £30pounds poverty line coincides with the reference Age Pension as described below. For eating habits in Ballycroy and Achill,
140 Chapter 6
people generally had three meals a day, and sometimes four meals during the work season in spring. In Ballycroy, people had tea, wheat bread or potatoes for breakfast, potatoes and herrings for lunch, and tea and wheat bread or potatoes for dinner. In Achill, people had tea and wheat bread (tea and potatoes among the poor) for breakfast, potatoesandfishoreggs(withtea)forlunch,andpotatoes and milk or eggs for dinner and oatmeal was added into the menu in summer [The Congested District Board for Ireland, Base Report, 334, 341]. In short, their diet was very poor with potatoes as their staple food. TheEngel’scoefficientwasaround50percentofthetotalhouseholdincome in both wealthy and poor families. While people in these districts were self-sufficienttoacertaindegree,theywerenotinafully-self-sufficientorfreefromcommodity economy [Matsuo, 1998, 41] since they purchased products on credit at stores during spring and summer, and made payments for them with the money earned by working away from home [Matsuo, 1998, 42].
Conclusion
Generally in Ireland the author proposed a hypothesis that along with a change in dominant, the inheritance system from partible to impartible inheritance at the middle of the nineteenth century, and the stem family norm, where household heads held the patriarchal rights for a long time, and then passed them down to their heirs and supported family situational factors were gradually. Above the hypothesis of Irish family structure we guess County Mayo based on the principles for the formation of the stem family in Irish agricultural districts. In County Mayo, the change in the land inheritance system occurred later than other counties. This was because the divided inheritance system continued into the late 19th century, leading to an increase in small farmers. Factors that supported the lives of small farmers included the access to commonage in after relatively favoured areas, and in other area seasonal migration to England and Scotland to work, and the production and sale of eggs. Thehypothesiswasverifiedbasedontheindividualdataofthe1901and1911censuses. In County Mayo, 70 percent of the population was farmer’s occupiers, of which 23.2 percent constituted extended family households and multiple family households in 1901 and 25.7 percent in 1911. In particular, multiple
141Household Structure of County Mayo in Ireland at early Twentieth Century
family households, a typical household type of the stem family, accounted for 4.8 percent in 1901 and 5.4 percent in 1911, proving that the stem family was predominant. The predominant downward extension of multiple family households corresponded to the aging of household heads, which was interpreted to indicate that household heads maintained their patriarchal rights for a long time. In addition, a large number of lineal kin, including parents, spouses of children, and grandchildren, in the distribution of kin provided further evidence for the predominance of the stem family. The increase in the number of extended family households and multiple family households in 1911 was considered due to a little impact of the pension system introduced in 1908. Where the pension expense in the UK of 1910 accounted for £10 million, 0.4 percent of GNP, and a pensioner was 3.1 percent of population, but it was £2,400,000, 1.6 percent, 6.7 percent in Ireland, and the pension expense and numerousness of the number of the pensioners were recognized. Therefore, it is judged that the weight among the family budget incomes of the pension was higher. [C. Ó Gráda, 2007, 7]. In County Mayo, the person who received an old age pension for one-year term was 6.4 percent in 1911, and there was it next to County Cork. Accordingly, while the relationships between the pension system and the stem family were not fully examined in this chapter, it was assumed that the increase of compound family households after the pension system. Guinnane pointed out that the introduction of the pension system had served to accelerate the transfer of the farm to a son who was an heir, which resulted in an increase in multiple family households in 1911 [T. Guinnane, 1993, 280, do, 1996, 111]. This claim by Guinnane seems an appropriate interpretation of the increase of stem families after the introducing of pension policy, since it is an effective family strategy for parents and children to live together and share resources (The person at old age with annual income less than 30 pounds can receive the pension of maximum of 12 pounds one year). In addition, the pension system served to make up for the decreased income from seasonal work away from home. The reason that, compared to other counties, there were more stem families in County Mayo in 1911 than 1901 was that small farmers in the deprived region thought that maintaining a stem family would be an effective family strategy for their well-being.

142 Chapter 6
Thus, the hypothesis on the stem family in County Mayo the author proposed wasverified.

Chapter 7The Structure of Irish Households of early Twentieth Century:
comparing results for County Clare and County Meath
Introduction
In the previous chapter, as a study site the County Mayo was a small farmer’s area of western Ireland, it revealed that the stem family has been recognized quite remarkable. In this chapter, we compared a family of the County Clare which was western Irish medium-scale farm family area and the family of County Meath which was a large-scale farming area of eastern Ireland. As a result, we can thereby make clear that a stem family is more dominant in the small and medium scale area in western Ireland than the family of the County which was a large-scale farming area of eastern Ireland. In other words, we has previously looked at household structures in early twentieth century western Ireland, using the 1901 and 1911 census micro data, roughly 20 percent of households were extended family households and multiple family households. It was observed in particular that a stem family norm supported by the family situation was emerging. By contrast, there has been little or no research to date that analyzes the household structures of eastern Ireland, although its agriculture, agricultural communities and history have been studied by Matsuo [1995], Wilson [T. M. Wilson, 1984, 1985, 1988, and 1990], Gilligan [1998] and Connell [2004]. This chapter sets out to identify the differences between household structures in the west and east of Ireland, based on the 1901 and 1911 census micro data for County Clare, a region of medium farms surveyed by Arensberg and Kimball, and County Meath, Leinster Province, a region considered to have been advanced in the adoption of large agriculture.
Hypothesis on Household Structures
Based on analysis of microdata from censuses carried out between 1821 and 1911, the author has observed that the predominant family structure in early
144 Chapter 7
nineteenth century Ireland was the nuclear family, supported by the potentiality of expanding land for cultivation, ease of potato cultivation, a partible inheritance system, early marriage age, and high marriage rate [L. A. Clarkson, 1981, 237; Y. Shimizu, 2011, 2012, 2013, 2014a, 2014b]. Subsequent changes to the inheritance system, however, brought drastic changes to family structures. There is not a clear-cut date for the changes, but the shift to impartible inheritance probably
Map 7.1. County Clare and County Meath in Ireland
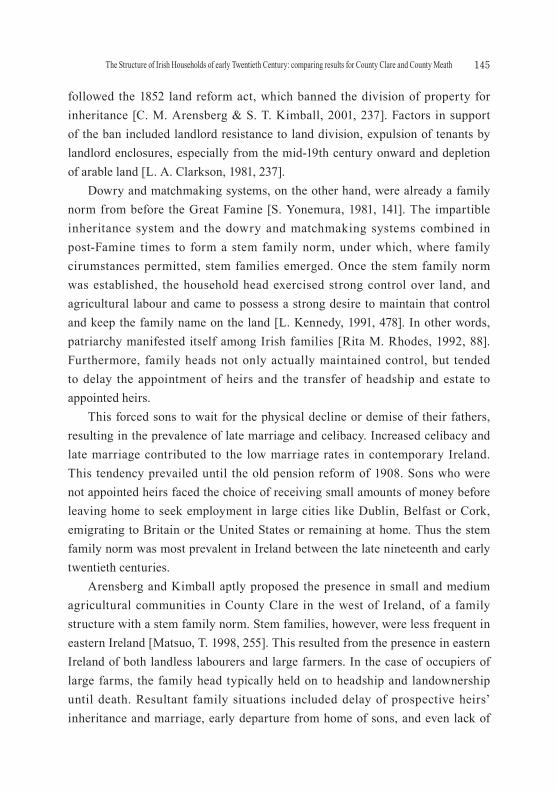
145The Structure of Irish Households of early Twentieth Century: comparing results for County Clare and County Meath
followed the 1852 land reform act, which banned the division of property for inheritance [C. M. Arensberg & S. T. Kimball, 2001, 237]. Factors in support of the ban included landlord resistance to land division, expulsion of tenants by landlord enclosures, especially from the mid-19th century onward and depletion of arable land [L. A. Clarkson, 1981, 237]. Dowry and matchmaking systems, on the other hand, were already a family norm from before the Great Famine [S. Yonemura, 1981, 141]. The impartible inheritance system and the dowry and matchmaking systems combined in post-Famine times to form a stem family norm, under which, where family cirumstances permitted, stem families emerged. Once the stem family norm was established, the household head exercised strong control over land, and agricultural labour and came to possess a strong desire to maintain that control and keep the family name on the land [L. Kennedy, 1991, 478]. In other words, patriarchy manifested itself among Irish families [Rita M. Rhodes, 1992, 88]. Furthermore, family heads not only actually maintained control, but tended to delay the appointment of heirs and the transfer of headship and estate to appointed heirs. This forced sons to wait for the physical decline or demise of their fathers, resulting in the prevalence of late marriage and celibacy. Increased celibacy and late marriage contributed to the low marriage rates in contemporary Ireland. This tendency prevailed until the old pension reform of 1908. Sons who were not appointed heirs faced the choice of receiving small amounts of money before leaving home to seek employment in large cities like Dublin, Belfast or Cork, emigrating to Britain or the United States or remaining at home. Thus the stem family norm was most prevalent in Ireland between the late nineteenth and early twentieth centuries. Arensberg and Kimball aptly proposed the presence in small and medium agricultural communities in County Clare in the west of Ireland, of a family structure with a stem family norm. Stem families, however, were less frequent in eastern Ireland [Matsuo, T. 1998, 255]. This resulted from the presence in eastern Ireland of both landless labourers and large farmers. In the case of occupiers of large farms, the family head typically held on to headship and landownership until death. Resultant family situations included delay of prospective heirs’ inheritance and marriage, early departure from home of sons, and even lack of
146 Chapter 7
heirs due to non-marriage of household heads. In the case of the households of landless labourers, offspring left home at an early age and could also form their own households at an early age if conditions allowed. Migration in Ireland is classified into internal migration, international migration and Atlantic migration [Steidl, Annemarie, 2007, 1-2; Steidl, Annemarie, 2009, 7-9]. A factor that encouraged internal migration in County Meath was the labour market in the adjacent capital, Dublin. Employment in Dublin and emigration to Britain or the U. S. were options for landless labourers and their children. This can be deduced, as described below, from the small number of continuing households in County Meath over the decade between 1901 and 1911, especially from the fact that cases of discontinued households and of new households were frequent among labourers. However, such household mobility was less pronounced in County Clare. For Clare’s medium-sized and larger rural households, staying put until succeeding to parental land was a more advantageous family strategy than moving elsewhere. In County Clare, households were typically formed by arranged marriages at the time of inheritance. In County Meath, on the other hand, heirs could either marry immediately upon inheritance, or choose to adopt a strategy of remaining single while running the family farm with the aid of siblings who remained at home. As landholdings of 100 acres or more required hired agricultural labour or servants in addition to family labour, unmarried siblings remaining at home were an important component of the workforce. The household structures of County Meath included a larger number of landholders who either married late in life or remained single than in County Clare. This also was likley to create a higher likelihood of internal, international andAtlanticmigrationamongresidents,afeaturewhichisalsoreflectedinthecounty’s population structure. From the above, it is possible to hypothesize that while households in both County Meath and County Clare were based on the stem family norm, family situational factors controlling the stem family norm became more varied in County Meath, resulting in lower occurrences of extended and multiple family households, and greater degrees of family dissolution and diversity in household formation type, compared to County Clare.
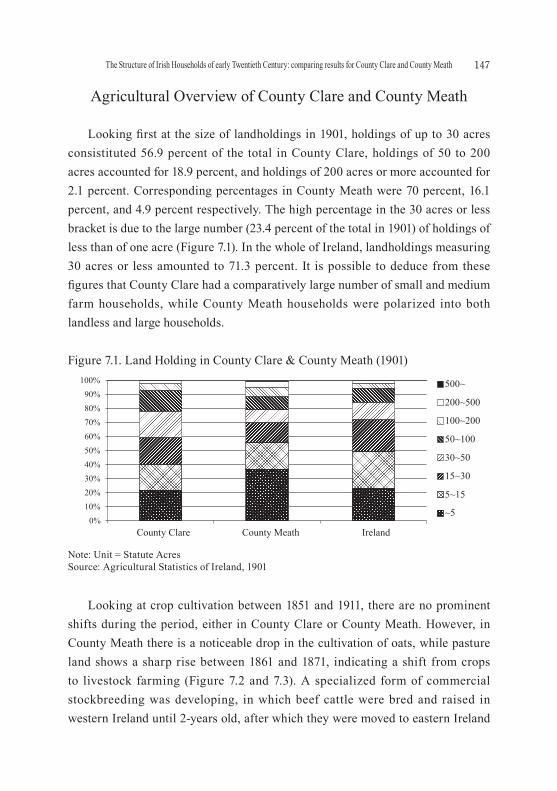
147The Structure of Irish Households of early Twentieth Century: comparing results for County Clare and County Meath
Agricultural Overview of County Clare and County Meath
Lookingfirstat thesizeoflandholdingsin1901,holdingsofupto30acresconsistituted 56.9 percent of the total in County Clare, holdings of 50 to 200 acres accounted for 18.9 percent, and holdings of 200 acres or more accounted for 2.1 percent. Corresponding percentages in County Meath were 70 percent, 16.1 percent, and 4.9 percent respectively. The high percentage in the 30 acres or less bracket is due to the large number (23.4 percent of the total in 1901) of holdings of less than of one acre (Figure 7.1). In the whole of Ireland, landholdings measuring 30 acres or less amounted to 71.3 percent. It is possible to deduce from these figuresthatCountyClarehadacomparativelylargenumberofsmallandmediumfarm households, while County Meath households were polarized into both landless and large households.
Looking at crop cultivation between 1851 and 1911, there are no prominent shifts during the period, either in County Clare or County Meath. However, in County Meath there is a noticeable drop in the cultivation of oats, while pasture land shows a sharp rise between 1861 and 1871, indicating a shift from crops to livestock farming (Figure 7.2 and 7.3). A specialized form of commercial stockbreeding was developing, in which beef cattle were bred and raised in western Ireland until 2-years old, after which they were moved to eastern Ireland
0%10%20%30%40%50%60%70%80%90%
100%
Ireland
500~
200~500
100~200
50~100
30~50
15~30
5~15
~5
County Clare County Meath
Figure 7.1. Land Holding in County Clare & County Meath (1901)
Note: Unit = Statute AcresSource: Agricultural Statistics of Ireland, 1901

148 Chapter 7
to be fattened until they were 2½ to 3½ years old for markets in Dublin or Britain [David Seth Jones, 1995, 4]. This development is evidenced by shifts in livestock numbers: the total number of cattle showed an increase in both County Clare and County Meath: in County Clare the number of cattle aged up to two years oldincreased,whileinCountyMeaththerewasasignificant increaseincattle aged above two. Another difference between the two counties is that pigs and poultry increased while sheep decreased in County Clare, in contrast to County Meath, where both cattle and sheep increased under the apparent shift from crop
0
100,000
200,000
300,000
400,000
500,000
600,000
1851 1861 1871 1881 1891 1901 1911
Potatoes
Rye
Wheat
Oats
Barly
Turnips
Cabbage
Hay
Pasture
Figure 7.2. Area under crops and pasture in County Clare
Figure 7.3. Areas under Crops and Pasture in County Meath
Source: Agricultural Statistics, 1847-1926, 1930.
0
50,000
100,000
150,000
200,000
250,000
300,000
350,000
400,000
450,000
1911
Potatoes
Rye
Wheat
Oats
Barly
Turnips
Cabbage
Hay
Pasture
1851 1861 1871 1881 1891 1901

149The Structure of Irish Households of early Twentieth Century: comparing results for County Clare and County Meath
farming to livestock farming (Figure. 7.4, 7.5, and 7.6), another indication that the division of roles between western Ireland, where cattle were bred, and eastern Ireland, where cattle were fattened, was becoming established. The next part of theparagraphwill lookattheramificationsthisregionaldifferentiationhashadon the household structures of western Ireland, where traditional farming was prevalent, and of eastern Ireland, where more advanced commercial farming was
Figure 7.4. Number of Live Stock in County Clare
Source: Agricultural Statistics 1847-1926, 1930.
0
100,000
200,000
300,000
400,000
500,000
600,000
Cattle ~1
Cattle 1~2
Cattle ~2
Milk Cow
Pigs
Poultry
Sheeps
19111861 1871 1881 1891 1901
Figure 7.5. Number of Live Stock in County Meath
Source: Agricultural Statistics 1847-1926, 1930.
0
100,000
200,000
300,000
400,000
500,000
600,000
Cattle ~1
Cattle 1~2
Cattle ~2
Milk Cow
Pigs
Poultry
Sheeps
19111861 1871 1881 1891 1901
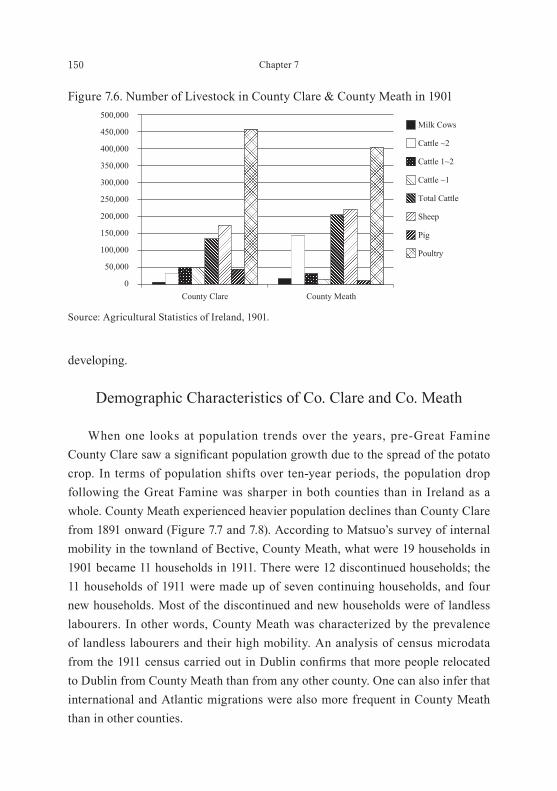
150 Chapter 7
developing.
Demographic Characteristics of Co. Clare and Co. Meath
When one looks at population trends over the years, pre-Great Famine CountyClaresawasignificantpopulation growth due to the spread of the potato crop. In terms of population shifts over ten-year periods, the population drop following the Great Famine was sharper in both counties than in Ireland as a whole. County Meath experienced heavier population declines than County Clare from 1891 onward (Figure 7.7 and 7.8). According to Matsuo’s survey of internal mobility in the townland of Bective, County Meath, what were 19 households in 1901 became 11 households in 1911. There were 12 discontinued households; the 11 households of 1911 were made up of seven continuing households, and four new households. Most of the discontinued and new households were of landless labourers. In other words, County Meath was characterized by the prevalence of landless labourers and their high mobility. An analysis of census microdata fromthe1911censuscarriedoutinDublinconfirmsthatmorepeoplerelocatedto Dublin from County Meath than from any other county. One can also infer that international and Atlantic migrations were also more frequent in County Meath than in other counties.
500,000
450,000
400,000
350,000
300,000
250,000
200,000
150,000
100,000
50,000
0County MeathCounty Clare
Cattle ~1
Cattle 1~2
Cattle ~2
Milk Cows
Total Cattle
Sheep
Pig
Poultry
Figure 7.6. Number of Livestock in County Clare & County Meath in 1901
Source: Agricultural Statistics of Ireland, 1901.
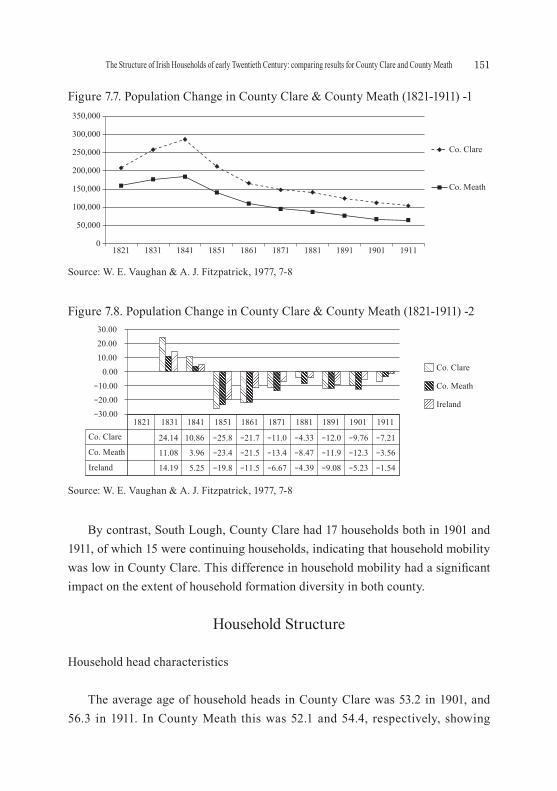
151The Structure of Irish Households of early Twentieth Century: comparing results for County Clare and County Meath
By contrast, South Lough, County Clare had 17 households both in 1901 and 1911, of which 15 were continuing households, indicating that household mobility waslowinCountyClare.Thisdifferenceinhouseholdmobilityhadasignificantimpact on the extent of household formation diversity in both county.
Household Structure
Household head characteristics
The average age of household heads in County Clare was 53.2 in 1901, and 56.3 in 1911. In County Meath this was 52.1 and 54.4, respectively, showing
Co. Clare
Co. Meath
0
50,000
100,000
150,000
200,000
250,000
300,000
350,000
1821 1831 1841 1851 1861 1871 1881 1891 1901 1911
Figure 7.7. Population Change in County Clare & County Meath (1821-1911) -1
Source: W. E. Vaughan & A. J. Fitzpatrick, 1977, 7-8
Co. Clare
Co. Meath
Ireland
-30.00
-20.00
-10.000.00
10.0020.0030.00
Co. Clare
Co. Meath
Ireland
-1.54
1821 1831 1841 1851 1861 1871 1881 1891 1901 1911
24.14 10.86 -25.8 -21.7 -11.0 -4.33 -12.0 -9.76 -7.21
11.08 3.96 -23.4 -21.5 -13.4 -8.47 -11.9 -12.3 -3.56
14.19 5.25 -19.8 -11.5 -6.67 -4.39 -9.08 -5.23
Figure 7.8. Population Change in County Clare & County Meath (1821-1911) -2
Source: W. E. Vaughan & A. J. Fitzpatrick, 1977, 7-8
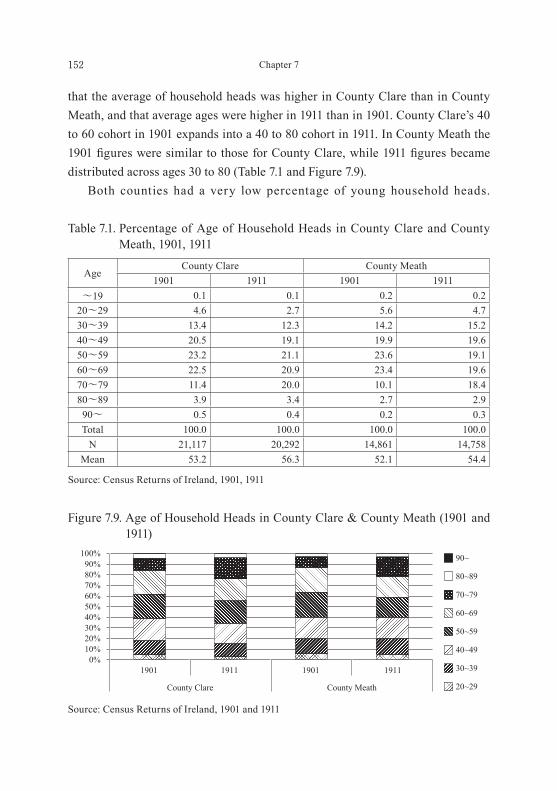
152 Chapter 7
that the average of household heads was higher in County Clare than in County Meath, and that average ages were higher in 1911 than in 1901. County Clare’s 40 to 60 cohort in 1901 expands into a 40 to 80 cohort in 1911. In County Meath the 1901figuresweresimilartothoseforCountyClare,while1911figuresbecamedistributed across ages 30 to 80 (Table 7.1 and Figure 7.9). Both counties had a very low percentage of young household heads.
Table 7.1. Percentage of Age of Household Heads in County Clare and County Meath, 1901, 1911
AgeCounty Clare County Meath
1901 1911 1901 1911~19 0.1 0.1 0.2 0.2
20~29 4.6 2.7 5.6 4.7 30~39 13.4 12.3 14.2 15.2 40~49 20.5 19.1 19.9 19.6 50~59 23.2 21.1 23.6 19.1 60~69 22.5 20.9 23.4 19.6 70~79 11.4 20.0 10.1 18.4 80~89 3.9 3.4 2.7 2.9
90~ 0.5 0.4 0.2 0.3 Total 100.0 100.0 100.0 100.0
N 21,117 20,292 14,861 14,758Mean 53.2 56.3 52.1 54.4
Source: Census Returns of Ireland, 1901, 1911
0%10%20%30%40%50%60%70%80%90%
100%
1911
County MeathCounty Clare
1901 1911 1901
60~69
70~79
80~89
90~
50~59
40~49
30~39
20~29
Figure 7.9. Age of Household Heads in County Clare & County Meath (1901 and 1911)
Source: Census Returns of Ireland, 1901 and 1911
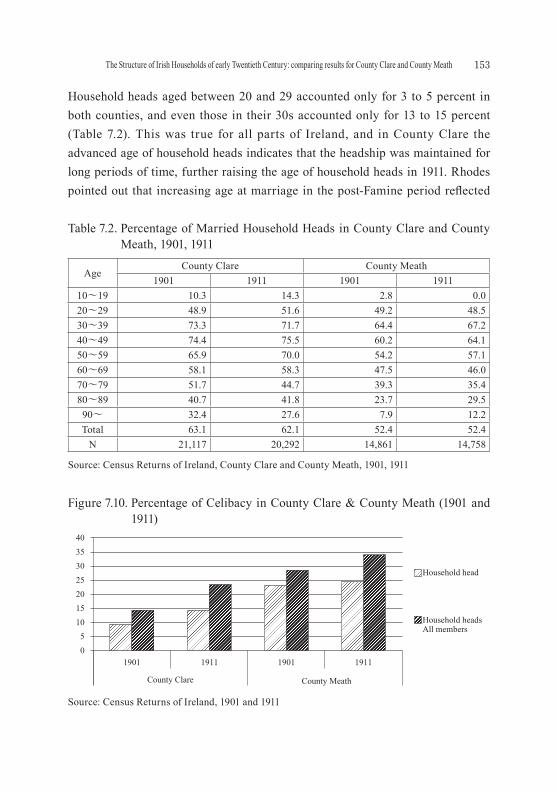
153The Structure of Irish Households of early Twentieth Century: comparing results for County Clare and County Meath
Household heads aged between 20 and 29 accounted only for 3 to 5 percent in both counties, and even those in their 30s accounted only for 13 to 15 percent (Table 7.2). This was true for all parts of Ireland, and in County Clare the advanced age of household heads indicates that the headship was maintained for long periods of time, further raising the age of household heads in 1911. Rhodes pointed out that increasing age at marriage in the post-Famineperiodreflected
Table 7.2. Percentage of Married Household Heads in County Clare and County Meath, 1901, 1911
AgeCounty Clare County Meath
1901 1911 1901 191110~19 10.3 14.3 2.8 0.0 20~29 48.9 51.6 49.2 48.5 30~39 73.3 71.7 64.4 67.2 40~49 74.4 75.5 60.2 64.1 50~59 65.9 70.0 54.2 57.1 60~69 58.1 58.3 47.5 46.0 70~79 51.7 44.7 39.3 35.4 80~89 40.7 41.8 23.7 29.5
90~ 32.4 27.6 7.9 12.2 Total 63.1 62.1 52.4 52.4
N 21,117 20,292 14,861 14,758
Source: Census Returns of Ireland, County Clare and County Meath, 1901, 1911
Figure 7.10. Percentage of Celibacy in County Clare & County Meath (1901 and 1911)
Source: Census Returns of Ireland, 1901 and 1911
05
10152025303540
Household head
Household headsAll members
1901 1911 1901 1911
County Clare County Meath

154 Chapter 7
these concerns as did the aging of the farmer class itself. The percentage of farmers 65 years and over almost doubled from 17.8 percent in 1871 to 33.3 percent in 1911 [Rita M. Rhodes, 1992, 88-9]. County Meath also shows this characteristic, although younger members of its population were more likely to become household heads than their counterparts in County Clare, because early marriages were more likely among landless labourers. The proportion of married household heads was higher in County Clare than in County Meath: in 1901, 63.1 percent of County Clare’s household heads were married, and 62.1 percent in 1911 (Table 7.2 and Figure 7.11). In County Meath the percentage was 52.4 in both years. In both years, household heads in their 40s were the most likely to be married in County Clare, while in County Meath the highest proportion of married household heads was found in the 30s age cohort. The proportion who never married among County Clare’s general population was 14.3 percent in 1901, and 23.5 percent in 1911. Among County Clare’s household heads, the proportion who never married was 9.3 percent in 1901, and 14.3 percentin1911.InCountyMeath,thefigureswere28.5percentand34.0percentfor the general population, and 23.1 percent and 24.4 percent for household heads. County Meath had a lower proportion of married household heads, and the county’s proportion who never married was far higher than in County Clare (Figure 7.10). In other words, County Clare is characterized by a higher proportion
0
10
20
30
40
50
60
70
80
10~19
Co. Clare 1901
Co. Clare 1911
Co. Meath 1901
Co. Meath 1911
90~80~8970~7960~6950~5940~4930~3920~29
Figure 7.11. Percentage of Marriages among Household Heads in County Clare and County Meath
Source: Census Returns of Ireland, County Clare and County Meath, 1901 and 1911

155The Structure of Irish Households of early Twentieth Century: comparing results for County Clare and County Meath
of household heads who married late in life and County Meath by a higher proportion of household heads who never married. These distinct marital trends significantly impacted the formation of households. In County Clare, the wait to inherit resulted in late marriages, and in County Meath, lifelong celibacy contributed to the formation of co-resident sibling households. A look at the percentage of household heads engaged in occupations with shares of 0.5 percent or more among the 414 occupational categories [Schurer, Kevin & Matthew Woollard, 2002, 46-52] reveals that farmers ranked as the top occupation among County Clare household heads in both 1901 and 1911, at
Table 7.3. Percentage of Occupation of Household Heads in County Clare and County Meath, 1901, 1911
County County Clare County MeathCode Occupation 1901 1911 1901 1911
2 CivilServants(officersandclerks) 0.4 0.6 0.2 0.25 Police 0.7 0.9 0.5 0.1
12 Army Pensioners 0.5 0.2 0.1 0.133 Teachers 0.8 0.8 0.1 0.655 Domestic Gardeners 0.1 0.1 0.3 0.556 Domestic Indoor Servants 3.7 1.4 3.8 1.162 Charwomen 0.3 0.1 0.5 0.281 OtherRailwayOfficialsandServants 0.3 0.3 0.4 0.584 Coachmen 0.3 0.2 0.5 0.5
100 Farmers 56.8 56.8 46.5 44.4103 Agricultural Laborers 6.6 5.4 18.3 20.6104 Shepherds 0.9 1.6 3.7 3.6112 Gardeners (not domestic) 0.2 0.1 0.6 0.5114 Grooms, Horse Keepers 0.0 0.0 0.6 0.8121 Fishermen 0.8 0.1 0.1 0.1168 Carpenters, Joiners 0.9 0.9 1.5 1.7214 Innkeepers, Hotel Keepers, Publicans 1.3 1.1 0.9 1.0236 Grocers 0.6 0.7 0.4 0.4282 Tailors 0.8 0.7 0.7 0.5290 Shoe, Boot-Makers, Traders 0.9 0.7 0.9 0.7377 Blacksmiths 0.6 0.6 0.6 0.8399 General Shopkeepers, Traders 2.4 2.2 0.6 0.4404 General Labourers 5.4 5.8 8.4 12.9
N 20,873 20,085 11,900 10,747
Note: over 0.5% of total occupationSource: Census Returns for Ireland, Co. Clare and Co. Meath, 1901 and 1911
156 Chapter 7
56.8 percent in both years. This was followed by agricultural labourers at 6.6 percent in 1901, and 5.4 percent in 1911, general labourers at 5.4 percent and 5.8 percent, servants at 3.7 percent and 1.4 percent, shopkeepers at 2.4 percent and 2.2 percent, and inn and hotel keepers and publicans at 1.3 percent and 1.1 percent (Table 7.3). In County Meath, farmers ranked top, at 46.5 percent and 44.4 percent in 1901 and 1911 respectively, followed by agricultural labourers at 18.3 percent and 20.6 percent, general labourers at 8.4 percent and 12.9 percent, shepherds at 3.7 percent and 3.6 percent, and servants at 3.8 percent and 1.1 percent (Table 7.3). The prevalence in County Meath of agricultural labourers and shepherds is a clear indication of the predominance of large livestock farming in the county. The prevalence of general labourers, [i.e. labourer who were not agricultural labourers] on the other hand, must have been the result of pull factors such as labour markets in the county towns of Navan, Trim and Kells, as well as neighboring Dublin. By comparison, County Clare was a more traditional agricultural region, although it had towns such as Ennis, Ennistymon and Kilrush. Unlike County Meath, it lacked a large city in its immediate vicinity. The following part of the report will examine how differences in the pattern of household heads affected household structures in the two counties.
Household Size
The average number of household members in County Clare was 5.2 persons in 1901 and 5.0 persons in 1911. In County Meath this was 4.4 and 4.3 persons, respectively, meaning that there was a difference of 0.7 to 0.8 persons between the two counties. A closer look reveals that County Meath had a large proportion of households comprising one to four people, unlike County Clare, which had a greater proportion of households with four or more household members, a contrastthatisreflectedinthedifferenceinaveragehousehold size between the two counties (Figure 7.12). Factors that affected household size most are thought to be the number of children and co-resident non-relatives. The average number of children County Clare was 3.6 in 1901, and 3.5 in

157The Structure of Irish Households of early Twentieth Century: comparing results for County Clare and County Meath
6
8
3
109
11~
54
21
7
11~ 2.02.13.23.910 1.91.92.93.3
9 3.03.54.55.48 4.65.06.57.47 6.97.09.09.46 9.39.911.311.45 12.54 14.93 16.32 17.71 10.810.36.16.2
0%10%20%30%40%50%60%70%80%90%
100%
19111901 1911 1901County Clare County Meath
13.314.313.212.2
13.815.314.812.6
12.314.716.716.6
Figure 7.12. Size of Households in County Clare & County Meath (1901 and 1911)
Source: Census Returns of Ireland, County Clare and County Meath, 1901 and 1911
Table 7.4. Percentage of Children in Households in County Clare and County Meath, 1901, 1911
County Clare County MeathNumber 1901 1911 1901 1911
1 18.9 19.7 23.6 24.4 2 18.5 21.0 21.8 21.5 3 17.4 17.5 17.5 18.8 4 14.0 14.3 13.8 13.2 5 10.9 10.3 9.3 9.3 6 8.3 7.1 6.6 5.7 7 5.8 4.8 3.9 3.8 8 3.1 2.7 2.1 2.0 9 1.8 1.6 0.9 0.8
10- 1.3 1.1 0.4 0.6 Total 100.0 100.0 100.0 100.0
N 15,833 14,911 9,762 9,041Mean 3.63 3.46 3.18 3.12
Source: Census Returns for Ireland, 1901 and 1911
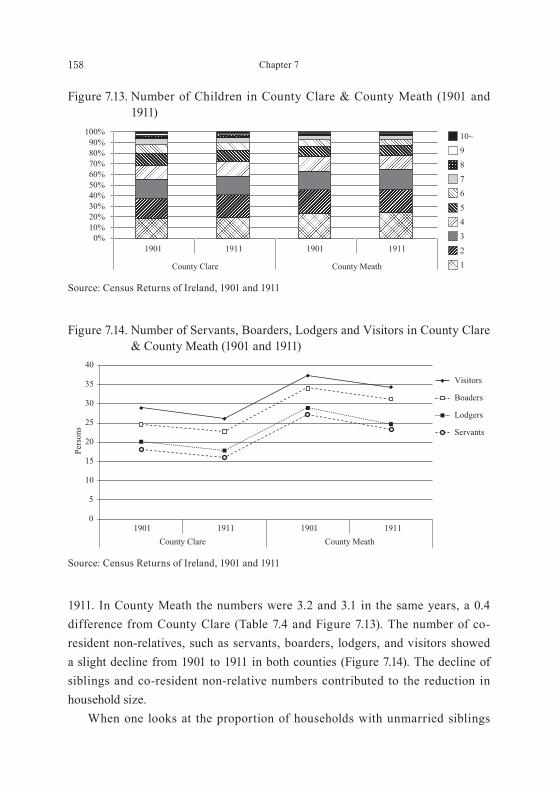
158 Chapter 7
1911. In County Meath the numbers were 3.2 and 3.1 in the same years, a 0.4 difference from County Clare (Table 7.4 and Figure 7.13). The number of co-resident non-relatives, such as servants, boarders, lodgers, and visitors showed a slight decline from 1901 to 1911 in both counties (Figure 7.14). The decline of siblings and co-resident non-relative numbers contributed to the reduction in household size. When one looks at the proportion of households with unmarried siblings
0%10%20%30%40%50%60%70%80%90%
100%
19111901 1911 1901
6
8
3
10~
9
5
4
2
1
7
County Clare County Meath
Figure 7.13. Number of Children in County Clare & County Meath (1901 and 1911)
Source: Census Returns of Ireland, 1901 and 1911
Figure 7.14. Number of Servants, Boarders, Lodgers and Visitors in County Clare & County Meath (1901 and 1911)
Source: Census Returns of Ireland, 1901 and 1911
0
5
10
15
20
25
30
35
40
Pers
ons
1911County MeathCounty Clare
1911 19011901
Lodgers
Visitors
Servants
Boaders

159The Structure of Irish Households of early Twentieth Century: comparing results for County Clare and County Meath
byage,inCountyClarethefiguresformalesdropat25-29inbothyears,whilefemales begin to decline at 20-24. Results were similar in County Meath where, however, the marriage rate was lower than in County Clare. Figures for County Clare males aged between 30 and 39 were 7.7 percent in 1901, and 10.9 percent in 1911. In County Meath this was 8.9 percent and 11.0 percent (Table 7.5). Two factors contributed to the result: postponement of marriage until inheritance, and the rise of the proportion never married, which became a nationwide trend in Ireland from around 1881.
Household Types
When one looks at the households in County Clare and County Meath according to the Hammel=Laslett household classification [E. A. Hammel and P. Laslett, 1974, 96], simple family households were the most prevalent type in County Clare, accounting for 62.6 percent of households in 1901, and 61.3 percent in 1911. This was followed by extended family households, which accounted for 18.5 percent and 18.7 percent respectivey, no-family households at 8.9 percent and 10.0 percent, and solitaries at 6.1 percent. Extended family households
Table 7.5. Percentage of Unmarried Children by Age Cohort in County Clare and County Meath, 1901, 1911
County Clare County Meath1901 1911 1901 1911
Male Female Male Female Male Female Male Female0~4 14.8 17.5 14.9 18.0 16.1 18.4 16.6 20.3 5~9 17.8 20.0 17.2 19.5 17.1 19.8 17.6 21.1
10~14 18.2 20.4 17.0 19.6 17.3 19.9 16.1 19.4 15~19 16.5 18.5 15.9 16.9 15.2 16.2 13.7 14.1 20~24 14.1 13.0 12.1 11.2 13.9 12.4 11.7 9.5 25~29 9.5 6.7 8.5 7.2 9.3 7.5 9.0 7.1 30~34 5.3 2.4 6.4 4.0 5.9 3.1 6.7 3.9 35~39 2.4 0.9 4.5 2.0 3.0 1.4 4.3 2.5 40~44 0.9 0.4 2.1 0.8 1.3 0.7 2.3 1.1 45~49 0.4 0.2 1.4 0.7 0.8 0.6 2.0 1.1 Total 100.0 100.0 100.0 100.0 100.0 100.0 100.0 100.0
N 31,170 25,556 27,931 22,861 16,030 13,303 15,461 12,204
Source: Census Returns for Ireland, 1901 and 1911

160 Chapter 7
0%10%20%30%40%50%60%70%80%90%
100%
1911
County MeathCounty Clare
5. Multiple family households
4. Extended family households
3. Simple family households
2. No family
1. Solitaries1901 1911 1901
Figure 7.15. Type of Households in County Clare & County Meath (1901 and 1911)
Source: Census Returns of Ireland, 1901 and 1911
Table 7.6. Composition of Households in County Clare and County Meath, 1901, 1911
County County Clare County MeathCategories Class 1901 1911 1901 1911
1. Solitaries1a Widow 3.2 2.4 3.2 3.1 1b Single 3.0 3.7 7.1 7.8
2. No family2a Co-residence siblings 4.0 5.2 8.9 9.0 2b Co-residence kin 2.7 2.6 4.5 4.7 2c Persons not related 2.3 2.3 3.6 4.0
3. Simple family households
3a Married couple 5.9 6.0 6.8 7.6 3b Married couple with children 38.6 37.9 34.1 33.7 3c Widowers with children 5.1 4.9 5.2 4.7 3d Widows with children 13.0 12.6 12.7 11.7
4. Extended family households
4a Extended upwards 7.1 7.2 3.3 3.3 4b Extended downwards 5.8 5.6 5.1 5.0 4c Extended laterally 4.3 4.9 3.6 3.3 4d Combinations of 4a-4c 1.3 1.0 0.6 0.6
5. Multiple family households
5a Secondary units upwards 1.7 2.0 0.3 0.3 5b Secondary units downwards 2.0 1.8 1.0 1.1 5c Secondary units lateral 0.0 0.0 0.0 0.0 5d Frdreches 0.0 0.0 0.0 0.0 5e Other multiple family households 0.0 0.0 0.1 0.1
Total 100.0 100.0 100.0 100.0 N 20,833 20,347 14,853 14,733
Source: Census Returns for Ireland, County Clare & County Meath, 1901, 1911

161The Structure of Irish Households of early Twentieth Century: comparing results for County Clare and County Meath
and multiple family households combined made up 22.2 percent in 1901 and 22.5 percent in 1911. Since it has already been verified that extended family households and multiple family households accounted for roughly 20 percent of households in western Ireland, County Clare can be seen as typical of the region. In County Meath, on the other hand, simple family households amounted to 59.1 percent of households in 1901, and 57.6 percent in 1911. No-family households occupied a 23.8 percent share in 1901 and 17.6 percent share in 1911. The share of solitaries also increased sharply from 3.2 percent in 1901 to 10.9 percent in 1911 (Figure 7.15 and Table 7.6). County Meath had lower percentages of extended family households and multiple family households than County Clare. In both years, they accounted for only 3.8 percent of County Meath households. Compared with County Clare, County Meath had a distinctly higher proportion of solitaries and no-family households, and lower proportions of extended family households and multiple family households. The prevalence of solitaries and no-family households was interpreted by Matsuo as an indication of loosening familial bonds [T. Matsuo, 1998, 260]. If one takes a closer look at each class of household, in County Clare where there was less variety in family strategy than in County Meath, a farm household would have been formed in the wake of inheritance and an arranged marriage based on a dowry system, after the household head’s demise. Such a family strategy must have been the most appropriate choice for County Clare’s many small and medium-sized farm households. County Meath households were characterized by a high occurrence of unmarried persons among solitaries, and high frequency of co-resident siblings, relatives and non-relatives constituting no-family households. The low occurrence of upward and lateral extensions among extended family households, and the low occurrence of upward extensions among multiple family households were also characteristic of County Meath households. Such characteristics had not been observed in western Ireland. Several factors coincided to bring about these characteristics. Prolonged household headship by the parent forced offspring to wait for the parent’s physical decline or demise before succeeding to landholdings and headship, which increased the likelihood of the heir delaying marriage and maintaining co-

162 Chapter 7
residence with siblings. There was also the possibility of the mother becoming the heir after the death of the father, in which case offspring came into their inheritance only after the mother’s death, further delaying marriage. Furthermore, when it finally came to marriage by matchmaking, heirs of small and medium farm households, who had aged in the process of waiting for inheritance, had moredifficultyfindingmatchescomparedtoheirs of large farm households who couldfindlocalmatchesmorereadily[Irish Folklore Commission, manuscript, 1460]. Offspring of County Meath farm households were more likely to remain at home, increasing their chances of remaining single. Unmarried, only-child heirs would have chosen to co-reside with relatives or non-relatives. More choice was available to offspring of labourer households, including seeking employment in surrounding areas or in Dublin, or emigrating to Britain or the U. S., which in turn would have increased their likelihood of leaving parental homes at an early age to start new families. If all siblings left home early, this could create households composed of married couples without children, and an absence of heirs. In that case, available options included bringing a sibling back as heir to the parental household, transferring the inheritance to offspring of relatives or selling off the landholding. Heirs of large farm households in County Meath, however, were more likely to wait for their inheritance, in the meantime taking part in running the family farm under the control of the household head, rather than leave home. This diversity of possible family strategies resulted in the diversity of County Meath’s household structures. The polarization of County Meath households into large farm households and landless farm households contributed to the formation of households adapted to diverse family strategies. Although multiple family households accounted only for 1.3 to 1.4 percent of County Meath households, the combined sum of multiple family households and extended family households accounted for 13.8 percent, which may be interpreted as an indication of the presence of a stem family norm, suggesting the possibility that in farm households, family circumstances might favour the stem family norm in eastern Ireland as well. To find out which occupations were most likely among extended family households and multiple family households, these households were divided into farmers, labourers and others. Among County Clare farming households, 22.0
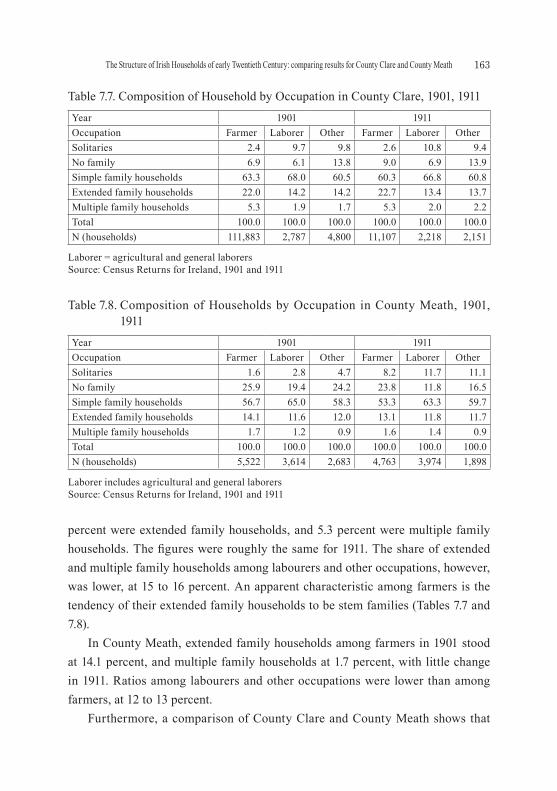
163The Structure of Irish Households of early Twentieth Century: comparing results for County Clare and County Meath
percent were extended family households, and 5.3 percent were multiple family households.Thefigureswereroughlythesamefor1911.Theshareofextendedand multiple family households among labourers and other occupations, however, was lower, at 15 to 16 percent. An apparent characteristic among farmers is the tendency of their extended family households to be stem families (Tables 7.7 and 7.8). In County Meath, extended family households among farmers in 1901 stood at 14.1 percent, and multiple family households at 1.7 percent, with little change in 1911. Ratios among labourers and other occupations were lower than among farmers, at 12 to 13 percent. Furthermore, a comparison of County Clare and County Meath shows that
Table 7.7. Composition of Household by Occupation in County Clare, 1901, 1911Year 1901 1911Occupation Farmer Laborer Other Farmer Laborer OtherSolitaries 2.4 9.7 9.8 2.6 10.8 9.4 No family 6.9 6.1 13.8 9.0 6.9 13.9 Simple family households 63.3 68.0 60.5 60.3 66.8 60.8 Extended family households 22.0 14.2 14.2 22.7 13.4 13.7 Multiple family households 5.3 1.9 1.7 5.3 2.0 2.2 Total 100.0 100.0 100.0 100.0 100.0 100.0 N (households) 111,883 2,787 4,800 11,107 2,218 2,151
Laborer = agricultural and general laborersSource: Census Returns for Ireland, 1901 and 1911
Table 7.8. Composition of Households by Occupation in County Meath, 1901, 1911
Year 1901 1911Occupation Farmer Laborer Other Farmer Laborer OtherSolitaries 1.6 2.8 4.7 8.2 11.7 11.1 No family 25.9 19.4 24.2 23.8 11.8 16.5 Simple family households 56.7 65.0 58.3 53.3 63.3 59.7 Extended family households 14.1 11.6 12.0 13.1 11.8 11.7 Multiple family households 1.7 1.2 0.9 1.6 1.4 0.9 Total 100.0 100.0 100.0 100.0 100.0 100.0 N (households) 5,522 3,614 2,683 4,763 3,974 1,898
Laborer includes agricultural and general laborersSource: Census Returns for Ireland, 1901 and 1911

164 Chapter 7
the numerical values ref lect countywide tendencies as described earlier. In County Clare, extended family households and multiple family households were found more frequently among farmers than in other occupations, while in County Meath, there was no noticeable difference between occupations in the frequency of extended and multiple family households. However, no-family households occurred more frequently with farmers than with other occupations, and solitaries were more frequent among farmers. This can be seen as a manifestation of the situation in which the heir did not form a family immediately after inheriting the property on a parent’s death.
Number of Kin
Discussed here are the numbers of co-resident relatives per 100 households, according to the relative’s relationship to the household head. The household head, spouse and their children are excluded [R. Wall, 1983, 500]. The number of relatives in County Clare was 51.3 persons in 1901, and 53.9 persons in 1911. In County Meath this was 46.9 persons and 49 persons in respective years. County Clare surpassed County Meath by 4.4 persons in 1901, and 4.9 persons in 1911 (Table7.9).ThesefiguresindicatethatCountyMeathhadfewerextended family households and multiplefamilyhouseholdsthanCountyClare,althoughfiguresfor County Clare were lower than County Donegal’s 70 to 90 persons, and higher than England’s 32 persons [R. Wall,1983,500].ThefiguresforCountyClarearethought to be close to the average for Ireland. A more detailed look reveals that the occurrence of stem family variables such as parents, children in law (many of whom were spouses of children) and grandchildren was more pronounced in County Clare than in County Meath (Figure 7.16 and Table 7.9). In County Meath such variables occurred less frequently, meaning there were fewer stem families. Siblings, on the other hand, occurred more frequently in County Meath, corresponding to the higher frequency of no-family households. The number of servants declined throughout the whole of Ireland after 1901 [R. Breen, 1983, 88]. Likewise in County Meath the number of servants declined from 27 in 1901 to 23 in 1911, but this still exceeded County Clare’s 7 to 9 servantsbyafairmargin,reflectingthelargerscaleoffarmoperationsinCounty

165The Structure of Irish Households of early Twentieth Century: comparing results for County Clare and County Meath
Meath.
Life Course of Household Heads and Formation of Households
As mentioned earlier, as a desire existed among household heads to hold on
Table 7.9. Resident Relatives and others by Relationship to Household Head in County Clare & County Meath by per 100 households
County County Clare County MeathRelation 1901 1911 1901 1911
Parents 8.7 9.6 2.7 2.3Siblings 14.2 16.8 21.6 20.9Siblings in law 2.0 2.1 1.8 1.8Children in law 3.5 3.4 1.2 2.5Nephews and Nieces 7.4 6.5 9.1 8.4Grandchildren 12.7 11.8 8.9 9.8Other relatives 2.8 3.7 1.6 3.3Total kin 51.3 53.9 46.9 49.0Servants 18.1 15.9 27.1 23.3Lodgers 2.0 1.9 1.8 1.4Boarders 4.6 5.0 5.2 6.5Visitors 4.2 3.3 3.2 3.1
Note: units = personsSource: Census Returns of Ireland, 1901 and 1911
0
5
10
15
20
25 Parents
Siblings
Siblings in law
Children in law
Nephews and Nieces
Grandchildren
Other relatives1901 1911 1901 1911
County Clare County Meath
Figure 7.16. Percentage of Kin in County Clare & County Meath (1901 and 1911)
Source: Census Returns of Ireland, 1901 and 1911

166 Chapter 7
to patriarch right and landholdings for as long as possible and keep the family name on the land, it prevented heirs from inheriting such privileges at an early stage. This led to heirs, viewed as a form of family labour, being forced to remain
Parents
Kin
Servants
Others
Sibling
Children
Spouse
Head0%
10%
20%
30%
40%
50%
60%
70%
80%
90%
100%
0~4 5~910~14
15~1920~24
25~2930~34
35~3940~44
45~4950~54
55~5960~64
65~6970+
Figure 7.17. Age Cohort of Household Heads and Household Relationships in County Clare (1911)
Source: Census Returns of Ireland, County Clare, 1911
Parents
Kin
Servants
Others
Sibling
Children
Spouse
Head0%
10%
20%
30%
40%
50%
60%
70%
80%
90%
100%
0~4 5~910~14
15~1920~24
25~2930~34
35~3940~44
45~4950~54
55~5960~64
65~6970+
Figure 7.18. Age Cohort of Household Heads and Household Relationships in County Meath (1911)
Source: Census Returns of Ireland, County Clare, 1911

167The Structure of Irish Households of early Twentieth Century: comparing results for County Clare and County Meath
single. To look at County Clare in 1911 in terms of the life course of household heads, household heads formed a gently sloping upward series of age cohorts from the 20s into the 60s, while resident silbings could be found even in their 50s (Figure 7.17). Siblings peaked at the 30s and 40s. They included younger generations than household heads, and their distribution shifted in parallel to that of household heads. Parents increased from the 60s onward. The most prominent overall shift observed in both years was the expansion of children in their 40s and 50s. In County Meath the age distribution of household heads age ranged from heads in the 20s to, though dropping slightly in the early 60s, a peak well beyond the 60s. Distribution of siblings continued into the 50s, and siblings aged between 20 and 80 are seen co-residing with household heads. Co-resident parents, on the other hand, started to increase from the late 60s (Figure 7.18). The comparison of the life course of family members in County Clare and County Meath indicates that there was prolonged co-residence of children in County Clare, and at the next stage they changed to co-residence of siblings in County Meath. County Clare had a distinctly higher proportion of co-resident parents. As for servants, in County Clare, they peaked in the younger age groups, whereas the groups were spread out more evenly in County Meath. The differencesinthelifecourseof thesetwocountiessignificantlyinfluencedthehigh occurrence of extended and multiple family households in County Clare, and their low occurrence in County Meath. In other words, household heads in County Clare maintained headship for longer periods than their counterparts in County Meath.
Conclusion
Based on the assumption that County Clare’s stem-family model proposed by Arensberg and Kimball was the prototypical Irish family, the author set out to identify the differences between household structures in the west and east of Ireland by looking at 1901 and 1911 census returns. In County Clare in western Ireland, household structures were characterized by the prevalence of small and medium farmers, low household mobility, and a pattern of relatively prolonged headship. The household head typically
168 Chapter 7
preferred to maintain his patriarchal headship for as long as he lived rather than transferring it to an heir. In consequence the heir, presumptive, remaining unmarried, took part in running the farm. Consequently, marriages tended to be late and in the form of arranged marriages once an heir came into his inheritance. However, total 25 percent of households were formed extended family households and multiple family households. These were mainly families, which possessed strong stem family norms, and which were inf luenced by family situational factors. In County Meath in eastern Ireland, households tended to consist of large farm households and landless labourer households. Landless labourers had high mobility, typically taking part in internal migration, international migration or Atlantic migration. Large farmers primarily engaged in livestock farming rather than crop farming, and like farmers in County Clare, household heads preferred to maintain their headships for long. In turn, heirs adopted the family strategy of participating in running the farm in anticipation of inheriting upon the household head’s demise. Even after coming into their inheritance, the marriage rate for County Meath heirs was lower than for County Clare, and the percentage of those who never married was twice that of County Clare. This led to a high occurrence of households formed by siblings remaining in the parental home, and a low occurrence of extended family households and multiple family households. This indicated a pattern of dissolution in household formation, a result of circumstances which altered the family norm in forming households.

Chapter 8Household Structures in the City of Dublin
in early Twentieth Century
Introduction
In the previous chapters, it has been to clarify the Irish peasant family structure in the early twentieth century from the nineteenth. People who have been discharged from such Irish rural areas must work in a domestic city or emigrated to UK and United States. However, in Ireland, at that time industry is not well developed, people will be working in Dublin and Belfast. In this chapter, we examine city family structure of Dublin with migrants often from rural areas. In other words, in the conventional chapter, we has primarily studied the family structure of rural families in the early twentieth century, using the data available from the 1901 and 1911 censusreturns.Brieflysummarizingpreviousresearch findings, among rural families in Ireland, the nuclear family was the dominant form of family until the mid-nineteenth century. However, the author’s theory is that after the mid-nineteenth century, stem families were formed due to the combination of two factors-marriages associated with a dowry and the change in the inheritance system from partible inheritance to impartible division. By the early twentieth century, stem families, facilitated by situational factors favoring their formation, had become a major norm of family formation in Ireland [Y. Shimizu, 2011, 2012, 2013, 2014a, 2014b]. In this chapter, the focus of study is shifted from rural families to urban families residing in the city of Dublin, the Irish capital. The purpose of this chapter is to identify the features of family structure in the city of Dublin in the early twentieth century, based on a comparison with rural families.
Theory Regarding the Family Structure in Dublin
The number of previous studies in Dublin history is relatively limited. Early studies include A. J. Humphrey’s research into urbanization and families in Dublin [A. J. Humphreys, 1966], J. V. O’Brien’s research into the history of
170 Chapter 8
Dublin as an impoverished city [O’Brien, J. V., 1982], and Mary Daly’s research on Dublin from a perspective of socio-economic history [Mary Daly, 1984]. More recent studies regarding Dublin include primarily the collection of academic papers edited by F. H. A. Aalen and K. Whelan [F. H. A. Aalen & K. Whelan (eds.), 1992] that deals with research into the city of Dublin. This collection particularly contains L. Cullen’s paper discussing the post-medieval history of the city of Dublin [L. Cullen, 1992], J. Prunty’s research into the slums of Dublin [J. Prunty, 1998], R. McManus’s research into the development history of the city of Dublin and its suburbs in the twentieth century [R. McManus, 2002], Seamas O’Maitiu’s research into urban areas in the Dublin suburbs [Seamas O’Maitiu, 2003] and Mel Cousins’s research on the relief of the poor in Ireland [Mel Cousins, 2011]. However, almost no previous studies dealt with the history of families in Dublin based on the data available from individual census returns. In this chapter, the author’s theory regarding analysis of the population and the family structures in the city of Dublin is set out. Concerning the population structure, the city of Dublin was weak in terms of incentives to attract labourers. Even during the Great Famine that began in 1845, rural residents chose to emigrate to Britain or the U. S, rather than to seek work in Dublin. Thereafter, the trend of emigration to the U. S. continued, the large numbers of emigrants being accounted for by economic prosperity in the U. S. In the early twentieth century, while Dublin was recognized as the second largest city after London in the United Kingdom, it was a less industrialized, less urbanized consumer city, unattractive from a labour market viewpoint, with a noticeably sluggish growth in population. The majority of the employees in Dublin were unskilled workers. Meanwhile, in contrast to rural areas, the city showed a demographic structure characterized by high marriage rates, high fertility rates, and high mortality rates. Population growth in Dublin was substantially maintained by natural increase. Populationinflowtothecitywasaccountedforbymigrantsfromalimitedrangeof geographical areas, mainly adjacent counties within the province of Leinster. With such a population structure as a background, what principle of family formation did families in the city of Dublin employ as their family strategy? To analyze the urban family structure in the city of Dublin, an effective framework comes from Hajnal’s theory of a nuclear family system in northwest Europe, where “simple family households” were dominant [John, Hajnal, 1982, 452]. John

171Household Structures in the City of Dublin in early Twentieth Century
Hajnal pointed out two types of household patterns, the northwest European household formation one and the joint household one. The household patterns in northwestern Europe can be characterized by three rules of normal household formation behavior. For the simple household system in northwestern Europe the common rules were: A Latemarriageforbothsexes(averagesagesatfirstmarriageof,say,
over 26 for men and 23 for women). B After marriage the couple had an independent household (the husband
as head of household). C Before marriage young people often circulate between households as
servants. He added two important explanations to his northwest European model. Firstly under rule A, the fact that a married couple had charge of their own household, implied that upon marriage, (a) a new household was created, or (b) one spouse joined the other in a household in which there had been no married couple,or(c)finallyif theytookoverafarmrunbytheparentsoraparentofthem, the parent or parent retired when the young people married. The practice of retirement by contract was common in most of northwest Europe. Secondly under rule C he emphasized the circulation of servants in the northwest European system. Servants, he argued, were found in substantial numbers concentrated at young adult ages throughout preindustrial northwestern Europe. The circulation of servants, providing occupation for young unmarried adults, is likely to have accounted for the late age of marriage [J. Hajnal, 1982, 452-3]. For families in Dublin, the “simple family households” proved more effective as a family strategy, than a more complex form based on the stem family. Meanwhile, families in the city of Dublin also included a considerable number of families migrating from rural areas. For these migratory families to lead a happy life in an urban area, adaptation to the norms of urban family was more effective than maintaining the norms of rural family. In other words, while a simple family households may have been on the nuclear system. The normative ethos of the rural family remained in some aspects of family structure in the city of Dublin. While adopting the structure of an urban family, families in the city had the potential to form a stem family, depending on familysituations.Tobespecific,family norms, such as patriliny (gender roles of patriarchs and their spouses) and
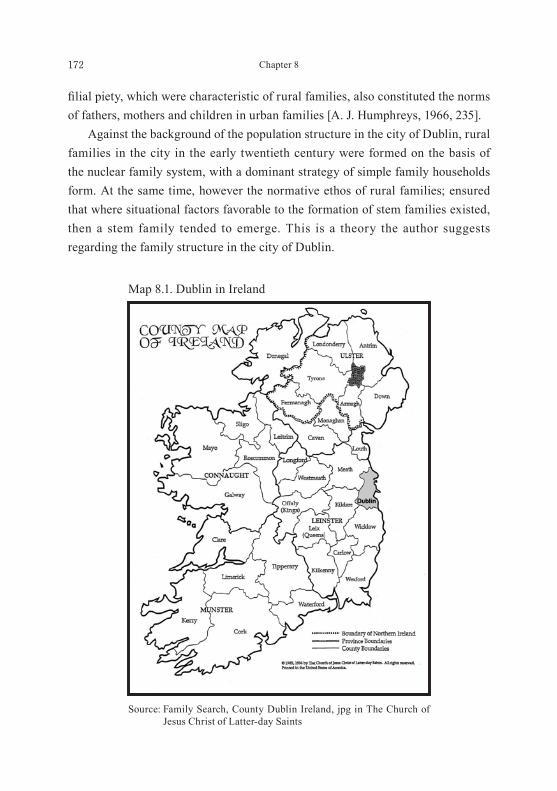
172 Chapter 8
filialpiety,whichwerecharacteristicofruralfamilies,alsoconstitutedthenormsof fathers, mothers and children in urban families [A. J. Humphreys, 1966, 235]. Against the background of the population structure in the city of Dublin, rural families in the city in the early twentieth century were formed on the basis of the nuclear family system, with a dominant strategy of simple family households form. At the same time, however the normative ethos of rural families; ensured that where situational factors favorable to the formation of stem families existed, then a stem family tended to emerge. This is a theory the author suggests regarding the family structure in the city of Dublin.
Map 8.1. Dublin in Ireland
Source: Family Search, County Dublin Ireland, jpg in The Church of Jesus Christ of Latter-day Saints

173Household Structures in the City of Dublin in early Twentieth Century
The individual data of the 1911 census returns used in this research concern 275,264 residents in 60,346 households in the city of Dublin, and 162,262 residents in 35,835 households in County Dublin (the area excluding the city of Dublin).
Demographic features of Dublin
Why was the population growth of the city of Dublin, shown in Figure 8.1, more sluggish than that of Belfast? It can be explained by examining population growth from the perspectives of natural increase and social increase. The following paragraphs examine the natural population growth of Dublin based on the rates of marriage, fertility, and mortality. Table 8.1 shows the marriage rates, crude birth rates, and crude death rates of
050,000
100,000150,000200,000250,000300,000350,000400,000450,000 County Clare
County Meath
Dublin City
Belfast
County Dublin
19111821 1831 1841 1851 1861 1871 1881 1891 1901
Figure 8.1. Population Growth of Dublin
Source: W. E. Vaughan & A. J. Fizpatrick, 1978, 5-11
Table 8.1. Marriage Rate, Birth Rate and Death Rate in County Dublin, County Clare and County Meath, 1865-1911
County Co. Dublin (City and County) Co. Clare Co. MeathYear Marriage Birth Death Marriage Birth Death Marriage Birth Death1865 7.8 27.1 24.4 4.6 22.4 13.4 2.9 20.6 16.4 1871 7.3 27.2 24.2 4.8 27.1 13.3 3.0 23.0 16.4 1881 7.1 28.5 25.7 2.7 22.4 14.2 3.7 20.5 16.9 1891 7.0 27.4 24.6 3.6 20.6 14.9 3.1 19.1 18.3 1901 6.6 26.2 23.9 3.5 20.6 14.6 4.2 19.1 17.2 1911 6.9 26.6 21.4 4.1 19.5 15.0 4.9 19.5 16.0
Source: Annual Report of the Registrar General for Ireland, Marriages, Births and Deaths, 1865, 1871, 1881, 1891, 1901 and 1911
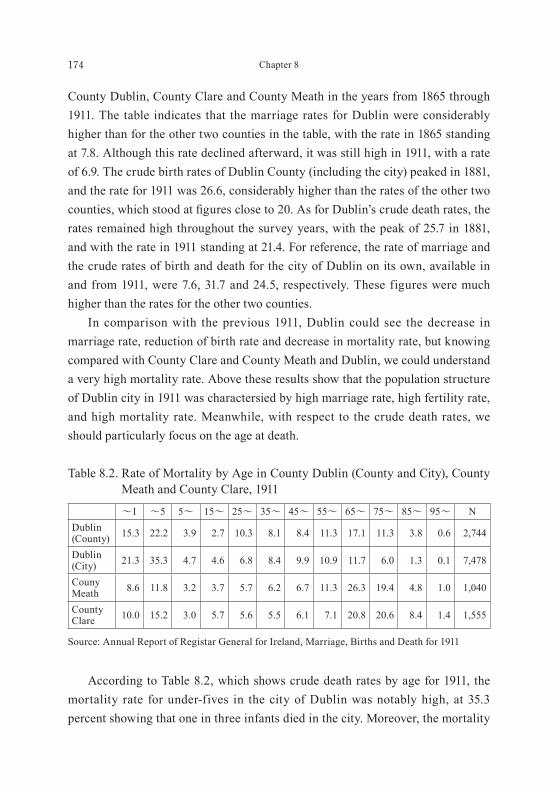
174 Chapter 8
County Dublin, County Clare and County Meath in the years from 1865 through 1911. The table indicates that the marriage rates for Dublin were considerably higher than for the other two counties in the table, with the rate in 1865 standing at 7.8. Although this rate declined afterward, it was still high in 1911, with a rate of 6.9. The crude birth rates of Dublin County (including the city) peaked in 1881, and the rate for 1911 was 26.6, considerably higher than the rates of the other two counties,whichstoodatfigurescloseto20.AsforDublin’scrudedeath rates, the rates remained high throughout the survey years, with the peak of 25.7 in 1881, and with the rate in 1911 standing at 21.4. For reference, the rate of marriage and the crude rates of birth and death for the city of Dublin on its own, available in and from 1911, were 7.6, 31.7 and 24.5, respectively. These figures were much higher than the rates for the other two counties. In comparison with the previous 1911, Dublin could see the decrease in marriage rate, reduction of birth rate and decrease in mortality rate, but knowing compared with County Clare and County Meath and Dublin, we could understand a very high mortality rate. Above these results show that the population structure of Dublin city in 1911 was charactersied by high marriage rate, high fertility rate, and high mortality rate. Meanwhile, with respect to the crude death rates, we should particularly focus on the age at death.
According to Table 8.2, which shows crude death rates by age for 1911, the mortality rate for under-fives in the city of Dublin was notably high, at 35.3 percent showing that one in three infants died in the city. Moreover, the mortality
Table 8.2. Rate of Mortality by Age in County Dublin (County and City), County Meath and County Clare, 1911
~1 ~5 5~ 15~ 25~ 35~ 45~ 55~ 65~ 75~ 85~ 95~ NDublin (County) 15.3 22.2 3.9 2.7 10.3 8.1 8.4 11.3 17.1 11.3 3.8 0.6 2,744
Dublin (City) 21.3 35.3 4.7 4.6 6.8 8.4 9.9 10.9 11.7 6.0 1.3 0.1 7,478
Couny Meath 8.6 11.8 3.2 3.7 5.7 6.2 6.7 11.3 26.3 19.4 4.8 1.0 1,040
County Clare 10.0 15.2 3.0 5.7 5.6 5.5 6.1 7.1 20.8 20.6 8.4 1.4 1,555
Source: Annual Report of Registar General for Ireland, Marriage, Births and Death for 1911
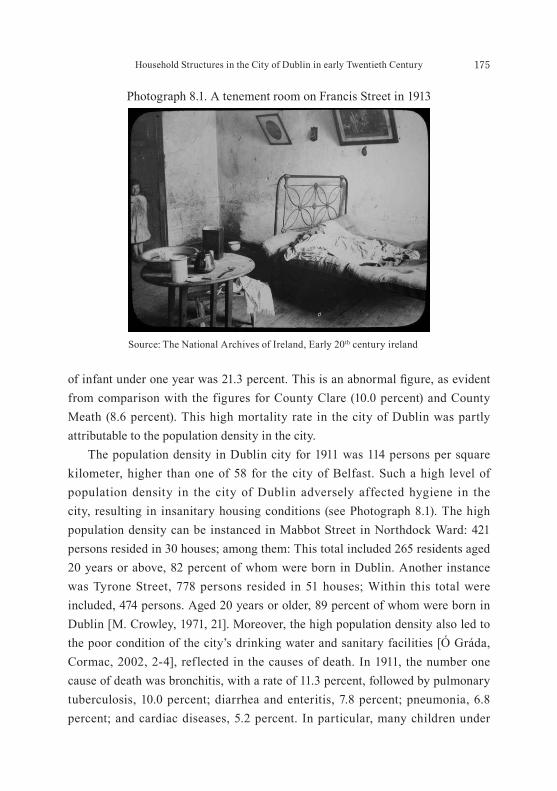
175Household Structures in the City of Dublin in early Twentieth Century
ofinfantunderoneyearwas21.3percent.Thisisanabnormalfigure,asevidentfrom comparison with the figures for County Clare (10.0 percent) and County Meath (8.6 percent). This high mortality rate in the city of Dublin was partly attributable to the population density in the city. The population density in Dublin city for 1911 was 114 persons per square kilometer, higher than one of 58 for the city of Belfast. Such a high level of population density in the city of Dublin adversely affected hygiene in the city, resulting in insanitary housing conditions (see Photograph 8.1). The high population density can be instanced in Mabbot Street in Northdock Ward: 421 persons resided in 30 houses; among them: This total included 265 residents aged 20 years or above, 82 percent of whom were born in Dublin. Another instance was Tyrone Street, 778 persons resided in 51 houses; Within this total were included, 474 persons. Aged 20 years or older, 89 percent of whom were born in Dublin [M. Crowley, 1971, 21]. Moreover, the high population density also led to the poor condition of the city’s drinking water and sanitary facilities [Ó Gráda, Cormac, 2002, 2-4], reflected in the causes of death. In 1911, the number one cause of death was bronchitis, with a rate of 11.3 percent, followed by pulmonary tuberculosis, 10.0 percent; diarrhea and enteritis, 7.8 percent; pneumonia, 6.8 percent; and cardiac diseases, 5.2 percent. In particular, many children under
Photograph 8.1. A tenement room on Francis Street in 1913
Source: The National Archives of Ireland, Early 20th century ireland
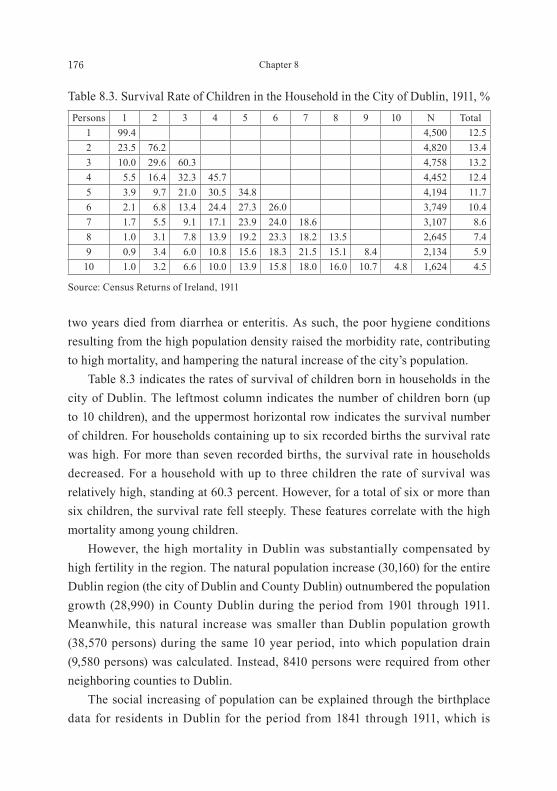
176 Chapter 8
two years died from diarrhea or enteritis. As such, the poor hygiene conditions resulting from the high population density raised the morbidity rate, contributing to high mortality, and hampering the natural increase of the city’s population. Table 8.3 indicates the rates of survival of children born in households in the city of Dublin. The leftmost column indicates the number of children born (up to 10 children), and the uppermost horizontal row indicates the survival number of children. For households containing up to six recorded births the survival rate was high. For more than seven recorded births, the survival rate in households decreased. For a household with up to three children the rate of survival was relatively high, standing at 60.3 percent. However, for a total of six or more than six children, the survival rate fell steeply. These features correlate with the high mortality among young children. However, the high mortality in Dublin was substantially compensated by high fertility in the region. The natural population increase (30,160) for the entire Dublin region (the city of Dublin and County Dublin) outnumbered the population growth (28,990) in County Dublin during the period from 1901 through 1911. Meanwhile, this natural increase was smaller than Dublin population growth (38,570 persons) during the same 10 year period, into which population drain (9,580 persons) was calculated. Instead, 8410 persons were required from other neighboring counties to Dublin. The social increasing of population can be explained through the birthplace data for residents in Dublin for the period from 1841 through 1911, which is
Table 8.3. Survival Rate of Children in the Household in the City of Dublin, 1911, %Persons 1 2 3 4 5 6 7 8 9 10 N Total
1 99.4 4,500 12.52 23.5 76.2 4,820 13.43 10.0 29.6 60.3 4,758 13.24 5.5 16.4 32.3 45.7 4,452 12.45 3.9 9.7 21.0 30.5 34.8 4,194 11.76 2.1 6.8 13.4 24.4 27.3 26.0 3,749 10.47 1.7 5.5 9.1 17.1 23.9 24.0 18.6 3,107 8.68 1.0 3.1 7.8 13.9 19.2 23.3 18.2 13.5 2,645 7.49 0.9 3.4 6.0 10.8 15.6 18.3 21.5 15.1 8.4 2,134 5.910 1.0 3.2 6.6 10.0 13.9 15.8 18.0 16.0 10.7 4.8 1,624 4.5
Source: Census Returns of Ireland, 1911
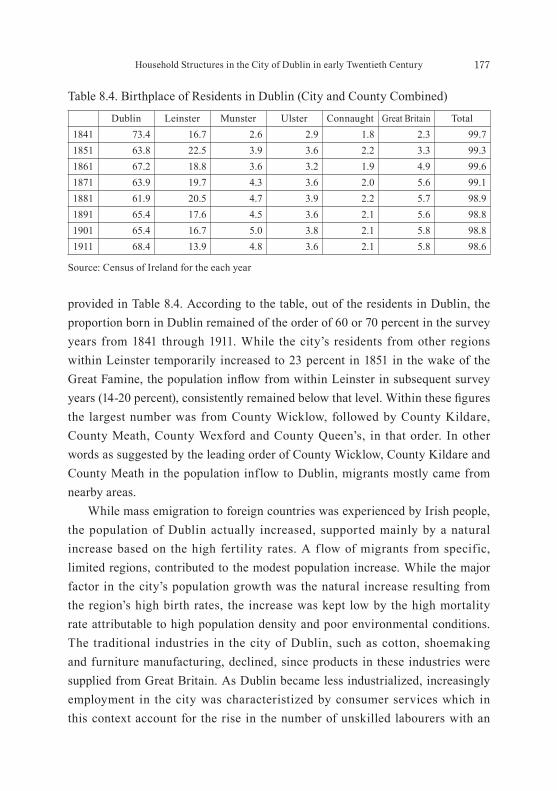
177Household Structures in the City of Dublin in early Twentieth Century
provided in Table 8.4. According to the table, out of the residents in Dublin, the proportion born in Dublin remained of the order of 60 or 70 percent in the survey years from 1841 through 1911. While the city’s residents from other regions within Leinster temporarily increased to 23 percent in 1851 in the wake of the GreatFamine,thepopulationinflowfromwithinLeinster in subsequent survey years(14-20percent),consistentlyremainedbelowthatlevel.Withinthesefiguresthe largest number was from County Wicklow, followed by County Kildare, County Meath, County Wexford and County Queen’s, in that order. In other words as suggested by the leading order of County Wicklow, County Kildare and County Meath in the population inflow to Dublin, migrants mostly came from nearby areas. While mass emigration to foreign countries was experienced by Irish people, the population of Dublin actually increased, supported mainly by a natural increase based on the high fertility rates. A f low of migrants from specific, limited regions, contributed to the modest population increase. While the major factor in the city’s population growth was the natural increase resulting from the region’s high birth rates, the increase was kept low by the high mortality rate attributable to high population density and poor environmental conditions. The traditional industries in the city of Dublin, such as cotton, shoemaking and furniture manufacturing, declined, since products in these industries were supplied from Great Britain. As Dublin became less industrialized, increasingly employment in the city was characteristized by consumer services which in this context account for the rise in the number of unskilled labourers with an
Table 8.4. Birthplace of Residents in Dublin (City and County Combined)
Dublin Leinster Munster Ulster Connaught Great Britain Total1841 73.4 16.7 2.6 2.9 1.8 2.3 99.7 1851 63.8 22.5 3.9 3.6 2.2 3.3 99.3 1861 67.2 18.8 3.6 3.2 1.9 4.9 99.6 1871 63.9 19.7 4.3 3.6 2.0 5.6 99.1 1881 61.9 20.5 4.7 3.9 2.2 5.7 98.9 1891 65.4 17.6 4.5 3.6 2.1 5.6 98.8 1901 65.4 16.7 5.0 3.8 2.1 5.8 98.8 1911 68.4 13.9 4.8 3.6 2.1 5.8 98.6
Source: Census of Ireland for the each year

178 Chapter 8
unattractive labour market, Dublin was unlikely to add greatly to its population. Preceding paragraphs examined the limited population growth in Dublin. In view of such population structure in Dublin, subsequent sections will aim to definethestructureoffamiliesinthecity of Dublin.
Attributions of household heads
Age attribution of household heads
Table 8.5 shows the age of household heads. According to the table, the highest average age of household heads was 56.3 years for County Clare, where the representative farms were mid-sized, followed by County Meath featuring large farms (54.4 years), County Dublin (in 1911 excluding the city, 49.4 years) and the city of Dublin (46 years). To examine the data in detail, the age of household heads in Counties Clare and Meath bunched in an age range from 40 through 79. In contrast, in families in the city of Dublin, the age of household heads was highest in the range from 30 through 39 (26 percent), and was progressively lower at older ages: 40 through 49 (24.1 percent), 50 through 59 (18.3 percent) and 60 through 69 (11.8 percent). Regarding the age of household heads, the concentration in the 30-39 age cohort in the city of Dublin suggests that although residents in the city at the time of marriage were younger than
Table 8.5. Age of Household Heads by County and Age Cohort, 1911Number County Clare County Meath City of Dublin County Dublin Total Dublin
~19 0.1 0.2 0.2 0.2 0.2 20~29 2.7 4.7 11.8 8.0 10.4 30~39 12.3 15.2 26.0 22.2 24.6 40~49 19.1 19.6 24.1 22.9 23.7 50~59 21.1 19.1 18.3 19.1 18.6 60~69 20.9 19.6 11.8 15.6 13.2 70~79 20.0 18.4 6.8 10.0 8.0 80~89 3.4 2.9 0.8 1.8 1.2 90~ 0.4 0.3 0.1 0.2 0.1 Total 100.0 100.0 100.0 100.0 100.0
N 20,291 14,758 60,338 35,529 95,867Mean 56.3 54.4 46.0 49.4 47.3
Source: Census Returns of County Dublin, County Clare and County Meath, 1911

179Household Structures in the City of Dublin in early Twentieth Century
their rural counterparts [A. J. Humphreys, 1966, 88], the marriage age in urban families in the city was still high.
Occupational structure of household heads
Table 8.6 shows occupation types by household head. Out of the 414 coded categories [K. Schurer & M. Woollard, 2002, 46-52] of occupations engaged in by 0.3 percent or more of the household heads for Dublin (city band and county combined) totaled 62 types, approximately double the numbers for County Clare, 29, and County Meath, 32. These results indicate the diversity in the occupational structure in urban areas. To examine the data in detail, the occupation held by the largest number of household heads was unskilled General Labourer, accounting for 13.5 percent. Aside from General Labourer, occupations held by at least 1 percent of the household heads included Servant, 2.7 percent; Carman, Carrier, Carter, Haulier, 2.2 percent; Carpenter, 1.9 percent; Tailor, 1.7 percent; Commercial Clerk, 1.7 percent; Painter, 1.6 percent; Messenger, Porter, Watchman 1.3 percent; Shopkeeper, 1.2 percent; Charwoman, 1.1 percent; Shoe, Boot-Maker, Dealer, 1.1 percent; RailwayOfficialandService,1.0percent;Printer, 1.0 percent; Builder, 1.0 percent; Dressmaker, 1.0 percent; and Coal heaver, 1.0 percent. These results imply that large scale manufacturing industries rarely prospered in the city of Dublin. The number of employees in the renowned manufacturer Guinness, one of the city’s few large employers, stood at about 2,500 [M. Crowley, 1971, 66]. The analysis in the preceding paragraphs, shows that household heads in the city of Dublin comprised individuals in younger age groups than in rural families. Large numbers of Dublin’s household heads engaged in the unskilled occupations characteristic of consumer cities. In the next section, the structure of Dublin’s families supported by such household heads is discussed.

180 Chapter 8
Table 8.6. Occupations of Household Heads for Dublin (City) and Dublin (County area only). 1911, %
Code Occupation Dublin (city) % Dublin (co.) % Total %2 Civil Service (officersandclerks) 0.3 0.4 0.23 Civil Service (messengers, & c) 0.4 0.4 0.4
24 Barrister, Solicitor 0.2 0.8 0.426 Law Clerk, and others connected with the law 0.3 0.3 0.332 Schoolmaster 0.2 0.4 0.354 Domestic Coachman, Groom 0.1 0.6 0.355 Domestic Gardener 0.2 1.3 0.656 Domestic Indoor Servant 2.7 1.8 2.458 Inn, Hotel Servant 0.5 0.1 0.360 OfficeKeeper 0.6 0.2 0.462 Charwoman 1.1 0.4 0.963 Washing and Bathing Service 0.5 0.7 0.567 Broker, Agent, Factor 0.2 0.4 0.371 Commercial Traveler 0.5 0.6 0.572 Commercial Clerk 1.7 1.3 1.575 Bank Service 0.1 0.5 0.377 Life, House, Ship & c., Insurance Service 0.3 0.4 0.481 OtherRailwayOfficialsandService 1.0 0.7 0.984 Cabman, Flyman, Coachman (not domestic) 0.7 0.7 0.785 Carman, Carrier, Carter, Haulier 2.2 1.2 1.886 Tramway Company Service 0.1 0.4 0.391 Seaman (Merchant Service) 0.4 0.5 0.495 Harbour, Dock, Wharf, Lighthouse Service 0.6 0.2 0.498 Messenger, Porter, Watchman (not Railway or Government) 1.3 0.3 0.9
100 Farmer, Grazier 0.1 4.6 1.8103 Agricultural Labourer, Farm Servant, Cottager 0.5 4.6 2.0112 Gardener (not domestic) 0.4 2.2 1.1114 Groom, Horse-keeper, Horse-breaker 0.3 0.3 0.3126 Printer 1.0 0.4 0.6135 Fitter, Tuener (Engine and Machine) 0.5 0.2 0.4167 Builder 1.0 0.6 0.8168 Carpenter, Joiner 1.9 1.4 1.7169 Bricklayer 0.8 0.4 0.7172 Plasterer, Whitewasher 0.3 0.1 0.3174 Plumber 0.5 0.3 0.5175 Painter, Glazier 1.6 0.7 1.2177 Cabinet Maker 0.5 0.2 0.4192 Coach maker 0.5 0.1 0.3214 Innkeeper, Hotel Keeper, Publican 0.4 0.4 0.4215 Lodging, Boarding House Keeper 0.2 0.4 0.3219 Brewer 0.9 0.1 0.6223 Milk seller, Dairyman 0.3 0.3 0.3225 Bucher, Meat Salesman 0.6 0.3 0.5229 Fishmonger 0.4 0.1 0.3231 Baker 0.7 0.3 0.6233 Greengrocer, Fruiterer 0.4 0.2 0.3236 Grocer, Tea, Coffee, Chocolate Maker, Dealer 0.8 0.8 0.8275 Draper, Linen Draper, Mercer 0.6 0.6 0.6282 Tailor 1.7 0.5 1.2283 Milliner, Dressmaker, Staymaker 1.0 0.7 0.9285 Shirt Maker, Seamstress 0.3 0.2 0.3290 Shoe, Boot-Maker, Dealer 1.1 0.4 0.8292 Wig Maker, Hair Dresser 0.4 0.1 0.3325 Cooper, Hoop Maker, Bender 0.5 0.0 0.3345 Coal heaver 1.0 0.3 0.7360 Road Labourer 0.4 0.1 0.3375 Iron Manufacture 0.4 0.1 0.3377 Blacksmith 0.5 0.3 0.4399 General Shopkeeper, Dealer 1.2 0.6 1.0404 General Labourer 13.5 8.9 11.8405 Engine Driver, Stoker, Fireman 0.6 0.2 0.5408 Factory Labourer 0.4 0.1 0.3
Source: Census Returns of County Dublin, 1911
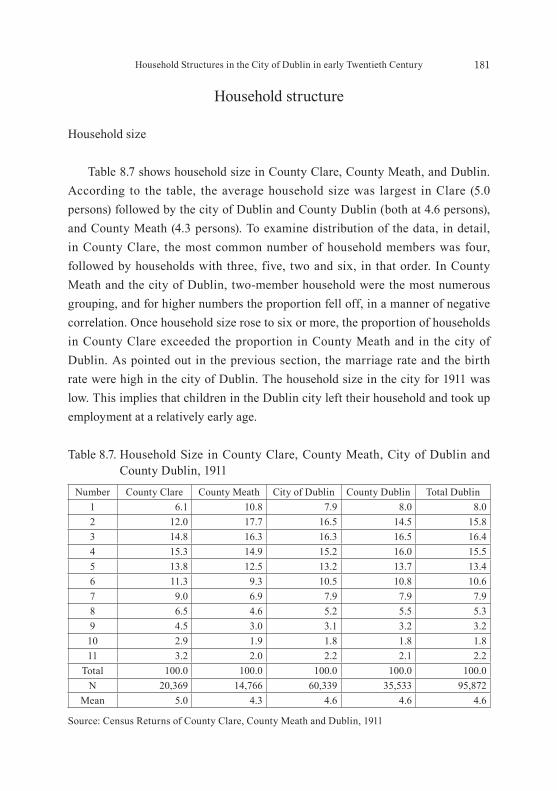
181Household Structures in the City of Dublin in early Twentieth Century
Household structure
Household size
Table 8.7 shows household size in County Clare, County Meath, and Dublin. According to the table, the average household size was largest in Clare (5.0 persons) followed by the city of Dublin and County Dublin (both at 4.6 persons), and County Meath (4.3 persons). To examine distribution of the data, in detail, in County Clare, the most common number of household members was four, followed by households with three, five, two and six, in that order. In County Meath and the city of Dublin, two-member household were the most numerous grouping, and for higher numbers the proportion fell off, in a manner of negative correlation. Once household size rose to six or more, the proportion of households in County Clare exceeded the proportion in County Meath and in the city of Dublin. As pointed out in the previous section, the marriage rate and the birth rate were high in the city of Dublin. The household size in the city for 1911 was low. This implies that children in the Dublin city left their household and took up employment at a relatively early age.
Table 8.7. Household Size in County Clare, County Meath, City of Dublin and County Dublin, 1911
Number County Clare County Meath City of Dublin County Dublin Total Dublin1 6.1 10.8 7.9 8.0 8.0 2 12.0 17.7 16.5 14.5 15.8 3 14.8 16.3 16.3 16.5 16.4 4 15.3 14.9 15.2 16.0 15.5 5 13.8 12.5 13.2 13.7 13.4 6 11.3 9.3 10.5 10.8 10.6 7 9.0 6.9 7.9 7.9 7.9 8 6.5 4.6 5.2 5.5 5.3 9 4.5 3.0 3.1 3.2 3.2
10 2.9 1.9 1.8 1.8 1.8 11 3.2 2.0 2.2 2.1 2.2
Total 100.0 100.0 100.0 100.0 100.0 N 20,369 14,766 60,339 35,533 95,872
Mean 5.0 4.3 4.6 4.6 4.6
Source: Census Returns of County Clare, County Meath and Dublin, 1911
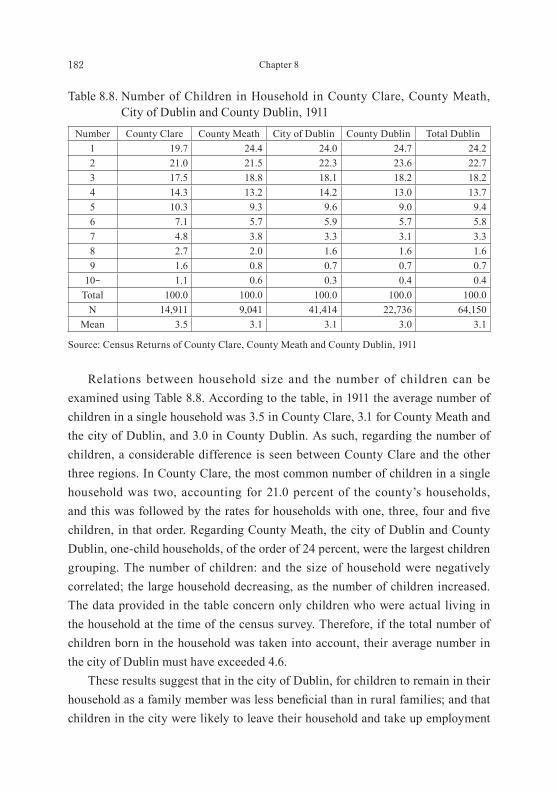
182 Chapter 8
Relations between household size and the number of children can be examined using Table 8.8. According to the table, in 1911 the average number of children in a single household was 3.5 in County Clare, 3.1 for County Meath and the city of Dublin, and 3.0 in County Dublin. As such, regarding the number of children, a considerable difference is seen between County Clare and the other three regions. In County Clare, the most common number of children in a single household was two, accounting for 21.0 percent of the county’s households, andthiswasfollowedbytheratesforhouseholdswithone,three,fourandfivechildren, in that order. Regarding County Meath, the city of Dublin and County Dublin, one-child households, of the order of 24 percent, were the largest children grouping. The number of children: and the size of household were negatively correlated; the large household decreasing, as the number of children increased. The data provided in the table concern only children who were actual living in the household at the time of the census survey. Therefore, if the total number of children born in the household was taken into account, their average number in the city of Dublin must have exceeded 4.6. These results suggest that in the city of Dublin, for children to remain in their householdasafamilymemberwaslessbeneficialthaninruralfamilies;andthatchildren in the city were likely to leave their household and take up employment
Table 8.8. Number of Children in Household in County Clare, County Meath, City of Dublin and County Dublin, 1911
Number County Clare County Meath City of Dublin County Dublin Total Dublin1 19.7 24.4 24.0 24.7 24.2 2 21.0 21.5 22.3 23.6 22.7 3 17.5 18.8 18.1 18.2 18.2 4 14.3 13.2 14.2 13.0 13.7 5 10.3 9.3 9.6 9.0 9.4 6 7.1 5.7 5.9 5.7 5.8 7 4.8 3.8 3.3 3.1 3.3 8 2.7 2.0 1.6 1.6 1.6 9 1.6 0.8 0.7 0.7 0.7
10- 1.1 0.6 0.3 0.4 0.4 Total 100.0 100.0 100.0 100.0 100.0
N 14,911 9,041 41,414 22,736 64,150Mean 3.5 3.1 3.1 3.0 3.1
Source: Census Returns of County Clare, County Meath and County Dublin, 1911

183Household Structures in the City of Dublin in early Twentieth Century
relativelyearlyinlife,reflectinganunderlyingfamily strategy to achieve well-being by maintaining their household at a small size. At the time of the census survey in 1911 in Dublin city, the size of families was relatively small, and the number of children in a single household was smaller than in a rural family. Although the size of households in Dublin at the time of survey was generally small, due to the small number of children, such situations should be deemed as just one phase in the life cycle of the household. According to Table 8.9 showing distribution of children by age, the average age of males and females was 16.9 and 16.3 respectively, for County Clare; 16.8 and 14.1 for County Meath; and 12.7 and 12.8 for the city of Dublin. A noticeable difference is that; the age of children was higher in the Counties of Clare and Meath than in the city of Dublin. To examine the data in detail, the distribution of male by age group was similar between County Clare and County Meath. In the city of Dublin, the proportion of males under 15 years of age was 61.5 percent, and the proportion of males under 19 years of age was 76.9 percent. Comparing these rates with corresponding rates for Counties Clare and Meath, it clearly shows that the ages in the city of Dublin were concentrated in younger age ranges. This contrast can be regarded as one of the results of the family strategy adopted
Table 8.9. Age of Children in County Clare, County Meath, City of Dublin and County Dublin, 1911
County County Clare County Meath City of Dublin County DublinAge Male Female Male Female Male Female Male Female0~4 14.6 17.8 16.2 19.8 23.3 22.9 21.2 20.6 5~9 16.8 19.3 17.3 20.7 20.7 20.5 19.4 18.9
10~14 16.6 19.3 15.8 19.0 17.5 18.0 16.8 16.8 15~19 15.5 16.7 13.5 13.8 15.4 15.8 14.9 14.4 20~24 11.9 11.2 11.6 9.6 11.0 11.3 11.5 11.2 25~29 8.5 7.4 9.0 7.4 6.3 6.0 7.4 7.8 30~34 6.6 4.3 7.0 4.4 3.1 2.8 4.4 4.5 35~39 5.0 2.2 4.7 2.8 1.6 1.4 2.3 2.6 40~44 2.6 1.0 2.7 1.3 0.6 0.8 1.2 1.6 45~49 2.2 7.1 2.3 1.3 0.4 0.6 0.7 1.3 Total 100.0 100.0 100.0 100.0 100.0 100.0 100.0 100.0
N 28,562 23,110 15,716 12,440 64,466 63,558 34,791 34,311Mean 16.9 16.3 16.8 14.1 12.7 12.8 14.0 14.5
Source: Census Returns of Ireland, County Clare, County Meath and County Dublin, 1911
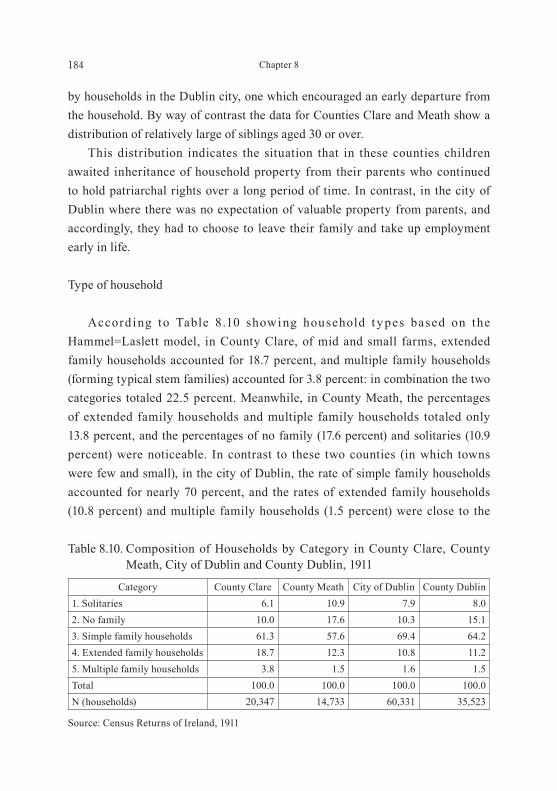
184 Chapter 8
by households in the Dublin city, one which encouraged an early departure from the household. By way of contrast the data for Counties Clare and Meath show a distribution of relatively large of siblings aged 30 or over. This distribution indicates the situation that in these counties children awaited inheritance of household property from their parents who continued to hold patriarchal rights over a long period of time. In contrast, in the city of Dublin where there was no expectation of valuable property from parents, and accordingly, they had to choose to leave their family and take up employment early in life.
Type of household Accord ing to Table 8.10 showing household t y pes based on the Hammel=Laslett model, in County Clare, of mid and small farms, extended family households accounted for 18.7 percent, and multiple family households (forming typical stem families) accounted for 3.8 percent: in combination the two categories totaled 22.5 percent. Meanwhile, in County Meath, the percentages of extended family households and multiple family households totaled only 13.8 percent, and the percentages of no family (17.6 percent) and solitaries (10.9 percent) were noticeable. In contrast to these two counties (in which towns were few and small), in the city of Dublin, the rate of simple family households accounted for nearly 70 percent, and the rates of extended family households (10.8 percent) and multiple family households (1.5 percent) were close to the
Table 8.10. Composition of Households by Category in County Clare, County Meath, City of Dublin and County Dublin, 1911
Category County Clare County Meath City of Dublin County Dublin1. Solitaries 6.1 10.9 7.9 8.0 2. No family 10.0 17.6 10.3 15.1 3. Simple family households 61.3 57.6 69.4 64.2 4. Extended family households 18.7 12.3 10.8 11.2 5. Multiple family households 3.8 1.5 1.6 1.5 Total 100.0 100.0 100.0 100.0 N (households) 20,347 14,733 60,331 35,523
Source: Census Returns of Ireland, 1911

185Household Structures in the City of Dublin in early Twentieth Century
percentages for County Meath (12.3 percent and 1.5 percent, respectively). In County Meath, the fact that the rates of solitaries and no family were relatively high clearly indicates weaker family formation and a degree of family disintegration. On the other hand, in the cityofDublintherewasafirmpatternoffamily formation. In Dublin, family formation was one of the family strategies to enhance the level of well-being. However not all families in the city of Dublin were formed on the basis of the simple family household system. In other words, while families in the city were generally formed on the basis of the nuclear family system, stem families also existed in the city. The next step is to look at families in the city of Dublin from the viewpoint of the class level in the household typology (See Table 8.11). Regarding solitaries, the rate of single in County Meath was 7.8 percent, surpassing the rates for the city of Dublin (4.2 percent) and County Dublin (5.1
Table 8.11. Composition of Households by Class in County Clare, County Meath, City of Dublin and County Dublin, 1911
Categories Class County Clare
County Meath
City of Dublin
County Dublin
1. Solitaries1a Widow 2.4 3.1 3.7 2.9 1b Single 3.7 7.8 4.2 5.1
2. No family2a Coresidence siblings 5.2 9.0 4.2 5.9 2b Coresidence kins 2.6 4.7 2.6 3.4 2c Persons not related 2.3 4.0 3.5 5.8
3. Simple family households
3a Married couple 6.0 7.6 10.0 9.0 3b Married couple with children 37.9 33.7 42.9 39.2 3c Widowers with children 4.9 4.7 3.6 3.5 3d Widows with children 12.6 11.7 12.9 12.5
4. Extended family households
4a Extended upwards 7.2 3.3 2.5 2.4 4b Extended downwards 5.6 5.0 3.7 4.2 4c Extended laterally 4.9 3.3 4.0 4.1 4d Combinations of 4a-4c 1.0 0.6 0.6 0.6
5. Multiple family households
5a Secondary units upwards 2.0 0.3 0.4 0.4 5b Secondary units downwards 1.8 1.1 0.8 0.9 5c Secondary units lateral 0.0 0.0 0.1 0.1 5d Frdreches 0.0 0.0 0.0 0.0 5e Other multiple family households 0.0 0.1 0.2 0.2
Total 100.0 100.0 100.0 100.0 N 20,347 14,733 60,331 35,523
Source: Census Returns of Ireland, County Clare, County Meath and County Dublin, 1911
186 Chapter 8
percent). As for no family, the rate of co-residence with siblings in County Meath stoodat9.0percent,andthiswasanexceptionalfigureincomparisonwithotherregions. As for simple family households in the city of Dublin, the rate of nuclear families comprising a couple and children totaled 42.9 percent, and married couples without children totaled 10.0 percent. Both of these rates were higher than in other regions. The family types of married couples with/without children were common in the age ranges the twenties through forties. The table also indicates that the rates of widows with children were high in all of the survey regions. Thisresultisreflectedintheaverage life expectancy of males in Ireland in and around1911(46.5years),afeatureitselfconfirmedinthestatisticalabsenceofmany household heads on the day of the census survey. Regarding extended family households in the city of Dublin, it was distinctive that the rate of lateral extension (4.0 percent) was more noticeable than that of upward extension and downward extension. On the other hand, for County Clare, the rates of upward extension and downward extension were relatively high, clearly indicating the presence of stem families. As for multiple family households, in County Clare, higher rates of upward extension and downward extension indicated a potential tendency to create stem families. In the city of Dublin, the rate of downward extension was high, and this was due to family situational factors; there were many families in which a couple co-resided with the family of their children, and in which a widow co-resided with the family of her children. Analysis suggests that in the family structure in the city of Dublin, the formation of simple family households featuring both high marriage rates, and late marriage was dominant, although marriage ages were not as high as in Counties Clare and Meath. At the same time, depending on situational factors, stem families could potentially be formed in the city, as well.
Numbers of kin
The data provided in Table 8.12 is based on a method for counting the number of relatives proposed by R. Wall in 1983 [R. Wall, 1983, 500]. The table shows the structure of the relationships of relatives living in the household to the household head, as well as the numbers of relatives and non-relatives in
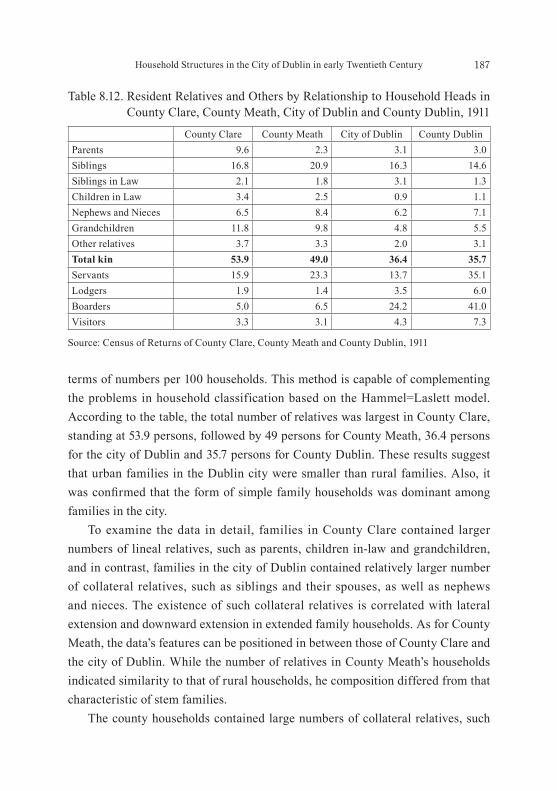
187Household Structures in the City of Dublin in early Twentieth Century
terms of numbers per 100 households. This method is capable of complementing the problems in household classification based on the Hammel=Laslett model. According to the table, the total number of relatives was largest in County Clare, standing at 53.9 persons, followed by 49 persons for County Meath, 36.4 persons for the city of Dublin and 35.7 persons for County Dublin. These results suggest that urban families in the Dublin city were smaller than rural families. Also, it wasconfirmedthattheformofsimple family households was dominant among families in the city. To examine the data in detail, families in County Clare contained larger numbers of lineal relatives, such as parents, children in-law and grandchildren, and in contrast, families in the city of Dublin contained relatively larger number of collateral relatives, such as siblings and their spouses, as well as nephews and nieces. The existence of such collateral relatives is correlated with lateral extension and downward extension in extended family households. As for County Meath, the data’s features can be positioned in between those of County Clare and the city of Dublin. While the number of relatives in County Meath’s households indicated similarity to that of rural households, he composition differed from that characteristic of stem families. The county households contained large numbers of collateral relatives, such
Table 8.12. Resident Relatives and Others by Relationship to Household Heads in County Clare, County Meath, City of Dublin and County Dublin, 1911
County Clare County Meath City of Dublin County DublinParents 9.6 2.3 3.1 3.0 Siblings 16.8 20.9 16.3 14.6 Siblings in Law 2.1 1.8 3.1 1.3 Children in Law 3.4 2.5 0.9 1.1 Nephews and Nieces 6.5 8.4 6.2 7.1 Grandchildren 11.8 9.8 4.8 5.5 Other relatives 3.7 3.3 2.0 3.1 Total kin 53.9 49.0 36.4 35.7 Servants 15.9 23.3 13.7 35.1 Lodgers 1.9 1.4 3.5 6.0 Boarders 5.0 6.5 24.2 41.0 Visitors 3.3 3.1 4.3 7.3
Source: Census of Returns of County Clare, County Meath and County Dublin, 1911

188 Chapter 8
as siblings, nephewsandnieces,andthedistributionpatternwasreflectedalsoin the high rate of no family. Farms worked by family members were prevalent, in County Clare, in contrast to County Meath, with its larger farms where the employment of farm labourers was commonplace. The number of servants was smallest in the city of Dublin (13.7 persons), and was largest in County Dublin (35.1 persons), attributable to the large number of servants residing in middle- and upper-class households in the suburbs of the city of Dublin. Meanwhile, in Dublin, servants aged 30 or less accounted for 85 percent of all servants in Dublin, and most younger servants were unmarried [D. Connor, G. Mills & N. Moore-Cherry, 2011, 254]. Therefore, these servants can be regarded as “lifecycle servants” as in Britain. The numbers of lodgers, boarders and visitors were relatively small in rural households. In the other hand, boarders had relatively high figures of 24.2 persons per 100 households for the city of Dublin, and 41 persons for County Dublin. Moreover, the numbers of lodgers and visitors for Dublin were larger than in rural households. As such, co-residence with non-kin can be regarded as a feature of urban households. Urban families tended to temporarily receive, in their household, relatives and acquaintances who at the time of immigration to the city lacked housing arrangements. The large number ofnon-kininhouseholdsinDublinwasdirectlyreflectedinthehousehold size in the region. The analysis in the preceding paragraphs shows that families in the city of Dublin had a smaller number of relatives than had families elsewhere. This situationwasreflectedintheexistenceofsimple family households; and by way of servants, boarders or visitors, a relatively large number of non-relatives.
Life course
Figure 8.2 suggests the life course of household heads in the city of Dublin. To describe the status of household members from the viewpoint of household head, household members in the city of Dublin got married either on reaching the age range of 15 through 19 or later. In accordance with such marriage, a spouse joined the household. In general the household head at the time of the census was mostlikelytobeinhis/herfiftiesorsixties.Ifpresent,parentsofhousehold heads werecommonlyinhigheragerangesbeyondthefiftiesorsixties.Thenumber

189Household Structures in the City of Dublin in early Twentieth Century
of children in the household started to decrease, after siblings reached their late twenties. Some household members were to remain single throughout their lifetime. The household contained servants ranging from their late teens upward through their thirties. Marriages in the city of Dublin took place at a younger age than in rural areas. Children left their household earlier in life. Household members who were parents of the household head feature mostly in age grouping above the late sixties. As for non-kin, servants aged between 15 and 40 lived in the household, and other non-relatives of various ages were also contained in the household.
Conclusion
From the evidence of the preceding sections, the outcome was that simple family households featuring late marriage were basically dominant among families in the Dublin city, and this was based on a family formation in line with the principle of the nuclear family system. These features suggest the Hajnal theory. However, urban society was not composed only of people born in the urban area; it also contained many immigrants from rural areas, some
Parents
Kin
Servants
Others
Sibling
Children
Spouse
Head0%
10%
20%
30%
40%
50%
60%
70%
80%
90%
100%
0~4 5~910~14
15~1920~24
25~2930~34
35~3940~44
45~4950~54
55~5960~64
65~6970~74
75~7980~84
85~8990~94 95~
Figure 8.2. Age of Household Heads and Household Relationships in City of Dublin (1911)
Source: Census of Returns of City of Dublin, 1911

190 Chapter 8
of whom perpetuated the ethos characteristic of rural families. Therefore, if family situational factors worked favorably, stem families could potentially be formed. In such cases, even in urban families, in specific instances members held patriarchal rights over a long period of time, in line with the ethos of rural families. However, children in urban families as a rule did not receive a property inheritance as was common in rural families. As a consequence, children in urban families were likely to leave their household earlier in life and take up employment as an unskilled worker or “lifecycle servant”. They got married if conditions for marriage were met. Their age at marriage tended to be lower than in rural families, in which children had over time some expectation of patriarchal rights. Young urban couples, in general, created and lived in a new home. The structure of urban families was based on the population structure featuring high marriage rates, high fertility and high mortality. As a conclusion, the simple family households were dominant family forms, and this implies that the family norms in line with the principle of the nuclear family system constituted one of the most effective family strategies to achieve well-being in urban life. While the nuclear family system was dominant among families in the city of Dublin, stem families could be formed as well, if situational factors worked favorably for such family formation. However, formation of stem families took place only in one of the phases of the life course of households. No previous studies have been conducted regarding families in urban society such as is attempted in the present study of Dublin. This research is intended to be meaningful, through identifying features of the family structure in the city of Dublin by numerical analysis.
Chapter 9Household Structure of Irish Immigrants In Britain
and America in 1880/1
Introduction
In the foregoing chapter, it was revealed to Dublin city family structure that people who emigrated from Ireland rural was formed. However, Ireland farmers are a lot of people after the Great Famine the United Kingdom and the United States were immigrants. The population movement, was higher for immigrants to foreign countries than the internal migration. In this chapter, using the assimilation theory by Todd, we want to clarify the structure of the Irish immigrant’s family in the United Kingdom and the United States. First to consider the immigration theory by Todd, we want to show that the assimilation theory is valid as an analytical framework of Irish immigrants from there. Le Destin Des Immigres, Emmanuel Todd explains the assimilation and segregation of immigrants by presenting the hypothesis of the “principle of host society omnipotence,” which postulates that “each host country has its own specific unconscious archetype, which functions as a framework that determines the views on and fates of immigrants.” It assumes two specific archetypes thatensurehostcountryomnipotence−universalism, observed in France, and differentialism, predominant in Germany, England and the United States. Universalism in this context means that the “integration of peoples can be achieved by sharing the universal idea that all human beings are fundamentally the same everywhere in the world,” whereas differentialism is regarded as an attitude opposite to universalist thinking [E. Todd, 1999, 33-35]. This suggests that in the anthropological dimension, France embodies a “process that assimilates all groups of immigrants and ethnic minorities, regardless of their physical characteristics or religious backgrounds.” Meanwhile, differentialism prevails in the United States and England, identifying and differentiating ethnic groups based on differences in physical characteristics, languages,religionsandotherdefiningstandards.Thesetwotypesof thinkingare then linked to different family structures [E. Todd, 1999, 46].

192 Chapter 9
Todd classif ies family structures according to two parameters, i.e., authoritative [authoritarian] /liberal parent-child relations and equality/inequality among brothers. Where studies on immigrants are concerned, he deduces universalism or differentialism from the parameter of quality/inequality among brothers alone [E. Todd, 1985, 6-11]. According to Todd’s assumption, universalist countries, on the one hand, have a family system symmetrized by egalitarian inheritance rules, and equality of all human beings is deduced from the equality of all brothers. Differentialist countries, on the other hand, assume an unsymmetrized family system, which gives different treatment to different brothers (Figure 9.1). Now, how does Todd view British and American societies, societies that have long hosted Irish immigrants, a group of people that I have been studying as my major research subject? In the English family system, inequality of inheritance based on their non-homogeneity, is weak. And, as a manifestation of the differentialist thinking thatdoesnotallowanyspecificethnicgrouptohaveitsowngeographical hub, absolute nuclear families predominate. Yet, it should also be noted that England places greater emphasis on class differentialism than on racial differentialism. Meanwhile, the United States, a country built by Protestant immigrants from
Source: E. Todd, 1985, 10.
Figure 9.1. E. Todd’s Family Types
193Household Structure of Irish Immigrants In Britain and America in 1880/1
England, originally embraced differentialism based on religion and inequality among brothers in the family. Nonetheless, as provided for in the Declaration of Independence, the country changed its attitude from differentialism to egalitarianism, leading white families to form egalitarian nuclear families. And with later immigrants from Europe who chose to assimilate themselves to the United States society, assimilation of the white population in general proceeded. This process, however, is believed to have been accompanied by a differentialist attitude toward the Indians, who were indigenous inhabitants, and the black people who were slaves. It should be noted that Todd, among his other achievements, measures the degree of assimilation and segregation based on the percentage of inter-marriage between an immigrant group and its host society. Particular attention should also be paid to the fact that Todd regards the percentage of female exogamy as an important measure for determining the degrees of immigrant assimilation and segregation. Based on the above observations, it is believed that Todd’s theoretical framework concerning immigrants is applicable, as a general framework, to examining the assimilation and segregation statuses of immigrants to host countries.
Hypothesis about Irish Immigrants in England and the United States
I propose the hypothesis that in Ireland, simple family households predominant in the early nineteenth century were replaced by extended family households and multiple family households that prevailed in the mid-nineteenth
century to around 1950, as a result of a shift toward impartible inheritance and the introduction of the matchmaking/dowry system [Y. Shimizu, 2011, 2012, 2013, 2014a, 2014b]. Meanwhile, young people other than household successors, who were excluded from stem families in their home country, sought to emigrate to other countriesratherthanfindjobsinIrishcitieswheremanufacturingindustrywason a limited scale. Irish immigrants in the nineteenth century also had a marked tendency to choose the United States as their destination, rather than England &

194 Chapter 9
Wales or Scotland. This inclination is believed to have resulted from the strong pull-push factors that existed in Ireland and the United States in those days. As mentioned above, due to the shift from the nuclear family to the stem family system in the mid-nineteenth century and thereafter, families in Ireland began to take on differentialist characters. Yet, when emigrating to Britain or the United States, Irish immigrants adopted a family strategy in which they assimilated themselves to the host societies by forming absolute nuclear families or egalitarian nuclear families. It is believed, however, that Irish immigrants found assimilation easier in England & Wales, where differentialism prevailed, than in the egalitarian U. S. society. Although the first-generation Irish immigrants formed and lived in ghetto-type communities, the second and third generations where mobile both geographically and occupationally, thereby undergoing a process of assimilation into the host societies. Specifically, rather than adapting themselves to the host societies on an individual basis, Irish immigrants in Britain and the United States built families and ensured that all family members should have jobs to pursue their well-being by securing the largest possible family income. To achieve these goals, they adopted the strategy of forming the simplest possible family structure. T. J. Meagher bases his observations on this particular family strategy [T. Meagher, 2001, 52-58]. This is why simple family households predominated among Irish immigrants, to adjust their family structure to that of the host societies. At the same time, their tendency to maintain - while modifying - their traditional family characteristics and Irish identity as distinct from those of the host societies is also manifest in their way of building families. In terms of family structure, Irish immigrants found it easier to adapt themselves to the British absolute nuclear family, which was based on differentialism marked by inequality among brothers, than to the American egalitarian nuclear family system. Thus far, I have outlined my hypothesis that Irish people excluded from the Irish family system emigrated to England and the United States and pursued a family strategy in which they sought assimilation to the host societies. The following are the parameters on which I base my hypothesis.⑴ Irish immigrants showed a high degree of geographical concentrations in

195Household Structure of Irish Immigrants In Britain and America in 1880/1
England and the United States.⑵ As in their birthplaces in Ireland, Irish immigrants married later in life, so the
heads of the families were older.⑶ Heads of Irish immigrant families tended to be employed as semiskilled or
unskilled workers, rather than on farms.⑷ The sex ratio among Irish immigrants was nearly equal, increasing the
possibility of endogamy.⑸ Irish immigrants tended to marry late or remain single, a marriage pattern to
which Hajnal’s theory applies [J. Hajnal, 1982].⑹ Irish immigrant households were smaller than those in their home country,
but larger than those in their host countries.⑺ The size of their households was attributable to their fecundity or fertility,
resulting from the lack of any effort at limitation of family size.⑻ Irish immigrant families had a stronger affinity to the standards of the
simple family household than to those of the stem family household that predominated in their home country: this affinitywasevenstrongerthaninother households in the host countries.
⑼ Heads of Irish immigrant families had fewer relatives than their counterparts in their home country than other heads of families in the host countries. Their relatives were limited to their parents’ generation, their own generation and their children’s generation.
⑽ While assimilating themselves into the host societies, Irish immigrants tended to maintain their traditional identity, manifested by high birthrates, development of Irish settlements and a strong inclination toward endogamy.
The aim of this chapter is to conduct bottom-upverificationofmyhypothesis,developed from the above parameters, concerning the family structure of Irish immigrants in Britain and the United States, using the database containing the original census record created under the NAPP (North Atlantic Population Project) 1 for England & Wales (1881) and for the United States (1880). Attention
1 The North Atlantic Population Project (NAPP) is a machine-readable database of the
complete censuses of Canada (1881), Great Britain (1881), Norway (1801, 1865, 1900,
1910), Sweden (1890, 1900), the United States (1880) and Iceland (1801, 1901). These
eleven censuses comprise our richest source of information on the population of the North
196 Chapter 9
will also be paid to differences in Irish immigrant assimilation patterns in England and the United States. It should also be noted that young Irish who emigrated to Britain and the United States following the Great Famine in 1845 and built families in their host countries constituted the core of Irish immigrants as of 1880, as heads of families about 60 years of age. They represent the characteristics of the typical families created by Irish immigrants who had left their country as a result of the Great Famine. For many years, numerous studies have been conducted with respect to Irish immigrants in Britain and the United States. In this sense, the hypothesis presented here is not particularly novel, but is meaningful in that it is based on the census data of the entire population of Britain and the United States, and is therefore quantitative and numerical in nature, in contrast to earlier studies that are mostly qualitative and monographic in nature. Before verifying my hypothesis, I would like to brief ly discuss the demographic characteristics of Ireland at the end of the nineteenth century, Ireland’s emigration status and the situation of Irish immigrants in England and the United States.
Ireland’s Demographic Trends
Irish people are known to have started emigrating well before the Great Famine in 1845: some of them left permanently to settle in other countries, others as seasonal workers, mostly on farms in Britain. There is no doubt, however, that the Great Famine caused a dramatic increase in the number of Irish emigrants. The population of Ireland in 1841, before the Famine, was more than 8 million. After the Famine, by 1851 it had dropped by about 20 percent, to 6.5 million. This drop clearly indicates that, during that 10-year period, 1.5 million Irish either
Atlantic world in the late nineteenth century, and they have only recently become available
for social science research. Samples of census data are also available for Canada (1852,
1871, 1891, 1901), Great Britain (1851), the German state of Mecklenburg-Schwerin (1819),
Norway (1875), and the United States (1850, 1860, 1870, 1900, 1910), which support cross-
temporal analyses. [North Atlantic Population Project, Minnesota Population Center,
University of Minnesota, homepage]

197Household Structure of Irish Immigrants In Britain and America in 1880/1
died of hunger or illnesses, or emigrated abroad. The Irish population continued declining even after that; by 1961, it had decreased to half the pre-famine population (Table 9.1). The sex ratio was 0.96-0.97 male to 1.0 female before the Famine. After the Famine the male ratio increased gradually, reaching 1.0 by 1911. These characteristics coincide with Collins’ observations [Brenda, Collins, 1993, 367]. Put another way, there was no sex difference in the ratio of immigrants.
Regarding the home provinces of Irish immigrants, while Ulster and Leinster produced many immigrants before the Famine, it is apparent that, after the
Table 9.2. Emigrants from Each Provinces, 1880-1900Year Province Leinster Munster Ulster Connaught Total N (persons)
1880Males 16.8 32.3 30.5 19.9 100.0 49,909
Females 17.0 31.4 28.3 23.3 100.0 45,558Total 16.9 32.1 29.5 21.5 100.0 95,464
1890Males 18.4 38.8 23.3 19.4 100.0 31,362
Females 15.5 38.0 23.2 23.3 100.0 29,952Total 17.0 38.3 23.3 21.3 100.0 61,313
1900Males 9.1 38.8 20.1 16.0 100.0 23,295
Females 7.3 37.3 20.0 33.6 100.0 23,812Total 8.1 38.3 20.0 29.8 100.0 47,107
Source: BPP, Emigration Statistics of Ireland, 1881, 1890-1, 1901
Table 9.1. Population of Ireland 1821 to 1926Male Female Total Percentage change
1821 3,341,926 3,459,901 6,801,8271831 3,794,880 3,972,521 7,767,401 14.191841 4,019,576 4,155,548 8,175,124 5.251851 3,190,630 3,361,755 6,552,385 -19.851861 2,837,370 2,961,597 5,798,967 -11.51871 2,639,753 2,772,624 5,412,377 -6.671881 2,533,277 2,641,559 5,174,836 -4.391891 2,318,953 2,385,797 4,704,750 -9.081901 2,200,040 2,258,735 4,458,775 -5.231911 2,192,048 2,198,171 4,390,219 -1.541926 2,114,977 2,113,576 4,228,553 -3.68
Source: W. E. Vaughan and A. J Fitzpatrick, 1978, 3

198 Chapter 9
Famine, the provinces producing greater numbers of immigrants shifted to the eastern and southern regions, where living standards ranked somewhere between the rich region in the north of Ireland and those of the poorest region, Connacht, in the west of the country. Compared to eastern Ireland, the western part of the country containing Connacht province was marked by a greater population pressure on its arable land, less social division of labour and more severe poverty. Yet this region produced fewer immigrants than other parts of the country, because the tenant farmers had a strong sense of attachment to the land, great reluctance to emigrate and were too poor to be able to pay the fare to America (Table 9.2). The number of emigrants for each decade from 1880, the beginning of the period discussed in this chapter, indicates that emigrants in 1880 totaled 95,000 forming a third peak following a second peak in the 1860s. The number decreases after 1880, when the largest portion, or 32.0 percent of emigrants, was from Munster, followed by Ulster, Connacht and Leinster. The Table 9.3 shows the percentages of the home provinces and the destinations of Irish immigrant.
Table 9.3. Destination in Percentage of the Emigrants from each Province (%)Province America Australia Canada England & Wales Scotland N (persons)
1880
Leinster 83.9 2.7 2.2 7.9 1.5 16,169Munster 79.7 3.2 0.8 12.5 0.4 30,654Ulster 62.4 2.6 7.6 7.5 18.5 28,122Connaught 92.8 2.0 1.4 2.3 1.1 20,519N (persons) 74,636 2,576 3,052 7,741 5,808 95,517
1890
Leinster 86.7 6.3 1.7 4.2 0.2 10,415Munster 84.4 4.6 1.1 9.1 0.4 23,554Ulster 80.0 2.5 6.7 1.7 8.5 14,277Connaught 94.5 2.0 0.9 1.3 1.2 13,067N (persons) 52,685 2,338 1,517 2,998 1,474 61,313
1900
Leinster 73.4 7.9 3.1 13.8 1.0 3,857Munster 87.5 1.3 0.4 9.7 0.9 17,933Ulster 57.2 2.6 2.4 19.1 17.4 9,438Connaught 98.3 0.4 0.3 0.3 0.6 14,060N (persons) 37,765 834 472 4,123 1,927 45,288
Source: BPP, Emigration Statistics of Ireland, 1881, 1890-1, 1901
199Household Structure of Irish Immigrants In Britain and America in 1880/1
In 1880, the number of emigrants to the United States stood at 75,000, followed by lower numbers for England & Wales, Scotland, Canada and Australia. By province, Connacht tops the list with 92.8 percent of its immigrants concentrated in the United States, followed by Leinster, Munster and Ulster. Besides the United States, many emigrants from Leinster landed in England & Wales. With respect to Munster, while the majority of emigrants were bound for the United States, some emigrated to England & Wales and Australia. Ulster had a smaller percentage of emigrants to the United States than the other provinces, with a substantial portion of its emigrants bound for Scotland, followed by Canada and England & Wales, presenting distinctive characteristics that set Ulster apart from the other provinces. These characteristics presumably reflect theprovince’spredominantlyProtestantreligiousbackground.Connacht stands out with its emigrants’ highest concentration in the United States (Table 9.3). Finally, with regard to the age composition of Irish emigrants, in 1880 the highest percentage (36.0 percent) of male emigrants were 20-24 years of age, followed by 25-29 year olds (17.3 percent) and 15-19 year olds (13.4 percent), indicating that the 15-29 year olds accounted for 66.7 percent of all male emigrants.Thesefiguresarebelievedtoimplythatemigrantsmainlycomprisedsingle men, many of whom were either disappointed in hopes of succeeding to farm households or had no such hopes as a result of the institutionalization of the stem family in the 1850s and thereafter through the introduction of impartible inheritance rules and the matchmaking system. The underdeveloped labour market, resulting from, Belfast apart, limited urbanization and industrialization was yet another push factor that promoted emigration. As for occupations before emigration, general workers represent the highest portion among male immigrants. The province with the highest percentage of general workers was Connacht, with 84 percent of its immigrants having been general workers before emigration, followed by Leinster, Munster and Ulster. Ulster stands out with a slightly larger portion of farmers than the other provinces. As regards female emigrants, servants account for the largest portion for all the provinces, with Connacht having the highest percentage, as in the case of general workers for male emigrants. These numbers show that, before emigration, most male emigrants from

200 Chapter 9
Irelandwereunspecifiedgeneral workers, i.e. semiskilled or unskilled workers, and most female emigrants were servants. As discussed below, these people were highly likely to have the same kinds of jobs in their destinations as the ones they’d had in their home country.
Regional Characteristics of Irish Immigrants in host societies
Geographic concentration of Irish immigrants in England & Wales
As indicated above, while England & Wales received a smaller number of Irish immigrants than did the United States, England & Wales are believed to have been destinations that were relatively easy for Irish people to access, in terms of travel distances and expense. Map 9.1 and Table 9.4 contain results of cross tabulation of Irish immigrants and British citizens (“British citizens” as used hereinafter refers to those born in England & Wales) by census division. In 1881, there were nearly 550,000 Irish immigrants in Britain, accounting for 2.1 percent of the entire British population. In the period between 1841 and 1971, Irish immigrants as a percentage of the
Table 9.4. Number of Population of England and Wales by Division, 1881Irish English Total
Eastern 1.3 5.3 5.2 Islands 0.6 0.5 0.5 London 14.5 14.4 14.7 Monmouth/Wales 3.9 6.2 6.1 Northern 11.7 6.2 6.3 North-Midland 2.0 6.5 6.3 North-Western 40.1 13.9 14.4 South-East 5.4 9.7 9.6 South -Midland 1.7 6.9 6.8 South-Western 2.3 7.3 7.2 West-Midland 6.0 11.9 11.7 Yorkshire 10.4 11.3 11.2 Total 100.0 100.0 100.0 N (persons) 544,596 24,871,802 25,864,702
Source: NAPP GB 1881 Data

201Household Structure of Irish Immigrants In Britain and America in 1880/1
entire population of England & Wales peaked in 1861 at 3.0 percent, which is believed to ref lect the impact of the 1845 Great Famine. The effect of the Famine seems to have persisted even until 1881. By census division, in 1881 the percentage of Irish immigrants was highest in northwestern England, where it represents 40.1 percent of the population, followed by 14.5 percent in London, 11.7 percent in northern England and 10.4 percent in Yorkshire as a whole.
Map 9.1. The Irish Immigrants in England and Wales, 1881

202 Chapter 9
When combined, these four divisions account for 76.7 percent of Irish immigrants, implying their markedly high concentration in these regions. Of the 40.1 percent of Irish immigrants in northwestern England, the greatest portion, or 38.5 percent, is concentrated in Lancashire, 10.9 percent in Middlesex and 4.2 percent in Surrey−twocountiesclose toLondon, 7.9 percent in West Yorkshire, and 6.7 percent in Durham. These figures show that 68 percent of Irish immigrants resided in these five counties, implying relatively higher concentration in cities and industrial areas.
Geographical concentration of Irish immigrants in the United States
Map 9.2 and 9.3 are also shows the distribution of Irish immigrants of 1880 in the United States. According to it, it can be seen that the Irish immigrants are concentrated in the United States of the Eastern Province. Then, in Map 9.4, we want to consider in detail the Irish immigrants were concentrated in the eastern part. Geographical distribution of Irish immigrants in the United States indicates that the highest portion of immigrants, 44.1 percent, migrated to the Mid-Atlantic region, followed by 19.7 percent to New England, 16.4 percent to the East North Central region and 9.2 percent to the WestNorthCentral.Thesefiguresshowamarked concentration of Irish immigrants in the area ranging from the East to the
Table 9.5. Percentage of Birth by Country in the USA, 1880
Country New England
Middle Atlantic
EastNorth
Central
WestNorth
CentralSouth
AtlanticEast
SouthCentral
WestSouth
CentralMountain Pacific Total N
United States 7.4 19.4 21.3 12.3 17.0 12.6 7.2 1.1 1.8 100.0 43,607,352Ireland 19.7 44.1 16.4 9.2 2.9 1.6 1.3 1.1 3.7 100.0 1,877,878Norway 0.6 1.5 38.5 55.8 0.1 0.1 0.5 1.2 1.6 100.0 182,522Sweden 4.6 10.4 32.9 43.7 0.4 0.4 0.9 3.7 3.0 100.0 195,445United Kingdom 12.1 34.5 26.6 11.8 2.7 1.2 1.5 5.3 4.3 100.0 912,711Italy 7.8 43.0 8.5 5.4 3.1 2.7 7.3 5.1 17.1 100.0 45,261Austria 1.7 26.4 29.8 24.4 1.9 1.3 6.0 2.1 6.3 100.0 36,656France 3.3 30.8 27.4 12.7 1.9 2.8 10.8 1.8 8.5 100.0 126,584Germany 1.8 29.2 38.7 18.8 3.5 2.0 2.8 0.7 2.4 100.0 1,984,683Netherlands 1.5 23.7 54.2 15.9 1.2 0.6 0.7 0.6 1.5 100.0 54,724Switzerland 1.6 22.1 37.1 22.2 2.0 2.7 2.3 3.2 6.8 100.0 90,595
Source: NAPP U. S. 1880 Data

203Household Structure of Irish Immigrants In Britain and America in 1880/1
Map 9.2. Number of Persons born in Ireland in USA, 1880
Source: http://www.demog.berkeley.edu/145/maps/Irish1880.gif
Map 9.3. Geographical Settlement of Irish Immigrants in USA, 1880

204 Chapter 9
North Central region. According to population distribution by state and place of birth, Irish immigrantsaccountedfor5percentormoreinfivestatesand3percentormoreinninestates,illustratingasignificantconcentrationofIrish immigrants’ places of residence. By state, the highest portion (26.6 percent) of Irish immigrants were concentrated in New York, followed by 12.6 percent in Pennsylvania and 12.1 percent in Massachusetts, indicating a marked geographical concentration of Irish immigrants in these states. With respect to population distribution by sex, the general tendency for male immigrants to outnumber their female counterparts does not apply to Irish immigrants, 47.9 percent of whom are male and 52.1 percent are female. In the case of U. S. citizens, 50.3 percent are male and 49.7 percent are female, a substantial difference from Irish immigrants. All these data demonstrate that, females outnumbered males up until 1891, as far as Irish immigrants were concerned [Commission on Emigration and other Population Problems, 1954, 115]. Among other states, New York, Massachusetts and Pennsylvania, which had high concentrations of Irish immigrants, presented
Map 9.4. Geographical Settlement of Irish immigrants in USA, New York, Massachusetts and Pennsylvania, 1880
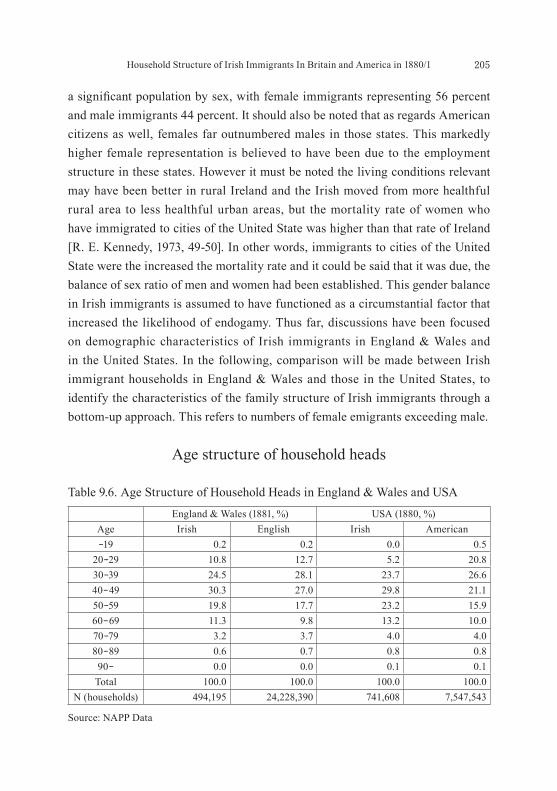
205Household Structure of Irish Immigrants In Britain and America in 1880/1
asignificantpopulationbysex,withfemaleimmigrantsrepresenting56percentand male immigrants 44 percent. It should also be noted that as regards American citizens as well, females far outnumbered males in those states. This markedly higher female representation is believed to have been due to the employment structure in these states. However it must be noted the living conditions relevant may have been better in rural Ireland and the Irish moved from more healthful rural area to less healthful urban areas, but the mortality rate of women who have immigrated to cities of the United State was higher than that rate of Ireland [R. E. Kennedy, 1973, 49-50]. In other words, immigrants to cities of the United State were the increased the mortality rate and it could be said that it was due, the balance of sex ratio of men and women had been established. This gender balance in Irish immigrants is assumed to have functioned as a circumstantial factor that increased the likelihood of endogamy. Thus far, discussions have been focused on demographic characteristics of Irish immigrants in England & Wales and in the United States. In the following, comparison will be made between Irish immigrant households in England & Wales and those in the United States, to identify the characteristics of the family structure of Irish immigrants through a bottom-up approach. This refers to numbers of female emigrants exceeding male.
Age structure of household heads
Table 9.6. Age Structure of Household Heads in England & Wales and USA
England & Wales (1881, %) USA (1880, %)Age Irish English Irish American-19 0.2 0.2 0.0 0.5
20-29 10.8 12.7 5.2 20.830-39 24.5 28.1 23.7 26.640-49 30.3 27.0 29.8 21.150-59 19.8 17.7 23.2 15.960-69 11.3 9.8 13.2 10.070-79 3.2 3.7 4.0 4.080-89 0.6 0.7 0.8 0.8
90- 0.0 0.0 0.1 0.1Total 100.0 100.0 100.0 100.0
N (households) 494,195 24,228,390 741,608 7,547,543
Source: NAPP Data

206 Chapter 9
The age structure of the heads of Irish immigrant households demonstrates that the 40-49 year-old bracket represented the highest percentage (30 percent) in Britain and the United States. While heads of Irish immigrant households were concentrated in 30-70 year-olds, the core age cohort of British and American household heads falls in the 20-60 year-old category, indicating the relative seniority of heads of Irish immigrant households. This characteristic can be attributed to the Irishimmigrants’inclinationtomarrylate,reflectingthesametendency toward later marriages as observed in their home country (Table 9.6).
This trait can also be confirmed from marriages of household heads. For one thing, the marital status of household heads indicate lower marriage rates among Irish immigrants than among others in their host countries. In Britain, for instance, the marriage rate of the heads of Irish immigrant households stands at 74.3 percent, as compared to 78.8 percent among British citizens. In the United States, the marriage rate of household heads is 76.3 percent for Irish immigrants and 82.7 percent for American citizens. At the same time, however, a smaller percentage of Irish immigrants remained unmarried. Those widowed/divorced also represented a larger portion among Irish immigrants than their counterparts in their host countries, due mainly to a greater percentage of wives who lose their husbands. This characteristic can also be confirmed from the large number of households headed by widows (3d, namely the type of 3d means a widow with children) in the table below concerning types of household heads. The Irishimmigrants’tendencytomarrylatecanalsobeidentifiedfromthedistribution of married household heads by age. Among married Irish immigrant
Table 9.7. Marital Status of Household Heads in England & Wales and USA
Marital statusEngland & Wales (1881) USA (1880)Irish English Irish American
Married, spouse present 68.5 73.6 74.1 80.7 Married, spouse absent 5.8 4.2 2.2 2.0 Widowed/Divorced 21.1 16.3 19.5 12.2 Never marriage/single 4.4 5.7 4.1 5.1 Total 100.0 100.0 100.0 100.0 N 180,113 5,089,880 736,599 7,480,886
Source: NAPP Data

207Household Structure of Irish Immigrants In Britain and America in 1880/1
household heads the largest cohort was the 40-49 year-olds in Britain and among the 30-39 year-olds in the United States. For British and American citizens, while the highest marriage rate is observed among the 30-39 year-olds, a substantial portion of married household heads falls in the 20-29 year-old cohort as well. Thesedataclearlydemonstrateasignificantdifferenceinmarriage age between Irish household heads and those in their host countries. This difference can be interpretedasreflectingtheinclinationofthenatalpeopleinthehostcountriesto marry earlier on the one hand, and the tendency of Irish immigrants to marry later on the other hand. Irish Americans also had a stronger tendency to stay single than did other white Americans suggesting that an Irish immigrants’ view on marriage was similar that view held by citizens in Ireland, but offered from the views held by Americans [T. Guinnane, Did Irish Marriage Patterns Survive the Emigrants Voyage? 1999, 16]. This tendency, therefore, was believed to embody certain aspects of Irish national traits. Regarding percentages of endogamy and exogamy, measures considered important for determining the extent of immigrants’ assimilation, the percentage of endogamy among Irish immigrants stands at 66.4 percent in Britain and 77.7 percent in the United States, suggesting that Irish immigrants in those countries maintained a strong inclination toward endogamy. Guinnane pointed out that among those Irish-women who married in America, 70 percent married Irish-born men or the sons of Irish-born immigrant also [T. W. Guinnane, 2004, 4].
Table 9.8. Percentage of Married Household Heads by Age in England & Wales and USA
AgeEngland & Wales (1881) USA (1880)
Irish English Irish American20~29 10.4 16.2 5.6 22.2 30~39 25.3 26.6 26.9 28.8 40~49 33.1 25.0 20.7 21.3 50~59 19.4 18.6 21.8 15.1 60~69 9.3 10.2 11.4 8.9 70~79 2.1 3.0 3.0 3.2 80~89 0.3 0.4 0.5 0.5 Total 100.0 100.0 100.0 100.0
N 10,374 216,011 562,247 6,186,609
Source: NAPP Data
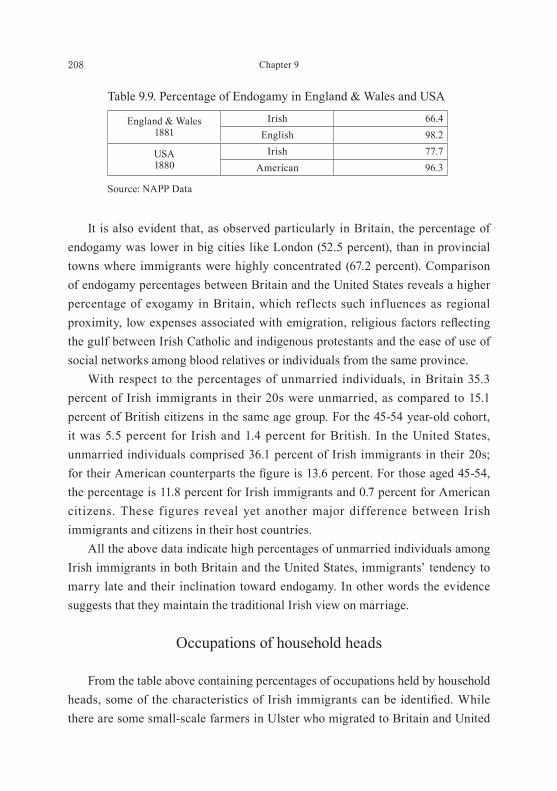
208 Chapter 9
It is also evident that, as observed particularly in Britain, the percentage of endogamy was lower in big cities like London (52.5 percent), than in provincial towns where immigrants were highly concentrated (67.2 percent). Comparison of endogamy percentages between Britain and the United States reveals a higher percentage of exogamy in Britain, which reflects such influences as regional proximity, low expenses associated with emigration,religiousfactorsreflectingthe gulf between Irish Catholic and indigenous protestants and the ease of use of social networks among blood relatives or individuals from the same province. With respect to the percentages of unmarried individuals, in Britain 35.3 percent of Irish immigrants in their 20s were unmarried, as compared to 15.1 percent of British citizens in the same age group. For the 45-54 year-old cohort, it was 5.5 percent for Irish and 1.4 percent for British. In the United States, unmarried individuals comprised 36.1 percent of Irish immigrants in their 20s; fortheirAmericancounterpartsthefigureis13.6percent.Forthoseaged45-54,the percentage is 11.8 percent for Irish immigrants and 0.7 percent for American citizens. These figures reveal yet another major difference between Irish immigrants and citizens in their host countries. All the above data indicate high percentages of unmarried individuals among Irish immigrants in both Britain and the United States, immigrants’ tendency to marry late and their inclination toward endogamy. In other words the evidence suggests that they maintain the traditional Irish view on marriage.
Occupations of household heads
From the table above containing percentages of occupations held by household heads, some of the characteristics of Irishimmigrantscanbeidentified.Whilethere are some small-scale farmers in Ulster who migrated to Britain and United
Table 9.9. Percentage of Endogamy in England & Wales and USA
England & Wales1881
Irish 66.4English 98.2
USA1880
Irish 77.7American 96.3
Source: NAPP Data

209Household Structure of Irish Immigrants In Britain and America in 1880/1
States, general workers and servants constituted core groups in other provinces. Meanwhile, in Britain and the United States, general workers such as miners, craftsmen and dealers comprise the greatest portion, while those engaged in farming were few (Table 9.10 and 9.11). Closer scrutiny reveals that Irish immigrants in Britain were concentrated in such categories as general workers, domestic servants and workers in construction and textiles, while those in agriculture were very few. In the United States, however, while general workers still composed a core group, there were substantial portions of skilled workers and farmers as well, which
Table 9.10. Occupations of Household Heads by Irish and English People, 1881Code Code of Occupations Irish English
1 General/Local Government 2.1 1.4 2 Defense of the country 2.4 0.6 3 Professionals 3.0 2.9 4 DomesticServiceOffices 7.6 5.3 5 Commercial Occupation 2.0 2.7 6 Conveyance of men, goods and messages 7.5 6.4 7 Agriculture 3.7 15.4 8 Animals 0.4 1.2 9 Books, Print and Maps 0.6 0.9
10 Dealers in Machines and Implements 1.3 2.9 11 Workers and Dealers in Houses, Furniture and Decorations 8.1 9.0 12 Workers and Dealers in Carriages and Harnesses 0.4 1.0 13 Workers and Dealers in Ship and Boats 1.2 0.7 14 Workers and Dealers in Chemicals and Compounds 1.5 0.4 15 Workers and Dealers in Tobacco and Pipes 0.1 0.2 16 Workers and Dealers in Food and Lodging 4.6 8.2 17 Workers and Dealers in Textiles Fabrics 5.6 5.3 18 Workers and Dealers in Dress 7.3 6.2 19 Workers and Dealers in Various Animal Substances 0.7 0.7 20 Workers and Dealers in Various Vegetables Substance 1.5 1.7 21 Workers and Dealers in Various Mineral Substances 14.2 13.4 22 WorkersandDealersinGeneralorUnspecifiedCommodities 19.6 8.3 23 Workers and Dealers in Refuse Matters 0.4 0.2 24 PersonswithoutSpecifiedOccupations 4.2 5.1
Total 100.0 100.0 N 167,430 4,864,961
Source: NAPP Data

210 Chapter 9
presentsamajordifferencefromBritain.Thisdifferenceisbelievedtoreflect1)Irish immigrants’ occupations in their home country, 2) classes of people with sufficient means of immigrating to the United States (classes able to procure enough money to cover expenses associated with emigration) and 3) lower-class workers’ tendency to immigrate to Britain. And yet, Irish immigrants in both countries show a common general tendency in that they comprise the foundation of key industrial sectors in big cities. Thus far, occupational tendencies of Irish immigrants have been studied. In the next section, discussions will be shifted to the characteristics of the family structures of Irish immigrants in Britain and the United States.
Household Structure
Size of households
The average household size in Britain was 4.93 for Irish immigrants and 4.65 for British citizens, while in the United States it was 5.22 for Irish immigrants and 4.88 for American citizens, clearly indicating that Irish immigrant households were larger than households of their host countries’ citizens. In Britain, British
Table 9.11. Percentage of Occupations of Household Heads in the United States, 1880
Occupations Irish American1 Professional, Technical 1.0 3.5 2 Farmers 18.2 48.3 3 Managers,Officials&Proprietors 7.6 5.9 4 Clerical and Kindred 0.9 1.3 5 Sales workers 1.7 1.9 6 Craftsman 14.8 10.9 7 Operatives 19.5 7.6 8 Service worker (private household) 1.5 0.8 9 Service worker (not household) 3.0 1.5
10 Farm Laborers 1.4 6.8 11 Laborers 30.4 11.6
Total 100.0 100.0 N 613,106 6,677,189
Source: NAPP U. S. 1880 Data
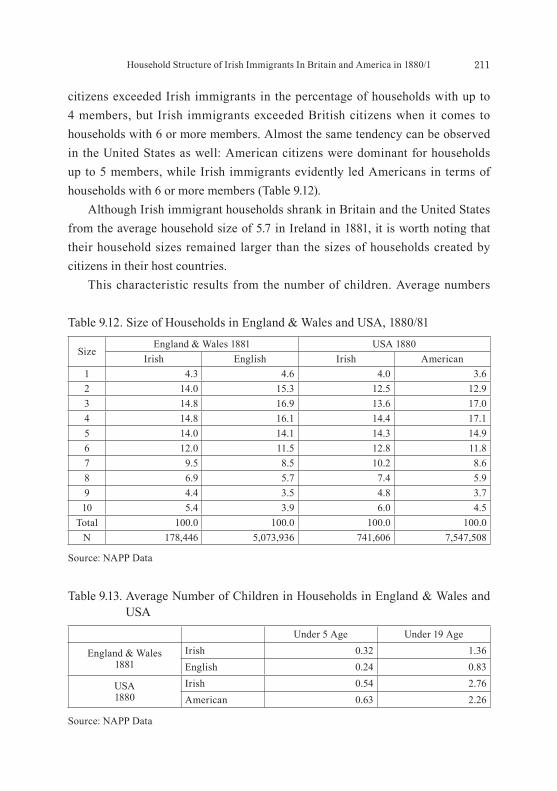
211Household Structure of Irish Immigrants In Britain and America in 1880/1
citizens exceeded Irish immigrants in the percentage of households with up to 4 members, but Irish immigrants exceeded British citizens when it comes to households with 6 or more members. Almost the same tendency can be observed in the United States as well: American citizens were dominant for households up to 5 members, while Irish immigrants evidently led Americans in terms of households with 6 or more members (Table 9.12). Although Irish immigrant households shrank in Britain and the United States from the average household size of 5.7 in Ireland in 1881, it is worth noting that their household sizes remained larger than the sizes of households created by citizens in their host countries. This characteristic results from the number of children. Average numbers
Table 9.12. Size of Households in England & Wales and USA, 1880/81
SizeEngland & Wales 1881 USA 1880
Irish English Irish American1 4.3 4.6 4.0 3.6 2 14.0 15.3 12.5 12.9 3 14.8 16.9 13.6 17.0 4 14.8 16.1 14.4 17.1 5 14.0 14.1 14.3 14.9 6 12.0 11.5 12.8 11.8 7 9.5 8.5 10.2 8.6 8 6.9 5.7 7.4 5.9 9 4.4 3.5 4.8 3.7 10 5.4 3.9 6.0 4.5
Total 100.0 100.0 100.0 100.0 N 178,446 5,073,936 741,606 7,547,508
Source: NAPP Data
Table 9.13. Average Number of Children in Households in England & Wales and USA
Under 5 Age Under 19 Age
England & Wales1881
Irish 0.32 1.36 English 0.24 0.83
USA1880
Irish 0.54 2.76 American 0.63 2.26
Source: NAPP Data
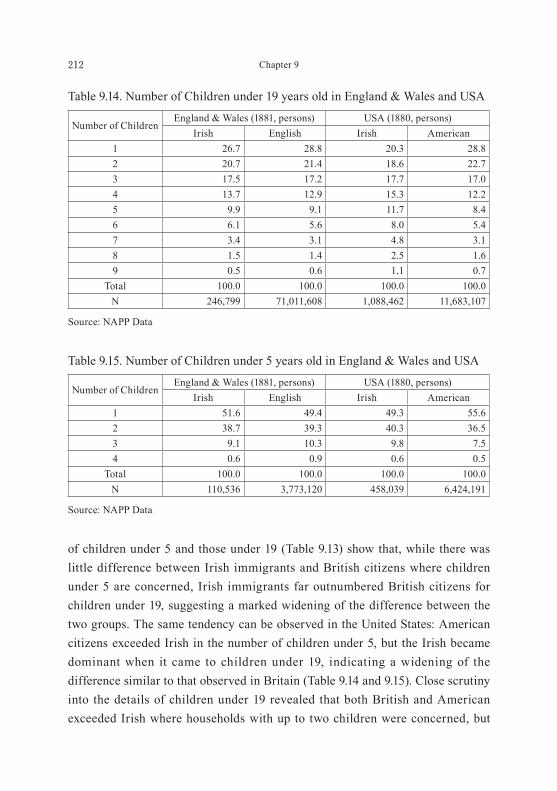
212 Chapter 9
of children under 5 and those under 19 (Table 9.13) show that, while there was little difference between Irish immigrants and British citizens where children under 5 are concerned, Irish immigrants far outnumbered British citizens for children under 19, suggesting a marked widening of the difference between the two groups. The same tendency can be observed in the United States: American citizens exceeded Irish in the number of children under 5, but the Irish became dominant when it came to children under 19, indicating a widening of the difference similar to that observed in Britain (Table 9.14 and 9.15). Close scrutiny into the details of children under 19 revealed that both British and American exceeded Irish where households with up to two children were concerned, but
Table 9.14. Number of Children under 19 years old in England & Wales and USA
Number of ChildrenEngland & Wales (1881, persons) USA (1880, persons)
Irish English Irish American1 26.7 28.8 20.3 28.8 2 20.7 21.4 18.6 22.7 3 17.5 17.2 17.7 17.0 4 13.7 12.9 15.3 12.2 5 9.9 9.1 11.7 8.4 6 6.1 5.6 8.0 5.4 7 3.4 3.1 4.8 3.1 8 1.5 1.4 2.5 1.6 9 0.5 0.6 1.1 0.7
Total 100.0 100.0 100.0 100.0 N 246,799 71,011,608 1,088,462 11,683,107
Source: NAPP Data
Table 9.15. Number of Children under 5 years old in England & Wales and USA
Number of ChildrenEngland & Wales (1881, persons) USA (1880, persons)
Irish English Irish American1 51.6 49.4 49.3 55.6 2 38.7 39.3 40.3 36.5 3 9.1 10.3 9.8 7.5 4 0.6 0.9 0.6 0.5
Total 100.0 100.0 100.0 100.0 N 110,536 3,773,120 458,039 6,424,191
Source: NAPP Data
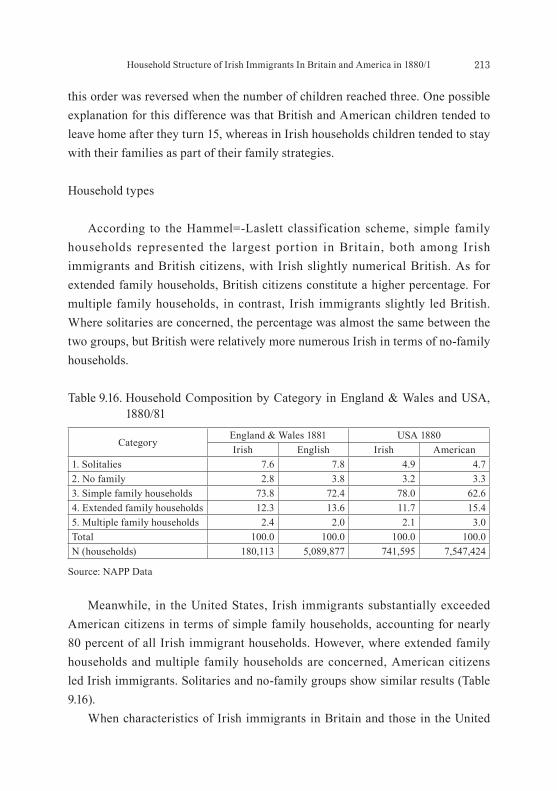
213Household Structure of Irish Immigrants In Britain and America in 1880/1
this order was reversed when the number of children reached three. One possible explanation for this difference was that British and American children tended to leave home after they turn 15, whereas in Irish households children tended to stay with their families as part of their family strategies.
Household types
According to the Hammel=-Laslett classification scheme, simple family households represented the largest portion in Britain, both among Irish immigrants and British citizens, with Irish slightly numerical British. As for extended family households, British citizens constitute a higher percentage. For multiple family households, in contrast, Irish immigrants slightly led British. Where solitaries are concerned, the percentage was almost the same between the two groups, but British were relatively more numerous Irish in terms of no-family households.
Meanwhile, in the United States, Irish immigrants substantially exceeded American citizens in terms of simple family households, accounting for nearly 80 percent of all Irish immigrant households. However, where extended family households and multiple family households are concerned, American citizens led Irish immigrants. Solitaries and no-family groups show similar results (Table 9.16). When characteristics of Irish immigrants in Britain and those in the United
Table 9.16. Household Composition by Category in England & Wales and USA, 1880/81
CategoryEngland & Wales 1881 USA 1880Irish English Irish American
1. Solitalies 7.6 7.8 4.9 4.7 2. No family 2.8 3.8 3.2 3.3 3. Simple family households 73.8 72.4 78.0 62.6 4. Extended family households 12.3 13.6 11.7 15.4 5. Multiple family households 2.4 2.0 2.1 3.0 Total 100.0 100.0 100.0 100.0 N (households) 180,113 5,089,877 741,595 7,547,424
Source: NAPP Data

214 Chapter 9
States are compared, it is evident that simple family households represented the largest portion of Irish immigrants in both countries. Among the simple family households, the subclass comprising widow with children (3d, namely 3d means the type of widowed with children) accounted for the largest portion in both countries, with 12.2 percent for Britain and 11.0 percent for the United States. This tendency should be regarded as resulting from the deaths of husbands. In fact, the average life span was 49 years for Irish men in 1870-90 (Table 9.17). As suggested above, Irish immigrants had a stronger tendency to form simple family households, despite the fact that their households were larger in size than their host society households. The number of resident relatives per 100 households demonstrates this particular characteristic more distinctly [R. Wall, 1983, 500]. The total number of relatives per 100 Irish immigrant households is 16.2 in Britain and 15.0 in
Table 9.17. Household Composition by Class in England & Wales and USA, 1880/81
Category ClassEngland & Wales (1881) USA (1880)
Irish English Irish American
1. Solitaries1a. Widowed 5.2 4.9 3.2 2.6 1b. Single 2.4 2.9 1.7 2.1
2. No family2a. Coresidence siblings 1.1 1.6 1.0 0.9 2b. Coresident relatives of other kinds 1.7 2.2 1.3 1.5 2c. Person not evidently related 0.0 0.0 0.9 0.9
3. Simple family households
3a. Married couples alone 11.4 12.9 9.5 12.4 3b. Married couples with child(ren) 46.6 49.0 54.2 52.9 3c. Widowers with child(ren) 3.3 2.7 3.0 1.7 3d. Widow with child(ren) 12.2 7.5 11.0 5.8 3e. Single women with child(ren) 0.3 0.3 0.3 0.8
4. Extended family households
4a. Extended upwards 2.9 3.2 3.1 4.5 4b. Extended downwards 5.5 6.6 4.0 5.2 4c. Extended laterally 3.0 3.9 3.9 4.8 4d. Combinations of 4a-4c 0.9 0.7 0.7 0.9
5. Multiple family households
5a. Secondary unit(s) Up 0.4 0.1 0.1 0.3 5b. Secondary unit(s) Down 1.8 1.8 1.8 2.4 5c. Units on one level 0.0 0.0 0.0 0.1 5d. Multiple: frereches 0.2 0.2 0.2 0.2 5e. Combinations of 5a-5d 0.0 0.0 0.0 0.0
Total 100.0 100.0 100.0 100.0 N (households) 180,113 5,089,877 741,595 7,547,424
Source: NAPP Data

215Household Structure of Irish Immigrants In Britain and America in 1880/1
theUnitedStates,significantlyfewerthan27.3(British)and33.5(American)inthe host societies. As the breakdown of relatives indicates, the small number of relatives characterizing Irish immigrant households is believed to result from the fact that Irish households had fewer siblings, nephews/nieces and grandchildren than their counterparts in the host societies. Still, it should be noted that Irish immigrants’ children and grandchildren, born in their host countries, will be citizens of USA (Table 9.18). The above data and observations suggest that, while Irish immigrants have larger household sizes than had other families in their host societies, they tended to build simple family households. Even when they form extended family households, such households consisted of parents living together with their grown-up children, unlike extended family households or multiple family households in their home country. In this way, Irish immigrants opted for a family strategy that would promote their assimilation into the host societies, thereby enhancing their well-being.
Table 9.18. Resident Relatives by Relationships to Household Heads in England & Wales and USA, 1880/81
England/Wales 1881 USA 1881Irish English Irish American
Parents 3.1 2.1 4.0 3.7 Parents-in-law 3.1 1.7 2.4 2.3 Siblings 4.0 5.4 4.4 6.7 Siblings-in-law 1.7 2.0 1.7 3.0 Children-in-law 0.8 1.4 0.5 2.6 Nephews/Nieces 1.5 5.0 0.9 4.7 Grandchildren 0.6 8.4 0.1 9.1 Relatives 1.4 1.3 1.0 1.4 Total 16.2 27.3 15.0 33.5
Note: per 100 HouseholdsSource: NAPP Data


Chapter 10Conclusion
Today, families in Ireland, like those in England, have a variety of characteristics. While the primary form of families in Ireland is the nuclear family,thefamilyformhasbeendiversifiedalongwithchangesinfamilyvaluesdue to an increase in cohabitation, late marriage, unmarried people, illegitimate children, and divorce (approved in 1995) and the approval of same-sex marriage in 2015. From the nineteenth century to the early twentieth century, however, there wasadefiniteshiftfromthenuclear family to the stem family. This book aims to elucidate such a shift in the family form based mainly on census returns. The author thinks that in general, family structure is determined by the family norm and family conditions. From this perspective, it seems appropriate to view Irish families in the nineteenth century to the early twentieth century within the framework of a shift from the family form based on the nuclear family system to that based on the stem family system. In short, while Irish families in the early nineteenth century were predominantly nuclear families based on the nuclear family system, they shifted to stem families based on the stem family system before and after the Great Famine in the mid-nineteenth century. However, this shift is often understood as two temporally disconnected conceptual family forms. In reality, this shift is not a discontinuous, but a continuous process, as pointed out by Jane Gray: Factors or signs of the stem family system (such as the impartible inheritance system and the matchmaking system) already appeared insomeregionsandspecifichierarchiesduringthetimewhenthenuclear family system was predominant, which allowed a smooth shift to the formation of stem families based on the stem family system. Based on such a model for a change in Irish families, the dominant family type or form in Ireland from the end of the eighteenth century to the mid-nineteenth century was the nuclear family based on the nuclear family system, which was supported by the family condition factor of the division of land ownership. Later, the integration of the widespread dowry-based matchmaking system among rural families and a change from the partible land ownership

218 Chapter 10
system to the impartible land ownership system gave birth to the formation of the stem family norm based on the stem family system. This stem family norm was supported by stem family conditions. This hypothesis was verified by elucidating the structure of rural families in Ireland based on the remaining the 1821 censusreturns(mainlyfivecounties)and the complete of the 1901 and 1911 census returns and then by examining the urban families in Dublin that had developed into a large city with migration of people from farm villages. Moreover, the characteristics of Irish families that emigrated to England and the United States after the Great Famine in 1845 were analyzed based on the complete 1881 census register of England and Wales and the complete 1880 census register of the United States. These three studies have elucidated the characteristics of Irish families from both aspects of temporal and spatial movements. According to the remaining the 1821 census returns, in the early nineteenth century County Meath and County King’s counties, which feature large landholdings, the transfer of land ownership occurred early, showing signs of the impartible inheritance system. Families in these counties had the following inherent characteristic: the compound family household was predominant among large landholding farmers, whereas the simple family household was predominant among labourers. In County Cavan and County Fermanagh, which were characterized by medium landholdings, the medium landholding farmers deemed the early division of landholdings and early marriage as good family strategies based on their economic foundation provided by farming and the home industry (domestic linen industry). Among these farmers, the single family household was a predominant form. In County Galway, which featured small landholdings, the partible inheritance system prevailed. Since people here were poor and could not make a living by farming alone, they held multiple jobs, such as those related to the domesticlinenindustryandfishery,andworkedas labourers. The heads of households in this region preferred a late inheritance to an early inheritance in consideration of their old age, and children acted accordingly to this family strategy. Consequently, while there were regional differences in family form among these three regions due to family conditions, basically, the nuclear family based on the nuclear family system was the most dominant family form. In the early twentieth century, the 100 percent census returns of 1901 and

219Conclusion
1911 became available. These records showed a significant regional difference in the formation of families in the nineteenth century between eastern Ireland and western Ireland: While the marriage rate was lower in western Ireland than eastern Ireland, the birthrate was higher and the mortality rate was lower in western Ireland than eastern Ireland. After the 1870s, the number of people who remained single for life began increasing, particularly in Leinster and Ulster, leading to the low household formation rate. While there was an increase in the number of people who remained single for life in Connacht and Munster, the natural growth of the population was secured by the high birthrate and the low mortality rate, and the household size was larger in these provinces than others. In Connacht and Munster, despite the natural growth of the population, the population structure showed a decrease in population due to a large number of emigrants to the United States. In western Ireland, the age of householders was higher in 1911 than 1901. This was due to the maintenance of patriarchal rights by householders. The fact that those householders had their heirs wait for inheritance without getting married rather than giving them an early inheritance led to late marriage and an increase in the number of unmarried people. This tendency was particularly evident among households in western Ireland since late marriage due to a late inheritance and having children other than heirs leave home as emigrants were considered good family strategies for the well-being of these households. On the other hand, in eastern Ireland, it was easier for children other than heirs to work in other cities in Ireland, such as in Dublin and Belfast, or to emigrate to the United States or England. Moreover, in eastern Ireland, there were more landless agricultural labourers and servants, who had options to make their own families (if they had enough money) or stay single. These people formed single family households, inhibiting the formation of stem families. For household types, the number of compound family households increased in 1911 compared with 1901 in Connacht and Munster in western Ireland, whereas it decreased in 1911 compared with 1901 in Ulster and Leinster in eastern Ireland. In other words, the distribution of the compound family household was high in the west and low in the east. The above analysis shows that the stem family was more predominant in western Ireland than eastern Ireland and that the stem family was formed in the

220 Chapter 10
small and medium-scale farming areas featuring the self-supporting agricultural form called peasant society. However, western Ireland here means only part of Connacht and Munster (Clare and Kerry counties). On the other hand, in eastern Ireland where a commercial agricultural society was formed, while there were some stem families, both family formation and the formation of the stem family system were weak since there existed a family condition where it was relatively easy for children to leave home/become independent and the possibility among landless labourers of forming a simple family household or staying single. In short, families in western Ireland had a strong stem family norm that was supported by family conditions, whereas in eastern Ireland, while a stem family norm existed, the family conditions to support the norm were not strong enough. These results show that the proposition by Arensberg and Kimball that the stem family system was formed among small and medium-scale farmers in western Ireland in the 1930s was statistically proved. Based on the regional differences across the country, families were compared among County Mayo, a poor, small-scale farming region, County Clare, a medium-scale farming region, and County Meath, a large-scale farming region. Below is the summary of the comparison. In County Mayo, the change in the land inheritance system occurred later than other counties. This was because the divided inheritance system continued into the late nineteenth century, leading to an increase in small farmers. Factors that supported the lives of small farmers included the access to commonage in after relatively favoured areas, and in other area seasonal migration to England and Scotland to work, and the production and sale of eggs. In County Mayo, 70 percent of the population was farmer’s occupiers, of which 23.2 percent constituted compound family households in 1901 and 25.7 percent in 1911. In particular, multiple family households, a typical household type of the stem family, accounted for 4.8 percent in 1901 and 5.4 percent in 1911, proving that the stem family was predominant. The predominant downward extension of multiple family households corresponded to the aging of household heads, which was interpreted to indicate that household heads maintained their patriarchal rights for a long time. In County Clare in Western Ireland, household structures were characterized by the prevalence of small and medium farmers, low household mobility, and
221Conclusion
continuous nature of landholding. The household head typically preferred to maintain his patriarchal rights for as long as he lived rather than transferring it to an heir earlier, and the heir remained unmarried while taking part in running the farm as family labour. Consequently, marriages tended to be late, and took place in the form of arranged marriages once an heir came into their inheritance. About 25 percent of households were complex family households. These were mainly stem families, which possessed strong stem family norms, and family situational factors also supported those norms. In County Meath in Eastern Ireland, households tended to be more polarized into large landholding households and landless labourer households. Landless labourers had high mobility, typically taking part in internal migration, international migration or Atlantic migration. Large farmers primarily engaged in livestock farming rather than crop farming, and like County Clare, their household heads preferred to maintain their patriarchal rights for long. In turn, heirs adopted the family strategy of participating in running the farm in anticipation of their inheritance upon the household head’s demise. Even after coming into their inheritance, the marriage rate for County Meath heirs was lower than other county, and the percentage of those who never married was twice that of County Clare. This lead to a high occurrence of households formed by siblings remaining in the parental home, and low occurrence of complex family households, indicating family dissolution in household formation, a result of family situational factors having stronger effects on household formation than family norm factors. As shown above, the nuclear family based on the nuclear family system was predominant among Irish farm families in the early nineteenth century, which shifted to the stem family based on the stem family system in 1901 and 1911. The stem family was more predominant among small and medium-scale farmers in western Ireland than large-scale farmers in eastern Ireland. However, the analysis of the remaining 1841 and 1851 census records, which was not discussed in this book, showed that changes in Irish families during the period from 1821 to 1901 did not take place in a phased manner as previously mentioned, but the number of complex family households, especially of extended family households, already began increasing in 1841 [Shimizu, Y. 2014a, 15]. Therefore, it seems more reasonable to think that the stem family was formed among Irish farm families

222 Chapter 10
as a result of gradual penetration of the stem family norms after the 1840s, which can be confirmed by the fact that the matchmaking marriage, one of the stem family norms, became widespread sometime after 1840s. In Cullen’s recommendation statement in this book, he has developed a theory that there were already norms of dowry, matchmaking and impartible inheritance before Great famine and the stem family has been already actualized. I do not completely deny his theory. That is, as mentioned in Chapter 4 that in census analysis of 1821, in large farmers and of County Meath and the small farmers of County Galway, I showed such stem family was present. However, there is in relation to inheritance still, because it is not fully elucidated. After all, though it is still unknown enough on the inheritance research, I judged it when the impartible inheritance might penetrate before and after famine by areas. This point will be the problems that we should examine more in future. The aforementioned family structures among Irish farmers were compared with stem families in Japan. One notices that the Irish stem family norm is less rigid than the Japanese Ie (Japanese stem family) norm, and that the Irish norm can be regarded as having a greater degree of elasticity determined by situational elements. In Japanese Ie, the eldest male is intended as the future heir at birth. The Ie norm clearly sets out who makes up the family, the eldest son remaining and all other male offspring leaving home dictated that only one child inherits the estate. In other words, in Japan, there were clear family norms, such as succession of Ie property by the oldest son, the eldest son inheritance system, and a property from the family of a bridegroom, which were supported by family conditions. The formative principle of the stem family was established because the Ie’s situational elements powerfully supported the family norm. The Irish family norm by comparison had a greater degree of f lexibility by situational elements. Among Irish families, however, while there were family norms, such as the determination of who would inherit family properties (mostly the oldest son) by the head of a family and the integration of a dowry (from a bride’s family) -based matchmaking system and the impartible inheritance system, the timing and possibility of inheritance and marriage were largely dependent on family conditions, such as regional and social hierarchical factors. Thus, the stem family norms in Ireland were weaker than those in Japan and more restricted by family conditions.

223Conclusion
Lastly, as it is possible to distinguish the Japanese Ie between northeast type and southwest type, we want to advocate the dichotomy of western Ireland type and eastern Ireland type of Irish rural stem family accompanied by regionalism of family structure. Family members who were forced to leave such families and people who could not make a living in Ireland moved to other cities within the country or emigrated to other countries. The family structure in early twentieth century Dublin, a city that received people who migrated from other parts of the country, was examined. The family structure in early twentieth century Dublin had the following characteristics. The form of simple family household featuring late marriage was basically dominant among urban families in the Dublin city, and this was based on a family formation in line with the principle of the nuclear family system. These featuresverifiedatheorysuggestedbyHajnal.However, theurbansocietywasnot composed only of people born in the urban area; it also contained many immigrants from rural areas, some of whom maintained the ethos characteristic of farming families. Therefore, if family situational factors worked favorably, stem families could potentially be formed. In such cases, even in urban families, atendencywassometimesseenthatspecificmembersheldpatriarchal rights over a long period of time, in line with an ethos of rural families. However, children in urban families generally did not receive property inheritance as was common in rural families. As a consequence, children in urban families were likely to leave their household earlier in life and take up employment as an unskilled worker or lifecycle servant. They got married if conditions for marriage were met. The age of their marriage tended to be lower than that seen among rural families, in which children awaited inheritance of patriarchal rights for a longer period of time. Young urban couples, in general, created and lived in a new home. As a result, it was discovered that among urban families in Dublin, the simple family households were a dominant family form, and this implies that the family norms in line with the principle of the nuclear family system constituted one of the most effective family strategies to achieve well-being in urban life. In addition to the population migration to cities, such as Dublin, many people emigrated from Ireland to England or the United States after the Great Famine in 1845. Therefore, although 35 years had passed since the Great Famine, Irish

224 Chapter 10
immigrant families were examined based on the 1881 census register of England and 1880 census register of the United States. Below are the characteristics of the Irish immigrant families obtained from the examination. First of all, Irishimmigrantswereconcentratedinspecificareasintheirhostcountries, and had a strong tendency to engage in the same kind of unskilled/semiskilled jobs as in the home country, as general workers/day labourers. Irish immigrant household heads were older than those in their host societies, a characteristic closely associated with their tendency to remain single or marry late. This tendency indicated that Irish immigrants retained views on marriage similar to those held by their countrymen back in Ireland. Viewed from the status of endogamy/exogamy, which indicated the extent of assimilation, Irish immigrants had a stronger inclination toward endogamy in the United States than in Britain. This tendency is interpreted as a clear indication of the extent of their acceptance in the host societies of those days. Although Irish immigrants tended to stay single and marry late, once married they had a relatively larger number of children and larger families than citizens in their host societies. With respect to household structures, unlike their countrymen in Ireland, Irish immigrants had a greater tendency to choose to build simple family households than did citizens of their host societies. Put another way, Irish immigrants chose a family strategy to assimilate themselves into the British absolute nuclear family system or American egalitarian nuclear family system by E. Todd’s family type. It is believed, however, that Irish immigrants found the assimilation process easier in Britain, where families were built on the assumption of inequality among brothers, than in the United States, where families were built on the basis of egalitarianism. This difference is attributable to the fact that Irish immigrants maintained the differentialist character embedded in the stem family principle that prevailed in their home country. Meanwhile, they found it less easy to adapt themselves to the universalist thinking of American society, which embraced the egalitarianism that emerged after the War of Independence. Nonetheless, the second and third generations of Irish immigrants are believed to have gradually become assimilated into the host society as they underwent geographic and socially upward movement. Thus, rural families in Ireland, urban families in Dublin, and Irish immigrant
225Conclusion
families in England and the United States were examined. The examination results showed that while the nuclear family was predominant among Irish rural families in the early nineteenth century, the stem family became predominant after the mid-twentieth century. While the structure of urban families that were formed in Dublin by people who migrated from farming villages in Ireland was basically the nuclear family based on the nuclear family system, it maintained the ethos and identity of rural families and had a potential for the formation of the stem family depending on family conditions. Irish immigrant families in England and the United States successfully assimilated into the respective society. In other words, they were required to abandon the stem family norm that features strong inter-generation ties and form the absolute nuclear family, but sometimes they can have possibilities to form the stem family in the country they immigrated into, if the situational factors of stem family meets in the country. Consequently, Irish ethos and identity were latent in the family structure of these immigrant families. However, we should look the ethos or identity of Irish immigrants is the Catholicinfluenceinthe United States with depending on following K. Kenny’s remarks. “Rebutting accusations of divided loyalty, Irish immigrants insisted that they could become good Americans but that they would do so on their own terms.BecausetheyspokeEnglishandwerethefirstCatholicgrouptoarriveinthe United States in large numbers, the Irish quickly took control of the American Catholic Church. As a popular saying put it, the church in the United States was “One,Holy,Catholic,andApostolic−andIrish.”Catholicismbecamethesinglemost important ingredient of Irish-American identity [K. Kenny, 2008] ”.

227
BibliographyUnpublished Document
Census Returns of County Cavan, County Fermanagh, County Galaway, County King’s and County Meath, 1821, National Archives of Ireland.
Census Returns of Ireland, County Mayo, 1901, National Archives of Ireland.
Census Returns of Ireland, County Mayo, 1911, National Archives of Ireland.
Census Returns 1901, County Clare & County Meath. National Archives of Ireland.
Census Returns 1911, County Clare & County Meath. National Archives of Ireland.
Minnesota Population Center. North Atlantic Population Project: Complete Count Microdata. Version 2.0 [Machine-readable database]. Minneapolis, MN: Minnesota Population Center, 2008.
Schurer, K., Woollard, M., 2003, National Sample from the 1881 Censuses of Great Britain. [data collection]. UK Data Service. SN: 4375, http://dx.doi.org/10.5255/UKDA-SN-4375-1
O’Reilly, Mat, 1956, Matchmaking, Williams Town, Oldcastle, Co. Meath, Irish Folklore Commission, ms.1460, University College of Dublin Folklore Department.
Shimizu’s Database of Irish Census of 1901 and 1911, 2011.
Shimizu’s Database of Irish Census of 1821. 2014.
Shimizu’s Linkage Data of Irish Census of 1901 and 1911, 2015.

228 Bibliography
Congested Districts Board for Ireland, Confidential Inspector’s Local Reports, 1892-1898 (Baseline Reports), National Library of Ireland.
Unpublished Dissertation
Almquist, Eric, Lucian, 1977, Mayo and Beyond: Land, Domestic Industry and Rural Transformation in the Irish West, unpublished Ph.D. Dissertation, Boston University.
Breen, Richard, 1980, Up the Airy Mountain and Down the Rushy Glen, Unpublished Ph.D. Dissertation, University of Cambridge.
Gabriel,ThomasMorleyGriffitt,1977,Keeping the Name on the Land: A Study of Land and Families in a County Mayo Parish, Unpublished Ph.D. Dissertation, University of Cambridge.
Shannon, Dunn, Little More Than a Winter Home: an Historical Archaeology of Irish Seasonal Migration at Slievemore, Achill Island, Unpublished Ph.D. Dissertation, Syracuse University, 2008.
Wilson, Thomas M., 1985, The Impact of the Common on Agriculture and Politics in Eastern Ireland, Unpublished Ph.D. Dissertation, The City University of New York.
British Parliamentary Sessional Papers
First Reports from His Majesty’s Commissioners for Inquiring into the Condition of the Poor Classes in Ireland: Poor Inquiry (Ireland) with Appendix (A) and Supplement, 1835, Vol. ⅩⅩⅩⅡ.
Appendix (D), containing Baronial Examination relative to Earning of Labourers, Cottier Tenants, Employment of Women and Children, Expenditure, 1836, Vol. ⅩⅩⅩ.

229Bibliography
Appendix (E), containing Baronial Examination relative to Food, Cottage and Cabins, Clothing and Furniture, Pawnbroking and Savings Banks, Drinking, 1836, Vol. ⅩⅩⅩⅡ.
Appendix (F), containing Baronial Examination relative to Con Acre, Quarter, or Score Ground, Small Tenantage, Consolidation of Farm and Dislodged Tenancy, Emigration, Landlord and Tenant, Nature and State of Agriculture, Taxation, Roads, Observation on the Nature and State of Agriculture; and Supplement, containing answers to questions 23 to 35, circulated by the Commissioners, 1836, Vol. ⅩⅩⅩⅢ.
The Census of Ireland for the year 1851, Part Ⅱ, Returns of Agricultural Produce in1851,1852,Dublin:HisMajesty’sStationeryOffice.
Department of Industry and Commerce, Agricultural Statistics 1847-1926, 1930, Dublin: Second annual report of the Register General of Marriages, Births and Deaths in Ireland: 1865, HC. 1869, Cd-4, Dublin: His Majesty’s Stationery Office.
First Annual Report of the Registrar-General of Marriages, Births and Deaths in Ireland,1864,Dublin:HerMajesty’sStationeryOffice1869.
Second detailed Annual Report of the Registrar-General for Ireland of the Marriages, Births and Deaths registered in Ireland in during the year 1865, 1870, HisMajesty’sStationeryOffice,HC1870,[C.4].
Eighth detailed Annual Report of the Registrar-General for Ireland of the Marriages, Births and Deaths registered in Ireland in during the year 1871, 1874, Dublin:Majesty’sStationeryOffice,HC1874,[C.968].
Emigration Statistics of Ireland 1880, London:HisMajesty’sStationeryOffice,1881, Cd-2828.
Eighteenth detailed Annual Report of the Registrar-General for Ireland of the

230 Bibliography
Marriages, Births and Deaths registered in Ireland in during the year 1881, 1882, Dublin:HisMajesty’sStationeryOffice,HC1882,[C.3368].
Eighteenth annual report of the Register General of Marriages, Births and Deaths in Ireland: 1881,HC,1882,Cd-3244,Dublin:HisMajesty’sStationeryOffice.
Emigration Statistics of Ireland, 1890, London:HisMajesty’sStationeryOffice,1890-1891, Cd-6295. Twenty-eighth detailed Annual Report of the Registrar-General for Ireland of the Marriages, Births and Deaths registered in Ireland in during the year 1891, 1892, HisMajesty’sStationeryOffice,HC1892,[C.6787].
Congested Districts Board for Ireland, First Annual Report of the Congested DistrictsBoardforIreland,1893,Dublin:Majesty’sStationeryOffice,[C-6908].
Emigration Statistics of Ireland, 1899, London:HisMajesty’sStationeryOffice1900, Cd-111.
Thirty-eighth detailed annual report of the Registrar General for Ireland containing A General Abstract of the Numbers of Marriages, Births, and Deaths, detailed annual report of the Register General (Ireland) of Marriages, Births and Deaths in Ireland during 1901, HC, 1902, Cd-1225, Dublin: His Majesty’s StationeryOffice.
Department of Agriculture and Technical Instruction for Ireland, 1902, Agricultural Statistics of Ireland, with Detailed Report for the Year 1901, Dublin: HisMajesty’sStationeryOffice,HC1902,[Cd.1170].
Department of Agriculture and Technical Instruction for Ireland, Agricultural Statistics of Ireland, Irish Agricultural Labourers, 1911, Dublin: His Majesty’s Stationery Office, Department of Agriculture and Technical Instruction for Ireland, 1911, Agricultural Statistics of Ireland, with Detailed Report for the Year 1911,Dublin:HisMajesty’sStationeryOffice,HC1912-1913,[Cd.6377].

231Bibliography
Forty-eighth detailed Annual Report of the Registrar-General for Ireland of the Marriages, Births and Deaths registered in Ireland in during the year 1911, 1912-1913,Dublin:Majesty’sStationeryOffice.HC1912-1913,[Cd.6313].
Ireland, Census of Ireland 1911: Province of Leinster, City of Dublin, HC,1912, Cd-60492-Ⅱ,Dublin:HisMajesty’sStationeryOffice.
Ireland, Census of Ireland 1911: Province of Leinster, County of Dublin, HC. 1912, Cd-6048-Ⅰ,Dublin:HisMajesty’sStationeryOffice.
Secondary Sources
Almquist, E. L., 1979, Pre-Famine Ireland and the Theory of European Proto-Industrialization: Evidence from the 1841 Census, Journal of Economic History, 39, 699-718.
Arensberg, C., 1937, (1959), The Irish Countryman, Gloucester: Peter Smith.
Arensberg, C. and S. Kimball, 2001 (1940), Family and Community in Ireland, 3rd ed. Ireland: CLASP.
Barber, Sarah, 1982, Irish Migrant Agricultural Labourers in Nineteenth Century Lincolnshire, Saothar, Journal of Irish Labour History Society, Vol.8, 10-23.
Bielenberg, A. and Ciara Breathnach, 2000, Family Income and Expenditure in the West of Ireland: the Evidence from the Baseline Reports of the Congested District Board, Meeting of Historical National Accounts Group for Ireland at the ESRI.
Birdwell-Pheasant, Donna, 1992, The Early Twentieth Irish Stem Family, in M. Silverman & P. H. Gulliver (eds.) Approaching the Past: Historical Anthropology through Irish Case Studies, New York: Columbia University Press, 56-78.
Birdwell-Pheasant, D., 1993, Irish Households in the early 20th Century: Culture,

232 Bibliography
Class and Historical Contingency, Journal of Family History 18, 1: 19-38.
Birdwell-Pheasant, D., 1999, The home place: centre and periphery Irish house and family systems.’ in D. Birdwell-Pheasant and D. Lawrence Zuniga, (eds.), House Life: Space, Place and Family in Europe, London: Bloomsbury Academic, 105-129.
Breathnach, Ciara, 2004, The Role of Women in the Economy of West of Ireland, 1891-1923, New Hibernia Review, 8-1, 80-92.
Breathnach, Ciara, 2005, The Congested Districts Board of Ireland, 1891-1923, Poverty and Development in the West of Ireland, Dublin: Four Courts Press.
Breen, R., 1983, Farm Servanthood in Ireland, 1900-40, The Economic History Review 36-1, 87-102.
Brody, H., 1974, Iniskilane: Change and Decline in the West Ireland, London: Harmondsworth.
Byrne, Ann, Ricca Edmondson and Tony Varley, Introduction to the Third Edition, 2001, in C. M. Arensberg and S. T. Kimball, Family and Community in Ireland, Ireland: CLASP, I-CI.
Budd, J. W. and Timothy Guinnane, 1991, Intentional Age-Misreporting and the 1908 Old Age Pensions Act in Ireland , Population Studies, 45, 497-518.
Bourke, Joanna, 1987, Women and Poultry in Ireland, 1891-1914, Irish Historical Studies, 25, 293-310.
Carney, F. J. 1977, Aspects of Pre-famine Irish Household Size: Composition and Differentials, in L. M. Cullen & T. C. Smout (eds.), Comparative Aspects of Scottish and Irish Economy and Social History 1600-1900, Edinburgh: John Donald Publishers, 32-46.

233Bibliography
Carney, F. J. 1977, Household Size and Structure in two areas of Ireland, 1821 and 1911, in L. M. Cullen & F. Furet (eds.), Ireland and France 17th-20th Centuries, Toward a Comparative Study of Rural History, Paris: Edition De L’Eclole Des Hautes Etude En Sciences Sociale, 149-165.
Clarkson, L. A., 1977, Household and Family Structure in Armagh City, 1770, Local Population Studies, 18, 14-31.
Clarkson, L. A., 1981, Marriage and Fertility in Nineteenth Century Ireland, in R. B. Outwaite (ed.), Marriage and Society, New York: Pargrave Macmillan.
Clarkson, L. A., 1989, The Environment and Dynamic of Pre-factory Industry in Northern Ireland, in Pat, Hudson (ed.), Regions and Industries, Cambridge: Cambridge University Press, 252-270.
Cohen, M., 1990, Peasant Differantation and Pro-Industrialization in Ulster Countryside: Tullylish 169-1825, Journal of Peasant Studies, 17, 413-32.
Commission on Emigration and other Population Problems 1948-1954, 1954, Dublin:TheStationeryOffice.
Collins, Brenda, 1993, The Irish in Britain, 1780-1921, in B. J. Graham & L. J. Proudfoot, (eds.), An Historical Geography of Ireland, London: Academic Press, 366-398.
Connell, K. H., 1950, The Population of Ireland, 1750-1845, Oxford: The Clarendon Press.
Connell, Peter, 2004, The Land and People of County Meath, 1750-1850, Dublin: Four Courts Press.
Connolly, S. J., 1985, Marriage in Pre-Famine Ireland, in Cosgrave, A. (ed.), Marriage in Ireland, Dublin: College Press, 78-98.
234 Bibliography
Connor, D., G. Mills & N. Morre-Cherry, 2011, The 1911 Census Dublin city: A Spatial Analysis, Irish Geography, 44-2/3, 245-263.
Corrigan, C., 1993, Household Structure in Early Twentieth Century Ireland, Irish Journal of Sociology, 3, 56-78.
Cousens, S. H. 1961, Emigration and Demographic Change in Ireland, 1851-1861, The Economic History Review, 14.2, 275-288.
Cousins, Mel, 2011, Poor Relief in Ireland, 1851-1914, Oxford: Peter Lang.
Cullen, L. M., 1972, An Economic History of Ireland since 1660, London: B. T. Batsford.
Cullen, Louis, 1992, The Growth of Dublin 1600-1900: Character and Heritage, in F. H. A. Aalen & K. Whelan (eds.), Dublin, City and Country: From Prehistory to Present, Dublin: Geography Publications.
Daly, Mary, 1984, Dublin, The Deposed Capital, a Social and Economic History 1860-1914, Cork: Cork University Press.
Drake, M., 1963, Marriage and Population Growth in Ireland, 1750-1845, The Economic History Review, 14, 301-313.
Duran ton, G., A. Rodriguez-Pose and R. Sandall, 2007, Family Types and Persistence of Regional Disparties in Europe, Bruges European Economic Research Papers, No10, College of Europe, http://www.coleurop.be/eco/publications.htm
Fauve-Chamoux, A. and Arrizabalaga, M., 2005, Family Transmission in Eurasian Context, The History of the Family, 10-3, 183-193.
Fitzpatrick, David, 1982, Family and Rural Unrest, in P. J. Drudy (ed.), Ireland: Land, Politics and People, Cambridge: Cambridge University Press, 37-75.

235Bibliography
Fitzpatrick, David, 1983, Irish Farming Families before the First World War, Comparative Studies in Society & History, 25, 339-395.
Fitzpatrick, David, 1985, Marriage in Post-famine Ireland, in Byart Cosgrave (ed.), Marriage in Ireland, Dublin: College Press, 116-131.
Freeman, T. C., 1943, The Congested Districts of Western Ireland, The Geographical Review, 13-1, 1-14.
Gibbon, Peter, Arensberg and Kimball Revisited, 1973, Economy and Society, 2, 479-498.
Gibbon, P. & C. Curtin, 1978, The Stem Family in Ireland, Comparative Studies in Society & History, 20-3, 429-453.
Gilligan, Jim, 1998, Graziers and Grasslands, Dublin: Irish Academic Press.
Gilligan, Patricia, 2013, Drumlomman Parish Cavan Ireland, Census 1821, 1955-2007, www.familyhistory.ie/docs/archives/Drumlomman.
Gray, J., 2005, Spinning the Threads of Uneven Development, Oxford: Lexington Books.
Gray, J., 2006, Gender Composition and Household Labour Strategies in Pre-famine Ireland, The History of the Family, 11-1, 1-18.
Gray, J., 2012, Household Formation, Inheritance and Class-Formation in Nineteenth Century Ireland: Evidence from County Fermanagh, in Anne-Lise Head-Konig (Ed.), Inheritance Practices, Marriage Strategies and Household Formation in European Rural Societies, Turnhout: Brepolis Publisher, 153-180.
Guinnane, Timothy W., 1993, The Poor Law and Pensions in Ireland, Journal of Interdisciplinary History, 24-2, 271-291.

236 Bibliography
Guinnane, Timothy W., 1996, The Family, State Support and Generational Relations in Rural Ireland at the Turn of the Twentieth Century, in Tamara Hareven (ed.), Aging and Generational Relations Over the Life Course, New York: Walter de Gruter, 100-119.
Guinnane, Timothy, 1997, The Vanishing Irish, Princeton: Princeton University Press.
Guinnane, Timothy, 1999, Did Irish Marriage Patterns Survive the Emigrants Voyage?, Irish-American Nuptiality, 1880-1920, Irish Economic and Social History, 26, 15-34.
Guinnane, T. W., C. M. Moehling & Ó Gráda, C. 2004, The Fertility of the Irish in America in 1910, Department of Economics, University College Dublin, Working Paper 04/02.
Hajnal, John, 1982, Two Kinds of Preindustrial Household Formation System, Population and Development Review, 8-3, 449-494.
Hammel, E. A. and Peter Laslett, 1974, Comparing Household Structure over Time and between Cultures, Comparative Studies in Society and History, 16-1, 73-109. Hammel, E. A., 1980, Household Structure in Fourteenth –Century Macedonia, Journal of Family History, 5-3, 242-273.
Hannan, D. F., 1979, Displacement and Development: Class, Kinship and Social Change in Irish Rural Communities, Dublin: The Economic and Social Research Institute.
Hannan, D. F., 1982, Peasant Models and Rural Ireland, in P. J. Drudy (ed.), Ireland: Land, Politics and People, Cambridge: Cambridge University Press, 141-165.
237Bibliography
Harkness, D. A. E., 1931, Irish Emigration, in W. F. Willcox (ed.), International Migration, VolⅡ: Interpretations, http://www.nber.org/chapter/c5112, 261-282
Humphreys A., 1966, New Dubliners, Urbanizatn and the Irish Family, Routledge.
Hynes, Eugene, 1988, Family and Religious Change in a Peripheral Capitalist Society: Mid-Nineteenth Century Ireland, in D. L. Thomas (ed.), The Religion and Family Connection: Social Science Perspectives, Utah: Religious Studies Center, Brigham Young University, 161-174.
Jones, David, 1995, Graziers, Land Reform, and Political Conflict in Ireland, Washington D. C.: The Catholic University of America Press.
Kennedy, Liam, 1991, Farm Succession in Modern Ireland: Elements of a Theory of Inheritance, Economic History Review, XLIV, 477-499.
Kennedy, L. and L. A. Clarkson, 1993, Irish Population History, 1700-1921, in B. J. Graham & L. J. Proudfoot (eds.), An Historical Geography of Ireland, San Diego: Academic Press, 158-184.
Kenny, K. Irish Immigrants in the United States, 2008,http://iipdigital.usembassy.gov/st/english/publication/2008/03/20080307131416ebyessedo0.6800043.html#axzz47XnFWV48
Kent, J. P, 2002, On the Decline of Marriage in Rural Ireland, 1851-1911: The Role of Ecological Constraints and/or Developing Philopatry, Population and Environment, 23-6, 525-540.
Laslett, P., 1965, The World We Have Lost, London: Routledge.
Laslett, P., 1972, (ed.) Household and Family in Past, Cambridge: Cambridge University Press.
238 Bibliography
Le Play’s, F. 1855. Les Ouvriers Europe´ens: E´tudes sur les Travaux, la Vie Domestique, et la Condition Morale des Populations Ouvi`eres de l’Europe. Paris, Fr.: Impr. Imp.
Le Play’s, F. 1871. L’organisation de la Famille Selon le Vrai Mod`ele Signal´e par L’histoire de Toutes les Races et de Tous les Temps. Tours, Fr.: Mame.
Le Play F. 1872. The Organization of Labour: In Accordance with Custom and the Law of the Decalogue. Transl. Gouverneur Emerson, MD. Philadelphia: Claxton, Remsen&Haffelfinger.
Lee, Joseph. 1968, Marriage and Population in Pre-Famine Ireland, The Economic History Review, 21-2, 283-295.
Lee Joseph, 1973, The Modernisation of Irish Society 1848-1918, Dublin: Gill and Macmillan.
Mason, W. S, 1819, Statistical Account or Parochial Survey of Ireland, Dublin: Faulkner Press.
Matsuo Taro, 1987, Ireland and Japan, Tokyo: Ronsosha.
Matsuo Taro, 1995, Landholding and Local Community in an Advanced Area of Ireland−TheParishes of Bective & Rataine, Co Meath 1821-1901, The Housei University Economic Review (The article by Matsuo is in Japanese), 62-3/4, 35-114.
Matsuo Taro, 1998, Transformation of Irish Rural Community, Tokyo: Ronsosha.
Meagher, Timothy, 2001, Inventing Irish America, Notre Dame: University of Notre Dame Press.
McKenna, Edward, 1978, Age, Region, and Marriage in Post-Famine Ireland: An Empirical Examination, The Economic History Review, 31-2, 238-256.

239Bibliography
McKernan, Anne, 1995, War, gender and Industrial Innovation: Recruiting Women Weavers in Early Nineteenth Century Ireland, Journal of Social History, 28, 109-24.McManus, R., 2002, Dublin 1910-1940, Dublin: Four Courts.
Mitchell, Brian, A New Genealogical Atlas of Ireland, Maryland: Genealogical Publishing Co. Inc.
Mitterauer Michael & Reinhard Sider, 1982, The European family, Oxford: Basil Blackwell.Michael Mitterauer, 1990, Historich-anthropologiche familienforschung, Wien: Koln:Bohlau verlag.
Morgan, V. & W. Macafee, 1984, Irish Population in the Pre-Famine Period: Evidence from County Antrim, The Economic History Review, 37, 182-96.
Morgan, V. & W. Macafee, 1987, Household and Family Size and Structure in County Antrim in the mid Nineteenth Century, Continuity and Change, 2-3, 455-476.
Nugent Walter, 1992, Crossing, The Great Transatlantic Migrations, 1870-1914, Indianapolis: Indiana University Press.
O’Brien, Joseph, 1982, Dear, Dirty Dublin: A City in Distress, 1899-1916, Berkeley & Los Angeles, California: University of California Press.
Ó Gráda, Cormac, 1973, Migration and Post-Famine Adjustment in the West of Ireland, Studia Hibernia, No.13, 48-76.
Ó Gráda, Cormac, 1994, Ireland, A New Economic History 1780-1939, Oxford: Clarendon Press.
Ó Gráda, Cormac, 2000, The Political Economy of the Old Age Pension: Ireland c. 1908-1940, UCD Center for Economic Researching Working Paper Series;

240 Bibliography
WP00/22, University College Dublin School of Economics.
Ó Gráda, Cormac, 2002, Infant and Child Mortality in Dublin a Century Ago, Center For Economic Research, Working Paper Series, Department of Economics, University College Dublin.
O’Maitiu, S., 2003, Dublin’s Suburban Towns 1834-1930, Dublin: Four Court Press.
O’Neill, Kevin, 1984, Family and Farm in Pre-famine Ireland, Wisconsin: The University of Wisconsin Press.
Rhodes, Rita, 1992, Women and the Family in Post-Famine Ireland, New York & London: Garland Publishing Inc.
Prunty, J., 1988, Dublin Slums 1800-1925, Dublin: Irish Academic Press.
Ruggles, S., 1994, The Transformation of American Family Structure, American Historical Review, 59, 103-128.
Ruggles, S., 2012, The Future of Historical Family Demography, in The Annual Review of Sociology, 38, 423-441, Polo Alto: Annual Reviews Inc.
Saito Osamu, 1998, Two Kind of Stem-Family System, Continuity and Change 13, 167-86. Schurer, K. & M. Woollard, 2002, National Sample from the 1881 Census of Great Britain 5% Random Sample, Working Documentation Version 1.1, University of Essex, Historical Censuses and Social Surveys Research Group, 2002.
Shimizu Yoshifumi, 2003, A Study of the Change of Irish Family System from the Early Nineteenth Century to Twentieth Century, St. Andrew’s University Sociological Review, 37-2, 53-90. (The article by Shimizu is in Japanese).

241Bibliography
Shimizu Yoshifumi, 2011, Household Structure of Co. Clare in Ireland at the Early 20th Century, St. Andrew’s University Sociological Review, 2011, 44-2, 5-37, (The articles by Shimizu are in Japanese).
Shimizu Yoshifumi, 2012, Household Structure of Co. Meath in Ireland, St. Andrew’s University Sociological Review, 45-2, 1-38. (The article by Shimizu is in Japanese).
Shimizu Yoshifumi, 2013, Transition of the Irish Household Structure: Comparing Results from the 1901 and 1911 Census Results, with Reference to Two Cases of Glencolumbkill and Clogheen, St. Andrew’s University Sociological Review, 47-1, 1-34.
Shimizu Yoshifumi, 2014a, Changes in Families in Ireland from the 19th Century to the Early 20th Century, St. Andrew’s University Sociological Review, 47-2, 1-24.
Shimizu Yoshifumi, 2014b, The Irish Household Structure in County Mayo in the Early Twentieth century, St. Andrew’s University Bulletin of the Research Institute, 39-2, 1-32, (The article by Shimizu is in Japanese).
Shimizu Yoshifumi, 2015, Regional Variation in Household Structure in Early Twentieth Century Ireland, St. Andrew’s University Bulletin of the Research Institute, 41-1, 19-54.
Steidl, Annemarie & E. Stockhammer, 2007, Coming and Leaving Internal Mobility in Late Imperial Austria, Department of Economics Working Paper No. 107, University of Vienna.
Steidl, Annemarie, 2009, Introduction, in Josej Ehmer (ed.), European Mobility, Vandenhoeck & Ruprecht & Co.
Todd, Emmanuel, 1985, The Explanation of Ideology, Oxford: Basil Blackwell.
242 Bibliography
Todd, Emmanuel, 1985, The Causes of Progress, Oxford: Basil Blackwell.
Todd, Emmanuel, 1992, L’Invention De L’Europe, (the Japanese edition by Ishizaki Harumi), Tokyo: Fujiwara Shoten.
Todd, Emmanuel, 1994, Le Destin Des Immigres, Editions de Seuil, (translated by Harumi Ishizaki, Imin no Unmei,Japanesetranslationfirstpublishededition,1999, Fujiwara Shoten).
Turner, Michael, 1993, Rural Economies in Post-Famine Ireland, c.1850-1914, in B. J. Graham & L. J. Proudfoot (eds.), An Historical Geography of Ireland, San Diego: Academic Press, 293-337.
Turner, Michael, 1996, After the Famine, Irish Agriculture 1850-1914, Cambridge: Cambridge University Press.
UCD GPEP Dublin, 1911, Census Project, Second City Dublin 1911, 2010-2011.
Vaughan, W. E and A. J. Fitzpatrick, 1978, Irish Historical Population 1821-1971, Dublin: Royal Irish Academy.
Wall, Richard, 1983, Household: Demographic and Economic Change in England, 1650-1970, in Richard Wall (ed.) Family Forms in Historical Europe, Cambridge: Cambridge University Press. 493-512.
Wakefield, E., 1812, An Account of Ireland, Statistical and Political, London: Longman.
Whelan, K., 2012, Clachans: Land Scape and Life in Ireland before and after the Famine, in P. A. Duffy and W. Nolan (eds.), At the Anvil: Essays in Honour of William J. Smyth, Dublin: Geography Publications, 453-475.
Wilson, Thomas M., 1984, From Clare to the Common Market: Perspectives in Irish Ethnography, Anthropological Quarterly, 57-1, 1-15.

243Bibliography
Wilson, Thomas M., 1990, From Patronage to Brokerage in the Local Politics of Eastern Ireland, The American Society for Ethnohistory, 37-2, 158-187.
Wilson, Thomas M., 1998, Thomas M. Wilson, Culture and Class among the “large” Farmers of Eastern Ireland, American Ethnologist, 14-4, 678-693.
Wilson, Thomas and Hastings Donnan, 2006, The Anthropology of Ireland, Oxford: Berg.
Yonemura Shoji, 1981, The Irish Marriage of Peasant Family (The article by Yonemura is in Japanese), Family History Research, Tokyo: Outski Shoten, 116-155.
Young, A. 1892, Arthur Young’s Tour in Ireland (1776-1779), Vol.1, Vol.2, London, George Bell & Sons.


245
Index
A
Aalen, F. H. A., K. Whelan & M. Stout 123
absolute nuclear family 22, 194, 224, 225
Achill island 108
Achill men 121
adaptation to the norms of urban family 171
adaptive family strategy 28, 73
adaptive strategy 28, 73
affinity195
age at marriage 1, 77, 153, 190
age cohort xviii, 47, 48, 49, 53, 54, 55, 57, 59,
60, 61, 63, 64, 65, 126, 127, 154, 167, 178,
206
ageforthefirstmarriage79
age of household heads 41, 47, 53, 57, 73, 83,
126, 151, 153, 178
Aghalurcher 36, 37
aging of household heads 126, 127, 141, 220
agricultural labour 27, 28, 39, 49, 50, 73, 94,
121, 128, 145, 146, 156, 219, 230, 231
agricultural servants 28, 73
agricultural statistics 33, 121, 230
Almquist, E. L. 5, 110, 111, 121, 122, 123, 125,
139, 228, 231
American citizens 205, 206, 207, 208, 210,
211, 212, 213
amount of eviction 109
analytical framework of Irish immigrant 191
appointment of heirs 145
arable land conditions 114
Arensberg and Kimball xi, xii, xv, xvii, xviii,
1, 3, 4, 21, 22, 23, 24, 25, 26, 28, 71, 72, 143,
145, 167, 220, 235
Arensberg, Conrad xi, xii, xv, xvii, xviii, 1,
3, 4, 8, 21, 22, 23, 24, 25, 26, 28, 36, 71, 72,
133, 143, 145, 167, 220, 231, 232, 235
artisans 67
assimilation 191, 193, 194, 196, 207, 215, 224
assimilation and segregation 191, 193
assimilation theory 191
assimilation to the host societies 194
attractions of city life 12
authoritarian family 22
average age of household heads 47, 83, 126,
151, 178
B
bachelorhood 94, 125
balance of sex ratio 205
Balfour, A. J. 105
Ballina 106, 117, 119, 130
Ballinrobe 106, 117, 118, 119
Ballycroy 138, 139, 140
barley 46
barony of Loughtee 45
base-line reports 111
beef cattle 147
Belfast xii, xiii, 27, 28, 38, 73, 84, 88, 93, 94,
110, 145, 169, 173, 175, 199, 219
Belmullet 117, 119, 130
Berkner, L. M. 14
big farmers 112
Birdwell-Pheasant, D. 231, 232
birth rate 46, 73, 77, 78, 79, 80, 93, 125, 126,
173, 174, 177, 181
birthplace data 176
246 Index
bottom-upverification195
breakdown of relatives 215
Breen, R. 23, 27, 164, 228, 232
bride 21, 23, 222
bride price 21
bridegroom’s family 23
British citizens 200, 206, 208, 210, 211, 212,
213
Brody, H. 23, 232
bronchitis 175
Builder 179
Byrne, Anne xii, 22, 232, 239
C
calculating strategy 67
Cambridge Population Group 1
capital and commercial functions 28, 73
cardiac diseases 175
Carman, Carrier, Carter, Haulier 179
Carney, F. J. xvi, 5, 26, 34, 35, 53, 232, 233
Carney’s hypothesis 53
carpenter 67, 179
cash income 111, 122, 123, 124
Castlebar 106, 117, 119, 123
cattle 46, 75, 76, 108, 114, 115, 119, 120, 121,
139, 147, 148, 149
cattle of over 2 years of age 75
celibacy 5, 27, 145, 155
census microdata 30, 150
census returns xi, xvi, xviii, 26, 30, 33, 34, 35,
36, 37, 41, 42, 43, 67, 72, 73, 93, 109, 167,
169, 170, 173, 217, 218, 227
census samples from 1821 and 1911 26
cereal cultivation to livestock farming 45
changing rural class structure 77
Charwoman 179
childless couple 15
children in law 135, 164
circulation of servants 171
city family structure of Dublin 169
city of Dublin xix, 169, 170, 171, 172, 173, 174,
175, 176, 177, 178, 179, 181, 182, 183, 184,
185, 186, 187, 188, 189, 190, 231
clachan 25, 242
Claremorris 117, 119, 123, 130
Clarkson, L. A. 27, 30, 46, 78, 144, 145, 233,
237
clerk 49, 179
co-residence with kin 133
co-residence with non-kin 133, 188
co-residence with siblings 133, 161, 186
co-resident elderly people 136
Coal heaver 179
Cohen, M. 5, 233
collateral relatives 16, 17, 57, 63, 92, 187
Collins, Brenda 27, 197, 233
commercial agricultural society 28, 73, 220
Commercial Clerk 179
commercial grazing 6, 8, 107
commercial livestock farming 75
commercial stockbreeding 147
commercialization of agriculture 7
commercialized farming 3
common land 25
commonage 7, 123, 139, 140, 220
community of congested houses 25
comparative family research 16
complex family households 5, 221
complex households 5, 8
compound family households 35, 36, 40, 41,
55, 56, 57, 58, 59, 60, 61, 62, 63, 67, 68, 112,
141, 219, 220
conacre system 46, 47
247Index
Congested District Board for Ireland 105, 138,
139, 140
Congests Districts Act 105
conjugal family system 18
conjugal family units 13
conjugal households 15
Connacht 3, 4, 25, 74, 75, 76, 77, 78, 79, 80, 81,
82, 83, 88, 93, 94, 121, 124, 198, 199, 219,
220
Connacht men 121
Connell K. H. 4, 33, 36, 143, 233
Connell, Peter 233
Connemara 47
Connolly, S. J. 67, 233
consolidating farmlands 46
construction of roads 47
consumer services 177
context of delayed inheritance 6
control of the household head 162
conventional family strategies 110
conventional seasonal working 110
coopers 67
core age cohort 127, 206
core industry 40
core poor law unions 106
core regions 108
Cork xii, xiii, 27, 38, 41, 75, 80, 85, 141, 145,
234
cottages 46
cottiers 45, 46
couple with children households 15
Cousens, S. H. 105, 109, 234
Cousins Mel xvi, 109, 170, 234
craftsmen 209
crisis of near-famine conditions in 1879 76
Crooserlough 39
crop acreage 114
crop farming 108, 114, 115, 119, 121, 148, 168,
221
crop rotation 46
cross-tabulation of the occupations of the
household heads 57
Crowley, M. 175, 179
Cullen Louis xi, xiii, xix, 38, 170, 222, 232,
233, 234
cultivation of potatoes 75
Curtin, C. xii, 3, 26, 235
D
Daly, M. 170, 234
database 33, 43, 195, 227
dealers 209
death rate 73, 77, 78, 80, 93, 125, 126, 173, 174
demographic variables 73
departure of children 93
Derryvallan 36, 37
designated sons 27
diarrhea and enteritis 175
differentialism 191, 192, 193, 194
differentialist attitude 193
distribution of children by age 54, 55, 183
diversity of County Meath’s household
structures 162
division of land to heirs 46
domestic groups 25
domestic indoor servants 128
domestic industry 7, 38, 39, 110, 124, 228
domestic industry of linen 110
domestic linen industry 7, 27, 39, 46, 218
domestic linen manufacturing 46
domestic servants 209
dominant family type 217
Donegal 38, 75, 83, 87, 121, 164
248 Index
Donegal men 121
Donnan, H. 23, 243
downward extension 133, 134, 141, 186, 187,
220
downward extension of multiple family
households 141, 220
downward multiple family households 57
dowry xvi, 21, 23, 25, 29, 30, 145, 161, 169,
193, 222
Dowry and matchmaking systems 145
dowry system 23, 25, 161, 193
Drake, M. 33, 234
Dressmaker 179
Dundalk Bay 74, 75
Durham xii, 202
dynamic analysis of household forms 90
dynamic system of inheritance 36
E
early marriage 4, 5, 29, 36, 41, 46, 49, 67, 68,
144, 154, 218
East North Central region 202
eastern and southern regions 198
eastern Ireland xvii, 28, 31, 72, 73, 74, 75, 76,
79, 83, 85, 86, 88, 90, 91, 92, 93, 94, 95, 105,
108, 117, 143, 145, 147, 149, 162, 168, 198,
219, 220, 221, 223, 228, 243
eastern Ireland of both landless labourers and
large farmers xvii, 145
eastern Ulster 39, 46
Edmondson, Ricca 22, 232
Edo-period population registers 18
effective strategies for the well-being 93
EFH to MFH 90
EFH to NF 90
EFH to SFH 90
egalitarian inheritance rules 192
egalitarian nuclear family 22, 194, 224
egalitarianism 193, 224
elderly with co-resident children 15
eldest male 222
eldest son 21, 222
eldest son inheritance system 222
emigration xvii, 1, 4, 29, 30, 77, 78, 80, 82,
124, 146, 170, 177, 196, 199, 204, 208, 210,
229, 230, 233, 234, 237
employ labour 28, 72
employing agricultural workers 75
enclosure by landlords 26
enforcement of Catholic doctrine 79
Ennis 156
Ennistymon 156
equal division of property 12
equality of all human beings 192
Erris 107, 139
ethnic minorities 191
ethnographic approach 1
ethos characteristic of rural families 190
European household systems 1
European marriage pattern 6
eviction of tenant farmers 26
exogamous community family 22
extended family households 3, 13, 20, 26, 35,
39, 40, 55, 56, 57, 58, 60, 66, 88, 89, 90, 91,
94, 125, 132, 133, 134, 140, 141, 143, 159,
161, 162, 163, 164, 168, 184, 186, 187, 193,
213, 215, 221
F
familial economy 28, 72
Family and Community xv, 1, 3, 22, 25, 71,
231, 232

249Index
family budget 112, 138, 139, 141
family circumstances 29, 30, 162
family cycle 21, 29
family estate 21
family farming 112
family life cycle 21, 34, 35, 53, 57
family name on the land 136, 145, 166
family norm xvii, 15, 21, 27, 28, 30, 37, 40, 68,
72, 73, 90, 91, 95, 111, 112, 140, 143, 145,
146, 162, 168, 171, 190, 217, 218, 220, 221,
222, 223, 225
family of a bridegroom 222
family situational xvii, 21, 27, 68, 73, 94, 95,
110, 112, 140, 143, 145, 146, 168, 171, 186,
190, 221, 223
family size 16, 34, 35, 53, 195, 239
family strategy 28, 37, 39, 46, 49, 67, 68, 72,
73, 112, 124, 141, 146, 161, 168, 170, 171,
183, 194, 215, 218, 221, 224
family type as an “ideal type” 18
farm management 21, 39, 73
farmers xvi, xvii, 3, 4, 5, 7, 25, 26, 28, 30, 37,
38, 39, 43, 44, 45, 46, 47, 48, 49, 50, 51, 53,
54, 55, 57, 67, 68, 72, 73, 74, 75, 83, 86, 88,
94, 105, 106, 109, 112, 113, 115, 117, 119,
123, 127, 128, 133, 139, 140, 141, 143, 145,
154, 155, 156, 162, 163, 164, 167, 168, 191,
198, 199, 208, 209, 218, 220, 221, 222, 243
farming from grain to livestock 44, 67
farming scale 73, 92
fattened animals 76
fattening of calves 76
Fauve-Chamoux, A. and Arrizabalaga, M. 234
female emigrants 199, 200, 205
female exogamy 193
fences and ditches 47
Fermanagh 5, 30, 34, 35, 36, 38, 39, 41, 42, 43,
44, 46, 47, 48, 49, 50, 51, 53, 54, 55, 56, 57,
59, 63, 67, 68, 85, 218, 227, 235
filialpiety172
Filmer’s patriarchal theory 16
financialcompensation27,28,71,73
fishing40,68
Fitzpatrick, David 3, 26, 27, 29, 234, 235
flax46
flaxandsoldflaxyarns46
food exports 45
formation of co-resident sibling households
155
formation of large farmers 44
formation of the stem family 27, 71, 73, 93, 94,
95, 136, 140, 218, 220, 225
forming stem families 21, 29
fowl cholera 105
fragmentary households 15
functionalist theory 23
furniture manufacturing 177
G
Gabriel, T. M. G. 26, 27, 111, 228
Galway Bay 74, 75
gender 2, 6, 36, 43, 54, 74, 126, 127, 171, 205,
235, 239
general labourers 30, 128, 156
general shop keepers 128
general workers 199, 200, 209, 224
geographical hub 192
Geographical Information System 8, 73
ghetto-type communities 194
Gibbon and Curtin 3, 235
Gibbon, Peter 3, 22, 23, 26, 235
Gilligan, Jim 235

250 Index
GIS xii, 71, 73, 93
Gokayama village 17
grain farming 39, 45, 76
grass, meadow, and clover 114
Gray Jane xiii, 5, 6, 9, 34, 36, 37, 217, 235
grazing conditions 106
Great Famine xvi, 2, 4, 26, 27, 30, 33, 36, 37,
76, 78, 83, 105, 109, 110, 114, 124, 126, 145,
150, 170, 177, 191, 196, 201, 217, 218, 222,
223
guarantee of the success of matchmaking 23
Guinnane, T. 3, 4, 6, 26, 112, 141, 207, 232,
235, 236
Guinness 179
H
haggard 24
Hajnal theory 189
Hammel and Laslett 2, 7
Hammel=Laslettclassification11,19,35,55
hand spinning and weaving of linen 110
Hannan, Damien 3, 4, 28, 72, 236
Harvard group 22
Harvard Irish Survey 22
hay 75, 119, 121, 139
Hayami group 17, 19
headship and landownership xvii, 145
heir xv, xvii, 1, 4, 12, 25, 27, 28, 29, 30, 40, 45,
46, 49, 67, 72, 73, 79, 83, 93, 110, 111, 131,
134, 136, 140, 141, 145, 146, 161, 162, 164,
166, 168, 219, 221, 222
heir delaying marriage 161
high birthrate 14, 29, 195, 219
high fertility 170, 174, 176, 177, 190
high frequency of co-resident siblings 161
high marriage rate 29, 144, 170, 174, 186, 190
high mortality 170, 174, 175, 176, 177, 190
high occurrence of unmarried persons 161
historical demography 19
history of the family 1, 17, 19
homogeneous society xv, 22
Hooton, E. 22
host societies 9, 194, 195, 200, 215, 224
hotel keepers and publicans 156
house renovation costs 23
houseful size 34
household and family systems 2
householdclassification2,5,8,11,12,13,14,
16, 18, 19, 20, 159, 187
household formation xviii, 4, 5, 6, 11, 16, 36,
73, 93, 133, 136, 146, 151, 168, 171, 219, 221,
235, 236
household head xvii, 14, 35, 41, 47, 48, 49, 53,
57, 60, 63, 64, 65, 73, 83, 93, 122, 126, 127,
128, 134, 136, 140, 141, 145, 146, 151, 152,
153, 154, 155, 156, 161, 162, 164, 165, 167,
168, 178, 179, 186, 188, 189, 205, 206, 207,
208, 220, 221, 224
household patterns xvii, 171
household size 16, 26, 34, 35, 51, 53, 73, 85,
129, 130, 156, 158, 181, 182, 188, 210, 211,
215, 219, 232, 233
householder’s lineal relatives 16
households in western Ireland 85, 86, 93, 161,
219
households of landless labourers 146
Humphreys, A. J. 169, 172, 179, 237
I
Ie 16, 18, 19, 222, 223
Ie system 16
immigrants to host countries 193

251Index
impartible inheritance system xvi, 26, 27, 82,
110, 145, 217, 218, 222
Inagh xv, 22
income 5, 6, 21, 23, 37, 39, 67, 110, 111, 112,
121, 122, 123, 124, 125, 139, 140, 141, 194,
231
independent household 171
industrious revolution 6
inequalities of class and gender 2
inequality of inheritance 192
infant mortality rate 80
inheritance xvi, xvii, 1, 4, 6, 12, 23, 25, 26, 27,
28, 29, 30, 33, 36, 37, 39, 40, 45, 46, 49, 67,
68, 72, 79, 82, 93, 109, 110, 124, 125, 136,
140, 144, 145, 146, 159, 161, 162, 168, 169,
184, 190, 192, 193, 199, 217, 218, 219, 220,
221, 222, 223, 235, 237
inheritance of farmland 79
inheritance system xvi, 23, 25, 26, 27, 36, 39,
45, 46, 49, 67, 68, 72, 82, 110, 125, 140, 144,
145, 169, 217, 218, 220, 222
insanitary housing conditions 175
inter-marriage 193
internal migration 146, 168, 191, 221
Irish Catholic 208
Irish family structure 11, 33, 140
Irish Folklore Commission 162, 227
Irish identity 194
Irish immigrant households 195, 205, 206, 210,
211, 213, 214, 215
Irish immigrants xii, xix, 9, 191, 192, 193, 194,
195, 196, 197, 200, 201, 202, 204, 205, 206,
207, 208, 209, 210, 211, 212, 213, 214, 215,
224, 225, 237
Irish National Land League 105
Irish rural family 3, 71
Irish seaports 82
J
Japanese lineal family system 18
joint family 11, 18
joint family system 18
Jones, David Seth 148, 237
Jordan, D. E. 114, 117
K
Kells 39, 44, 156
Kennedy, L. and L. A. Clarkson 78, 237
Kennedy, R. E. 205
Kenny, K. 225, 237
Kerry 38, 75, 80, 83, 88, 91, 94, 220
Kildare 75, 177
Killala 108, 117, 119, 130
Killanure 39
Kilrush 156
Kimball Solon xi, xii, xv, xvii, xviii, 1, 3, 4,
8, 21, 22, 23, 24, 25, 26, 28, 36, 71, 72, 133,
143, 145, 167, 220, 231, 232, 235
kinship relationships 8, 14
Koyama, Takashi 17, 18, 19
L
labour xvii, 6, 7, 9, 12, 27, 28, 29, 30, 39, 40,
44, 46, 47, 48, 49, 50, 53, 54, 55, 57, 64, 67,
68, 72, 73, 94, 112, 121, 125, 128, 145, 146,
150, 154, 156, 162, 163, 166, 168, 170, 177,
178, 179, 188, 198, 199, 218, 219, 220, 221,
224, 228, 230, 231, 235
labourers and servants 49, 219
Lancashire 121, 139, 202
land ownership norm 29
land subdivision 4, 5, 6, 29, 68, 117

252 Index
land tenure scale 21
land use 75, 114
land used 119
landholding category 53, 58, 59
landholding scale 73, 75, 114
landholding size 43, 45, 46, 50, 53
landholdings of 1 to less than 30 acres 74
landholdings of 100 acres 74, 75, 112, 113, 146
landholdings of 30 to less than 100 acres 74
landholdings of less than 1 acre 74
landless agricultural workers and servants 93
landless labourer households 168, 221
landless spinners and workers 37
landless worker 28, 73, 94, 95
landlord system 4
landlords’ intentions 45
large families 17, 85
large farmers xvii, 28, 39, 44, 45, 46, 50, 57,
67, 68, 72, 73, 75, 145, 168, 221, 222
large holding 43, 44
large-scale agricultural areas 30
large-scale farming area 143
late age of marriage 171
late inheritance 40, 218, 219
late marriage 4, 14, 27, 30, 36, 79, 83, 86, 93,
125, 145, 155, 171, 186, 189, 217, 219, 223
lateral extension 57, 133, 134, 161, 186, 187
laterally extended family households 56, 57
Le Play’s, Frédéric 11, 12, 238
Lee, J. 33, 77, 79, 80, 238
Leinster 38, 74, 75, 76, 77, 78, 79, 80, 82, 83,
88, 93, 94, 143, 170, 177, 197, 198, 199, 219,
231
Leitrim 38
life course in household 63
life cycle 21, 34, 35, 41, 53, 57, 62, 67, 68, 183
life expectancy 186
lifecycle servants 188
lifelong celibacy 155
lifetime bachelor 125
Limerick 38, 75, 80, 88
Lincolnshire and Cambridge 121
line from County Londonderry and County
Kerry 91
line from County Mayo to County Tipperary
86
line from Londonderry to Limerick 88
lineal consanguinity 135
linen spinning industry 38
linen weavers and spinners 47
linen weaving 37
linkage techniques 73, 93
livestock farmers 45
livestock farming 39, 45, 46, 75, 76, 108, 114,
115, 121, 123, 147, 149, 156, 168, 221
livestock production 5
lodgers 63, 135, 158, 188
London xii, 170, 201, 202, 208, 229, 230, 232,
233, 234, 237, 240, 242, 243
Louth 38
Lower Kells 44
M
Mabbot Street in Northdock Ward 175
male emigrants 199
male-to-female ratio 54
manufacturing of linen textiles 39, 68
manufacturing populations 12
marginal land 107, 123
marginal peripheral unions 108
marital fertility 1
market town 39
marriage age 73, 79, 144, 179, 186, 207

253Index
marriage and birth rate 77, 126
marriage by matchmaking 162
marriage of the worker 67
marriage rate 29, 30, 73, 78, 79, 80, 83, 86, 93,
125, 144, 145, 159, 168, 170, 173, 174, 181,
186, 190, 206, 207, 219, 221
married household heads 83, 154, 206, 207
Mason W. S. 33, 238
masons 67
Massachusetts 204
matchmaker 23
matchmaking 23, 25, 27, 29, 30, 33, 39, 110,
145, 162, 193, 199, 217, 222
Matsuo, Taro xi, 25, 105, 112, 122, 140, 143,
145, 150, 161, 238
mature animals 107
McKenna, E. E. 79, 238
McManus, R. 170, 239
Meagher, T. J. 194, 238
medium and large landholding categories 59
medium farmers 28, 37, 72, 75, 167, 220
medium holding 43, 44
medium sized farm holdings 3, 7
medium-sized agricultural area 30
Messenger, Porter, Watchman 179
method for counting the number of relatives
186
Mid-Atlantic region 202
mid-nineteenth century 2, 11, 26, 33, 37, 68,
93, 110, 169, 193, 194, 217, 237
mid-sized farming areas 26
mid-western region 3
Middlesex 202
migrant workers 28, 72, 121, 125
miners 209
mini-famine in 1879 78, 82, 105
mixed agriculture of grain farming and
livestock farming 76
model for a change in Irish families 217
modernization 23
Morgan and Macafee 5, 26, 239
Morioka, Kiyomi 18, 19
mortality of infant under one year 174
mountain and barren regions 139
Mulranny 139
multi-generational household composition 3
multiple family households 13, 35, 39, 40, 56,
57, 58, 60, 66, 87, 88, 89, 90, 91, 94, 95, 133,
134, 140, 141, 143, 146, 161, 162, 163, 164,
167, 168, 184, 186, 193, 213, 215, 220
multiple work pattern 50
Munster 4, 38, 74, 75, 76, 77, 78, 79, 80, 81, 82,
83, 88, 93, 94, 198, 199, 219, 220
Murdock’s nuclear family theory 16
N
Napoleonic inheritance law 12
NAPP (North Atlantic Population Project) xi,
195
National Archives xi, xiii, 2, 41, 227
natural increase 93, 109, 170, 173, 176, 177
natural population growth 80, 126, 173
Navan 156
nephews and nieces 57, 63, 135, 187, 188
New England 202
new family with the dowry 29
New York 204, 228, 231, 233, 236, 240
Newport 139
ninbetsu-cho 17
no family households 13, 35, 59, 88, 133
non-heir 29, 79
non-homogeneity 192
254 Index
non-marriage rate 78
norm of the nuclear family 29
normative ethos of the rural family 171
North Central region 202, 204
northern England 201
nuclear family xv, xvi, xvii, xviii, 11, 12, 14,
16, 20, 21, 22, 26, 27, 29, 30, 33, 36, 37, 39,
40, 41, 53, 57, 62, 64, 67, 68, 69, 72, 93, 110,
133, 144, 169, 170, 172, 185, 189, 190, 194,
217, 218, 221, 223, 224, 225
nuclear family life cycles 53, 57
nuclear family system 11, 12, 14, 21, 27, 29, 30,
33, 36, 37, 39, 41, 62, 64, 67, 68, 69, 93, 110,
170, 172, 185, 189, 190, 194, 217, 218, 221,
223, 224, 225
number of acres 42, 43
number of cattle 75, 108, 114, 115, 119, 120,
121, 148
number of cattle per cattle breeder 75
number of children 53, 54, 55, 79, 85, 86, 130,
131, 156, 176, 182, 183, 188, 211, 212, 213,
224
number of collateral relatives 57, 63, 187
number of emigrants 82, 105, 198, 199, 219
number of extended family households 35, 55,
66, 141
number of household members 51, 130, 156,
181
number of kin 62, 63, 65, 73, 134, 135, 164
number of labourers 29
number of living children 131
number of multiple family households 55, 88
number of simple family households 35, 55, 60
number of single people 79
number of small occupiers 108
numbers of lineal relatives 187
O
Ó Gráda, C. xii, 4, 78, 80, 111, 121, 141, 175,
236, 239, 240
O’Brien, J. V. 169, 170, 239
O’Maitiu, Seamas 170, 240
O’Neill, K. xii, 5, 26, 240
oats 24, 46, 119, 121, 139, 147
occupation 42, 43, 48, 49, 53, 54, 55, 57, 68,
83, 127, 128, 155, 162, 163, 164, 171, 179,
199, 208, 210
occupation categories 48, 68
occupation of household heads 83
occupational differences 50, 67
occurrence of upward and lateral extensions
161
old age pension 111, 112, 141, 232, 239
one-child land inheritance system 23
one-heir norm 29
one-heir patrilineal inheritance 30
P
Painter 179
parent’s physical decline or demise 161
parental land 146
parents-in-law 63
parents’ generation 195
parish 1, 5, 36, 37, 39, 43, 238
part-time income 21
partible inheritance xvi, 4, 26, 29, 36, 39, 40,
45, 46, 49, 67, 68, 82, 109, 110, 124, 144, 169,
218
partible land subdivision 5
paternal co-residence 21
255Index
patriarch 12, 16, 23, 25, 27, 79, 83, 93, 111,
126, 127, 134, 136, 140, 141, 145, 166, 168,
171, 184, 190, 219, 220, 221, 223
patriarch right and landholdings 166
patriarchal headship 168
patriarchal rights 23, 27, 79, 83, 93, 111, 126,
127, 134, 136, 140, 141, 184, 190, 219, 220,
221, 223
patriliny 171
peasant family structure 169
peasant society 28, 72, 73, 94, 220
penetration of celibacy 27
Pennsylvania xii, 204
percentage of single people 29
percentage of young household heads 152
percentages of endogamy and exogamy 207
permanent emigration 124
personal consumption 75
pneumonia 175
polarization of County Meath households 162
polarization of the age of male household heads
127
poor condition of the city’s drinking water and
sanitary facilities 175
poor environmental conditions 177
Poor Inquiry in 1836 33
poor law union 106, 107, 108, 117, 118, 119,
120, 121, 122, 125, 130, 139
poorer peasantry 105
population density 175, 176, 177
population drain 176
population growth 4, 6, 33, 45, 46, 80, 105,
109, 126, 150, 170, 173, 176, 177, 178, 234
population shifts 150
possibility of endogamy 195
post-Famine 2, 7, 145, 153, 235, 238, 239, 242
postponement of the heir’s marriage 40
potato 4, 24, 29, 30, 46, 47, 75, 78, 105, 119,
121, 123, 124, 125, 139, 140, 144, 150
potato harvest 29, 121
potatoesandfishoreggs140
potatoes and herrings for lunch 140
potatoes and milk or eggs for dinner 140
potentiality of expanding land for cultivation
144
poverty and congested living conditions 105
pre-Famine household systems 7
premature deaths 14
priests 39, 47, 49, 71, 79
principle of host society omnipotence 191
principle of the nuclear family system 189,
190, 223
Printer 179
production and sale of eggs by housewives
110, 111
production for market 28, 72
prolonged headship 167
prolonged holding of patriarchal rights by
fathers 79
Prolonged household headship 161
proportion of married household heads 154
Protestant immigrants 192
proto-industrialization 6, 7, 27, 29, 110, 231
Prunty, J. 170, 240
pull factors 156
pull-push factors 194
pulmonary tuberculosis 175
Q
quality/inequality among brothers 192
Queen’s xiii, 177
256 Index
R
RailwayOfficialandService179
rate of change from the simple family
households to the stem family 90
rates of birth and death 174
rates of survival of children born in households
176
rates of widows with children 186
record linkage 8
reduction in household size 158
regional and social hierarchical factors 222
regional bias 35
regional categories in the core and peripheral
regions 116
regional difference 8, 71, 218, 219, 220
regional variation xviii, 5, 8, 27, 28, 71, 72, 73,
76, 88, 93, 95, 241
regional variation in household structure xviii,
8, 241
regional variation in the Irish stem family 27,
72
regional variation in the stem family system
71
regionality 38, 64, 67, 68
relationship to the householder 42
relationships between co-resident kin 62
relief of the poor in Ireland 170
retirement income 23
retirement system 21
revisionist position 15
Rhodes, Rita M. 145, 153, 154, 240
Roscommon 38, 75, 80, 88
Royal Irish Constabulary and Metropolitan
Police 82
Ruggles Steven xi, 11, 12, 14, 15, 16, 240
rundale system 25, 39, 40, 47, 68, 117, 123
rural family 3, 33, 71, 171, 183
Rynamona xv, 22
S
Saito, Osamu 17, 21, 240
sale of eggs 7, 110, 111, 115, 121, 124, 140, 220
seamstresses 111
seasonal migrants 75, 111, 121, 122, 123, 125
seasonal migration 7, 124, 125, 140, 220
semiskilled or unskilled workers 195, 200
servant 11, 28, 39, 49, 63, 64, 66, 67, 73, 92,
93, 111, 128, 135, 136, 146, 156, 158, 164,
167, 171, 179, 188, 189, 190, 199, 200, 209,
219, 223
settlement of debts 23
sex ratio 195, 197, 205
SFH to the multiple family households 89
sheep 46, 119, 120, 121, 148
shifting arable land to grassland 114
Shirakawa village 17
‘shock’ of the Famine 4
Shoe, Boot-Maker, Dealer 179
shoemaking 177
shopkeeper 156, 179
shushi aratame-cho 18, 19
siblings 1, 6, 13, 57, 63, 64, 66, 92, 133, 135,
136, 146, 155, 158, 161, 162, 164, 167, 168,
184, 186, 187, 188, 189, 215, 221
simple family formation 5
simple family households 5, 13, 26, 28, 35, 39,
55, 56, 57, 58, 59, 60, 61, 63, 64, 67, 68, 73,
88, 89, 90, 91, 93, 132, 133, 159, 161, 170,
171, 172, 184, 186, 187, 188, 189, 190, 193,
194, 213, 214, 215, 223, 224
simple family system 4, 8, 9, 36
size of co-resident kin 135

257Index
size of households 51, 53, 55, 85, 183, 210
size of kinship 63
Sligo 38, 75, 80, 92
sluggish growth in population 170
slums of Dublin 170
small farm system 7
small farmers 28, 38, 39, 44, 45, 46, 47, 49, 68,
72, 105, 128, 140, 141, 220, 222
small farming region 75
small holdings xvi, xvii, 43, 44, 110
small landholding category 58, 59
small number of children 183
small patches of land 46
small-farm regime 3
small-scale landholding structure 123
smaller families 85
smallholders with a side job 112
socio-economic patterns 6
solitaries 5, 11, 13, 28, 35, 59, 73, 88, 89, 133,
159, 161, 164, 184, 185, 213
South Lough 151
spinning 7, 38, 39, 40, 46, 49, 110
spread of the potato crop 150
staple food 124, 125, 140
static death rate and emigration 77
statistics on marriage, birth, and death 33
Steidl, Annemarie 146, 241
stem family xi, xii, xv, xvii, xviii, 4, 5, 6, 7, 8,
11, 12, 16, 18, 21, 22, 23, 25, 27, 28, 29, 30,
31, 33, 36, 37, 40, 57, 63, 67, 68, 69, 71, 72,
73, 87, 88, 89, 90, 91, 92, 93, 94, 95, 110, 111,
112, 133, 134, 135, 136, 140, 141, 142, 143,
145, 146, 162, 164, 168, 171, 172, 194, 195,
199, 217, 218, 219, 220, 221, 222, 223, 224,
225, 231, 235
stem family members 92
stem family norm xvii, 27, 28, 40, 68, 72, 73,
90, 91, 95, 111, 112, 140, 143, 145, 146, 162,
168, 218, 220, 221, 222, 225
stem family system xvii, 4, 5, 7, 8, 11, 18, 21,
25, 27, 29, 30, 33, 36, 37, 57, 68, 69, 71, 93,
110, 133, 134, 194, 217, 218, 220, 221
stem-family-basedhouseholdclassification11
strategy of remaining single 146
structural-functionalist 3
subdivision 4, 5, 6, 29, 68, 117
suburbs of the city of Dublin 188
succeeding to landholdings and headship 161
succession of Ie property 222
Surrey 202
Swinford 108, 117, 119, 121, 122, 125
T
Tailor 179
tea and wheat bread or potatoes for dinner 140
temporal and spatial movements 218
tenant 26, 30, 44, 46, 74, 109, 113, 123, 139,
145, 198, 228, 229
tenant farmers 26, 30, 46, 113, 139, 198
textile industry 49
textile production 5
The Congested District Board for Ireland, Base
Report 139, 140
the United States xii, xiii, 9, 11, 14, 145, 191,
192, 193, 194, 195, 196, 199, 200, 202, 205,
206, 207, 208, 209, 210, 211, 212, 213, 214,
215, 218, 219, 223, 224, 225, 237
theoretical construction of the small family 16
tillage 75
Tipperary 38, 75, 85, 87
Toda, Teizo 16, 17, 19

258 Index
Todd, Emmanuel 22, 71, 74, 191, 192, 193,
224, 241, 242
Todd’s map 71
total number of children 131, 182
total number of relatives 187, 214
townland 3, 26, 39, 43, 150
traditional farmers 28, 72
traditional farming system of Europe by Todd
74
traditional Japanese family 16, 19
transfer of headship 145
transfer of patriarchal rights before death 127
transformation of Irish family life 1
Trim 156
turf bogs 114
Turner, M. 74, 242
typical household type of the stem family 141,
220
typology of Matsuo 112
Tyrone Street 175
U
Ulster 7, 25, 38, 39, 46, 74, 75, 76, 77, 78, 79,
80, 81, 82, 83, 88, 93, 94, 110, 197, 198, 199,
208, 219, 233
unattractive labour market 178
uncles and aunts 136
universalism 191, 192
unmarried reduction 125
unskilled labourers 177
unskilled workers 170, 195, 200
upward extension 133, 134, 161, 186
upward multiple family households 57
urban families 9, 169, 172, 179, 187, 188, 190,
218, 223, 224, 225
utilitarian management approach of landlords
67
V
variation of the nuclear family system 21
Varley, T. xii, 22, 232
vertical extension 133, 134
vertically extended family households 56, 57
W
wage-earners 28, 72
waiting for inheritance 28, 72, 93, 162
Wakefield,E.33,242
Wall, R. xii, 14, 17, 63, 91, 134, 135, 164, 186,
214, 242
Warner, W. Lloyd 22, 23
Warner’s Yankee City study 23
Warwickshire, Stafford, and Cheshire 121
waste land 4, 105, 107, 109, 123
water-powered spinning frames 110
Waterford 75, 85
wealthy core region 121
weaving 37, 39, 40, 46, 49, 110
weaving and spinning 40, 46
well-being 4, 67, 93, 112, 141, 183, 185, 190,
194, 215, 219, 223
well-being life 67
West North Central 202
west of Ireland xvi, 4, 7, 105, 145, 231, 232,
239
west room 23, 24, 25
West Yorkshire 202

259Index
western Ireland 23, 28, 71, 72, 73, 74, 75, 76,
79, 83, 85, 86, 88, 90, 91, 92, 93, 94, 95, 105,
143, 147, 149, 161, 167, 219, 220, 221, 223,
235
western Irish medium-scale farm family area
143
Westport 106, 108, 117, 119, 120, 130, 139
wheat 46, 119, 139, 140
wheat bread or potatoes for breakfast 140
Wicklow 177
widowed/divorced 206
widowers with children 56
widows with children 56, 133, 186
Wilson, T. M. 23, 143, 228, 242, 243
workers in construction and textiles 209
Y
Yankee City study 22, 23
yarn at home 39
Yorkshire 201, 202
young livestock 107, 115
Young, Arther 33, 190, 223, 237, 243
Z
zadruga 20

260
この 「研究叢書」 は、所員の推薦する学術的共同研究および個人研究の成果を継続的に刊行することにより、もって、新たな文化の創造と学術の進歩に寄与しようとするものである。
〈Author〉
YOSHIFUMI SHIMIZU is a Professor of Sociology in the Faculty of Sociology, Momoyama Gakuin University (St. Andrew’s University), Osaka, Japan.He is the author of Changing World of the Family
(in Japanese), Nakanishiya Shuppan, Kyoto, 1999 and, Experience of Ireland (Co-author in Japanese), Hosei University Press, Tokyo. 2009.Email: [email protected]
About the Author

Studies of Post-1841 Irish Family Structures
研究叢書 30
2016 年 12 月 16 日 発行
著 者 Yoshifumi Shimizu
発行者 桃山学院大学総合研究所 [594-1198] 大阪府和泉市まなび野 1 − 1 ℡(0725)54-3131(代)
印刷所 友 野 印 刷(株)
発行日=納品日