Studies about the origin of the non-spectroscopic interferences caused by sodium and calcium in...
18
Spectrochimica Acta Part B 57 (2002) 1753–1770 0584-8547/02/$ - see front matter 2002 Elsevier Science B.V. All rights reserved. PII: S0584-8547 Ž 02 . 00141-6 Studies about the origin of the non-spectroscopic interferences caused by sodium and calcium in inductively coupled plasma atomic emission spectrometry. Influence of the spray chamber design Salvador Maestre, Juan Mora, Jose-Luis Todolı* ´ ´ Department of Analytical Chemistry, University of Alicante, P.O. Box 99, 03080, Alicante, Spain Received 22 April 2002; accepted 16 August 2002 Abstract In the present work a systematic study about the characterization of the performance of three spray chambers in terms of inductively coupled plasma atomic emission spectrometry (ICP-AES) analytical figures of merit and matrix effects caused by sodium and calcium at high concentrations was carried out. In addition, experiments were conducted in order to understand the origin of the non-spectroscopic interferences caused by sodium and calcium in ICP-AES. The chambers used were a double pass (DP) a cyclonic (CC) and a home made single pass (SP). In all the cases a high efficiency nebulizer was operated at liquid flow rates ranging from 20 to 200 ml min . The results revealed y1 that the ICP-AES sensitivities were higher for the SP than for the two remaining spray chambers. The data concerning the matrix effects caused by concomitants (i.e. sodium and calcium) indicated that the extent of these effects was higher for the DP than for the SP and CC. In the presence of these elements in excess, finer tertiary aerosols were generated than for water. Nonetheless, similar primary aerosols were generated irrespective of the matrix tested. Several experiments were conducted in order to elucidate the mechanism leading to the matrix effects caused by sodium and calcium in terms of aerosol transport towards the plasma. It was concluded that a combination of droplet charge effects and a reduction in the extent of solvent evaporation could be responsible for these effects. 2002 Elsevier Science B.V. All rights reserved. Keywords: Inductively coupled plasma atomic emission spectroscopy; Non-spectroscopic interferences; Spray chamber; Easily ionized elements 1. Introduction In inductively coupled plasma atomic emission spectrometry (ICP-AES), the analytical signal and the extent of the matrix effects depend mainly on *Corresponding author. Fax: q34-96-590-3464. E-mail address: [email protected] (J.-L. Todolı). ´ the amount of sample that is introduced into the plasma. When dealing with liquid samples, the sample is usually turned out into an aerosol (pri- mary aerosol) and only the finest droplets are driven towards the plasma (tertiary aerosol). The emission signal is given by both the amount and the characteristics of the tertiary aerosol. These
-
Upload
independent -
Category
Documents
-
view
3 -
download
0
Transcript of Studies about the origin of the non-spectroscopic interferences caused by sodium and calcium in...
Spectrochimica Acta Part B 57(2002) 1753–1770
0584-8547/02/$ - see front matter� 2002 Elsevier Science B.V. All rights reserved.PII: S0584-8547Ž02.00141-6
Studies about the origin of the non-spectroscopic interferencescaused by sodium and calcium in inductively coupled plasmaatomic emission spectrometry. Influence of the spray chamber
design
Salvador Maestre, Juan Mora, Jose-Luis Todolı*´ ´
Department of Analytical Chemistry, University of Alicante, P.O. Box 99, 03080, Alicante, Spain
Received 22 April 2002; accepted 16 August 2002
Abstract
In the present work a systematic study about the characterization of the performance of three spray chambers interms of inductively coupled plasma atomic emission spectrometry(ICP-AES) analytical figures of merit and matrixeffects caused by sodium and calcium at high concentrations was carried out. In addition, experiments were conductedin order to understand the origin of the non-spectroscopic interferences caused by sodium and calcium in ICP-AES.The chambers used were a double pass(DP) a cyclonic(CC) and a home made single pass(SP). In all the cases ahigh efficiency nebulizer was operated at liquid flow rates ranging from 20 to 200ml min . The results revealedy1
that the ICP-AES sensitivities were higher for the SP than for the two remaining spray chambers. The data concerningthe matrix effects caused by concomitants(i.e. sodium and calcium) indicated that the extent of these effects washigher for the DP than for the SP and CC. In the presence of these elements in excess, finer tertiary aerosols weregenerated than for water. Nonetheless, similar primary aerosols were generated irrespective of the matrix tested.Several experiments were conducted in order to elucidate the mechanism leading to the matrix effects caused bysodium and calcium in terms of aerosol transport towards the plasma. It was concluded that a combination of dropletcharge effects and a reduction in the extent of solvent evaporation could be responsible for these effects.� 2002 Elsevier Science B.V. All rights reserved.
Keywords: Inductively coupled plasma atomic emission spectroscopy; Non-spectroscopic interferences; Spray chamber; Easilyionized elements
1. Introduction
In inductively coupled plasma atomic emissionspectrometry(ICP-AES), the analytical signal andthe extent of the matrix effects depend mainly on
*Corresponding author. Fax:q34-96-590-3464.E-mail address: [email protected](J.-L. Todolı).´
the amount of sample that is introduced into theplasma. When dealing with liquid samples, thesample is usually turned out into an aerosol(pri-mary aerosol) and only the finest droplets aredriven towards the plasma(tertiary aerosol). Theemission signal is given by both the amount andthe characteristics of the tertiary aerosol. These

1754 S. Maestre et al. / Spectrochimica Acta Part B 57 (2002) 1753–1770
parameters are, in turn, a strong function of thedesign and performance of the sample introductionsystem. The most usual liquid sample introductionsystem consists of a nebulizer, which generates theaerosol, and a spray chamber, which selects themaximum drop size introduced into the plasmaw1x.Regarding spray chambers, the double pass
spray type one(also called Scott type) has beentraditionally the most common design used in theICP instrumentsw2x. Additional spray chamberdesigns such as the cyclonicw3–6x or the singlepass w7,8x can be found in the literature. It hasbeen described that, in the case of cyclonic spraychambers, the aerosol follows a double concentricspiral trajectory before being introduced into theplasma basew9x. However, according to recentmathematical simulationsw10,11x, these chambersappear to behave primarily as an impactor ratherthan an industrial cyclonic device. What seemsclear is that the aerosol path can be considered tobe easier for single pass than for cyclonic ordouble pass designs. In addition, modifications ofthe cyclonic design have been developed in orderto handle low volume samplesw12–14x, to inter-face separation techniques with plasma spectrom-etry w15x and to analyze samples by flow injectionanalysisw8,16x.
Matrix effects due to easy and not easy-to-ionize elements(e.g. sodium or calcium) havebeen recently reviewedw17x. These matrix effectscan be originated inside the plasma andyor in theliquid sample introduction system. As regards theeffects in the plasma, sodium and calcium canmodify the plasma local values of temperature andelectronic density. Other processes such as modi-fication in the spatial distribution of the emittingspecies have also discussed as possible sources ofthe matrix effectsw17x. It is well known that, inorder to minimize the interferences due to themodification of plasma thermal characteristics, itshould be operated under the so-called robustconditions w18x. These conditions are reachedwhen working at high RF power values(i.e. higherthan 1.3 kW more or less) and at low nebulizergas flow rates(i.e. below 0.7 l min ).y1
As regards the contribution of the sample intro-
duction system to the matrix effects caused byconcomitants, it should be stated that, althoughthis factor was initially neglectedw19,20x, thepresence of high concentration of elements in thesample may have a significant influence on thebehavior of this component of the equipmentw21,22x. Under plasma robust conditions, thematrix effect caused by elements such as sodiumor calcium are mainly attributed to the sampleintroduction systemw23x. In general terms, whendealing with samples with concomitant concentra-tions below 20 000 mg l , the nebulization pro-y1
cess is not disturbed. However, the mass of analytetransport rate leaving the spray chamber can bemodified with respect to that found for plain watersolutions w21,23x. A phenomenon responsible forchanges in the total mass of analyte reaching theplasma when having a highly concentrated elementin the sample is the so called aerosol ionic redis-tribution, AIR. This accounts for the changes inthe analyte concentration in the aerosol dropletswhen compared to the concentration in the originalsample bulkw24,25x. According to the bibliogra-phy, AIR takes place when a new droplet isgenerated(i.e. nebulization or renebulization pro-cesses inside the spray chamber due to dropletimpacts) w26x. Droplet charge effects can play arelevant role on the extent of the AIR through thedroplet Coulombic fission processesw27–29x.Another phenomenon responsible for the modifi-cation in the total amount of analyte reaching theplasma is the solvent evaporation. In the presenceof dissolved salts, this event is dampened withrespect to waterw30,31x. Moreover, for other ionicmatrices(i.e. inorganic acids) it has been observedthat the solvent evaporation from the solutionsettled on the spray chamber walls affects theextent of the interferencesw32x.
The design of the spray chamber has an impor-tant effect on the extent of the interferences inICP-AES, because it modifies the magnitude ofthe aerosol transport phenomena taking place alongits path towards the plasma. Previously publishedwork has already shown that for a cyclonic spraychamber the suppression in the emission signalcaused by inorganic acids is less significant thanfor a double pass spray chamberw33,34x.
1755S. Maestre et al. / Spectrochimica Acta Part B 57 (2002) 1753–1770
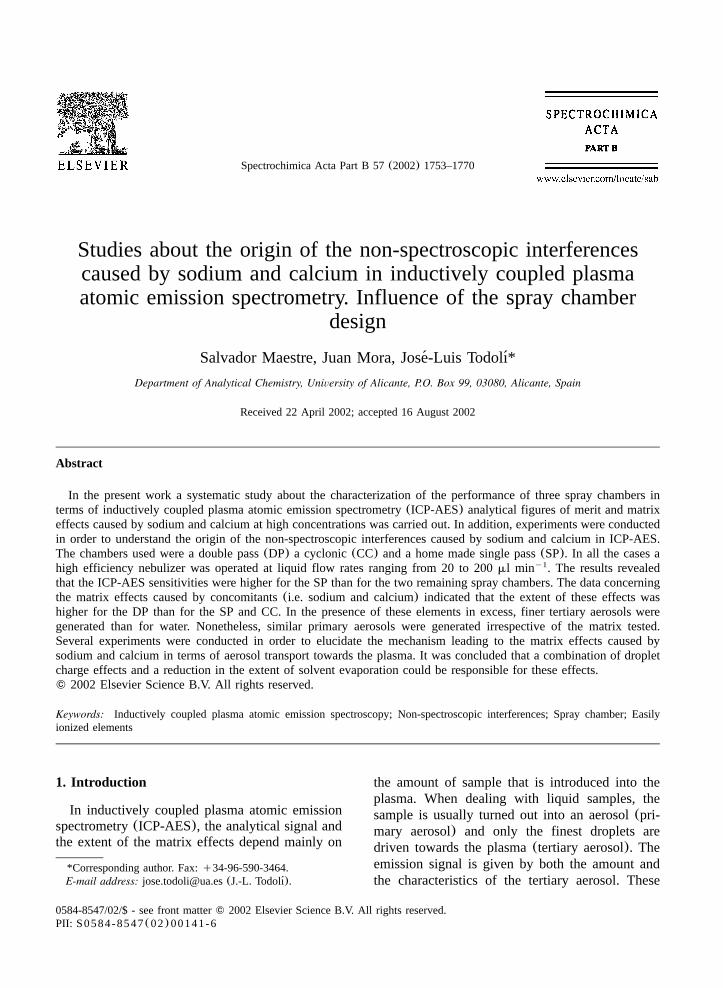
Fig. 1. Pictures of different spray chambers.(a) The single pass spray chamber, SP;(b) jacketed double pass spray chamber, JDP;(c) orifice double pass spray chamber, ODP.
The present work will be focused on the studyof the influence of the spray chamber design onthe ICP-AES analytical figures of merit and thematrix effects due to the presence of high concen-trations of sodium and calcium in the sample. Inaddition, fundamental studies aimed to the under-standing of the mechanism responsible of thematrix effects in terms of aerosol transport towardsthe plasma will be presented in this work.
2. Experimental
A high efficiency pneumatic concentric nebuliz-er w35x, HEN (HEN-170-AA, J.E. Meinhard CA,USA) was used throughout. Its gas outlet cross-section area was 1.1=10 mm , whereas its freey2 2
aspiration rate was 40ml min at 1 l miny1 y1
argon stream.Four spray chambers were used, a Ryton double
pass-Scott type spray chamber(DP, Perkin-ElmerUberlingen, Germany), a glass cyclonic spray¨
chamber(CC, Glass Expansion, Pty, Australia), a
homemade single pass spray chamber(SP, seepicture in Fig. 1a) and a jacketed double passspray chamber(JDP, see picture in Fig. 1b). In allthe cases, tertiary aerosols left the spray chamberby an upper exit, whereas drain(i.e. coarsestdroplets) was removed via a lower conduction.The inner volumes were 100, 43, 22 and 105 cm3
for the DP, CC, SP and the JDP, respectively. Inthe experiments carried out with the JDP, thechamber walls temperature was controlled bymeans of a thermostated bath(Haake, Mod. F3-KHaake Mess-Technik GmbHu Co., Karlsruhe, Ger-many). The temperatures of the spray chamberswalls were settled at 0, 15, 25 and 508C.In order to measure the aerosols inside the
chamber, a home made double pass spray chamberwith an orifice was used(ODP, see picture in Fig.1c). Its inner volume was 100 cm . Obviously, the3
chamber orifices modified the gas dynamics, butthey were expected not to cause any change in theaerosol transport phenomena inside the chambercentral tube.

1756 S. Maestre et al. / Spectrochimica Acta Part B 57 (2002) 1753–1770
Table 1ICP-AES operating conditions
RF power(kW) 1.45Integration time(ms) 100Sampling time(ms) 1000Outer gas flow rate(l min )y1 15Auxiliary gas flow rate(l min )y1 0.5Nebulizer-carrier gas flow rate(l min )y1 0.6Observation height(mm above load coil) 5Sample uptake rate(ml min )y1 VariableInjector diameter(mm) 0.87
The liquid sample was supplied to the nebulizerby means of a Gilson Minipuls 3 peristaltic pump(Villiers Le Bel, France). The liquid flow rate(Q ) was varied between 20 and 200ml min byy1
l
using 0.19-mm i.d. Tygon capillaries. Argon wasemployed for nebulization in all the cases.The drop size distributions(DSD) of the aero-
sols generated by the nebulizer(primary aerosols)and those leaving the spray chamber(tertiaryaerosols) were characterized by means of a laserFraunhofer diffraction system(model 2600c, Mal-vern Instruments, Malvern Worcestershire, UK).The laser beam generated by this instrument has a10-mm diameter. Because primary aerosols werecharacterized by placing the nebulizer tip at 10mm from the beam center, droplets included withinthe 5–15-mm range from the nebulizer exit weremeasured. In the case of the tertiary ones, the exitof the spray chamber was placed 5 mm away fromthe laser beam center. Therefore, the dropletswhich interacted with the laser beam were thosecontained up to 10 mm above the spray chamberexit. When the ODP was used, the laser beamwent through the orifice located near the end ofthe centered tube. A set of three replicates wasperformed in each case, the precision(R.S.D.)achieved being always lower than 2%.Solvent transport rate(S ) measurements weretot
performed by means of a direct method(i.e. bythe adsorption of the aerosol in a U-tube filledwith silica gel during a period of 10 min). Byweighing it before and after the aerosol tubeexposition, theS values were easily derived.tot
Analyte transport rate values were obtained by adirect method(i.e. by collecting the aerosol on aglass fiber filter, type AyE, 47-mm diameter, 0.3-mm pore size, Gelman Sciences, Ann Arbor, MI,USA). To this end, a 500-mg l Mn solution wasy1
nebulized. The Mn retained after a period of 10min was extracted by washing the filters with1.0% (w w ) nitric acid solution. The totaly1
solution volume was made up to 100 ml in avolumetric flask. Finally, the Mn concentration ineach solution was determined by flame atomicabsorption spectrometry(FAAS). The precision ofthe transport experiments was always better than5% (R.S.D. from three replicates).
The emission signal was measured with a Per-kin-Elmer Optima 3000 ICP-AES instrument(Uberlingen, Germany). Table 1 gathers the con-¨
ditions of the instrument. The viewing height, RFpower and carrier gas flow rate were optimizedfor each chamber in order to obtain the highestMg II yMg I ratio.Aqueous standards containing 10 mg l ofy1
each element were prepared from an ICP multie-lement standard solution(IV, Merck, Darmstadt,Germany). Table 2 lists the wavelengths and lineenergy sum values,E (i.e. sum of ionizationsum
and excitation energies) for ionic lines as well asthe excitation energy values for the atomic ones.Solutions of sodium and calcium were preparedfrom solid NaCl and CaCl (Panreac, analysis2
grade). In order to prevent the nebulizer tip block-ing induced by solid particles, every solution waspreviously filtered using PTFE filters(1-mm poresize, Millipore).
3. Results and discussion
3.1. Preliminary considerations
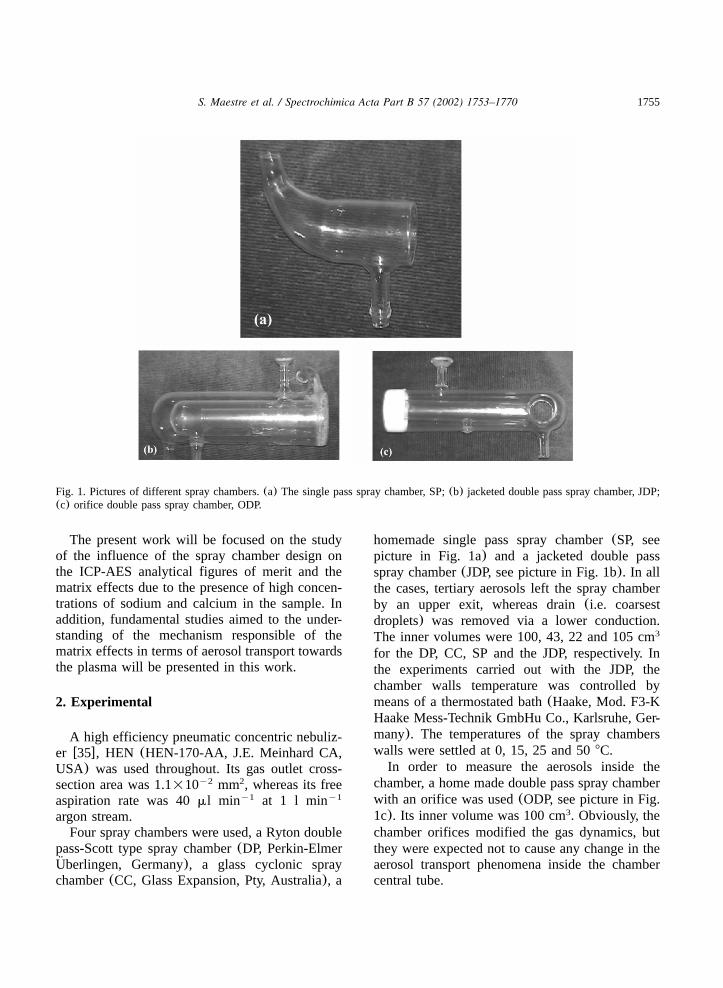
The system used in the present work to measurethe aerosol drop size distributions has a detectorwhich consists of a series of 30 concentric ringsplaced on the lens focal planew36x. Fig. 2 plotsthe energy measured by the detector rings for twodroplets having different diameters. According tothis figure, for a small droplet, the laser radiationis preferentially scattered and focused on the rings21–30(i.e. high angles) whereas for a coarse one,the majority of the radiation does on the two firstrings (i.e. low angles).
1757S. Maestre et al. / Spectrochimica Acta Part B 57 (2002) 1753–1770
Table 2Lines tested in the present work
Line Wavelength E asum
(nm) (eV)
Li I 670.781 1.8Mn I 294.920 2.8Mg I 285.213 3.1Cr I 357.869 3.5Cu I 324.754 3.8Al I 308.215 4Ga I 294.364 4.31Pb I 216.999 5.7Cu I 222.778 7.2Cd I 361.061 7.4Zn I 334.502 7.8Ba II 455.403 7.93Sr II 421.552 8.6Sr II 407.771 8.7Ba II 230.424 11.2Mg II 280.270 12.1Mn II 257.610 12.3Cr II 267.595 12.9Co II 228.616 13.7Ni II 221.647 14.3Cd II 226.502 14.5Zn II 202.548 15.5Mg II 279.079 16.5
E sIonization energyqexcitation energy.asum
Fig. 2. Energy measured for two droplets with different diam-eters as a function of the detector ring.(-j-) Drop diameter:118mm; (-d-) Drop diameter: 1.2mm.
Radiation that has passed through the aerosolwithout suffering diffraction reaches the detectorcenter. By comparing this radiation with that meas-ured in absence of aerosol, it is possible to estimatethe amount(mass, volume) of aerosol which isbeing measured. The parameter obtained in thisway is the so-called obscuration. Nevertheless, itis necessary to take into account the contributionof the drop size to the diffraction efficiency. Tothis end, the so called volume concentration(VC)can be used. The VC is defined as the percentageof laser sampling volume which is occupied byaerosol particles. This parameter is given by thefollowing mathematical relationship:
100log(1yOb)eVCs (1)y3 V Qi ib82 di
Whereb is the length of the laser cylinder whichis being used to obtain the diffraction pattern,Obis the obscuration defined as the difference
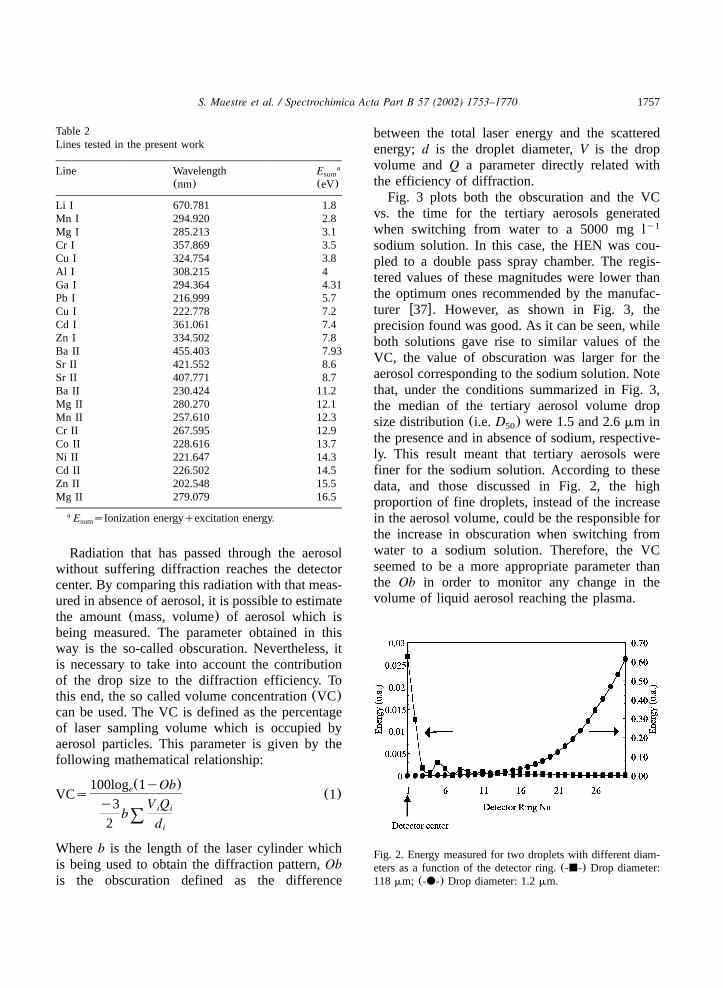
between the total laser energy and the scatteredenergy; d is the droplet diameter,V is the dropvolume andQ a parameter directly related withthe efficiency of diffraction.Fig. 3 plots both the obscuration and the VC
vs. the time for the tertiary aerosols generatedwhen switching from water to a 5000 mg ly1
sodium solution. In this case, the HEN was cou-pled to a double pass spray chamber. The regis-tered values of these magnitudes were lower thanthe optimum ones recommended by the manufac-turer w37x. However, as shown in Fig. 3, theprecision found was good. As it can be seen, whileboth solutions gave rise to similar values of theVC, the value of obscuration was larger for theaerosol corresponding to the sodium solution. Notethat, under the conditions summarized in Fig. 3,the median of the tertiary aerosol volume dropsize distribution(i.e. D ) were 1.5 and 2.6mm in50
the presence and in absence of sodium, respective-ly. This result meant that tertiary aerosols werefiner for the sodium solution. According to thesedata, and those discussed in Fig. 2, the highproportion of fine droplets, instead of the increasein the aerosol volume, could be the responsible forthe increase in obscuration when switching fromwater to a sodium solution. Therefore, the VCseemed to be a more appropriate parameter thanthe Ob in order to monitor any change in thevolume of liquid aerosol reaching the plasma.
1758 S. Maestre et al. / Spectrochimica Acta Part B 57 (2002) 1753–1770
Fig. 3. Variation of the VC(-d-) and the obscuration(-j-)of the aerosols leaving the double pass spray chamber withtime when switching from water to a 5000-mg l sodiumy1
solution.Q s0.4 l min ; Q s800ml min .y1 y1g l
Fig. 4. Tertiary aerosol volume drop size distribution curves infrequency for the different chambers tested. Dashed line:cyclonic spray chamber, CC; black line: single pass spraychamber, SP; gray line: double pass spray chamber, DP.Q sg0.4 l min ; Q s50 ml min .y1 y1
l
Fig. 5. Primary aerosol volume drop size distribution curves infrequency for the high efficiency nebulizer.(a) Q s800 mll
min ; (b) Q s100ml min ; Q s0.4 l min .y1 y1 y1l g
3.2. Plain water solutions
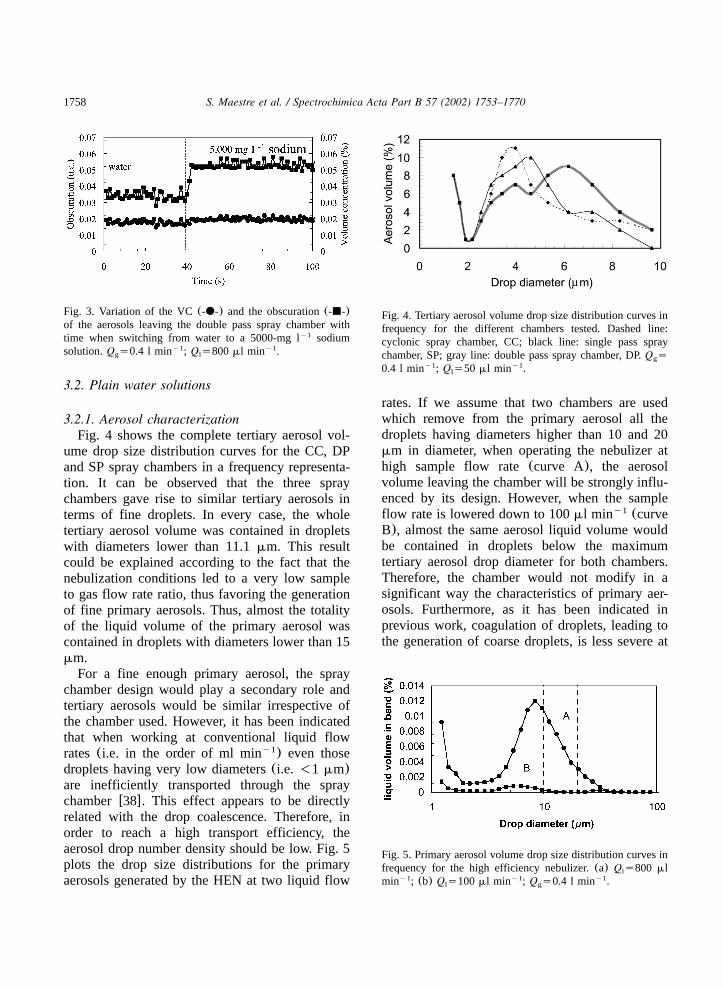
3.2.1. Aerosol characterizationFig. 4 shows the complete tertiary aerosol vol-
ume drop size distribution curves for the CC, DPand SP spray chambers in a frequency representa-tion. It can be observed that the three spraychambers gave rise to similar tertiary aerosols interms of fine droplets. In every case, the wholetertiary aerosol volume was contained in dropletswith diameters lower than 11.1mm. This resultcould be explained according to the fact that thenebulization conditions led to a very low sampleto gas flow rate ratio, thus favoring the generationof fine primary aerosols. Thus, almost the totalityof the liquid volume of the primary aerosol wascontained in droplets with diameters lower than 15mm.For a fine enough primary aerosol, the spray
chamber design would play a secondary role andtertiary aerosols would be similar irrespective ofthe chamber used. However, it has been indicatedthat when working at conventional liquid flowrates(i.e. in the order of ml min ) even thosey1
droplets having very low diameters(i.e. -1 mm)are inefficiently transported through the spraychamberw38x. This effect appears to be directlyrelated with the drop coalescence. Therefore, inorder to reach a high transport efficiency, theaerosol drop number density should be low. Fig. 5plots the drop size distributions for the primaryaerosols generated by the HEN at two liquid flow
rates. If we assume that two chambers are usedwhich remove from the primary aerosol all thedroplets having diameters higher than 10 and 20mm in diameter, when operating the nebulizer athigh sample flow rate(curve A), the aerosolvolume leaving the chamber will be strongly influ-enced by its design. However, when the sampleflow rate is lowered down to 100ml min (curvey1
B), almost the same aerosol liquid volume wouldbe contained in droplets below the maximumtertiary aerosol drop diameter for both chambers.Therefore, the chamber would not modify in asignificant way the characteristics of primary aer-osols. Furthermore, as it has been indicated inprevious work, coagulation of droplets, leading tothe generation of coarse droplets, is less severe at
1759S. Maestre et al. / Spectrochimica Acta Part B 57 (2002) 1753–1770
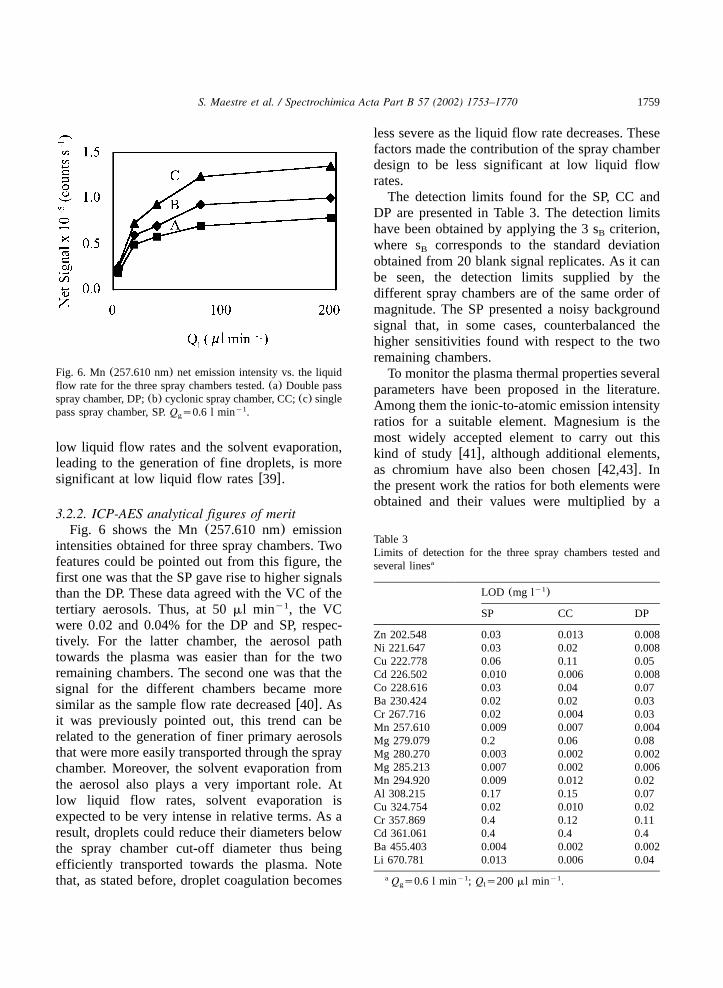
Fig. 6. Mn (257.610 nm) net emission intensity vs. the liquidflow rate for the three spray chambers tested.(a) Double passspray chamber, DP;(b) cyclonic spray chamber, CC;(c) singlepass spray chamber, SP.Q s0.6 l min .y1
g
Table 3Limits of detection for the three spray chambers tested andseveral linesa
LOD (mg l )y1
SP CC DP
Zn 202.548 0.03 0.013 0.008Ni 221.647 0.03 0.02 0.008Cu 222.778 0.06 0.11 0.05Cd 226.502 0.010 0.006 0.008Co 228.616 0.03 0.04 0.07Ba 230.424 0.02 0.02 0.03Cr 267.716 0.02 0.004 0.03Mn 257.610 0.009 0.007 0.004Mg 279.079 0.2 0.06 0.08Mg 280.270 0.003 0.002 0.002Mg 285.213 0.007 0.002 0.006Mn 294.920 0.009 0.012 0.02Al 308.215 0.17 0.15 0.07Cu 324.754 0.02 0.010 0.02Cr 357.869 0.4 0.12 0.11Cd 361.061 0.4 0.4 0.4Ba 455.403 0.004 0.002 0.002Li 670.781 0.013 0.006 0.04
Q s0.6 l min ; Q s200ml min .a y1 y1g l
low liquid flow rates and the solvent evaporation,leading to the generation of fine droplets, is moresignificant at low liquid flow ratesw39x.
3.2.2. ICP-AES analytical figures of meritFig. 6 shows the Mn(257.610 nm) emission
intensities obtained for three spray chambers. Twofeatures could be pointed out from this figure, thefirst one was that the SP gave rise to higher signalsthan the DP. These data agreed with the VC of thetertiary aerosols. Thus, at 50ml min , the VCy1
were 0.02 and 0.04% for the DP and SP, respec-tively. For the latter chamber, the aerosol pathtowards the plasma was easier than for the tworemaining chambers. The second one was that thesignal for the different chambers became moresimilar as the sample flow rate decreasedw40x. Asit was previously pointed out, this trend can berelated to the generation of finer primary aerosolsthat were more easily transported through the spraychamber. Moreover, the solvent evaporation fromthe aerosol also plays a very important role. Atlow liquid flow rates, solvent evaporation isexpected to be very intense in relative terms. As aresult, droplets could reduce their diameters belowthe spray chamber cut-off diameter thus beingefficiently transported towards the plasma. Notethat, as stated before, droplet coagulation becomes
less severe as the liquid flow rate decreases. Thesefactors made the contribution of the spray chamberdesign to be less significant at low liquid flowrates.The detection limits found for the SP, CC and
DP are presented in Table 3. The detection limitshave been obtained by applying the 3 s criterion,B
where s corresponds to the standard deviationB
obtained from 20 blank signal replicates. As it canbe seen, the detection limits supplied by thedifferent spray chambers are of the same order ofmagnitude. The SP presented a noisy backgroundsignal that, in some cases, counterbalanced thehigher sensitivities found with respect to the tworemaining chambers.To monitor the plasma thermal properties several
parameters have been proposed in the literature.Among them the ionic-to-atomic emission intensityratios for a suitable element. Magnesium is themost widely accepted element to carry out thiskind of study w41x, although additional elements,as chromium have also been chosenw42,43x. Inthe present work the ratios for both elements wereobtained and their values were multiplied by a
1760 S. Maestre et al. / Spectrochimica Acta Part B 57 (2002) 1753–1770
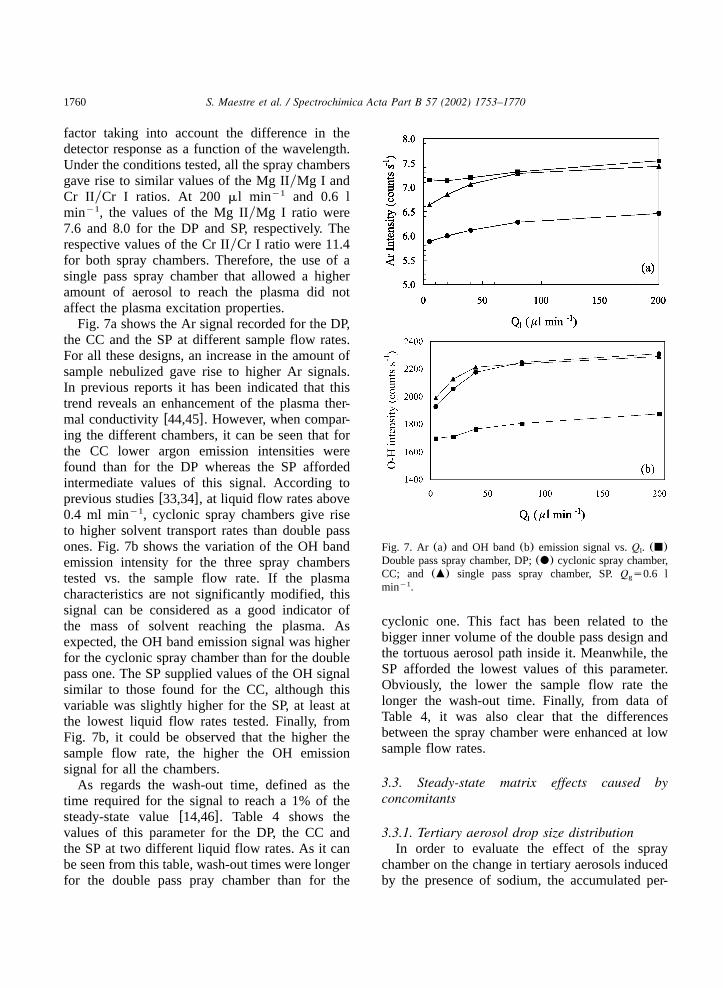
Fig. 7. Ar (a) and OH band(b) emission signal vs.Q . (j)l
Double pass spray chamber, DP;(d) cyclonic spray chamber,CC; and (m) single pass spray chamber, SP.Q s0.6 lg
min .y1
factor taking into account the difference in thedetector response as a function of the wavelength.Under the conditions tested, all the spray chambersgave rise to similar values of the Mg IIyMg I andCr IIyCr I ratios. At 200ml min and 0.6 ly1
min , the values of the Mg IIyMg I ratio werey1
7.6 and 8.0 for the DP and SP, respectively. Therespective values of the Cr IIyCr I ratio were 11.4for both spray chambers. Therefore, the use of asingle pass spray chamber that allowed a higheramount of aerosol to reach the plasma did notaffect the plasma excitation properties.Fig. 7a shows the Ar signal recorded for the DP,
the CC and the SP at different sample flow rates.For all these designs, an increase in the amount ofsample nebulized gave rise to higher Ar signals.In previous reports it has been indicated that thistrend reveals an enhancement of the plasma ther-mal conductivityw44,45x. However, when compar-ing the different chambers, it can be seen that forthe CC lower argon emission intensities werefound than for the DP whereas the SP affordedintermediate values of this signal. According toprevious studiesw33,34x, at liquid flow rates above0.4 ml min , cyclonic spray chambers give risey1
to higher solvent transport rates than double passones. Fig. 7b shows the variation of the OH bandemission intensity for the three spray chamberstested vs. the sample flow rate. If the plasmacharacteristics are not significantly modified, thissignal can be considered as a good indicator ofthe mass of solvent reaching the plasma. Asexpected, the OH band emission signal was higherfor the cyclonic spray chamber than for the doublepass one. The SP supplied values of the OH signalsimilar to those found for the CC, although thisvariable was slightly higher for the SP, at least atthe lowest liquid flow rates tested. Finally, fromFig. 7b, it could be observed that the higher thesample flow rate, the higher the OH emissionsignal for all the chambers.As regards the wash-out time, defined as the
time required for the signal to reach a 1% of thesteady-state valuew14,46x. Table 4 shows thevalues of this parameter for the DP, the CC andthe SP at two different liquid flow rates. As it canbe seen from this table, wash-out times were longerfor the double pass pray chamber than for the
cyclonic one. This fact has been related to thebigger inner volume of the double pass design andthe tortuous aerosol path inside it. Meanwhile, theSP afforded the lowest values of this parameter.Obviously, the lower the sample flow rate thelonger the wash-out time. Finally, from data ofTable 4, it was also clear that the differencesbetween the spray chamber were enhanced at lowsample flow rates.
3.3. Steady-state matrix effects caused byconcomitants
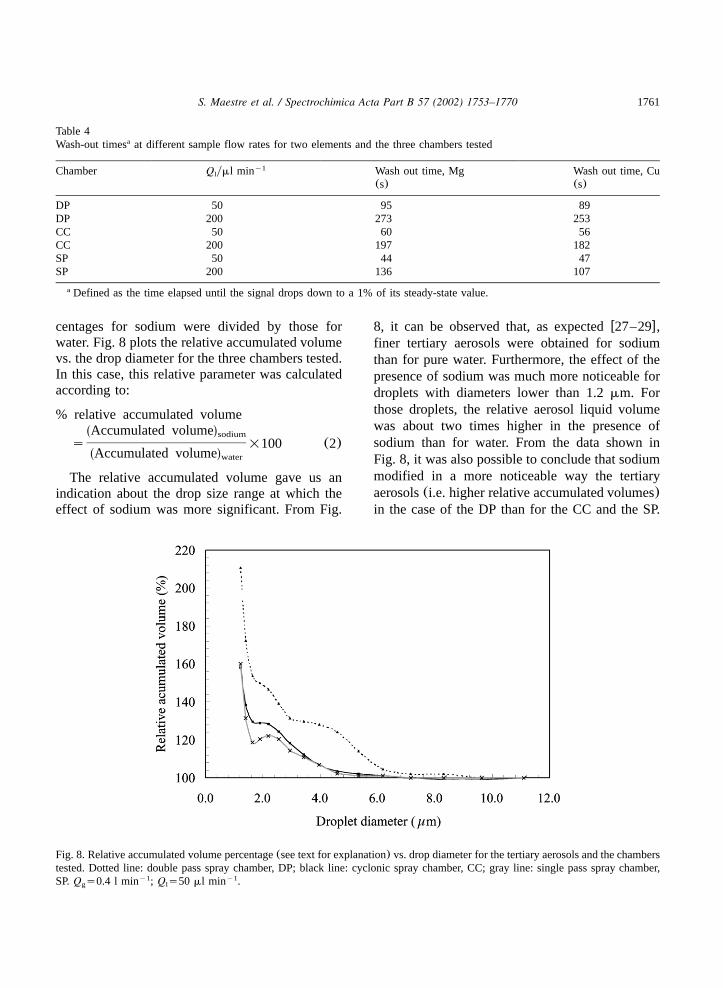
3.3.1. Tertiary aerosol drop size distributionIn order to evaluate the effect of the spray
chamber on the change in tertiary aerosols inducedby the presence of sodium, the accumulated per-
1761S. Maestre et al. / Spectrochimica Acta Part B 57 (2002) 1753–1770
Table 4Wash-out times at different sample flow rates for two elements and the three chambers testeda
Chamber Q yml miny1l Wash out time, Mg Wash out time, Cu
(s) (s)
DP 50 95 89DP 200 273 253CC 50 60 56CC 200 197 182SP 50 44 47SP 200 136 107
Defined as the time elapsed until the signal drops down to a 1% of its steady-state value.a
Fig. 8. Relative accumulated volume percentage(see text for explanation) vs. drop diameter for the tertiary aerosols and the chamberstested. Dotted line: double pass spray chamber, DP; black line: cyclonic spray chamber, CC; gray line: single pass spray chamber,SP.Q s0.4 l min ; Q s50 ml min .y1 y1
g l
centages for sodium were divided by those forwater. Fig. 8 plots the relative accumulated volumevs. the drop diameter for the three chambers tested.In this case, this relative parameter was calculatedaccording to:
% relative accumulated volumeŽ .Accumulated volumesodium
s =100 (2)Ž .Accumulated volumewater
The relative accumulated volume gave us anindication about the drop size range at which theeffect of sodium was more significant. From Fig.
8, it can be observed that, as expectedw27–29x,finer tertiary aerosols were obtained for sodiumthan for pure water. Furthermore, the effect of thepresence of sodium was much more noticeable fordroplets with diameters lower than 1.2mm. Forthose droplets, the relative aerosol liquid volumewas about two times higher in the presence ofsodium than for water. From the data shown inFig. 8, it was also possible to conclude that sodiummodified in a more noticeable way the tertiaryaerosols(i.e. higher relative accumulated volumes)in the case of the DP than for the CC and the SP.
1762 S. Maestre et al. / Spectrochimica Acta Part B 57 (2002) 1753–1770
For the two latter devices, the presence of sodiumdid not have any significant effect for those drop-lets with diameters above 7.2mm (i.e. relativeaccumulated volume values close to 100%) where-as for the double pass spray chamber this diameterwas located at 9.6mm.As regards the VC, there were no conspicuous
differences as a function of the solution tested.Thus, for the DP, atQ s0.4 l min andQ s50y1
g l
ml min , this magnitude took values of 0.02%y1
both for water and sodium 5000 mg l solution.y1
The respective VC values in the case of the SPwere 0.04 and 0.045%.
3.3.2. Studies about the mechanism responsible forthe matrix effectsThe tertiary aerosols were finer when an ionic
matrix was present in the sample than whennebulizing water alone. A possible explanationwas given by Agnes and co-workers as followsw27–29x: Pneumatically generated droplets canhave a net electrical charge at their surfaces. Oncedroplets are generated, they reduce their diametersthrough solvent evaporation. When these dropletsreach a critical diameter(approx. 4mm) w28x theycannot withstand the charge on their surfaces andthey are dispersed in other progeny ones.In the present work, the effect of the presence
of sodium on the characteristics of tertiary aerosolswas evaluated. The experiments were aimed tomodify the extent of two processes:(i) the solventevaporation; and(ii) the net electrical charge atthe surface of the droplets.Tertiary aerosols were measured at different
temperatures. The matrix used was 5000 mg ly1
of either Na or Ca solutions. The jacketed doublepass spray chamber spray chamber(JDP) wasused(see Fig. 1b). For a given set of nebulizationconditions (i.e. sample and gas flow rates) thematrix effects in terms of shift in drop size distri-bution were more severe as the temperature wentup. For instance, at 0.4 l min and 800mly1
min , the drop inD induced by the presencey150
of sodium or calcium was 25 and 80% at 0 and50 8C, respectively. These results were in agree-ment with the theory proposed by Agnes et al.,because an increase in the chamber walls temper-
ature promoted the solvent evaporation and it couldlead to an increase in the droplet fission frequency.From the comments made before, it appears that
the matrix effects were more severe as the solventevaporation was enhanced. The extent of solventevaporation could also be modified by changingthe nebulization conditions. At this point additionalexperiments were carried out at room temperatureby modifying the nebulizer liquid and gas flowrates. Thus, for example, for the SP at a 0.4lmin gas flow rate, theD dropped by 42% andy1
50
13% at 50 and 800ml min , respectively. There-y1
fore it was obvious that the matrix effects weremore severe as the liquid flow rate was decreased.Again this trend fitted well with the mechanismproposed by Agnes et al. However, when increas-ing the nebulizer gas flow rate(i.e. enhanced thesolvent evaporation) the matrix effects caused byeither sodium or calcium were less severe. Thus,at a liquid flow rate of 800ml min , the presencey1
of sodium induced a 13 and 2% drop in theD50
at a gas flow rate of 0.4 and 1.0 l min ,y1
respectively. These latter results were not in agree-ment with the droplet fission theory and wereconsistent with previous investigations which indi-cate that the matrix effects caused by inorganicacids are more severe at low than at high gas flowratesw47x.In the explanation proposed by Agnes and co-
workers, the solvent evaporation is of capitalimportance. However, this aerosol transport phe-nomenon can be considered as relatively slow. Ithas been indicated that those droplets havingdiameters higher than 10mm need approximately60 s to evaporate completely at room temperaturew30,31x. According to simple theoretical calcula-tions, based on previously published workw30,31x,it was observed that the time required for thecomplete evaporation of a droplet with a 1-mmdiameter is approximately 60 ms. We could alsoroughly estimate the minimum time that a dropletwill spend inside the double pass spray chamberby dividing the gas flow rate by the inner volumeof this chamber. At 0.7 l min the droplety1
residence time in the DP chamber is approximately9 s. For plain water droplets having 1- and 10-mminitial diameters, the former would evaporate com-pletely(the evaporation time for that droplet would

1763S. Maestre et al. / Spectrochimica Acta Part B 57 (2002) 1753–1770
be 60 ms) whereas for the latter droplet, the finaldiameter after 9 s would be 9.5mm. Therefore,theoretically, the change in drop size for coarsedroplets due to evaporation would be almost neg-ligible. Note that in these calculations, the contri-bution of the increasing gas saturation degreecaused by the progressive solvent evaporation hasbeen neglected. Besides this, it has also beenmentioned that the critical diameter below whichdroplets disperse in other progeny ones is approx-imately 4 mm w27x. For a 5000 mg l sodiumy1
solution, the droplets that would reach this diam-eter through solvent evaporation for a 9-s residencetime were those having approximately 5mm indiameter. Therefore, according to these data, themain mechanism responsible for the generation offiner aerosols in the presence of inorganic speciesthan for pure water does not appear to be thesolvent evaporation and their further dispersion infiner droplets, at least at room temperature.A possible explanation for the effect of sodium
on tertiary aerosol characteristics could be thebreak down of those droplets having a charge–diameter ratio above a critical value just at theexit of the nebulizer. The primary aerosols weremeasured for water, sodium and calcium matricesat 5 mm from the nebulizer tip. These experimentsrevealed that, in the presence of either sodium orcalcium at 5000 mg l , the aerosols had the samey1
statistical parameters as for water alone. Therefore,the aerosol differences as a function of the ionicmatrix were due to processes occurring after theaerosol generation. Further experiments were car-ried out in which the aerosols characteristics weremeasured at 18 mm from the nebulizer tip andacross the aerosol cone. These experiments wereperformed to investigate the effect of the aerosolsolvent evaporation just after its generation. Again,the presence of sodium did not result in anysignificant change in the whole drop sizedistribution.Water solutions containing sodium or calcium
together with surfactants were prepared in order todecrease the net charge on the droplets and, hence,to decrease the fission’s frequency during thetransport of the aerosol through the spray chamber.To this end three surfactants of different ioniccharacteristics were used, a non-ionic surfactant
(i.e. Triton X-100) an anionic surfactant(i.e.sodium dodecyl sulfate, SDS) and a cationic one(hexadecyl-tributylamonium bromide, CTAB).These compounds were present in the solution ata concentration corresponding to the criticalmicelle concentration(i.e. CMC). The results indi-cated that the presence of surfactant did not modifyin a significant way the matrix effects caused byeither sodium or calcium in terms of changes inthe tertiary aerosol characteristics. At 50mlmin and 0.4 l min , the drops inD causedy1 y1
50
by the presence of sodium with respect of waterwere 45, 54 and 47% for Triton X-100, SDS andCTAB, respectively(remember that, in absence ofsurfactant, the drop inD was 42%). These results50
were not in agreement with a droplet fissionmechanism.Another experiment was carried out in order to
find the part of the spray chamber in which thematrix effects were more significant. In this case,we used the double pass spray chamber shown inFig. 1c (ODP). The aerosols were measured forwater and for the 5000-mg l sodium solution.y1
At 0.2 l min and 200ml min , theD of they1 y13,2
aerosols leaving the inner tube of the ODP were18% lower in the presence of sodium than thosemeasured for pure water. Therefore, it could beconcluded that the changes in the aerosol charac-teristics induced by the presence of sodium wereproduced, at least partially, somewhere betweenthe nebulizer tip and the exit of the spray chamberinner tube.Stewart and Olesikw32x have concluded that the
charge effects are not responsible for the genera-tion of finer aerosols in the presence of ionicmatrices such as nitric acid solutions. Solventevaporation from the droplets surface can also beresponsible of the changes in the characteristics ofthe tertiary aerosol induced by the matrixw30xbecause the vapor pressure of the solution decreas-es as increasing the salt concentration. Theoreticalcalculationsw31x demonstrated that for a 10 000mg l sodium solution, the decrease in droplety1
diameter would be lower than 5% and 2.5% fordroplets with diameters of 0.5 and 1mm, respec-tively. This effect becomes less obvious as the saltconcentration decreases. Finer tertiary aerosolscould be expected in the presence of dissolved
1764 S. Maestre et al. / Spectrochimica Acta Part B 57 (2002) 1753–1770
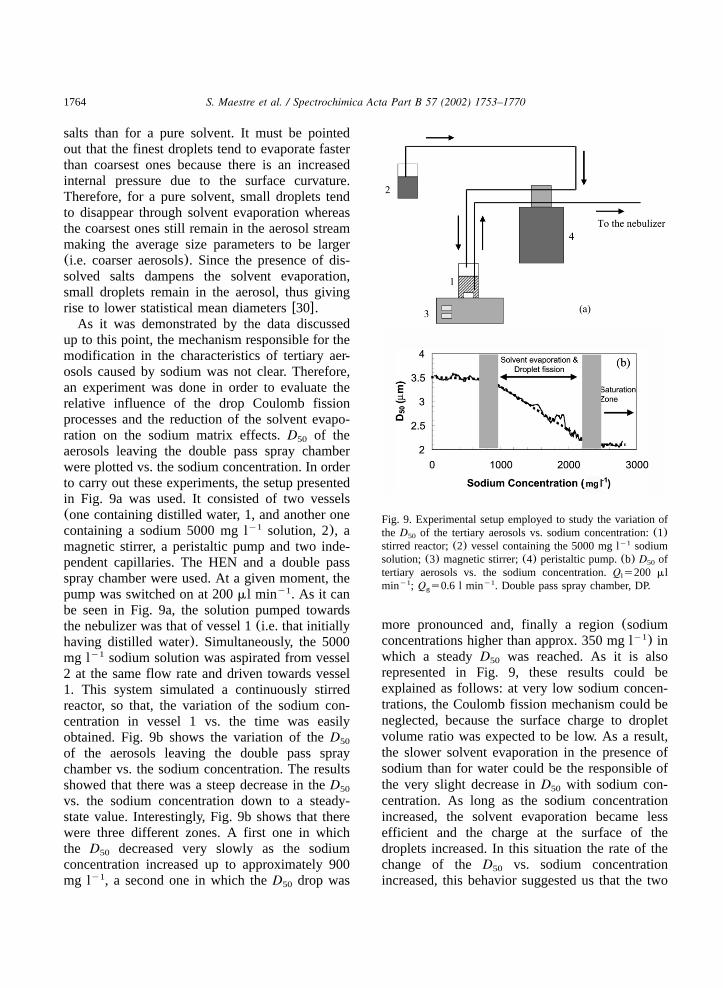
Fig. 9. Experimental setup employed to study the variation ofthe D of the tertiary aerosols vs. sodium concentration:(1)50
stirred reactor;(2) vessel containing the 5000 mg l sodiumy1
solution;(3) magnetic stirrer;(4) peristaltic pump.(b) D of50
tertiary aerosols vs. the sodium concentration.Q s200 mll
min ; Q s0.6 l min . Double pass spray chamber, DP.y1 y1g
salts than for a pure solvent. It must be pointedout that the finest droplets tend to evaporate fasterthan coarsest ones because there is an increasedinternal pressure due to the surface curvature.Therefore, for a pure solvent, small droplets tendto disappear through solvent evaporation whereasthe coarsest ones still remain in the aerosol streammaking the average size parameters to be larger(i.e. coarser aerosols). Since the presence of dis-solved salts dampens the solvent evaporation,small droplets remain in the aerosol, thus givingrise to lower statistical mean diametersw30x.
As it was demonstrated by the data discussedup to this point, the mechanism responsible for themodification in the characteristics of tertiary aer-osols caused by sodium was not clear. Therefore,an experiment was done in order to evaluate therelative influence of the drop Coulomb fissionprocesses and the reduction of the solvent evapo-ration on the sodium matrix effects.D of the50
aerosols leaving the double pass spray chamberwere plotted vs. the sodium concentration. In orderto carry out these experiments, the setup presentedin Fig. 9a was used. It consisted of two vessels(one containing distilled water, 1, and another onecontaining a sodium 5000 mg l solution, 2), ay1
magnetic stirrer, a peristaltic pump and two inde-pendent capillaries. The HEN and a double passspray chamber were used. At a given moment, thepump was switched on at 200ml min . As it cany1
be seen in Fig. 9a, the solution pumped towardsthe nebulizer was that of vessel 1(i.e. that initiallyhaving distilled water). Simultaneously, the 5000mg l sodium solution was aspirated from vessely1
2 at the same flow rate and driven towards vessel1. This system simulated a continuously stirredreactor, so that, the variation of the sodium con-centration in vessel 1 vs. the time was easilyobtained. Fig. 9b shows the variation of theD50
of the aerosols leaving the double pass spraychamber vs. the sodium concentration. The resultsshowed that there was a steep decrease in theD50
vs. the sodium concentration down to a steady-state value. Interestingly, Fig. 9b shows that therewere three different zones. A first one in whichthe D decreased very slowly as the sodium50
concentration increased up to approximately 900mg l , a second one in which theD drop wasy1
50
more pronounced and, finally a region(sodiumconcentrations higher than approx. 350 mg l) iny1
which a steadyD was reached. As it is also50
represented in Fig. 9, these results could beexplained as follows: at very low sodium concen-trations, the Coulomb fission mechanism could beneglected, because the surface charge to dropletvolume ratio was expected to be low. As a result,the slower solvent evaporation in the presence ofsodium than for water could be the responsible ofthe very slight decrease inD with sodium con-50
centration. As long as the sodium concentrationincreased, the solvent evaporation became lessefficient and the charge at the surface of thedroplets increased. In this situation the rate of thechange of theD vs. sodium concentration50
increased, this behavior suggested us that the two

1765S. Maestre et al. / Spectrochimica Acta Part B 57 (2002) 1753–1770
Fig. 10. Effect of the line energy on the relative net emission intensity(I ) for the cyclonic(a) the single pass(b) and the doublerel
pass(c) spray chambers.(A) Q s20 ml min ; (B) Q s40 ml min ; (C) Q s80 ml min ; (D) Q s200ml min . Q s0.6 ly1 y1 y1 y1l l l l g
min . Matrix: sodium 5000 mg l .y1 y1
mechanisms(reduction in the solvent evaporationextent and Coulomb droplet fission) acted simul-taneously. Finally, when the sodium concentrationwas further increased, a constant value inD was50
found. Therefore, a saturation effect was found inwhich the charge at the droplets surface reached amaximum value.
3.3.3. ICP-AES emission signalFig. 10 shows the effect of the excitation(atom-
ic lines) and excitationqionization energy(ioniclines) on the relative net emission intensity(I )rel
for the double pass(Fig. 10a), cyclonic(Fig. 10b)and single pass(Fig. 10c) spray chambers. Theresults summarized in this figure correspond tothose using sodium as the concomitant and theyhave been obtained at four different liquid flowrates. I has been calculated by dividing therel
emission intensity in the presence of sodium bythat found in absence of this element. Finally, this
parameter has been multiplied by 100. From thesefigures it can be seen that for a given liquid flowrate and spray chamber,I did not vary in arel
significant way as a function of the line energy,for most of the lines. According to publishedresults, this behavior is typical for a robust plasmaw18x. Fig. 10 also shows thatI varied with energyrel
line according to a pattern that was irrespective ofthe liquid flow rate. When switching betweenspray chambers, the pattern was just slightly mod-ified. This can be accounted for by consideringthat there were no conspicuous differences in termsof the total mass of solvent delivered to the plasmafor the chambers tested(Table 5). Finally, Fig. 10shows that theI values were somewhat lowerrel
(stronger matrix effects) for the double pass spraychamber than for the two remaining designs. Thematrix effects found for calcium were slightlymore pronounced than those discussed for sodium.
1766 S. Maestre et al. / Spectrochimica Acta Part B 57 (2002) 1753–1770
Table 5Values of the total mass of solvent transported towards theplasma for the different spray chambers and matrices tested
Spray chamber Ql Matrixa Stot
(ml min )y1 (mg min )y1
Double pass 20 Water 0.009Sodium 0.010Calcium 0.010
200 Water 0.014Sodium 0.012Calcium 0.015
Cyclonic 20 Water 0.009Sodium 0.010Calcium 0.010
200 Water 0.014Sodium 0.015Calcium 0.015
The concentration of calcium or sodium is 5000 mg l .a y1
Nevertheless, as it can be seen in Table 5,S fortot
the two matrices tested were virtually identical.The robustness of the plasma was also tested by
measuring the Mg IIyMg I and the Cr IIyCr Iratios. It was found that none of these two para-meters changed when introduced to either sodiumor calcium solutions instead of introducing theplain water one. The conclusions drawn whenmeasuring the argon atomic emission intensitymeasurements were also in agreement with thoseresults.Another striking effect is that observed at low
Q , because the lower this variable the more severel
the matrix effects. This fact, has been alreadydiscussed for inorganic acids and saltsw48,49x.This fact could not be attributed to a change inthe plasma excitation characteristics, because theion-to-atom line ratios and the Ar signal registereddid not agree with this trend. The measurementsof the analyte transport rate leaving the spraychamber indicated that, at 20ml min , there wasy1
a slight drop inW when sodium or calcium weretot
present with respect to water. However, the dropin emission signal was, in all the cases, muchmore pronounced than that in analyte transport.Thus for example, for the double pass spraychamber, the Mn signal drop induced by thepresence of sodium was approximately 10 and50% at 200 and 20ml min , respectively. They1
respectiveW dropping factors were just 6 andtot
18%. As it was verified in the present work, thislack of correspondence could not be attributed tothe matrix effects caused by sodium when carryingout theW determination through FAAS.tot
3.4. Transient matrix effects caused byconcomitants
In previous studies concerning the effects ofinorganic acids, it has been found that whenswitching between solutions of different acid con-centration, an additional matrix effect appears;these are the so-called transient matrix effects.These dynamic interferences lead to an increase inthe time required for the signal to reach a constantvalue w50–52x. The extent of the transient effectshas been reported both in terms of emission signaland tertiary aerosol characteristics. According toStewart and Olesikw32x, when introducing a nitricsolution after running the system with a morediluted acid solution, the signal sharply decreasesand then increases slowly until it reaches a plateau.These effects have been explained by these authorsin terms of preferential solvent evaporation formeither the chamber walls or the aerosols. Amongthe variables influencing the acid transient effects,the spray chamber plays a very important role,mainly at low liquid flow rates. Thus, it has beenfound that the cyclonic spray chamber gives riseto a mitigation of these effects with respect to thedouble pass onew53x. In the present work, theseeffects have been characterized both in terms ofchanges in the tertiary aerosol drop size distribu-tion and ICP-AES emission signal.
3.4.1. Tertiary aerosolsFig. 11 plots the relativeD vs. time for the50
double pass, cyclonic and single pass spray cham-bers. In these experiments distilled water wasnebulized and, at a given moment(indicated byarrows in Fig. 11) a solution containing 5000 mgl was introduced. The results indicated that ity1
was necessary to wait approximately 5 s in orderto reach theD steady value. Results found for50
calcium gave rise to identical drop size distributionprofiles. According to the concentration of theconcomitants, the solution physical properties were

1767S. Maestre et al. / Spectrochimica Acta Part B 57 (2002) 1753–1770
Fig. 12. Net emission signal for the Cu 324 atomic line vs.time when switching from a sample without matrix to a solu-tion containing 5000 mg l of sodium.(-X-) 200 ml miny1 y1
and(-d-) 50ml min . Spray chamber: double pass.Q s0.6y1g
l min .y1
Fig. 11. RelativeD of the aerosols leaving the chambers test-50
ed vs. time when switching from distilled water to a 5000 mgl sodium solution.Q s0.6 l min ; Q s50 ml min .y1 y1 y1
g l
(---) cyclonic, (-j-) double pass and(—) single pass spraychamber.
not strongly modified. This could explain thedifferences when comparing these results withthose found for inorganic acidsw32x.
3.4.2. Transient matrix effects on the ICP-AESsignalThe evolution of the signal vs. time was regis-
tered when a solution containing 5000 mg l ofy1
sodium was introduced after nebulization of a plainwater solution. The results for the atomic line Cu324 nm are presented in Fig. 12 for the doublepass spray chamber. It can be easily checked that,at 200ml min there was no transient effect ony1
the signal when the matrix of the solution wasmodified. Nevertheless, at 50ml min the situa-y1
tion was slightly different and the time required toachieve a stationary signal was approximately 20s longer.
4. Conclusions
From the results shown in the present work, itcan be concluded that the use of a single passspray chamber for the introduction of very lowliquid sample volumes in ICP-AES is beneficialfrom the point of view of either analytical figuresof merit or matrix effects caused by sodium. It hasalso been observed that the work at very low
liquid flow rates results in an intensification of thematrix effects caused by both sodium and calcium.This effect has proven to be independent of thespray chamber design.The fundamental studies concerning the con-
comitant non-spectral interferences in ICP-AESindicated that while primary aerosols had the samecharacteristics irrespective of the matrix tested(i.e.water, sodium or calcium 5000 mg l), tertiaryy1
aerosols were finer in the presence of any of theseconcomitants. Under the plasma conditions testedin the present work(i.e. robust plasma), themechanism responsible for the changes in thetertiary aerosol would be a combination of areduction in the extent of solvent evaporation andan increase in the droplet fission caused by elec-trostatic repulsion at the droplet surface in thepresence of either sodium or calcium. These phe-nomena appear to take place simultaneously insidethe chamber and their relative importance dependson the spray chamber design and nebulizationconditions.
Acknowledgments
The authors wish to thank to Mr Alan Eastgate(Glass Expansion) for the loan of the cyclonic
1768 S. Maestre et al. / Spectrochimica Acta Part B 57 (2002) 1753–1770
spray chamber employed in the present study. Alsothe authors are grateful to the Direccion General´de Investigacion Cientıfica y Tecnica(DGICyT,´ ´ ´Spain) for the economical support(Project Ref.1FD 97-1080-C01 9.
References
w1x A. Montaser, M.G. Minnich, J. McLean, H. Liu, J.A.Caruso, C.W. McLeod, in: A. Montaser(Ed.), Induc-tively Coupled Plasma Mass Spectrometry, Wiley-VCH,New York, 1998, p. 83.
w2x R.H. Scott, V.A. Fassel, R.N. Kniseley, D.E. Nixon,Inductively coupled plasma-optical emission analyticalspectrometry—compact facility for trace analysis ofsolutions, Anal. Chem. 46(1974) 75–81.
w3x L. Ebdon, R. Collier, Particle size effects on kaolinslurry analysis by inductively coupled plasma-atomicemission spectrometry, Spectrochim. Acta Part B 43(1988) 355–369.
w4x X. Zhang, H. Li, Y. Yang, Determination of impuritiesin highly pure platinum by inductively coupled plasma-atomic emission spectrometry, Talanta 42(1995)1959–1963.
w5x M. Hoenig, H. Baeten, S. Vanhentenrijk, G. Ploegaerts,T. Bertholet, Evaluation of various commercially avail-able nebulization devices for inductively coupled plasmaatomic emission spectrometry, Analysis 25(1997)13–19.
w6x M. Wu, G.M. Hieftje, New spray chamber for induc-tively coupled plasma spectrometry, Appl. Spectrosc.46 (1992) 1912–1918.
w7x H. Isoyama, T. Uchida, T. Niwa, C. Iida, J.G. Nakagawa,Small spray chamber for inductively coupled plasmaatomic emission-spectrometry and its evaluation by adigital signal sampling technique, J. Anal. At. Spectrom.4 (1989) 351–355.
w8x H. Isoyama, T. Uchida, C. Iida, J.G. Nakagawa, Smallspray chamber with a concentric nebulizer for induc-tively coupled plasma atomic emission-spectrometry, J.Anal. At. Spectrom. 5(1990) 307–310.
w9x G. Liden, A. Gudmundsson, Semi-empirical modelling´to generalise the dependence of cyclone collectionefficiency on operating conditions and cyclone design,J. Aerosol. Sci. 28(1997) 853–874.
w10x G. Schaldach, L. Berger, H. Berndt, Meeting of theFederation of Analytical Chemistry and SpectroscopySocieties, Detroit, Paper� 18, 2001.
w11x G. Schaldach, L. Berger, I. Razilov, H. Berndt, Charac-terization of a cyclone spray chamber for ICP spectrom-etry by computer simulation, J. Anal. At. Spectrom. 17(2002) 334–344.
w12x C. B’Hymer, K.L. Sutton, J. Caruso, Comparison offour nebulizer–spray chamber interfaces for the high-performance liquid chromatographic separation of arsen-ic compounds using inductively coupled plasma massspectrometric detection, J. Anal. At. Spectrom. 13(1998) 855–858.
w13x K.A. Taylor, B.L. Sharp, D.J. Lewis, H.M. Crews,Design and characterisation of a microconcentric nebu-liser interface for capillary electrophoresis-inductivelycoupled plasma mass spectrometry, J. Anal. At. Spec-trom. 13(1998) 1095–1100.
w14x M. Haldimann, A. Eastgate, B. Zimmerli, Improvedmeasurement of iodine in food samples using inductive-ly coupled plasma isotope dilution mass spectrometry,Analyst 125(2000) 1977–1982.
w15x J.A. Day, J.A. Caruso, J.S. Becker, H.J. Dietze, Appli-cation of capillary electrophoresis interfaced to doublefocusing sector field ICP-MS for nuclide abundancedetermination of lanthanides produced via spallationreactions in an irradiated tantalum target, J. Anal. At.Spectrom. 15(2000) 1343–1348.
w16x M. Wu, Y. Madrid, J.A. Auxier, G. Hieftje, New spraychamber for use in flow injection plasma emissionspectrometry, Anal. Chim. Acta 286(1994) 155–167.
w17x J.L. Todolı, L. Gras, V. Hernandis, J. Mora, Elemental´matrix effects in ICP-AES, J. Anal. At. Spectrom. 17(2002) 142–169.
w18x C. Dubuisson, E. Poussel, J.M. Mermet, Comparison ofaxially and radially viewed inductively coupled plasmaatomic emission spectrometry in terms of signal-to-background ratio and matrix effects, J. Anal. At. Spec-trom. 12(1997) 281–286.
w19x J.P. Rybarczyk, C.P. Jester, D.A. Yates, S.R. Koirtyo-hann, Spatial profiles of interelement effects in theinductively coupled plasma, Anal. Chem. 54(1982)2162–2170.
w20x G. Horlick, M.W. Blades, Clarification of some analyteemission characteristics of the inductively coupled plas-ma using emission spatial profiles, Appl. Spectrosc. 34(1980) 229–233.
w21x K. O’Hanlon, L. Ebdon, M. Foulkes, Effect of easilyionisable elements on the mass transport efficiency ofsolutions and slurries used in plasma emission spectrom-etry, J. Anal. At. Spectrom. 12(1997) 329–331.
w22x R. Rezaaiyaan, J.W. Olesik, G.M. Hieftje, Interferencesin a low-flow, low-power inductively coupled plasma,Spectrochim. Acta Part B 40(1985) 73–83.
w23x C. Dubuisson, E. Poussel, J.L. Todolı, J.M. Mermet,´
Effect of sodium during the aerosol transport andfiltering in inductively coupled plasma atomic emissionspectrometry, Spectrochim. Acta Part B 53(1998)593–600.
w24x R.K. Skogerboe, S.J. Freeland, Experimental character-ization of aerosol production, transport, vaporization,

1769S. Maestre et al. / Spectrochimica Acta Part B 57 (2002) 1753–1770
and atomization systems. Part I: factors controllingaspiration rates, Appl. Spectrosc. 39(1985) 916–920.
w25x R.K. Skogerboe, S.J. Freeland, Experimental character-ization of aerosol production, transport, vaporization,and atomization systems. Part II: factors controllingaerosol size distributions produced, Appl. Spectrosc. 39(1985) 920–925.
w26x J.A. Borowiec, A.W. Boorn, J.H. Pillard, M.S. Cresser,R.F. Browner, M.J. Matteson, Interference effect fromaerosol ionic redistribution in analytical atomic spec-trometry, Anal. Chem. 52(1980) 1054–1059.
w27x Q. Xu, D. Balik, G.R. Agnes, Aerosol static electrifi-cation and its effects in inductively coupled plasmaspectroscopy, J. Anal. At. Spectrom. 16(2001)715–723.
w28x Q. Xu, G. Mattu, G.R. Agnes, Influence of dropletswith net charge in inductively coupled plasma atomicemission spectroscopy and implications for the easilyionizable element chemical matrix effect, Appl. Spec-trosc. 53(1999) 965–973.
w29x Q. Xu, G.R. Agnes, Use of laser light scatter signals tostudy the effect of a DC biased mesh screen in a spraychamber on aerosols generated for use in atomic spec-troscopy, Appl. Spectrosc. 54(2000) 94–98.
w30x B.L. Sharp, Pneumatic nebulisers and spray chambersfor inductively coupled plasma spectrometry. A review.Part 2: spray chambers, J. Anal. At. Spectrom. 3(1988)939–963.
w31x M.S. Cresser, R.F. Browner, A method for investigatingsize distributions of aqueous droplets in the range 0.5–10mm produced by pneumatic nebulizers, Spectrochim.Acta Part B 35(1980) 73–79.
w32x I.I. Stewart, J.W. Olesik, Transient acid effects in induc-tively coupled plasma optical emission spectrometryand inductively coupled plasma mass spectrometry, J.Anal. At. Spectrom. 13(1998) 843–854.
w33x S. Maestre, J. Mora, J.L. Todolı, A. Canals, Evaluation´
of several commercially available spray chambers foruse in inductively coupled plasma atomic emissionspectrometry, J. Anal. At. Spectrom. 14(1999) 61–68.
w34x J.L. Todolı, S. Maestre, J. Mora, A. Canals, V. Hernan-´
dis, The role of the spray chamber in inductivelycoupled plasma atomic emission spectrometry at verylow liquid flow rates, Fresenius J. Anal. Chem. 368(2000) 773–779.
w35x J.W. Olesik, J.A. Kinzer, B. Harkleroad, Inductivelycoupled plasma optical emission spectrometry usingnebulizers with widely different sample consumptionrates, Anal. Chem. 66(1994) 2022–2030.
w36x A.H. Lefebvre, Atomization and Sprays HemispherePublishing Corporation, New York, 1989.
w37x Malvern Instruments, 2600 Laser Diffraction User Man-ual, Malvern, 1987.
w38x J.W. Olesik, L.C. Bates, Characterization of aerosolsproduced by pneumatic nebulizers for inductively cou-pled plasma sample introduction. Effect of liquid andgas flow rates on volume based drop size distributions,Spectrochim. Acta Part B 50(1995) 285–303.
w39x J.W. Olesik, Federation of Analytical Chemistry anSpectroscopy Societies, FACSS, Detroit, Michigan,Paper� 49, 2001.
w40x J.L. Todolı, J.M. Mermet, Influence of the spray cham-´ber design on vapor-based liquid sample introduction atroom temperature in ICP-AES, J. Anal. At. Spectrom.17 (2002) 211–218.
w41x J.M. Mermet, Use of magnesium as a test element forinductively coupled plasma atomic emission-spectrom-etry diagnostics, Anal. Chim. Acta 250(1991) 85–94.
w42x E.H. van Veen, M.T.C. de Loos-Vollebregt, On the useof line intensity ratios and power adjustments to controlmatrix effects in inductively coupled plasma opticalemission spectrometry, J. Anal. At. Spectrom. 14(1999)831–838.
w43x M. Stepan, P. Musil, E. Poussel, J.M. Mermet, Matrix-induced shift effects in axially viewed inductively cou-pled plasma atomic emission spectrometry,Spectrochim. Acta Part B 56(2001) 443–453.
w44x I. Novotny, J.C. Farinas, W. Jia-Liang, E. Poussel, J.M.˜Mermet, Effect of power and carrier gas flow on thetolerance of water loading in inductively coupled plasmaatomic emission spectrometry, Spectrochim. Acta PartB 51 (1996) 1517–1526.
w45x J.L. Todolı, J.M. Mermet, Evaluation of a direct injec-´tion high-efficiency nebulizer(DIHEN) in reference toa high-efficiency nebulizer(HEN) coupled to a cyclonicspray chamber as a liquid sample introduction systemfor ICP-AES, J. Anal. At. Spectrom. 16(2001)514–520.
w46x G. Legere, E.D. Salin, Fast-clearing spray chamber for´ `ICP-AES, Appl. Spectrosc. 48(1994) 761–765.
w47x I.I. Stewart, J.W. Olesik, The effect of nitric acidconcentration and nebulizer gas flow rates on aerosolproperties and transport rates in inductively coupledplasma sample introduction, J. Anal. At. Spectrom. 13(1998) 1249–1256.
w48x J.L. Todolı, J.M. Mermet, Acid interferences in atomic´spectrometry: analyte signal effects and subsequentreduction, Spectrochim. Acta Rev. 54(1999) 895–929.
w49x S. Maestre, J. Mora, L. Gras, J.L. Todolı, Study of the´matrix effects produced by inorganic species in induc-tively coupled plasma atomic emission spectrometrywith several spray chambers, Can. J. Anal. Sci. Spec-trosc. 45(2000) 124–132.
w50x F.J.M.J. Maessen, J. Balke, J.L.M. De Boer, Preservationof accuracy and precision in the analytical practice oflow-power ICP-AES, Spectrochim. Acta Part B 37(1982) 517–526.

1770 S. Maestre et al. / Spectrochimica Acta Part B 57 (2002) 1753–1770
w51x M. Carre, K. Lebas, M. Marichy, M. Mermet, E.´Poussel, J.M. Mermet, Influence of the sample introduc-tion system on acid effects in inductively-coupled plas-ma-atomicemission-spectrometry, Spectrochim. ActaPart B 50(1995) 271–283.
w52x R.I. Botto, Method for correcting for acid and salt
matrix interferences in ICP-AES, Spectrochim. ActaPart B 40(1985) 397–412.
w53x J.L. Todolı, J.M. Mermet, Effect of the spray chamber´design on steady and transient acid interferences ininductively coupled plasma atomic emission spectrom-etry, J. Anal. At. Spectrom. 15(2000) 863–867.