Students' Performance on Institutional Learning Outcomes
187
St. Cloud State University theRepository at St. Cloud State Culminating Projects in Higher Education Administration Department of Educational Leadership and Higher Education 5-2017 Students' Performance on Institutional Learning Outcomes Cheryl R. Norman St. Cloud State University, [email protected] Follow this and additional works at: hps://repository.stcloudstate.edu/hied_etds Part of the Higher Education Commons , and the Higher Education Administration Commons is Dissertation is brought to you for free and open access by the Department of Educational Leadership and Higher Education at theRepository at St. Cloud State. It has been accepted for inclusion in Culminating Projects in Higher Education Administration by an authorized administrator of theRepository at St. Cloud State. For more information, please contact [email protected]. Recommended Citation Norman, Cheryl R., "Students' Performance on Institutional Learning Outcomes" (2017). Culminating Projects in Higher Education Administration. 12. hps://repository.stcloudstate.edu/hied_etds/12
-
Upload
khangminh22 -
Category
Documents
-
view
3 -
download
0
Transcript of Students' Performance on Institutional Learning Outcomes

St. Cloud State UniversitytheRepository at St. Cloud StateCulminating Projects in Higher EducationAdministration
Department of Educational Leadership and HigherEducation
5-2017
Students' Performance on Institutional LearningOutcomesCheryl R. NormanSt. Cloud State University, [email protected]
Follow this and additional works at: https://repository.stcloudstate.edu/hied_etds
Part of the Higher Education Commons, and the Higher Education Administration Commons
This Dissertation is brought to you for free and open access by the Department of Educational Leadership and Higher Education at theRepository at St.Cloud State. It has been accepted for inclusion in Culminating Projects in Higher Education Administration by an authorized administrator oftheRepository at St. Cloud State. For more information, please contact [email protected].
Recommended CitationNorman, Cheryl R., "Students' Performance on Institutional Learning Outcomes" (2017). Culminating Projects in Higher EducationAdministration. 12.https://repository.stcloudstate.edu/hied_etds/12

Students’ Performance on Institutional Learning Outcomes
by
Cheryl Ruth Norman
A Dissertation
Submitted to the Graduate Faculty of
St. Cloud State University
in Partial Fulfillment of the Requirements
for the Degree of
Doctor of Education
in Higher Education Administration
May, 2017
Dissertation Committee:
Michael Mills, Chairperson
Frances Kayona
Steven McCullar
Krista Soria

2
Abstract
In response to increased attention within higher education to develop essential learning
outcomes, faculty and administrators have worked to measure students’ performance in relation
to these outcomes. Students’ learning is often measured through standardized tests or students’
perception of their learning, rather than authentic learning that is connected to the curriculum.
This study incorporated results from one institution’s involvement in the Association of
American Colleges and Universities (AAC&U) project to assess learning outcomes using the
Valid Assessment of Learning in Undergraduate Education (VALUE) rubrics. The learning
outcomes assessed included critical thinking, quantitative literacy, and written communication.
The purpose of this quantitative study was to identify relationships between students’
demographic background characteristics, collegiate experiences, and performance on three
learning outcomes. The independent variables included race/ethnicity, age, gender,
socioeconomic status, program of study, credit hours and degree level. Astin’s I-E-O model was
used as a framework for my study to determine whether students grow or change differently
based on the characteristics students bring to college and what they experience in college, and
compared these variables with their performances on outcomes after exposure to the
environment. The institution was a Midwestern 2-year public community college. Data
collected were analyzed using multiple linear regressions to determine which independent
variables had statistically significant relationships with higher scores on the three learning
outcomes. The findings suggested that health majors and students’ increase in age scored higher
in critical thinking, African American students and business and math majors scored higher in
quantitative literacy, and females and Asian students scored lower in critical thinking.

3
Acknowledgements
This has been an amazing journey to becoming a Doctor of Education in Higher
Education Administration. Thank you to my advisor Dr. Michael Mills for your constructive
feedback, and to my committee members Dr. Frances Kayona and Dr. Steven McCullar. I want
to especially thank Dr. Krista Soria for her support and advice in analyzing the data. I would like
to thank all of the instructors listed above as well as many others in this program for their
passion, insight, and for taking the time to develop me as a future administrator in higher
education. Thank you to my parents, Pearl and Duane, for modeling hard work and for being so
proud of me as I strived to complete my doctoral program. I appreciated the bed and breakfast
you provided each weekend of my classes. Mom, I wish you were here to attend my graduation.
I miss you, and even though you are no longer physically here, your presence will be felt.
Thank you to my children Alexis and Taylor, Clarke and Shelby, Jericho, and Abigail for
your support, love, prayers, and encouragement. I know this has taken so much of my time away
from you and I am incredibly thankful that God has blessed me with each one of you. Thank you
to my sisters, Carolyn and Pam, for the many phone calls that kept me going during my long
drives to and from school as I attended classes. Thank you also for listening to me through the
highs and lows, and encouraging me to keep going. Thank you to Cohort 8, for stretching me in
many ways and opening my mind to many new thoughts and ideas. Thank you to collaborative
Cohort 7, for welcoming me into your classes and writing sessions. Thank you especially to my
husband, Ken. I could not have completed this program or this dissertation without your support
and encouragement. You believed in me even when I did not. You are an amazing, faithful, and
gracious life partner. I love you so much. I am thrilled to be completing this degree just in time
to become grandparents together and welcoming baby boy Jones.

4
Table of Contents
Page
List of Tables……………………………………………………………………………………..7
List of Figures………………………………………………………………………………….…8
Chapter
I. Introduction………………………………………………………………….........9
Statement of the Problem………………………………………………..12
Description and Scope of the Research………………………………….13
Research Question……………………………………………………….19
Purpose of the Study……………………………………………………..20
Assumptions……………………………………………………………..21
Delimitations……………………………………………………………..22
Summary…………………………………………………………………23
II. Literature Review………………………………………………………………..25
Definition of the Assessment of Learning Outcomes……………………27
Historical Impact of the Assessment of Learning Outcomes in
Higher Education………………………………….......................29
Current Trends in the Assessment of Student Learning in Higher
Education………………………………………………………...33
Assessment Tools………………………………………………………..38
Demographics……………………………………………………………43
Theoretical Framework…………………………………………………..63
Relevance of the Synthesis for the Research Project…………………….81

5
Summary…………………………………………………………………83
III. Method…………………………………………………………………………...84
Research Design………………………………………………………….85
Description of the Sample………………………………………………..86
Instruments for Data Collection………………………………………….90
Data Collection Procedures………………………………………………95
Analysis…………………………………………………………………..98
Institutional Review Board Process…………………………………….102
Summary………………………………………………………………..102
IV. Results…………………………………………………………………………..104
Demographic Information………………………………………………105
Testing Multiple Linear Regression Assumptions……………………...110
Multiple Linear Regression Results…………………………………….123
Synthesis………………………………………………………………..131
Summary………………………………………………………………..136
V. Conclusions..……………………………………………………………………137
Conclusions..……………………………………………………………139
Limitations……………………………………………………………...151
Recommendations…….………………………………………………...153
Summary………………………………………………………………..163
References………………………………………………………………………………164
Appendices…………………………………………………………………………...…179
A. Critical Thinking VALUE Rubric………………………………………….179

6
B. Quantitative Literacy VALUE Rubric……………………………………...181
C. Written Communication VALUE Rubric…………………………………..183
D. Institutional Review Board Approval………………………………………185

7
List of Tables
Table Page
1. Comparison of Population and Sample………………………………………………….89
2. Coding Scheme…………………………………………………………………………100
3. Descriptive Statistics for Demographic Independent Variables………………………..107
4. Descriptive Statistics for Dependent Variables………………..……………………….109
5. Critical Thinking Pearson Correlation………………………………………………….112
6. Quantitative Literacy Pearson Correlation……………………………………………...113
7. Written Communication Pearson Correlation…………………………………………..114
8. Model Summary for Critical Thinking…………………………………………………124
9. ANOVA for Critical Thinking………………………………………………………….124
10. Critical Thinking Coefficients………………………………………………………….125
11. Model Summary for Quantitative Literacy………………….………………………….126
12. ANOVA for Quantitative Literacy……………………………………………………..127
13. Quantitative Literacy Coefficients……………………………………………………...127
14. Model Summary for Written Communication………………………………………….128
15. ANOVA for Written Communication………………………………………………….129
16. Written Communication Coefficients…………………………………………………..130
17. Significant Predictive Variables………………………………………………………..133

8
List of Figures
Figures Page
1. Astin’s I-E-O Model……………………………………………………………………..78
2. Histogram of Standardized Residuals in Critical Thinking…………………………….117
3. Histogram of Standardized Residuals in Quantitative Literacy………………………...117
4. Histogram of Standardized Residuals in Written Communication……………………..118
5. Normal P-P plot for Standardized Residuals for Critical Thinking………………….…119
6. Normal P-P plot for Standardized Residuals for Quantitative Literacy………………..119
7. Normal P-P plot for Standardized Residuals for Written Communication……………..120
8. Scatterplot of Standardized Residuals in Critical Thinking…………………………….121
9. Scatterplot of Standardized Residuals in Quantitative Literacy………………………..121
10. Scatterplot of Standardized Residuals in Written Communication…………………….122

9
Chapter I: Introduction
Students’ learning is often measured through standardized tests, students’ self-reported
evaluation of their learning, or the grades that instructors apply to the assignments students
complete that culminates in final semester grades (Berrett, 2016). Those measures of learning
are often faulty because standardized tests are not connected to the curriculum, self-reported
attitudes regarding learning may not be accurate, and grades do not always reflect how much a
student has learned. For decades, higher education has been accused of having a lack of
accountability in measuring student learning. The public places pressure upon higher education
institutions to carry out assessments of what, and how much, students are learning and to ensure
that students are progressing in their learning from point of entry to exit in college (Blaich &
Wise, 2011). Yet, even with this focus on student learning, evidence regarding the factors that
have a positive impact on student learning remains scarce (Stes, Maeyer, Gijbels, & Petegem,
2012).
In response to public pressures and accreditation requirements, higher education
administrators and faculty have worked to establish student learning outcomes—and systems of
assessment for those outcomes—at their institutions. Student learning outcomes assessment in
higher education is designed to evaluate the effectiveness of teaching, while gaining an
understanding of the outcomes students have learned. The assessment and evaluation of teaching
and learning is potentially unclear; therefore, it is beneficial to define assessment of learning
outcomes, consider why we assess learning outcomes, and understand how to use assessment on
college campuses. Accrediting bodies have required higher education institutions to assess
student learning to be accountable in collecting data and transparent in reporting information
regarding student performance on institutional learning outcomes (Blaich & Wise, 2011).

10
According to Berrett (2016), accountability requires proof beyond grade-point averages, that
students have learned something. However, with all of these measures in place, there remains a
gap in the literature regarding evidence of what, and how much, students are actually learning
while enrolled in higher education (Berrett, 2016; Harward, 2007; Kuh, Ikenberry, Ewell,
Hutchings, & Kinzie, 2015).
According to Astin, “outcomes refers to the student’s characteristics after exposure to the
environment” (1993, p. 7). Types of outcomes include intellective and affective domains and
consist of higher-order reasoning and logic as well as student’s attitudes, values, and behaviors
(Astin, 1993). Identifying essential learning outcomes in higher education has developed over
the last three decades (Kuh et al., 2015). The Association of American Colleges & Universities
(2017) has developed essential learning outcomes for liberal education that includes knowledge
of human cultures and the physical natural world, intellectual and practical skills, personal and
social responsibility, and integrative and applied learning. The Wabash National Study of
Liberal Arts Education (2006) included the following outcomes in their study of liberal
education: integration of learning, inclination to inquire and lifelong learning, effective reasoning
and problem solving, moral character, intercultural effectiveness, leadership, and well-being.
The Bringing Theory to Practice Project focuses on deeper levels of framing and describing
outcomes to understand the core purposes of liberal education to determine whether students are
achieving those core outcomes (Harward, 2007). Harward argues that there is a need in
undergraduate learning to assess real learning and development of students in the areas of
argument, critical skills, and analytical and synthetic thinking and expression.
Recent work in the assessment of student learning outcomes has moved from
standardized tests or students’ self-reported evaluation of their learning to the use of rubrics to

11
assess authentic student work (Kuh et al., 2015). Rubrics measure authentic student work
evidenced in homework and papers that students regularly produce to make a fundamental
connection to the daily work of education (Berrett, 2016). The rubric tool offers an approach
that is closer to the action of teaching to assess learning outcomes (Kuh et al.).
According to Kuh et al. (2015), “the process of assessment has taken precedence over the
use of its findings to improve student success and educational effectiveness” (para. 5). To make
any kind of impact on learning, assessment needs to be actionable, concentrated on the use of its
findings, and focused on the needs and interests of its end users. The lack of data analysis of
learning outcomes leads to an absence of actions that would lead to an increase in student
learning (Wabash National Study, 2011). What this implies is that institutions of higher
education are collecting data and not using results to make informed decisions about how
students are learning or what can lead to improvements in learning. A deeper level of attending
to outcomes might involve and lead to a deeper understanding of what, and how much, students
are learning in higher education (Ewell, 2010; Harward, 2007).
My study analyzed previously collected data that assessed three specific institutional
learning outcomes of critical thinking, quantitative literacy and written communication using the
Association of American Colleges and Universities (AAC&U) Valid Assessment of Learning in
Undergraduate Education (VALUE) rubrics. Faculty from this particular institution submitted
student samples taken from class assignments. The VALUE rubrics contain a common
definition and set of criteria, used to score the student samples. My analysis used the raw data
collected to make informed decisions on how student demographics and other characteristics
influence performance on institutional learning outcomes. Results from this study include
implications for theory, practice, and future research.

12
Statement of the Problem
One issue facing student performance on learning outcomes is the fact that individuals
within higher education do not have a clear picture of how to pinpoint how much (or how well)
students learn, and do not use assessment information to improve students’ success (Blaich &
Wise, 2011; Ewell, 2010; Harward, 2007; Tremblay, Lalancette, & Roseveare, 2012). College
and university faculty and administrators are looking for effective ways to support students’
success; however, in the past few decades, the focus has been on retention and completion
initiatives (Kuh, Kinzie, Buckley, Bridges, & Hayek, 2011). The Obama administration pushed
the completion agenda to increase the number of Americans who hold a postsecondary
credential, including an increase in the focus on certificate and associate degrees obtained from
community colleges (Fain, 2016). Despite all this focus, retention rates have not improved over
the years.
According to Tremblay et al. (2012), while it would appear that learning outcomes in
systems of higher education would be important to track and analyze, the data remains scarce in
many higher education institutions. Relatively few college and university personnel are using
assessment data information to communicate the findings to their campus communities, and rarer
still are institutions that are using the information to lead to an increase in student success
(Blaich & Wise, 2011). Meaningful and valuable assessments produce a level of transparency
that allow students to work toward outcome attainment because of attending a particular
institution.
There may be a similar set of institutional learning outcomes across colleges and
universities, but there is not a common definition or set of criterion assigned to institutional
learning outcomes. The nonexistence of common institutional learning outcome definitions and

13
criteria leads to difficulty in comparing data on the assessment of institutional learning outcomes
across institutions. To provide baseline standards for institutions, AAC&U developed the
VALUE rubrics to create common definitions and criteria to measure and compare institutional
learning outcomes across colleges and universities (AAC&U, 2014). The implementation of the
VALUE rubrics across higher educational settings is in its infancy; therefore, there is a lack of
research on the use of this tool to measure student learning. To my knowledge, this is the first
dissertation conducted that reviews student performance on institutional learning outcomes using
the AAC&U VALUE rubrics.
Description and Scope of the Research
Assessment is a means of answering questions about educational best practice, and how
to achieve our educational intentions about what—and how well—students learn (Maki, 2004).
According to Maki (2004), “a systemic and systematic process of examining student work
against our standards of judgment enables us to determine the fit between what we expect our
students to be able to demonstrate or represent and what they actually do demonstrate” (p. 2).
Learning is the foundational knowledge, abilities, values, and attitudes that an institution desires
to develop in students (Maki, 2004). The scope of this research is to identify student
performance represented in authentic student work (identified as artifacts), and scored using the
AAC&U VALUE rubrics. The AAC&U VALUE rubrics create a systematic process to define
what students should be able to demonstrate and to score artifacts to identify students’
performance on learning outcomes.
The study used three learning outcomes that are central to the values and integral to the
work at the institution and includes critical thinking, quantitative literacy, and written
communication. Two of the three learning outcomes, critical thinking and written

14
communication, were core general education competency areas the institution recognized as
institutional learning outcomes. Quantitative literacy, the third learning outcome under study,
was an area of struggle for students at this, and many other, two-year community colleges. In
fact, according to placement testing, 10% of students enter college prepared to enroll in college-
level math courses and 90% test into developmental levels of math (Office of Strategy, Planning
& Accountability, 2016). One of the institution’s strategic priorities, chosen to improve the
quality of education it offers students, was instruction in mathematics. The study was a starting
point in evaluating data to demonstrate how students perform on institutional learning outcomes,
and evaluated significant findings from the data.
Learning is multi-dimensional, revealed in performance over time, and is affected by a
number of demographic and collegiate variables. The study analyzed existing data taken from a
collaborative project that includes five public and five private colleges and universities that used
the AAC&U VALUE rubrics to assess institutional learning outcomes. The rubrics are
assessment tools that include definitions and criteria that involve not only knowledge, but also
values, attitudes, and habits of mind. Student performance measures the “benchmark” starting
point for learning, “milestones” progress accomplished performance, and the “capstone”
culminating level of achievement (Rhodes & Finley, 2013).
According to Goodrich-Andrade (2000), rubrics are easy to use, make sense at a glance,
include clear expectations, and provides student feedback about their strengths and areas of
needed improvement. Instructors use rubrics to evaluate learning outcomes, develop effective
coursework to help students gain knowledge in the intended learning outcome, and provide
students with feedback on specific criteria.

15
The existing data used in the study is from a collaborative project using the AAC&U
VALUE rubrics. It is worth clarifying the distinctions between the AAC&U multi-state project,
the work of the institution, and the significance of my study.
Association of American Colleges and Universities Multi-State Project
The AAC&U Multi-State Collaborative to Advance Quality Student Learning was an
acronym-laden project measuring outcomes to provide insight into student learning (Berrett,
2016). The project included a large-scale, novel approach, with strong faculty support intended
to make a large impact on understanding student performance on important learning outcomes of
a college education (Berrett, 2016). Faculty members from over 100 institutions in 2009
developed the VALUE rubrics under guidance of AAC&U (Berrett, 2016). Rubrics have a scale
ranging from 0-4 to evaluate how students demonstrate various criteria of each outcome. The
project involved 900 faculty members at 80 public two- and four-year institutions in 13 states.
The pilot study assessed 7,000 samples of student work (Carnahan, 2015). According to
Carnahan, the multi-state collaborative in its pilot year “tested the feasibility of cross-state and
cross-institutional efforts to document student achievement without using standardized tests and
without requiring students to do any additional work or testing outside their regular curricular
requirements” (2015, para 5). Data about student achievement of key learning outcomes used a
common rubric-based assessment approach. The data generated has shown limited use in
making decisions that lead to an increase in students’ performance on these learning outcomes.
This project produced the rubrics and outcome criteria used to evaluate the student assignment
artifacts included in this study to assess the three institutional learning outcomes.
State Collaborative Project

16
AAC&U decided to implement a collaborative project within one state. The two-year
community college used in my study was included in a specific pilot endeavor focused on five
private and five public two- and four-year institutions. The institution committed to measure six
outcomes over three years to obtain data on the assessment of student learning. Faculty members
and staff from the ten institutions received training in scoring student work samples. Faculty
members across disciplines at this two-year institution submitted student work samples (artifacts)
that focused on the institutional learning outcomes of critical thinking, quantitative literacy, and
written communication. Artifact submission into TaskStream, a nationwide database, led to
scoring by individuals trained in applying the AAC&U VALUE rubrics. Faculty members from
the institution who submitted student artifacts, received raw scores produced from the rubric
scores tabulated by the trained and calibrated assessors involved in the national study. It was up
to individuals from the institution to analyze the data to determine significant findings that could
lead to improvement of students’ performance on the chosen learning outcomes.

17
This Study
I performed an analysis of how students perform on institutional learning outcomes using
the AAC&U data collected from a Midwestern urban two-year community college. My study
included an analysis of the data to determine significant findings in the relationships between
students’ demographic background characteristics, collegiate experiences, and performance on
three learning outcomes. The three learning outcomes assessed include critical thinking,
quantitative literacy, and written communication. The institution under study participated in a
collaborative project and received raw data through the previously described score attainment.
My study analyzed this raw data. My study included implications for theory, practice, and future
research, found in chapter five.
Conceptual Framework
The American Association for Higher Education (AAHE) developed nine principles of good
practice for assessing student learning (New Leadership Alliance for Student Learning and
Accountability, 2012). These nine principles include:
1. The assessment of student learning begins with educational values.
2. Assessment is most effective when it reflects an understanding of learning as
multidimensional, integrated, and revealed in performance over time.
3. Assessment works best when the programs it seeks to improve have clear, explicitly
stated purposes.
4. Assessment requires attention to outcomes but also, and equally, to the experiences that
lead to those outcomes.
5. Assessment works best when it is ongoing, not episodic.

18
6. Assessment fosters wider improvement when representatives from across the
educational community are involved.
7. Assessment makes a difference when it begins with issues of use and illuminates
questions that people really care about and work toward.
8. Assessment is most likely to lead to improvement when it is part of a larger set of
conditions that promote change.
9. Through assessment, educators meet responsibilities to students and to the public.
(New Leadership Alliance for Student Learning and Accountability, 2012, pp. 10-11)
I worked to be mindful of these nine principles in the conceptual framework, which included the
construction and execution of the study.
The concepts used to guide this discussion included the I-E-O model developed by Astin
(1993), and the research findings of Arum and Roksa (2011), and the Wabash National Study of
Liberal Arts Education (2007), and a number of other recent studies that focused on students’
performance on learning outcomes in higher education. Astin’s I-E-O model formed the
backbone of my study. Astin’s model emphasizes the relationship between inputs (I),
environment (E), and outcomes (O) and is based upon elements designed as far back as 1962.
The basic elements have remained the same over the years and remain relevant today (Astin,
1993). According to Astin (1993), the model takes into account student characteristics as they
enter college (I), the educational experiences to which the student is exposed (E), and student
responses after exposure to the college environment (O). Astin’s I-E-O model worked as a
framework for my study to determine whether students grow or change differently based on the
characteristics students bring to college and what they experience in college, and compare these
variables with their performances on outcomes after exposure to the environment (Astin, 1993).

19
Arum and Roksa (2011), took higher education institutions to task because their research
suggested that students in higher education did not demonstrate significant improvements on
learning outcomes throughout the four-semester span of their study. Arum and Roksa’s (2011)
work served as a framework for components of this study, including the duration of study (as
shown in credits earned) and performance on the AAC&U VALUE rubrics criteria. The Wabash
Study, in their overview of the findings, were surprised and disappointed by the lack of increase
in student’s performance on many outcome measures, and actually observed small declines in
some of the outcomes (Blaich & Wise, 2007). Elements of Wabash Study were used to analyze
students’ performance on three outcome measures, to determine whether or not there is an
alignment in the findings of their study and mine.
Research Question
Booth, Colomb, and Williams (2008) encouraged researchers to identify a research
question by constructing a research topic, question, and significance statements. I developed the
research question for this study through this three-step formula statement: I studied the
assessment of student learning (topic) because I wanted to evaluate the characteristics of the
independent variables (question) in order to evaluate differences in performance in higher
education outcomes (significance). I investigated the following research question:
RQ1. Is there a relationship between students’ background characteristics, collegiate
experiences, and learning outcome scores in critical thinking, quantitative literacy, and
written communication?
Demographic background characteristics included the following variables: race/ethnicity,
age, gender, and socioeconomic status. Collegiate experiences included the following variables:

20
program of study, credit hours and degree level. The inclusion of these variables allowed for an
exploratory study using the AAC&U VALUE rubrics.
Purpose of the Study
The purpose of this study was to examine how students perform on institutional learning
outcomes using the AAC&U VALUE rubrics to determine whether there are significant
differences in students’ performance based upon their background characteristics and collegiate
experiences. The study is significant in that there is little-to-no research on the performance of
students on institutional outcomes using the AAC&U VALUE rubrics to assess learning.
Interest in the topic of student learning outcomes assessment came from the desire to
create an atmosphere around assessment that is valuable, meaningful, and positively impactful on
students’ success. These desires were conceptual desires, rather than evidence-based. Student
acquisition of learning outcomes, intended in coursework, program, and institutional level
competencies, leads to their eventual success (Morante, 2003). The likely result of making
changes based on efforts to improve student learning could lead to successful course completion,
degree completion, transfer to another program or institution, or preparation for the desired field
of employment (Suskie, 2009, pp. 58-59). Meaningful assessment occurs when individuals in
higher education are intentional in how they assess the evidence of student learning (Maki,
2004). The climate and culture around assessment influences the attitude and awareness
students, faculty, staff, and administration develop around assessment practices (Maki, 2004;
Maki, 2015). All of these factors contribute to the value of assessment and the creation of
meaningful assessment practices.
There are several facets of the assessment of student learning that are worth reviewing.
Each faculty member in the program, department or discipline within a higher educational

21
institution collects evidence on how students are performing in that program. Programs gather
evidence in multiple ways. Because there is not a standard for what constitutes evidence of
student learning, it is difficult to compare student learning across disciplines—and especially
difficult to compare across institutions. Often, the focus is on students’ grades as a proxy for
what or how much students’ learn.
This study is significant because the data and findings add to the limited quantitative data
that exists on the assessment of student performance on institutional learning outcomes in higher
education using the AAC&U VALUE rubrics. I drew information from existing data to look at
specific demographics to develop conclusions on significant differences in performance on
institutional learning outcomes. This study represented a deeper investigation into the use of the
VALUE rubrics to assess student learning and add relevant information to the findings
developed by researchers such as Astin (1993), Arum and Roksa (2011), and the Wabash Study
(2007). Additionally, in this study, I determined whether students are showing significant
progress in learning throughout their experience in higher education.
Assumptions of the Study
There are certain factors assumed true for the study; for instance, I assumed that:
1. Instructors followed the procedures set forth by AAC&U in what types of student work
samples (artifacts) were included in the study.
2. Artifact submission reflected authentic student work taken from classroom assignments,
and as a result were a real representation of student learning.
3. A representative sample of student work reflected the population of this Midwestern
urban community college.

22
4. As individuals in this institution brought stakeholders within the campus community
together to participate in implementing the AAC&U VALUE rubrics, the focus was on
intentional assignment design that led to students having the opportunity to learn and
succeed in these learning outcomes
Delimitations
I conducted this study in one community college located in a Midwestern urban area. My
focus was to gain more knowledge regarding the performance of students on institutional
learning outcomes. There were limitations in the data. This study was based on research at one
institution, selected for its participation in the AAC&U project participation. Similarly, the
students’ artifacts evaluated in this study were selected based on specific criteria. Neither
institutional selection nor assignment selection represented random assignments, and the results
of the study had limited generalizability.
The results may not reflect the demographics of other institutions and may not be
generalizable to other higher education institutions. Work samples drawn from disciplines
across this community college were not necessarily representative of the disciplines found in
other higher education settings. This data analysis may not be comparable to other higher
education institutions that have not implemented critical thinking, quantitative literacy, or written
communication as their institutional learning outcomes.
The demographics of this study included variables such as race/ethnicity. It is unrealistic
to view all students within a race/ethnicity as having similar characteristics and experiences
within higher education, and yet the data combined these large student demographic categories.
Large categorical data limits the analysis of results. African American students could include
both individuals born in the United States as well as those born outside the United States. This

23
study did not differentiate Native-born and foreign-born African Americans. Asian Americans
were categorized together even though that may mean individuals were Native Hawaiian,
Samoan American, Korean American, Cambodian American, Hmong American, Vietnamese
American, Indian American, Chinese American, or Filipino American (Poon, Squire, Kodama,
Byrd, Chan, Manzano, Furr, Bushandat, 2016).
Summary
As higher education continues its focus on the development and improvement of student
learning, there is a continued accountability to measure institutional learning outcomes. There is
a problem across institutions nationally in defining learning outcomes, developing criteria to
measure learning outcomes, and collecting data to reflect what and how much students are
learning. The lack of information on student performance on institutional learning outcomes,
combined with Arum and Roksa’s (2011) and Wabash (2007) findings that students do not show
significant gains in learning, leads to the importance of this study to not only measure learning,
but to also determine whether or not students are making gains in their learning.
In the literature review, I address the historical impact and current trends in the
assessment of learning, examine the assessment tools used in higher education to evaluate
student learning, and review each of the demographic variables under research. A review of the
literature provided me with a glimpse into the framing of the problem and a foundation to
understand the breadth of the study and possible implications of the findings. In chapter two, I
include a review of Astin’s I-E-O model (1993), Arum and Roksa’s (2011) findings, the Wabash
National Study (2007), and a number of additional studies to compare the results found in the
studies regarding the progress of student learning.

24

25
Chapter II: Literature Review
The practice of evaluating student learning has been around countless years and, while
evaluation has transformed from oral recitation and tests to multidimensional, holistic measures
of students’ learning, the assessment of learning outcomes as a movement continues to expand
(Bresciani, Gardner, & Hickmott, 2009; Erwin, 1991; Ewell, 2002; Saunders, 2011). Instructors
in higher education have traditionally evaluated student learning within the confines of their
courses to make judgments on student learning, usually to assign a grade to reflect the level of
knowledge acquired. There has been a shift in higher education to incorporate not only course
learning outcomes, but also institutional learning outcomes that students should attain in higher
education (Erwin, 1991; Ewell, 2002). A review of the impact of the assessment of institutional
learning outcomes requires a definition of assessment, a review of how students learn in higher
education, the current findings related to demographic differences in students’ learning, and
research into theories related to student learning outcomes that inform my study and bring
insights to assessment practitioners.
Institutions, employers, and students themselves may prefer different sets of learning
outcomes they feel are essential as a result of attending college. Faculty members, within the
parameters set by their higher educational institution, decide what is meaningful and valuable in
their coursework (Gray, 2002). The outcomes employers like to see students demonstrate may
lie in sharp contrast with what students entering the workforce are prepared to demonstrate
(Jankowski, Hutchings, Ewell, Kinzie, & Kuh, 2013). More than 75% of employers call for
emphasis in critical thinking, complex problem-solving, written and oral communication, and
applied knowledge in real-world settings (Hart Research Associates, 2013). In fact, Hart
Research Associates (2013) found that nearly all employers, 93%, agreed that the capacity to

26
think critically, communicate clearly, and solve problems was more important than an
undergraduate degree. Outcomes for students may include the social aspects of life in college
and have nothing to do with the knowledge and skills learned in the classroom. This diverse and
differing view of elements essential in higher education has led to the adoption of institutional
learning outcomes to help bring clarity to what students can expect to learn in their higher
education experience.
According to Arum and Roksa (2011), stakeholders in higher education include students,
parents of students, and administrators in higher education; business leaders and future
employers; faculty and staff at higher education institutions; and legislators, among others. The
stakeholders are concerned over undergraduate learning; specifically, the return on their
investment in higher education, and whether graduates have acquired the necessary skills to be
competitive in the workplace (Arum & Roksa, 2011). According to the Secretary of Education’s
Commission on the Future of Higher Education, known as the Spellings Commission,
“unacceptable numbers of college graduates enter the workforce without the skills employers say
they need in an economy where, as the truism holds correctly, knowledge matters more than
ever” (2006, p. x).
Institutional learning outcomes draw from an institution’s mission, purpose, and values to
provide meaningful experiences for students as they complete a degree (Maki, 2004). Astin’s I-
E-O model considers student inputs, the educational environment, and student outcomes after
exposure to the environment. Researchers study the impact of college attendance on the
development of the individual, and critics question whether students are actually learning from
their collegiate experiences (Astin, 1993). Arum and Roksa (2011) examined students’ learning
in higher education, from the beginning of their first year college experience through the end of

27
their second year of college, and drew conclusions that students complete their degrees not really
having learned much from their experience. Before exploring a theoretical framework, it is
beneficial to define learning outcomes and assessment, examine the history of assessment of
student learning to better understand current issues of today, and consider the change in
demographics in higher education and the impact demographics have on student learning.
Definition of the Assessment of Learning Outcomes
Individuals in higher learning institutions develop learning outcome statements that
“describe what students should demonstrate, represent, or produce in relation to how and what
they have learned” (Maki, 2004, p. 60). According to Shireman (2016), student outcomes are
“quantifiable indicators of knowledge acquired, skills learned, and degrees attained, and so on”
(para. 6). Institutional learning outcomes are developed across an institution, collectively
accepted, and quantitatively and/or qualitatively assessed during a student’s educational
experience (Maki, 2004). The most beneficial evidence of learning comes from authentic
student coursework found in papers, written examinations, projects, and presentations, rather
than fabricated outcome measures obtained through standardized tests or student surveys not
directly connected to the curriculum (Shireman, 2016).
The definition of the assessment of learning has taken on many forms. According to
Ewell (2002), assessment can refer to “processes used to determine an individual’s mastery of
complex abilities, generally through observed performance” or “large scale assessment used to
benchmark school and district performance in the name of accountability,” or “program
evaluation to gather evidence to improve curricula or pedagogy” (p. 9). These definitions of the
assessment of student learning speak to the process of accountability and improvement of the
student or program performance. Baker (2004) defined assessment from an accreditation

28
viewpoint stating that “institutions are evaluated with regard to the manner and degree to which
they fulfill their missions and goals…a determination of the institution’s success and quality in
achieving its intended educational and institutional outcomes” (p. 8). Erwin (1991) preferred a
more general definition of the assessment of student learning, stating that it is “undertaken so
that institutions can document students’ progress in higher education – in other words, the
‘outcome’ after their exposure to college” (p. 2). Erwin (1991) does go on to a more specific
definition of the assessment of student learning as “the process of defining, selecting, designing,
collecting, analyzing, interpreting, and using information to increase students’ learning and
development” (p. 15). Bresciani et al. (2009) express the importance of establishing common
terminology and define assessment of learning in higher education as “outcomes-based
assessment is about improving student success and informing improvements in the practice of
student services and programming” (p. 15).
For the purposes of this study, the American Association of Colleges and Universities
(AAC&U) Valid Assessment of Learning in Undergraduate Education (VALUE) rubrics define
critical thinking, quantitative literacy, and written communication. The VALUE rubrics include
criteria that will outline what students should demonstrate in relation to how and what they have
learned. The outcomes data used for this study was collected through scoring of student artifacts
using the VALUE rubrics to evaluate student performance. The study reflected Erwin’s general
definition of the assessment of learning in higher education to reveal student performance on
institutional learning outcomes undertaken to document student learning to replicate Astin’s I-E-
O model, the outcome after exposure to college.
Historical Impact of the Assessment of Learning Outcomes in Higher Education

29
The history of how student learning has been assessed in higher education has an impact
on the current trends and future direction of the assessment of learning. Assessment of learning
is not a new idea. As far back as Plato and Aristotle, oral recitation has been used to demonstrate
learning and “as early as 1063 CE, the University of Bologna used ‘juried reviews’ to
demonstrate student learning” (Bresciani et al., 2009, p. 3). Bresciani et al. found that in the
colonial era, learning assessment remained within the classroom environment. Throughout
history, the most common assessments of learning were oral reports and written exams, often
followed by immediate and critical feedback (Thelin, 2011). Assessment of learning in the
United States in the 1930s and 1940s focused on traditionally aged college students who lived in
campus dormitories and evaluated how students were motivated to learn (Bresciani et al.).
Reaction to concerns in the K-12 educational setting spurred assessment of learning in
higher education in the 1980s. The U.S. Department of Education was concerned over a lack of
success in K-12 education and a key group of stakeholders wrote a report, A Nation at Risk, to
call for more accountability to evaluate student performance and address weaknesses in our
schools (Ewell, 2002). The policy reports Time for Results and Involvement in Learning
represented the response in higher education to the K-12 concerns and centered on examining
learning outcomes and improvement of teaching and learning (Bresciani et al., 2009; Ewell,
2002; Kuh, 2011; Wright, 2002). Reports concerning educational assessment and accountability
encouraged institutions to learn from assessment and use the feedback to make institutional
changes leading to student success.
Mandates calling for assessment of learning, thought to be a passing fad in higher
education, were largely ignored (Bresciani et al., 2009). The directives of the 1980s demanding
accountability turned into assessment as a movement in the 1990s, now embedded into the

30
framework of higher education (Bresciani et al.; Erwin, 1991; Saunders, 2011). Policymakers
and legislators became involved and both the state and federal legislators demanded greater
accountability within higher education and began asking for evidence of learning in higher
education (Bresciani et al.). Accrediting agencies in the new millennium renewed efforts
demanding proof of outcomes-based assessment, standards embedded in instruction to map
coursework to learning outcomes, a process for defining learning inside and outside the
classroom, and methods and tools that would provide tangible and useful results (Bresciani et
al.).
Although assessment and evaluation of student learning has been around for centuries,
the First National Conference on Assessment in Higher Education, sponsored by the National
Institute of Education and the American Association for Higher Education, was not held until
1985 in Columbia, South Carolina (Bresciani et al., 2009; Ewell, 2002). This conference
resulted in a recommendation that “high expectations be established for students, that students be
involved in active learning environments, and that students be provided with prompt and useful
feedback” (Ewell, 2002, p. 7). The first assessment conference was just the beginning. The
conference initiated a greater involvement of accrediting agencies as the vehicle that demanded
institutions to show evidence of learning outcomes assessment, and a plan of action to improve
learning at the course, program, and institutional levels. The review of program assessment was
a natural result of this conference (Ewell, 2002).
According to Black and Kline (2002), program review has been in existence, in a variety
of forms, over a century prior to the first assessment conference in 1985. As far back as the
1800s, Horace Mann evaluated curriculum in the teacher-training program that is the first model,
now referred to as program review (Black & Kline, 2002). Mann submitted annual reports

31
between 1838 and 1850 that were not what we would classify as learning outcomes, but
contained information on issues such as “geographic distribution of schools, teacher training,
financial support for poor students, and selection of an appropriate curriculum,” which don’t
sound like learning outcomes (p. 224). As a result of concerns that faculty were not engaging
students in an efficient manner, Joseph Rice in 1895-1905 followed Mann’s efforts and
developed standardized tests to assess teacher training and student engagement (p. 224). Ralph
Tyler, 1932-1940, focused on learning outcomes to review a program and “made some of the
first formal linkages between outcomes measures and desired learning outcomes” (p. 226).
Beginning in the 1980s, and continuing on to today, recommendations for key elements
in program review include such things as embedding a locally based institutional review of
learning linked to the mission statement, having a clear purpose to enhance program quality,
involving stakeholders in a way that is systematic and ongoing, and containing a focus on
continuous improvement (Black & Kline, 2002). Each state is independent in what it requires of
program review, leading to a greater involvement of accrediting agencies in holding institutions
accountable for their practices in the assessment of learning.
The First National Conference on Assessment in Higher Education in 1985 required
accrediting agencies throughout the United States to revise their procedures to place greater
emphasis on assessment as a form of institutional accountability (Wright, 2002). The Southern
Association of Colleges and Schools in 1986 took the lead in linking outcomes assessment to
institutional effectiveness, and the Western Association of Schools and Colleges followed their
lead in the same year (p. 242). In 1989, North Central Association called for a self-study in all of
their institutions to assess student achievement (p. 242). The Middle States Association had been
asking for “evidence of outcomes since 1953, but enforcement was lax until the word assumed

32
new importance in the context of the late 1980s” (p. 243). The Northwestern Association
adopted a policy on assessment in the early 1990s, and in 1992, the New England Association
moved to include a mandate to assess all eleven of its standards (Wright, 2002).
Not only nationally, but globally, higher education institutions have experienced “clearer
accountability to governments and society at large to ensure quality and cost-efficient operation”
(Tremblay, Lalancette, & Roseveare, 2012, p. 29). Higher education institutions are under
pressure to improve the quality of their teaching. A number of countries have some degree of
performance-based funding and external quality evaluations (Tremblay et al.). Global ranking
tools have led to growing emphasis on transparency and accountability and demands for colleges
and universities to engage in the assessment of learning outcomes (Tremblay et al.). While
assessment of learning outcomes has previously been internal, and accreditors were content with
colleges and universities trying to complete assessment, this is no longer sufficient (Tremblay et
al.). According to Sullivan (2015), state and federal policy and governmental entities are
“mobilizing to provide metrics about access, affordability, completion, and job-related outcomes
such as earnings, but it is clear that these metrics will say nothing significant about student
learning” (p.3). Current efforts work to provide metrics that provide data on student learning in
higher education.
Current Trends in the Assessment of Student Learning in Higher Education
The central emphasis of the assessment of student learning in higher education has
changed from a focus on instruction to a focus on learning (Tremblay et al., 2012). Where
assessment of learning in higher education previously focused on how students received the
means to learn, it now focuses on ways to support the learning process by whatever means work
best for the student (Tremblay et al.). This has led to a student-focused approach, rather than an

33
instructor-focused approach to evaluating learning in the classroom. Assessment of learning is
encouraged to evaluate the innovative methods of teaching that involves students as active
learners rather than passive receivers of knowledge. This emphasis is to understand teaching and
learning to identify effective teaching strategies and test new ideas to enhance learning outcomes
(Tremblay et al.).
Globally, there has been a growing focus on the assessment of student learning outcomes.
The shift from input-based concepts, such as the number of classes taken and student workload,
to outcome-based assessment is seen throughout Europe and the United States today (Tremblay
et al., 2012). According to the Bologna Declaration of twenty-nine ministers of education in
June of 1999, the charge of these ministers of education resulted in a key commitment for
Europe to write all higher education modules and programs in terms of learning outcomes by
2010 (Bologna Secretariat, 1999). According to Tremblay et al., in the 2008 Assessment of
Higher Education Learning Outcomes (AHELO) feasibility study, the Organization for
Economic Co-operation and Development conducted an initiative to assess whether it is possible
to develop international measures of learning outcomes in higher education.
The beginning of the second decade of the 21st century presented a similar shift, to
learning outcomes assessment, in the United States as was seen in Europe (Tremblay et al.,
2012). Outcome assessment appeared in the new vision of the Association of American Colleges
and Universities (AAC&U) Liberal Education and America’s Promise (LEAP) initiative
launched to outline “essential learning outcomes that contemporary college students need to
master in both general education and the major” (Tremblay et al., p. 36). The Lumina
Foundation (2011) presented the Degree Qualification Profiles to encourage implementation of
quality assurance, accountability and transparency provisions in the assessment of learning

34
outcomes. The Degree Qualification Profiles is a U.S. version of the Bologna-based degree
framework (Tremblay et al.). According to Maki, “In 2007, AAC&U launched the Valid
Assessment of Learning in Undergraduate Education (VALUE) project in order to develop an
approach to assessing student progress in achieving the LEAP Essential Learning Outcomes”
(2015, p. 1). According to Maki (2015),
The identification of the LEAP Essential Learning Outcomes represents a “first” in
American higher education. For the first time, faculty and other educational professionals
from across representative two-year and four-year colleges and universities collaborated
to articulate what contemporary higher education institutions commonly expect students
to demonstrate because of a liberal education. Of even greater national significance is the
collaborative nature of the development of the aligned VALUE rubrics and the
“mainstreaming” of the criteria and standards of judgment. (p. 1)
Local, national, and global accountability in learning outcomes assessment methods
previously driven by changing workforce needs, increase engagement in the global economy,
and growth of knowledge through technology (Maki, 2015). Employer surveys reflect the
complex needs of the workplace with 91% of employers asking employees to take on a broader
set of skills, 90% of employers ask employees to coordinate with other departments, and 88% of
employers believe that employees need higher levels of learning and knowledge to succeed (Hart
Research Associates, 2010). According to the 2013 Hart Research Associates, employers today
would like to see an increase in complex learning outcomes such as critical and creative thinking,
ethical reasoning, global learning, innovation, and collaboration.
Another trend in higher education is the transparency and accountability of reporting
learning outcome assessment. Transparency in student success rates provide a clear picture of

35
which institutions graduate students and have a greater rate of employment. In reality, the
impact of accreditation has helped to sustain assessment of learning across institutions, but the
assessment of institutional outcomes has also strengthened accrediting agencies (Wright, 2002).
The foundation of the assessment report is to ensure quality at the course, program, and
institutional level through accountability. The report on the assessment of student learning is not
an end in itself. The report is an institution’s opportunity to conduct a self-study as an “ongoing
process that leads to continuous quality improvement in student knowledge, skills and abilities”
(Saunders, 2011, p. 37). The institutional self-study provides a chance for the institution to
reflect on findings from the assessments and implement change that enhances student success.
Assessment of learning involves the evaluation of course, program, and institutional
outcomes; and whether students can demonstrate mastery of the skills outlined in the learning
outcomes. Institutions in higher education ask programs to clarify action steps that lead toward
continuous improvement. These action items include changes in course design to lead to an
increase in student success and completion of a program of study. Participation in the
assessment of learning keeps the power in the hands of the faculty because faculty members
decide what is meaningful and valuable to evaluate in their coursework (Gray, 2002).
Assessment of learning requires a collaborative effort in bringing together faculty across
discipline areas, and sets the tone for administrative involvement to add to the climate and
culture surrounding the assessment of learning outcomes.
Assessment of learning should be conceptual, looking at the assessment of learning as an
instrument of persuasion; in both adding meaning and validity to the success of the students, and
in collecting data to support what has largely been a narrative analysis of program review. The
assessment of learning leads to the central concept, which is foundational in the assessment

36
process, of ‘assessment as learning’ rather than limiting it to the assessment of learning (Loacker,
Cromwell, & O’Brien, 1985, para. 3). Assessment as learning keeps the focus on how the
faculty and institution use assessment results to serve the learner.
The difficulty is in taking assessment from a concept or theory to finding evidence that
assessment leads to institutional and student learning improvements. Unfortunately, the Wabash
Study found that gathering data, even with the complicated longitudinal method employed, was
easier than using the information to improve student learning (Blaich & Wise, 2011). According
to Blaich and Wise (2011),
Although all nineteen institutions from the first cohort of the Wabash National Study in
2006 worked extraordinarily hard to collect data multiple times from students, nearly
40% of the institutions have yet to communicate the findings of the study to their campus
communities, and only about a quarter of the institutions have engaged in any active
response to the data. (p. 3)
Researchers from the Wabash National Study of Liberal Arts Education learned that most
Institutions had more than enough actionable assessment evidence, that was either well known
by individuals or was tucked away unnoticed among data collected previously, to make informed
decisions to respond to the findings (Blaich & Wise, 2011). Most institutions have little
experience in reviewing and making sense of the learning outcomes assessment data, how to
follow-up on findings, and how to make changes that could lead to an increase in learning
(Blaich & Wise, 2011).
What can be done to have these important findings rise above the busy environments
found in education and move beyond the grading and programming to lead to data driven
continuous improvement? According to Blaich and Wise (2011), for assessment to have an

37
impact, it must rise out of extended conversations across the institution among people wanting to
know about their teaching and learning environment and what assessment evidence is revealing
about their demographics. According to Blaich and Wise (2011), assessment of learning
outcomes, done correctly, is “using assessment to improve student learning in an entirely public
process in which people with different levels of experience and different intellectual
backgrounds must work together toward a common end” (p. 5).
The current trends in assessment of institutional outcomes are not without issues and
challenges. Current assessment issues have implications for students, faculty, administration,
and the institution as a whole. Individuals within institutions should demonstrate a commitment
to assessment and are accountable by accrediting agencies that seek evidence of institution-wide,
program-level, and course-level student learning. Ten years after the Bologna Declaration, the
vision of using the assessment of learning outcomes throughout Europe actually occurred in only
a few countries, which led to the reaffirmation of the importance of including the attainment of
learning outcomes in assessment procedures (Tremblay et al., 2012). According to the Wabash
National Study (2011), the lack of using the assessment of learning outcomes in Europe is also
prevalent in the United States as demonstrated by the lack of using the assessment results to
make informed decisions that would lead to an increase in student learning.
A significant issue found in the current trends in the assessment of learning outcomes can
be found in the lack of clarity in how to assess, when to assess, or how the evidence is, or is not,
used for improvement in student learning. There can be conflicting ideas of what assessment is
and does as well as how to assess for abstract learning concepts. New innovations in the future,
like linking graduation requirements to achievement of learning outcomes rather than the credit
hour, may demand new forms of assessment (Penn, 2011). There may be factors contributing to

38
student success, not currently assessed in and out of the classroom. Challenges in assessment
include ever-changing institutional, faculty, and student culture. The historical factors, current
trends, issues and challenges influence learning outcomes of today and the possibilities of the
future. It is necessary to review assessment tools used to collect evidence of student learning.
Assessment Tools
Current trends in assessment call for a design of innovative assessment tools with an
emphasis on transferable, complex, cross-discipline student learning outcomes (Penn, 2011).
According to Sternberg (2011), “hundreds of institutions and entire state systems of higher
education now assess learning in college via a standardized test” (para. 2). Some of the
approaches used to assess learning outcomes in college today include performance assessments
such as capstone projects, licensure exams, student portfolios, field experiences, surveys,
interviews and focus groups, and general knowledge and skills measures (Nunley, Bers, and
Manning, 2011).
Some of the tools used to assess student learning in higher education include the
Collegiate Learning Assessment (CLA), the ACT Collegiate Assessment of Academic
Proficiency (CAAP), and the ETS Proficiency Profile (ETS-PP). These standardized instruments
provide content developed by external experts, quantitative methods of interpreting student
achievement, quick and easy administration and objective scoring, and a history of validity and
reliability studies (Maki, 2004). The Association of American Colleges and Universities
(AAC&U) Valid Assessment of Learning in Undergraduate Education (VALUE) rubrics were
developed as an alternative to standardized tests or student surveys to assess and evaluate student
learning.

39
Although the CLA, CAAP, and ETS-PP have been widely used throughout higher
education to assess student learning, there has also been criticism of these assessment
instruments. According to Berrett (2016), the CLA, CAAP, and ETS-PP have attracted
widespread interest, but disconnect from authentic student coursework and do little to drive
improvement of student learning. Critics of the CLA question the validity of standardized testing
rather than using authentic student work samples to measure learning in higher education (Arum
& Roksa, 2011). The CLA, and standardized testing in general, does not “focus on the specific
knowledge taught in particular courses and majors” (Arum & Roksa, 2011, p. 25). The CAAP,
an ACT product, measures reading, writing, mathematics, science, and critical thinking
(Sternberg, 2011). The ETS-PP (formerly MAPP) measures “critical thinking, reading, writing,
and mathematics in the context of the humanities, social sciences, and natural sciences”
(Sternberg, 2011, para. 3). The CAAP and ETS-PP, are known to be valid and reliable, but fail
to have “sufficient breadth to adequately serve as measures of learning in college” (Sternberg,
2011, para. 4). In other words, any of these tests used alone are too narrow to serve as an
institution’s only measure of institutional learning outcomes.
Using standardized tests such as the CAAP or the ETS-PP, fails to measure student
learning that is diverse or covers the breadth and depth of discipline-specific knowledge
(Lederman, 2013). Standardized instruments do not provide evidence of the strategies and
processes students draw upon to apply learning (Maki, 2004). Standardized tests as measures of
student learning do not accurately portray student attainment or provide useful and meaningful
information (Lederman, 2013). According to Sullivan (2015), “A standardized test of students’
reasoning and communication skills cannot probe their highest skill levels because applied
learning takes such different forms in different fields” (p. 4). Standardized tests, used alone to
40
measure student learning, are inadequate to measure individual or institutional progress
(Sullivan, 2015). The Wabash Study uses several different instruments and surveys to measure
learning, but admit that these measures are not as authentic as papers, projects, and exams
students complete in their work at their institutions (Blaich & Wise, 2007).
The AAC&U VALUE rubric is an alternative assessment tool that uses authentic student
work to measure learning outcomes (Lederman, 2013). The AAC&U VALUE rubrics report
institutional-level results for outcomes such as critical thinking and written communication. The
benefit of the VALUE rubrics is that even though they are not standardized, the results can be
reported using a numerical scheme (Lederman, 2013). The AAC&U VALUE rubrics allows for
the use of authentic student work that varies from student to student and program to program, yet
allows for comparisons between programs and even institutions (Lederman, 2013). Authentic
assessment methods provide a representation of integrated learning, alignment with students’
learning experiences, and opportunities to demonstrate learning, as opposed to test-generated
occasions (Maki, 2004).
Institutions struggle with how to assess for abstract learning outcomes such as critical
thinking or cultural competence (Nunley et al., 2011). AAC&U used a process that examined
existing campus rubrics and related documents to develop criteria for each learning outcome
(Rhodes, 2010). The AAC&U VALUE rubrics assess abstract learning outcomes such as critical
thinking, intercultural competence, teamwork, and global learning. Authentic student work,
collected and scored using the AAC&U VALUE rubrics, contain both concrete and abstract
outcomes. Criticism of authentic assessment methods for not providing easily quantifiable
evidence and efficient scoring methods, are absent in this study using the AAC&U VALUE
rubrics to quantify evidence and efficiently score artifacts (Maki, 2004). The assessment of

41
authentic student work is a viable alternative to standardized tests or the use of surveys that ask
students to self-report what they believe they have learned.
The VALUE rubrics, designed for use at any institution, are not based on institutional
size, type, location, or mission. According to Maki (2015), the rubrics monitor progress based
on assignments developed that encourage students to apply their learning across their
experiences. The performance indicators provide a rating scale from benchmark to milestone to
capstone. The advantage of the rubrics is that they can be adapted to the level of the learner and
can be used for a wide range of assignments. According to Rhodes (2011),
The VALUE rubrics were developed as broad, institutional level, or “meta” rubrics and
we recognize that rubric use at program, disciplinary or even classroom levels requires
adapting the rubrics with more specific language and purposes. For example, using
rubrics to grade assignments does not necessitate the need for precise, psychometric
methods. In developing and testing the rubrics, the faculty and professional staff
development teams anchored the demonstrated learning for students at the entry and exit
points for degree attainment. To provide signposts that learning was moving in the
desired direction, milestones were developed between the benchmark—where rubric
developers found their students’ current performance on average—and the capstone—
where rubric developers hoped their students would be to attain a baccalaureate degree.
(para. 5)
In summary, a review of the assessment tools used in higher education examined
standardized tests such as the CLA, CAAP, and ETS-PP to compare to the VALUE rubrics used
in this study. Although widely used, these standardized tests fail to connect to authentic student
coursework. The use of the AAC&U VALUE rubrics has the potential to measure authentic

42
assignments such as papers, projects, and exams students complete in their coursework at their
institutions and allow for comparisons between programs and even institutions.

43
Demographics
The demographics of students enrolled in higher education has become increasingly
diverse. There has been a shift in enrollment from the elite to mass, even universal in some
countries. Access and participation in higher education in the United States, according to
Tremblay et al. (2012), “is the growing heterogeneity of students in terms of their socio-
economic background, academic ability and preparedness, career expectations, motivation and
engagement” (p. 20). The expanding demographic diversity across most institutions presents
new challenges and opportunities. The realities of expanding diversity present itself in areas
such as the variability of students’ levels of college readiness or preparation, gaps in
postsecondary graduation attainment between certain race/ethnicities, uneven course-taking
patterns resulting in financial or personal limitations, and varying levels of English-language
fluency (Maki, 2015).
Assessment efforts that focus on creating measures to compare outcomes of students
between institutions fail to encompass the complex range of student learning and experiences
that occur between demographic groups within institutions. According to Blaich and Wise
(2011), “The variation among students within the Wabash National Study institutions is vastly
larger than the median differences between institutions” (p. 1). In other words, comparing
student performance on institutional learning outcomes within an institution will produce greater
variability than results between institutions. Even if an institution has greater than average
growth on a particular outcome, such as critical thinking, chances are that many of the students
within certain demographics found within an institution will not have grown as much, or may
have even declined in their performance on a particular outcome such as critical thinking (Blaich
& Wise, 2011).

44
Cultural diversity is the number of diverse groups represented in an organization; the
higher the number of diverse groups result only in an increase in the probability that students
from different backgrounds will interact (Gurin, Dey, Hurtado & Gurin, 2002). Structural
diversity does not guarantee meaningful interaction or the creation of an equitable environment
(Gurin et al., 2002, p. 334). Gurin et al. (2002) found that traditional students are at a critical
developmental stage in which diversity has an impact on learning outcomes.
Student demographic variables affect student learning as certain demographics link to
lower levels of academic preparedness and success. According to Arum and Roksa (2011),
“inequalities at the point of entry into higher education are not surprising, given the pervasive
disparities in the K-12 system” (p. 38). Arum and Roksa, in their study using the College
Learning Assessment (CLA), found that students whose parents had no college experience lag
behind those whose parents had graduate or professional degrees. According to Arum and
Roksa, “This pattern suggests that higher education in general reproduces social inequality”
(2011, p. 40).
Race/Ethnicity
For decades, higher education institutions have struggled to create an equitable
environment. The 1954 Brown v. Board of Education case, though it addresses admission to
elementary and secondary schools, also applies to a protection against discrimination in higher
education as well (Kaplin & Lee, 2014). The inequities and injustices of discrimination in higher
education are still wrestled with sixty years later in today’s postsecondary setting (Thelin, 2011).
According to the National Center for Education Statistics (2013), researchers found that of the
first time, full-time bachelor’s degree-seeking students who matriculated in 2006, 62.5% of
white students and 70.6% of Asian students completed a bachelor’s degree within six years. In

45
contrast, 40.2% of black students, and 40.2% of American Indian/Alaska Native students
completed a bachelor’s degree within six years (National Center for Education Statistics, 2013).
The Office of Management and Budget (OMB) revised the guidelines on racial/ethnicity
used by the federal government to the five categories of American Indian or Alaska Native,
Asian, Black or African American, Native Hawaiian or Other Pacific Islander, and White” (Ross,
Kena, Rathbun, Kewal-Ramani, Zhang, Kristapovich, & Manning, 2012). According to Ross et
al. (2012), “It is important to note that Hispanic origin is an ethnicity rather than a race, and
therefore persons of Hispanic origin may be of any race” (p. 1). I will include the following
race/ethnicities in my study: Hispanic, African American, Asian, Native American and
Caucasian. The rapid increase in student diversity found in colleges and universities has helped
to expand the notion that studying these diverse students will lead to better understanding of their
learning gains and gaps in higher education (Thelin, 2011).
Hispanic. Hispanic-serving colleges may well have begun before 1992, but not
designated as Hispanic-serving until then (Schmidt, 2003). According to Schmidt, over two
hundred and forty colleges in the United States “have been designated ‘Hispanic-serving
institutions’ by the federal government, meaning that at least a quarter of their enrollment is
Hispanic” (para. 5). The Hispanic enrollment in higher education has dramatically increased
since 2000 (Samuel & Scott, 2014). The Hispanic population first increased in states such as
California, Arizona, Texas, and New Mexico, and then migrated across states and represent more
than 12% of college enrollments nationwide (Thelin, 2011). Hispanic enrollment in higher
education is projected to increase by 46% between 2009 and 2020 (Maki, 2015).
Despite this increase in enrollment, Hispanic students have the lowest chance of
completing college of all ethnic groups (Garibaldi, 2014; Samuel & Scott, 2014). The Hispanic

46
population, and their rising rates of student enrollment and performance in higher education, has
become the subject of a growing body of research in the area of minority student performance
(Samuel & Scott, 2014).
Hispanic students’ obtain significantly smaller critical thinking scores on standardized
tests compared to their White counterparts (Terenzini, Springer, Yaeger, Pascarella, & Nora,
1994). The net disadvantage accruing to Latino students, relative to White students, was about
six percentile points (Terenzini et al., 1994). Pascarella and Terenzini (2005), note that the lack
of growth in critical thinking skills adversely affect Hispanic students more than in any other
student demographic.
According to Schmidt (2003), “By the age of 17, Hispanic high-school students, on
average, have the same reading and mathematics skills as white 13-year-olds” (para. 22).
Hispanic students are less likely to take college-prep courses, more likely to drop out of school,
and less likely to have had a parent who attended college (Schmidt, 2003). Hispanic students are
less likely to make it to upper-division courses, earn a bachelor’s degree, and have the lowest
rate of graduate-school enrollment (Schmidt, 2003). Hispanic students are far more likely to
attend a two-year college, yet not likely reflected in the demographics of college faculty or
administrators (Schmidt, 2003).
African American. In addition to the rising concern of college access and outcomes for
the growing Hispanic population, the ongoing concern regarding African American student
success is, and has been, heavily researched. Black students remain underrepresented in the
population of American college students (Harper, 2006). Black students have lower graduation
rates than White and Asian students (Schmidt, 2003). According to the American Council on
Education, at the turn of the century only 40% of eligible Black students went to college, with

47
only 46% of those who attended colleges or universities graduating within six years (Grier-Reed,
2008).
African American students made significantly smaller gains in standardized scores in
critical thinking than did White students (Terenzini et al., 1994). Specifically, the disadvantage
for African-American students in critical thinking was about .16 of a standard deviation (six
percentile points) in the first year of college and about .18 of a standard deviation (seven
percentile points) after three years of college (Terenzini et al., 1994).
According to Flowers (2003), the White student sample self-reported greater gains in
science and technology and intellectual and writing skills than African American students.
African American students, according to the Flowers study, had a lower level of reading
comprehension in standardized measures during the students’ first year of college. These low
measures in reading increased in magnitude during the students’ third year of college, when
African American students’ scores were attenuated compared to White peers.
A recent edition of the Journal of Blacks in Higher Education (2015) informs institutions
of higher learning that the black student graduation rate has increased three percentage points in
the last year. However, the current black student graduation rate of 42% remains twenty
percentage points below the graduation rate for White students, which is reported at 62% (JBHE
Foundation, 2015). According to Garibaldi (2014), two-year colleges enroll more than 40% of
all black students, but only 45% of black students complete their degree.
According to Arum and Roksa (2011) in their study using the College Learning
Assessment (CLA) tool, “the gap between African-American and white students was particularly
stark: African-American students lagged almost one standard deviation (or thirty-four percentile
points) behind their white peers when they entered college” (p. 38). Not only do African

48
American students enter college with lower CLA scores, but they also gain less over time and the
gap between African American and white students widen over time (Arum & Roksa, 2011).
According to Arum and Roksa (2011),
Although African-American students on average were more likely to attend schools that
had 70% or more minority students, took fewer advanced placement courses, and
performed less well on college admission tests, these differences only partially explained
their lower rate of progress on skills measured by the CLA during the first two years of
college. (p. 111)
Other factors that lead to the increase in CLA gap between African American and white students
include lower socioeconomic status, lower academic preparation at entry into higher education,
and lower faculty expectations and demands (Arum & Roksa, 2011).
A Pascarella, Edison, Nora, Hagedorn, & Terenzini (1995/1996) study did find that
attending a two-year institution prior to a four-year institution had positive effects on reading
comprehension and mathematics for African American students, but negative effects for white
students.
Overall, a nurturing environment for black students is likely to have a positive impact on
black student retention and graduation rates (JBHE Foundation, 2015). Support services are
essential in order to lead to higher retention and completion rates. According to Willie,
Garibaldi, and Reed (1991), in order for black students to succeed in higher education it is
necessary to have resources such as outreach programs, flexible admission requirements,
availability of a variety of financial aid packages, and mentoring. Fifteen years later, the charge
of Willie, Garibaldi and Reed still holds true today; black students in higher education need wrap

49
around support to succeed in college. According to Harper (2006), “between 1977 and 2003,
black male degree attainment increased by an average of 0.2 percentage points” (p. vii).
African American enrollment in higher education projects an increase of 25% between
2009 and 2020 (Maki, 2015). With this continued increase in enrollment of black students in
higher education, colleges have a responsibility to provide academic resources to ensure African
American students attain institutional learning outcomes necessary to successfully complete their
program of study and receive their degrees.
Asian. Asian American populations have changed the complexion of higher education in
the United States due to a massive influx of students (Roach, 2001). Asian Americans are twice
as likely as African Americans, and two-thirds as likely as Latinos, to have at least a bachelor’s
degree (Shireman, 2016). Of all immigrants, both men and women, with a bachelor’s degree
only 9% are Hispanic and 30% black, as opposed to 54% white immigrants and 63% Asian
(Baum & Flores, 2011). Half of all Hispanic immigrants do not have a high school diploma and
that percentage goes down to 5% of Asian and white immigrants who do not have a high school
diploma (Baum & Flores, 2011). Asian Pacific Islander enrollment projects an increase by 25%
between 2009 and 2020 (Maki, 2015).
The term ‘Asian’ is extremely broad, and there are a number of stereotypes to address.
One stereotype classifies Asian Americans and Pacific Islanders (AAPIs) as a hardworking high
achieving racial group (Poon et al., 2016). Data such as college entry tests may suggest AAPIs
are achieving high levels of educational success, which leads to the misconception that when
AAPIs fail it is due to individual deficits (Poon et al.). According to Poon et al., high-test scores
of Asian American students lead to inappropriately joining this group with Whites to call
attention to the test score achievement gap between Black and Latino students relative to White

50
students. The stereotype of high performance of Asian Americans completely disregards the
Asian Americans experience in higher education and results in the omission of AAPIs in policy
discourse on racial inequalities (Poon et al.). Recent research is beginning to present data on
deficiencies and disparities of Asian American subgroups, specifically Pacific Islanders and
Southeast Asian Americans (Poon et al.). Misconceptions fail to recognize the diversity within
the Asian classification.
To complicate the Asian American experience in higher education, this category includes
a wide variety of cultures. Asian Americans, typically not regionally situated, attend a wide
range of institutions across the United States (Chang, Park, Lin, Poon, & Nakanishi, 2007).
Asian Americans are an extremely diverse population with tremendous variations in ethnicity
and socioeconomic class (Chang et al.). Some of the categories within the Asian classification
may include, but are not limited to, Native Hawaiian, Samoan American, Korean American,
Cambodian American, Hmong American, Vietnamese American, Indian American, Chinese
American, and Filipino American (Poon et al., 2016). It is unrealistic to view all of these
categories as having similar characteristics and experiences within higher education. The trends
in college enrollment does not support the claim that Asian Americans find universal success in
higher education, as there are a number of obstacles yet to overcome to not only gain access, but
to also complete a degree in higher education (Chang et al.).
Even with the increased levels of Asian students – compared with other students of color
– in much of the research, the findings of a recent study by Liu and Roohr (2013) found an
unexpected decline in performance of Asian students at community colleges. The 10-year study
found a decline in reading, math, and critical thinking for Asian students. Liu and Roohr believe
that this decline in performance may be due to the fact that there has been an increase of first-

51
generation immigrants attending community college over the last 10 years. Another reason, as
presented above, may be due to the considerable variation among students from different parts of
Asia. This incredibly diverse population may find differences in parental education levels,
family expectations and value on education, language proficiency, and pre-college achievement
levels.
Native American. Native American appears in the literature as American Indian,
Alaskan Native, and Native Hawaiian. According to Campbell (2016), Native American
students are among ethnic groups with the lowest completion rates, and lowest performance on
learning outcomes in higher education, than other ethnic groups except Hispanics. Native
American students are more likely than White students to have social risk factors, low academic
preparation for college, be first generation enrolled in college, enroll in a community college,
come from a lower socioeconomic status, and have lower average SAT and ACT scores
(Freeman & Fox, 2005). According to Freeman and Fox (2005), American Indians compose
“only about 1 percent of the total college university enrollment in 2002, an increase from 0.7
percent in 1976” (p. 112).
Faculty, staff, and administrators in higher education are unprepared to work with Native
American students. The majority of faculty and administrators in higher education are not Native
American, and the curriculum and environment are not culturally relevant to meet the needs of
Native American students (Campbell, 2016). Community college personnel fail to work with
Native American students to develop educational pathways to career, find programs in a field of
study that fit their needs, or recognize their educational achievement and success (Campbell,
2016). Campbell’s study (2016), found that performance on learning outcomes would increase
by offering a higher number of courses that introduced Native American culture in hopes to

52
enable Native American students to feel more visible and less singled out. According to
Campbell, offering faculty pedagogical training on “issues relevant to Native American students,
such as historical trauma and social conventions, would help build an understanding between
non-Native American faculty and Native American students” (2016, p. 364).
Caucasian. White students are the racial majority in higher education. The rate of
employment and degrees earned is higher among white citizens of the United States than any
other people group (Ross et al., 2012). Compared to students of color, white students are more
likely to have a bachelor’s degree, higher standardized test scores, completed rigorous college-
preparatory courses, parents who attended college, attended college full-time, gone on to
graduate school, spoken English as their native language, and enrolled in college right after high
school (Schmidt, 2003). According to Schmidt (2003), white students are less likely to live in
poverty and less likely to be required to enroll in remedial coursework at the college or
university level.
Although there is a recognized gap in the college completion rate between students of
color and white students, student success is lagging for all low-income students and students
with disabilities, regardless of race and ethnicity (Kuh, Kinzie, Buckley, Bridges, & Hayek,
2011). According to Kuh et al. (2011), “It is also possible that White first-generation students –
especially those from low-income family backgrounds – experience conflicts and challenges
similar to those of first-generation ethnic minority students” (p. 15).
Age
Higher education has shown an increase in students aged twenty-five and older and a
proportionate decrease in students aged twenty-four and younger (Brock, 2010). The traditional
student often refers to an individual that enrolls within a year from high school graduation

53
(Brock, 2010). The nontraditional mature student is often defined differently by researchers
(Fragoso, Goncalves, Ribeiro, Monteiro, Quitas, Bago, Fonseca, & Santos, 2013).
Nontraditional mature students often have employment and family responsibilities that influence
their college experience (Fragoso et al.). More mature students may struggle with returning to
school after spending a number of years away from education. The nontraditional student group
is increasing in higher education today and may be changing to become the traditional student
(Brock, 2010).
According to Hoskins, Newstead, and Dennis (2006), age was a significant predictor of
performance. Sheard (2009) conducted a 2-year correlational study to examine whether age
(gender and hardiness were also included in the study) predicted university final degree grade
point average. Sheard (2009) tracked data from 134 university undergraduate students and found
that mature-age students achieved higher final degree GPA compared to younger undergraduates.
Gender
Using demographic information to understand the barriers to success requires
consideration of racial and ethnic minorities as well as gender considerations. Male gender is a
growing area of disparity and concern, especially within minority student populations. Through
examination of the enrollment rates of each racial group, Garibaldi (2014) reports that the
number of women attending college in the United States in 2012 was significantly higher than in
2002. The increase in enrollment is modest for Caucasian (7.3%), Asian (16.7%) and American
Indian women (4.1%) (Garibaldi, 2014). There are dramatic increases in African American
(48.2%) and Hispanic (79.2%) women which represents a trend that, while promising for
women, causes concern for the male counterparts in these two racial groups (Garibaldi, 2014).

54
The percentage of females with immediate postsecondary enrollment was higher than that
of males for several race/ethnicities; including White, Hispanic, and Asian students (Ross et al.,
2012). There is a disparity of success in higher education between black men and black women.
According to Garibaldi (2007), “women of all races are receiving more undergraduate, graduate
and first-professional degrees than men” (p. 331). The graduation gap in bachelor’s degrees
earned by black men and women grow larger each year (Garibaldi, 2007). Between 1993-1994
and 2003-2004, black women earned a larger number of bachelor’s degrees, with an increase of
62.7% for women compared to 40.6% for men (Garibaldi, 2007). Gender gaps in Black men and
women are also becoming larger in elementary, secondary, and postsecondary educational
settings (Garibaldi, 2007).
College enrollment of women, between 1959 and 2002, increased 29% for women and
only 8% for men (Kuh et al., 2011). The number of bachelor’s degrees were higher for men in
1970, compared to 2001 when women earned a majority of bachelor’s degrees (Kuh et al., 2011).
Women score higher on high school grades, and have widened the reading scores and narrowed
the gap in math scores on standardized tests (Kuh et al., 2011). Globally, women slightly
outnumber men with about 51% of global enrollments in higher education (Tremblay et al.,
2012).
Using the CLA to assess learning, women and men demonstrate the same level of skills
in learning outcomes such as critical thinking, complex reasoning, and writing skills (Arum &
Roksa, 2011). It is interesting to note that in sharp contrast to the inequalities of racial and
socioeconomic status in performance on the CLA, gender demonstrated the same level of
performance on the CLA at entrance into college and as women and men progress through

55
college (Arum & Roksa, 2011). Age and gender has an impact on student success, though not as
direct a link to performance in higher education as socioeconomic status.
Pell-Eligibility
Related to racial and ethnic demographics, socioeconomic status is another important
variable of today’s college student. According to Kuh et al. (2011), “Rigorous academic
preparation, high educational aspirations, and family support are easier to come by if the family
has economic resources” (p. 24). Academic performance increases as family income increases,
and is evident directly through resources available in the home and indirectly through social
capital needed to succeed in school (Kuh et al., 2011). Family socioeconomic status and funding
from property taxes influence access to the type of school and classroom, instructional materials,
teacher experience, and teacher-student ratios (Kuh et al., 2011). All of these factors, influenced
by families with higher socioeconomic status and school districts with an increase in funding
from property taxes, lead to higher performance on learning outcomes.
The American Psychological Association (2015), measures socioeconomic status (SES)
through a combination of education, income and occupation. SES is the numerical variable used
to indicate the social class of people. Pascarella and Terenzini (2005) identify that even after
controlling for race and gender, students’ SES and income background remains significantly
related to persistence in college. According to Fowler and Boylan (2010), any non-academic,
personal factors including financial and work issues, affect students’ performance and ultimately
their ability to persist. For example, students who are struggling financially often decide to take
on two or more jobs while studying, to cope with their financial burden. The lack of persistence
in college students coming from low socioeconomic status transfers to low performance on
institutional learning outcomes for this demographic.

56
According to Arum and Roksa (2011), the majority of college students receive some sort
of financial aid, and 65% of the students in their sample reported working while in college.
African-American students, Hispanic students, and students coming from less educated families
report working more hours per week than white students coming from more educated families
(Arum & Roksa, 2011). African American students rely more heavily on grants and loans to
cover college expenses (Arum & Roksa, 2011). Asian students took out the lowest percentage of
student loans to cover college expenses (Arum & Roksa, 2011).
Perna and Swail (2001) explained the link between low income and persistence by
asserting that those low-income students have a corresponding lower persistence/graduation rates
than their higher income counterparts. The link between low income and persistence rates may
imply directly that with access to finances, these students would persist at a higher rate, based on
the added financial access (Perna & Swail, 2001). However, Heller’s (2002) study found that
access to financial aid does not ensure persistence rate for low-income students.
A family with economic resources show an increase in performance in higher education
due to the kind of school and classroom environment to which they had access and the number of
resources found in the home (Kuh et al., 2011). The proportion of students who attend college is
lower for those with a lower income. A low-income student may be worse off financially for
having attended a college or university because they are less likely to have earned a degree and,
because of attending college have student loans to repay (Kuh et al., 2011). Low-income
students are less like to attend a four-year university because they are more expensive to attend
than a two-year community college (Kuh et al., 2011). Low-income students are less likely to
take the steps necessary, such as college preparation classes and entrance exams, to lead them to
enroll in four-year universities (Kuh et al., 2011).

57
For most low-income students the path to completing their bachelor’s degree is long,
indirect and uncertain (Engle & Tinto, 2008). Many low-income students do not complete their
degree. Low-income students disproportionately come from lower levels of academic
preparation and are from ethnic and racial minority backgrounds (Engle & Tinto, 2008). These
students tend to be older and do not receive financial support from parents, have families they
support, and work while attending college (Engle & Tinto, 2008). The opportunity to complete a
degree has not increased and, unfortunately, the segregation of low-income students has not seen
significant changes over time (Engle & Tinto, 2008). Socioeconomic status is interesting to view
in light of patterns found in the performance on student learning outcomes. The low results for
low-income students found in all areas mentioned reflect in similar low-results for low-income
students in the area of performance on institutional learning outcomes. As mentioned, a large
indicator of student success centers more on socioeconomic status than any other demographic
(Borman & Dowling, 2010). Achievement of learning outcomes for students of all race and
ethnicities increase as their income increases (Borman & Dowling, 2010). Socioeconomic status
has an impact on a student’s choice of program of study, which can affect performance on
student learning outcomes.
According to Lightweis (2014), “there is little research conducted on first-generation
white students who come from a working-class background” (p. 461). Similar to all first
generation students, low-income white students are just as likely to drop out of college because
of their low socioeconomic status (Kuh et al., 2011). Inequalities in education remain. As
evidenced in the literature, white students have a higher rate of student success in higher
education than students of color have in higher education. Yet, even after taking into account
race and ethnicity, a large indicator of student success centers on socioeconomic status (Borman

58
& Dowling, 2010). Achievement outcomes for students of all race and ethnicities increase as
their income increases (Borman & Dowling, 2010). This suggests that going to a high poverty
school can have a profound impact on a student’s achievement outcomes, which goes beyond
minority status (Borman & Dowling, 2010).
Program of Study
At the Midwest urban two-year college under study, students declare their field, or
program, of study. Arum and Roksa (2011), report notable patterns between program of study
and performance on the CLA. Students enrolled in the social sciences, humanities, science and
mathematics programs have higher CLA scores than students in other college majors (Arum &
Roksa, 2011). Students enrolled in business or education have the lowest performance on the
CLA (Arum & Roksa, 2011). Arum and Roksa also note that students in health, social science,
humanities, science, and math are more likely to expect to pursue further education, such as
doctorate or professional degrees, and score higher in critical thinking and writing. While
students in business, education and social service fields do not expect to pursue further education
and score lower in critical thinking and writing (Arum & Roksa, 2011).
Pascarella and Terenzini (2005), found it difficult to form any firm conclusion
concerning the impact of program of study and scores on standardized critical thinking measures.
A number of studies find it is difficult to determine if program of study or other experiences
cause the differences in scores on critical thinking (McDonough, 1997; Money, 1997; Sebrell &
Erwin, 1998; Spaulding & Kleiner, 1992). Studies have found it difficult to determine if
different academic fields of study tend to attract students with different levels of critical thinking
skills or if experiences in the major cause the differences in critical thinking skills (Gadzella &
Masten, 1998; Gunn, 1993). Pascarella and Terenzini (1991) found that science majors started

59
out with higher critical thinking scores. Pascarella and Terenzini (2005) found it difficult to
define academic major, which may contribute to inconsistent findings.
Students in some programs of study may perform higher on some learning outcomes than
others, based on the content emphasis in their discipline areas (Arum & Roksa, 2011). For
instance, some programs emphasize oral rather than written communication. Or, we may expect
students in math and science courses to score higher than other students in quantitative literacy
as opposed to written communication.
Kugelmass and Ready (2011) found, in their study of academic programs, that critical
thinking development was more likely a function of practices within each program of study than
between majors or fields. Comparing one program of study with another has shown that
disciplinary context has a greater influence on critical thinking development than a comparison
between disciplines (or programs of study). For instance, a small percent of variance (under
10%) in critical thinking could be explained by students’ program of study. Kim and Sax (2011)
found that the relationship of students with faculty members within different programs of study
had a greater influence on the development of critical thinking than program of study. For
instance, research on student engagement with faculty found increased development of critical
thinking with students in the following demographic areas: Latinos, Asian Americans, Whites,
males, females, and middle-class and upper-class students (Kim & Sax, 2011). According to
studies, increases in critical thinking occurs when faculty members have open channels of
communication, treat students more equitably, provide prompt feedback to students, clearly
articulate course and program requirements, and support student viewpoints (Kim & Sax, 2011;
Pike & Killian, 2001). According to Kim and Sax (2011), it is interactions within programs of
study, rather than particular academic programs, that is associated with critical thinking gains.

60
Credit Hours
Arum and Roksa (2011) found that a significant number of students did not demonstrate
much improvement in a number of learning outcomes between their first semester of college
enrollment and the end of their second year. Arum and Roksa (2011) used the same students in a
longitudinal study.
Pascarella and Terenzini (1991) found that students’ exposure to postsecondary education
increased verbal, quantitative, oral, and written skills as well as analytical skills and critical
thinking. It is interesting to note that Pascarella and Terenzini (2005), in their second volume of
How College Affects Students, uncovered inconsistent findings and conclusions from their
previous synthesis of the literature and did not see the same gains from freshmen to senior
progress as they did in research presented in their earlier edition. The most recent edition of
How College Affects Students, examined the public discourse questioning the value of higher
education and students’ development of designated learning outcomes (Pascarella, Mayhew,
Rockenbach, Bowman, Seifert, Wolniak, & Terenzini, 2016). The most recent edition found
that, even though it was a focus of their research, there are few studies that examine the extent to
which students change during college. Where previous research compared students who had
attended college with students who had not, current studies focused on the extent students’
progress through their collegiate experience (Pascarella et al., 2016). According to Pascarella et
al., “since the previous volume, scholars are asking more questions about why college affects
students that if college affects students” (p. 10). The challenge in the most recent volume is that
the assumption of student change was followed up with very few longitudinal studies that
tracked student progress throughout their college experience (Pascarella et al.).
Degree Levels

61
Students choose coursework based on individual preference or by a college’s general
education requirement, remediation requirements, or program of study in the degree that students
are seeking (Arum & Roksa, 2011). Coursework varies in the degree requirements examined by
Arum and Roksa (2011). For instance, students in humanities and social sciences reported taking
courses with higher reading and writing requirements (Arum & Roksa, 2011). Students in
science, mathematics and liberal arts core courses reported low likelihood of taking courses with
high reading and writing requirements (Arum & Roksa, 2011). Students in business, education,
social work, engineering and computer science courses also reported lower levels of reading and
writing requirements (Arum & Roksa, 2011).
Similar to programs of study, this research examined the types of degrees’ students are
earning and how this affects performance on institutional learning outcomes. Students who
earned an associate’s degree may perform higher on some learning outcomes than students who
earned a certificate. As a result, students may score higher on one learning outcome than
another. The reading, writing and mathematical requirements found in specific degrees are
interesting to note as the learning outcomes measured in this study include Critical Thinking,
Quantitative Literacy, and Written Communication.
Summary
In reviewing the variables found in the study, it is clear that higher education has become
increasingly diverse. Student access and participation in higher education has led to a growing
number of students entering college from diverse race/ethnicities, socioeconomic backgrounds,
and ages. Students are entering college with a wide range of options in programs to study and
degree levels to obtain. With this increase in diversity comes attention on student success within

62
demographic categories. Students of color are completing degrees at a lower rate than white
students. Achievement in learning outcomes for all students is a growing concern.

63
Theoretical Framework
The review of the literature by Pascarella and Terenzini (2005), concluded that students
made significant gains in subject matter knowledge and became more critical, reflective, and
sophisticated thinkers. They found that students’ exposure to postsecondary education appeared
to enhance general verbal, quantitative, oral communication, written communication, analytic,
critical thinking, and reasoning skills. Pascarella and Terenzini qualified this by stating that it
was important to know how students change or grow during the undergraduate years because
college graduates did not always perform well. According to Pascarella and Terenzini (2005),
“not all students develop(ed) as critical thinkers during college” (p. 158).
The earlier works of Pascarella and Terenzini (1991) and Astin (1977) did not include an
assessment of student’s cognitive development measured on standardized tests and surveys, data
on the characteristics of each institution’s general education program, measures of student peer
groups, and characteristics of the faculty at each institution. Astin’s newer book (1993) assessed
how students are affected by their colleges in how to understand how students change,
developing a model for studying student outcomes, and designing an analysis of college impact.
The issue Astin (1993) explored in his research included “what difference college attendance
makes in the development of the individual” (p. 5).
A review of the literature provided an opportunity to see whether research agrees with
Pascarella and Terenzini’s (1991) claim that exposure to postsecondary education enhance select
student learning outcomes. The first and second volumes of the Pascarella and Terenzini texts
(1991, 2005), focused on the impact of college attendance on student outcomes and compared
this with students who did not attend college. The current review in volume three focused on the
relationship between students’ exposure to college measured in terms of credit hours completed,

64
class standing, or a comparison between students in their freshman and senior years (Pascarella
et al., 2016). According to Pascarella et al., “we found that exposure to postsecondary education
had a positive association with student learning and development, controlling for a multitude of
potentially confounding influences” (p. 36). The synthesis of the literature presented in volume
3 found: credit hours completed had a small positive relationship with reading comprehension
(Bray, Pascarella, and Pierson, 2004); credit hours had a positive association using standardized
assessments of reading, writing, math, and critical thinking (Lakin, Elliot, & Liu, 2012); credit
hours had a positive impact on students’ ETS Proficiency Profile total scores and all subscores
(Liu and Roohr, 2013); and class standing and students’ overall self-reported gains on the NSSE
found a consistently larger effect size for sophomores, junior, and seniors when compared to
freshmen (Pike, Kuh, & Gonyea, 2003).
My examination of the literature focused on results of learning outcome research found in
the VALUE Report 2017, Liu and Roohr’s (2013) learning outcome research at community
colleges, the Wabash National Study of Liberal Arts Education, the findings of Arum and Roksa
(2011) that students are academically adrift, and Bok’s (2008) findings on underachieving
colleges. The theoretical framework used in this study will center on Astin’s I-E-O model.
VALUE Report 2017
It is essential to note that late in my dissertation writing a report came out from AAC&U,
On Solid Ground: Value Report 2017, that included results from the first two years of the
VALUE rubric initiative. While the report was not published in time to guide this research, it is
important to include it here in the review of the literature. The report includes much of what is
found in this study: an explanation of the development and testing of the VALUE rubrics, the
process of gathering authentic student work samples (artifacts), the scoring of artifacts using the

65
rubrics, the use of a submission platform called TaskStream to allow scoring of artifacts by
nationally calibrated scorers, and the results of the study. The report states that the VALUE
rubrics were designed to focus on an assets-based, rather than a deficit-based, approach that
builds on what a student can do rather, than determining the skills that a student is lacking
(VALUE report, 2017, p. 26). The rubrics work from the assumption that all students have the
potential to achieve the capstone level outlined on each of the rubrics.
Results presented in the 2017 report, of artifacts gathered in 2016, involved the following
for 2-year institutions: critical thinking included 840 artifacts, quantitative literacy included 576
artifacts, and written communication included 919 artifacts (VALUE report, 2017, p. 36). Data
was also available for 4-year institutions, but not reported here. Key findings suggest that the
strongest performance was in written communication, yet students had the lowest scores in the
use of evidence to support their writing (VALUE report, 2017, p. 4). In critical thinking students
demonstrate strength in explaining issues and presenting evidence related to issues, yet struggled
to draw conclusion or place issues in a meaningful context (VALUE report, 2017, p. 4).
Quantitative literacy skills revealed strength in calculating and interpreting data, but difficulty in
applying knowledge (VALUE report, 2017, p. 4).
The report only included artifacts from students who had completed 75% of the credit
hours required for their program of study. According to the VALUE report (2017), students at 2-
year institutions with 45 credit hours or more had completed 75% of their program of study. The
report indicated that the findings suggested that the focus on core learning outcomes supports
enhanced levels of higher order achievement across critical thinking, quantitative literacy, and
written communication (VALUE report, 2017, p. 4). It is interesting to note that for students
who were in the final portion of their 2-year associate’s degree, there remained a high percentage

66
(8-50%) of the students that were below the benchmark level and received a zero score. This
could mean that the student was not asked to demonstrate that particular criterion, or it could
mean that the student did not exhibit any evidence of learning for that specific criterion (VALUE
report, 2017, p. 9). So we do not know how to accurately interpret that result. It may or may not
suggest that students were actually showing proficiency in these learning outcomes.
The VALUE Report (2017) surveyed chief academic officers at institutions involved in
the project, and 85% of the respondents reported that their institution had articulated institutional
learning outcomes, but only 9% believed that their students know about these learning outcomes.
Nearly all respondents believe their institution tracks retention and completion rates, but only
70% report tracking students’ achievement of learning outcomes, and only 17% reported that
they disaggregated data based on demographics such as race/ethnicity and socioeconomic status
(VALUE report, 2017, p. 49). Nearly a third of the respondents reported having set equity goals
for student learning that are aligned with demographic characteristics, yet only 17% disaggregate
the data they collect to better understand achievement of learning outcomes across different
demographic populations (VALUE report, 2017, p. 49). Even after reporting the lack of
institutions to disaggregate the data based on demographics, the VALUE report failed to present
data that disaggregated the data based on demographics.

67
Learning Outcome Research at Community Colleges
Research conducted by Liu and Roohr (2013), focused on evaluating student learning
outcomes to see if community colleges are providing adequate training to students. The study
investigated students from 13 community colleges over the course of ten years (2001-2010) to
assess learning in reading, writing, mathematics, and critical thinking. The study examined
students’ number of credit hours to classify students as having completed zero credits, less than
30 credits, 61-90 credits, and greater than 90 credits. According to Liu and Roohr (2013), “For
comparison purposes, we also included students from 8 research universities (n = 68,045), 13
comprehensive colleges and universities (n = 120,269), and 11 liberal arts colleges (n =52,245)”
(p. 15). The total number of students included in the study was 286,961; this number compared
community college students to students from other colleges and universities (Liu & Roohr, 2013,
p. 15).
The study used the ETS Proficiency Profile to assess college-level learning outcomes
(Liu & Roohr, 2013). As presented earlier, the ETS-PP has been widely used throughout higher
education to assess student learning, but this assessment tool is disconnected from authentic
student coursework. The ETS-PP measures critical thinking, reading, writing, and mathematics
in the context of the humanities, social sciences, and natural sciences. The standard form,
containing 108 questions in each skill area, and the short form, with 27 questions in each skills
area was administered in about 2 hours and 40 minutes (Liu & Roohr, 2013, p. 14). A critique of
the ETS-PP is that it is known to be valid and reliable, but does not have breadth and depth to
adequately serve as measures of authentic student learning in college or provide evidence of how
students apply learning.

68
The researchers conducted an analysis of covariance (ANCOVA) to examine
performance between community college and the other institutional types, with the number of
credit hours used as an indicator of the amount of college-level experience (Liu & Roohr, 2013,
p. 17). The outcome variables were the EPP total and subscale scores examined in three
different time periods of 2001, 2005, and 2010 (Liu and Roohr, 2013, p. 17). A stepwise
regression analysis was conducted using the total test score as the dependent variable and
included a number of predictors (Liu & Roohr, 2013).
Results of both total and subscale scores on the EPP – when controlling for the number of
college credit hours – revealed that differences in performance between research universities and
community colleges widened during this 10 year span, differences between comprehensive
colleges and community colleges narrowed, and community colleges outperformed liberal arts
colleges during this 10 year span (Liu & Roohr, 2013, p. 18). Results of the EPP total and
subscale scores of student performance within research universities improved, students within
both comprehensive and liberal arts colleges resulted in a decrease in performance, and students
in community colleges remained stable (Liu & Roohr, 2013, p. 19). The results in relation to
performance and number of credit hours completed at research universities revealed that as
students completed more credit hours they showed an increase in performance in critical
thinking, quantitative literacy, and written communication (Liu & Roohr, 2013). Students at
community colleges started at a lower performance level than the other types of colleges, but
caught up and even exceeded liberal art students (Liu & Roohr, 2013, p. 20). Female students’
performed higher than males in written communication and lower than males in mathematics.
The researchers attempted to further understand the differences between community
colleges and other types of institutions by evaluating ACT and SAT scores and high school GPA

69
between 2001 and 2010. What the researchers found was that such data were not available for
community colleges because these types of institutions are all open admission and do not track
this data.
Using White students as the reference group, African American students performed
lowest on the total score, Asian student performance decreased consistently over the 10 years,
and Hispanic student performance increased (Liu & Roohr, 2013, p. 26). Specific subscale
scores found: White and African American students’ performance remained relatively stable
over 10 years in reading and writing with small increases on critical thinking; African American
students declined in mathematics; Asian students declined in reading, mathematics, and critical
thinking, and remained stable in writing; Hispanic students increased in all four subscales with
largest improvement in critical thinking (Liu & Roohr, 2013, p. 26)
In summary, the results of this study revealed that community college students caught up
with, and in some areas, outperformed students from liberal arts colleges (Liu & Roohr, 2013).
Other results indicated that community college students made significant improvements in
critical thinking over the last 10 years, the gender performance gap widened at community
colleges with women performing lower than men, the overall performance gap widened between
white students outperforming students of color at community colleges, and Asian students
showed declining performance in all of the learning outcomes.

70
Wabash National Study of Liberal Arts Education
The Wabash National Study of Liberal Arts Education (WNSLAE) consisted of a large-
scale mixed-methods longitudinal study to investigate factors that affect the outcomes of liberal
arts education. The WNSLAE involved 19 campuses, surveyed 4500 students throughout the
United States and interviewed 315 students at six institutions of the 19 campuses involved in this
study (Blaich & Wise, 2007; Goodman, Baxter, Seifert, & King, 2011; King, Baxter, Barber,
Perez, & Taylor, 2012; Pascarella & Blaich, 2013). Surveying over 4,000 students offers the
breadth of a quantitative research method and interviewing over 300 students offers the depth of
a qualitative research method (Goodman et al.). Many articles have been written in response to
the findings from the Wabash Study. Most of the published findings only use findings from the
cohort in the sample from 2006, however, two additional cohorts began the study in 2007 and
2008 (King et al., 2012).
This type of mixed methods research approach provided multiple lenses to evaluate
student learning. According to Goodman et al., “Two teams of researchers simultaneously
gathered qualitative and quantitative data based on different aspects of the same research
question: What are the practices and conditions that foster student learning on liberal education
outcomes?” (2011, p. 2). Seven outcomes under study include integration of learning,
inclination to inquire and lifelong learning, leadership, well-being, intercultural effectiveness,
moral character, and effective reasoning and problem solving (Blaich & Wise, 2007).
According to King et al. (2012), the outcomes tied to liberal arts education are distinctive
because of the connection between outcomes that incorporate cognitive development as well as
interpersonal and intrapersonal development.

71
The quantitative portion included the following instruments: the CAAP Critical Thinking
Test, the Defining Issues Test-2, the Ryff Scales of Psychological Well-Being, the Socially
Responsible Leadership Scale, the Miville-Guzman Universality-Diversity Scale, the Orientation
toward Learning Scale, the Life Goals Scale, and the Need for Cognition Scale (Blaich & Wise,
2007; Goodman et al., 2011; King et al., 2012; Pascarella & Blaich, 2013). The CAAP Critical
Thinking test determines improvement on a variety of critical thinking outcomes. The Defining
Issues Test-2 measures moral reasoning. The Ryff Scale of Psychological Well-Being and the
Socially Responsible Leadership Scale measure well-being and leadership. The Miville-Guzman
Universality-Diversity Scale and the Orientation toward Learning Scale measure students’
attitudes about diversity. The Life Goals Scale and the Need for Cognition Scale measure
academic motivation, community involvement, and professional success. The quantitative
instruments administered to students suggest connections between educational practices
associated with outcomes that influence student learning (Goodman et al.).
The qualitative portion involved student interviews to identify educational experiences
that foster development of outcomes and explore how students develop because of their
collegiate experiences (Blaich & Wise, 2007). Three hundred fifteen students who participated
in the quantitative survey component were interviewed in the fall of 2006, 228 were interviewed
again in the fall of 2007, 204 in fall of 2008, and 177 in fall of 2009 (King et al., 2012).
Interviews lasted 60 to 90 minutes and participants received a $30 stipend per interview.
Interviews consisted of an initial portion focused on how students’ entering characteristics
influenced achievement and development, a second section explored the educational experiences
students’ identified as most significant impacting their experiences, and a third section addressed
students’ synthesis and patterns of experiences. Interviewing students offered a forum to add

72
meaning to the practices students viewed as central to their learning experiences (Goodman et
al., 2011).
The 2006 sample consisted of incoming first-year, full-time, undergraduate students at 17
four-year colleges and universities and 2 two-year colleges (King et al., 2012). Students’ at large
institutions were randomly selected to participate, and at small institutions the sample was the
entire incoming first-year students. Students were invited to participate in a national longitudinal
study that included a 90 to 100 minute survey in the fall of 2006, and two follow-up sessions
occurred in the spring of 2007 and again in the spring of 2010. The follow-up sessions took
about two hours and included the series of instruments listed above. Students were paid a $50
stipend at each of the three data collection points. Of the over 4,000 students in the initial
sample, 2,212 participated in the spring 2010 follow-up (52.8% persistence rate).
In contrast to Pascarella and Terenzini (2005), Blaich and Wise (2007), in their overview
of the first year findings of the Wabash National Study of Liberal Arts Education (WNSLAE),
were surprised and disappointed by the lack of change on many outcome measures. According
to Blaich and Wise (2007), “although improvement on the CAAP Critical Thinking test was
statistically significant, the change was so small (less than 1% increase) that it was practically
meaningless” (p. 2). The Wabash National Study actually saw small declines in the outcomes
that measure students’ attitudes about diversity, and larger consistent declines in students’
academic motivation and interest in academic subject matter and community involvement
(Blaich & Wise, 2007). Faculty, staff, and administrators at almost every Wabash Study
institution have been surprised and concerned that their students seem to experience small
growth or even declines on outcomes in the study (Blaich & Wise, 2007).

73
Pascarella & Blaich (2013) completed a non-experimental analysis of the Wabash
National Study and compared their results with initial findings from the study. Pascarella and
Blaich acknowledged that the Wabash Study did not uncover compelling evidence that liberal
arts college attendance has a direct impact on cognitive development. Pascarella and Blaich’s
findings, however, suggest that if students report high levels of clarity and organization in
instruction and significant experiences with higher level learning expectations, the implications
revealed significant advantages on both critical thinking skills and their need for cognition.
Their research also found that students who attended liberal arts colleges, as compared to
research universities and regional institutions, reported significantly higher levels of clarity and
organization in instruction and higher frequency of deep-learning experiences. According to the
researchers, this distinct focus on instruction and learning may positively impact student
outcomes if applied at all types of institutions.
According to Blaich and Wise (2007), a statistical technique called factor analysis was
used in the quantitative method to examine student responses to survey questions about their
college experiences. The factor analysis locates clusters of questions that focused on core
elements of student experiences to measure some underlying component using common social
science language (Blaich & Wise, 2007). A scale was implemented to predict the extent to
which students changed over the course of the study on the following clusters: good teaching and
high quality interactions with faculty; academic challenge and high expectations; diversity
experiences; frequency of interacting with faculty and staff; interactions with peers; and
cooperative learning (Blaich & Wise, 2007). Students’ experienced a positive impact on the
experiences of good teaching and high quality interactions with faculty, academic challenge and
high expectations, and diverse learning opportunities (Blaich & Wise, 2007; Goodman et al.,

74
2011; Pascarella & Blaich, 2013). Students’ experienced a weaker or mixed relationship with
the outcomes of frequency of interacting with faculty and staff, interactions with peers, and
cooperative learning.
According to Blaich and Wise (2007), students change very little on the outcomes
measured, but found a set of teaching practices that predict student growth on outcomes. Three
teaching practices that influence learning include providing students with academic challenge,
diverse experiences, and good teaching (Goodman et al., 2011). According to Blaich and Wise
(2007), faculty, staff and administrators in higher education “bear an educational responsibility
to find ways to strengthen the impact of their education at our institutions” (p. 10). Individuals
in higher education can use the findings from the quantitative and qualitative data from the
Wabash Study to guide educators in learning more about practices that foster student learning
(Goodman et al.).
Arum and Roksa, Academically Adrift
Arum and Roksa in their book Academically Adrift: Limited Learning on College
Campuses, present their findings from research involving the Collegiate Learning Assessment
(CLA) tool, survey responses, and transcript data (Arum & Roksa, 2011). The Collegiate
Learning Assessment Longitudinal Project, initiated in the fall of 2005, included a short survey
to a group of freshmen students, with a follow-up survey two years later to the same students
during the spring of 2007. Institutions in the Arum and Roksa project were located across the
United States and included private residential, liberal arts, large research, Historically Black
Colleges and Universities (HBCUs), and Hispanic Serving Institutions (HSIs).
Arum and Roksa (2011) conducted extensive research and revealed that a significant
number of students do not demonstrate significant improvements in a range of learning outcomes

75
between their first semester of college enrollment and the end of their second year. The
researchers discuss the lack of external pressure to demonstrate learning and the concern over
whether or not institutions are turning out productive workers. Arum and Roksa questioned the
lack of transparency and accountability in student learning and wasted resources (2011).
Arum and Roksa (2011), focused on student social background to understand patterns of
stratification manifested in learning outcomes in higher education. Arum and Roksa considered
the following variables: race/ethnicity, parental occupation and education, language spoken at
home, and student attendance at a predominantly non-white high school. The researchers
measured the difference in the distribution of scores between 2005 and 2007. Arum and Roksa
designed scales to measure students’ perception of the degree of effort invested in the CLA test
as well as the importance of doing well. Students from a variety of sociodemographic
backgrounds and academic preparations produced similarly distributed scores that did not help to
explain differential performance of students engaging in similar learning activities.
The concern over undergraduate learning has led to the necessity to measure “whether
students are actually developing capacity for critical thinking and complex reasoning at college”
(Arum & Roksa, 2011, p. 2). Even with the concern over undergraduate learning, there is a lack
of external pressure to demonstrate learning, which has “contributed to a failure systematically to
measure and evaluate students’ gains in higher education” (Arum & Roksa, 2011, p. 17).
Globalization and fiscal constraints have brought an awareness to the concerns about learning in
higher education and whether the money and resources devoted to a college education has
prepared individuals to be productive workers.
Arum and Roksa (2011) used the College Learning Assessment (CLA) survey, designed
to measure the learning outcomes of critical thinking, analytical reasoning, problem solving and

76
writing. The Arum and Roksa (2011) study found that students in higher education are
“academically adrift”, by which they meant that they found a prevalent pattern of limited
learning, disturbingly low gains in student performance, individual learning characterized by
persistent and growing inequality, and a notable variation within and across institutions.
The Arum and Roksa (2011) findings state that what students bring and what students do
in college matters, but what faculty members do matters as well. According to Arum and Roksa
(2011), “when faculty have high expectations and expect students to read and write reasonable
amounts, students learn more” (p. 119). Students in the study who reported having to read more
than forty pages a week and write more than twenty pages over the course of a semester, also
reported studying more than two hours per week than students who do not have these
requirements (p < 0.01). When students are required to attend to their coursework, it increases
the likelihood they will complete assignments and learn the content presented, which increases
their performance on learning outcomes. This is similar to what people like Astin and Pace
found back in the 60’s – input and effort matter and make for more successful student learning.
According to Arum and Roksa (2011), the collegiate experience today is largely a social
experience that encourages students to have fun rather than require that they learn.

77
Bok’s Our Underachieving Colleges
It has become less of a surprise to see yet another text that examines the progress college
students make toward outcomes is lacking in higher education. According to former Harvard
President Derek Bok (2008), students improve much less than they should in critical thinking,
quantitative literacy, written communication, and moral reasoning. Bok states that many
students graduate without being able to analyze complex problems, even though critical thinking
is an essential learning outcome of a college education. He also believes that most students
never take a course in quantitative literacy. Contrary to most of my review of the literature,
Bok’s conceptual piece on the state of learning in college today, believes researchers try to
discover how much students are learning and what methods help student learn best. He believes
research is not translated into implications that lead to trying new methods of teaching to
overcome the lack of performance on learning outcomes, and rarely are successful teaching
techniques shared with the faculty as a whole.
Bok’s book concludes with ideas that lead to increase in student performance and
success. Some of the ideas that Bok encouraged included continued external pressure from
accrediting bodies to implement effective plans for outcomes assessment (Bok, 2008, p. 330).
Bok believes that all new and continuing faculty members should be assessed on an ongoing
basis and money spent to train faculty in teaching and learning techniques (Bok, 2008, p. 317),
Higher education institutions should develop rigorous program evaluations and outcomes
assessment of speaking, reasoning, writing, and language competencies on a regular and
predictable basis. Assessment results should be used to make changes in curricular planning.
Doctoral programs should be required to include advanced study of cognitive development and

78
diverse pedagogies. Bok believes that a commitment to these strategies would result in increase
in students’ performance in higher education.
Astin’s I-E-O Model
Astin’s I-E-O model provides a basis to determine whether students grow or change
differently under varying demographic environmental conditions. According to Astin (1993),
“many educators are interested in how students change and develop in college and what might be
done to enhance that development” (p. xix). The elements of Astin’s I-E-O model has served as
a conceptual guide for studying college student development and has stayed the same since its
first introduction in 1962 (Astin, 1993).
Figure 1. Astin’s I-E-O Model. Adapted from Achieving Educational Excellence: A Critical
Assessment of Priorities and Practices in Higher Education, by A. W. Astin, 1985, San
Francisco, CA: Jossey-Bass.
Input (I) refers to the characteristics of the student at the time of entry into higher
education, environment (E) refers to the environment students are exposed to in college, and
outcomes (O) refers to the student’s characteristics after exposure to the college environment
(Astin, 1993). Outcomes compare to input to determine growth or change in the student during
Input Environment
Outcomes

79
college. According to Astin (1993), “The basic purpose of the model is to assess the impact of
various environmental experiences by determining whether students grow or change differently
under varying environmental conditions” (p. 7). This model provides a basis for understanding
educational outcomes. The learning outcomes relevant to this study included critical thinking,
quantitative literacy, and written communication.
Outcomes are measured by the type of outcome, cognitive and affective, and the type of
data, psychological and behavioral (Astin, 1993). My study focused on the cognitive and
psychological type of outcomes that include knowledge, critical thinking ability, basic skills,
special aptitudes and academic achievement (Astin, 1993). My study used student characteristics
at entry, such as gender and socioeconomic status, in an effort to identify connections between
student characteristics (I), environment (E) and outcomes (O).
According to Astin (1993), the data used in the I-E-O model included multiple indicators
composed of ACT or SAT scores, pretests on possible outcome measures, self-predictions about
possible future outcomes, and personal characteristics that might affect the propensity to change
or to attain certain outcomes. Other data included a follow-up questionnaire, and scores on
standardized tests (Graduate Record Examination, Law School Admission Test, Medical College
Admission Test, and National Teacher Examination). The sample in Astin’s study included
freshmen entering higher education in the fall of 1985 at 309 randomly selected institutions. A
total of 27,064 students completed either a normative or expanded survey, representing a 29.7%
response rate. Over four thousand students who completed a survey returned a follow-up
questionnaire, representing a 24.6% response rate.
The first stage of Astin’s statistical analyses involved a multiple regression analysis to
obtain a predicted or expected score on each outcome measure under investigation (Astin, 1993).

80
Astin compared predicted outcomes with actual outcome measures using input variables, and an
“effect is said to occur when an environmental variable adds something to the prediction of the
outcome over and above what we can predict from entering freshman characteristics” (p. 25).
The rationale is simply that students who have the greatest exposure to the college environment
would score higher. Astin’s study approaches this in terms of time of exposure and intensity of
exposure. Time of exposure is how long the student has attended college. Astin’s intensity of
exposure is the frequency of interaction with other students and with faculty.
Astin’s (1993) study indicated that students change in many ways through their college
experience. Women get better grades in college, are more likely to complete a bachelor’s degree
and graduate with honors; men become more proficient on verbal and quantitative scales on the
GRE test. Astin found that students from high socioeconomic families have the most significant
positive outcomes in college than any other indicator: in completion of a bachelor’s degree,
satisfaction with the undergraduate experience, a higher grade point average, more likely to enter
graduate school, higher retention and completion rates, and significantly higher scores in critical
thinking and problem solving skills. Astin provides a model that remains relevant today.
Summary
My examination of the literature revealed more findings than theories regarding what and
how much students learn in their time spent in higher education. Liu and Roohr found that
students in community colleges caught up with students from liberal arts colleges and made
significant improvements in critical thinking, but the overall performance gap widened between
white students and students of color at community colleges. The VALUE Report 2017 found the
strongest performance in written communication, yet students struggled applying what they
learned in writing, critical thinking, and quantitative literacy. Arum and Roksa found that

81
students are academically adrift; which involved a lack of transparency and accountability in
student learning, wasted resources, and a lack of improvements in a range of learning outcomes.
The Wabash National Study of Liberal Arts Education also found student gains discouragingly
low, to the degree that some of the outcomes in the study actually found declines in outcome
measures. Bok found that students show a lack of progress in critical thinking, quantitative
literacy, written communication, and moral reasoning. Astin’s I-E-O model provided a
theoretical framework that brought together the elements of the findings to explore how students
change and develop in college. The model considers student input and the environment to
understand how these elements influence outcomes. A synthesis of the relevance of the literature
review is offered below.
Relevance of the Synthesis for the Research Project
This review of the literature provides a historical perspective and examines current trends
in the assessment of learning outcomes, assessment tools used to measure learning,
demographics included in the study, and the theoretical framework applied to this study. The
historical perspective provided insight into how we arrived today with an emphasis on the
assessment of learning outcomes. Today, the current trends offer a variety of assessment tools
designed to measure learning in higher education, some of which have come under scrutiny.
Many of these assessment tools draw from standardized tests or student surveys to measure
learning, rather than authentic evidence of student work drawn from the classroom. The existing
data analyzed for this study measured authentic student work samples taken from coursework
and scored using rubrics.
The purpose of this study was to examine how students perform on institutional learning
outcomes using the AAC&U VALUE rubrics to determine whether or not there are significant

82
differences in performance between demographic characteristics and collegiate experiences
associated with students’ learning outcome scores in critical thinking, quantitative literacy, and
written communication. The problem is that individuals within higher education do not have a
clear picture of how to pinpoint how much (or how well) students learn, and do not use the use
assessment information to improve on factors that may contribute to students’ success (Blaich &
Wise, 2011; Ewell, 2010; Harward, 2007, Tremblay, Lalancette, & Roseveare, 2012). The study
is significant due to the lack of research on the performance of students on institutional outcomes
that use scores obtained using the AAC&U VALUE rubrics to measure authentic student work.
A review of the demographic variables included in this study was important to provide a
better understanding of how students have historically performed in higher education. Key
differences in performance rates between low socioeconomic students of color and high
socioeconomic white students was seen in the literature and may predict how students will
perform on the learning outcomes used for this study.
Astin’s I-E-O model (1993), the VALUE Report 2017, Liu and Roohr’s (2013) learning
outcome research at community colleges, the Wabash National Study of Liberal Arts Education,
the findings of Arum and Roksa (2011) that students are academically adrift, and Bok’s (2008)
findings on underachieving colleges provided a framework for understanding student progress
after exposure to the learning environment. Astin’s model offered important information on
student input and environment to demonstrate the factors that have an impact on student
performance on learning outcomes. The studies provided insight into how students have
progressed, or have failed to progress, in performance on learning outcomes in higher education.
Summary

83
Institutions in higher education today are focused on student success and ensuring that
students are prepared for the future (Nunley, Bers, & Manning, 2011). Effective assessment of
learning outcomes in higher education can be a challenge. Measuring and attaining success in
learning outcomes in higher education can be an even greater challenge particularly for low-
income students and students of color. Chapter 3 presents the research design to measure the
three learning outcomes of critical thinking, quantitative literacy, and written communication.

84
Chapter III: Method
I conducted a quantitative study using existing data for this dissertation research.
According to Punch (2009), quantitative researchers conceptualize reality in terms of variables,
measure these variables and study relationships between these variables. According to Merriam
(2009), characteristics of quantitative research feature a deductive process through a quantitative
measurement, a goal to predict or confirm, a predetermined or structured design, and findings
that are always numerically expressed. I paid special attention to the demographic groups found
in the student body at a two-year community college in the United States. The stratified sample
used in the present study reflected the demographics of this institution in the data compiled for
review and analysis.
As previously stated, I investigate the following research question:
RQ1. Is there a relationship between students’ background characteristics, collegiate
experiences, and learning outcome scores in critical thinking, quantitative literacy, and
written communication?
The learning outcomes data included in this study were collected from rubrics used to
assess students’ learning in three areas: critical thinking, quantitative literacy, and written
communication. These rubrics were developed by the American Association of Colleges
&Universities (AAC&U) Multi-State Collaborative to Advance Quality Student Learning, a
large-scale initiative intended to measure student performance on learning outcomes in higher
education (Berrett, 2016). AAC&U conducted a multi-state collaborative study with faculty and
staff from across the United States to score student work samples using the rubrics to measure
student performance. These rubrics contain a 4-point scale to measure five to six criteria for
each learning outcome to evaluate student assignments. AAC&U replicated this study within

85
one state. Five private and five public institutions participated, and the two-year community
college used in this study was part of the state collaborative project. I analyzed how students
perform on institutional learning outcomes using the AAC&U data gathered from this
Midwestern urban community college.
Below, I present information on the research design, the data used for my study, the
instrument used to collect the data, my data collection procedures, analysis, and the Institutional
Review Board (IRB) approval process.
Research Design
I conducted linear regressions predicting the three dependent variables of student learning
outcomes scores in critical thinking, quantitative literacy, and written communication. The
independent variables in the three regressions included race/ethnicity, age, gender, Pell-
eligibility, program of study, credit hours, and degree level within a two-year community
college. My goal was to provide insight into possible significant differences in students’
performance based upon demographic differences and collegiate experiences.
In conducting a linear regression, if I received a positive correlation that is significant
that means that one demographic is more likely than another to score higher (or lower) on that
particular learning outcome. Individuals are not isolated by one characteristic at one time. For
instance, a student is not just female, or African American, or Pell-eligible, or earning an
associate’s degree in the criminal justice program. All of the variables should be examined in
the presence of other variables. A student is all of these things at once, and a multiple linear
regression can test for whether or not these independent variables matter in comparison to other
independent variables. The question is: What is the driving force that impacts performance of
student learning outcomes? Does one variable trump all others in this study? This is the benefit

86
of using multiple linear regressions; it looks at relationships in the presence of other independent
variables. The strongest relationships between these independent variables can be evaluated.
Astin’s (1993) I-E-O model suggests the association between college experiences and
demographic variables. We know through the literature that demographics have a significant
impact on student performance in higher education. Astin’s I-E-O model provides a supportive
framework for this study because 1) the input (I) measured include the characteristics of students
such as race/ethnicity, age, gender, and socioeconomic status; 2) the collegiate experiences (E)
measured include students’ experiences during college and include program of study, credit
hours completed, and degree level; and 3) the student outcomes (O) explored include numerical
scores on student work samples obtained using the AAC&U VALUE rubrics. Astin’s intensity
of student effort is not included in the study due to the variables available to examine, which
means there were variables included in Astin’s study that are not measured within this study.
This may imply that two-year institutions should consider collecting more data with more
potential for explaining their outcomes.
Description of the Sample
The dependent variables used in this study are rubric scores provided by faculty in three
areas: critical thinking, quantitative literacy, and written communication. Faculty used AAC&U
VALUE rubrics to assess students’ learning from samples of 377 students’ work collected
(called artifacts) from 38 instructors in 17 disciplines in the participating institution in 2016.
Sixty-five artifacts were lost due to lack of information such as the students’ age, Pell-eligibility,
or program of study. The institution is a two-year public community and technical college
located in an urban area in a Midwestern state of the United States. The institution has a
Carnegie classification of associate’s, public urban-serving single campus (Carnegie, 2017).

87
Faculty members from the institution who submitted artifacts were from a number of
discipline areas including accounting, business, chemistry, communication studies, community
health, economics, education, English, English to students of other languages, first year student
transition, global studies, machine tool technology, math, music, philosophy, political science,
and welding. I performed an in-depth analysis of the raw data obtained from national scoring to
determine the differences in students’ performance based on independent variables such as
race/ethnicity, age, gender, Pell-eligibility, program of study, number of credit hours completed,
and degree level.
The institutional population of 10,000 students are 55% female, 43% Pell-eligible, with
an average age of 27 (Fact Sheet, 2016). The students at this institution are 39% white, 31%
Black or African American, 10% Hispanic, 7% two or more races, 6% Asian, 4% unknown, 2%
nonresident alien, and 1% American Indian or Alaskan Native. Table 1 below compares
demographics from the data, based on the artifacts collected, with the demographics of this
institution, and indicates that the demographics at this institution is comparable to the data
collected in this sample. In regard to race and ethnicity, age, gender, and socioeconomic status
the data gathered in the sample compares with the demographics found at the institution. In
regard to age, the sample appears to be slightly older than the institutional population. There
were more females than males in the sample when compared to the institution. Socioeconomic
status, measured in terms of Pell-eligibility, found fewer Pell-eligible students at the institution
then found in the sample. There were more students in the study who were enrolled in health
and medicine programs, technical areas, and in the social sciences. The study found fewer
students enrolled in business and math programs as well as criminal justice. The study was
comparable with the institution in regards to students enrolled in natural sciences and education

88
program. The academic programs involved in the study do not reflect all programs offered at the
institution.

89
Table 1
Comparison of Population and Sample
Independent Variable Institutional Percentage Sample Percentage
Race/Ethnicity
Hispanic 10 12.7
African American 31 27.8
Asian 6 8.2
Native American 1 0.9
White 39 37.0
Non-resident alien 2 3.2
Two or more races 7 7.9
Unknown 4 2.2
Age
17-24 52 44.9
25-34 30 34.5
35-44 10 12.4
45-54 5 5.6
55 or greater 2 2.6
Gender
Male 43 44.0
Female 55 54.7
Socioeconomic Status
Pell-eligible 43 52.5
Non-Pell-eligible 57 47.5
Program of Study
Health/Medicine 12.6 26.6
Natural Sciences 3.3 4.1
Business & Math 25.1 20.5
Criminal Justice 6.3 4.8
Technical 5.3 10.7
Social Sciences 11.4 29.8
Education 3.8 3.5
Degree Level
Associate’s 51 83.5
Certificate 40 12
Campus Fact Sheet (2016)

90
Researchers determine the number of the sample size based on the population size and
confidence levels. Implementing the online Raosoft Sample Size Calculator (2004), with the
population of this institution being approximately 10,000 (N size of population), the margin of
error set at 5%, and the confidence level determined to be 95%. With this criterion submitted,
the number of artifacts to include in the research sample (n size of sample), was determined to
include 370 artifacts collected for all three outcomes, over one hundred artifacts per learning
outcome. The sample size, the number of artifacts collected, was 377, which initially satisfied
the number of artifacts to be collected for a representative sample. Sixty-five artifacts, however,
were lost due to lack of information available from the institutional research office. The loss of
this data decreased the sample size. In reviewing the impact of sample size, with 300 artifacts
the margin of error increases from 5% to 5.62% (Raosoft, 2004).
Instruments for Data Collection
Description of VALUE Rubrics
The VALUE rubrics, developed by AAC&U, use a common definition and set of criteria
to measure learning outcomes to assess authentic student work submitted by instructors using
samples taken from class assignments. Teams of faculty members and other educational
professionals from over 100 private and public, 2- and 4-year, research and liberal arts
institutions across the United States between the years 2007-2009 developed the VALUE rubrics
(Berrett, 2016). Faculty from over 100 college campuses then tested drafts of each rubric with
their own student work samples in the year 2009 (AAC&U, 2017).
The VALUE rubrics include 16 learning outcomes under three general areas of
intellectual and practical skills, personal and social responsibility, and integrative and applied
learning. Intellectual and practical skills include the following learning outcomes:

91
• Inquiry and analysis
• Critical thinking
• Creative thinking
• Written communication
• Reading
• Quantitative literacy
• Information literacy
• Teamwork
• Problem solving
Personal and social responsibility skills include the following learning outcomes:
• Civic engagement
• Intercultural knowledge and competence
• Ethical reasoning
• Foundations and skills for lifelong learning
• Global learning
Integrative and applied learning include the following learning outcome:
• Integrative learning
The rubrics have a scale ranging from 0-4 to evaluate how students demonstrate various
criteria of each outcome (Berrett, 2016). The performance indicators provide a progression from
benchmark to milestone to capstone. Performance indicators include milestones between the
benchmark, where rubric developers found their students’ current performance on average, and
the capstone, where rubric developers hoped their students would be at the completion of their
degree (Rhodes, 2011).

92
The present study is focusing on three of the outcomes developed by AAC&U: critical
thinking, quantitative literacy, and written communication. These three outcomes were analyzed
because the data used in the study was aggregated from the state collaborative project in which
the institution under study participated. The institution’s administrators and faculty members
committed to analyzing these three outcomes as part of the project. The raw data received from
AAC&U comes as one general score for each artifact. The specific criteria for each outcome are
found in Appendices A, B, and C.
Validity and Reliability of the AAC&U VALUE Rubrics
Validity is an analysis of whether the assessment instrument truly captures the concept
and variables it intends to measure. According to Maki (2004), “A valid method enables direct
and accurate assessment of the learning described in outcome statements” (p. 93). According to
the 2017 VALUE report, the rubrics were created because of a dissatisfaction in higher education
with standardized tests having limited validity due to the fact that these tests do not measure
authentic student learning that is directly connected to classroom curriculum. The VALUE
rubrics, created by national teams of faculty, hold a high degree of face validity because faculty
are familiar with outcome assessment on college campuses (Rhodes & Finley, 2013). Validity
comes in the level of agreement attained among all the people involved in the development of the
rubric. The VALUE rubrics were tested at over one hundred colleges and universities, using
authentic student work samples, before the rubrics were made available to the public (VALUE
Report, 2017). Establishment of content validity, through the specific employment of faculty
and other national experts to populate the development teams, verified that the rubrics criteria
cover the full range of concept meaning (Rhodes & Finley, 2013). According to Rhodes and
Finley (2013), “because the VALUE rubrics meet at least two specifications for establishing

93
validity, face validity and content validity, rubric users can have a high degree of confidence that
a particular rubric is capturing the specified learning outcome” (p. 15).
Reliability measures how consistently the scorers grade student responses (Maki, 2004).
Reliability ensures that the assessment is consistent over time or in different contexts or between
raters. According to Rhodes and Finley (2013), “A common method for establishing reliability
for rubrics is through inter-coder or inter-rater scoring, a method by which two or more coders
evaluate the same work sample, score it according to a common rubric, and calculate a reliability
score” (Rhodes & Finley, 2013, p. 16). Inter-rater reliability was developed through calibration
sessions when different individual scorers agree in their scoring of sample student work (Maki,
2004).
Researchers seeking to test national reliability estimates for the VALUE rubrics had two
objectives: to establish cross-disciplinary scores for each rubric and to establish reliability scores
within disciplines to examine similarities and differences across faculty from the different
disciplinary backgrounds (Finley, 2011). Forty-two faculty participated in the study including
faculty from the broad discipline areas of humanities, natural sciences, social sciences, and
professional and applied sciences. Each faculty member scored three samples of student work.
The initial round of scoring was to familiarize themselves with the rubric and compare to
previously determined calibration scores set by rubric experts employed to establish baseline
scores by national representatives already well acquainted with the VALUE rubrics. If the
scores were closely aligned with pre-determined calibration scores, the individuals went on to
score two more work samples; if there was a divergence in scoring the individual would work
with a team to review the discrepancy before moving on to the additional work samples.

94
Researchers at AAC&U used a multi-rater kappa statistic to establish reliability for the
VALUE rubrics. The kappa scores indicate the degree to which raters’ scores are similar, and
takes into account the amount of agreement on scores between raters, but also the probability that
scorers will agree with each other. Student work samples were analyzed based on the five-point
scale used in each rubric. Sores calculated for each criterion were combined into one category.
The fullest majority of data points included additional measures of central tendency for
consolidation. According to Finley (2011), “if the average was 2.0 but the mode and median
were 2.0 and 1.5, ratings of 1 and 2 would be collapsed into a single category” (para 8). The
kappa score using the combined average for all rubrics was .18 for perfect agreement, .42 for
approximate agreement using four categories, and .69 for approximate agreement using three
categories. The kappa scores increased as fewer rating categories were considered.
According to the VALUE Report (2017), Gwet’s AC was used to test reliability using a
range of agreement across the dimensions for critical thinking, quantitative literacy, and written
communication outcomes. They found the agreement to be described as moderate to strong.
Written communication showed the highest levels of inter-rater agreement in scores and
quantitative literacy had the lowest levels of inter-rater agreement (VALUE Report, 2017, p. 30).

95
Data Collection Procedures
Faculty members from the Midwestern urban community college had previously
submitted student work products, referred to in this study as artifacts, and these artifacts were
assessed by nationally trained scorers using the appropriate VALUE rubrics. The artifact was
typically an assignment for a course, which was written to facilitate evaluation of the learning
outcome and used to calculate the students’ grades for the course. The artifacts could have come
from any discipline area – and be radically different in content – and still be scored by the same
rubric. Each student submitted a single artifact, which was scored using the VALUE rubric, and
each student record was paired with institutional records about students’ demographic
characteristics data. An artifact was only measured using one outcome (either critical thinking,
quantitative literacy, or written communication). I had three separate datasets that I analyzed:
the critical thinking group had 106 artifacts, the quantitative literacy group had 107 artifacts, and
the written communication group had 99 artifacts.
According to AAC&U (2015), faculty were required to complete an assignment
coversheet for the artifacts submitted that indicate:
Which criteria of the appropriate VALUE Rubric was their assignment designed to
address. Faculty members are encouraged to submit assignments that address as many of
the VALUE Rubric dimensions for a specific learning outcome as appropriate to allow
for a more comprehensive measure of student proficiency levels for each learning
outcomes. Faculty will submit written student work only. Excluded from the study
include multiple-choice exams, video, and other alternative modalities. Student work
(the “artifact”) included work completed independently. Student work completed as part
of a team/group project is not acceptable. Faculty exclude student work that breaches the

96
confidentiality or anonymity of the student, faculty member, or institution providing the
work. For example, students may have referenced their course instructor in their work,
which would breach confidentiality and rendered unusable. Institutions decide upon the
appropriate protocol for ensuring that submitted student work, after it has been de-
identified, and not traced back to the student, instructor, or course. (pp. 1-2)
The assessment committee and institutional research administrator at this Midwest urban
community college had previously used a stratified sampling approach to create a sample that
reflected the general demographic characteristics of the student population at this institution;
with respect to gender, race/ethnicity, major or program of study, Pell-eligibility, and age. To
ensure the artifacts submitted reflect the demographics of the general student population at the
institution involved in the study, participating faculty submitted work from all students enrolled
in their course who completed the assignment. A total of ten student artifacts per faculty
member was manually-generated to include in the sample. A purposeful evaluation of the
sample was conducted to determine whether or not the selected student artifacts reflected the
demographics of the general student population at this institution. A second sample was
generated if the artifacts did not reflect the demographics of the general student population.
Individuals in the office of research and assessment at AAC&U (2015) undertook a final
review of the campus sampling methods in order to evaluate whether the methods lined up with
the predetermined guidelines. Sampling guidelines included drawing only ten artifacts from any
one course and collecting a target of over one hundred artifacts per learning outcome (AAC&U,
2015). According to AAC&U (2015), artifacts should include students majoring across a variety
of disciplinary areas or programs and taught by a variety of instructors.

97
AAC&U used an online system developed by Taskstream, called Aqua, to collect and
assess artifacts (Carnahan & Rhodes, 2016). Prior to the submission of artifacts to AAC&U,
artifact numbers were developed to replace student identifiers. According to Carnahan and
Rhodes, rigorous planning and development went into the recruiting and training of faculty and
institutions to participate in the AAC&U national calibration sessions. AAC&U personnel
worked with Taskstream to develop a platform and database designed to make the collection and
scoring of artifacts as smooth as possible (Carnahan & Rhodes, 2016).
Scorers engaged in a pre-scoring exercise by using a specified rubric to score one work
sample using the Taskstream system Aqua. Personnel from AAC&U analyzed whether or not
the scores were closely aligned with pre-determined calibration scores, the individuals went on to
score two more work samples; if there was a divergence in scoring the individual would work
with a team to review the discrepancy before moving on to score additional work samples.
Scorers then completed a review of online training materials, scored four additional student
works samples, to determine the necessity of additional practice with the rubrics. Qualified
scorers participated in scoring of artifacts. AAC&U scored all artifacts one time and one-third,
randomly selected, artifacts twice in order to measure inter-rater reliability (Carnahan & Rhodes,
2016). The scores on the artifacts used in this study came from the national scoring completed
for the institution under study. I used the scores from each artifact and combined them with
student characteristics to create the database.

98
Analysis
I relied on analysis techniques to examine the data to make conclusions and uncover
whether there were significant differences in the three dependent variables; students’ VALUE
rubric scores in critical thinking, quantitative literacy, and written communication learning
outcomes. As stated previously, I am using a multiple linear regression. I dummy-code the
independent variables as shown in Table 2 below. For example, gender was recoded into a
different variable as female (1) and male (0). Pell-eligibility was recoded yes/no/not available.
A decision was made as to whether to recode the ‘not available’ as not Pell-eligible, or to not
include this data in the sample. I chose not to include students in the sample who did not have
Pell-eligible information available from the office of institutional research. The students who did
not have Pell-eligible information available may not have filled out the Free Application for
Federal Student Aid (FAFSA) or may be international students. Taking them out meant a loss in
response rate. In order to analyze each race/ethnicity individually it was necessary to recode
each race/ethnicity variable independently. For instance, Hispanic student response data was
recoded as a 1 and all others were recoded as a 0, African American students were recoded as a 1
and all others were recoded as a 0, and so on. This was completed rather than coding all students
of color as a 1 in comparison to White students recoded as a 0.
Academic major was restructured into categories. Programs were divided into the
following categories: health and medicine, natural sciences, business and math, criminal justice,
technical fields, social sciences, engineering, and education. I included community health
worker, addiction counseling, pre-nursing, professional nursing, human services, dental
assistance, medical office assistant, and pharmacy technician in health and medicine. I included
chemistry, biology, and polysomnography in sciences. Business management, software

99
development, computer support and network administration, mathematics, accounting technician,
and entrepreneurship were grouped within business and math. Criminal justice included legal
office specialist, criminal justice studies, and law enforcement. Technical areas included HVAC
(heating, ventilation, and air conditioning), welding and metal fabrication, early childhood
education, and architectural technology. Engineering was its own category. Education included
urban teacher education and special education. I controlled for major because I analyzed
whether or not students in a certain major may have a higher performance on certain outcomes.
For instance, we might expect that math majors would score higher in quantitative literacy.
Students in this study were from a number of programs that require a variety of credit
hours to complete the specific degree. Some of the degrees at the community college involved in
this study had up to 72 credits to completion. It is important to keep in mind that most
community college degrees only require around 60 credits, but it is possible for students to have
completed more than 60 credits due to a change in majors or transferring in a number of credits.
I decided to categorize students into those who have completed 0-30 credits and a second
category of student who have completed over 50 credits. Students ranged from having
completed 0 credits to up to 106 credits.

100
Table 2
Coding Scheme
Independent Variables
Coding Scheme
Demographic Characteristics: Inputs
Race/Ethnicity
Hispanic 0 = all other students; 1 = Hispanic
African American 0 = all other students; 1 = African American
Asian 0 = all other students; 1 = Asian
Native American 0 = all other students; 1 = Native American
White 0 = all other students; 1 = White
Age Continuous; 17-66
Gender 0 = male; 1 = female
Socioeconomic Status 0 = non-Pell-eligible; 1 = Pell-eligible
Collegiate Experiences: Environment
Program of study
Health/Medicine 0 = all other programs; 1 = Health/Medicine
Natural Sciences 0 = all other programs; 1 = Natural Sciences
Business and Math 0 = all other programs; 1 = Business and Math
Criminal Justice 0 = all other programs; 1 = Criminal Justice
Technical 0 = all other programs; 1 = Technical Programs
Social Sciences 0 = all other programs; 1 = Social Sciences
Education 0 = all other programs; 1 = Education
Credit hours
Less than 30 credits earned Continuous; 0-30
Over 50 credits earned Continuous; 50-106
Level of degree
Certificate degree 0 = all other degrees; 1 = Certificate degree
Associates degree 0 = all other degrees; 1 = Associate’s degree

101
The dependent variable average scores on the rubrics were used rather than analyzing
each criterion separately. To build the data in SPSS, I entered in all of the separate independent
variables to be analyzed. Academic program, race/ethnicity, Pell-eligibility, number of credits,
gender, and age were all entered into SPSS. I used SPSS 23.0 to analyze the relationships
between students’ demographic background characteristics and collegiate experiences with
students’ learning outcome scores.
I examined underlying assumptions of multiple linear regression to ensure the data were
suitable. Multicollinearity, homoscedasticity, linearity, normality of residuals, independent
errors, and presence of outliers were reviewed in each model to ensure no assumptions were
violated. I first tested for multi-collinearity, which occurs when there are strongly correlated
independent variables. I reviewed the correlations table and variance inflation factors (VIF) for
evidence of strong correlations. I looked at the Durbin-Watson value, which is a statistic related
to independence of residual errors in the model.
After testing assumptions, I ran multiple linear regressions for each of the three outcomes
to determine the relationship between students’ demographic characteristics and collegiate
experiences and their outcomes associated with critical thinking, quantitative literacy, and
written communication as measured using the Association of American Colleges and
Universities (AAC&U) Valid Assessment of Learning in Undergraduate Education (VALUE)
rubrics. I chose a p value of less than .05 to indicate statistical significance (Research
Consultation, 2007).

102
Institutional Review Board Process
This study involved minimal risk to the individuals who submitted work samples in the
original data collected. Violation of confidentiality in this study is not a research risk or a risk
that rose above minimal. This study included educational practices conducted in “established or
commonly accepted educational settings, involving normal educational practices" (Office of
Human Subjects Protections, 2009, section 45CFR46.101). This study used existing
information, which involves research through “the collection or study of existing data,
documents, records…if these sources are publicly available or if the information is recorded by
the investigator in such a manner that subjects cannot be identified, directly or through identifiers
linked to the subjects” (Office of Human Subjects Protections, 2009, section 45CFR46.101).
The Institutional Review Board from the institution at St. Cloud State University
approved the study, and can be found in Appendix D. The researcher assured that the risk was
minimal and confidentiality assured. The study was an evaluation of an educational process
conducted by the institution to improve its own processes.
Summary
This chapter described the research methodology used in the study. The purpose of this
study was to determine how students perform on assessments of institutional student learning
outcomes. The results, organized by demographic variables, will help to determine how students
perform on assignments assessed in three learning outcome areas: critical thinking, quantitative
literacy, and written communication. Demographics such as age, gender, ethnicity and Pell-
eligibility often relate to student success. I captured the data previously collected by the
institution under study for participation in a collaborative project to assess how students are
performing on institutional learning outcomes using the AAC&U VALUE rubrics.

103
Chapter 4 will reiterate the research question and present the data and the findings, to
examine what differences and correlations were found. Chapter five presents an interpretation of
the findings, possibilities for further research, implications of the theory used in the study, and
recommendations to the field.

104
Chapter IV: Results
I conducted an explanatory study to examine students’ performance on institutional
learning outcomes. This study used existing data, generated by trained faculty evaluators, to
move beyond the raw scores to produce findings on the relationships between students’
demographic characteristics and collegiate experiences associated with scores using a common
definition and set of criteria in the areas of critical-thinking, quantitative literacy, and written
communication. An explanatory study examines the trait or mechanism of the relationship
between the independent and dependent variables to enrich a theory’s expectation or belief. I
used Astin’s I-E-O model as the principle framework to examine input, environment, and
outcomes.
Astin’s I-E-O model considers student inputs, the educational environment, and student
outcomes after exposure to the environment (Astin, 1993). This study examined student
characteristics at entry, such as gender or socioeconomic status, and then analyzed in an effort to
identify co-variations between student characteristics (I), environment (E) and outcomes (O).
Collegiate experiences (E) indicated student experiences during enrollment at the institution
under study and include program of study, credit hours completed and degree level. Student
outcome (O) included numerical results of student work samples obtained using the Association
of American Colleges and Universities (AAC&U) Valid Assessment of Learning in
Undergraduate Education (VALUE) rubrics.
I investigated the following research question:
RQ1. Is there a relationship between students’ demographic characteristics, collegiate
experiences, and learning outcome scores in critical thinking, quantitative literacy, and
written communication?

105
This chapter discusses the results of data previously collected from faculty and evaluated
by trained scorers regarding student learning as measured by the AAC&U VALUE rubrics. I
conducted three separate multiple linear regressions to predict students’ performance on three
dependent variables in the study. Before that, I examined assumptions of multicollinearity,
homoscedasticity, linearity, and independent/normal errors in each model. A synthesis of the
results presents conclusions drawn from the data regarding my research question. The chapter
concludes with a summary of the findings.
Demographic Information
Table 3 below contains the demographics of the independent variables of race/ethnicity,
age, gender, socioeconomic status, program of study, credit hours earned, and degree level.
Scores were originally collected for 377 artifacts. Sixty-five artifacts, not included in the
analyses conducted, were lost due to lack of information such as the students’ age, Pell-
eligibility, or program of study. Data from the institutional research office was missing, which
may be due to the fact that students did not fill out a FAFSA form, or may have been
undocumented or international students. The loss of this data decreased the sample size. In
reviewing the impact of sample size, with 300 artifacts the margin of error increases from 5% to
5.62% (Raosoft, 2004). Artifacts were not assessed by more than one of the outcome rubrics,
therefore, in breaking the data down into individual outcomes of critical thinking (n = 106),
quantitative literacy (n = 107), and written communication (n = 99); the margin of error increases
to 9.78% (Raosoft, 2004). The lower the sample size, the higher the margin of error. Margin of
error determines the level of accuracy of the results. The implications for this for the findings of
the study will indicate caution when extending findings from the sample to the population.
It is important to collect enough data to obtain a reliable regression model to examine

106
each of the dependent variables (Field, 2013). According to Field (2013), the aim is to test the
overall fit of a model to find a large effect, then a sample size of 77 would suffice (with up to 20
predictors); however, if I am expecting a medium effect, a sample size of 160 will suffice (with
up to 20 predictors). Field states that you should always have a sample size above 55 in a
regression model, and encourages researchers not to bother with a small effect size because it
would require the time and resources to collect hundreds of cases of data (p. 313). The message
Field provides is that sample sizes do not need to be massive if the researcher is looking for
medium to large effects (Field, 2013, p. 313). I have a sample size of 106 for critical thinking,
99 in written communication, and 107 in quantitative literacy. With that sample size, I can
expect to find a medium to large effect.
The participants in this study included 316 students enrolled in the two-year public
community college involved in the study. Table 3 lists the frequency and percentage of students
for each of the independent variables found in the study.

107
Table 3
Descriptive Statistics for Demographic Independent Variables
Independent Variable Total (n) Frequency Percentage
Race/Ethnicity 316
Hispanic 40 12.7
African American 88 27.8
Asian 26 8.2
Native American 3 0.9
White 117 37.0
Non-resident alien 10 3.2
Two or more races 25 7.9
Unknown 7 2.2
Age 316
17-24 142 44.9
25-34 109 34.5
35-44 39 12.4
45-54 18 5.6
55-66 8 2.4
Gender 316
Male 139 44.0
Female 173 54.7
Not Available 4 1.3
Socioeconomic Status 316
Pell-eligible 166 52.5
Non-Pell-eligible 150 47.5
Program of study 316
Health/Medicine 84 26.6
Natural Sciences 13 4.1
Business and Math 59 18.7
Criminal Justice 12 3.8
Technical 34 10.7
Social Sciences 88 27.8
Education 11 3.5
Credit hours 316
Less than 30 credits 196 62.0
Over 50 credits earned 77 24.4
Between 30-50 credits 43 13.6
Degree level 316
Certificate degree 38 12.0
Associates degree 264 83.5
Unknown 11 3.4
Demographic Information in Critical Thinking

108
I used three separate dependent variables in my analysis: critical thinking, quantitative
literacy, and written communication. Artifacts collected for critical thinking showed a higher
percentage of Asian students in the sample as compared to the institution, higher number of
females then males, higher number of Pell-eligible students, lower number of students in the 17-
24 age range in the sample compared to the institution, and a higher number of students in the
health/medicine and social science programs of study than are found in the population of
students at this institution. All other areas were comparable to the population found at the
institution under study.
Demographic Information in Quantitative Literacy
Artifacts collected for quantitative literacy showed a higher percentage of White students
and students from two or more races, a lower number of African American students, more males
than females, a higher number of Pell-eligible students, a higher number of students in the 45-54
age range, and a higher number of students in the health/medicine and social science programs of
study than are found in the population of students at this institution. No artifacts were collected
from Native American students. All other areas were comparable to the population found at the
institution under study.
Demographic Information in Written Communication
Artifacts collected for written communication showed a higher percentage of Pell-eligible
students, a lower number of students in the 17-24 age range, and a higher number of students in
the 25-34 and 35-44 age ranges. All other areas were comparable to the population found at the
institution under study.
As presented in chapter 3, the overall demographics found in my study was representative
of the population of students enrolled at this Midwestern urban community college. The sample

109
included students from a diverse population as represented in race/ethnicity, age, program of
study and degree level.
Mean Scores
The mean scores and standard deviations were calculated for all the three dependent
variables used in a simultaneous multiple regression analysis. Results are in Table 4 below.
Correlational analysis was used to examine the relationships between the variables.
Table 4
Descriptive Statistics for Dependent Variables
N Mean Std. Deviation
Critical Thinking Outcome Score 106 1.683 .7831
Quantitative Literacy Outcome Score 107 1.6195 .84124
Written Communication Outcome Score 99 1.9520 .78270
This indicated that the mean scores for all students in critical thinking was 1.683,
quantitative literacy was 1.6195, and written communication was 1.952. Scores range from 0 to
4. Benchmark scores are 1, milestone scores are 2 and 3, and capstone scores are 4. Students’ in
critical thinking and quantitative literacy scored at the benchmark level. Students’ in written
communication scored close to the milestone level. Students’ scored highest in written
communication and lowest in quantitative literacy.
Testing Multiple Linear Regression Assumptions
Before presenting the data results, it is essential to run tests to ensure statistical
assumptions have been met and to make sure that the data does not fail these assumptions.

110
Multiple linear regression assumes that the variables are normally distributed, that the
independent variables are not highly correlated with each other, and that the variance of error
terms are similar across the independent variables. Multicollinearity tests the assumption that the
independent variables are not highly correlated with each other (Field, 2013). I performed
correlational analyses to examine the relationships among the independent variables. I ran tests
to explore normal distribution, variance, and linear correlation. I examined assumptions of
multicollinearity, homoscedasticity, linearity, and independent/normal errors.
I ran separate linear regressions with my three dependent variables of critical thinking,
quantitative literacy, and written communication along with all of the independent variables:
race/ethnicity, age, gender, socioeconomic status, and program of study.
Pearson Correlations
As displayed in Tables 5, 6, and 7, Pearson Correlations calculated independent variables
to make sure the co-variation between independent variables was not too high, which means that
each variable could potentially contribute some explanation independent of the other variables.
In critical thinking, certificate and associate’s degrees were closely related. Over 30 credits
earned and over 50 credits earned were also closely related in critical thinking. As none of the
other correlations reached the .80 threshold, the analysis indicated that no other variables were
closely related for critical thinking. For quantitative literacy, certificate and associate’s degrees
were closely related. No other correlations reached the .80 threshold, which indicated that no
other variables were closely related for quantitative literacy. For written communication,
certificate and associate’s degrees were closely related. No other correlations reached the .80
threshold, which indicated that no other variables were closely related for written
communication.

111

112
Table 5
Critical Thinking Pearson Correlation
Out-
come
Ave Female
Social
Sci Asian
Native
Amer Black
His-
panic Pell Age
Assoc
iates
Certifi
cate
Justic
e
Tech-
nical
Busi-
ness/
Math
Healt
h
Scien
ce
Less
Than
30
Over
50
OutAveScore 1.000
Female
Social Sci
-.165
-.093
1.000
-.122
1.000
Asian -.084 -.073 -.086 1.000
Native Amer .015 -.142 -.060 -.035 1.000
Black -.127 .086 .117 -.230 -.063 1.000
Hispanic .070 .007 -.022 -.151 -.041 -.271 1.000
Pell -.115 -.015 .040 -.073 .094 .246 -.016 1.000
Age .348 -.022 -.011 .038 -.068 .044 .027 .081 1.000
Associates -.026 .013 .252 .028 .049 .163 -.187 .042 -.302 1.000
Certificate .172 .047 -.249 -.060 -.040 -.142 .282 .066 .432 -.817 1.000
Justice .068 -.076 .212 -.071 -.019 .199 .055 .191 .025 .098 -.080 1.000
Technical -.179 -.126 -.105 -.061 -.017 .140 .087 .050 -.077 -.201 .094 -.034 1.000
Bus/Math -.053 -.030 .078 -.075 .223 -.055 -.112 -.042 -.147 .088 -.030 -.087 -.075 1.000
Health .258 .341 -.303 .034 -.089 -.043 .093 -.034 .299 -.023 .174 -.180 -.155 -.398 1.000
Sciences .045 .058 -.037 .201 -.022 -.045 .030 .036 -.080 -.001 .037 -.044 -.038 -.097 -.202 1.000
Lessthan30 -.143 -.069 -.227 .047 .066 -.195 .283 -.117 -.184 -.232 .215 -.081 .115 .072 -.125 .053 1.000
Over 50 .110 .130 .174 .020 -.053 .098 -.228 .070 .218 .212 -.155 .011 -.092 -.052 .187 -.120 -.805 1.000

113
Table 6
Quantitative Literacy Pearson Correlation
Quant
Out-
come Fem Asian
Socia
Scien Black
Hispa
nic Pell Age
Associ
ates
Certif
icate
Justic
e
Techn
ical
Bus/Ma
th Health
Scien
ces
Less
Than
30
Over
50
QuantOut 1.000
Female -.210 1.000
Asian .034 -.005 1.000
SocialScienc -.016 .003 -.035 1.000
Black .169 -.048 -.129 .130 1.000
Hispanic .121 -.138 -.071 .165 -.187 1.000
Pell -.145 .113 .034 -.007 .339 -.144 1.000
Age .026 -.088 -.145 .065 .253 -.051 .250 1.000
Associates -.193 .051 -.025 .265 -.042 -.036 .148 .075 1.000
Certificate .122 .004 .062 -.217 .066 .089 -.017 .007 -.818 1.00
Justice .052 -.115 -.031 .226 -.080 .193 -.006 .030 .060 -.049 1.00
Technical .026 -.237 .062 -.217 -.002 -.012 .043 -.017 -.251 .343 -.049 1.000
Bus/Math .211 -.096 -.113 -.258 .024 -.084 -.070 .364 .095 -.034 -.070 -.181 1.000
Health -.115 .226 -.067 .042 .134 .018 .222 .160 -.329 .426 -.042 -.108 -.154 1.000
Sciences .013 .088 -.038 -.104 -.099 .140 -.065 .042 .074 -.060 -.023 -.060 -.086 -.051 1.000
Lessthan30 .149 -.100 -.103 -.094 -.129 -.017 -.235 -.144 -.177 .091 -.179 .275 -.085 -.114 .131 1.00
Over 50 -.114 -.031 .081 -.002 .122 .043 .148 .128 .067 .006 -.078 -.201 .035 .221 -.096 -.733 1.000

114 Table 7
Written Communication Pearson Correlation
Writ
LO Fem
Soc
Scien Asian
Nat
Amer Black
Hispa
-nic Pell Age
Assoc
iates
Certifi
cate
Justic
e
Techn
ical
Bus/M
ath Heal Scien
Educ
Less
30
Over
50
Writ LO 1.000
Female
Soc Sci
-.141
-.008
1.000
.031
1.000
Asian -.186 .058 -.105 1.000
NatAmer -.082 .123 -.092 -.045 1.000
Black -.091 -.101 .059 -.209 -.095 1.000
Hispanic .087 -.004 -.134 -.128 -.058 -.268 1.000
Pell -.181 .037 -.081 .077 .131 .381 -.270 1.000
Age -.068 -.016 -.073 -.045 .111 .165 -.205 .350 1.000
Associat .150 -.092 .110 .019 -.157 .256 -.100 -.055 .094 1.000
Certificat -.149 .016 -.068 .011 .190 -.221 .153 .037 -.088 -.862 1.000
Justice -.167 -.039 .116 .361 -.036 -.075 .140 .147 -.014 -.152 .196 1.000
Technicl -.196 .072 -.132 -.065 -.029 .200 -.083 .187 .401 .080 -.069 -.052 1.000
Bus/Mat .039 -.256 -.088 -.065 .112 -.154 -.198 -.070 .076 .189 -.163 -.124 -.100 1.000
Health .297 .067 -.195 -.036 .073 .090 .142 .058 .021 -.031 -.055 -.156 -.126 -.298 1.000
Sciences
Educat
-.196
-.207
.072
.173
.093
-.228
.114
-.112
-.029
-.051
.200
.047
-.083
.041
-.122
.065
-.107
.009
.080
-.148
-.069
.201
-.052
-.090
-.042
.254 -.100
-.126
-.172
1.000
-.217
1.000
Less30 -.130 -.021 -.201 .013 -.010 -.047 -.029 -.037 -.252 -.182 .178 -.103 -.015 -.009 -.157 .191 -.057 1.000
Over50 .146 .001 -.031 -.029 .077 .056 .021 .084 .334 .164 -.124 .041 .111 .001 .047 -.122 .154 -.641 1.000

115
Tables 5, 6, and 7 calculate the correlation coefficients to provide an indication of the
magnitude of the relationship between variables. Multicollinearity is possible if variables are
strongly correlated, which can lead to errors in regression models (Field, 2013). The results
showed a low relationship between almost all of the variables. In all three models certificate
degrees were closely correlated with associate’s degrees. For critical thinking, over 50 credits
earned was closely correlated with under 30 credits earned. All correlations among all other
variables were below .80, indicating a low likelihood of multicollinearity between the
independent variables (Field, 2013). Pearson’s correlation coefficient provides a good overall
method, but misses more subtle forms of multicollinearity (Field, 2013). According to Field
(2013), “luckily, SPSS produces various collinearity diagnostics, one of which is the variance
inflation factor (VIF)” (p. 325). The VIF and tolerance levels were examined and described
below. These two statistics conduct a closer analysis of whether the variables had a strong linear
relationship with one another.
Tolerance Levels and Variance Inflation Factor
Two additional checks for multicollinearity of the independent variables are the tolerance
levels and the Variance Inflation Factor (VIF). When using a multiple linear regression, adding
more, similar variables may fail to make things clearer as the variables may correlate with one
another. The VIF scores should be well beneath 10 and tolerance values greater than .1 to
indicate the relative threshold levels that, if crossed, would highlight problems with the data.
(Field, 2013). For critical thinking the VIF scores ranged from 1.136 to 4.393 and the tolerance
values ranged .228 to .881. For quantitative literacy the VIF scores ranged from 1.227 and
4.184 and the tolerance values ranged from .247 and .838. For written communication the VIF
scores ranged from 1.205 and 4.734 and the tolerance values ranged from .211 and .830. This

116
indicates that there is no reason for concern that the independent variables excessively influence
each other, and that multicollinearity was not a concern for all variables within the three models.
Scatter Diagrams
Multiple linear regression assumes that the data are not skewed, that outliers do not exist,
that the residuals are normally distributed, that the variance around the regression line is the
same for all values of the predictor variable, and that the residuals have a constant variance and
are not correlated with each other. Scatter diagrams of residuals, partial plots, and normal
probability plots of residuals were constructed to test these assumptions.
The histograms of standardized residuals indicated the data contained normally
distributed errors (see Figures 2, 3, and 4). The normal P-P plots of standardized residuals
showed points close to the line (see Figures 5, 6, and 7). The scatterplots of standardized
residuals showed the data met the assumptions of homogeneity of variance and linearity (see
Figures 8, 9, and 10).

117
Figure 2. Histogram of standardized residuals in critical thinking

118
Figure 3. Histogram of standardized residuals in quantitative literacy
Figure 4. Histogram of standardized residuals in written communication
Figures 2, 3, and 4 show the histogram is a bar-type graph for quantitative data. Each
histogram developed respectively from the three dependent variable of critical thinking,
quantitative literacy, and written communication and the same independent variables submitted
for each dependent variable. The common boundaries between adjacent bars emphasized the
continuity of the data, as with continuous variables (Field, 2013). The graphs show that a dense
concentration of the independent variables has an impact on each of the learning outcomes
(Field, 2013). The histogram of standardized residuals in critical thinking, quantitative literacy,
and written communication indicated the data contained normally distributed errors.

119
Figure 5. Normal P-P plot of standardized residuals for critical thinking

120
Figure 6. Normal P-P plot of standardized residuals for quantitative literacy
Figure 7. Normal P-P plot of standardized residuals for written communication
The scatterplots shown in Figures 5, 6, and 7 represent the difference between the
expected value and the observed value for a given variable that is shown in the form of a straight
line. If the residuals are normally distributed, then the data should appear as a collection of
points that are randomly scattered around a straight line. Normal P-P plot of standardized
residuals showed points close to the line for critical thinking, quantitative literacy, and written
communication.

121
Figure 8. Scatterplot of standardized residuals in critical thinking

122
Figure 9. Scatterplot of standardized residuals in quantitative literacy
Figure 10. Scatterplot of standardized residuals in written communication
The scatterplots shown in figures 8, 9, and 10 reflect no obvious outliers and the cloud of
dots is evenly spaced around the line, and indicate homoscedasticity (Field, 2013).
Homoscedasticity literally means the same amount of scatter. In testing homoscedasticity, the
results suggested random scatter and variability in scatterplots of standardized residuals against
the standardized predicted values. Scatterplot of standardized residuals showed the data met the
assumptions of homogeneity of variance and linearity in critical thinking, quantitative literacy,
and written communication.
In summary, testing assumptions of multiple regressions ensures data is suitable for
regression analysis. In all regressions, I examined assumptions of multicollinearity,
homoscedasticity, linearity, and independent/normal errors. I found that multicollinearity

123
assumptions were not violated (variance inflation factors in all three outcomes ranged from 1.136
to 4.734). In testing homoscedasticity, the results suggested random scatter and variability in
scatterplots of standardized residuals against the standardized predicted values. The scatter plot
for all three outcomes did suggest a potential for a linear relationship. In producing histograms
of standardized residuals and normal probability plots comparing the distribution of standardized
residuals to a normal distribution, I found evidence for normality (Field, 2013). Examinations of
matrix scatterplots suggested the relationships between the predictor and outcome variables were
linear. Residual errors were consistently independent across the models. Overall, the results of
these tests suggest that the assumptions were not violated for each of the linear regressions in this
study (Field, 2013).
Multiple Linear Regression Results
After completing tests for assumptions, I ran multiple linear regressions to determine if
there was a relationship between students’ demographic background characteristics and
collegiate experiences, and learning outcome scores in critical thinking, quantitative literacy and
written communication. I used the multiple linear regression in order to determine which
independent variables had statistically significant relationships with higher scores on the three
learning outcomes (dependent variables), which allowed me to examine the research question to
test covariations among the variables.
Critical Thinking
The results of the first linear regression, Table 8, shows the results of the independent
variables in the multiple regression analysis in critical thinking. The Durbin-Watson value is at
2.42. Durbin-Watson value is a statistic related to independence of residual errors in the model.

124
The R2 is the percent (36.5%) of variation in the outcome variable (critical thinking) can be
accounted for by the independent variables.

125
Table 8
Model Summary for Critical Thinking
Model R R Square
Adjusted R
Square
Std. Error of the
Estimate Durbin-Watson
1 .605a .365 .234 .6853 2.423
Table 9 illustrates the overall regression for the model predicting students’ critical
thinking scores was statistically significant, F(17, 88) =2.885, p < .001. The first number is the
number of variables included in the data. The second number is the between-group variance
divided by the within-group variance. This study set out to investigate the variation between
groups. The F-value is statistically significant (p < .001), which signifies that there is a
significant relationship between the set of independent variables and the dependent variable.
Table 9
ANOVA for Critical Thinking
Model Sum of Squares df Mean Square F Sig.
1 Regression 23.041 17 1.355 2.885 .001
Residual 41.348 88 .470
Total 64.389 105
I conducted analyses to test the unique contribution between the independent variables
and the dependent variables by calculating coefficients for each independent variable. An
analysis of beta weight and the statistical significance for critical thinking is presented in Table
10 below.

126
Table 10
Critical Thinking Coefficients
Model
Unstandardized Coefficients
Standardized
Coefficients
T Sig. B Std. Error Beta
1 (Constant) 1.261 .437 2.887 .005
Female
Social Sciences
-.518
-.178
.163
.174
-.310
-.102
-3.168
-1.022
.002*
.310
Asian -.502 .235 -.204 -2.132 .036*
Native American -.111 .734 -.014 -.151 .881
Black -.267 .179 -.156 -1.492 .136
Hispanic -.059 .223 -.027 -.263 .793
Pell -.239 .147 -.153 -1.628 .107
Age .020 .009 .243 2.271 .026*
Associates .440 .329 .225 1.339 ..184
Certificate .496 .400 .222 1.240 .218
Justice .630 .385 .154 1.638 .105
Technical -.417 .444 -.089 -.940 .350
BusinessNMath .255 .232 .120 1.098 .275
Health .460 .202 .294 2.283 .025*
Sciences .679 .358 .185 1.894 .061
Lessthan30 -.250 .261 -.148 -.959 .340
Over50 -.037 .284 -.020 -.132 .895
Note. * p < .05
Examination of the regression coefficient on the critical thinking outcome reveals that
there is a significant difference in performance between males and females (B = -.310, t = -
3.168, p = .002). Based on the beta the direction of the impact is negative. The results indicate
that women score lower than men on the critical thinking outcome. Simply put, scores were
significantly lower for females than males. Asian students have significantly lower critical
thinking scores compared to all of their peers (B = -.204, t = -2.132, p = .036). For every year of

127
age that a student increases they are significantly more likely to have higher critical thinking
scores (B = .243, t = 2.271, p = .026). Students in health majors have significantly higher critical
thinking scores (B = .294, t = 2.283, p = .025). All other students had similar performance in
critical thinking based on their scores; meaning that significant differences in scores were not
found for any other independent variable.
Quantitative Literacy
Table 11 shows the results of the independent variables in the multiple regression
analysis in quantitative literacy. The Durbin-Watson value is at 2.34. This suggests that I have a
model that showed independence of residual errors in the model. The model explains 24.1% of
the variance. All of the variables in the model account for about 24.1% of variance (R Square)
for the quantitative literacy outcome.
Table 11
Model Summary for Quantitative Literacy
Model R R Square
Adjusted R
Square
Std. Error of the
Estimate Durbin-Watson
1 .491a .241 .086 .78672 2.348
Table 12 illustrates the overall regression for the second model predicting students’
quantitative literacy scores was statistically significant, F(16, 90) =1.7555, p < .050. There are
16 variables included in the data, 90 is the between-group variance divided by the within-group
variance. The F-value is statistically significant (p < .050), which signifies that there is a
significant relationship between the set of independent variables and the dependent variable.

128
Table 12
ANOVA for Quantitative Literacy
Model Sum of Squares Df Mean Square F Sig.
1 Regression 17.062 16 1.066 1.755 .050
Residual 54.695 90 .608
Total 71.757 106
An analysis of beta weight and statistical significance for quantitative literacy is
presented in Table 13 below.
Table 13
Quantitative Literacy Coefficients
Model
Unstandardized Coefficients
Standardized
Coefficients
T Sig. B Std. Error Beta
1 (Constant) 2.025 .521 3.884 .000
Female -.173 .180 -.104 -.962 .339
Asian .422 .399 .109 1.057 .293
Black .457 .218 .242 2.092 .039*
Hispanic .367 .297 .130 1.235 .220
Social Science .119 .211 .065 .565 .573
Pell -.083 .191 -.051 -.436 .664
Age -.006 .010 -.069 -.591 .556
Associates -.664 .406 -.296 -1.635 .106
Certificate -.243 .493 -.094 -.492 .624
Justice .530 .643 .088 .824 .412
Technical -.059 .485 -.023 -.121 .904
BusinessNMath .577 .251 .285 2.298 .024*
Health -.274 .364 -.093 -.753 .453
Sciences .264 .503 .053 .525 .601
Lessthan30 .240 .276 .142 .869 .387
Over50 -.005 .296 -.002 -.015 .988

129
Note. * p < .05
Examination of the regression coefficient on the quantitative literacy outcome (Table 13)
revealed a significant difference in performance in two of the variables. Black students
performed significantly higher in quantitative literacy than their peers (B = .242, t = 2.092, p =
.039), the beta direction of the impact is positive. Students in business and math majors had
significantly higher quantitative literacy scores (B = .285, t = 2.298, p = .024). All other students
had similar performance in quantitative literacy based on their scores; meaning that significant
differences in scores were not found for any other independent variable.
Written Communication
Table 14 shows the results of the independent variables in the multiple regression
analysis in written communication. The Durbin-Watson value is at 2.00. This suggests that the
model shows independence of residual errors. All of the variables in the model account for
about 30.9% of variance (R Square) for the written communication outcome.
Table 14
Model Summary for Written Communication
Model R R Square
Adjusted R
Square
Std. Error of the
Estimate Durbin-Watson
1 .556a .309 .143 .72692 2.004
Table 15 illustrates the overall regression for the written communication model was
statistically significant, F(18, 80) = 1.887, p < .029. The F-value is statistically significant (p <
.029), which signifies that there is a significant relationship between the set of independent
variables and the dependent variable.

130
Table 15
ANOVA for Written Communication
Model Sum of Squares Df Mean Square F Sig.
1 Regression 18.012 18 1.0001 1.887 .029
Residual 42.435 80 .530
Total 60.447 99
An analysis of beta weight and the statistical significance for written communication is
presented in Table 16 below.

131
Table 16
Written Communication Coefficients
Model
Unstandardized Coefficients
Standardized
Coefficients
T Sig. B Std. Error Beta
1 (Constant) 1.888 .585 3.226 .002
Female
Social Science
-.195
-.011
.168
.198
-.123
-.007
-1.156
-.057
.251
.954
Asian -.477 .308 -.175 -1.550 .125
Native American -.529 .570 -.095 -.928 .356
Black -.202 .219 -.119 -.921 .360
Hispanic -.116 .254 -.052 -.458 .648
Pell -.107 .188 -.068 -.569 .571
Age -.010 .011 -.111 -.892 .375
Associates .576 .471 .249 1.225 .224
Certificate .328 .528 .127 .622 .536
Justice -.285 .375 -.087 -.759 .450
Technical -.518 .444 -.130 -1.165 .247
BusinessNMath -.103 .243 -.052 -.423 .673
Health .428 .218 .244 1.961 .053
Sciences
Education
-.590
-.366
.420
.293
-.149
-.147
-1.403
-1.248
.165
.216
Lessthan30 .013 .222 .008 .059 .953
Over50 .345 .233 .194 1.481 .143
Note. * p < .05
Examination of the regression coefficient on the written communication outcome (Table
16) revealed that none of the variables independently accounted for significant variation in the
dependent variable.
Results of Independent Variables
Race/Ethnicity. Results of multiple linear regressions revealed that race/ethnicity was a
significant predictor of performance on learning outcomes in two areas. Asian students were
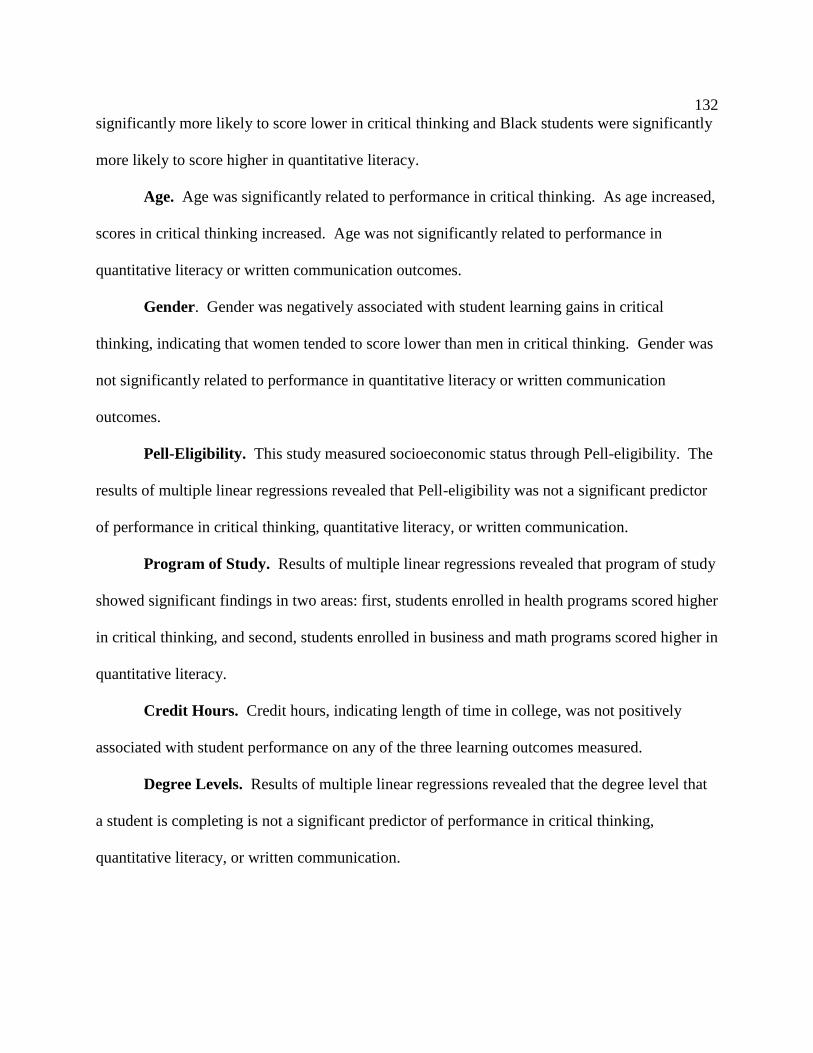
132
significantly more likely to score lower in critical thinking and Black students were significantly
more likely to score higher in quantitative literacy.
Age. Age was significantly related to performance in critical thinking. As age increased,
scores in critical thinking increased. Age was not significantly related to performance in
quantitative literacy or written communication outcomes.
Gender. Gender was negatively associated with student learning gains in critical
thinking, indicating that women tended to score lower than men in critical thinking. Gender was
not significantly related to performance in quantitative literacy or written communication
outcomes.
Pell-Eligibility. This study measured socioeconomic status through Pell-eligibility. The
results of multiple linear regressions revealed that Pell-eligibility was not a significant predictor
of performance in critical thinking, quantitative literacy, or written communication.
Program of Study. Results of multiple linear regressions revealed that program of study
showed significant findings in two areas: first, students enrolled in health programs scored higher
in critical thinking, and second, students enrolled in business and math programs scored higher in
quantitative literacy.
Credit Hours. Credit hours, indicating length of time in college, was not positively
associated with student performance on any of the three learning outcomes measured.
Degree Levels. Results of multiple linear regressions revealed that the degree level that
a student is completing is not a significant predictor of performance in critical thinking,
quantitative literacy, or written communication.

133
Synthesis
Multiple linear regressions revealed a number of findings regarding relationships between
students’ demographic background characteristics and collegiate experiences associated with
students’ learning outcome scores in critical thinking, quantitative literacy, and written
communication as measured using the Association of American Colleges and Universities
(AAC&U) Valid Assessment of Learning in Undergraduate Education (VALUE) rubrics.
I presented demographic information regarding the students at the institution under study.
Data presented confirmed that the sample was a close representation of the population of
students at the institution under study. The study included more females than males. The ages
ranged from 17 – 66 years of age. There were a higher number of students from low
socioeconomic status, as measured by Pell-eligibility.
I performed regression analyses to examine the relationships among the independent
variables. The results showed a low relationship between almost all of the variables; in all three
models certificate degrees were closely correlated with associate’s degrees, and in critical
thinking the over 50 credits earned was closely correlated with the under 30 credits earned. All
correlations among all other variables were below .80, indicating a low likelihood of
multicollinearity between the independent variables. The VIF values were below 10 and
tolerance values were greater than .1, indicating there was no reason for concern that the
independent variables excessively influence each other, or that multicollinearity was a concern.
I used the multiple linear regression in order to determine which independent variables
had statistically significant relationships to higher scores on the three learning outcomes
(dependent variables). Examination of the regression coefficient on the critical thinking outcome
revealed that there was a significant difference in females scoring lower than males, Asian

134
students having significantly lower scores, students enrolled in health programs scoring higher,
and for every year of age that a student increases they are significantly more likely to have
higher critical thinking scores. The regression coefficient on the quantitative literacy outcome
revealed that there was a statistical significance in Black students and students in business and
math programs to perform higher on the quantitative literacy outcome. Examination of the
regression coefficient on the written communication outcome reveals that there are no significant
differences in performance within all of the variables. Table 17 below provides information on
the significant predictive variables relative to their beta weights and statistical significance to the
outcome dependent variable.
Table 17
Significant Predictive Variables
Beta T Sig.
Critical Thinking
Higher scores
Health majors
Age
Lower scores
Females
Asian students
.294
.243
-.310
-.204
2.283
2.271
-3.168
-2.132
.025
.026
.002
.036
Quantitative Literacy
Higher scores
Business and math majors
African American students
.285
.242
2.298
2.092
.024
.039
Written Communication
No significant predictive variables
p < .05
This study allowed me to examine the research question and the relationships between
students’ demographic background characteristics and collegiate experiences associated with

135
students’ learning outcome scores in critical thinking, quantitative literacy, and written
communication as measured using the Association of American Colleges and Universities
(AAC&U) Valid Assessment of Learning in Undergraduate Education (VALUE) rubrics. Are
these results meaningful?
First of all, the models used in this study explained 36.5% of the variance of critical
thinking, 24% of the variance of quantitative literacy, and 31% of the variance of written
communication. In a multiple linear regression model R-squared correlates all the variables,
including the independent variables with each other as well as with the dependent variable
(Field, 2013). The variables do not explain all of the factors that contribute to student
performance. It is difficult to determine if the variance results for critical thinking, quantitative
literacy and written communication is an important amount. It makes for a good explanatory
model, but there are variables that could be added that would allow for a higher explanatory
power. Other variables could include high school grade point average or ACT and SAT scores.
The difficulty is found in the community college not tracking this information because they are
open access institutions. Other available variables could include high school attended, scores on
college entrance exams, students participating in pre-college experiences like Postsecondary
Enrollment Options (PSEO), assignment difficulty, course enrolled that the assignment was
submitted from, or the faculty status that the assignment was taken from.
Second, the results were statistically significant at the threshold of confidence of p < .05.
It suggested that the particular findings from my study is unlikely to have occurred by chance,
but also that it is practically meaningful (Pascarella, Mayhew, Rockenbach, Bowman, Seifert,
Wolniak, & Terenzini, 2016). Findings that are statistically significant are important and
necessary as individuals within higher education want to respond to these findings to create

136
change that improves student outcomes. From the data, I can draw the conclusion that there
were some significant differences between students’ performance in both the critical thinking
and quantitative literacy learning outcomes. The co-variants showed us what contributed to
improved outcomes: health majors scored higher in critical thinking and business and math
major majors scored higher in quantitative literacy. I can conclude that there is a lack of
difference between those early in their collegiate programs compared with students late in their
collegiate education in all of the outcome areas of critical thinking, quantitative literacy, and
written communication. This leads me to believe that students are not showing significant gains
in these outcomes as a result of their collegiate experience.
In addition, the beta weights indicated how much the dependent variable increased when
the independent variable increased by one standard deviation (Field, 2013). This assumes that
other variables in the model are held constant. In a multiple linear regression, the beta weights
can be ranked in order to decide which variable has the most impact (Field, 2013). It is
important to be careful not to rely on beta weights too heavily, but should be used as a starting
point for further investigation. Examination of the standardized coefficients suggest that
students in health programs (β = .294), students who increase in age (β = .243), and students
completing an associate’s degree (β = .225) and certificate degree (β = .222) were the most
positively associated with students’ development of critical thinking scores. Students in business
and math programs (β = .285) and African American students (β = .242) were the most positively
associated with students’ development of quantitative literacy scores. Students completing an
associate’s degree (β = .249) and students enrolled in health programs (β = .244) were the most
positively associated with students’ development of written communication scores. A change in
rubric scores between .222 and .294 is not a substantial change, but it is something to learn from

137
that could lead to further investigation into what variables play an important role and have the
most impact in a community college environment.
Finally, the average range of the scores on the rubrics were between .5 and 2. It is not
unreasonable that students at a community college would perform at the benchmark and
milestone levels. This is appropriate for students who have completed the majority of their
coursework for a certificate or associate’s degree. The scores were what is expected of students
in their first years at a community college. This is not to say that all students at a two-year
community college should perform at a benchmark level and progress in a linear fashion toward
the capstone level. All students perform at varying levels, and the scores found in this study
reflected this variation.
Summary
The insights gained by this research will contribute to the data regarding student
performance on institutional learning outcomes. This study hopes to provide insights gained by
the AAC&U as well as individuals at the institution under study in examining how to improve
student learning and performance. Chapter 5 brings together the previous four chapters and
analyze the findings to add interpretations and implications for further research and practice to
colleges and university personnel.

138
Chapter V: Conclusions
The purpose of this study was to examine how students performed on institutional
learning outcomes using the American Association of Colleges and Universities (AAC&U)
Valid Assessment of Learning in Undergraduate Education (VALUE) rubrics to determine
whether there were significant differences in students’ performance based upon their
demographic background characteristics and collegiate experiences. What I discovered from the
literature was that, even though there is increased pressure to measure student learning in higher
education, there is a lack of information that shows what students are actually learning while
enrolled in colleges and universities (Astin, 1993; Arum & Roksa, 2011; Berrett, 2016; Blaich &
Wise, 2011; Harward, 2007; Kuh, Ikenberry, Ewell, Hutchings, & Kinzie, 2015). Assessment
tools are often either standardized tests that do not reflect what a student is learning in the
classroom, or the tools used to assess learning consist of students’ perceptions of what they have
learned. The development of the AAC&U VALUE rubrics provided the opportunity to measure
authentic student work samples from the classroom to complete a quantitative analysis of student
rubric scores. The rubrics offered a common definition and set of criterion for select learning
outcomes that can be used to compare within and between college campuses. I developed the
following research question that served as a basis for the study:
RQ1. Is there a relationship between students’ background characteristics, collegiate
experiences, and learning outcome scores in critical thinking, quantitative literacy, and
written communication?
I examined the research question through multiple linear regressions to analyze the
relationship between the learning outcomes and the variables of race/ethnicity, age, gender, Pell-
eligibility, program of study, credit hours, and degree level. What we know from previous

139
research is that students of color and students having a low socioeconomic status have lower
levels of performance in higher education than white students (Borman & Dowling, 2010;
Campbell, 2016; Freeman & Fox, 2005; Garibaldi, 2014; Samuel & Scott, 2014). Studies
suggest the necessity of taking into account the demographic variables, such as race/ethnicity and
socioeconomic status, when evaluating student performance on learning outcomes in higher
education.
To my surprise, I discovered that students show a lack of performance on learning
outcomes as they progress through their collegiate experience (Arum & Roksa, 2011; Blaich &
Wise, 2011; Bok, 2008). The Wabash National Study of Liberal Arts Education and Arum and
Roksa’s Academically Adrift findings drew conclusions that students complete their degrees not
really having learned much from their college or university experience. Insights gained from this
study will contribute to the data regarding student performance on institutional learning
outcomes, and will inform assessment practitioners of implications for theory, practice, and
future research.
What I found from the analysis of the data used in this study is that health majors scored
higher in critical thinking. Women did not perform as well as men in critical thinking. Asians
scored lower in critical thinking. African Americans scored higher in quantitative literacy.
Students from business and math majors scored higher in quantitative literacy. As individuals
increased in age their scores in critical thinking also increase. I also found that students were not
scoring higher on any of the outcomes as they completed more credits in college. First, I discuss
my findings and compare them to the existing body of research on student performance on
institutional learning outcomes. Next, I present limitations of the study and considerations for
future research. Third, the implications of the use of Astin’s (1993) I-E-O model will be

140
addressed, as well as how my results align to a number of current findings on underachieving
colleges in regards to the lack of increase in student performance on many outcome measures.
Finally, I present implications for practice and future research in order to use the results of my
study to improve student learning and success and point to new avenues for further research
topics.
Conclusions
The results of this study suggest that implementation of the AAC&U VALUE rubrics
provides the opportunity to use authentic student work samples to gain insight into student
performance. I investigated if there was a relationship between student demographic
characteristics and collegiate experiences and their performance on learning outcomes. It would
seem that a student would increase in performance on learning outcomes as they earned more
credits in college. This lack of increase in performance based on an increase in credits earned is
in line with the findings from my literature review. Educators in higher education can use these
results to design curricula that will better prepare students for success in higher education and
increase the likelihood of faculty to design instruction with every learner in mind.
By detecting these predictors of success (age, program majors, race/ethnicity, gender),
higher education administrators can better prepare faculty to identify the needs of the students
and design instruction that will meet their learning needs. Identifying and connecting students
through engaged instruction in critical thinking, quantitative literacy, and written communication
will provide an environment that fosters an increase in attainment of these outcomes.
As presented in the first chapter, the American Association for Higher Education (AAHE)
developed principles of good practice for assessing student learning (New Leadership Alliance
for Student Learning and Accountability, 2012). These principles include tying learning with

141
educational values, such as institutional outcomes, and increasing attention to outcomes and to
the experiences that lead to increased performance in those outcomes (New Leadership Alliance
for Student Learning and Accountability, 2012).
The most important “take away” is that the results of this study suggest that
implementation of the AAC&U VALUE rubrics produce reliable results and provides the
opportunity to use authentic student work samples to gain insight into student performance. It is
imperative that individuals from institutions use the results from the assessment of learning
outcomes to make informed decisions on practices that would lead to an increase of student
performance on the outcomes. It is equally important to desegregate the data to know how
students from specific demographic background areas and collegiate experiences are performing
on the outcomes. The key to increasing performance is to provide academic support to students
that are not showing significant gains in outcome areas. All of this leads to a culture around
assessment of learning outcomes that is valuable and meaningful and works toward student
success. The results of this study suggest that there were some significant indicators related to
student learning, which are examined below.
Race/Ethnicity
Results of multiple linear regressions revealed that race/ethnicity was a significant
predictor of performance on learning outcomes in two areas. Asian students were significantly
more likely to score lower in critical thinking and African American students were significantly
more likely to score higher in quantitative literacy. The low performance of Asian students in
critical thinking was an unexpected finding. Asian students, in the research conducted by
Shireman (2016), Baum and Flores (2011), and Poon et al. (2016), have been described as high-
achieving. Shireman (2016) and Baum and Flores (2011) found that Asian Americans are more

142
likely than African Americans or Latinos to obtain a high school diploma and a bachelor’s
degree. Poon et al. found from college entry tests that Asian students are achieving high levels
of educational success. However, in my analysis, Asian students scored significantly lower in
critical thinking than all other variables other than females.
My findings in regards to Asian students are more in line with the Liu and Roohr (2013)
study. Liu and Roohr (2013) found that Asian students declined in reading, math, and critical
thinking scores on standardized tests administered over 10 years at community colleges. One
possible explanation, according to Liu and Roohr, is that there is an increase in first-generation
Asian immigrants attending community colleges over the last 10 years. Another explanation for
the low-performance of Asian students in my study may be due to the fact that there are large
variations among students from different countries of origin. I will present implication for future
research that disaggregates this population into different Asian subgroups in order to perform an
in-depth analysis of the findings. It is important to pay attention to Asian students’ declining
performance, especially if the trends of enrollment for this racial group continue to increase
across the United States (Garibaldi, 2014)
My findings in regards to African American students are not in line with research
conducted by Arum and Roksa (2011), Schmidt (2003), and Terenzini, Springer, Yaeger,
Pascarella, and Nora (1994). What we know in general about African American students’
performance in higher education is that they have lower graduation rates than White and Asian
students (Schmidt, 2003). According to Terenzini et al., (1994), Black students have
significantly smaller gains in standardized scores in critical thinking than White students.
According to Arum and Roksa (2011), Black students lagged behind white students by almost 1
standard deviation (or 34 percentile points) when they entered college, and Black students gain

143
less over time than white students, which means that the gap widens over time. Arum and Roksa
administered the Collegiate Learning Assessment (CLA) tool; which measures critical thinking,
analytic reasoning, problem solving, and written communication skills. The CLA does contain
some assessment of quantitative reasoning skills. Arum and Roksa found that African American
students enter college with lower CLA scores, and that the gap between African American and
white students widen over time.
At the two-year institution under study there is a high number of Somali students. The
results from this study do not reflect the number of African American students born inside the
United States and those who are foreign-born. It would be important in the future for community
and technical colleges to collect demographic information that breaks down race and ethnicities
into subgroups. In the era of big data, there is a necessity for institutions to collect more
information on students and the potential of seeing a more democratic way to measure outcomes.
It is interesting that my findings, in regards to the high performance of African American
students in quantitative literacy, were in line with the positive effects found in African American
students attending a two-year college (Pascarella, Edison, Nora, Hagedorn, & Terenzini,
1995/1996). When looking at institutional type and its’ impact on African American students,
attending a two-year college prior to a four-year institution found an increase in performance for
African American students on quantitative literacy skills. This is important to note, and will be
addressed in my implications for practice section.
Age
Results of multiple linear regressions revealed that age is significantly related to
performance in critical thinking. As age increased, scores in critical thinking increased. My
findings are in line with the overall results found in the studies by Hoskins, Newstead, and

144
Dennis (2006) and Sheard (2009). Hoskins et al., found age to be a significant predictor of
performance in higher education in more mature students gaining higher level of degrees than
younger students do. Sheard (2009) found that mature-age students achieved higher final degree
GPAs compared to younger undergraduates. In the findings from my study, age was not
significantly related to performance in quantitative literacy or written communication outcomes.
Gender
I found that gender was negatively associated with student learning gains in critical
thinking, indicating that women tended to score lower than men in critical thinking. My findings
are not in line with studies conducted by Garibaldi (2007), Kuh, Kinzie, Buckly, Bridges, and
Hayek (2011), and Arum and Roksa (2011). Geribaldi (2007) found that women of all
race/ethnicities are completing college at a higher rate and receiving more degrees than men do.
Kuh et al., (2011) found that college enrollment for women has increased at a higher rate than for
men and women score higher in reading and math on standardized tests than men do. Contrary
to my findings, Arum and Roksa (2011) found that women demonstrate the same level of skills
in learning outcomes such as critical thinking, complex reasoning, and writing skills and
demonstrate the same level of performance at college entrance and progress through college as
men. Similar levels of performance on the CLA for gender is interesting to note as it was in
sharp contrast to observed race/ethnicity and socioeconomic status inequalities. Women and
men entered college at a similar level of skill in critical thinking and persisted through higher
education remaining at the same levels in critical thinking.
Pell-Eligibility
This study measured socioeconomic status through Pell-eligibility, and did not find that
socioeconomic status had an impact on academic performance. My findings from the data

145
analysis was in sharp contrast to my review of the literature with regards to socioeconomic
status. According to Bowman and Dowling (2010), socioeconomic status is the best indicator of
success in achievement on learning outcomes among demographic variables. According to Kuh
et al. (2011), academic performance increased as family income increased. Fowler and Boylan
(2010) found that financial issues affect performance and students’ ability to persist. Perna and
Swail (2001) also found a link between low-income students and corresponding lower
persistence and graduation rates. Achievement outcomes for students of all race/ethnicities
increased as their income increased (Bowman & Dowling, 2010). The results of this study may
be due to the high number of Pell-eligible students found on the campus under study, or the high
diversity found in all demographic areas. My study may indicate that socioeconomic status was
not a significant indicator of performance, but it is still important to be mindful of this
demographic in future studies as prior research has shown it to be significant.
Program of Study
Program of study revealed significant findings in two areas: first, students enrolled in
health programs scored higher in critical thinking; and second, students enrolled in business and
math programs scored higher in quantitative literacy. My findings in regards to students in
health programs, and students in business and math programs are in line with research conducted
by Arum and Roksa (2011). Arum and Roksa (2011) found that students in health programs are
more likely to score higher in critical thinking and writing. A number of studies found it difficult
to determine if program of study, or other experiences, cause the differences in high scores on
learning outcomes (McDonough, 1997; Money, 1997; Sebrell & Erwin, 1998; Spaulding &
Kleiner, 1992). Gadzella and Masten (1998) and Gunn (1993) found it difficult to determine if
programs of study tend to attract students with different levels of skills, or if experiences in the

146
program of study cause the differences in skills. Arum and Roksa (2011), although indicating
that students in health programs scored higher in critical thinking, did find it difficult to
determine student performance based on programs of study.
Some programs may emphasize certain learning outcomes over other learning outcomes,
and as a result, students in these programs may score higher on outcomes such as critical
thinking than other outcomes such as written communication (Arum & Roksa, 2011).
Developing critical thinking in students is a required outcome in health programs such as pre-
nursing, nursing, home health aide, community health worker, dental assistant, pharmacy
technician, and medical office assistant. Health programs include critical thinking in
accreditation and licensure requirements. Students in health programs must be able to analyze,
reason, and make decisions in order to demonstrate proficiency in critical thinking. Students in
health majors scored higher in critical thinking due to the attention paid to this learning outcome.
I will address, in the implications for practice section, the continued attention in health programs
to familiarize students in what it means to think critically and how to measure the attainment of
this skill.
My findings also indicated that students in business and math programs scored higher in
quantitative literacy. Several components may help to explain the positive and significant
relationships observed between higher performance of students in business and math programs
on the quantitative literacy outcome. High quantitative literacy scores for business and math
students may be the effect of the course or the effect of the fact that students who are pursuing a
business or math major have a propensity for that particular learning outcome. Deciding to
pursue a particular major indicates not only that there is the potential for taking classes in that
major but also an interest in that subject. Business and math majors may enjoy math, and,

147
consequently, take classes in that area. The students in these majors receive more practice in
quantitative literacy skills because they do math regularly in their classes. Proficiency in a
particular learning outcome may be another indicator for success. It is not surprising that my
findings revealed that students in health programs performed higher in critical thinking and
students in business and math programs had higher scores on the quantitative literacy outcome.
Credit Hours
Credit hours, indicating length of time in college, was not positively associated with
student performance on any of the three learning outcomes measured. This lack of difference by
credit hours earned is important as it provides some empirical support for the findings from Liu
and Roohr (2013), Bok (2008), Arum and Roksa’s (2011) study as well as the Wabash National
Study (2007), which indicate that a significant number of students do not demonstrate
improvements in a range of learning outcomes as they progress through their college experience.
Longitudinal studies are necessary to test whether this lack of progress persists when tracking the
same group of students through college, which is difficult to complete at a two-year community
college because the student completion rate remains low and it is challenging to track students if
they transfer to other institutions to complete their degrees.
My data included scores from students at the beginning of their college experience,
having completed less than 30 credits, and at the end of their college experience, having
completed more than 50 credits. Note that most community college degrees only require around
60 credits, but it is possible for students to have completed more than 60 credits due to a change
in majors or transferring in a number of credits. I decided to categorize students who have
completed 0-30 credits and students who have completed over 50 credits earned. The recently
released VALUE Report (2017) included associates degree students enrolled at a 2-year college

148
as those students who completed over 45 credits in the category of completing more than 75% of
their program of study. It is important to note that in this study, as well as in the AAC&U multi-
state study findings in the VALUE Report in 2017, the credit hours completed may not reflect
students enrolled in certificate or diploma degree programs.
Pascarella and Terenzini, in their 1991 synthesis, found that students’ exposure to
postsecondary education increased performance in critical thinking, quantitative literacy, and
written communication. In Pascarella and Terenzini’s 2005 synthesis uncovered inconsistent
findings and did not see the same gains from freshmen to senior progress as they did in their
1991 synthesis of the research. Much of the work of Pascarella and Terenzini’s first two
volumes focused on a comparison between students who attended college versus those who did
not. The 2016 volume did not find that researchers were conducting studies that compared
students who attended college with students who did not, but rather focused on longitudinal
studies that evaluated performance based on progress through college measured in credit hours
(Pascarella et al, 2016). The studies reviewed in the most recent volume did not see significant
progress in students as they progressed through college. The current volume aligns with the
focus of my study, and the findings presented here that students do not experience significant
progress in select learning outcomes with the increase in the number of credit hours completed.
Degree Levels
Results of multiple linear regressions revealed that the degree level that a student is
completing was not a significant predictor of performance in critical thinking, quantitative
literacy, or written communication. Students earning an associate’s degree did not perform
higher on any of the learning outcomes than students earning a certificate degree. Arum and
Roksa (2011) found that the type of coursework varied in the degree requirements, and reported

149
that students in higher-level degrees took courses with high reading and writing requirements.
According to the research findings, degree levels have not consistently affected students’ level of
performance on learning outcomes. For instance, Harper (2006) found that race/ethnicity and
gender were greater indicators than degree levels on performance on learning outcomes.
Although the beta weights did indicate associate’s degrees were the positively associated with
students’ development of critical thinking and written communication scores, the findings from
the data analysis were in line with the inconclusive findings from the literature. As stated earlier,
it is important to be careful not to rely too heavily on beta weights, but they are a starting point
for further investigation into the impact of associate’s degrees compared with other variables.
Dependent Variables
I conducted an analysis to show the mean averages for the variables used in the multiple
regression analysis. This indicated that the mean scores for all students in critical thinking was
1.683, quantitative literacy was 1.6195, and written communication was 1.952. The rubrics are
assessment tools that include definitions and criteria that involve not only knowledge, but also
values, attitudes, and habits of mind. Student performance measures the “benchmark” starting
point for learning (score of 1), “milestones” representing progress toward more accomplished
performance (score of 2-3), and the “capstone” describing the culminating level of achievement
(score of 4). Students can score zero, which could represent that this criterion was not attempted
or that this criterion was attempted but the student failed to reach the benchmark. In critical
thinking and quantitative literacy, the average score for all student performance measured
between benchmark and milestone, or starting point for learning. In written communication, the
average score for all student performance measured at the beginning of the “milestone” level,
representing more accomplished performance.

150
The findings in my study aligned with the VALUE Report (2017) findings that the
strongest student performance was found in written communication. The report limited its
analysis to initiative-wide results for 2-year and 4-year institutions, including only the data from
students who had completed 75% of the credits toward program completion. It provided only the
score percentages for individual criterion and not overall rubric scores. It did not break down
any of the data into performance based on students’ demographics.
There is some discussion in regards to the AAC&U VALUE rubrics that students
attending a two-year community college should perform at the “benchmark” or beginning of the
“milestones” level. As students’ progress and transfer to a four-year college or university, they
should progress further on the scale reaching higher “milestones” and finally the “capstone”
level. The newly released VALUE Report (2017), makes no determination of what types of
scores should be considered levels of achievement at two-year institutions. They qualify this by
adding that the rubrics reflect the collective best thinking for learning within higher education,
“so it is not unreasonable to say that scores at the two Milestone levels are appropriate for
students who have completed the majority of their coursework for an associate’s degree” (p. 35).
My conclusion is that the average scores in this study are what you would expect of students in
their first year at a community college.
Summary Discussion
The AAC&U VALUE rubrics create a common framework to define and measure
specific learning outcomes. Progress in analyzing the data that has been gathered from the multi-
state and within-state projects to measure select outcomes using the VALUE rubrics is lacking.
Only recently, January 2017, a report came out from AAC&U with an overview of the multi-
state and two within-state projects and their findings. Very little is known regarding the in-house

151
assessments that colleges participate in through the use of these rubrics. One concern is that the
data collected to assess learning outcomes is not being used to make informed decisions that
impact student performance on the outcomes measured. Faculty participating in assessment
acknowledge that there are several years of student learning outcomes assessment data that has
not been evaluated or reported back to stakeholders to indicate how students are performing or
what can be done to work toward continuous improvement (VALUE Report, 2017). Greater
attention should be paid to use the data aggregated through the use of the VALUE rubrics to
assess authentic student learning outcomes to produce meaningful and sustainable benefits to
practices that lead to student success.
What was surprising are the areas in which there were no significant findings. There
were no significant differences between several race/ethnicity demographics (including Native
American, Hispanic, and multiracial), several programs of study (including criminal justice,
social science, science, education, and technical programs), socioeconomic status, credit hours
completed, and degree level of the student on the three VALUE rubric outcome measures. If
students are gaining knowledge during their college experience, measured in credit hours
completed, scores should increase with more credits completed.
The model in this study explained 36.5% of the variance of critical thinking, 24% of the
variance of quantitative literacy, and 31% of the variance of written communication. This
indicates a good model fit. We can’t explain all factors that contribute to student performance on
outcomes, but my study explained approximately one-third of the variation in performance on
the dependent variables.
This study produced a number of significant findings, to provide important information
about students’ learning on these three learning-outcome assessments. This study provides

152
implications for administrators, faculty members, researchers, and policymakers in regards to
future research, practice, and theory. My findings point to the need to further utilize qualitative
and quantitative assessments using the VALUE rubrics to produce comparable results to conduct
with-in institution evaluation and between-institution comparisons that should lead to
improvement.
Limitations
I conducted this study in one institution of higher education located in a Midwestern
urban area. The particular institutional context of the study – student demographic
characteristics, geography, institution type, and programs of study – could limit generalizability
of the findings to other institutional types. In addition to the fact that the study was conducted at
one institution, it also does not involve a random sample, which would limit the generalizability.
Data was missing for a number of students in the Pell-eligible category because there was
no information on a number of students. This could be due to students being ineligible for
financial aid, (wealthy, international, undocumented, etc.) or not having completed the Free
Application for Federal Student Aid (FAFSA). Studies have indicated that many students who
would be Pell-eligible do not complete the FAFSA (Kantrowitz, 2009). As mentioned earlier,
these students were removed from the study.
Low scores of Asian students in critical thinking may be because this demographic
includes a wide variety of Asian cultures, with tremendous variations in ethnicity and
socioeconomic class (Chang, Park, Lin, Poon, & Nakanishi, 2007). It is unrealistic to view all
Asian categories as having similar demographic characteristics and experiences within higher
education. Not having desegregated this population into subgroups may limit the analysis of
these findings. A study that broke down the race/ethnicities into subcategories would be

153
valuable. Black students include both individuals born in the United States as well as foreign-
born, and not differentiated in this study. Further research differentiating race/ethnicities would
provide valuable insight into student performance regarding specific demographic
characteristics.
There were limited variables for me to use to match the I-E-O model. There were some
variables that could potentially have informed this study that were not being tracked by the
institution, and therefore were not included in my study. Community colleges may not collect
the kind of admissions data collected at a four-year university including high school attended,
attitudinal indicators like intent for enrolling, ACT scores, high school grade point average, or
students participating in pre-college experiences like Postsecondary Enrollment Options (PSEO).
A determination was made to use 0-30 credits earned and over 50 credits earned. This
reflects the population of students at a community college who are enrolled in an associate’s
degree, but does not take into account those students enrolled in a certificate or diploma
program. It also does not take into account students who enroll who are not seeking a degree,
but are taking a course for another reason.
Despite these limitations, there are several strengths to this study. To my knowledge, this
is the first dissertation that uses authentic student work samples scored with the AAC&U
VALUE rubrics to evaluate students’ performance on learning outcomes. A recent report was
released by AAC&U in January 2017 that does not include an analysis of the demographics
included in this study. The variables included in my study identify and provide information in
regards to Astin’s I-E-O model that includes Input (race/ethnicity, age, gender, Pell-eligibility)
Environment (programs of study, degree level, credit hours) and Outcomes (critical thinking,
quantitative literacy, written communication) measures.

154
Recommendations
Based on the results of the study, there are a number of recommendations for future
efforts centered on theory, practice, and research that would directly impact student performance
on institutional outcomes.
Implications for Theory
Theories provide an opportunity to explain the relationships among and between the
variables in the study, but are often not considered to be measured directly. The difficulty I
found in developing the theory for my dissertation was that there is a lack of theories that explain
the how and why of student learning. I found research studies that explained learning measures,
and the magnitude of what was learned, but this was limited to research findings and not to
theories related to student learning. The first two Pascarella and Terenzini (1991, 2005)
volumes, and the third volume by Pascarella et al. (2016), provide many relevant examples of
how college affects students. The difference between the synthesis of the studies gathered in the
Pascarella and Terenzini texts and the creation of a theory is that a theory explains the how and
why of the phenomena related to the studies.
Arum and Roksa’s (2011) findings and the Wabash National Study (2007) findings
explored the lack of increase in student performance on institutional outcomes. These two
studies were longitudinal, which adds to their value. Longitudinal studies are difficult to perform
at a two-year college, due to the low completion rate and the reality that students transfer to four-
year institutions to complete their degree. What these two studies failed to do, however, was to
discuss the reasons for the lack of performance on learning outcomes. For example, the studies
failed to explore how the increase in use of technology benefit or detract from the development
of critical thinking, quantitative literacy, and written communication in higher education today.

155
Arum and Roksa (2011), critique higher education institutions because their research suggests
that students in higher education do not demonstrate significant improvements of learning
outcomes throughout the four-semester span of their study. Arum and Roksa’s work serves as a
framework for components of this study, including the duration of study (as shown in credits
earned) and performance on the AAC&U VALUE rubrics criteria, but is not a theory that relates
to students’ performance on outcomes.
Astin’s I-E-O model was the closest I could find to a theory. Astin’s model was first
developed in 1962, which suggests there is work to be done in developing relevant theories today
that relate to student learning, the assessment of student learning, and students’ performance on
learning outcomes. The basic elements have remained the same over the years and remain
relevant today, yet Astin’s I-E-O Model was developed over fifty years ago.
Astin’s I-E-O model served as a framework for my study to determine student
performance at one point in time, based on the characteristics students bring to college. The
model allowed for the independent variables used in my study to be open to choice and
availability of data collected at the institution. Astin’s (1993) study indicated that students’
change in many ways through their college experience. Women get better grades in college, are
more likely to complete a bachelor’s degree and graduate with honors; and men become more
proficient on verbal and quantitative scales on the GRE test (Astin, 1993). My study actually
found that females have the most significant negative outcome than any other indicator in critical
thinking, although I am unable to know if this was a pre-college condition or one obtained during
college. Astin found that students from high socioeconomic families have the most significant
positive outcomes in college in completion of a bachelor’s degree, satisfaction with the
undergraduate experience, a higher grade point average, more likely to enter graduate school,

156
higher retention and completion rates, and significantly higher scores in critical thinking and
problem solving skills (Astin, 1993). This study did not find socioeconomic status to be a
significant predictor of positive or negative outcomes in critical thinking, quantitative literacy, or
written communication. However, this might be because the yes/no response on Pell Eligibility
is not a very effective measure of socioeconomic status and the Pell qualification standards are
so low that many non-Pell eligible students are still at a relatively low socioeconomic status.
It would be helpful in the future to find ways to measure learning to better understand
student development and connections between theory and practice. The future may include a
Norman Model of Student Outcomes, based on what is lacking today in regards to relevant
student learning theories. This model would include the use of tools, such as the AAC&U
VALUE rubrics, to assess authentic student learning. The rubrics appear to lead to equitable
results that move toward a more democratic way to measure learning. It is difficult to avoid
cultural bias in standardized tests (Jaschik, 2010; Reese, 2013). This new model promotes racial
equity by evaluating students on an individual basis. The model will encourage the interaction
between faculty and students in the assignment design process through the integration of clearly
defined criteria necessary for students to demonstrate the desired outcome. Student involvement
in the implementation of rubrics that define criteria, along with assignment design, would lead to
significant learning experiences and increase student performance in outcomes such as critical
thinking, quantitative literacy, and written communication. There is work to be done to develop
this new model that connects theory to practice. To summarize, the theory I am suggesting
connects authentic student work taken from course assignments with the implementation of
clearly defined criteria to increase individual student performance that is equitable and
democratic.

157
Implications for Practice
This study adds to the research using a quantitative method to move beyond raw data to
produce findings to allow individuals within institutions to improve decision-making that leads
to student success. There is a gap between the introduction of the critical thinking learning
outcome and the measurement of this skill that fails to guide instructors in how to teach critical
thinking (Willingham, 2007). Through the implementation of essential learning practices, such
as active learning, instructors can be developed in their craft of teaching to better meet the needs
of their students. The implication is that there is a compelling need to strengthen the support of,
and investment in, faculty development at the community college level.
Based on the results of the study, it is crucial to understand the challenges and barriers
females and Asian students experience in critical thinking in higher education, and to develop
strategies to overcome those barriers. Providing academic support to these two demographics is
essential. Kim and Sax (2011), found that Asian American students showed significant gains in
critical thinking skills when connected to faculty interaction. Providing Asian role models in the
classroom can significantly influence performance in learning outcomes (Liu & Roohr, 2013).
Programs like Statway, a two-semester course for completing a college-level statistics equivalent
for developmental math students, identify at-risk students in math, but there are other programs
to identify at-risk students in other learning outcomes (Carnegie Foundation, 2017). Statway is a
student-centered approach that focuses on involving students in their own learning and breaks
down negative ideas of struggle areas to create a sense of belonging to empower students toward
success. Low confidence levels, lack of support, lower levels of academic preparation in pre-
college education experience, and lack of support from college faculty of students who have

158
been historically marginalized may deter students from performing in areas such as critical
thinking, quantitative literacy, and written communication.
The institution under study has taken measures to directly work toward increasing a
students’ sense of belonging in math courses by implementing the Statway program. The
Statway program may have led to an increase in math scores for African American students who
participated in this study. It is interesting to note that my study was in line with the findings that
African American students’ performed higher in quantitative literacy when they attended a two-
year college before a four-year institution (Pascarella et al., 1995/1996). One practice to
consider is to encourage students to complete their math requirement at the two-year level before
transferring to a four-year institution to complete their degree. It would be interesting to track
whether or not any of the students who scored higher in quantitative literacy completed the
Statway program.
An important implication for practice is to encourage individuals within institutions to
report results of data collection to stakeholders impacted by the assessment of learning outcomes.
Very little is known about the in-house assessment procedures and use of results within
institutions that are implementing the AAC&U VALUE rubrics. Individuals within institutions
of higher education are collecting this data, but may not be using the results to make informed
decisions about how students are learning or what can lead to improvements in learning. Blaich
and Wise suggest that individuals use the data already collected to perform thorough audits of
useful information (2011). Individuals within the institution under study should allow a
significant number of faculty, staff, students, and administrators an opportunity to respond to the
evidence – and engage in collaborative discussions surrounding the results of the findings as well
as the use of the VALUE Rubrics. This would allow individuals an opportunity to offer their

159
perceptions of what the results might indicate as well as discuss the potential of the rubrics as an
equitable assessment tool to measure student learning. Response from faculty, staff, and
administrators could identify one or two outcomes on which to focus improvement efforts.
Blaich and Wise emphasize how important and impactful it is to include students in the
discussion. As already emphasized, students should be brought in to the assessment process and
instructional design at all stages of the implementation of the AAC&U VALUE rubrics.
During this time of big data, institutions need to collect more information on students.
Community colleges are open access and, therefore, are not tracking important demographic
information that would lead to informed decisions on student performance. The study is not able
to analyze which specific Asian American subgroups performed poorly in critical thinking or if
there were specific African American subgroups that scored higher in quantitative literacy.
Socioeconomic status is measured by Pell-eligibility. Students are either Pell-eligible or they are
not. It would be helpful to analyze socioeconomic status as a continuum based on income, rather
than through the yes or no response indicating Pell-eligibility status. Pell-eligibility is difficult to
define as students may come from the same circumstances, but be coded differently. An
implication for future practice needs to include a better plan to gather demographic information
that would lead to a more democratic way to measure and analyze student performance on
learning outcomes. Present practices make it difficult to analyze the findings to make relevant
steps to increase student performance.
Use of Rubrics. One last implication for practice is to promote the use of rubrics as a
teaching tool to improve existing assignments and to share with students to create a better
understanding of how to demonstrate outcomes. According to Goodrich-Andrade (2000), rubrics

160
are easy to use and explain to students, allow students to know what they will be graded on, and
provide students with feedback about their strengths and areas of needed improvement.
This study revealed the possibility of faculty use of common rubrics to evaluate authentic
student work samples. According to AAC&U’s On Solid Ground report (2017), faculty can
score these artifacts produced within their area of expertise or outside of their area of expertise.
A wide range of individuals within institutions across the nation, and even globally, can develop
plans that use student work samples across a variety of departments to demonstrate achievement
of select student learning outcomes. Faculty members within institutions can train and produce
reliable results using a rubric-based assessment approach rather than rely on standardized tests to
determine performance on learning outcomes. The results taken from the data can be used to
improve assignments to teach and assess key learning outcomes such as critical thinking,
quantitative literacy, and written communication. Faculty members can use the rubrics with
students to allow them to see the elements necessary to demonstrate proficiency in the learning
outcome.
A web-based program, such as TaskStream or SharePoint, can create a framework to
upload and score student artifacts to facilitate in the assessment process. According to the
AAC&U report (2017), “any system of reviewing learning outcomes should help build and
support a culture of student learning that allows for assessment results to be used by each campus
and by larger public systems for improving student learning and for program improvement” (p.
19). The key element of this statement is the importance of building a culture that uses
assessment results for improvement of learning. The use of assessment results is missing in
closing the loop that leads to improvement in student performance. What I discovered in my
research is that there are more than enough data being gathered. The analysis of the data and

161
reporting back the results is what is missing on college campuses today. The use of the rubrics
would allow for an approach that is designed to measure how students from a variety of
demographics perform on select learning outcomes.
The results of this study suggest that the VALUE rubrics are an unbiased assessment tool.
The utility of the findings indicate very few differences in scores that point to the possibility that
the rubrics are nonbiased, and can be used to develop and score artifacts that individualize
results. This is a remarkable study in that it contributes to the work that is currently being
undertaken in using the VALUE rubrics, but the findings also suggest that this is an assessment
tool that provides an opportunity to go beyond standardized tests and students’ perceptions of
their learning to create equity in student learning.
As individuals in institutions bring stakeholders within the campus community together
to participate in implementing the AAC&U VALUE rubrics, it is important to focus on
intentional assignment design that leads to students having the opportunity to learn and succeed
in these learning outcomes. According to Berrett (2016), implementation of the VALUE rubrics
in a project will help guide faculty on how to create assignments that develop skills in critical
thinking, quantitative literacy, and written communication. It is not that students cannot
demonstrate the skill; it may be that students do not receive information about what that skill is
(Berrett, 2016). Embedding the VALUE rubrics into course assignments encourages faculty to
revise assignments and make explicit steps for students to demonstrate select learning outcomes.
For instance, individuals within institutions can study a course or a number of courses within a
program and focus on one learning outcome during one semester or over time. Faculty can work
on developing skills through implementing modifications in the curriculum then reassess the
learning again after those changes take place to look for improvements.

162
Implications for Research
In reviewing the limitations of the study, they provided areas of opportunity for future
researchers to gather additional information regarding student demographics to examine
measures of students’ development in learning outcomes using authentic classroom assignments.
Researchers could look into students in the Pell-eligible variable to determine status for students
who do not complete the FAFSA. It would be interesting to learn how international or
undocumented students, who would not have completed the FAFSA, score compared to native-
born students.
Gaining further insight into what variables would contribute to the literature, researchers
may consider including a number of student demographic characteristics and collegiate
experiences. The list of variables used in my study is not an exhaustive list. The community
college staff may not collect the kind of data collected at a four-year university. Further research
could include variables such as ACT scores, students’ high school grade point average (GPA),
students participating in pre-college experiences like Postsecondary Enrollment Options (PSEO)
or College in the Schools (CIS), high school attended, score on placement tests, and attitudinal
indicators like educational intent.
My study provides a correlational research design to consider the use of quantitative
methods presented here to drive continued research in the use of the AAC&U VALUE rubrics to
measure student performance on institutional learning outcomes. Future research might also
involve qualitative methods in relation to the AAC&U VALUE rubrics. Qualitative methods
may include interviews and observation of faculty regarding assignment design and scoring
methods. Qualitative methods such as conducting interviews with students may add meaning to
their experiences and perceptions of their performance on learning outcomes.

163
Continued work to embed Astin’s I-E-O model within future research would emphasize
inputs and experience to the VALUE rubric outcomes. Future researchers may adopt alternative
models to examine student performance on learning outcomes using authentic student work
taken from classroom assignments. Currently, research in using authentic student work tied to
performance on institutional learning outcomes is limited. Continued research using authentic
student work samples taken from their classroom experience, and scored using the AAC&U
VALUE rubrics, would prove valuable and provide insight into what leads to progress in learning
outcomes for all students. Ideally, it would be beneficial to use authentic work samples on the
same students on two or more occasions and then compare the outcomes at these different times
to be able to measure an increase in performance. However, this type of longitudinal data
collection requires tracking of students’ personal information, as well as an increase in human
and financial resources beyond those needed in a single data collection (Pascarella et al., 2016).
Obtaining longitudinal data at a two-year community college is a challenge as students drop out
and transfer and the time between the initial sample and follow-up sample may be too short for a
significant increase in performance to occur.
Astin’s (1993) intensity of exposure addresses the frequency of interaction with other
students and with faculty. Intensity of exposure is not included in this study. Another area for
future research adds faculty interaction with students through interviews and observations in a
qualitative or quantitative study approach. Faculty interaction can be studied through intentional
assignment design and implementation that focuses on specific criteria within an outcome as
presented in the VALUE rubrics.
Last, future research could include a deeper analysis of existing data from the
institution’s participation in the AAC&U project. An analysis of the data could include an in-

164
depth review of only one of the learning outcomes. The data could be desegregated into
race/ethnicities subgroups to determine if there is a difference in performance for particular
student populations. The data could be broken into separate categories for students enrolled in
certificate programs, diploma awards, and associate’s degrees. Analysis could evaluate the
faculty members to see if there is an impact on student performance based on full-time or adjunct
faculty. If this type of data was available, future research could include additional variables that
may further explain all of the factors that contribute to student performance. Further analysis of
the data from the institution under study could provide additional insights into student
performance.
Summary
In summary, the results of this study suggest that the AAC&U VALUE rubrics not only
provides the unique opportunity to use authentic student work samples to gain insight into
student performance, but it also appears to be an unbiased assessment tool to measure learning.
Continued implementation of the VALUE rubrics is encouraged on this and other college
campuses. Introduce the definition and criteria included in the rubrics for select learning
outcomes, desegregate the demographic variables to collect important information, analyze
results, and then use the data to dialogue on how students’ performed on the learning outcomes.
Future development of the Norman Model of Student Outcomes connects authentic student work
taken from course assignments with the implementation of clearly defined criteria to increase
individual student performance that is equitable and democratic.

165
References
American Psychological Association. (2015). Education and Socioeconomic Status Fact Sheet.
Retrieved from http://www.apa.org/pi/ses/resources/publications/factsheet-
education.aspx
Arum, R., & Roksa, J. (2011). Academically adrift: Limited learning on college campuses.
Chicago, IL: University of Chicago Press.
Association of American Colleges & Universities. (2015). AAC&U VALUE project: Minnesota
collaborative & Great Lakes Colleges association collaborative sampling plan
guidelines.
Association of American Colleges and Universities. (2017). Essential learning outcomes.
Retrieved from http://www.aacu.org/leap/essential-learning-outcomes
Association of American Colleges and Universities. (2017). On solid ground: VALUE report
2017. Retrieved from
https://www.aacu.org/sites/default/files/files/FINALFORPUBLICATIONRELEASEONS
OLIDGROUND.pdf
Astin, A. W. (1977). Four critical years: Effects of college on beliefs, attitudes, and knowledge.
San, Francisco, CA: Jossey-Bass.
Astin, A. W. (1985). Achieving educational excellence: A critical assessment of priorities and
practices in higher education. San Francisco, CA: Jossey-Bass.
Astin, A. W. (1993). What matters in college: Four critical years revisited. San Francisco, CA:
Jossey-Bass.

166
Baker, R. (2004). Keystones of regional accreditation: Intentions, outcomes and sustainability. In
P. Hernon & R. E. Dugan (Eds.), Outcomes assessment in higher education: Views and
perspectives (pp. 1-15). Westport, CT: Libraries Unlimited.
Baum, S. & Flores, S. M. (2011). Higher Education and Children in Immigrant Families.
Future of Children. 21(1), 171-193.
Berrett, D. (2016, October 16). The next great hope for measuring learning. Chronicle of Higher
Education. Retrieved from http://chronicle.com/article/The-Next-Great-Hope-for/238075
Black, K. E. & Kline, A. K. (2002). Program review: A spectrum of perspectives and practices.
In T. W. Banta and Associates (Eds.), Building a scholarship of assessment (pp. 223-
239). San Francisco, CA: Jossey-Bass.
Blaich, C. & Wise, K. (2007). Overview of findings from the first year of the Wabash national
study of liberal arts education. Wabash National Study of Liberal Arts Education.
Retrieved from
http://static1.1.sqspcdn.com/static/f/333946/3612649/1247854258370/Overview_of_Find
ings_from_the_First_Year_web_07.17.09.pdf?token=ToYnoSXgQf0K3uYaU5JOFwOqp
VA%3D
Blaich, C. & Wise, K. (2011). From gathering to using assessment results: Lessons from the
Wabash National Study. Wabash National Study of Liberal Arts Education. Retrieved
from http://learningoutcomesassessment.org/documents/Wabash_001.pdf
Bok, D. (2008). Our underachieving colleges: A candid look at how much students learn and
Why they should be learning more. Princeton University Press.
Bologna Secretariat. (1999). Making the most of our potential: Consolidating the European

167
Higher Education Area. Bucharest Communiqué of the European Ministers of Education,
Retrieved from
https://media.ehea.info/file/Ministerial_conferences/02/8/1999_Bologna_Declaration_En
glish_553028.pdf
Booth, W. C., Colomb, G. G, & Williams, J. M. (2008). The craft of research (3rd ed.). Chicago,
IL: University of Chicago Press.
Borman, G. D., & Dowling, M. (2010). Schools and inequality: A multilevel analysis of
Coleman’s equality of educational opportunity data. Teachers College Record, 112(5),
1201-1246.
Bray, G. B., Pascarella, E. T., & Pierson, C. T. (2004). Postsecondary education and some
dimensions of literacy development: An exploration of longitudinal evidence. Reading
Research Quarterly, 39(3), 306-330.
Bresciani, M. J., Gardner, M. M., & Hickmott, J. (2009). Demonstrating student success: A
practical guide to outcomes-based assessment of learning and development in student
affairs. Stylus Publishing, LLC.
Brock, T. (2010). Young adults and higher education: Barriers and breakthroughs to success:
Future of Children, 20(1), 109-132.
Campus Fact Sheet. (2016). Retrieved from: http://www.minneapolis.edu/About-Us/Fact-Sheet
Carnahan, J. (2015). Colleges across the country demonstrate they can evaluate authentic
student work consistently across institutions and states. State Higher Education Executive
Officers Association. Washington, D.C. Taken from

168
http://www.sheeo.org/sites/default/files/MSC%20Pilot%20Study%20Results%20Release
_SHEEO_092415.pdf
Carnahan, J. & Rhodes, T. (2016, March 24). The multi-state collaborative to advance learning
outcomes assessment/VALUE initiative [Webinar]. In Taskstream Webinar Series.
Retrieved from https://www1.taskstream.com/resource/assessment-for-improvement-
mscwebinar1/?utm_source=Pardot&utm_medium=email&utm_campaign=March2016M
SCWebinarRecording
Carnegie Classification of Institutions of Higher Education. (2017). Retrieved from:
http://carnegieclassifications.iu.edu/lookup_listings/view_institution.php?unit_id
Carnegie Foundation for the Advancement of Teaching. (2017). How a network improvement
Community improved success rates for struggling college math students. Retrieved from:
https://www.carnegiefoundation.org/resources/publications/how-a-networked
improvement-community-improved-success-rates-for-struggling-college-math-students/
Chang, M. J., Park, J. J., Lin, M. H., Poon, O. A., & Nakanishi, D. T. (2007). Beyond myths:
The growth and diversity of Asian American College Freshmen, 1971-2005. Los Angeles:
Higher Education Research Institute, UCLA.
Commission on the Future of Higher Education, Secretary of Education, U.S. Department of
Education. (2006). A test of leadership: Charting the future of U.S. higher education.
Washington, D.C.: U.S. Department of Education. Retrieved from
http://www2.ed.gov/about/bdscomm/list/hiedfuture/reports/final-report.pdf
Engle, J., & Tinto, V. (2008). Moving beyond access: College success for low-income, first
generation students. Pell Institute for the Study of Opportunity in Higher Education.

169
Erwin, T.D. (1991). Assessing student learning and development: A guide to the principles,
goals, and method of determining college outcomes. San Francisco, CA: Jossey-Bass.
Ewell, P. (2010). Twenty years of quality assurance in higher education: What's happened and
what's different? Quality in Higher Education, 16(2), 173-175.
doi:10.1080/13538322.2010.485728
Ewell, P. T. (2002). An emerging scholarship: A brief history of assessment. In T. W. Banta and
Associates (Eds.), Building a scholarship of assessment (pp. 3-25). San Francisco, CA:
Jossey-Bass.
Fain, P. (2012, December 5). More cracks in the credit hour. Inside Higher Ed. Retrieved from
https://www.insidehighered.com/news/2012/12/05/carnegie-foundation-considers
redesign-credit-hour
Fain, P. (2016, December 8). Completion and the value of college. Inside Higher Ed. Retrieved
from https://www.insidehighered.com/news/2016/12/08/experts-talk-about-college-
completion-push-and-what-comes-next
Field, A. (2013). Discovering statistics using IBM SPSS statistics. London, England: SAGE
Publications.
Finley, A. (2011). How reliable are the VALUE rubrics? Washington, DC: Association of
American Colleges and Universities. Retrieved from
https://www.aacu.org/peerreview/2011-2012/fall-winter/finley
Fowler, P. R., & Boylan, H. R. (2010). Increasing student success and retention: A
multidimensional approach. Journal of Developmental Education, 34(2), 2-4, 6, 8-10.
Flowers, L. A. (2003). Differences in self-reported intellectual and social gains between African

170
American and White college students at predominantly White institutions: Implications
for student affairs professions. Journal of Student Affairs Research and Practice, 41(1),
68-84.
Fragoso, A., Goncalves, T., Ribeiro, C. M., Monteiro, R., Quintas, H., Bago, J., Fonseca, H. M.,
Santos, L. (2013). The transition of mature students in higher education: Challenging
traditional concepts? Studies in the Education of Adults 45(1), 6-81.
Freeman, C., & Fox, M. (2005). Status and trends in the education of American Indians and
Alaska Natives (NCES 2005-18). U.S. Department of Education, National Center for
Education Statistics. Washington, D.C.: U.S. Government Printing Office. Retrieved
from https://nces.ed.gov/pubs2005/2005108.pdf
Gadzella, B., & Masten, W. (1998). Critical thinking and learning processes for students in two
major fields. Journal of Instructional Psychology, 25, 256-261.
Garibaldi, A. (2014). The expanding gender and racial gap in American higher education.
Journal of Negro Education 3(33), 371-384.
Garibaldi, A. M. (2007). The educational status of African American males in the 21st century.
Journal of Negro Education, 76(3), 324-333.
Gray, P. J. (2002). The roots of assessment: Tensions, solutions, and research directions. In T. W.
Banta and Associates (Eds.), Building a scholarship of assessment (pp. 223- 239). San
Francisco, CA: Jossey-Bass.
Goodman, K. M., Baxter Magolda, M., Seifert, T. A., & King, P.M. (2011). Good practices for
student learning: Mixed-method evidence from the Wabash National Study. About
Campus, 16(1); 2-9.

171
Goodrich-Andrade, H. (2000). Using rubrics to promote thinking and learning. Educational
Leadership, 57(5), 13-18. Retrieved from http://www.ascd.org/publications/educational-
leadership/feb00/vol57/num05/Using-Rubrics-to-Promote-Thinking-and-Learning.aspx
Gunn, C. (1993). Assessing critical thinking: Development of a constructed response sheet.
Dissertation Abstracts International, 54, 2267B.
Gurin, P., Dey, E. L., Hurtado, S., & Gurin, G. (2002). Diversity and higher education: Theory
and impact on educational outcomes. Harvard Educational Review, 72(3), 330.
Harper, S. R. (2006). Black male students at public flagship universities in the US: Status trends
and implications for policy and practice. Washington, DC: Joint Center for Political and
Economic Studies.
Hart Research Associate. (2010). Raising the bar: Employers views on college learning in the
wake of the economic downturn. Washington, DC: Association of American Colleges and
Universities.
Hart Research Association (2013). It takes more than a major: Employer priorities for college
learning and student success. Washington, DC: Association of American Colleges and
Universities.
Harward, D. W. (2007). Examining the outcomes of the bringing theory to practice project.
Peer Review, 9(3). Retrieved from https://www.aacu.org/publications-
research/periodicals/examining-outcomes-bringing-theory-practice-project
Heller, D. E. (2002). State aid and student access: The changing picture. Condition of Access:
Higher Education for Lower Income Students. Westport, CT: Praeger Publishers.
Hoskins, S. L., Newstead, S. E. & Dennis, I. (2006). Degree performance as a function of age,

172
gender, prior qualifications and discipline studied. Assess & Evaluation in Higher
Education 22(3), 317-328. Doi: 10.1080/0260293970220305
JBHE Foundation. (2015). Black student college graduation rates remain low, but modest
progress begins to show. The Journal of Blacks in Higher Education, 50(1), 88-96.
Jankowski, N., Hutchings, P., Ewell, P., Kinzie, J., & Kuh, G. (2013). The degree qualifications
profile: What it is and why we need it now. Change, 45(6), 6-15.
doi:10.1080/00091383.2013.841515
Jaschik, S. (2010, June 21). New evidence of racial bias on SAT. Inside Higher Ed. Retrieved
from https://www.insidehighered.com/news/2010/06/21/sat
Kantrowitz, M. (2009). Analysis of why some students do not apply for financial aid. Retrieved
from http://www.finaid.org/educators/20090427CharacteristicsOfNonApplicants.pdf
Kaplin, W. A. & Lee, B. A. (2014). The law of higher education. San Francisco, CA: Jossey-
Bass.
Kim, Y. K., & Sax, L. J. (2011). Are the effects of student-faculty interaction dependent on
academic major? An examination using multilevel modeling. Research in Higher
Education, 52(6), 589-615.
King, P. M., Baxter Magolda, M. B. Barber, J. P., Perez, R. J., & Taylor, K. B. (2012, November).
Researcher learning about assessing student development: Lessons from the Wabash
National Study. Symposium conducted at the annual conference of the Association for the
Study of Higher Education, Las Vegas, NV.
Kugelmass, H. & Ready, D. D. (2011). Racial/ethnic disparities in collegiate cognitive gains: A

173
multilevel analysis of institutional influences on learning and its equitable distribution.
Research in Higher Education, 42(4), 323-348.
Kuh, G. D. (2011). What educators and administrators need to know about college student
engagement. In Harper, S. R. & Jackson, J. F. L. (Eds.), Introduction to American higher
education (pp. 189-212). New York, NY: Routledge.
Kuh, G. D., Ikenberry, N. A., Cain, T. R., Ewell, P. T., Hutchings, P., & Kinzie, J. (2015, Sept –
Oct). Beyond compliance: Making assessment matter. Change. Retrieved from
http://www.changemag.org/Archives/Back%20Issues/2015/September-
October%202015/assessment_full.html
Kuh, G. D., Kinzie, J., Buckley, J. A., Bridges, B. K., & Hayek, J. C. (2011). Piecing together
the student success puzzle: Research, propositions, and recommendations. ASHE Higher
Education Report, Vol 32, No. 5. San Francisco: Jossey-Bass.
Lakin, J. M., Elliot, D. C., & Liu, O. L. (2012). Investigating ESL students’ performance on
outcomes assessments in higher education. Educational and Psychological Measurement,
72(5), 734-753.
Lederman, D. (2013, May 6). Public university accountability 2.0. Inside Higher Ed. Retrieved
from https://www.insidehighered.com/news/2013/05/06/public-university-accountability-
system-expands-ways-report-student-learning
Lightweis, S. (2014). The challenges, persistence, and success of White, working-class,
first-generation college students. College Student Journal, 48(3), 461-467.
Liu, O., & Roohr, K. (2013). Investigating ten-year trends of learning outcomes at community

174
Colleges. ETS Research Report Series, 2013(2), i–45. doi:10.1002/j.2333-
8504.2013.tb02341.x
Loacker, G., Cromwell, L., & O’Brien, K. (1985, October). Assessment in higher education: To
serve the learner. Paper presented at the National Conference on Assessment in Higher
Education, Columbia, SC.
Lumina Foundation. (2011). The Degree Qualifications Profile. Indianapolis, IN: The Lumina
Foundation.
Maki, P. L. (2004). Assessing for learning: Building a sustainable commitment across the
institution. Sterling, Virginia: Stylus Publishing.
Maki, P. (2015). Assessment that works: A national call, a twenty-first-century response.
Washington, DC: Association of American Colleges and Universities.
McDonough, M. (1997). An assessment of critical thinking at the community college level
Dissertation Abstracts International, 58, 2561A.
Merriam, S. B. (2009). Qualitative research: A guide to design and implementation. San
Francisco, CA: Jossey-Bass.
Money, S. (1997). The relationship between critical thinking scores, achievement scores, and
grade point average in three different discipline. Dissertation Abstracts International, 58,
3401A.
Morante, E. A. (2003). A handbook on outcomes assessment for two year colleges. College of
the Desert, Palm Desert, California.
National Center for Education Statistics. (2013). Digest of education statistics. Washington, DC:

175
National Center for Educational Statistics, Institute of Educational Sciences, US
Department of Education. Retrieved from
https://nces.ed.gov/programs/digest/d13/tables/dt13_326.10.asp
New Leadership Alliance for Student Learning and Accountability. (2012). Assuring quality:
An institutional self-assessment tool for excellent practice in student learning outcomes
Assessment. Washington, DC.
Nunley, C., Bers, T., & Manning, T. (2011). Learning outcomes assessment in community
colleges. National Institute for Learning Outcomes Assessment. Retrieved from
http://www.learningoutcomesassessment.org/documents/CommunityCollege.pdf
Office of Strategy, Planning & Accountability. (2016). MCTC data shop: Data as of spring
2016. Minneapolis, MN: Author.
Pascarella, E. T., & Blaich, C. (2013). Lessons from the Wabash National Study of Liberal Arts
Education. Change: The Magazine of Higher Learning, 45(2), 6-15.
Pascarella, E., & Terenzini, P. (1991). How college affects students: Findings and insights from
twenty years of research. San Francisco, CA: Jossey-Bass.
Pascarella, E., & Terenzini, P. (2005). How college affects students: A third decade of research
(Vol. 2). San Francisco, CA: Jossey Bass.
Pascarella, E. T., Edison, M. I., Nora, A., Hagedorn, L., & Terenzini, P. T. (1995/1996).
Cognitive effects of community colleges and four-year colleges. Community College
Journal, 66(3), 35-39.
Pascarella, E. T., Mayhew, M. J., Rockenbach, A. B., Bowman, N. A., Seifert, T. A., Wolniak, G.
C., & Terenzini, P. T. (2016). How college affects students: 21st century evidence that

176
higher education works. (Vol. 2). San Francisco, CA: Jossey Bass.
Penn, J. D. (2011). Future directions for assessing complex general education student learning
outcomes. New Directions for Institutional Research, (149), 5-14, 109-117.
Perna, L. W., & Swail, W. S. (2001). Pre-college outreach and early intervention. Thought &
Action, 17(1), 99-110.
Pike, G. R., & Killian, T. (2001). Reported gains in student learning: Do academic disciplines
make a difference? Research in Higher Education, 42(4), 429-454.
Pike, G. R., Kuh, G. D., & Gonya, R. M. (2003). The relationship between institutional mission
and students’ involvement and educational outcomes. Research in Higher Education
44(2), 241-261.
Poon, O., Squire, D., Kodama, C., Byrd, A. Chan, J., Manzano, L., Furr, S., Bushandat, D.,
(2016). A critical review of the model minority myth in selected literature on Asian
Americans and Pacific Islanders in higher education. Review of Educational Research,
86(2), 469-502. doi:10.3102/003465431561205
Punch, K. F. (2009). Introduction to research methods in education. London: Sage Publications.
Raosoft. (2004). Raosoft: Sample size calculator. Raosoft, Inc. Retrieved from
http://www.raosoft.com/samplesize.html
Research Consultation. (2007). The t-test in dissertation and thesis research. Retrieved from
http://www.researchconsultation.com/t-test-statistics.asp
Reese, R. (2013, February 21). Minority testing bias persists. The Huffington Post. Retrieved
from http://www.huffingtonpost.com/ronnie-reese/test-bias-minorities_b_2734149.html
Rhodes, T. L. (Ed.). (2010). Assessing outcomes and improving achievement: Tips and tools for

177
using rubrics. Association of American Colleges and Universities.
Rhodes, T. L. (2011). Emerging evidence on using rubrics. Association of American College and
Universities, 13/14, 4(1). Retrieved from https://www.aacu.org/peerreview/2011-
2012/fall-winter/rhodes
Rhodes, T. L., & Finley, A. (2013). Using the VALUE rubrics for improvement of learning and
authentic assessment. Washington, DC: Association of American Colleges and
Universities.
Roach, R. (2001). Is higher education ready for minority America? Black Issues in Higher
Education, 18(8), 29.
Ross, T., Kena, G., Rathbun, A., Kewal-Ramani, A., Zhang, J., Kristapovich, P., & Manning, E.
(2012). Higher Education: Gaps in Access and Persistence Study (NCES 2012-046). U.S.
Department of Education, National Center for Education Statistics. Washington, DC:
Government Printing Office.
Samuel, K. R., & Scott, J. A. (2014). Promoting Hispanic student retention in two Texas
community colleges. Research in Higher Education Journal, 25.
Saunders, L. (2011). Information literacy as a student learning outcome: The perspective of
institutional accreditation. Santa Barbara, CA: Library of Congress.
Sebrell, K., & Erwin, T. (1998). Assessment of critical thinking: One performance method
analyzed. Unpublished paper, Center for Assessment and Research Studies, James
Madison University, Harrisonburg, VA.
Shireman, R. (2016). The real value of what students are learning in college. New York, NY:

178
The Century Foundation. Retrieved from https://tcf.org/content/report/the-real-value-of-
what-students-do-in-college/
Schmidt, P., (2003, November 28). Academes Hispanic future: The nation’s largest minority
group faces big obstacles in higher education, and colleges struggle to find the right ways
to help. The Chronicle of Higher Education. Retrieved from
http://www.chronicle.com/article/Academes-Hispanic-Future/20497
Sheard, M. (2009). Hardiness commitment, gender, and age differentiate university academic
performance. British Journal of Educational Psychology, 79(1), 189-204. Doi:
10.1348/000709908X304406
Spaulding, S., & Kleiner, K. (1992). The relationship of college and critical thinking: Are critical
thinkers attracted or created by college disciplines? College Student Journal, 26, 162-
166.
Stes, A., De Maeyer, S., Gijbels, D., & Van Petegem, P. (2012). Instructional development for
teachers in higher education: Effects on students' learning outcomes. Teaching in Higher
Education, 17(3), 295-308.
Sternberg, R. J. (2011, February 8). Who is really adrift? Inside Higher Ed. Retrieved from
https://www.insidehighered.com/views/2011/02/08/a_critique_of_academically_adrift_a
d_the_test_behind_many_of_the_findings
Sullivan, D. F. (2015). The VALUE breakthrough getting the assessment of student learning in
college right. Washington, DC: Association of American Colleges and Universities.
Suskie, L. (2009). Assessing student learning: A common sense guide. San Francisco, CA:
Jossey-Bass.

179
Terenzini, P., Springer, L., Yaeger, P., Pascarella, E., & Nora, A. (1994, November). The
Multiple influences on students’ critical thinking skills. Paper presented at the meeting of
the Association for the Study of Higher education, Orlando.
Thelin, J. R. (2011). A history of American higher education. Baltimore, MD: John Hopkins
University Press.
Tremblay, K., Lalancette, D., & Roseveare, D. (2012). Assessment of higher education learning
outcomes: Feasibility study. Volume 1 – Design and Implementation. OECD.
Willingham, D. T. (2007, Summer). Critical thinking: Why is it so hard to teach? American
Educator. Retrieved from
http://www.aft.org/sites/default/files/periodicals/Crit_Thinking.pdf
Willie, C. V., Garibaldi, A. M. & Reed, W. L. (Eds.). (1991). The education of African
Americans. New York: Auburn House.
Wright, B. D. (2002). Accreditation and the scholarship of assessment. In T. W. Banta and
Associates (Eds.), Building a scholarship of assessment (pp. 223- 239). San Francisco,
CA: Jossey-Bass.

180
Appendix A: Critical Thinking VALUE Rubric
for more information, please contact [email protected]
The VALUE rubrics were developed by teams of faculty experts representing colleges and universities across the United States through a process that examined many
existing campus rubrics and related documents for each learning outcome and incorporated additional feedback from faculty. The rubrics articulate fundamental criteria for each
learning outcome, with performance descriptors demonstrating progressively more sophisticated levels of attainment. The rubrics are intended for institutional-level use in
evaluating and discussing student learning, not for grading. The core expectations articulated in all 15 of the VALUE rubrics can and should be translated into the language of
individual campuses, disciplines, and even courses. The utility of the VALUE rubrics is to position learning at all undergraduate levels within a basic framework of expectations
such that evidence of learning can by shared nationally through a common dialog and understanding of student success.
Definition
Critical thinking is a habit of mind characterized by the comprehensive exploration of issues, ideas, artifacts, and events before accepting or formulating an opinion or
conclusion.
Framing Language
This rubric is designed to be transdisciplinary, reflecting the recognition that success in all disciplines requires habits of inquiry and analysis that share common attributes.
Further, research suggests that successful critical thinkers from all disciplines increasingly need to be able to apply those habits in various and changing situations encountered in
all walks of life.
This rubric is designed for use with many different types of assignments and the suggestions here are not an exhaustive list of possibilities. Critical thinking can be
demonstrated in assignments that require students to complete analyses of text, data, or issues. Assignments that cut across presentation mode might be especially useful in some
fields. If insight into the process components of critical thinking (e.g., how information sources were evaluated regardless of whether they were included in the product) is
important, assignments focused on student reflection might be especially illuminating.
Glossary
The definitions that follow were developed to clarify terms and concepts used in this rubric only.
• Ambiguity: Information that may be interpreted in more than one way.
• Assumptions: Ideas, conditions, or beliefs (often implicit or unstated) that are "taken for granted or accepted as true without proof." (quoted from
www.dictionary.reference.com/browse/assumptions)
• Context: The historical, ethical. political, cultural, environmental, or circumstantial settings or conditions that influence and complicate the consideration of any issues,
ideas, artifacts, and events.
• Literal meaning: Interpretation of information exactly as stated. For example, "she was green with envy" would be interpreted to mean that her skin was green.
• Metaphor: Information that is (intended to be) interpreted in a non-literal way. For example, "she was green with envy" is intended to convey an intensity of emotion, not a
skin color.

181
CRITICAL THINKING VALUE RUBRIC for more information, please contact [email protected]
Definition
Critical thinking is a habit of mind characterized by the comprehensive exploration of issues, ideas, artifacts, and events before accepting or formulating an opinion or conclusion.
Evaluators are encouraged to assign a zero to any work sample or collection of work that does not meet benchmark (cell one) level performance.
Capstone
4
Milestones
3 2
Benchmark
1
Explanation of issues Issue/problem to be considered critically is
stated clearly and described comprehensively,
delivering all relevant information necessary for
full understanding.
Issue/problem to be considered critically is stated,
described, and clarified so that understanding is not
seriously impeded by omissions.
Issue/problem to be considered
critically is stated but description
leaves some terms undefined,
ambiguities unexplored, boundaries
undetermined, and/or backgrounds
unknown.
Issue/problem to be considered
critically is stated without
clarification or description.
Evidence
Selecting and using
information to investigate a
point of view or conclusion
Information is taken from source(s) with enough
interpretation/evaluation to develop a
comprehensive analysis or synthesis.
Viewpoints of experts are questioned thoroughly.
Information is taken from source(s) with enough
interpretation/evaluation to develop a coherent analysis
or synthesis.
Viewpoints of experts are subject to questioning.
Information is taken from source(s)
with some interpretation/evaluation,
but not enough to develop a coherent
analysis or synthesis.
Viewpoints of experts are taken as
mostly fact, with little questioning.
Information is taken from source(s)
without any
interpretation/evaluation.
Viewpoints of experts are taken as
fact, without question.
Influence of context and
assumptions
Thoroughly (systematically and methodically)
analyzes own and others' assumptions and
carefully evaluates the relevance of contexts
when presenting a position.
Identifies own and others' assumptions and several
relevant contexts when presenting a position.
Questions some assumptions.
Identifies several relevant contexts
when presenting a position. May be
more aware of others' assumptions
than one's own (or vice versa).
Shows an emerging awareness of
present assumptions (sometimes
labels assertions as assumptions).
Begins to identify some contexts
when presenting a position.
Student's position
(perspective,
thesis/hypothesis)
Specific position is imaginative, taking into
account the complexities of an issue.
Limits of position are acknowledged.
Others' points of view are synthesized within
position.
Specific position (perspective, thesis/hypothesis) takes
into account the complexities of an issue.
Others' points of view are acknowledged within
position (perspective, thesis/hypothesis).
Specific position (perspective,
thesis/hypothesis) acknowledges
different sides of an issue.
Specific position (perspective,
thesis/hypothesis) is stated, but is
simplistic and obvious.
Conclusions and related
outcomes (implications and
consequences)
Conclusions and related outcomes are logical
and reflect student’s informed evaluation and
ability to place evidence and perspectives
discussed in priority order.
Conclusion is logically tied to a range of information,
including opposing viewpoints; related outcomes
(consequences and implications) are identified clearly.
Conclusion is logically tied to
information; some related outcomes
(consequences and implications) are
identified clearly.
Conclusion is inconsistently tied to
some of the information discussed;
related outcomes (consequences and
implications) are oversimplified.

182
Appendix B: Quantitative Literacy VALUE Rubric for more information, please contact [email protected]
The VALUE rubrics were developed by teams of faculty experts representing colleges and universities across the United States through a process that examined many existing campus rubrics and
related documents for each learning outcome and incorporated additional feedback from faculty. The rubrics articulate fundamental criteria for each learning outcome, with performance descriptors
demonstrating progressively more sophisticated levels of attainment. The rubrics are intended for institutional-level use in evaluating and discussing student learning, not for grading. The core expectations
articulated in all 15 of the VALUE rubrics can and should be translated into the language of individual campuses, disciplines, and even courses. The utility of the VALUE rubrics is to position learning at
all undergraduate levels within a basic framework of expectations such that evidence of learning can by shared nationally through a common dialog and understanding of student success.
Definition Quantitative Literacy (QL) – also known as Numeracy or Quantitative Reasoning (QR) – is a "habit of mind," competency, and comfort in working with numerical data. Individuals with strong QL
skills possess the ability to reason and solve quantitative problems from a wide array of authentic contexts and everyday life situations. They understand and can create sophisticated arguments supported by
quantitative evidence and they can clearly communicate those arguments in a variety of formats (using words, tables, graphs, mathematical equations, etc., as appropriate).
Quantitative Literacy Across the Disciplines
Current trends in general education reform demonstrate that faculty are recognizing the steadily growing importance of Quantitative Literacy (QL) in an increasingly quantitative and data-dense
world. AAC&U’s recent survey showed that concerns about QL skills are shared by employers, who recognize that many of today’s students will need a wide range of high level quantitative skills to
complete their work responsibilities. Virtually all of today’s students, regardless of career choice, will need basic QL skills such as the ability to draw information from charts, graphs, and geometric figures,
and the ability to accurately complete straightforward estimations and calculations.
Preliminary efforts to find student work products which demonstrate QL skills proved a challenge in this rubric creation process. It’s possible to find pages of mathematical problems, but what
those problem sets don’t demonstrate is whether the student was able to think about and understand the meaning of her work. It’s possible to find research papers that include quantitative information, but
those papers often don’t provide evidence that allows the evaluator to see how much of the thinking was done by the original source (often carefully cited in the paper) and how much was done by the
student herself, or whether conclusions drawn from analysis of the source material are even accurate.
Given widespread agreement about the importance of QL, it becomes incumbent on faculty to develop new kinds of assignments which give students substantive, contextualized experience in using
such skills as analyzing quantitative information, representing quantitative information in appropriate forms, completing calculations to answer meaningful questions, making judgments based on
quantitative data and communicating the results of that work for various purposes and audiences. As students gain experience with those skills, faculty must develop assignments that require students to
create work products which reveal their thought processes and demonstrate the range of their QL skills.
This rubric provides for faculty a definition for QL and a rubric describing four levels of QL achievement which might be observed in work products within work samples or collections of work.
Members of AAC&U’s rubric development team for QL hope that these materials will aid in the assessment of QL – but, equally important, we hope that they will help institutions and individuals in the
effort to more thoroughly embed QL across the curriculum of colleges and universities.
Framing Language
This rubric has been designed for the evaluation of work that addresses quantitative literacy (QL) in a substantive way. QL is not just computation, it is a habit of mind, a way of thinking about the
world that relies on data and on the mathematical analysis of data to make connections and draw conclusions. Teaching QL requires us to design assignments that address authentic, data-based problems.
Such assignments may call for the traditional written paper, but we can imagine other alternatives: a video of a PowerPoint presentation, perhaps, or a well designed series of web pages. In any case, a
successful demonstration of QL will place the mathematical work in the context of a full and robust discussion of the underlying issues addressed by the assignment.
Finally, QL skills can be applied to a wide array of problems of varying difficulty, confounding the use of this rubric. For example, the same student might demonstrate high levels of QL
achievement when working on a simplistic problem and low levels of QL achievement when working on a very complex problem. Thus, to accurately assess a students QL achievement it may be necessary
to measure QL achievement within the context of problem complexity, much as is done in diving competitions where two scores are given, one for the difficulty of the dive, and the other for the skill in
accomplishing the dive. In this context, that would mean giving one score for the complexity of the problem and another score for the QL achievement in solving the problem.

183
QUANTITATIVE LITERACY VALUE RUBRIC for more information, please contact [email protected]
Definition Quantitative Literacy (QL) – also known as Numeracy or Quantitative Reasoning (QR) – is a "habit of mind," competency, and comfort in working with numerical data. Individuals with strong QL skills possess the ability to reason and solve quantitative problems from a wide array of authentic contexts and everyday life situations. They understand and can create sophisticated arguments supported by quantitative evidence and they can clearly communicate those arguments in a variety of formats (using words, tables, graphs, mathematical equations, etc., as appropriate).
Capstone 4
Milestones 3 2
1
Interpretation Ability to explain information presented in mathematical forms (e.g., equations, graphs, diagrams, tables, words)
Provides accurate explanations of information presented in mathematical forms. Makes appropriate inferences based on that information.
Provides accurate explanations of information presented in mathematical forms. For instance, accurately explains the trend data shown in a graph.
Provides somewhat accurate explanations of information presented in mathematical forms, but occasionally makes minor errors related to computations or units.
Attempts to explain information presented in mathematical forms, but draws incorrect conclusions about what the information means.
Representation Ability to convert relevant information into various mathematical forms
Skillfully converts relevant information into an insightful mathematical portrayal in a way that contributes to a further or deeper understanding.
Competently converts relevant information into an appropriate and desired mathematical portrayal.
Completes conversion of information but resulting mathematical portrayal is only partially appropriate or accurate.
Completes conversion of information but resulting mathematical portrayal is inappropriate or inaccurate.
Calculation Calculations attempted are essentially all successful and sufficiently comprehensive to solve the problem.
Calculations attempted are essentially all successful and sufficiently comprehensive to solve the problem.
Calculations attempted are either unsuccessful or represent only a portion of the calculations required to comprehensively solve the problem.
Calculations are attempted but are both unsuccessful and are not comprehensive.
Application / Analysis Ability to make judgments and draw appropriate conclusions based on the quantitative analysis of data, while recognizing the limits of this analysis
Uses the quantitative analysis of data as the basis for deep and thoughtful judgments, drawing insightful, carefully qualified conclusions from this work.
Uses the quantitative analysis of data as the basis for competent judgments, drawing reasonable and appropriately qualified conclusions from this work.
Uses the quantitative analysis of data as the basis for workmanlike (without inspiration or nuance, ordinary) judgments, drawing plausible conclusions from this work.
Uses the quantitative analysis of data as the basis for tentative, basic judgments, although is hesitant or uncertain about drawing conclusions from this work.
Assumptions Ability to make and evaluate important assumptions in estimation, modeling, and data analysis
Explicitly describes assumptions and provides compelling rationale for why each assumption is appropriate. Shows awareness that confidence in final conclusions is limited by the accuracy of the assumptions.
Explicitly describes assumptions and provides compelling rationale for why assumptions are appropriate.
Explicitly describes assumptions. Attempts to describe assumptions.
Communication Expressing quantitative evidence in support of the argument or purpose of the work
Uses quantitative information in connection with the argument or purpose of the work, presents it in an effective format, and explicates it with consistently high quality.
Uses quantitative information in connection with the argument or purpose of the work, though data may be presented in a less than completely effective format or some parts of the explication may be uneven.
Uses quantitative information, but does not effectively connect it to the argument or purpose of the work.
Presents an argument for which quantitative evidence is pertinent, but does not provide adequate explicit numerical support.

184
Appendix C: Written Communication VALUE Rubric
for more information, please contact [email protected]
The VALUE rubrics were developed by teams of faculty experts representing colleges and universities across the United States through a process that examined many existing campus rubrics and related
documents for each learning outcome and incorporated additional feedback from faculty. The rubrics articulate fundamental criteria for each learning outcome, with performance descriptors demonstrating
progressively more sophisticated levels of attainment. The rubrics are intended for institutional-level use in evaluating and discussing student learning, not for grading. The core expectations articulated in all 15 of the
VALUE rubrics can and should be translated into the language of individual campuses, disciplines, and even courses. The utility of the VALUE rubrics is to position learning at all undergraduate levels within a basic
framework of expectations such that evidence of learning can by shared nationally through a common dialog and understanding of student success.
Definition
Written communication is the development and expression of ideas in writing. Written communication involves learning to work in many genres and styles. It can involve working with many different
writing technologies, and mixing texts, data, and images. Written communication abilities develop through iterative experiences across the curriculum.
Framing Language
This writing rubric is designed for use in a wide variety of educational institutions. The most clear finding to emerge from decades of research on writing assessment is that the best writing assessments are
locally determined and sensitive to local context and mission. Users of this rubric should, in the end, consider making adaptations and additions that clearly link the language of the rubric to individual contexts.This
rubric focuses assessment on how specific written work samples or collectios of work respond to specific contexts. The central question guiding the rubric is "How well does writing respond to the needs of
audience(s) for the work?" In focusing on this question the rubric does not attend to other aspects of writing that are equally important: issues of writing process, writing strategies, writers' fluency with different
modes of textual production or publication, or writer's growing engagement with writing and disciplinarity through the process of writing.
Evaluators using this rubric must have information about the assignments or purposes for writing guiding writers' work. Also recommended is including reflective work samples of collections of work that
address such questions as: What decisions did the writer make about audience, purpose, and genre as s/he compiled the work in the portfolio? How are those choices evident in the writing -- in the content,
organization and structure, reasoning, evidence, mechanical and surface conventions, and citational systems used in the writing? This will enable evaluators to have a clear sense of how writers understand the
assignments and take it into consideration as they evaluate
The first section of this rubric addresses the context and purpose for writing. A work sample or collections of work can convey the context and purpose for the writing tasks it showcases by including the
writing assignments associated with work samples. But writers may also convey the context and purpose for their writing within the texts. It is important for faculty and institutions to include directions for students
about how they should represent their writing contexts and purposes. Faculty interested in the research on writing assessment that has guided our work here can consult the National Council of Teachers of
English/Council of Writing Program Administrators' White Paper on Writing Assessment (2008; www.wpacouncil.org/whitepaper) and the Conference on College Composition and Communication's Writing
Assessment: A Position Statement (2008; ww.ncte.org/cccc/resources)
Glossary
• Content Development: The ways in which the text explores and represents its topic in relation to its audience and purpose.
• Context of and purpose for writing: The context of writing is the situation surrounding a text: who is reading it? Under what circumstances will the text be shared or circulated? What social or political
factors might affect how the text is composed or interpreted? The purpose for writing is the writer's intended effect on an audience. Writers might want to persuade or inform; they might want to report or summarize
information; they might want to work through complexity or confusion; they might want to argue with other writers, or connect with other writers.
• Disciplinary conventions: Formal and informal rules that constitute what is seen generally as appropriate within different academic fields. Writers will incorporate sources according to disciplinary and genre
conventions, according to the writer's purpose for the text. Through increasingly sophisticated use of sources, writers develop an ability to differentiate between their own ideas and the ideas of others, credit and build
upon work already accomplished in the field or issue they are addressing, and provide meaningful examples to readers.
• Evidence: Source material that is used to extend, in purposeful ways, writers' ideas in a text.
• Genre conventions: Formal and informal rules for particular kinds of texts and/or media that guide formatting, organization, and stylistic choices, e.g. academic papers, poetry, webpages, or essays.
• Sources: Texts (written, oral, behavioral, visual, or other) that writers draw on as they work for a variety of purposes -- to extend, argue with, develop, define, or shape their ideas, for example.

185
WRITTEN COMMUNICATION VALUE RUBRIC for more information, please contact [email protected]
Definition
Written communication is the development and expression of ideas in writing. Written communication involves learning to work in many genres and styles. It can involve working with many different
writing technologies, and mixing texts, data, and images. Written communication abilities develop through iterative experiences across the curriculum.
Capstone
4 Milestones
3 2 Benchmark
1
Context of and Purpose for
Writing
Includes considerations of
audience, purpose, and the
circumstances surrounding the
writing task(s).
Demonstrates a thorough understanding of
context, audience, and purpose that is
responsive to the assigned task(s) and focuses
all elements of the work.
Demonstrates adequate consideration of context,
audience, and purpose and a clear focus on the
assigned task(s) (e.g., the task aligns with audience,
purpose, and context).
Demonstrates awareness of
context, audience, purpose, and
to the assigned tasks(s) (e.g.,
begins to show awareness of
audience's perceptions and
assumptions).
Demonstrates minimal attention to context,
audience, purpose, and to the assigned
tasks(s) (e.g., expectation of instructor or
self as audience).
Content Development Uses appropriate, relevant, and compelling
content to illustrate mastery of the subject,
conveying the writer's understanding, and
shaping the whole work.
Uses appropriate, relevant, and compelling content to
explore ideas within the context of the discipline and
shape the whole work.
Uses appropriate and relevant
content to develop and explore
ideas through most of the work.
Uses appropriate and relevant content to
develop simple ideas in some parts of the
work.
Genre and Disciplinary
Conventions
Formal and informal rules inherent
in the expectations for writing in
particular forms and/or academic
fields (please see glossary).
Demonstrates detailed attention to and
successful execution of a wide range of
conventions particular to a specific discipline
and/or writing task including organization,
content, presentation, formatting, and
stylistic choices
Demonstrates consistent use of important conventions
particular to a specific discipline and/or writing
task(s), including organization, content, presentation,
and stylistic choices
Follows expectations
appropriate to a specific
discipline and/or writing task(s)
for basic organization, content,
and presentation
Attempts to use a consistent system for
basic organization and presentation.
Sources and Evidence Demonstrates skillful use of high-quality,
credible, relevant sources to develop ideas
that are appropriate for the discipline and
genre of the writing
Demonstrates consistent use of credible, relevant
sources to support ideas that are situated within the
discipline and genre of the writing.
Demonstrates an attempt to use
credible and/or relevant sources
to support ideas that are
appropriate for the discipline
and genre of the writing.
Demonstrates an attempt to use sources to
support ideas in the writing.
Control of Syntax and Mechanics Uses graceful language that skillfully
communicates meaning to readers with
clarity and fluency, and is virtually error-free.
Uses straightforward language that generally conveys
meaning to readers. The language in the portfolio has
few errors.
Uses language that generally
conveys meaning to readers with
clarity, although writing may
include some errors.
Uses language that sometimes impedes
meaning because of errors in usage.

186
Appendix D: Institutional Review Board Letter