Structure and evolution of online social networks
7
Structure and Evolution of Online Social Networks Ravi Kumar Jasmine Novak Andrew Tomkins Yahoo! Research, 701 First Ave, Sunnyvale, CA 94089. {ravikumar, jnovak, atomkins}@yahoo-inc.com ABSTRACT In this paper, we consider the evolution of structure within large online social networks. We present a series of measurements of two such networks, together comprising in excess of five million people and ten million friendship links, annotated with metadata capturing the time of every event in the life of the network. Our measurements expose a surprising segmentation of these networks into three regions: singletons who do not participate in the network; isolated communities which overwhelmingly display star structure; and a giant component anchored by a well-connected core region which persists even in the absence of stars. We present a simple model of network growth which captures these aspects of component structure. The model follows our ex- perimental results, characterizing users as either passive members of the network; inviters who encourage offline friends and acquain- tances to migrate online; and linkers who fully participate in the social evolution of the network. Categories and Subject Descriptors: H.2.8 [Data Management]: Database Applications—Data Mining General Terms: Measurements, Theory Keywords: graph mining, small-world phenomenon, graph evolu- tion, social networks, stars 1. INTRODUCTION In this paper, we study the evolution of large online social net- works. To our knowledge, this is the first detailed evaluation of the growth processes that control online social networks in the large. The power of people interacting with people in an online setting has driven the success or failure of many companies in the internet space. Social media applications such as flickr (flickr.com) or myspace (www.myspace.com) have exploded in popularity, shocking pundits and realigning the online landscape. Similarly, classically successful online destinations that deal largely in the buying and selling of physical items owe much of their success to the power of online networks; consider for instance the product reviews of Amazon (amazon.com) or the reputation mechanism of Ebay (ebay.com). In fact, social networks have become the Permission to make digital or hard copies of all or part of this work for personal or classroom use is granted without fee provided that copies are not made or distributed for profit or commercial advantage and that copies bear this notice and the full citation on the first page. To copy otherwise, to republish, to post on servers or to redistribute to lists, requires prior specific permission and/or a fee. KDD’06, August 20–23, 2006, Philadelphia, Pennsylvania, USA. Copyright 2006 ACM 1-59593-339-5/06/0008 ...$5.00. subject of numerous startup companies in their own right, offering each user the promise of managing her own social network as a valuable resource to be shepherded and grown. As the stock of social networks has grown, so too has interest in the academic community. Offline networks have been the subject of intense academic scrutiny for many decades, but the availability of large online social networks has raised new sets of questions. Much work to date has focused on the structure of a static snapshot of an evolving social network. In this paper, we have access to the entire lifetime of two large social networks, and hence we are able to study their dynamic properties. We study the social network of Flickr, and Yahoo! 360. SUMMARY OF FINDINGS. We begin with a study of the overall properties of the network. We show that the density of the network, which measures the amount of interconnection per person, follows the same unexpected pattern in both networks: rapid growth, de- cline, and then slow but steady growth. We postulate based on the timing of the events that the pattern is due to the activities of early adopters who create significant linkages in their exploration of the system, followed by a period of rapid growth in which new mem- bers join more quickly than friendships can be established, settling finally into a period of ongoing organic growth in which both mem- bership and linkage increases. Next, we classify members of a social network into one of three groups: the singletons, the giant component, and the middle region, as follows. Singletons. The singletons are degree-zero nodes who have joined the service but have never made a connection with another user in the social network. They may viewed as loners who do not partici- pate actively in the network. Giant component. The giant component represents the large group of people who are connected to one another through paths in the social network. These people find themselves connected directly or indirectly to a large fraction of the entire network, typically con- taining most of the highly active and gregarious individuals. Middle region. The middle region is the remainder. It consists of various isolated communities, small groups who interact with one another but not with the network at large. We will show that this group may represent a significant fraction of the total population. We begin with a detailed study of the middle region, which rep- resent about 1/3 of the users of Flickr and about 10% of the users of Yahoo! 360. We show first that over significant periods of time, and significant fractions of growth in the network (exceeding 10x), the fraction of users who exist in isolated communities of a particu- lar size remains remarkably stable, even though the particular users change dramatically. We study the migration patterns of isolated communities, seek- ing insight to how these communities grow and merge. Our find- Research Track Poster 611
-
Upload
independent -
Category
Documents
-
view
3 -
download
0
Transcript of Structure and evolution of online social networks
Structure and Evolution of Online Social Networks
Ravi Kumar Jasmine Novak Andrew TomkinsYahoo! Research, 701 First Ave, Sunnyvale, CA 94089.
{ravikumar, jnovak, atomkins}@yahoo-inc.com
ABSTRACTIn this paper, we consider the evolution of structure within largeonline social networks. We present a series of measurements oftwo such networks, together comprising in excess of five millionpeople and ten million friendship links, annotated with metadatacapturing the time of every event in the life of the network. Ourmeasurements expose a surprising segmentation of these networksinto three regions: singletons who do not participate in the network;isolated communities which overwhelmingly display star structure;and a giant component anchored by a well-connected core regionwhich persists even in the absence of stars.
We present a simple model of network growth which capturesthese aspects of component structure. The model follows our ex-perimental results, characterizing users as either passive membersof the network; inviters who encourage offline friends and acquain-tances to migrate online; and linkers who fully participate in thesocial evolution of the network.
Categories and Subject Descriptors: H.2.8 [Data Management]:Database Applications—Data Mining
General Terms: Measurements, Theory
Keywords: graph mining, small-world phenomenon, graph evolu-tion, social networks, stars
1. INTRODUCTIONIn this paper, we study the evolution of large online social net-
works. To our knowledge, this is the first detailed evaluation of thegrowth processes that control online social networks in the large.
The power of people interacting with people in an online settinghas driven the success or failure of many companies in the internetspace. Social media applications such as flickr (flickr.com)or myspace (www.myspace.com) have exploded in popularity,shocking pundits and realigning the online landscape. Similarly,classically successful online destinations that deal largely in thebuying and selling of physical items owe much of their success tothe power of online networks; consider for instance the productreviews of Amazon (amazon.com) or the reputation mechanismof Ebay (ebay.com). In fact, social networks have become the
Permission to make digital or hard copies of all or part of this work forpersonal or classroom use is granted without fee provided that copies arenot made or distributed for profit or commercial advantage and that copiesbear this notice and the full citation on the first page. To copy otherwise, torepublish, to post on servers or to redistribute to lists, requires prior specificpermission and/or a fee.KDD’06, August 20–23, 2006, Philadelphia, Pennsylvania, USA.Copyright 2006 ACM 1-59593-339-5/06/0008 ...$5.00.
subject of numerous startup companies in their own right, offeringeach user the promise of managing her own social network as avaluable resource to be shepherded and grown.
As the stock of social networks has grown, so too has interest inthe academic community. Offline networks have been the subjectof intense academic scrutiny for many decades, but the availabilityof large online social networks has raised new sets of questions.Much work to date has focused on the structure of a static snapshotof an evolving social network. In this paper, we have access to theentire lifetime of two large social networks, and hence we are ableto study their dynamic properties. We study the social network ofFlickr, and Yahoo! 360.
SUMMARY OF FINDINGS. We begin with a study of the overallproperties of the network. We show that the density of the network,which measures the amount of interconnection per person, followsthe same unexpected pattern in both networks: rapid growth, de-cline, and then slow but steady growth. We postulate based on thetiming of the events that the pattern is due to the activities of earlyadopters who create significant linkages in their exploration of thesystem, followed by a period of rapid growth in which new mem-bers join more quickly than friendships can be established, settlingfinally into a period of ongoing organic growth in which both mem-bership and linkage increases.
Next, we classify members of a social network into one of threegroups: the singletons, the giant component, and the middle region,as follows.Singletons. The singletons are degree-zero nodes who have joinedthe service but have never made a connection with another user inthe social network. They may viewed as loners who do not partici-pate actively in the network.Giant component. The giant component represents the large groupof people who are connected to one another through paths in thesocial network. These people find themselves connected directlyor indirectly to a large fraction of the entire network, typically con-taining most of the highly active and gregarious individuals.Middle region. The middle region is the remainder. It consists ofvarious isolated communities, small groups who interact with oneanother but not with the network at large. We will show that thisgroup may represent a significant fraction of the total population.
We begin with a detailed study of the middle region, which rep-resent about 1/3 of the users of Flickr and about 10% of the usersof Yahoo! 360. We show first that over significant periods of time,and significant fractions of growth in the network (exceeding 10x),the fraction of users who exist in isolated communities of a particu-lar size remains remarkably stable, even though the particular userschange dramatically.
We study the migration patterns of isolated communities, seek-ing insight to how these communities grow and merge. Our find-
Research Track Poster
611
ings are quite surprising. The likelihood that two isolated commu-nities will merge together is unexpectedly low. Evolution in themiddle region is characterized by two processes: isolated commu-nities grow by a single user at a time, and then may eventually bemerged into the giant component; these processes capture the ma-jority of activity within the middle region. Furthermore, we presenta structural finding showing that almost all the isolated communi-ties are in fact stars: a single charismatic individual (in the onlinesense) linked to a varying number of other users who have very fewother connections.
We study the formation of these stars and show that they growrapidly, and then either merge into the giant component or ceasegrowth when the individual holding the community together losesfocus on growing the network.
Next, we turn to the structure of the giant component. We showthat, in this region, the merging of stars does not represent the defin-ing structural characteristic of the giant component. Instead, merg-ing stars represent a sort of outer layer of the region, around a muchmore tightly-connected core of active members who are the heartof the entire social network. Removal of all stars from the giantcomponent has no significant impact on the connectivity of the re-maining nodes.
Over time, the average distance between users in the giant com-ponent is seen to fall. This surprising result has been observed inother settings [22]; we show it here for online social networks.
Given these findings, we draw some high-level behavioral con-clusions about the structure and evolution of online social networks.First, there are two distinct ways that people join the network: theymay register by actively seeking out the network, or they may beinvited by a friend or colleague. The stars in the middle region arelargely characterized by invitations, and the individuals perform-ing the invitations are typically motivated more by migrating andexisting offline social network into an online setting, rather thanbuilding new connections online. On the other hand, the membersof the well-connected core of the giant component are the reverse:they are highly focused on the evolution of the internal network ofwhich they are perhaps the key piece.
MODEL. Based on these observations, we propose a rudimentarymodel of network evolution in which we attempt to capture thesalient properties of our measurements using as small a parame-ter space as possible. Our model uses a notion of biased prefer-ential attachment which introduces a disparity between the relativeease of finding potential online connections within the giant com-ponent, and the relative difficulty of locating potential connectionsout in the isolated communities. The model accurately reproducesthe quantitatively very different component structure of Flickr andYahoo! 360.
ORGANIZATION. The paper is organized as follows. In Section 2,we discuss the related work on theoretical and experimental anal-ysis of large-scale social and other related networks. In Section 3,we describe our experiments and observations about the Flickr andYahoo! 360 social networks. In Section 4, we outline the biasedpreferential attachment model for online social network evolution.In Section 5, we discuss our findings and outline thoughts for futurework. Finally, Section 6 concludes the paper.
2. RELATED WORKLarge real-world graphs such as the world-wide web, internet
topology, phone call graphs, social networks, email graphs, biolog-ical networks, and linguistic networks have been extensively stud-ied from a structural point of view. Typically, these studies addressproperties of the graph including its size, density, degree distribu-
tions, average distance, small-world phenomenon, clustering co-efficient, connected components, community structures, etc. Webriefly outline some of the work in this area. Faloutsos, Faloutsos,and Faloutsos [13] made a crucial observation showing that the de-gree distribution on the internet follow a power law. Subsequently,an intense body of work followed in both computer science andphysics communities, aimed at studying properties of large-scalereal-world graphs. Power law degree distributions were also notedon the graph defined by the world-wide web [21, 4]. Broder et al[8] studied the world-wide web from a connectivity point of viewand showed that it has a large strongly connected component. Sev-eral other studies have also shown that the average diameter of theweb is quite small [8, 3]. Online friendship and email graphs havebeen studied in the context of explaining and analyzing friendships[18] and demonstrating the small-world and navigability propertiesof these graphs [23, 9, 1]. For surveys of analysis of large graphs,the readers are referred to [29, 28, 2, 25, 11, 10, 16].
Many of these above studies were performed on static graphswhereas most real-world graphs are evolving in nature. In fact,there are very papers that study the evolution of real-world graphs;this is partly because of the difficulty in obtaining temporal in-formation about every node/edge arrival in an evolving real-worldgraph. A typical way this problem is addressed is to take snap-shots of the graph at various points in time and use these snapshotsto make inferences about the evolutionary process. This approachwas used to study the linkage pattern of blogs and the emergenceof bursty communities in the blogspace [19]. Structural propertiesof different snapshots of the world-wide web graph was studied byFetterly et al and Cho et al [14, 27]. Recently, Leskovec, Kleinberg,and Faloutsos [22] considered citation graphs and showed that theseexhibit densification and shrinking diameters over time.
A parallel body of work is concerned with developing tractablemathematical models for massive graphs. Because of their evo-lutionary nature and their power law degree distributions, thesegraphs cannot be modeled by traditional Erdo–Renyi random graphs[12, 6]. However, there have been a few alternate models that aremore faithful to observed properties. One is the so-called configu-ration model, which chooses a graph uniformly at random from allgraphs with a prescribed degree distribution [5, 24, 26]; the degreedistribution can be set to match practical observations and is usu-ally a power law. Another approach is to use a generative modelto describe the evolution of graphs. A typical example is the copy-ing or the preferential attachment model [20, 4]: nodes arrive oneby one, and link themselves to a pre-existing node with probabil-ity proportional to the degree of the latter. This “rich get richer”principle can be analytically shown to induce power-law degreedistributions. Kleinberg [17, 15] proposed a model to explain thesmall-world phenomenon and navigability in social networks; seealso [30]. Leskovec et al [22] proposed a forest-fire graph model toexplain the decreasing diameter phenomenon observed in citationgraphs. For a survey of mathematical analysis of some of thesemodels, the readers are referred to [7, 16].
3. MEASUREMENTSIn this section we detail our study on two online social networks
at Yahoo!. Each social network is presented as a directed timegraph G = (V, E), i.e., every node v ∈ V and directed edge〈u, v〉 ∈ E in the graph G has an associated time stamp vt and〈u, v〉t indicating the exact moment when the particular node v orthe edge e became part of the graph [19]. In particular, for anytime t, there is a natural graph Gt that comprises all the nodes andedges that have arrived up until time t; here we assume that the end
Research Track Poster
612
points of an edge always arrive during or before the edge itself. Weuse timegraph to refer to properties that are specific to the evolu-tion and use graph to refer to the graph GJan2006 as the final graph.We note that our study of timegraphs is of much finer granularitythan almost all of previous such studies in that we know the exactmoment of each node/edge arrival.
3.1 DatasetsThe dataset consists of two online social networks at Yahoo! —
Flickr and Yahoo! 360. Each of these social networks is presentedas a timegraph. For privacy reasons, all the data used in the paperwere provided to us after appropriate anonymization. For confi-dentiality reasons, we do not specify the exact number of nodes oredges in these timegraphs but only provide a ball-park estimate —this will not in any way affect the presentation of our results or theinferences that can be drawn.
Flickr (www.flickr.com) is an active and popular online photosharing and social networking community. Flickr users can uploadand tag photos and share them with their friends or publicly. Eachuser in Flickr can invite a new friend to Flickr or can add a pre-existing Flickr user as a friend. In Jan 2006, the Flickr timegraphconsisted of around one million nodes and around eight million di-rected edges. The dataset we used had the following anonymizedinformation about each Flickr user: the time when the user becamea Flickr member and the list of friends he/she has on Flickr, and foreach friend, the time when the user befriended the person. Eventhough we had the entire Flickr timegraph available, for our experi-ments, we focused only on the evolution of the timegraph since theFlickr website was publicly launched (Feb 2004); this amounted toabout 100 weeks worth of data. We made this decision in order toavoid the initial phase before the public launch when Flickr usagewas mostly limited to internal users and the user/friendship addi-tion processes were too skewed to lead to meaningful conclusions.
Yahoo! 360 (360.yahoo.com) is a social networking web-site that is part of the Yahoo! user network. Users of Yahoo! 360can add contacts and invite other users to the 360 network. Yahoo!360 is primarily used to share a blog or photo albums among thefriends of a user. In Jan 2006, the Yahoo! 360 timegraph consistedof around five million nodes and a around seven million directededges. As in Flickr, we used an anonymized timegraph and as be-fore, chose to discard the initial segment of the timegraph in orderto filter out pre-launch noise/bias. This resulted in about 40 weeksworth of data.
3.2 Basic timegraph propertiesIn this section we consider three basic properties of these timegraphs.
The first property we consider is the reciprocity of a directed graph,that is, the fraction of directed edges 〈u, v〉 such that 〈v, u〉 also ex-ists in the graph. The goal is to understand:
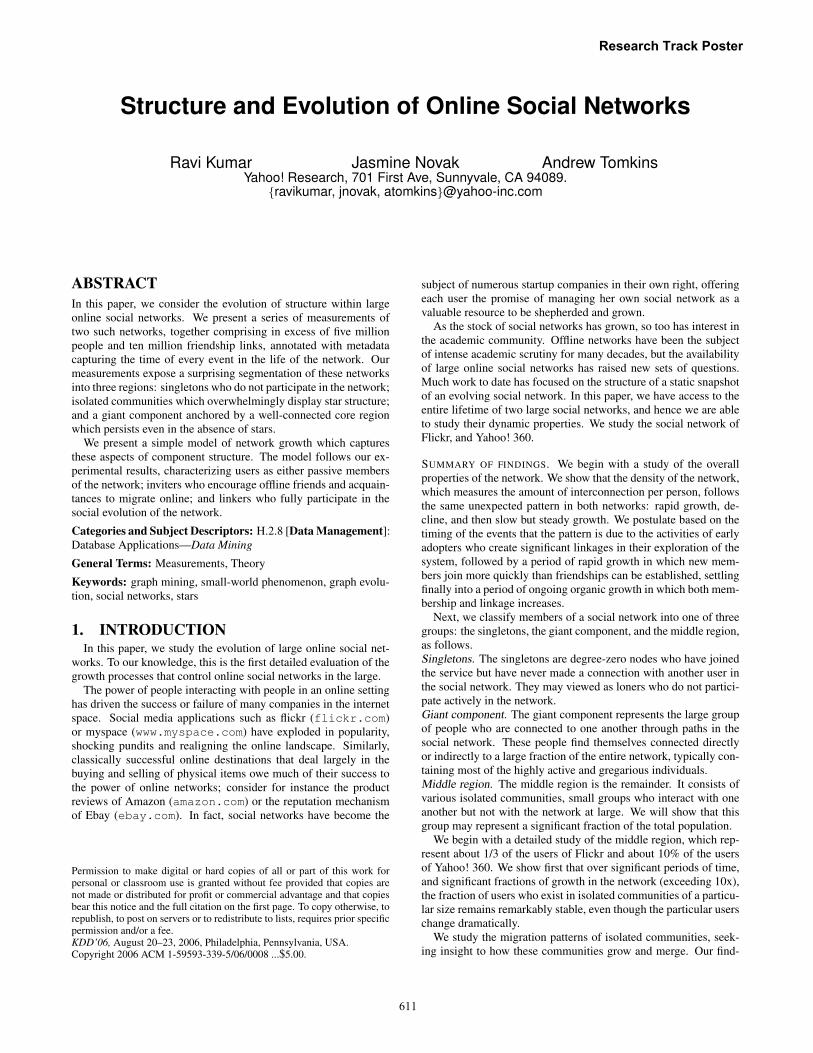
Are friendships reciprocal in online social networks?The reciprocity of the Flickr final graph is around 70.2%, and thatof the Yahoo! 360 final graph is around 84%. Thus, friendshipedges are highly mutual. In fact, a finer analysis shows that notonly are many friendship edges reciprocal but in fact many recip-rocal edges are formed almost simultaneously. Figure 1 shows forreciprocal edges 〈u, v〉t and 〈v, u〉t′ in the Flickr final graph, thedistribution of |t−t′|, i.e., the delay (in days) of the reciprocity. Wesee that an overwhelming fraction of reciprocal edges arrive withina day of each other. A similar phenomenon is also seen in the Ya-hoo! 360 final graph. From these observations, we conclude thatfor the purposes of analysis and for simplicity of exposition, we canpretend that the graph is undirected. So, for the remainder of thepaper, we deal only with undirected graphs and treat the Flickr and
Figure 1: Delay (in days) of reciprocity in Flickr final graph.
Yahoo! 360 graphs to be undirected by removing all uni-directionaledges.
Next, we look at the density of these graphs, that is, the ratioof undirected edges to nodes, of the timegraphs. In a recent work,Leskovec et al [22] observed that certain citation graphs becamedenser over time. We wish to ask a similar question for onlinesocial networks:
How does the density of online social networks behaveover time?
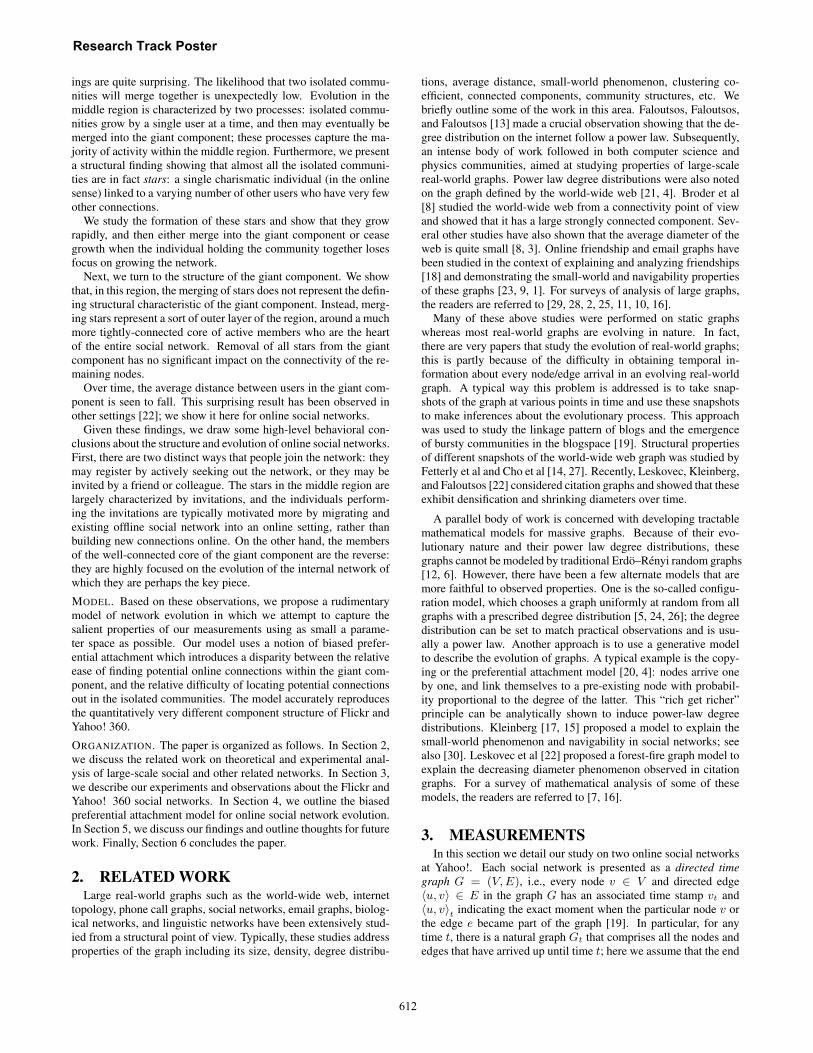
It turns out that the density of social networks as a function of timeis non-monotone. Figure 2 shows the density of the Flickr andYahoo! 360 timegraphs. In both the plots there are three clearly
Figure 2: Density of Flickr and Yahoo! 360 timegraphs, byweek.
marked stages: an initial upward trend leading to a peak, followedby a dip, and the final gradual steady increase. We believe that thisis due to the following social phenomenon. Right after the launch,there is an initial euphoria among a few enthusiasts who join thenetwork and frantically invite many of their friends to join; thisgives rise to the first stage that culminates in a peak. The secondstage corresponds to a natural dying-out of this euphoria and thisleads to the dip. The third stage corresponds to true organic growthof the network (when more and more people know about the net-work). This growth takes takes over the node/edge creation activ-ities, slowly overwhelms the dip, and eventually leads to a steadyincrease in density. To the best of our knowledge, this phenomenonhas not been observed before in real social networks (again, per-haps due to the lack of suitable data).
For completeness, we also look at the degree distribution of thesegraphs. Figure 3(A) shows the degree distribution of the Flickr finalgraph in log-log scale. As expected, it is a power law. The Yahoo!360 final graph exhibits an almost identical degree distribution. Itis interesting to note the non-monotone shape of this plot for thefirst three values of the degree (i.e., degree = 0, 1, 2). This peak oc-curs because of the “invite” option that is often used in adding new
Research Track Poster
613
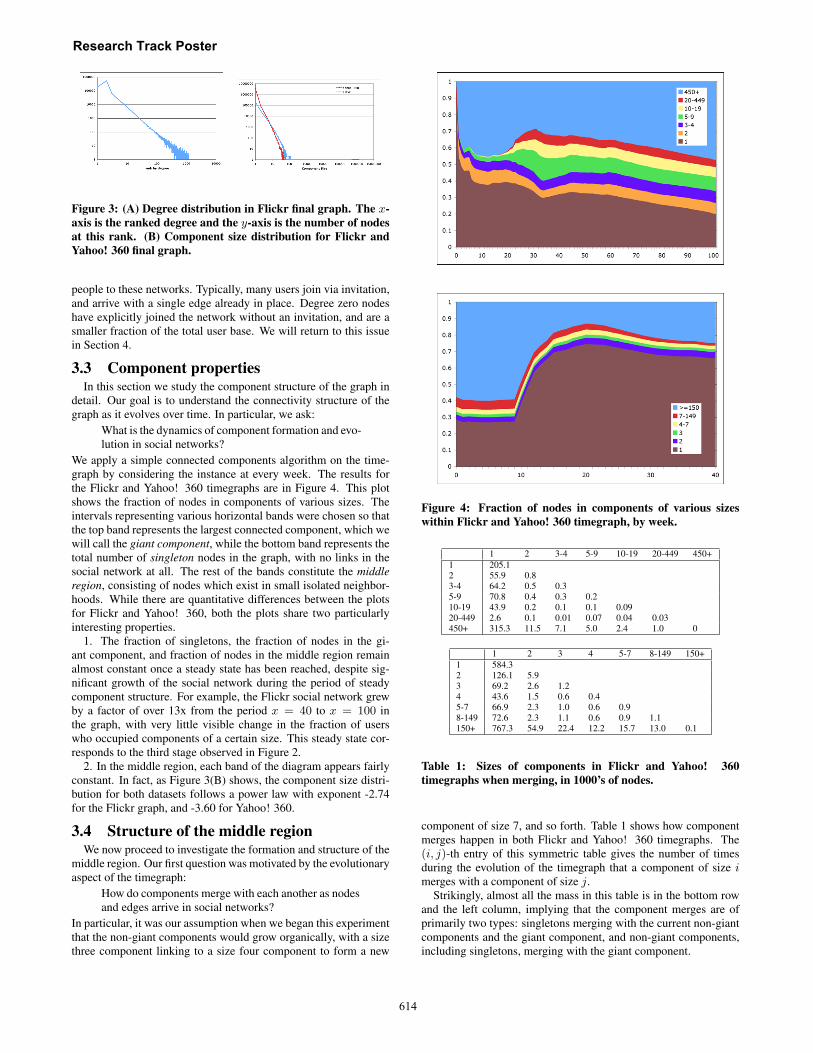
Figure 3: (A) Degree distribution in Flickr final graph. The x-axis is the ranked degree and the y-axis is the number of nodesat this rank. (B) Component size distribution for Flickr andYahoo! 360 final graph.
people to these networks. Typically, many users join via invitation,and arrive with a single edge already in place. Degree zero nodeshave explicitly joined the network without an invitation, and are asmaller fraction of the total user base. We will return to this issuein Section 4.
3.3 Component propertiesIn this section we study the component structure of the graph in
detail. Our goal is to understand the connectivity structure of thegraph as it evolves over time. In particular, we ask:
What is the dynamics of component formation and evo-lution in social networks?
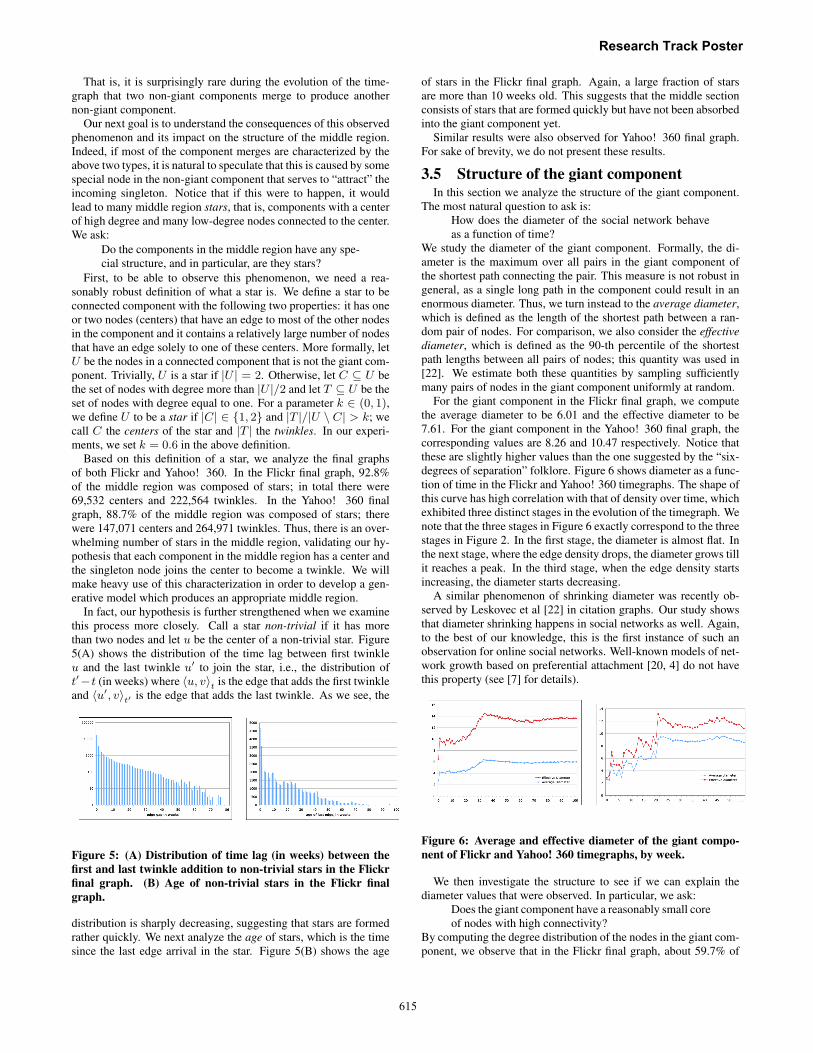
We apply a simple connected components algorithm on the time-graph by considering the instance at every week. The results forthe Flickr and Yahoo! 360 timegraphs are in Figure 4. This plotshows the fraction of nodes in components of various sizes. Theintervals representing various horizontal bands were chosen so thatthe top band represents the largest connected component, which wewill call the giant component, while the bottom band represents thetotal number of singleton nodes in the graph, with no links in thesocial network at all. The rest of the bands constitute the middleregion, consisting of nodes which exist in small isolated neighbor-hoods. While there are quantitative differences between the plotsfor Flickr and Yahoo! 360, both the plots share two particularlyinteresting properties.
1. The fraction of singletons, the fraction of nodes in the gi-ant component, and fraction of nodes in the middle region remainalmost constant once a steady state has been reached, despite sig-nificant growth of the social network during the period of steadycomponent structure. For example, the Flickr social network grewby a factor of over 13x from the period x = 40 to x = 100 inthe graph, with very little visible change in the fraction of userswho occupied components of a certain size. This steady state cor-responds to the third stage observed in Figure 2.
2. In the middle region, each band of the diagram appears fairlyconstant. In fact, as Figure 3(B) shows, the component size distri-bution for both datasets follows a power law with exponent -2.74for the Flickr graph, and -3.60 for Yahoo! 360.
3.4 Structure of the middle regionWe now proceed to investigate the formation and structure of the
middle region. Our first question was motivated by the evolutionaryaspect of the timegraph:
How do components merge with each another as nodesand edges arrive in social networks?
In particular, it was our assumption when we began this experimentthat the non-giant components would grow organically, with a sizethree component linking to a size four component to form a new
Figure 4: Fraction of nodes in components of various sizeswithin Flickr and Yahoo! 360 timegraph, by week.
1 2 3-4 5-9 10-19 20-449 450+1 205.12 55.9 0.83-4 64.2 0.5 0.35-9 70.8 0.4 0.3 0.210-19 43.9 0.2 0.1 0.1 0.0920-449 2.6 0.1 0.01 0.07 0.04 0.03450+ 315.3 11.5 7.1 5.0 2.4 1.0 0
1 2 3 4 5-7 8-149 150+1 584.32 126.1 5.93 69.2 2.6 1.24 43.6 1.5 0.6 0.45-7 66.9 2.3 1.0 0.6 0.98-149 72.6 2.3 1.1 0.6 0.9 1.1150+ 767.3 54.9 22.4 12.2 15.7 13.0 0.1
Table 1: Sizes of components in Flickr and Yahoo! 360timegraphs when merging, in 1000’s of nodes.
component of size 7, and so forth. Table 1 shows how componentmerges happen in both Flickr and Yahoo! 360 timegraphs. The(i, j)-th entry of this symmetric table gives the number of timesduring the evolution of the timegraph that a component of size imerges with a component of size j.
Strikingly, almost all the mass in this table is in the bottom rowand the left column, implying that the component merges are ofprimarily two types: singletons merging with the current non-giantcomponents and the giant component, and non-giant components,including singletons, merging with the giant component.
Research Track Poster
614
That is, it is surprisingly rare during the evolution of the time-graph that two non-giant components merge to produce anothernon-giant component.
Our next goal is to understand the consequences of this observedphenomenon and its impact on the structure of the middle region.Indeed, if most of the component merges are characterized by theabove two types, it is natural to speculate that this is caused by somespecial node in the non-giant component that serves to “attract” theincoming singleton. Notice that if this were to happen, it wouldlead to many middle region stars, that is, components with a centerof high degree and many low-degree nodes connected to the center.We ask:
Do the components in the middle region have any spe-cial structure, and in particular, are they stars?
First, to be able to observe this phenomenon, we need a rea-sonably robust definition of what a star is. We define a star to beconnected component with the following two properties: it has oneor two nodes (centers) that have an edge to most of the other nodesin the component and it contains a relatively large number of nodesthat have an edge solely to one of these centers. More formally, letU be the nodes in a connected component that is not the giant com-ponent. Trivially, U is a star if |U | = 2. Otherwise, let C ⊆ U bethe set of nodes with degree more than |U |/2 and let T ⊆ U be theset of nodes with degree equal to one. For a parameter k ∈ (0, 1),we define U to be a star if |C| ∈ {1, 2} and |T |/|U \ C| > k; wecall C the centers of the star and |T | the twinkles. In our experi-ments, we set k = 0.6 in the above definition.
Based on this definition of a star, we analyze the final graphsof both Flickr and Yahoo! 360. In the Flickr final graph, 92.8%of the middle region was composed of stars; in total there were69,532 centers and 222,564 twinkles. In the Yahoo! 360 finalgraph, 88.7% of the middle region was composed of stars; therewere 147,071 centers and 264,971 twinkles. Thus, there is an over-whelming number of stars in the middle region, validating our hy-pothesis that each component in the middle region has a center andthe singleton node joins the center to become a twinkle. We willmake heavy use of this characterization in order to develop a gen-erative model which produces an appropriate middle region.
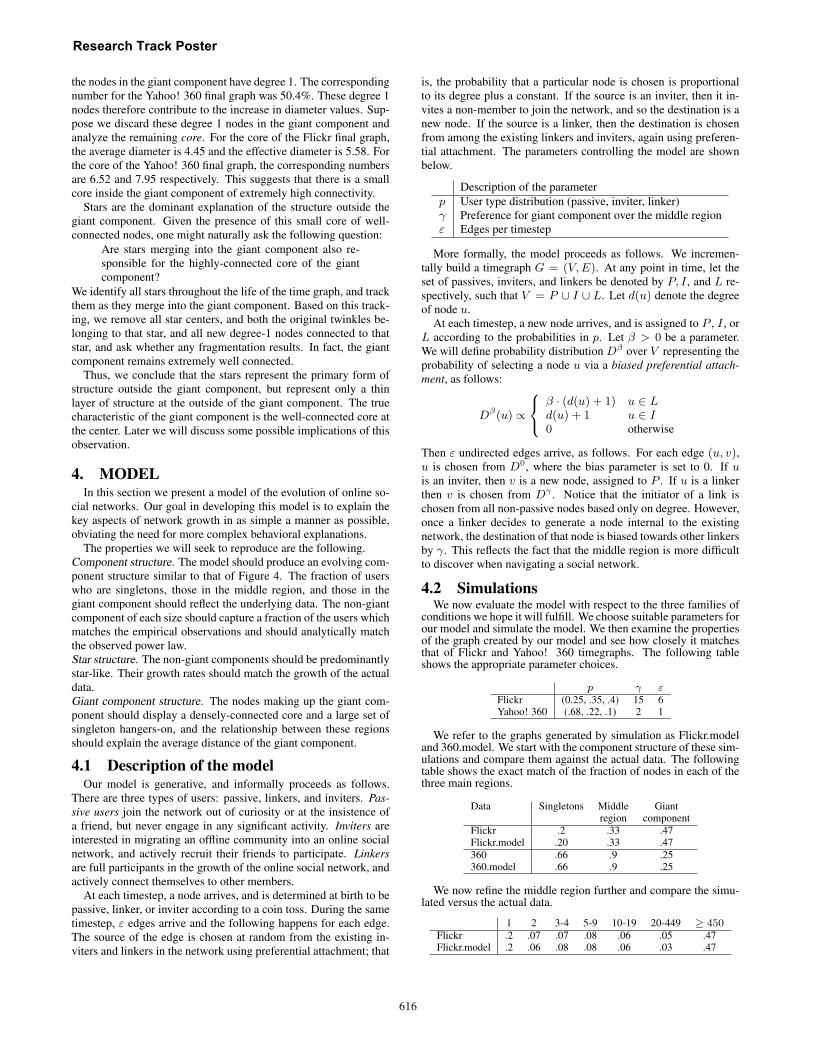
In fact, our hypothesis is further strengthened when we examinethis process more closely. Call a star non-trivial if it has morethan two nodes and let u be the center of a non-trivial star. Figure5(A) shows the distribution of the time lag between first twinkleu and the last twinkle u′ to join the star, i.e., the distribution oft′−t (in weeks) where 〈u, v〉t is the edge that adds the first twinkleand 〈u′, v〉t′ is the edge that adds the last twinkle. As we see, the
Figure 5: (A) Distribution of time lag (in weeks) between thefirst and last twinkle addition to non-trivial stars in the Flickrfinal graph. (B) Age of non-trivial stars in the Flickr finalgraph.
distribution is sharply decreasing, suggesting that stars are formedrather quickly. We next analyze the age of stars, which is the timesince the last edge arrival in the star. Figure 5(B) shows the age
of stars in the Flickr final graph. Again, a large fraction of starsare more than 10 weeks old. This suggests that the middle sectionconsists of stars that are formed quickly but have not been absorbedinto the giant component yet.
Similar results were also observed for Yahoo! 360 final graph.For sake of brevity, we do not present these results.
3.5 Structure of the giant componentIn this section we analyze the structure of the giant component.
The most natural question to ask is:How does the diameter of the social network behaveas a function of time?
We study the diameter of the giant component. Formally, the di-ameter is the maximum over all pairs in the giant component ofthe shortest path connecting the pair. This measure is not robust ingeneral, as a single long path in the component could result in anenormous diameter. Thus, we turn instead to the average diameter,which is defined as the length of the shortest path between a ran-dom pair of nodes. For comparison, we also consider the effectivediameter, which is defined as the 90-th percentile of the shortestpath lengths between all pairs of nodes; this quantity was used in[22]. We estimate both these quantities by sampling sufficientlymany pairs of nodes in the giant component uniformly at random.
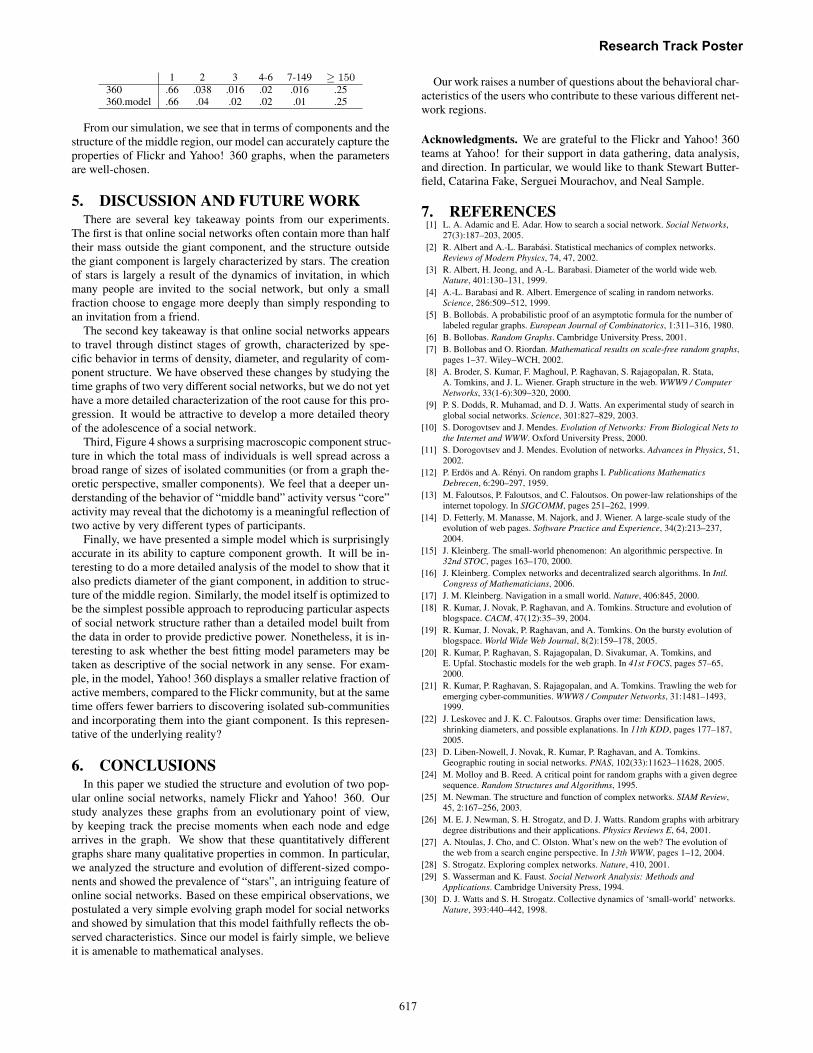
For the giant component in the Flickr final graph, we computethe average diameter to be 6.01 and the effective diameter to be7.61. For the giant component in the Yahoo! 360 final graph, thecorresponding values are 8.26 and 10.47 respectively. Notice thatthese are slightly higher values than the one suggested by the “six-degrees of separation” folklore. Figure 6 shows diameter as a func-tion of time in the Flickr and Yahoo! 360 timegraphs. The shape ofthis curve has high correlation with that of density over time, whichexhibited three distinct stages in the evolution of the timegraph. Wenote that the three stages in Figure 6 exactly correspond to the threestages in Figure 2. In the first stage, the diameter is almost flat. Inthe next stage, where the edge density drops, the diameter grows tillit reaches a peak. In the third stage, when the edge density startsincreasing, the diameter starts decreasing.
A similar phenomenon of shrinking diameter was recently ob-served by Leskovec et al [22] in citation graphs. Our study showsthat diameter shrinking happens in social networks as well. Again,to the best of our knowledge, this is the first instance of such anobservation for online social networks. Well-known models of net-work growth based on preferential attachment [20, 4] do not havethis property (see [7] for details).
Figure 6: Average and effective diameter of the giant compo-nent of Flickr and Yahoo! 360 timegraphs, by week.
We then investigate the structure to see if we can explain thediameter values that were observed. In particular, we ask:
Does the giant component have a reasonably small coreof nodes with high connectivity?
By computing the degree distribution of the nodes in the giant com-ponent, we observe that in the Flickr final graph, about 59.7% of
Research Track Poster
615
the nodes in the giant component have degree 1. The correspondingnumber for the Yahoo! 360 final graph was 50.4%. These degree 1nodes therefore contribute to the increase in diameter values. Sup-pose we discard these degree 1 nodes in the giant component andanalyze the remaining core. For the core of the Flickr final graph,the average diameter is 4.45 and the effective diameter is 5.58. Forthe core of the Yahoo! 360 final graph, the corresponding numbersare 6.52 and 7.95 respectively. This suggests that there is a smallcore inside the giant component of extremely high connectivity.
Stars are the dominant explanation of the structure outside thegiant component. Given the presence of this small core of well-connected nodes, one might naturally ask the following question:
Are stars merging into the giant component also re-sponsible for the highly-connected core of the giantcomponent?
We identify all stars throughout the life of the time graph, and trackthem as they merge into the giant component. Based on this track-ing, we remove all star centers, and both the original twinkles be-longing to that star, and all new degree-1 nodes connected to thatstar, and ask whether any fragmentation results. In fact, the giantcomponent remains extremely well connected.
Thus, we conclude that the stars represent the primary form ofstructure outside the giant component, but represent only a thinlayer of structure at the outside of the giant component. The truecharacteristic of the giant component is the well-connected core atthe center. Later we will discuss some possible implications of thisobservation.
4. MODELIn this section we present a model of the evolution of online so-
cial networks. Our goal in developing this model is to explain thekey aspects of network growth in as simple a manner as possible,obviating the need for more complex behavioral explanations.
The properties we will seek to reproduce are the following.Component structure. The model should produce an evolving com-ponent structure similar to that of Figure 4. The fraction of userswho are singletons, those in the middle region, and those in thegiant component should reflect the underlying data. The non-giantcomponent of each size should capture a fraction of the users whichmatches the empirical observations and should analytically matchthe observed power law.Star structure. The non-giant components should be predominantlystar-like. Their growth rates should match the growth of the actualdata.Giant component structure. The nodes making up the giant com-ponent should display a densely-connected core and a large set ofsingleton hangers-on, and the relationship between these regionsshould explain the average distance of the giant component.
4.1 Description of the modelOur model is generative, and informally proceeds as follows.
There are three types of users: passive, linkers, and inviters. Pas-sive users join the network out of curiosity or at the insistence ofa friend, but never engage in any significant activity. Inviters areinterested in migrating an offline community into an online socialnetwork, and actively recruit their friends to participate. Linkersare full participants in the growth of the online social network, andactively connect themselves to other members.
At each timestep, a node arrives, and is determined at birth to bepassive, linker, or inviter according to a coin toss. During the sametimestep, ε edges arrive and the following happens for each edge.The source of the edge is chosen at random from the existing in-viters and linkers in the network using preferential attachment; that
is, the probability that a particular node is chosen is proportionalto its degree plus a constant. If the source is an inviter, then it in-vites a non-member to join the network, and so the destination is anew node. If the source is a linker, then the destination is chosenfrom among the existing linkers and inviters, again using preferen-tial attachment. The parameters controlling the model are shownbelow.
Description of the parameterp User type distribution (passive, inviter, linker)γ Preference for giant component over the middle regionε Edges per timestep
More formally, the model proceeds as follows. We incremen-tally build a timegraph G = (V, E). At any point in time, let theset of passives, inviters, and linkers be denoted by P, I , and L re-spectively, such that V = P ∪ I ∪ L. Let d(u) denote the degreeof node u.
At each timestep, a new node arrives, and is assigned to P , I , orL according to the probabilities in p. Let β > 0 be a parameter.We will define probability distribution Dβ over V representing theprobability of selecting a node u via a biased preferential attach-ment, as follows:
Dβ(u) ∝
8<: β · (d(u) + 1) u ∈ Ld(u) + 1 u ∈ I0 otherwise
Then ε undirected edges arrive, as follows. For each edge (u, v),u is chosen from D0, where the bias parameter is set to 0. If uis an inviter, then v is a new node, assigned to P . If u is a linkerthen v is chosen from Dγ . Notice that the initiator of a link ischosen from all non-passive nodes based only on degree. However,once a linker decides to generate a node internal to the existingnetwork, the destination of that node is biased towards other linkersby γ. This reflects the fact that the middle region is more difficultto discover when navigating a social network.
4.2 SimulationsWe now evaluate the model with respect to the three families of
conditions we hope it will fulfill. We choose suitable parameters forour model and simulate the model. We then examine the propertiesof the graph created by our model and see how closely it matchesthat of Flickr and Yahoo! 360 timegraphs. The following tableshows the appropriate parameter choices.
p γ εFlickr (0.25, .35, .4) 15 6Yahoo! 360 (.68, .22, .1) 2 1
We refer to the graphs generated by simulation as Flickr.modeland 360.model. We start with the component structure of these sim-ulations and compare them against the actual data. The followingtable shows the exact match of the fraction of nodes in each of thethree main regions.
Data Singletons Middle Giantregion component
Flickr .2 .33 .47Flickr.model .20 .33 .47360 .66 .9 .25360.model .66 .9 .25
We now refine the middle region further and compare the simu-lated versus the actual data.
1 2 3-4 5-9 10-19 20-449 ≥ 450Flickr .2 .07 .07 .08 .06 .05 .47Flickr.model .2 .06 .08 .08 .06 .03 .47
Research Track Poster
616
1 2 3 4-6 7-149 ≥ 150360 .66 .038 .016 .02 .016 .25360.model .66 .04 .02 .02 .01 .25
From our simulation, we see that in terms of components and thestructure of the middle region, our model can accurately capture theproperties of Flickr and Yahoo! 360 graphs, when the parametersare well-chosen.
5. DISCUSSION AND FUTURE WORKThere are several key takeaway points from our experiments.
The first is that online social networks often contain more than halftheir mass outside the giant component, and the structure outsidethe giant component is largely characterized by stars. The creationof stars is largely a result of the dynamics of invitation, in whichmany people are invited to the social network, but only a smallfraction choose to engage more deeply than simply responding toan invitation from a friend.
The second key takeaway is that online social networks appearsto travel through distinct stages of growth, characterized by spe-cific behavior in terms of density, diameter, and regularity of com-ponent structure. We have observed these changes by studying thetime graphs of two very different social networks, but we do not yethave a more detailed characterization of the root cause for this pro-gression. It would be attractive to develop a more detailed theoryof the adolescence of a social network.
Third, Figure 4 shows a surprising macroscopic component struc-ture in which the total mass of individuals is well spread across abroad range of sizes of isolated communities (or from a graph the-oretic perspective, smaller components). We feel that a deeper un-derstanding of the behavior of “middle band” activity versus “core”activity may reveal that the dichotomy is a meaningful reflection oftwo active by very different types of participants.
Finally, we have presented a simple model which is surprisinglyaccurate in its ability to capture component growth. It will be in-teresting to do a more detailed analysis of the model to show that italso predicts diameter of the giant component, in addition to struc-ture of the middle region. Similarly, the model itself is optimized tobe the simplest possible approach to reproducing particular aspectsof social network structure rather than a detailed model built fromthe data in order to provide predictive power. Nonetheless, it is in-teresting to ask whether the best fitting model parameters may betaken as descriptive of the social network in any sense. For exam-ple, in the model, Yahoo! 360 displays a smaller relative fraction ofactive members, compared to the Flickr community, but at the sametime offers fewer barriers to discovering isolated sub-communitiesand incorporating them into the giant component. Is this represen-tative of the underlying reality?
6. CONCLUSIONSIn this paper we studied the structure and evolution of two pop-
ular online social networks, namely Flickr and Yahoo! 360. Ourstudy analyzes these graphs from an evolutionary point of view,by keeping track the precise moments when each node and edgearrives in the graph. We show that these quantitatively differentgraphs share many qualitative properties in common. In particular,we analyzed the structure and evolution of different-sized compo-nents and showed the prevalence of “stars”, an intriguing feature ofonline social networks. Based on these empirical observations, wepostulated a very simple evolving graph model for social networksand showed by simulation that this model faithfully reflects the ob-served characteristics. Since our model is fairly simple, we believeit is amenable to mathematical analyses.
Our work raises a number of questions about the behavioral char-acteristics of the users who contribute to these various different net-work regions.
Acknowledgments. We are grateful to the Flickr and Yahoo! 360teams at Yahoo! for their support in data gathering, data analysis,and direction. In particular, we would like to thank Stewart Butter-field, Catarina Fake, Serguei Mourachov, and Neal Sample.
7. REFERENCES[1] L. A. Adamic and E. Adar. How to search a social network. Social Networks,
27(3):187–203, 2005.[2] R. Albert and A.-L. Barabasi. Statistical mechanics of complex networks.
Reviews of Modern Physics, 74, 47, 2002.[3] R. Albert, H. Jeong, and A.-L. Barabasi. Diameter of the world wide web.
Nature, 401:130–131, 1999.[4] A.-L. Barabasi and R. Albert. Emergence of scaling in random networks.
Science, 286:509–512, 1999.[5] B. Bollobas. A probabilistic proof of an asymptotic formula for the number of
labeled regular graphs. European Journal of Combinatorics, 1:311–316, 1980.[6] B. Bollobas. Random Graphs. Cambridge University Press, 2001.[7] B. Bollobas and O. Riordan. Mathematical results on scale-free random graphs,
pages 1–37. Wiley–WCH, 2002.[8] A. Broder, S. Kumar, F. Maghoul, P. Raghavan, S. Rajagopalan, R. Stata,
A. Tomkins, and J. L. Wiener. Graph structure in the web. WWW9 / ComputerNetworks, 33(1-6):309–320, 2000.
[9] P. S. Dodds, R. Muhamad, and D. J. Watts. An experimental study of search inglobal social networks. Science, 301:827–829, 2003.
[10] S. Dorogovtsev and J. Mendes. Evolution of Networks: From Biological Nets tothe Internet and WWW. Oxford University Press, 2000.
[11] S. Dorogovtsev and J. Mendes. Evolution of networks. Advances in Physics, 51,2002.
[12] P. Erdos and A. Renyi. On random graphs I. Publications MathematicsDebrecen, 6:290–297, 1959.
[13] M. Faloutsos, P. Faloutsos, and C. Faloutsos. On power-law relationships of theinternet topology. In SIGCOMM, pages 251–262, 1999.
[14] D. Fetterly, M. Manasse, M. Najork, and J. Wiener. A large-scale study of theevolution of web pages. Software Practice and Experience, 34(2):213–237,2004.
[15] J. Kleinberg. The small-world phenomenon: An algorithmic perspective. In32nd STOC, pages 163–170, 2000.
[16] J. Kleinberg. Complex networks and decentralized search algorithms. In Intl.Congress of Mathematicians, 2006.
[17] J. M. Kleinberg. Navigation in a small world. Nature, 406:845, 2000.[18] R. Kumar, J. Novak, P. Raghavan, and A. Tomkins. Structure and evolution of
blogspace. CACM, 47(12):35–39, 2004.[19] R. Kumar, J. Novak, P. Raghavan, and A. Tomkins. On the bursty evolution of
blogspace. World Wide Web Journal, 8(2):159–178, 2005.[20] R. Kumar, P. Raghavan, S. Rajagopalan, D. Sivakumar, A. Tomkins, and
E. Upfal. Stochastic models for the web graph. In 41st FOCS, pages 57–65,2000.
[21] R. Kumar, P. Raghavan, S. Rajagopalan, and A. Tomkins. Trawling the web foremerging cyber-communities. WWW8 / Computer Networks, 31:1481–1493,1999.
[22] J. Leskovec and J. K. C. Faloutsos. Graphs over time: Densification laws,shrinking diameters, and possible explanations. In 11th KDD, pages 177–187,2005.
[23] D. Liben-Nowell, J. Novak, R. Kumar, P. Raghavan, and A. Tomkins.Geographic routing in social networks. PNAS, 102(33):11623–11628, 2005.
[24] M. Molloy and B. Reed. A critical point for random graphs with a given degreesequence. Random Structures and Algorithms, 1995.
[25] M. Newman. The structure and function of complex networks. SIAM Review,45, 2:167–256, 2003.
[26] M. E. J. Newman, S. H. Strogatz, and D. J. Watts. Random graphs with arbitrarydegree distributions and their applications. Physics Reviews E, 64, 2001.
[27] A. Ntoulas, J. Cho, and C. Olston. What’s new on the web? The evolution ofthe web from a search engine perspective. In 13th WWW, pages 1–12, 2004.
[28] S. Strogatz. Exploring complex networks. Nature, 410, 2001.[29] S. Wasserman and K. Faust. Social Network Analysis: Methods and
Applications. Cambridge University Press, 1994.[30] D. J. Watts and S. H. Strogatz. Collective dynamics of ‘small-world’ networks.
Nature, 393:440–442, 1998.
Research Track Poster
617