MANET: tracing evolution of protein architecture in metabolic networks
13
BioMed Central Page 1 of 13 (page number not for citation purposes) BMC Bioinformatics Open Access Database MANET: tracing evolution of protein architecture in metabolic networks Hee Shin Kim 1 , Jay E Mittenthal 2 and Gustavo Caetano-Anollés* 1 Address: 1 Department of Crop Sciences, University of Illinois at Urbana-Champaign, Urbana, IL 61801, USA and 2 Department of Cell and Developmental Biology, University of Illinois at Urbana-Champaign, Urbana, IL 61801, USA Email: Hee Shin Kim - [email protected]; Jay E Mittenthal - [email protected]; Gustavo Caetano-Anollés* - [email protected] * Corresponding author Abstract Background: Cellular metabolism can be characterized by networks of enzymatic reactions and transport processes capable of supporting cellular life. Our aim is to find evolutionary patterns and processes embedded in the architecture and function of modern metabolism, using information derived from structural genomics. Description: The Molecular Ancestry Network (MANET) project traces evolution of protein architecture in biomolecular networks. We describe metabolic MANET, a database that links information in the Structural Classification of Proteins (SCOP), the Kyoto Encyclopedia of Genes and Genomes (KEGG), and phylogenetic reconstructions depicting the evolution of protein fold architecture. Metabolic MANET literally 'paints' the ancestries of enzymes derived from rooted phylogenomic trees directly onto over one hundred metabolic subnetworks, enabling the study of evolutionary patterns at global and local levels. An initial analysis of painted subnetworks reveals widespread enzymatic recruitment and an early origin of amino acid metabolism. Conclusion: MANET maps evolutionary relationships directly and globally onto biological networks, and can generate and test hypotheses related to evolution of metabolism. We anticipate its use in the study of other networks, such as signaling and other protein-protein interaction networks. Background Cellular metabolism represents a collection of enzymatic reactions and transport processes that convert metabolites into molecules capable of supporting cellular life. It is the best-studied biological network, with highly branched pathways describing the enzymatic processing of metabo- lites. Though underappreciated, it also represents one of the greatest achievements of science, resulting from almost two centuries of biochemical research. There is considerable interest in the processes underlying the evolution of cellular metabolism. The existence of a core ensemble of metabolic reactions common to most organisms suggests that the global metabolic structure has been the subject of strong evolutionary constraint. Simi- larly, network connectivity properties suggest modular components typical of evolved systems [1-3] and emer- gence of hub metabolites involved in many reactions by enzyme specialization [4]. How metabolic networks func- tion and change as organisms increased in complexity remains an important question, making metabolism an Published: 19 July 2006 BMC Bioinformatics 2006, 7:351 doi:10.1186/1471-2105-7-351 Received: 13 April 2006 Accepted: 19 July 2006 This article is available from: http://www.biomedcentral.com/1471-2105/7/351 © 2006 Kim et al; licensee BioMed Central Ltd. This is an Open Access article distributed under the terms of the Creative Commons Attribution License (http://creativecommons.org/licenses/by/2.0 ), which permits unrestricted use, distribution, and reproduction in any medium, provided the original work is properly cited.
Transcript of MANET: tracing evolution of protein architecture in metabolic networks
BioMed CentralBMC Bioinformatics
ss
Open AcceDatabaseMANET: tracing evolution of protein architecture in metabolic networksHee Shin Kim1, Jay E Mittenthal2 and Gustavo Caetano-Anollés*1Address: 1Department of Crop Sciences, University of Illinois at Urbana-Champaign, Urbana, IL 61801, USA and 2Department of Cell and Developmental Biology, University of Illinois at Urbana-Champaign, Urbana, IL 61801, USA
Email: Hee Shin Kim - [email protected]; Jay E Mittenthal - [email protected]; Gustavo Caetano-Anollés* - [email protected]
* Corresponding author
AbstractBackground: Cellular metabolism can be characterized by networks of enzymatic reactions andtransport processes capable of supporting cellular life. Our aim is to find evolutionary patterns andprocesses embedded in the architecture and function of modern metabolism, using informationderived from structural genomics.
Description: The Molecular Ancestry Network (MANET) project traces evolution of proteinarchitecture in biomolecular networks. We describe metabolic MANET, a database that linksinformation in the Structural Classification of Proteins (SCOP), the Kyoto Encyclopedia of Genesand Genomes (KEGG), and phylogenetic reconstructions depicting the evolution of protein foldarchitecture. Metabolic MANET literally 'paints' the ancestries of enzymes derived from rootedphylogenomic trees directly onto over one hundred metabolic subnetworks, enabling the study ofevolutionary patterns at global and local levels. An initial analysis of painted subnetworks revealswidespread enzymatic recruitment and an early origin of amino acid metabolism.
Conclusion: MANET maps evolutionary relationships directly and globally onto biologicalnetworks, and can generate and test hypotheses related to evolution of metabolism. We anticipateits use in the study of other networks, such as signaling and other protein-protein interactionnetworks.
BackgroundCellular metabolism represents a collection of enzymaticreactions and transport processes that convert metabolitesinto molecules capable of supporting cellular life. It is thebest-studied biological network, with highly branchedpathways describing the enzymatic processing of metabo-lites. Though underappreciated, it also represents one ofthe greatest achievements of science, resulting fromalmost two centuries of biochemical research.
There is considerable interest in the processes underlyingthe evolution of cellular metabolism. The existence of acore ensemble of metabolic reactions common to mostorganisms suggests that the global metabolic structure hasbeen the subject of strong evolutionary constraint. Simi-larly, network connectivity properties suggest modularcomponents typical of evolved systems [1-3] and emer-gence of hub metabolites involved in many reactions byenzyme specialization [4]. How metabolic networks func-tion and change as organisms increased in complexityremains an important question, making metabolism an
Published: 19 July 2006
BMC Bioinformatics 2006, 7:351 doi:10.1186/1471-2105-7-351
Received: 13 April 2006Accepted: 19 July 2006
This article is available from: http://www.biomedcentral.com/1471-2105/7/351
© 2006 Kim et al; licensee BioMed Central Ltd.This is an Open Access article distributed under the terms of the Creative Commons Attribution License (http://creativecommons.org/licenses/by/2.0), which permits unrestricted use, distribution, and reproduction in any medium, provided the original work is properly cited.
Page 1 of 13(page number not for citation purposes)

BMC Bioinformatics 2006, 7:351 http://www.biomedcentral.com/1471-2105/7/351
interesting model for the evolution of biomolecular net-works.
Metabolism is largely driven by enzymatic specificities.Consequently, the origin and evolution of metabolic net-works can be explored advantageously by focusing onprotein molecules. However, metabolism is very ancientand parts of the metabolic network probably evolvedprior to the origin of cellular life from reactions that couldhave proceeded without catalysis or with inorganic cata-lysts [5]. This view is supported to some extent by in vitroexperiments that try to simulate pre-biotic chemistry. It islikely that polypeptides became metabolic catalyststhrough takeover of pre-biotic reactions [6]. The earliestenzymes were probably weakly catalytic and multifunc-tional with broad specificities. Gradually, more numer-ous, effective, and specific enzymes evolved from themultifunctional enzymes through gene duplication,mutation and divergence. The only condition necessaryfor such a scenario appears to be selection for fastergrowth [7].
As enzymatic pathways became more complicated, newenzymatic functions and metabolic pathways could havebeen generated by recruitment of individual enzymesfrom the same or different pathways, or by enzymaticrecruitments en masse from entire pathways. In this regard,several possible scenarios for the evolution of enzymes inmetabolic pathways have been proposed [8]. One popularscenario is the "backwards" (or retrograde) evolutionhypothesis in which pathways evolve driven by successfulproduction of their end products [9]. Here, biosyntheticpathways undergo retro-evolution, with recruitment ofenzymes (from within or outside the pathway) to hostsites sequentially more remote from the end product ofthe pathway. By a symmetrical argument, catabolic path-ways could have evolved sequentially from the metabolitebeing degraded [10]. An alternative scenario is one inwhich new pathways evolve by "enzyme recruitment"from diverse donor sites throughout metabolism [11].This hypothesis assumes there is already an active enzy-matic core with multifunctional and/or specializedenzymes from which new enzyme recruits are drawn formetabolic innovation. The result is an evolutionary"patchwork" of homologous enzymes that are present indifferent pathways [6].
There is considerable evidence supporting the patchworkrecruitment scenario [8]. For example, enzymes with α/βbarrel fold structure that catalyze similar reactions occuracross metabolic pathways [12]. These patterns of struc-tural homology appeared to be pervasive when structuralassignments and sequence comparisons were used to ana-lyze the small-molecule metabolism in Escherichia coli[13,14]. Recruitment occurred with little regularity in
these instances. However, proximity of donor and hostsites appear to influence the probability of recruitment,with diversification to new host sites occurring mainlyfrom nearby enzymes and varying with metabolite usageand enzyme class [15]. It is noteworthy that sequencecomparisons revealed homologous enzyme pairs occur-ring close to each other in the metabolic network moreoften than expected by chance [16]. However, thesehomologous enzyme pairs had similar functions thatcould be best explained by patchwork recruitment. Theseobservations suggest the retrograde evolution modelplayed a small part in the process of metabolic enzymeevolution. None of these studies however used a phyloge-netic approach to establish evolutionary patterns. Becausecommon ancestry is the organizing principle underlyingbiology, we generate here a database for the evolutionarystudy of metabolic networks that integrates fragmentaryknowledge about molecules and their interaction withphylogenomic information. This database characterizespatterns of evolution in cellular metabolism that will helpto resolve the contribution of various plausible evolution-ary scenarios.
Proteins consist of domains, compact sections of the pro-tein molecule that have distinct structure, function andevolutionary history [17] and are used as a basis for struc-tural classification [18,19]. Protein domains represent afinite number of folding architectures, the so-called pro-tein folds [20]. These folds are highly diverse and arebelieved to originate from a common ancestor [20-22].Crystallographic information gathered by structuralgenomics has enhanced our knowledge of the universe offold architecture. This effort has been complemented bymatching structures defined by a library of folds togenome sequences. For example, "occurrence analysis"methods compare how often a particular fold or foldgroup occurs in various genomes [23]. This providesinsights on the evolution of genomes because proteinswith similar sequences have analogous structures, andstructures are highly conserved in nature [23,24]. Usingthis approach, whole-genome trees were reconstructedbased on the occurrence of fold architectures and geneorthologs in genomes. These trees resemble those recon-structed from the sequence of the small subunit of ribos-omal RNA (rRNA) and showed the tripartite nature of ourorganismal world [24-29].
We recently used an approach based on a census of foldsto study protein diversification and reconstruct universalphylogenomic trees describing the evolution of proteinfold architecture [27,30,31]. Our approach is based ontwo fundamental premises: (1) that protein structure is farmore conserved than sequence and consequently carriesconsiderable phylogenetic signal, and (2) that proteinfolds that are successful and popular in nature are gener-
Page 2 of 13(page number not for citation purposes)
BMC Bioinformatics 2006, 7:351 http://www.biomedcentral.com/1471-2105/7/351
ally more ancestral. Trees reconstructed from global fold-usage statistics showed there were clear evolutionary pat-terns in the appearance of protein folds. For example, thefolds in the α/β protein class appeared at the base of thetree, and were followed by those in the α+β, all-α, all-β,small, and multidomain classes respectively [27]. A simi-lar tendency was recently observed when reconstructingparsimonious scenarios describing occurrence patterns offolds in organismal phylogenies [32]. We also traced thenumber of enzymatic functions associated with folds inthe tree of protein architecture and found that older foldswere associated with an increased number of enzymaticfunctions. These phylogenomic studies suggest enzymaticmultifunctionality was replaced by specialized functionduring evolution. Interestingly, a direct associationbetween protein classes and function was previouslyrevealed in which for example α/β folds were dispropor-tionately associated with enzymes, especially transferasesand hydrolases, while all-α and small proteins were asso-ciated with non-enzymes [33]. Within α/β folds, five foldswere the most functionally versatile (TIM-barrel, Ross-mann, ferredoxin, α/β hydrolase, and P-loop NTP hydro-lase). These folds were all placed at the base of ourphylogenomic tree.
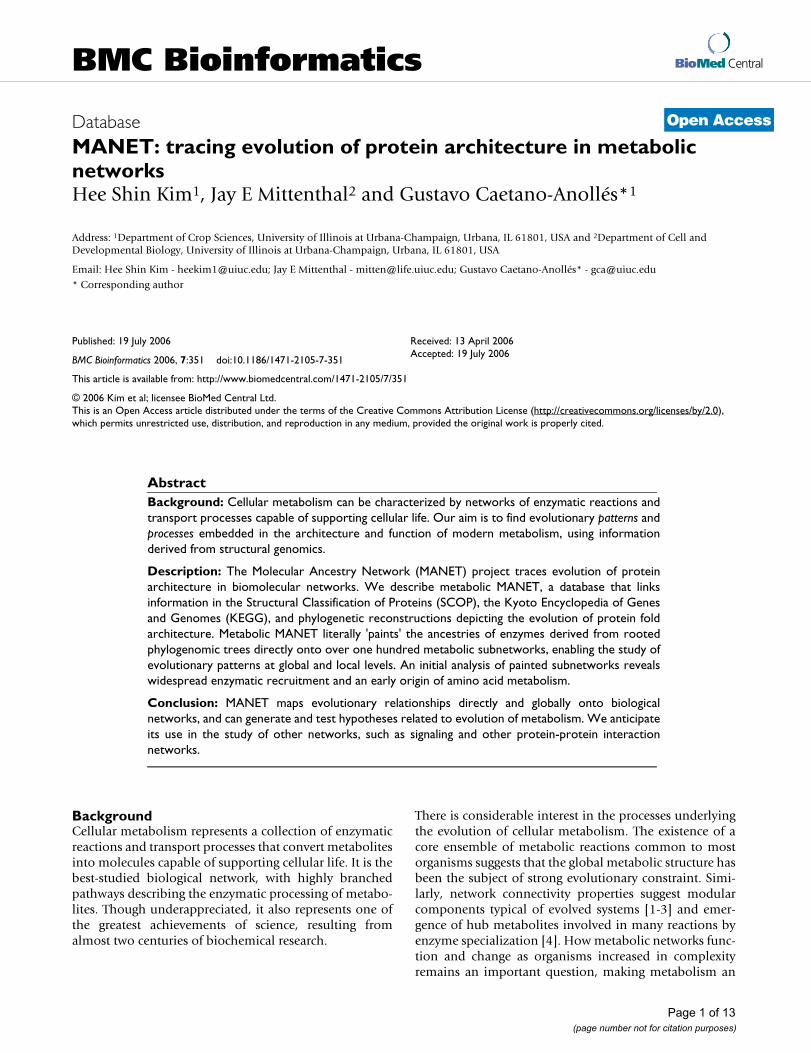
The Molecular Ancestry Network (MANET) project usesinformation embedded in our phylogenomic trees to traceevolution of protein fold architecture in biomolecularnetworks (Fig. 1). In this paper, we describe the construc-tion of metabolic MANET, a database that explores theevolution of modern metabolism. Metabolic MANETuncovers evolutionary patterns in metabolism at globaland local levels and reveals evolutionary relationshipsbetween protein architecture and enzymatic function. Weused Protein Data Bank (PDB) entries to link enzymes toprotein folds and hidden Markov models (HMMs) toassign structures to enzymes for which there was onlygene information. Phylogenomic trees were then recon-structed from protein fold occurrence in sequencedgenomes representing species within the three organismaldomains of life. These trees were used to assign a relativeage (ancestry) to each metabolic enzyme for which a pro-tein structure was known or could be inferred. Finally,ancestries were "painted" onto metabolic subnetwork rep-resentations with a color (value) that described the rela-tive age of each enzyme in metabolism.
Construction and contentApproachMANET links three flat files describing the metabolicpathways database of the Kyoto Encyclopedia of Genesand Genomes (KEGG), the Structural Classification ofProteins (SCOP) database, and phylogenomic trees recon-structed from a genome census of protein folds (Fig. 2A).KEGG provides integrated information about cellular
metabolism [34,35]. This database contains graphical dia-grams describing 132 metabolic subnetworks groupedinto 11 mesonetworks. Mesonetworks pool subnetworkswith functionally-related pathways. For example, the mes-onetwork "amino acid metabolism" includes 16 subnet-works that describe the synthesis and degradation ofspecific amino acids. The KEGG pathway file included4,362 metabolic enzymes classified according to theirfunction, 137 pathways and molecular complexes, 12,778PDB structural entries, and nucleotide and amino acidgene sequences. SCOP maps Protein Data Bank (PDB)entries onto a structural classification of proteins [18]. TheSCOP file included a classification of 24,037 PDB entriesassociated with fold families, fold superfamilies, andfolds. The phylogenomic trees describe phylogenetic rela-tionships of protein fold architectures and were recon-structed from fold occurrence in genomes that have beencompletely sequenced. The phylogenomic file summa-rizes the evolution of 784 folds in 174 genomes. Figure 2Billustrates the data model of MANET in terms of entitiesand their relationships. The schema shown in Figure 2Cspecifies the column heads for the entities and relation-ships. MANET links all components of the schema relat-
The Molecular Ancestry Network (MANET)Figure 1The Molecular Ancestry Network (MANET). The MANET project traces evolutionary patterns derived from phylogenomic analysis along biomolecular networks. In one implementation of our method, we "paint" network nodes with a color scale that reflect their ancestries.
Biomolecularnetwork
mane
Molecularancestry network
Phyogenomic tree
Oldest
Youngest
Ancestry:
Page 3 of 13(page number not for citation purposes)

BMC Bioinformatics 2006, 7:351 http://www.biomedcentral.com/1471-2105/7/351
Page 4 of 13(page number not for citation purposes)
Principles of database designFigure 2Principles of database design. A. The metabolic MANET database links the KEGG database, the SCOP database, and a database of phylogenomic trees of protein fold architecture. B. Entity-Relationship (ER) data model. "MetabolicAncestryNet-work" is the union of the relation "MetabolicNetworkwithPDB and Ancestry" and the relation "MetabolicNetwork-B and Ancestry". C. Relation schema for the ER model, specifying the name of each file and defining "MetabolicNetwork-A" and "Met-abolicNetwork-B" (see Additional file 1).
Phylogenomic DBSCOP DB KEGG DB
A
MetabolicNetwork–A (enzyme, pdb, pathway)PDBclassification (pdb, class)MetabolicNetworkWithPDB (pdb, class, foldclass, ancestryvalue)
MetabolicNetwork–B (enzyme, class, pathway)
Ancestry (foldclass, ancestryvalue)
MetabolicAncestryNetwork (enzyme, pdb, class, foldclass, ancestryvalue, pathway)
C
Class
Enzyme
PDBstructure
Pathway
Ancestryvalue
Foldclass
ClassPDBstructure ISA
Metabolic
Network
Metabolic
Ancestry
Network
MetabolicNetwork
MetabolicNetwork–B
MetabolicNetwork–A
PDBclassification
Ancestry
BMetabolic MANET DB
mmaaneMETABOLIC
TREES OF FOLD ARCHITECTUREFOLD ARCHITECTURE METABOLIC NETWORKS
WithPDB

BMC Bioinformatics 2006, 7:351 http://www.biomedcentral.com/1471-2105/7/351
ing protein folds and enzymatic function within anevolutionary perspective.
Phylogenetic analysisA set of phylogenetic features (characters) was used todescribe the frequencies with which individual proteinfolds occur in an individual genome. This frequency wastermed genomic abundance (G). At global levels, itdescribes how popular is a fold architecture in nature. Inorder to calculate G, we assigned structural domains toproteins. We did this using the HMM-based SUPER-FAMILY database [36]. SUPERFAMILY assigns proteinstructures to amino acid sequences at the fold superfamilylevel, i.e. at a hierarchical level capable of pooling proteinsfor which there is structural and sequence evidence of acommon evolutionary ancestor [37]. The HMM searchingprotocol uses a probability cut-off E of 0.02. Differencesin topologies of trees reconstructed with more stringentcut-off values were found negligible [29], so we did notexplore the role of this parameter. We also used the hier-archical scheme of SCOP to assign superfamilies to folds.Version 1.67 classifies 65,122 domains present in 24,037PDB entries into 1,447 superfamilies and 887 proteinfolds. We analyzed the genome sequence of 36, 19 and117 genomes from Eucarya, Archaea, and Bacteria, respec-tively, and reconstructed phylogenetic trees describing theevolution of 784 protein folds. Phylogenomic characterswere coded as previously described [27]. G was normal-ized using gap-recoding techniques to compensate for dif-ferences in genome size and proteome representation,and was then subjected to logarithmic transformation toaccount for unequal variances. The data was range stand-ardized to a 0–20 scale compatible with most phyloge-netic analysis programs, treated as linearly orderedmultistate characters using an alphanumeric format withnumbers 0–9 and letters A-K, and encoded in the NEXUSformat. The ANCSTATES command was used to polarizecharacters assuming that the number of protein represent-atives in a genome exhibiting a particular fold increases inthe course of evolution. Character argumentation is sup-ported by model and assumptions described and dis-cussed previously [27,30,31]. Phylogenies werereconstructed using maximum parsimony (MP) as theoptimality criterion in PAUP* [38], and phylogenetic reli-ability was evaluated by the bootstrap method [39]. Opti-mal most-parsimonious trees were obtained fromheuristic maximum parsimony searches with tree-bisec-tion-reconnection (TBR) branch swapping and 100 repli-cates of random addition sequence after exclusion ofuninformative phylogenomic characters. To decreasesearch times during branch swapping of suboptimal trees,not more than one tree was saved in each replicate. Thestructure of phylogenetic signal in the data was tested bythe skewness (g1) of the length distribution of > 104 ran-dom trees and permutation tail probability (PTP) tests of
cladistic covariation using >103 replicates. Homoplasyand synapomorphy were measured with ensemble con-sistency (CI) and retention (RI) indices.
Because reconstructed trees were intrinsically rooted, weestablished the relative age of individual protein folds bymeasuring a distance in nodes from the hypotheticalancestral fold on a relative 0–1 scale. Concretely, wecounted the number of nodes in every lineage from theroot to the terminals of the tree and divided this numberby the maximum number of nodes in a lineage. This nodedistance (nd) depicts the number of cladogenic eventsalong a lineage and was used as an indicator of the ancestryof each metabolic enzyme for which a protein structure isknown or could be inferred. A Perl script was written toextract ancestry values from phylogenetic trees.
Note that the central assumption that folds are more prev-alent and widely shared the more ancient is their originfollows a parsimony rationale supported by patterns ofdistribution and sharing of protein folds across life, statis-tical analyses, and phylogenetic considerations [27]. Ourmodel is global and applies to the world of genomes, sam-pled by phylogenetic characters describing organisms inthe three domains of life. Consequently, the modelshould be relatively insensitive to "genome lineage" spe-cific factors such as selection pressures for genome expan-sion or reduction, life styles of organisms considered, andhorizontal gene transfer events. However, our model isminimalist in that it does not account for differences inevolutionary rates across lineages and changes in the sizeof the protein world expected to have occurred duringevolution. In particular, evolution of individual folds maybe influenced by factors affecting rates, induced for exam-ple by instrinsic fold properties (e.g. flexibility). Conse-quently, fold ancestries should be regarded as lowerbounds for times of origin.
ParsingWe retrieved flat files directly from KEGG [40] and SCOP[41]. The retrieval date for data presented in this paperwas December 2004. We used Perl scripts to parse datafrom the files, store the parsed data into the entities ofMANET, and manipulate the collected information in thedatabase system. For example, we parsed data fields suchas enzyme entry, pathway, and structural PDB entry fromthe database file "enzyme" obtained from KEGG, andinserted them into the entity called "MetabolicNetwork-A". Similarly, we parsed PDB entries (structures) andSCOP protein classifiers from database files such as"dir.cla.scop.txt_1.67" obtained from SCOP into "PDB-classification". Ancestry values were recorded into theentity "Ancestry".
Page 5 of 13(page number not for citation purposes)

BMC Bioinformatics 2006, 7:351 http://www.biomedcentral.com/1471-2105/7/351
Join operations and coloring of enzymesJoin operations necessary to combine information fromentities in MANET and coloring of enzymes are describedin the supplementary data [see Additional file 1]. The joinoperation linked 687 enzymes to protein folds. This rep-resents about 35% of total enzymes associated with path-way information in the KEGG database. Coloring depictsgraphically the relative age of metabolic enzymes, whenthese are associated to folds. A 'code generator' was usedto output PHP and Visual Basic script files that paint theancestries of enzymes on metabolic subnetwork diagrams.
Superfamily prediction using HMMsIn order to increase protein fold assignments to enzymesin metabolic pathways, we used a library of HMMs forremote homology detection in SUPERFAMILY. We usedthe model library, Perl wrapper scripts for sequence align-ment, and the Sequence Alignment and Modeling System(SAM), and ran the SUPERFAMILY software packagelocally in a 15-node dual-processor Xserve cluster usingthe genes catalog file obtained from KEGG. This fileincludes amino acid and nucleotide sequence informa-tion from complete or partial genome sequences. Detailscan be found in the supplementary data file.
Statistical analysisHMM-based structural prediction increased assignmentsof protein fold to enzymes in metabolic pathways. How-ever, biases in fold superfamily prediction could affectevolutionary tracings in networks. To test the effect of pre-diction bias, we selected amino acid sequences associatedwith enzymes that had structural PDB entries. Statisticaltests were performed using the SAS software package [42].The frequency distributions of ancestries derived directlyfrom structural models (group A) and from HMM predic-tion (group B) were compared by using the Wilcoxon ranksum test. This test is one of several statistical tests that ana-lyze two groups. It requires equal variances and independ-ence of samples taken at random, but unlike t-based tests,it does not require for groups to have normal distributions[43]. The null hypothesis of no difference between groupswas tested using the NPAR1WAY procedure in SAS withgrouped data.
We also performed a global statistical analysis of distribu-tion of ancestries in mesonetworks. All average ancestryvalues of enzymes in the 11 mesonetworks described inKEGG were analyzed by ANOVA and by multiple pair-wise comparisons with the SAS package. There is a highprobability of declaring at least one pair of means signifi-cantly different when running multiple comparisonsunless the per-comparison error rate α is small amongsample means [43]. We therefore considered Type I errorrates related to multiple comparisons, choosing the LeastSquares Means with adjustment for multiple comparisons
as the general linear model (GLM) procedure and theTukey-Kramer method as the post-hoc test. The Tukey-Kramer multiple-comparison procedure controls errorrates by testing every pair of means. The mesonetwork dis-tribution data was subjected to logarithmic [log (y+1)]transformation. This reduced variances by about 1% andapproximated data to normality.
UtilityA substantial body of literature has shown that linkingprotein structure to proteins in biomolecular networkscan be advantageous. Some of these studies involved com-prehensive structure-enzyme mapping exercises andexplored mechanistic aspects related to enzymatic func-tion. For example, global analysis of small-molecule met-abolic pathways in Escherichia coli has shown extendeddistribution of structural homologues across metabolism[13,14,44,45], sometimes confined to specific subnet-works [45]. This and other evidence suggests the presenceof widespread enzymatic recruitment and other evolu-tionary processes. Linking structure to metabolic functionhas also shown that in metabolism, catalytic mechanismsand co-factor binding properties are conserved while sub-strate specificity is variable [14,40]. It appears it is easierto evolve binding sites than catalytic mechanisms. Arecent study also shows for example that only a few foldsuperfamilies exhibit great substrate diversity, while mostdo not [46]. Knowledge of structure can therefore helpgenerate hypotheses about possible substrates associatedwith a protein.
However, proteins with similar structures may or may notbe evolutionary related, and other approaches that intro-duce phylogenetic views are therefore needed. For exam-ple, Copley and Bork [12] used sequence, structure, andfunction to derive a phylogeny describing the evolution ofmembers of 12 superfamilies with α/β barrel fold struc-ture involved in metabolism. Establishing homologies atthese levels provided indications that these fold super-families shared a common origin.
Our metabolic MANET database adds an evolutionarycomponent to global assignment of protein structure toenzymes in metabolic subnetworks. Phylogenomic treesthat describe the evolutionary relationship between pro-tein fold architectures were used to define ancestries ofindividual folds, and these were traced onto metabolicsubnetwork diagrams representing modern metabolism.Because our phylogenies were reconstructed from foldoccurrence in hundreds of organisms with fullysequenced genomes spanning all three domains of life,they represent global phylogenetic statements about theprotein world [27]. These statements are therefore appro-priately mapped to enzymatic structure in global cross-
Page 6 of 13(page number not for citation purposes)

BMC Bioinformatics 2006, 7:351 http://www.biomedcentral.com/1471-2105/7/351
organismal representations of metabolism, such as thoseembedded in KEGG.
Tracing evolution of protein architecture in metabolic net-works is useful. The exercise can uncover evolutionary pat-terns of architectural diversification within individualpathways of a subnetwork or between subnetworks andmesonetworks. Because metabolism is highly conserved,with about half of enzymes present in at least one speciesfrom the three domains of life [47], it is therefore possibleto identify evolutionary patterns unique to the metaboliccore that is universally conserved. MANET can also helpidentify processes driving the evolution of modern metab-olism at local and global levels, including enzyme recruit-ment. It also allows query of SCOP, PDB, EnzymeCommission (EC) numbers, and subnetwork informationthat is useful for discovery of links between enzymaticactivities and structures.
The web interface of MANET implements server-sidescripts with a system of database management that pro-vides visualization, query, and statistical analysis dynam-ically. All components of MANET are Perl-based andeasily updated. Enzymes associated with protein folds arepainted directly on subnetwork diagrams. Each enzyme isalso hyper-linked to the KEGG database so that the usercan retrieve additional information by clicking in the dia-gram. MANET also provides numerous functionalities,which enable searching for specific protein folds withdefined ancestry values, displaying the distribution ofenzymes that are painted, and exploring folds in individ-ual subnetworks. Finally, the frequency distribution ofancestry values for each subnetwork can also be visual-ized.
Results and discussionThe MANET database project traces the evolution of pro-tein structure in biomolecular networks with bioinfor-matic, phylogenetic, and statistical methods. MetabolicMANET links the SCOP and KEGG databases to universalphylogenies of protein fold architecture. The database wasassembled in multiple steps. We first reconstructed phyl-ogenomic trees describing the evolution of protein foldsin 174 proteomes belonging to Eucarya, Archaea and Bac-teria. These trees are large and can be visualized usinghyperbolic tree visualization tools [48]. Figure 3 showscladogram, hyperbolic, and circular tree representationsof the tree of protein architecture used in this study. Thetree is consistent with phylogenies generated previouslyfrom a set of 32 proteomes using the same approach [27].These tree reconstructions were then used to assign a rela-tive age (ancestry) to each fold based on how manycladogenic events occurred in each lineage (Fig. 3).Finally, ancestries were literally painted onto metabolicsubnetworks with information derived from SCOP, KEGG
and HMM-based fold superfamily prediction tools. Figure4 describes a representative subnetwork of metabolicMANET showing enzymatic nodes painted with molecu-lar ancestries. Please note that ancestries represent a lowerlimit on the time at which the fold might have beenadopted for a particular enzymatic activity.
Reconstructed trees were based on a genomic census ofprotein architecture. Consequently, they depend on theaccuracy of genomic databases, a balanced genomic sam-pling of the living world, efficient and accurate assign-ment of structures to proteins, a structural classificationscheme that depicts evolutionary patterns, and methodsof phylogenetic tree and character state reconstruction.The influence of these factors has been discussed previ-ously [27,30,31]. While there is no possible gold standardthat can be used to confirm the validy of phylogenomicstatements, the genome census data we use to generate thetree of fold architectures was also used to generate trees ofproteomes, and these trees group organisms in the threedomains for the most part according to established organ-ismal classification [Wang and Caetano-Anollés, ms. inpreparation]. This observation supports the validity ofphylogenetic signal embedded in the data.
Our study also rests on the accuracy of SCOP, a robustprotein classification scheme [18,49], and on the mono-phyletic nature of protein folds and superfamilies. Conse-quently our inferences should be regarded as rough firstapproximations. While we do not expect major changes inthe operational definition of a protein fold, many foldscould be better described by "continuous" rather than"discrete" distributions in structure space [50]. Further-more, we trust SCOP hierarchies reflect true evolutionarygroupings. In SCOP, proteins in families express clear evo-lutionary relationships. They generally exhibit >30% pair-wise residue identities or have functions and/or structuresthat provide definite evidence of common descent. Simi-larly, fold superfamilies contain proteins with structuraland functional features that are highly suggestive of acommon evolutionary origin. However, highly popularfolds encompass collections of fold superfamilies thatshare the same arrangement and topology of secondarystructures but may not have a common evolutionary ori-gin. Consequently, the monophyletic nature of proteinfolds needs to be examined case by case, as has been donefor the (βα)8 barrels [12,51].
Currently, metabolic MANET contains 23,217 entrieslinking 1,255 enzymatic activities to PDB entries, folds,ancestry values, and pathways. A total of 6,552 PDBentries are associated with metabolic subnetworks. Basedon information derived mostly from crystallographicstructural models, 33% of metabolic protein nodes werepainted in phylogenetic tracings of the metabolic path-
Page 7 of 13(page number not for citation purposes)

BMC Bioinformatics 2006, 7:351 http://www.biomedcentral.com/1471-2105/7/351
Page 8 of 13(page number not for citation purposes)
Phylogenomic tree reconstruction of protein fold architecture generated from a domain census in 174 completely sequenced genomesFigure 3Phylogenomic tree reconstruction of protein fold architecture generated from a domain census in 174 com-pletely sequenced genomes. The structural census was defined by advanced HMMs and assigned domain structure to about 60% of genomic sequences. Three optimal trees of 115,818 steps were obtained after a heuristic search (CI = 0.134, RI = 0.696; RC = 0.093; g1 = -0.406; p < 0.01). The consensus phylogenomic tree is shown as a rooted dendrogram with terminals colored according to ranges of ancestry values (A), an unrooted hyperbolic tree (B), and a rooted circle tree (C). Terminal taxa are not labeled except for the fold of oldest origin, c.37, the P-loop hydrolase fold.
c.37
A B
Ancestral
Derived
0-0.050.05-0.100.10-0.150.15-0.200.20-0.300.30-0.400.40-0.500.50-0.600.60-0.700.70-0.800.80-0.900.90-1.00
c.37
C
c.37

BMC Bioinformatics 2006, 7:351 http://www.biomedcentral.com/1471-2105/7/351
ways that are registered in KEGG. Use of HMMs thatassign probable fold superfamily identities to proteinsequences increased the fraction of painted enzymes to63%. Individual steps in the analysis and sorting of datacan be found in the supplementary data [see Additionalfile 1]. Among the 132 subnetworks from the MANETdatabase, 122 subnetworks described metabolic pathwaysand 10 subnetworks described processing of genetic, envi-ronmental and cellular information. On average, 72% ofenzymes were painted in metabolic MANET [see Addi-tional file 1], ranging from 6% for the monoterpenoidbiosynthesis subnetwork to 100% for subnetworks suchas aminoacyl-tRNA biosynthesis, reductive carboxylatecycle (CO2 fixation), and novobiocin biosynthesis. Largesubnetworks such as those belonging to nucleotide, car-bohydrate and amino acid mesonetworks were paintedsimilarly to others. Interestingly, some subnetworks con-
tained more evolutionary information. Subnetworks suchas purine metabolism and pyrimidine metabolism thatcontain many more enzymes than others had about 83%and 79% of enzymes painted, respectively. Only 10 sub-networks (7.6%) in metabolic MANET did not haveentries associated with ancestry values. These were beta-lactam resistance and clavulanic acid biosynthesis in mes-onetwork "biosynthesis of secondary metabolites", 1,1,1-Trichloro-2,2-bis(4-chlorophenyl) ethane (DDT) degra-dation and bisphenol A degradation in "biodegradationof xenobiotics", glycosylphosphatidylinositol(GPI)-anchor biosynthesis in "glycan biosynthesis and metabo-lism", and biosynthesis of ansamycins, biosynthesis ofsiderophore group nonribosomal peptides, biosynthesisof vancomycin group antibiotics, and biosynthesis of typeII polyketide products in mesonetwork "biosynthesis of
Representative subnetwork diagram describing molecular ancestries in metabolic MANETFigure 4Representative subnetwork diagram describing molecular ancestries in metabolic MANET. A colored scale is use to assign binned ancestry values to enzyme nodes named with EC numbers. The red color represent enzyme nodes with the oldest ancestry (i.e. with ancestry values falling within the oldest range) and the blue color those of youngest ancestry. Some enzymes have more than one structural assignment. They are multidomain proteins or have different structures in different organisms. Colored enzymes with ancestry assignments resulting from HMM-based predictions are distinguished with a "sf" marking at the top right of rectangles depicting enzymatic nodes. Each subnetwork diagram also shows a frequency distribution plot of ancestries.
Page 9 of 13(page number not for citation purposes)

BMC Bioinformatics 2006, 7:351 http://www.biomedcentral.com/1471-2105/7/351
polyketides and nonribosomal peptides". The efficiencyof painting was not biased by subnetwork size (Fig. 5).
Evolutionary tracing in MANET reflects informationderived from structural models present in the PDB or rep-resents HMM-based inferences of structural classification.In order to test if biases in fold superfamily predictionscould affect evolutionary tracings in networks, wedesigned a statistical test that compared frequency distri-butions of ancestries derived from the join operationdefined by structural models (population group A) orderived from HMM-based predictions (population groupB). We selected amino acid sequences associated withenzymes that had structural PDB entries and participatedin the join operation. A total of 72,354 amino acidsequences within this category were selected, and result-ing ancestry values were calculated and analyzed (Fig. 6A).The mean (± SE) for ancestry value distributions was0.277 ± 0.008 and 0.296 ± 0.006 for populations groupsA and B, respectively. Basic statistical parameters showedboth ancestry frequency distributions were not normallydistributed but had the same shape with almost the samevariance (0.072 and 0.078 for groups A and B). However,measurements of skewness (1.068 and 0.990) and kurto-sis (0.233 and -0.029) indicate the distribution of group Bwas shifted to the right of the distribution of group A. The
Wilcoxon rank sum test showed that the p-value (0.0553)for a one-tailed test was greater than the expected value forα = 0.05 (using both normal or t-approximation), failingto reject the null hypothesis that ancestry values distribu-tions for groups A and B were identical. We therefore con-clude that ancestry value distributions derived fromstructural models or HMM predictions were not signifi-cantly different at the 95% confidence level.
We also tested the accuracy of the HMM prediction. Weselected PDB entries corresponding to enzymes in KEGGthat participated in the join operation and were classifiedstructurally, assigned PDB sequence records downloadedfrom ASTRAL [52] to the PDB entries, and analyzed thePDB sequences using the HMM package at E value = 0.02.Superfamily IDs and structural classifications correspond-ing to the PDB sequences were retrieved. Out of 21,173PDB entries corresponding to enzymes identified by thejoin operation, 20,941 PDB entries mapped to ASTRAL.Sequences corresponding to these PDB entries were ana-lyzed further. The HMM-based method rejected 212sequences, leaving a total of 20,729 PDB entries with anassigned fold structure. Out of these, only 67 PDB entriesdiffered in the expected fold assignment. At the foldsuperfamily level of classification, 106 PDB entries dif-fered in the expected superfamily assignment. Theseresults indicate that the HMM-based superfamily predic-tion can be performed at 98% accuracy levels. The detailsof this analysis can be found in our website.
The assignment of numerical ancestry values to enzymesin cellular metabolism uncovers evolutionary patterns ofarchitectural diversification within the metabolic net-work. A quick examination of ancestry distributionsdepicted in each subnetwork and mesonetwork diagramof the MANET database reveals that enzymes of old origingenerally coexist with those of recent origin (see examplesubnetwork; Fig. 4). A more detailed analysis of individ-ual subnetwork paintings reveals the absence of clear pat-terns in individual pathways. Enzymes of old origin weregenerally followed haphazardly by enzymes of recent ori-gin, and vice versa, with no apparent pattern along path-ways. The patchy appearance of ancestries in subnetworksbelonging to all metabolic mesonetworks supportsstrongly the enzyme recruitment (patchwork) evolution-ary scenario as the major evolutionary force responsible ofpresent day metabolism. Metabolic MANET makes visu-ally evident enzymatic recruitment patterns that havebeen observed previously (e.g. [13,14]), placing them intoa relative evolutionary time frame. This offers the possibil-ity of reconstructing temporal timelines of recruitmentepisodes in subnetworks and mesonetworks. Other evolu-tionary alternatives (backward evolution, forward evolu-tion, de novo invention, pathway duplication, etc.) arenot readily visible in our evolutionary tracing exercise. A
Painting efficiency in metabolic subnetworksFigure 5Painting efficiency in metabolic subnetworks. The plot describes the total number of enzymes (black line) and the total number of painted enzymes (red line) in each of the 132 subnetworks described in KEGG, sorted according to enzyme number. Subnetworks belonging to individual meson-etworks are identified with different colors.
0
20
40
60
80
100
Numberofenzymes/subnetwork
Subnetwork 1331
CarbohydrateAmino acidsOther aminoacidsSecondary metabolitesNucleotidesCofactors and vitaminsEnergyXenobioticsGlycansPolyketides and otherLipids
Page 10 of 13(page number not for citation purposes)

BMC Bioinformatics 2006, 7:351 http://www.biomedcentral.com/1471-2105/7/351
detailed analysis of each subnetwork will be required toreveal the incidence of these possible evolutionary mech-anisms. Pathway 'take-over' mechanisms in which newenzymes replace either pre-biotic chemistries or oldenzymes, and 'co-option' mechanisms in which oldenzymes gain novel functions, are also possible. In thisregard, we are currently evaluating possible take-over epi-sodes in metabolic subnetworks that may result from enmasse enzymatic recruitment processes occurring in sub-network pathways. We envision that uncovering take-overpatterns in MANET at global levels will require extensiveinformation about possible pre-biotic chemistries andnovel phylogenetic approaches.
The evolutionary patterns revealed by MANET have otherinteresting implications. If we assume that pre-bioticchemistries remain imprinted in modern metabolism as
relics of the pre-biotic world, patterns of enzymatic ances-tries may reveal fundamental steps in prebiotic evolution.These evolutionary patterns may still manifest in the sub-networks despite obscuring events such as take-overs.Morowitz [53,54] proposed that metabolism evolvedthrough the sequential addition of shells to an "energyamphiphile" core (shell A), which consisted of the Krebscycle, glycolysis, and fatty acid biosynthesis. The amina-tion of 2-ketoglutarate was the gateway to shell B, the syn-thesis of most amino acids. In shell C sulfur wasincorporated into cysteine and methionine. The gatewaysto shell D, ring closure and synthesis of nitrogen and din-itrogen heterocycles, gave access to purines, pyrimidines,and many cofactors, including B12. This scenario suggeststhat compounds in shell D evolved after enzymes (derivedfrom shell B and C) and were not a part of prebiotic chem-istry. The energy amphiphile core is consistent with
Box-and-whiskers plot describing global frequency distribution profilesFigure 6Box-and-whiskers plot describing global frequency distribution profiles. A. Comparison of ancestry values derived from structural models using the join operation (population group A) and predicted using HMMs (population group B) in met-abolic MANET. B. Statistical analysis of ancestry distribution in metabolic mesonetworks. Mesonetwork distributions next to vertical bars headed by the same letter are not significantly different (p < 0.05). The Least Squares (LS) means and number of enzymes analyzed (n) are given for each mesonetwork. Skeletal boxes describe median, lower and upper quartiles, and whisk-ers describe maximum and minimum values. Crosses indicate mean values.
Other amino acidsAmino acidsCarbohydrateXenobioticsCofactors and vitaminsNucleotidesPolyketides and otherSecondary metabolitesEnergyGlycansLipids
a b c
0.0830.0920.0930.0960.0970.0970.0980.0990.1060.1120.115
Mesonetwork
map01160map01150map01110map01196map01190map01140map01180map01195map01120map01170map01130
Pathway IDLS mean
15981975515849726514116374211367
nAncestry value
Ancestry value
Population group APopulation group B
A
B
0 0.2 0.4 0.6 0.8 1
0 0.2 0.4 0.6 0.8 1
Older
Younger
Page 11 of 13(page number not for citation purposes)

BMC Bioinformatics 2006, 7:351 http://www.biomedcentral.com/1471-2105/7/351
Wächtershäuser's proposal that life evolve on pyrite (see[5]). According to this theory of an iron-sulfur world, areductive citric acid cycle that used thio-organic homo-logues evolved early and was later coopted for oxidation.The reductive citric acid cycle, an autocatalytic network,expanded by branch reactions into higher homologouscycles. This archaic network included pathways for thesynthesis and degradation of phosphorylated sugars,some amino acids (glutamate, aspartate, alanine, lysine),fatty acids and isoprenoids, coenzymes (includingtetrapyrroles), and purines.
When ancestry patterns embedded in the subnetworks ofMANET were analyzed, sequential evolution of metabolic"shells" was not obvious. However, pervasive enzymerecruitment could have masked the original pre-bioticevolutionary patterns. In fact, we performed a global sta-tistical analysis of the distribution of ancestries ofenzymes in metabolism, testing if global evolutionary pat-terns in metabolism matched possible "shell" scenarios(Fig. 6B). We calculated mean ancestry levels from fre-quency distribution patterns of ancestry data for mesonet-works, assuming these values were indicative of anaverage age of the enzymes examined. The statistics of dis-tribution of ancestries in mesonetworks showed that dis-tributions differed significantly in mean ancestry levels (p< 0.0001; ANOVA, F-test). Furthermore, the analysisrevealed that amino acid mesonetworks were the oldestand lipid (including steroid) and glycan mesonetworkswere relatively recent evolutionary additions (p < 0.05;Tukey-Kramer multiple comparison). The early evolution-ary appearance of mesonetworks related to amino acidmetabolism suggests that metabolic routes leading to thesynthesis of polypeptides (shells B and C of Morowitz)'internalized' early into the protein-based enzymaticmachinery.
While mesonetworks may pool subnetworks of differentaverage ancestry complicating interpretation, our resultsare nevertheless consistent with the shell hypothesis ofMorowitz [54]. In this regard, the early evolution ofamino acid metabolic mesonetworks raises an interestingquestion. Why were the energy amphiphile core pre-bioticfunctions not the first to be replaced by enzymatic coun-terparts? These pre-biotic functions were the oldest andprobably the most stable. One explanation is that replace-ment of non-enzymatic amino acid metabolic pathwaysfollows the need to secure amino acid synthesis for pro-tein-based enzymatic activities. It is possible that pre-biotic entities could have competed with each other forenvironmental resources during this early stage of meta-bolic evolution. Within this context, the opening of thegateway to amino acid synthesis proposed by Morowitzcould have offered the possibility of creating enzymes thatwould perform pre-biotic functions more effectively.
ConclusionWe constructed a database that links biomolecular net-works, protein structure, and phylogenomics. MetabolicMANET traces the evolution of protein structure directlyonto metabolic networks defined by KEGG, enabling thestudy of evolutionary patterns in metabolism at globaland local levels. MANET can be a valuable resource andconstitutes a discovery tool. Individual pathways withinsubnetworks and mesonetworks can be examined andevolutionary patterns can be detected by visual inspectionor statistical analysis of ancestry distributions. The data-base has many possible applications. For example, it canbe used to search for patterns of fold superfamily sharingbetween subnetworks, with the aim of displaying thecoordinated evolution of the subnetworks. Evolutionaryinformation deposited in metabolic MANET will beenhanced by the exponential increase in the number ofgenomes that have been sequenced, the number of foldarchitectures uncovered, and the number of metabolicenzymes with gene assignments. The principles used inthe construction of metabolic MANET are general and canbe extended to other biomolecular networks. In the nearfuture, we plan to analyze other networks of importance,such as cell signaling and other protein interaction net-works.
Availability and requirementsThe MANET database can be accessed via the Internet athttp://manet.uiuc.edu. Data materials are formatted asEXCEL or column-delimited flat files for parsing with pro-gramming tools such as Perl and are openly available atour web site. The use of information obtained from theKEGG and SCOP databases is restricted by licensing con-ditions specified elsewhere. Contact information: THEMANET PROJECT, Atelier of Plant Bioinformatics, E-mail:[email protected].
Authors' contributionsHSK acquired data, developed methods, wrote the codes,created the database, and performed statistical analyses.GCA and JEM initiated and conceived the project. GCAguided HSK in research and interpretation of results. GCAand HSK created figures and did most of the writing withinput from JEM. All authors read and approved the finalmanuscript.
Additional material
Additional File 1Description of join operations, superfamily prediction using HMMs, color-ing, and analysis and sorting of data. Table 1 describes painting efficiency in metabolic MANET.Click here for file[http://www.biomedcentral.com/content/supplementary/1471-2105-7-351-S1.pdf]
Page 12 of 13(page number not for citation purposes)
BMC Bioinformatics 2006, 7:351 http://www.biomedcentral.com/1471-2105/7/351
AcknowledgementsWe thank S. Hwang for initial Perl scripts related to phylogenetic tree reconstruction and ancestry value generators. Research was supported in part with funds from UIUC and grants from the Office of Naval Research (TRECC A6538-A76) and NSF (MCB-0343126) to GCA. Any opinions, findings, and conclusions or recommendations expressed in this material are those of the authors and do not necessarily reflect the views of the funding agencies.
References1. Rives AW, Galitski T: Modular organization of cellular net-
works. Proc Natl Acad Sci USA 2003, 100:1128-1133.2. Ravasz E, Somera AL, Mongru DA, Oltvai ZN, Barabási A-L: Hierar-
chical organization of modularity in metabolic networks. Sci-ence 2002, 297:1551-1555.
3. Gimera R, Amaral LAN: Functional cartography of complexmetabolic networks. Nature 2005, 433:895-900.
4. Pfeiffer T, Soyer OS, Bonhoeffer S: The evolution of connectivityin metabolic networks. PLOS Biology 2005, 3:1269-1275.
5. Maden BEH: No soup for starters? Autotrophy and the originsof metabolism. Trends Biochem Sci 1995, 20:337-341.
6. Kacser H, Beeby R: On the origin of enzyme species by meansof natural selection. J Mol Evol 1984, 20:38-51.
7. Lazcano A, Miller SL: On the origin of metabolic pathways. J MolEvol 1999, 49:424-431.
8. Schmidt S, Sunyaev S, Bork P, Dandekar T: Metabolites: a helpinghand for pathway evolution? Trends Biochem Sci 2003,28:336-341.
9. Horowitz NH: On the evolution of biochemical syntheses. ProcNatl Acad Sci USA 1945, 31:153-157.
10. Cordón F: Tratado Evolucionista de Biologia Madrid, Spain: Aguilar;1990.
11. Jensen RA: Enzyme recruitment in evolution of new function.Ann Rev Microbiol 1976, 30:409-425.
12. Copley RR, Bork P: Homology among (βα)8 barrels: implica-tions for the evolution of metabolic pathways. J Mol Biol 2000,303:627-640.
13. Teichmann SA, Rison SCG, Thornton JM, Riley M, Gough J, ChothiaC: Small-molecule metabolism: an enzyme mosaic. TrendsBiotech 2001, 19:482-486.
14. Teichmann SA, Rison SC, Thornton JM, Riley M, Gough J, Cothia C:The evolution and structural anatomy of the small moleculemetabolic pathways in Escherichia coli. J Mol Biol 2001,311:693-708.
15. Alves R, Chaleil RAG, Sternberg MJE: Evolution of enzymes inmetabolism: A network perspective. J Mol Biol 2002,320:751-770.
16. Light S, Kraulis P: Network analysis of metabolic enzyme evo-lution in Escherichia coli. BMC Bioinformatics 2004, 5:15.
17. Riley M, Labedan B: Protein evolution viewed throughEsherichia coli protein sequences: Introducing the notion of astructural segment of homology, the module. J Mol Biol 1997,268:857-868.
18. Murzin AG, Brenner SE, Hubbard T, Chothia C: SCOP: A struc-tural classification of proteins database for the investigationof sequences and structures. J Mol Biol 1995, 247:536-540.
19. Orengo CA, Michie AD, Jones S, Jones DJ, Swindells MB, ThorntonJM: CATH: a hierarchic classification of protein domainstructures. Structure 1997, 5:1093-1108.
20. Chothia C, Gough J, Vogel C, Teichmann SA: Evolution of the pro-tein repertoire. Science 2003, 300:1701-1703.
21. Chothia C: Proteins-1000 families for the molecular biologist.Nature 1992, 357:543-544.
22. Orengo CA, Jones DT, Thornton JM: Protein superfamilies anddomain superfolds. Nature 1994, 372:631-634.
23. Gerstein M, Hegyi H: Comparing genomes in terms of proteinstructure: Surveys of a finite parts list. FEMS Microbiol Rev 1998,22:277-304.
24. Gerstein M: Patterns of protein-fold usage in eight microbialgenomes: A comprehensive structural census. Proteins 1998,33:518-534.
25. Wolf YI, Brenner SE, Bash PA, Koonin EV: Distribution of proteinfolds in the three superkingdoms of life. Genome Res 1999,9:17-26.
26. Lin J, Gerstein M: Whole-genome trees based on the folds andorthologs: Implications for comparing genomes on differentlevels. Genome Res 2000, 10:808-818.
27. Caetano-Anollés G, Caetano-Anollés D: An evolutionarily struc-tured universe of protein architecture. Genome Res 2003,13:1563-1571.
28. Deeds EJ, Hennessey H, Shakhnovich EI: Prokaryotic phylogeniesinferred from protein structural domains. Genome Res 2005,15:393-402.
29. Yang S, Doolittle RF, Bourne PE: Phylogeny determined by pro-tein domain content. Proc Natl Acad Sci USA 2005, 102:373-378.
30. Caetano-Anollés G, Caetano-Anollés D: Universal sharing pat-terns in proteomes and evolution of protein fold architec-ture and life. J Mol Evol 2005, 60:484-498.
31. Wang M, Boca SM, Kalelkar R, Mittenthal JE, Caetano-Anollés D: Aphylogenomic reconstruction of the protein world based ona genomic census of protein fold architecture. Complexity 2006in press.
32. Winstanley HF, Abeln S, Deane CM: How old is your fold? Bioinfor-matics 2005, 21:i449-i458.
33. Hegyi H, Gerstein M: The relationship between protein struc-ture and function: a comprehensive survey with applicationto the yeast genome. J Mol Biol 1999, 288:147-164.
34. Kanehisa M: Toward pathway engineering: A new database of genetics andmolecular pathways Institute for Chemical Research, Kyoto University;1999.
35. Kanehisa M, Goto S, Kawashima S, Okuno Y, Hattori M: The KEGGresources for deciphering the genome. Nucleic Acids Res 2004,32:D277-D280.
36. Superfamily [http://supfam.mrc-lmb.cam.ac.uk/SUPERFAMILY]37. Gough J, Karplus K, Hughey R, Chothia C: Assignment of homol-
ogy to genome sequences using a library of hidden Markovmodels that represent all proteins of known structure. J MolBiol 2001, 313:903-919.
38. Swofford DL: Phylogenetic analysis using parsimony and other programs(PAUP*), version 4.0 Sunderland, MA: Sinauer Associates; 1998.
39. Felsenstein J: Confidence limits on phylogenies: an approachusing the bootstrap. Evolution 1985, 39:783-791.
40. Kyoto Encyclopedia of Genes and Genomes [ftp://ftp.genome.ad.jp/pub/kegg]
41. Structural Classification of Proteins [http://scop.mrc-lmb.cam.ac.uk/scop/parse/index.html]
42. SAS: OnlineDoc®, version 8 Cary, NC: SAS Institute Inc; 1999. 43. Ott RL, Longnecker M: Statistical methods and data analysis 5th edition.
Pacific Grove: Duxbury Press; 2001. 44. Rison SCG, Teichmann SA, Thornton JM: Homology, pathway dis-
tance and chromosomal localization of the small moleculemetabolism enzymes in Escherichia coli. J Mol Biol 2002,318:911-932.
45. Saqui MAS, Sternberg JE: A structural census of metabolic net-works for E. coli. J Mol Biol 2001, 313:1195-1206.
46. Nobeli I, Spriggs RV, George RA, Thornton JML: A ligand-centricanalysis of the diversity and evolution of protein-ligand rela-tionships in E. coli. J Mol Biol 2005, 347:415-436.
47. Peregrin-Alvarez JM, Tsoka S, Ouzounis CA: The phylogeneticextent of metabolic enzymes and pathways. Genome Res 2003,13:422-427.
48. Bingham J, Sudarsanam S: Visualizing large hierarchical clustersin hyperbolic space. Bioinformatics 2000, 16:660-661.
49. Lo Conte L, Brenner SE, Hubbard TJP, Chothia C, Murzin A: SCOPdatabase in 2002: Refinements accommodate structuralgenomics. Nucleic Acids Res 2002, 30:264-267.
50. Harrison A, Pearl F, Mott R, Thornton J, Orengo C: Quantifying thesimilarities within fold space. J Mol Biol 2002, 323:909-929.
51. Nagano N, Orengo CA, Thornton JM: One fold with many func-tions: the evolutionary relationships between TIM barrelfamilies based on their sequences, structures and functions.J Mol Biol 2002, 321:741-765.
52. Chandonia JM, Hon G, Walker NS, Lo Conte L, Koehl P, Levitt M,Brenner SE: The ASTRAL compendium in 2004. Nucleic AcidsRes 2004, 32:D189-D192.
53. Morowitz H: A theory of biochemical organization, metabolicpathways, and evolution. Complexity 1999, 4:39-53.
54. Morowitz HJ, Kostelnik JD, Yang J, Ody GD: The origin of inter-mediary metabolism. Proc Natl Acad Sci USA 2000, 97:7704-7708.
Page 13 of 13(page number not for citation purposes)
http://www.ncbi.nlm.nih.gov/entrez/query.fcgi?cmd=Retrieve&db=PubMed&dopt=Abstract&list_uids=7482696
http://www.ncbi.nlm.nih.gov/entrez/query.fcgi?cmd=Retrieve&db=PubMed&dopt=Abstract&list_uids=7482696
http://www.ncbi.nlm.nih.gov/entrez/query.fcgi?cmd=Retrieve&db=PubMed&dopt=Abstract&list_uids=6429341
http://www.ncbi.nlm.nih.gov/entrez/query.fcgi?cmd=Retrieve&db=PubMed&dopt=Abstract&list_uids=6429341
http://www.ncbi.nlm.nih.gov/entrez/query.fcgi?cmd=Retrieve&db=PubMed&dopt=Abstract&list_uids=9180377
http://www.ncbi.nlm.nih.gov/entrez/query.fcgi?cmd=Retrieve&db=PubMed&dopt=Abstract&list_uids=9180377
http://www.ncbi.nlm.nih.gov/entrez/query.fcgi?cmd=Retrieve&db=PubMed&dopt=Abstract&list_uids=7723011
http://www.ncbi.nlm.nih.gov/entrez/query.fcgi?cmd=Retrieve&db=PubMed&dopt=Abstract&list_uids=7723011
http://www.ncbi.nlm.nih.gov/entrez/query.fcgi?cmd=Retrieve&db=PubMed&dopt=Abstract&list_uids=7723011
http://www.ncbi.nlm.nih.gov/entrez/query.fcgi?cmd=Retrieve&db=PubMed&dopt=Abstract&list_uids=9309224
http://www.ncbi.nlm.nih.gov/entrez/query.fcgi?cmd=Retrieve&db=PubMed&dopt=Abstract&list_uids=9309224
http://www.ncbi.nlm.nih.gov/entrez/query.fcgi?cmd=Retrieve&db=PubMed&dopt=Abstract&list_uids=1608464
http://www.ncbi.nlm.nih.gov/entrez/query.fcgi?cmd=Retrieve&db=PubMed&dopt=Abstract&list_uids=7990952
http://www.ncbi.nlm.nih.gov/entrez/query.fcgi?cmd=Retrieve&db=PubMed&dopt=Abstract&list_uids=7990952
http://www.ncbi.nlm.nih.gov/entrez/query.fcgi?cmd=Retrieve&db=PubMed&dopt=Abstract&list_uids=9849936
http://www.ncbi.nlm.nih.gov/entrez/query.fcgi?cmd=Retrieve&db=PubMed&dopt=Abstract&list_uids=9849936
http://www.ncbi.nlm.nih.gov/entrez/query.fcgi?cmd=Retrieve&db=PubMed&dopt=Abstract&list_uids=9927481